itegratg green n in and gray - the partnership · integrating green and gray i worldbank.org |...
TRANSCRIPT

iIntegrating Green and Gray
WORLDBANK.ORG | WRI.ORG
iNTEGRATiNG GREEN AND GRAY Creating Next Generation Infrastructure
GREG BROWDER, SUZANNE OZMENT, IRENE REHBERGER BESCOS, TODD GARTNER, AND GLENN-MARIE LANGE

ACKNOWLEDGMENTSWe are pleased to acknowledge our institutional strategic partners, who provide core funding to WRI: Netherlands Ministry of Foreign Affairs, Royal Danish Ministry of Foreign Affairs, and Swedish International Development Cooperation Agency.
This report was prepared through a partnership between the World Bank (WB) and the World Resources Institute (WRI). The WB team was led by Greg Browder comprising Irene Rehberger, Glenn-Marie Lange, Denis Jean-Jacques Jordy, Niels B. Holm-Nielsen, Brenden Jongman, Stefanie Kaupa, Kathia Havens, and Boris Ton Van Zanten. The WRI team was led by Suzanne Ozment comprising Todd Gartner, Gretchen Ellison, Kara DiFrancesco, Mai Ichihara, Russell King, and Leah Schleifer.
The report has greatly benefitted from the strategic direction of Andrew Steer (President & CEO of WRI) and Marianne Fay (Chief Economist of the Sustainable Development Vice-presidency of the WB).
We express our sincere gratitude to the following individuals who provided incisive comments and guidance on this report, listed in alphabetical order: Paola Agostini (WB), Ger Bergkamp (ARCOWA), Benoit Bosquet (WB), Roland Alexander Bradshaw (WB), Moushumi Chaudhury (WRI), Richard Damania (WB), Julie Dana (WB), Sean Gilbert (WRI), Klaas de Groot (WB), Nagaraja Rao Harshadeep (WB), Juliet Lamont (Creekcats Environmental Partners), Xiaokai Li (WB), Fabiana Machado (Inter-American Development Bank), Laura Malaguzzi (WRI), Lisa Mandle (Stanford University), Elizabeth Moses (WRI), Betsy Otto (WRI), Kate Owens (WRI), Jennifer Sara (WB), Steven N. Schonberger (WB), Daniel Shemie (TNC), Rod Taylor (WRI), and Javier Warman (WRI), and Carmen Rosa Yee-Batista (WB).
The case studies featured in this report draw on inputs from the following individuals: Anjali Acharya (WB), Vietnam case; Eric Brusberg (WB) and Winston Yu (WB), Poland case; Jaime Camacho (TNC), Ecuador case; Marcella D’Souza (WOTR), India case; Gunars Platais and Stefano P. Pagiola (WB), Brazil case; Jennifer Pryce (Calvert Impact Capital), Washington, DC case; Chantal Richey, Natalia Limones, and Dominick Revell de Waal (WB), Somalia case; and Julie Rozenberg (WB), Sri Lanka case. Toyoko Kodama, Gaia Hatzfeldt, and Sofia Bettencourt provided input on the social dimensions of green infrastructure.
This report’s production and layout were provided by WRI’s Shazia Amin, Billie Kanfer, and Romain Warnault, and Lauri Scherer. James Anderson, Meriem Gray, Martin Hall, Li Lou, Pascal Saura, and Leah Schleifer provided invaluable support for dissemination of the work.
This report was prepared with support from the Global Water Security & Sanitation Partnership (GWSP) and the Global Facility for Disaster Reduction and Recovery (GFDRR).
ABOUT THE AUTHORSGreg Browder is the Global Lead of the Water Security and Water Resource Management Global Solutions Group within the World Bank Water Global Practice.
Contact: [email protected]
Suzanne Ozment is a Senior Associate with the World Resources institute’s Natural infrastructure initiative.
Contact: [email protected]
Irene Rehberger Bescos is a Water Resource Management Analyst with the World Bank Water Global Practice.
Contact: [email protected]
Todd Gartner is Director of the World Resources institute’s Cities for Forests and Natural infrastructure initiatives.
Contact: [email protected]
Glenn-Marie Lange is a Senior Environmental Economist with the World Bank Environment and Natural Resources Global Practice.
Contact: [email protected]
Design and layout by:Billie [email protected]

TABLE OF CONTENTS1 Foreword
3 Executive Summary
13 Why Integrate Green and Gray Infrastructure?
27 Improving Service Delivery with Green Infrastructure
41 The Social Foundation of Green Infrastructure
51 The Economics of Green Infrastructure
61 Creating New Financing Options with Green Infrastructure
73 Enabling Policies for Effective Green Infrastructure
81 The Way Forward
85 Appendix A. Services That Can Integrate Green Infrastructure and Related Case Studies
122 Appendix B. References Endorsing Green Infrastructure and Similar Approaches
125 References

WRI.org iv

1Integrating Green and Gray
This report is, therefore, essential reading for those responsible for delivering infrastructure services. Water and power utilities, storm and flood man-agement agencies, and irrigation departments can use the guidelines to integrate natural approaches into their plans. Public officials can learn to how to enable green-gray infrastructure development through improved policies, laws, and regulations. Ministries of Finance and Budget can gain insights on how to approach financing, often a major barrier for infrastructure, by opening new financ-ing channels from mission-driven investors and governments.
The World Bank Group aims to elevate the role of natural infrastructure across its operations. It has committed to leveraging its finance to catalyze potentially billions of additional dollars from public and private sources for climate adaptation. To meet its ambitious goals in this area, ensuring that infra-structure performs well under a changing climate will be essential to success. World Resources Insti-tute is also expanding its analytical, convening, and coalition-building roles in advancing natural infra-structure, while pioneering new financing models to increase investment in green-gray approaches.
The next generation of infrastructure can help drive economies and strengthen communities and the environment. But this needs governments, service providers, and development agencies to work together to amplify the benefits of natural solutions. We hope this report provides them with the inspira-tion and guidance to do just that.
The world has huge infrastructure needs for eco-nomic growth, jobs, and poverty reduction. In developing countries, achieving the infrastructure-related Sustainable Development Goals (SDGs) and staying on track to limit global temperature increase to two degrees could cost 4.5 percent to 8 percent of GDP, depending on how efficiently it is done. A traditional focus on exclusively human-built “gray” infrastructure would put costs at the higher end of that spectrum and make it more chal-lenging to meet these needs.
But this challenge also provides an incentive to take advantage of an opportunity we have always had: using “green” systems such as forests, wetlands, and mangroves to complement gray infrastructure. By harnessing the power of nature, infrastructure services can be provided at a lower cost while deliv-ering greater impact.
In this report, the World Bank and World Resources Institute show how the next generation of infrastructure projects can tap natural systems and, where appropriate, integrate green and gray infrastructure. This call for the next generation of infrastructure—both green and gray—echoes the World Bank’s Changing Wealth of Nations 2018 report, which showed that natural capital can be leveraged rather than liquidated through the devel-opment process.
Natural systems have long been recognized for their ability to deliver or contribute to core infrastruc-ture services—water purification and storage, flood management, irrigation, and electricity genera-tion. But, until now, there has been a lack of clear guidance on how to integrate green infrastructure into human-built projects so that they deliver better services at lower cost.
FOREWORD
Andrew SteerPresident World Resources Institute
Laura TuckVice President for Sustainable DevelopmentWorld Bank
WRI.org 2

3Integrating Green and Gray
EXECUTiVE SUMMARYintegrating nature into mainstream infrastructure systems can
produce lower cost and more resilient services. This report guides
developing country service providers and their partners on how to
seize this opportunity. it reviews approaches and examples of how
to integrate green infrastructure into mainstream project appraisal
processes and investments.

WRI.org 4
The ChallengeA new generation of infrastructure proj-ects is necessary to achieve development goals, including water security, disaster risk reduction, poverty alleviation, and resilience to climate change. Nearly half the world’s population already lives in areas with water scarcity, and natural disasters affected 96 million people in 2017 (Burek et al. 2016; CRED 2017). Climate change and growth patterns will exacerbate these threats: by 2050, nearly 20 percent of the world’s population will be at risk of floods, and up to 5.7 billion people will live in water-scarce areas (WWAP 2018). At the same time, communities, rural and urban, developed and developing, are struggling to build reliable, safe, and economically viable infrastructure to provide residents with clean water and power, flood protection, and resilience against drought.
Protecting populations from these multiply-ing threats with traditional built infrastruc-ture such as massive dams and seawalls alone will be insufficient. Projections of global financing needs for water supply infrastructure alone are estimated at US$6.7 trillion by 2030 and $22.6 trillion by 2050, significantly outpacing financial flows to this sector (OECD 2018). Against this backdrop, the gains the world has made toward meeting UN Sustainable Development Goals (SDGs), including ending poverty and hunger, and providing clean water and sanitation for all, are under threat. Solutions that are cost-effective, enhance infrastructure service provision, show resilience in a changing climate, and contribute to social and environmental goals must be developed and deployed worldwide.
Recognizing that next generation infra-structure has a critical role to play in meeting the climate adaptation challenge, a growing movement is promoting nature-based solutions and creating opportunities to scale up use of green infrastructure. The United Nations World Water Development Report 2018 highlighted how nature-based solu-tions (including green infrastructure) can help meet the 2030 SDGs (WWAP 2018). Similarly, the High Level Panel on Water convened by the United Nations and World Bank concluded that green infrastructure can “help address some of the most pressing water challenges, particularly if planned in harmony with gray infrastructure” (HLP 2018).
HIGHLIGHTS
▪ Traditional infrastructure systems worldwide rely on built solutions to support the smooth and safe functioning of societies. in the face of multiplying environmental threats, this approach alone can no longer provide the climate resiliency and level of services required in the 21st century.
▪ Natural systems such as forests, floodplains, and soils can contribute to clean, reliable water supply and protect against floods and drought. in many circumstances, combining this “green infrastructure” with traditional “gray infrastructure,” such as dams, levees, reservoirs, treatment systems, and pipes, can provide next generation solutions that enhance system performance and better protect communities.
▪ Service providers such as water utilities, flood management agencies, irrigation agencies, and hydropower companies can deliver more cost-effective and resilient services by integrating green infrastructure into their plans. However, to guide its appropriate use in mainstream infrastructure programs, green infrastructure must be as rigorously evaluated and carefully designed as gray projects.
▪ This report offers service providers a framework to evaluate green infrastructure from a technical, environmental, social, and economic perspective, and to assess key enabling conditions, with illustrative examples.
▪ it also provides guidance for policymakers and development partners, who must set the incentives and enabling conditions to mainstream solutions that unite green and gray infrastructure.

5Integrating Green and Gray
SERVICE GRAY INFRASTRUCTURE COMPONENTS
EXAMPLES OF GREEN INFRASTRUCTURE COMPONENTS AND THEIR FUNCTION
Water supply and sanitation Reservoirs, treatment plants, pipe network
Watersheds: improve source water quality and thereby reduce treatment requirements
Wetlands: Filter wastewater effluent and thereby reduce wastewater treatment requirements
Hydropower Reservoirs and power plants Watersheds: Reduce sediment inflows and extend life of reservoirs and power plants
Coastal flood protection Embankments, groynes, sluice gates Mangrove forests: Decrease wave energy and storm surges and thereby reduce embankment requirements
Urban flood management Storm drains, pumps, outfalls Urban flood retention areas: Store stormwater and thereby reduce drain and pump requirements
River flood management Embankments, sluice gates, pump stations
River floodplains: Store flood waters and thereby reduce embankment requirements
Agriculture irrigation and drainage
Barrages/dams, irrigation and drainage canals
Agricultural soils: increase soil water storage capacity and reduce irrigation requirements
Toward Next Generation InfrastructureIntegrating green and gray infrastructure can help fill the need for climate-resilient 21st century solutions. While it is still early days, there is mounting evidence that natural sys-tems can be combined with traditional gray infra-structure to provide lower-cost and more resilient services. Over time, and done properly, combining green and gray infrastructure offers the potential to help provide water, food, and energy to growing populations, lift communities out of poverty, and mitigate climate change.
While this report focuses on the services shown in Table ES-1, the general approach can be applied to almost all gray infrastruc-ture, including transportation and power. Real world examples from around the world feature throughout the report, and Appendix A provides 12 detailed case studies, 6 of these from the World Bank’s portfolio. These describe successful, innova-tive approaches to infrastructure service delivery being pioneered in Brazil, China, Costa Rica, Ecuador, India, Poland, Somalia, Sri Lanka, the Netherlands, United States, and Vietnam.
Ongoing projects that utilize green infra-structure have generated many lessons learned that can inform the next generation of infrastructure. Although green infrastructure may not be appropriate for every project or loca-tion, opportunities to use natural systems in project designs are frequently overlooked and have not yet entered the mainstream. This is partly the result of piecemeal research, focused mainly on isolated case studies with limited relevance to other con-texts or insight into long-term trends. However, successful examples of and experience with green infrastructure have now gained critical mass, gen-erating robust design processes that enable service providers and development partners to confidently consider green and gray infrastructure approaches, and investment opportunities, on an equal footing.
Green infrastructure has gained momen-tum among governments, civil society, and development partners such as multilateral development banks and bilateral agen-cies. As green infrastructure gains momentum, development partners historically focused on gray infrastructure are embracing the concept and value of “putting nature to work.” For example, the World Bank’s Wealth Accounting and the Valuation of
Table ES-1 | How Green and Gray infrastructure Can Work Together
Source: Authors.

WRI.org 6
Ecosystem Services framework seeks to account for the value of nature in mainstream planning processes, and its programs aim to drive uptake of nature-based solutions in disaster risk management and other relevant sectors (WAVES 2016). From 2012 to 2017, the World Bank approved at least 81 projects with green infrastructure components in the environment, urban, water, and agricultural sectors—however, this remains a small percentage of all approved projects in these sectors.
About This ReportThis joint report by the World Bank and the World Resources Institute seeks to guide developing country service providers and their partners on how to integrate natural systems into their infrastructure programs in ways that better protect their populations and achieve service delivery goals. It provides insights, solutions, and examples that will guide the World Bank’s thinking on how “putting nature to work” can help meet its core mandates related to reducing extreme poverty, promoting shared prosperity, and meeting the challenges of climate adaptation and resiliency.
The report is intended for a broad audience of stakeholders that are key to advancing the integration of green and gray infrastructure solutions on the ground. These include the following:
▪ Service providers, such as water utilities, mu-nicipal stormwater departments, flood manage-ment agencies, irrigation agencies, and hydro-power companies in the vanguard of efforts to design and maintain green infrastructure.
▪ The coalition of partners, including local gov-ernments, central government agencies, and community leaders that are typically required to get green infrastructure off the ground.
▪ Policymakers looking to understand the chal-lenges and opportunities of integrating green infrastructure into development plans and seeking guidance on the enabling conditions for green infrastructure investment.
The report describes how combining green and gray infrastructure can deliver a triple win for the economy, communities, and the environment, and provides guidance on how to incorporate green infrastructure in project design, appraisal, and implementa-tion. As shown in Figure ES-1, the report covers the technical, environmental, social, and economic dimensions of a typical project assessment and the key enabling conditions required to facilitate suc-cessful implementation of green-gray projects.
In Summary: Evaluating the Benefits and Limitations of Green Infrastructure Strategically combining green and gray infrastructure to lower costs and improve resiliency can help tackle the looming financial and environmental crisis facing global infrastructure systems. With the right conditions, green infrastructure components can cost-effectively enhance service delivery, while also empowering communities and increasing infrastructure systems’ resilience and flexibility in a changing climate. Below, we summarize the report’s findings on the technical, social, and economic potential offered by green infrastructure, and the enabling conditions it requires. Readers should note that the mixed success of green infrastructure projects to date suggests that these advantages may not be realized unless service providers conduct an early, thorough, and robust assessment to inform the utilization, design, and implementation of combined green-gray solutions.

7Integrating Green and Gray
ENABLING CONDITIONS: FiNANCE AND POLiCYCHAPTERS 5 & 6
Green infrastructure’s ability to provide multiple public and private benefits can unite interests of diverse investors and decision-makers to open pathways for financing, utilization, and large-scale promotion. Supportive policies can greatly aid in adoption of green infrastructure. Understanding policy and financing conditions is a key step of the project development process.
Figure ES-1 | integrating Green and Gray infrastructure: Key Questions and Opportunities for Stakeholders
Source: Authors.
OPPO
RTUN
ITIE
SQU
ESTI
ONS
TECHNICAL AND ENVIRONMENTAL SOCIAL ECONOMIC
CHAPTER 2
Green infrastructure can boost infrastructure system resilience due to its natural adaptive and regenerative capacity. it can be multifunctional, generating numerous positive environmental impacts.
CHAPTER 3
Green infrastructure can empower communities through participation in project operations. This enhances project sustainability as long-term viability is highly dependent on community support.
CHAPTER 4
Green infrastructure can be low-cost, and cost-effective, helping enhance the economic efficiency of infrastructure investments. its multiple benefits can generate both monetary values and nonmarket benefits.
Can green infrastructure reduce the cost, increase the quality, and/or improve the resilience of the service?
Is it possible to get multiple stakeholders to support green infrastructure, and can land issues be addressed?
Can green infrastructure be justified in terms of cost, as well as in broader economic terms?

WRI.org 8
improving Technical Performance Considering green infrastructure cre-ates new technical options for service delivery. By combining built infrastructure with solutions that harness natural systems, providers can improve performance and decrease risk. For example, Appendix A highlights a project in Poland where establishing multipurpose flood retention areas in the Odra and Vistula River Basins will reduce peak river flows. Together with traditional flood embankments, this will protect against the recurrence of a very severe (1,000-year) flood.
Defining the role natural systems such as forests, floodplains, and mangroves can play within infrastructure systems is becoming easier with emerging technology, scientific knowledge, and insights from a growing number of projects. These demon-strate that green infrastructure can be designed in response to local circumstances to complement, substitute, or safeguard gray infrastructure. New biophysical and economic modeling techniques can also enable green infrastructure assessments as part of typical project evaluation.
Stakeholders assessing the technical per-formance of green infrastructure must take into account complexity and uncertainty. The performance of green infrastructure depends greatly on ever-shifting local environmental, social, and political conditions, which can sometimes cast uncertainty onto projects. At the same time, green infrastructure’s innate ability to adapt to changing climate conditions and its relative ease of revers-ibility are advantages in a rapidly changing world. Appendix A features an example of how to deal with uncertainty, centered on an urban wetland conser-vation project in Sri Lanka to improve stormwater drainage services. Project partners used a com-prehensive “decision-making under uncertainty” economic model, which showed a wide range of potential outcomes but indicated that going ahead was worth the risk.
The Social Foundation of Green infrastructureGreen infrastructure has an important social dimension. While gray infrastructure is usually operated and owned by a company or government entity, the main operators of green
Figure ES-2 | Reservoir Lifespan increases with Well-Designed Green infrastructure for Erosion Control
Image: World Bank.

9Integrating Green and Gray
infrastructure are often local communities, respon-sible for implementing land stewardship practices, and for maintaining the project over the long term. Green infrastructure typically operates at a land-scape level, crossing property boundaries or juris-dictions and often involving multiple stakeholder groups. Understanding the costs and benefits for different groups, including women, is therefore important for success; green infrastructure does, however, often have high social transaction costs.
Green infrastructure is most successful when it meets the needs and interests of local stakeholders and communities, and when these groups have a stake in main-taining the solution over the long term. Green infrastructure offers significant opportu-nities to resolve social inequality or to support vulnerable communities—but these opportunities can be missed, and social challenges exacerbated, if projects are poorly planned and executed. Although this typically requires more effort than employing social safeguards for gray infrastructure, it also opens opportunities to develop win-win solutions that both benefit communities and enhance ser-vices. For example, Appendix A presents a project in rural Somalia where simple “sand dams” were built in place of expensive and difficult-to-maintain groundwater wells, with the communities operating
and maintaining the infrastructure. These small dams capture and store sand, which accumulates water and recharges readily accessible shallow aquifers.
The Economics of Green infrastructureGreen infrastructure can be cost-effective and deliver wide-ranging cobenefits valu-able to society. The financial case for considering green infrastructure has been well-documented in areas such as reducing the cost of water-related service provision, but varies depending on local conditions. Service providers and their partners should therefore conduct site-based assessments on a case-by-case basis to evaluate financial impacts. Savings generated by natural systems can be large—for example, Chapter 4 showcases how New York City saved 22 percent, or $1.5 billion, by combining green and gray infrastructure instead of pursuing a gray-only strategy to secure water supply for the city (Bloomberg and Holloway 2018).
While the financial case is critical to green-lighting projects, it is also advantageous for service providers to consider environmen-tal and social cobenefits. These cobenefits can be expressed in either monetary or nonmonetary terms on the basis of a “multi-criteria analysis” of a green-gray infrastructure approach, including potential winners, losers, and trade-offs.
Figure ES-3 | Cobenefits for Communities Makes Next Generation infrastructure More Successful
Image: Payton Chung/Flickr.

WRI.org 10
Creating Enabling Conditions: Finance and Policy Green infrastructure opens up new financ-ing frontiers for an industry facing major investment shortfalls. In general, tight gov-ernment budgets are constraining infrastructure improvements even as need soars. However, because they generate significant environmental and social cobenefits, projects that harness natural systems are attractive options for grants, subsidies, and mission-driven investors. Leveraging govern-ment funds as cost-share, pooling investment across project beneficiaries, issuing green bonds for green infrastructure, and engaging insurance com-panies are all relevant approaches that mainstream financial institutions are pursuing. Appendix A includes a case in Quito, Ecuador, where water utilities, private companies, and nongovernmental organizations (NGOs) set up a “water fund,” which acts both as an organization and a financing mecha-nism for watershed protection.
Policy support for green infrastructure can make good politics. A common barrier for widespread adoption of green infrastructure is that government agencies must develop enabling policies, laws, and regulations for its use. However, as evidence mounts that combined infrastructure approaches can provide multiple community and public benefits, several countries have adopted comprehensive enabling policies, blazing a trail for others to follow. Chapter 6 highlights the example of Peru, which passed a law requiring water utili-ties to earmark revenue for water conservation and combatting climate change, and to consider these strategies in their budgeting and planning processes.
Integrating green infrastructure into traditional projects helps overcome a common challenge with gray infrastructure: the “Not in My Back Yard!” (NIMBY) Syndrome. If project proponents engage with government agencies, civil society organiza-tions, and communities to develop win-win green infrastructure, political leaders can have a dual incentive to support green infrastructure: public support and enhanced services. Governments or civil society can serve as intermediaries and guar-antors between service providers and communities. Appendix A features the example of a flood bypass in California on land that farmers were allowed to cultivate between flood events and where a wetland conservation area was also created.
Recommendations for Scaling Green InfrastructureService providers, policymakers, financial institutions, researchers, civil society, regulators, and communities must cooper-ate to put green infrastructure to work. Partnerships among these actors in developing countries, in collaboration with and support from development partners, can spark the urgently needed transition to next generation infrastructure by integrating the consideration and assessment of natural systems throughout the project cycle. The following efforts are key:
▪ All stakeholders must work with and en-courage policymakers to promote green-gray approaches through policies, laws, and regulations. Once there is policy com-mitment at multiple levels, then governments
11Integrating Green and Gray
can create the enabling conditions by adjusting laws and regulations to allow service providers to proactively develop green infrastructure.
▪ National and local government agencies should routinely consider opportuni-ties to integrate green infrastructure approaches in regional and master planning, as well as land-use planning processes, such as river basin or urban development plans. This will encourage wa-ter service and other providers to assess if and how green infrastructure components might be incorporated into their infrastructure projects.
▪ Service providers must utilize advanced methods and tools to analyze the perfor-mance of green infrastructure. Specifi-cally, they need to expand beyond traditional engineering approaches to incorporate new approaches related to ecology and environ-mental management. The same analytical rigor applied for gray infrastructure must be applied for “ecological engineering”—while recogniz-ing that the complexity of natural systems may generate less precision.
▪ Stakeholders should prioritize social support for green infrastructure and build long-term coalitions. Service pro-viders, in particular, need to invest resources in developing new areas of expertise related to stakeholder engagement and community interactions.
▪ Service providers should take advantage of green infrastructure’s characteristics to sell innovative financing approaches. In addition to standard financing instruments for built engineering systems, service provid-ers should increasingly tap emerging funding sources from governments, development agen-cies, and the private sector.
▪ Service providers should develop sup-portive partnerships with approving bodies, civil society organizations, potential co-investors, and technical experts. For example, multilateral develop-ment banks can bring financial resources, and bilateral development agencies can offer more upstream, specialized expertise to help plan green-gray solutions. Civil society groups often bring cutting-edge expertise and/or are well attuned to local circumstances.
▪ In addition to supporting their client’s efforts to develop green-gray infrastruc-ture, development partners can advance the knowledge frontier for next genera-tion infrastructure in three ways. First, they can build capacity with their own orga-nizations to understand the potential of green infrastructure and engage developing country clients. Next, they can utilize green-gray as-sessment tools and approaches in their internal processes. And finally, they can help overcome knowledge gaps that act as barriers to scaling green infrastructure, by investing in perfor-mance monitoring and in widely communicat-ing results and real world experience.

13Integrating Green and Gray
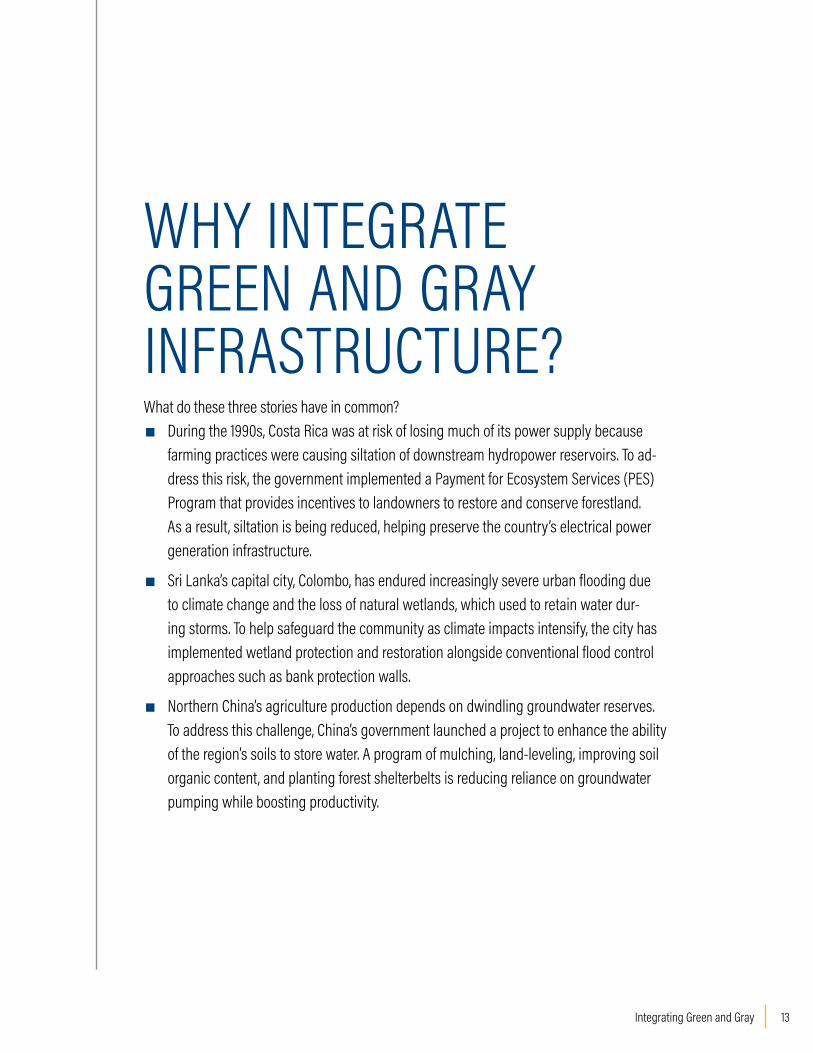
What do these three stories have in common?
▪ During the 1990s, Costa Rica was at risk of losing much of its power supply because farming practices were causing siltation of downstream hydropower reservoirs. To ad-dress this risk, the government implemented a Payment for Ecosystem Services (PES) Program that provides incentives to landowners to restore and conserve forestland. As a result, siltation is being reduced, helping preserve the country’s electrical power generation infrastructure.
▪ Sri Lanka’s capital city, Colombo, has endured increasingly severe urban flooding due to climate change and the loss of natural wetlands, which used to retain water dur-ing storms. To help safeguard the community as climate impacts intensify, the city has implemented wetland protection and restoration alongside conventional flood control approaches such as bank protection walls.
▪ Northern China’s agriculture production depends on dwindling groundwater reserves. To address this challenge, China’s government launched a project to enhance the ability of the region’s soils to store water. A program of mulching, land-leveling, improving soil organic content, and planting forest shelterbelts is reducing reliance on groundwater pumping while boosting productivity.
WHY iNTEGRATE GREEN AND GRAY iNFRASTRUCTURE?
WRI.org 14
These stories demonstrate how governments and communities can harness nature’s innate ability to substitute for or enhance infrastructure systems, and design development projects in ways that both address development challenges and curb ecosystem degradation. These types of strategies are collectively called nature-based solutions, while solutions explicitly designed to deliver a service are termed “green infrastructure.” Box 1.1 defines all the key terms used in this report; the relation and distinctions between them are shown in Figure 1.1.
Today’s Infrastructure Development ChallengesWhile traditionally, human societies understood that they depended on healthy ecosystems for well-being and economic development (MEA 2005; Gartner et al. 2013), this recognition has eroded in the modern industrial era. As they developed, countries shifted focus to engineered, gray solu-tions—providing reliable, safe drinking water exclusively through water storage reservoirs and treatment plants; protecting communities from floods and coastal storms through construction of seawalls and jetties; securing water throughout the growing season through massive dams and irriga-tion systems; and using pipes and pumps to collect and transport stormwater away from cities. This gray infrastructure has played an important role in overcoming development challenges to date, and will continue to do so.
Today, however, gray infrastructure systems are falling short of meeting our needs, and are increas-ingly at risk of failure in a changing climate and a changing world. Nearly half the world’s popula-tion already lives with water scarcity, and natural disasters affected 96 million people in 2017. Rising global temperatures means that infrastructure must become more resilient to deal with ever more severe drought and floods. Yet service providers are relying on infrastructure principles conceived in the last century to address 21st century challenges, while ignoring and degrading natural ecosystems.
Strategically combining green and gray infrastruc-ture to provide services and achieve development goals can help address these urgent challenges. This report focuses on green infrastructure approaches that tackle challenges in the following sectors:
Water supply and hydropower: Projections of global financing needs for water supply infra-structure alone (not including energy, flood, or irrigation) are estimated at $6.7 trillion by 2030 and $22.6 trillion by 2050, significantly outpacing financial flows to the sector. Watershed degrada-tion compounds these challenges. As upstream ecosystems and the services they provide are lost or degraded, downstream water and hydropower operations face greater risk of siltation, loss of hydropower production, wear and tear on infra-structure assets, and higher treatment or operating
BOX 1.1 | KEY TERMS
Green infrastructure (also sometimes called natural infrastructure, or engineering with nature) intentionally and strategically preserves, enhances, or restores elements of a natural system, such as forests, agricultural land, floodplains, riparian areas, coastal forests (such as mangroves), among others, and combines them with gray infrastructure to produce more resilient and lower-cost services. Gray infrastructure is built structures and mechanical equipment, such as reservoirs, embankments, pipes, pumps, water treatment plants, and canals. These engineered solutions are embedded within watersheds or coastal ecosystems whose hydrological and environmental attributes profoundly affect the performance of the gray infrastructure. Nature-based solutions (NBS) is an umbrella term referring to “actions to protect, sustainably manage, and restore natural or modified ecosystems that address societal challenges effectively and adaptively, simultaneously providing human well-being and biodiversity benefits.”a
Service providers are responsible for delivering development objectives, such as water security, river flood management, coastal flood protection, drought prevention, and groundwater management. This report is aimed at service providers and their development partners, responsible for water supply, hydropower, flood management, coastline protection, and irrigation and drainage, to help them consider green infrastructure as a means of enhancing service delivery.Development partners include development banks, bilateral donors, and other development agencies that work with service providers and developing country governments to support development projects. These organizations increasingly acknowledge the potential role of “putting nature to work,” including through green infrastructure.
Source: Authors.a Cohen-Shacham et al. 2016.

15Integrating Green and Gray
under high threat, and about 1 percent of mangrove forests are lost each year (Burke 2011).
River flood management: Global GDP losses to river floods total roughly $96 billion per year, and the world’s poorest countries are most exposed (Luo et al. 2015) (see Figure 1.2). Natural flood-plains and riparian areas dissipate flood energy, reducing peak flows and storing water for slow release (USEPA 2016). On most large rivers in the world, these benefits have been lost as upstream dam operations and levees have disconnected floodplains from rivers, and landscape degradation has reduced nature’s capacity to capture and store water and attenuate peak flows (BGS 2010). Devel-opment in former floodways can also increase flood risk by putting more assets and lives in danger.
Urban stormwater management: Because city surfaces are impermeable, storms generate high volumes of runoff, which can lead to flooding and pollution. In systems with combined sewer and
Sources: Adapted from WAVES 2016, Cohen-Shacham et al. 2016, and WWAP 2018.
Figure 1.1 | Green infrastructure is a Subset of Natural Capital and Nature-based Solutions
costs. Already, this impacts drinking water for more than 700 million people, and costs global cities $5.4 billion per year in water treatment (McDonald et al. 2016).
Coastal flooding and erosion protection: The consequences of unabated coastal flooding can be extremely costly. In 2005, average losses suffered by the world’s 136 largest coastal cities amounted to roughly $6 billion per year. By 2050, these losses are expected to soar to at least $52 billion per year, and as high as $1 trillion per year if climate change and land subsidence significantly worsen (Hallegatte et al. 2013). Coastal ecosystems such as mangroves, coral reefs, and sand dunes can act as buffers against sea-level rise as well as against natural hazards that bring intense wind, rainfall, or storm surge. Yet, globally, these ecosys-tems are at risk due to coastal development, unsus-tainable fishing, watershed and marine pollution, or thermal stress triggered by climate change. As of 2010, more than 60 percent of the world’s reefs are
NATURAL CAPITAL: The planetary resources (e.g., plants, animals, air, water, soils, minerals) that sustain life and well-being. Natural capital underpins clean air, water and energy security, shelter, medicine, and more. Natural capital concepts are increasingly applied in national and corporate accounting to keep track of society’s dependence and impact on these vital resources.
NATURE-BASED SOLUTIONS: An umbrella term referring to actions that protect, manage, and restore natural capital in ways that address societal challenges effectively and adaptively. These include structural and nonstructural actions, ranging from ecosystem restoration to integrated resource management, green infrastructure, and more.
GREEN INFRASTRUCTURE: A subset of nature-based solutions that inten-tionally and strategically preserves, enhances, or restores elements of a natural system to help produce higher-quality, more resilient, and lower-cost infrastructure services. infrastructure service providers can integrate green infrastructure into built systems.

WRI.org 16
stormwater pipes, excess floodwaters can result in raw sewage discharging into waterways or back-ing up into homes. These hazards threaten human health and safety while disrupting transport and business activities. Urban property flood dam-age alone is costing $120 billion per year—about one-quarter of total global economic losses related to water insecurity (PBL et al. 2014). By 2050, an estimated 1.3 billion people will live in flood-prone areas, and the poorest and most vulnerable will suf-fer disproportionately.
Drought management: From 1980 to 2010, temperature extremes and droughts caused global economic losses of nearly $250 billion, and on aver-age about 35 million people are affected annually (PBL et al. 2014). Forests, wetlands, and floodplains have a natural capacity to help sustain water sup-plies year-round by storing water during wet sea-sons, slowly releasing it during dry seasons, and/or promoting groundwater infiltration. However, as demand for water resources outstrips supply, and ecosystem degradation takes hold, these natural water reserves are depleted.
Agriculture, irrigation, and drainage: According to the Food and Agriculture Organization of the United Nations (FAO), food production must grow by 70 percent by 2050 if everyone is to have enough to eat. Unsustainable land and water management practices can damage the health and productivity of
cultivable land. The top two meters of soil contain most water storage capacity, store plant nutrients, serve as a critical greenhouse gas sink, and are a hotbed of biodiversity. Yet, widespread erosion, compaction, nutrient loss, and salinity are degrad-ing the capacity of soils worldwide to support the ecosystem services essential for meeting humanity’s projected food production needs (FAO and ITPS 2015).
The Case for Embracing Green infrastructureNumerous studies have found that green infra-structure can be a viable component of water, disaster risk, flood, and agriculture management programs providing infrastructure services, among others (see Table ES-1). Box 1.2 and Appendix B reference works that have already made the case for greater integration of nature-based solutions into infrastructure programs, or are initiating efforts to jumpstart green infrastructure in earnest worldwide. Proponents argue that while gray infra-structure typically serves limited purposes, green infrastructure can sometimes deliver multiple ben-efits, simultaneously, underpinning environmental and social goals. In addition, research suggests that green infrastructure is more flexible and resilient to climate change than its gray counterpart (Cohen-Shacham et al. 2016; Ozment et al. 2015; WBCSD 2017).
Figure 1.2 | Dramatic Rise in Economic Losses Due to Flooding
Note: The occurrence of floods (including coastal, urban, and river flooding) is the most frequent of all natural disasters, and the risk is increasing. Total flooding losses exceeded $40 billion in exceptional years such as 1998 and 2010.Source: Jha et al. 2012.
0
50
100
150
200
250
1950s 1960s 1970s 1980s 1990s 2000s
US$ B
illion
s

17Integrating Green and Gray
BOX 1.2 | DEVELOPMENT PARTNER INITIATIVES TO SCALE GREEN INFRASTRUCTURE
Development partners and governments have formed new programs and facilities to encourage service providers to consider green infrastructure in development programs. For example:
▪ The High Level Panel on Water is an international body convened by the World Bank and United Nations that comprises several heads of state. The panel’s action plan recognizes the role healthy ecosystems play in the provision of water services and the importance of green and gray infrastructure working together to address global water challenges (High Level Panel on Water 2018).
▪ The UN World Water Assessment Programme in its World Water Development Report 2018 detailed how nature-based solutions to water challenges can accelerate progress toward the 2030 Sustainable Development Goals, making the case that green infrastructure is cost-effective, flexible in the face of climate change, and can provide multiple benefits to communities (WWAP 2018).
▪ The Inter-American Development Bank along with The Nature Conservancy, FEMSA Foundation, and the Global Environment Facility formed the $27 million Latin American Water Funds Partnership. This aims to protect 7 million acres of watersheds across Latin America by investing money in conservation practices through 19 active funds (iDB 2018).
▪ The European Natural Capital Facility, funded by the European investment Bank, supports projects delivering on biodiversity and climate adaptation through loans and investments (EiB 2018).
▪ The World Bank recently inventoried its portfolio related to water management and disaster risk management and identified at least 81 projects with green infrastructure components. it recently launched a dedicated green infrastructure support program, producing technical guidance notes and creating a cross-sectoral community of practice.
Building on these and similar efforts, development partners can move from isolated projects toward systematic integration of green and combined infrastructure projects in their investment portfolios.

WRI.org 18
While nature-based solutions are gaining trac-tion, the implementation of the concept of “next generation infrastructure,” where green and gray infrastructure work in harmony, is still in its early stages. Many reasons account for this slow uptake, but fundamentally green infrastructure requires a new way of doing business: governments and devel-opment partners need to perceive the infrastructure challenges from new perspectives, and develop innovative techniques for planning, designing, and financing green infrastructure. There are many challenges of incorporating green infrastructure into water-related, flood protection, disaster risk, and other relevant sector management programs, including the following:
▪ Assessing green infrastructure’s technical per-formance and its interaction with gray infra-structure is imprecise because of the inherent complexity of most natural systems, though technological advances are starting to overcome these challenges.
▪ Green infrastructure requires service providers on the delivery frontline to engage with dif-ferent types of stakeholder as well as to build relationships with nontraditional development partners. This can be time-consuming and costly, and require new skill sets.
▪ Enabling conditions and policies for financ-ing and implementing green infrastructure are often missing. As a result, it is often challenging for service providers, such as flood manage-ment agencies, municipal governments, water utilities, or power companies, to own green infrastructure.
▪ Lack of synthesis of lessons learned from existing green infrastructure projects, and the lack of comprehensive scientific knowledge and data to inform green designs in different geographies, has led to some inefficiencies in the design, assessment, and implementation of green and gray infrastructure projects.
This report seeks to help service providers and their partners navigate these barriers, by providing high-level guidance and many examples of effective real world approaches. The fundamental question that most service providers face is not whether to incorporate green infrastructure into their pro-grams, but rather, given a specific context, how best to blend green and gray solutions. The goal of this report is to provide strategic guidelines on how to move forward in creating this next generation infrastructure.
Figure 1.3 | Green Corridors Prevent Diffuse Pollution from Agriculture
Image: World Bank.

19Integrating Green and Gray
Needs for Mainstreaming Green-Gray InfrastructureResearch and early lessons from the field suggest that governments, utilities, and companies that invest in a combined infrastructure approach can cost-effectively improve performance, promote resilience, and provide multiple benefits to com-munities. However, the challenges presented by identifying, designing, and evaluating green infra-structure with the necessary rigor and exactitude to meet engineering standards are relatively new. The mixed success and inconsistent documenta-tion of existing green infrastructure components around the world has exposed the need for service providers to conduct thorough, systematic assess-ments to determine if and how to proceed with such investments. At the same time, governments and development partners need to develop more refined approaches for assessing proposed green infrastruc-ture projects, addressing related social issues, and understanding risks. Professionalizing and system-atizing green infrastructure in this way is critical to pursuing such projects on the global scale.
Site-based design and assessment is a clear start-ing point for mainstreaming green infrastructure. Engineers, planners, and decision-makers are trained to follow explicit guidelines and national or international standards for evaluating the techni-cal, social, and economic performance and impacts of gray infrastructure, and comparing performance across different strategies. And development banks and other institutions that invest in infrastructure use strict criteria.
The World Bank, for example, has strong environ-mental and social safeguard requirements guided by operational policies and procedures, as well as
a requirement to include technical and economic assessments for all projects (World Bank 2018). This means that incorporating green components requires that their technical specifications, costs and benefits, and overall risk tolerance can be assessed at the same level of rigor as for gray infra-structure projects, with comparable metrics. Yet, at present decision-makers often lack information to adequately evaluate and compare green infra-structure options to business-as-usual (BAU) built approaches.
Successful green infrastructure projects must also map the interests of all stakeholders and find common priorities. Typically, such projects involve significant cross-sector coordination to realize the full range of benefits, community buy-in, and long-term sustainability. Common stakeholders include project developers and coordinators, landowners and communities serving as project implementers, investors such as development partners, approv-ing bodies, technical advisers, and third parties providing monitoring and evaluation (Ozment et al. 2016). Development partners can play a key role in supporting governments and other stakeholders in the complex planning required. Educating stake-holders about the benefits of natural capital can also lead to more favorable outcomes.
Green infrastructure design and performance is heavily influenced by local ecological, social, and political conditions. It is therefore not the most suitable, cost-effective, or desirable solution in every situation, given that natural and human systems are inherently heterogeneous and vary across geographies. In this way, it is similar to gray infrastructure design, which does not work well in all settings, can overrun estimated costs, and may

WRI.org 20
underperform if expected conditions do not materi-alize. Risk assessment is therefore a key component of site-based green infrastructure assessment.
Why the World Bank Is Integrating Green and Gray InfrastructureHistorically, the World Bank has focused on either gray infrastructure projects or environmental projects as distinct efforts. However, as evidence mounts that putting nature to work not only enhances infrastruc-ture services, but also generates significant social and environmental benefits, the World Bank has started to finance and promote green-gray approaches that align with its core mandates. A key objective of this report is to help inform and expand the Bank’s own use of green-gray approaches.
World Bank’s Twin Goals: The Bank’s overarching goals are to reduce extreme poverty and increase shared prosperity in a sustainable manner. Green infrastructure contributes to these goals on many fronts. By incorporating natural options alongside built ones, the World Bank can help clients achieve lower-cost, higher-benefit, and more sustainable infrastructure solutions. Sustainable and inclusive infrastructure services, which focus on quality and impact, have the potential to raise economic growth and people’s well-being, thus contributing to shared prosperity (Bhattasali and Thomas 2016).
Green infrastructure can also contribute to social inclusion and poverty reduction. For example, it may help raise incomes and provide important benefits in rural areas, where typically a disproportionate share of the population is poor and indigenous groups are more likely to be located. In rapidly growing urban areas, poor people often have no alternative but to live on flood-prone land, such as low-lying neighborhoods or along rivers. Natural systems such as flood reten-tion areas or river remeandering approaches offer opportunities to improve their well-being.
World Bank’s Climate Action Plans: The World Bank calls for and promotes transformational approaches
to meet climate challenges through the 2016 Climate Action Plan and 2019 Action Plan on Climate Change Adaptation and Resilience (World Bank 2016a; World Bank forthcoming). Together, these present the Bank’s strategies for helping client countries mitigate greenhouse gas emissions and improve their ability to adapt to climate change. Green infrastructure can help to improve climate adaptation and resiliency, due to the generally robust buffering capacity of ecosystems and their ability to help mitigate rainfall or drought extremes. At the same time, natural systems’ compo-nents like mangroves, seagrass beds, and estuaries can contribute to mitigation efforts due to their large carbon storage capacities. Under the 2016 Climate Action Plan, the Bank has committed to accounting and tracking climate cobenefits from the projects it finances. Understanding the linkages between natural and gray infrastructure will help broaden understand-ing of climate-related adaptation measures, and allow the Bank to more comprehensively account for how it supports adaptation measures in client countries.
World Bank’s Green Infrastructure Portfolio: The World Bank typically analyzes its portfolio through assigned project codes, which specify the sector(s) and themes a project supports. The Bank recently conducted a customized portfolio analysis to review water, environmental, and disaster risk management projects under implementation during 2012 to 2017 that analysts judged to contain green infrastructure–related components. The analysis found 81 World Bank–financed projects that employed a combined approach of green and gray infrastructure during the time frame. Chapter 5 provides more information on the Bank’s portfolio.
In addition, the World Bank has recently produced guidance notes and related reports for implement-ing green infrastructure, presented in Box 1.3. This report complements previous sector-specific publica-tions with an overarching assessment framework for combining green and gray infrastructure.
World Bank’s Next Generation Infrastructure Projects: The World Bank Group has often been at

21Integrating Green and Gray
the forefront of infrastructure policy and financing for developing countries. The Bank was a leader in the application of environmental and social safeguards for infrastructure projects starting in the 1980s. The Bank promoted public-private partnerships (PPPs) starting in the 1990s, and is now emphasizing Maximizing Finance for Development (MFD), an approach that helps countries to systematically leverage all sources
of finance, expertise, and solutions (World Bank n.d.[a]). The Bank also recognizes the potential for new disruptive technologies to transform the develop-ment agenda, including infrastructure (Mohieldin 2018). This report provides general guidance on how to mainstream this approach into the global develop-ment agenda—including in World Bank–financed projects.
Figure 1.4 | The Poor Are the Most Vulnerable to Climate Change
B. Flood waters impact communities
A. Water collection in arid areas
Source: World Bank.
Source: CAPRA initiative/Flickr.

WRI.org 22
BOX 1.3 | SELECTED WORLD BANK NATURE-BASED SOLUTIONS REPORTS AND COMMUNITY OF PRACTICE
▪ implementing Nature Based Flood Protection: Principles and implementation Guidelines (World Bank 2017a)
▪ The Role of Green infrastructure Solutions in Urban Flood Risk Management (Soz et al. 2016)
▪ Managing Coasts with Natural Solutions: Guidelines for Measuring and Valuing the Coastal Protection Services of Mangroves and Coral Reefs (Beck and Lange 2016)
▪ Grow in Concert with Nature: Sustaining East Asia’s Water Resources through Green Water Defense (Li et al. 2012)
The Bank also hosts a “Natural Hazards—Nature-based Solutions Platform.” The website (http//:www. naturebasedsolutions.org) showcases projects, investments, guidance, and studies, making use of nature to reduce the risks associated with natural hazards (World Bank 2017b).
About This Report: A Framework to Integrate Green InfrastructureThis report is a joint publication of the World Bank and World Resources Institute. Its goal is to encour-age stakeholders in the World Bank’s client coun-tries, including policymakers, government agencies, public utilities, and civil society organizations, to expand their view of infrastructure to include green infrastructure, and then find the appropriate mix of green and gray infrastructure to best meet their development needs. Development partners, such as multilateral development banks and bilateral aid agencies, may also use this report as a resource to support developing countries in mainstreaming combined infrastructure approaches.
Chapters 2 to 6 highlight key considerations for green infrastructure in relation to the technical, social, and economic evaluations used for invest-ment decisions and project management, as well as financial and policy dimensions. Figure 1.4 shows the key opportunities for each of the dimensions, as well as the key questions each chapter addresses. Service providers and other stakeholders should consider this a conceptual road map for integrating green and gray infrastructure. The structure of the report mirrors the project cycle, touching base on the key technical, social, economic, financial, and policy dimensions that practitioners must take into account to operationalize the next generation of infrastructure.
Given the widespread lack of long-term perfor-mance data for global green infrastructure projects, as well as inconsistencies in project assessments, this report is not the final say on how to integrate green and gray infrastructure. Rather, it is a first step in the right direction, compiling real world experiences and insights to guide stakeholders in improving assessment and execution and to encour-age greater deployment worldwide.
Figure 1.5 | Rain Gardens and Other Green infrastructure Reduce Urban Stormwater and Flood Events
Image: NACTO/Flickr.

23Integrating Green and Gray
Figure 1.6 | Framework for Service Providers to integrate Green infrastructure
Source: Authors.
Green infrastructure should be appraised on an equal footing with gray infrastructure, while also taking into account its special characteristics and related risks and opportunities. Key questions and guidance for conducting such an assessment are highlighted below.
TECHNICAL DIMENSIONS: Would green infrastructure lower the cost, increase the quality, or improve the resilience of the service?
▪ identification: Look for opportunities through regional and master planning exercises.
▪ Planning: Undertake planning-level studies using general assessment tools to determine general scope, function, and cost for inclusion in the “infrastructure Master Plan.”
▪ Design: Use best-practice analytical tools to determine the natural system’s potential performance, as well as more precise scope and life–cycle–cost estimates.
▪ Environmental cobenefits: Use best-practice analytical tools to determine these as well as potential negative impacts that need to be mitigated.
SOCIAL DIMENSIONS: is it possible to get multiple stakeholders to support the proposed green infrastructure design?
▪ Land: Ensure that it’s possible to purchase land or influ-ence land use to support the project.
▪ Communities: Obtain local community support, particularly over the long run.
▪ Government and civil society partners: Work with local governments and relevant government agencies in coordi-nation with civil society organizations to help build strong coalitions to support use of natural systems.
▪ Social cobenefits: Develop win-win solutions so that affected communities benefit from green infrastructure; identify any negative social impacts and ensure they are mitigated.
ECONOMIC DIMENSIONS: Can the green infrastructure be justified in terms of cost, as well as in broader economic terms?
▪ Cost-effectiveness: Assess whether the proposed project will reduce or at least not significantly increase the cost of service.
▪ Cobenefits: Account for the environmental and social cobe-nefits using quantitative and qualitative indicators.
▪ Multi-criteria Analysis: Systematically consider all relevant factors, including monetary and nonmonetary benefits to determine if the project is justified.
FINANCIAL DIMENSIONS: Can the green infrastructure be financed and financially sustained over time?
▪ Funding source: Evaluate your funding sources, such as tariffs, taxes, and transfers, and determine how secure these financial flows are over time.
▪ Develop green financing packages: investigate the pos-sibility of packaging green infrastructure as a stand-alone component for financiers seeking sustainable investments.
▪ Market the green infrastructure: Explore government grants or concessionary loans or grants from development partners or the private sector.
ENABLING POLICIES: What can the service provider do to improve the enabling environment for green infrastructure?
▪ Proactive government engagement: interact with governments at multiple levels, from political leaders to government ministries, for assistance with policies, laws, regulations, research, and community outreach.
▪ Development partners: Where appropriate, engage with development partners and specialized civil society organi-zations to help develop and finance the green infrastruc-ture project.
WRI.org 24
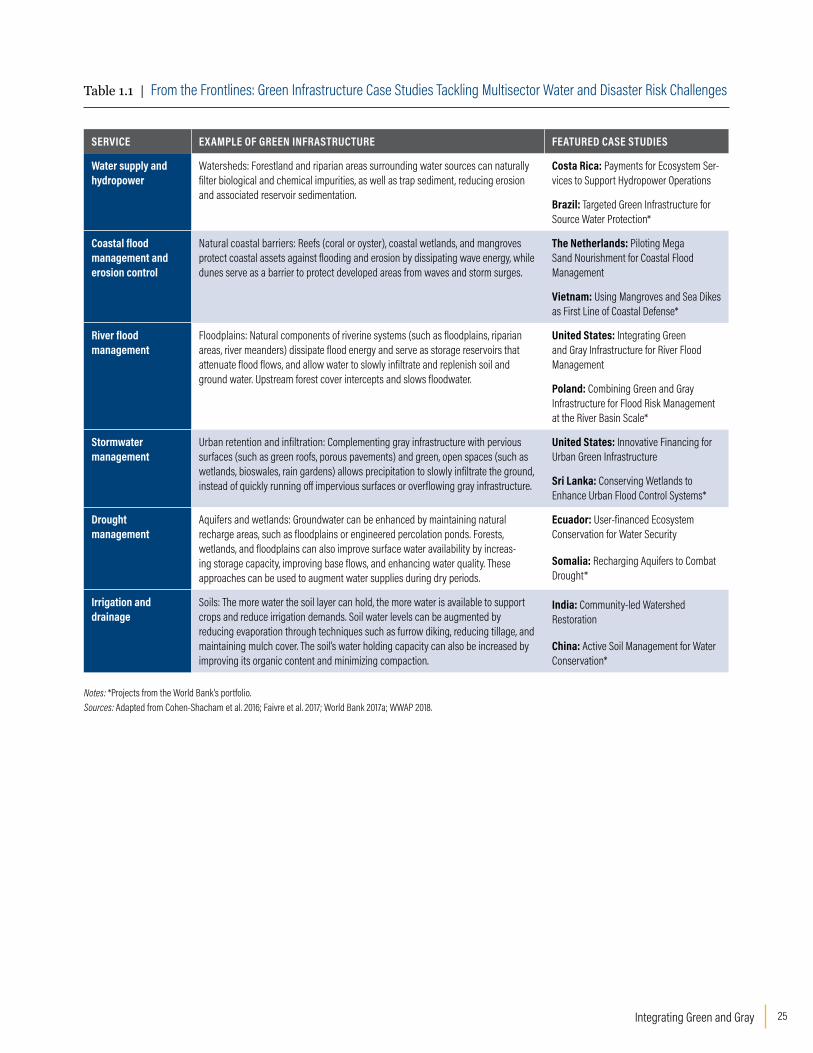
Case Study insights Stakeholders can use the general framework above in relation to almost all infrastructure services that rely on gray infrastructure. However, this report focuses on six key development challenges (see Table 1.1), drawing on a broad literature base as well as 12 case studies to offer practical insights into how to apply the framework to successfully assess and implement green infrastructure. These cases were selected from two sources: a literature review combined with expert consultation, and an inven-tory of projects supported by the World Bank’s Global Practices that integrated green and gray infrastructure.
Of the projects identified through the inventory, six were chosen from the World Bank portfolio as case studies, along with six cases led by other stakeholder groups. Data collection consisted of desktop review of documents, databases, aca-demic journal articles, and expert input. These 12
examples, described in detail in Appendix A, are used to illustrate effective deployment of natural and combined infrastructure systems, and how that experience can be applied more broadly. They highlight the costs and benefits of implementation, innovative or successful financing models, social dimensions, challenges, and lessons learned. They do not necessarily represent the best or most typical use of natural systems, but instead shed light on successful implementation by summarizing proven results or by highlighting unique challenges and approaches.
Readers should note that the cases featured here were evaluated and designed in different ways, and some projects did not conduct a robust assess-ment prior to implementation. Furthermore, given the fledgling state of the sector, only a few offer insights into the long-term performance of green infrastructure.
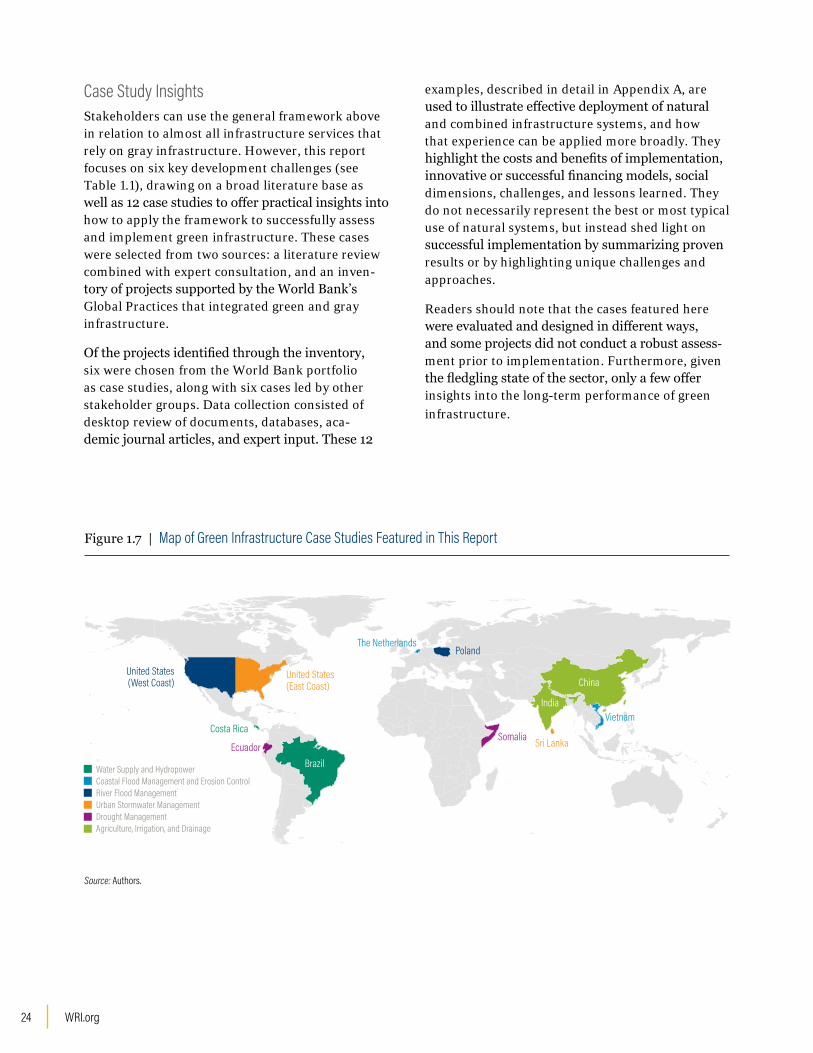
Figure 1.7 | Map of Green infrastructure Case Studies Featured in This Report
Costa Rica
Ecuador
United States(West Coast)
United States (East Coast)
The NetherlandsPoland
Somalia Sri Lanka
India
China
Vietnam
BrazilWater Supply and HydropowerCoastal Flood Management and Erosion ControlRiver Flood ManagementUrban Stormwater ManagementDrought ManagementAgriculture, Irrigation, and Drainage
Source: Authors.
25Integrating Green and Gray
SERVICE EXAMPLE OF GREEN INFRASTRUCTURE FEATURED CASE STUDIES
Water supply and hydropower
Watersheds: Forestland and riparian areas surrounding water sources can naturally filter biological and chemical impurities, as well as trap sediment, reducing erosion and associated reservoir sedimentation.
Costa Rica: Payments for Ecosystem Ser-vices to Support Hydropower Operations
Brazil: Targeted Green infrastructure for Source Water Protection*
Coastal flood management and erosion control
Natural coastal barriers: Reefs (coral or oyster), coastal wetlands, and mangroves protect coastal assets against flooding and erosion by dissipating wave energy, while dunes serve as a barrier to protect developed areas from waves and storm surges.
The Netherlands: Piloting Mega Sand Nourishment for Coastal Flood Management
Vietnam: Using Mangroves and Sea Dikes as First Line of Coastal Defense*
River flood management
Floodplains: Natural components of riverine systems (such as floodplains, riparian areas, river meanders) dissipate flood energy and serve as storage reservoirs that attenuate flood flows, and allow water to slowly infiltrate and replenish soil and ground water. Upstream forest cover intercepts and slows floodwater.
United States: integrating Green and Gray infrastructure for River Flood Management
Poland: Combining Green and Gray infrastructure for Flood Risk Management at the River Basin Scale*
Stormwatermanagement
Urban retention and infiltration: Complementing gray infrastructure with pervious surfaces (such as green roofs, porous pavements) and green, open spaces (such as wetlands, bioswales, rain gardens) allows precipitation to slowly infiltrate the ground, instead of quickly running off impervious surfaces or overflowing gray infrastructure.
United States: innovative Financing for Urban Green infrastructure
Sri Lanka: Conserving Wetlands to Enhance Urban Flood Control Systems*
Drought management
Aquifers and wetlands: Groundwater can be enhanced by maintaining natural recharge areas, such as floodplains or engineered percolation ponds. Forests, wetlands, and floodplains can also improve surface water availability by increas-ing storage capacity, improving base flows, and enhancing water quality. These approaches can be used to augment water supplies during dry periods.
Ecuador: User-financed Ecosystem Conservation for Water Security
Somalia: Recharging Aquifers to Combat Drought*
Irrigation and drainage
Soils: The more water the soil layer can hold, the more water is available to support crops and reduce irrigation demands. Soil water levels can be augmented by reducing evaporation through techniques such as furrow diking, reducing tillage, and maintaining mulch cover. The soil’s water holding capacity can also be increased by improving its organic content and minimizing compaction.
India: Community-led Watershed Restoration
China: Active Soil Management for Water Conservation*
Notes: *Projects from the World Bank’s portfolio.Sources: Adapted from Cohen-Shacham et al. 2016; Faivre et al. 2017; World Bank 2017a; WWAP 2018.
Table 1.1 | From the Frontlines: Green infrastructure Case Studies Tackling Multisector Water and Disaster Risk Challenges


27Integrating Green and Gray
iMPROViNG SERViCE DELiVERY WiTH GREEN iNFRASTRUCTURE ▪ identifying green infrastructure opportunities usually begins in the upstream planning process, for
example through regional, urban, land-use, or master plans.
▪ Predicting technical performance is often imprecise because of the adaptive nature of ecosys-tems—but this very characteristic also contributes to resiliency.
▪ New tools and methods have emerged to better predict how green and combined green-gray infrastructure performs, but monitoring and evaluation during operations is critical.
▪ The expected environmental cobenefits, as well as potential negative impacts, are often central to a project’s overall viability and should be carefully assessed.

WRI.org 28
Service providers typically evaluate infrastructure opportunities through technical assessment, judg-ing infrastructure’s performance on criteria such as service levels, costs, and resilience. However, assessing green infrastructure projects on these grounds, as well as taking into account their unique features, requires utilizing environmental and contextual information that may be new to project developers and evaluators.
SERVICE ILLUSTRATIVE ISSUES EXAMPLES OF PERFORMANCE METRICS
Water supply and hydropower
Watersheds: Conservation of existing forests or reforestation, land terracing, etc., in the upper watersheds. A key technical assessment issue is to what extent these interventions will reduce sediment in rivers that flow into reservoirs or are used for drinking water supplies. For hydropower reservoirs, watershed conservation can influence the hydropower infrastructure life span and operating costs; for water sup-ply, it can influence the performance requirements of water treatment facilities.
Reservoir storage capacity
Energy production capacity and firm power production
Turbidity at water intake point
Fire risk reduction
Land area restored/protected*
Coastal flood management and erosion control
Natural coastal barriers: Conservation or enhancement of mangrove forests, coral reefs, and sand dunes. A key technical assessment is to what extent these interven-tions will reduce wave energy and associated storm surges, thereby reducing coastal flood risk and erosion. The effectiveness of natural systems can influence the design of sea walls and embankments, coastal groynes, and beach sand replenishment.
Decrease in wave/storm surge height
Sand accumulation
Length of coastline protected from storm surge/waves*
River flood management
Floodplains: The maintenance or enlargement of natural floodplains to serve as retention areas for flood waters. A key technical assessment is to what extent these interventions will reduce flood flows and water levels, thus reducing flood risk. The effectiveness of natural floodplains will influence the location and size of flood control embankments.
Magnitude of flood without damage
Floodplain storage capacity
Risk of damage to facilities and infrastructure
Floodplain area connected*
Urban stormwa-ter management
Urban retention and infiltration: Flood retention zones in urban areas, such as lakes and riparian zones, as well as efforts to promote rainwater infiltration—for example through permeable pavements and green roofs. Key technical assessments are to determine the extent to which these interventions reduce stormwater peak flows, as well as the impact on water quality. The effectiveness of green areas will influence the size of stormwater pipes and associated pumps, as well as the need to treat combined storm and wastewater flows.
Decreased runoff
Annual number of sewer/stormwater overflows
Regulatory incompliances
Drought management
Aquifers: The management of groundwater aquifers in coordination with surface water to enhance resiliency. in some cases, aquifer recharge can be facilitated through engineered percolation ponds or check dams. A key technical assessment is to determine the extent to which the storage function of aquifers can be optimized. The effectiveness of aquifers will influence the design and operation of surface water reservoirs.
Quantity of water saved/stored
Depth to groundwater
Dry season stream flows
Lost use of facilities and infrastructure (i.e., downtime)
Irrigation and drainage
Soils: improving soil water retention capacity through agronomic practices, such as furrow diking, reducing tillage, maintaining mulch cover, and improving soil organic content. A key technical assessment is to determine the extent to which these mea-sures will improve the soil water retention capacity and nonbeneficial evaporation, and thus reduce the need for supplemental irrigation. The effectiveness of on-farm practices will influence the design of irrigation and drainage infrastructure, including the requirements for storage, canals, and pumps.
Reduction in irrigation demand
Reduction in drainage flows
increase in crop yields/diversity
Water use efficiency
Land area under improved management*
Note: *intermediate or proxy indicators that do not explicitly link actions to outcomes.
Source: Authors; examples of performance metrics adapted from Gray et al. (in review).
Table 2.1 | issues to include in Green infrastructure Technical Assessment, Examples by Service
Table 2.1 highlights some key issues for service providers to focus on in assessing natural systems and their relation to associated gray infrastructure. This chapter then examines how to identify green infrastructure opportunities in the broader plan-ning context, and to design, monitor, and evaluate such projects.
29Integrating Green and Gray
Identifying Green Infrastructure Opportunities in Planning ProcessesOpportunities for enhancing gray infrastructure with natural systems are not always easy to identify within the context of normal planning processes, as sectoral responsibilities and administrative jurisdictions may complicate efforts to identify and incorporate such projects. These challenges can be addressed by adjusting both regional planning and infrastructure master planning.
Regional planning processes: A wide variety of regional and/or sectoral planning processes, such as land-use master plans, coastal zone plans, forest management plans, national or state-level water resources plans, and river basin plans can be used to identify potential green infrastructure opportunities. Good practice entails identifying—at least at a conceptual level—the linkages between forests, wetlands, agricultural land use, and water infrastructure functions, such as those related to this report’s six service areas. For water resources plans, potential linkages should naturally emerge through due diligence. Regional planning processes are an ideal mechanism for identifying project opportunities that service providers could further analyze in terms of feasibility.
Infrastructure master planning: Agencies responsible for water services undertake periodic master planning exercises, typically on a five-year cycle with annual updates, to formulate their investment program and financial needs. These agencies include water utilities, water resource and agricultural agencies, power companies, and oth-ers. Good practice would entail including potential green infrastructure investments in their menu of options, with these ideally having been identi-fied during the regional planning process. Master plans typically consider investments at either the prefeasibility or feasibility level. Given their relative complexity, investments in green infrastructure would probably fall under the first category. But if such opportunities can be confirmed as feasible at this stage, then resources can be directed to undertaking detailed feasibility and design stud-ies and explicitly considering linkages with gray infrastructure.
As they ponder strategic pursuit of green infra-structure, planners should be aware of the range of contributions it can make to better service and other outcomes. For example, green infrastructure can do the following:
▪ Reduce gray infrastructure require-ments: In the United States, the filtration services provided by the healthy forests sur-rounding water supply in Portland, Maine, substituted the need for a water filtration plant, saving the city an estimated $97 to $155 mil-lion over 20 years (Gartner et al. 2013). Box 2.1 provides another example where green has substituted for gray infrastructure. Very rarely, however, will an entire infrastructure project meet service standards through green infra-structure alone.
▪ Complement gray infrastructure compo-nents, enhancing overall service provi-sion: In Colombo, Sri Lanka, urban wetlands and flood retention parks complement the gray stormwater system by allowing for the slow infiltration and filtering of stormwater into the ground, decreasing the volume of water that moves through the gray system (see Appendix A, case 4.B).
▪ Safeguard gray infrastructure assets, acting as a first line of defense and/or system redundancy in the face of a changing climate: In the Philippines, mangroves, reefs, and other natural systems annually avert more than $1 billion in dam-ages to residential and industrial infrastruc-ture (Tercek and Beck 2017). Including green infrastructure components as added layers of protection may be especially applicable for sec-tors or projects with low tolerance for failure or that face high climate risk.
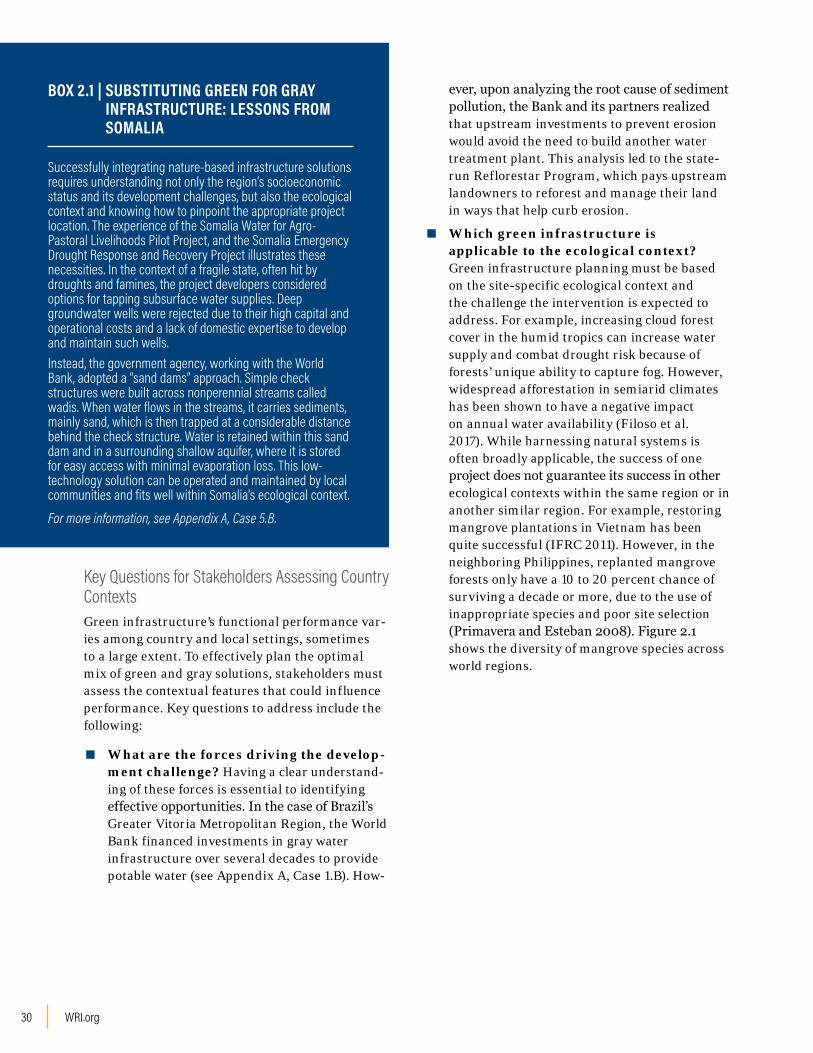
WRI.org 30
Key Questions for Stakeholders Assessing Country ContextsGreen infrastructure’s functional performance var-ies among country and local settings, sometimes to a large extent. To effectively plan the optimal mix of green and gray solutions, stakeholders must assess the contextual features that could influence performance. Key questions to address include the following:
▪ What are the forces driving the develop-ment challenge? Having a clear understand-ing of these forces is essential to identifying effective opportunities. In the case of Brazil’s Greater Vitoria Metropolitan Region, the World Bank financed investments in gray water infrastructure over several decades to provide potable water (see Appendix A, Case 1.B). How-
BOX 2.1 | SUBSTITUTING GREEN FOR GRAY INFRASTRUCTURE: LESSONS FROM SOMALIA
Successfully integrating nature-based infrastructure solutions requires understanding not only the region’s socioeconomic status and its development challenges, but also the ecological context and knowing how to pinpoint the appropriate project location. The experience of the Somalia Water for Agro-Pastoral Livelihoods Pilot Project, and the Somalia Emergency Drought Response and Recovery Project illustrates these necessities. in the context of a fragile state, often hit by droughts and famines, the project developers considered options for tapping subsurface water supplies. Deep groundwater wells were rejected due to their high capital and operational costs and a lack of domestic expertise to develop and maintain such wells.instead, the government agency, working with the World Bank, adopted a “sand dams” approach. Simple check structures were built across nonperennial streams called wadis. When water flows in the streams, it carries sediments, mainly sand, which is then trapped at a considerable distance behind the check structure. Water is retained within this sand dam and in a surrounding shallow aquifer, where it is stored for easy access with minimal evaporation loss. This low-technology solution can be operated and maintained by local communities and fits well within Somalia’s ecological context.
For more information, see Appendix A, Case 5.B.
ever, upon analyzing the root cause of sediment pollution, the Bank and its partners realized that upstream investments to prevent erosion would avoid the need to build another water treatment plant. This analysis led to the state-run Reflorestar Program, which pays upstream landowners to reforest and manage their land in ways that help curb erosion.
▪ Which green infrastructure is applicable to the ecological context? Green infrastructure planning must be based on the site-specific ecological context and the challenge the intervention is expected to address. For example, increasing cloud forest cover in the humid tropics can increase water supply and combat drought risk because of forests’ unique ability to capture fog. However, widespread afforestation in semiarid climates has been shown to have a negative impact on annual water availability (Filoso et al. 2017). While harnessing natural systems is often broadly applicable, the success of one project does not guarantee its success in other ecological contexts within the same region or in another similar region. For example, restoring mangrove plantations in Vietnam has been quite successful (IFRC 2011). However, in the neighboring Philippines, replanted mangrove forests only have a 10 to 20 percent chance of surviving a decade or more, due to the use of inappropriate species and poor site selection (Primavera and Esteban 2008). Figure 2.1 shows the diversity of mangrove species across world regions.

31Integrating Green and Gray
▪ What is the appropriate siting location and scale for the project? Planning pro-cesses should identify the general location and spatial extent to produce desired outcomes, as well as identify priority areas to focus efforts. For example, proper siting of groundwater recharge mechanisms requires considering factors such as slope, drainage, land use/land cover, lithology, geomorphology, and soil char-acteristics. A technical assessment of these fac-tors in Somalia identified 15 priority sites in the beds of ephemeral rivers on which to develop sand dams (see Appendix A, Case 5.B).
▪ What is the socioeconomic status of the region? As Box 2.1 illustrates, in fragile and underresourced countries, technical and capacity limitations may cause project develop-ers to rely more on local communities, rather than draw on government agencies or private industry. Green infrastructure projects that are managed by communities often have an advantage in such settings over more complex built solutions.
Figure 2.1 | Mangrove Species Only Thrive in Specific Eco-regions
Source: Deltares 2014.
High-Level Assessment ToolsLarge-scale and coarser resolution assessment tools can relatively quickly perform a high-level assess-ment that agencies can use to identify and prioritize areas with green infrastructure potential during the planning process. Table 2.2 contains examples of tools with global or countrywide coverage that have the capability for this type of reconnaissance-level survey. These may be useful for national or regional decision-makers seeking locations where harnessing natural systems might deliver suitable solutions for addressing development challenges.
1-2 3-4 5-8 9-12 13-16 17-20 21-25 26-35 36-40 41-47Mangrove Species
40°N
20°N
0°
20°S
40°S

WRI.org 32
SERVICE EXAMPLE OF LARGE-SCALE TECHNICAL ANALYSIS TOOLS
Water supply and hydropower Global Forest Watch–Watera combines global data on water stress with near real time, high-resolution data on tree cover change, enabling users to view where ecosystem change may be having adverse impact on water resources. it helps users identify which of their sites are exposed to water risks because of loss and degradation of natural infrastructure.
Coastal flood management and erosion control
Coastal Resilienceb is an approach and web-based mapping tool designed to help communities understand their vulnerability to coastal hazards, reduce their risk, and determine the value of green infrastructure. The tool’s apps enable planners and decision-makers to visualize current and future risk and then identify a suite of infrastructure solutions that reduce social and economic risks, while maximizing the benefits and services provided by nature. Cur-rently, the Coastal Resilience apps encompass 17 coastal states in the Caribbean, Mexico, and Central America.
River flood management Aqueduct Global Flood Analyzerc provides users with an open-access online platform to quantify and monetize river flood risks worldwide. The tool estimates current and potential future effects on GDP, the affected population, and urban damage from river floods for every state, country, and major river basin in the world.
Urban stormwater management Urban Water Blueprint Mapd estimates the level of conservation of permeable areas needed to achieve a reduction in sediment and nutrients for more than 500 cities worldwide.
Drought management Aqueduct Water Risk Atlase is a global water risk mapping tool that helps companies, investors, governments, and other users understand where and how water risks and opportunities are emerging worldwide. it uses the best available data to create high-resolution, customizable global maps of water risk but does not evaluate options for green infrastructure.
Irrigation and drainage Soil Moisture Active Passive (SMAP)f measures—and produces global maps of—soil moisture every two to three days over a three-year period. This soil moisture information is key to understanding the flows of water and heat energy between the surface and atmosphere and the potential role of green infrastructure in retaining soil moisture.
Sources: a WRi 2016; b TNC 2016; c WRi 2015; d TNC 2014; e WRi 2013; f NASA 2017.
Table 2.2 | Tools for General identification of Green infrastructure Opportunities
Green infrastructure Time FramesIdentifying and incorporating opportunities into national or regional planning processes entails careful sequencing of natural and gray components. For example, solutions that involve restoration or change in management of natural resources may require a longer time horizon than built solutions before benefits reach their intended threshold (Fig-ure 2.2). For example, it takes coral reefs at least two to five years to grow and reproduce, and longer before they reach a size and maturity to stabilize shorelines. Similarly, by some estimates it takes
about four decades for a restored tropical forest to fully recover its structure and ecosystem functional-ity. Assuming that green infrastructure’s functional-ity develops at similar rates, restoring forests may yield some infrastructure benefits in the short term, but will likely not reach full potential for 40 years. Not all projects, however, need to reach 100 percent of their potential to meet baseline goals for service delivery. Likewise, some green infrastructure sys-tems may have higher functionality during grow-ing seasons and less functionality in winter or dry seasons when plants are dormant; service providers must take these fluctuations into account.

33Integrating Green and Gray
Assessing Technical Performance Once relevant agencies have identified opportuni-ties through a broad planning process, service providers and their development partners can design and appraise specific green infrastructure projects. Key considerations in the design process include prioritizing high-impact interventions and areas, evaluating technical performance, assessing cobenefits and environmental impacts, and under-standing risk and uncertainty.
At the project level, green infrastructure designers often use modeling tools that can quantitatively assess site-specific biophysical performance metrics to develop an optimal green infrastructure strat-egy. While gray infrastructure engineering models mainly tend to be deterministic, models that assess
green infrastructure are more probabilistic and require much larger-scale inputs, such as land use, hydrological conditions, and ecosystem responses, among others.
A growing set of models and software tools are now available to support such modeling, as shown in Table 2.3. In combination with modeling, or where modeling is not feasible, the technical merit of green infrastructure can be evaluated using expert opinion, and local stakeholder guidance solicited to develop solutions and estimate likely outcomes. Since use of green infrastructure is closely aligned with traditional and local knowledge of ecosystem functioning and nature-society interaction, includ-ing this knowledge in technical evaluations can be invaluable (WWAP 2018; Nesshöver et al. 2017).
Figure 2.2 | Varying Time Frames for Achieving Benefits with Green or Gray Components
Figure 2.3 | integrating Communities’ Local Knowledge Enhances Modeling Tools for Green infrastructure Planning
Note: For illustrative purposes.
Source: Adapted from Bloomberg and Holloway 2018.
Image: WOTR/Flickr.
Bene
fits
Time (years)
Restored green infrastructure
Built infrastructure

WRI.org 34
SERVICE EXAMPLES OF PROJECT-LEVEL TECHNICAL ANALYSIS TOOLS
Water supply and hydropower
Soil and Water Assessment Tool (SWAT)a predicts the environmental and hydrological impact of land-use change at a watershed scale.
Forest Service Water Erosion Prediction Project (FS WEPP) Modelb is a set of interfaces designed to allow users to quickly evaluate erosion and sediment delivery potential from forests. The model predicts erosion rates and sediment delivery using input values for forest conditions developed by scientists at the Rocky Mountain Research Station, part of the U.S. Forest Service.
Spreadsheet Tool for Estimating Pollutant Load (STEPL)c calculates nutrient and sediment loads from different rural land uses and best management practices on a watershed scale. The tool provides a user-friendly interface to create a customized spreadsheet-based model in Microsoft Excel. it computes watershed surface runoff; nutrient loads, including nitrogen, phosphorus, and five-day biological oxygen demand; and sediment delivery. The annual sediment load is calculated based on the Universal Soil Loss Equation and the sediment delivery ratio. The sediment and pollutant load reductions that result from implementing best management practices are computed using the relevant known efficiencies.
Coastal flood management and erosion control;
river flood management
Xbeachd is a two-dimensional model for wave propagation, long waves and mean flow, sediment transport, and morphological changes of the near-shore area, beaches, dunes, and back-barrier during storms.
Hydrologic Engineering Center Flood Damage Assessment (HEC–FDA)e software provides the capability to perform an integrated hydrologic engineering and economic analysis when formulating and evaluating flood risk management plans.
MIKE FLOODf includes a wide selection of specialized 1D and 2D flood simulation engines, with the ability to model flooding involving rivers, flooding in streets, floodplains, drainage networks, coastal areas, dams, levee and dike breaches, or any combination of these.
Urban stormwater management
MIDS Calculatorg is an Excel-based stormwater quality tool to predict the annual pollutant removal performance of low-impact development best management practices. The calculator will compute the volume reduction associated with infiltration practices, plus the total suspended solids and total phosphorus reductions for practices including permeable pavements, green roofs, bioretention, bioretention with underdrain (biofiltration), infiltration basin, tree trench, tree trench with underdrain, swale side slope, swale channels, swales with underdrains, wet swale, cistern/reuse, sand filter, constructed wetland, and constructed stormwater pond.
System for Urban Stormwater Treatment and Analysis Integration (SUSTAIN)h assists stormwater professionals in developing and implementing plans for stormwater flow and pollutant controls on a watershed scale. SUSTAiN contains seven modules that integrate with ArcGiS. Hydrology, hydraulics, and pollutant loading are computed using EPASWMM, Version 5.
Drought management
Groundwater and Surface-water FLOW (GSFLOW)i is a coupled groundwater and surface-water flow model based on the USGS Precipitation-Runoff Modeling System (PRMS) and Modular Groundwater Flow Model (MODFLOW). GSFLOW can be used to evaluate the effects of factors such as land-use change, climate variability, and groundwater withdrawals on surface and subsurface flow for watersheds that range from a few square kilometers to several thousand square kilometers, and for time periods extending from months to several decades.
Agriculture, irrigation, and drainage
Agricultural Production Systems Simulatorj simulates biophysical processes in agricultural systems, particularly as they relate to the economic and ecological outcomes of management practices in the face of climate risk.
Source: a USDA-ARS and Texas A&M 2018; b USFS n.d.; c USEPA 2018a; d Deltares et al. n.d.; e USACE n.d.; f DHi n.d.; g Minnesota Pollution Control Agency 2017; h USEPA 2018b; i USGS n.d.; j APSiM 2018.
Table 2.3 | Tools for Technical Analysis of Proposed Green infrastructure Projects

35Integrating Green and Gray
The sophistication of the model that stakeholders choose should align with the project scale and costs. For example, the Sand Motor project in the Nether-lands required enlistment of the consultant Deltares to develop complex modeling tools on coastal mor-phology, aeolian transport, and fresh groundwater resources, to help ensure that the costly investment would perform optimally (see Box 2.2).
Smaller-scale projects, such as community-led watershed restoration in India (see Appendix A, Case 6.A) have been undertaken, based only on a qualitative understanding of benefits and project performance, without any quantitative modeling.
BOX 2.2 | ADVANCED MODELING AND MONITORING: THE NETHERLANDS SAND MOTOR
To prevent shoreline erosion, the coast of southern Holland has long required constant maintenance—through the deposit of new sand in small, targeted locations along the coastline, which is an expensive operation. An innovative approach to reducing costs harnesses the natural power of the sea for depositing sand along the coastline. The Sand Motor project, launched in 2011, off the Delfland Coast, applies a large volume of sand (21.5 million cubic meters) in a single operation and relies on natural ocean currents to distribute the sand across the coast. Over 20 years, the Sand Motor will be fully incorporated into the coastline, making communities safer and providing more space for nature and recreation. To receive approval, this project required a comprehensive technical assessment based on sophisticated cost-benefit marine modeling (Taal et al. 2016). The ultimate design was determined by comparing the Sand Motor’s predicted economic and environmental effects to business as usual. Researchers mapped the expected environmental impacts with a qualitative ranking system and used quantitative modeling tools to predict the coast’s morphological changes under the proposed project. Design workshops brought together experts from several disciplines, including morphologists, ecologists, and dredging operation specialists. This integrated approach was instrumental in achieving the Sand Motor’s multifunctional design. Since there is always uncertainty in modeling natural systems, an extensive monitoring and evaluation program was also implemented. The photos below show the coastline’s development over the project’s first five years.
July 2011 August 2016
When analyzing how to improve watershed water quality in the U.S. city of Portland, Maine, local stakeholders helped identify five forest-based solu-tions that would help water quality over the next 20 years. These included riparian buffers, upgrades to culverts, third-party sustainability certification of future timber harvests and forest management, reforestation of riparian zones, and conserva-tion easements. The local water provider and civil society partners then consulted specific studies and data sources to determine the extent to which each green infrastructure option would be available and feasible (Talberth et al. 2013).
Source: De Zandmotor 2018.
For more information, see Appendix A, Case 2.A. Images: Zandmotor/Flickr.

WRI.org 36
Assessing Cobenefits and Environmental Impact Careful design of green infrastructure projects can ensure that they not only serve their primary protective objective, but also deliver a wide range of ancillary benefits. The latter may include increased biodiversity, carbon sequestration, improved livelihoods and welfare among vulnerable people and communities, decreased heat island effect, increased resilience and adaptive capacity, improved public health, and much else (WWAP 2018). Delivering these wide-ranging and impactful cobenefits through infrastructure projects can be advantageous for governments and development partners that have a mission to alleviate poverty and achieve sustainable development.
However, while such cobenefits can be substantial, it is not guaranteed that all environmental impacts will be positive. For example, green infrastructure that utilizes nonnative trees could displace habitat, and may be ill-suited to resisting local pests and diseases, resulting in broader tree cover loss and habitat degradation. Avoiding or minimizing such negative impacts can be achieved relatively easily by conducting a technical assessment of a proposed project’s natural elements and its predicted interac-tions with the surrounding environment.
In addition, green infrastructure’s cobenefits can be enhanced, and negative environmental impacts avoided, through intentional design. A thorough assessment of benefits and trade-offs allows project developers to design a master plan of infrastructure solutions that takes advantage of nature’s regenera-tive processes to generate multiple benefits. Holistic technical analyses necessitate interdisciplinary work across domains such as ecology, economics, engineering, sociology, tourism, and urban plan-ning, to coordinate the most effective strategies. Such interdisciplinary assessments can also be used to adjust project design in ways that equitably bal-ance the distribution of benefits while minimizing negative trade-offs. Box 2.3 provides an example of how multibenefit analysis can determine a path forward to achieve optimal impacts.
BOX 2.3 | THE MANY USES OF GREEN INFRASTRUCTURE: LESSONS OF A CALIFORNIA FLOOD RETENTION PROJECT
The Yolo Bypass is a 240 square kilometer wetland area along a natural depression near Sacramento and an important feature of California’s flood containment infrastructure. A set of weirs diverts water from the Sacramento River into the Yolo Bypass. One weir passes floodwaters by gravity once it reaches a certain level, while the other is actively managed using floodgates operated by the state’s Department of Water Resources, according to regulations established by the U.S. Army Corps of Engineers. All water exits the Yolo Bypass through its “toe drain” into the Sacramento–San Joaquin Delta. The bypass floods as early as October and as late as June each year and can store as much as 80 percent of floodwaters during large events.
The system was completed in 1924, and over time multiple cobeneficial uses have emerged. Approximately two-thirds of the area is privately owned by farmers who take advantage of the rich and moisture-laden soils during the dry season. The basin also includes a 64 square kilometer designated wildlife area managed by the state’s Department of Fish and Wildlife. This sustains nearly 200 species of birds and one of the highest salmon populations in California, and provides a haven for recreation and bird watching.
For more information, see Appendix A, Case 3.A.

37Integrating Green and Gray
Understanding and Managing UncertaintyUncertainty is not a new concept to engineers and decision-makers, who must often develop strategies to minimize risks of project failure. Green infra-structure design, however, must manage dynamic sources of uncertainty due to the adaptive nature of ecosystems, thus requiring perceptive approaches to characterize and minimize project risks (Seastedt et al. 2008). For example, human-induced distur-bances can degrade coral reefs, causing grazers to leave the habitat and algae to replace hard coral. Even if restoration efforts are subsequently under-taken to cultivate coral reefs for coastal protection, the degraded system may have already shifted to a new state that cannot be restored to its previous condition (Suding et al. 2004).
Risk and uncertainty assessments can mitigate such risks by accounting during project design for site-specific constraints and the interconnected dynam-ics of the local environment. At the same time, green infrastructure solutions generally offer great potential to naturally regenerate after a hazard, and to adapt to changing climate conditions, providing added value in terms of project resilience.
In the future, projects designed to harness the regenerative properties of nature could easily require less maintenance than built solutions.
However, both green and gray infrastructure face risks of damage and destruction by natural hazards. Pests and disease may wreak havoc on wetlands designated for flood control, for example. An oil spill may harm oyster reefs for coastal protection, or an uptick in global commodity prices may incite development of a watershed designated for source water protection. The current lack of site-specific empirical data on green infrastructure performance also contributes to high uncertainty levels. As more performance data are collected, this source of uncertainty will be reduced.
Traditional approaches to managing uncertainty, such as building excess capacity or redundan-cies into the system, apply to both gray and green options. Whereas gray infrastructure redundancies may include having backup technologies at the ready in case of failure, nature-based “redundan-cies” may include intermixing tree species with different drought tolerances or utilizing multiple interventions. Combining green and gray infra-structure can also increase project resilience to uncertain and changing conditions. For example, both the Yolo Bypass and Poland’s Raciborz Dry Polder system operate as one of several nature-based flood retention basins within larger systems, and total flood retention capacity is greater than that of the storm size they are designed to protect against (see Appendix A, Cases 3.A and 3.B).
Figure 2.4 | Restoring Meanders Alleviates Flooding by Giving Room to the River
Image: World Bank.

WRI.org 38
Recently, the deep uncertainty associated with ris-ing global temperatures and ongoing socioeconomic pressures has led to increased focus on resilient and robust strategies that perform reasonably well over a range of future conditions. As a result, research organizations, governments, and development banks have developed new evaluation approaches in recent years to assess the robustness, rather than the optimization, of development projects under climate change. These include decision-scaling (Brown et al. 2012), eco-engineering decision-scal-ing (Poff et al. 2016), robust decision-making (Lem-pert et al. 2003; Lempert and Kalra 2011; Sayers et al. 2012), info-gap theory (Hall and Harvey 2009), and others summarized in Garcia et al. (2014) and Ray and Brown (2015).
For example, one strategy for robust and resilient green infrastructure might involve the selection of a diverse range of native plant species whose climatic range covers both current conditions and climate change projections. Another might develop floodplains to accommodate projected increases in the size of extreme storms, while also providing benefits for recreation, agriculture, and habitat, whether or not flood magnitude increases.
Monitoring and Evaluation Due to the dynamic nature and inherent uncer-tainty of green infrastructure described above, it is
essential that service providers and their develop-ment partners develop, finance, and implement a robust monitoring and evaluation plan. Tracking long-term monitoring data allows stakeholders to identify needs for adaptive management and opportunities to improve performance. A growing evidence base for green infrastructure’s techni-cal performance, linking actions to outcomes, will help to inform its appropriate usage and determine when and how such projects meet the needs of the development community.
Many development projects, in general, do not invest heavily in monitoring and evaluation, primarily due to a lack of funds and/or inadequate appreciation of its crucial function. This is espe-cially problematic for green infrastructure, which cannot be fairly assessed without long-term moni-toring since it can often take much longer to yield benefits, compared to gray infrastructure, which can begin full operation soon after construction. Ozment et al. (2016) found that watershed invest-ment programs in the United States often overlook the importance of monitoring until a project is well under way. By establishing a monitoring program that fits the temporal scale of nature-based solu-tions, project developers will be able to appease investors and other stakeholders, who may feel uneasy about the slower gains.
Figure 2.5 | New Technologies Can Support Green infrastructure Planning and Monitoring
Image: David Godwin, Southern Fire Exchange/Flickr.

39Integrating Green and Gray
As an example, after eight years in existence, the Quito Water Fund (Fondo para la Protección del Agua, FONAG) in Ecuador began implementing a hydrologic data management program in 2008 with a long-term monitoring horizon of 30 years (see Appendix A, Case 5.A). FONAG now includes funding for monitoring in its budget and expects the fund to be able to cover future associated costs (Encalada et al. 2015). Though there is no analy-sis of the project’s direct impacts during its first decade, project managers are confident that future performance will be evaluated to guide adaptive management going forward.
Monitoring green infrastructure that covers large geographical areas may require data collection and analysis at the local, regional, national, and even international scales. As solutions at various geo-graphic levels are not exclusive, effective evaluation may also necessitate upscaling and downscaling monitoring results, as well as coordinated process-ing and communication among agencies at different governance levels (Nesshöver et al. 2017). Newer technologies, such as remote sensing, can support stakeholders by providing faster and more cost-effective information for monitoring large-scale projects (Box 2.4).
BOX 2.4 | USING REMOTE SENSING FOR GREEN INFRASTRUCTURE MONITORING: LESSONS FROM CHINA
China’s government recently conducted a conservation project to reduce water use by controlling evapotranspiration from cropland. The North China plains rely on groundwater for irrigation, and any excess that does not evaporate returns to the aquifer for reuse. Hence, the green infrastructure project sought to reduce nonbeneficial water loss from cropland by maximizing water retention in the soil alongside the use of supplemental gray irrigation provided by groundwater pumps. Project managers used new technologies based on remote sensing techniques and complex algorithms to estimate evapotranspiration, and then achieved reductions through agronomic measures including land leveling, maintaining soil cover, reducing tillage, and wind breaks. Results included increasing kilograms of wheat produced per cubic meter of evapotranspiration from 1.01 to 1.84—almost a doubling of water use efficiency.For more information, see Appendix A, Case 6.B.
Figure 2.6 | Flood Risk Monitoring
Image: U.S. Geological Survey/Flickr.


41Integrating Green and Gray
THE SOCiAL FOUNDATiON OF GREEN iNFRASTRUCTURE ▪ Green infrastructure typically has a significant land footprint, which can be a complicating
factor due to the need to acquire property or modify land-use practices, which increases transaction costs.
▪ Communities are often responsible for long-term operation, and thus their support is critical to a project’s viability.
▪ Water-related service providers must typically work with other key stakeholders, including local governments and civil society organizations, to broker and sustain green infrastructure.
▪ Properly implemented, green infrastructure may generate significant social cobenefits in terms of community empowerment. At the same time, service providers and their partners must apply social safeguards to ensure no negative impacts occur.

WRI.org 42
Social dimensions are key to the viability and sustainability of infrastructure projects that harness natural systems such as forests, floodplains, aqui-fers, and soils. Most importantly, such interven-tions typically have larger land footprints than gray infrastructure and require extensive consultations and buy-in from affected communities to secure land-use agreements.
Establishing social safeguards involving land acqui-sition and indigenous peoples, and paying atten-tion to social inclusion issues, especially gender, are also requirements that yield positive benefits.
SERVICE ILLUSTRATIVE SOCIAL ISSUES AND APPROACHES
Water supply and hydropower Watersheds: Upper watershed areas often include indigenous peoples who rely on forests for their livelihoods. Tailored consultation processes that are culturally suitable for indigenous peoples are indispensable for ensuring local communi-ties are engaged in sustainable forest protection activities. Watershed protection interventions often face the issue of illegal logging by outsiders. Special attention should be paid to gender as women’s livelihoods may be affected differently than men’s.
Coastal flood management and erosion control
Natural coastal barriers: Maintaining natural coastal defenses requires close collaboration with local communities. Maintaining reefs often involves working with fishermen and divers to avoid activities that cause damage. Sustaining or creating new mangroves typically involves working with the aquaculture industry; while maintaining buffer zones often involves working with developers and local farmers.
River flood management Floodplains: Typically boasting rich soils and found on prime agricultural land, natural floodplains are usually main-tained by limiting new development while working with farmers to allow for temporary inundation of farmland.
Urban stormwater management
Natural retention: Flood retention areas in urban settings are often inhabited by poor communities’ informal settle-ments. Maintaining and expanding such areas typically involves preventing families from building on or near flood-prone areas, and relocating households.
Drought management Aquifers: Maintaining or increasing groundwater recharge areas often requires limiting land use. Service providers may face many of the same social issues encountered in river flood management and urban stormwater management.
Agriculture, irrigation, and drainage
Soils: improving soil water conservation requires working directly with farmers and incentivizing them to adopt new agronomic practices, either through education or economic incentives.
Source: Authors.
Table 3.1 | Engaging Communities: Key Social issues by Type of intervention
In addition, community stewardship of projects is often necessary to ensure long-term viability of the investment. While all of this requires a large investment of time and resources, the right types of engagement can bear significant dividends.
As the examples in Table 3.1 suggest, many green infrastructure interventions can help empower local communities and promote inclusion, while provid-ing valuable contributions to broader infrastructure service objectives.

43Integrating Green and Gray
The social dimensions of green infrastructure neces-sitate a very different approach than gray infrastruc-ture, due to two key considerations discussed below:
▪ Communities are typically critical to project success since they steward the land and habitats being harnessed as infrastructure solutions.
▪ Service providers need support from govern-ment agencies and civil society organizations in addressing the social aspects of effective green infrastructure projects, which represent a new approach to doing business.
Communities Are Key to SuccessGray infrastructure requires long-term operations and maintenance, which is typically the direct respon-sibility of the service provider. Effective green infra-structure, on the other hand, often requires the active support of dynamic local communities, which gener-ally depends on close collaboration with the service provider.
While both gray and green infrastructure projects can raise tough decisions for local communities about land use, livelihoods, and even way of life, communi-ties often take on central roles in delivering nature-based project outcomes, and therefore face different decisions. For example, source water protection projects often contract landowners to implement new farming practices or restrict farming on their lands to
provide downstream water benefits. In addition, com-munity members and private landowners are often responsible for regular maintenance and adaptive management. This can include tasks such as replant-ing trees, maintaining water retention structures, or thinning forests for fire management. The resilience of projects to environmental and social risks also frequently relies on local knowledge of the land and communal stewardship. This raises the stakes for ensuring that community buy-in is durable, that com-munities have the capacity to take on such roles, and that legal contractual obligations are well-understood and agreed upon.
Making this happen depends on comprehensive social analysis that carefully considers the willingness and capacity of local stakeholders to participate in a planned project over the long term. A social inclusion strategy capable of facilitating two-way communica-tion is advisable to inform project design and ensure communities have fair deciding power over design and implementation. This approach also benefits proj-ect developers by homing in on the features and ben-efits that are most important to ensuring long-term community buy-in. Education and capacity-building are also more common features of well-planned green infrastructure projects, compared with built solutions. Box 3.1 showcases an exemplary community-owned project in India that has driven development and social inclusion.
BOX 3.1 | COMMUNITY-LED RESTORATION DRIVES LONG-TERM SUCCESS: LESSONS FROM INDIA
A participatory watershed development project across the Kumbharwadi Basin in Maharashtra State, led by the Watershed Organization Trust (WOTR), illustrates how extensive stakeholder engagement can secure community ownership and buy-in for green infrastructure projects.All villagers underwent hands-on training, and learned about conservation, sustainable land management, and green infrastructure maintenance practices before any interventions were implemented. in integrating social dimensions of the project, special attention was paid to the different roles of men and women in the community through the use of WOTR’s Participatory Net Planning methodology. The villagers formed a community committee with proportional socioeconomic and gender representation of households. in addition, local youth were trained to work on the project, which proved crucial for the sustainable management of land and water resources and to secure long-term community support. Between 1998 and 2012, the collective net agricultural income of affected villagers increased from $69,000 per year to $625,000 per year, due to better crop yields, more land under cultivation, and the ability to shift to more valuable crops (Gray and Srinidhi 2013). The cumulative benefits were nearly three times the total costs of the program.Due to its success in capturing the complexity of equitable social inclusion, WOTR’s Participatory Net Planning tool has become widely used by state governments in india as well as by the National Bank for Agriculture and Rural Development (Kale and D’souza 2014).For more information about this project, see Appendix A, Case 6.A.
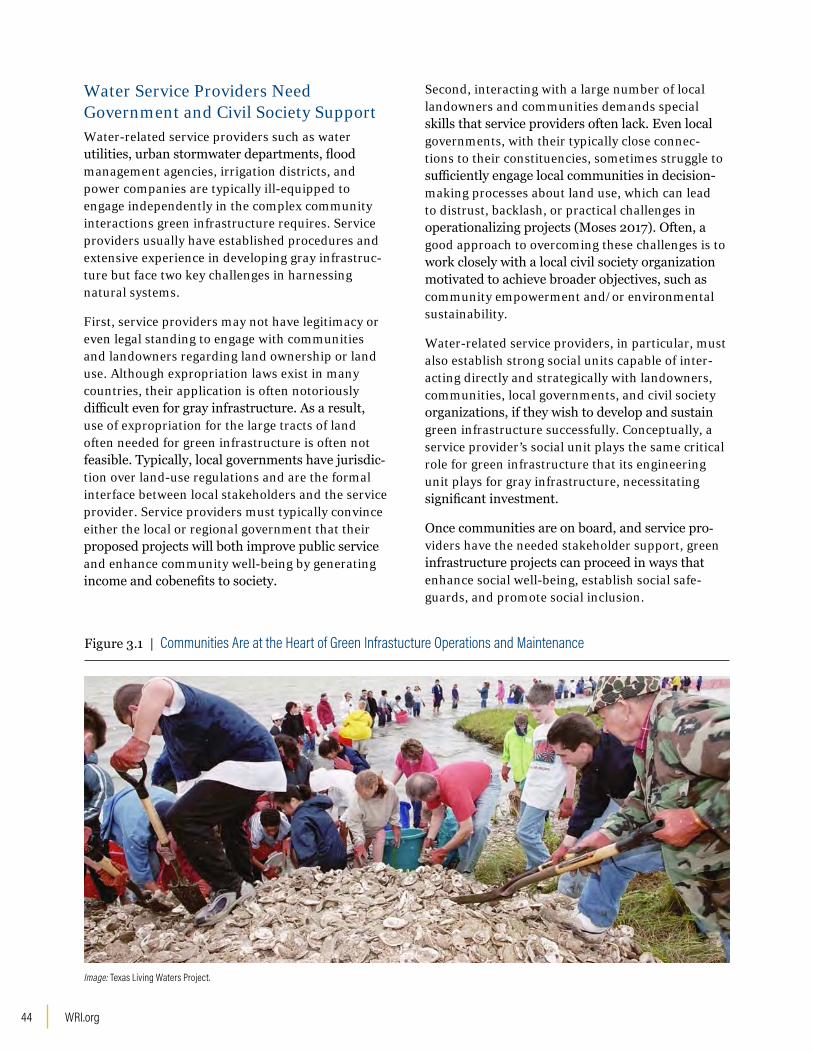
WRI.org 44
Water Service Providers Need Government and Civil Society SupportWater-related service providers such as water utilities, urban stormwater departments, flood management agencies, irrigation districts, and power companies are typically ill-equipped to engage independently in the complex community interactions green infrastructure requires. Service providers usually have established procedures and extensive experience in developing gray infrastruc-ture but face two key challenges in harnessing natural systems.
First, service providers may not have legitimacy or even legal standing to engage with communities and landowners regarding land ownership or land use. Although expropriation laws exist in many countries, their application is often notoriously difficult even for gray infrastructure. As a result, use of expropriation for the large tracts of land often needed for green infrastructure is often not feasible. Typically, local governments have jurisdic-tion over land-use regulations and are the formal interface between local stakeholders and the service provider. Service providers must typically convince either the local or regional government that their proposed projects will both improve public service and enhance community well-being by generating income and cobenefits to society.
Second, interacting with a large number of local landowners and communities demands special skills that service providers often lack. Even local governments, with their typically close connec-tions to their constituencies, sometimes struggle to sufficiently engage local communities in decision-making processes about land use, which can lead to distrust, backlash, or practical challenges in operationalizing projects (Moses 2017). Often, a good approach to overcoming these challenges is to work closely with a local civil society organization motivated to achieve broader objectives, such as community empowerment and/or environmental sustainability.
Water-related service providers, in particular, must also establish strong social units capable of inter-acting directly and strategically with landowners, communities, local governments, and civil society organizations, if they wish to develop and sustain green infrastructure successfully. Conceptually, a service provider’s social unit plays the same critical role for green infrastructure that its engineering unit plays for gray infrastructure, necessitating significant investment.
Once communities are on board, and service pro-viders have the needed stakeholder support, green infrastructure projects can proceed in ways that enhance social well-being, establish social safe-guards, and promote social inclusion.
Figure 3.1 | Communities Are at the Heart of Green infrastucture Operations and Maintenance
Image: Texas Living Waters Project.

45Integrating Green and Gray
Harnessing Cobenefits to Enhance Social Well-beingThrough community outreach, engagement, and an inclusive decision-making process, social assess-ment can help identify and seize opportunities to improve the welfare and well-being of disadvan-taged groups for any development project. Socially inclusive projects and policies improve social well-being, taking into account not only present society, but also future generations (World Bank 2018).
As mentioned in Chapter 2, well-designed green infrastructure can achieve multiple benefits that contribute to community well-being. For example, urban parks designed for flood control can also provide air quality control, combat the heat island effect, and provide space for community gardens or playgrounds. Or, service providers can issue pay-ments for ecosystem services that facilitate much-needed shifts to more sustainable and productive natural resource–use paradigms. For example, payments can enable landowners to shift from overgrazing pasturelands to agroforestry systems, or fishermen to adjust their practices (see Box 3.2).
However, it takes careful understanding of local social dynamics, as well as thoughtful program design, to deliver such benefits. Research has shown that some programs have not only failed to deliver positive social benefits of green infrastruc-ture, but unintentionally had deleterious impacts on local communities, highlighting the importance of thoughtful program design (Hove et al. 2011; Pit-tock and Xu 2010). This raises the question of how best to collect social information to inform design in ways that maximize positive social outcomes.
Even though no specialized tools for conducting social analysis of green infrastructure currently exist, adapting social analysis frameworks from similar projects, such as landscape restoration initiatives, has shown promise. Recognizing that green infrastructure requires special attention,
BOX 3.2 | INCENTIVIZING SHRIMP FARMERS TO MODIFY THEIR PRACTICES: LESSONS FROM VIETNAM
Successful implementation of green infrastructure projects may require farmers to modify their agricultural practices. This requires an extensive outreach program demonstrating that farmers can benefit economically. The Vietnam Mekong Delta Climate Resiliency and Sustainable Livelihood Project illustrates this point. in Vietnam, coastal shrimp farmers are encouraged to shift from intensive shrimp farming—a risky business, given the potential for shrimp diseases and storms that disrupt operations—to a combination shrimp-mangrove system. The reconstruction of a mangrove belt can help reduce the impacts of storm surges and flooding along the coast. Converting to a shrimp-mangrove system creates opportunities for farmers to become internationally certified as a sustainable seafood operation, which can fetch a premium price in the market and therefore increase farmer revenue. in addition, the less intensive and more natural shrimp cultivation reduces disease and provides for a steadier income. A shift into certified organic mangroves was estimated to generate an annual net benefit of $992 per hectare per year over current practices at the time of project appraisal.For more information, see Appendix A, Case 2.B.
practitioners have begun to look to other fields to get a more complete picture of relevant social factors (Nesshöver et al. 2017). Approaches include pairing established social safeguards, such as the World Bank’s Environmental and Social Frame-work (World Bank 2017c), with additional analytic frameworks developed to specifically assess topics related to the social dimensions of environmental projects. This represents an important step toward creating higher-quality assessments, strength-ening the foundation for improved community engagement and participation. Box 3.3 highlights approaches specifically designed to evaluate social-environmental interactions in landscape gover-nance, while Figure 3.1 provides an example from Rwanda.

WRI.org 46
Several approaches have been specifically formulated to develop an understanding of the socioecological landscape. These approaches were not developed with green infrastructure in mind per se, but could be used in combination with existing social safeguards, and may improve the quality and use of social assessments in planning and implementing green infrastructure.
▪ Social Landscape Mapping: The guidebook, “Mapping Social Landscapes,” takes a new approach to environmental governance by focusing on the networks of actors within landscapes. it centers on two main approaches: first, mapping actors’ resource flows, and second, mapping actors’ priorities and values. This method has been tested in Brazil, india, indonesia, Kenya, Mexico, and Rwanda. in a step-by-step process, practitioners are invited to use the methodologies, analyze the results, and develop a strategy for change. By considering actor networks, restoration practitioners can be more efficient with resources, collaboration, and outreach, and better anticipate potential conflicts and bottlenecks (Buckingham et al. 2018).
▪ Participatory Approach to Landscape Governance Assessment: The landscape governance assessment methodology was developed by the Green Livelihoods Alliance as a two-day workshop to help give agency to communities facing land-use decisions and to help them identify development priorities. The workshop focuses on the following four criteria: inclusive and equitable decision-making; social cohesion and collaboration in the landscape; coordination among actors, sectors, and scales; and sustainable landscape thinking and action. The method was designed to be cost-effective and manageable in time and effort, yet provide a reasonable idea of the status of key aspects of landscape governance. The participant approach allows stakeholders to partake in interactive discussions to evaluate criteria, and indicators to assess social inclusivity and sustainable landscape governance (Graaf et al. 2017).
▪ Indicators of Resilience in Socioecological Production Landscapes and Seascapes: These indicators are tools for engaging local communities in adaptive management of the landscapes and seascapes in which they live. The indicators measure diversity and ecosystem protection, biodiversity (including agricultural biodiversity), knowledge and innovation, governance and social equity, and livelihoods and well-being. Through participatory “assessment workshops,” stakeholders evaluate current conditions across the landscape and identify priority actions. By enhancing communication and building consensus on resiliency challenges, the evaluation of these indicators can help position communities to effectively undertake green infrastructure projects (Bergamini et al. 2014).
▪ Participatory Watershed Management Planning Methodology: The development of this tool was funded by the Program on Forests (PROFOR) and implemented by the J/P Haitian Relief Organization, as part of the “Haiti Takes Root” National Reforestation initiative. Stakeholders are involved in the three phases of this methodology (site selection, microwatershed assessment strategy, and intervention prioritization) to identify watershed management priorities that line up with peoples’ economic motivations, and ensure that scarce resources are allocated in a way that is effective, inclusive, and appreciated.
BOX 3.3 | ADAPTING SOCIAL ANALYSIS FOR GREEN INFRASTRUCTURE: SELECT ASSESSMENT APPROACHES

47Integrating Green and Gray
Figure 3.2 | Mapping Stakeholder Priorities, Natural Resource Restoration in Rwanda
Note: in 2017, stakeholders in Rwanda used social landscape mapping techniques to understand which benefits of restoration were most important at different levels of governance to inform strategies for the national restoration program.
Source: Buckingham et al. 2018.
Establishing Social Safeguards Green infrastructure is not immune to the negative social impacts often associated with controversial gray infrastructure projects. As a starting point, therefore, green infrastructure should be assessed in the same ways as gray infrastructure. Understanding both a project’s direct and indirect impacts on affected communities, and designing projects to mitigate and compensate for negative effects is critical to meeting social safeguards and creating a successful project. In particular, without mitigation efforts, green infrastructure projects may harm communities or individuals that depend on targeted lands or waters for subsistence or livelihoods. For example, watershed protection projects may restrict people’s access to land or natural resources, and without proper assessment, could fail to fully compensate affected communities for lost opportunities or to offer superior alternatives.
To avoid situations such as these, development part-ners have already created effective policies and tools. For example, the World Bank’s environmental and social Safeguard Policies include approaches, guiding principles, and indicators for evaluating the impact of development projects and for developing responsive strategies to ensure social and environmental sustain-ability (World Bank 2018). Over the last 20 years, these Safeguard Policies have been updated continu-ously to advance transparency, nondiscrimination, and sustainable development.
In cases where projects may result in lost lands, income, or access to natural resources, affected com-munity members must be adequately compensated. Countries often set legal requirements or guidelines for resettlement and compensation. Many develop-ment partners maintain strict policies regarding the
Water
NATIONAL
DISTRICT
COMMUNITY
Community
Forest Products &Commodities
Climate Mitigation& Adaptation
Energy (Fuelwood,Charcoal) Production
Food & Agriculture
Soil

WRI.org 48
resettlement and compensation of people removed from lands and/or those whose rights are infringed (World Bank 2017). At a minimum, these policies focus on “doing no harm” and ensuring that affected parties are no worse off after the project than before. As green infrastructure enters the mainstream, the development community has an important role to play in going beyond the minimum requirements to ensure that such projects improve social welfare, par-ticularly among disadvantaged communities. Box 3.4 provides an example of a well-planned and successful approach.
Promoting Social Inclusion Any development project can exacerbate or help resolve social inequalities, such as gender issues or marginalization of vulnerable communities. In relation to green infrastructure, the potential impact on women, indigenous peoples, the poor, and other disadvantaged populations should receive special attention. For example, a project can encounter prob-lems if it engages with communities where property rights or land-use decision-making is inequitable to begin with, such as when women are banned from
the decision-making process, or deciding power is concentrated among an elite few (Rinkus et al. 2017). It is therefore important for service providers and their development partners to understand which actors have the power to influence and make decisions regarding the local environment (Graaf et al. 2017).
To this end, all relevant stakeholders in a develop-ment project must be democratically involved during planning and implementation. Green infrastructure stakeholder mapping, engagement, and negotiation can be a more complex and laborious process than for gray infrastructure projects, though it varies case to case. One reason for the complexity is that ecosystems and political/property boundaries rarely align. As a result, a project that calls for action across a landscape may require customized engagement for multiple individuals, groups, and levels of governance. In addition, changes in ecosystem management can trigger nonlocal impacts. For example, many reservoir sedimentation and eutrophication challenges origi-nate from upper watersheds, but their impacts are felt mainly by communities and other stakeholders in the lower watershed. The diverse stakeholders of green
To make way for a green infrastructure flood protection project in Poland, the government and the World Bank adopted a similar approach to a conventional infrastructure project in compensating communities for loss of land. Through the use of a Resettlement Action Plan, two communities with approximately 200 affected households received a choice of compensation. About 47 families were resettled in Nieboczowy—literally translated as “New Village”—with housing and services, and the rest received cash compensation and moved elsewhere. The relocation succeeded in empowering local authorities to lead the resettlement process, establishing a community committee, and assisting landowners with individualized advisory services on compensation packages. The project also delivered cobenefits by enabling farmers to continue using the land for agricultural purposes when the area is not inundated. For more information, see Appendix A, Case 3.B.
BOX 3.4 | APPLYING SOCIAL SAFEGUARDS TO GREEN INFRASTRUCTURE: LESSONS FROM POLAND

49Integrating Green and Gray
infrastructure projects may also be subject to different regulations and jurisdictions, requiring several levels of government involvement to carry out agreed-upon maintenance duties. For example, the National Room for the River Program in the Netherlands required an extensive and comprehensive stakeholder process that involved communities, municipalities, provinces, and water boards. The process helped to identify 700 interventions from a predefined list to achieve the project’s goal of lowering water levels to protect 4 mil-lion people from flooding. Of these 700 interventions, 400 were finally implemented in 2015, with stake-holder support and without delays (RfR n.d.).
Green infrastructure projects can uniquely impact gender equality because of the different roles and responsibilities men and women play in managing natural resources and because of their differing access to information and resources (Sachs and Laudazi 2009). Given that women typically play a central role in managing and safeguarding natural resources, their participation and involvement in planning and imple-menting such projects can increase effectiveness and efficiency (United Nations 2014). Project developers and partners should also look to align green infra-structure investments with other actions that increase women’s opportunities for development.
Additionally, because project developers often use incentive structures or compensation to promote environmental stewardship, they must consider how to deliver such benefits, both financial and otherwise, in ways that ensure equity across stakeholder groups. When hiring local residents to implement develop-ment projects, for example, developers must consider how gender affects available time and labor; for example, women perform more household labor than men, and women’s market labor is often undervalued (Mwangi et al. 2011). In male-dominated societies, community leaders may prefer gray solutions, in part because local male laborers are typically contracted to carry out the work (Bettencourt 2018). Green infra-structure, on the other hand, tends to involve unpaid females (community) to perform tasks, such as plant-ing and maintaining seedlings, which provide benefits more difficult to monetize (Bettencourt 2018).


51Integrating Green and Gray
THE ECONOMiCS OF GREEN iNFRASTRUCTURE ▪ Service providers are ultimately concerned about how to deliver high service standards that are
also affordable; they should look for the optimal combination of green and gray infrastructure to achieve this goal.
▪ Green infrastructure often has a different cost structure than gray infrastructure, and needs to be carefully evaluated to ensure proper economic analysis of options.
▪ The often significant environmental and social cobenefits that harnessing green infrastructure can generate should be included in the project’s economic evaluation. Such cobenefits can sometimes be a driving factor in selecting a green infrastructure component, especially when the public sector or mission-driven investors are involved.
▪ Since green infrastructure typically generates both monetary and nonmonetary cobenefits, a semiquantitative, multi-criteria analysis (MCA) approach is often the most suitable methodology for evaluating projects.
WRI.org 52
Economic analysis is used for infrastructure plan-ning in two very distinct ways. At the regulatory level, economic cost-benefit analysis is often used to help determine the appropriate level of service. At the service provider level, a cost-effectiveness eco-nomic analysis is typically employed to plan specific infrastructure components. Green infrastructure components, however, represent a special case in that not only do they impact the cost of service provision, they typically also have significant envi-ronmental and social cobenefits to consider. This chapter explores key issues for governments, ser-vice providers, and development partners and other investors to consider as they undertake economic analysis for green infrastructure projects, including estimating both costs and cost-effectiveness.
Setting service standards: Typically, infrastruc-ture service levels are determined through a regula-tory or planning process within a political context, using a cost-benefit analysis. Benefits are related to the outcomes of the service, such as public health, reduced flood damages, higher agricultural pro-ductivity, or healthier freshwater ecosystems. As an example, consider a stylized case of flood manage-ment, which uses flood risk, expressed in terms of frequency of flooding every 10, 50, or 100 years, as its service standard. For each service standard, there are benefits that can be quantified, for exam-ple in terms of avoided damages. For each service standard, there are also costs that can be quantified in terms of capital and operating costs of the infra-structure. In addition to the economic cost-benefit analysis, other factors are often considered, such as the ability to finance investments associated with a given service standard, as well as public health concerns or the desire to avoid loss of life.
Green infrastructure, as part of a combined system, both contributes to achieving the service benefits and is included in the costs of the service. The focus of this chapter is not to assess appropriate service standards, but rather to provide guidance on how best to combine green and gray infrastructure to achieve the required service standard.
Cost-effectiveness analysis and green infra-structure: Once a service standard is set through a government decision, then it is the role of the ser-vice provider to deliver the least-cost solution. Each component of the infrastructure is designed to work in harmony with the overall system to minimize costs. As an example, a drinking water treatment plant must produce an effluent that meets a certain regulatory standard. A related cost-effectiveness analysis will determine what is the best technology and plant layout to meet this standard while mini-mizing costs. Similarly, if a watershed management program is considered in combination with a water treatment plant, then the service provider’s goal is to find the least-cost combination of watershed improvements and water treatment to meet the regulatory requirements.
Service providers should consider criteria beyond cost-effectiveness, however, if they want to capture the full impact of infrastructure investments on society, or if they want to identify opportunities to partner with mission-driven investors. Table 4.1 provides examples of how green infrastructure components can lower costs of gray infrastructure in ways that can be factored into a standard cost-effectiveness analysis. It also highlights cobenefits to account for when considering the optimal combi-nation of green and gray infrastructure for a given service standard.

53Integrating Green and Gray
SERVICE POTENTIAL SOURCES OF INFRASTRUCTURE COST REDUCTION
POTENTIAL ECONOMIC COBENEFITS
Water supply and hydropower
Healthy watersheds extend the life of the reservoir, reduce wear on hydropower equipment, potentially reduce water treatment plant operational and maintenance costs, and potentially reduce water treatment plant capital investments.
Watersheds: Enhanced nontimber forest products, nature-based tourism and recreation opportunities, carbon storage, biodiversity, and cultural heritage preservation.
Coastal flood management and erosion control
Natural coastal barriers, such as mangroves, wetlands, and sandbars, lower costs for gray infrastructure, such as seawalls, sea dikes, and groynes. These barriers can reduce wave energy and the height of a storm surge, which potentially lowers the cost and/or improves the resilience of the built solution.
Natural coastal barriers: More productive fisheries, coastal tourism and recreation opportunities, carbon storage, and enhanced marine biodiversity.
River flood management
Floodplains lower costs for gray infrastructure, such as flood control embankments, sluice gates, and pumping stations. The floodplains store flood waters and lower flood levels, thus potentially lowering the cost and/or improving the resilience of the built solution.
Floodplains: improved recreation opportunities, enhanced water quality, provision of fisheries and migratory bird habitats, floodplain nutrient replenishment, groundwater recharge, and carbon storage (Noe and Hupp 2005; Opperman 2014).
Urban stormwater management
Stormwater retention areas lower costs for stormwater drains, pump stations, and treatment of combined storm and wastewater discharges. They filter pollutants and can remove up to 90 percent of heavy metals from stormwater (LiDC 2007).
Stormwater retention areas: Creation of urban amenities, such as green spaces and enhanced urban ecology, has increased property values by 5 to 15 percent and generates health benefits for city-dwellers (Haq 2011).
Drought management Aquifers: Lower or eliminate costs for new reservoirs or desalination plants and their associated conveyance systems.
Aquifers: Combat subsidence, prevent salinity intrusion in coastal areas, or improve afforestation and/or vegetation cover due to higher water tables.
Agriculture, irrigation, and drainage
Soils: increasing soil moisture through agronomic measures can lower irrigation infrastructure capital and reduce irrigation requirements.
Soils: increased agricultural productivity, reductions in soil loss and drainage water.
Source: Authors.
Table 4.1 | Potential Cost Reductions and Economic Cobenefits Associated with Green infrastructure

WRI.org 54
COST COMPONENT GENERAL DEFINITION CONSIDERATIONS WHEN COSTING GREEN INFRASTRUCTURE
Preparation costs Cost of planning, engineering, permitting, environmental and social assessments, etc.
Costs associated with extensive training and consultations with a wide range of stakeholders to ensure participation and social acceptance.
Capital costs Cost of civil works, equipment, land, and other up-front capital investments.
Generally low civil works and equipment costs, but potentially high land costs due to large land footprint.
Financing costs Service charges and interest payments associ-ated with borrowed funds.
Often receives public funds on a grant or concessional basis, so financing costs may be lower.
Operation and maintenance
Labor, fuel, equipment, and civil works maintenance.
Requires expertise in biological systems and different kinds of interventions to ensure maintenance, monitoring, and verification.
May require recurrent payments to compensate landowners/users/com-munities for use of land.
Source: Adapted from Gray et al. (in review).
Estimating Green Infrastructure CostsA major selling point for adopting green infrastruc-ture is that in some circumstances it can provide relatively low-cost solutions. However, it is difficult to generalize since such projects cover a wide range of interventions at different geographic scales. How costs of green and gray infrastructure compare
thus depends very much on the type of interven-tion and the characteristics of the specific site. Both green and gray infrastructure costs can generally be divided into four broad categories: preparation costs, capital costs, financing costs, and operation and maintenance (O&M) costs (see Table 4.2).
Table 4.2 | Cost Categories for infrastructure
Figure 4.1 | Combining Green and Gray infrastructure Can Be Cost-effective
Images: Flickr (left) , thanh.ha.dang/Flickr (right)

55Integrating Green and Gray
Standard Cost-Effectiveness Analysis for Green InfrastructureIn combined infrastructure approaches, most green activities directly impact the cost of service by reducing the cost of gray components in one of three main ways: by reducing capital costs, by reducing O&M costs, and by increasing climate resilience. A standard cost-effectiveness approach can therefore be used to evaluate a project’s specific green and gray infrastructure components. Exam-ples where harnessing natural systems has benefit-ted service providers by lowering service costs are shown below:
▪ Water supply and hydropower: Source water protection strategies designed for wa-ter quality benefits reduce capital costs in the form of bypassed water treatment processes and avoided costs. For example, New York City’s protective management of the Catskill-Delaware watershed enabled the city to “re-place” the up-front capital costs of building an expensive treatment plant estimated near $8.0 billion with the comparatively cheaper green infrastructure strategy that has only cost a little over $1.5 billion since the 1990s (Gartner et al. 2013). Additionally, projects upstream of dams reduce reservoir sedimentation, extend-ing the life of facilities and reducing dredging and maintenance costs. In Costa Rica, siltation of hydropower reservoirs was mitigated with upstream forest restoration and land manage-ment practices (see Appendix A, Case 1.A).
▪ Coastal flood management and erosion: In the late 1980s, rapid aquaculture expansion along the northern coast of Vietnam caused significant loss of mangrove forests, which in turn decreased natural defenses against coastal floods and erosion in an area with a rapidly growing population. Recognizing that mangrove restoration could help mitigate the impact of disasters and protect livelihoods, the Vietnam Red Cross launched the Mangrove Plantation and Disaster Risk Reduction Project in 1994 to enhance existing gray infrastruc-ture and reduce flood risk. By 2010, $9 mil-lion was invested to restore 9,000 hectares of mangroves along the shores of 166 communes as well as 100 kilometers of dike lines. This natural bulwark cut the cost of damages to the
When governments, service providers, and other stakeholders fail to fully account for the cost of green infrastructure, this can lead to project failure. In Nigeria, a sand nourishment project for coastal flood and erosion protection turned out to be a cost-lier option than anticipated (Niang et al. 2012). The site required sand replenishment every two to three years, which was too costly for the government to maintain, and the operation failed due to lack of regular maintenance.
Green infrastructure often involves operating costs that are quite different than for gray infrastructure, such as the ongoing investments needed to adap-tively manage natural areas in a changing climate. This can present challenges and uncertainties when estimating the costs of green components in a combined infrastructure project. When researchers applied a general costing approach (akin to that of Table 4.2) to targeted reforestation efforts in Brazil-ian watersheds, they found that the cost per hectare ranged widely from $2,500 to $13,000 (Ozment et al. 2018; Feltran-Barbieri et al. 2018). These costs depended on the maturity of the local reforestation industry, the willingness of landowners to partici-pate, the natural regeneration potential of the target site, and whether forest protection laws would be enforced.
Around the world, the current costs of implement-ing green infrastructure vary widely, and cost data for specific locations can be hard to access. For example, a meta-analysis of over 76 mangrove proj-ects for coastal flooding by Narayan et al. (2016) found costs ranging from $500 to $65,000 per hectare, with a median value of $1,000. Similarly, the cost of restoring and reconnecting floodplains varies with land prices, ranging from roughly $10,000 to $800,000 per hectare across Europe alone (EEA 2017). This high variability indicates the importance of identifying an appropriate interven-tion for each specific site. Developing robust cost estimates that assess feasibility and opportunity costs of proposed options is essential to guide project planners toward more cost-effective green infrastructure solutions.

WRI.org 56
dikes by $80,000 to $295,000, and saved an additional $15 million in avoided damages to private property and other public infrastructure (IFRC 2011).
▪ The city government of Portland, Oregon has struggled to handle growing volumes of sewage and stormwater runoff from impervious sur-faces. From 1990 to 2011, the city implemented a combined sewer overflow (CSO) control program that expanded gray infrastructure, including tunnels and treatment facilities, to re-duce its CSOs and clean up local waterways. In 2007, it introduced a complementary program to spur the use of green infrastructure for urban stormwater management. Since 2007, service providers have installed permeable pavements and bioswales throughout the city, reducing peak flow by 80 to 94 percent in target areas. Portland officials estimate that their $9 million investment in green infrastructure has yielded a savings of $224 million in stormwater costs related to repairs and maintenance (USEPA 2010).
▪ A cost-effectiveness analysis of infrastructure options in New York City, shown in Figure 4.2, found that a combined green-gray approach would not only meet stormwater management targets more cost-effectively, but also attract more private investment, relieving pressure on the city’s budget.
Beyond Cost-Effectiveness Analysis The objective of combining green and gray infra-structure is to improve service, lower costs, and/or improve resilience. Cost-effectiveness analysis can help shed light on whether a green component meets that threshold, but it does not reveal the full picture. Green infrastructure may also generate ancillary social, economic, and environmental cobe-nefits related to human health and livelihoods, food and energy security, ecosystem rehabilitation and maintenance, climate adaptation and resilience, and biodiversity (WWAP 2018).
Although these cobenefits may not be the direct concern of the service provider, they are of inter-est to the general public, the government, affected communities, and civil society organizations. For some projects, other factors may come into play—such as uncertainty and the desire to make decisions that may not be optimal but can help to avoid bad outcomes. Box 4.1 presents an example of the multiple factors an expanded cost-effectiveness analysis can include, to provide a more robust and complete picture of a project’s potential benefits.
Figure 4.2 | Reducing Cost by Mixing Green and Gray infrastructure*, New York City
Note: *Combining green and gray infrastructure cost 22 percent less than gray alone.Source: Bloomberg and Holloway 2018.
$0
$2
$4
$6
$8
Green strategy
Cost-e�ective gray investments
Gray strategy
Cost
($ B
illion
s in
2010
Doll
ars)
$2.9 $2.9
$1.5
$3.9$0.9$0.03
$5.3
$2.4
$6.8
Green infrastructure — public investment
Optimize existing system
Green infrastructure — private investment
Potential tanks, tunnels, and expansions

57Integrating Green and Gray
Figure 4.3 | Cost-Effectiveness Analysis for Watershed Restoration Program, Brazil
BOX 4.1 | EXPANDED COST-EFFECTIVENESS ANALYSIS FOR WATERSHED RESTORATION PROGRAM IN BRAZIL
An economic analysis of the São Paulo Watershed Conservation Plan (Ozment et al. 2018) revealed that green infrastructure, in the form of watershed restoration, was a worthwhile investment. Two scenarios were considered: the first was restoring the watershed; and the second, continuing “business as usual” (BAU), dredging the water supply reservoir and incurring high water treatment costs. The cost-effectiveness analysis below reveals that watershed restoration is $4.5 million cheaper than the BAU case over a 30-year period using a 9 percent discount rate. However, the decision-making process includes several additional important considerations.
▪ TIME AND UNCERTAINTY: Figure 4.3 shows restoration costs are incurred in the first 10 years, while the BAU costs are still relatively low during this time. Thus, the restoration program could be considered a precautionary “robust” investment to avoid a potentially bad outcome—high levels of reservoir siltation and increased treatment costs, which lead to increased risk to public health. in addition, the payback period, shown where the yellow moves into the positive zone around year 23, indicating a low rate of return, would be unacceptable to investors. However, in addition to making a “robust” deci-sion—that is, avoiding a bad outcome—potential cobenefits should be considered. When using the “social discount rate” for Brazil recommended by World Bank, the project’s payback period is 18 years.
▪ COBENEFITS: Though the project’s cobenefits were not monetarily valued, their identification sheds light on the analysis. The project would likely increase dry season water flows, an important factor given São Paulo’s growing water stress. A preliminary but conservative estimate of climate benefits found that the project would sequester enough carbon to more than offset projected carbon emissions due to land-use change in the state of São Paulo. in addition, the project is expected to make over $30 million available for rural communities to restore forests over 30 years, which would have posi-tive impacts on rural livelihoods and enable farmers to shift to more environmentally sustainable production systems that integrate forestland. Finally, the project would bring back a mosaic of the rare Atlantic Rainforest, one of the most biodi-verse—but also among the most threatened—forest types on the planet.
The project was broadly considered to be economically viable by water managers and other key stakeholders in the region, and as of 2018, project plans are being refined and a financing plan is under discussion.
Source: Ozment et al. 2018.
4.55
- 12
- 8
- 4
0
4
8
0 5 10 15 20 25 30
USD
Millio
ns
YearsNPV (9% discount rate) Restoration costs Benefits (avoided costs of sediment pollution)

WRI.org 58
Economic valuation of cobenefits is a well-established practice in environmental and natural resource economics (e.g., Atkinson et al. 2018; Freeman III et al. 2014). While it is beyond the scope of this report to examine the many economic methods available for assessing green infrastruc-ture cobenefits, a brief overview is provided below. Some valuation methods can produce highly reliable quantitative results, while others are more indicative.
Benefits that have market prices, or near-market equivalents like increased agricultural and aquacul-ture production, recreation and tourism, reduced sedimentation of hydropower reservoirs, and lower water treatment costs can be readily valued using market-based approaches. However, valuing cobe-nefits can be challenging when there are no market prices in play, or when the biophysical measure-ment of benefit is uncertain. Carbon sequestration can be valued using a range of internationally estab-lished prices, while biodiversity protection, which is difficult to measure, may be evaluated using nonmonetary approaches. As with all economic analysis, understanding the distribution of benefits and costs among different stakeholders is critical to designing a successful infrastructure solution.
In many cases, the value of these additional benefits can be substantial, and can make green infrastruc-ture projects attractive investments for govern-ments or impact investors that value improved community welfare (Cohen-Shacham et al. 2016; Gartner et al. 2013; Ozment et al. 2016). Some con-crete examples for flood management, water sup-ply, and soil water conservation are listed below:
▪ Coastal/river/urban storm and flood management: Green infrastructure objec-tives typically focus on reducing the likelihood of damage and loss of life during storms, but such solutions can also make less likely storms negatively impacting nature-dependent indus-tries such as tourism, recreation, and fisheries. For example, the economic value created by restoring mangroves in Vietnam came from both disaster risk reduction and enhanced community livelihoods. Coastal communities’ income rose due to increased yields rang-ing from 200 to 800 percent of aquaculture products like shells and oysters. Estimates of the direct economic benefits from the govern-ment’s combined green-gray strategy range
from $344,000 to $6.7 million (IFRC 2011) (see Appendix A, Case 2.B).
▪ Soil water conservation: Green infrastruc-ture that increases agricultural productivity yields increases in farmers’ incomes and food security, and can improve soil conditions and increase soil moisture and nutrients. This in turn reduces the need for external inputs, such as irrigation water and fertilizers.
▪ Water supply: The substantial value of cobe-nefits from green approaches to water supply can even surpass a project’s intended benefits. For example, New York City’s Green Infrastruc-ture Plan aims to reduce sewer management costs by $2.4 billion over 20 years. In addition, every fully vegetated acre will also provide total annual benefits equivalent to $8,522 in reduced energy demand, $166 in reduced CO2 emissions, $1,044 in improved air quality, and $4,725 in increased property value (Bloomberg and Holloway 2018; Foster et al. 2011).
Employing Multi-criteria AnalysisGiven the importance and range of green infra-structure cobenefits, some of which do not have clear market values, service providers and their partners can consider using multi-criteria analysis (MCA) to evaluate the rationale for going ahead with projects. This methodology allows assessment of options against several broad criteria that have different units (both quantitative and qualitative). These criteria are weighted according to their relative importance and used to “score” infrastruc-ture options. By using MCA, decision-makers can rank infrastructure options not just by economic efficiency, but also by their ability to deliver other desired outcomes, such as equity, biodiversity, public acceptance, and quality of life (Gray et al., in review). This approach is most appropriate for assessing projects with substantial, and perhaps even greater, additional benefits beyond the pri-mary infrastructure purpose.
Additionally, as noted in Chapter 2, the deep uncertainty associated with climate change and socioeconomic pressures has led to increased focus on resilient and robust strategies that perform rea-sonably well over a range of future conditions. Box 4.2 shows how decision-making under uncertainty was factored into an economic analysis for valuing wetlands for flood control in Colombo, Sri Lanka.

59Integrating Green and Gray
BOX 4.2 | DECISION-MAKING UNDER UNCERTAINTY: LESSONS FROM SRI LANKA IN VALUING WETLANDS FOR URBAN FLOOD CONTROL
To evaluate the viability of restoring wetlands as a natural barrier in the flood-prone city of Colombo, Sri Lanka, the World Bank and partners applied an approach known as Decision-Making under Uncertainty. The figure below depicts an analysis of the trade-offs between urban development and wetland protection, comparing five scenarios ranging from 0 to 100 percent of target wetlands conserved by 2030. Since many variables, such as economic growth or climate change, affect both the value of urban development and the value of wetland protection, a sophisticated computer model was developed to randomly analyze hundreds of different scenarios, reflecting the inherent uncertainty of each variable as well as of the combination of variables. The potential benefits were monetized and included flood protection, recreation, carbon sequestration, and water quality improvements. The potential costs included loss of revenue from property development on wetland areas. For each scenario, the result is represented as a point in Figure 4.4 below, indicating the wetland benefits (blue lines), the opportunity cost due to lost land rents (red lines), and the net value of conservation (yellow lines). Since the analysis is based on the concept of uncertainty, there is a broad range of potential outcomes, including where the “net value of conservation” is below zero. However, in most scenarios, the net value is positive. Moreover, as more wetland area is conserved, the general trend is for net values to increase. This type of analysis can provide planners with some degree of confidence to proceed with wetland conservation efforts, while still signaling that there is risk involved.For more information on this project, see Appendix A, Case 4.B.
-150
-100
-50
0
50
100
150
200
0% 30% 50% 90% 100%
Annu
al co
sts an
d ben
efits
in 20
30, R
S billi
on
Percent wetland coverage
Costs Benefits Net Present Value Range of certainty
Figure 4.4 | Wetlands Conservation Cost-Benefit Analysis for Colombo, Sri Lanka


61Integrating Green and Gray
CREATiNG NEW FiNANCiNG OPTiONS WiTH GREEN iNFRASTRUCTURE ▪ The financing demands for global infrastructure are large and growing.
▪ Governments and service providers struggle to finance infrastructure needs because of constrained budgets and low tariffs.
▪ Green infrastructure can be packaged and marketed as “green investments,” thus helping to ease financing challenges.
▪ Governments, the private sector, and development agencies are often willing to provide grants or concessional loans for green infrastructure because it both improves services and supports broader environmental and social goals.

WRI.org 62
Infrastructure Finance Models General Finance Model for Service Provid-ers: All infrastructure services require an adequate stream of revenue or budget over the long term to ensure their sustainability. Service providers that operate in a commercial manner, such as water utilities or hydropower companies, typically refer to these finance streams as revenues, while govern-ment entities, such as flood management agencies, typically refer to them as budgets. Usually, these funds come from one of three main sources, collec-tively known as the 3Ts (OECD 2009):
▪ Tariffs: A source that comes from users pay-ing for a specific service. For example, power companies charge customers for the amount of electricity used, or water companies charge for the quantity of water provided.
▪ Taxes: A source that comes from the govern-ment—either through the general budget or a dedicated tax, to help pay for a service within its jurisdiction. For example, a municipal or state government may provide funding to a department to provide flood management services.
▪ Transfers: A source that comes from outside the government that is providing the service. For example, a state government may receive a grant from the federal government or an inter-national development agency.
Figure 5.1 shows a typical general infrastructure finance model that utilizes the 3Ts. It demonstrates how service sustainability relies on a sufficient flow of funds from any combination of the 3Ts to make capital investments, cover operation and mainte-nance costs, and meet any debt service require-ments. From a private investor’s perspective, the model shows that to finance service providers, investors must have confidence they will be repaid with a return commensurate to the risk. This requires that some combination of the 3Ts will be sufficient to cover both debt service and the costs associated with providing the service.
Using this model to finance much-needed infra-structure improvements poses a fundamental problem for many service providers in developing countries. The challenge they face is that access to funding through the 3Ts is often insufficient to make the necessary capital investments and/or provide the necessary operation and maintenance resources to meet desired service levels. This shortage of funds is typically caused by tight public budgets.
In some cases, funds are also constrained by low tariffs, driven by affordability concerns and political constraints. Accessing finance to cover these fund-ing gaps is a severe challenge in the infrastructure sector. The OECD (2018) estimates that global financing needs for water supply and wastewater
Source: Authors.
Figure 5.1 | General infrastructure Finance Model
Tariffs Gray infrastructure
Green infrastructure
O&M
Debt Service
Taxes
Transfers
Private finance
Funds flow
Repayment

63Integrating Green and Gray
infrastructure alone (not including irrigation or flood control) will be $6.7 trillion by 2030—more than three times current investment levels—and may reach $22.6 trillion by 2050.
Green Infrastructure Finance Model: Although service providers should view green infra-structure as part of their overall asset base, such projects have special characteristics in the form of cobenefits that can be exploited to open up new financing options. Thus, there are advantages to moving these projects outside the standard service provider finance model shown above, and market-ing them instead to governments, the private sector, or development agencies as stand-alone investment opportunities. Figure 5.2 provides a conceptual financing model of such an approach.
This model highlights four potential sources of finance, each aimed at funders with different moti-vations for backing green infrastructure:
▪ Public finance: Governments are often moti-vated to provide grants for green infrastructure components both as a recognition of its contri-bution to service provision, but also because of its potential environmental and social cobenefits. The latter imply greater impact and create additional political constituencies for the investment.
▪ Private finance: A growing pool of individu-als or companies is looking for global oppor-tunities to make green investments. These individuals or entities are typically willing to provide finance at concessional rates through
Source: Authors.
Figure 5.2 | Green infrastructure Finance Model
Government
Public Finance Private Finance
Green infrastructure
Development Finance
Service Provider
Funds flow
Repayment

WRI.org 64
specialized instruments, such as climate bonds or green bonds. Some individual companies are also looking to support green infrastructure through concessional loans or grants as part of their corporate stewardship policies or to benefit directly from the investments.
▪ Development agencies: Many agencies seek to invest in such projects on a grant or concessional loan basis because nature-based solutions align with their core mandates, such as climate resilience, poverty reduction, and environmental sustainability.
▪ Service providers: Service providers them-selves are often willing to invest directly in combined green-gray projects, using their normal “3T” channels, such as revenue from tariffs, based solely on the potential for im-proved service performance.
For service providers, tapping into this demand for green investments can help address their finance challenges at multiple levels, since such projects can often lower overall service costs. Even when providers need to borrow funds, they can often do this on a concessional basis, thus reducing debt service, as governments are often responsible for the debt servicing.
The following sections provide specific real world examples of green infrastructure financing approaches to inform and help steer service provid-ers and other key stakeholders.
Green Infrastructure Investment Levels Currently, $52 billion per year flows to conservation projects, some of which is for green infrastructure (Credit Suisse and McKinsey & Co. 2016). To date, there is no comprehensive, stand-alone global assessment of green infrastructure investments. However, Forest Trends has analyzed global water-shed conservation and restoration efforts, identify-ing at least 419 programs that invest approximately $25 billion per year (Bennett and Ruef 2016). The bulk of these funds comes from public and phil-anthropic sources, with more than 95 percent of total transaction value for watershed investments delivered through direct government subsidies (Bennett and Ruef 2016). Figure 5.4 shows the global breakdown.
Figure 5.3 | Mangroves Stabilize Coastlines by Trapping Sediment in Their Roots and Reducing Wave impacts with Their Dense Vegetation
Image: Adam Fagen/Flickr.

65Integrating Green and Gray
Public Finance Governments play an important role in funding green infrastructure, both as the main financier and as the entity responsible for setting policies that enable private investment. Some common public funding sources that service providers can tap into are described below.
General revenue funds: Governments at the national or subnational level may draw upon their general tax revenues to finance green infra-structure programs. This approach is particularly appropriate for projects that require large up-front investment.
Earmarking government revenue: Some governments have dedicated revenue from existing sources to fund green or green-gray projects. For example, Costa Rica funds its Payments for Ecosys-tem Services Program by dedicating revenue from fuel and water taxes, along with grants and loans from bilateral and multilateral donors (Blackman and Woodward 2010). Box 5.1 provides an example of a state government in Brazil that supports green infrastructure.
Figure 5.4 | Global investments in Watershed Conservation, by Region
Project developers often take advantage of multiple financial instruments and funding sources over the course of a project. For example, a study of 13 watershed investment programs in the United States found that grants and philanthropic dona-tions often provided seed funding for projects to get off the ground (Ozment et al. 2016). Once service providers could demonstrate results, they were bet-ter able to engage larger-scale investors looking to receive direct, long-term benefits from the program. These later funders included local water utilities, water-dependent businesses, and the U.S. Forest Service.
Moving forward, the growing movement to main-stream “conservation finance” and unlock private capital for conservation efforts that have monetiz-able benefits should help increase the flow of funds to green infrastructure (Credit Suisse and McKinsey & Co. 2016; Hamrick 2016). Private investment in conservation more than doubled between 2005 and 2015 (Hamrick 2016).
Notes: k= thousands; m=millions; b=billions; ha=hectares. Not shown: 3 programs crossing multiple regions worth 2.6m in transaction value. Source: Bennett and Ruef 2016.
AfricaAsia Europe Latin America &CaribbeanNorth America Oceania
Number of Programs (419 total)
Total Transaction Value (24.6b total)
Area in 2015 (486.7m ha in total)
16
117.8m
84k
169
14.2b
426.6m 47.7m
26k
8.9m
135k
6.4b3.8b
65.9m
52.3m
71 47107 6

WRI.org 66
Dedicated service fees: Service providers, with the consent of regulators, sometimes create a dis-tinct fee or charge for green infrastructure users. For example, some U.S. utilities levy watershed protection fees or surcharges to reinvest in water-shed protection measures. Similarly, a federal law in Brazil established a fee that water users must pay to the local water company, which then passes the funds to local watershed committees for reinvest-ment in watershed maintenance. Some of these committees have decided to invest in reforestation.
Municipal bonds: In the United States, local governments have used dedicated municipal bonds to quickly raise capital and jumpstart watershed investments to protect water supply. Municipal bonds allow government agencies to borrow money from investors and repay it over time, using tax or other revenue. However, while bonds can provide up-front capital, they offer a fixed amount of funding that eventually runs out and may not be sufficient for watershed maintenance (Ozment et al. 2016).
Environmental mitigation/compensation funds: Fifty-seven countries have developed or are developing national environmental or biodiversity mitigation policies that mandate compensatory mitigation (offsets) for unavoidable impacts to natural ecosystems (McKenney and Wilkinson 2015). The resulting funding sources raised through mitigation requirements are key enablers of conservation and restoration activities globally, some of which is directed toward green infrastructure. In the United States, for example, compensatory mitigation generates $3.8 billion a year from companies that must pay for unavoidable ecosystem loss or degradation (BenDor et al. 2015). The money is channeled into activities that enhance or restore more watershed services—such as water filtration—than were destroyed. In Brazil, the National Environmental Conservation Law gener-ated approximately $200 million in its first decade (Villarroya et al. 2014). To direct these funds into green infrastructure, São Paulo has created an online registry, where compensators match up with restoration project proposals that provide natural infrastructure benefits (State Government of São Paulo n.d.).
The state of Espírito Santo in Brazil has a long history of supporting green infrastructure stewardship, with many key players already committed to this agenda (Kissinger 2014). in 2008, the state was the first in the country to pass a law mandating payments for ecosystem services (PES). it also established a State Water Resources Fund, FUNDAGUA, to support PES programs, targeted to protect watersheds. The law stipulated that a small portion of oil royalties received by the implementing agency through FUNDAGUA, should go to finance PES and land stewardship. The World Bank also provided cost-sharing funds to the program, and the state government is exploring options to leverage additional funds from beneficiaries, such as the water sector and watershed committees (Kissinger 2014). Leveraging additional funds will help the state of Espírito Santo progress from payments for green infrastructure that rely on state and World Bank international Development Association funds, to a model where downstream water users support upstream communities. For more information, see Appendix A, Case 1.B.
BOX 5.1 | PUBLIC PROGRAMS AND BLENDED FINANCE PAY FOR GREEN INFRASTRUCTURE: LESSONS FROM BRAZIL

67Integrating Green and Gray
Private Finance This section covers finance from a variety of sources, including commercial finance, private companies, and the insurance sector. In some cases these players are investors; in others, they are beneficiaries, agreeing to pay for services provided. In 2015, for example, cities, companies, and water utilities collectively invested $657 million in water-shed restoration or protection.
Environmentally focused bonds: Increased interest in making investments that generate social or environmental benefits alongside a financial return has spurred the development of environ-mentally focused bonds. (Green, blue, climate, and environmental impact bonds are collectively referred to here as “green bonds.”) The green bond market has grown more than 10-fold since 2013, with $389 billion in labeled green bonds issued in 2017 (Filkova 2018). In 2018, the Climate Bonds Initiative released new bonds that explicitly seek to target green infrastructure components as part of water projects—including water supply, flood management, and climate adaptation (Gartner and Matthews 2018). These fixed income investments can be helpful in engaging risk-averse beneficiaries of green infrastructure projects as bonds spread the cost over a project’s useful life rather than require a large up-front investment from beneficiaries.
Pay-for-success (also referred to as pay-for-per-formance, environmental impact bond, or conser-vation impact bond) is an approach to contracting that ties payments for service delivery to the achievement of measurable outcomes that support natural infrastructure investments. Washington, DC’s, Stormwater Bond represents one of the first applications of a pay-for-success model, with inter-est rates paid to investors according to how well the green infrastructure performs (see Box 5.2).
DC Water, the public water utility in Washington, DC, issued a municipal environmental impact bond in 2016, structured to share performance risks associated with green infrastructure, rewarding investors if the green project’s performance exceeds expectations, and limiting financial risk to DC Water if it underperforms. The 30-year, $25 million tax-exempt bond was placed with two private investors, and its proceeds are providing all the up-front capital needed for construction of three green infrastructure installations to improve the incidence and volume of combined sewer overflows by better managing stormwater in Washington, DC. The bond has an initial 3.43 percent interest coupon payable semi-annually for the first five years. At the five-year mark, a one-time $3.3 million contingent payment may be made to investors or DC Water, based on performance evaluation and U.S. Environmental Protection Agency determination of the success of the installations, as follows:
▪ if the installations reduce stormwater runoff more than ex-pected, DC Water makes an outcome payment to investors.
▪ if the installations reduce stormwater runoff less than ex-pected, investors make a risk-share payment to DC Water.
▪ if the installations reduce stormwater runoff as expected, just the basic principal and interest is due from DC Water to investors.
This model encourages investors to do due diligence, as they have a financial stake in the performance of the project; investors funding sustainable, innovative water management solutions such as this may also gain reputational benefits.For more information, see Appendix A, Case 4.A.
BOX 5.2 | FINANCING URBAN GREEN INFRASTRUCTURE: LESSONS FROM THE UNITED STATES

WRI.org 68
Corporate stewardship: Many multinational companies invest in green infrastructure to pro-tect their source waters. For example, Coca-Cola has systematically implemented “Source Water Vulnerability Assessments,” which gauge risks to the watersheds where they operate and determine suitable corporate responses. The beer company Anheuser Busch InBev has set a goal to support watershed protection at all its facilities located in those countries that are key for its business.
Water funds: Water funds pool income from mul-tiple water-dependent companies and public sector stakeholders, with each small contribution adding to the cumulative impact. For example, in Quito, Ecuador, the local water company established a Water Fund to leverage water users’ willingness to pay for conservation efforts on a voluntary basis. The nondeclining, 80-year delimited trust fund receives financial contributions from the govern-ment, private companies, public utilities, and civil society (Arias et al. 2010; Coronel and Zavala 2014).
Insurance payments for risk reduction: Conservation-focused insurance products, such as flood mitigation bonds, offer promise for financing green infrastructure as a risk mitigation strategy. For example, in 2018, insurance and reinsurance brokerage Willis Towers Watson launched a Global Ecosystem Resilience Facility, which utilizes risk pooling and financial instruments, such as catas-trophe bonds, resilience bonds, grants, and loans, to promote nature-based programs such as coastal restoration (Artemis 2018).
Public-private partnerships: Public-private partnerships (PPPs) involve the private sector through a contractual agreement that enables their participation in project financing, planning, design, construction, operation, and maintenance. For example, landscape degradation in the upper Gil González watershed in southwest Nicaragua led to increasing water scarcity and deterioration of water quality. In response, the Belén local government and a private sugar company, CASUR, whose busi-ness relies heavily upon irrigation water during the dry season, entered into a payment for hydrological ecosystem services scheme. Both the local govern-ment and the company were service buyers, with the German Development Agency (GIZ) acting as facilitator (Hack et al. 2013).
Figure 5.5 | integrating Nature into infrastructure Designs Can Create Room for Rivers and Reduce Flood Risk
Image: Roger Veringmeier.

69Integrating Green and Gray
Development Partner Finance Development partner financing generally focuses on “public good investments,” while helping to facilitate private financing for “private good invest-ments.” Since many green infrastructure projects offer strong public good elements, as well as gener-ally high levels of risk and uncertainty, develop-ment partners are ideally placed to finance green infrastructure, which helps complement invest-ments by the private sector for more conventional gray infrastructure.
Development partners can finance specific projects that include green components. This can take the form of either conventional project financing where loan disbursements are made against payments to contracts, or through approaches akin to the “pay-for-success” financing models discussed in the previous section. The World Bank’s Program for Results (PforRs) is one example of this mechanism, in which loan disbursements are made against actual results.
Multilateral development banks (MDBs), includ-ing the World Bank and African, Inter-American, Asian, and European development banks typically provide such finance through loans to national governments at either market rates or on conces-sionary terms. Box 5.3 provides an overview of the World Bank’s green infrastructure portfolio. Some donor governments also offer bilateral financing for green infrastructure on either concessional loan or grant terms.
MDBs typically have specialized financing arms, such as the World Bank Group’s International Finance Corporation, that promote private invest-ments in developing countries through financial instruments such as equity, debt, and guarantees. In addition, specialized financial mechanisms that can provide grant or concessional financing for green infrastructure projects include the Global Environment Facility (GEF), the Green Climate Fund (GCF), and Climate Investment Funds.

WRI.org 70
in total, 81 World Bank–financed projects with green infrastructure or more broadly nature-based approaches were approved between 2012 and 2017. A project was included if it had a component that uses nature-based solutions, to contribute either directly or indirectly to delivery of infrastructure services. Among the Bank’s Global Practice (GP) sectors, Environment and Natural Resources (ENR); Social, Urban, Rural and Resilience (SURR); and Water naturally have the highest number of projects, followed by Agriculture, Transport, and information and Communication Technology (iCT).
What the World Bank achieves with green infrastructureThe World Bank is acknowledging the vast potential of the next generation of infrastructure to tackle the above-mentioned development challenges (source water and reservoir protection, coastal flooding and erosion protection, etc.). For example, in this portfolio review, the restoration or creation of mangrove forests was used in 23 projects, in many cases along with other built infrastructure components to enhance coastal flood protection. Similarly, reforestation and afforestation in watersheds and floodplains has been used extensively for flood protection and erosion control along with other gray components. Urban green spaces, coral reefs restoration, and aquifer recharge have also been used in World Bank projects to enhance storm protection or water supply services. Where the World Bank works with green infrastructurein terms of number of projects, the regional frontrunner in the use of these approaches is Africa, accounting for more than 60 percent of projects together with East Asia and the Pacific (EAP), followed by South Asia, Latin America and the Caribbean (LAC), and the Middle East and North Africa (MENA), as depicted in Figure 5.6. EAP and MENA host the largest number of efforts to manage water quality and quantity. Coastal challenges, like flooding and erosion, are mostly located in East Asia and the Pacific, and increasingly Latin America and the Caribbean. “inland” challenges, such as landslides and urban flooding as well as drought, are found mostly in projects across the Africa Region.
BOX 5.3 | WORLD BANK NATURE-BASED SOLUTIONS PROJECT PORTFOLIO, 2012–2017
Figure B5.3.1 | World Bank Projects with Green infrastructure Components
Soure: Authors.
0 5 10 15 20 25 30
Social, urban, rural and resilience
Environment and natural resources
Water
Agriculture
Social protection and labor
Transport and information andcommunications technology
Number of projects

71Integrating Green and Gray
Philanthropic Funds and GrantsMany conservation projects rely on seed funding in the form of grants to cover start-up costs and demonstration projects, and only engage larger-scale investors when a project is already proven and fully operational. Most grants and donations cannot be depended upon for long-term funding, however. For green infrastructure projects expecting a low or long-term return, grants or donations and program-related investments (PRIs) can be mixed with other funding sources to help “de-risk” projects seeking multiple investors.
Grants and donations: Public sector and philanthropic donors currently support the major-ity of green infrastructure test beds and pilots worldwide. For example, the U.S. Department of Agriculture’s Natural Resources Conservation Service (NRCS) operates a grant funding category dedicated to conservation finance–related projects, which aims to jumpstart private investment in con-servation activities. The World Bank has also uti-lized Global Environmental Facility (GEF) grants
mixed with loans to fund green infrastructure. For example, in China, the World Bank’s Water Con-servation Projects team leveraged a GEF grant to fund a new, untested pilot monitoring approach to measure project outcomes (see Appendix A, Case 6.B). The Bank’s resulting loan financed the devel-opment of new infrastructure, including innovative approaches to improve soil water conservation.
Program-related investments (PRIs): Some foundations have started offering loans or equity stakes at below-market interest rates (1 to 2 per-cent) for projects aligned with their mission, and there has been a steady rise in such PRIs for social and environmental projects. However, this has also created some difficulty in transitioning from the pilot phase—usually supported by grant-based seed funders—to larger-scale investments backed by private beneficiaries. This is because foundations and government funders often do not require per-formance monitoring to be tied to a development objective, opting instead for simple implementation checks (Bennett and Ruef 2016).
Source: Authors’ World Bank internal Portfolio Review.
Latin America and the Caribbean9 projects
MNA1 project
South Asia11 projects
East Asia and the Pacific26 projects
Africa29 projects
Europe and Central Asia5 projects
Figure 5.6 | World Bank Green infrastructure Projects, by Region
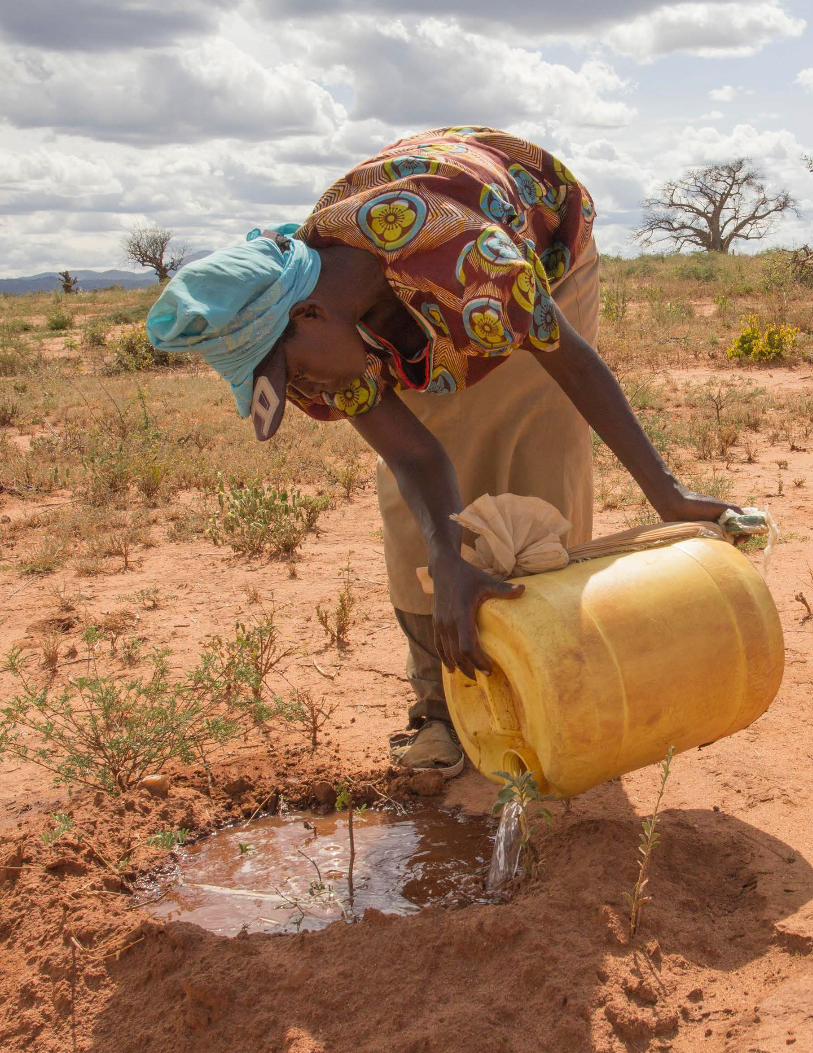

73Integrating Green and Gray
ENABLiNG POLiCiES FOR EFFECTiVE GREEN iNFRASTRUCTURE ▪ Compared to gray infrastructure, green solutions face many constraints, and so require proactive
policy interventions.
▪ Legal changes are often required to unlock investments by service providers.
▪ Development partners can play an important role in enabling projects that harness natural systems.

WRI.org 74
Sometimes simple changes in policy and legal frameworks can create major pathways for green infrastructure. The formation of the Quito Water Fund provides such an example.Quito’s drinking water comes from mountain ecosystems, which, despite protection efforts, have faced degradation from urban encroachment and unsustainable farm practices. This in turn threatened both the quantity and quality of water flowing to the city. in the 1990s Ecuador’s park service was responsible for protecting these areas, but the trickle of available public funds to cover these efforts proved insufficient to meet conservation needs.Quito’s water utility and other key stakeholders recognized the need to establish a long-term ecosystem conservation effort to secure water supply. Stakeholders agreed that the creation of a mutual fund with the voluntary participation of multiple water users, especially the water utility itself, was the ideal approach to create a sustained source of funding to support conservation efforts well into the future.One barrier to creating the fund was a law that prohibited government organizations such as the water utility from investing in private financial mechanisms. However, with a crucial change in the law governing public financing in 1999, Quito’s water company was able to establish the Quito Water Fund (Fondo para la Protección del Agua, FONAG)—the first water fund in Latin America.Creating the fund unlocked significantly more finance for green infrastructure than had been available through public environmental funds alone. The fund launched with an initial investment of $20,000 from the Quito water utility and $1,000 from The Nature Conservancy. it has since grown to $12 million, with an annual budget of approximately $2 million. Quito’s electric company and beer and water companies have also contributed. The Quito Water Fund has protected 33,000 hectares of key ecosystems and restored 2,500 hectares of degraded areas, and is now investing heavily in evaluating the hydrological impacts of these efforts.For more information, see Appendix A, Case 5.A.
BOX 6.1 | CHANGING POLICY TO FACILITATE SERVICE PROVIDER INVESTMENT IN THE QUITO WATER FUND
Compared to gray infrastructure, green solutions face many constraints, which require proactive policy interventions. As a result, supportive institu-tions and robust and effective policy frameworks are essential for implementing high-quality projects and catalyzing wider adoption on the global scale. Most relevant policies worldwide were developed without green infrastructure in mind and can inadvertently hinder or even prevent consideration of green infrastructure strategies. (Box 6.1 provides an example.)
Proactive Government Support Is Essential To guide efforts to create enabling conditions for systematic use of green infrastructure, these chal-lenges and others must be addressed (Credit Suisse and McKinsey & Co. 2016; Bennett and Ruef 2016; Ozment et al. 2016):
▪ High transaction costs: Nature-based solu-tions inherently require collaboration across sectors and sometimes across jurisdictions for implementation. These projects typically entail more partnership and capacity-building efforts than gray infrastructure before being “shovel ready,” since they often cross jurisdictions and sectors and rely on untrained communities. Sectoral divides in policymaking and planning can also increase the cost of implementing green infrastructure and reduce its viability. As a result, stakeholders must make a large finan-cial and human investment in “soft” activities to protect the investment.
▪ Jurisdictional spending restrictions: Many government departments and agen-cies don’t have the authority to spend money outside their jurisdictions. Yet, optimal green infrastructure project design follows ecosystem boundaries, not jurisdictional ones. For exam-ple, proposals to provide payments for a forest restoration project designed to improve water quality may be hindered because the project’s location does not fall within the jurisdiction of a single water utility or city. Brazil has over-come this challenge by establishing laws to facilitate cross-jurisdictional, statewide pay-ments for ecosystem services (see Appendix A, Case 1.B).

75Integrating Green and Gray
Examples of Enabling Policies and Programs Since green infrastructure is a relatively new con-cept, supportive national and subnational policies are lacking in most areas of the world (Shames et al. 2017). However, several countries, including Peru, the United States, and China, are introducing policy efforts that blaze a trail for other governments to follow. This chapter does not provide a compre-hensive review and evaluation of these policies, but rather points to some promising examples.
For instance, Peru has dealt with water crises related to El Niño for centuries, but climate change is exacerbating these challenges. Recognizing this increased risk, in 2016, Peruvian lawmakers passed a Sanitation Sector Reform Law. This requires water utilities to earmark revenue from water tariffs for watershed conservation and climate change adaptation, and to consider these strategies in offi-cial budgeting and planning processes (Jenkins et al. 2016). To date, this policy change has generated $30 million for green infrastructure projects via payments for ecosystem services, and an additional $86 million for climate change mitigation and disaster risk management (Momiy 2018).
In a similar move that paired policy reform with enabling financing mechanisms, California passed a bill that classified source watersheds as integral components of water infrastructure. The law represented a major change in the state’s legal and financing landscape by allowing the use of green infrastructure projects to support source water-sheds with the same types of financing typically reserved for gray infrastructure (State of California 2016). This innovation may motivate more invest-ments from utilities and other beneficiaries, as well as the state, in watershed health. One such early project is the Forest Resilience Bond, which utilizes investor capital and cost-sharing among beneficia-ries, including water utilities, to pay for benefits created by restoration activities, including a drop in the risk of severe wildfires.
▪ Risk-reward profile: Many institutional investors, and even development partners, may consider green infrastructure to be high risk and low reward. Despite the potential benefits of such projects, service providers charged with securing water supply or managing risks to communities may default to better known and tested solutions until more and better long-term green infrastructure performance data become available. Lack of systematic data collection and data sharing at regional and national levels can therefore inhibit planning and investment for much-needed solutions that complement hard-pressed gray infrastructure by harnessing natural systems.
▪ Unpredictable cash flows and long lock-in periods: As discussed in Chapters 2 and 4, green infrastructure benefits involve some inherent ecological uncertainty, are not easily predicted, and sometimes require more time to reach full functionality than gray infrastruc-ture. These characteristics can create chal-lenges with setting a payment schedule among beneficiaries. They can also pose challenges to investors seeking short- or medium-term returns, since projects that involve ecological restoration may take years for benefits to ac-crue.
As highlighted in the previous chapter, these kinds of challenges can be overcome through innovative financing and by mission-driven investors who can tolerate long payback periods. However, progres-sive policies and/or regulator buy-in also underpins these successful finance innovations. More gener-ally, effective policy and finance strategies for green infrastructure often go hand in hand.

WRI.org 76
China’s approach, through the National Program on Sponge Cities, is to inspire public-private partner-ships (PPPs) that unlock private finance for urban green infrastructure (Li et al. 2016). Under the program, the government provides funding and technical support to cities implementing urban green infrastructure to address growing water scarcity and flood hazards. The program invests between $59 and $88 million a year in each of its 30 pilot cities for three consecutive years as start-up capital for introducing green roofs, permeable pave-ments, and wetland restoration. China’s Ministry of Finance created a PPP model by soliciting private investment in construction projects and formalizing the government procurement process for PPPs.
Other countries have developed enabling condi-tions for green infrastructure through research and operational guidelines. For example, in 2016, the European Commission developed a green infra-structure research and innovation policy agenda, which called for targeted large-scale projects. Research and Innovation actions at the EU level are expected to foster an interdisciplinary stakeholder community to build a stronger evidence base to guide green infrastructure activities (Faivre et al. 2017).
Similarly, in 2009 the U.S. Department of Agricul-ture created the Office of Environmental Markets (OEM) to catalyze the development of ecosystem services. OEM aims to support uniform standards and market infrastructure that will facilitate market-based approaches to agriculture, forest,
and rangeland conservation and enhance America’s natural capital (USDA 2016). The Conservation Title of the federal Farm Bill provides public fund-ing for this program.
A growing number of international agreements, including the Paris Agreement, High Level Panel on Water, Sustainable Development Goals, and Sendai Framework for Disaster Risk Reduction, all include high-level commitments to promote ecosystem-based solutions, such as green infrastructure (see Appendix B for more information). These commit-ments are intended to result in country-level action, creating a window for more policy changes like the ones featured above. For example, among signa-tories of the Paris Agreement, 102 countries have committed to restore or protect natural resources as an adaptation measure in their Nationally Deter-mined Contributions (NDCs) (IIED 2018). Nature-based solutions were most commonly mentioned in the NDCs submitted by low- and lower-middle-income countries.
Since green infrastructure–support policies have typically been in place for a short time, and some have yet to be implemented, very few have been rigorously tested and proved effective. Where experiences with legislation have been monitored, the results show that green infrastructure policy implementation requires substantial adaptation over time to achieve its goals (see Box 6.2). Fol-lowing the progress and outcomes of these policies will provide better insights on how to improve their impact.
Figure 6.1 | Agroforestry Can Boost Farm Productivity While Conserving Soil and Water
Image: WRi/Flickr.

77Integrating Green and Gray
General Principles for GovernmentsTo facilitate the needed global transition toward national enabling conditions that support green as well as gray infrastructure, public policy should ide-ally include the following elements (adapted from Shames et al. 2017; Ozment et al. 2015):
▪ Incorporate sustainable landscape vi-sion into strategies and policies. A high-level vision can help mediate common conflicts between economic growth and conservation interests. Governments can act by first creating a shared vision of the multiple goals of sus-tainable landscapes and then embedding that vision into relevant jurisdictional strategies.
▪ Harmonize sectoral plans to incorporate multiple goals for harnessing natural systems. Sector-siloed government plan-ning processes often hinder projects that seek to achieve multiple, cross-sector objectives. Development partners can help policymakers recognize potential synergies by supporting the alignment of green infrastructure objectives, budgets, and capacities across agencies respon-sible for different sectors, and by facilitating and rewarding interagency collaboration. To operationalize such approaches, governments should promote interagency coordination that minimizes red tape.
▪ Create incentives for local actors to participate through policy and public finance. Governments can earmark public funds for explicit green infrastructure pro-grams or set policy that generates funds from other sources, such as land value capture, water tariffs, and insurance. This can include align-ing public incentives with local or privately led projects to maximize benefits, as well as establishing national payments for ecosystem services or land acquisition programs.
▪ Encourage or require decision-makers to consider green infrastructure op-tions in planning processes. This could take the form of new guidance or policy, such as providing criteria for infrastructure projects to include evaluations of green options, or the adoption of building codes or zoning laws that require dedicating space to green elements.
Historically, land-use changes in Costa Rica were primarily driven by clearing lands for agricultural needs and for the development of transportation infrastructure networks. While forest covered nearly 80 percent of the country’s land area in the 1940s, forested area had dropped to roughly 40 percent by the 1980s. By 2013, however, Costa Rica’s forest cover had rebounded to approximately 50 percent of the country’s land area (Porras et al. 2013). This was the result of a policy mix that evolved over the course of the past century, including, for example, secure land titles for landowners (Thacher et al. 1996); legally protected lands (Porras et al. 2013); deforestation bans; and an evolution of efforts to provide financial incentives for restoration (Daniels et al. 2010; Bennett and Henninger 2010). As one component within this suite of policies, Costa Rica set up one of the first national Payments for Ecosystem Services programs in the world. in this program, water users such as hydropower companies pay upstream landowners within the same watershed to manage land in a way that supports water management goals. This program enabled the country to move beyond relying solely on tax revenue funds to incorporate user/beneficiary finance for ecosystem services stewardship. Between 1997 and 2017, more than 17,000 contracts were signed with landowners to carry out a range of forest restoration and conservation practices on a cumulative 1.2 million hectares. Costa Rica’s PES program has adaptively managed its implementation strategy to achieve the intended goals. Several years ago, program evaluations critiqued that PES was doing little to slow deforestation. As a result, the program has adopted new approaches, utilizing more advanced tools and mechanisms to prioritize efforts in high-impact regions and to better ensure green infrastructure performance (Porras et al. 2013; Blackman and Woodward 2010). For more information, see Appendix A, Case 1.A.
BOX 6.2 | POLICY INNOVATION SUPPORTS GREEN INFRASTRUCTURE IN COSTA RICA

WRI.org 78
▪ Empower civil society to build partner-ships. Effective green infrastructure projects need locally legitimate multistakeholder bodies to negotiate conflicts and trade-offs, identify opportunities for synergistic action, and de-termine the most appropriate spatial-targeting and sequencing of investments. Effective public policy should empower all relevant stakehold-ers, particularly the less powerful ones, to participate in these local decision-making processes.
▪ Recognize land and resource rights and responsibilities. Governments can play an important role in recognizing and enforcing lo-cally legitimate systems of rights and responsi-bilities that govern who can initiate and benefit from green infrastructure projects. It is also important to set policy that protects communi-ties and landowners to ensure they receive fair compensation for the marketable ecosystem services they provide.
▪ Develop a regulatory framework that supports green infrastructure in plan-ning processes and as a compliance mechanism. These frameworks need to support green infrastructure broadly, and provide enforceable and well-coordinated rules at landscape scale. To accomplish this, govern-ments can work to ensure that land-use zoning and planning reflects agreed landscape goals; provide the resources and capacities to imple-ment and enforce laws and regulations; and coordinate regulations across sectors. Gov-ernments can signal, for example, that green infrastructure can be used to comply with environmental requirements of building codes for urban settings, safety regulations for water supply, and environmental impact mitigation plans for all services.
▪ Participate directly in green infrastruc-ture partnerships. In most successful cases to date, governments play a variety of important roles in green infrastruc-ture partnerships. These include hosting stakeholder meetings, engaging key stake-holders, bridging inputs from public agencies, advising on policy options, using their outreach mechanisms to raise public awareness, and legitimizing support for the multistakeholder platform.
▪ Build the knowledge and technical capacity to implement green infrastruc-ture. Planning and managing projects that harness natural systems requires a unique body of knowledge and technical capacity. Col-lecting baseline data on ecosystem health and following trends in environmental degradation like deforestation, drought, and restoration, makes it easier to determine the suitability of green infrastructure in meeting local needs and priorities, as well as to monitor project impacts and promote shared learning. To support this process, governments can develop and dissemi-nate information through research and data collection programs, as well as generate and share information on implementation. Other important investments include building the capacities of service providers, governments, development partners, and other stakeholders to facilitate collaborative processes, and devel-oping metrics that measure multiple outcomes.

79Integrating Green and Gray
Role of Development PartnersDevelopment partners can support enabling environments for green infrastructure by promot-ing the above principles to partner governments. In addition, the development community can help governments overcome barriers to implementation by supporting the following:
▪ Joint investment planning among stakeholders
▪ Development of supportive market and trade rules
▪ Knowledge and technical capacity to implement green infrastructure
▪ Development of fiscal policy to incentivize such solutions
Development partners can deploy specific instru-ments to help promote reforms:
Country program documents: Development partners typically prepare national program docu-ments to guide their interventions with client coun-tries in collaboration with national governments. For example, the World Bank prepares a “System-
atic Country Diagnosis” and “Country Partnership Framework.” This type of high-level analysis and policy dialogue can help highlight the linkages between green and gray infrastructure.
Sector strategies and master plans: Develop-ment partners often finance national-level stud-ies that focus on strategic sector-level planning. Relevant examples include national environmental, agricultural, and water plans. In addition, they often support the formulation of infrastructure master plans; for example, for water or power utili-ties. These studies—which are often formulated and overseen by development partners—provide ideal opportunities to promote the adoption of support-ive policies.
Policy financing: Development partners can also promote supportive policies and financing mecha-nisms using policy finance instruments. These instruments release financing to a country’s general budget based upon government adoption of specific agreed-upon policies and often focus on policies related to the environment, agriculture, and other natural resource management issues.
Figure 6.2 | Green Roofs Help Control Urban Flooding While Also Reducing Heating and Cooling Needs for Buildings
Image: DJANDYW.COM/Flickr.
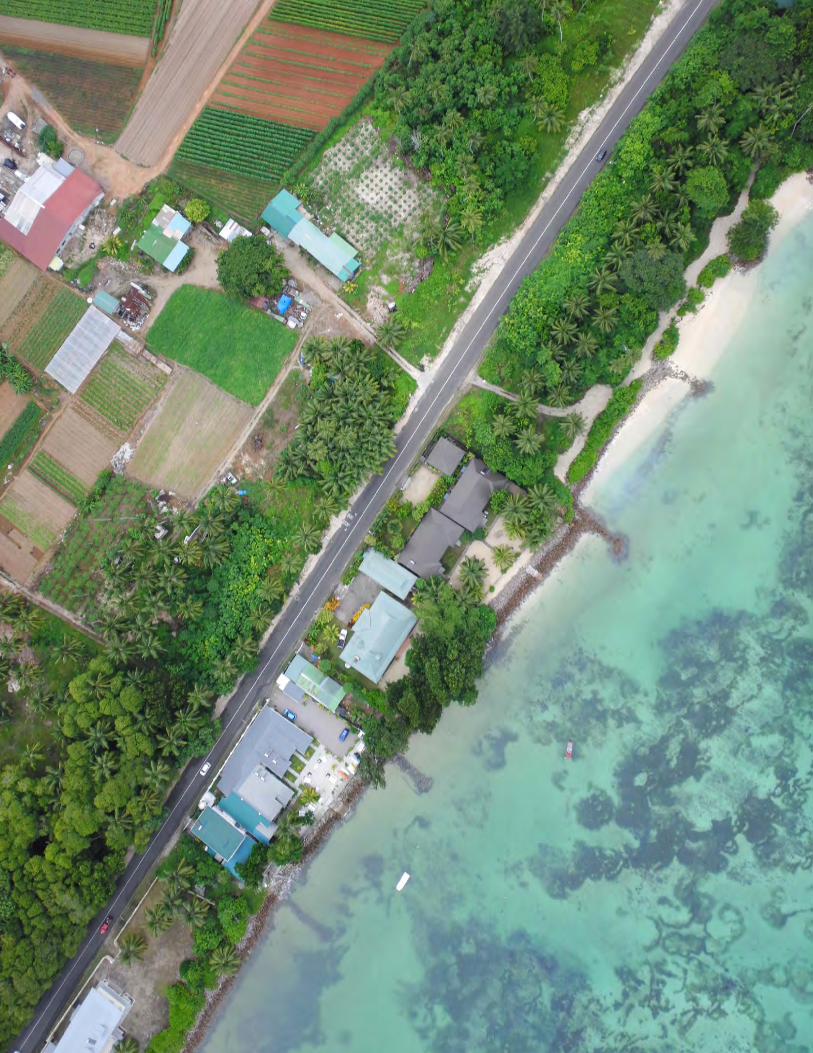

81Integrating Green and Gray
THE WAY FORWARDThe general value proposition for integrating green and gray
infrastructure is clear: a “triple-win” of being good for the economy,
good for communities, and good for the environment. By opening
new financing opportunities, seeking to engage coalitions of active
citizens and engaged institutions, and harnessing nature’s assets,
the development of next-generation infrastructure can play a role in
building a better future.

WRI.org 82
Until now, a key bottleneck to its widespread use has been the need for guidance and information to design and evaluate green infrastructure on the same footing as gray infrastructure. This report moves beyond the common discourse of nature-based solutions in isolation, showing how com-bining green and gray infrastructure often offers technical, social, and economic advantages. In providing such guidance, this report should enable governments, service providers, and their develop-ment partners to adopt more effective green-gray project strategies.
The lessons extracted from the case studies and the robust literature base provided in this report can help inform their infrastructure programs and spur development of new projects. Using the framework provided will enable stakeholders to undertake a structured and objective appraisal of project risk and return, so that a more vigorous case for invest-ment in combined approaches can be made.
While this guidance has immediate use, more work must be done to ease the process of planning, appraising, and implementing green infrastructure. The level of complexity and uncertainty, together with the need to prioritize social support for green infrastructure and engage in broad multisector partnerships, can be unchartered territory for service providers and their development partners. The most suitable approach depends largely on the specific context. For example, a green infrastructure approach may be technically optimal in one context and ineffectual in another. Likewise, the social dynamics in one community may allow for win-win green infrastructure, while another community could reject the same proposal.
In addition to the guidance provided in this report, governments, service providers, and development partners can together facilitate accelerated adop-tion of green infrastructure by undertaking the following:
Routinely considering opportunities to integrate green infrastructure approaches in the planning process. As a first step, govern-
ments, service providers, and development partners should begin to routinely consider opportunities to identify and integrate green infrastructure options in the planning process. They can use the frame-work provided in Chapter 1 of this report to under-stand key questions to ask when screening for green infrastructure opportunities in high-level planning processes, such as river basin plans, urban master plans, or infrastructure master plans.
Utilizing advanced tools and guidelines to design and assess the performance of green infrastructure. New technology is reducing the cost of data collection and improving the perfor-mance of modeling and monitoring tools; this can help increase confidence in the performance of green infrastructure. At the same time, the formula-tion of new operational guidelines and best practice manuals will provide tools to guide the formulation of green-gray approaches. This report points out some limitations in current tools and guidelines—especially in ensuring that social support for green infrastructure is prioritized, as well as for consis-tent and high-quality reporting on observed green infrastructure costs and performance. Consistent monitoring and reporting of green infrastructure performance would enhance the evidence base, improve design, and result in better projects and more widespread adoption.
Leveraging partnerships to bring resources and skills to the infrastructure planning process. While this report was led by the World Bank and the World Resources Institute, many more organizations have contributed to the dis-course and many more still need to join in. These stakeholders include approving bodies, civil soci-ety organizations, project beneficiaries, potential co-investors, and technical experts. Integrating green and gray infrastructure requires buy-in from engineers, economists, financial experts, environ-mental and social specialists, and most importantly policymakers. As a first step, the discourse on green infrastructure must be expanded beyond the envi-ronmental sustainability realm to include engineer-ing circles, and it must permeate policy discussions.

83Integrating Green and Gray
Engaging policymakers to promote green-gray approaches through policies, laws, and regulations. Toward this goal, an important step is crafting policy statements that explicitly recog-nize the role of natural systems in safeguarding and enhancing infrastructure at the national, regional, municipal, and utility/company levels. While this report highlighted several examples of policy reforms aimed at unlocking investments, these types of policies are still relatively rare, and their effectiveness has not been systematically studied. Such policy evaluations are necessary to define best practices and inform future efforts around the world.
Building capacity within development part-ner organizations, planning agencies, and service providers to understand the poten-tial of green infrastructure. For example, the World Bank, with funding from the Global Facility for Disaster Reduction and Recovery, is developing targeted communication materials that describe nature-based solutions to address common hazards, and providing guidance to countries on where to apply these solutions (World Bank 2017b).
Looking Ahead: Learning New Lessons and Closing Knowledge GapsAs policymakers, service providers, and their devel-opment partners start to mainstream green-gray approaches, they are likely to encounter additional bottlenecks that will need to be addressed. An important issue is the need to develop a more com-prehensive and robust body of scientific knowledge to inform the selection and design of green infra-structure strategies. The report points to key data and research gaps that may prevent widespread adoption of green infrastructure. Plugging these gaps requires the following:
▪ Better monitoring of project performance, along with improved scientific knowledge
▪ Better documentation of experiences to deter-mine what works, what doesn’t, and what’s the fastest way to make progress
▪ Better economic analysis that incorporates en-vironmental and social cobenefits, as well as the values of resilience and reversibility
New efforts that build on this report will in turn reveal additional lessons that further enhance green infrastructure design and assessment practices. Ideally, future projects will draw on the guidance in this report to consistently assess costs and benefits of green infrastructure in ways that can be syn-thesized to inform future projects. These projects will also generate new lessons on financing green and gray infrastructure, develop best management practices, and provide insights on how best to pursue combined solutions.
Project developers should plan performance monitoring and evaluation early in the process, and account for monitoring costs in their budget. Devel-opment partners can share practical case studies of both successful and unsuccessful experiences that help others understand why and how to consider green-gray approaches. Other key stakeholders such as civil society and government researchers can help address these bottlenecks by targeting research to fill knowledge gaps identified through existing project experiences.
As more governments, service providers, and their development partners draw on lessons learned, the integration of green and gray solutions will herald the next generation of infrastructure, which performs better, generates multiple benefits, and increases climate resilience.

APPENDIX A | Services That Can integrate Green infrastructure and Related Case Studies

85integrating Green and Gray
This appendix features green infrastructure in the context of the infrastructure services listed below. For each service, two case studies are provided—one from the World Bank portfolio (denoted by an asterisk) and one from outside the World Bank portfolio. The cases illustrate how projects have integrated green infrastructure into gray infrastructure systems, or substituted gray infrastructure components with green infrastructure in a wide variety of contexts and geogra-phies across the world.
Table of Contents86 1. Water Supply and Hydropower
88 1a. Payments for Ecosystem Services to Support Hydropower Operations in Costa Rica
90 1b. Targeted Green infrastructure for Source Water Protection in Brazil*
92 2. Coastal Flood Management and Erosion Control
94 2a. Piloting Mega Sand Nourishment for Coastal Flood Management in the Netherlands
96 2b. Using Mangroves and Sea Dikes as First Line of Coastal Defense in Vietnam*
98 3. River Flood Management
100 3a. integrating Green and Gray infrastructure for River Flood Management in the United States
102 3b. Combining Green and Gray infrastructure for Flood Risk Management at the River Basin Scale in Poland*
104 4. Urban Stormwater Management
106 4a. innovative Financing for Urban Green infrastructure in the United States
108 4b. Conserving Wetlands to Enhance Urban Flood Control Systems in Sri Lanka*
110 5. Drought Management
112 5a. User-financed Ecosystem Conservation for Water Security in Ecuador
114 5b. Recharging Aquifers to Combat Drought in Somalia*
116 6. Agriculture, Irrigation, and Drainage
118 6a. Community-led Watershed Restoration in india
120 6b. Active Soil Management for Water Conservation in China*
APPENDiX A: SERViCES THAT CAN iNTEGRATE GREEN iNFRASTRUCTURE AND RELATED CASE STUDiES

WRI.org 86
The ChallengeService providers and government agencies respon-sible for water supply and hydropower often face disruptions and management challenges due to upstream ecosystem degradation. These challenges include the following:
▪ Siltation and pollution, which can occur when catchment areas are unsustainably man-aged and lack protective vegetative cover, such as with overgrazing or wildfires. Surface water runoff and erosion carries increasing amounts of sediment, nutrients, pesticides, fertilizers, and other pollutants or debris into rivers and reservoirs. Resulting turbid waters can create costly wear and tear on hydropower dams and turbines, and even require dredging because of reduced reservoir storage capacity.
▪ Impaired quantity and timing of flows, which can occur when a watershed’s ability to capture, infiltrate, and store water is inhibited, such as with deforestation. Landscape deg-radation can damage the natural sponge-like characteristics of forests, grasslands, wetlands, and riparian areas, causing surface water runoff and reduced water storage. Groundwater recharge, maintenance of stream flows during dry seasons, and flood risks can be affected (McDonald and Shemie 2014).
These challenges can be costly. Watershed degrada-tion impacts drinking water for more than 700 mil-lion people, and costs global cities US$5.4 billion in water treatment annually (McDonald and Shemie 2014). Worldwide annual costs to replace lost reser-voir storage capacity due to sedimentation—in the form of constructing new or raising existing dams—are estimated to be $10 to $20 billion (Palmieri et al. 2003). Cost-effective, sustainable management of watersheds and reservoir catchment areas to help prevent reservoir sedimentation from occurring may be more economically desirable.
What Role Can integrating Green and Gray infrastructure Play?Targeted protection, restoration, or management of watersheds and natural landscapes in headwaters upstream of water intake points can help improve water quality, sediment control, and timing and seasonal flows of water (Gartner et al. 2013). Examples include the following:
▪ Forests, wetlands, and riparian buffers. Conservation or restoration of these ecosystems can help stabilize soils and combat erosion; preserve their ability to store water and aug-ment flows; and filter pollutants, preventing their entrance into the water supply.
▪ Active forest management practices. Re-turning a forest to healthy conditions through active management, such as mechanical thin-ning, removal of small trees and brush, and prescribed burning can help reduce overgrowth and wildfire risk. Burned lands reduce vegeta-tion and expose soil, resulting in an increased risk of flooding and erosion.
▪ Reconnecting rivers to floodplains. Set-ting back or removing levees at the edge of river channels can help increase channel capacity and reduce exposure to floodwaters and erosion risk. Providing more room for meandering and healthy floodplains enables the creation of for-est and wetland habitats that store water and decrease sedimentation downstream (UNEP et al. 2014).
Green infrastructure can provide hydrological benefits with significant savings in avoided cost. For example, New York City has avoided building a new filtration plant that would have cost the city $8 to $10 billion by making a $1.5 billion investment in its 2,000 square-mile upper watershed. This invest-ment has also resulted in the injection of $100 million into the rural economy through supple-mental income to farmers and landowners involved in efforts to conserve the watershed (UNEP et al. 2014).
1. WATER SUPPLY AND HYDROPOWER
OVERVIEW | Water Supply and Hydropower

87Integrating Green and Gray
ConsiderationsPrograms to preserve upper watersheds for source water protection and the longevity of hydropower reservoirs and facilities involve a range of stake-holders. Stakeholders can include downstream beneficiaries such as communities, businesses, and utilities that buy or make payments for watershed services; upstream landholders that represent public, commercial, collective, and private inter-ests; and investors that contribute initial capital to design and begin projects.
Ensuring a diverse funding base is important for securing sufficient initial and long-term funding for these programs (Ozment et al. 2016), and requires understanding barriers to scaling watershed invest-ments (Bennett and Ruef 2016). Projects that can demonstrate both the quantifiable ecological ben-efits received as well as financial returns for dollars invested can help leverage a larger pool of dollars (Bennett and Ruef 2016).
Source: USDA NRCS Texas/Flickr.
Figure A1 | A Riparian Buffer Offers a Natural Filtration System That Helps Prevent Pollutants from Reaching the Water Stream

WRI.org 88
LOCATION: Nationwide Through national policy, Costa Rica implemented a voluntary payment for an ecosystem services program that directly incentivized landowners to restore and conserve forestland, preserving downstream reservoirs and the health of the country’s hydropower generation infrastructure.
Background The vast majority of Costa Rica’s land area was once forested. In 1943, 77 percent (3.9 million hectares [ha]) of the country was forestland, but by the late 1980s this figure had fallen to 41 percent—less than 2.1 million hectares—and Costa Rica had one of the highest deforestation rates of any nation in the world (Buckingham and Hanson 2015a; Bennett and Henninger 2010). The primary causes of deforestation were clearing land for crops and livestock, and the country’s rapidly developing road network. Deforestation upstream of hydro-power dams was resulting in soil erosion and sedimentation of reservoirs, threatening reservoir capacity and the deterioration of hydropower turbines in a country that was relying upon hydropower for three-quarters of its electricity (Buckingham and Hanson 2015a). In 1996, Costa Rica’s Forestry Law 7575 established a National Fund for Forest Financing (Fondo Nacional de Financiamiento Forestal, FONAFIFO) overseen by the Ministry of Environment and Energy (Ministerio de Ambiente, Energía y Telecomunicaciones, MINAET) to facilitate payment for ecosystem services (PES) for forest conservation and restoration. Monitoring of compliance by landowners participating in the FONAFIFO PES program is the responsibility of MINAET and the National System of Protected Areas (Sistema Nacional de Areas de Conservación, SINAC).
integrating Green and Gray infrastructure Between 1997 and 2017, more than 17,000 contracts were signed with landowners to carry out a range of for-est restoration and conservation practices (FONAFIFO 2018). At the end of 2017, more than 280,000 hectares were enrolled in the program (Table A1). As of 2005, 35 percent of lands participating in the PES program were in a watershed with downstream users of hydrological services—drinking water and hydropower facili-ties—and thus classified as important for water benefits, while 30 to 65 percent were in biodiversity priority areas (Pagiola 2008) country-wide program of payments, the PSA program. The PSA program has worked hard to develop mechanisms to charge the users of environmental services for the services they receive. It has made substantial progress in charging water users, and more limited progress in charging biodiversity and carbon sequestration users. Because of the way it makes payments to service providers (using approaches largely inherited from earlier programs.
CASE STUDY 1APayments for Ecosystem Services to Support Hydropower Operations in Costa Rica
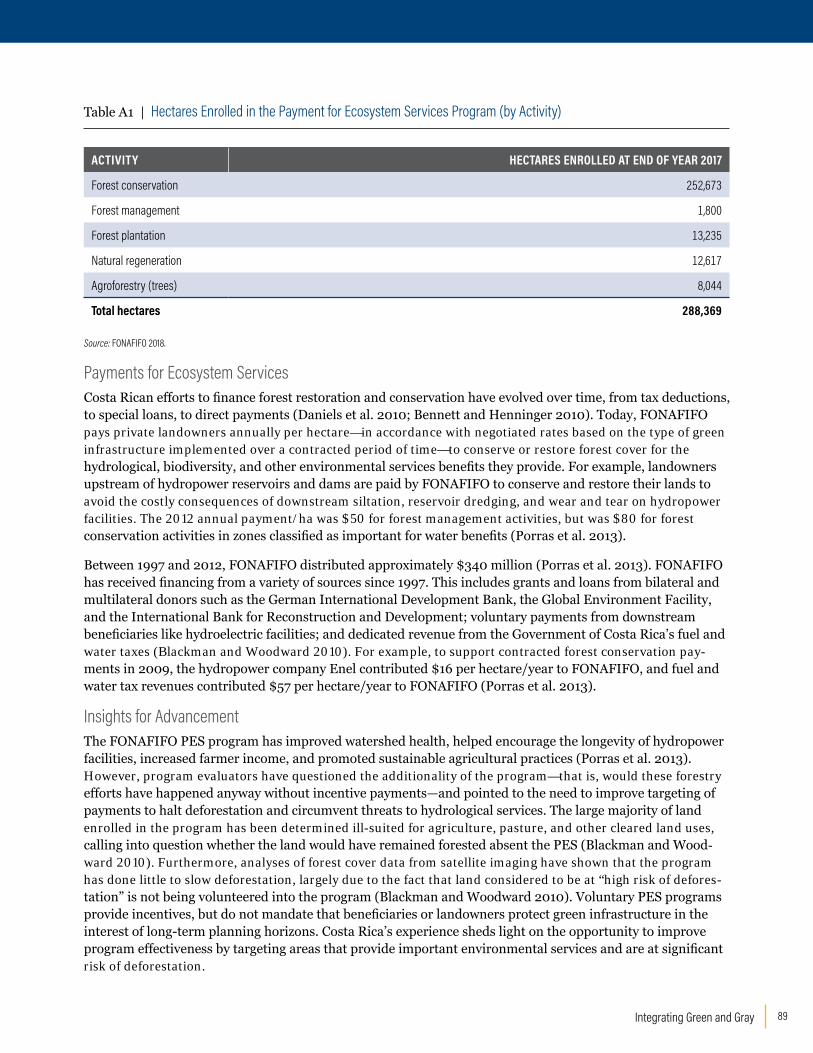
89Integrating Green and Gray
ACTIVITY HECTARES ENROLLED AT END OF YEAR 2017
Forest conservation 252,673
Forest management 1,800
Forest plantation 13,235
Natural regeneration 12,617
Agroforestry (trees) 8,044
Total hectares 288,369
Source: FONAFiFO 2018.
Payments for Ecosystem Services Costa Rican efforts to finance forest restoration and conservation have evolved over time, from tax deductions, to special loans, to direct payments (Daniels et al. 2010; Bennett and Henninger 2010). Today, FONAFIFO pays private landowners annually per hectare—in accordance with negotiated rates based on the type of green infrastructure implemented over a contracted period of time—to conserve or restore forest cover for the hydrological, biodiversity, and other environmental services benefits they provide. For example, landowners upstream of hydropower reservoirs and dams are paid by FONAFIFO to conserve and restore their lands to avoid the costly consequences of downstream siltation, reservoir dredging, and wear and tear on hydropower facilities. The 2012 annual payment/ha was $50 for forest management activities, but was $80 for forest conservation activities in zones classified as important for water benefits (Porras et al. 2013).
Between 1997 and 2012, FONAFIFO distributed approximately $340 million (Porras et al. 2013). FONAFIFO has received financing from a variety of sources since 1997. This includes grants and loans from bilateral and multilateral donors such as the German International Development Bank, the Global Environment Facility, and the International Bank for Reconstruction and Development; voluntary payments from downstream beneficiaries like hydroelectric facilities; and dedicated revenue from the Government of Costa Rica’s fuel and water taxes (Blackman and Woodward 2010). For example, to support contracted forest conservation pay-ments in 2009, the hydropower company Enel contributed $16 per hectare/year to FONAFIFO, and fuel and water tax revenues contributed $57 per hectare/year to FONAFIFO (Porras et al. 2013).
insights for AdvancementThe FONAFIFO PES program has improved watershed health, helped encourage the longevity of hydropower facilities, increased farmer income, and promoted sustainable agricultural practices (Porras et al. 2013). However, program evaluators have questioned the additionality of the program—that is, would these forestry efforts have happened anyway without incentive payments—and pointed to the need to improve targeting of payments to halt deforestation and circumvent threats to hydrological services. The large majority of land enrolled in the program has been determined ill-suited for agriculture, pasture, and other cleared land uses, calling into question whether the land would have remained forested absent the PES (Blackman and Wood-ward 2010). Furthermore, analyses of forest cover data from satellite imaging have shown that the program has done little to slow deforestation, largely due to the fact that land considered to be at “high risk of defores-tation” is not being volunteered into the program (Blackman and Woodward 2010). Voluntary PES programs provide incentives, but do not mandate that beneficiaries or landowners protect green infrastructure in the interest of long-term planning horizons. Costa Rica’s experience sheds light on the opportunity to improve program effectiveness by targeting areas that provide important environmental services and are at significant risk of deforestation.
Table A1 | Hectares Enrolled in the Payment for Ecosystem Services Program (by Activity)
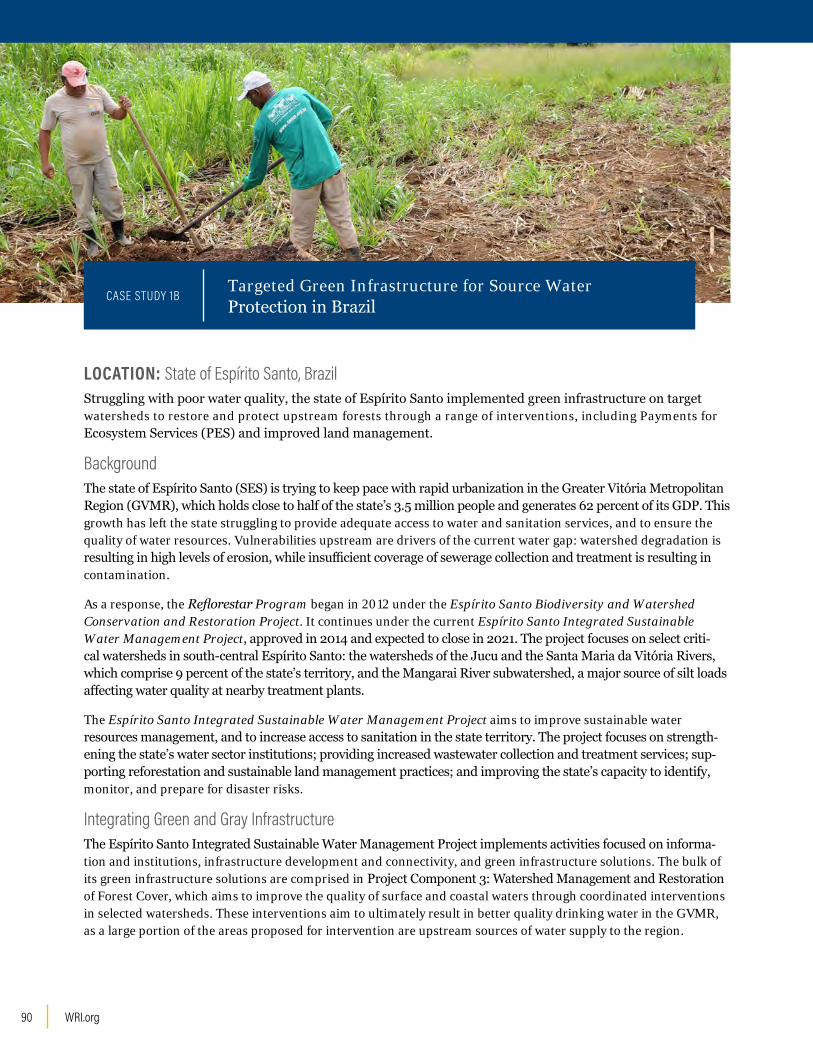
WRI.org 90
LOCATION: State of Espírito Santo, Brazil Struggling with poor water quality, the state of Espírito Santo implemented green infrastructure on target watersheds to restore and protect upstream forests through a range of interventions, including Payments for Ecosystem Services (PES) and improved land management.
Background The state of Espírito Santo (SES) is trying to keep pace with rapid urbanization in the Greater Vitória Metropolitan Region (GVMR), which holds close to half of the state’s 3.5 million people and generates 62 percent of its GDP. This growth has left the state struggling to provide adequate access to water and sanitation services, and to ensure the quality of water resources. Vulnerabilities upstream are drivers of the current water gap: watershed degradation is resulting in high levels of erosion, while insufficient coverage of sewerage collection and treatment is resulting in contamination.
As a response, the Reflorestar Program began in 2012 under the Espírito Santo Biodiversity and Watershed Conservation and Restoration Project. It continues under the current Espírito Santo Integrated Sustainable Water Management Project, approved in 2014 and expected to close in 2021. The project focuses on select criti-cal watersheds in south-central Espírito Santo: the watersheds of the Jucu and the Santa Maria da Vitória Rivers, which comprise 9 percent of the state’s territory, and the Mangarai River subwatershed, a major source of silt loads affecting water quality at nearby treatment plants.
The Espírito Santo Integrated Sustainable Water Management Project aims to improve sustainable water resources management, and to increase access to sanitation in the state territory. The project focuses on strength-ening the state’s water sector institutions; providing increased wastewater collection and treatment services; sup-porting reforestation and sustainable land management practices; and improving the state’s capacity to identify, monitor, and prepare for disaster risks.
integrating Green and Gray infrastructureThe Espírito Santo Integrated Sustainable Water Management Project implements activities focused on informa-tion and institutions, infrastructure development and connectivity, and green infrastructure solutions. The bulk of its green infrastructure solutions are comprised in Project Component 3: Watershed Management and Restoration of Forest Cover, which aims to improve the quality of surface and coastal waters through coordinated interventions in selected watersheds. These interventions aim to ultimately result in better quality drinking water in the GVMR, as a large portion of the areas proposed for intervention are upstream sources of water supply to the region.
CASE STUDY 1BTargeted Green Infrastructure for Source Water Protection in Brazil

91Integrating Green and Gray
Sediment Reduction The Watershed Management and Restoration of Forest Cover project component supports two key programs to reduce sedimentation and improve water quality:
▪ Reflorestar Program ($16.2 million): The Reflorestar Program implements a Payments for Ecosystem Services (PES) scheme to encourage conservation of forest cover and restoration of degraded ecosystems in the watersheds upstream of the GVMR. The land uses supported by Reflorestar tend to increase infiltration, reduce runoff, and limit access to rivers by livestock, thus reducing erosion, and hence sediment loads.
▪ Mangaraí River Pilot Project ($7.4 million). The Mangaraí River subwatershed is a major source of silt loads affecting the water quality at its Santa Maria and Carapina treatment plants. The Mangaraí River Pilot Project seeks to reduce silt loads originating in this subwatershed through a holistic approach that combines reforesta-tion and improved land management with a range of other interventions, such as improvement to roads and sanitation in the watershed. The Secretariat of Water and Environment for the State of Espírito Santo (Sec-retaria de Estado do Meio Ambiente e Recursos Hídricos, SEAMA) estimates indicate that recovering forest cover in 10,000 hectares could result in 20 percent of sediment reduction lost (SEAMA 2018).
This project component has an estimated net economic benefit of $13 to $18 million, and an internal rate of return ranging from 12.7 to 16.8 percent. Its main beneficiaries are landowners, who receive payments for environmental ecosystem services, achieve regulatory compliance, and generate higher income from more productive practices. Further, if the intervention is able to stabilize turbidity levels, the water utilities and hydropower companies and even the port of Vitória would benefit from sediment retention upstream. While recent estimates indicate that the water utility CESAN (Companhia Espírito Santense de Saneamento) would save a total of R$15.5 million over 30 years by saving in average input costs, avoiding future investments in new filtering equipment, or reducing mainte-nance costs in Carapia alone; the port of Vitória would also save by avoiding new dredging operations (Pagiola et al. forthcoming). Subsequently, consumers also benefit from avoided costs of service providers, which could otherwise result in higher prices and tariffs.
insights for Advancement The challenges and successes of the Espírito Santo Integrated Sustainable Water Management Project have been influenced by both policies and incentives. Early on, the changing legal and political landscape generated confu-sion, leading farmers who had already signed up to the PES program to unsubscribe when they thought they would be fined for noncompliance. Once the legislation was formalized, farmers re-enrolled. In addition, the program garnered political support from both the governor and secretary of environment. Meanwhile, the multilevel incen-tive structure was another main driver for participation and success of the program. As mentioned above, landown-ers, the state, and water users all had something to gain from the program. Other drivers for success included the following:
▪ Targeted restoration. Although politicians wanted to avail themselves of the program funds for all of their constituents, it was important that the program focus on priority areas where they would have the largest con-servation return on reduced sediment for each dollar spent.
▪ Local participation. It was important to have the local population provide feedback on the program. This brought not only legitimacy, but also local ownership.
▪ Outreach and education. With the aim to engage citizens of all ages, the project published a successful series of comic books about watershed conservation geared toward children and distributed these in schools.
▪ Technical staff. A committed and capable technical staff is fundamental to obtaining results on the ground.
▪ Leadership. The program has a well-prepared, capable, and committed leader who is supported at the high-est level by the secretary of environment.
This PES law in the State of Espírito Santo has since been used as a model throughout Brazil. With the project’s support, the SES intends to expand its Reflorestar Program to 21 municipalities and restore approximately 3,850 hectares of forest. Insights into the challenges and drivers for success from experience with this project can help inform successful applications in other geographies.
For more information, see World Bank (2014).

WRI.org 92
The ChallengeCoastal areas around the world are vulnerable to damages to built structures, livelihoods, and ecosys-tems inflicted by risky development patterns, rising seas, and intensifying weather events, posing chal-lenges to coastal management authorities and the communities they protect. Some challenges these service providers face include the following:
▪ Inundation of low-lying areas, which can occur when wind tides, coastal storms, and surges create abnormal rise in seawater that ultimately submerges the coast and hinterland in floodwater. As sea levels rise, storm flooding can be exacerbated and permanently inundate surface areas.
▪ Saltwater intrusion and higher water tables, which can occur as rising seawater pushes its way inland below the surface. Invad-ing saltwater increases the salinity of estuaries and moves into freshwater aquifers, contami-nating drinking water supplies and decreas-ing freshwater storage in aquifers. As water tables are forced closer to the surface, risk for groundwater flooding and exacerbated flooding from storm surges and heavy rainfall increases (Barlow 2003).
▪ Shoreline and dune erosion, which can occur when waves, currents, and wind remove sand and rock from the beach system. Storm surges significantly retreat shorelines and challenge the integrity of dunes, carrying sand away to deposits offshore (USGS 2017). Surface area elevation ultimately subsides, encroaching toward the sea.
Consequences can be catastrophic. In 2005, aver-age losses from flooding in more than 130 of the world’s largest coastal cities were roughly $6 billion per year. By 2050, losses are expected to increase to at least $52 billion per year, and could be as high as $1 trillion per year because of subsidence and climate-related impacts (Hallegatte et al. 2013).
What Role Can integrating Green infrastructure Play?Green infrastructure can complement conventional gray infrastructure to protect communities and buf-fer against coastal waves and erosion. For example:
▪ Mangroves and salt marshes. Mangroves and salt marsh ecosystems can help increase water storage, prevent erosion by stabilizing sediment, and decrease wave heights and veloc-ity. Salt marshes have been shown to reduce nonstorm wave heights by an average of 72 per-cent, while mangroves can achieve a 31 percent reduction (Narayan et al. 2016).
▪ Coral and oyster reefs systems. Coral and oyster reef systems can help break waves and dissipate their energy before they reach the coastline. Coral reefs, for example, are esti-mated to reduce nonstorm wave heights by an average of 70 percent (Narayan et al. 2016).
▪ Sandy beaches and dunes. Maintaining robust beaches and dunes, for instance, with artificial replenishment, can help prevent waves and storm surges from breaching inland or developed areas. Vegetation on dunes can also help prevent erosion by trapping and stabi-lizing sand.
▪ Seagrass. Seagrass can help stabilize sedi-ment and regulate water flow and currents that cause coastal erosion in shallow areas. Sea-grass beds have been estimated to reduce non-storm wave height by an average of 36 percent (Narayan et al. 2016).
Coastal wetlands in the United States are estimated to provide $23.2 billion/year in storm protection services alone (Costanza et al. 2008). Green infra-structure can provide a wealth of valuable coben-efits all of the time. From fishing, tourism, biodiver-sity, and recreation to water quality and storage or storm surge buffers, it presents an array of services relevant for coastal development and planning deci-sions (Sutton-Grier et al. 2015).
2. COASTAL FLOOD MANAGEMENT AND EROSiON CONTROL
OVERVIEW | Coastal Flood Management and Erosion Control

93Integrating Green and Gray
ConsiderationsData continue to emerge that shed light on green infrastructure’s resilience and protective benefits against coastal challenges, and economic valua-tion has contributed to better-informed decision-making about coastal resources and development
(Waite et al. 2015). The effectiveness of different designs in providing particular services must also be better understood to comprehend what level of protection can be expected, in varying contexts and geographies (Sutton-Grier et al. 2015).
Figure A2 | Coastal Mangroves that Help Stabilize Sediment and Attenuate Waves
Source: WRi/Flickr.

WRI.org 94
LOCATION: Province of South HollandA first-of-its-kind mega artificial sand nourishment project has been constructed to pilot whether its innovative sand nourishment design can maintain the coastal equilibrium of the Delfland Coast, building primary defense dunes and requiring fewer regular nourishment operations over a 20-year time horizon.
Background The bedrock of the Dutch coastal foundation is its sand stocks. The sand shoals extend seaward when sediment supply exceeds demand, and the coastline recedes when less sand is available than needed to sustain it. To stay in equilibrium, a baseline volume of sand needs to be maintained in the coastline relative to sea-level rise (Taal et al. 2016). Ensuring there is enough sand in the coastal zone prevents structural erosion of the coastal foundation as the wind, waves, and tide spread sand across the surf, beaches, and sand dunes. The coastal equilibrium is actively managed today by the Rijkswaterstaat (RWS), the Dutch Ministry of Infrastructure and Water Management, to build robust sand dunes for primary sea defense against coastal flooding in the hinterland (Taal et al. 2016). In 2011, the RWS constructed its first-ever “mega” sand nourishment pilot project on the Delfland Coast, called the Sand Motor. The €70 million project was financed by the Province of South Holland (the Province) and RWS through the EU Regional Development Fund “Kansen voor West” Program (Rijkswaterstaat 2013; Bontje and Slinger 2017).
Description of Green infrastructure and interim ResultsEvery year, the RWS conducts artificial sand nourishment operations to maintain the baseline volume of sand required in the coastal foundation across different stretches of the Dutch coastline. This consists of dumping required volumes of sand dredged from offshore deposits precisely when and where they are needed underwater on the foreshore (Taal et al. 2016). From 2005 to 2015, annual nourishment operations for regular coastal main-tenance on the Province coastline resulted in 15.4 million cubic meters (m3) of sand deposited (Bontje and Slinger 2017). Over eight months in 2011, 21.5 million m3 of sand was dredged from 10 kilometers (km) offshore and deposited for the construction of the Sand Motor. It was created to pilot whether dumping an excess volume of sand in a single operation is more effective at enhancing coastal protection—by growing sand dunes and the shore-line—in the long run, while needing fewer regular nourishment operations for the maintenance of the Delfland Coast over a 20-year period (Taal et al. 2016).
CASE STUDY 2APiloting Mega Sand Nourishment for Coastal Flood Management in the Netherlands

95Integrating Green and Gray
After five years in existence, the project monitoring area still contained an extra volume of sand equivalent to 95 percent of the volume deposited at construction, with 80 percent of that sand within the contours of the sand body created in 2011. The shoreline had grown to the north and south, with the Sand Motor narrowed by 260 meters from its original two-kilometer width, but dunes in the project area had grown less quickly than in standard nour-ishment operations. This is thought to be in part because sand was getting captured by the dune’s lake and lagoon. Due to its initial performance, the Sand Motor is expected to “live” even longer than 20 years (Taal et al. 2016).
Long-term Challenges It will be difficult to isolate the effects of the Sand Motor on long-term coastal protection with regard to dune devel-opment. When the Sand Motor was constructed, two regular sand nourishment operations, totaling 2 million m3 of sand deposited were also implemented on either side of the Sand Motor. Additionally, in 2010 the Delfland Coast sand dunes were reinforced and broadened with 17.6 million m3 of sand (Taal et al. 2016). The area was already considered in safe condition when the Sand Motor was constructed, and any protection benefits from the Sand Motor would be additional. But, the effects of these interventions cannot be distinguished from one another and have to be considered in conjunction.
The Sand Motor’s impact on hydrology and freshwater supplies, and associated extra costs to mitigate these risks, are other effects to consider. There was concern prior to construction that the project would negatively impact groundwater flows by shifting the boundary between salt and freshwater, ultimately affecting vegetation, biodi-versity, and drinking water supplies. To prevent this, the Province and local water utility agreed to install water extraction wells and a drainage facility (Taal et al. 2016). The costs of these additional interventions to prevent adverse effects of meganourishment operations the size of the Sand Motor were not accounted for in the €70 mil-lion project price tag (Bontje and Slinger 2017).
insights for AdvancementOver a 20-year period, less sand in total would have been required to maintain the baseline volume of sand needed by the Delfland Coast using regular sand nourishment operations than has been used for the Sand Motor, which is equivalent to what is needed to maintain this stretch of coastline for a period of 50 years (Taal et al. 2016). While fewer regular nourishment operations are expected to be needed during the life span of the Sand Motor, they are still expected to be needed for supplementation to some extent. This presents implications for the cost-effectiveness of meganourishment versus conventional nourishment projects, as well as for the effective use of resources. Further, it calls into question the appropriateness of a meganourishment project design in the developing context, considering countries like the Gambia and Nigeria have struggled to successfully implement regular-sized sand nourishment operations on their coastlines due to issues with cost, design, and maintenance (Niang et al. 2012).
Whether this project design is cost-effective compared to other approaches is unclear, but its transferability requires significant understanding of coastline dynamics and baseline sand volume needs relative to sea-level rise; capacity for comprehensive impact assessments; robust monitoring and evaluation capabilities; and financial resources for either importing or dredging suitable supplies of sand deposits not only for a megasized project, but for supplemental maintenance needs.

WRI.org 96
LOCATION: Selected provinces of Mekong Delta, VietnamAs part of an integrated climate resilience and sustainable livelihoods project, Vietnam (in partnership with the World Bank) is implementing an infrastructure design that utilizes mangroves and sea dikes to protect coastal communities from flooding and erosion.
Background The Mekong Delta (Delta) is densely populated and home to 22 percent of Vietnam’s population, most of whom are near-poor households living in rural coastal areas, highly dependent upon rice or shrimp farming for their livelihoods. In the region, recent urbanization and intensification of agriculture and aquaculture production are among the rapid changes occurring that are increasing economic growth, but simultaneously creating issues of unsustainable land and water resource use. Furthermore, the region is facing increased saline intrusion, erosion, and flooding from land subsidence and sea-level rise in the southern part of the Ca Mau Peninsula that is affecting the livelihoods of Delta communities. The natural sedimentation process that occurs between the Delta and the coastline may also be impeded by upstream hydropower development in the Mekong Basin, reducing sediment load down the Delta.
In 2016, the Mekong Delta Integrated Climate Resilience and Sustainable Livelihoods (MD-ICRSL) Project was developed to strengthen integrated climate-resilient management and development across different sectors and institutional levels in the Mekong Delta. The project consists of a host of measures in different hydroecological sub-regions, and was designed to help operationalize the vision and strategy of the Dutch-financed Mekong Delta Plan that had been articulated for the different subregions. The multisectoral project required a complex arrangement of implementation across ministries, and the engagement of target provinces as well communities, research agencies, and development partners. In the coastal areas, including the estuary and peninsula, the project has prioritized modernization and increased sustainability of aquaculture by adopting polyculture-based systems, and mangrove regeneration along the outer coastline as reinforcement of the coastline and hinterland protection. Nearly $387 million from the International Development Association, the Global Environment Facility Adaptation Fund, and the Vietnam Government is financing the project.
A Green and Gray infrastructure Design for Coastline ProtectionThe traditional approach to protecting the coastline in Vietnam consists of constructing sea dikes, many of them armed with rocks and/or concrete. Furthermore, in the peninsula area, natural mangroves play an important role in ecosystem productivity and in protecting coastal communities from storm surges and coastal erosion. However, the mangroves have rapidly declined over time, primarily due to unplanned shrimp farming and urban develop-ment; a lack of regulations and institutions that permit integrated coastal management helps exacerbate the
CASE STUDY 2BUsing Mangroves and Sea Dikes as First Line of Coastal Defense in Vietnam
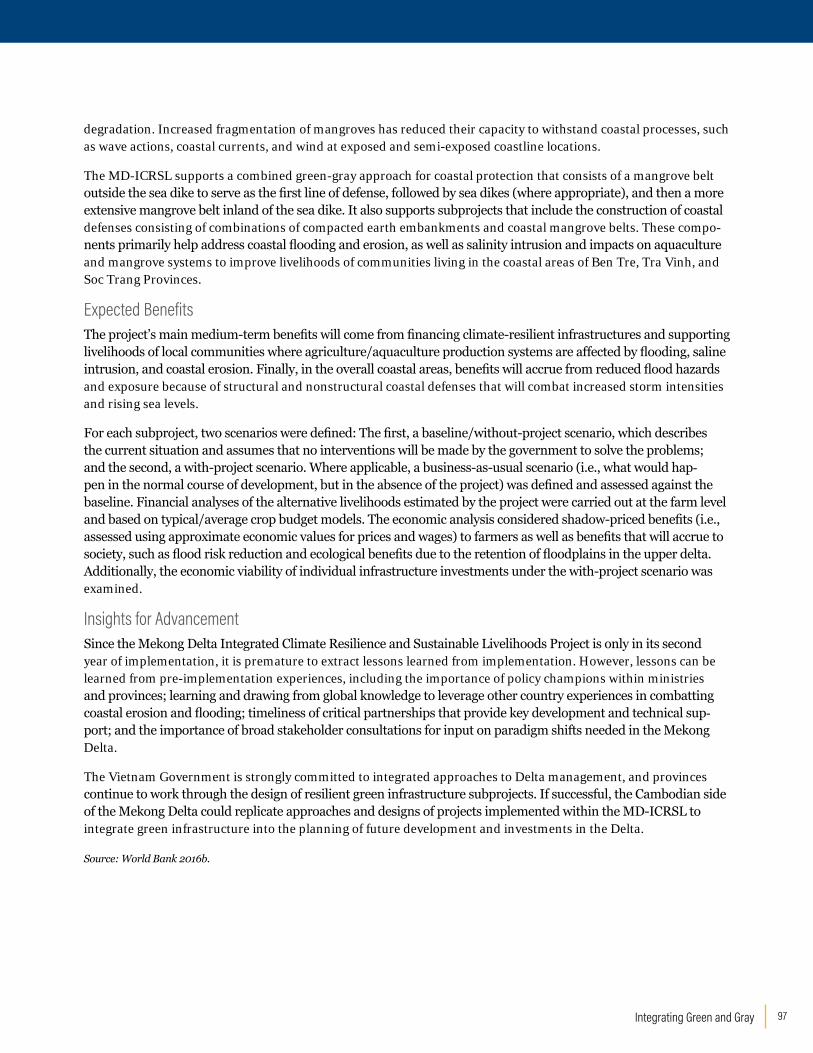
97Integrating Green and Gray
degradation. Increased fragmentation of mangroves has reduced their capacity to withstand coastal processes, such as wave actions, coastal currents, and wind at exposed and semi-exposed coastline locations.
The MD-ICRSL supports a combined green-gray approach for coastal protection that consists of a mangrove belt outside the sea dike to serve as the first line of defense, followed by sea dikes (where appropriate), and then a more extensive mangrove belt inland of the sea dike. It also supports subprojects that include the construction of coastal defenses consisting of combinations of compacted earth embankments and coastal mangrove belts. These compo-nents primarily help address coastal flooding and erosion, as well as salinity intrusion and impacts on aquaculture and mangrove systems to improve livelihoods of communities living in the coastal areas of Ben Tre, Tra Vinh, and Soc Trang Provinces.
Expected BenefitsThe project’s main medium-term benefits will come from financing climate-resilient infrastructures and supporting livelihoods of local communities where agriculture/aquaculture production systems are affected by flooding, saline intrusion, and coastal erosion. Finally, in the overall coastal areas, benefits will accrue from reduced flood hazards and exposure because of structural and nonstructural coastal defenses that will combat increased storm intensities and rising sea levels.
For each subproject, two scenarios were defined: The first, a baseline/without-project scenario, which describes the current situation and assumes that no interventions will be made by the government to solve the problems; and the second, a with-project scenario. Where applicable, a business-as-usual scenario (i.e., what would hap-pen in the normal course of development, but in the absence of the project) was defined and assessed against the baseline. Financial analyses of the alternative livelihoods estimated by the project were carried out at the farm level and based on typical/average crop budget models. The economic analysis considered shadow-priced benefits (i.e., assessed using approximate economic values for prices and wages) to farmers as well as benefits that will accrue to society, such as flood risk reduction and ecological benefits due to the retention of floodplains in the upper delta. Additionally, the economic viability of individual infrastructure investments under the with-project scenario was examined.
insights for AdvancementSince the Mekong Delta Integrated Climate Resilience and Sustainable Livelihoods Project is only in its second year of implementation, it is premature to extract lessons learned from implementation. However, lessons can be learned from pre-implementation experiences, including the importance of policy champions within ministries and provinces; learning and drawing from global knowledge to leverage other country experiences in combatting coastal erosion and flooding; timeliness of critical partnerships that provide key development and technical sup-port; and the importance of broad stakeholder consultations for input on paradigm shifts needed in the Mekong Delta.
The Vietnam Government is strongly committed to integrated approaches to Delta management, and provinces continue to work through the design of resilient green infrastructure subprojects. If successful, the Cambodian side of the Mekong Delta could replicate approaches and designs of projects implemented within the MD-ICRSL to integrate green infrastructure into the planning of future development and investments in the Delta.
Source: World Bank 2016b.

WRI.org 98
The ChallengeRiver flooding is both a natural and necessary phenomenon that is critical for floodplain ecosys-tem health. Flooding helps maintain soil nutrient equilibrium for productive floodplains and replen-ishes underground aquifers. However, flooding also creates immense challenges for human health, safety, and livelihoods, including the following:
▪ Infrastructure and property damage, which can occur when homes and buildings become water-logged and inundated with debris and sediment deposits. Debris can block waterways, and rapidly rising, fast-moving waters can damage built structures like roads and bridges.
▪ Floodplain ecosystem disruption, which can occur when larger and more frequent river flooding displaces aquatic life, impairs water quality, and increases erosion (USEPA 2016). Nutrients, fertilizer, pesticides, debris, and volumes of sediment are transferred both to and from the floodplain, disrupting its balanced fertility.
▪ Water contamination, which can occur when contaminant-prone floodwaters inundate source water supplies and community water treatment systems with pollutants and sedi-ment. Turbidity increases to levels that promote the growth of harmful waterborne diseases and makes it difficult to treat drinking water (USEPA 2016).
River flooding can be a costly disaster. For example, in 2011 Thailand was inundated with above-average monsoon rainfall that caused severe river flooding and estimated losses of $30 billion. Rivers over-flowed their banks, and insufficient dam operation led to the release of even more water, which exacer-bated the flooding (Gale and Saunders 2013). The insured losses from the event ($12 billion) ranked among the highest-ever worldwide from a freshwa-ter flood disaster (Gale and Saunders 2013). World-wide, estimates suggest global GDP exposed to river floods is $96 billion per year (Luo et al. 2015).
What Role Can integrating Green infrastructure Play?Green infrastructure can complement conventional built solutions that are designed to contain or regu-late river flow and water levels, helping to absorb excess water, reduce velocity, and regulate peak flows. Examples include the following:
▪ Floodplains and bypasses. Reconnect-ing rivers to floodplains or undeveloped areas where they have been disconnected by gray infrastructure can help restore natural flood mitigation properties, like water storage, and convey water during flood events. Bypasses comprise built diversions, such as weirs, to help control water volumes, while floodplains natu-rally absorb water (EEA 2017).
▪ Inland wetlands. Vegetated wetlands are sponge-like ecosystems that can help absorb the influx of floodwaters during wet periods, and release water during dry periods (Strassburg and Latawiec 2014). Storage capacity of a particular wetland depends on the type of wetland and its location.
▪ Riverbeds and banks. Allowing rivers to fol-low their natural meandering course can help reduce floodwater velocity. This can sometimes require removing built reinforcements or revegetating riverbanks or riparian areas (Bair 2000).
▪ Upland forests. Upstream areas with deep soils can help slow and retain runoff, result-ing in lower flood peaks and a longer lag time for excess water to reach downstream areas. Upland forest management is most effective at slowing and retaining moderate floods before soil saturation (Bathurst et al. 2011).
Natural flood mitigation properties can present cobenefits aside from flood protection. For exam-ple, in China, opening sluice gates in the Yangtze River Basin to allow water to flow into previously disconnected lakes rehabilitated the natural func-tions of the wetland system and improved wild fisheries’ species diversity and populations. Catches increased by 15 percent, and certified eco-fish farm-
3. RiVER FLOOD MANAGEMENT
OVERVIEW | River Flood Management

99Integrating Green and Gray
ing increased income of fishers by 20 to 30 percent on average (UNEP et al. 2014). Also 448 km2 of wetlands were restored, providing an estimated 285 million m3 of floodwater storage capacity in Yubei Province (Pittock and Xu 2010).
ConsiderationsThe implementation of river flood prevention measures are rarely done in isolation, making it difficult to assess the individual benefits of a
particular green component. Detailed and compa-rable cost-effective data are scarce, and cost-benefit information is highly dependent on the geographi-cal location of the measure implemented, requiring site-specific analyses for accurate assessments (EEA 2017). Better tools, data collection, and analytical frameworks for comparing a spectrum of inter-ventions are needed to inform decision processes around river flood management strategies.
Figure A3 | Flooded Yolo Bypass, Diverting Waters from inundating Low-lying Developed Areas and Relieving Pressure on Built Floodwater Management infrastructure
Source: Steve Martaranoo/Flickr

WRI.org 100
LOCATION: Sacramento Valley, CaliforniaYolo Bypass, the largest contiguous California floodplain, plays a vital role in the Sacramento River flood control infrastructure system alongside a network of built overflow weirs and relief structures that divert floodwaters into adjacent basins or natural bypasses and channel them downstream, protecting communities from inundation.
BackgroundFollowing devastating floods in the early 1900s, a “levees only” approach to managing colossal floodwaters of the Sacramento River was deemed insufficient, and efforts to establish a comprehensive, multichannel flood-control system in the Sacramento Valley materialized (Opperman et al. 2009). The Jackson Plan, which proposed creat-ing a system of levees, weirs, and bypasses—including the Yolo Bypass—to route and control floodwaters out of the main river channel, was adopted by the California legislature in 1911 and the U.S. Congress in 1917 through the Flood Control Act (James and Singer 2008). From then, construction began on the Sacramento River Flood Con-trol Project (SRFCP), and the Yolo Bypass was finalized in 1924 (Smalling et al. 2007). The infrastructure system of the SRFCP is part of a larger integrated river basin system for water resources management in California that is responsible not only for flood control, but also for the provision of water to Southern California and throughout the Sacramento-San Joaquin Delta, and is jointly managed and financed by federal, state, and local authorities (James and Singer 2008).
integrating Green and Gray infrastructure in the Jackson PlanThe Yolo Bypass is a 240-square-kilometer (km2) wetland area (65 kilometers long) of the Yolo Basin floodplain, a natural depression along the west side of the Sacramento River. The bypass receives water from five source water-sheds with seasonally varying hydrology; its dominant land uses are agricultural fields and waterfowl management. Two-thirds of the bypass is privately owned and used for agriculture; it also encompasses the 64 km2 Yolo Bypass Wildlife Area managed by the state’s Department of Fish and Wildlife (Smalling et al. 2007; Opperman et al. 2009).
CASE STUDY 3AIntegrating Green and Gray Infrastructure for River Flood Management in the United States

101Integrating Green and Gray
The bypass floods as early as October and as late as June each year, and can hold more than 4.5 times as much water as the Sacramento River (Smalling et al. 2007), conveying 80 percent of its floodwaters during large events (Opperman et al. 2009). Although flood control is the bypass’s main purpose, it is a flourishing network of mosaic wetlands with marshes, ponds, and riparian areas that provides valuable groundwater recharge to a drought-stricken state and fosters abundant wildlife habitat, recreation, and productive agricultural lands when it is not flooded. The bypass is home to nearly 200 species of birds and sustains the highest salmon population in California (Sommer et al. 2001).
The SRFCP includes approximately 1,760 kilometers of 10 overflow structures—six overflow weirs, three upstream relief structures, and one emergency overflow roadway—and bypass channels to convey floodwater downstream (Russo 2008; James and Singer 2008). The Fremont and Sacramento Weirs within this system divert floodwaters from the Sacramento River/Sutter Bypass watershed away from Sacramento and other low-lying communities into the Yolo Bypass. The Fremont Weir passes floodwater through gravity once it reaches a certain elevation, while the Sacramento Weir uses floodgates managed by the state’s Department of Water Resources, according to regulations established by the U.S. Army Corps of Engineers (Russo 2008). The bypass also receives water from four other source watersheds, which during the dry season constitute most of the water flowing into the bypass. All water drains southeast across the bypass toward its “Toe Drain,” a low-flow riparian channel, into the Sacramento-San Joaquin Delta (Smalling et al. 2007).
The Yolo Bypass’s natural flood control management capacity relieves significant pressure on the gray infrastruc-ture system during overflow events. Together, the natural and built system connect the river to the floodplain and help to protect surrounding communities by reducing the extent of frequent inundations of broad lowland areas of the valley in one of the most flood-prone regions of the United States (James and Singer 2008). However, the system—in need of regular maintenance and improvement—cannot eliminate future flooding risks.
insights for AdvancementPreserving the natural floodplain abilities of the Yolo Bypass wetland system and protecting it from development is indeed a successful green infrastructure story in California’s flood and water management history. These solu-tions present a wealth of cobenefits beyond flood control and add resilience to the conventional gray infrastructure system. However, such a solution is also subject to structural deficiencies that could bring costly consequences and high risk to flood management in the event the levee system fails. Furthermore, this system is a very expensive, multibillion-dollar investment in water and flood management over the lifetime of the infrastructure system, with recurring costs to ensure its stability. Approaches to reconnecting floodplains to rivers could present difficult trade-offs between flood management and existing livelihoods, such as relocation and reconstruction of communities, or in rural economies that national development depends upon, making the approach economically and politically infeasible in other contexts.

WRI.org 102
LOCATION: Odra and Vistula BasinsFlooding of Poland’s Odra and Vistula River Basins devastated communities in 1997, 2006, and 2010. Three consecutive projects were created to mitigate the impacts of frequent flooding and to enhance flood preparedness across the country. While the first project was an emergency recovery project, the following two projects, still under implementation today, use a mix of green and gray infrastructure to reduce peak flows and enhance flood forecast-ing during flash floods.
BackgroundThe catchment areas of the Odra and the Upper Vistula Rivers cover 54 percent of Polish territory cumulatively, leaving much of the country vulnerable to frequent and large floods experienced in these river basins. In 1997, rainfall four times the long-term average caused a massive floodwater inundation, resulting in the loss of 54 lives and estimated damages of ZI8.5 billion ($2.3 billion). This disastrous flooding catalyzed reconstruction and flood protection efforts supported by the Emergency Flood Recovery Project, financed by the World Bank and European Investment Bank.
In addition to reconstruction of infrastructure, additional flood protection was needed. This became clear after flooding events in 2006 and 2010 in the Upper Vistula, the Lower Odra Basin, and the Nysa Klodzka Valley. The Odra River Flood Protection Project (ORFPP) and subsequently, the Odra-Vistula Flood Management Project (OVFMP) expand upon previous efforts by enhancing flood preparedness in the Odra and Vistula River Basins.
These two projects, currently under implementation, are financed by the World Bank, Council of Europe Devel-opment Bank (CEB), European Union/European Commission, and the Government of Poland for a total of $1.8 billion. The ORFPP focuses on southeastern Poland (Lower and Upper Silesia) and the economically crucial city of Wroclaw; the OVFMP focuses on the Middle and Lower Odra, and the Upper Vistula Basin, enhancing flood protection in Krakow, Warsaw, and Sandomierz-Tarnobrzeg industrial centers.
integrating Green and Gray infrastructureBoth projects emphasize a systems approach to deliver flood protection services to Polish populations using green and gray infrastructure, and were inspired by the Dutch Room for the River Program. For example, by combining the construction of a dry polder (Raciborz) to enhance upstream retention capacity in the Upper Odra and mod-ernizing the Wroclaw Floodway System, the ORFPP will safely pass a flow of 3,100 cubic meters/second (m3/s) through and around Wrocław downstream. With the combination of both the dry polder and floodway system, the city will be protected against the recurrence of a very intense flood (a 1,000-year flood), as occurred in 1997. Green infrastructure measures financed under the ORFPP and OVFMP projects include the following:
CASE STUDY 3BCombining Green and Gray Infrastructure for Flood Risk Management at the River Basin Scale in Poland
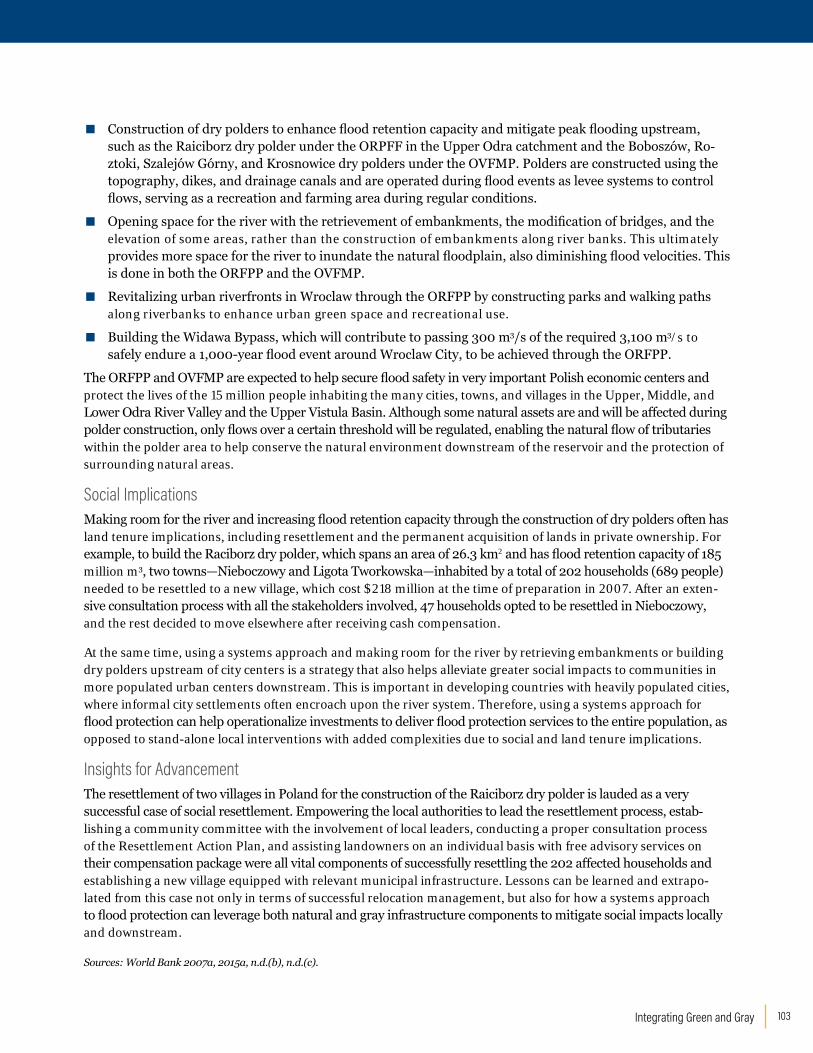
103Integrating Green and Gray
▪ Construction of dry polders to enhance flood retention capacity and mitigate peak flooding upstream, such as the Raiciborz dry polder under the ORPFF in the Upper Odra catchment and the Boboszów, Ro-ztoki, Szalejów Górny, and Krosnowice dry polders under the OVFMP. Polders are constructed using the topography, dikes, and drainage canals and are operated during flood events as levee systems to control flows, serving as a recreation and farming area during regular conditions.
▪ Opening space for the river with the retrievement of embankments, the modification of bridges, and the elevation of some areas, rather than the construction of embankments along river banks. This ultimately provides more space for the river to inundate the natural floodplain, also diminishing flood velocities. This is done in both the ORFPP and the OVFMP.
▪ Revitalizing urban riverfronts in Wroclaw through the ORFPP by constructing parks and walking paths along riverbanks to enhance urban green space and recreational use.
▪ Building the Widawa Bypass, which will contribute to passing 300 m3/s of the required 3,100 m3/s to safely endure a 1,000-year flood event around Wroclaw City, to be achieved through the ORFPP.
The ORFPP and OVFMP are expected to help secure flood safety in very important Polish economic centers and protect the lives of the 15 million people inhabiting the many cities, towns, and villages in the Upper, Middle, and Lower Odra River Valley and the Upper Vistula Basin. Although some natural assets are and will be affected during polder construction, only flows over a certain threshold will be regulated, enabling the natural flow of tributaries within the polder area to help conserve the natural environment downstream of the reservoir and the protection of surrounding natural areas.
Social implicationsMaking room for the river and increasing flood retention capacity through the construction of dry polders often has land tenure implications, including resettlement and the permanent acquisition of lands in private ownership. For example, to build the Raciborz dry polder, which spans an area of 26.3 km2 and has flood retention capacity of 185 million m3, two towns—Nieboczowy and Ligota Tworkowska—inhabited by a total of 202 households (689 people) needed to be resettled to a new village, which cost $218 million at the time of preparation in 2007. After an exten-sive consultation process with all the stakeholders involved, 47 households opted to be resettled in Nieboczowy, and the rest decided to move elsewhere after receiving cash compensation.
At the same time, using a systems approach and making room for the river by retrieving embankments or building dry polders upstream of city centers is a strategy that also helps alleviate greater social impacts to communities in more populated urban centers downstream. This is important in developing countries with heavily populated cities, where informal city settlements often encroach upon the river system. Therefore, using a systems approach for flood protection can help operationalize investments to deliver flood protection services to the entire population, as opposed to stand-alone local interventions with added complexities due to social and land tenure implications.
insights for AdvancementThe resettlement of two villages in Poland for the construction of the Raiciborz dry polder is lauded as a very successful case of social resettlement. Empowering the local authorities to lead the resettlement process, estab-lishing a community committee with the involvement of local leaders, conducting a proper consultation process of the Resettlement Action Plan, and assisting landowners on an individual basis with free advisory services on their compensation package were all vital components of successfully resettling the 202 affected households and establishing a new village equipped with relevant municipal infrastructure. Lessons can be learned and extrapo-lated from this case not only in terms of successful relocation management, but also for how a systems approach to flood protection can leverage both natural and gray infrastructure components to mitigate social impacts locally and downstream.
Sources: World Bank 2007a, 2015a, n.d.(b), n.d.(c).

WRI.org 104
The ChallengeUrban stormwater runoff poses challenges for cities that can threaten the livelihoods, health, and safety of communities, including the following (UNEP et al. 2014):
▪ Flooding, which can occur when volumes of rainfall exceed a city’s capacity for captur-ing and transporting stormwater to storage or appropriate treatment for reuse or disposal. Densely built environments lack permeable surfaces and open space for water infiltration and absorption. Urban design and sprawling development patterns contribute to enhanced flooding risks when cities expand into flood-prone areas such as floodplains or wetlands.
▪ Pollution of communities and water resources, which can occur when stormwater, sewage, and industrial wastewater overwhelm drainage systems with large volumes of water and sewage. System overflow or sewer backup can release untreated stormwater, wastewater, and raw sewage into homes, communities, and surrounding water bodies. Inadequate treat-ment and sanitation systems can also result in improper discharge of wastewater, polluting urban environments.
Globally, $120 billion per year is lost through flood damages to urban property (PBL et al. 2014). In 2005, major flooding in Mumbai resulted in $1.7 billion in damages and 500 mortalities. A combination of inten-sifying and changing weather patterns, disruption of natural drainage pathways, aging and polluted built drainage systems, unrestricted building in low-lying areas, and loss and degradation of mangrove forests that once helped absorb rainfall have contributed to annual urban flooding events in the city. Urbaniza-tion by itself has increased stormwater runoff two- to three-fold (Ranger et al. 2011).
What Role Can integrating Green infrastructure Play?Green infrastructure can aid in absorbing, filtering, and slowing stormwater runoff, which helps mitigate urban flooding and improve water quality. It typically entails lower-cost interventions that help complement the functions of gray infrastructure strategies, such as water treatment facilities, storage tunnels, sewers, retention or detention ponds, and stormwater convey-ance systems. Examples include the following:
▪ Green roofs. Rooftop vegetation enables rain-fall infiltration and evapotranspiration of stored water, which helps slow stormwater runoff by reducing the rate at which water reaches the drainage system. Green roofs can retain on av-erage 75 percent of the stormwater they receive (Scholz-Barth 2001).
▪ Permeable pavements. Porous concrete, asphalt, or interlocking pavers allow water to percolate through their surfaces to be treated and stored in soils and rock beds below. Some applications have demonstrated a 90 percent reduction in runoff volumes (LIDC 2007).
▪ Bioretention areas. Rain gardens or bioswales (i.e., vegetated trenches that receive rainwater runoff) collect, absorb, filter, and store water. These improvements can help maintain predevelopment timing of stormwater runoff and control peak discharge rates (USEPA 2017a).
▪ Open spaces. Natural areas like parks and hillsides in urban settings help with water absorption and mitigate the risk of landslides on steep slopes. Open spaces also include con-structed parks and greenways.
▪ Constructed wetlands. Creating natural areas with sponge qualities helps capture and retain stormwater, allowing for greater water infiltration. An acre of wetland can store 3.8 to 5.7 million liters of floodwater, reducing the peak load on stormwater and wastewater sys-tems (PDEP 2006).
4. URBAN STORMWATER MANAGEMENT
OVERVIEW | Urban Stormwater Management

105Integrating Green and Gray
Green infrastructure that is used to address urban stormwater challenges is most effective when appro-priately sited and designed (UNEP et al. 2014), and is generally a component of a city’s larger stormwater management program that may include a mix of built and natural components. Portland, Oregon, is one example. For decades the city has embraced manage-ment design that incorporates green roofs and streets, vegetated basins, and urban forests and wetlands, in addition to expanding the drainage capacity of its built system to better manage its stormwater.
ConsiderationsGreen infrastructure can aid in reducing the urban heat island effect, boosting property values, creating recreational opportunities, enhancing biodiversity, improving air quality, among other benefits (UNEP et al. 2014). Its economic values, and what makes it profitable and successful or unsuccessful solutions for stormwater management in urban settings, needs to be better studied and understood. New project designs and concepts may otherwise fail to appeal to cities that depend on proven gray infrastructure meth-ods and/or lack the knowledge, skills, and capabilities to undertake alternative solutions.
Figure A4 | Green Roof Atop a Parking Garage and Rail Yard in illinois That Helps Slow Stormwater Runoff
Source: Center for Neighborhood Technology/Flickr.

WRI.org 106
LOCATION: Washington, DCA municipal Environmental Impact Bond has been structured to share performance risks associated with green infrastructure investments, rewarding investors if green infrastructure performance exceeds expectations and limiting financial risk to the local water authority if the project underperforms.
Background DC Water, the District of Columbia (DC) Water and Sewer Authority, operates the city’s wastewater collection system. One-third of Washington, DC, is served by a single-piping combined sewer system that was built over 100 years ago (DC Water 2017a). When it rains, if the capacity of the combined sewer is exceeded, excess flow (i.e., untreated sewage, industrial waste, and stormwater) gets discharged directly into DC’s waterways to prevent flood-ing in homes and streets. Approximately two billion gallons of combined sewer overflow (CSO) is discharged into local streams and rivers on an annual basis today (DC Water 2015). As the area has urbanized and the population has grown, these CSO events have become more frequent and intense, causing harm to nearby aquatic environ-ments and communities.
In the early 2000s, DC Water’s CSOs grew to such a high frequency and volume that they violated the United States Clean Water Act and the terms and conditions of its National Pollutant Discharge Elimination System permit (USEPA 2015a). In agreement with the U.S. Environmental Protection Agency (EPA), a 20-year Long-Term Con-trol Plan was created in 2005 to reduce CSOs by investing in sewer and wastewater infrastructure projects, includ-ing three deep stormwater runoff tunnels under the city in the Anacostia, Potomac, and Rock Creek watersheds (USEPA 2015a).
In 2015, the $2.6 billion plan was modified to allow the incorporation of green infrastructure, a roughly $100 million total investment, to handle runoff volumes produced by rainfall on roughly 200 impervious hectares to potentially reduce or eliminate the need for a storage tunnel in the Rock Creek watershed and reduce the length of the tunnel needed in the Potomac River watershed (DC Water 2015). However, using green roofs, bioswales, and green space to control stormwater runoff is still considered unproven and a risky investment compared to gray infrastructure. To show that green infrastructure can meet EPA performance standards and build investor confi-dence, the first pilot project is being implemented and financed by a novel scheme called the Environment Impact Bond, which rewards investors if performance exceeds expectations and limits financial risk to DC Water if perfor-mance is less than expected.
CASE STUDY 4AInnovative Financing for Urban Green Infrastructure in the United States

107Integrating Green and Gray
integrating Green and Gray infrastructure: Description of the Component Rock Creek Project A (RC-A) will span eight hectares and employ a combination of three green infrastructure installations (DC Water 2017b; USEPA 2015a):
▪ Bioretention or rain gardens, which are vegetated on-the-ground basins or planter boxes that collect and absorb runoff from parking lots, sidewalks, and streets, and slowly drain excess water.
▪ Permeable pavements, which are pervious concrete, porous asphalt, or permeable interlocking pavers that allow stormwater to percolate and infiltrate to the soil below.
▪ Downspout disconnection, which reroutes rooftop drainage pipes from draining into storm sewers to drain instead into rain barrels or pervious surfaces, such as a lawn or vegetated basin.
Construction began in the summer of 2017 and is expected to finish in early 2019. Partners conducted 12 months of preconstruction site monitoring to measure baseline levels of stormwater runoff without green infrastructure in place, and created performance outcome ranges for expected runoff reduction (see Table A2). From 2019 to 2020, 12 months of postconstruction sewer flow monitoring and assessment will take place to calculate the effectiveness of RC-A, measured by the percentage reduction in stormwater runoff (Goldman Sachs et al. n.d.).
Financing Urban Green infrastructureIn September 2016, DC Water issued an innovative adaptation of a Pay-for-Success financing model that shares performance risk between DC Water and investors to finance green infrastructure that reduces the incidence and volume of CSOs. The environmental impact bond is a 30-year, $25 million tax-exempt municipal bond, with an initial 3.43 percent interest coupon payable semi-annually for the first five years. It was placed with two institu-tional investors, Goldman Sachs and Calvert Impact Capital, and its proceeds are providing the up-front capital to construct RC-A (USEPA 2017b). At the five-year mandatory tender, a $3.3 million risk share or outcome payment could be required—either to investors by DC Water or to DC Water by investors—based on the proven success of the project following performance evaluation (see Table A2).
PERFORMANCE TIER
OUTCOME RANGES FOR RUNOFF REDUCTION
ONE-TIME CONTINGENT OUTCOME/RISK-SHARE PAYMENT
EXPECTED LIKELIHOOD (%)
1 Stormwater runoff reductions greater than 41.3% of measured baseline
DC Water makes outcome Payment to investors of $3.3 million
2.5
2 Stormwater runoff reductions between 18.6% and 41.3% of measured baseline
No additional payment other than basic principal and interest (3.43%) payable
95.0
3 Stormwater runoff reductions less than 18.6% of measured baseline
investors make risk share payment to DC Water of $3.3 million
2.5
Sources: Goldman Sachs et al. n.d.; USEPA 2017b
insights for AdvancementDC Water’s environmental impact bond structure is the first of its kind and encourages investors to seek out strong projects, while encouraging water authorities and other implementing agencies to pursue innovative methods that boast broader social or environmental impacts than the status quo approaches. It is too early to tell whether its structure is successful and transferrable to other urban settings, or whether its benefits outweigh those from other funding approaches. However, there are approximately 860 cities in the United States alone with combined sewer systems that could stand to benefit from the lessons derived from Washington, DC (USEPA 2015b). If successful, it would link financial payouts with environmental performance and could encourage other municipalities and sewer/water entities to consider adopting green infrastructure as part of their urban water management strategy, using this financing mechanism to cover the associated downside risks.
Table A2 | Contingent Payment at Mandatory Tender Date (April 1, 2021)

WRI.org 108
LOCATION: ColomboThe Metro Colombo Urban Development Project uses a mixture of green and gray infrastructure to reduce flood risks, improve drainage, and create recreation opportunities in the Colombo Metropolitan Region. The economic desirability of urban wetlands has been evaluated using a cutting-edge approach.
Background Colombo is Sri Lanka’s commercial and financial hub. The surrounding Colombo Metropolitan Region (CMR)–the urban belt that encircles Colombo–is rapidly growing and accounts for almost half of the national GDP. Yet several obstacles are preventing the CMR from realizing its full economic potential: infrastructure and services are inad-equate and lack capacity, especially regarding drainage, sewerage, solid waste, and urban transport infrastructure.
In recent decades, rapid urbanization in the CMR has caused steady degradation and conversion of the region’s wetlands, which are essential for storing water during heavy rains. As a result, the water-holding capacity of the wetlands in the area has decreased by about 40 percent over the last 10 years, directly increasing flood risks. At the same time, climate change and sea-level rise are exacerbating the impacts of the region’s vulnerability to flood-ing. Stormwater management strategies in the city have conventionally been engineering-based, disregarding the important flood-mitigation benefits offered by wetlands.
In 2012, the Metro Colombo Urban Development Project was approved by the World Bank and included delivering support to strengthen urban wetland management and strategic planning for urban resilience through a state-of-the-art Decision-Making under Uncertainty (DMU) approach. The project is set to close in 2020.
integrating Green and Gray infrastructure The Metro Colombo Urban Development Project uses wetlands as green infrastructure to complement a gray infrastructure investment package. The project utilizes flood and drainage management and infrastructure reha-bilitation by providing implementation support to achieve desired outcomes. Gray infrastructure measures target the drainage capacity of canals and lakes and a number of microdrainage interventions in the Colombo Municipal Council. These components aim to enhance the outflow capacity of the systems, whose limited capacity has been constrained further by solid waste, floating debris, and a lack of regular maintenance. The flood control and drain-age management program, including the green infrastructure components in the project, is estimated to benefit, directly or indirectly, about 2.5 million people.
CASE STUDY 4BConserving Wetlands to Enhance Urban Flood Control Systems in Sri Lanka

109Integrating Green and Gray
The project’s green infrastructure strategy includes creating a paradigm shift in which urban wetlands have been perceived and incorporated into city development plans, supported by high-level policy discussions and demon-stration projects of wise use of wetlands. About 2,000 hectares of wetlands were identified as an important water storage–capacity area for Colombo, which helps buffer against the impact of floods. Besides water storage, wet-lands provide cobenefits such as carbon sequestration, climate regulation through reduced use of air conditioning near wetland areas, wastewater treatment, and recreation opportunities.
To design the project’s interventions, all subcomponents of the project were assessed and prioritized, based on cri-teria specific to project development objectives and technical readiness. The green and gray components for flood and drainage management were selected on technical grounds for their short- and long-term flood-risk mitigation abilities, including diverting water in the upper catchment area, limiting inflow down the basin; creating additional retention reservoirs in the project area; removing bottlenecks to maximize conveyance capacity; improving capacity of system outflows; improving overall water quality to reduce health hazards; and improving canal bank protection.
Evaluating Economic DesirabilityTo preserve water storage capacity in the CMR, it is common practice that the local flood management and land reclamation agency convert wetlands into lakes. In most cases, the lakes deliver the same flood protection as the former wetland area, but most cobenefits delivered by wetlands—biodiversity, wastewater treatment, and carbon sequestration, for instance—are lost. Although these cobenefits clearly have an economic value, uncertainties regarding climate change factors, the current-day value of cobenefits, and development patterns can inhibit quan-tification. To assess the economic desirability of wetland conservation despite these uncertainties, a World Bank study applied the cutting-edge DMU approach using participatory and quantitative methods. It found that wetland conservation is the most desirable option from a welfare economic perspective, considering trade-offs between urban development and wetland protection scenarios.
insights for Advancement The project has established Colombo’s first urban wetland park in Beddegana, while a second park in that same area is under design. Together, both parks will work to protect the historic ramparts of the ancient kingdom of Kotte in close proximity to the wetland area, while providing passive recreational space and education and ecotour-ism opportunities. At another wetland site, Beira Lake, bank protection walls have been erected, and a pedestrian promenade added on top of the protection walls, making the space accessible to and usable by the public. A third wetland site, Viharamahadevi Park, was redesigned to enhance water storage capacity.
The successes or challenges of this project cannot be assessed at this stage, as the project is still ongoing. So far, implementation has shown that identification and incorporation of the cobenefits in addition to risk reduction benefits are essential to making an economic case for wetland conservation. The cutting-edge methodology applied was able to assess the economic value of wetlands in a context of deep uncertainties about future urban develop-ment and climate change. DMU methodology could also be applied to navigate uncertainties and provide decision-relevant support in similar projects.

WRI.org 110
The ChallengeLand and water management practices, growing water consumption patterns, and climate-related changes create challenges related to the availability of water throughout the year, especially during dry seasons and extreme drought conditions, including the following:
▪ Land and watershed degradation, which can occur from unsustainable agricultural prac-tices, such as overgrazing or deforestation, can lead to desertification in drought-prone areas. Deteriorated vegetative cover increases soil ero-sion and hinders the health and fertility of soil and its natural water retention capacity.
▪ Increased hunger and food insecurity, which can occur when there are insufficient quantities of reliable, affordable, and nutritious foods available to support healthy lives, due in part to a lack of water available to yield suffi-cient crops and livestock.
▪ Power sector outages, which can occur when economies are highly reliant on electricity generation from hydropower or thermoelectric power plants, and insufficient volumes of water are available.
▪ Reliance on supplemental water sup-plies, which can occur when inadequate amounts of fresh water are available during dry seasons or persistent drought to sustain a com-munity. National governments, for example, provide assistance by trucking or piping water from another location.
These challenges are costly to human lives and economies and stress the urgency of finding solu-tions amid a context of growing competition for water resources and a changing climate. From 1980 to 2010, temperature extremes and droughts caused global economic losses of nearly $250 billion, affect-ing an average 35 million people annually (PBL et al. 2014). In India, water supplies are predicted to fall 50 percent below demand by 2030 (WRG 2009). More
than half the country’s groundwater wells are expe-riencing groundwater decline, and more than half its surface area faces extremely high water stress—using more than 40 percent of its annually available surface water each year (IWT 2015). In 2016, more than 330 million people were struck by severe drought with $100 billion in economic losses, including from crop and livestock loss and power outages or shutdowns (Kala 2017).
What Role Can integrating Green infrastructure Play?Artificial aquifer recharge, dams, and other technical solutions like stone barriers or embankment struc-tures are among the built solutions that can be relied upon to help an area capture, direct, and store water in soil, aquifers, or reservoirs. Green infrastructure can also be leveraged to help maintain or enhance the water retention capacity of soils, playing a posi-tive role for water supply in dry seasons and drought conditions. Examples include the following:
▪ Rainwater harvesting. Directly capturing rainfall using tillage or pitting practices can help store it in the soil to ensure water for crops or other vegetation (UNEP et al. 2014). Con-tour trenching, for example, captures rainfall in small trenches on croplands, infiltrating and storing the water in the soil to nourish crops over a longer period of time.
▪ Cloud or humid forests and wetlands. These ecosystems have soil protection, water infiltration, and natural storage capabilities that help in the seasonal provision of water and water flow regulation. Cloud forests can capture fog and retain moisture in vegetation, slowly re-leasing it over time into the soil to help ensure long-term water retention and supply during dry periods (Eller et al. 2013).
▪ Aquifer storage and recharge. Maintaining the catchment areas of watersheds and aquifers can help enhance water infiltration and storage capacity of soils and geologies that recharge groundwater and aquifers below.
5. DROUGHT MANAGEMENT
OVERVIEW | Drought Management

111Integrating Green and Gray
Combining green infrastructure with technical solu-tions can further increase an area’s ability to infiltrate and store water in soil, aquifers, or reservoirs. In Yatenga Province of Burkina Faso—one of the poorest regions in the world and long-plagued by drought—farmers used agroforestry and planting pits alongside technical measures such as stone bunds to restore degraded landscapes, control surface water runoff, and enhance water infiltration. Before implementa-tion, all wells fell dry by the end of the rainy season (Kaboré and Reij 2004). Following implementation, groundwater recharge levels significantly improved and all wells held water throughout the dry season.
ConsiderationsIn some cases, implementing a single technique or measure for drought resilience or water availability may not be enough to achieve meaningful impact. Adopting a menu of solutions can help environmental improvements because soil, water, and vegetation regeneration are mutually reinforcing. Technical solutions can help increase impacts but may require intense labor and prove to be costlier because of the need to purchase and transport materials. Ultimately, lessons for transferability can be drawn from regions that have implemented such solutions alone or in tan-dem about the longevity of their benefits and social/political sustainability for ensuring water availability in times of increasing competition for dwindling supplies.
Figure A5 | Sand Dam in Somalia Used as Green infrastructure for Aquifer Recharge
Source: World Bank.

WRI.org 112
LOCATION: Quito, EcuadorThe Quito Water Fund (Fondo para la Protección del Agua, FONAG)—one of the first water funds in Latin Amer-ica—is a financial tool that leverages water user payments for conservation efforts to ensure sustainable watershed management and quality water supply throughout the year.
Background Quito’s more than 2.3 million residents depend on protected high-altitude reserves in the Andean páramos to provide their drinking water. In the late 1990s, Quito faced increasing pressure on its water resources from growing consumption and competition for available supplies, and scarce financial resources to put toward efforts to increase them. Existing water fees were failing to cover even the costs of maintaining water distribution, and at least 30 percent of water consumed at the time was not being charged for at all (Echavarria 2002). Although formally pro-tected, the Reserves were also increasingly threatened by city expansion, deforestation, and landscape degradation resulting from unsustainable agricultural and grazing practices and a network of developing roadways.
The degradation was expected to damage critical functions of the watershed and its long-term capacity to provide secure water for Quito, including the timing and maintenance of water flow and quality through reduced water retention, soil moisture and groundwater replenishment, and increased erosion (Echavarria 2002). The need for secure, long-term financing for conservation and restoration of these critical ecosystems was recognized as a chal-lenge and an opportunity. As a result, Quito’s public water utility (Empresa Pública Metropolitana de Agua Potable y Saneamiento, EPMAPS) founded the Quito Water Fund as a trust fund in 2000 in partnership with The Nature Conservancy (TNC) to finance efforts to maintain provision of quality water supply, especially throughout the dry season (Encalada et al. 2015). The fund has since been joined by other user constituents and has received signifi-cant funding from other international donors and partners.
integrating Green infrastructure into the Water Supply System Quito’s source Reserves cover over 520,000 hectares and are part of the natural páramos ecosystem in the Andes Mountains surrounding the city, characterized by sponge-like grasslands and cloud forests known for their capacity to retain humidity and regulate water flows (Echavarria 2002). When snow from local glaciers melts or low-level clouds and fog hover among the forest canopy, the precipitation is captured by the vegetation and soils of the páramos system, ensuring long-term water retention and slow release into various water bodies and wetlands. The Reserves are also part of the country’s national park system, managed by Ecuador’s Ministry of the Environment (Echavarria 2002).
CASE STUDY 5AUser-financed Ecosystem Conservation for Water Security in Ecuador

113Integrating Green and Gray
FONAG implements a variety of interventions aimed at maintaining and improving the function of the Reserve watersheds, including on-the-ground restoration and conservation activities, an environmental education program, and a hydrologic data management program for monitoring and evaluation (Encalada et al. 2015). Since 2005, FONAG has protected 33,000 hectares of key páramo areas from grazing and burning through park guard surveil-lance; and restored 2,500 hectares of degraded areas through riparian fencing, cattle, and fire exclusion, and the replanting of native vegetative species (Encalada et al. 2015; TNC 2018).
At its present phase of consolidation, FONAG is investing heavily in generating information on the hydrological benefits of its interventions through a mixed monitoring and modeling strategy. By improving the quantification of benefits, the fund and partners can reveal how on-the-ground activities impact ecosystem integrity and water flow and quality; and evaluate return on investments (ROI) based on the hydrological benefits FONAG investments achieve—such as what was done in partnership with TNC in a recent ROI pilot project. To this end, FONAG is evolving from a general ecosystem services conservation and restoration approach toward a model that evaluates the delivery of concrete benefits in terms of water quantity and quality for specific users.
User-financed Water AvailabilityFONAG was created to serve as a long-term financing mechanism for watershed protection. It is a nondeclining, 80-year delimited trust fund that receives financial contributions from its constituents—mainly public utilities—but also private companies and NGOs. The main contribution mechanism to its capital is through the utility EPMAPS, which adds a 2 percent surcharge to monthly water bills of users in Quito’s municipal service area, under authority of a 2007 city ordinance (Arias et al. 2010; Coronel and Zavala 2014). Furthermore, the fund has leveraged gener-ous contributions from donors and partners like the World Bank, Inter-American Development Bank, USAID, German development agency GIZ, the Municipality of the Metropolitan District of Quito, and the French Institute for Research and Development (Coronel and Zavala 2014).
FONAG’s terms and conditions and institutional structure are set by its enabling contract. The fund is managed by a board of directors, which consists of constituents that have contributed to FONAG, and is supervised by a techni-cal secretariat of 50 staff members—including park rangers, and technical and administrative staff—that acts as its executive director (Arias et al. 2010). The money is invested by an independent financial manager, Enlace Fondos, and the revenues generated are used to fund annual watershed protection activities directly implemented by the fund (Coronel and Zavala 2014). The fund launched with an initial investment of $1,000 from TNC and $20,000 from the Quito water company (Arias et al. 2010) and has grown to $12 million with an annual budget of approxi-mately $2 million today.
Other important stakeholders have become constituents of FONAG since its inception in 2000, recognizing the importance of protecting their supply of water, including the Quito Electric Company, and private beer and water bottling organizations like Cervecería Nacional and Tesalia Springs Company, and the NGO CAMAREN (Arias et al. 2010; Coronel and Zavala 2014).
insights for AdvancementFONAG has inspired the planning and development of dozens of other water funds across the region (Encalada et al. 2015). This mechanism ensures broad-based stakeholder participation, and links nature and its water quantity and quality benefits to water users, taking a long-term perspective on ensuring water availability and flow. The goal is to create well-managed watersheds to benefit downstream users, which, in turn, pay for the activities required to preserve the watershed and its ecosystem benefits. Importantly, demonstrating and quantifying the hydrological benefits of the fund is crucial to understanding local ecological relationships, how to target investments to most effectively protect watersheds, and the transferability of similar mechanisms to other contexts.

WRI.org 114
LOCATION: Somaliland and Puntland, Somalia Aquifer recharge mechanisms are being applied in drought-sensitive rural settlements to improve community water resource supplies and drought resiliency throughout the year to alleviate drought emergencies and extreme poverty and tackle fragility.
Background Somalia is impacted by fragility, conflict, and violence, and is one of the poorest countries in the world with 73 percent of the population living in poverty. The country has a very dry climate, marked by high variability, low precipitation, very high temperatures, and extreme weather events. Traditional water sources in rural areas often lack the capacity to sustain water supply during prolonged dry periods. These conditions make rural communities extremely vulnerable to climate stresses and shocks, as livelihoods depend on scarce water resources for domes-tic purposes and livestock, and to access fodder. Water insecurity compounds and exacerbates the fragility cycle (Sadoff et al. 2017). Investing in water-related infrastructure is therefore crucial to alleviate drought emergencies and extreme poverty, and in turn, to tackle fragility (Sadoff et al. 2017), and is a World Bank priority in line with the International Development Association’s 2018 replenishment strategy, which allocated $75 billion to combat fragility and climate change and to tackle gender inequality.
The Water for Agro-Pastoral Livelihoods Pilot Project (WALPP), established in 2015, and the Somalia Emergency Drought Response and Recovery Project (SEDRRP), established in 2017, support Somali rural communities while setting examples for how to enable effective, resilient, and sustainable water investments in fragile countries.
▪ WALPP pilots investing in water-related infrastructure in a fragile country with the objective of improv-ing pastoral and agropastoral communities’ access to, and management of, small-scale water sources, and enhancing the capacity of the government to implement small-scale water interventions in targeted arid lands of Somaliland (SL) and Puntland (PL).
▪ The SEDRRP is mainly a humanitarian operation to respond to the 2017 Drought. However, it also aims at transitioning to a long-term development intervention approach in SL and PL, through a technical assistance that plans water supply investments in 15 of the most underserved population and drought-sensitive settlements in these two States under conditions of fragility.
Utilizing Green infrastructure in Place of Gray in Fragile Countries WALPP is financing green infrastructure to develop underutilized agropastoral water supplies through sand dams or subsurface dams at eight project sites across SL and PL. Adapting to the conditions on the ground, the develop-ment of sand dams in the beds of ephemeral rivers (sand rivers-wadis) in Somalia is expected to enhance water
CASE STUDY 5B Recharging Aquifers to Combat Drought in Somalia

115Integrating Green and Gray
harvesting, increase soil moisture, and replenish the water table, while avoiding water losses that would otherwise result from evaporation and runoff. These methods have the potential to provide key water resources for agropas-toralists and pastoralists during long dry seasons when surface water storage, such as that in berkads, is exhausted. These developments, with an estimated extractable volume of water between 1,800 and 27,000 m3, are completed and starting to deliver water supplies to the local communities. Going forward, hydrological monitoring and com-munity surveys will test the performance and community acceptance of these investments. If proved successful, they can be scaled into larger financing initiatives.
Similarly, SEDRRP has recommended investments in sand dams or subsurface dams in 15 priority areas identi-fied through a groundwater development planning methodology that assessed where and how to intervene in the region. The methodology maximized use of existing information (including both remote sensing and ground-level data), coordination with other international agencies, and consultations with local stakeholders to identify the most underserved and drought-sensitive settlements of SL and PL, which constitute the 15 priority areas.
SEDRRP was initially looking for borehole drilling sites for targeted planned investments. However, the expense, lack of capacity for operations, and maintenance required, and conditions of political fragility on the ground made traditional built infrastructure options such as these infeasible. As a result, SEDRRP has recommended nature-based solutions for groundwater resources development and resilient water interventions in the 15 priority settle-ments. Ultimately, these interventions will be financed under a third project in preparation: the Regional Ground-water Initiative in the Horn of Africa.
Description of Green infrastructureSand dams are made of concrete and are similar in structure to low-lying, impermeable weirs. They are built across wadis or other identified red soils, retaining sediments and water flowing downstream during and after rainfall events. This empowers the accumulated and existing natural alluvial sediments to hold moisture, and infiltrate and recharge the water table for domestic and pastoral uses. Similarly, subsurface dams, prevent seepage into loose sediments, retaining the water underground and further preventing evaporation. Behind the retaining wall of the sand or subsurface dam, shallow wells sunk with caisson rings serve as reservoirs from which water is distributed for domestic water supply and livestock to standpipes, which separate human and livestock water use to enhance water quality and health.
insights for Advancement In Somaliland and Puntland, many donors, humanitarian actors, and government agencies are financing water infrastructure, and well drilling in particular, often in a poorly coordinated and unplanned manner. Lack of water-related information, partial information, and unreliable water and well monitoring capabilities are often major concerns. Data-sharing on these activities is not a common or transparent practice. Maximizing the use of existing information—including remote sensing and ground-level data—and coordinating with other agencies, the government, and the local communities is important to help ensure interventions are targeted to drought-sensitive and underserved settlements, and that investments encompass long-term sustainability to build resiliency in poor communities.
Upon conclusion of the WALPP, an evaluation assessment will be performed to assess how project delivery has been sustained; whether the project has had positive or negative socioeconomic impact on communities, and nota-bly on the state of peace-building in the areas; and how the project has helped to change citizen-state relations. The investments made by this pilot project and lessons learned will help to formulate a guidance on a coordinated and systematic approach to groundwater exploration in the region, and on navigating its main challenges. The results of the socioeconomic impact analysis will also help determine whether these projects can be effectively replicated in other areas of the region through related programs like SEDRRP.
Sources: World Bank 2015b, 2017d, n.d.(d), n.d.(e).

WRI.org 116
The ChallengeUnsustainable land and water management practices can damage the health and productivity of cultivable land that communities rely upon for sustenance and livelihoods. Climatic conditions, like low precipitation, heat waves, or droughts, can also play a role in exacer-bating challenges faced, including the following:
▪ Soil erosion and nutrient depletion, which can occur when soils become vulnerable to wind and water erosion, resulting in topsoil loss and intense weathering that can affect crop yields. Erosion reduces nutrient levels and soil fertility.
▪ Reduced soil moisture/water retention capacity, which can occur when vegetation is lost or damaged, such as with livestock over-grazing or deforestation. Subsoil organic matter is affected and its ability to infiltrate and store water diminished, impacting plant growth and soil fertility.
▪ Desertification, which can occur when land that was once fertile ultimately turns to desert because of deforestation, inappropriate crop and livestock practices, or persistent drought-like conditions, impoverishing vegetation and wildlife.
Food security is critical for human welfare and eco-nomic growth. Food production needs to increase 70 percent by 2050 to feed future populations (FAO and ITPS 2015), but some regions are struggling to pro-duce even enough food for today. For example, Sub-Saharan African smallholder farmers depend upon agriculture for their livelihoods, but often produce just enough food to feed their families and are unable to generate enough income to make investments that can increase agricultural yields. The region has suffered from the most severe land degradation in the world, costing $58 billion annually, driven by defores-tation and grassland conversion to cropland because of low livestock productivity (Nkonya et al. 2016). Countries in the region have designed a number of policies and strategies to address land degradation
and to enhance productivity. However, investment from both countries and their development partners has remained low, especially for livestock, which accounts for the largest area degraded. Our results show that conversion of grassland to cropland and deforestation are the major factors driving land use/cover change.
What Role Can integrating Green infrastructure Play?Green infrastructure can help improve soil condi-tions for growth and agricultural productivity and reduce the need for costly inputs or additives, such as irrigation water, pesticides, and fertilizers. Examples include the following:
▪ Agroforestry and Silvopasture systems. Planting trees and shrubs on cropland or pastureland can help protect soil from water runoff, erosion, and nutrient depletion. Using commodity trees can also generate additional income.
▪ Rotational livestock grazing. Grazing only one portion of pasture at a time allows the rest of the pasture to rejuvenate. This practice can help forage plants rebuild and deepen their roots to improve the health and longevity of the soil.
▪ Farmer-managed natural regeneration (FMNR). Allowing native trees and shrubs to regrow from remnant underground root systems, or planting new ones, helps lock in nutrients and boost crop yields near trees. Fall-ing leaves decompose and fertilize soils, helping with moisture retention. Trees can also be used for valuable products to supplement incomes.
▪ Furrow diking. Plowing ridge-like barriers into soil alongside row crops holds irrigation and rainwater longer, preventing runoff and enabling water to slowly soak into the soil. This practice can help curb soil erosion and retain moisture and nutrients.
6. AGRiCULTURE, iRRiGATiON, AND DRAiNAGE
OVERVIEW | Agriculture, irrigation, and Drainage

117Integrating Green and Gray
Some of these measures can also diversify income streams to reduce overall vulnerability for livelihoods that are primarily dependent upon agriculture. For example, since the mid-1980s, five million hectares in the Maradi and Zinder regions of Niger have been restored by FMNR (Buckingham and Hanson 2015b). This region was once on the brink of severe desertification but has improved its natural environ-ment to increase food security, household incomes, and its resilience to cope with weather-related crises impacting agricultural production. Crop yields have increased to feed an additional 2.5 million people (Reij et al. 2009); gross income has grown by $17 mil-lion to $21 million/year (Haglund et al. 2011); farmers have tripled their incomes through sales of restoration products (WRI 2008); and during times of drought, agriculture on FMNR landscapes fared better than those without (Yamba et al. 2005).
ConsiderationsOne-third of the world’s land is classified as severely degraded, while fertile soil is being lost at 24 billion tons/year (Dudley and Alexander 2017). Competition for land and food will continue to grow as the quantity of productive land declines and becomes increas-ingly threatened by climate change. However, with rates of return on investment as high as $4 for every $1 invested in places like Sub-Saharan Africa, taking action with green infrastructure can be a cost-effective way to help address food insecurity in light of these challenges (Nkonya et al. 2016).
Figure A6 | Ethiopia: Agroforestry on Steep Slopes Helps Prevent Soil Erosion and improve Water infiltration for More Productive Farming
Source: WRi/Flickr.

WRI.org 118
LOCATION: MaharashtraA participatory watershed development (WSD) program has improved agricultural yields and income generation for poor rural villagers by restoring degraded landscapes of the Kumbharwadi watershed, increasing rainwater capture, storage capacity, and soil fertility, and reducing soil erosion.
Background The Kumbharwadi is a 910-hectare watershed in the arable, but low-producing rainfed regions of poor, rural India. Its lands are historically characterized by erratic, deficient, and delayed rainfall patterns; consist of hilly or moun-tainous terrain that makes improving land productivity with large-scale irrigation virtually impossible; and once suffered from severe degradation due to deforestation and unsustainable agriculture and livestock practices. Two villages and roughly 1,000 people that are highly dependent on the land for their livelihoods and sustenance call this watershed home (Gray and Srinidhi 2013).
In the mid-1990s, more than 50 percent of the Kumbharwadi was categorized as wasteland because of weather-related impacts and unsustainable land-use practices (Gray and Srinidhi 2013). Village women traveled for drink-ing water and fuel wood, and agricultural production became possible for only half the year, forcing villagers to migrate the remaining half of the year for employment. Supplemental drinking water was needed from 25 to 30 government-supplied water tankers annually to sustain villagers during the dry seasons. To restore the watershed and its agricultural productivity, the Watershed Organisation Trust (WOTR) implemented a participatory WSD project from 1998 to 2002 in the Kumbharwadi. The program was financed by the German Bank for Development and the German Agency for Technical Cooperation, and funds granted through the National Bank for Agriculture and Rural Development (NABARD) and WOTR (Gray and Srinidhi 2013).
integrating Green and Gray Approaches for inclusive RevitalizationWOTR engaged all land-owning families in planning a range of interventions on their property, including the following:
▪ Ecosystem-based solutions, like afforestation, reforestation, agroforestry, and on-farm contour trenching, which regenerated the landscape and helped retain soil and its moisture, improving fertility for cultivation.
▪ Physical water management built structures, like check dams, farm bunding, and loose boulder structures, which helped slow the velocity of water runoff, increase infiltration into groundwater reserves, and regulate the timing and flows of water throughout the seasons.
Both ecosystem-based and built interventions were relied upon as complementary interventions to revitalize the watershed. As part of WOTR’s Participatory Net Planning (PNP) methodology for inclusive watershed develop-ment, all villagers, beginning in 1998, underwent hands-on training in the watershed and learned about conserva-
CASE STUDY 6A Community-led Watershed Restoration in India

119Integrating Green and Gray
tion, sustainable land management, and maintenance of program interventions before implementation. When the project ended in 2002, ecosystem-based solutions had been carried out on 375 hectares of previous forestland, wasteland, and grassland, and farm bunding on 492 hectares, as well as one check dam and seven loose boulder structures constructed (Gray and Srinidhi 2013). WOTR’s PNP approach has also been widely successful in achiev-ing an equitable decision-making process through its prerequisite establishment of a village committee. By requir-ing proportional gender and socioeconomic household representation, even marginalized groups are integrated into project development. In addition, local youth are trained under the guidance of an expert engineer to help supervise the work being implemented, which has proved crucial for long-term management of land and water resources.
improved Agricultural Yields and income GenerationResults from this project indicate increased groundwater levels, improved soil fertility, and marked gains in agri-cultural productivity (see Table A3). Net agricultural income increased from $69,000/year to almost $625,000/year for the watershed, which was due to several factors, including the expansion of cultivable area; crop yields ben-efitting from better land management practices and the ability for small-scale irrigation; and villagers able to switch from grain crops to cash crops with higher prices/unit sold. As crop-based incomes increased, villagers also shifted investments to higher-producing cattle varieties, which brought a corresponding increase in livestock income (Gray and Srinidhi 2013). Among the most notable ancillary benefits is the fact that villagers no longer need to rely on supplemental water supplies from the government.
IMPACT INDICATOR UNITREPORTING YEAR
1998 2002 2012
Total cropped area Hectares 457 510 566
Value of cropland Rupee/hectare 15,000 65,000 65,000
Variety of crops grown during Rabi season Hectares 4 14 25
Agricultural employment Months/year 3–4 8–9 12
Agricultural wage rate Rupee 25 65 225
Land under irrigation (perennial) Hectares 0.00 9.72 50.00
Average depth of water table below ground level Meters 6.5 3.5 3.0
Government supplied water tankers Number/years 25–30 0 0
Wells Number 63 85 91 Source: Gray and Srinidhi 2013.
insights for AdvancementA decade following project completion, the cumulative benefits of the WSD program from 1998 to 2012 were three times the cumulative costs of the program (values adjusted to 2012, US$) (Gray and Srinidhi 2013). The project improved not only agricultural productivity, but also overall livelihoods and incomes for these communities, which motivated watershed maintenance long after project completion. The WSD project model was replicated across rainfed regions of India—over 380 projects covering almost 260,000 hectares in six Indian states. However, these communities are still highly sensitive to fluctuations in annual rainfall and temperature changes. Thus in 2014, WOTR introduced the Water Stewardship Initiative in 106 villages, including Kumbharwadi, to empower locals to actively manage the watershed over time (Samuel et al. 2015). Future projects in similar geographies and weather conditions would also benefit from active social engagement and from understanding how to optimize WSD-like interventions and investments for greatest societal benefits. However, a lack of consistency in data reporting, col-lection, and methodology has made it difficult to leverage the success of these projects for targeted optimization or to measure where similar projects have been successful.
Table A3 | Agricultural and Ancillary Benefits from Kumbharwadi Watershed Development Program

WRI.org 120
LOCATION: Municipalities of Beijing, Shenyang, Qingdao; provinces of Hebei, Ningxia, ShanxiArid northern China depends on overabstracted groundwater for agricultural productivity. The China Water Conservation Project used green and gray infrastructure to enhance the soil’s ability to store water. Activities to preserve the green infrastructure functions of farmland (such as mulching, land-leveling, improving organic soil content and forest shelterbelts) led to increased productivity and farmer incomes, and decreased groundwater pumping and consumptive water use.
Background The northern plains of China are one of the great agricultural regions in the world, producing crops that feed hun-dreds of millions of people. This arid region’s dependence on overabstracted groundwater is putting agricultural productivity at risk, and resulting in low farm incomes. One culprit for low agricultural productivity in northern China is nonbeneficial evapotranspiration (NBET)—the water lost due to evapotranspiration (ET) from soil and nonagricultural plants.
The World Bank-financed China Water Conservation Projects were implemented in the municipalities of Beijing, Shenyang, and Qingdao and in the provinces of Hebei, Ningxia, and Shanxi to reduce NBET. The China Water Conservation Project 1 (WC1) was implemented from 2001 to 2006. Project 2 (WC2) was implemented over the period 2012 to 2017. These projects were completed by the Hai River Basin Integrated Water Resources Manage-ment Project, which was implemented over the period 2004 to 2010 and financed through a $17 million grant from the Global Environment Facility (GEF).
integrating Green and Gray infrastructureChina’s initial attempts at improving agricultural water productivity focused on physical infrastructure such as canal lining and sprinkler systems, but were not fully successful. In contrast, the China Water Conservation Proj-ects improved physical irrigation infrastructure, while also optimizing the green infrastructure provided by the soil.
The soil’s ability to store water and reduce NBET was enhanced through several agronomic measures:
▪ Mulching with crop residue or plastic sheets helped to maintain soil moisture and helped reduce soil ero-sion.
▪ Land-leveling helped rainwater evenly percolate into the soil and reduced evaporation caused by pools of water in low-lying areas.
▪ Improving the organic content of the soil helped to increase its water storage capacity.
▪ Tillage was reduced or eliminated in the dry season to maintain soil moisture, and deep ploughing was practiced in the wet season to increase water percolation.
CASE STUDY 6B Active Soil Management for Water Conservation in China

121Integrating Green and Gray
▪ Forest shelterbelts were planted to reduce wind speeds over fields, which helped to reduce overall evapo-ration rates.
▪ Irrigation applications were improved with respect to timing and amount, based on close monitoring of soil moisture conditions.
The projects also improved irrigation infrastructure through canal lining and adoption of sprinkler irrigation sys-tem. Farmers were encouraged, if there were appropriate market conditions, to move toward more profitable and less water-intensive crops—often grown in green houses. Finally, farmers were organized into Water User Associa-tions to help maintain irrigation infrastructure and manage water locally.
Water Conservation through Soil ManagementThe project’s primary goals were to increase the value-added per unit of ET and achieve groundwater sustainability. The ET was measured through an innovative remote sensing–based technology, which allowed each participating county to measure its actual agricultural ET water consumption. The approach of managing ET is often termed “real water savings,” as opposed to irrigation efficiency, which typically focuses only on the efficiency of applied irrigation water.
The three key targets for the project development indicators for both WC1 and WC2 were met or exceeded. The first target focused on reducing the amount of ET per kilogram of cash crop produced (wheat, corn, and rice). For WC1, it was estimated that prior to the project, the average ET rate was 735 millimeters per hectare (mm/ha), and after the project, this was reduced to 612 mm/ha, resulting in an average water savings of 1,200 cubic millimeters/hectare (mm3/ha). The second target focused on reducing groundwater overdraft, as measured by a reduction in groundwater abstractions. In all WC1 and WC2 areas, the rate of groundwater level decline was either significantly reduced or eliminated. For WC1, it was calculated that average groundwater pumped per hectare of farmland decreased by 30 percent, which helped to stabilize groundwater levels. The total reduction in consumptive water use was estimated at approximately 128 million m3/year. The third target focused on increases in farmer incomes, and in all WC1 and WC2 areas, farmer incomes increased, typically in the range from 100 to 200 percent. Finally, WC1 benefitted 358,088 families and had an overall quantifiable economic rate of return of 24 percent, and WC2 benefitted 594,200 farmers and had an overall quantifiable economic rate of return of 19 percent.
insights for Advancement The success of the China Water Conservation Projects shows that managing soil through better agronomic prac-tices has the potential to significantly increase both its water storage capacity and reduce NBET—the key indicator for real water savings. Researchers in this project found that remote sensing data were critical for measuring ET and monitoring consumptive water use to calculate real water savings.
Future irrigation infrastructure programs can benefit from combining with agronomic practices that enhance the green infrastructure benefits provided by the soil. In addition, extensive stakeholder engagement is critical to inducing farmers to change their agronomic practices. Farmers must be convinced that their behavioral changes will result in increased incomes and reduced consumptive water use.
There is real potential to scale up solutions that value soil as an important infrastructural asset. Most countries depend on rainfed agriculture, which is inherently uncertain and oftentimes puts pressure on soil health. Mapping rainwater and soil moisture, prioritizing soil health, and supplementing with small-scale irrigation can improve the livelihoods of farmers in rainfed areas (IWMI 2010).

WRI.org 122
APPENDiX B. REFERENCES ENDORSiNG GREEN iNFRASTRUCTURE AND SiMiLAR APPROACHESThis annotated bibliography presents a selection of publications that have done one of the following:
▪ Made a strong general case for green infrastructure
▪ Tracked the rate of adoption or investment in green infrastructure
▪ Showed significant support for green infrastructure or broader nature-based solutions on a global level
Collectively, these resources demonstrate the growing momentum for integrating green and gray infrastructure, and the increasingly clear reasoning for promoting such an approach. This list is illustrative and not meant to be comprehensive.
R. Abell. N. Asquith, G. Boccaletti, L. Bremer, E. Chapin, A. Erickson-Quiroz, J. Higgins, et al. 2017. “Beyond the Source: The Environmental, Economic, and Community Benefits of Source Water Protection.” Arlington, VA: The Nature Conservancy.
https://thought-leadership-production.s3.amazonaws.com/2017/08/15/13/08/06/94ed694b-95aa-457d-a9d0-4d8695cfaddc/Beyond_The_Source_Full_Report_FinalV4.pdf.
▪ This global high-level analysis demonstrates that 40 percent of source watershed areas show high to moderate levels of degradation.
▪ Four out of five cities can reduce sediment and nutrient pollution by a meaningful amount through forest protection, pastureland reforestation, and improved agricultural practices.
▪ One in six cities could recoup the costs of green infrastructure protection through savings in annual water treatment costs alone.
G. Bennett and F. Ruef. 2016. “Alliances for Green Infrastructure: State of Watershed Investment 2016.” Ecosystem Marketplace: A Forest Trends Initiative. Washington, DC: Forest Trends.
http://www.forest-trends.org/documents/files/doc_5463.pdf.
▪ This global survey examines transactions for green infrastructure for water from 2014 to 2015, including sources such as public subsidy payment programs, user-driven watershed investments, water quality credit trading, and environmental water markets.
▪ in 2015, nearly $25 billion was spent across 62 countries on payments for green infrastructure for water. These payments supported 419 programs.
▪ Public and private investment in watershed protection grew at record levels of about 12 percent per year between 2013 and 2015.
T.S. Bridges, J. Lillycrop, J.R. Wilson, T.J. Fredette, B. Suedel, C.J. Banks, and E.J. Russo. 2013. “Engineering with Nature for Sustainable Water Resources Infrastructure.” US Army Corps of Engineers contribution to 2013 PIANC Yearbook.
https://ewn.el.erdc.dren.mil/pub/EWNFactSheet_Final.pdf.
▪ This fact sheet describes the Engineering With Nature (EWN) initiative of the U.S. Army Corps of Engineers (USACE), which aims to enable more sustainable delivery of water resources infrastructure services.
▪ The intentional alignment of natural and engineering processes can efficiently and sustainably deliver economic, environmental, and social benefits through collaborative processes.
Climate Bonds Initiative. “The Water Infrastructure Criteria: Climate Bonds Standard.”
https://standard.climatebonds.net/files/files/Climate%20Bonds%20Water%20infrastructure%20Criteria%20introductory%20Brochure%20April%202018.pdf.
▪ This brochure introduces the Climate Bonds Standard Water Criteria, which lay out eligibility requirements for certification for a Certified Climate Bond.
▪ The criteria cover green infrastructure. This provides an avenue for green infrastructure projects to attract the financing they need to address growing water challenges.
F. Cohen, K. Hamilton, C. Hepburn, F. Sperling, and A. Teytelboym. 2017. “The Wealth of Nature: Increasing National Wealth and Reducing Risk by Measuring and Managing Natural Capital.” Oxford, UK: Institute for New Economic Thinking.
https://www.wavespartnership.org/en/knowledge-center/wealth-nature-increasing-national-wealth-and-reducing-risk-measuring-and-managing.
▪ This report discusses natural capital accounting, providing a description of its status among policymakers and the business community, offering recommendations on additional areas for research and a series of actions to be taken immediately.
▪ The first section identifies the three challenges faced by natural capital: it is not accurately measured; it is not compatible with all economic models, and there are no institutions to properly manage or support it. The remaining sections describe next steps and include discussion of “natural infrastructure” supporting greater prosperity.

123Integrating Green and Gray
High Level Panel on Water. 2018. “Making Every Drop Count: An Agenda for Water Action.” Outcome Document.
https://sustainabledevelopment.un.org/content/documents/17825HLPW_Outcome.pdf.
▪ Eleven heads of state and a special advisor were convened by the UN and World Bank to provide leadership and recommendations for the management of water in accordance with Sustainable Development Goal (SDG) 6: “Ensure availability and sustainable management of water and sanitation for all.”
▪ The report advocates for use of green infrastructure in harmony with gray infrastructure to make water infrastructure more sustainable and resilient, among other actions.
Natural Capital Financial Alliance. 2012. “Natural Capital Declaration.” UNEP Finance Initiative.
http://www.naturalcapitalfinancealliance.org/the-declaration.
▪ More than 40 financial institutions have signed on to the declaration to acknowledge the role of natural capital in maintaining a sustainable global economy.
▪ The declaration commits to understanding how natural capital fits into the operations of financial institutions; to support methodologies to integrate natural capital into decision-making; to seek global consensus on how to include natural capital into private sector decision-making and accounting; and to collaborate to represent natural capital on financial reports.
S. Naumann, T. Kaphengst, K. McFarland, and J. Stadler. 2014. “Nature-based Approaches for Climate Change Mitigation and Adaptation. The Challenges of Climate Change—Partnering with Nature.” Bonn: German Federal Agency for Nature Conservation (BfN), Ecologic Institute.
https://www.ecologic.eu/sites/files/publication/2014/eco_bfn_nature-based-solutions_sept2014_en.pdf.
▪ This brochure outlines the multifaceted advantages of nature-based solutions for climate change mitigation and adaptation.
▪ While there is presently a lack of specific funds for nature-based solutions at the European Union (EU)-level, there are several potentially related funding programs and opportunities to apply such solutions.
S. Ozment, K. DiFrancesco, and T. Gartner. 2015. “Natural Infrastructure in the Nexus.” Nexus Dialogue Synthesis Paper. Gland, Switzerland: International Union for Conservation of Nature.
https://portals.iucn.org/library/sites/library/files/documents/Nexus-001.pdf.
▪ This paper discusses how green infrastructure can help decision-makers and infrastructure managers address interconnected challenges facing water, energy, and food systems, often referred to as the “nexus”.
▪ it highlights reasons to include green infrastructure in planning and decision-making, and reviews efforts to build momentum for increased protection and restoration of green infrastructure around the world.
P. Sukhdev, H. Wittmer, C. Schröter-Schlaack, C. Nesshöver, J. Bishop, P. Brink, H. Gundimeda, et al. 2010. “Mainstreaming the Economics of Nature: A Synthesis of the Approach, Conclusions and Recommendations of TEEB.” The Economics of Ecology and Biodiversity.
http://www.teebweb.org/our-publications/teeb-study-reports/synthesis-report/.
▪ This report bridges the gap between biodiversity and the arena of international, national, and local policy—as well as with the business community—by describing how to value the economic contribution of ecosystem services.
▪ it makes the case for the systematic appraisal of ecosystem services, and offers examples of how to do so in different settings.
World Business Council for Sustainable Development (WBCSD). 2017. “Incentives for Natural Infrastructure: Review of Existing Policies, Incentives and Barriers Related to Permitting, Finance and Insurance of Natural Infrastructure.” Geneva: WBCSD.
https://www.wbcsd.org/Clusters/Water/Natural-infrastructure-for-Business/Resources/incentives-for-Natural-infrastructure.
▪ This report documents private and public implementation of green infrastructure globally, focusing on three factors for implementation: permitting, financing, and insurance.
▪ The report is prepared on behalf of the WBCSD green infrastructure platform that convenes over 30 multinational companies to advance the business case for investment in green infrastructure.
WWAP (World Water Assessment Program)/UN-Water. 2018. “The United Nations World Water Development Report 2018: Nature-Based Solutions for Water.” Paris: UNESCO.
http://unesdoc.unesco.org/images/0026/002614/261424e.pdf.
▪ This report promotes nature-based solutions to help achieve the 2030 Agenda for Sustainable Development through NBS.
▪ it presents a broad perspective of the UN system on freshwater resources and sanitation issues.
World Wide Fund for Nature (WWF). 2017. “Natural and Nature-Based Flood Management: A Green Guide.” Gland, Switzerland: WWF.
https://c402277.ssl.cf1.rackcdn.com/publications/1058/files/original/WWF_Flood_Green_Guide_FiNAL.pdf?1495628174.
▪ This guide supports communities at the local level to use nature-based methods for flood risk management.
▪ The guide is designed for those responsible for flood risk management, including municipal governments, community groups, and NGOs, and provides disaster response case studies and a set of adaptable tools for readers to understand their local context of flood risks and weigh different management options, both structural and nonstructural.

WRI.org 124
World Bank. 2017. “Implementing Nature Based Flood Protection: Principles and implementation Guidance.” Washington, DC: World Bank.
http://documents.worldbank.org/curated/en/739421509427698706/pdf/120735-REViSED-PUBLiC-Brochure-implementing-nature-based-flood-protection-web.pdf.
▪ The objective of this document is to present five principles and guidance for the evaluation, design, and implementation of nature-based solutions for flood risk management as an alternative or complement to conventional engineering measures.
▪ The first part describes key considerations for planning nature-based solutions, and the second part presents a step-by-step implementation timeline and required activities and outputs for each step as a reference for disaster risk and climate adaptation professionals.
T. Gartner, J. Mulligan, R. Schmidt, and J. Gunn. 2013. “Natural Infrastructure: Investing in Forested Landscapes for Source Water Protection in the United States.” Washington, DC: World Resources Institute.
https://www.wri.org/publication/natural-infrastructure.
▪ This report is a guide and reference for professionals working in the field of water conservation and management to understand and utilize green infrastructure.
▪ The report is divided into three sections starting with an outline of the business case and proof of green infrastructure. The second section explains the design and implementation steps identifying stakeholders and finance options. The final section offers insights from case studies.
S. Ozment, T. Gartner, H. Huber-Stearns, K. DiFrancesco, N. Lichten, and S. Tognetti. 2016. “Protecting Drinking Water at the Source: Lessons from Watershed Investment Programs in the United States.” Washington, DC: World Resources Institute.
https://www.wri.org/sites/default/files/Protecting_Drinking_Water_at_the_Source.pdf.
▪ WRi and Colorado State University analyzed 13 watershed investment programs in the United States to identify common approaches, underlying conditions, and lessons learned.
▪ The report distills 10 key success factors to consider in watershed investment program development.
United Nations Environment Programme (UNEP), International Union for Conservation of Nature (IUCN), The Nature Conservancy (TNC), World Resources Institute (WRI), and U.S. Army Corps of Engineers. 2014. “Green Infrastructure Guide for Water Management: Ecosystem-Based Management Approaches for Water-Related Infrastructure Projects.”
http://www.unepdhi.org/-/media/microsite_unepdhi/publications/documents/unep/web-unep-dhigroup-green-infrastructure-guide-en-20140814.pdf.
▪ This guide is an overview of three key water management issues related to water supply, water quality, and flooding, and details 12 green infrastructure solutions, their relevant ecosystem services, and estimated installation costs.
▪ The report also describes a methodology for water management options assessment based on the six-step Green-Gray Analysis (GGA), using an example case study on water quality regulation from Sebago Lake in the U.S. state of Maine, as well as several others to illustrate green infrastructure valuation.
125Integrating Green and Gray
REFERENCESAPSiM (Agricultural Production Systems siMulator). 2018. “Agricultural Production Systems siMulator (APSiM).” http://www.apsim.info/.
Arias, V., S. Benitez, and R. Goldman. 2010. “Water Fund for Catchment Management in Quito, Ecuador.” The Economics of Ecosystems and Biodiversity (TEEB) case study. http://www.teebweb.org/wp-content/uploads/CaseStudies/Water%20fund%20for%20catchment%20management%20in%20Quito,%20Ecuador.pdf.
Artemis. 2018. “Willis Towers Watson Launches Global insurance Facility for Resilience.” Artemis.Bm—The Catastrophe Bond, Insurance Linked Securities & Investment, Reinsurance Capital, Alternative Risk Transfer and Weather Risk Management (blog). March 9. http://www.artemis.bm/blog/2018/03/09/willis-towers-watson-launches-global-insurance-facility-for-resilience/.
Atkinson, G., N. Braathen, B. Groom, and S. Mourato. 2018. “Cost-Benefit Analysis and the Environment: Further Developments and Policy Use.” Paris: OECD.
Bair, B. 2000. “Stream Restoration Cost Estimates.” Proceedings of the Salmon Habitat Restoration Cost Workshop, Gladstone, OR, November 14–16.
Barlow, P.M. 2003. “Ground Water in Freshwater-Saltwater Environments of the Atlantic Coast.” Circular 1262. Reston, VA: U.S. Department of the interior, U.S. Geological Survey. https://pubs.usgs.gov/circ/2003/circ1262/pdf/circ1262.pdf.
Bathurst, J.C., A. iroumé, F. Cisneros, J. Fallas, R. iturraspe, M.G. Novillo, A. Urciuolo, et al. 2011. “Forest impact on Floods Due to Extreme Rainfall and Snowmelt in Four Latin American Environments 1: Field Data Analysis.” Journal of Hydrology 400 (3–4): 281–91.
Beck, M. and G-M Lange (eds). 2016. Managing Coasts with Natural Solutions: Guidelines for Measuring and Valuing the Coastal Protection Services of Mangroves and Coral Reefs. Wealth Accounting and the Valuation of Ecosystem Services Partnership (WAVES) Technical Paper. Washington, DC: World Bank Group.
BenDor, T., T.W. Lester, A. Livengood, A. Davis, and L. Yonavjak. 2015. “Estimating the Size and impact of the Ecological Restoration Economy.” PLOS One 10 (6): e0128339. doi:10.1371/journal.pone.0128339.
Bennett, G., and F. Ruef. 2016. “Alliances for Green infrastructure: State of Watershed investment 2016.” Ecosystem Marketplace: A Forest Trends initiative. Washington, DC: Forest Trends. http://www.forest-trends.org/documents/files/doc_5463.pdf.
Bennett, K., and N. Henninger. 2010. “Payments for Ecosystem Services in Costa Rica and Forest Law No. 7575: Key Lessons for Legislators.” Washington, DC: World Resources institute. https://www.agora-parl.org/sites/default/files/090422_e-parliament_forests_initiative.pdf.
Bergamini, N., W. Dunbar, P. Eyzaguirre, K. ichikawa, i. Matsumoto, D. Mijatovic, Y. Morimoto, et al. 2014. Toolkit for the Indicators of Resilience in Socio-Ecological Production Landscapes and Seascapes. NU-iAS; Bioversity international. Rome: institute for Global Environmental Strategies (iGES), United Nations Development Programme (UNDP). https://www.bioversityinternational.org/e-library/publications/detail/toolkit-for-the-indicators-of-resilience-in-socio-ecological-production-landscapes-and-seascapes/.
Bettencourt, S. 2018. Personal correspondence between the authors and Sophia Bettencourt. March.
BGS (British Geological Survey). 2010. “Groundwater Flooding.” Factsheet. British Geological Survey. https://www.bgs.ac.uk/downloads/start.cfm?id=1824.
Bhattasali, D., and V. Thomas. 2016. “is infrastructure investment the Answer to Sluggish Economic Growth?” Brookings (blog). April 5. https://www.brookings.edu/blog/future-development/2016/04/05/is-infrastructure-investment-the-answer-to-sluggish-economic-growth/.
Blackman, A., and R.T. Woodward. 2010. “User Financing in a National Payments for Environmental Services Program: Costa Rican Hydropower.” Discussion Paper. Washington, DC: Resources for the Future. https://pdfs.semanticscholar.org/6bfb/3f72ba42ecc3f1b7f5e46f46d684d3d1985a.pdf.
Bloomberg, M., and C. Holloway. 2018. “NYC Green infrastructure Plan. Executive Summary.” New York: City of New York. http://www.nyc.gov/html/dep/pdf/green_infrastructure/NYCGreeninfrastructurePlan_ExecutiveSummary.pdf.
Bontje, L.E., and J.H. Slinger. 2017. “A Narrative Method for Learning from innovative Coastal Projects—Biographies of the Sand Engine.” Ocean & Coastal Management 142 (June): 186–97. doi:10.1016/j.ocecoaman.2017.03.008.

WRI.org 126
Brown, C., Y. Ghile, M. Laverty, and K. Li. 2012. “Decision Scaling: Linking Bottom-up Vulnerability Analysis with Climate Projections in the Water Sector.” Water Resources Research 48 (9). doi:10.1029/2011WR011212.
Buckingham, K., and C. Hanson. 2015a. “The Restoration Diagnostic Case Example: Costa Rica.” Case Study. The Restoration Diagnostic. Washington, DC: World Resources institute. https://www.wri.org/sites/default/files/WRi_Restoration_Diagnostic_Case_Example_Costa_Rica.pdf.
Buckingham, K., and C. Hanson. 2015b. “The Restoration Diagnostic Case Example: Maradi and Zinder Regions, Niger.” Case Study. The Restoration Diagnostic. Washington, DC: World Resources institute. https://www.wri.org/sites/default/files/WRi_Restoration_Diagnostic_Case_Example_Niger.pdf.
Buckingham, K., S. Ray, B. Arakwiye, A.G. Morales, R. Singh, D. Maneerattana, S. Wicaksono, H. Chrysolite, A. Minnick, and L. Johnston. 2018. “Mapping Social Landscapes: A Guide to Restoration Social Opportunities Mapping.” Washington, DC: World Resources institute.
Burek, P., Y. Satoh, G. Fischer, T. Kahil, L. Nava Jimenez, A. Scherzer, S. Tramberend, et al. 2016. “Water Futures and Solutution Fast Track initiative.” Laxenburg, Austria: international institute for Applied Systems Analysis.
Burke, L. 2011. Reefs at Risk Revisited. Washington, DC: World Resources institute.
Cohen-Shacham, E., G. Walters, C. Janzen, and S. Maginnis. 2016. “Nature-Based Solutions to Address Global Societal Challenges.” Gland, Switzerland: international Union for Conservation of Nature (iUCN). https://portals.iucn.org/library/sites/library/files/documents/2016-036.pdf.
Coronel, L., and P. Zavala. 2014. “Guide and Practical Tool to Create a Water Fund: Lessons Learned and Experiences in Ecuador.” Quito, Ecuador: U.S. Agency for international Development (USAiD). http://pdf.usaid.gov/pdf_docs/PA00KNG1.pdf.
Costanza, R., O. Perez-Maqueo, M.L. Martinez, P. Sutton, S.J. Anderson, and K. Mulder. 2008. “The Value of Coastal Wetlands for Hurricane Protection.” A Journal of the Human Environment 37 (4). http://www.bioone.org/doi/pdf/10.1579/0044-7447%282008%2937%5B241%3ATVOCWF%5D2.0.CO%3B2.
CRED (Centre for Research on the Epidemiology of Disasters). 2017. “Natural Disasters 2017.” Brussels: CRED.
Credit Suisse and McKinsey & Co. 2016. “Conservation Finance From Niche to Mainstream.” Credit Suisse Group AG and McKinsey Center for Business and Environment.
Daniels, A.E., K. Bagstad, V. Esposito, A. Moulaert, and C.M. Rodriguez. 2010. “Understanding the impacts of Costa Rica’s PES: Are We Asking the Right Questions?” Ecological Economics, Special Section—Payments for Ecosystem Services: From Local to Global, 69 (11): 2116–26. doi:10.1016/j.ecolecon.2010.06.011.
DC Water. 2015. “Long Term Control Plan Modification for Green infrastructure.” https://www.dcwater.com/sites/default/files/green-infrastructure-ltcp-modificaitons.pdf.
DC Water. 2017a. “Combined Sewer System.” https://www.dcwater.com/css.
DC Water. 2017b. “Rock Creek Project A Green infrastructure Program: A Part of the DC Clean Rivers Project.” https://www.dcwater.com/sites/default/files/project/documents/2017%20Fall%20RCA%20Factsheet_Website.pdf.
De Zandmotor. 2018. “The Sand Engine.” The Sand Engine. 2018. http://www.dezandmotor.nl/en/home/.
Deltares. 2014. in Michel, J. 2014. “Oil Spills in Mangroves; Planning & Response Considerations.” Technical Report. Washington, DC.
Deltares, University of Miami, TU Delft, and UNESCO-iHE institute for Water Education. “XBeach.” http://oss.deltares.nl/web/xbeach/. Accessed November 7, 2018.
DHi. n.d. “MiKE FLOOD.” https://www.mikepoweredbydhi.com/products/mike-flood. Accessed November 7, 2018.
Dudley, N., and S. Alexander. 2017. “Global Land Outlook.” Bonn: United Nations Convention to Combat Desertification (UNCCD).
Echavarria, M. 2002. Financing Watershed Conservation: The FONAG Water Fund in Quito, Ecuador. London: Earthscan Publications.
EEA (European Environmental Agency). 2017. “Green infrastructure and Flood Management: Promoting Cost-Efficient Flood Risk Reduction via Green infrastructure Solutions.” Copenhagen: European Environmental Agency. https://www.eea.europa.eu/publications/green-infrastructure-and-flood-management/at_download/file.
EiB (European investment Bank). 2018. “Natural Capital Financing Facility: in a Nutshell.” European investment Bank. http://www.eib.org/products/blending/ncff/in-a-nutshell/index.htm.
Eller, C.B., A.L. Lima, and R.S. Oliveira. 2013. “Foliar Uptake of Fog Water and Transport Belowground Alleviates Drought Effects in the Cloud Forest Tree Species, Drimys Brasiliensis (Winteraceae).” New Phytologist 199 (1): 151–62. doi:10.1111/nph.12248.

127Integrating Green and Gray
Encalada, A., E. Suarez, J. Schrekinger, R. Arboleda, M.E. Sanchez, S. Benitez, M. Saenz, et al. 2015. “Case Study 2 FONAG.” in Bridging Theory and Practice for Hydrological Monitoring in Water Funds, edited by L. Bremer, A.L. Vogl, B. de Bievre, and P. Petry. Arlington, VA: The Nature Conservancy. http://www.naturalcapitalproject.org/wp-content/uploads/2015/11/Monitoring_Theory_to_Practice_full_30Nov2015.pdf.
Faivre, N., M. Fritz, T. Freitas, B. de Boissezon, and S. Vandewoestijne. 2017. “Nature-Based Solutions in the EU: innovating with Nature to Address Social, Economic and Environmental Challenges.” Environmental Research 159: 509–18. doi:10.1016/j.envres.2017.08.032.
FAO (Food and Agriculture Organization of the United Nations) and iTPS (intergovernmental Technical Panel on Soils). 2015. “Status of the World’s Soil Resources (SWSR)—Main Report.” Rome: FAO and iTPS.
Feltran-Barbieri, R., S. Ozment, P. Hamel, E. Gray, H. Mansur, T. Piazzetta Valente, J. Baladelli Ribeiro, et al. 2018. “Natural infrastructure in the Guandu Water System, Rio de Janeiro.” Sao Paulo, Brazil: World Resources institute-Brazil.
Filkova, M. 2018. “Bonds and Climate Change: The State of the Market 2018.” Climate Bonds initiative. https://www.climatebonds.net/files/reports/cbi_sotm_2018_final_01k-web.pdf.
Filoso, S., M.O. Bezerra, K.C. Weiss, and M.A. Palmer. 2017. “impacts of Forest Restoration on Water Yield: A Systematic Review.” PLOS One 12 (8): e0183210.
FONAFiFO (National Fund for Forest Finance). 2018. “PES Contracted Hectares by Year and Type.” FONAFiFO. http://www.fonafifo.go.cr/media/1388/gepsa-hectareascontratadas.pdf.
Foster, J., A. Lowe, and S. Winkelman. 2011. “The Value of Green infrastructure for Urban Climate Adaptation.” Washington, DC: Center for Clean Air Policy, 52.
Freeman iii, A.M., J.A. Herriges, and C.L. Kling. 2014. “The Measurement of Environmental and Resource Values Theory and Methods.” Third Edition. Washington, DC: Resources for the Future.
Gale, E.L., and M.A. Saunders. 2013. “The 2011 Thailand Flood: Climate Causes and Return Periods.” Weather 68 (9): 233–37. doi:10.1002/wea.2133.
Garcia, L.E., J.H. Matthews, D.J. Rodriguez, M. Wijnen, K.N. DiFrancesco, and P. Ray. 2014. Beyond Downscaling—A Bottom-up Approach to Climate Adaptation for Water Resources Management. Washington, DC: World Bank Group.
Gartner, T., and J. Matthews. 2018. Forests and Wetlands Are Water Infrastructure. New Green Bond Helps Finance Their Protection (blog). May 22. https://www.wri.org/blog/2018/05/forests-and-wetlands-are-water-infrastructure-new-green-bond-helps-finance-their.
Gartner, T., J. Mulligan, R. Schmidt, and J. Gunn. 2013. “Natural infrastructure: investing in Forested Landscapes for Source Water Protection in the United States.” Washington, DC: World Resources institute. https://www.wri.org/sites/default/files/wri13_report_4c_naturalinfrastructure_v2.pdf.
Goldman Sachs, DC Water, and Calvert Foundation. n.d. “FACT SHEET: DC Water Environmental impact Bond.” http://www.goldmansachs.com/media-relations/press-releases/current/dc-water-environmental-impact-bond-fact-sheet.pdf. Accessed November 7, 2018.
Graaf, M. de, L. Buck, S. Shames, and R. Zagt. 2017. “Assessing Landscape Governance: A Participatory Approach.” Washington, DC: EcoAgriculture Partners. https://ecoagriculture.org/publication/assessing-landscape-governance-a-participatory-approach/.
Gray, E., S. Ozment, J. Altamirano, R. Feltran-Barbieri, and G. Morales. in review. “Green Gray Assessment: How to Assess the Costs and Benefits of Green investments for Water Supply Systems.” Working Paper. Washington, DC: World Resources institute.
Gray, E., and A. Srinidhi. 2013. “Watershed Development in india: Economic Valuation and Adaptation Considerations.” Washington, DC: World Resources institute, December. https://www.wri.org/sites/default/files/watershed_development_india.pdf.
Hack, J., M. Kosmus, H.J. Krauter, B. Weiskopf, and D. Somarriba. 2013. “Payments for Hydrological Ecosystem Services in the Gil González Watershed—a Public-Private-Partnership Case Study.” The Economics of Ecology and Biodiversity (TEEB). http://doc.teebweb.org/wp-content/uploads/2013/03/PES-in-Gil-Gonzales-Watershed-a-public-private-partnership-Nicaragua.pdf.
Haglund, E., J. Ndjeunga, L. Snook, and D. Pasternak. 2011. “Dry Land Tree Management for improved Household Livelihoods: Farmer Managed Natural Regeneration in Niger.” Journal of Environmental Management 92 (7): 1696–705. doi:10.1016/j.jenvman.2011.01.027.
Hall, J., and H. Harvey. 2009. “Decision Making under Severe Uncertainties for Flood Risk Management: A Case Study of info-Gap Robustness Analysis.” Proceedings of 8th international Conference on Hydroinformatics, Concepción, Chile, January 12–16. http://www.floodsite.net/html/partner_area/project_docs/T20-08-05-hic-infogap.pdf.

WRI.org 128
Hallegatte, S., C. Green, R.J. Nicholls, and J. Corfee-Morlot. 2013. “Future Flood Losses in Major Coastal Cities.” Nature Climate Change 3 (9): 802–6. doi:10.1038/nclimate1979.
Hamrick, K. 2016. “State of Private investment in Conservation 2016.” Washington, DC: Forest Trends. http://www.naturevesttnc.org/pdf/investing-in-Conservation-2016-full.pdf.
Haq, S.M.A. 2011. “Urban Green Spaces and an integrative Approach to Sustainable Environment.” Journal of Environmental Protection 02 (05): 601–8. doi:10.4236/jep.2011.25069.
High Level Panel on Water. 2018. “Making Every Drop Count: An Agenda for Water Action.” Outcome Document. https://sustainabledevelopment.un.org/content/documents/17825HLPW_Outcome.pdf.
Hove, H., J. Parry, and N. Lujara. 2011. “World Resources Report Case Study. Maintenance of Hydropower Potential in Rwanda Through Ecosystem Restoration.” World Resources Report Case Study. Washington, DC: World Resources institute. https://www.wri.org/sites/default/files /wrr_case_study_ecosystem_restoration_rwanda.pdf.
iDB. (inter-American Development Bank). 2018. “Latin American Water Funds Partnership.” https://www.iadb.org/en/sector/water-and-sanitation/founds-partnership/home.
iFRC (international Federation of Red Cross and Red Crescent Societies). 2011. “Mangrove Plantation in Viet Nam: Measuring impact and Cost Benefit.” Geneva: iFRC. http://www.ifrc.org/Global/Publications/disasters/reducing_risks/Case-study-Vietnam.pdf.
iiED (international institute for Environment and Development). 2018. “Nature-Based Solutions: Nature-Based Solutions Policy Platform.” http://www.nbspolicyplatform.org/adaptation-planning/adaptation-action-types/nature-based-actions/.
iWMi (international Water Management institute). 2010. “Water issue Brief: Managing Water for Rainfed Agriculture.” Colombo, Sri Lanka: iWMi. http://www.iwmi.cgiar.org/Publications/Water_issue_Briefs/PDF/Water_issue_Brief_10.pdf.
iWT (india Water Tool). 2015. “india Water Tool 2.1.” http://www.indiawatertool.in/.
James, L.A., and M.B. Singer. 2008. “Development of the Lower Sacramento Valley Flood-Control System: Historical Perspective.” Reston, VA: American Society of Civil Engineers. https://ascelibrary.org/doi/10.1061/%28ASCE%291527-6988%282008%299%3A3%28125%29.
Jenkins, M., G. Gammie, and J. Cassin. 2016. “Peru Approves New innovative Environmental Policies.” Forest Trends (blog). July 27. http://forest-trends.org/blog/2016/07/27/peru-approves-new-innovative-environmental-policies/.
Jha, A.K., R. Bloch, and J. Lamond. 2012. Cities and Flooding: A Guide to Integrated Urban Flood Risk Management for the 21st Century. Washington DC: World Bank Publications.
Kaboré, D., and C. Reij. 2004. The Emergence and Spreading of an Improved Traditional Soil and Water Conservation Practice in Burkina Faso. Vol. 114. Washington, DC: international Food Policy Research institute. http://www.ifpri.org/publication/emergence-and-spreading-improved-traditional-soil-and-water-conservation-practice.
Kala, C.P. 2017. “Environmental and Socioeconomic impacts of Drought in india: Lessons for Drought Management.” Science and Education 5 (2): 43–48.
Kale, E., and M. D’souza. 2014. “Adapting to Climate Variation through Crop Diversification.” LEISA India, March. https://www.wotr.org/sites/default/files/LEiSA-india-March-2014-Pages-26-28.pdf.
Kissinger, G. 2014. “Financing Strategies for integrated Landscape investments: Case Study Atlantic Forest, Brazil.” Washington, DC: EcoAgriculture Partners.
Lempert, R.J., S.C. Bankes, and S.W. Popper. 2003. Shaping the Next One Hundred Years: New Methods for Quantitative, Long-Term Policy Analysis. Santa Monica, CA: RAND Corporation. http://www.rand.org/pubs/monograph_reports/MR1626.html.
Lempert, R.J., and N. Kalra. 2011. “Managing Climate Risks in Developing Countries with Robust Decision Making.” Washington, DC: World Resources institute. http://www.rand.org/pubs/external_publications/EP201100254.html.
Li, X., G. Turner, and L. Jiang. 2012. “Grow in Concert with Nature: Sustaining East Asia’s Water Resources through Green Water Defense.” Washington, DC: World Bank. https://elibrary.worldbank.org/doi/abs/10.1596/978-0-8213-9588-2.
Li, X., J. Li, X. Fang, Y. Gong, and W. Wang. 2016. “Case Studies of the Sponge City Program in China.” Conference Paper. World Environmental and Water Resources Congress 2016, West Palm Beach, Florida, May 22–26. 295–308. doi:10.1061/9780784479858.031.
LiDC (Low impact Development Center). 2007. “Low impact Development Urban Design Tools.” Beltsville, MD: LiDC. https://www.lid-stormwater.net/.
Lopez, H. 2008. The Social Discount Rate: Estimates for Nine Latin American Countries. Policy Research Working Paper; No. 4639. Washington, DC: World Bank.
Luo, T., A. Maddocks, C. iceland, P. Ward, and H. Winsemius. 2015. “World’s 15 Countries with the Most People Exposed to River Floods.” Washington, DC: World Resources institute, March. http://www.wri.org/blog/2015/03/world%E2%80%99s-15-countries-most-people-exposed-river-floods.
129Integrating Green and Gray
McDonald, R., and D. Shemie. 2014. “Urban Water Blueprint: Mapping Conservation Solutions to the Global Water Challenge.” Washington, DC: The Nature Conservancy. http://water.nature.org/waterblueprint/#/section=overview&c=3:6.40265:-37.17773.
McDonald, R., K. Weber, J. Padowski, T. Boucher, and D. Shemie. 2016. “Estimating Watershed Degradation over the Last Century and its impact on Water-Treatment Costs for the World’s Large Cities.” Proceedings of the National Academy of Sciences 113 (32): 9117–22.
McKenney, B., and J. Wilkinson. 2015. “Achieving Conservation and Development: 10 Principles for Achieving the Mitigation Hierarchy.” Washington, DC: The Nature Conservancy.
MEA (Millennium Ecosystem Assessment Program), ed. 2005. Ecosystems and Human Well-Being: Synthesis. Washington, DC: island Press.
Minnesota Pollution Control Agency. 2017. “MiDS Calculator—Minnesota Stormwater Manual.” January 18. https://stormwater.pca.state.mn.us/index.php/MiDS_calculator.
Mohieldin, M. 2018. “Development and Disruptive Technology.” Washington, DC: World Bank. http://pubdocs.worldbank.org/en/871791519172227154/Development-and-Disruptive-Technology-UAE-University.pdf.
Momiy, F. 2018. “Natural infrastructure for Water Security.” Brochure. Forest Trends.
Moses, E. 2017. In India and Indonesia, Civil Society Groups Help Manage Critical Watersheds (blog). March 30. https://www.wri.org/blog/2017/03/india-and-indonesia-civil-society-groups-help-manage-critical-watersheds.
Mwangi, E., R. Meinzen-Dick, and Y. Sun. 2011. “Gender and Sustainable Forest Management in East Africa and Latin America.” Ecology and Society 16 (1). doi:10.5751/ES-03873-160117.
Narayan, S., M.W. Beck, B.G. Reguero, i.J. Losada, B. van Wesenbeeck, N. Pontee, J.N. Sanchirico, et al. 2016. “The Effectiveness, Costs and Coastal Protection Benefits of Natural and Nature-Based Defences.” PLOS One 11 (5): e0154735. doi:10.1371/journal.pone.0154735.
NASA (National Aeronautics and Space Administration). 2017. “SMAP—Soil Moisture Active Passive.” http://www.nasa.gov/smap.
Nesshöver, C., T. Assmuth, K.N. irvine, G.M. Rusch, K.A. Waylen, B. Delbaere, D. Haase, L. Jones-Walters, H. Keune, and E. Kovacs. 2017. “The Science, Policy and Practice of Nature-Based Solutions: An interdisciplinary Perspective.” Science of the Total Environment 579: 1215–27.
Niang, i., G. Nai, R. Folorunsho, M. Diop, M. Sow, D. Trawally, S. Faye, et al. 2012. “Guide on Adaptation Options in Coastal Areas for Decision-Makers.” Paris: UNESCO. http://unesdoc.unesco.org/images/0021/002166/216603E.pdf.
Nkonya, E., T. Johnson, H.Y. Kwon, and E. Kato. 2016. “Economics of Land Degradation in Sub-Saharan Africa.” in Economics of Land Degradation and Improvement—a Global Assessment for Sustainable Development, edited by E. Nkonya, A. Mirzabaev, and J. von Braun, 215–59. Heidelberg and New York: Springer, Cham. doi:10.1007/978-3-319-19168-3_9.
Noe, G.B., and C.R. Hupp. 2005. “Carbon, Nitrogen, and Phosphorus Accumulation in Floodplains of Atlantic Coastal Plain Rivers, USA.” Ecological Applications 15 (4): 1178–90.
OECD (Organisation for Economic Co-operation and Development). 2009. “Managing Water for All: An OECD Perspective on Pricing and Financing.” Paris: OECD.
OECD. 2018. “Financing Water: investing in Sustainable Growth.” Paris: OECD Environment Policy Paper No. 11.
Opperman, J. 2014. “A Flood of Benefits: Using Green infrastructure to Reduce Flood Risks.” Arlington, VA: The Nature Conservancy.
Opperman, J., G. Galloway, J. Fargione, J. Mount, B. Richter, and S. Secchi. 2009. “Sustainable Floodplains through Large-Scale Reconnection to Rivers.” Science Magazine, Policy Forum 326: 1487–88. doi:10.1126/science.1178256.
Ozment, S., K. DiFrancesco, and T. Gartner. 2015. “Natural infrastructure in the Nexus.” Nexus Dialogue Synthesis Paper. Gland, Switzerland: international Union for Conservation of Nature. doi:10.2305/iUCN.CH.2015.NEX.4.en.
Ozment, S., R. Feltran-Barbieri, P. Hamel, E. Gray, J. Baladelli Ribeiro, S. Barreto, T. Piazzetta Valente, et al. 2018. “Natural infrastructure in Sao Paulo’s Water System.” Washington, DC: World Resources institute.
Ozment, S., T. Gartner, H. Huber-Stearns, K. DiFrancesco, N. Lichten, and S. Tognetti. 2016. “Protecting Drinking Water at the Source: Lessons from Watershed investment Programs in the United States.” Washington, DC: World Resources institute. https://www.wri.org/sites/default/files/Protecting_Drinking_Water_at_the_Source.pdf.
Pagiola, S. 2008. “Payments for Environmental Services in Costa Rica.” Ecological Economics, 65 (4): 712–24. doi:10.1016/j.ecolecon.2007.07.033.

WRI.org 130
Pagiola, S. G. Platais, and M. Sossai. Forthcoming. “Protecting Natural Water infrastructure in Espirito Santo, Brazil.” Water Economics and Policy. Accepted October 2018. DOi: 10.1142/S2382624X18500273.
Palmieri, A., S. Farhed, G.W. Annandale, and A. Dinar. 2003. Reservoir Conservation. The RESCON Approach. Vol. 1. Washington, DC: The international Bank for Reconstruction and Development/World Bank. http://documents.worldbank.org/curated/en/819541468138875126/pdf/349540v10Reservoir0conservation0RESCON.pdf.
PBL (Netherlands Environmental Assessment Agency), Willem Ligtvoet, and Henk Hilderink. 2014. “Towards a World of Cities in 2050: An Outlook on Water-Related Challenges.” The Hague: PBL. http://www.pbl.nl/sites/default/files/cms/publicaties/PBL_2014_Towards%20a%20world%20of%20cities%20in%202050_1325_0.pdf.
PDEP (Pennsylvania Department of Environmental Protection). 2006. “Pennsylvania Stormwater BMP Manual.” Harrisburg, PA: PDEP. http://pecpa.org/wp-content/uploads/Stormwater-BMP-Manual.pdf.
Pittock, J., and M. Xu. 2010. “Controlling Yangtze River Floods: A New Approach.” World Resources Report. Washington, DC: World Resources institute. https://www.wri.org/our-work/project/world-resources-report/controlling-yangtze-river-floods-new-approach.
Poff, N.L., C.M. Brown, T.E. Grantham, J.H. Matthews, M.A. Palmer, C.M. Spence, R.L. Wilby, et al. 2016. “Sustainable Water Management under Future Uncertainty with Eco-Engineering Decision Scaling.” Nature Climate Change 6 25–34. https://www.nature.com/articles/nclimate2765.
Porras, i., D.N. Barton, M. Miranda, and A. Chacon-Cascante. 2013. “Learning from 20 Years of Payments for Ecosystem Services in Costa Rica.” London: international institute for Environment and Development. http://pubs.iied.org/16514iiED/.
Primavera, J.H., and J.M.A. Esteban. 2008. “A Review of Mangrove Rehabilitation in the Philippines: Successes, Failures and Future Prospects.” Wetlands Ecology and Management 16 (5): 345–58. doi:10.1007/s11273-008-9101-y.
Ranger, N., S. Hallegatte, S. Bhattacharya, M. Bachu, S. Priya, K. Dhore, F. Rafique, et al. 2011. “An Assessment of the Potential impact of Climate Change on Flood Risk in Mumbai.” Climatic Change 104 (1): 139–67. doi:10.1007/s10584-010-9979-2.
Ray, P.A., and C.M. Brown. 2015. Confronting Climate Uncertainty in Water Resources Planning and Project Design: The Decision Tree Framework. Washington, DC: World Bank Publications.
Reij, C., G. Tappan, and M. Smale. 2009. “Agroenvironmental Transformation in the Sahel: Another Kind of” Green Revolution.” Washington, DC: international Food Policy Research institute. https://core.ac.uk/download/pdf/6257709.pdf.
RfR (Room for the River). n.d. “Room for the River.” https://www.ruimtevoorderivier.nl/english/. Accessed November 7, 2018.
Rijkswaterstaat. 2013. “Sand Motor Fact Sheet: Pilot Project for Natural Coastal Protection.” http://www.dezandmotor.nl/uploads/2015/09/factsheet-zandmotor-delflandse-kust-eng-lr.pdf.
Rinkus, M.A., S.R. da C. Seixas, and T. Dobson. 2017. “‘Ninguém Me Chama’—‘Nobody Asked Me’: Gendered Patterns of Participation in Sea Turtle Conservation in Northeast Brazil.” Human Ecology 45 (4): 487–98. doi:10.1007/s10745-017-9914-5.
Rozenberg, J., M. Simpson, L. Bonzanigo, M. Bangalore, and L. Prasanga. 2015. “Wetlands Conservation and Management: A New Model for Urban Resilience in Colombo.” Washington, DC: World Bank Group. https://collaboration.worldbank.org/servlet/JiveServlet/downloadBody/21539-102-5-27686/final_report_wetlands_Colombo_mtdf.pdf.
Russo, M. 2008. “Sacramento River Flood Control Project Weirs and Flood Relief Structures.” Sacramento: State of California, Department of Water Resources. http://baydeltaconservationplan.com/Libraries/Dynamic_Document_Library/Fact_Sheet_-_Sac_River_System_Weirs_and_Relief_Structures.sflb.ashx.
Sachs, C., and M. Laudazi. 2009. “Module 10—Gender and Natural Resources Management.” in Gender in Agriculture Sourcebook. Washington, DC: World Bank, international Fund for Agricultural Development (iFAD), Food and Agriculture Organization (FAO). http://siteresources.worldbank.org/iNTGENAGRLiVSOUBOOK/Resources/Module10.pdf.
Sadoff, C.W., E. Borgomeo, and D. de Waal. 2017. “Turbulent Waters: Pursuing Water Security in Fragile Contexts.” Washington, DC: World Bank Group. https://openknowledge.worldbank.org/bitstream/handle/10986/26207/W16005.pdf?sequence=2&isAllowed=y.
Samuel, A., L. Crispino, D. Zade, S. Srivatsa, A. Phadtare, N. Gupta, and V. Raskar. 2015. “Watershed Development, Resilience and Livelihood Security: An Empirical Analysis.” Pune, india: WOTR (Watershed Organisation Trust). https://wotr.org/system/files/research_outputs/WSD,%20Resilience%20and%20Livelihood%20Security.pdf.
Sayers, P.B., G.E. Galloway, and J.W. Hall. 2012. “Robust Decision-Making under Uncertainty—towards Adaptive and Resilience Flood Risk Managment infrastructure.” in Flood Risk: Planning, Design and Management of Flood Defence Infrastructure, edited by P.B. Sayers. London: iCE Publishing. http://www.iwapublishing.com/template.cfm?name=isbn9781780404561.
131Integrating Green and Gray
Scholz-Barth, K. 2001. “Green Roofs: Stormwater Management from the Top Down.” Environmental Design & Construction 4 (1): 62-9.
SEAMA (Secretariat of Water and Environment for the State of Espírito Santo). 2018. “Avaliação das oportunidades da restauração de paisagens e florestas para o estado do espírito Santo, Brasil.” Vitória, Brazil: SEAMA.
Seastedt, T.R., R.J. Hobbs, and K.N. Suding. 2008. “Management of Novel Ecosystems: Are Novel Approaches Required?” Frontiers in Ecology and the Environment 6 (10): 547–53.
Shames, S., K. Heiner, and S. Scherr. 2017. “Public Policy Guidelines for integrated Landscape Management.” Washington, DC: EcoAgriculture Partners, 38.
Smalling, K.L., J.L. Orlando, and K.M. Kuivila. 2007. “Occurrence of Pesticides in Water, Sediment, and Soil from the Yolo Bypass, California.” San Francisco Estuary and Watershed Science 5 (1). https://escholarship.org/content/qt9716926g/qt9716926g.pdf?nosplash=3e54395fafe4c3dd81565c6e96307d7d.
Sommer, T.R., M.L. Nobriga, W.C. Harrell, W. Batham, and W.J. Kimmerer. 2001. “Floodplain Rearing of Juvenile Chinook Salmon: Evidence of Enhanced Growth and Survival.” Canadian Journal of Fisheries and Aquatic Sciences 58: 325–33. doi:https://doi.org/10.1139/f00-245.
Soz, S.A., J. Kryspin-Watson, and Z. Stanton-Geddes. 2016. “The Role of Green infrastructure Solutions in Urban Flood Risk Management.” Washington, DC: World Bank. https://openknowledge.worldbank.org/bitstream/handle/10986/25112/108291.pdf?sequence=4&isAllowed=y.
State Government of Sao Paulo. n.d. “Programa Nascentes: Proteção e restauração de mata ciliar.” http://www.ambiente.sp.gov.br/programanascentes/. Accessed November 7, 2018.
State of California. 2016. Source Watersheds: Financing. Assembly Bill-2480. Vol. AB-2480. https://leginfo.legislature.ca.gov/faces/billTextClient.xhtml?bill_id=201520160AB2480.
Strassburg, B.B., and A.E. Latawiec. 2014. “The Economics of Restoration: Costs, Benefits, Scale and Spatial Aspects.” Paper presented at the Convention on Biological Diversity, international institute for Sustainability, Linhares, Brazil, March. https://www.cbd.int/doc/meetings/ecr/cbwecr-sa-01/other/cbwecr-sa-01-iis-en.pdf.
Suding, K.N., K.L. Gross, and G.R. Houseman. 2004. “Alternative States and Positive Feedbacks in Restoration Ecology.” Trends in Ecology & Evolution 19 (1): 46–53.
Sutton-Grier, A.E., K. Wowk, and H. Bamford. 2015. “Future of Our Coasts: The Potential for Natural and Hybrid infrastructure to Enhance the Resilience of Our Coastal Communities, Economies and Ecosystems.” Environmental Science & Policy 51: 137–48.
Taal, M.D., M.A.M. Loffler, C.T.M. Vertegaal, J.W.M. Wijsman, L. Van der Valk, and P.K. Tonnon. 2016. “Development of the Sand Motor: Concise Report Describing the First Four Years of the Monitoring and Evaluation Programme (MEP).” Delft, the Netherlands: Deltares. http://www.dezandmotor.nl/uploads/2016/09/monitoring-and-evaluation-report-sand-motor-eng.pdf.
Talberth, J., E. Gray, L. Yonavjak, and T. Gartner. 2013. “Green versus Gray: Nature’s Solutions to infrastructure Demands.” The Solutions Journal 4 (1): 40–47.
Tercek, M., and M. Beck. 2017. “Mangroves: A Star Player in the Coastal Protection Game.” Conservancy Talk (blog). August 8. https://blog.nature.org/conservancy/2017/08/08/mangroves-a-star-player-in-the-coastal-protection-game/.
Thacher, T., D.R. Lee, and J. Schelhas. 1996. “Farmer Participation in Reforestation incentive Programs in Costa Rica.” Agroforestry Systems 35 (3): 269–89. doi:10.1007/BF00044458.
TNC (The Nature Conservancy). 2014. “Urban Water Blueprint.” http://water.nature.org/waterblueprint/#/intro=true.
TNC. 2016. “Coastal Resilience.” http://coastalresilience.org/approach/identify/.
TNC. 2018. “Water Funds Toolbox: Quito Water Fund (FONAG).” https://waterfundstoolbox.org/regions/latin-america/quito-water-fund.
UNEP (United Nations Environment Programme), iUCN (international Union for Conservation of Nature), TNC (The Nature Conservancy), WRi (World Resources institute), and U.S. Army Corps of Engineers. 2014. “Green infrastructure Guide for Water Management: Ecosystem-Based Management Approaches for Water-Related infrastructure Projects.” http://www.unepdhi.org/-/media/microsite_unepdhi/publications/documents/unep/web-unep-dhigroup-green-infrastructure-guide-en-20140814.pdf.
United Nations. 2014. “international Decade for Action ‘Water for Life’ 2005–2015. Focus Areas: Gender and Water.” http://www.un.org/waterforlifedecade/gender.shtml.
USACE (United States Army Corps of Engineers). n.d. “HEC-FDA.” http://www.hec.usace.army.mil/software/hec-fda/. Accessed November 7, 2018.
USDA (United States Department of Agriculture). 2016. “USDA Office of Environmental Markets.” https://www.fs.fed.us/ecosystemservices/OEM/.
USDA-ARS (USDA Agricultural Research Service), and Texas A&M AgriLife Research. 2018. “SWAT: Soil and Water Assessment Tool.” https://swat.tamu.edu/.
WRI.org 132
USEPA (United States Environmental Protection Agency). 2010. “Green infrastructure Case Studies: Municipal Policies for Managing Stormwater with Green infrastructure.” EPA-841-F-10-004. https://nepis.epa.gov/Exe/ ZyPDF.cgi/P100FTEM.PDF?Dockey=P100FTEM.PDF.
USEPA. 2014. “Storm Water Management Model (SWMM).” Data and Tools. USEPA. May 21. https://www.epa.gov/water-research/storm-water-management-model-swmm.
USEPA. 2015a. “District of Columbia Water and Sewer Authority, District of Columbia Clean Water Settlement.” Overviews and Factsheets. May 18. https://www.epa.gov/enforcement/district-columbia-water-and-sewer-authority-district-columbia-clean-water-settlement.
USEPA. 2015b. “Combined Sewer Overflows.” Overviews and Factsheets. Combined Sewer Overflows. October 13. https://www.epa.gov/npdes/combined-sewer-overflows-csos.
USEPA. 2016. “River Flooding.” https://www.epa.gov/sites/production/files/2016-08/documents/print_river-flooding-2016.pdf.
USEPA. 2017a. “Opti-Tool: EPA Region 1’s Stormwater Management Optimization Tool.” Overviews and Factsheets. July 11. https://www3.epa.gov/region1/npdes/stormwater/ma/opti-tool-fact-sheet.pdf.
USEPA. 2017b. “DC Water’s Environmental impact Bond: A First of its Kind.” U.S. EPA Water infrastructure and Resiliency Finance Center. https://www.epa.gov/sites/production/files/2017-04/documents/dc_waters_environmental_impact_bond_a_first_of_its_kind_final2.pdf.
USEPA. 2018a. “STEPL.” March 26. http://it.tetratech-ffx.com/steplweb/default.htm.
USEPA. 2018b. “System for Urban Stormwater Treatment and Analysis integration (SUSTAiN).” January 24. https://www.epa.gov/water-research/system-urban-stormwater-treatment-and-analysis-integration-sustain.
USFS (United States Forest Service). n.d. “FS WEPP interfaces.” https://forest.moscowfsl.wsu.edu/fswepp/. Accessed November 7, 2018.
USGS (United States Geological Survey). 2017. “National Assessment of Storm-induced Coastal Change Hazards.” https://coastal.er.usgs.gov/hurricanes/.
USGS. n.d. “GSFLOW: Coupled Groundwater and Surface-Water Flow Model.” https://water.usgs.gov/ogw/gsflow/. Accessed November 7, 2018.
Villarroya, A., A.C. Barros, and J. Kiesecker. 2014. “Policy Development for Environmental Licensing and Biodiversity Offsets in Latin America.” PLOS One 9 (9): e107144. doi:10.1371/journal.pone.0107144.
Waite, R., B. Kushner, M. Jungwiwattanaporn, E. Gray, and L. Burke. 2015. “Use of Coastal Economic Valuation in Decision Making in the Caribbean: Enabling Conditions and Lessons Learned.” Ecosystem Services 11: 45–55. doi:10.1016/j.ecoser.2014.07.010.
WAVES (Wealth Accounting and the Valuation of Ecosystem Services Partnership). 2016. “Managing Coasts with Natural Solutions: Guidelines for Measuring and Valuing the Coastal Protection Services of Mangroves and Coral Reefs.” Washington, DC: World Bank.
WBCSD (World Business Council for Sustainable Development). 2017. “incentives for Natural infrastructure: Review of Existing Policies, incentives and Barriers Related to Permitting, Finance and insurance of Natural infrastructure.” Geneva: WBCSD.
World Bank. 2007a. “Poland—Odra River Basin Flood Protection Project (ORFPP).” Project Appraisal Document 31771-PL. Washington, DC: World Bank Group. http://documents.worldbank.org/curated/en/552201468145748680/pdf/31771.pdf.
World Bank. 2007b. “China—Water Conservation Project (English).” Washington, DC: World Bank Group. http://documents.worldbank.org/curated/en/632171468019260971/pdf/iCR0000191.pdf.
World Bank. 2012. “Sri Lanka—Metro Colombo Urban Development Project.” Project Appraisal Document. Washington, DC: World Bank Group. http://documents.worldbank.org/curated/en/416991468101364610/pdf/662580PAD0Box30official0use0only090.pdf.
World Bank. 2014. “Brazil—Espirito Santo integrated Sustainable Water Management Project.” Project Appraisal Document P130682. Washington, DC: World Bank Group. http://documents.worldbank.org/curated/en/789111468015871663/pdf/804430PAD0P130010Box382166B00OUO090.pdf.
World Bank. 2015a. “Poland—Odra-Vistula Flood Management Project (OVFMP).” Project Appraisal Document PAD1203. Washington, DC: World Bank Group. http://documents.worldbank.org/curated/en/320251467986305800/pdf/PAD1203-PAD-P147460-R2015-0142-1-Box391498B-OUO-9.pdf.
World Bank. 2015b. “Somali—Water for Agro-Pastoral Livelihoods Pilot Project: Environmental and Social Management Framework (English).” Environmental Assessment. Washington, DC: World Bank Group. http://documents.worldbank.org/curated/en/193621468294982176/pdf/E48070P152024000Box391426B00PUBLiC0.pdf.
133Integrating Green and Gray
World Bank. 2016a. “World Bank Group Climate Change Action Plan.” Washington, DC: World Bank Group. http://pubdocs.worldbank.org/en/677331460056382875/WBG-Climate-Change-Action-Plan-public-version.pdf.
World Bank. 2016b. “Vietnam—Mekong Delta integrated Climate Resilience and Sustainable Livelihoods Project (English).” Project Appraisal Document. Washington, DC: World Bank Group. http://documents.worldbank.org/curated/en/840701467996680631/pdf/PAD1610-PAD-P153544-iDA-R2016-0110-1-Box394889B-OUO-9.pdf.
World Bank. 2017a. “implementing Nature-Based Flood Protection: Principles and implementation Guidance.” Washington, DC: World Bank. http://documents.worldbank.org/curated/en/739421509427698706/implementing-nature-based-flood-protection-principles-and-implementation-guidance.
World Bank. 2017b. “Natural Hazards—Nature-Based Solutions.” Project Platform. Washington, DC: World Bank Group. https://naturebasedsolutions.org/.
World Bank. 2017c. “World Bank Environmental and Social Framework.” World Bank Group. http://pubdocs.worldbank.org/en/837721522762050108/Environmental-and-Social-Framework.pdf#page=81&zoom=80.
World Bank. 2017d. “Somalia Emergency Drought Response and Recovery Project (SEDRPP).” Project Appraisal Document PAD2425. Washington, DC: World Bank Group. http://documents.worldbank.org/curated/en/683581495802767249/pdf/Project-Appraisal-Document-PAD-P163830-2017-05-22-CLEAN-05232017.pdf.
World Bank. 2017e. “China—Second Water Conservation Project (English).” Washington, DC: World Bank Group. http://documents.worldbank.org/curated/en/528541514907606963/pdf/iCR00004275-rvsd-12182017.pdf.
World Bank. 2018. “Sustainable Development.” Washington, DC: World Bank Group. http://www.worldbank.org/en/topic/sustainabledevelopment.
World Bank. Forthcoming. “Action Plan on Climate Change Adaptation and Resilience: Managing Climate Risks for a More Resilient Future” Washington, DC: World Bank Group.
World Bank. n.d. (a). “Maximizing Finance for Development (MFD).” Washington, DC: World Bank Group. http://www.worldbank.org/en/about/partners/maximizing-finance-for-development. Accessed November 7, 2018.
World Bank. n.d. (b). “Projects & Operations: Odra River Basin Floor Protection.” http://projects.worldbank.org/P086768/odra-river-basin-flood-protection?lang=en&tab=overview. Accessed November 7, 2018.
World Bank. n.d. (c). “Projects & Operations: Odra-Vistula Flood Management Project.” Washington, DC: World Bank Group. http://projects.worldbank.org/P147460?lang=en. Accessed November 7, 2018.
World Bank. n.d. (d). “Projects & Operations: Somalia Emergency Drought Response and Recovery Project.” Washington, DC: World Bank Group. http://projects.worldbank.org/P163830?lang=en. Accessed November 7, 2018.
World Bank. n.d. (e). “Projects & Operations: Water for Agropastoral Livelihoods Pilot Project.” Washington, DC: World Bank Group. http://projects.worldbank.org/P152024?lang=en. Accessed November 7, 2018.
WRG (2030 Water Resources Group). 2009. “Charting Our Water Future: Economic Frameworks to inform Decision-Making.” Washington, DC: 2030 Water Resources Group. https://www.mckinsey.com/~/media/mckinsey/dotcom/client_service/sustainability/pdfs/charting%20our%20water%20future/charting_our_water_future_full_report_.ashx.
WRi (World Resources institute). 2008. “Roots of Resilience: Growing the Wealth of the Poor: Ownership—Capacity—Connection.” World Resources Report. Washington, DC: World Resources institute.
WRi. 2013. “Aqueduct Water Risk Atlas/World Resources institute.” http://www.wri.org/resources/maps/aqueduct-water-risk-atlas.
WRi. 2015. “Aqueduct Global Flood Analyzer/World Resources institute.” March. http://www.wri.org/resources/maps/aqueduct-global-flood-analyzer.
WRi. 2016. “Global Forest Watch Water.” http://water.globalforestwatch.org/.
WWAP (United Nations World Water Assessment Program)/UN-Water. 2018. The United Nations World Water Development Report 2018: Nature-Based Solutions for Water. Paris: UNESCO. http://unesdoc.unesco.org/images/0026/002614/261424e.pdf.
Yamba, B., M. Larwanou, A. Hassane, and C. Reij. 2005. “Niger Study: Sahel Pilot Study Report.” Washington, DC: U.S. Agency for international Development and international Resources Group.

WRI.org 134
ABOUT WRiWorld Resources institute is a global research organization that turns big ideas into action at the nexus of environment, economic opportunity, and human well-being.
Our Challenge
Natural resources are at the foundation of economic opportunity and human well-being. But today, we are depleting Earth’s resources at rates that are not sustainable, endangering economies and people’s lives. People depend on clean water, fertile land, healthy forests, and a stable climate. Livable cities and clean energy are essential for a sustainable planet. We must address these urgent, global challenges this decade.
Our Vision
We envision an equitable and prosperous planet driven by the wise management of natural resources. We aspire to create a world where the actions of government, business, and communities combine to eliminate poverty and sustain the natural environment for all people.
Our Approach
COUNT iT
We start with data. We conduct independent research and draw on the latest technology to develop new insights and recommendations. Our rigorous analysis identifies risks, unveils opportunities, and informs smart strategies. We focus our efforts on influential and emerging economies where the future of sustainability will be determined.
CHANGE iT
We use our research to influence government policies, business strategies, and civil society action. We test projects with communities, companies, and government agencies to build a strong evidence base. Then, we work with partners to deliver change on the ground that alleviates poverty and strengthens society. We hold ourselves accountable to ensure our outcomes will be bold and enduring.
SCALE iT
We don’t think small. Once tested, we work with partners to adopt and expand our efforts regionally and globally. We engage with decision-makers to carry out our ideas and elevate our impact. We measure success through government and business actions that improve people’s lives and sustain a healthy environment.
PHOTO CREDiTSCover photo Atelierdreiseitl; table of contents Kelly Fike/USFWS; foreword ian; pp. 2, 12, 26, 60, 72, 84, 114, 118 World Bank; p. 40 Roots, Tubers & Bananas; p. 50 Marizilda Cruppe/ WRi Brasil; p. 80 GFDRR/World Bank Disaster Risk Management; p. 88 Vilseskogen; p. 90 Agência Brasília; p. 94 Zandmotor; p. 96 -JvL-; p. 100 Robert-Couse-Baker; p. 102 Francisco Anzola; p. 106 DeepRoot; p. 108 Explore Sri Lanka; p. 112 Diego Delso; p. 120 CiFOR.
135Integrating Green and Gray
Copyright 2019 World Bank and World Resources institute. This work is licensed under the Creative Commons Attribution 4.0 international License. To view a copy of the license, visit http://creativecommons.org/licenses/by/4.0/. The material in this work is subject to copyright. Because The World Bank encourages dissemination of its knowledge, this work may be reproduced, in whole or in part, for noncommercial purposes as long as full attribution to this work is given. Please cite the work as follows: Browder, G. S. Ozment, i. Rehberger Bescos, T. Gartner, and G-M Lange. 2019. Integrating Green and Gray: Creating Next Generation Infrastructure. Washington, DC: World Bank and World Resources institute. Any queries on rights and licenses, including subsidiary rights, should be addressed to World Bank Publications, The World Bank Group, 1818 H Street NW, Washington, DC 20433, USA; fax: 202-522-2625; e-mail: [email protected].
Each World Resources institute report represents a timely, scholarly treatment of a subject of public concern. WRi takes responsibility for choosing the study topics and guaranteeing its authors and researchers freedom of inquiry. it also solicits and responds to the guidance of advisory panels and expert reviewers. Unless otherwise stated, however, all the interpretation and findings set forth in WRi publications are those of the authors.
Maps are for illustrative purposes and do not imply the expression of any opinion on the part of WRi, concerning the legal status of any country or territory or concerning the delimitation of frontiers or boundaries.
This work is a product of the staff of The World Bank with exter nal contributions. The findings, interpretations, and conclusions expressed in this work do not necessarily reflect the views of The World Bank, its Board of Executive Directors, or the governments they represent.
The World Bank does not guarantee the accuracy of the data included in this work. The boundaries, colors, denominations, and other information shown on any map in this work do not imply any judgment on the part of The World Bank concerning the legal status of any territory or the endorsement or acceptance of such boundaries.
To download this report, visit worldbank.org/water

WRI.org 136
10 G STREET NE SUiTE 800WASHiNGTON, DC 20002, USA+1 (202) 729-7600WWW.WRi.ORG iSBN 978-1-56973-955-6
1818 H STREET NW WASHiNGTON, DC 20433, USA +1 (202) 473 1000WWW.WORLDBANK.ORG