item 4: purpose of the workshop - dws
TRANSCRIPT

2015/07/24
1
PRESENTATION TITLE
Presented by:Name SurnameDirectorate
Date
CONTINUATION OF THE ALL TOWN RECONCILIATION STRATEGIES IN THE LIMPOPO PROVINCE
Strategies Steering Committee Workshop No. 2
DWS: National Water Resource PlanningTuesday, 21 July 2015Pietersburg Club, Polokwane
1
1 WELCOME AND INTRODUCTION OF MEMBERS T. Nditwani
2 ATTENDANCE AND APOLOGIES T. Nditwani
3 ACCEPTANCE OF AGENDA T. Nditwani
4 PURPOSE OF WORKSHOP T. Nditwani
5 ROLE OF THE STRATGIES STEERING COMMITTEE T. Nditwani
6 BACKGROUND OF THE STUDY T. Nditwani
7 UPDATING OF PRIORITY STRATEGIES: METHODOLOGY C Talanda
8 UPDATED PRIORITY STRATEGIES(Parallel Sessions) C Talanda /
L de Jager‐ Vhembe DM‐ Mopani DM
‐ Capricorn DM‐ Waterberg DM
9 REMAINDER OF THE STUDY PROGRAMME – PHASE 1 M. Esterhuizen
10 WAY FORWARD T. Nditwani
11 GENERAL T. Nditwani
12 DATE OF THE NEXT MEETING AND CLOSURE T. Nditwani
13 LUNCH ALL
Agenda
2
Item 4: Purpose of the Workshop
3
Item 4: Purpose of the Workshop• SSC Workshop No. 1 held in April 2013:
– To introduce the study to all Stakeholders (SH)– To establish and define the role of the Strategies Steering Committee (SSC)
– Facilitate cooperation and interaction with the SH’s – To outline findings during the Inception Phase– To outline the scope of work, methodology, way forward and preliminary study programme
– To obtain comments and input from SH’s – To prioritise the strategies to be updated
4

2015/07/24
2
Item 4: Purpose of the Workshop• Purpose of this SSC Workshop No. 2:
– Present methodology for updating strategies– Present the updated reconciliation strategies that were prioritised in the SSC Workshop 1
– Agree on the preferred development scenarios– Obtain comments and inputs from the SSC– Way forward
5
Item 5: Role of Strategies Steering Committee (SSC)
6
Role of Strategies Steering Committee (SSC)
• SSC Terms of Reference (Information Pack)• Provide executive guidance to the direction and outcomes
of the study• Provide supplementary information and input from a local
and regional perspective• Facilitate strategic linkages with other initiatives• Disseminate information from the study to the relevant
organizations • Incorporate strategies’ recommendations into
development plans such as WSDP’s, IDP’s, Implementation Readiness Studies (RBIG), License Applications etc.
• To facilitate the acceptance and sign‐off of the updated Reconciliation Strategies
7
Item 6: Background of the Study
8

2015/07/24
3
Background to This Assignment• 2007: Development of Reconciliation Strategies for All
Towns• Key general messages from All Town Studies (2007‐2011)
– Improved management will solve largest portion of immediate problems
– Minimal metering (limited water use records)– High per capita use in many towns pointing to WC/WDM potential
– Groundwater remains a feasible source of water for many towns
– Municipal infrastructure constraints rather than water resource availability limitations
– Rudimentary strategies – improvement required9
Background to this Assignment• 2012: Continuation of the DWS Planning Regions’ All
Town Reconciliation Strategies: Phase 1 – Update and review priority strategies ‐ three year appointment (until 2015)
10
DWS: NWRP ‐National Office
Northern Planning Region• PSP, SSC
Eastern Planning Region• PSP, SSC
Southern Planning Region• PSP, SSC
Central Planning Region• PSP, SSC
11 12

2015/07/24
4
Purpose of Study• This assignment is the first review and updating of
priority strategies– Budget constraints dictated that not all strategies can be reviewed and updated during this assignment
• On‐going process even after these studies end
• Assist DWS and Water Services Authorities (WSAs) to:– Update and revise priority strategies
• To remain technically relevant and sustainable– Reconcile water requirements and water resources (up to 2035)
– Identify areas requiring comprehensive Reconciliation Strategies
13
Purpose of Study cont.
• Assist DWS and WSAs (cont.):– Evaluation of interventions where shortfalls occur
• Management and/or infrastructure– Align strategies with known development planning processes
– Provide recommendations for the sustainable management of water resources
• Promote the use of strategies’ information in local, provincial and national planning environments
14
Study Communication & Process
15
All Towns Study
(Inception: 2012)
Products*
(Oct’12)
Inception and Information Collection
(Apr ’13)
Products*
Products*
All Towns Strategies (2015)
Final Updated Strategies
(Jul ’15)
(Aug ’15)
* Minutes, BID, Inception and Status Quo Reports
Inform
ation on DW
S Project
Web
site
RevisedStrategies
Technical Support and Study Management
SMT,Prioritisation
SSC 1
Approval ofStrategies & Sign Off
Draft Strategies(Priorities)
SSC 2
Progress feedback, validation & scenario development
Products*
Item 7: Updating Priority Strategies Methodology
16

2015/07/24
5
Prioritisation of Reconciliation Strategies
– Step 1: Identification of Category 4 strategies (towns currently in water balance deficit)
– Step 2: Eliminate towns where solutions are in an advance stage of planning or implementation (RBIG projects)
– Step 3: Add towns where RBIG or other processes are in an early stage of planning and can still be influenced by strategy recommendations
– Step 4: Add any other hot spot areas identified on a national, provincial or local strategic level
– Step 5: Final selection was confirmed at Strategy Steering Committee Workshop 1
17
Updating Priority Reconciliation Strategies
• Detailed assessment of strategies according to the following themes:– Demographics (Census 2011) & Economic Drivers, migration etc.
– Water requirements (importance of metering)– WC/WDM– Infrastructure (RBIG Projects)– Water resources
• Surface water (DWS Studies)• Groundwater (desktop investigations)
– Water quality
• Linkages with Recon Strategies for Large Systems18
Theoretical Water Requirements• Population allocated to each Level of Service (LOS) category
(Census 2011)
• Assumed Losses: Water Treatment =10%, Distribution = 10% (DWS Guidelines)
• Indirect usage for established towns
Category Dwelling TypeAverage Water Consumption
(l/capita/day)
1 Flats 226
2 Clusters 255
3
Single Residential
Low Income 101
4 Medium Income 189
5 High Income 304
6 Very High Income 442
7
Informal
Below RDP Level 12
8 RDP Level 40
9 Above RDP Level 80
19
Water Requirement Projections• Water Requirement projections derived
– Unit consumptions calibrated according to actual use (theoretical values used where no info available)
– Projected population per town (High Scenario)
– Estimated timing and extent of upgrading of water services (selected scenario)
20

2015/07/24
6
Water Requirement Projections• Scenario 1 (Established Town ‐mostly formal):
– LOS assumed to be at a minimum of Residential Low Income by 2025
– 5% increase in Residential Medium Income 2011 to 2025 and a further 6% increase by 2035 (total of 11%)
– 2.5% increase in Residential High Income from 2011 to 2025 and a further 3.3% increase by 2035 (total of 5.8%)
Category Dwelling Type
1 Flats
2 Clusters
3
Single
Residential
Low Income
4 Medium Income
5 High Income
6 Very High Income
7
Informal
Below RDP Level
8 RDP Level
9 Above RDP Level
21
• Scenario 2 (Town/Village ‐ formal and informal LOS):– LOS assumed to be at a minimum of Above RDP Level by 2025
– 5% increase in Residential Low Income 2011 to 2025 and a further 6% increase by 2035 (total of 11%)
– 2.5% increase in Residential Medium Income from 2011 to 2025 and a further 2.3% increase by 2035 (total of 4.8%)
Category Dwelling Type
1 Flats
2 Clusters
3
Single
Residential
Low Income
4 Medium Income
5 High Income
6 Very High Income
7
Informal
Below RDP Level
8 RDP Level
9 Above RDP Level
Water Requirement Projections
22
Water Requirement Projections• Scenario 3 (Village ‐mostly informal):
– LOS assumed to be at a minimum of RDP Level by 2025.
– 5% increase in Above RDP Level by 2011 to 2025 and a further 6.7% increase by 2035 (total of 11.7%)
Category Dwelling Type
1 Flats
2 Clusters
3
Single
Residential
Low Income
4 Medium Income
5 High Income
6 Very High Income
7
Informal
Below RDP Level
8 RDP Level
9 Above RDP Level
– 2.5% increase in Residential Low Income from 2011 to 2025 and a further 3% increase by 2035 (total of 5.5%)
23
Updating Priority Reconciliation Strategies cont.
• Compile water balance diagrams (up to 2035)• Identify potential development scenarios (management and infrastructure) for reconciliation of water requirements and water resources
24

2015/07/24
7
Importance of Metering
0.00
0.05
0.10
0.15
0.20
0.25
0.30
0.35
0.40
0.45
0.50
2011 2013 2015 2017 2019 2021 2023 2025 2027 2029 2031 2033 2035
Ann
ual R
equi
rem
ents
(m
illio
n m
3 /a)
Xikundu Weir Groundwater Development Allocation (Surface Water) Allocation (Groundwater)
WTP Capacity Low Scenario High Scenario Actual Use
Available Resource
Uncertainty
25
Item 8: Updated Strategies
26
27
Prioritised Strategies UpdatedDistrict
Municipality Local Municipality Strategy
Mopani
Greater Giyani
Giyani System A and B WSS
Combined Strategy: Giyani Cluster
Giyani System C WSSGiyani System D WSSGiyani System F1 WSSGiyani System F2 WSS
Greater Letaba Sekgosese GWS
Greater TzaneenModjadjiskloof SchemeThapane RWSTours RWS Scheme
Ba‐Phalaborwa Namakgale ‐ Lulekani RWS ClusterGreater Giyani Mapuve System N WSS Combined Strategy:
Malamulele West/Mapuve System N Cluster
Vhembe
Thulamela
Malamulele West WSSMalamulele West WSSMakhado Mapuve System RWSLambani ThulamelaTshifudi RWSNzhelele Thulamela RWS Combined Strategy: Nzhelele
ClusterMakhado
Nzhelele Makhado RWSMakhadoMiddle Letaba RWS
Musina Musina
28
Prioritised Strategies Updated
District Municipality Local Municipality Strategy
Capricorn
Blouberg Senwabarwana GWSMolemole Molemole West
Polokwane
Hout River RWSMoletje East RWSMoletje North GWSMoletje South GWSOlifants‐Sand RWS
Combined Strategy: Polokwane Cluster
Badimong RWSLaaste Hoop RWSMankweng RWSMothapo RWSSegwasi RWSSebayeng‐Dikgale RWSBoyne RWSChuene Maja RWSMolepo RWS
Waterberg Lephalale Lephalale Urban

2015/07/24
8
29
District Municipality Local Municipality Strategy
CapricornAganang
Aganang North RWSBakone RWSGa‐Mokobodi RWS
Lepele‐NkumpiGroothoek RWS,Specon RWS,Mphahlele RWS ClusterFlag Boshilo RWS West
Waterberg Mogalakwena
Greater Rebone RWSBakenberg RWSMapela RWSMokopane RWS
Sekhukhune Greater Tubatse
De Hoop ‐MalekanaDe Hoop ‐MampuruLower Steelpoort ‐MooihoekLower Steelpoort – North, East, PrakitseerLebaleloBurgersfortSteelpoort town
Strategies Addressed in ORWRDP Ph2
30
District Municipality Local Municipality Strategy
Sekhukhune
Makhuduthamaga
Flag Boshielo ‐Makhuduthamaga
De Hoop ‐Middle Ngwaritsi
De Hoop ‐ Vergelegen
De Hoop ‐ Ngwaritsi
De Hoop ‐ Lepellane
De Hoop ‐ Nkadimeng
De Hoop ‐ Schoonoord
De Hoop ‐ Nebo Plateau Mampur
De Hoop ‐ Spitskop
Leolo Local Sources
Fethakgomo
De Hoop ‐ Lepellane
Lebalelo North ‐ Fetakgomo
Olifantspoort South
Strategies Addressed in ORWRDP Ph2
31
MOPANI DMGreater Giyani LM
32

2015/07/24
9
33
Giyani Strategy
34
Giyani Strategy• Demographics (high growth): 179 008 (2011) – 201 721 (2035)
• Water sourced from Middle Letaba Dam, Nsami Dam and groundwater
• Water requirement projection (high growth):
• 2011 Theoretical: 6.780 million m3/a (18.563 Ml/d, 104 l/c/d)
• 2011: 14.281 million m3/a (39.099 Ml/d, 218 l/c/d) (GW :3.600 million m3/a, SW: 10.681 million m3/a)
• 2035: 19.853 million m3/a (54.355 Ml/d, 269 l/c/d)
Category Dwelling Type % Population per Category1 Flats 1%
13% Formal
2 Clusters 0%3
Single Residential
Low Income 8%4 Medium Income 2%5 High Income 2%
6 Very High Income1%
7Informal
Below RDP Level 38%87% Informal8 RDP Level 19%
9 Above RDP Level 30%
35
0
5
10
15
20
25
2011 2013 2015 2017 2019 2021 2023 2025 2027 2029 2031 2033 2035
Ann
ual R
equi
rem
ents
(m
illio
n m
3 /a)
Giyani WTW Capacity Utilised Equipped Boreholes Nandoni Transfer Groundwater Augmentation
Unutilised Equipped Boreholes Allocation (Surface Water) Allocation (Groundwater) WTW Capacity
Low Scenario High Scenario High Scenario with WCWDM Theoretical
Giyani Water Balance
Giyani WTW Capacity
Groundwater
High Scenario
Support from Nandoni Dam
Theoretical
High Scenario (incl. WC/WDM)
Unutilised Equipped Boreholes
36

2015/07/24
10
Total Middle Letaba and Nsami Dam (Middle Letaba RWS, Giyani and Malamulele West/Mapuve System N)
37
Giyani Conclusions & Recommendations• Water requirements already exceed the WTW capacity and groundwater
allocation (projected shortfall of 6.0 million m3/a (16.5 Ml/d by 2035)
• Projected water requirements for the total Middle Letaba and Nsami Dam supply area exceed the available resources from 2012 onwards. The following reconciliation measures are required:
• WC/WDM analysis confirmed savings of 2.8 million m3/a (7.8 Ml/d). WSA to implement measures specified in WC/WDM Strategy and BP
• Implementation of pipeline from Nandoni Dam to Giyani (5 million m3/a, 13.7 Ml/d))
• Pipeline to replace canal (4 million m3/a, 11.0 Ml/d))
• Supply from Nandoni Dam to committed areas (7.7 million m3/a)
• Groundwater Developments in supply areas (12.9 million m3/a, 35.3 Ml/d) ‐ Commission Feasibility Study
• Metering and monitoring of water use
• Continuous optimal utilisation of all resources
38
MOPANI DMGreater Letaba LM
39 40

2015/07/24
11
Sekgosese Cluster
41
• Water sourced from groundwater only (no metered information available)
• Water Requirement projection (high growth)• 2011 Theoretical: 0.496 million m3/a (1.36 Ml/d, 84 l/c/d)• 2035: 0.584 million m3/a (1.60 Ml/d, 95 l/c/d)
Sekgosese Cluster
Category Dwelling Type % Population per Category
1 Flats 0%
0% Formal
2 Clusters 0%3
Single Residential
Low Income 0%4 Medium Income 0%5 High Income 0%6 Very High Income 0%7
Informal
Below RDP Level 22%100%
Informal8 RDP Level 15%9 Above RDP Level 62%
• Demographics (high growth): 16 761 (2011) – 16 835 (2035)
42
Sekgosese Cluster Water BalanceWater balance before / after reconciliation options.
No Metered Records
43
• Projected water requirements does not exceed the available resources until at least 2035. The following reconciliation measures are required:
• Implement WC/WDM;
• Groundwater study to confirm resource availability
• Metering and monitoring of water use
• Infrastructure assessment to deliver committed volume
• Water use entitlements should be investigated and confirmed
Sekgosese Cluster
44

2015/07/24
12
MOPANI DMGreater Tzaneen LM
45 46
Tzaneen/Modjadjiskloof RWS Strategy
47
Tzaneen/Modjadjiskloof RWS StrategyChuene Maja RWS• Demographics (high growth): 32 911(2011) – 44 048(2035)
• Vergelegen/Magoebaskloof Dams (Politsi, Modjadjieskloof and Ga‐Kgapane), Ebenezer/Tzaneen Dam (Tzaneen) and groundwater
• Water requirement projection (high growth):
• 2011 Theoretical: 3.144 million m3/a (8.607 Ml/d, 261 l/c/d ) 2011: 4.857 million m³/a (13.297 Ml/d, 403 l/c/d)
(GW: 0.140, SW Blue Drop: 4.717 million m3/a)
• 2035: 6.868 million m3/a (18.803 Ml/d, 427 l/c/d)
Category Dwelling Type % Population per Category1 Flats 4
49% Formal
2 Clusters 53
Single Residential
Low Income 204 Medium Income 65 High Income 9
6 Very High Income8
7Informal
Below RDP Level 551% Informal8 RDP Level 3
9 Above RDP Level 43
48

2015/07/24
13
Magoebaskloof & Vergelegen Balance
49
Great Letaba System Balance(Irrigation, Industrial and Domestic (Siluwane-Nondweni Extended
RWS, Ritavi/Letaba RWS, Tzaneen/ Modjadjiskloof and Ritavi ll RWS))
50
• Projected water requirements exceed available water resources from 2014 onwards (1.964 million m3/a (5.4 Ml/d) shortfall 2035. The following reconciliation measures are required:
• WC/WDM savings in urban sector are 0.8 million m3/a (2.19 Ml/d). WSA to improve management information and implement measures specified in the WC/WDM Strategy and Business Plan
• Irrigation restriction policy/operating rule results in a 38% reduction below allocation
• Raising of Tzaneen Dam • Implementation of Nwamitwa Dam• Additional groundwater development (Commission Feasibility
Study) >2.5 million m3/a (6.85 Ml/d)• Metering and monitoring of water use
Tzaneen/Modjadjiskloof Conclusions and Recommendations
51
Thapane RWS Strategy
52

2015/07/24
14
Thapane RWS StrategyChuene Maja RWS• Demographics (high growth): 50 380 (2011) – 61 931 (2035)
• Water sourced from Thapane Dam & Groundwater.
• Water requirement projection (high growth):
• 2011 Theoretical: 1.048 million m3/a (2.868 Ml/d, 56 l/c/d ) 2011: 1.688 million m³/a (4.621 Ml/d, 92 l/c/d )
(GW :0.300 million m3/a, SW: 1.388 million m3/a)
• 2035: 3.257 million m3/a (8.917 Ml/d, 144 l/c/d)
Category Dwelling Type % Population per Category1 Flats 0%
0% Formal
2 Clusters 0%3
Single Residential
Low Income 0%4 Medium Income 0%5 High Income 0%
6 Very High Income 0%7
InformalBelow RDP Level 55%
100%Informa
l8 RDP Level 19%9 Above RDP Level 26%
53
Thapane RWS Water Balance
0.0
0.5
1.0
1.5
2.0
2.5
3.0
3.5
4.0
4.5
5.0
2005 2007 2009 2011 2013 2015 2017 2019 2021 2023 2025 2027 2029 2031 2033 2035
Ann
ual R
equi
rem
ents
(m
illio
n m
3 /a)
Ebenezer Groundwater New Groundwater Development
Middle Letaba System Support WTW Capacity High Scenario with WCWDM
High Scenario Theoretical
1 in 50 year yield (98% assurance)
Support from Nwamitwa Dam
Existing borehole capacity
Potable Groundwater Exploitation Potential
High Scenario
Theoretical Scenario
54
• Projected water requirements exceed available resources from 2012 (shortfall of 1.557 million m3/a (4.3 Ml/d) by 2035). The following reconciliation measures are required:
• WSA to improve management information and implement measures specified in the WC/WDM Strategy and Business Plan
• Development of additional groundwater resources (0.584 million m3/a, 1.6 Ml/d). Feasibility study required
• Support from the Groot Letaba System 0.254 million m3/a (0.7 Ml/d) in 2020 and 0.970 million m3/a (2.7 Ml/d) in 2035, once Nwamitwa Dam is commissioned (2020)
• Continuous optimal utilisation of all the existing water resources• Metering, monitoring, billing and revenue collection• No licenced water use registered in the WARMS database. Water use
entitlement should be investigated and confirmed
Thapane Conclusions and Recommendations
55
Tours RWS Strategy
56

2015/07/24
15
Tours RWS StrategyChuene Maja RWS• Demographics (high growth): 47 731(2011) – 61 128 (2035)
• Water sourced from Tours Dam & Groundwater
• Water requirement projection (high growth):
• 2011 Theoretical: 1.236 million m3/a (3.385 Ml/d, 68 l/c/d ) 2011: 2.922 million m³/a (8.000 Ml/d, 161 l/c/d)
(GW: Negligible, SW Blue Drop: 2.922 million m3/a)
• 2035: 5.223 million m3/a (14.300 Ml/d, 234 l/c/d)
Category Dwelling Type % Population per Category1 Flats 0%
0% Formal
2 Clusters 0%3
Single Residential
Low Income 0%4 Medium Income 0%5 High Income 0%
6 Very High Income 0%7
InformalBelow RDP Level 47%
100% Informal8 RDP Level 18%9 Above RDP Level 35%
57
0
1
2
3
4
5
6
7
2005 2007 2009 2011 2013 2015 2017 2019 2021 2023 2025 2027 2029 2031 2033 2035
Ann
ual R
equi
rem
ents
(m
illio
n m
3 /a)
Tours Dam Groundwater Groundwater Augmentation
Allocation (Surface Water) Allocation (Groundwater) WTW Capacity
High Scenario with WCWDM High Scenario Theoretical
Tours RWS Water Balance
1 in 50 year yield (98% assurance)
Groundwater (allocation)
Groundwater Augmentation
High Scenario (incl. Irrigation)
Theoretical Scenario (incl. Irrigation)
58
• Projected water requirements exceed available water resources from 2014 onwards (1.964 million m3/a (5.4 Ml/d) shortfall 2035. The following reconciliation measures are required:
• Preliminary WC/WDM analysis indicates 5% or 0.147 million m³/a (0.4 Ml/d) savings. WSA to Implement measures specified in the WC/WDM Strategy and Business Plan
• Development of additional groundwater resources (1.817 million m3/a, 5.0 Ml/d). Feasibility study required
• Other options only to be investigated once confirmed groundwater resources are fully developed
• Metering, monitoring, billing and revenue collection• 2012 DWS Blue Drop Assessments (WTW operating at 200% capacity) ‐
needs to be confirmed together with Tours WTW upgrading requirements
• No licenced water use registered in the WARMS database. Water use entitlement should be investigated and confirmed
Tours Conclusions and Recommendations
59
MOPANI DMBa‐Phalaborwa LM
60

2015/07/24
16
61
PHALABORWA - NAMAKGALE - LULEKANI RWS CLUSTER
62
PHALABORWA - NAMAKGALE - LULEKANI RWS CLUSTER
• Water sourced from Phalaborwa Barrage
• Water Requirement projection (high growth)• 2011 Theoretical: 7.237 million m3/a (19.82 Ml/d, 150 l/c/d)• 2011: 23.811 million m3/a (65.19 Ml/d, 494 l/c/d)• 2035: 25.697 million m3/a (70.35 Ml/d, 450 l/c/d)
Category Dwelling Type % Population per Category
1 Flats 1%
9% Formal
2 Clusters 0%3
Single Residential
Low Income 4%4 Medium Income 1%5 High Income 1%6 Very High Income 2%7
Informal
Below RDP Level 8%91%
Informal8 RDP Level 6%9 Above RDP Level 77%
• Demographics (high growth): 131 839 (2011) – 156 204 (2035)
63
PHALABORWA NAMAKGALE - LULEKANI RWS CLUSTER
Phalaborwa Barrage Yield (Risk Analysis) with following conditions:• First utilise incremental runoff in the Lower Olifants• Then request support from the Blyderivierspoort Dam if incremental
runoff is not sufficient• Then request support from the Flag Boshielo Dam / De Hoop Dam
when the above resources are insufficient.• The operation of the Olifants River System with regards to the
Ecological Water needs to be finalised
64

2015/07/24
17
• Projected water requirements do not exceed available resources until at least 2035. The following measures are required:
• WSA to implement WC/WDM
• Detailed operational analysis of Olifants River System to maximize yield. This should take into account Barrage Sedimentation
• Investigate extent of further re‐use by industrial consumers and feasibility into re‐use of treated effluent from WWTWs
• Groundwater Feasibility Study for the Olifants Catchment (DWS) to confirm groundwater development potential
• Water allocations to be aligned with projected water requirements
• Findings from this Strategy should be incorporated into the Continuation of the Olifants River Water Supply System Reconciliation Strategy
PHALABORWA - NAMAKGALE - LULEKANI RWS CLUSTER
65
VHEMBE DMThulamela LM
66
67
Malamulele West and Mapuve/System N RWS Strategy
68

2015/07/24
18
Malamulele West and Mapuve/System N RWS• Demographics (high growth): 76 092(2011) – 99 222(2035)
• Water sourced from Middle Letaba Dam & Groundwater; Nandoni Dam used from 2012
• Water requirement projection (high growth):
• 2011 Theoretical: 1.500 million m3/a (4.107 Ml/day, 54 l/c/d)
• 2011: 1.768 million m3/a (4.841 Ml/d, 64 l/c/d) to (GW :0.490 million m3/a, SW: 1.278 million m3/a)
• 2035: 2.787 million m3/a (7.625 Ml/d, 84 l/c/d)
Category Dwelling Type % Population per Category1 Flats 0%
0% Formal
2 Clusters 0%3
Single Residential
Low Income 0%4 Medium Income 0%5 High Income 0%
6 Very High Income 0%7
InformalBelow RDP Level 32%
100% Informal8 RDP Level 38%9 Above RDP Level 30%
69
Malamulele West and Mapuve/System N RWS
Mapuve WTW Capacity
Groundwater
High Scenario (incl. MW)
Groundwater Augmentation
Unutilised Equipped Boreholes
Theoretical (incl. MW)
High Scenario (excl. MW)
70
Total Middle Letaba and Nsami Dam (Middle Letaba RWS, Giyani and Malamulele West/Mapuve System N)
71
Malamulele West and Mapuve/System N RWS• Malamulele West/Mapuve System N Cluster (excl. Malamulele West)
water requirements do not exceed the available resources.
• The projected requirements for total Middle Letaba and Nsami Dam supply areas exceed the available resources from 2012 onwards. The following reconciliation measures are required:
• WC/WDM analysis confirmed savings of 2.8 million m3/a (7.8 Ml/d). Implement measures specified in the WC/WDM Strategy and BP
• Implementation of pipeline from Nandoni Dam to Giyani (5 million m3/a, 13.7 Ml/d)
• Pipeline to replace canal (4 million m3/a, 11.0 Ml/d)
• Supply from Nandoni Dam to committed areas (7.7 million m3/a)
• Groundwater Developments in supply areas (12.9 million m3/a, 35.3 Ml/d) ‐ Commission Feasibility Study
• Metering, monitoring, billing and revenue collection
• Continuous optimal utilisation of all resources after support from Nandoni Dam
72

2015/07/24
19
Lambani Regional Water Supply Strategy
73
Lambani RWS StrategyChuene Maja RWS• Demographics (high growth): 6 333 (2011) – 6 287 (2035)
• Allocation from Xikundu Weir in the Luvuvhu River (0.214 million m3/a) increased to 0.322 million m3/a (since Nandoni Dam)
• Water requirement projection (high growth):
• 2011 Theoretical: 0.100 million m3/a (0.274 Ml/d, 43 l/c/d ) 2011: 0.214 million m3/a (0.589 Ml/day, 93 l/c/d)
(SW: 0.214 million m3/a (historic record))
• 2035: 0.305 million m3/a (0.835 Ml/day, 133 l/c/d)
Category Dwelling Type % Population per Category1 Flats 0%
0% Formal
2 Clusters 0%3
Single Residential
Low Income 0%4 Medium Income 0%5 High Income 0%
6 Very High Income0%
7Informal
Below RDP Level 44%100% Informal8 RDP Level 54%
9 Above RDP Level 2%
74
Lambani RWS Water Balance
0.00
0.05
0.10
0.15
0.20
0.25
0.30
0.35
0.40
0.45
0.50
2011 2013 2015 2017 2019 2021 2023 2025 2027 2029 2031 2033 2035
Ann
ual R
equi
rem
ents
(m
illio
n m
3 /a)
Xikundu Weir Groundwater Development Allocation (Surface Water) Allocation (Groundwater)
WTP Capacity Low Scenario High Scenario Actual Use
75
Total Xikundu and Mingha Weir (Lambani Tshifudi and North Malamulele East clusters)
0.0
1.0
2.0
3.0
4.0
5.0
6.0
7.0
2011 2013 2015 2017 2019 2021 2023 2025 2027 2029 2031 2033 2035
Ann
ual R
equi
rem
ents
(m
illio
n m
3 /a)
Xikundu & Mhinga Weirs Groundwater Use Allocation (Surface Water) Allocation (Groundwater)WTP Capacity's High Scenario Low Scenario
76

2015/07/24
20
Lambani Conclusion & Recommendations• Projected water requirements do not exceed available resources
until at least 2035
• WSA to improve management information and implement recommended measures stated in the WC/WDM Strategy and Business Plan
• Groundwater investigations confirmed that noticeable resources could be developed. Feasibility study required (make additional water available in Nandoni Dam)
• Metering, monitoring, billing and revenue collection
• Assessment of infrastructure capabilities to deliver the total committed volume of water needs to be conducted
• Current allocation to be increased to water committed to area since implementation of Nandoni Dam
77
Tshifudi RWS Strategy
78
Tshifudi RWS Strategy
• Water sourced from Xikundu Weir (with allocations from Nandoni Dam) and Groundwater.
• Water Requirement projection (high growth)• 2011 Theoretical: 0.627 million m3/a (1.72 Ml/d, 61 l/c/d)• 2011: 1.125 million m3/a (3.08 Ml/d, 109 l/c/d)• 2035: 1.477 million m3/a (4.04 Ml/d, 121 l/c/d)
Category Dwelling Type % Population per Category
1 Flats 0%
0.00% Formal
2 Clusters 0%3
Single Residential
Low Income 0%4 Medium Income 0%5 High Income 0%6 Very High Income 0%7
Informal
Below RDP Level 24%100.00%
Informal8 RDP Level 65%9 Above RDP Level 11%
• Demographics (high growth): 28 337 (2011) – 33 391 (2035)
79
Tshifudi RWS Strategy Water Balance
80
2015/07/24
21
Total Xikundu and Mingha Weir (Lambani Tshifudi and North Malamulele East clusters)
0.0
1.0
2.0
3.0
4.0
5.0
6.0
7.0
2011 2013 2015 2017 2019 2021 2023 2025 2027 2029 2031 2033 2035
Ann
ual R
equi
rem
ents
(m
illio
n m
3 /a)
Xikundu & Mhinga Weirs Groundwater Use Allocation (Surface Water) Allocation (Groundwater)WTP Capacity's High Scenario Low Scenario
81
• The projected water requirements do no exceed the available resources until at least 2035. The following reconciliation measures are required:
• WSA to implement WC/WDM
• Metering, monitoring, billing and revenue collection
• Assess municipal infrastructure capabilities to deliver total committed volume of water to the Tshifudi Cluster
• Feasibility study to investigate developing available groundwater resources to make additional water allocations available in Nandoni Dam in future if required
Tshifudi RWS Conclusions and Recommendations
82
Nzhelele RWS Strategy
83
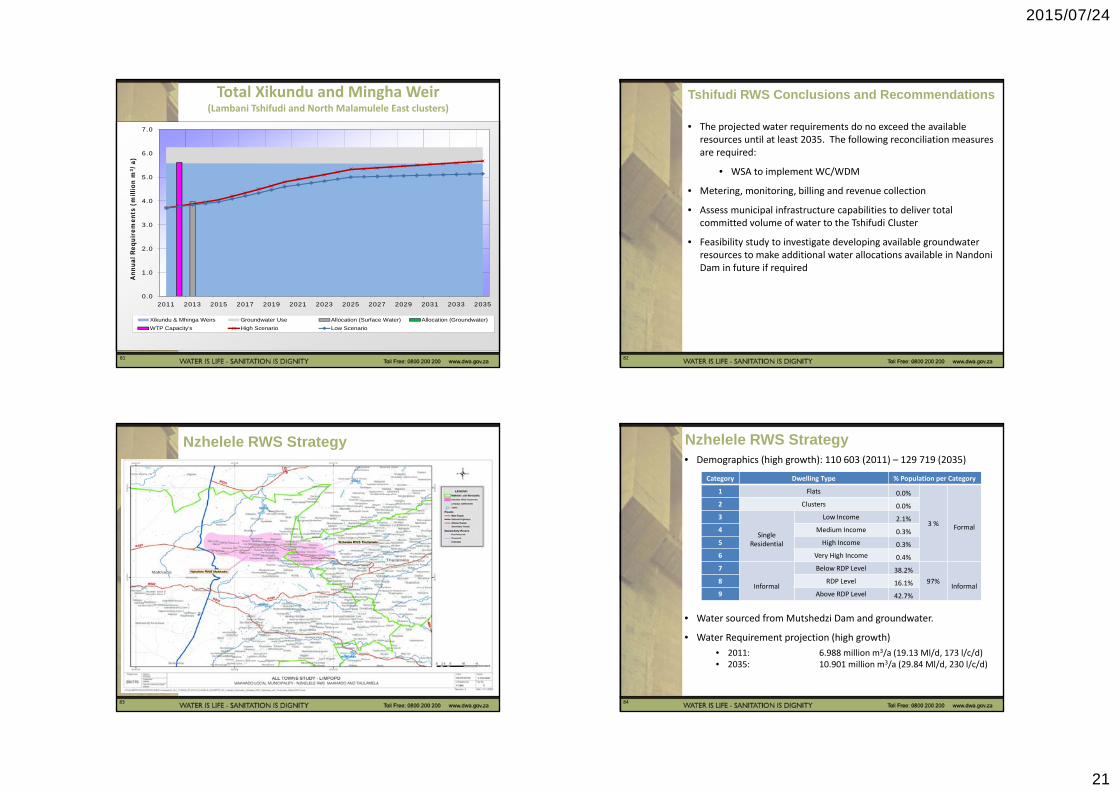
Nzhelele RWS Strategy
• Water sourced from Mutshedzi Dam and groundwater.
• Water Requirement projection (high growth)• 2011: 6.988 million m3/a (19.13 Ml/d, 173 l/c/d)• 2035: 10.901 million m3/a (29.84 Ml/d, 230 l/c/d)
Category Dwelling Type % Population per Category
1 Flats 0.0%
3 % Formal
2 Clusters 0.0%3
Single Residential
Low Income 2.1%4 Medium Income 0.3%5 High Income 0.3%6 Very High Income 0.4%7
Informal
Below RDP Level 38.2%97%
Informal8 RDP Level 16.1%9 Above RDP Level 42.7%
• Demographics (high growth): 110 603 (2011) – 129 719 (2035)
84

2015/07/24
22
Nzhelele RWS Strategy
85
• Projected water requirements exceed available resources from 2012. Shortfall of 4.472 million m3/a (12.24 Ml/d) by 2035. The following reconciliation measures are required:
• WSA to implement WC/WDM
• Undertake Groundwater Feasibility Study to confirm available groundwater resources
• Additional sources of water need to be investigated (after groundwater feasibility study has been completed). Potential to supply water from Nzhelele Dam by increasing the efficiency of irrigation from the dam, transferring water use entitlements if possible. Future water from Vondo Dam if Dam in Mutale Catchment is developed.
• Metering, monitoring, billing and revenue collection
• Assessment of municipal infrastructure capabilities
Nzhelele RWS Strategy
86
VHEMBE DMMakhado LM
87 88

2015/07/24
23
Makhado RWS Strategy
89
Makhado RWS Strategy• Demographics (high growth): 27 417 (2011) – 33 566(2035)
• Water sourced from Albasini Dam and groundwater
• Water requirement projection (high growth):
• 2011 Theoretical: 3.284 million m3/a (8.992 Ml/d, 328 l/c/d)
• 2011: 5.035 million m³/a (13.786 Ml/d, 503 l/c/d) (GW :1.200 million m3/a, SW: 3.835 million m3/a)
• 2035: 6.049 million m3/a (17.548 Ml/d, 523 l/c/d)
Category Dwelling Type % Population per Category1 Flats 6%
72% Formal
2 Clusters 2%3
Single Residential
Low Income 35%4 Medium Income 10%5 High Income 11%
6 Very High Income8%
7Informal
Below RDP Level 3%28% Informal8 RDP Level 1%
9 Above RDP Level 24%
90
0
1
2
3
4
5
6
7
8
2005 2007 2009 2011 2013 2015 2017 2019 2021 2023 2025 2027 2029 2031 2033 2035
Ann
ual R
equi
rem
ents
(m
illio
n m
3 /a)
Albisini Dam Groundwater Nandoi Support
Allocation (Surface Water) Allocation (Groundwater) Makhado & Nandoni WTW
High Scenario Theoretical High Scenario with WCWDM
Makhado RWS Water Balance
Makhado WTW Allocation
Groundwater
High ScenarioSupport from Nandoni Dam
TheoreticalHigh Scenario
(incl. WC/WDM)
91
0
2
4
6
8
10
12
14
16
2005 2007 2009 2011 2013 2015 2017 2019 2021 2023 2025 2027 2029 2031 2033 2035
Ann
ual R
equi
rem
ents
(m
illio
n m
3 /a)
Albisini Dam (1 in 50) Groundwater (Urb) Albisini Dam (1 in 20)Groudnwater (Irr) Nandoi Support Allocation (Surface Water)Allocation (Groundwater) Makhado & Nandoni WTW High Scenario (Urb+Irr)High Scenario (Urb) High Scenario (Urb+Irr) WC/WDM High Scenario (Urb) WC/WDM
Total Albasini Dam Balance
Albasini Dam (1 in 50)
Groundwater (Urb)
Urban & Irrigation
Support from Nandoni Dam Urban
Albasini Dam (1 in 20)
Groundwater (Irr)
92

2015/07/24
24
Makhado Conclusions & Recommendations• Makhado RWS requirements exceed allocated resources. Shortfall of
2.809 million m3/a (7.7 Ml/d) by 2035.
• For the total Albasini Dam supply area (incl. Albasini GWWS) the projected shortfall is 6.909 million m3/a (18.9 Ml/d) by 2035. The following reconciliation measures are required:
• Preliminary WC/WDM analysis confirmed potential savings of 1.454 million m3/a (3.981 Ml/d). The WSA must fully implement the recommended measures specified in the Strategy and Business Plan
• Implementation of the infrastructure to provide support from Nandoni Dam (3.819 million m3/a, 10.456 Ml/d)
• Reduction in upstream irrigation (GW and SW) to improve Albasini Dam yield
• Continuous optimal utilisation of all resources after support from Nandoni Dam
• Investigate feasibility of re‐use for irrigation parks/sport or industrial us
• Reregistered licenced water use needs to be investigated and confirmed. The water committed from Nandoni Dam also needs to be registered
93
Middle Letaba RWS Strategy
94
Middle Letaba RWS Strategy• Demographics (high growth): 296 036 (2011) ‐ 333 219 (2035)
• Water sourced from Middle Letaba Dam and groundwater
• Water requirement projection (high growth):
• 2011 Theoretical: 8.640 million m3/a (23.655 Ml/day, 80 l/c/d)
• 2011: 9.740 million m3/a (26.667 Ml/d, 90 l/c/d)(GW :3.770 million m3/a, SW: 5.970 million m3/a)
• 2035: 13.171 million m3/a (36.060 Ml/d, 108 l/c/d)
Category Dwelling Type % Population per Category1 Flats 0%
2% Formal
2 Clusters 0%3
Single Residential
Low Income 2%4 Medium Income 0%5 High Income 0%
6 Very High Income 0%7
InformalBelow RDP Level 29%
98% Informal8 RDP Level 29%9 Above RDP Level 39%
95
Middle Letaba RWS Strategy• Plans underway to support Elim/Vleifontein, Majosi Cluster
and Vyeboom Masia Clusters from the Nandoni Dam. However water requirements of all clusters need to be included in the water balance to confirm augmentation volumes
96

2015/07/24
25
0
5
10
15
20
25
2011 2013 2015 2017 2019 2021 2023 2025 2027 2029 2031 2033 2035
Ann
ual R
equi
rem
ents
(m
illio
n m
3 /a)
Middle Letaba WTW Capacity Utilised Equipped Boreholes Unutilised Equipped Boreholes Groundwater Augmentation
Allocation (Surface Water) Allocation (Groundwater) WTW Capacity Low Scenario
High Scenario Theoretical
Middle Letaba RWS Water Balance
Middle LetabaWTW Capacity
Groundwater
High Scenario (incl. MW)
Groundwater Augmentation
Unutilised Equipped Boreholes
Theoretical
97
Total Middle Letaba and Nsami Dam (Middle Letaba RWS, Giyani and Malamulele West/Mapuve System N)
98
Middle Letaba Conclusions & Recommendations• Middle Letaba water requirements do not exceed the available resources.
The projected requirements for total Middle Letaba and Nsami Dam supply areas exceed the available resources from 2012 onwards. The following reconciliation measures are required:
• WC/WDM analysis confirmed savings of 2.8 million m3/a (7.8 Ml/d). Implement measures specified in the WC/WDM Strategy and BP
• Implementation of pipeline from Nandoni Dam to Giyani (5 million m3/a, 13.7 Ml/d)
• Pipeline to replace canal between Middle Letaba and Nsami dams (4 million m3/a, 11.0 Ml/d)
• Supply from Nandoni Dam to committed areas (7.7 million m3/a , 21.10 Ml/d)
• Groundwater Developments in supply areas (12.9 million m3/a, 35.3 Ml/d) ‐ Commission Feasibility Study
• Metering, monitoring, billing and revenue collection
• Continuous optimal utilisation of all resources after support from Nandoni Dam
99
VHEMBE DMMusina LM
100

2015/07/24
26
101
Musina RWS Strategy
102
Musina RWS StrategyChuene Maja RWS• Demographics (high growth): 43 540 (2011) – 56 117 (2035)
• Water sourced from Limpopo River/Groundwater
• Water requirement projection (high growth):
• 2011 Theoretical: 4.019 million m3/a (11.005 Ml/d, 253 l/c/d ) 2011: 5.450 million m3/a (14.9 Ml/day, 343 l/c/d)
(SW: 5.450 million m3/a (historic record))
• 2035: 8.614 million m3/a (23.6 Ml/day, 362 l/c/d)
Category Dwelling Type % Population per Category1 Flats 6%
76% Formal
2 Clusters 1%3
Single Residential
Low Income 48%4 Medium Income 12%5 High Income 6%
6 Very High Income3%
7Informal
Below RDP Level 4%24% Informal8 RDP Level 0%
9 Above RDP Level 20%
103
0.0
1.0
2.0
3.0
4.0
5.0
6.0
7.0
8.0
9.0
10.0
11.0
2003 2005 2007 2009 2011 2013 2015 2017 2019 2021 2023 2025 2027 2029 2031 2033 2035
Ann
ual R
equi
rem
ents
(m
illio
n m
3 /a)
Year (Ending 31 October)
Total Yield Registered Water Use WTP CapacityHigh Scenario Requirements Low Scenario Requirements High Scenario with WCWDMActual Use WARMS Allocation
Musina RWS Water Balance
High Scenario
High Scenario (incl. WC/WDM)
WARMS Allocation Musina LM
IDP
104

2015/07/24
27
0
20
40
60
80
100
120
140
160
180
200
2010 2015 2020 2025 2030 2035 2040 2044
Water Req
uiremen
ts (m
illion m
3 /a)
Year
Zhove Dam Overabstracted Groundwater Groundwater harvest potentialNzhelele Dam allocation Total water requirements
Musina LM Water Balance (incl. Mutasshi/Musina Corridor)
Total Water Requirements
Nzhelele Dam Allocation
Groundwater Harvest Potential
Over abstracted Groundwater
Zhove Dam
105
• Musina is not experiencing a water resource shortfall assuming the allocated supply volume from the Limpopo River/Aquifer is sustainable within the broader context of the Limpopo River Basin (LIMCOM Limpopo River Basin Monograph study)
• Preliminary WC/WDM analysis indicates 10% or 0.632 million m³/a (1.73 Ml/d) savings. WSA to implement recommended measures stated in the WC/WDM Strategy and Business Plan
• DWS Limpopo WMA Reconciliation Strategy incorporated RBIG Feasibility Study for the Mutasshi/Musina Corridor BWS information and developed a water balance for the Musina LM. The following interventions are required :
• Groundwater abstraction exceeds the harvest potential. Groundwater feasibility study be conducted to confirm the total groundwater exploitation potential for the Musina LM.
• Augmentation from Zhove Dam on Umzingwane River (Zimbabwe). At least 30 million m3/a could be purchased from the ZINWA and it is recommended that negotiations should commence in this regard.
Musina Conclusions and Recommendations
106
• Actual water abstraction volumes to be recorded and registered
• Metering, monitoring, billing and revenue collection
• The licenced water use registration should be investigated and confirmed
Musina Conclusions and Recommendations
107
CAPRICORN DMBlouberg LM
108

2015/07/24
28
109
Senwabarwana GWS Strategy
110
Senwabarwana GWS Strategy
• Water sourced from groundwater
• Water Requirement projection (high growth)• 2011 Theoretical: 0.960 million m3/a (2.63 Ml/d, 154 l/c/d)• 2035: 1.543 million m3/a (4.22 Ml/d, 165 l/c/d)
Category Dwelling Type % Population per Category
1 Flats 4%
28% Formal
2 Clusters 1%3
Single Residential
Low Income 18%4 Medium Income 2%5 High Income 3%6 Very High Income 2%7
Informal
Below RDP Level 14%72%
Informal8 RDP Level 15%9 Above RDP Level 42%
• Demographics (high growth): 17 085 (2011) – 25 578 (2035)
111
Senwabarwana GWS Strategy
Maximum supply from Glen Alpine Dam
No Metered Records
Groundwater
Additional Future Groundwater
112

2015/07/24
29
• Projected water requirements exceed available resources from 2012. Shortfall of 0.799 million m3/a (2.19 Ml/d) by 2035. The following reconciliation measures are required:
• WSA to implement WC/WDM• Groundwater feasibility study to confirm exploitation potential• Augmentation from Glen Alpine Dam:
• DWS IRS 2014: Max allocation of 0.337 Mm3/a (0.92 Ml/d) to Cluster
• DWS Stand Alone Dams 2011: No surplus available . Study is required to confirm the available resources
• Additional water sources to be identified, once groundwater feasibility study and Glen Alpine study is concluded. This includes possible extension the ORWRDP Phase 2B (Flag Boshielo Dam) link to the Aganang LM, potential transfer of water use entitlements (pending agreement on policy and procedures) etc.
• Metering, monitoring, billing and revenue collection
• Infrastructure assessment to deliver total required volume
• Water use allocations need to be confirmed and brought in line with projected water requirements if required.
Senwabarwana GWS Strategy
113
CAPRICORN DMMolemole LM
114
115
Molemole West RWS Strategy
116

2015/07/24
30
Molemole West RWS Strategy
• Water sourced from groundwater.
• Water Requirement projection (high growth)• 2011 Theoretical: 1.334 million m3/a (3.65 Ml/d, 111 l/c/d)• 2035: 1.566 million m3/a (4.29 Ml/d, 129 l/c/d)
Category Dwelling Type % Population per Category
1 Flats 0%
8% Formal
2 Clusters 0%3
Single Residential
Low Income 5%4 Medium Income 1%5 High Income 1%6 Very High Income 1%7
Informal
Below RDP Level 20%92%
Informal8 RDP Level 12%9 Above RDP Level 61%
• Demographics (high growth): 32 887 (2011) – 33 126 (2035)
117
Maximum supply from Glen Alpine Dam
Molemole West RWS Strategy
No Metered Records
118
• Projected water requirements exceed available resources from 2012. Shortfall of 1.238 million m3/a (3.39 Ml/d) by 2035. The following reconciliation measures are required:
• WSA to implement WC/WDM• Groundwater feasibility study to confirm groundwater yield• Augmentation from Glen Alpine Dam:
• DWS IRS 2014: Max allocation of 0.337 Mm3/a (0.92 Ml/d) to Cluster
• DWS Stand Alone Dams 2011: No surplus available. Study is required to confirm the available resources
• Additional water sources to be identified, once groundwater feasibility study and Glen Alpine study is concluded. This includes possible extension the ORWRDP Phase 2B (Flag Boshielo Dam) link to the Aganang LM, potential transfer of water use entitlements (pending agreement on policy and procedures) etc.
• Meter installation programme
• Infrastructure assessment to deliver total required volume
• This Cluster’s water use allocations need to be confirmed and brought in line with projected water requirements if required
Molemole West RWS Strategy
119
CAPRICORN DMPolokwane LM
120

2015/07/24
31
121
Houtrivier RWS Strategy
122
Houtrivier RWS• Demographics (high growth): 31 442 (2011) – 37 421 (2035)
• Water sourced from Houtrivier Dam & Groundwater.
• Water requirement projection (high growth):
• 2011 Theoretical: 0.885 million m3/a (2.422 Ml/d, 77 l/c/d)
• 2011: 1.007 million m3/a (2.756 Ml/d, 88 l/c/d) (GW :0.483 million m3/a, SW: 0.584 million m3/a)
• 2035: 1.393 million m3/a (3.814 Ml/d, 121 l/c/d)
Category Dwelling Type % Population per Category1 Flats 0%
0% Formal
2 Clusters 0%3
Single Residential
Low Income 0%4 Medium Income 0%5 High Income 0%
6 Very High Income 0%7
InformalBelow RDP Level 26%
100% Informal8 RDP Level 18%9 Above RDP Level 56%
123
0.0
0.5
1.0
1.5
2.0
2.5
2005 2007 2009 2011 2013 2015 2017 2019 2021 2023 2025 2027 2029 2031 2033 2035A
nn
ual
Req
uir
emen
ts (
mill
ion
m3/
a)
Houtrivier Dam Groundwater Rehabilitation of Existing Boreholes Additional Groundwater Development Allocation (Surface Water) Allocation (Groundwater)WTW Capacity Low Scenario High ScenarioTheoretical
Houtrivier RWS Water Balance
Houtrivier Dam
Groundwater Augmentation
Rehabilitation of Existing Boreholes
Groundwater
124

2015/07/24
32
Houtrivier Conclusions & Recommendations
• Projected water requirements exceed available water resources from 2015 onwards. Shortfall of 0.326 million m3/a (0.892 Ml/d) by 2035. The following reconciliation measures are required:
• Conduct detailed WC/WDM analysis to confirm potential savings and identify WC/WDM measures
• Rehabilitation of existing boreholes (0.217 million m3/a, 0.6 Ml/d)
• Additional groundwater development (0.109 million m3/a. 0.3 Ml/d) . Conduct a feasibility study to confirm and develop additional groundwater resources augmentation and water quality
• Registration, metering and monitoring of boreholes required
• The yield of Houtrivier Dam needs to be confirmed
• Water allocations are unknown and need to be confirmed
125
Moletjie North RWS Strategy
126
Moletjie North RWS Water Balance• Demographics (high growth): 7 164(2011) – 8 366 (2035)
• Water sourced from Groundwater
• Water requirement projection (high growth):• 2011: 0.249 million m3/a (0.682 Ml/d, 95 l/c/d) • 2035: 0.317 million m3/a (0.868 Ml/d, 104 l/c/d)
Category Dwelling Type % Population per Category
1 Flats 0%
0% Formal
2 Clusters 0%3
Single Residential
Low Income 0%4 Medium Income 0%5 High Income 0%
6 Very High Income 0%7
InformalBelow RDP Level 10%
100% Informal8 RDP Level 11%9 Above RDP Level 79%
127
0.0
0.1
0.2
0.3
0.4
0.5
0.6
0.7
0.8
0.9
2005 2007 2009 2011 2013 2015 2017 2019 2021 2023 2025 2027 2029 2031 2033 2035A
nn
ual
Req
uir
emen
ts (
mill
ion
m3/a
)
Houtrivier Dam (Total Yield) Groundwater Rehabilitation of Existing Boreholes
Additional Groundwater Development Groundwater Development Potential Water Use Allocation (Groundwater)Low Scenario Theoretical Actual Use
Moletjie North RWS Water Balance
Groundwater
Rehabilitation of Existing Boreholes
Groundwater Augmentation
No Metered Records
128

2015/07/24
33
Moletjie East RWS Strategy
129
Moletjie East RWS• Demographics (high growth): 37 422 (2011) – 37 577
(2035)
• Water sourced from Groundwater
• Water requirement projection (high growth):• 2011: 1.067 million m3/a (2.923 Ml/d, 78 l/c/d)• 2035: 1.225 million m3/a (3.353 Ml/d, 89 l/c/d)
Category Dwelling Type % Population per Category1 Flats 0%
0% Formal
2 Clusters 0%3
Single Residential
Low Income 0%4 Medium Income 0%5 High Income 0%
6 Very High Income 0%7
InformalBelow RDP Level 16%
100% Informal8 RDP Level 44%9 Above RDP Level 40%
130
0.0
0.5
1.0
1.5
2.0
2.5
2005 2007 2009 2011 2013 2015 2017 2019 2021 2023 2025 2027 2029 2031 2033 2035
Ann
ual R
equi
rem
ents
(m
illio
n m
3 /a)
Chuene Dam Yield Groundwater Rehabilitation of Existing Boreholes
Additional Groundwater Development Water Use Allocation (Groundwater) Low Scenario
High Scenario Actual Use
Moletjie East RWS Water Balance
Groundwater
Rehabilitation of Existing Boreholes
Groundwater Augmentation
No Metered Records
131
Moletjie South RWS Strategy
132

2015/07/24
34
Moletjie South RWS• Demographics (high growth): 13 499 (2011) – 13 278
(2035)
• Water sourced from Groundwater
• Water requirement projection (high growth):• 2011: 0.546 million m³/a (1.495 Ml/d, 111 l/c/d) • 2035: 0.578 million m³/a (1.582 Ml/d, 120 l/c/d)
Category Dwelling Type % Population per Category1 Flats 0%
0% Formal
2 Clusters 0%3
Single Residential
Low Income 0%4 Medium Income 0%5 High Income 0%
6 Very High Income 0%7
InformalBelow RDP Level 6%
100% Informal8 RDP Level 7%9 Above RDP Level 87%
133
0.0
0.2
0.4
0.6
0.8
1.0
1.2
1.4
2005 2007 2009 2011 2013 2015 2017 2019 2021 2023 2025 2027 2029 2031 2033 2035
Ann
ual R
equi
rem
ents
(m
illio
n m
3 /a)
Groundwater Rehabilitation of Existing Boreholes Additional Groundwater Development GW Development PotentialWater Use Allocation (Groundwater) Actual UseLow Scenario High Scenario
Moletjie South RWS Water Balance
Groundwater
Rehabilitation of Existing Boreholes
Groundwater Augmentation
No Metered Records
134
Moletjie North, East, South RWS’s Conclusions & Recommendations
• The current water requirements exceed the available groundwater resources. Following reconciliation measures are required:
• Conduct detailed WC/WDM analysis to confirm potential savings and identify WC/WDM measures
• Rehabilitation of existing boreholes: North = 0.044 million m3/a (0.1 Ml/d), East = 0.380 million m3/a (1.0 Ml/d), South = 0.044 million m3/a (0.1 Ml/d)
• Additional groundwater development: North = 0.200 million m3/a (0.5 Ml/d), South = 0.297 million m3/a (0.8 Ml/d). A feasibility study to confirm and develop additional groundwater resources augmentation and water quality (treatment requirements)
• Current groundwater water use volume to be confirmed
• Registration, metering and monitoring of boreholes required
• Water allocations are unknown and need to be confirmed135
Chuene Maja RWS Strategy
136
2015/07/24
35
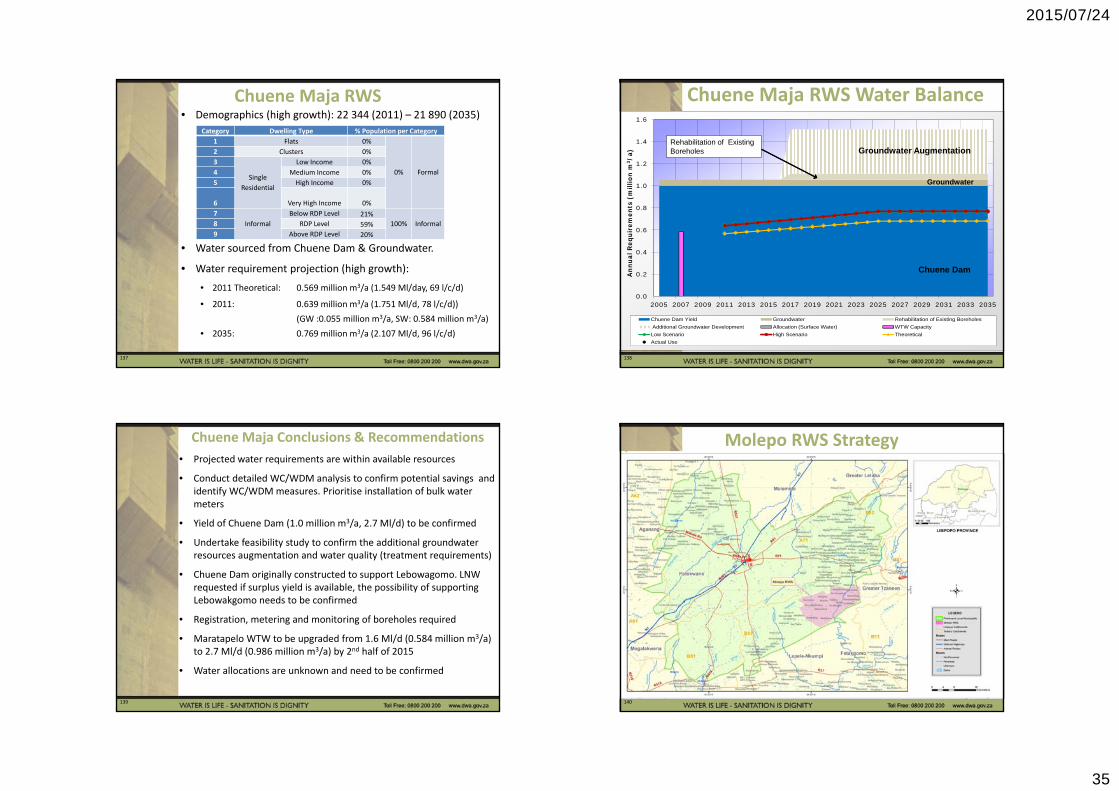
Chuene Maja RWS• Demographics (high growth): 22 344 (2011) – 21 890 (2035)
• Water sourced from Chuene Dam & Groundwater.
• Water requirement projection (high growth):
• 2011 Theoretical: 0.569 million m3/a (1.549 Ml/day, 69 l/c/d)
• 2011: 0.639 million m3/a (1.751 Ml/d, 78 l/c/d)) (GW :0.055 million m3/a, SW: 0.584 million m3/a)
• 2035: 0.769 million m3/a (2.107 Ml/d, 96 l/c/d)
Category Dwelling Type % Population per Category1 Flats 0%
0% Formal
2 Clusters 0%3
Single Residential
Low Income 0%4 Medium Income 0%5 High Income 0%
6 Very High Income 0%7
InformalBelow RDP Level 21%
100% Informal8 RDP Level 59%9 Above RDP Level 20%
137
0.0
0.2
0.4
0.6
0.8
1.0
1.2
1.4
1.6
2005 2007 2009 2011 2013 2015 2017 2019 2021 2023 2025 2027 2029 2031 2033 2035
Ann
ual R
equi
rem
ents
(m
illio
n m
3 /a)
Chuene Dam Yield Groundwater Rehabilitation of Existing Boreholes Additional Groundwater Development Allocation (Surface Water) WTW CapacityLow Scenario High Scenario TheoreticalActual Use
Chuene Maja RWS Water Balance
Chuene Dam
Groundwater
Rehabilitation of Existing Boreholes Groundwater Augmentation
138
Chuene Maja Conclusions & Recommendations• Projected water requirements are within available resources
• Conduct detailed WC/WDM analysis to confirm potential savings and identify WC/WDM measures. Prioritise installation of bulk water meters
• Yield of Chuene Dam (1.0 million m3/a, 2.7 Ml/d) to be confirmed
• Undertake feasibility study to confirm the additional groundwater resources augmentation and water quality (treatment requirements)
• Chuene Dam originally constructed to support Lebowagomo. LNW requested if surplus yield is available, the possibility of supporting Lebowakgomo needs to be confirmed
• Registration, metering and monitoring of boreholes required
• Maratapelo WTW to be upgraded from 1.6 Ml/d (0.584 million m3/a) to 2.7 Ml/d (0.986 million m3/a) by 2nd half of 2015
• Water allocations are unknown and need to be confirmed
139
Molepo RWS Strategy
140

2015/07/24
36
Molepo RWS• Demographics (high growth): 21 466 (2011) – 20 919 (2035)
• Water sourced from Molepo Dam & Groundwater
• Water requirement projection (high growth):• 2011 Theoretical: 0.497 million m3/a (1.361 Ml/d, 63 l/c/d)
• 2011: 0.989 million m3/a (2.709 Ml/d, 126 l/c/d) (GW :0.237 million m3/a, SW: 0.752 million m3/a)
• 2035: 1.154 million m3/a (3.159 Ml/d, 147 l/c/d)
Category Dwelling Type % Population per Category1 Flats 0%
0% Formal
2 Clusters 0%3
Single Residential
Low Income 0%4 Medium Income 0%5 High Income 0%
6 Very High Income 0%7
InformalBelow RDP Level 22%
100% Informal8 RDP Level 49%9 Above RDP Level 29%
141
Molepo RWS Water Balance
Molepo Dam 1 in 50 year yield (DWS Stand Alone Dams Study)
Groundwater
Rehabilitation of Existing Boreholes
Groundwater Augmentation
142
Molepo Conclusions & Recommendations• Projected water requirements do not exceed the available resources
• Conduct detailed WC/WDM analysis to confirm potential savings and identify WC/WDM measures. Prioritise installation of bulk water meters
• Registration, metering and monitoring of boreholes required
• Undertake feasibility study to confirm the additional groundwater resources augmentation and water quality (treatment requirements)
• Surplus yield from Molepo Mam to support to neighbouring areas (i.e. Boyne RWS, Mankweng RWS and/or Laaste Hoop RWS) to be considered to reduce the load from the Olifants transfer scheme
• Molopo WTW currently operating at 82% capacity
• Water allocations are unknown and need to be confirmed
143
Polokwane Cluster
144

2015/07/24
37
Polokwane Cluster• Demographics (High): 489 160 (2011)–626 034 (2035)
• Water sourced from Ebenezer Dam, Dap Naude Dam, Olifantspoort Weir, Seshego Dam and groundwater
• Water requirement projection (high growth):
• 2011 Theoretical: 24.274 million m3/a (66.459 Ml/d, 136 l/c/d)
• 2011: 46.405 million m3/a (127 Ml/d, 260 l/c/d)• 2035: 67.630 million m3/a (185 Ml/d, 296 l/c/d)
Category Dwelling Type% Population per
Category1 Flats 3.3%
45% Formal
2 Clusters 2.1%3
Single Residential
Low Income 24.7%4 Medium Income 5.8%5 High Income 5.0%
6Very High Income 3.9%
7Informal
Below RDP Level 10.0%55% Informal8 RDP Level 13.0%
9 Above RDP Level 32.3%
145
Polokwane Cluster Water Balance
Ebenezer
Dap Naude
Olifantspoort
GroundwaterGroundwater Augmentation
Re-use
ORWRDP Ph2 ProjectionLarger commercial, industrial and institutional
requirements
Seshego
146
Polokwane Conclusions & Recommendations
• Current water use exceeds the currently allocated water resources
• Preliminary WC/WDM analysis indicates savings of 3.266 million m3/a (8.9 Ml/d)
• Conduct detailed WC/WDM analysis to confirm potential savings and identify WC/WDM measures to be implemented. Installation of bulk water meters to be prioritised
• Current groundwater water use volume to be confirmed
• Registration, metering and monitoring of boreholes required
• Undertake feasibility study to confirm the additional groundwater resources augmentation (incl. quality , potential impacts on surface flows and groundwater levels, artificial recharge)
• Polokwane forms part of the larger integrated Olifants River System and the Letaba River System
147
Polokwane Conclusions & RecommendationsLetaba River System
• Current Dap Naudé licenced allocation (6.52 million m3/a) is not recommended due lower yield (HFY = 2.1 million m3/a) Historic average supply approx. 4 million m3/a
• Ebenezer Dam licenced allocation of 12 million m3/a not be increased above 16.2 million m3/a
• Factors that could further influence the allocation from the Letaba:
• Validation and Verification of Registered Water Users: In process but anticipated unlawful use to be minimal
• Groundwater Development: LNW indicated substantial volumes of GW could be developed for users downstream of the Ebenezer Dam in exchange for an allocation from Ebenezer Dam. It is recommended that a feasibility study is conducted (incl. potential impact on base flows)
• Compulsory Licencing: For the re‐allocation of water could be considered (can only be considered once the verification of existing water users is complete)
148

2015/07/24
38
Polokwane Conclusions & RecommendationsOlifants River System
• Total Olifantspoort Weir licenced allocation is 14.6 million m3/a. Additional support supplied by augmentation options i.e. GW. Feasibility study conducted to confirm the development potential
• Factors that could further influence the allocation :
• Validation and Verification (V&V) of Registered Water Users: • Irrigation (De Hoop): Existing lawful water use more or less fully utilised
• Irrigation (Flag Boshielo): Informal irrigation (15.8 million m3/a) seldom requests releases and water use not measured. Commission V&V study to confirm potential utilisation of unused allocations
• Ecological Water Requirements: The possibility for the temporary utilisation of a portion of the EWR releases. The ecological consequences of this option to be investigated and quantified
• Compulsory Licencing: For the re‐allocation of water could be considered (can only be considered once the verification of existing water users is complete)
149
WATERBERG DMLephalale LM
150
151
Lephalale Urban Strategy
152

2015/07/24
39
Lephalale Urban• Mokolo and Crocodile (West) Water Augmentation Project:
Phase 2: Post Feasibility Bridging Study (July 2013)
• Demographics: 32 600 (2011) – 133 457 (2035)
Category Dwelling Type% Population per Category
1 Flats
58% Formal
2 Clusters3
Single Residential
Low Income4 Medium Income5 High Income
6 Very High Income7
InformalBelow RDP Level
42% Informal8 RDP Level9 Above RDP Level
• Water requirement projection (high growth):• 2011: 6.490 million m3/a (17.769 Ml/d, 555 l/c/d)• 2035: 13.970 million m3/a (32.248 Ml/d, 287 l/c/d)
153
0
20
40
60
80
100
120
140
160
2005 2010 2015 2020 2025 2030
An
nu
al R
equ
irem
ents
(m
illio
n m
3/a
)
Mokola Dam Yield (1:100) Groundwater MCWAP 2A MCWAP 2B
Allocation (Surface Water) Allocation (Groundwater) WTW Capacity High Scenario with WCWDM
High Scenario Theoretical Actual Use
Lephalale Water Balance
Mokolo Dam
MCWAP
Water Requirement Projection (Scenario C4D) incl. Irrigation & EWR
Groundwater Augmentation
154
0
50
100
150
200
250
2014 2016 2018 2020 2022 2024 2026 2028 2030 2032 2034 2036 2038 2040 2042 2044
Volume (m
illion m
3 /a)
Mokolo Crocodile Water Augmentation Project (Phase 2)Water Requirements and Water Availability
Water available_Alternative Scenario Water available_Base Scenario
Water transfer requirements (20% conveyance losses) Water Transfer requirements (15% conveyance losses)
Water available in the Crocodile for transfer
(incl. City of Tshwane WAP)Transfer to Lephalale
Critical period
Lephalale water transfer requirements (Aug 2013)
(With 15 and 20% conveyance losses)
MCWAP Water Availability
155
Lephalale Conclusions & Recommendations• Projected requirements exceed available resources by 2017• WC/WDM plan to be developed with clear performance targets and
implemented
• Prioritise MCWAP implementation (75 million m3/a). Long term augmentation 110 million m3/a
• Groundwater – surface water interactions to be investigated and confirmed before development
• Zeeland WWTW return flows currently re‐used (irrigation). New WWTW to be built in Marapong (mine to use treated effluent from new WWTW)
• Mokolo Annual Operating Analysis:
– Tracking of actual water use per water use sector
– WRPM analysis with the most recent information
• Allocations to be aligned with projected requirements
156

2015/07/24
40
Item 9: Remainder of the Study Programme – Phase 1
157
Remainder of the Study Programme –Phase 1
• SSC to submit comments by 14 August 2015 to:• Northern Planning Region Deputy Study Leader:
Ms Monja Esterhuizen ([email protected])
158
Remainder of the Study Programme –Phase 1
• Distribution of the updated priority strategies for comment: on CD & upon request
• Review and incorporate comments– Prepare final priority strategies– Prepare final District Municipality Summary Reports
• Distribution of the final priority strategies & DM Summary Reports to – The DWS Head Office– DWS Regional Offices
• DWS website• Final SMT meeting in September 2015
159
Item 10: Way Forward
160

2015/07/24
41
Way Forward• Incorporation of the strategies into annual planning cycle
by the WSAs (WSDPs, IDPs, License Applications etc.):– Infrastructure planning, project development – Water source planning and development
• DWS confirm and ensure planning, development and alignment with strategies (WSDPs, IDPs, License Applications etc.), monitor and enforce
• DWS identified priority areas for the development of in‐depth reconciliation strategies:– Olifants‐Sand Cluster– Mahikeng Cluster
• Continuous engagement with DWS – prioritise areas for the continuation of the All Towns Reconciliation Strategies – Phase 2
161
Item 10: General
162
Item 11: Date of Next Meeting and Closure
163
Thank You
Drive Safely
164