item 8c, attachment 6, page 1 of 12
TRANSCRIPT

TO: Members of the Investment Committee, CalPERS
FROM: Meketa Investment Group
DATE: September 13, 2021
RE: Semi-Annual Real Estate Performance Review as of June 30, 2021
In our role as the Board Real Estate Consultant, Meketa Investment Group (“Meketa”) conducted a
semi-annual performance review of the Real Estate Portfolio (“the Portfolio”) based on data provided
in Wilshire’s California Public Employees’ Retirement System (“CalPERS”) Real Assets Performance
Analysis Review for the period ended June 30, 2021, and selected CalPERS reports.1 This memorandum
provides the Portfolio performance data and information on key policy parameters, along with
summary market commentary.
Performance2
Portfolio-Level Returns
CalPERS (“the System”) assigns the goals of diversification from public securities, current income and
inflation protection to its real assets portfolios, of which real estate comprises 84.8%. The Portfolio’s
diversification is serving the System, as different property sectors experience varying demand and
supply dynamics. Similarly, CalPERS’ focus on highest quality locations and materials that attract credit
worthy tenants provides defensive characteristics. Across real estate markets, no property type or
geographic region necessarily outperforms over the long-term, so diversification is critical.
This became more apparent during the quarter’s results reported for March 31, 2021, which reflected
property operations during the fourth full quarter of the COVID pandemic, January 1 through March 31, 2021.
It is also crucial to keep in mind that real estate is a long-term, illiquid asset, and shorter term, quarter
to quarter changes in value, based on third party appraisals, may not necessarily reflect long-term
trends in either direction.
Overall, returns have moderated for both CalPERS and the broader market. CalPERS’ Real Estate
Portfolio returns generally mirrored the benchmark, modestly outperforming the benchmark over the
one-year and ten-year periods and modestly underperforming the benchmark over the three-year
and five-year periods. Measured by a percentage of Loan to Value, CalPERS has historically used more
1 Real Assets Program Allocation, Characteristics, and Leverage Reports (pdf) and Datasheets (Excel), Period Ending March 31, 2021, and Real
Assets Quarterly Performance Report, Partnership Financial Statements as of March 31, 2021. 2 Per Wilshire’s CalPERS Real Assets Performance Analysis Review for the period ended June 30, 2021 reported with a 1-quarter lag, so
effectively as of March 31, 2021.
Item 8c, Attachment 6, Page 1 of 12

leverage than the benchmark (32.1% versus the benchmark of 23.2%). When property values are rising,
this accelerates returns. When values decline, this detracts from performance. Measured by the
3.3x multiple of Net Operating Income to debt service, (coverage ratio), and the strength of the
tenancies, this is nevertheless a prudent level of debt. Both LTV and DSRC are well within policy
guidelines of <50% and >1.5, respectively.
Performance Attribution
The portfolio posted a positive 1.9% return for the trailing one year period, split between 3.1% of current
income and depreciation of 1.3%. Among core holdings, mall retail property investments, to which
CalPERS has a material overweight compared to the benchmark, and which account for 16.0% of the
portfolio, declined by 13.2% during the trailing year period. These investments have produced an
8.2% total net return since inception. These assets continued to decline in value. While visitor traffic has
begun to return following vaccinations becoming more common, it still remains below historic levels. As
a result, some retailers have struggled to pay rent and/or closed stores. CalPERS’ malls, which are well
located and have financially strong and experienced joint venture partners operating them, are all
currently open and expected to experience continued improved operations over the next 18-24 months
compared to the year ending March 31, 2021.
The other portion of CalPERS’ retail holdings, grocery-anchored shopping centers, which amount to
8.6% of the portfolio, posted a -1.2% total net return for the trailing year period. The grocery-anchored
shopping centers have been impacted primarily by the temporary closure of the small businesses,
including restaurants, which lease in-line stores. However, the demand for groceries and the gradual
re-opening/increased operating capacities of various businesses has begun to result in improving
fundamentals.
As of this reporting period, the core risk portfolio, comprised of completed, leased and cash flowing
assets, representing 83.8% of the Real Estate Portfolio, produced strong longer term returns of 5.7% for
the five-year return against MSCI/PREA benchmark returns of 5.2%. Virtually all core properties are
held directly in lower cost separate accounts (as opposed to investing indirectly through open-end
commingled pools). These long-term strategic partnerships anchor the Portfolio. Efforts continue to
transition the Portfolio away from legacy, non-strategic assets and risks towards higher quality,
stabilized assets that serve the role of the asset class.
1 CalPERS Real Estate Policy Benchmark, with historical composition as follows: As of July 1, 2018 is the MSCI/PREA US ACOE Quarterly Property
Fund Index (Unfrozen), Net of Fees. From July 1, 2011 through June 30, 2018, the Policy Benchmark was the NCREIF Fund Index Open-End
Diversified Core Equity, Net of Fees. The. Policy Benchmark results are shown on a blended basis during the relevant trailing periods.
Item 8c, Attachment 6, Page 2 of 12

Key Policy Parameters
The Real Estate Portfolio is compliant with all key parameters related to diversification and other limits
applicable at the Portfolio level, as demonstrated in the following table.
1 Private investment data are one quarter lagged, so effectively as of March 31, 2021. 2 Private investment data are one quarter lagged, so effectively as of March 31, 2021. 3 Real Assets Quarterly Performance Report as of March 31, 2021; and Real Assets 2021.3.31 Characteristics Report (Excel), based on asset-level risk. 4 Real Assets Quarterly Performance Report as of March 31, 2021; and Real Assets 2021.3.31 Characteristics Report (Excel), based on asset-level
geography. 5 CalPERS Real Assets Portfolio Allocation Report (Excel), Period Ending March 31, 2021: calculated based on manager- and account-level NAV.
Percent calculated using relevant NAV plus total unfunded commitments for relationships/investments and same for the Real Assets
Program ($56.4 billion). 6 CalPERS Real Assets Portfolio Leverage Report (pdf), Quarter Ending March 31, 2021.
Item 8c, Attachment 6, Page 3 of 12

Implementation
The Real Estate Portfolio had a market value of $38.7 billion at the end of the current reporting period,
representing 84.8% of the Real Assets Program and 8.2% of the Total Fund. Including Forestland and
Infrastructure, the Real Assets program currently comprises 9.7% of the total portfolio against a
long-term target allocation of 13%, within the policy range of 8% to 18%. CalPERS has a very small
exposure to overseas properties, and almost no exposure to the hospitality industry in its private real
estate holdings.
The CalPERS business model for real estate emphasizes control, transparency, alignment and
governance. CalPERS’ market advantages are its size, scale and ability to hold assets for longer periods.
The implementation of this business model is primarily through direct investing with separately
managed accounts, in which CalPERS has effectively complete control. Cancellable separate accounts
have been created with expert, aligned fiduciary managers/partners. These relationships are overseen
by Staff with the benefit of independent fiduciary consultants’ prudent person opinions, and monitored
on behalf of the Trustees by the Board Real Estate Consultant. This provides a replicable, scalable model
that can grow as the Total Fund size grows and invest within the strategic ranges based on market
conditions and alternative investments available to the Total Fund. As the System grows and markets
evolve, this method of investing helps control risk and reduce costs.
CalPERS continues to be an industry leader in creating and embracing Responsible Contractor Policies
and ESG best practices at its properties. Partnerships holding 90% of CalPERS’ real estate assets on a
net asset value basis completed reporting to GRESB this year, up from 89% last year, and with score
improvement across all managers. The Real Assets energy optimization initiative, which seeks to
reduce carbon intensity of the real estate portfolio through a focus on energy cost, energy use,
renewable energy use and production, included 71 projects this year, resulting in an estimated annual
cost savings of $2.9 million. The Real Assets team continues to work closely with its strategic partners
to make incremental improvements and share best practices across the portfolio.
Real Estate Market Commentary:
Disruption Continues, and While One Puzzle Has Been Solved, Many Others Await
During the past 90 days, a confusing economic picture began to change, but became no less confusing
for the real estate industry.
The pandemic, which showed signs of being brought under control as vaccinations became widespread,
has become a pandemic of the unvaccinated. This, in turn, has required alterations in many locations to
the relaxation of restrictions. The emergence of the Delta variant has increased infection rates in certain
parts of the US, and in several other parts of Asia and Europe, with various “re-openings” occurring only
to be reduced when it becomes apparent that we are not yet out of danger from the virus.
Implications for property occupancy and performance are still somewhat unclear. In general, the
shortest-lived recession in history has also described the arc of changes in property values—many have
Item 8c, Attachment 6, Page 4 of 12

rebounded to pre-pandemic levels in sectors besides hospitality and retail. Usage of office space has
recovered, though work from home still is a significant percentage of hours. When the vaccines receive
final approval from the CDC, replacing the emergency approval currently in place, it is expected that
employers will generally be able to require employees be vaccinated as a condition of employment.
This will increase occupancy in offices and benefit surrounding support (retail and leisure) revenues.
Residential eviction moratoria are expiring in many locations which will likely result in some relocations
in the short term but will also bring more reliable cash flows thereafter.
It is not yet clear how the Congress will address an infrastructure bill, nor whether political divisions will
continue to be so partisan as to preclude much new legislation. This is an important tipping point, as
changes to capital gains and other taxes that effect real estate operations and sales could have a
meaningful impact on transaction volumes and potentially values.
Low interest rates continue to drive liability-based investors away from fixed income and towards
alternative assets Like CalPERS, many long-term investors are considering increases to their private
market assets’ allocation, especially real estate. This has resulted in an unprecedented amount of funds
being committed, but not yet invested, in property, and has sustained and increased prices, especially
in the industrial, data center, life sciences and single-family rental sectors.
Consolidations among real estate investment managers has given birth to new offerings of size at a
record pace. On some level, these fund managers are direct and indirect competition for CalPERS and
the size of the new funds allows them to bid for assets previously too rich without significant
concentration risk.
Meketa believes that market conditions will not be clear for at least another 12-18 months, and
shorter-term investment results are likely to be less homogenous across regions and property types.
The continuing rise in public equity market values has made more capital available merely from the
“Denominator Effect” and a desire to keep fully invested at target percentage levels. This increased
supply of capital has caused prices to remain full for the types of assets that CalPERS seeks as
consistent with its long-term strategy. Meketa believes that CalPERS’ strategic, long-term tilt to the
historic centers of population and employment growth is sound. Staff is also exploring expanding the
target location list as trends evolve in space utilization and customer preferences and giving more
study to investing overseas.
While CalPERS’ (and its benchmark) target leverage levels are conservative and created within the context
of the Total Fund, interest rates are still at very attractive levels for private owners, flight capital and
investors who are not liability driven to the same degree. Spread investing, and the lack of alternatives for
current return, serve to maintain strong interest in leveraged property purchases. To the extent that
demand drives cap rates lower, and they continue to average their historic range of 150-250 basis points
above the risk free rate of the ten-year Treasury bond, then declines in value due to lower occupancies and
slower growth of effective rental rates will be mitigated. New construction of most property types
(exceptions are data centers and “last mile” distribution and fulfillment centers) is disciplined.
Item 8c, Attachment 6, Page 5 of 12

Conclusion
The shadows of the next wave of the pandemic and polarization of views on policies and legislation
continue to loom over the property markets around the world. Like other asset classes, so much of the
private real estate sector’s near future hinges on the pervasiveness of the vaccine and therapeutics,
mutations of the virus, and subsequent changes in behavior by real estate occupants and investors,
influenced by the twin long-term trends represented by technology and migration. The transaction and
financing markets have become less frozen than six months ago, but continue to be challenging for
core buyers, core sellers and property owners, who are neither buying nor selling. Nonetheless,
CalPERS’ continued discipline, long-term investment horizon in this illiquid asset class, and focus on the
role of the asset class should continue to serve the needs of the System.
Please do not hesitate to contact us if you have questions or require additional information.
CF/KR/EFB/DG/SPM/jls
Item 8c, Attachment 6, Page 6 of 12

Attachment
Real Estate Market Views
Real Estate Fundamentals – Vacancy by Property Type1
In the first quarter of 2021, vacancy rates increased for all property types except multifamily.
Multifamily vacancies decreased by 89 basis points in the first quarter after reaching 8.0% in the fourth
quarter of 2020. Industrial vacancies appeared to have bottomed just above 3.0% and is currently
tracking at 3.5%. Office and retail have seen sharp increases in vacancy due to the COVID-19 pandemic.
All property types had vacancies that increased over the trailing twelve months. Compared to one year
ago, vacancy rates in multifamily increased 72 basis points, office increased 226 basis points, industrial
increased 5 basis points, and retail increased 235 basis points. Overall, the vacancy rate across all
properties increased 95 basis points from Q1 2020.
1 Source: NCREIF.
Item 8c, Attachment 6, Page 7 of 12

NOI Growth1
The trailing twelve-month rate of NOI growth increased slightly in Q1 2021 to -5.5%. The ongoing
COVID-19 pandemic has negatively impacted commercial property operations as operating expenses
have not declined in response to the shutdown when compared to revenues, particularly for retail and
urban multifamily properties. Industrial NOI growth has remained relatively flat, currently trending at
6.8% for the trailing year ending Q1 2021 (down 149 basis points from a year ago). Office NOI growth
trended up to 2.9% year-over-year, and Apartment NOI (a sector with “gross” rents, compared to “net”
rents in other property types experienced negative NOI growth at 14.0% year-over-year. Retail NOI
growth has improved slightly from the previous three quarters, now at -17.2% year-over-year.
1 Source: NCREIF.
Item 8c, Attachment 6, Page 8 of 12
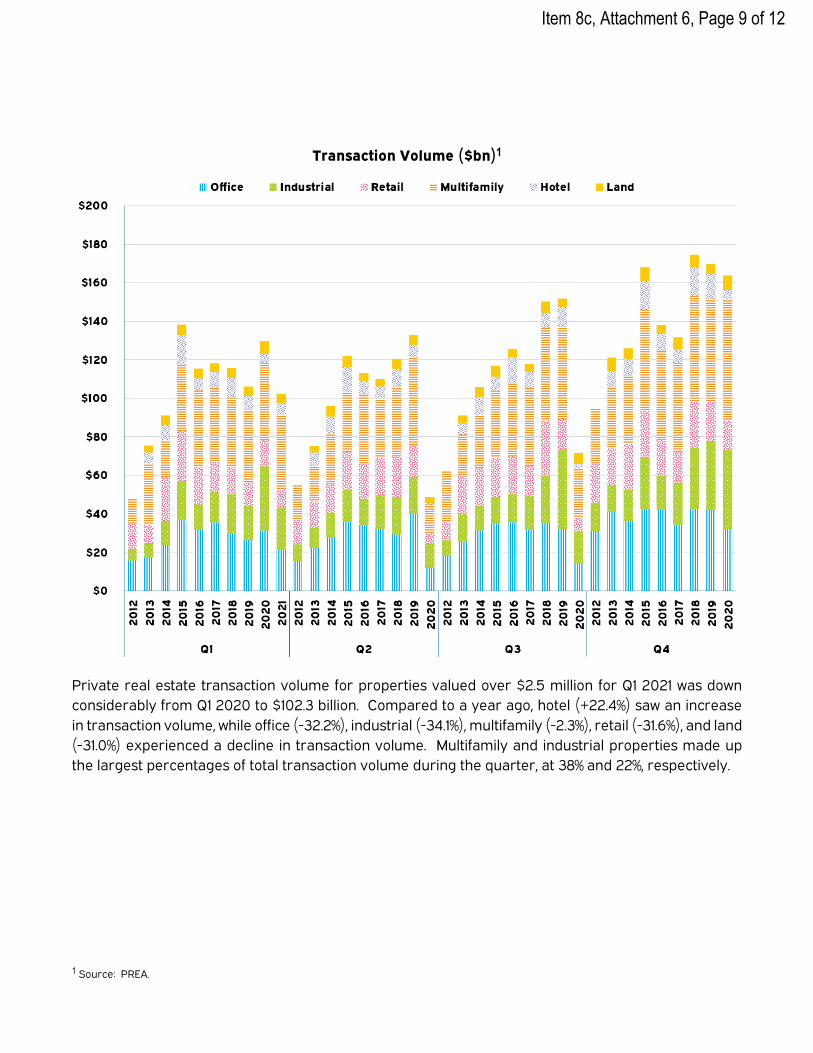
Transaction Volume ($bn)1
Private real estate transaction volume for properties valued over $2.5 million for Q1 2021 was down
considerably from Q1 2020 to $102.3 billion. Compared to a year ago, hotel (+22.4%) saw an increase
in transaction volume, while office (-32.2%), industrial (-34.1%), multifamily (-2.3%), retail (-31.6%), and land
(-31.0%) experienced a decline in transaction volume. Multifamily and industrial properties made up
the largest percentages of total transaction volume during the quarter, at 38% and 22%, respectively.
1 Source: PREA.
Item 8c, Attachment 6, Page 9 of 12
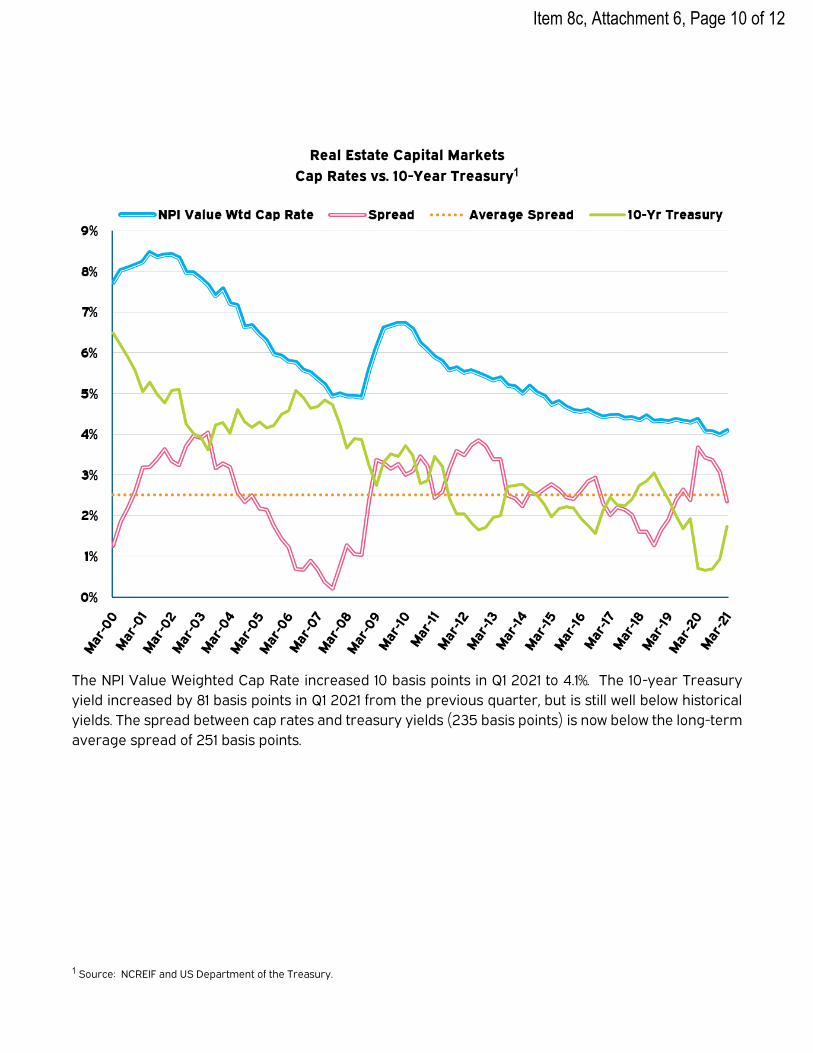
Real Estate Capital Markets
Cap Rates vs. 10-Year Treasury1
The NPI Value Weighted Cap Rate increased 10 basis points in Q1 2021 to 4.1%. The 10-year Treasury
yield increased by 81 basis points in Q1 2021 from the previous quarter, but is still well below historical
yields. The spread between cap rates and treasury yields (235 basis points) is now below the long-term
average spread of 251 basis points.
1 Source: NCREIF and US Department of the Treasury.
Item 8c, Attachment 6, Page 10 of 12

Trailing Period Returns1
Private real estate indices were positive in Q1 2021 and continue to be positive over the 1-year, 3-year,
5-year, and 10-year time horizons. Public real estate performance in 2020 and into 2021 has been
volatile, returning 8.3% in Q1 2021, after posting a negative return (-5.1%) over the course of 2020.
1 Source: NCREIF.
Item 8c, Attachment 6, Page 11 of 12

ODCE Return Components1
(Equal Weight, Net)
The NFI-ODCE Equal Weight return for Q1 2021 was positive at 2.1%, posting the highest quarterly return
since Q1 2016. The income component of the quarterly return increased slightly to 0.9%, and
appreciation for the quarter was strong at 1.2%.
1 Source: NCREIF.
Item 8c, Attachment 6, Page 12 of 12