item no. 12.1
TRANSCRIPT

P.O. Box 1749 Halifax, Nova Scotia B3J 3A5 Canada
Item No. 12.1.1 Environment and Sustainability Standing Committee
November 4, 2021
TO: Chair and Members of Environment and Sustainability Standing Committee
SUBMITTED BY: Kelly Denty, Executive Director, Planning and Development
Jacques Dubé, Chief Administrative Officer
DATE: August 10, 2021
SUBJECT: Municipal Electric Vehicle Strategy
ORIGIN
September 19, 2019 Halifax Regional Council passed the following motion:
“That Halifax Regional Council direct the Chief Administrative Officer to:
1. Report back to Environment and Sustainability Standing Committee with bothan electric vehicle infrastructure strategy and light-duty fleet strategy, completewith budgetary considerations to:
a. Install and administer public electric vehicle charging infrastructure atnew and existing Municipal facilities, rights of way and/or publicparking sites including rural fire stations with backup generators andpark and ride terminal locations; and
b. Convert a portion of the municipal fleet to electric vehicles and installcharging stations at municipal facilities.
2. Return to Council with recommendations for specific legislative amendmentsto enable the Municipality to require necessary zero emission vehicleinfrastructure in new developments.”
June 23, 2020 Halifax Regional Council adoption of HalifACT
RECOMMENDATIONS ON PAGE 2
Original Signed
Original Signed

Municipal Electric Vehicle Strategy Standing Committee Report - 2 - November 4, 2021 LEGISLATIVE AUTHORITY Halifax Regional Municipality Charter, 2008 SNS c 39: 7A The purposes of the Municipality are to
(a) provide good government; (b) provide services, facilities and other things that, in the opinion of the Council, are necessary
or desirable for all or part of the Municipality; (c) develop and maintain safe and viable communities.
79A (1) Subject to subsections (2) to (4), the Municipality may only spend money for municipal
purposes if:
(a) the expenditure is included in the Municipality`s operating budget or capital budget or is otherwise authorized by the Municipality;
34(3) The Council shall provide direction on the administration, plans, policies, and programs of the Municipality to the Chief Administrative Officer. 61(3) The property vested in the Municipality, absolutely or in trust, is under the exclusive management and control of the Council, unless an Act of the Legislature provides otherwise. Building Code Act 4 (1) The Minister may make such regulations as are considered necessary or advisable for the purpose of establishing a Building Code governing minimum standards for the construction and demolition of buildings … 4(2) Upon the recommendation of the council of a municipality, the Minister may, by regulation, prescribe additional standards applicable to the construction or demolition of buildings in that municipality, where such standards are more stringent than the standards in the Building Code or relate to matters not regulated by the Building Code. RECOMMENDATION It is recommended that the Environment and Sustainability Standing Committee recommend that Halifax Regional Council:
1. Adopt the Halifax Regional Municipality Electric Vehicle Strategy as set out in Attachment 1 of this report;
2. Recommend that the Minister of Municipal Affairs and Housing prescribe additional standards by
regulation of the Building Code Act to require “EV Ready” parking stalls for the construction of new buildings within the Halifax Regional Municipality and request the Mayor write a letter to the Minister requesting these regulations; and
3. Request the Mayor write a letter to the Premier of Nova Scotia requesting that the Zero Emission Vehicle mandate, introduced in the Environmental Goals and Climate Change Reduction Act, be strengthened to better align with HalifACT.

Municipal Electric Vehicle Strategy Standing Committee Report - 3 - November 4, 2021 BACKGROUND HalifACT: Acting on Climate Together is the Municipality’s long-term climate action plan to reduce emissions and help communities adapt to a changing climate. The Plan1 aligns with the Climate Emergency that was declared by Halifax Regional Council on January 29, 2019, which emphasized that climate change is a serious and urgent threat to our community. The Plan was unanimously approved by Halifax Regional Council in June of 2020 and outlines a suite of actions that are necessary to meet the significant carbon reductions outlined in the plan. As part of Council’s approval, staff was directed to prioritize efforts in seven critical core areas, one being to develop a municipal electric vehicle strategy that would guide a low carbon transportation transition. Through a competitive process, Dunsky Energy Consulting was hired in spring 2020 to develop this electric vehicle strategy that provides recommendations relating to public infrastructure, policy requirements, education needs and a municipal light duty fleet transition plan to position Halifax as an EV-ready municipality. DISCUSSION In 2016, the transport sector contributed to 20% of overall community emissions, with light duty cars and trucks making up 90% of the total. While HalifACT first recommends a transition to public transit or active transportation, it also recommends that the Municipality take significant action to accelerate the transition to electric vehicles (EVs). The Halifax Regional Municipality Electric Vehicle Strategy in Attachment 1, referred to throughout this report as the Strategy, lists the direct and indirect strategic actions required to accelerate the EV transition. As mentioned above, the Strategy was developed by Dunsky Energy Consulting with direction from the Municipality. To develop the Strategy, Dunsky leveraged their expertise in clean mobility, their proprietary modeling software, reviewed EV strategies in other jurisdictions, and conducted stakeholder engagement. The stakeholder engagement consisted of Municipal staff, leaders in the sector and interested community members. This engagement was conducted to develop partnerships and ensure the recommended actions were feasible. The final Strategy includes four key areas of focus: Public Charging Infrastructure: this section includes a detailed plan of the number of chargers needed within the Halifax region, specific recommendations on geographical locations, and overall cost estimates. Electric Vehicle Policies: this section includes specific recommendations on municipal and provincial policies that can help increase access to home charging which will alleviate a significant barrier to EV adoption. Advocacy and Support: this section covers critical actions that are outside of the Municipality’s direct control but for which it can advocate for, as well as educational partnerships. Light Duty Fleet Electrification: this section provides the Municipality with a roadmap for electrifying its light duty fleet to achieve its 100% EV target in the most cost effective and the least disruptive way. Full technical details of each area of focus are covered in the Strategy.
1 HalifACT – Acting on Climate Together, Halifax Regional Council Package https://www.halifax.ca/sites/default/files/documents/city-hall/regional-council/200623rc916.pdf

Municipal Electric Vehicle Strategy Standing Committee Report - 4 - November 4, 2021 Public Charging Infrastructure One of the most common barriers to EV adoption is range anxiety brought on by the lack of public charging infrastructure. Range anxiety refers to the concern that the vehicles battery will run out before finding a charging site. While most charging (approximately 80%) is typically done overnight at home, public infrastructure can ease this anxiety, provide an alternative to those without at-home charging and signal to the consumer that investments are being made to support the transition.
In recent years, Nova Scotia Power Inc. (NSPI) has led investments in public charging along provincial highways, however there is no clear mandate for them to continue this work, nor is there a defined leader in the space. There are currently only three public Direct Current Fast Charging (DCFC) and 40 level 2 (L2) ports in the municipality. Dunsky’s EV Adoption Model, which looks at the current baseline of charging infrastructure, the average driving distance of residents and the number of multi-use residential dense areas, recommends that 100 DCFC ports and 1,000 L2 ports be installed within the next ten years to help accelerate the transition to EVs.
DCFCs provide the fastest charge to EV owners. Depending on the electrical capacity of the charger, an EV owner can expect an 80% charge in 20-60 minutes. Due to this high rate of charge, DCFCs are typically installed along highway corridors and alongside amenities within dense multi-use residential areas. This offers EV owners a similar experience to traditional re-fueling, should they be covering long distances or not have access to at home charging.
L2 charging sites provide a slower charge to EV owners at a rate of about 40 kilometres per hour or a full charge in about 8 hours. Due to this slower charge, they are typically installed at homes, workplaces, on-street in dense residential areas and public parking lots where EV owners are parked for several hours, overnight or simply require a top up.
While it is anticipated that the utility and private investors will support public charging deployment as the adoption of EVs increase across the province, the Municipality has the responsibility to lead in the short term. This aligns with other leading jurisdictions like Toronto, Victoria and Montreal, who have already deployed or have plans to deploy public charging within their communities.
The Strategy recommends that charging sites be deployed in two phases as outlined in figure 1.
Figure 1: HRM public charging infrastructure plan

Municipal Electric Vehicle Strategy Standing Committee Report - 5 - November 4, 2021 In Phase 1, it is recommended that charging sites be installed along highways to close the gap for rural communities and off-street within the urban core. This will play a more critical role than on-street charging in early adoption. Phase 1 has a lower installation rate than Phase 2 to account for a ramp up in EV adoption, to allow time for monitoring and assessment and to develop partnerships for more private investment, as the Municipality only has authority to place charging sites on Municipally owned land. Charging sites along highways and off-street, as recommended in the Strategy, will need to be deployed by the private sector, or other levels of government.
To increase coverage across the region and initiate Phase 1, an application has been submitted to Natural Resources Canada’s (NRCan) Zero Emission Vehicle Infrastructure Program2 (ZEVIP). NRCan’s ZEVIP offers eligible organizations funding to install electric vehicle chargers in public places, workplaces, municipal fleet depots and multi-unit residential buildings. The fund covers 50% of eligible costs up to a maximum of $5 million. Eligible costs include infrastructure, installation and salaries of staff coordinating the project. In partnership with Facility Design and Construction and after consultation with NSPI, the following locations have been considered:
Table 1: Charging locations considered through ZEVIP
Site Community L2 Ports DCFC Ports Zatzman Sportsplex Dartmouth 20 1 Kiwanis Grahams Grove Park Dartmouth 4 0 RBC Centre Burnside 12 0 J.D. Shatford Memorial Public Library Hubbards 0 1 Musquodoboit Harbour Public Library Musquodoboit Harbour 0 1 Fire Station 38 Middle Musquodoboit 0 1 Cole Harbour Place Cole Harbour 20 1 Sackville Sports Stadium Lower Sackville 20 0 New Sheet Harbour Recreation Centre Sheet Harbour 0 1 Keshen Goodman Public Library Halifax 10 1 St. Margaret’s Centre Upper Tantallon 20 1 Sackville Public Library Lower Sackville 0 1
A total of $1 million is being requested through ZEVIP, with matching funds available in the 2021/22 Climate Change Capital Account, CB200012. A funding decision should be made by December 2021 and if successful, applicants will have 30 months to install and commission the sites. The first site is not expected to be operational until the start of the 2022/23 fiscal year. Future areas to be considered are outlined in figures 2 and 3 below. The total cost of the Public Deployment Plan is $23,000,000 as summarized in Appendix C of the Strategy. Again, this cost will not be borne solely by the Municipality as HRM will work to develop partnerships, secure funding, and encourage private investment.
2 Zero-Emission Vehicle Infrastructure Program (ZEVIP). https://www.nrcan.gc.ca/energy-efficiency/transportation-alternative-fuels/zero-emission-vehicle-infrastructure-program/21876

Municipal Electric Vehicle Strategy Standing Committee Report - 6 - November 4, 2021
Figure 2: Recommended DCFC install locations along highway corridors
Figure 3: Recommended DCFC and L2 install locations within the urban core

Municipal Electric Vehicle Strategy Standing Committee Report - 7 - November 4, 2021 Aside from capital costs, ongoing operational costs need to be considered. Operational costs will include an annual service agreement fee paid to the charger manufacturer for administration, payment collection, monitoring and maintenance along with electricity costs. It is expected that the service agreement will be approximately $150 per L2 port and $1,500 per DCFC annually. Currently, there is no set tariff for EV charging so the annual electricity costs will depend on the location of the charging site, the grid connection configuration (existing service or new) and the annual usage. Without a specific tariff, predicting the annual operating costs can be difficult, especially if annual consumption is high enough to introduce demand charges. These unknown demand charges can be a key barrier to both public and private deployment. To better predict and strengthen the business case for both public and private charger operators, municipal staff will continue to engage NSPI towards the development of a specific tariff. In the meantime, all municipally-owned charging sites will be designed to minimize demand charges. To offset annual operating and maintenance costs, fees will be collected from users of the sites. This fee (or fees) and the enforcement mechanism are still being determined in consultation with Legal and Legislative Services and will be presented to Halifax Regional Council for consideration. The fees will be set to try and cover the annual operating costs. Looking to other site operators in the province, fees are initially being considered at $1.50 per hour of charging for L2 ports and $15 per hour for DCFC sites, pro-rated by minute. With these fees and the sites listed above, estimated annual operating costs with a maturing market (10% utilization in years 1-3 increasing to 30% in year 4) are presented in table 2. To cover operating costs, the required utilization rate depends on the charging configuration. For a single, 50kW DCFC, the utilization rate must be more than 2% to cover operating costs. For a 20 port L2 site, the utilization must be between 4 and 8% or more than 17% to break even. Due to the introduction of demand charges, utilization rates of between 9 and 16% will result in a net loss of a maximum of $5,000 annually. Table 2: Summary of estimated operating costs
Operating Year 1 2022/23
Year 2 2023/24
Year 3 2024/25
Year 4 2025/26
Gross $8,500 $60,000 $140,000 $335,000 In each year, the operating costs increase as more charging ports are added. It is recommended that these operating costs be considered by Council in the budget years identified. These operating costs will be refined as the sites begin to operate and annual usage data becomes available. At the estimated usage rates, it is anticipated that most or all of the annual operating costs will be offset. Electric Vehicle Policies & Programs The increase of public charging will ease range anxiety and signal to the consumer that investments are being made to support the transition to EVs. This, however, does not solve the barrier to accessing charging at home, the primary charging method for most consumers. Approximately 10% of municipal residents currently live in multi-use residential buildings (MURBs) without access to overnight charging. With the passing of the Centre Plan, more density is expected within the urban core, and without dedicated overnight charging, it will be difficult for the mainstream consumer to see EVs as a desirable alternative to gas vehicle ownership. While the adoption levels of EVs are low today, it is likely that any newly constructed building will see a 100% EV penetration within its lifetime. Therefore, the Strategy recommends that all newly constructed residential and non-residential buildings be future-proofed for EV charging. Future proofing buildings for EV charging ensures that parking stalls are “EV Ready”. This means that all required electrical components are in place (wires, breakers, conduit etc.) except for the physical charger. This makes adding the charger, when needed, straightforward and without invasive and costly electrical

Municipal Electric Vehicle Strategy Standing Committee Report - 8 - November 4, 2021 retrofits. The Residential Electric Vehicle Charging Guide for Local Governments3, published by the City of Richmond, estimates that the upfront cost of “EV Ready” parking stalls during construction is nearly half the cost of retrofitting after the building is constructed. As it would be inconsistent with the Building Code Act, the Halifax Regional Municipality cannot mandate the inclusion “EV Ready” parking stalls for new construction. Through S 4(2) of the Building Code Act, the council of a municipality may recommend that the Minister prescribe additional standards applicable to the construction of buildings in that municipality. Therefore, to help ensure future and current EV owners have access to home charging, it is recommended that the Mayor write a letter to the Minister of Municipal Affairs and Housing requesting specific authority to mandate “EV Ready” parking stalls for new construction within the Halifax Regional Municipality. Specifically, the request would be to require 100% of parking stalls in new residential buildings (multi-unit and single unit dwellings) and 20% of parking stalls for non-residential buildings be “EV Ready”. This request would align with the Municipal Electric Vehicle Strategy, HalifACT and Council’s Strategic Priority of Environment.4 As mentioned above, retrofitting an existing building for EV charging can be costly and invasive. To support building owners with this transition, the Strategy recommends that the Municipality include EV charging infrastructure as an eligible measure in a future financing program and act as a delivery agent to provide funding through NRCan’s ZEVIP program and other future funding sources. Staff will consider including EV infrastructure as an eligible measure in the Retrofit, Renewables and Resilient program, currently under development, which aims to achieve the building emission reduction targets of HalifACT. Staff will engage with Procurement and Legal Services to determine if HRM can act as a Third-Party Delivery Agent through ZEVIP. If so, an application will be submitted during the next intake round. Education, Advocacy & Legislation In addition to the initiatives above, the Municipality can play a role in educating the public on the benefits of EVs and addressing common misconceptions. The Strategy recommends partnering with existing public education initiatives and strengthening these offerings through in-kind staff time and our outreach networks. In spring 2021, the Municipality partnered with the Clean Foundations Next Ride5 program to support their EV test drive events through offering municipally-owned parking lots free of charge. On July 11th, following all COVID-19 protocols, the Municipality co-hosted Charged Up with the Clean Foundation at the RBC Centre in Burnside. On October 3rd, Halifax co-hosted Electric Avenue at the Canada Games Centre. Even with public charging, supportive policies, and education, achieving the HalifACT target of 100% new vehicles sales being EV by 2030 is not possible without a Zero Emission Vehicle (ZEV) mandate. A ZEV mandate sets mandatory EV sales targets for automakers, ensuring a robust supply for consumers at dealerships. Currently, only 1 in 10 dealerships in Nova Scotia have a single EV in stock. This supply shortage is exacerbated as other jurisdictions implement a ZEV mandate and automakers prioritize those markets. On June 29, 2021, the Government of Canada announced a federal ZEV mandate, requiring 100% of car and passenger truck sales be zero-emission by 20356. This mandate aligns with both Quebec and California, leading North American jurisdictions. On October 27th, 2021, the Environmental Goals and Climate Change Reduction Act7 was introduced. Within this Act is a commitment to develop and implement a ZEV mandate that ensures, at a minimum, that 30% of new vehicle sales of all light-duty and personal
3 Residential Electric Vehicle Charging: A Guide for Local Governments. https://www.richmond.ca/__shared/assets/Residential_EV_Charging_Local_Government_Guide51732.pdf 4 The Electric Vehicle Strategy recommends HRM charter amendments to enable EV Ready parking stalls however this is in error and will be revised to reflect the recommendation contained within this report. 5 Next Ride NS. https://nextridens.com/ 6 Transport Canada, news release. https://www.canada.ca/en/transport-canada/news/2021/06/building-a-green-economy-government-of-canada-to-require-100-of-car-and-passenger-truck-sales-be-zero-emission-by-2035-in-canada.html?fbclid=IwAR1Hg2ivMykQl3gS48h4ah39cmScc_fmzYBJ2MeIri2mbDmOXB4CUCRXIjI 7 Bill NO. 57, Nova Scotia Legislature, https://nslegislature.ca/legc/bills/64th_1st/1st_read/b057.htm

Municipal Electric Vehicle Strategy Standing Committee Report - 9 - November 4, 2021 vehicles in the Province will be zero emission vehicles by 2030. This target is a great step forward to decarbonizing transportation within the Province, however it does not align with the target of HalifACT. Therefore, it is recommended that, should the Act pass as drafted, the Mayor write a letter to the Premier of Nova Scotia requesting that the Provincial ZEV mandate be strengthened to better align with HalifACT. While the Province has not yet defined light-duty and personal vehicles, HRM defines light-duty vehicles as trucks, cars, vans and SUVs weighing under 4,500 kilograms. Municipal Light Duty Fleet Electrification A provincial ZEV mandate would aid in the success of Council’s HalifACT motion to establish a target of net-zero municipal operations by the year 2030, as this includes decarbonizing our corporate fleet. For the scope of this Strategy, Dunsky Consulting looked at electrifying municipal light duty fleet vehicles. As of 2020, the corporate light duty fleet consisted of 541 vehicles, which include cars, pick-up trucks, vans and sport utility vehicles. An analysis of daily usage determined that while the pick-up truck segment has the highest maximum daily kilometres, all existing Canadian-sold EV options have enough battery capacity to cover the maximum required daily driving distance with a single charge.
To ensure all operational needs are met, Dunsky used their Fleet Electrification Optimization model to determine the most cost effective, and least disruptive Optimal electrification Plan (OEP) to achieve a full electric light duty fleet by 2030. The model considered the following:
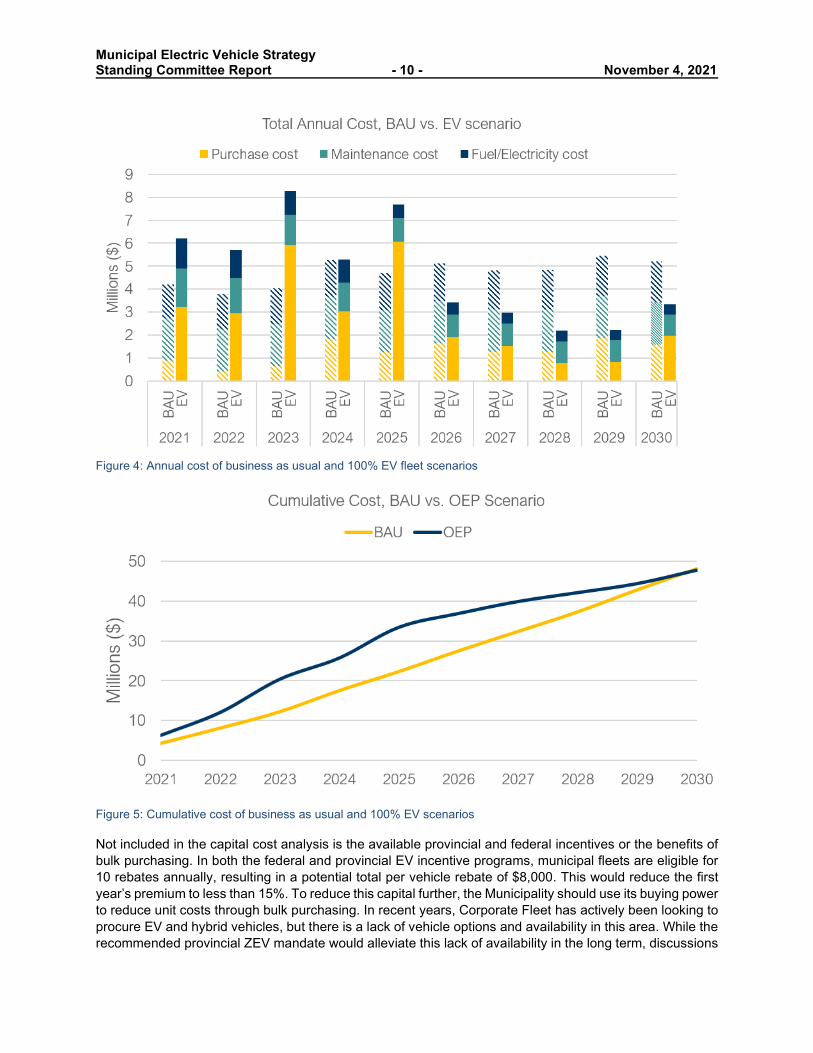
Total Cost of Ownership: This includes upfront cost, maintenance cost, fuel and electricity costs, carbon tax rates. EV Availability Timeline: This includes a list of announced and anticipated vehicles for both BEVs and PHEVs. EV Price Forecast: This includes the cost of vehicle replacements for ICE, BEV and PHEV from 2020 to 2030 for all vehicle segments. Fleet Optimization Algorithm: This determines the optimal year for vehicle replacement to achieve the EV fleet composition set target (i.e. 100% by 2030 for HRM) On average, an electric vehicle purchased today will come at a cost premium of about 30% (about $14,000) when compared to a standard gas vehicle. This cost premium will reduce year over year as EVs move towards cost parity, expected in the late 2020s. Although the initial capital costs will be higher to complete this transition, the accumulated annual operating savings associated with lower fuel costs and less maintenance result in lower total cost of ownership when compared to a business as usual scenario as shown in figures 4 and 5.
Municipal Electric Vehicle Strategy Standing Committee Report - 10 - November 4, 2021
Figure 4: Annual cost of business as usual and 100% EV fleet scenarios
Figure 5: Cumulative cost of business as usual and 100% EV scenarios Not included in the capital cost analysis is the available provincial and federal incentives or the benefits of bulk purchasing. In both the federal and provincial EV incentive programs, municipal fleets are eligible for 10 rebates annually, resulting in a potential total per vehicle rebate of $8,000. This would reduce the first year’s premium to less than 15%. To reduce this capital further, the Municipality should use its buying power to reduce unit costs through bulk purchasing. In recent years, Corporate Fleet has actively been looking to procure EV and hybrid vehicles, but there is a lack of vehicle options and availability in this area. While the recommended provincial ZEV mandate would alleviate this lack of availability in the long term, discussions

Municipal Electric Vehicle Strategy Standing Committee Report - 11 - November 4, 2021 with Original Equipment Manufacturers has suggested that vehicle stock would be guaranteed if clear intent to purchase at bulk was shown. To obtain the most competitive pricing and ensure availability, staff plan to issue a multi-year tender to ensure dedicated stock at competitive pricing is in place. Once issued and closed, staff will report back to Council for budget considerations. With the available incentives and volume purchasing pricing, the premium for procuring electric vehicles should be closer to that of their internal combustion counterparts, reducing the net additional cost. Note that a portion of these costs may be covered by the Corporate Fleet annual budget for vehicle purchases. Table 3: Estimated annual capital required for fleet transition
Municipal Fleet Electrification 2022/23 2023/24 2024/25 2025/26 2026/31 Total
Net Capital (after est. rebate) $3,100,000 $2,900,000 $5,900,000 $3,400,000 $12,500,000 $27,800,000
To ensure the EVs purchased will have dedicated charging ports, design work has begun to outfit our fleet depots. The new fire headquarters at 10 Symonds Road in Bedford has been designed for 40 L2 charging sites. These sites will support the light duty fire fleet transition. The Mackintosh Depot replacement will also include some charging for its fleet vehicles. The other depots will be included for consideration in NRCan’s latest ZEVIP stream which prioritizes commercial and public fleet charging. To minimize capital costs, the depots will be designed for active load management. As most fleet vehicles are at home base by 5 PM, active load management can provide several vehicles a full overnight charge via a single circuit. Estimated annual capital for fleet charging infrastructure is outlined in table 4. These figures do not include cost sharing through ZEVIP (potentially 50%) or any other funding streams as these funds have yet to be secured. Tooling, safety equipment and staff training will be determined by the new Sustainable Green Fleet Analyst. Table 4: Estimated annual capital required for fleet charging.
Municipal Fleet Electrification 2022/23 2023/24 2024/25 2025/26 Total
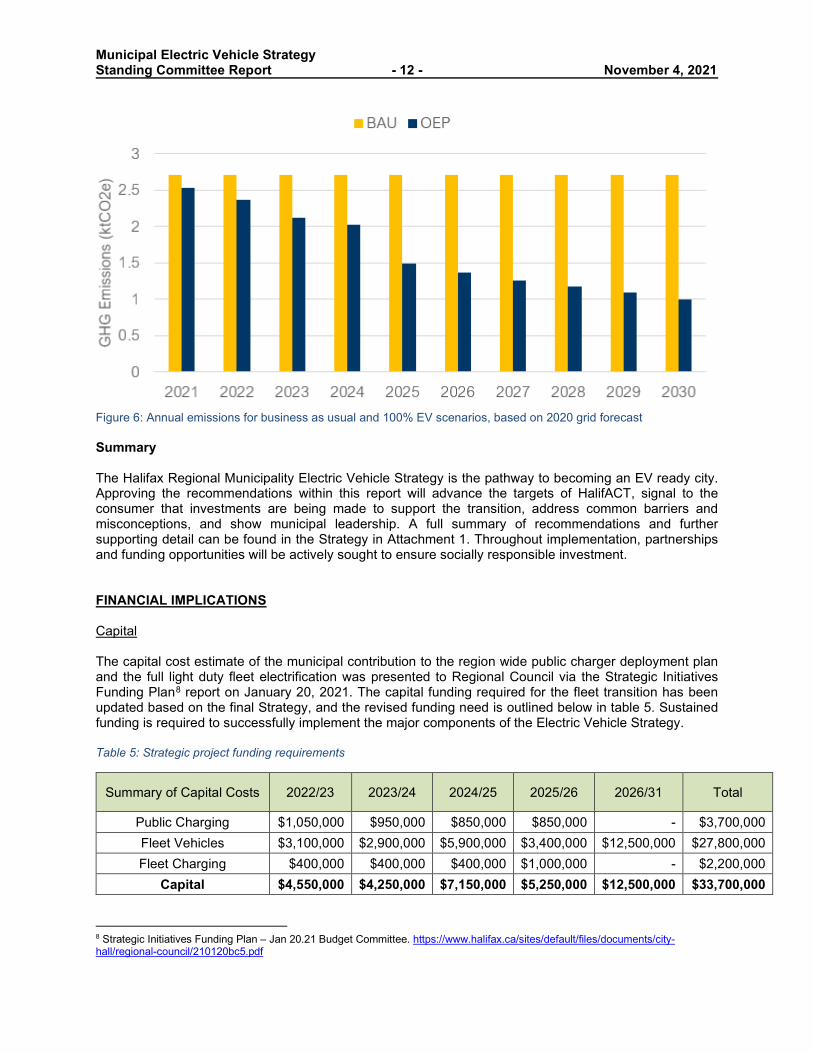
Capital $400,000 $400,000 $400,000 $1,000,000 $2,200,000 Figure 6 compares the annual emissions associated with a business as usual scenario and full fleet electrification, based on a 2020 grid emission forecast. This annual emission reduction may be greater by 2030 as the current Provincial government recently announced a target of 80% renewable electricity by 2030.
Municipal Electric Vehicle Strategy Standing Committee Report - 12 - November 4, 2021
Figure 6: Annual emissions for business as usual and 100% EV scenarios, based on 2020 grid forecast Summary The Halifax Regional Municipality Electric Vehicle Strategy is the pathway to becoming an EV ready city. Approving the recommendations within this report will advance the targets of HalifACT, signal to the consumer that investments are being made to support the transition, address common barriers and misconceptions, and show municipal leadership. A full summary of recommendations and further supporting detail can be found in the Strategy in Attachment 1. Throughout implementation, partnerships and funding opportunities will be actively sought to ensure socially responsible investment. FINANCIAL IMPLICATIONS Capital The capital cost estimate of the municipal contribution to the region wide public charger deployment plan and the full light duty fleet electrification was presented to Regional Council via the Strategic Initiatives Funding Plan8 report on January 20, 2021. The capital funding required for the fleet transition has been updated based on the final Strategy, and the revised funding need is outlined below in table 5. Sustained funding is required to successfully implement the major components of the Electric Vehicle Strategy. Table 5: Strategic project funding requirements
Summary of Capital Costs 2022/23 2023/24 2024/25 2025/26 2026/31 Total
Public Charging $1,050,000 $950,000 $850,000 $850,000 - $3,700,000 Fleet Vehicles $3,100,000 $2,900,000 $5,900,000 $3,400,000 $12,500,000 $27,800,000 Fleet Charging $400,000 $400,000 $400,000 $1,000,000 - $2,200,000
Capital $4,550,000 $4,250,000 $7,150,000 $5,250,000 $12,500,000 $33,700,000
8 Strategic Initiatives Funding Plan – Jan 20.21 Budget Committee. https://www.halifax.ca/sites/default/files/documents/city-hall/regional-council/210120bc5.pdf

Municipal Electric Vehicle Strategy Standing Committee Report - 13 - November 4, 2021 This summary of capital costs does not include future funding opportunities or rebates, aside from the existing federal and provincial vehicle rebate. These capital costs will be refined as funding opportunities are secured. To ensure responsible investments, an application has been submitted to the ZEVIP for 50% cost sharing for 115 public charging ports. This fund will be applied to future public and fleet charging needs. There currently is enough budget in Capital account CB200012 – HalifACT 2050 – Climate Action Plan to initiate the public charging stations portion of the EV Strategy. The planned budget for the next three years in this account is in table 6 below. There are insufficient funds in this account to execute the entire Strategy as this account also funds other Climate Change action items such as deep energy retrofits, solar installations, green infrastructure projects and risk and vulnerability assessments of critical infrastructure. During the 2022/23 capital budget process, additional funds will be requested to support executing the action items in the HalifACT 2050 – Climate Action Plan. Table 6: Current proposed Capital budget for HalifACT 2050 – Climate Action Plan
Budget 2022/23 2023/24 2024/25 Total
CB200012 – HalifACT 2050 – Climate Action Plan $2,000,000 $3,000,000 $4,000,000 $9,000,000
The total capital for the fleet transition is estimated at $27,800,000, which includes current vehicle rebates totalling $80,000 annually. This capital cost will be fully offset by substantial lifecycle savings realized by reduced maintenance and fuel costs. The EV Strategy as part of the Strategic Initiatives Capital Funding will be debt financed. Capital budgets for electric vehicles will be presented to Regional Council for approval based on detailed project plans, project readiness and capacity to deliver. Operating While the fee structure for public charging is still being developed, with estimated fees and usage rates, it is anticipated that the revenues from user fees will offset the cost of electricity and licensing fees. The operating costs for the fleet vehicles and fleet charging stations should be significantly lower than with combustion vehicles in the business as usual scenario. Exact cost savings would depend on the fleet replacement schedule, vehicles usage and rates of both fuel and electricity. As an example, at current prices, the cost to drive an electric vehicle is approximately ¼ the cost to drive a comparable combustion engine the same distance. There is sufficient existing operating budget to cover the cost to operate and maintain vehicles and there will be operating cost savings as the fleet converts to electric vehicles. RISK CONSIDERATION A key risk is lack of capital and personnel resources to successfully implement at the rate required to achieve the goals of HalifACT. Implementing the municipal portion of the Public Deployment Plan and the full fleet transition will require the capital outlined in table 5 above. Although the initial capital costs will be higher to complete the fleet transition, the accumulated annual operating savings result in lower total cost of ownership when compared to a business as usual scenario. Public and fleet charging will require project management and coordination with the utility, property owners (as some fleet deports are leased) and charger manufacturers throughout operation. The fleet transition will require a modification in fleet logistics to ensure all vehicles are fully charged and operational needs can be met.

Municipal Electric Vehicle Strategy Standing Committee Report - 14 - November 4, 2021 Currently, there is a lack of availability of EVs in the region. This scarcity, if not improved through a ZEV mandate or the multi-year tender recommended above, will pose a significant risk to completing the fleet transition by 2030. Staff will continue to explore options and report back to Regional Council if additional direction is required. Overall, the risks associated with climate change are complex and multifaceted. Regional Council has declared a climate emergency and by not reacting promptly and effectively, Halifax could be faced with a reputational risk with its citizens, stakeholders, and other cities and governments. Climate change poses an immediate and long-term risk to human health, the built environment, and the natural environment. If climate change is not considered in financial decision-making, there is the risk of investing poorly and maladapting, resulting in long-term costs that are exponentially higher. By not investing in and preparing for climate change, resiliency becomes more difficult, and the physical and economic impacts of climate change will have the greatest effect on the most vulnerable sectors of society. COMMUNITY ENGAGEMENT As outlined in the Strategy, engagement was conducted with leaders in the sector within the community. One of these stakeholders was the Electric Vehicle Association of Atlantic Canada, which represents both owners and those interested in EVs within the community. Additionally, significant community engagement relating to the items discussed above was completed during the development of HalifACT. ENVIRONMENTAL IMPLICATIONS There is significant environmental benefit to the recommendation as outlined in the report. ALTERNATIVES The Environment and Sustainability Standing Committee may choose to refuse or modify some or all of the recommendations outlined in this report. ATTACHMENTS Attachment 1: Halifax Regional Municipality Electric Vehicle Strategy ______________________________________________________________________ A copy of this report can be obtained online at halifax.ca or by contacting the Office of the Municipal Clerk at 902.490.4210. Report Prepared by: Kevin Boutilier, Clean Energy Specialist, Environment & Climate Change, 902.719.8567 ____________________________________________________________________________________

ELECTRIC VEHICLESTRATEGYSupporting the municipality in achieving its electricmobility goals .

Submitted to:
Halifax Regional Municipality
PO Box 1749
Halifax NS B3J 3A5
Halifax.ca | [email protected]
902-719-8567
Prepared by:
Dunsky Energy Consulting
50 Ste-Catherine St. West, suite 420
Montreal, QC, H2X 3V4
www.dunsky.com | [email protected]
+ 1 514 504 9030
In partnership with:
AES Engineering
About Dunsky
Dunsky provides strategic analysis and counsel focused exclusively on helping our clients accelerate
the clean energy transition, effectively and responsibly.
With a focus on buildings, renewables and mobility, our 30+ experts support our clients –
governments, utilities and others – through three key services: we assess opportunities (technical,
economic, market); design strategies (programs, plans, policies); and evaluate performance (with a
view to continuous improvement).

HalifACT, the municipality’s long-term climate action plan to reduce emissions and help communities
adapt to a changing climate, identified critical actions needed to decrease emissions from the
transportation sector. Halifax Regional Municipality is looking to build on its climate leadership by planning
for a city with decarbonized transportation.
The Halifax region has seen little electric vehicle (EV) adoption to date. Many barriers remain for residents
who are looking to purchase an EV, including access to charging infrastructure, high capital costs, and
limited availability of EVs.
The Halifax Regional Municipality Electric Vehicle Strategy provides ambitious yet achievable actions that
will help catalyze EV adoption in a significant way over the next ten years by addressing the barriers to
adoption specific to the Halifax region. The Strategy was developed through stakeholder engagement, a
review of leading practices, as well as modeling and analysis.
To help reach HRM’s ambitious EV targets, the following actions are recommended:
• Deploy charging infrastructure to alleviate the barrier associated with access to charging and
enable residents to charge at work, in urban/suburban areas, and on highways.
• Electrify the municipal light duty fleet by following the optimal municipal fleet electrification
plan which enables 100% transition to electric vehicles by 2030.
• Enable greater access to home and workplace charging by implementing policies requiring
100% EV ready parking in new residential construction and 10-20% EV ready parking in non-
residential buildings.
• Advocate for sustained funding for both provincial and federal purchase incentives and a
provincial ZEV mandate.
• Support existing public education initiatives through funding existing campaigns, sharing EV
information on HRM’s platforms, and training dedicated staff to support ongoing activities.
HRM’s EV Strategy puts the Region on a pathway to deliver on its HalifACT climate action goals and
enable greater adoption of electric mobility for all residents.
Executive Summary
Urban/Suburban Highway
Charging
DC Fast Charging
≈100 ports by 2030 L2 Charging
≈1000 ports by 2030
On-street Off-street

1. Introduction ................................................................................................................... 1
1.1 – Context ................................................................................................................................................. 1
1.2 – Barriers to Electric Vehicle Adoption ................................................................................................. 1
1.3 – The Halifax Region EV Landscape ...................................................................................................... 2 EV adoption ..................................................................................................................................... 2 Public Charging Infrastructure .......................................................................................................... 3 EV Policies ....................................................................................................................................... 4
1.4 – Developing the Strategy ...................................................................................................................... 4 Objective ......................................................................................................................................... 4 Methodology .................................................................................................................................... 4
1.5 – Report Purpose and Structure ............................................................................................................ 6
2. Public Charging Infrastructure..................................................................................... 7
2.1 – Public Infrastructure and EV Adoption .............................................................................................. 7
2.2 – Types of Charging Infrastructure ....................................................................................................... 7 Direct Current Fast Charging ........................................................................................................... 7 Level 2 Charging ............................................................................................................................ 10
2.3 – Municipal Initiatives in Public Infrastructure ................................................................................... 11 Toronto, Ontario ............................................................................................................................. 11 Victoria, British Columbia ............................................................................................................... 12 Montreal, Québec .......................................................................................................................... 13
2.4 – Halifax Region Context ...................................................................................................................... 14
2.5 – Public Charging Infrastructure Plan ................................................................................................. 17 Methodology .................................................................................................................................. 17 Recommended Charging Infrastructure ......................................................................................... 19 Cost Considerations ...................................................................................................................... 24 Potential Sites ................................................................................................................................ 24 Deployment Partnerships ............................................................................................................... 26 Funding opportunities .................................................................................................................... 26 Monitoring and Adapting ................................................................................................................ 27
3. Fleet Electrification ..................................................................................................... 28
3.1 – Context ............................................................................................................................................... 28
3.2 – Methodology ...................................................................................................................................... 28
3.3 – Fleet Electrification Plan ................................................................................................................... 29 Scenarios ...................................................................................................................................... 29 Fleet Electrification Roadmap ......................................................................................................... 29 Charging Infrastructure Requirements ............................................................................................ 33 Cost Considerations ...................................................................................................................... 35 Operational Considerations ........................................................................................................... 37
Table of Contents

4. Municipal EV Policies ................................................................................................. 38
4.1 – EV Ready Requirements for New Construction............................................................................... 38 Policy Implementation .................................................................................................................... 39
4.2 – EV Ready Retrofits in Existing Buildings.......................................................................................... 39
5. Advocacy and Support ............................................................................................... 40
5.1 – Advocate for Sustained Financial Incentives ................................................................................... 40
5.2 – Advocate for a ZEV Mandate ............................................................................................................. 40
5.3 – Public Education ................................................................................................................................ 41
6. Strategy Map ................................................................................................................ 43
Appendix A. List of Stakeholders .............................................................................. 45
Appendix B. EVA Methodology .................................................................................. 46
Appendix C. Annual Deployment Plan ...................................................................... 49
Appendix D. Vehicle Models Options ........................................................................ 50

List of Figures
Figure 1 — Breakdown of the Halifax region’s 2016 transportation sector emissions by vehicle segment 1 Figure 2 — Cumulative EV sales by province as of Q3 2019 3 Figure 3 — Petro-Can Direct Current Fast Charging stations 9 Figure 4 — On-street level 2 charging in Montreal, Quebec 10 Figure 5 — Current public charging infrastructure in HRM 15 Figure 6 — Heat map of households in a building that has 5 or more storeys in the urban core of the Halifax
region 18 Figure 7 — Heat map of median driving distance (km) one way in the Halifax region 19 Figure 8 — Additional L2 Ports (left) and additional DCFC ports (right) 20 Figure 9 — Geographic distribution of chargers for phase 1 and 2 22 Figure 10 — Map showcasing some examples of charging locations 26 Figure 11 — Left: Fleet composition by vehicle segment. Right: Maximum average daily kilometers driven by
vehicle segment 28 Figure 12 — Fleet electrification roadmap by vehicle segment 30 Figure 13 — Proportion of EVs vs. ICE vehicles in the fleet (2021 – 2030) 31 Figure 14 — Annual fleet GHG emissions of BAU vs. OEP 32 Figure 15 — Cumulative GHG emissions of BAU vs. OEP scenarios 33 Figure 16 — Number of EVSE needed for the fleet with potential for circuit sharing 34 Figure 17 — Installation cost of electrical vehicle service equipment with and without power sharing 34 Figure 18 — Total annual cost for BAU and OEP scenarios 36 Figure 19 — Discounted incremental cash flow for the OEP scenario 36 Figure 20 — NPV Difference between OEP and BAU as a function of discount rate 37
List of Tables
Table 1 — Charging time needed to add 300 km for DCFC 7 Table 2 — Business case assessment of a DC Fast Charger in the Halifax Region 8 Table 3 — Examples of DCFC site locations 9 Table 4 — Charging time needed to add 300 km using L2 chargers 10 Table 5 — Examples of level 2 charging site locations 11 Table 6 — Location of current L2 charging sites 16 Table 7 — Details of the phased Public Charging Infrastructure Plan for HRM 21 Table 8 — Cost estimates of Phase 1 and Phase 2 24 Table 9 — Cost estimate outline of 100% EV sales 2030 24 Table 10 — Scenarios for the Fleet Electrification Plan 29 Table 11— Fleet electrification roadmap by vehicle segment and powertrain type 31

Glossary of Terms and Acronyms
BEV Battery electric vehicle
DCFC Direct current fast charging
EV Electric vehicle
EV energy
management system
(EVEMS)
A means used to control EVSE loads through the process of connecting,
disconnecting, increasing, or reducing electric power to the loads and consisting of
any of the following: a monitor(s), communications equipment, a controller(s), a
timer(s), and other applicable device(s). By controlling EVSE loads, EVEMSs can
ensure that the electrical capacity of a circuit is not exceeded. EVEMSs can thereby
reduce the electrical capacity and associated infrastructure costs necessary to provide
EV charging in a building. EVEMSs are sometimes referred to as “load sharing,”
“power sharing” or “smart charging”.
EV Ready Energized electrical outlet capable of providing “Level 2” charging
EV supply equipment
(EVSE)
A complete assembly consisting of conductors, connectors, devices, apparatus, and
fittings installed specifically for the purpose of power transfer and information exchange
between a branch electric circuit and an electric vehicle. Also referred to as a
“charging station”
EVA Dunsky’s electric vehicle adoption model
HalifACT HRM’s long-term climate action plan
Halifax Region Refers to the community
Halifax Regional
Municipality (HRM)
Refers to the municipal government
ICEV Internal combustion engine vehicle
L2 Level 2 charging
MURB Multi-unit residential building
NSPI Nova Scotia Power Inc.
PHEV Plug-in hybrid electric vehicle
TCO Total cost of ownership
Zero emission vehicle
(ZEV)
Vehicle which produces no emissions from the on-board source of power (e.g. electric
vehicle, hydrogen fuel cell vehicle)

| efficiency • renewables • mobility
1
1. Introduction
1.1 – Context
In June 2020, Halifax Regional Council unanimously approved HalifACT1, the municipality’s long-term
climate action plan to reduce emissions and help communities adapt to a changing climate. HalifACT is
seen as one of the most ambitious climate action plans in Canada, targeting steep and rapid reduction in
emissions with a target of 75% reduction over 2016 levels by 2030 and net-zero by 2050. The pathway to
net-zero was developed by assessing the opportunities within multiple sectors including buildings, energy
supply, transportation, water, wastewater, and solid
waste.
The transportation sector is the second highest energy
consumer in the Halifax region, accounting for 30% of
energy use and 20% of emissions2. Particularly, light
duty cars and trucks make up around 90%2 of the
overall emissions in this sector (Figure 1). To achieve the
required emission reductions in this sector, HalifACT
provides specific recommendations for increasing
transit, active transportation, and electric mobility.
Specifically, HalifACT recommends that HRM (the
municipal government) takes significant actions to
substantially increase the uptake of personal and
commercial light duty electric vehicles (EVs). In addition,
HalifACT recommends that HRM adopts a commitment to
achieve net-zero municipal operations by 2030, which
includes electrifying all municipal fleet vehicles.
This report lays out the Halifax Regional Municipality Electric Vehicle Strategy, which consists of a list of
direct and indirect strategic actions that will put the Halifax region on the path to accomplish its ambitious
electric mobility objectives.
1.2 – Barriers to Electric Vehicle Adoption
Despite growing sales globally and across Canada, EVs still face several barriers that impede their wide-
spread adoption; most notably:
1 HalifACT: Acting on Climate Together 2 Halifax Regional Municipality: Energy use and Greenhouse Gas Emissions Baseline Inventory, 2016 & Business-
As usual Scenario to 2050
Figure 1 — Breakdown of the Halifax region’s 2016 transportation sector emissions by vehicle segment
Cars, 43%
Light Trucks,
46%
Heavy Trucks,
8%
Buses, 3%
| efficiency • renewables • mobility
2
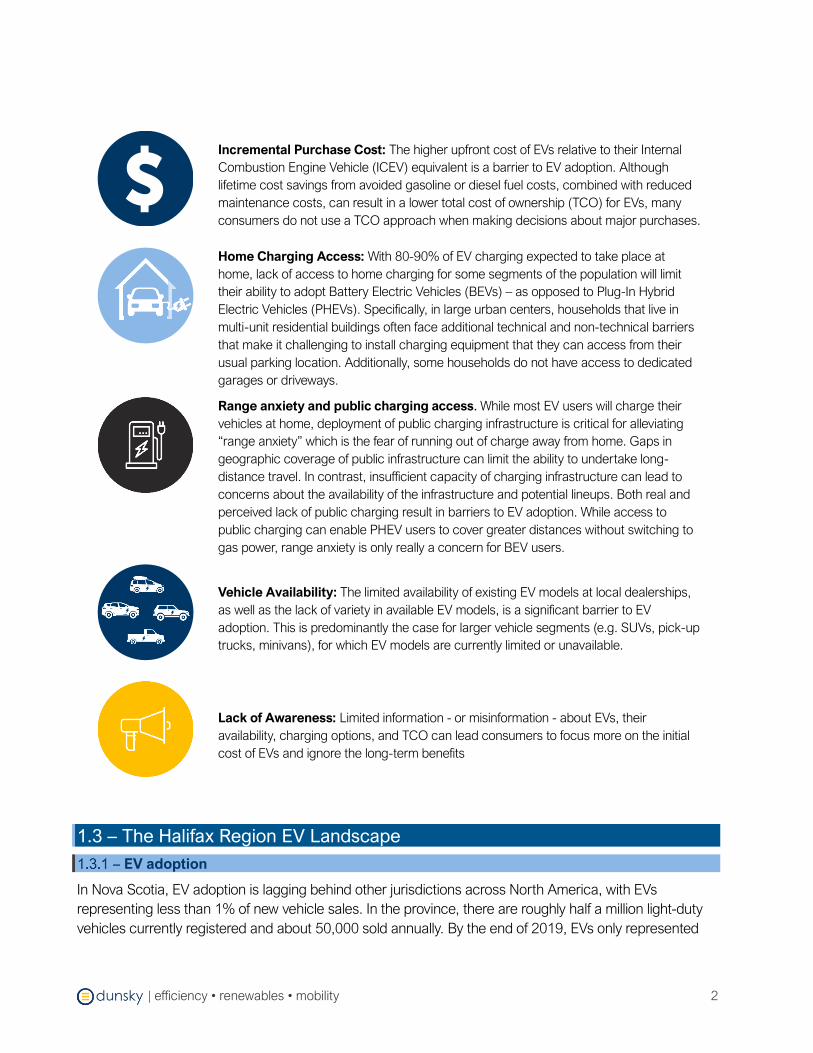
Incremental Purchase Cost: The higher upfront cost of EVs relative to their Internal
Combustion Engine Vehicle (ICEV) equivalent is a barrier to EV adoption. Although
lifetime cost savings from avoided gasoline or diesel fuel costs, combined with reduced
maintenance costs, can result in a lower total cost of ownership (TCO) for EVs, many
consumers do not use a TCO approach when making decisions about major purchases.
Home Charging Access: With 80-90% of EV charging expected to take place at
home, lack of access to home charging for some segments of the population will limit
their ability to adopt Battery Electric Vehicles (BEVs) – as opposed to Plug-In Hybrid
Electric Vehicles (PHEVs). Specifically, in large urban centers, households that live in
multi-unit residential buildings often face additional technical and non-technical barriers
that make it challenging to install charging equipment that they can access from their
usual parking location. Additionally, some households do not have access to dedicated
garages or driveways.
Range anxiety and public charging access. While most EV users will charge their
vehicles at home, deployment of public charging infrastructure is critical for alleviating
“range anxiety” which is the fear of running out of charge away from home. Gaps in
geographic coverage of public infrastructure can limit the ability to undertake long-
distance travel. In contrast, insufficient capacity of charging infrastructure can lead to
concerns about the availability of the infrastructure and potential lineups. Both real and
perceived lack of public charging result in barriers to EV adoption. While access to
public charging can enable PHEV users to cover greater distances without switching to
gas power, range anxiety is only really a concern for BEV users.
Vehicle Availability: The limited availability of existing EV models at local dealerships,
as well as the lack of variety in available EV models, is a significant barrier to EV
adoption. This is predominantly the case for larger vehicle segments (e.g. SUVs, pick-up
trucks, minivans), for which EV models are currently limited or unavailable.
Lack of Awareness: Limited information - or misinformation - about EVs, their
availability, charging options, and TCO can lead consumers to focus more on the initial
cost of EVs and ignore the long-term benefits
1.3 – The Halifax Region EV Landscape
EV adoption
In Nova Scotia, EV adoption is lagging behind other jurisdictions across North America, with EVs
representing less than 1% of new vehicle sales. In the province, there are roughly half a million light-duty
vehicles currently registered and about 50,000 sold annually. By the end of 2019, EVs only represented

| efficiency • renewables • mobility
3
0.3% of annual vehicle sales, with approximately 400 EVs on the roads (≈250 EVs registered in HRM3).
Compared to other parts of Canada, the Halifax region has had a relatively limited EV market, falling
significantly behind other leading markets. Specifically, EV adoption in Canada today is centered in the
three provinces that have provided, or currently provide, purchase incentives, among other supporting
policies and investments; Quebec, Ontario, and British Columbia. Figure 2 outlines the number of EV sales
per province which has Nova Scotia ranking 6th in the country.
Figure 2 — Cumulative EV sales by province as of Q3 20194
Public Charging Infrastructure
There has been some progress made to date in Nova Scotia in terms of the deployment of DCFC
infrastructure, but substantially more investment is required. While most of this has been led by Nova
Scotia Power Inc. (NSPI), there is uncertainty around future investments given that the Nova Scotia Utility
and Review Board rejected NSPI’s latest request to make rate-based investments in charging
infrastructure. Currently, it is not clear who will be involved in public infrastructure deployment
within the Halifax region.
3 Data retrieved from the Nova Scotia Department of Energy and Mines 4 Electric Mobility Canada (2019), “Electric Vehicle Sales in Canada – Q3 2019”

| efficiency • renewables • mobility
4
EV Policies
In the Canadian context, provincial incentives have proven
to have a clear impact on adoption, as demonstrated in
Quebec, British Columbia, and Ontario. There is also
evidence of the long-term impact of incentives, with
Ontario’s EV market share of new vehicle sales remaining
well ahead of other provinces despite their rebates ending
in 2018. While the lack of provincial incentives in recent
years has put Nova Scotia behind the leading jurisdictions
in Canada, newly implemented provincial incentives
will help alleviate financial barriers and encourage
further adoption.
One of the key barriers to adoption in Nova Scotia is the
limited availability of EV models in dealerships. Dunsky’s
analysis showed that only 1 in 10 dealerships in Nova
Scotia have at least one EV available for purchase. This
has been further echoed by local stakeholders who
acknowledged long wait times and a complete lack of
availability of certain models. Currently, Nova Scotia does not have a ZEV mandate which is the
most effective tool available to deal with the supply constraint on EVs.
While the percentage of residents living in multi-unit residential buildings (MURBs) is lower in the Halifax
region than in some other major cities, access to charging in MURBs is still an important barrier to
adoption. The Halifax region does not currently have any building requirements for EV charging
in private parking spots.
1.4 – Developing the Strategy
Objective
To realize the emission reductions required from the transportation sector, HalifACT provided HRM with a
clear direction to take serious actions to accelerate the transition to EVs. The Halifax region is currently
facing specific barriers to EV adoption that require a tailored approach and strategic actions. We
developed this made-for-Halifax strategy to provide ambitious yet achievable actions that will help
catalyze EV adoption in a significant way over the next ten years by addressing the barriers to
adoption specific to the Halifax region.
Methodology
As part of the procurement process, HRM had identified the need to develop detailed plans for both
municipal fleet electrification and public charging infrastructure. For that reason, the strategy focuses on
providing HRM with a clear path forward on those fronts. In addition, we identified and recommended
additional actions that can be implemented or supported by HRM which will be critical in developing a
A provincial ZEV
mandate combined with
provincial incentives can
significantly increase EV
uptake in Nova Scotia –
exceeding the Federal
target of 30% new
vehicle sales.
Electric Vehicle Adoption in Nova
Scotia: 2020 – 2030
Prepared by Dunsky Energy Consulting
For Ecology Action Centre

| efficiency • renewables • mobility
5
thriving EV ecosystem and move the Halifax region towards its mobility goals. As part of the process, we
leveraged our deep expertise and experience in clean mobility and EV policies and our proprietary models
and tools, reviewed EV strategies in other jurisdictions, and conducted stakeholder engagement with HRM
staff and leaders in the sector within the community.
Modeling and Analysis
The Strategy leveraged results from a recently published report
by the Ecology Action Centre, Electric Vehicle Adoption in Nova
Scotia 2020-20305, which evaluated the potential for EV adoption
in the province under various policy scenarios. The study was
conducted by Dunsky and leverages the use of our Electric
Vehicle Adoption (EVA) model. We used the results under the
most ambitious adoption scenario from the adoption model to
determine the appropriate level of charging infrastructure
necessary and to develop a suitable public charging
infrastructure plan. Additional modelling was conducted to
develop the municipal fleet electrification plan using Dunsky’s
Fleet Electrification Optimization model. The model was used to
determine the optimal path for electrification while reducing costs
and maximizing benefits.
Stakeholder Engagement
In order to capture a broad spectrum of perspectives, a variety of stakeholders were engaged to inform
the development of the strategy including HRM staff and external key stakeholders from the community
(Appendix A). Interviews were conducted to help shape the Strategy and build support throughout the
process. Following the development of the draft Strategy, a workshop was held to solicit input on next
steps, obtain support for implementation of the strategy, and ensure no major gaps exist.
Overall, there was broad support for the strategy from all stakeholders consulted. Key insights include:
• Stakeholders believed that the strategy’s public charging infrastructure plan provided fulsome
geographic coverage that is aligned with the ambition of the HalifACT plan.
• HRM should engage with NSPI and leverage their experience in charging infrastructure deployment.
• Stakeholders indicated the importance of equity considerations in the geographic distribution of
infrastructure.
• HRM should prepare an information package to engage with the private sector for partnerships for
charging infrastructure deployment.
5 https://ecologyaction.ca/press-release/fuelling-change-electric-vehicles-ecology-action-centre-calls-provincial-
action
~65,000 EVs on the road
forecasted by 2030 under a
Zero-Emission Vehicle
mandate and provincial
incentives.
Electric Vehicle Adoption in Nova Scotia:
2020 – 2030
Prepared by Dunsky Energy Consulting for
Ecology Action Centre

| efficiency • renewables • mobility
6
• HRM should engage with real-estate developers as part of its process of implementing EV policies in
new construction.
• A suggestion was proposed to create an on-going working group for electric mobility that brings
together key stakeholders and ensures coordination.
1.5 – Report Purpose and Structure
This report provides the technical details and context for the Strategy. It includes a list of direct and
indirect strategic actions that will support the Halifax region’s transition to decarbonize light duty
transportation. Direct actions are those that can be implemented by HRM while indirect actions are those
that HRM can help advocate for and/or support their implementation.
The strategy includes four key areas of focus:
1. Public Charging Infrastructure: this section includes a detailed plan of the number of chargers
needed within the Halifax region, specific recommendations on geographical locations, and overall
cost estimates.
2. Fleet Electrification: this section provides HRM with a clear roadmap for electrifying its light duty
fleet to achieve its 100% EV target in the most cost effective and the least disruptive way.
3. Municipal EV Policies: this section includes specific recommendations on municipal policies that
can help increase access to home charging which will alleviate a significant barrier to EV adoption.
4. Advocacy and Support: this section covers critical actions that are outside of HRMs direct control
but which they can advocate for.
Technical details of each area of focus are covered under dedicated sections in the report. This report will
be accompanied by a public-facing document that will briefly and concisely summarize the key action
areas laid out in this strategy.
| efficiency • renewables • mobility
7
2. Public Charging Infrastructure
2.1 – Public Infrastructure and EV Adoption
A key lever for enabling EV adoption is public charging infrastructure. While most charging is typically done
at home overnight, public charging provides additional flexibility for EV drivers covering longer distances,
easing range anxiety. Range anxiety is the concern that the car’s battery will run out before finding a
location to charge at. Along with easing range anxiety, public charging provides an alternative charging
option for those without access to home charging. Visibility of public charging also signals to consumers
that investments are being made for EV infrastructure and can improve adoption levels.
2.2 – Types of Charging Infrastructure
Direct Current Fast Charging
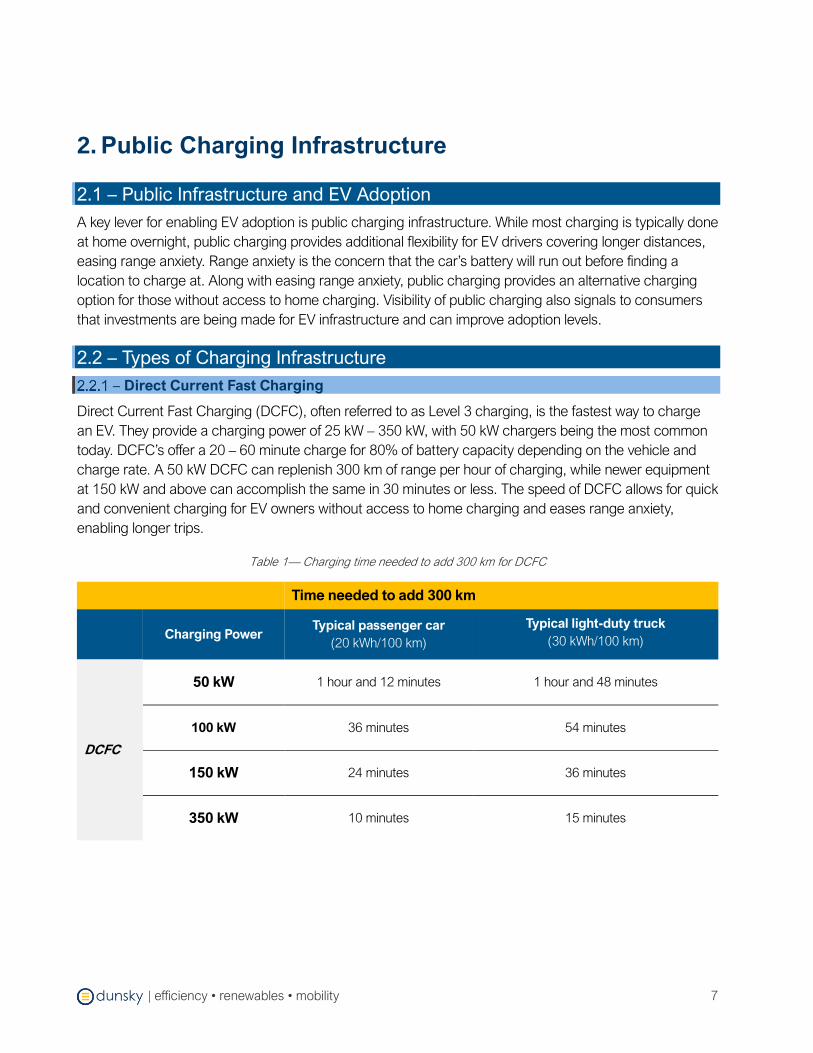
Direct Current Fast Charging (DCFC), often referred to as Level 3 charging, is the fastest way to charge
an EV. They provide a charging power of 25 kW – 350 kW, with 50 kW chargers being the most common
today. DCFC’s offer a 20 – 60 minute charge for 80% of battery capacity depending on the vehicle and
charge rate. A 50 kW DCFC can replenish 300 km of range per hour of charging, while newer equipment
at 150 kW and above can accomplish the same in 30 minutes or less. The speed of DCFC allows for quick
and convenient charging for EV owners without access to home charging and eases range anxiety,
enabling longer trips.
Table 1— Charging time needed to add 300 km for DCFC
Time needed to add 300 km
Charging Power Typical passenger car
(20 kWh/100 km)
Typical light-duty truck
(30 kWh/100 km)
DCFC
50 kW 1 hour and 12 minutes 1 hour and 48 minutes
100 kW 36 minutes 54 minutes
150 kW 24 minutes 36 minutes
350 kW 10 minutes 15 minutes

| efficiency • renewables • mobility
8
Currently the Halifax region has three DCFC stations. High
costs and low revenue opportunities mean there is a lack of
investment in this space. An illustrative example of the
business case based on a 10% utilization rate (maturing
market) is presented in Table 2. Early deployments have
been led by NSPI, but there will be a need for ongoing
expansion in the future to fill the gaps by densifying charging
in urban/suburban areas and adding sites on highway
corridors. Overall, HRM will need to initially step in to fill the
market gap as well as advocate for NSPI to deploy fast
chargers themselves or provide a demand charges rate
structure that helps with improving the business case.
Table 2 — Business case assessment of a DC Fast Charger in the Halifax Region
Expenses Assumptions
Capital Cost $150,000 150 kW DCFC charger including equipment
and installation costs
Demand Charges/year $18,000 $10 per kW demand charge
Energy Charges/year $6,570 10% utilization rate, 75 kW average charging power, and
$0.10/kWh electricity rate
Annual Operation &
Maintenance $1,500
Expected DCFC annual O&M costs including planned and
unplanned repairs as well as site maintenance6
Annual Costs $26,070
Revenue Assumptions
Scenario 1 $13,140 Current usage fee ($0.25/min or $15/hour)
Scenario 2 $26,280 Hypothetical usage fee ($0.50/min or $30/hour)
6 EVSE Pilot – Costs and Reliability - AVISTA
Even with a higher
usage fee than what is
currently being used in
Nova Scotia, revenue
from a fast charger will
barely cover operation
costs with no prospects
of a return on capital
costs.

| efficiency • renewables • mobility
9
Urban/Suburban fast charging hubs:
To reduce barriers experienced by those
without access to home charging,
DCFC works best at convenient
locations that people are already visiting
regularly, like grocery stores or malls.
Making charging accessible in a
location where drivers can charge while
doing short tasks, such as eating or
shopping, is a convenient way for
people to charge their vehicle. The ideal
geographic distance should allow for
everyone to reach a DCFC charger
within a 5-minute drive in populous
urban/suburban areas.
Highway fast charging: DCFC should be deployed along highway corridors so drivers can quickly
charge up on longer trips. Having frequent stations (within 60 km of each other) eases range anxiety and
placing stations by amenities like restaurants or stores adds convenience for drivers.
Table 3 — Examples of DCFC site locations
Urban/Suburban Fast Charging Hubs Highway Fast Charging
• Grocery stores
• Shopping centers
• Central restaurants
• Rest stops
• Fast food restaurants
• Coffee shops
• Visitor centers
• Gas stations
In the short-term, urban/suburban DCFC hubs should be deployed in convenient locations beside
amenities in MURB dense areas and along highway corridors to ensure stations are within 60 km of each
other. In the medium to long term, additional ports should be added to the most heavily utilized stations to
avoid congestion and additional stations should be added to fill any charging gaps found.
Figure 3 — Petro-Can Direct Current Fast Charging stations

| efficiency • renewables • mobility
10
Level 2 Charging
A typical Level 2 (L2) charger (7.2 kW is most common today) can charge an EV at a rate of
approximately 40 km of range per hour. L2 chargers are most commonly used at homes, workplaces and
public charging locations. While less impactful than DCFC due to their slower charge times, the lower cost
of L2 charging makes it easier to deploy and can be leveraged where longer charge times are not a
hinderance to drivers. Currently, the Halifax region has approximately 40 L2 chargers that are primarily
located in the downtown core.
Table 4 — Charging time needed to add 300 km using L2 chargers
Time needed to add 300 km
Charging Power Typical passenger car
(20 kWh/100 km)
Typical light-duty truck
(30 kWh/100 km)
Level 2 7.2 kW 8.3 hours 12.5 hours
20 kW 3 hours 4.5 hours
On-street charging: Deploying on-street, curbside charging in
MURB dense areas can potentially alleviate charging barriers for
those that do not have access to home charging, provided they
are conveniently located. Dedicated on-street parking spots for EV
charging can provide a substitute for home charging, particularly
for those who do not have access to off-street parking, enabling
the convenience of overnight charging close to home. Additionally,
on-street charging can be deployed in urban commercial areas
(e.g. downtown core). The complexity of installing charging in the
curbside environment, typically requiring underground wiring,
dedicated mounting pedestals and cable management, leads to
higher overall costs than installations in off-street parking lots. On-
street charging also requires supporting parking policy to
established parking spaces that are reserved for EVs while
charging.
Workplace Charging: L2 stations are ideal for workplace
charging as drivers can plug in when they arrive and have a fully
charged vehicle eight hours later when leaving work. Workplace
charging sites can either be in a private parking lots or in public
parking lots that are primarily used for workplace parking.
Public parking lots: A type of off-street charging that places charging sites at locations where people
would leave their car parked for several hours. This includes parking lots at locations like parks, rec
centers, retail outlets, or movie theatres. This segment also includes park and ride sites, where a driver
Figure 4 — On-street level 2 charging in Montreal, Quebec

| efficiency • renewables • mobility
11
could opt to park their car and continue their journey using another mode of transportation (i.e. public
transit).
Table 5 — Examples of level 2 charging site locations
On-street charging Workplace Charging Public Parking Lots
• City streets that have high
levels of on-street parking
• Private workplace parking lots
• Public parkades used for
workplace parking
• Public parks
• Recreation centres
• Movie theatres
• Retail and grocery stores
• Park and rides
In the short term L2 on-street charging should be deployed on residential streets in MURB dense areas,
workplace parking lots and urban/suburban parking lots in populous areas. Park and ride locations can
incorporate L2 stations depending on the typical usage of those lots and whether EV drivers are likely to
benefit from charging there. The medium to long-term strategy will depend heavily on home charging
access in MURBs. If charging access does not substantially improve in MURBs then additional curbside
and workplace L2 charging will need to be added.
2.3 – Municipal Initiatives in Public Infrastructure
Municipal governments are playing a critical role in public infrastructure across Canada, with Toronto,
Victoria, and Montreal leading the way.
Toronto, Ontario
In 2020 the City of Toronto developed an Electric Vehicle Strategy7 that identifies a range of actions to help
the City achieve its 2050 goal of having all transportation powered by zero carbon energy sources. The EV
Strategy’s ultimate objective is having 100% of light-duty vehicles being zero emitting by 2050.
To meet these long-term goals, significant EV uptake is required in Toronto. Currently, approximately 0.6%
of vehicles registered in the City are EVs. There are also currently very few public EV charging stations
across the city: 131 L2 sites (602 ports) and 30 DCFC sites (102 ports). While there are approximately 20
City-owned EV charging stations in Toronto, 19 of which are L2 and 1 that is DCFC, these stations are
only available to City vehicles. Public, city-owned charging infrastructure pilots are currently underway.
Toronto’s 2020 EV Strategy identifies an overall need for 650 DCFC ports and 10,000 L2 ports in public
locations by 2030.
Toronto currently has the following programs and strategies to address charging infrastructure needs in
the City:
7 https://www.toronto.ca/wp-content/uploads/2020/02/8c46-City-of-Toronto-Electric-Vehicle-Strategy.pdf
| efficiency • renewables • mobility
12
• Residential On-street EV Charging Station Pilot: A pilot project is underway that will install on-
street public charging infrastructure in residential permit parking areas. Plans call for 13 stations at 7
locations that may include electrical and streetlight poles. The charging station parking spots are open
to all electric vehicle owners with a “Level 2” connection on their vehicle. To use the stations, EV
drivers can register for an account online with FLO, Canada’s Largest EV charging network. Once
signed up, users can download the app and order a FLO card that they will use to activate the station
and charge their vehicle. Toronto Hydro, in agreement with the City of Toronto, established the EV
charging rates that apply to the chargers, which are competitive with the cost of other public charging
stations in Toronto. Rates during the day are $2 per hour, while overnight will be a flat $3 fee. A higher
day rate encourages users to free up the station for daytime drivers but the lower flat fee at night
means residents can leave their car overnight and drive off in the morning fully charged. 8 Led by
Toronto Hydro and Transportation Services.
• Downtown On-street EV Charging Station Pilot: A pilot project that will install on-street public
charging infrastructure in Toronto’s downtown core. Current plans call for 3 stations at 2 locations.
Led by Toronto Hydro and Transportation Services.
• Parking Garage Charge Station Pilot Project: A pilot project that will install charging infrastructure
in Toronto Parking Authority (TPA) operated parking facilities. Led by Toronto Hydro and TPA.
• Toronto Green Standard: The Toronto Green Standard (TGS) outlines sustainable design
requirements for new private and city-owned developments. The TGS includes mandatory (Tier 1) and
voluntary (Tiers 2 – 4) guidelines. They include standards for charging infrastructure including
mandatory requirements for the installation of charging infrastructure and EV-capable parking spots in
new developments. Led by City Planning.
• Toronto Hydro’s EV Charging Infrastructure Strategy: Toronto Hydro is continually examining the
impacts of EV charging on the grid and accommodating within its infrastructure planning activities.
• Waterfront Toronto: An initiative involving the federal, provincial and City governments to renew
Toronto’s waterfront. The initiative requires all buildings governed by Toronto Waterfront to meet
minimum green building requirements, which include minimum requirements for charging
infrastructure (i.e. 2% of parking spaces require L2 charging infrastructure, with the remaining spaces
being EV-ready).
Victoria, British Columbia
The City of Victoria has committed to expanding public EV charging options to help meet the climate
change targets of an 80 per cent reduction in greenhouse gas emissions from 2007 levels and a switch to
100 per cent renewable energy by 2040 as outlined in the City’s Climate Leadership Plan.
The Victoria region has made remarkable progress on electric vehicle (EV) adoption to date, with the
highest percentage of EV sales anywhere in Canada. Victoria's Electric Vehicle Strategy identifies actions
to help the City of Victoria meet its Climate Leadership Plan goal of renewable energy powering 30% of
passenger vehicles registered in Victoria by 2030.
8 https://electricautonomy.ca/2020/11/07/toronto-curbside-ev-charging/

| efficiency • renewables • mobility
13
Within the City of Victoria9, there were 825 EVs on the road in 2020, representing approximately 12% of
new vehicle sales and nearly 2% of all vehicles registered in Victoria. The broader Capital Regional
District had 5,698 EVs on the road in 2020.
The City of Victoria only has 74 Level 2 public charging ports, and no fast charging ports, while the
broader Capital Regional District has 210 Level 2 ports and 29 DCFC ports. Since 2013, the City has
been investing in EV charging infrastructure and now owns and operates 13 public Level 2 chargers
located in five City-owned parkades as well as six recently installed curbside chargers on Broad Street.
Funding for the chargers and the installation has been provided in part by NRCAN’s Zero Emission Vehicle
Infrastructure Program and the CleanBC Go Electric Program in collaboration with BC Hydro. There is a
fee for use of the chargers and users will be required to limit their stay to 40 minutes. Beginning on
January 4, 2021, a $1 per hour EV charging fee came into effect for all City-owned EV chargers, including
those in parkades and along Broad Street. Parking and EV charging fees can be combined and paid for
using the Flo App or using a preloaded Flo purchase card on Broad Street and in the Johnson Street
parkade. Parking restrictions are in place to ensure that only EVs that are charging are parked in the EV
parking stalls.
The City of Victoria has been working with BC Hydro to install the city’s first DCFC station with two ports at
the south end of Store Street. Construction is underway with the chargers expected to be ready for public
use by April 2021.
Going forward, the City of Victoria is currently working with Dunsky Energy Consulting to identify needs for
public Level 2 and DCFC charging ports required to achieve the City’s target of zero-emission vehicles
representing 30% of vehicles in circulation by 2030.
Montreal, Québec
Quebec is a leading market for EV adoption in Canada thanks to a range of programs and policies,
including financial incentives, a ZEV mandate that sets mandatory targets for EV sales for automakers,
and a robust public charging ecosystem. Since its launch in 2012, Hydro Quebec’s Electric Circuit public
charging network has deployed over 3000 public charging ports, including 450 DCFC ports as of early
2021. In 2018, Hydro Quebec’s regulator approved a plan to deploy 1600 DCFC ports over 10 years, on
the basis that this deployment would support increased adoption of EVs and an overall increase in
revenue. This revenue would come from electricity sales through residential charging that would offset the
costs of DCFC deployment. This approval has led to an acceleration of Hydro Quebec’s deployment of
DCFCs across the province.
The City of Montreal has partnered with the Electric Circuit for deployments within the City, including both
public Level 2 and DCFC ports. As of early 2021, there were over 1000 Level 2 ports and 17 DCFC ports
on the Electric Circuit network within the City of Montreal. While Hydro Quebec covers the full cost of
9 The City of Victoria is a relatively small portion of greater Victoria, with a population of 85,792 out of a total
383,360 in the Capital Regional District.

| efficiency • renewables • mobility
14
installation and operation of DCFC ports within Montreal, Montreal assumes all costs for Level 2 ports.
Over 500 of the City’s Level 2 ports are installed in curbside locations, particularly in dense
neighbourhoods with limited off-street parking. Montreal’s 2020-2030 Climate Plan10 includes an action to
grow this network further through ongoing collaboration with Hydro Quebec.
Usage fees for Electric Circuit charging stations in Montreal include either a $2.50 per session flat fee or
$1 per hour for Level 2 chargers (including curbside chargers) and $12 per hour for 50 kW fast chargers.
2.4 – Halifax Region Context
HalifACT, HRM’s ambitious climate action plan, aims to shift the Halifax region to a low-carbon economy
by 2050. HalifACT acknowledges that wide-spread adoption of EVs will require a significant amount of
coordination with local partners and industry specialists to prepare for a shift from gasoline to electricity.11
Significant deployment of public infrastructure is required to drive adoption levels and be ready for
increased charging needs. These deployments will provide EV drivers with access to significantly more
charging infrastructure and alleviate important barriers to adoption.
Nova Scotia has seen some investment in public charging infrastructure thanks to initiatives led by NSPI
and some private organizations with the support of the federal government through Natural Resources
Canada’s Electric Vehicle and Alternative Fuel Infrastructure Deployment Initiative. At the end of 2019, 66
L2 stations and 17 DCFC stations were installed across the province. Unfortunately, there is uncertainty
around future investments from the NSPI given that the Nova Scotia Utility and Review Board rejected
NSPI’s latest request to make rate-based investments in charging infrastructure. Specifically, there are
currently 40 L2 stations and three DCFC stations12 in the Halifax region as shown in Figure 5.
The first noticeable gap with current public infrastructure is the lack of fast charging. There are only three
DCFC sites, one of which is solely for charging Tesla vehicles and is located outside of the urban core.
With only one DCFC Tesla station along a highway corridor, charging sites along major highway routes will
be needed to ease range anxiety and enable quick and convenient charging on longer trips. The other two
DCFC sites are in Spryfield and the South end of the peninsula. This is not enough for the more populous
neighbourhoods, especially on the peninsula. DCFC hubs will need to be added in densely populated
urban and suburban neighbourhoods to provide charging for those without access to home charging.
10 https://montreal.ca/en/articles/montreal-climate-plan-objective-carbon-neutral-2050-7613 11 https://www.halifax.ca/sites/default/files/documents/about-the-city/energy-
environment/HRM_HaliFACT_vNew%20Logo_.pdf 12 Vehicle dealerships fast charging sites have been excluded as they typically see minimal use

| efficiency • renewables • mobility
15
While there is decent
geographic coverage of L2 off-
street charging sites across the
more densely populated urban
and suburban neighbourhoods,
most of the charging sites only
have 1-2 ports. While
geographical coverage is
important, having charging
hubs with multiple ports
creates a more reliable system
that will be more convenient for
the end user. It is also important to note
that the current L2 sites are primarily for
off-street charging, located in parking lots
of amenities such as shopping centers,
grocery stores and public buildings. While
off-street charging is convenient for many
people, there is a lack of on-street
charging in residential areas that can
serve as a substitute for those without
easy access to charging at home.
Figure 5 — Current public charging infrastructure in HRM
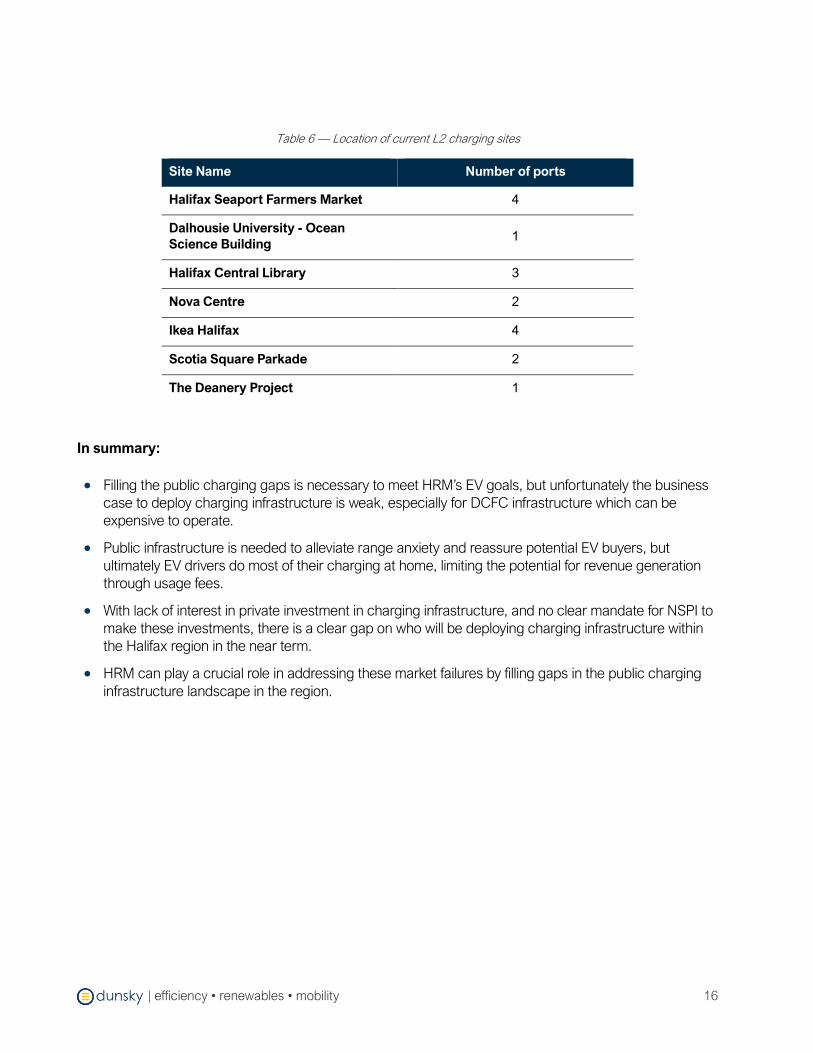
| efficiency • renewables • mobility
16
Table 6 — Location of current L2 charging sites
Site Name Number of ports
Halifax Seaport Farmers Market 4
Dalhousie University - Ocean
Science Building 1
Halifax Central Library 3
Nova Centre 2
Ikea Halifax 4
Scotia Square Parkade 2
The Deanery Project 1
In summary:
• Filling the public charging gaps is necessary to meet HRM’s EV goals, but unfortunately the business
case to deploy charging infrastructure is weak, especially for DCFC infrastructure which can be
expensive to operate.
• Public infrastructure is needed to alleviate range anxiety and reassure potential EV buyers, but
ultimately EV drivers do most of their charging at home, limiting the potential for revenue generation
through usage fees.
• With lack of interest in private investment in charging infrastructure, and no clear mandate for NSPI to
make these investments, there is a clear gap on who will be deploying charging infrastructure within
the Halifax region in the near term.
• HRM can play a crucial role in addressing these market failures by filling gaps in the public charging
infrastructure landscape in the region.

| efficiency • renewables • mobility
17
2.5 – Public Charging Infrastructure Plan
Methodology
Dunsky’s EV Adoption (EVA) Model was used to determine the necessary levels of public charging
infrastructure needed to be deployed to support the EV population resulting from 30% EV market share
(new sales) by 2030. Combined with a qualitative assessment of charging locations, we developed a
detailed public infrastructure deployment plan that provides numbers of chargers needed, types of
chargers, and geographical considerations.
The EVA Model incorporates learnings from leading jurisdictions regarding optimal levels of charging
infrastructure deployment to support a growing EV population. See Appendix B for more details on the
EVA modeling methodology. In 2020, Dunsky was retained to model province-wide adoption scenarios for
Nova Scotia on behalf of the Ecology Action Centre13. Results from this analysis were leveraged to identify
potential trajectories for EV adoption and required infrastructure deployment levels within the Halifax
region.
To validate the current landscape in Nova Scotia in terms of the effect of policies and intervention on EV
adoption, our team conducted consultations with key stakeholders in the Halifax region. Relevant market
actors included local and provincial governments, utilities, industry associations, and automotive
dealerships. Interviews focused on understanding the challenges and barriers specific to Nova Scotia.
Along with stakeholder consultation, the public infrastructure deployment plan was created by conducting
a qualitative assessment of public infrastructure gaps. Gaps were identified by assessing the following:
• Baseline charging site locations14
• Driving distance15
• Multi-unit residential building dense areas15
Figure 6 shows the number of multi-unit residential buildings across the Halifax region. Through our
assessment we concluded that MURBs of five stories or more are mostly centered in the downtown core
and surrounding areas. This indicates that the focus needs to be on off-street and on-street charging hubs
on the peninsula and the surrounding areas to accommodate those without home charging access.
Unlike larger cities like Toronto or Vancouver, most of the Halifax region’s population does not live in
MURBs as it consists of a mix of urban, suburban, and rural regions. Toronto has approximately 30% of
their population living in buildings that are 5 storeys or more, while the Halifax region has 10%. That 10%
13 https://ecologyaction.ca/press-release/fuelling-change-electric-vehicles-ecology-action-centre-calls-provincial-
action 14 Data for baseline charging site locations was retrieved from PlugShare’s EV Charging Station Map and
NRCan’s Electric Charging and Alternative Fuelling Stations Locator tool 15 Data was retrieved from the Canadian Urban Sustainability Practitioners Energy Poverty and Equity Explorer
Tool

| efficiency • renewables • mobility
18
of the population is concentrated on the peninsula, with certain neighbourhoods having up to 87% of
households in buildings with 5 or more storeys.
Figure 6 — Heat map of households in a building that has 5 or more storeys in the urban core of the Halifax region
Figure 7 shows the variability of the median cumulative driving distance (one-way) across the Halifax
region. Through our analysis, we found that residents in central urban/suburban neighbourhoods
surrounding the peninsula are not driving a significant distance in their commute (<10 km one-way).
However, residents in the surrounding suburban/rural regions are driving longer distances as many are
likely commuting into the urban core for work. Residents in the more rural, east end of the Halifax region
tend to drive less as they are not likely commuting into the urban core. These insights indicate the need to
improve charging access along commuting highways and improve workplace charging for those
commuting into the peninsula.

| efficiency • renewables • mobility
19
Figure 7— Heat map of median driving distance (km) one way in the Halifax region
Recommended Charging Infrastructure
The following categories are necessary for implementing a successful public charging plan in the Halifax
region:
Urban/Suburban DCFC hubs
DCFC highway charging
L2 on-street charging
L2 off-street parking
The charging categories highlighted above were selected to cover a range of use cases for EV charging.
The public infrastructure deployment plan is split into two phases - the first phase from 2021 to 2025 and
the second from 2026 to 2030.

| efficiency • renewables • mobility
20
In both Phase 1 and Phase 2, the North End and South End of the urban core require the most L2
charging to accommodate for high levels of both off-street and on-street parking. Dartmouth and Bedford
require the second highest L2 charging to accommodate for high levels of MURBs and workplace
charging. Figure 8 shows the total number of L2 ports and DCFC ports needed for both phases.
Phase 1 has a lower installation rate than Phase 2 to account for ramp up in adoption and to allow time for
monitoring and assessment. In Phase 1, the majority of deployed L2 charging should be off-street parking
(approximately 80%), which will play a more critical role than on-street charging in early adoption. The
remaining 20% of ports should be installed on residential streets where there are residents who rely on on-
street parking and where the street configuration facilitates curbside installations. With no current DCFC
highway charging available, Phase 1 looks to deploy eight sites to increase geographic coverage across
the Halifax region. The plan details the level of public charging infrastructure needed to reduce adoption
Phase 1
Timeline: 2021-2025
Objective: Increase geographical
coverage across the Halifax region in
both urban, suburban and rural areas
DCFC Ports: 16
Level 2 Ports: 336
Phase 2
Timeline: 2026-2030
Objective: Fill remaining gaps and add
charging capacity where needed as
adoption grows
DCFC Ports: 52
Level 2 Ports: 650
HRM Public Charging Infrastructure Plan
Figure 8 — Additional L2 Ports (left) and additional DCFC ports (right)
0
5
10
15
20
25
30
35
40
45
50
Urban/Suburban DCFC
hubs
DCFC highway
charging
Nu
mb
er
of D
CF
C P
ort
s
Phase 1 Phase 2
0
100
200
300
400
500
600
700
800
On-street charging Off-street charging
Nu
mb
er
of L
2 P
ort
s
Phase 1 Phase 2

| efficiency • renewables • mobility
21
barriers and support the EV population forecasted by 2030. Table 7 outlines the phased plan in more
detail.
Table 7 — Details of the phased Public Charging Infrastructure Plan for HRM
Phase 1 L2
Sites
L2
Ports/Site
L2
Ports
DCFC
Sites
DCFC
Ports/Site
DCFC
Ports # of EVs
1 Urban/Suburban DCFC
hubs 0 0 0 8 2 16
13,314 2 DCFC highway charging 0 0 0 8 3 24
3 On street L2 charging 12 6 72 0 0 0
4 Off-street L2 charging 30 6 or 12 264 0 0 0
Phase 1 Total 42 336 16 2 to 3 40
Phase 2 L2
Sites
L2
Ports/Site
L2
Ports
DCFC
Sites
DCFC
Ports/Site
DCFC
Ports # of EVs
1 Urban/Suburban DCFC
hubs 0 0 0 0
add 4 ports
to existing
sites.
32
64,578 2 DCFC highway charging 0 0 0 5 4 20
3 On street L2 charging 28 6 168 0 0 0
4 Off-street L2 charging 43 6 or 20 482 0 0 0
Phase 2 Total 71 650 5 4 52
Overall Plan 113 986 21 2 to 4 92
As shown in Figure 9 below, the plan includes highway charging sites with greater geographic range with
3-4 ports per site, a sufficient port-to-site ratio to ensure that drivers will have access to a free port. In the
more populated urban/suburban areas, DCFC sites are located in 8 neighbourhoods so that everyone is
within a five-minute drive of a DCFC site. The urban/suburban DCFC sites initially have 2 ports per site in
Phase 1 for early adopters and increase the port-to-site ratio to a total of 6 ports per site in Phase 2. As
the sites already provide good geographic coverage, Phase 2 focuses on increasing ports as adoption
grows. In all cases, sites should be future-proofed to minimize the cost of future expansions to add
additional ports.

| efficiency • renewables • mobility
22
Figure 9 — Geographic distribution of chargers for phase 1 and 2

| efficiency • renewables • mobility
23
Key Public Charging Infrastructure Plan highlights include:
• Installing over 100 DCFC ports and around 1,000 L2 ports.
• Increasing geographic coverage in over 20 areas (8 in the urban/suburban core, and 13 in the greater
Halifax region)
• Outlining the needed L2 and DCFC charging to support goal that 30% of all new vehicle sales are EV
by 2030. Under this scenario there will be approximately 6000 EVs on the road in the Halifax region by
2025 and 29,000 EVs by 2030.
• Additional public infrastructure deployment would be needed to support the goal that 100% of all new
vehicle sales are EV by 2030. It would require approximately 3500 L2 ports and 330 DCFC ports to
be deployed by 2030. Under this more ambitious scenario there will be a total of 200,000 EVs on the
road in all of Nova Scotia by 2030 and roughly 90,000 EVs on the road in the Halifax region by 2030.

| efficiency • renewables • mobility
24
Cost Considerations
The capital cost estimate of the public charging infrastructure plan is around $23 million. Table 8 outlines
the cost breakdown for Phase 1 and Phase 2 per charging category. DCFC infrastructure costs dominate
the overall costs. While off-street charging has a higher level of deployment than on-street (80% of ports in
Phase 1 are off-street) the cost estimates of the two segments are roughly the same. This is attributed to
the higher cost of on-street charging, which is roughly three times as much as off-street parking16.
Table 8 — Cost estimates of Phase 1 and Phase 2
Scenario: 30% EV Sales by 2030
Phase L2
DCFC On-street Off-street
Phase 1 (2021-2025) $1,080,000 $1,320,000 $7,800,000
Phase 2 (2025-2030) $2,520,000 $2,410,000 $7,850,000
Totals $3,600,000 $3,730,000 $15,650,000
Program Total ~$23,000,000
While this was not included in the detailed plan, we evaluated the level of infrastructure needed to
support the projected EV population under 100% EV sales by 2030 scenario. The estimated capital
cost for that scenario would increase the overall cost to $80 million.
Table 9 — Cost estimate outline of 100% EV sales 2030
Scenario: 100% EV Sales by 2030
Phase L2
DCFC On-street Off-street
Totals $11,880,000 $12,309,000 $54,500,000
Program Total ~$78,700,000
Potential Sites
The municipality provided a list of potential EV charging sites at municipal locations and several were
chosen as high potential sites based on the following criteria:
Urban/Suburban DCFC hubs: Sites are near amenities where people tend to spend 15 – 45 minutes.
This includes grocery stores, shopping centers, and food services. Sites should not be chosen where
people typically spend longer periods of time as DCFC charging does not typically require more than
45 minutes. Locations such as movie theatres or parks are not ideal for DCFC sites.
16 This is mainly due to the higher cost associated with electrical infrastructure for on-street installations.

| efficiency • renewables • mobility
25
L2 off-street charging: Best suited at locations where people would leave their car parked for several
hours, such as parks, rec centers, or movie theatres. This also includes central public parking lots that
are used for park and ride or workplace parking. Private workplace parking lots are also included in
this segment, but site location is dependant on the property owner.
Figure 10 shows a few examples of potential locations for deployment based on geographic coverage. We
advise that this is a high-level example and site locations will depend on site conditions and will need to be
determined on a case-by-case basis.

| efficiency • renewables • mobility
26
Figure 10 — Map showcasing some examples of charging locations
Deployment Partnerships
There are different methods when it comes to HRM deploying EV charging infrastructure:
• Own and operate: This is when HRM pays the upfront costs to deploy and operate the charging
sites. HRM can also retain ownership of the equipment while outsourcing the operation of the site to a
third party. Generally, this is the deployment model that has been implemented by municipalities
across North America.
• Make Ready: This is strictly a utility deployment model where the utility pays for and owns the
electrical infrastructure on the site, leaving the site host to choose charging equipment that best fits
their needs. HRM can work with NSPI to enable a make ready program.
• Leasing: HRM owns the charging infrastructure but a third party agrees to rent the site for a period of
time.
With a lack of a business case at this stage for private investment in public infrastructure and NSPI unable
to make further investments without regulatory approval, HRM should play an immediate active role in
deployment of charging infrastructure while advocating for regulatory change that can allow greater
support from the electric utility. If NSPI is given approval in the future to either deploy infrastructure directly
or provide incentives, this will reduce the pressure on HRM to be the sole actor in this area. Likewise, as
EV adoption increases and the economics of operating charging infrastructure improve, HRM can either
continue deployment with a more attractive business case or support a transition towards third party
ownership of charging sites.
Funding opportunities
As highlighted above, the level of investment that will be needed from HRM will be dependent on the
evolution of the market and the level of engagement from market players in public charging infrastructure.
However, there are existing and potential funding opportunities that HRM can leverage to reduce its overall
cost of deployment. Funding sources include:
• Natural Resource Canada’s Zero Emission Vehicle Infrastructure Program (ZEVIP) is specifically
designed to deploy zero-emission vehicle charging (L2 and higher) where Canadians live, work and
play. The program targets multiple streams like public places, on-street, workplaces, and light-duty
vehicle fleets. The program releases multiple requests for proposals each year focusing on one or
several streams at a time. HRM should continuously monitor the program to ensure no funding
opportunities are missed.
• Natural Resource Canada’s Electric Vehicle and Alternative Fuel Infrastructure Deployment Initiative
aims to establish a coast-to-coast network of fast-charging stations along the national highway
systems. Given the wide-spread geography of the Halifax region, HRM can leverage this program to
cover a portion of the deployment costs for highway fast charging.
• The Federation of Canadian Municipalities Green Municipal Fund (GMF) provides municipalities
funding to switch to innovative and sustainable practices, faster. There is a precedent where the GMF
was used to fund charging infrastructure as part of innovative mobility solutions. HRM should consider
leveraging the fund to cover a portion of charging infrastructure deployment costs in urban centres.

| efficiency • renewables • mobility
27
• The Investing in Canada Infrastructure Program (ICIP) has a funding stream dedicated for green
infrastructure which includes EV charging.
Monitoring and Adapting
Phase 2 deployment can benefit from the learnings of Phase 1. EV adoption rates, forecasts and site
usage should be monitored on a semi-annual or annual basis to shift Phase 2 plans appropriately.
Utilization of existing charging sites can help inform which sites would benefit from expansion, and more
broadly, which types of infrastructure have been most successful in supporting adoption. Residents
without access to charging at home may gravitate towards either using nearby on-street L2 infrastructure
or may instead use a nearby fast charger roughly once a week. Usage data from existing stations can help
to understand whether one type of infrastructure is in higher demand and worthy of higher levels of
investment.
L2 on-street charging should be monitored closely as usage levels can help determine the streets and
neighbourhoods that are most reliant on the infrastructure. Further analysis is needed to fully determine
the role of curbside charging in phase 2. A larger analysis of housing data is needed, specifically the
number of homes and streets with no driveways/garages. Also, the number of MURB EV charging retrofits
will have a significant impact on the level of on-street charging that will be necessary in Phase 2.
That said, utilization should not be the only metric of success for all types of charging infrastructure.
DCFC sites can have an outsized impact on encouraging EV adoption by providing a level of reassurance
with the possibility of a quick top-up, even if ultimately this reassurance is only put to use on occasion.
Usage data analysis can be complemented with user and general population surveys to gain a better
understanding of the degree to which infrastructure investments are having an impact.

| efficiency • renewables • mobility
28
3. Fleet Electrification
3.1 – Context
The primary objective of this component of the strategy is to develop clear recommendations for the least
disruptive light-duty fleet transition pathway. HalifACT includes a commitment to achieve net-zero
municipal operations by 2030, which includes electrifying 100% of corporate fleet vehicles.
The current corporate fleet consists of 541 light-duty vehicles with cars (e.g. hatchbacks, sedans) making
up almost 40% of the fleet composition. The second largest segment is pick-up trucks, making up almost
a quarter of the total fleet. The pick-up truck segment also has the highest maximum average daily
kilometers driven, as shown in Figure 11. The maximum daily kilometers driven highlights that, on average,
all vehicles in the fleet would be able to cover the required maximum daily distance within the
range of a typical EV (300-400 km) in each of the respective vehicle segments. It should be noted that
some fleet vehicles will also be idling for significant amounts of time which can influence the range of the
vehicles. However, electric vehicles offer additional benefits in terms of cost savings for vehicles with high
idling time.
Figure 11— Left: Fleet composition by vehicle segment. Right: Maximum average daily kilometers driven by vehicle segment
3.2 – Methodology
Dunsky’s Fleet Electrification Optimization model was used to determine the most optimal pathway for
electrification of the corporate fleet. The most optimal pathway will achieve electrification in the most cost-
effective way, while meeting the requirements of the fleet and minimizing disruption to operations.
38%
21%
18%
23%
Fleet Composition by Vehicle Segment
CAR SUV VAN PICK UP TRUCK
0
50
100
150
200
250
300
350
CAR PICK UP
TRUCK
SUV VAN
Kilo
mete
rs
Maximum Average Daily Kilometers Driven

| efficiency • renewables • mobility
29
Specifically, the model includes the following:
• Total Cost of Ownership (TCO): includes upfront cost, maintenance cost, fuel and electricity costs,
carbon tax rates.
• Dunsky’s EV Availability Timeline: includes a list of announced and anticipated vehicles for both
BEVs and PHEVs.
• Dunsky’s EV Price Forecast: includes the cost of vehicle replacements for ICE, BEV and PHEV from
2020 to 2030 for all vehicle segments.
• Fleet Optimization Algorithm: determines the optimal year for vehicle replacement in order to
achieve the EV fleet composition set target (i.e. 100% by 2030 for HRM)
3.3 – Fleet Electrification Plan
Scenarios
To assess the economic and GHG impact of the electrification plan, two scenarios that reflect different
levels of electrification were developed as shown in Table 10. The business as usual (BAU) scenario
represents the status-quo assuming the continued use of gas-powered vehicles. The Optimal
Electrification Plan (OEP) scenario includes the 100% by 2030 target with option for early replacements of
vehicles before 2030 in cases where there is an economic advantage.
Table 10 — Scenarios for the Fleet Electrification Plan
Business as Usual (BAU) Optimal Electrification Plan (OEP)
Electrification Target 0% 100% by 2030
Planned Retirement Threshold 15 years or 400,000 km 15 years or 400,000 km
Early Retirement N/A Optimal year
Fleet Electrification Roadmap
The fleet electrification roadmap presents a detailed yearly plan that includes the specific numbers of
vehicles electrified, vehicle types (e.g. SUV, car), and powertrain technology (BEV, PHEV) for every year.
Figure 12 highlights the numbers of EVs added to the fleet by vehicle type per year from 2020 to 2030.
During the first two years we set a ten percent replacement limit that was applied to reduce disruption to
operations and gradually introduce EVs into the fleet.
In 2023, the replacement limit is increased, specifically in the car and SUV segments. In 2025, there is a
significant increase in pick-up truck EVs which is due to the anticipated availability of these vehicles during
that year, which will unlock the electrification potential for that vehicle segment. A significant proportion of
the fleet (i.e. 75%) is replaced within the first five years of the study period as shown in Figure 13. Given
that the model only recommends early replacement based on an advantageous economic case versus
the status quo, this is an indication of the positive business case for EVs despite their higher capital cost.
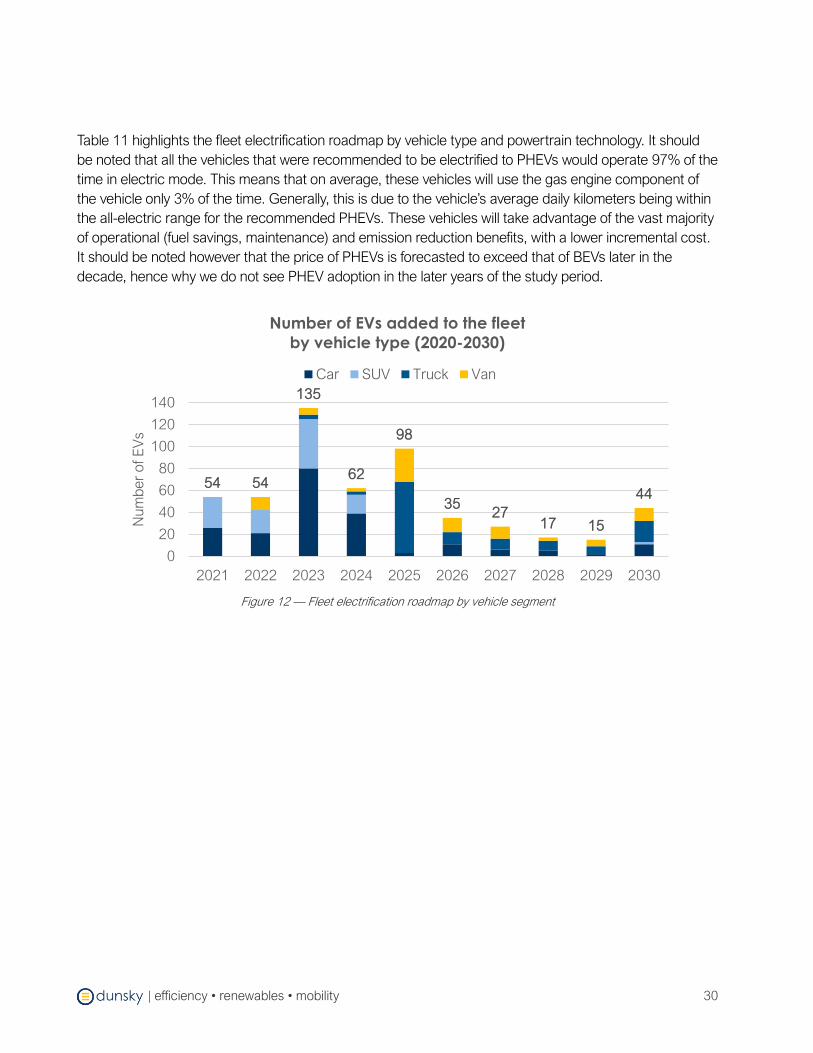
| efficiency • renewables • mobility
30
Table 11 highlights the fleet electrification roadmap by vehicle type and powertrain technology. It should
be noted that all the vehicles that were recommended to be electrified to PHEVs would operate 97% of the
time in electric mode. This means that on average, these vehicles will use the gas engine component of
the vehicle only 3% of the time. Generally, this is due to the vehicle’s average daily kilometers being within
the all-electric range for the recommended PHEVs. These vehicles will take advantage of the vast majority
of operational (fuel savings, maintenance) and emission reduction benefits, with a lower incremental cost.
It should be noted however that the price of PHEVs is forecasted to exceed that of BEVs later in the
decade, hence why we do not see PHEV adoption in the later years of the study period.
Figure 12 — Fleet electrification roadmap by vehicle segment
54 54
135
62
98
3527
17 15
44
0
20
40
60
80
100
120
140
2021 2022 2023 2024 2025 2026 2027 2028 2029 2030
Nu
mb
er
of E
Vs
Number of EVs added to the fleet
by vehicle type (2020-2030)
Car SUV Truck Van

| efficiency • renewables • mobility
31
Figure 13 — Proportion of EVs vs. ICE vehicles in the fleet (2021 – 2030)
Table 11—Fleet electrification roadmap by vehicle segment and powertrain type
Vehicle Type 2021 2022 2023 2024 2025 2026 2027 2028 2029 2030 Total
CAR 26 21 80 39 3 11 6 5 2 11 204
BEV 23 16 17 3 3 11 6 5 2 11 97
PHEV 3 5 63 36 - - - - - - 107
PICK UP TRUCK 4 3 65 11 10 9 7 19 128
BEV 4 3 65 11 10 9 7 19 128
SUV 28 21 45 17 2 113
BEV 9 1 3 3 - - - - - 2 18
PHEV 19 20 42 14 - - - - - - 95
VAN 12 6 3 30 13 11 3 6 12 96
BEV 11 6 3 30 13 11 3 6 12 95
PHEV 1 - - - - - - - - 1
Total 54 54 135 62 98 35 27 17 15 44 541
BEV 32 28 30 12 98 35 27 17 15 44
PHEV 22 26 105 50
10%20%
45%56%
74% 81% 86% 89% 92%100%
0%
20%
40%
60%
80%
100%
2021 2022 2023 2024 2025 2026 2027 2028 2029 2030
Proportion of EVs vs ICE Vehicles in the Fleet
(2020 -2030)
ICE EV
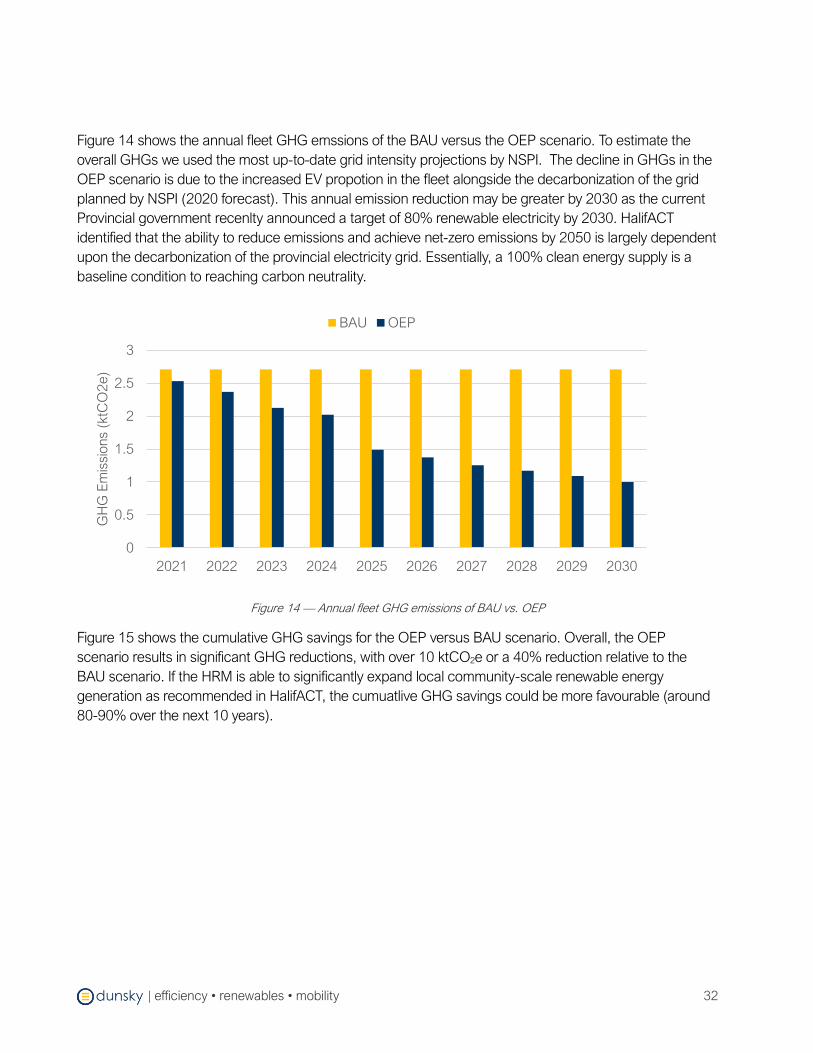
| efficiency • renewables • mobility
32
Figure 14 shows the annual fleet GHG emssions of the BAU versus the OEP scenario. To estimate the
overall GHGs we used the most up-to-date grid intensity projections by NSPI. The decline in GHGs in the
OEP scenario is due to the increased EV propotion in the fleet alongside the decarbonization of the grid
planned by NSPI (2020 forecast). This annual emission reduction may be greater by 2030 as the current
Provincial government recenlty announced a target of 80% renewable electricity by 2030. HalifACT
identified that the ability to reduce emissions and achieve net-zero emissions by 2050 is largely dependent
upon the decarbonization of the provincial electricity grid. Essentially, a 100% clean energy supply is a
baseline condition to reaching carbon neutrality.
Figure 14 — Annual fleet GHG emissions of BAU vs. OEP
Figure 15 shows the cumulative GHG savings for the OEP versus BAU scenario. Overall, the OEP
scenario results in significant GHG reductions, with over 10 ktCO2e or a 40% reduction relative to the
BAU scenario. If the HRM is able to significantly expand local community-scale renewable energy
generation as recommended in HalifACT, the cumuatlive GHG savings could be more favourable (around
80-90% over the next 10 years).
0
0.5
1
1.5
2
2.5
3
2021 2022 2023 2024 2025 2026 2027 2028 2029 2030
GH
G E
mis
sio
ns
(ktC
O2
e)
BAU OEP

| efficiency • renewables • mobility
33
Figure 15 — Cumulative GHG emissions of BAU vs. OEP scenarios
Charging Infrastructure Requirements
The fleet’s transition to EVs will introduce a new component to fleet operations: charging infrastructure.
The number of chargers (i.e. ports) required is simply correlated with the number of vehicles in order to
simplify operations and ensure that each vehicle is able to charge after use. However, there are several
suitable options for electrical configurations that can help reduce installation costs and optimize the
performance of the chargers to minimize the impact on the building’s electrical operations (i.e. demand
charges).
The most notable options for electric vehicle service equipment
(EVSE) configurations include dedicated circuits and circuit
sharing. Dedicated circuits require significant electrical system
infrastructure to accommodate the electrical load and generally
have no interaction with other EVSE. Circuit sharing (i.e. power
sharing) is defined by multiple EVSE being supplied from a single
circuit with demand control to ensure circuit rating is not exceeded.
Figure 16 highlights the high potential for four way sharing within
the fleet. Given the average kilometers driven by the vehicles, the
vast majority of the fleet will be capable of power sharing, which will
reduce installation costs significantly.
0
5
10
15
20
25
30
2021 2022 2023 2024 2025 2026 2027 2028 2029 2030
GH
G E
mis
sio
ns
(ktC
O2
e)
BAU OEP
Power sharing makes it
possible for fleets to meet
driver demand and
charge more EVs without
making major
infrastructure updates.

| efficiency • renewables • mobility
34
Figure 16 — Number of EVSE needed for the fleet with potential for circuit sharing
Figure 17 shows a comparison of the total cost of hardware and installation of EV chargers under a power
sharing strategy versus no power sharing. Power sharing can reduce installation cost by 36%, or
approximately one million dollars. There are many options for power sharing, however the simplest option
would be to implement an equal split between chargers.
Figure 17 — Installation cost of electrical vehicle service equipment with and without power sharing
204
11396
128
0
50
100
150
200
250
Cars SUVs Vans Pick-ups
Nu
mb
er
of P
ort
s
Four Way Sharing Two Way Sharing Dedicated Circuit
-36%
0.00
0.50
1.00
1.50
2.00
2.50
3.00
Mill
ion
s (
$)
No Power Sharing With Power Sharing

| efficiency • renewables • mobility
35
Cost Considerations
While EVs are typically going to cost more
upfront than a conventional vehicle in the
near term, significant cost savings can be
captured from reduced maintenance and
fuel costs. Overall maintenance cost for an
EV is far lower (around 25-50% of the cost
for gas vehicles) due to fewer moving
parts, fewer fluids, less wear on the brakes
due to regenerative braking, and only
minimal maintenance required for the
battery, electric powertrain, and
electronics. For example, New York City17
examined the maintenance costs for BEVs
in its fleet and found that they were around
25% of the total costs of their gas
counterparts. One concern that is often
flagged when considering maintenance
costs is regarding battery degradation. However, recent data18 shows that batteries are likely to outlast the
usable life of the vehicle itself. The savings on maintenance, fuel and the higher resale value well-
position EVs from a cost perspective.
Figure 18 shows the total annual cost for the BAU scenario versus the OEP scenario. The total annual
costs for the BAU scenario are dominated by operation costs (maintenance and fuel), while the costs for
EVs are dominated by upfront purchase costs. In the earlier years, when the fleet is transitioning and early
replacement of gas cars is taking place, the OEP scenario shows a higher annual cost. However, later
years show a lower cost for the OEP scenario due to the high savings on operations and the lower
proportion of early retirement.
Figure 19 shows the discounted net cash flow (5%) for the cost/benefits of the OEP scenario relatively to
the BAU scenario. Initially, the cash flow is negative due to high replacement rates in the first five years.
However, in later years, the cost benefits of EVs start to materialize and result in a positive cash flow.
Figure 20 shows a sensitivity analysis of the net present value (NPV) relative to the discount rate. The
analysis highlights that even with a high discount rate (5%), the NPV remains around zero, indicating that
the fleet can achieve its zero emissions target without any significant incremental cost.
17 https://www.government-fleet.com/327215/nyc-compares-maintenance-costs-for-ev-and-gasoline-vehicles 18 https://www.geotab.com/press-release/ev-battery-degradation-tool/
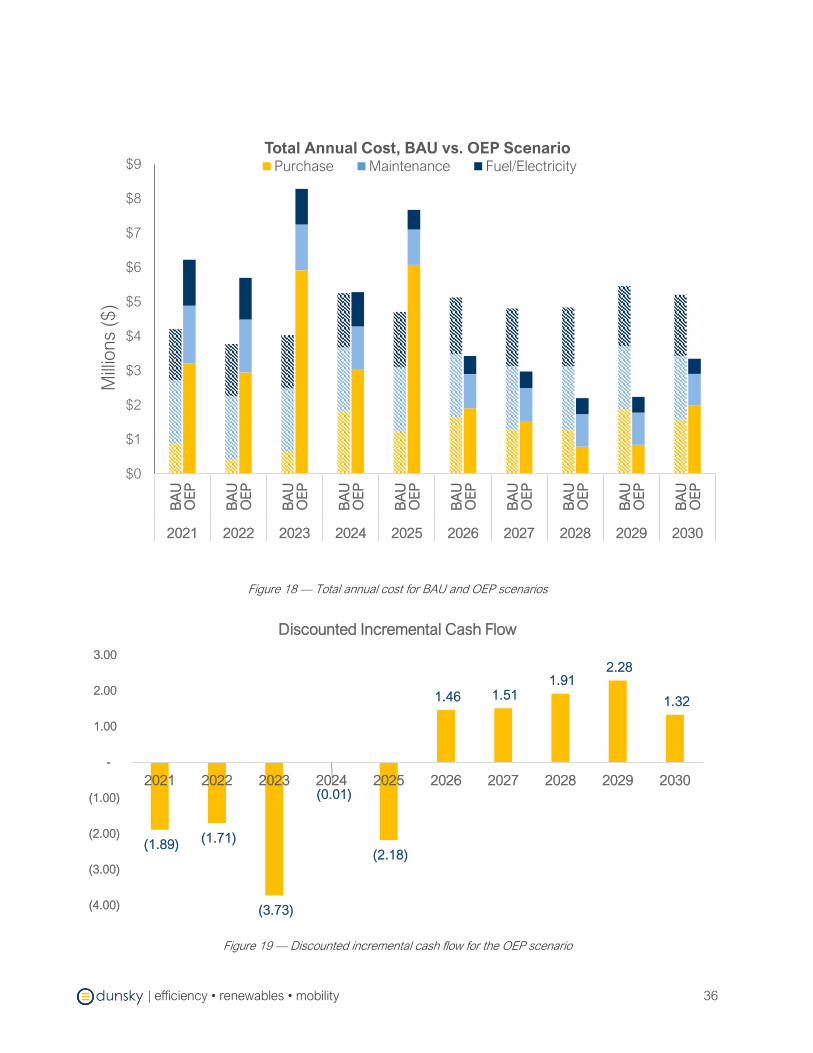
| efficiency • renewables • mobility
36
Figure 18 — Total annual cost for BAU and OEP scenarios
Figure 19 — Discounted incremental cash flow for the OEP scenario
$0
$1
$2
$3
$4
$5
$6
$7
$8
$9B
AU
OE
P
BA
U O
EP
BA
U O
EP
BA
U O
EP
BA
U O
EP
BA
U O
EP
BA
U O
EP
BA
U O
EP
BA
U O
EP
BA
U O
EP
2021 2022 2023 2024 2025 2026 2027 2028 2029 2030
Mill
ion
s (
$)
Total Annual Cost, BAU vs. OEP ScenarioPurchase Maintenance Fuel/Electricity
(1.89)(1.71)
(3.73)
(0.01)
(2.18)
1.46 1.51 1.91
2.28
1.32
(4.00)
(3.00)
(2.00)
(1.00)
-
1.00
2.00
3.00
2021 2022 2023 2024 2025 2026 2027 2028 2029 2030
Discounted Incremental Cash Flow

| efficiency • renewables • mobility
37
Figure 20 — NPV Difference between OEP and BAU as a function of discount rate
Operational Considerations
As highlighted earlier, introducing EVs to the fleet will offer several benefits; however, proper planning will
be required to ensure minimal disruption to the fleet operations. The following should be considered:
• Hire personnel dedicated to planning and overseeing the fleet transition.
• Provide comprehensive training to staff to familiarize them with both the vehicles as well as the
charging infrastructure19.
• Maintain in-house technicians to conduct routine maintenance on the vehicles (e.g. brakes, tires).
• Leverage the dealerships or a third party for more complex maintenance on the electric powertrain
(i.e. high voltage system).
• Ensure ongoing maintenance and support for the EV charging equipment.
• Implement active load management to help better manage demand charges and reduce cost.
19 This can be done by leveraging organizations involved in public education and awareness regarding EVs (i.e.
NextRide Campaign).
(1.50)
(1.00)
(0.50)
-
0.50
1.00
1.50
2.00
2.50
0% 1% 2% 3% 4%NP
V (
Mill
ion
s $
)
Discount Rate (%)
NPV Differential Profile
| efficiency • renewables • mobility
38
4. Municipal EV Policies
Local governments can play a significant role in accelerating adoption by implementing and advocating
other levels of government for a range of policies. As highlighted earlier, public charging infrastructure is
an important area where the municipality can directly influence the market. However, while a portion of the
market may be willing to use public or workplace charging as a substitute for charging at home, the ability
to charge overnight and wake up to a full charge can help more mainstream consumers see EVs as a
desirable alternative to gas car ownership. Therefore, access to charging at home is critical for maximizing
the convenience of EV ownership. Some local governments are well-positioned to help maximize access
to charging at home, both by setting requirements for new construction, and by encouraging retrofits of
the existing building stock. Cities may also implement other policies that can help incentivize EV adoption.
Some examples include, zero emission vehicle zones, on-street parking regulations, high occupancy
vehicle (HOV) lanes and free access to toll bridges.
4.1 – EV Ready Requirements for New Construction
Lack of home charging, particularly in MURBs is one of
the key barriers to adoption of EVs. Similarly, access to
charging in other residential and commercial contexts
can significantly support EV adoption.
While EV penetration in the Halifax region is low today,
any new residential building constructed today is very
likely to see a 100% EV penetration within its lifetime.
Designing these buildings with EVs in mind will help
ensure that residents can have access to charging and
will accelerate adoption in MURBs. “EV ready” stalls feature an adjacent electrical outlet at the parking
space with the ability to install EVSE in the future.
Local governments in BC now require 100% EV ready residential parking in new developments. Designing
for 100% EV Ready parking in MURB condominiums is particularly important. Condominium parking
tenure typically provides very limited opportunity to swap (i.e. trade) parking stalls. Under these
circumstances, households without EV Ready parking will not be able to access EV charging in their
assigned parking space.
Designing for 100% EV Ready parking is cost-effective when cities allow new developments to use EV
Energy Management Systems (EVEMSs). EVEMSs are a type of technology that control EV loads – they
allow for multiple EVs to charge on a given electrical circuit. This significantly reduces the total size of the
electrical infrastructure that must be installed to make all parking EV Ready, and reduces cost. The cost of
providing 100% EV Ready parking can be comparable to the cost of providing just 20% of parking on
dedicated, unmanaged circuits (as several cities have previously required, such as the City of Toronto).
For the reasons stated above, we recommend that HRM implements the following policies:
Over 14 BC local
governments
representing the
majority of new
residential units in the
province adopted EV
ready requirements in
new buildings

| efficiency • renewables • mobility
39
• Require 100% EV ready parking in new residential construction (MURBs and single-family
homes).
• Require 10-20% EV ready parking in non-residential buildings.
Policy Implementation
Based on preliminary discussions with HRM’s legal team, implementation of the policies recommended
above are in conflict with existing laws and regulations enacted by the Province such as the Building Code
Act, Building Code Regulations, Electrical Installation and Inspection Act and Electrical Code Regulations.
Therefore, it is recommended that HRM request a charter amendment from the Province of Nova Scotia to
gain authority to mandate the requirement of electric vehicle supply equipment in new construction.
4.2 – EV Ready Retrofits in Existing Buildings
While requirements for new construction can help ensure that any new buildings are designed with EVs in
mind, the existing building stock must also be addressed. To date, integration in existing MURBs,
workplaces and fleets is minimal. Future-proofing parking with comprehensive EV Ready retrofits can
lower life cycle cost and simplify future EVSE installations. For example, it can be about a fifth of the cost to
retrofit all parking spaces to be EV ready at once than, upgrading a few stalls at a time. Moreover, it
ensures households have immediate access to EV charging, whereas organizing incremental upgrades
can be complicated and take many months. This is especially the case in condominiums, where decision-
making and parking space swapping can be challenging.
Governments and utilities can help encourage building owners to take more comprehensive approaches
to EV Readiness. For example, British Columbia recently launched an EV Ready Rebate Program20,
providing incentives to MURBs to implement comprehensive designs for 100% EV Ready buildings. This
will be much lower cost on a life cycle basis than incrementally retrofitting MURBs a few parking spaces at
a time to implement charging.
Given that penetration of EVs is currently low in the Halifax region, HRM should consider supporting both
small scale retrofits to implement a few charging stations (which can be a first step or “foot in the door”, if
a condominium is not ready for comprehensive upgrades) as well developing comprehensive retrofit
programs. We recommend HRM implements the following policies:
• Offer a retrofit program for MURBs with a focus on rental properties to promote more equitable
access to electric mobility options. Coordinate with the Province and NSPI to seek leveraged
incentive funds.
• Develop a pilot program to provide buildings owners and condominiums support to develop an EV
Ready Plan that will guide comprehensive 100% EV Ready retrofits. These studies can help build
momentum and highlight the benefits of comprehensive retrofits over incremental ones.
• Act as a delivery agent to provide funding through NRCan’s ZEVIP program and other future EV
funding sources.
20 BC EV Ready Rebate Program
| efficiency • renewables • mobility
40
5. Advocacy and Support
5.1 – Advocate for Sustained Financial Incentives
The higher upfront cost of EVs relative to Internal Combustion Engine Vehicles (ICEVs) remains one of the
key barriers to EV adoption. While cost reduction trends are expected over the next decade, a cost
forecast analysis recently conducted by Dunsky showed that price parity for medium-sized LDVs would
likely be as far as 2030. In addition, our analysis showed that the total cost of ownership (TCO) breakeven
point for an EV purchased in 2020 would be close to 10 years in the absence of financial incentives.
The use of financial incentives to encourage the adoption of EVs has proven to be an effective policy lever
in overcoming these barriers across many jurisdictions. The market in Canada follows the same trend,
with leading jurisdictions (QC, ON, BC) being ones that have implemented a provincial financial incentive.
As highlighted earlier, incentives also seem to have long-term impacts, with Ontario remaining well ahead
of other provinces even after the government stopped the incentives in 2018.
Stakeholders indicated that financial incentives would be a critical intervention in helping move the market
forward in the province. Specifically, upfront purchase incentives were highlighted as most likely to directly
address cost barriers from a consumer’s perspective. While there are several other approaches to offering
financial incentives, including tax credits and discounts on annual fees, studies have shown that upfront
incentives are the most effective in influencing adoption by directly addressing the high upfront
incremental cost of EVs.
The province of Nova Scotia recently announced upfront purchase incentives for new and used EVs
($3,000 and $2,000 respectively), as well as e-Bikes ($500). HRM should play a role in advocating for
sustained funding for both provincial and federal purchase incentives and a gradual planned
phase-out that ensures the affordability of EVs over the long-term
5.2 – Advocate for a ZEV Mandate
While financial incentives, deployment of charging infrastructure, and awareness campaigns can be
critical tools to help increase consumer demand for EVs, adoption can remain stifled by the lack of
availability of EVs due to vehicle supply constraints. EV supply was identified as a major constraint in Nova
Scotia by multiple stakeholders. Dunsky’s own analysis found that 90% of dealerships in the province
have no EVs available for purchase. Stakeholders identified several barriers to entry for dealerships looking
to begin selling EVs, including training of sales staff and service technicians, and the cost of specialized
tools and charging infrastructure. Also, multiple stakeholders indicated that automakers are prioritizing
markets where they are mandated to sell EVs over Nova Scotia, with some dealerships struggling to
receive inventory and putting customers on months-long waiting lists.
Many jurisdictions in North America have adopted the California ZEV standard, which requires
automakers to sell a certain number of electric vehicles based on the overall vehicle sales in the
province/state. The program works based on a credit system, where each EV sold earns a number of

| efficiency • renewables • mobility
41
credits based on the type of technology and its battery range. The automotive industry has traditionally
pushed back against ZEV mandates citing them as a high burden on their business. However, recent
developments seem to indicate otherwise, with GM calling for a National ZEV program and announcing a
halt to ICEV production by 2035 (aligned with California’s newly announced mandate). Several states with
a similar vehicle market size to Nova Scotia have successfully adopted a ZEV mandate (e.g. Maine, Rhode
Island, Vermont). It is important to note that all ZEV states/provinces have also adopted demand-side
policies (i.e. financial incentives). This ensures that proper steps are taken to ensure there is sufficient
consumer demand to meet the mandated supply targets.
Several stakeholders in Nova Scotia indicated that the province would benefit significantly from the
introduction of a ZEV mandate. A ZEV mandate would ensure that interested consumers could find EVs
available for purchase in local automotive dealerships in sufficient supply to satisfy that demand. HRM
should advocate for a provincial ZEV mandate that is aligned with the leading jurisdictions in
North America (e.g. Quebec, California)
5.3 – Public Education
To address information barriers facing EVs, initiatives to educate and increase awareness of EVs can have
a significant impact in accelerating adoption at relatively low cost. EV marketing and awareness
campaigns, test drive events, and “leading by example” (e.g. electrification of government and utility
fleets) can increase awareness of EVs by correcting misconceptions and addressing perceived barriers to
adoption. Key components of an education and awareness plan include:
• EV Information (i.e. websites, FAQ, case studies)
• Campaigns/Active Marketing
• Test-and-drive events/showrooms
• Account manager engagements/advisory services
Recent education and awareness efforts through the Clean Foundation’s “Next Ride” initiative have
been successful to date with more than 89 events, 1,200 test drives and 5,000 engagements, helping
Nova Scotians discover the benefits of EVs. The Clean Foundation has also developed a web platform, EV
Assist21 Nova Scotia, to provide information on EV basics, owning an EV, electric charging, and available
infrastructure in Nova Scotia. NSPI houses an EV webpage that connects people with charging station
maps, highlights EV benefits and provides information on EVs.
HRM should support the public education initiatives that are already underway, rather than duplicating
efforts. HRM can offer resources like funding, staff time and EVs to partners already implementing EV
awareness and education programs. HRM should first connect with organizations that are operating EV
education programs and suggest a partnership.
21 https://evassist.ca/

| efficiency • renewables • mobility
42
As a partner, HRM can:
• Share EV information: Help spread awareness of events and information via social media and have
an informational webpage directing the public to partner resources and events.
• Share EVs and charging infrastructure for events: Share branded fleet EVs with partners for test-
and-drive and education events and offer a charging site location for educational field trips or events.
Include educational signage at charging sites.
• Offer municipal space: Offer municipal sites or a simple method to book streets or city lots for test-
and drive events and other education/awareness events.
• Train staff and offer staffing resources: Have staff trained on the benefits of EVs and have them
help partners facilitate events and spread information.
• Provide funding: Help fund partner events or awareness initiatives across the Halifax region.

| efficiency • renewables • mobility
43
6. Strategy Map
HRM’s EV Strategy is summarized in the following strategy map. Each action area is linked to specific
recommended initiatives for HRM to act on. These outcomes are the result of local and best-practice
research, a thoughtful stakeholder engagement process, and tailored modeling and analysis.
EV
Str
ate
gy
ACTION
AREA
OPPORTUNITY
AREA To address barriers and enable adoption
RECOMMENDED INITIATIVES Actions designed to accelerate adoption
Public
Charging
Deploy charging infrastructure
With lack of interest in private investment in charging infrastructure and
no clear mandate for the utility to make these investments, there is an
obvious gap for who will be deploying charging infrastructure within the
city in the near term. HRM can play a crucial role in addressing these
market failures by filling gaps in the public charging infrastructure
landscape in the region
• Invest in public Level 2 on-street and in parking facilities
o 2021-2025: 336 ports
o 2026-2030: 650 ports
• Invest in public DCFC hubs for urban/suburban areas as
well as highways
o 2021-2025: 40 ports
o 2026-2030: 52 ports
Fleet
Electrification
Decarbonize Municipal Fleet
• The optimal electrification plan developed for HRM enable the
city to electrify 100% of its light duty vehicle fleet while reducing
annual GHGs by more than 60% by 2030. This results in
cumulative reduction of over 10 ktCO2e in 10 years with little to
no incremental cost to existing fleet operations despite the high
rate of early replacements to EVs.
Municipal
Policies
New Buildings
• Require 100% EV ready parking in new residential construction
(MURBs and single-family homes).
• Require 10-20% EV ready parking in non-residential buildings
Retrofit
• Offer a retrofit program for MURBs with a focus on rental
properties to promote more equitable access to electric mobility
options. Coordinate with the Province and electrical utility to
seek leveraged incentive funds.
• Develop a pilot program to provide building owners and
condominiums support to develop EV Ready Plans that will guide
comprehensive 100% EV Ready retrofits. These studies can help
building momentum and highlight the benefits of comprehensive
retrofits over incremental ones.
• Act as a delivery agent to provide funding through NRCan’s
ZEVIP program and other future EV funding sources.
Advocacy and
Support Financial Incentives
• HRM should play a role in advocating for sustained funding for
both provincial and federal purchase incentives and a gradual
planned phase-out that ensures the affordability of EVs over the
long-term.

| efficiency • renewables • mobility
44
ZEV Mandate
• HRM should advocate for a provincial ZEV mandate that is
aligned with the leading jurisdictions in North America (e.g.
Quebec, California)
Public Education
• Share EV information: Help spread awareness of events and
information via social media and have an informational webpage
directing the public to partner resources and events.
• Share EVs and charging infrastructure for events: Share
branded fleet EVs with partners for test-and-drive and education
events and offer a charging site location for educational field
trips or events. Include educational signage at charging sites.
• Offer municipal space: Offer municipal sites or a simple
method to book streets or city lots for test-and drive events and
other education/awareness events.
• Train staff and offer staffing resources: Have staff trained on
the benefits of EVs and have them help partners facilitate events
and spread information.
• Provide funding: Help fund partner events or awareness
initiatives across the Halifax region.

| efficiency • renewables • mobility
45
Appendix A. List of Stakeholders
HRM Internal Team Key Staff and Departments
Parking Services
Traffic Management
• Victoria Horne, Manager Parking Services
• Christopher Davis, Supervisor Right of Way
Services
Building Operations • John Mason, Building Operations Manager
Corporate Fleet • Scott Sears, Corporate Fleet Manager
Legal Services • Claire Gillivan, Municipal Solicitor
External Stakeholders Main contact
Nova Scotia Power Inc. • Sanjeev Pushkarna, Sr. Program Manager, Smart
Grid Nova Scotia
Nova Scotia Department of Energy and
Mines
• Krista Phillips, Clean Energy and Transportation
Strategist
Clean Foundation • Jeremie Bernardin, Clean Transportation
Program Manager
Steele Auto Group • Peter Porteous, VP Business Development
Ecology Action Centre • Kelsey Lane, Sustainable Transportation
Coordinator
Electric Vehicle Association of Atlantic
Canada • Kurt Sampson, Chair

| efficiency • renewables • mobility
46
Appendix B. EVA Methodology
The study uses Dunsky’s Electric Vehicle Adoption (EVA) Model. The EVA Model was developed to address
a growing need by utilities and governments to understand the potential size of the EV market in their
respective jurisdictions and corresponding impacts. Based on rigorous data, EVA leverages the modeling
framework behind Dunsky’s proven Solar Adoption Model, and builds on the knowledge base and expertise
of our mobility practice. EVA projects market demand for EVs based on several key factors.
Technical potential: The theoretical potential for deployment based on size (annual sales and fleet size)
and vehicle class (e.g. cars, SUVs, trucks, buses) of the local vehicle market as well as the availability of
different powertrain types (i.e. BEV, PHEV) for each vehicle class.
Customer economics: The unconstrained economic potential based on the Total Cost of Ownership
(TCO) of EVs and ICEVs. The TCO calculation considers the incremental upfront vehicle cost, fuel costs, as
well as operations and maintenance (O&M) costs over the vehicle’s lifetime.

| efficiency • renewables • mobility
47
Constrained potential: EV-specific barriers to adoption, including range requirements, range anxiety,
home charging access, and public infrastructure deployment22 (Level 2 and DCFC).
Supply-side Constraints: Dunsky developed a proprietary tool to scan dealerships for local availability of
EV models. EVA leverages this data to apply a constraint on the accessible market potential. This allows for
modeling of various scenarios, including a supply-side mandate.
Market dynamics: Coupling technology diffusion theory with local market data to determine the rate of
adoption of EVs locally, as well as competition between vehicle types.
The following approach was used in the study to forecast EV adoption in Nova Scotia:
1. Market Segmentation and Characterization: The LDV market was broken down into three representative
segments, cars, SUVs, and trucks, that capture differences in vehicle costs, usage patterns, and EV
model availability, among other factors.
2. Model Calibration: Using historical data on vehicle sales, costs and other parameters, EVA was
benchmarked to historical EV sales in Nova Scotia (2012 – 2019), and key model parameters were
calibrated to capture local market characteristics.
3. Key inputs and assumptions: For each vehicle segment, assumptions on average vehicle characteristics
(fuel consumption, powertrain size, battery size, etc.) are used to develop a representative model of
vehicles within the segment. Additional assumptions on utilization (e.g. distance traveled) and
operational costs were also compiled and used to calculate a bottom-up vehicle cost and TCO for the
different powertrains within each vehicle segment.
The following sources were used for Nova Scotia-specific inputs:
• Statistics Canada: population, area of population centers, and housing composition.
• Nova Scotia Power Inc.: electricity rates
• NRCan Comprehensive Energy Use Database: number of vehicles, annual vehicle sales, and
fuel prices.
• NRCan Electric Charging and Alternative Fueling Stations Locator: charging station
deployment.
4. Vehicle Cost: For each vehicle class (i.e. car, truck, SUV) and drivetrain (i.e. ICE, BEV, PHEV)
combination, the model develops a representative vehicle archetype to forecast EV adoption. A bottom-
up vehicle cost is calculated for each vehicle type using data from Dunsky’s internal database on typical
vehicle characteristics for each segment (baseline vehicle cost, powertrain size and cost, vehicle
efficiency, battery size and cost, etc.). The bottom-up estimates are then compared to actual vehicle
22 In considering charging infrastructure barriers in a jurisdiction, the EVA model considers regional coverage (geographic
coverage of public charging infrastructure based of highway lengths and number of population centers that require coverage),
local availability (a measure of the capacity of charging infrastructure required to handle local demand for charging by EVs –
captured through an EV/port ratio for Level 2 and DCFC), and charging time (a measure of the average charging time installed
public charging infrastructure in a jurisdiction can provide)

| efficiency • renewables • mobility
48
models of similar characteristics on the market to validate accuracy on estimates. Future vehicle costs
are calculated using the same approach by varying battery costs and other key time-dependent factors.
5. Vehicle Availability: Using Dunsky’s proprietary tool, we scanned the local availability of EV models
across dealerships in Nova Scotia. The compiled data is used to determine the achievable market
potential based on data from other jurisdictions with different levels of supply constraints. This is then
used to forecast EV adoption in Nova Scotia under current constraints as well as considering increased
availability in dealerships under natural market evolution and supply-side policies.
6. Scenario Analysis: Using Nova Scotia-specific data complemented with national data and other
assumptions based on Dunsky’s professional judgment and experience from other jurisdictions, we use
the calibrated model to forecast future EV adoption in Nova Scotia. Specifically, the analysis considers
adoption under various scenarios reflecting different interventions and policies (e.g. purchase
incentives, ZEV mandates) as well as market and technology uncertainties (e.g. electricity rates, battery
costs, etc.)

| efficiency • renewables • mobility
49
Appendix C. Annual Deployment Plan
Year L2 Ports DCFC Ports Cost Estimate
2020 (Existing
infrastructure)
94 11 N/A
2021 18 4 $852,400
2022 48 7 $1,603,900
2023 60 7 $1,685,500
2024 90 9 $2,254,500
2025 120 13 $3,156,000
2026 152 17 $4,093,600
2027 146 13 $3,332,800
2028 116 13 $3,128,800
2029 116 7 $2,048,800
2030 120 0 $816,000
Total 1,080 101 ~ $23,000,000

| efficiency • renewables • mobility
50
Appendix D. Vehicle Models Options
Vehicle Type Example EV models
CAR
BEV
• Chevy Bolt (Available)
• Nissan Leaf (Available)
• VW e-Golf (Available)
• Hyundai Ioniq (Available)
• Kia Niro (Available)
• Kia Soul (Available)
PHEV
• Kia Niro (Available)
• Prius Prime (Available)
• Kia Optima (Available)
PICK UP TRUCK
BEV
• Rivian R1T (2021, Announced)
• Chevy pick-up (2022, Announced)
• F-150 (2022, Announced)
SUV
BEV • Volvo XC40 (2021, Announced)
• VW ID4 (2021, Announced)
PHEV • Ford Escape (2021, Announced)
• Mitsubishi Outlander (Available)
VAN
BEV • Chanje V1800 (Available)
• Ford Transit (2022, Announced)
PHEV • Toyota RAV4 prime (2021, Announced)

| efficiency • renewables • mobility
51
This report was prepared by Dunsky Energy Consulting. It represents our professional judgment
based on data and information available at the time the work was conducted. Dunsky makes no
warranties or representations, expressed or implied, in relation to the data, information, findings
and recommendations from this report or related work products.