itemized tax deductions for individuals: data analysis · itemized tax deductions for individuals:...
TRANSCRIPT
Itemized Tax Deductions for Individuals:
Data Analysis
Sean Lowry
Analyst in Public Finance
September 21, 2017
Congressional Research Service
7-5700
www.crs.gov
R43012
Itemized Tax Deductions for Individuals: Data Analysis
Congressional Research Service
Summary Reforming or limiting itemized tax deductions for individuals has gained the interest of policy
makers as one way to increase federal tax revenue, increase the share of taxes paid by higher-
income tax filers, simplify the tax code, or reduce incentives that might lead to inefficient
economic behavior. However, limits on deductions could cause adverse economic effects or
changes in the distributional burden of the federal income tax code. This report is intended to
identify who claims itemized deductions, for how much, and for which provisions.
This report analyzes data to inform the policy debate about reforming itemized tax deductions for
individuals. In 2014, 30% of all tax filers chose to itemize their deductions rather than claim the
standard deduction. In addition, the data indicate that both the share of tax filers who itemized
their deductions and the amount claimed by each tax filer increased as adjusted gross income
(AGI) increases. AGI is the basic measure of income under the federal income tax and is the
income measurement before itemized deductions and personal exemptions are taken into account.
Although higher-income tax filers were more likely to itemize their deductions and claim a larger
amount of itemized deductions than lower-income tax filers, the majority of itemizers (56.2%)
had an AGI less than $100,000, and 86.8% of itemizers had an AGI less than $200,000.
Tax filers in different income ranges tended to claim different itemized deductions in different
frequencies. In 2014, tax filers in higher income ranges claimed deductions for charitable gifts,
state and local income taxes, and real estate taxes at higher rates than tax filers in lower income
ranges. For example, the deduction for charitable gifts was claimed by 37% of itemizing tax filers
with an AGI between $50,000 and $100,000, whereas it was claimed by 68% to 87% of itemizing
tax filers with an AGI above $100,000. Deductions for state and local income taxes and the
deduction for charitable gifts comprised a larger share of itemized deductions as income rose.
The four largest itemized deductions are estimated to account for 17.8% ($241.2 billion) of the
approximately $1.4 trillion in tax expenditures in FY2018. These deductions were for state and
local income or sales taxes, home mortgage interest, charitable gifts, and real estate taxes.
These findings have several implications for reforming or limiting itemized tax deductions. First,
efforts to target itemized tax deduction limits on the highest income class analyzed in this report
(+$1 million in AGI) are limited in the amount of revenue that can be raised. Although tax filers
with an AGI greater than $1 million claimed a larger average amount of deductions ($424,864),
87% of itemizers had an AGI less than $200,000 (or 97% have less than $500,000 in AGI) and
they accounted for 65% of itemized deductions claimed (or 82% for itemizers with less than
$500,000 in AGI).
Second, the structure of a limit on itemized deductions could affect which deductions a tax filer
might claim. A limit based on a percentage reduction in the overall tax benefits of itemized
deductions would not likely change the relative choice of deduction claims. However, limits using
a flat-dollar amount likely would alter deduction claims and possibly tax filer behavior. A tax filer
who has deductions that exceed a flat-dollar value cap must choose which deductions to claim.
Even if a tax filer chooses not to claim a particular deduction because of the dollar cap, the tax
filer might still engage in the activity for other reasons (although possibly to a lesser extent).
Third, the structure of a limit on itemized deductions also has an effect on its capacity to raise
revenue. Limiting deductions might raise the taxable income of some individuals, and tax a
higher share of their income at a higher marginal tax rate. However, certain combinations of
deduction limits may shift some tax filers to claim the standard deduction instead of itemizing. In
this case, the revenue increase by limiting itemized deduction would be partially offset by more
tax filers claiming the standard deduction.
Itemized Tax Deductions for Individuals: Data Analysis
Congressional Research Service
Contents
Introduction ..................................................................................................................................... 1
An Overview of Itemized Tax Deductions ...................................................................................... 1
Analysis of Tax Data ....................................................................................................................... 2
Who Claims Itemized Tax Deductions? .................................................................................... 2 Analysis of Selected Deductions ............................................................................................... 4
Which Itemized Deductions Contribute Most to Revenue Loss? .................................................... 7
Policy Implications .......................................................................................................................... 8
Figures
Figure 1. Shares of Tax Itemizers and Itemized Deductions Claimed, by Adjusted Gross
Income (AGI), 2014 ..................................................................................................................... 4
Figure 2. Distribution of Itemized Deductions, by Adjusted Gross Income (AGI), 2014 .............. 6
Tables
Table 1. Share of Tax Filers Claiming Itemized Tax Deductions and Average Deduction
Claimed, by Adjusted Gross Income (AGI), 2014 ....................................................................... 3
Table 2. Average Amount Claimed by Tax Filers for Various Tax Deductions, 2014 ..................... 5
Table 3. Amount of Itemized Deductions Claimed as a Share of the Adjusted Gross
Income (AGI) of Itemizers, 2014 ................................................................................................. 7
Table 4. Itemized Tax Deductions Estimated to Contribute Most to Individual Income
Tax Revenue Losses in FY2018 ................................................................................................... 8
Contacts
Author Contact Information ........................................................................................................... 11
Itemized Tax Deductions for Individuals: Data Analysis
Congressional Research Service 1
Introduction Reforming or limiting itemized tax deductions for individuals has gained the interest of policy
makers as one way to increase federal tax revenue, increase the share of taxes paid by higher-
income tax filers, simplify the tax code, or reduce incentives that might lead to inefficient
economic behavior. However, limits on deductions, in the views of some, would have adverse
economic effects or changes in the distributional burden of the federal income tax code.
Discussions about itemized tax deduction reform are informed by analysis of tax filer data.
This report analyzes the most recently available public data from the Internal Revenue Service’s
(IRS) Statistics of Income (SOI) to provide an overview of who claims itemized deductions, what
they claim them for, and the amount in deductions claimed. In addition, the revenue loss
associated with several of the larger deductions is presented using data from the Joint Committee
on Taxation’s (JCT’s) tax expenditure estimates. This report concludes with a brief discussion of
the implications of various policy options to reform or limit itemized deductions. More in-depth
discussion on options for reforming itemized tax deductions, as a whole or individually, can be
found in other CRS reports.1
An Overview of Itemized Tax Deductions Individual income tax filers have the option to claim either a standard deduction or the sum of
their itemized deductions on the federal income tax. The standard deduction is a fixed amount,
based on filing status, available to all taxpayers. Alternatively, tax filers may claim itemized
deductions. Tax filers who itemize must report each item separately on their tax returns and be
able to provide documentation in the event of an IRS audit. Whichever deduction a tax filer
claims—standard or itemized—the deduction amount is subtracted from adjusted gross income
(AGI) to determine taxable income.2 AGI is the broad measure of income under the federal
income tax and is the income measurement before itemized deductions and personal exemptions
are taken into account.
Generally, only individuals with aggregate itemized deductions greater than the standard
deduction would find it worthwhile to itemize.3 The tax benefit of choosing to itemize is the
amount that their itemized deductions exceed the standard deduction multiplied by their top
marginal income tax rate.
Some itemized deductions can only be claimed if they meet or exceed minimum threshold
amounts (also known as a floor) to simplify tax administration and compliance. Floors usually
1 For example, see CRS Report R43079, Restrictions on Itemized Tax Deductions: Policy Options and Analysis, by
Jane G. Gravelle and Sean Lowry; CRS Report R44242, The Effect of Base-Broadening Measures on Labor Supply and
Investment: Considerations for Tax Reform, by Jane G. Gravelle and Donald J. Marples; and CRS Report R42435, The
Challenge of Individual Income Tax Reform: An Economic Analysis of Tax Base Broadening, by Jane G. Gravelle and
Thomas L. Hungerford. 2 For more information on how tax deductions reduce taxable income, see CRS Report R42872, Tax Deductions for
Individuals: A Summary, by Sean Lowry. 3 Although this is generally the case, the Government Accountability Office (GAO) estimated that about 510,000 tax
filers (representing about 0.1% of all individual taxes paid) in 1998 overpaid their taxes by claiming the standard
deduction, even though they could have itemized their deductions for a greater tax benefit. GAO did not determine the
reasons why tax filers might have done this. See U.S. General Accounting Office, Tax Deductions: Further Estimates
of Taxpayers Who May Have Overpaid Federal Taxes by Not Itemizing, GAO-02-509, March 2002, at
http://www.gao.gov/new.items/d02509.pdf.
Itemized Tax Deductions for Individuals: Data Analysis
Congressional Research Service 2
come in the form of a limit based on a percentage of AGI. For example, eligible extraordinary
medical and dental expenses must amount to at least 10% of AGI for most tax filers to claim an
itemized deduction; total expenses less than this floor are not eligible for an itemized deduction.4
In addition, some itemized deductions are subject to a cap (also known as a ceiling) in benefits or
eligibility. Caps are meant to reduce the extent that tax provisions can distort economic behavior,
limit revenue losses, or reduce the availability of the deduction to higher-income tax filers. For
example, the itemized deduction for home mortgage interest can only be claimed for the value of
interest payments made on the first $1 million of mortgage debt.
Analysis of Tax Data This section of the report uses publicly available tax data from the IRS to provide a profile of
itemizers and some insight into trends among various itemized deduction provisions. Itemized
deductions are often grouped together in broader discussions of tax policy, in part because they
are grouped together on the tax Form 1040.5 But, itemized deductions exist for a variety of
reasons and are designed in ways such that they target (or exclude) certain types of tax filers.
Analysis of data on these deductions can inform these discussions over reforming one or more
itemized deduction provisions. Specifically, the data analysis in this report intends to identify who
claims itemized deductions, for how much, and for which provisions.
This analysis might be relevant to the 115th Congress, as there has been growing congressional
interest in reforming or limiting itemized tax deductions for individuals. Some see reforming
itemized tax deductions as one way to increase federal tax revenue (and possibly contribute to
deficit reduction), increase the share of taxes paid by higher-income tax filers, simplify the tax
code, or reduce incentives that might lead to inefficient economic behavior.
Who Claims Itemized Tax Deductions?
In 2014, 30% of all tax filers chose to itemize their deductions rather than claim the standard
deduction.6 Of this 30% of tax filers, a greater share of higher-income individuals chose to
itemize their deductions compared with lower-income individuals. Table 1 shows the share of tax
filers who chose to itemize their deductions and the average sum of those deductions in 2014 by
AGI.
Higher-income tax filers chose to itemize their deductions more often than lower-income tax
filers in 2014. As shown in Table 1, the share of tax filers who chose to itemize in income ranges
above $200,000 remained virtually the same (over 90%), although the average sum of itemized
deductions claimed increases substantially as income rises. For taxpayers with an AGI greater
than $200,000, the share that itemized ranged from 91% to 93% and the average sum of itemized
4 The Patient Protection and Affordable Care Act (P.L. 111-148, as amended) increased the floor for individuals
claiming the itemized deduction for medical expenses from 7.5% to 10% of adjusted gross income (AGI). The higher
floor went into effect for tax filers under age 65 beginning for the 2013 tax year. Individuals 65 or older, however, were
still able to claim the deduction under the lower, 7.5% floor for tax years 2013 through 2016. Under current law, the
higher, 10% floor applies to all tax filers beginning with the 2017 tax year. Given this higher floor, it can be expected
that fewer people will claim the medical expenses deduction in tax years 2017 and beyond compared to the 2014 data
presented in this report. 5 This report analyzes 2014 data, which are the most recently available public data from the IRS. 6 CRS analysis of the Internal Revenue Service’s Statistics of Income 2014 Data, Tables 1.4 and 2.1, at
https://www.irs.gov/statistics/soi-tax-stats-individual-statistical-tables-by-size-of-adjusted-gross-income.
Itemized Tax Deductions for Individuals: Data Analysis
Congressional Research Service 3
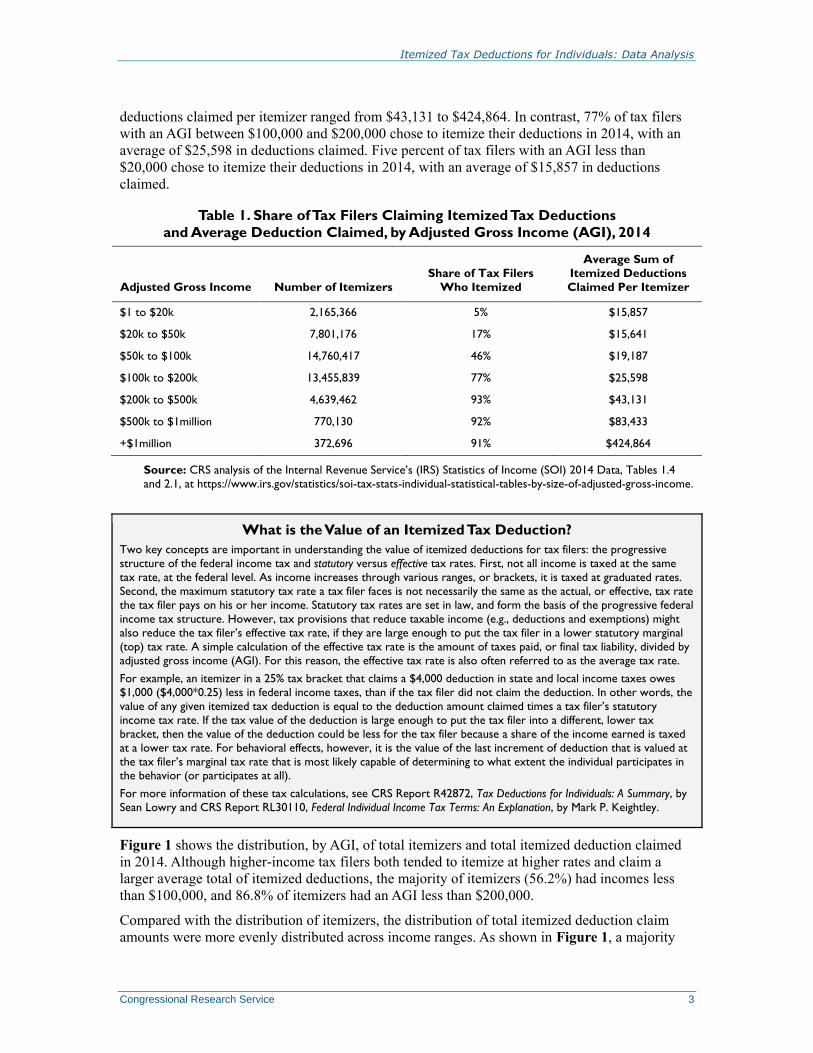
deductions claimed per itemizer ranged from $43,131 to $424,864. In contrast, 77% of tax filers
with an AGI between $100,000 and $200,000 chose to itemize their deductions in 2014, with an
average of $25,598 in deductions claimed. Five percent of tax filers with an AGI less than
$20,000 chose to itemize their deductions in 2014, with an average of $15,857 in deductions
claimed.
Table 1. Share of Tax Filers Claiming Itemized Tax Deductions
and Average Deduction Claimed, by Adjusted Gross Income (AGI), 2014
Adjusted Gross Income Number of Itemizers
Share of Tax Filers
Who Itemized
Average Sum of
Itemized Deductions
Claimed Per Itemizer
$1 to $20k 2,165,366 5% $15,857
$20k to $50k 7,801,176 17% $15,641
$50k to $100k 14,760,417 46% $19,187
$100k to $200k 13,455,839 77% $25,598
$200k to $500k 4,639,462 93% $43,131
$500k to $1million 770,130 92% $83,433
+$1million 372,696 91% $424,864
Source: CRS analysis of the Internal Revenue Service’s (IRS) Statistics of Income (SOI) 2014 Data, Tables 1.4
and 2.1, at https://www.irs.gov/statistics/soi-tax-stats-individual-statistical-tables-by-size-of-adjusted-gross-income.
What is the Value of an Itemized Tax Deduction?
Two key concepts are important in understanding the value of itemized deductions for tax filers: the progressive
structure of the federal income tax and statutory versus effective tax rates. First, not all income is taxed at the same
tax rate, at the federal level. As income increases through various ranges, or brackets, it is taxed at graduated rates.
Second, the maximum statutory tax rate a tax filer faces is not necessarily the same as the actual, or effective, tax rate
the tax filer pays on his or her income. Statutory tax rates are set in law, and form the basis of the progressive federal
income tax structure. However, tax provisions that reduce taxable income (e.g., deductions and exemptions) might
also reduce the tax filer’s effective tax rate, if they are large enough to put the tax filer in a lower statutory marginal
(top) tax rate. A simple calculation of the effective tax rate is the amount of taxes paid, or final tax liability, divided by
adjusted gross income (AGI). For this reason, the effective tax rate is also often referred to as the average tax rate.
For example, an itemizer in a 25% tax bracket that claims a $4,000 deduction in state and local income taxes owes
$1,000 ($4,000*0.25) less in federal income taxes, than if the tax filer did not claim the deduction. In other words, the
value of any given itemized tax deduction is equal to the deduction amount claimed times a tax filer’s statutory
income tax rate. If the tax value of the deduction is large enough to put the tax filer into a different, lower tax
bracket, then the value of the deduction could be less for the tax filer because a share of the income earned is taxed
at a lower tax rate. For behavioral effects, however, it is the value of the last increment of deduction that is valued at
the tax filer’s marginal tax rate that is most likely capable of determining to what extent the individual participates in
the behavior (or participates at all).
For more information of these tax calculations, see CRS Report R42872, Tax Deductions for Individuals: A Summary, by
Sean Lowry and CRS Report RL30110, Federal Individual Income Tax Terms: An Explanation, by Mark P. Keightley.
Figure 1 shows the distribution, by AGI, of total itemizers and total itemized deduction claimed
in 2014. Although higher-income tax filers both tended to itemize at higher rates and claim a
larger average total of itemized deductions, the majority of itemizers (56.2%) had incomes less
than $100,000, and 86.8% of itemizers had an AGI less than $200,000.
Compared with the distribution of itemizers, the distribution of total itemized deduction claim
amounts were more evenly distributed across income ranges. As shown in Figure 1, a majority

Itemized Tax Deductions for Individuals: Data Analysis
Congressional Research Service 4
(63.6%) of total itemized deduction claims (amounts, in dollars) were made by itemizers with an
AGI greater than $100,000. Although tax filers with an AGI more than $1 million comprised
0.8% of itemizers they claimed 13.1% of all itemized tax deductions in 2014. Similarly, tax filers
with an AGI between $500,000 and $1 million accounted for 1.8% of itemizers, but they claimed
5.3% of all itemized deductions. Tax filers with an AGI between $50,000 and $100,000 accounted
for 33.6% of all itemizers, but they claimed 23.5% of all itemized deductions.
Figure 1. Shares of Tax Itemizers and Itemized Deductions Claimed,
by Adjusted Gross Income (AGI), 2014
Source: CRS analysis of the IRS’ SOI 2014 Data, Tables 1.4 and 2.1, at https://www.irs.gov/statistics/soi-tax-
stats-individual-statistical-tables-by-size-of-adjusted-gross-income.
Analysis of Selected Deductions
Another way to analyze tax data on itemized deductions is to look at specific deductions. Specific
deductions tend to benefit different types of itemizers based on their income. In addition to
differences in the income of the itemizer, the variation in itemized deduction claims can also be
explained, in part, by the structure of certain provisions (e.g., floors or ceilings that are designed
to limit claims).
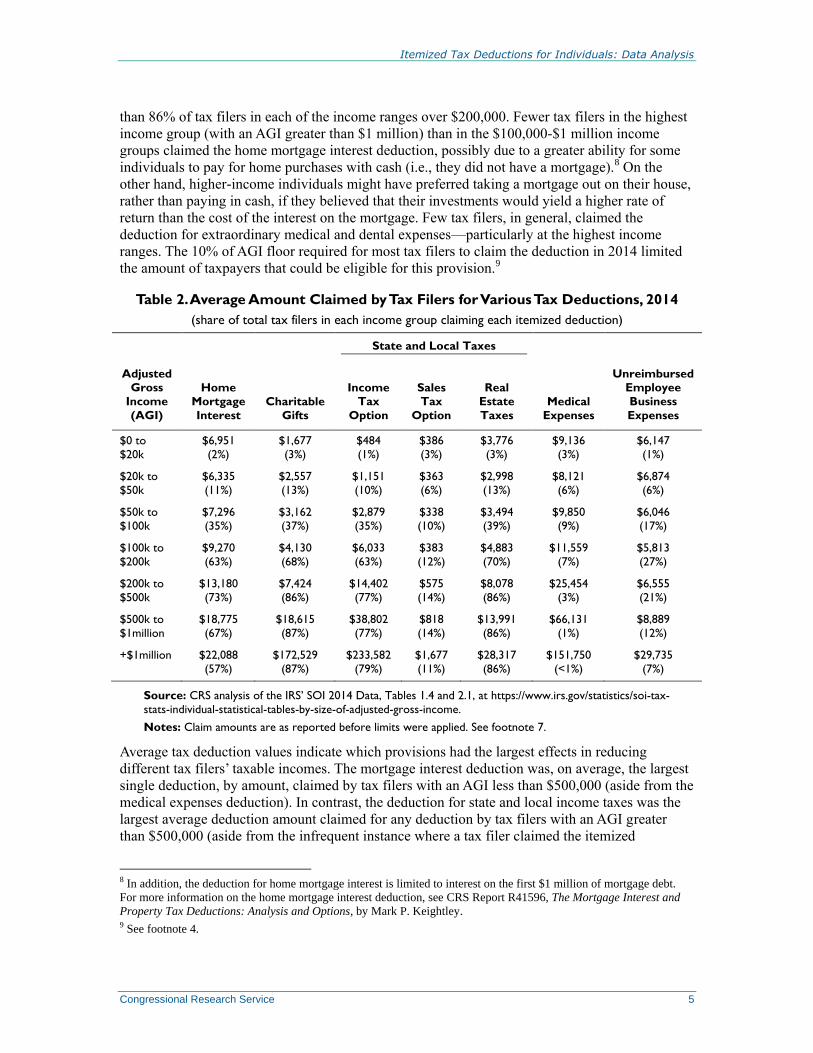
Tax filers in different income ranges tended to claim specific itemized deductions in different
frequencies. Table 2 shows the average amount claimed in 2014 for selected deductions and the
share of total tax filers who itemized in each income class that claimed a particular deduction.7
Tax filers in higher-income ranges claimed deductions for charitable gifts, state and local income
taxes, and real estate property taxes at higher rates than tax filers in lower-income ranges. For
example, the deduction for charitable gifts was claimed by 37% of tax filers with an AGI between
$50,000 and $100,000; 68% of tax filers with an AGI between $100,000 and $200,000; and more
7 All reported claim amounts in this report are tallied before limits were applied. There is a general “phaseout of
itemized deductions” (called “Pease,” after Rep. Donald Pease who initially sponsored the legislative provision)
applied for certain high-income taxfilers. For tax filers affected by Pease, the total of certain itemized deductions is
reduced by 3% of the amount of AGI exceeding the threshold. The total reduction, however, cannot be greater than
80% of the deductions. However, the Pease limit is triggered by income, not amount of deductions claimed, and is
effectively an additive tax rate rather than a limit on itemized deductions. For more information, see IRS, Your Income
Tax (Publication 17), 2016, at https://www.irs.gov/publications/p17/ch29.html; and CRS Report R42872, Tax
Deductions for Individuals: A Summary, by Sean Lowry. Another example of a limit on itemized deductions is that
charitable deductions generally cannot exceed 50% of a tax filer’s AGI in any single year.
Itemized Tax Deductions for Individuals: Data Analysis
Congressional Research Service 5
than 86% of tax filers in each of the income ranges over $200,000. Fewer tax filers in the highest
income group (with an AGI greater than $1 million) than in the $100,000-$1 million income
groups claimed the home mortgage interest deduction, possibly due to a greater ability for some
individuals to pay for home purchases with cash (i.e., they did not have a mortgage).8 On the
other hand, higher-income individuals might have preferred taking a mortgage out on their house,
rather than paying in cash, if they believed that their investments would yield a higher rate of
return than the cost of the interest on the mortgage. Few tax filers, in general, claimed the
deduction for extraordinary medical and dental expenses—particularly at the highest income
ranges. The 10% of AGI floor required for most tax filers to claim the deduction in 2014 limited
the amount of taxpayers that could be eligible for this provision.9
Table 2. Average Amount Claimed by Tax Filers for Various Tax Deductions, 2014
(share of total tax filers in each income group claiming each itemized deduction)
State and Local Taxes
Adjusted
Gross
Income
(AGI)
Home
Mortgage
Interest
Charitable
Gifts
Income
Tax
Option
Sales
Tax
Option
Real
Estate
Taxes
Medical
Expenses
Unreimbursed
Employee
Business
Expenses
$0 to
$20k
$6,951
(2%)
$1,677
(3%)
$484
(1%)
$386
(3%)
$3,776
(3%)
$9,136
(3%)
$6,147
(1%)
$20k to
$50k
$6,335
(11%)
$2,557
(13%)
$1,151
(10%)
$363
(6%)
$2,998
(13%)
$8,121
(6%)
$6,874
(6%)
$50k to
$100k
$7,296
(35%)
$3,162
(37%)
$2,879
(35%)
$338
(10%)
$3,494
(39%)
$9,850
(9%)
$6,046
(17%)
$100k to
$200k
$9,270
(63%)
$4,130
(68%)
$6,033
(63%)
$383
(12%)
$4,883
(70%)
$11,559
(7%)
$5,813
(27%)
$200k to
$500k
$13,180
(73%)
$7,424
(86%)
$14,402
(77%)
$575
(14%)
$8,078
(86%)
$25,454
(3%)
$6,555
(21%)
$500k to
$1million
$18,775
(67%)
$18,615
(87%)
$38,802
(77%)
$818
(14%)
$13,991
(86%)
$66,131
(1%)
$8,889
(12%)
+$1million $22,088
(57%)
$172,529
(87%)
$233,582
(79%)
$1,677
(11%)
$28,317
(86%)
$151,750
(<1%)
$29,735
(7%)
Source: CRS analysis of the IRS’ SOI 2014 Data, Tables 1.4 and 2.1, at https://www.irs.gov/statistics/soi-tax-
stats-individual-statistical-tables-by-size-of-adjusted-gross-income.
Notes: Claim amounts are as reported before limits were applied. See footnote 7.
Average tax deduction values indicate which provisions had the largest effects in reducing
different tax filers’ taxable incomes. The mortgage interest deduction was, on average, the largest
single deduction, by amount, claimed by tax filers with an AGI less than $500,000 (aside from the
medical expenses deduction). In contrast, the deduction for state and local income taxes was the
largest average deduction amount claimed for any deduction by tax filers with an AGI greater
than $500,000 (aside from the infrequent instance where a tax filer claimed the itemized
8 In addition, the deduction for home mortgage interest is limited to interest on the first $1 million of mortgage debt.
For more information on the home mortgage interest deduction, see CRS Report R41596, The Mortgage Interest and
Property Tax Deductions: Analysis and Options, by Mark P. Keightley. 9 See footnote 4.
Itemized Tax Deductions for Individuals: Data Analysis
Congressional Research Service 6
deduction for extraordinary medical expenses). The average deduction for charitable gifts also
increases sharply for tax filers with an AGI of $1 million or above. The average amount of the
charitable gift deduction claimed by tax filers with an AGI between $500,000 and $1 million was
$18,615. In contrast, the average amount of the charitable gift deduction for tax filers with an
AGI greater than $1 million was $172,529 in 2014.
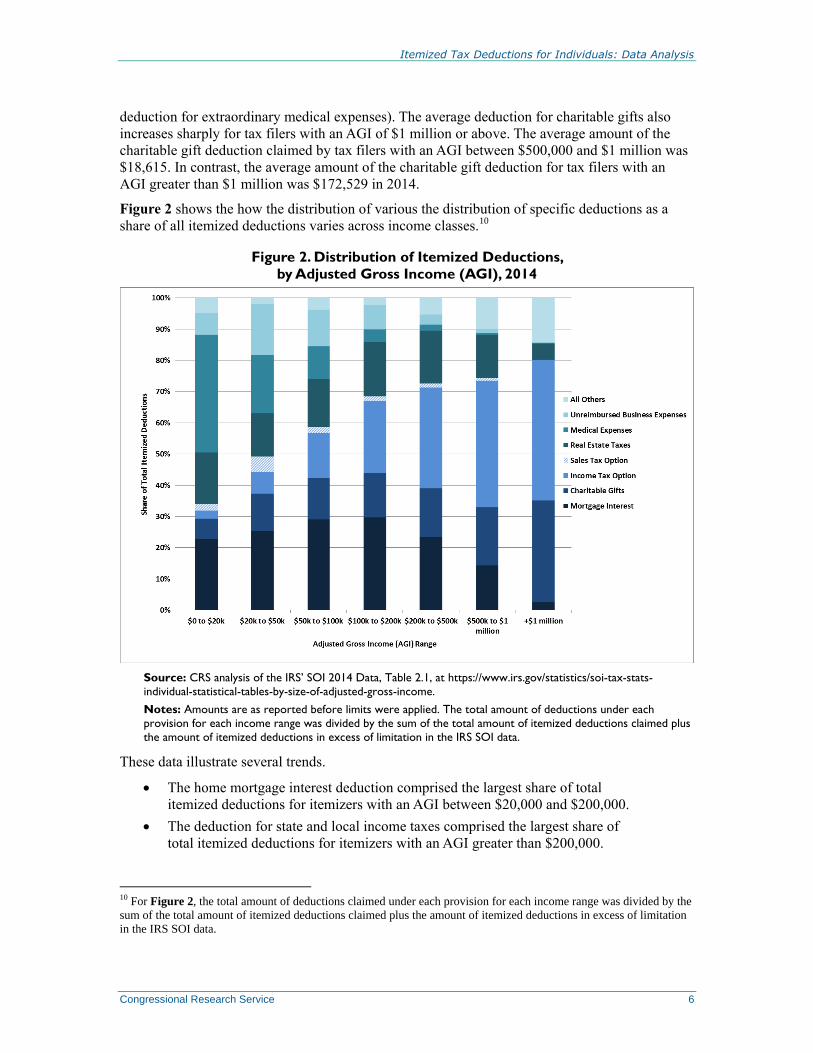
Figure 2 shows the how the distribution of various the distribution of specific deductions as a
share of all itemized deductions varies across income classes.10
Figure 2. Distribution of Itemized Deductions,
by Adjusted Gross Income (AGI), 2014
Source: CRS analysis of the IRS’ SOI 2014 Data, Table 2.1, at https://www.irs.gov/statistics/soi-tax-stats-
individual-statistical-tables-by-size-of-adjusted-gross-income.
Notes: Amounts are as reported before limits were applied. The total amount of deductions under each
provision for each income range was divided by the sum of the total amount of itemized deductions claimed plus
the amount of itemized deductions in excess of limitation in the IRS SOI data.
These data illustrate several trends.
The home mortgage interest deduction comprised the largest share of total
itemized deductions for itemizers with an AGI between $20,000 and $200,000.
The deduction for state and local income taxes comprised the largest share of
total itemized deductions for itemizers with an AGI greater than $200,000.
10 For Figure 2, the total amount of deductions claimed under each provision for each income range was divided by the
sum of the total amount of itemized deductions claimed plus the amount of itemized deductions in excess of limitation
in the IRS SOI data.

Itemized Tax Deductions for Individuals: Data Analysis
Congressional Research Service 7
The deductions for state and local income taxes and charitable contributions
composed a larger share of total deductions claimed as income rise.
Table 3 shows the amounts claimed for certain itemized deductions as a share of the total income
of itemizers. Itemized deduction claims are high when measured as a share of income for lower-
income itemizers (although, as noted in Table 1, tax filers in lower income choose to itemize at
relatively lower rates).11 Total itemized deduction claims as a share of income decline as income
increases. Across all itemizers, deductions claims amounted to 18.9% of AGI. In terms of specific
deductions, total claims for the deduction for home mortgage interest comprised the largest share
of income among itemizers with less than $200,000 in AGI. For itemizers with an AGI greater
than $200,000, the claims for state and local income taxes comprised the largest single deduction
as measured as a share of income.
Table 3. Amount of Itemized Deductions Claimed as a Share
of the Adjusted Gross Income (AGI) of Itemizers, 2014
State and Local Taxes
Adjusted
Gross Income Mortgage
Interest
Income
Tax Option
Sales Tax
Option
Real Estate
Taxes
Charitable
Giving
All Itemized
Deductions
$0 to $20k 29.9% 3.4% 2.7% 21.7% 7.7% 131.3%
$20k to $50k 10.9% 2.9% 0.9% 6.0% 4.0% 43.0%
$50k to $100k 7.5% 3.7% 0.4% 4.0% 2.8% 25.8%
$100k to $200k 5.5% 4.3% 0.3% 3.2% 2.1% 18.6%
$200k to $500k 3.6% 5.0% 0.2% 2.6% 1.9% 15.1%
$500k to
$1million 2.0% 5.7% 0.1% 1.9% 2.1% 12.4%
+$1million 0.4% 6.7% 0.0% 0.8% 2.8% 12.4%
All Itemizers 4.5% 4.9% 0.3% 2.8% 2.4% 18.9%
Source: CRS analysis of the IRS’ SOI 2014 Data, Table 2.1, at https://www.irs.gov/statistics/soi-tax-stats-
individual-statistical-tables-by-size-of-adjusted-gross-income.
Notes: Claim amounts are as reported before limits were applied. See footnote 7. Itemized deduction claims as
a share of AGI were greater than 100% for the lowest AGI range because statutory adjustments (e.g., losses and
other above-the-line deductions) lowered AGI below gross income levels.
Which Itemized Deductions Contribute Most to
Revenue Loss? Some itemized deductions are classified as tax expenditures, or losses in federal tax revenue.
Table 4 shows the Joint Committee on Taxation (JCT) estimates for the top four itemized
deductions that are expected, under current law, to contribute most to annual tax expenditures in
FY2018. Tax expenditures are defined under the Congressional Budget and Impoundment
Control Act of 1974 (P.L. 93-344) as “revenue losses attributable to provisions of the Federal tax
11 Itemized deduction claims as a share of AGI were greater than 100% for the lowest AGI range because statutory
adjustments (e.g., losses and other above-the-line deductions) lowered AGI below gross income levels.
Itemized Tax Deductions for Individuals: Data Analysis
Congressional Research Service 8
laws which allow a special exclusion, exemption, or deduction from gross income or which
provide a special credit, a preferential rate of tax, or a deferral of tax liability.”
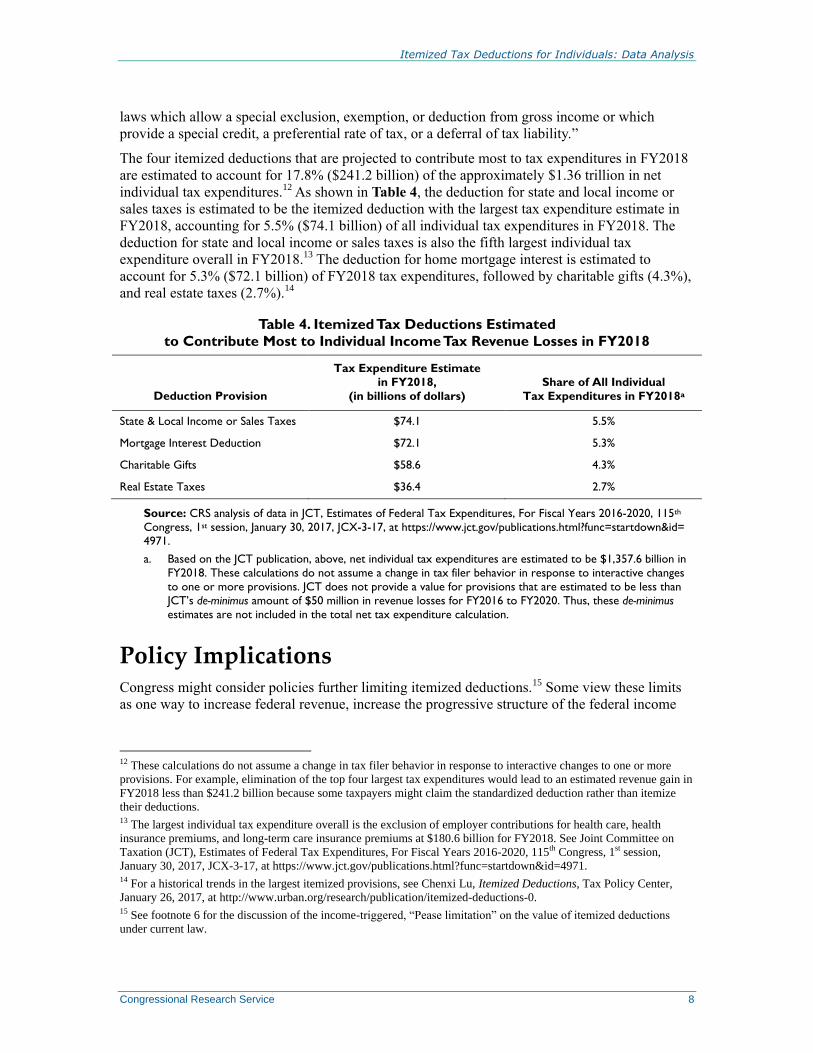
The four itemized deductions that are projected to contribute most to tax expenditures in FY2018
are estimated to account for 17.8% ($241.2 billion) of the approximately $1.36 trillion in net
individual tax expenditures.12 As shown in Table 4, the deduction for state and local income or
sales taxes is estimated to be the itemized deduction with the largest tax expenditure estimate in
FY2018, accounting for 5.5% ($74.1 billion) of all individual tax expenditures in FY2018. The
deduction for state and local income or sales taxes is also the fifth largest individual tax
expenditure overall in FY2018.13 The deduction for home mortgage interest is estimated to
account for 5.3% ($72.1 billion) of FY2018 tax expenditures, followed by charitable gifts (4.3%),
and real estate taxes (2.7%).14
Table 4. Itemized Tax Deductions Estimated
to Contribute Most to Individual Income Tax Revenue Losses in FY2018
Deduction Provision
Tax Expenditure Estimate
in FY2018,
(in billions of dollars)
Share of All Individual
Tax Expenditures in FY2018a
State & Local Income or Sales Taxes $74.1 5.5%
Mortgage Interest Deduction $72.1 5.3%
Charitable Gifts $58.6 4.3%
Real Estate Taxes $36.4 2.7%
Source: CRS analysis of data in JCT, Estimates of Federal Tax Expenditures, For Fiscal Years 2016-2020, 115th
Congress, 1st session, January 30, 2017, JCX-3-17, at https://www.jct.gov/publications.html?func=startdown&id=
4971.
a. Based on the JCT publication, above, net individual tax expenditures are estimated to be $1,357.6 billion in
FY2018. These calculations do not assume a change in tax filer behavior in response to interactive changes
to one or more provisions. JCT does not provide a value for provisions that are estimated to be less than
JCT’s de-minimus amount of $50 million in revenue losses for FY2016 to FY2020. Thus, these de-minimus
estimates are not included in the total net tax expenditure calculation.
Policy Implications Congress might consider policies further limiting itemized deductions.15 Some view these limits
as one way to increase federal revenue, increase the progressive structure of the federal income
12 These calculations do not assume a change in tax filer behavior in response to interactive changes to one or more
provisions. For example, elimination of the top four largest tax expenditures would lead to an estimated revenue gain in
FY2018 less than $241.2 billion because some taxpayers might claim the standardized deduction rather than itemize
their deductions. 13 The largest individual tax expenditure overall is the exclusion of employer contributions for health care, health
insurance premiums, and long-term care insurance premiums at $180.6 billion for FY2018. See Joint Committee on
Taxation (JCT), Estimates of Federal Tax Expenditures, For Fiscal Years 2016-2020, 115th Congress, 1st session,
January 30, 2017, JCX-3-17, at https://www.jct.gov/publications.html?func=startdown&id=4971. 14 For a historical trends in the largest itemized provisions, see Chenxi Lu, Itemized Deductions, Tax Policy Center,
January 26, 2017, at http://www.urban.org/research/publication/itemized-deductions-0. 15 See footnote 6 for the discussion of the income-triggered, “Pease limitation” on the value of itemized deductions
under current law.
Itemized Tax Deductions for Individuals: Data Analysis
Congressional Research Service 9
tax code, simplify the tax code, or reduce economic distortions in the tax code.16 When a tax filer
loses the ability to take deductions, then their taxable income increases (absent other behavioral
changes). Others seek to limit itemized deductions to increase progressivity in the tax code, where
tax filers with higher incomes pay a larger share of their income in taxes than those with less
income.
Arguments against broad limits to itemized deductions vary. The economic effects of limiting
itemized tax deductions might be undesirable for some.17 Those who are willing to accept the
economic consequences of limits on itemized tax deductions might argue for reform of individual
provisions, rather than broader limits, because the rationale for itemized deductions varies. For
example, some might find the deduction for charitable contributions desirable but not the
deduction for state and local income taxes.18
Others argue that higher-income tax filers already provide most of the revenue collected through
the individual federal income tax, and might oppose further efforts to increase the progressivity of
the federal income tax code.
Some proposals to reform or limit itemized deductions include a flat, dollar-value cap or
percentage of income cap on total deductions; a limit on the tax rate at which deductions can be
valued; converting deductions into credits; and various others.19 Although this report does not
assess these policies in depth, it provides insights from the data analysis on itemized tax
deductions that might be useful for informing the debate concerning reform options.
First, efforts to target limits on itemized tax deductions toward higher-income tax filers are
restricted in the amount of revenue that can be raised. Some have suggested a fixed dollar amount
cap as one possible way to target revenue raised from primarily higher-income households.20
However, to avoid increasing the taxable income of most households, the cap on total deductions
would need to be set high enough such that it would not be lower than the average deduction
values for those in the middle or lower portion of the income distribution. For example, Table 1
suggests that a cap of $25,000 would affect the average itemizer with an AGI less than $200,000.
However, higher caps could have more limited ability to raise revenue. Even though those at the
16 Some say that itemized deductions should be limited because they distort economic behavior, by providing
individuals with tax incentives to engage in activities that would otherwise be viewed as inefficient. 17 For more detailed analysis, see CRS Report R43079, Restrictions on Itemized Tax Deductions: Policy Options and
Analysis, by Jane G. Gravelle and Sean Lowry; and CRS Report R44242, The Effect of Base-Broadening Measures on
Labor Supply and Investment: Considerations for Tax Reform, by Jane G. Gravelle and Donald J. Marples. 18 However, eliminating deductions for one type of activity but not another might lead to unequal treatment of similar
activities. For an example of how this might relate to deductions for charitable giving and the deduction for state and
local taxes (SALT), see Martin A. Sullivan, “Economic Analysis: Why the SALT Deduction Is Always Under Attack,”
Tax Notes, December 17, 2012. 19 For a sample of policy options to limit itemized deductions, see Congressional Budget Office (CBO), Options for
Reducing the Deficit: 2017 to 2026, December 6, 2016, pp. 136-143, at https://www.cbo.gov/budget-options/2016/
52254; Len Burman et al., “Economic and Distributional Effects of Tax Expenditure Limits,” in The Economics of Tax
Policy, ed. Alan J. Auerbach and Kent Smetters (Oxford: Oxford Scholarship Online, 2017), draft dated March 13,
2016 available at http://debatemedia.wharton.upenn.edu.s3.amazonaws.com/taxpapers/burmantoder.pdf; U.S.
Department of the Treasury, General Explanations of the Administration’s Fiscal Year 2017 Revenue Proposals,
February 2016, pp. 153-154, at https://www.treasury.gov/resource-center/tax-policy/Documents/General-Explanations-
FY2017.pdf; and Martin Feldstein, Daniel Feenberg, and Maya MacGuineas, Capping Individual Tax Expenditure
Benefits, National Bureau of Economic Research, Working Paper 16921, April 2011, at http://papers.nber.org/papers/
w16921. 20 See Len Burman et al., “Economic and Distributional Effects of Tax Expenditure Limits,” in The Economics of Tax
Policy, ed. Alan J. Auerbach and Kent Smetters (Oxford: Oxford Scholarship Online, 2017), draft dated March 13,
2016 available at http://debatemedia.wharton.upenn.edu.s3.amazonaws.com/taxpapers/burmantoder.pdf.
Itemized Tax Deductions for Individuals: Data Analysis
Congressional Research Service 10
top of the income range have high average itemized deduction claim totals, data from Table 1
indicates that 87% of itemizers have an AGI less than $200,000 (or 97% have less than $500,000
in AGI) and Figure 1 indicates that these tax filers account for 65% of itemized deductions
claimed (or 82% for itemizers with less than $500,000 in AGI).
Second, the form of a limit on itemized deductions might affect which deductions a tax filer
might claim. If a tax filer potentially has deductions that exceed a flat-dollar value cap, then the
tax filer must choose which deductions to claim. Table 2 provides some estimates of which
deductions may “fill” up a taxpayer’s cap, if that cap is based on a fixed amount, whereas Table 3
provides estimates under a limit in the form of a share of AGI.
A reduction in the tax benefit derived from activities eligible for tax deduction can affect tax filer
behavior. Deductible activities that are more easily adjustable in the short run (e.g., charitable
giving) could be reduced after enactment of a limit on deductions in favor of activities that are
more difficult to adjust or plan for in the short run (e.g., state and local income or sales taxes, or
extraordinary medical expenses).21 Over time, tax filers might adjust their behavior to
accommodate for limits in itemized deductions (e.g., renting a residence might be more preferable
for some, if they can no longer deduct mortgage interest). However, a tax filer might still engage
in particular activities for other reasons (although possibly to a lesser extent) even without a tax
benefit.22 Figure 2 shows what share of a tax filer’s itemized deductions are composed individual
itemized deductions.
In contrast, limits that are not tied to fixed amounts could be structured in a way that does not
cause a tradeoff among tax-deductible activities. For example, these limits could be capped based
on a share of the tax filer’s income. Although these limits would be less likely to cause a tradeoff
between tax-deductible activities, they may reduce the tax-beneficial value of these activities. By
reducing the value of those activities (in terms of tax liability), a tax filer might choose to claim a
smaller deduction related to a certain activity (based on the behavioral response for each activity).
Third, the extent to which a limit on itemized deductions increases revenue depends on its
structure. Limits on itemized deductions increase the amount of income of itemizers that is
subject to taxation (and by also potentially taxing more of that income under a higher marginal
income tax bracket), thereby increasing revenue.23 Certain combinations of deduction limits may
shift some tax filers to claim the standard deduction instead of itemizing. In this case, the revenue
increase by limiting itemized deduction would be partially offset by more tax filers claiming the
standard deduction.
21 See Martin A. Sullivan, “Deduction Caps: The Next AMT?,” Tax Notes, December 10, 2012. 22 For example, some researchers argue that charitable gifts result in “consumption” benefits or “warm glow” for the
giver, such as social recognition and personal satisfaction. Those tax filers who are more motivated by these
consumption benefits might be less responsive to changes in tax preferences for charitable giving. See Roger
Colinvaux, Brian Galle, and Eugene Steuerle, Evaluating the Charitable Deduction and Proposed Reforms, Urban
Institute, June 2012, p. 9, at http://www.urban.org/UploadedPDF/412586-Evaluating-the-Charitable-Deduction-and-
Proposed-Reforms.pdf. For analysis and estimates of the behavioral responses of charitable giving to itemized
deduction caps, see CRS Report R40518, Charitable Contributions: The Itemized Deduction Cap and Other FY2011
Budget Options, by Jane G. Gravelle and Donald J. Marples 23 The effect of limiting (or repeal) of certain tax deductions on revenue would depend on how a proposal is structured.
For more information see Len Burman, Christopher Geissler, and Eric J. Toder, “How Big Are Total Individual Tax
Expenditures, and Who Benefits From Them,” American Economic Review, Papers and Proceedings of the One
Hundred Twentieth Annual Meeting of the American Economic Association, vol. 98, no. 2 (May 2008), pp. 79-83.

Itemized Tax Deductions for Individuals: Data Analysis
Congressional Research Service 11
Author Contact Information
Sean Lowry
Analyst in Public Finance
[email protected], 7-9154
Acknowledgments
Joshua Stick, CRS intern, provided assistance in preparing an updated version of this report.