its-related transport concepts and organisations ......alter motorway speed limits in real-time to...
TRANSCRIPT

EJTIR Issue 17(1), 2017
pp. 86-102 ISSN: 1567-7141
tlo.tbm.tudelft.nl/ejtir
Using automatic number plate recognition data to investigate the regularity of vehicle arrivals
Fraser N. McLeod1
Transportation Research Group, University of Southampton, United Kingdom.
Tom J. Cherrett2 Transportation Research Group, University of Southampton, United Kingdom.
Simon Box3 Transportation Research Group, University of Southampton, United Kingdom.
Ben J. Waterson4 Transportation Research Group, University of Southampton, United Kingdom.
James A. Pritchard5 Transportation Research Group, University of Southampton, United Kingdom.
This paper uses automatically-recorded vehicle number plate data from a network of 22 cameras in Dorset, UK, to investigate the extent to which regular trip making can be determined using the regularity of individual vehicle arrival times across the same sites and time intervals over extended periods of several months and illustrates how a cohort of recognised regular vehicles may provide indicative evidence of traffic delays. Regularity was defined based on minimum numbers of observations over a given period and with specified maximum values of standard deviation in arrival time, with sensitivity to different values being tested. It was found that around one-fifth of all vehicles were regular during the morning peak where the definition required at least 30 observations out of 210 working days and with a standard deviation in arrival time of no more than ten minutes; significantly fewer vehicles were found to be regular in the afternoon peak. The turnover, or churn, of regular vehicles was found to be considerable, with only one-tenth of defined regular vehicles being continuously regular throughout the period and with identified pools of regular drivers halving in size every three months, as vehicles ceased to be regular and where the pool was not updated. This suggests that any database of regular drivers should be updated at least quarterly to ensure that new regular vehicles are included and that old ones are discarded. These findings may have inferences for traffic information systems tailored for different driver groups according to assumed levels of network knowledge. Keywords: automatic number plate recognition, churn, commuting, network performance, regularity, travel behaviour.
1 A: Boldrewood Innovation Campus, Southampton, SO16 7QF, UK T: +442380593316 E: [email protected] 2 A: Boldrewood Innovation Campus, Southampton, SO16 7QF, UK T: +442380594657 E: [email protected] 3 E: [email protected] (Visiting Researcher at University of Southampton) 4 A: Boldrewood Innovation Campus, Southampton, SO16 7QF, UK T: +442380592345 E: [email protected] 5 A: Boldrewood Innovation Campus, Southampton, SO16 7QF, UK T: +442380599578 E: [email protected]

EJTIR 17(1), 2017, pp.86-102 87 McLeod, Cherrett, Box, Waterson and Pritchard Using automatic number plate recognition data to investigate the regularity of vehicle arrivals 1. Introduction
Traffic managers and information/systems providers could benefit from a greater understanding of the numbers of regular (and non-regular) vehicles in the network, as drivers may have different needs for and may respond differently to traffic information or guidance according to their familiarity with the road network. For example, research has suggested that drivers with good road network knowledge prefer information only whereas those less familiar with the network may require specific guidance (Budhiraja, 2005) and driver diversion rates in response to information received have been shown to depend on a number of factors, including the driver familiarity with the network, trip purpose, expected delay, the level of information received and driver confidence in the system (Peeta and Gedela, 2001).
Automatic Number Plate Recognition (ANPR) data, widely used by transport authorities for journey time or network state estimation or for enforcement purposes (e.g. for tolling, bus lanes and average speed checks), may also be useful for assessing the extent of vehicle regularity. The key research questions addressed in this study were: i) to what extent can regular trip making be determined using the regularity of individual vehicle arrival times across the same sites and time intervals over extended periods of several months?; ii) Can a cohort of recognised regular vehicles provide indicative evidence of traffic delays given the levels of churn one may expect in these cohorts over time? While this research was mainly limited to considering regularity at specific sites within a network and for given time intervals (e.g. morning peak), some examples of tracking individual vehicles between different sites are also given (end of section 4.1) to show how the data may also be used to investigate regularity of specific trips.
The main contributions of the paper are: (i) a summary of the background pertaining to the use of ANPR in traffic management and information provision and for understanding vehicle arrival patterns and travel behaviour; (ii) provision of empirical evidence of individual vehicle regularity and the churn rates of regular vehicles from a substantial ANPR dataset (22 cameras, 10-month period, 55 million observations), whereas previous studies (e.g. Del Mistro and Behrens, 2008; Cherrett and McDonald, 2002) have been small-scale in comparison, in terms of duration and network coverage; (iii) illustration of some approaches for making use of regular vehicles identified in ANPR data for traffic management or information provision.
2. Background
This section provides background information about how ANPR and related data have been used within traffic management and information dissemination theory and practice (section 2.1) and how vehicle regularity has been defined and used from traffic, transport or personal travel perspectives (section 2.2).
2.1 ANPR and related data use for traffic management and information provision One of the main uses of ANPR is for monitoring and control of transport systems and infrastructure such as those used for bus lane enforcement (i.e. to penalise those not entitled to use them), for checking vehicle speeds or for road charging (Leape, 2006; Attard and Ison, 2010; Velaga and Pangbourne, 2014). Another common use by local authorities is for sampling of journey times along key links in the network for transport planning or management purposes or for dissemination to the public (Kuroiwa et al., 2006; Hounsell et al., 2009; Hasan et al., 2011; Li et al., 2013). Latency is a recognised issue in networks where ANPR cameras are situated far apart as there can be time delays between congestion developing and accurate journey time estimates being returned (Bertini et al., 2005). Geographical information systems and advanced data visualisation techniques may be used to harness the full power of ANPR systems, particularly in large cities with many cameras (Cheng et al., 2013). Outside cities, ANPR data have been used to

EJTIR 17(1), 2017, pp.86-102 88 McLeod, Cherrett, Box, Waterson and Pritchard Using automatic number plate recognition data to investigate the regularity of vehicle arrivals alter motorway speed limits in real-time to smooth traffic flow and maintain vehicle speeds (Paulo et al., 2010).
Linking ANPR data to other data sources can extend its scope and usefulness, for example, combining with vehicle licensing information to identify vehicle types, and with emissions data, to estimate pollutant levels (Department for Environment Food and Rural Affairs, 2013). The use of ANPR data to estimate emissions in this way could complement direct air quality measurements (Pokharel et al., 2002) or other indirect estimates from fuel sales (Schifter et al., 2005). It has also been used by the French Ministry of Transport to target overloaded heavy goods vehicles by linking vehicle classification to weigh-in-motion equipment (Stanczyk and Klein, 2012). ANPR data have also been linked to weather information to gain insights into how different weather conditions affect travel times (Tsapakis et al., 2013).
Directly related to this research, ANPR data have been used to show returning vehicle patterns at specific points in a network: Del Mistro and Behrens (2008) found significant differences in the returning patterns of vehicles using roads feeding a residential area, the central business district and a main arterial road around Cape Town, South Africa; Cherrett and McDonald (2002) found that during the morning peak on three key roads in Southampton around half of the vehicles seen one day were also seen the next day and, in 62% of those cases, the arrival times were within five minutes of each other, suggesting highly regular returning behaviour.
ANPR systems cannot be relied upon to be 100% accurate in detecting all vehicles and in reading all number plates correctly. Number plates can be missed or read incorrectly for a variety of reasons including: i) obscuration by other vehicles or objects (e.g. in congested conditions); ii) poor visibility (e.g. shadows, glare); iii) positioning and configuration of the camera, which can affect image resolution; and iv) issues with the number plate itself (e.g. missing, damaged, dirty or use of non-standard fonts) (Keilthy, 2008; Gazcón et al., 2012). Reviews of ANPR technology suggest typical overall success rates in the range 85%-95% (Du et al., 2013; Patel et al., 2013) which mean that ANPR data are not well suited to measurement of vehicle flow unless the detection rate can be determined and corrected for.
2.2 Defining and making use of vehicle regularity The concept of vehicle regularity can cover many possible facets of trip-making and resulting traffic patterns. In this paper, it was defined from the context of frequency and consistency of arrival times of individual vehicles over an extended period of time (i.e. months), at specific points in the network (i.e. locations of ANPR cameras) and for selected time intervals (e.g. peak traffic periods) (see section 3 for precise definition). This definition was chosen for its simplicity and as it was considered to be particularly relevant to traffic managers or other information providers who are often dealing with road network issues that are highly location and time specific (e.g. accident at point X, started 0730, cleared 0830). In published literature, regularity is more usually considered from the point of view of an individual person’s trip-making behaviour and takes a much broader perspective, less restricted by location or time constraints and sometimes considering other modes of transport (e.g. bus, train, walking, cycling) (Schönfelder and Axhausen, 2010). Irrespective of definitions used, some relevant observations can be drawn from reported literature, as summarised in this section.
Regular trip-making by car is usually associated with commuting to and from work or an educational establishment and these trips tend to be concentrated during traditional weekday morning and afternoon peak traffic periods (Department for Transport, 2015). While work-related or other ‘mandatory’ travel (e.g. school runs) may account for only around 20% of all car trips in developed countries (Järv et al, 2014) this can increase to around 50% during morning peak traffic (Downs, 2004). Greater variability in vehicle arrival patterns has been observed during the afternoon peak period compared to the morning as around two-thirds of trips may be
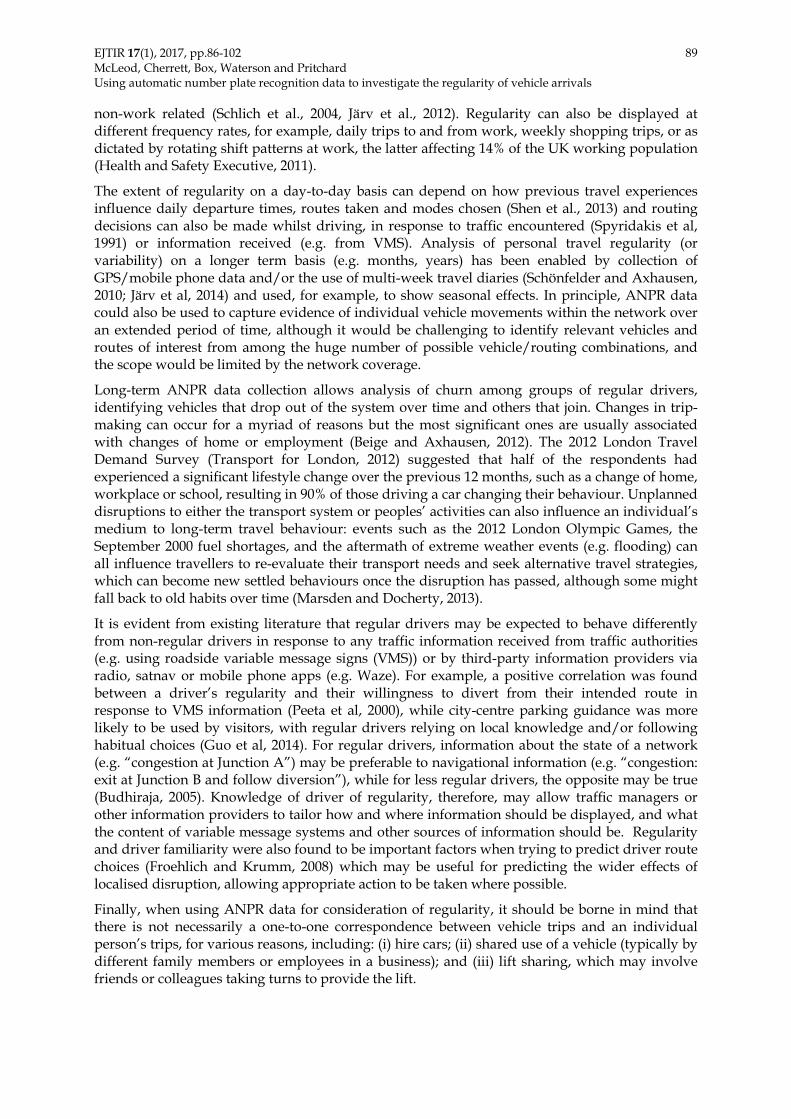
EJTIR 17(1), 2017, pp.86-102 89 McLeod, Cherrett, Box, Waterson and Pritchard Using automatic number plate recognition data to investigate the regularity of vehicle arrivals non-work related (Schlich et al., 2004, Järv et al., 2012). Regularity can also be displayed at different frequency rates, for example, daily trips to and from work, weekly shopping trips, or as dictated by rotating shift patterns at work, the latter affecting 14% of the UK working population (Health and Safety Executive, 2011).
The extent of regularity on a day-to-day basis can depend on how previous travel experiences influence daily departure times, routes taken and modes chosen (Shen et al., 2013) and routing decisions can also be made whilst driving, in response to traffic encountered (Spyridakis et al, 1991) or information received (e.g. from VMS). Analysis of personal travel regularity (or variability) on a longer term basis (e.g. months, years) has been enabled by collection of GPS/mobile phone data and/or the use of multi-week travel diaries (Schönfelder and Axhausen, 2010; Järv et al, 2014) and used, for example, to show seasonal effects. In principle, ANPR data could also be used to capture evidence of individual vehicle movements within the network over an extended period of time, although it would be challenging to identify relevant vehicles and routes of interest from among the huge number of possible vehicle/routing combinations, and the scope would be limited by the network coverage.
Long-term ANPR data collection allows analysis of churn among groups of regular drivers, identifying vehicles that drop out of the system over time and others that join. Changes in trip-making can occur for a myriad of reasons but the most significant ones are usually associated with changes of home or employment (Beige and Axhausen, 2012). The 2012 London Travel Demand Survey (Transport for London, 2012) suggested that half of the respondents had experienced a significant lifestyle change over the previous 12 months, such as a change of home, workplace or school, resulting in 90% of those driving a car changing their behaviour. Unplanned disruptions to either the transport system or peoples’ activities can also influence an individual’s medium to long-term travel behaviour: events such as the 2012 London Olympic Games, the September 2000 fuel shortages, and the aftermath of extreme weather events (e.g. flooding) can all influence travellers to re-evaluate their transport needs and seek alternative travel strategies, which can become new settled behaviours once the disruption has passed, although some might fall back to old habits over time (Marsden and Docherty, 2013).
It is evident from existing literature that regular drivers may be expected to behave differently from non-regular drivers in response to any traffic information received from traffic authorities (e.g. using roadside variable message signs (VMS)) or by third-party information providers via radio, satnav or mobile phone apps (e.g. Waze). For example, a positive correlation was found between a driver’s regularity and their willingness to divert from their intended route in response to VMS information (Peeta et al, 2000), while city-centre parking guidance was more likely to be used by visitors, with regular drivers relying on local knowledge and/or following habitual choices (Guo et al, 2014). For regular drivers, information about the state of a network (e.g. “congestion at Junction A”) may be preferable to navigational information (e.g. “congestion: exit at Junction B and follow diversion”), while for less regular drivers, the opposite may be true (Budhiraja, 2005). Knowledge of driver of regularity, therefore, may allow traffic managers or other information providers to tailor how and where information should be displayed, and what the content of variable message systems and other sources of information should be. Regularity and driver familiarity were also found to be important factors when trying to predict driver route choices (Froehlich and Krumm, 2008) which may be useful for predicting the wider effects of localised disruption, allowing appropriate action to be taken where possible.
Finally, when using ANPR data for consideration of regularity, it should be borne in mind that there is not necessarily a one-to-one correspondence between vehicle trips and an individual person’s trips, for various reasons, including: (i) hire cars; (ii) shared use of a vehicle (typically by different family members or employees in a business); and (iii) lift sharing, which may involve friends or colleagues taking turns to provide the lift.

EJTIR 17(1), 2017, pp.86-102 90 McLeod, Cherrett, Box, Waterson and Pritchard Using automatic number plate recognition data to investigate the regularity of vehicle arrivals 3. Methodology
Live data feeds from 22 ANPR cameras originally set up by Dorset County Council to monitor network performance during the 2012 Olympic sailing events in Weymouth were used in this research. The majority of the data presented in this paper covered the period 4th April 2013 to 12th February 2014, excluding four consecutive days (17-20 June) on which all data were lost due to a system breakdown. In addition, three cameras were removed from service during the survey period resulting in reduced datasets: with reference to numbers and directions shown in Figure 1, sites 8(W), 4(N) and 6(N and S) comprised 88, 107 and 163 weekdays, respectively. The ANPR data were fed into a database and analysed using SQL (Structured Query Language). An ANPR record in the database comprised a number plate reading (e.g. AB12XYZ), the time and date the plate was recorded, a camera location code, and a percentage value (0%-100%) representing the system’s confidence in the accuracy of the reading (average found in data was 90.1%). The entire dataset comprised over 55 million individual vehicle observations and covered 210 weekdays; data were also available for weekends but were not used here.
Vehicles were defined as being regular according to the number of times (N) they appeared in the data set for a given site, time interval (e.g. morning peak) and period (e.g. several months) and the consistency of their arrival times as measured by the standard deviation of arrival time in minutes (σ). As regularity is a somewhat subjective term, a range of values for N and σ were considered (section 5.1) to determine how many vehicles would be defined as regular according to different combinations of the two parameters namely:
- N ≥ 30, 40, 50, 60, 70, 80, 90, 100, 110 and 120 observations (out of 210 weekdays), and - σ ≤ 5, 6, 7, 8, 9, 10, 11, 12, 13, 14, 15 minutes,
giving 110 (=10x11) combinations of (N, σ) pairs – the resulting numbers of identified regular vehicles are shown for the morning peak (Table 1). As one would expect, the number of ‘regular vehicles’ varied according to the strictness of the definition, ranging from 13,455 vehicles (N≥30, σ≤15) to only 220 vehicles (N≥120, σ≤5). The definition chosen here for all subsequent analyses was (N≥30, σ≤10), following on from the work by Cherrett and McDonald (2002).
Table 1. Numbers of vehicles across sites meeting minimum days observed and maximum standard deviation of arrival time criteria
Max. σ (minutes)
Minimum number of days observed (N) (percentage of 210 working days)
30 (14%)
40 (19%)
50 (24%)
60 (28%)
70 (33%)
80 (38%)
90 (43%)
100 (47%)
110 (52%)
120 (57%)
5 1726 1262 990 820 648 538 432 343 271 220 6 2565 1913 1517 1232 997 832 668 530 427 347 7 3475 2618 2084 1695 1383 1136 905 721 585 477 8 4500 3439 2759 2258 1832 1504 1199 960 781 636 9 5590 4327 3506 2887 2367 1957 1574 1265 1032 826 10 6770 5281 4281 3532 2895 2406 1964 1585 1290 1034 11 8036 6334 5153 4254 3513 2915 2379 1926 1571 1264 12 9269 7363 5983 4940 4093 3398 2777 2264 1840 1473 13 10608 8461 6889 5698 4737 3925 3200 2609 2112 1694 14 11965 9570 7802 6446 5356 4449 3634 2942 2374 1915 15 13455 10811 8821 7298 6069 5036 4116 3316 2684 2161
It should be noted that the vehicles identified as ‘regular’ in Table 1 were not necessarily all distinct from one another as some may have been defined as being regular at more than one site

EJTIR 17(1), 2017, pp.86-102 91 McLeod, Cherrett, Box, Waterson and Pritchard Using automatic number plate recognition data to investigate the regularity of vehicle arrivals (for example, one vehicle was observed to be regular at five separate sites, including four sites where the vehicle was regular in opposing directions of travel, indicating a regular return trip within the morning peak). A more detailed analysis of 2974 regular vehicles (N≥30, σ≤10) during the first four months of the data collection period (4 April – 4 August, 2013), suggested that 1671 vehicles (56.2%) were regular at one site only; 686 (23.1%) at two sites; 332 (11.2%) at three; 181 (6.1%) at four; and 104 (3.5%) at between five and nine sites.
For the analysis of frequency of individual vehicle observations (section 4.1), a minimum 90% read rate confidence level was applied to avoid the inclusion of too many spurious number plate readings; however, it’s recognised that this procedure would likely have discarded significant numbers of genuine readings too (the overall sample was reduced by 25.9%). This relates to concerns raised in section 2.1 about ANPR not being well suited to counting vehicles, so the observations of section 4.1 should be treated with some caution. For the analysis of regularity of vehicle arrivals (section 5.1) no minimum confidence level requirement was applied on the basis that the selected plates (i.e. those observed N or more times) would be highly likely to be genuine (confidence grows with sample size) and, conversely, spurious plates would likely not be selected due to appearing in the data infrequently, typically once only.
Analyses focussed on weekdays and defined morning (0700-0900) and afternoon peak traffic time intervals (1630-1830). Using a similar approach to Cherrett and McDonald (2002), when considering a given time interval, vehicle arrivals were included in the analysis if their mean arrival times were within the time interval, with the mean arrival time calculations being based on all vehicle observations within the interval extended by 30 minutes on each side (e.g. 0630-0930). As an example, a vehicle arriving at 0630, 0650, 0710, 0720 and 0725 on different days would have been included in the analysis, as its mean arrival time (0703) was within the defined morning peak time interval (0700-0900). Where a vehicle was observed more than once during a time interval on the same day then only the first observation was used when calculating its mean and standard deviation of arrival time. This happened rarely and was often associated with buses which were separately identified using bus operator vehicle records and removed from the dataset.
For the assessment of using regular vehicles as indicators of network performance (section 5.2) the mean standard score (also known as z-score) was calculated for a defined set of regular vehicles (1):
zd = ( 1
𝑅𝑅𝑑𝑑) ∗ ∑ (𝑡𝑡𝑖𝑖 − 𝜇𝜇𝑖𝑖)/𝜎𝜎𝑖𝑖𝑖𝑖∈S (1)
where, S = set of regular vehicles arriving in the time interval on day d Rd = number of regular vehicles arriving in the time interval on day d t i = arrival time of ith regular vehicle appearing on day d, µ i = mean arrival time of vehicle i over the defined period, σi = standard deviation of arrival time of vehicle i over the defined period.
The mean standard score represents the mean number of standard deviations that observed vehicle arrival times differ from their mean values, with positive values indicating lateness and negative values earliness. As the mean standard score can be skewed by a few vehicles being very early or late, the median standard score was also obtained for comparison. Individual days were then ranked at each site according to both their mean and median standard score values to quickly identify the days with the highest values where there might be some network problem causing vehicle delays. To demonstrate the technique, in this analysis we defined regular vehicles as being observed on N ≥ 30 occasions with a standard deviation in arrival time of σ ≤ 10 for the morning peak interval (0700-0900) over the period April–July 2013.

EJTIR 17(1), 2017, pp.86-102 92 McLeod, Cherrett, Box, Waterson and Pritchard Using automatic number plate recognition data to investigate the regularity of vehicle arrivals The analysis of churn of regular vehicles (section 5.3) was made by considering a series of rolling four-month periods with updating every month. That is, sets of regular vehicles were identified for the periods April-July, May-August, June-September etc., for each site during the morning peak and then compared with one another to assess for how long individual vehicles were defined as regular (number of periods) and the churn, expressed as a decay rate of the size of a pool of identified regular vehicles over time due to some ceasing to be regular.
While the main analyses focused on regularity of vehicle arrivals at a specific site, some example analyses of identifying individual vehicles between a pair of sites were also undertaken (section 4.1) to illustrate the potential for widening the investigation to consideration of specific routes.
4. Description of the case study area and data
The 22 ANPR cameras were located at 13 sites along the A354 connecting the county town of Dorchester (population approximately 19,100), the seaside town of Weymouth (population approximately 52,300) and the Isle of Portland (population approximately 12,400), Dorset, UK, a distance of around 15km (Figure 1). Of the 13 sites, nine had two cameras, one covering each direction of travel, and four had a single camera. The directions covered at each site are indicated by arrows (Figure 1) and all roads had two-way traffic flow.
Figure 1. ANPR sites and directions of travel covered (Notes: 1. For simplicity, the indicated directions are approximated as north, south, east, west
2. The Isle of Portland, referred to in text, is just off the map to the south)
For the majority of its length, the A354 had a single lane in each direction but with two northbound lanes out of Weymouth (the Weymouth Relief Road). Separate data from automatic traffic counters (pneumatic loops in the road surface), at site #3, for 2013, were obtained to

EJTIR 17(1), 2017, pp.86-102 93 McLeod, Cherrett, Box, Waterson and Pritchard Using automatic number plate recognition data to investigate the regularity of vehicle arrivals quantify average working week (Monday to Friday) two-way vehicle flows (TWVF) by month (Figure 2), and by time of day (Figure 3). These indicated a peak TWVF during July and August of just over 29,300 vehicles per week, with a continuous movement of over 1,600 vehicles per hour (TWVF) between 0700 and 1800. Separate one-way counts recorded during one week in June 2014 indicated that on weekday mornings, the predominant flow of vehicles was northbound towards Dorchester, while in the afternoon the pattern was reversed: the average flow northbound peaked at 1,427 vehicles per hour, from 0700 to 0800, while the average flow southbound peaked at 1,395 vehicles per hour, from 1700 to 1800.
Figure 2. Seasonal variation (2013) in two-way flow at site #3 on the A354 (see Figure 1)
Figure 3. Variation in weekday two-way flow, 2013, at site #3 on the A354 (see Figure 1)
4.1 Frequency of vehicle observations The number of observations of each number plate during the 210-day period and in the time interval 0700-0900, based on plates with a minimum read confidence estimate of 90%, was obtained for each site and averaged across the sites, shown as a cumulative frequency plot (Figure 4). This showed that, on average across the sites, 55.7% of the distinct number plates recorded were only observed once during this time interval for the particular site during the
0
5000
10000
15000
20000
25000
30000
35000
Jan Feb Mar Apr May Jun Jul Aug Sep Oct Nov Dec
Ave
rage
two-
way
veh
icle
flow
(v
ehic
les/
wor
king
wee
k)
Month of year, 2013
0
500
1000
1500
2000
2500
0-1
1-2
2-3
3-4
4-5
5-6
6-7
7-8
8-9
9-10
10-1
111
-12
12-1
313
-14
14-1
515
-16
16-1
717
-18
18-1
919
-20
20-2
121
-22
22-2
323
-24
Ave
rage
two-
way
veh
icle
flow
(v
ehic
les/
hour
)
Hour of day

EJTIR 17(1), 2017, pp.86-102 94 McLeod, Cherrett, Box, Waterson and Pritchard Using automatic number plate recognition data to investigate the regularity of vehicle arrivals whole period, while a further 26.9% were observed between two and five times and a further 6.8% observed between six and ten times. These data suggest that at each site, one could expect only a small group of habitual road users: for example, only 5.9% of the observed vehicle population was observed more than 20 times in the 210 days during the morning peak.
Figure 4. Cumulative frequency averaged across all sites of individual vehicle observations in 210-day period during morning peak (0700-0900)
Table 2. Proportions of one-off observations of plates at each site
Site number (Figure 1)
Northbound Southbound
1 58% -
2 - 53%
3 53% 62%
4 59% -
5 49% 59%
6 49% 61%
9 58% 43%
11 45% 58%
13 55% 61%
Site number Eastbound Westbound 7 51% -
8 51% 59%
10 52% 60%
12 48% 55%
It should be noted that one-off observations could either be genuine or a misreading of a plate that appears elsewhere in the database, despite the minimum 90% confidence level imposed, so some caution in interpretations is needed. The proportions of these one-off observations varied significantly between sites (43% to 62%, χ2 = 6195 and χ2 (0.05) (21 d.f.) = 41.4) with the mean observed across southbound sites (57%) being slightly higher compared to northbound (53%)
0%
20%
40%
60%
80%
100%
Cum
ulat
ive
prop
ortio
n of
veh
icle
pop
ulat
ion
Number of times same vehicle observed at same site between 0700-0900

EJTIR 17(1), 2017, pp.86-102 95 McLeod, Cherrett, Box, Waterson and Pritchard Using automatic number plate recognition data to investigate the regularity of vehicle arrivals (Table 2), which may be a reflection of higher commuting flow in the northbound direction toward Dorchester during the morning period.
Although not the main focus of this paper, these data may also be used to reveal the movements of vehicles between sites. For example, during the morning (0630-0930), on average, 32.8% of vehicles travelling northwards (towards Dorchester) at site 6 were also observed at site 3 on the same day; while, in the opposite direction of travel (towards Weymouth), 26.8% of vehicles travelling southwards at site 3 were also observed at site 6. And, to provide some indication of typical commuting travel, on average, only 19% of vehicles observed travelling southwards at site 3 in the morning (0630-0930) were also observed returning to the same site in the opposite direction during the afternoon (1600-1900), suggestive of the greater variability in route choice in the afternoon resulting from differing activity profiles (Schlich et al., 2004).
5. Results and Discussion
All results were based on regular vehicles having N≥30 observations with a standard deviation in arrival time within the AM or PM peak period of σ ≤ 10 minutes (section 3).
5.1 Understanding vehicle arrival time regularity For the morning peak (0700-0900), 6770 regular vehicles were identified, corresponding to approximately one-fifth of the traffic total traffic flow, while a similar analysis for the afternoon peak (1630-1830) indicated only 820 regular vehicles across all the sites (Table 3). This is attributed to the fact that proportionally more commuting takes place during the morning compared to the afternoon (Department for Transport, 2015) and that work departure times have been observed to be more flexible, given that other activities can be combined with the afternoon return journey (Järv et al., 2012; Schlich et al., 2004). During the morning peak period, the number of regular vehicles in the northbound direction, ranged from 208 to 531 vehicles between the sites, with an average of 358 vehicles; while in the southbound direction, the range was 205 to 544 vehicles, with an average of 333 vehicles.
Table 3. Numbers of regular vehicles (N≥30, σ≤10) in AM/PM peak periods
Site number Northbound Southbound 0700-0900 1630-1830 0700-0900 1630-1830
1 297 14 - -
2 - - 297 37
3 531 47 495 74
4 208 21 - -
5 518 65 544 77
6 492 74 263 37
9 242 66 279 21
11 344 24 245 10
13 231 14 205 41
Total 2900 325 2291 297
Site number Eastbound Westbound 7 315 98 - -
8 286 26 100 4
10 137 12 186 12
12 300 22 255 24
Total 1038 158 541 40
A more detailed breakdown of vehicle regularity, by 15-minute time window based on average arrival time, was performed for the morning peak period at two selected sites and both directions

EJTIR 17(1), 2017, pp.86-102 96 McLeod, Cherrett, Box, Waterson and Pritchard Using automatic number plate recognition data to investigate the regularity of vehicle arrivals of travel (site numbers 3 and 5, Figure 1), those recording the largest numbers of regular vehicles (Table 4). This analysis indicated a range of between 36 and 102, and an average of 65 regular vehicles across the different combinations. The number of regular vehicles in each time window reflected the overall flow profile, with most being observed in the 0800-0815 time window. The site where the most regular vehicles were observed was #5, southbound (544 vehicles) which is likely to reflect traffic travelling to the two major supermarkets located there but, more significantly, the Mount Pleasant park-and-ride site which has space for 1000 vehicles and services Weymouth by bus every 15 minutes outside of the winter months.
Table 4. Numbers of regular vehicles (N≥30, σ≤10) by 15-minute time interval
Site number Direction 15-minute interval commencing Total 0700 0715 0730 0745 0800 0815 0830 0845
3 North 75 76 82 64 64 64 59 47 531 5 North 84 69 65 48 72 68 74 38 518 3 South 39 39 65 70 84 68 64 66 495 5 South 36 41 54 72 89 102 74 76 544 Total 234 225 266 254 309 302 271 227 2088
5.2 Regular vehicles as indicators of network performance The conjecture here was that daily observation of the arrival times of previously identified sets of known regular drivers for given sites in the network could provide an indication of network performance. The calculation and ranking of mean and median standard score values (section 3) for the morning peak interval (0700-0900) over the period April–July 2013 indicated several sites where the 23rd July 2013 was ranked highly both by mean and median value. To illustrate the mean standard score for each day at one of those sites (#11, A354 northbound) is shown (Figure 5), where the largest value (0.568) occurred on 23rd July 2013.
Figure 5. Mean standard score at site #11, northbound
The vehicle lateness profile for 23rd July 2013 (Figure 6) confirmed that 74 of the 111 defined regular vehicles arrived later than usual (by a minute or more), of which 24 vehicles were more than 10 minutes late. The likely explanation for this was roadworks just upstream of the site, recorded in a traffic management database at the Dorset traffic control centre. The analyses found a number of other sites/dates where the mean (or median) standard score was noticeably higher
-0,3
-0,2
-0,1
0
0,1
0,2
0,3
0,4
0,5
0,6
0,7
04-04-13 24-04-13 14-05-13 03-06-13 23-06-13 13-07-13 02-08-13
mea
n st
anda
rd s
core
Date (dd/mm/yy)

EJTIR 17(1), 2017, pp.86-102 97 McLeod, Cherrett, Box, Waterson and Pritchard Using automatic number plate recognition data to investigate the regularity of vehicle arrivals than on other days at the same site although in those cases no explanatory evidence was found from other traffic information sources.
Figure 6. Lateness of regular vehicles (N≥30, σ≤10) at site #11, northbound on 23/7/13
5.3 Quantifying the churn of regular vehicles If regular drivers are to be monitored for traffic management purposes, for assessment of network performance (section 5.2), or for other reasons, it will be important to regularly update the sets of drivers that are identified as being regular due to the likelihood of some vehicles/drivers ceasing to be regular and other new regulars entering the system. For this reason, the churn, or turnover rate, of regular vehicles at specific sites and times of day is of interest. To illustrate, sets of regular vehicles were determined and updated each month for a series of seven rolling four-month periods, covering the morning peak (0700-0900) at the two selected busiest sites (#3 and #5) across both directions of travel (Table 5). Results suggested a trend in the declining numbers of regular vehicles over time also reflected by the seasonal decline in traffic flow (Figure 2) and the closure of the park-and-ride facility, close to site #5, over the winter period (from 1 October onwards). While the numbers of regular vehicles identified over a 4-month period ranged between 264 and 454 across the four sites, the number of different vehicles identified as regular at each site in one or more of the periods ranged between 727 and 1285 (labelled ‘Distinct vehicles’ in Table 5).
Table 5. Number of regular vehicles (N≥30, σ≤10) at selected sites over time
Site# Direction
Period (from April 2013 to January 2014) Distinct vehicles
P&R open P&R open for part of period
P&R closed
Apr- Jul
May-Aug Jun-Sep Jul-
Oct Aug-Nov Sep-Dec Oct-
Jan 3 North 358 336 319 316 276 242 222 861
5 North 449 414 406 413 416 418 454 727
3 South 307 284 271 299 277 292 264 1285
5 South 367 331 334 354 333 305 288 864
Total 1481 1365 1330 1382 1302 1257 1228 3737 Note: Park-and-ride site closed from 1st October
-2500
-2000
-1500
-1000
-500
0
500
1000
1500
2000
2500
0700 0730 0800 0830 0900
late
ness
(s)
Time (hhmm)
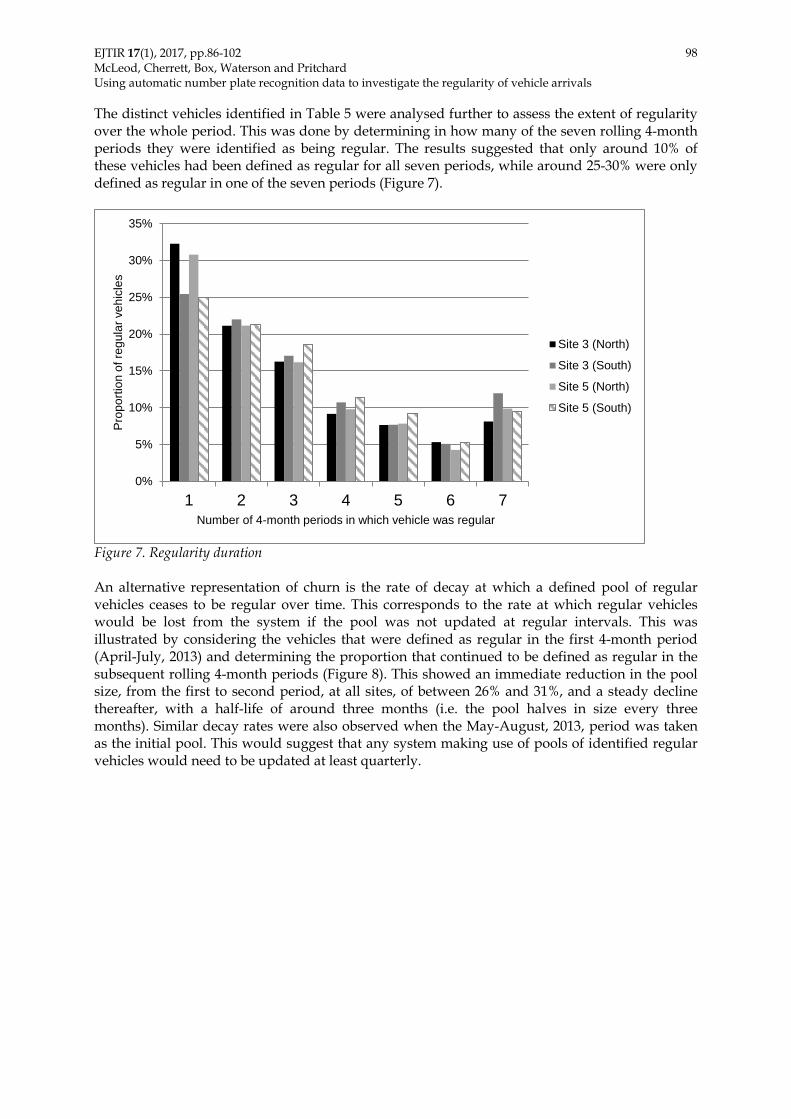
EJTIR 17(1), 2017, pp.86-102 98 McLeod, Cherrett, Box, Waterson and Pritchard Using automatic number plate recognition data to investigate the regularity of vehicle arrivals The distinct vehicles identified in Table 5 were analysed further to assess the extent of regularity over the whole period. This was done by determining in how many of the seven rolling 4-month periods they were identified as being regular. The results suggested that only around 10% of these vehicles had been defined as regular for all seven periods, while around 25-30% were only defined as regular in one of the seven periods (Figure 7).
Figure 7. Regularity duration An alternative representation of churn is the rate of decay at which a defined pool of regular vehicles ceases to be regular over time. This corresponds to the rate at which regular vehicles would be lost from the system if the pool was not updated at regular intervals. This was illustrated by considering the vehicles that were defined as regular in the first 4-month period (April-July, 2013) and determining the proportion that continued to be defined as regular in the subsequent rolling 4-month periods (Figure 8). This showed an immediate reduction in the pool size, from the first to second period, at all sites, of between 26% and 31%, and a steady decline thereafter, with a half-life of around three months (i.e. the pool halves in size every three months). Similar decay rates were also observed when the May-August, 2013, period was taken as the initial pool. This would suggest that any system making use of pools of identified regular vehicles would need to be updated at least quarterly.
0%
5%
10%
15%
20%
25%
30%
35%
1 2 3 4 5 6 7
Pro
porti
on o
f reg
ular
veh
icle
s
Number of 4-month periods in which vehicle was regular
Site 3 (North)
Site 3 (South)
Site 5 (North)
Site 5 (South)

EJTIR 17(1), 2017, pp.86-102 99 McLeod, Cherrett, Box, Waterson and Pritchard Using automatic number plate recognition data to investigate the regularity of vehicle arrivals
Figure 8. Decay rate of regular vehicles (N≥30, σ≤10)
6. Conclusions and further research
This research has demonstrated how ubiquitous ANPR data may be utilised for identification of regular vehicles within the traffic stream, with potential applications in traffic planning and management, traffic information provision, or for more general study of returning traffic. The research presented here focused on regularity at specific points within the network and for time intervals of particular interest, where, for example, approximately one-fifth of vehicles were defined to be regular during the morning peak according to the definition used (N≥30, σ ≤ 10), while very few vehicles were defined to be regular in the afternoon peak, reaffirming other studies that have indicated greater variation in travel behaviour as part of the commute home. An investigation of the extent to which a pool of identified regular vehicles changed over time suggested not only a seasonal decline in numbers, reflecting seasonal decline in overall flows, but also a considerable amount of churn, with only 10% of vehicles being consistently regular over the period and with 25-30% only defined as regular once. The findings suggest that any database of regular drivers, derived from ANPR data and using a similar definition of regularity, would need to be updated at least quarterly to ensure that new regular vehicles are included and that old ones are discarded in a timely fashion.
The mean (or median, if preferred) standard score statistic provides a summary of how late (or early) an identified pool of regular drivers is at a site, compared to average arrival times, and can be used as an indicator of daily network performance. This may be used for traffic planning purposes or, more dynamically, as an indicator of network incidents; however, its practical usefulness for the latter may be limited due to latency (delay between a specific incident occurring and vehicles arriving at a location) and as it provides no explanatory information about the cause or location of any incident.
ANPR data from an area network provides a rich data source with many possibilities for further exploration, such as more in-depth analyses of individual vehicle movements between sites and at different times of day over a series of days to provide mode detailed insights into intrapersonal behaviour. Such analysis may also reveal reasons for the observed churn rates of regularly returning vehicles at key points in the network, such as vehicles disappearing from the area entirely, or using different routes, or travelling at different times of day. Linking to other vehicle
0%
10%
20%
30%
40%
50%
60%
70%
80%
May-Aug Jun-Sep Jul-Oct Aug-Nov Sep-Dec Oct-Jan
Reg
ular
s re
mai
ning
from
orig
inal
poo
l
Time period
Site 3 (North)
Site 3 (South)
Site 5 (North)
Site 5 (South)
EJTIR 17(1), 2017, pp.86-102 100 McLeod, Cherrett, Box, Waterson and Pritchard Using automatic number plate recognition data to investigate the regularity of vehicle arrivals data sets, such as from the UK’s Driver and Vehicle Licensing Agency (DVLA), could provide further explanatory information, such as whether a vehicle has been transferred to another person or taken off the road.
References
Attard, M. and Ison, S. G. (2010). The implementation of road user charging and the lessons learnt: the case of Valletta, Malta. Journal of Transport Geography, 18(1), 14-22.
Beige, S. and Axhausen, K. W. (2012). Interdependencies between turning points in life and long-term mobility decisions. Transportation, 39(4), 857-872.
Bertini, R. L., Lasky, M. and Monsere, C. M. (2005). Validating predicted rural corridor travel times from an automated license plate recognition system: Oregon’s frontier project. Proceedings 2005 IEEE Intelligent Transportation Systems, 706–711.
Budhiraja, H. (2005). Network knowledge – its impact on driver response to guidance systems. Traffic Engineering and Control, 46(5), 193-196.
Cheng, T., Tanaksaranond, G., Brunsdon, C. and Haworth, J. (2013). Exploratory visualisation of congestion evolutions on urban transport networks. Transportation Research Part C: Emerging Technologies, 36, 296-306.
Cherrett T. J. and McDonald M. (2002). Traffic composition during the morning peak period - implications for urban traffic management systems. European Journal of Transportation and Infrastructure Research, 2(1), 41-55.
Del Mistro, R. and Behrens, R. (2008). How variable is the variability in traffic? How can TDM succeed? 27th Southern African Transport Conference: Partnership for Research and Progress in Transportation, Pretoria.
Department for Environment Food and Rural Affairs (2013). 2013 Government GHG Conversion Factors for Company Reporting : Methodology Paper for Emission Factors. https://www.gov.uk/government/uploads/system/uploads/attachment_data/file/224437/pb13988-emission-factor-methodology-130719.pdf, last accessed 5 September 2016.
Department for Transport (2015). National Travel Survey: England 2014. Available at: https://www.gov.uk/government/uploads/system/uploads/attachment_data/file/457752/nts2014-01.pdf, last accessed 5 September 2016.
Downs, A. (2004). Still stuck in traffic: coping with peak-hour traffic congestion. Washington D.C.: Brookings Institution Press, p455.
Du, S., Ibrahim, M., Shehata, M. and Badawy, W. (2013). Automatic license plate recognition (ALPR): a state-of-the-art review, IEEE Transactions on Circuits and Systems for Video Technology, 23(2), 311-325.
Froehlich, J. and Krumm, J. (2008). Route prediction from trip observations. Proceedings of SAE World Congress, 2193(2008-01–0201), 53.
Gazcón, N. F., Chesñevar, C. I., and Castro, S. M. (2012). Automatic vehicle identification for Argentinean license plates using intelligent template matching. Pattern Recognition Letters, 33(9), 1066-1074.
Guo, W., Ji, Y., Wang, W., Blythe, P., & Tang, D. (2014). Understanding drivers’ perspective on parking guidance information. IET Intelligent Transport Systems, 8(4), 398–406.
Hasan, S., Choudhury, C. F., Ben-Akiva, M. E., and Emmonds, A. (2011). Modeling of travel time variations on urban links in London. Transportation Research Record, 2260, 1-7.
Hounsell, N.B., Shrestha, B. P., Piao, J. and McDonald, M. (2009). Review of urban traffic management and the impacts of new vehicle technologies. Institution of Engineering and Technology, Intelligent Transport Systems, 3(4), 419-428.
EJTIR 17(1), 2017, pp.86-102 101 McLeod, Cherrett, Box, Waterson and Pritchard Using automatic number plate recognition data to investigate the regularity of vehicle arrivals Health and Safety Executive (2011). Changes in shift patterns over the last ten years (1999 to 2009). Research Report RR887.
Järv, O., Ahas, R., Saluveer, E., Derudder, B., Witlox, F. (2012). Mobile phones in a traffic flow: a geographical perspective to evening rush hour traffic analysis using call detail records. PLoS ONE 7(11): e49171.
Järv, O., Ahas, R., Witlox, F. (2014) Understanding monthly variability in human activity spaces: A twelve-month study using mobile phone call detail records. Trans. Res. C: Emerging Tech. 38, 122-135.
Keilthy, L. (2008). ANPR system performance. Parking Trend International, June issue. http://nebula.wsimg.com/1205ba4f6f448b01cb774681f96b7b0a?AccessKeyId=4CB8F2392A09CF228A46&disposition=0&alloworigin=1, last accessed 5 September 2016.
Kuroiwa, H., Kawahara, T., Kamijo, S., and Sakauchi, M. (2006). Vehicle matching between adjacent intersections by vehicle type classification. IEEE International Conference on Systems, Man and Cybernetics, 389–394.
Leape, J. (2006). The London congestion charge. The Journal of Economic Perspectives, 20(4), 157–176.
Li, R., Chai, H., and Tang, J. (2013). Empirical study of travel time estimation and reliability. Mathematical Problems in Engineering, 2013.
Marsden, G. and Docherty, I. (2013). Insights on disruptions as opportunities for transport policy change. Trans Research A: Policy and Practice, 51, 46-55.
Patel, C., Shah, D. and Patel, A. (2013). Automatic number plate recognition system (ANPR): A survey. International Journal of Computer Applications, 69(9), 21-33.
Paulo, D., Collins, G., Cooper, C., Patel, R., and Wallace, S. (2010). M25 speed harmonisation. Institute of Engineering and Technology. Road Transport Information and Control - Better transport through technology conference.
Peeta, S., Ramos, J. L. and Pasupathy, R. (2000). Content of variable message signs and on-line driver behavior. Transportation Research Record, 1725(1), 102–108.
Peeta, S. and Gedela, S. (2001). Real-time variable message sign-based route guidance consistent with driver behavior. Transportation Research Record, 1752, 117–125.
Pokharel, S. S., Bishop, G.A, and Stedman, D. H. (2002). An on-road motor vehicle emissions inventory for Denver: an efficient alternative to modeling. Atmospheric Environment, 36(33), 5177–5184.
Schifter, I., Díaz, L., Múgica, V., and López-Salinas, E. (2005). Fuel-based motor vehicle emission inventory for the metropolitan area of Mexico city. Atmospheric Environment, 39(5), 931–940.
Schlich, R., Schönfelder, S., Hanson, S., Axhausen, K. (2004). Structures of leisure travel: temporal and spatial variability. Transport Reviews, 24, 219–237.
Schönfelder, S. and Axhausen, K.W. (2010). Urban rhythms and travel behaviour: spatial and temporal phenomena of daily travel. Routledge, Abingdon, UK.
Shen, Y., Kwan, M.-P., and Chai, Y. (2013). Investigating commuting flexibility with GPS data and 3D geovisualization: a case study of Beijing, China. Journal of Transport Geography, 32, 1-11.
Spyridakis, J., Barfield, W., Conquest, L., Haselkorn, M. and Isakson C. (1991). Surveying commuter behaviour: Designing motorist information systems. Transportation Research A, 25(1), 17-30.
Stanczyk, D. and Klein, E. (2012). Heavy traffic data collection and detection of overloaded HGV. Procedia - Social and Behavioral Sciences, 48, 133-143.
Transport for London (2012). Roads Task Force – technical note 16. Understanding why people change behaviour. Transport for London. Available at http://www.tfl.gov.uk/cdn/static/cms/documents/technical-note-16-understanding-why-people-change-behaviour.pdf, last accessed 5 September 2016.

EJTIR 17(1), 2017, pp.86-102 102 McLeod, Cherrett, Box, Waterson and Pritchard Using automatic number plate recognition data to investigate the regularity of vehicle arrivals Tsapakis, I., Cheng, T., and Bolbol, A. (2013). Impact of weather conditions on macroscopic urban travel times. Journal of Transport Geography, 28, 204-211.
Velaga, N. R. and Pangbourne, K. (2014). Achieving genuinely dynamic road user charging: issues with a GNSS-based approach. Journal of Transport Geography, 34, 243-253.