its version 2 - harriman house · 2016-04-21 · harriman house ltd 3a penns road petersfield...
TRANSCRIPT
• • • • Sample • • • •

• • • • Sample • • • •
www.harriman-house.com/intelligenttradingsystems

Intelligent Trading Systems Applying Artificial Intelligence to Financial Markets
Ondrej Martinsky

HARRIMAN HOUSE LTD
3A Penns Road Petersfield Hampshire GU32 2EW
GREAT BRITAIN
Tel: +44 (0)1730 233870 Fax: +44 (0)1730 233880
Email: [email protected] Website: www.harriman-house.com
First published in Great Britain in 2010
Copyright © Harriman House Ltd
The right of Ondrej Martinsky to be identified as the author has been asserted in accordance with the Copyright, Design and Patents Act 1988.
ISBN: 978-1-906659-53-0
British Library Cataloguing in Publication Data
A CIP catalogue record for this book can be obtained from the British Library.
All rights reserved; no part of this publication may be reproduced, stored in a retrieval system, or transmitted in any form or by any means, electronic, mechanical, photocopying, recording, or
otherwise without the prior written permission of the Publisher. This book may not be lent, resold, hired out or otherwise disposed of by way of trade in any form of binding or cover other than that in
which it is published without the prior written consent of the Publisher.
Printed and bound in the UK by MPG Books Group
No part of this book may be reproduced or transmitted in any form, by any means, electronic or mechanical, including photocopying, recording, or by any information storage and retrieval system, without prior written permission from the author.
Limit of Liability/Disclaimer of Warranty: While the author has used his best efforts in preparing this book, he makes no representations or warranties with respect to the accuracy or completeness of the contents of this book and specifically disclaims any implied warranties of merchantability or fitness for a particular purpose. The advice and strategies contained herein may not be suitable for your situation. You should consult a professional when appropriate. The author shall not be liable for any loss of profit or any other commercial damages, including but not limited to special, incidental, consequential, or other damages
Preface This book deals with the problem of market price prediction in the context of crowd behavior. It highlights the contrast between the phenomenon of mass psychology and the efficient market hypothesis, which is essentially based on common economic theory. Its basic assumption is that if there is a model of interaction between masses and agents participating in markets, then there also must exist means for prediction of the whole market behavior, even if the behavior of each single agent is not predictable.
From a practical point of view, it describes methods of technical analysis used for the prediction of price movements and discusses a soft computing approach used in the composition of automated trading systems. This book brings alternative, soft computing computational models to trading strategies and innovatively combines two different areas of science – artificial intelligence and technical analysis. One of the main benefits of this book is a demonstration that the soft computing approach in combination with the ‘soft’ social sciences produces more reliable results than the conventional mathematical models.
This book is addressed to all who are concerned with the topics of trading, financial markets and security exchanges as well as all who have either theoretical or practical knowledge from the fields of artificial intelligence and soft computing, and are wondering how these topics can be applied in financial markets.
iii

Contents Introduction ...........................................................................................1
1 Reality, the intersection of multiple theories..................7 1.1 Efficient market hypothesis...................................................................8 1.2 The theory of chaos.............................................................................10 1.3 Behavioral market theory....................................................................14
2 The dynamics of crowd behavior ........................................19 2.1 Methodologies for the study of markets .............................................19 2.2 The system theory point of view ........................................................21 2.2.1 The exchange of energy and information ......................................22 2.2.2 The crowd’s life cycle....................................................................24 2.2.3 Unexpected events and shocks.......................................................27 2.2.4 Generalized turnover patterns ........................................................29 2.2.5 Generalized pro-trend patterns.......................................................32 2.3 The wave principle ..............................................................................35 2.3.1 The hierarchical organization of Elliott waves ..............................37 2.3.2 The direction of waves...................................................................38 2.3.3 The mode of waves ........................................................................39 2.3.4 The hierarchy of complete cycles ..................................................42 2.3.5 Variations of motive waves ...........................................................44 2.3.6 Variations of corrective waves.......................................................48 2.3.7 The principle of alternation............................................................52 2.4 Fibonacci mathematics in financial markets .......................................52 2.4.1 The golden ratio .............................................................................53 2.4.2 The golden rectangle and golden spiral .........................................54 2.4.3 The application of Fibonacci numbers in financial markets ..........55
3 Security exchanges at a glance..............................................61
3.1 Financial markets ................................................................................61 3.2 Security exchanges..............................................................................63 3.2.1 Entities participating in markets ....................................................63
v

3.2.2 Order-driven and quote-driven markets .........................................68 3.2.3 World’s largest and most long-standing security exchanges .........70 3.2.4 Types of orders...............................................................................72 3.2.5 Pit trading versus electronic trading...............................................76 3.3 Exchange clearing systems..................................................................78
4 Basic tenets of automated trading .......................................85
4.1 Indicators and oscillators.....................................................................86 4.1.1 Moving averages ............................................................................86 4.1.2 Average directional index ..............................................................90 4.1.3 Average true range .........................................................................92 4.1.4 Relative strength index...................................................................93 4.1.5 Bollinger bands ..............................................................................95 4.2 Money management ............................................................................96 4.3 Statistics ............................................................................................100 4.4 The sensitivity to changes of parameters ..........................................104
5 Simulation and backtesting of trading strategies ...107
5.1 The value of simulation in trading ....................................................107 5.2 Human factor in the trading chain.....................................................108 5.3 Modeling of intra-bar price movements............................................109 5.4 Modeling of order execution .............................................................111 5.5 Modeling of time and price skews ....................................................113 5.6 Discrete Event System Specification ................................................115 5.6.1 DEVS formalism..........................................................................116 5.6.2 Simulators and coordinators for DEVS........................................117 5.7 Simulation of the trading environment..............................................122 5.7.1 The data provider component......................................................125 5.7.2 The delay component ...................................................................126 5.7.3 The order execution component...................................................127 5.7.4 The ATS component .....................................................................129 5.7.5 The parallel run of multiple trades ...............................................133 5.8 Embedding trading strategies into the simulation .............................135 5.8.1 Simulation case study........................................................................136
vi

6 Optimization of trading strategies....................................141 6.1 Parametric trading strategies .............................................................141 6.1.1 Choosing an appropriate fitness function ....................................143 6.1.2 Parametric surface........................................................................146 6.2 Exhaustive search..............................................................................149 6.3 Genetic algorithms ............................................................................150 6.3.1 Inspiration from nature ................................................................151 6.3.2 Computational model of genetic evolution..................................151 6.3.3 Optimization case study ...............................................................157
7 Fuzzy approach to trading strategies..............................161
7.1 Concept of uncertainty and the basics of fuzzy logic theory ............162 7.1.1 Linguistic variables and fuzzy sets ..............................................163 7.2 Fuzzy logic and fuzzy inference .......................................................166 7.2.1 Fuzzification ................................................................................168 7.2.2 Inference engine and evaluation of rules .....................................169 7.2.3 Defuzzification.............................................................................176 7.3 Fuzzy-based trading strategies ..........................................................177 7.3.1 Triple Screen Trading System .....................................................177 7.3.2 Fuzzy approach to the Triple Screen Trading System .................180 7.4 Analysis of sensitivity and robustness ..............................................187 7.4.1 Sensitivity analysis of the whole market system .........................187 7.4.2 Sensitivity analysis of the signaling system.................................188 7.5 Case study .........................................................................................190 Summary .....................................................................................................193 Bibliography and further reading ................................................................195 Notations, functions and mathematical symbols .........................................199
vii
List of Figures 1.1.a The attractor of the S&P 500’s daily price changes.................................12 1.1.b,c Weekly and monthly price changes of the S&P 500................................12 1.1.d Monthly price changes of the DJIA index between 1928 and 2008 ........12 1.2.a,b Outcome and probability valuations of rationally reasoning agents ........16 1.2.c,d Outcome and probability valuations deformed by human psychology....16 2.1 A hypothetical well-modeled multi-agent market environment ..............20 2.2 The relationship between the price changes and future expectations ......25 2.3.a,b Information shocks caused by an unexpected change of the trend ..........28 2.4.a,b Top-down and bottom-up turnover patterns.............................................30 2.5 Example of the bottom-up turnover in a daily chart of the DJIA ............32 2.6 Pro-trend information shock patterns .......................................................33 2.7 Example of the pro-trend shock in a daily chart of the S&P 500.............34 2.8 The five-wave evolutionary pattern of the market trend..........................35 2.9 The supercycle wave in the DJIA between 1933 and 1977 .....................38 2.10 Actionary and reactionary subwaves of the bullish base wave ................39 2.11.a,b Bullish and bearish motive patterns .........................................................41 2.12.a,b Corrective patterns in bullish and bearish trends .....................................42 2.13 The recursive hierarchy of complete cycles .............................................44 2.14 The impulse motive wave ........................................................................45 2.15.a-c Extensions in the first, third and fifth segment of the impulse wave .......45 2.16.a,b Truncations of the motive pattern in bullish and bearish markets ...........46 2.17.a,b Ending diagonals in bullish and bearish markets .....................................47 2.18.a,b Leading diagonals in a first wave of the zigzag correction......................47 2.19.a,b Zigzag corrections in bullish and bearish markets ...................................48 2.20.a,b Regular flats in bullish and bearish markets ............................................50 2.20.c,d Bullish and bearish extended flats............................................................50 2.20.e,f Bullish and bearish running flats..............................................................50 2.21.a,b Double-three and triple-three complex corrections..................................52 2.22.a,b The golden rectangle and golden spiral....................................................55 2.23 The relationship between the golden spiral and market movements .......56 2.24 The golden spiral and the hierarchy of complete cycles ..........................57 2.25 Retracements in the DJI index during the 2008 crisis..............................58
2.26 The ϕ and ϕ2 retracements in the five-wave patterns ...........................59
ix

2.27 Example of the ϕ and ϕ2 retracements in the S&P 500 ........................59
3.1 Communication between a buyer, seller and intermediaries....................68 3.2 Intraday chart with extended hours of the NYSE:GE trading..................78 3.3 The incomplete interval data graph used by clearing algorithms.............81 3.4 Example of an opening gap caused by offline clearing algorithms..........82 4.1 Example of the MACD indicator on the Russell 2000 index...................89 4.2 Example of the Moving Ribbon indicator on the Russell 2000 index .....90 4.3 Average Directional Index and directional movements ...........................91 4.4 ADX oscillator applied to a daily chart of the Russell 2000 index ..........92 4.5 The comparison of the ATR and ADX oscillators ...................................93 4.6 Bollinger Bands and RSI oscillator applied to the Russell 2000 index....95 4.7 Risk-reward ratio and placement of profit targets and stop-losses...........99 4.8.a,b Equity curves of different strategies applied on the er2u7 futures.........102 4.9.a-f The sensitivity to changes of parameters ...............................................106 5.1 Data chains of the automatic and semi-automatic trading systems........109 5.2 Interpolation of prices within the bar .....................................................111 5.3 Significant intra-bar time intervals.........................................................112 5.4 Hierarchy of DEVS components and DEVS coordinators.....................117 5.5 Arrangement of the trading model components .....................................123 5.6 The Data Provider component...............................................................126 5.7 The Delay component ............................................................................127 5.8 The Order Execution component ...........................................................128 5.9 The ATS component ...............................................................................131 5.10 States of the order tracker.......................................................................132 5.11 Environment for parallel run of multiple trades with the router ............134 5.12 Another approach of the trading environment without the router ..........135 6.1.a-d The same strategy optimized using several different fitness functions..146 6.2 Pivot chart of parameters of the signaling system..................................148 6.3 Pivot chart of money management stops................................................149 6.4 Flow chart of the process of genetic evolution.......................................153 6.5 Replacement of the part of parent population by offspring....................155 6.6 Illustration of the double crossover of two parent chromosomes ..........156 6.7 Genetic optimization of trading strategy ................................................157 6.8 Performance of the simulated trading strategy.......................................158 7.1 Membership functions of the market assessment...................................165 7.2.a Membership functions of the short-term market balance.......................168
x
7.2.b Membership functions of the strength of market trend ..........................168 7.3 Logical product of two fuzzy propositions on different universes.........172 7.4 Unification of individual consequents into a compound response.........176 7.5 Membership functions of the first screen of Triple Screen System .......181 7.6 The stop-loss linguistic variable of the Triple Screen System ...............184 7.7 Fuzzy controller of the Triple Screen Trading System ..........................185 7.8 Fuzzy surfaces for the output variables assessment and stop-loss .........186 7.9 Sensitivity surface of the fuzzy-based Triple Screen System ................189 7.10.a,b Equity curves of the conventional and fuzzy-based trading systems.....191
xi

1
Introduction Over the years, we have had an opportunity to see the difference in evolution of trends in information technologies. Today, information technologies are not an independent scientific discipline, but they have penetrated into all aspects of modern life and become an interdisciplinary matter. Because of this, we also see some differences between reality itself and information technologies, which are primarily aimed at reflecting this reality in a proper and utilizable way. Information technologies, as a part of exact science, contrast strongly with the real environment, which is inexact, uncertain and indeterminable. Theoretical or abstract applications of reality encounter difficulties when applied to a real, organic environment. Because of this, soft computing methods have increased in importance over the years.
Optimization of artificial intelligence-based applications for real usage is nowadays one of the biggest technical challenges facing science. Such optimization is a key step in successfully representing the uncertainty of reality. Laboratory conditions in which applications are developed often do not correspond to the environment in which they will be finally employed. Unlike with traditional hard computing systems, and besides the need to find an appropriate application structure, there is also a need to find the appropriate parameters of a system and, of course, appropriate evaluation metrics. How well an intelligent system should meet customers’ requirements is also uncertain. The functionality of classical hard computing applications is evaluated only in the context of strictly defined demands and constraints, but even theoretically well-made intelligent systems often do not match real customers’ needs and expectations.
Generally, life in the real world is a fight: and part of this is a fight for money in a free market. In the global financial marketplace, agents both trade with each other and challenge a system; a system of which they are a part. The purpose of this work is to describe the behavior of the masses involved in this system, using soft computing methods, and to build a profitable intelligent system that will make practical use of the theoretical knowledge of market behavior.
Neoclassical economic theory and the efficient market hypothesis assume that the behavior of the whole market is given as a sum of rationally reasoning agents and also that the price in a free market exactly reflects its fundamental situation. In fact, the reasoning of agents acting on financial markets is not rational,

2 Intelligent Trading Systems
but agents influence each other in ways readily described by mass psychology. As the behavior of the masses has its own psychological attributes, this is predictable – even by artificial intelligence.
In fact, one might say artificial intelligence is especially able to do this: for, considered, carefully, a system based on artificial intelligence is able to analyze market behavior more precisely, and to generate more reliable trading recommendations, than a flesh-and-blood trader. Granted, if the trader evaluates market behavior detachedly he is probably able to take better decisions and achieve superior trading results. The point is that traders are rarely psychologically detached from decisions which they take, because they are often handling their own money, and take decisions that markedly affect their wealth. In other words, mental blocks too often prevent traders from making rational decisions; trading is an intellectually simple, but psychologically difficult, activity. A system based on artificial intelligence would therefore be the right choice for this kind of activity, because it avoids the psychological weaknesses of human nature.
From the point of view of system theory, a crowd is a self-organizing hierarchical system, which is describable and predictable by the computation techniques of artificial intelligence and soft computing. Since an intelligent system stands outside of the mass, it can be a successful tool for the prediction of market behavior within it and for detection of advisable trading opportunities. In this field of research, this work deals with the development, implementation and simulation of appropriate trading strategies as well as with money and risk management methods for securing speculative operations with financial derivatives.
Organization of the book
This book is organized into two parts. The first one contains four chapters and defines the subject from an economic point of view. The second part, with three chapters, discusses possible solutions from the technical and mathematical points of view. In other words, the main purpose of this book is to apply mathematical and artificial intelligence methods to the economic problem.
This work is intended for all who are concerned with the topics of trading, financial markets and security exchanges as well as for all who have either theoretical or practical knowledge from the fields of artificial intelligence and soft computing, and are wondering how these topics can be applied in financial markets.

Introduction 3
The first chapter introduces readers to various economic theories and hypotheses, such as the efficient market hypothesis, chaos theory and behavioral market theory. The main intention of the first chapter is to comparatively illustrate contradictions in these theories and to show that economics as a whole is not an exact science. The conclusion of the first chapter is based on an assumption that although these theories contradict each other, the truth is somewhere at the intersection of them and the exact tenets depend on the purpose and field of study.
The second chapter describes the dynamics of crowd behavior. The basic premise is that the whole of society (or, respectively, any crowd) is a system of interconnected agents. However, entities and relationships between them are enormously complicated. There are two points of view; individual humans can be studied by cognitive psychology, and society as a whole by system theory. The second chapter classifies society in a financial market as a dynamic non-linear self-organizing system and models it by limit cycles, energetic barriers and information shocks. Additionally, system theory is used to substantiate several aspects of the well-known Elliott wave principle. Since the Fibonacci sequence and golden ratio occurs everywhere in nature, the second chapter also studies how this sequence affects various dynamic systems, especially financial markets.
The third chapter is a practical introduction to financial markets and security exchanges. It defines terms such as economic system and financial market, and explains the operating principles of the security exchanges. It also outlines the roles of various entities participating in markets and highlights several differences between brokers, dealers and market makers. The third chapter classifies security exchanges into two types according to their operating modes. It describes differences between the order-driven and quote-driven markets and explains how orders are handled in a continuous trading mode and in a call auction mode. In addition, this chapter discusses the mathematical background of the online and offline clearing mechanisms and briefly describes how the clearing mechanisms affect the welfare and fairness of the trading environment.
The fourth chapter introduces readers to the basic tenets of automated trading systems and to fundamentals of money management and statistical evaluation of trading results. The visual analysis and interpretation of Elliott waves introduced in the second chapter is a very subjective process. Ambiguities which occur in charts may cause traders to firstly perform a deep technical analysis and then make a final decision and final interpretation only on a psychological basis. This problem doesn’t exist in mechanical trading systems, which generate exact (psychologically unbiased) advice for traders. The advantage of mechanical trading

4 Intelligent Trading Systems
systems is that they provide crisp signals and eliminate the psychological aspects of trading. The fourth chapter also introduces readers to several trading strategies based on various types of indicators and shows how statistical analysis can be used to evaluate the income, stability and robustness of these strategies. Although the fourth chapter explains how trading strategies generate recommendations on markets and how to statistically evaluate the outcome of such strategies, it doesn’t make readers familiar with the principles of such evaluations.
Because of this, the fifth chapter discusses several aspects of the simulation of trading environments and proposes several models of time and price skews that occur on markets. It introduces readers to the basics of the Discrete Event System Specification (DEVS) and constructs an appropriate trading simulator.
The fifth chapter also provides some technical knowledge and resources needed for the simulation of trading strategies proposed in the fourth chapter and contains a very simple simulation case study. Seeing that the trading simulator doesn’t fully fit the specification of DEVS, this chapter presents all customizations and explains why they are important for more accurate simulation results.
Since simulation tools allow traders to repeatedly and comparatively run various strategies on the same data, they are also appropriate for a wide spectrum of optimization tasks. The optimization of trading strategies is a process of making them more profitable, robust and stable considering given market conditions. Because of this, the sixth chapter introduces readers to parametric trading strategies and shows how genetic algorithms can be used for the optimization of them. The sixth chapter also contains a case study of genetic optimization and explains the biggest problem of all optimization methods, which is the curve fitting of in-sample market data.
Automated trading systems are based mainly on the computational evaluation of crisp inputs. Even though this evaluation is an objective process that eliminates the psychological aspects of trading, it is not very robust since it doesn’t reflect the vagueness of the real trading environment. This is caused by the fact that conventional automated trading strategies are primarily based on an exact and symbolic representation of reality.
Several decades ago, scientists and researchers believed that every problem, no matter how complex, could be solved by a computational system with adequate power. The uncertainty found everywhere in nature forced scientists to reevaluate their approaches and attitudes to solving large, complex problems. The concept of uncertainty originates from the shift of paradigm in artificial intelligence. If we are not able to avoid uncertainty, we must use computational methods which implicitly

Introduction 5
allow an uncertainty in the input data (for example, as the soft computing approach does).
Because of this, the seventh chapter shows how soft computing, especially fuzzy logic, can be used for a more reliable prediction and modeling of market behavior. This chapter explains general principles of fuzzy logic and fuzzy reasoning and shows how we can use fuzzy controllers to eliminate the sensitivity of signaling systems in trading strategies.
The seventh chapter also introduces readers to the Triple Screen Trading System and proposes how this system can be improved by a fuzzy inference mechanism. Additionally, the seventh chapter analyzes sensitivities of both conventional and fuzzy-based triple screen trading systems and compares their characteristic properties, such as their robustness or stability, and the overall outcome of each.

7
Chapter 1
Reality, the intersection of multiple theories Common economic theory is not an exact science, since it describes relations between real individuals who aren’t exact. Because of this, various theories and hypotheses have been introduced for the description of market behavior. Some of them posit that the agents acting on financial markets are rational and reasoning; others look to mass psychology, and its understanding of the irrational behavior of crowds, to reach an alternative view.
Economic theories and theories of market behavior are regarded as only approximate models of real markets. Because of this, they are still in a development process. The occurrence of events in financial markets that do not have a precedent in history forces us again and again to re-evaluate our former approximations, models and theories of economic behavior. Because of this, various contrary theories have evolved over the decades, but none of them represent reality with adequate confidence. The best representation of reality is somewhere at the intersection of multiple economic theories, but it is hard to say how well one theory or another describes it.
In addition, economic theories and models affect reality itself, because they affect the behavior of the masses that make decisions based on these models. This is an answer to the question of why new events without precedent still occur in the markets. The example of a theory which is applicable looking back into the past, but which doesn’t work in current times, is the Dow Theory. This is the case because investors modified their behavior after the theory was published.
This chapter introduces several theories of market behavior to illustrate the inexactness of economic science. This is the key observation that helps us to understand how technical analysis describes the behavior of crowds in financial markets and how to utilize these descriptions in the construction of profitable intelligent systems.

8 Intelligent Trading Systems
1.1 Efficient market hypothesis The efficient market hypothesis is derived from the well-known theory of rational choice, which is based on formal models of social and economic behavior. The theory of rational choice together with neoclassical synthesis is a major theoretical paradigm in modern economic science. This theory is based on an assumption that every single agent in the market has his own preference function indicating the utilization of combinations of goods, and he performs rational and effective actions to maximize this utilization. The theory of rational choice provides us models which don’t fully describe reality, but these models help us to take decisions which can be considered as rational in the context of maximizing a good utilization.
The efficient market hypothesis assumes that financial markets are informationally efficient. This means that all known information is actually involved in the current market price, thus it is impossible to continually outperform average market revenues by trading with public information. According to some thoughts, any relevant information that can affect the market is flashed to it within thirty seconds.1
There is one common misleading fact about the efficient market hypothesis. Compared to the theory of rational choice, the efficient market hypothesis doesn’t require agents acting on the market to be, so to speak, rational in their reasoning. When new information is published, some traders may underrate it, and others can overrate it. However, individual reactions of traders are counted together, and the net market price change is then given as a sum of the behavior of a large number of irrationally reasoning agents. Since particular mistakes of overrating and underrating traders are mutually eliminated, the behavior of the whole market is always right and corresponds to published fundamentals.
Three forms of this hypothesis have been defined according to its strength (Mullainathan, et al., 2001). The weak form declares that extraordinary returns cannot be earned by using strategies that rely on historical movements of prices. Because of this, technical analysis and methods based on a serial dependence between market prices cannot be used for a prediction of future prices. This form is referred to as weak, because it supposes that publicly available fundamental
1 The information about the disaster of Space Shuttle Columbia was flashed to market
prices within nine seconds of it being published.

Reality, the intersection of multiple theories 9
information is not immediately flashed into the current prices, thus it can be used for a prediction of the short-term market movements.
The semi-strong form of this hypothesis declares that continuous extraordinary returns cannot be gained using publicly available information, because the price is adjusted according to published information immediately. Since there is not enough time to realize market transactions between when the information is published and when the market is adapted, there is also no way to utilize this information. However, the semi-strong hypothesis allows insider traders to use non-public information for achieving profits before markets can adapt to it.
A strong form of the efficient market hypothesis assumes that all public and private information is actually involved in market prices, thus it is impossible even for insider traders to continually outperform average market returns. The strong form explains the existence of a small group of investors that excessively and continually outperform market returns as a result of the normal distribution of earnings over a huge number of individuals.2
On the basis of previous experiences, most people would agree that fundamental events affect market prices immediately. However, the market as a whole often overrates published information, and because of this, the prices are often irrational. The efficient market hypothesis doesn’t provide an explanation of market bubbles, crashes and speculative fluctuations of market prices. These fluctuations are caused by the similar behavior of a large amount of individuals at the same time. If this kind of mass behavior is rational, then there must be rational
2 Warren Buffett explained this fact in his talk given at Columbia University in 1984
using the model of the “coin-flipping contest”. We assume that every day 225 million Americans wager a dollar and if they call correctly, they win a dollar back from those who called wrong. After twenty days there will be 215 people, who called their coins flip correctly twenty times in a row. Each of these people turned one dollar into a million. The reasoning of this example supports the explanation given in the efficient market hypothesis, but Warren Buffett argued that there are some differences between the distribution of winners in this example and successful investing professionals. There is nothing surprising in the example of the coin-flipping contest, but it would be suspicious if all winners came from the same village. This is exactly what is happening on financial markets – a small group of extraordinary successful investors share several common characteristics and strategies. These strategies are based on long-term investments, deep fundamental analysis of securities and on a concept of market pricing instead of market timing.

10 Intelligent Trading Systems
well-known fundamental reasons which support it. The history of bubbles and crashes reveals that no such reasons were available. Instead of this, investors often assure each other that a certain type of investment is a “sure thing”, because it is continually rising. The Tulip mania of 16373, the South Sea Bubble of the 1720s4 or the dot-com bubble of the 2000s are events that disprove the efficient market hypothesis.
1.2 The theory of chaos Scientists define the financial market as a complex self-organizing hierarchical non-linear dynamic system. The keywords non-linear and dynamic are important in the context of the theory of chaos. A non-linear system is a system which is comprised of more than a linear dependence between input and output variables. The keyword dynamic means that the system is evolving over time. The chaos theory studies behavior of natural systems from many fields of science and examines characteristics which these systems share. One of the common characteristics of these systems is a sensitivity to input conditions. A very little change in input conditions can cause a large deviation in the system’s behavior over a period of time. This phenomenon is also known as the butterfly effect.5 Even these systems are deterministic in their structures, though they seem to be non-deterministic due to the complex behavior caused by the butterfly effect. The whole universe is considered as non-deterministic just for this reason.
One of the fields where chaos theory is applied is the research of financial markets and economics. According to this application of the theory, it is impossible to predict future market prices by applying patterns that occurred in the past to the current situation in the market. This is caused by several factors. One of these
3 Tulip mania was a period during which the prices of future contracts for tulips rose to
extremely high levels and then (un)expectedly collapsed.
4 The South Sea Bubble was a bubble in stock prices of the South Sea Company. The underlying cause of this bubble was a monopoly right to trade with Spanish America.
5 So called because even a small change in the atmosphere caused by the movement of a butterfly’s wing can lead to a tornado on the opposite side of the world.

Reality, the intersection of multiple theories 11
factors is that the current market situation is defined by thousands of various parameters, which will never be exactly replicated, including the following:
• Horizontal and vertical structure of the crowd. • Traders’ beliefs, hopes and desires. • Market prices, traded volumes and open interest. • The fundamental economic situation.
It is impossible to comprehensively describe the whole market situation because not all parameters are quantitative and because there is no way to observe most of them. Usually, we know only the market price and the volume of realized transactions. Because of the limited number of known parameters, we wouldn’t be able to predict behavior of a market system even if it was deterministic and non-chaotic.
Some systems are chaotic in all phases, but most of them are chaotic only in a certain subset of the phase space. The state of a system at a specific time is represented by a point in the n-dimensional parameter space. The set of points to which the system converges after a long period of time is referred to as the attractor.
Tony Plummer in his work (Plummer, 2003) defined a two dimensional
phase space ct / ct−1 which contains pairs of daily consecutive market price
changes as follows. The daily price change is defined as a percentage difference between the closing prices of two consecutive days. If we employ such a definition in our further considerations, we will get the price attractors as shown in Figure 1.1.
Figure 1.1.a represents the attractor of consecutive price changes of the S&P 500 stock index between the years 1950 and 2008 on a daily basis. According to this attractor, there is no significant serial dependence between daily market price changes. In other words, short-term movements of stock prices are chaotic. Furthermore, the bounds of this attractor represent maximum daily deviations between the closing prices. As you can see in the Figure 1.1.a, the S&P 500 index hasn’t exceeded a 10% daily price change in a long time, except the fallout on Black Monday, October 19 1987, when markets unexpectedly lowered more than 22%. The attractor also shows that the stock market quickly recovered from this fallout and returned to an ordinary state within several days.

12 Intelligent Trading Systems
Figure 1.1: (a) The attractor of the S&P 500’s daily price changes
between years 1950 and 2008. (b,c) Weekly and monthly price changes of the S&P 500 index. (d) Monthly price changes of the Dow
Jones Industrial Average Index between 1928 and 2008.
We have seen that short-term movements of the S&P 500 index involve chaotic behavior. Let’s examine if the chaotic behavior is also employed in the middle-term and long-term movements. We will consider pairs of the market price changes based on a longer time period. Figures 1.1.b and 1.1.c represent attractors of the week and month market price changes. As we can see, these attractors are slightly stretched along the diagonal line. This anomaly represents one important implication between the consecutive market prices. If a market is currently rising and the price change between today and last week is positive, then there is a high

Reality, the intersection of multiple theories 13
probability that tomorrow’s price change will be positive also (and vice versa for falling markets).6
The degree of chaotic behavior in market prices can be measured by a so-called Fractal Efficiency Ratio. This ratio is given as a net price change over bars divided by the sum of individual bars’ ranges (see Eq. 1.1). In other words, the volatility over periods is divided by the aggregated volatilities of individual bars. If this ratio is equal to one, the corresponding system is non-chaotic and has a great trending characteristic. If it is equal to zero, the system doesn’t have trending capabilities, thus it is purely chaotic.
FER n =ct − ct−n
ct− i − ct− i−1i=0
n
∑
(1.1)
We can form several conclusions according to the attractors based on various time frames of the same market. The shape of these attractors tells us how well the market is able to trend, and the bounds represent the strength of market price movements. The larger ratios correspond to more stretched attractors. By
comparing attractors based on daily and weekly time frames, we assume that daily price changes are chaotic and unpredictable, but weekly price changes, beside the chaotic behavior, also include trending tendencies. This fact contradicts the principles of the butterfly effect, because we are able to predict price movements on a weekly basis even if the movements on a daily basis are purely chaotic.7
If the market price movement is not purely chaotic, there must be a pattern or a model which describes it. The market researchers discovered that these patterns exist in a chart based on an arbitrary time frame. For example, patterns
6 Points in the upper right quadrant of the attractor mean that both today’s and
yesterday’s price changes are positive, thus the market is continually rising. Points in the bottom left quadrant represent a falling market. There are also several points in the upper left and bottom right quadrants. These points represent situations where the market changes its direction.
7 The weekly time frame of an attractor means that the percentage change of closing prices is calculated on a period of one week, independent of the fact that the time frame of the underlying chart is one day.

14 Intelligent Trading Systems
based on a daily time frame combine to form weekly patterns, then the weekly patterns form into monthly ones, and so on. This concept resembles the well-known principle of fractal geometry, which is also based on an assumption that several low-level geometrical patterns form a higher one.
Consider the measurement of a state border line. The length measured on a large scale map will be different to the length measured more precisely on a detailed plan. The more precise measurement involves more detailed shapes in the line. Because of this, the length of such a line depends on a measurement and grows with the increasing degree of details. In an extreme case, if we omit the atomic integrity, the length will go to infinity.
Since price movements share several properties with fractal geometry, the estimation of the next price change also depends on the scale of the measurement. Because of this, the estimate of the next price movement will be always different from reality, no matter how deep we go in the level of detail during the estimation.
1.3 Behavioral market theory Behavioral market theory is a theoretical background for a wide range of technical analysis methods. This theory is a part of behavioral economics, which applies scientific research on human behavior as affected by emotional factors.8
There are two different perspectives within this. The first deals with emotionally affected individuals. The reasoning of such individuals is studied by cognitive psychology. The second is covered by behavioral market theory, which studies the behavior of a crowd composed of such individuals.
We discussed several aspects of the efficient market hypothesis in Section 1.1. The tenets of behavioral market theory are in strong contrast to the principles of efficient markets. Although both theories tolerate an existence of irrationally reasoning agents, the efficient market hypothesis assumes that irrational reactions of traders are mutually eliminated. The important difference between these theories is that the behavioral market theory doesn’t make such an assumption.
8 S. Mullainathan and R. H. Thaler in (Mullainathan, et al., 2001) defined behavioral
economics as the combination of economics and psychology, which investigates what happens in markets when individuals display human limitations and complications.

Reality, the intersection of multiple theories 15
The efficient market hypothesis and neoclassical economics define the rationally reasoning individual (Homo economicus) as a calculating unemotional utilization maximizer. The defenders of the efficient market hypothesis argue that the behavior of the financial crowd is altered by the principles of competition and evolution; thus individuals who are unable to act rationally are swiftly eliminated from involvement. Long-term bubbles attest that this cannot be the case, so one of the biggest shortcomings of neoclassical economics must be that it completely ignores the cognitive and psychological aspects of economic agents. This is particularly caused by the fact that a rational economic framework is easier to formalize. Behavioral economics tries to formalize even the psychological aspects, which is a much more difficult task.
Professors S. Mullainathan and R. H. Thaler in their work ‘Behavioral Economics’ establish three different ways in which humans deviate from the standard model of Homo economicus. The first is a bounded rationality, which means the limited cognitive abilities of humans to solve problems. The second deviation is a bounded willpower, which is based on the fact that people often make choices that do not correspond with their long-term interest. For example, people often prematurely take their money out of mutual funds in bad times when the security prices are (temporarily) low. The bounded self-interest, as the third deviation, is based on the observation that humans are often willing to defer their own interests to help others.
Even if people have the sufficient time and resources needed for thorough reasoning, they will never be rational until they are emotionally reconciled to the decisions which they take. Due to reasons of psychological self-control, humans often refuse to choose the rational solution, even when they know what it is. For most people, short-term psychological satisfaction is more important than long-term financial gain.
One of the pillars of behavioral economics is the prospect theory proposed by Dr Kahneman and Tversky, which describes how humans make decisions between alternatives which involve risk. Compared to the expected utility hypothesis9, the prospect theory also takes account of the psychological aspects of human decisions. Let’s assume that humans quantitatively evaluate the objective 9 The expected utility hypothesis mathematically describes betting preferences of people
with regard to risky and uncertain outcomes. It is strictly rational and it does not consider the psychological aspect of human decisions. Because of this, the expected utility hypothesis is widely accepted as a model of the rational choice theory.
16 Intelligent Trading Systems
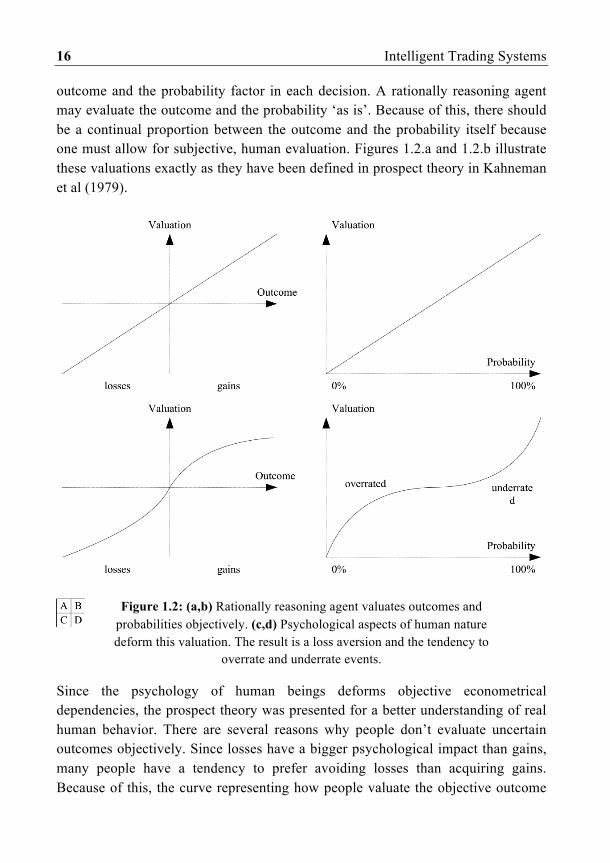
outcome and the probability factor in each decision. A rationally reasoning agent may evaluate the outcome and the probability ‘as is’. Because of this, there should be a continual proportion between the outcome and the probability itself because one must allow for subjective, human evaluation. Figures 1.2.a and 1.2.b illustrate these valuations exactly as they have been defined in prospect theory in Kahneman et al (1979).
Figure 1.2: (a,b) Rationally reasoning agent valuates outcomes and
probabilities objectively. (c,d) Psychological aspects of human nature deform this valuation. The result is a loss aversion and the tendency to
overrate and underrate events.
Since the psychology of human beings deforms objective econometrical dependencies, the prospect theory was presented for a better understanding of real human behavior. There are several reasons why people don’t evaluate uncertain outcomes objectively. Since losses have a bigger psychological impact than gains, many people have a tendency to prefer avoiding losses than acquiring gains. Because of this, the curve representing how people valuate the objective outcome

Reality, the intersection of multiple theories 17
is not symmetrical (Fig. 1.2.c). The theory of bounded rationality shows that people are more sensitive to changes of wealth rather than to absolute levels of it. This is represented by the concave shape of the outcome function. The probability and the risk are also not evaluated objectively. In general, people have a tendency to underrate events that have a high probability of occurring and to overrate events that have a small probability of occurring.
Let’s assume that we have opportunities, each with a corresponding outcome and probability. The utilization of such outcomes is given by the following equation:
U = vo oi( ) ⋅ vp pi( )
i=0
n
∑ , (1.2)
where is the objective outcome of the opportunity, and is the objective
probability of such an outcome. Since humans don’t valuate outcomes and probabilities objectively, this formula also employs two functions for subjective
psychological valuation. Function vo o( ) is the subjective valuation of the outcome
probability o , and function vp p( ) is the subjective valuation of the outcome
probability . The prospect theory is an econometrical illustration of ambiguities between
the objective valuation of uncertain outcomes and the way humans subjectively valuate them. Besides the prospect theory, there is much other evidence that proves that ordinary econometrical methods based on rational reasoning don’t work in real markets. The purpose of the psychologically adjusted models is not to provide a formalized framework for estimations of market prices, but only to help understand how real humans behave and why technical analysis methods work.
The purpose of this chapter was to introduce several economic theories and to highlight several major differences and contradictions between them. Since economics is not an exact science, the contradictions only support the fact that real market behavior cannot be fully described with a theoretical background. As the title of this chapter suggests, the reality is somewhere at the intersection of multiple theories.
Intelligent TradingSystems
Applying Artificial Intelligence to Financial MarketsOndrej Martinsky
www.harriman-house.com/intelligenttradingsystems
Paperback: 9781906659530
Follow us on Twitter: @harrimanhouse for the latest news and special offers
Available direct from Harriman House and all good booksellers. To ordera copy of the print or ebook edition go to: