it’s what we know. - snl · 01 it’s what we know ... through careful site selection. a prime...
TRANSCRIPT

C B L & A S S O C I AT e S P r O P e r T I e S , I N C . 2 0 0 6 A N N u A L r e P O r T
It’s what we know.

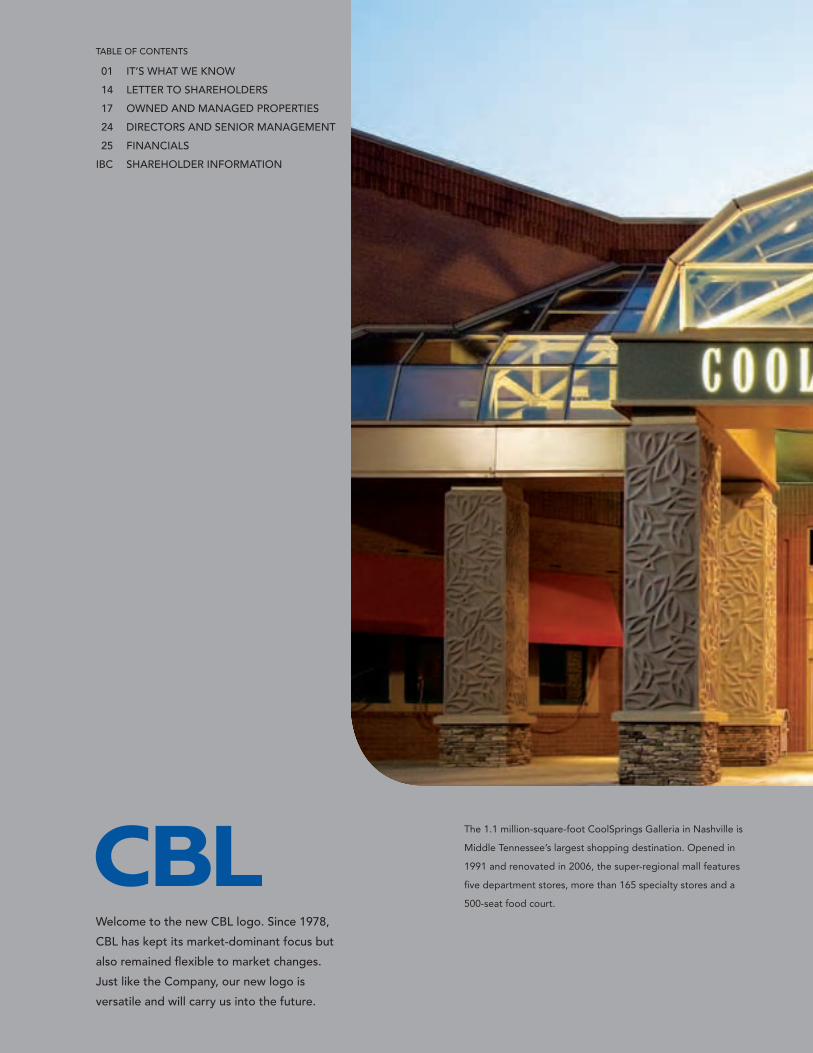
TABLE OF CONTENTS
01 IT’S WHAT WE KNOW
14 LETTER TO SHAREHOLDERS
17 OWNED AND MANAGED PROPERTIES
24 DIRECTORS AND SENIOR MANAGEMENT
25 FINANCIALS
IBC SHAREHOLDER INFORMATION
Welcome to the new CBL logo. Since 1978,
CBL has kept its market-dominant focus but
also remained flexible to market changes.
Just like the Company, our new logo is
versatile and will carry us into the future.
The 1.1 million-square-foot CoolSprings Galleria in Nashville is
Middle Tennessee’s largest shopping destination. Opened in
1991 and renovated in 2006, the super-regional mall features
five department stores, more than 165 specialty stores and a
500-seat food court.

Find out what we know…
From approving the initial site plan to leasing the last shop, CBL knows what it takes
to be successful. Quality shopping destinations and the latest in fashions are a few of
the things that keep us on your mind, but we know it takes much more to maintain a
94 percent occupancy rate, have the preeminent property in a market and continuously
enhance shareholder returns. �
FACT: More than 90 percent of CBL malls dominate their markets.
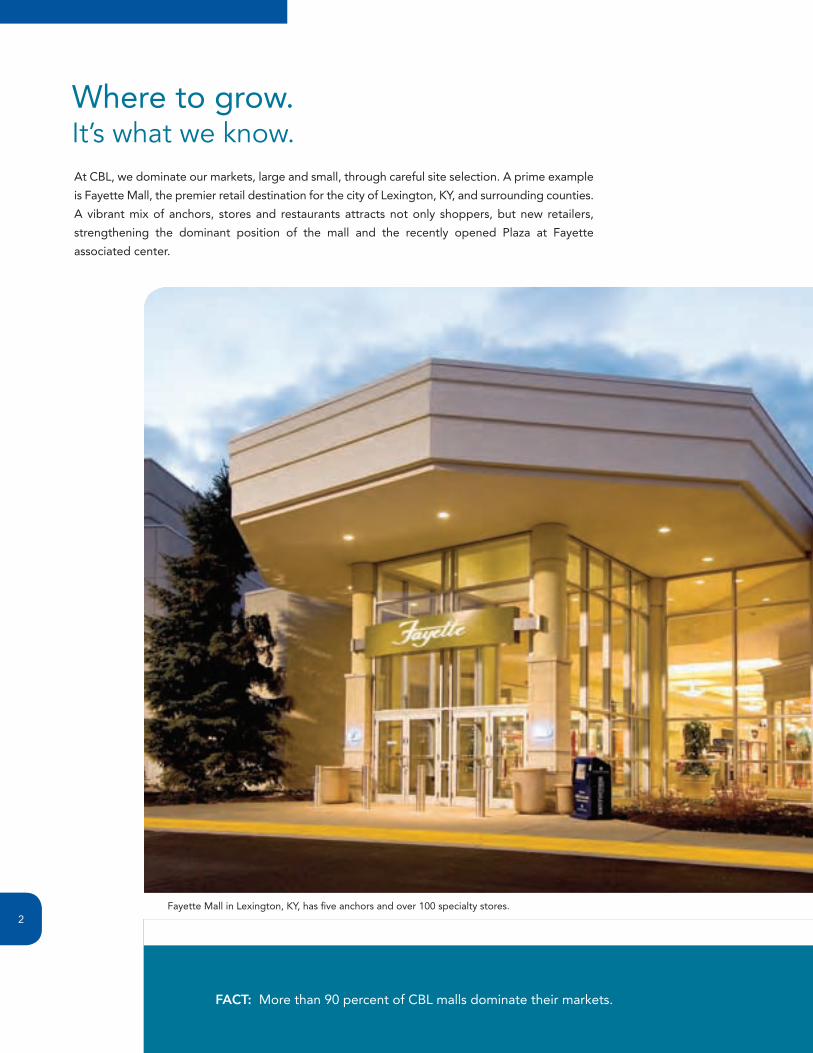
Where to grow. It’s what we know.At CBL, we dominate our markets, large and small, through careful site selection. A prime example
is Fayette Mall, the premier retail destination for the city of Lexington, KY, and surrounding counties.
A vibrant mix of anchors, stores and restaurants attracts not only shoppers, but new retailers,
strengthening the dominant position of the mall and the recently opened Plaza at Fayette
associated center.
Fayette Mall in Lexington, KY, has five anchors and over �00 specialty stores.�
Drop by to get “in”. It’s what we know.Fashion trends move at the speed of the Internet, and students from Athens, GA to College Station,
TX, want the hottest stores carrying the latest clothes and accessories. Offering unmatched access
as the premier retail location in a given market, CBL’s properties provide retailers with a perfect
venue to introduce new lines or concept stores. Check out Shi by Journeys at CoolSprings Galleria
in Nashville, TN, or H&M at West Towne Mall in Madison, WI.
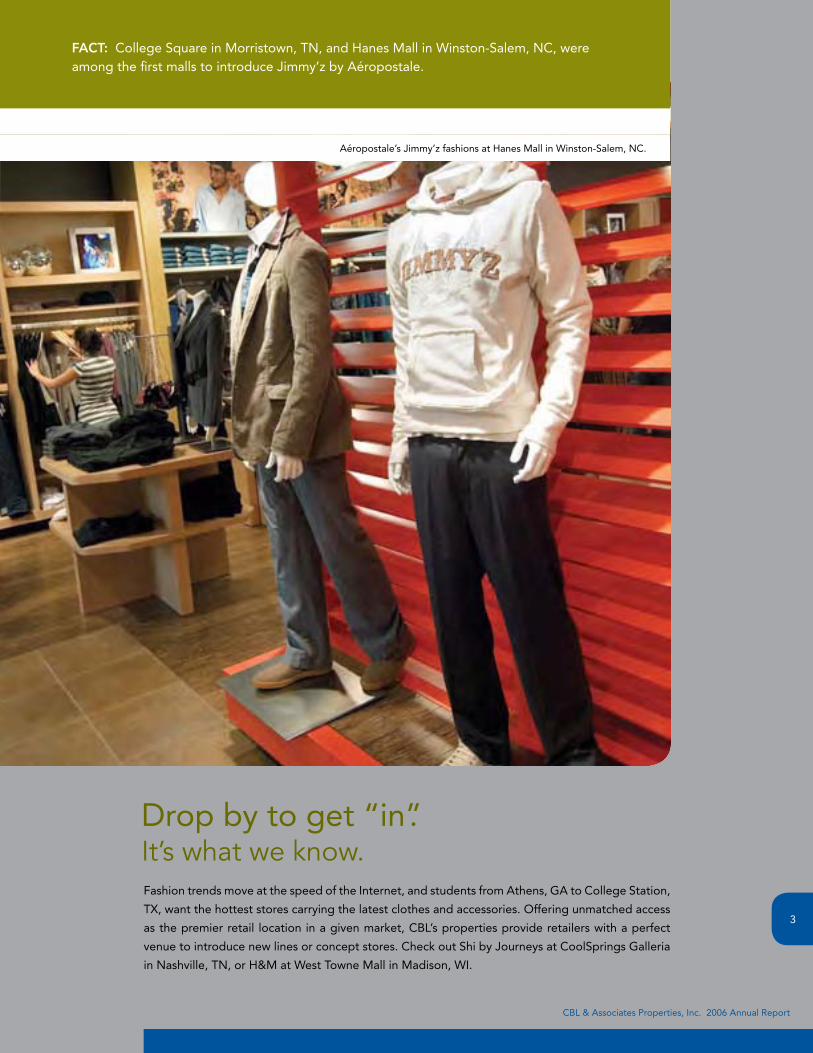
FACT: College Square in Morristown, TN, and Hanes Mall in Winston-Salem, NC, were among the first malls to introduce Jimmy’z by Aéropostale.
Aéropostale’s Jimmy’z fashions at Hanes Mall in Winston-Salem, NC.
CBL & Associates Properties, Inc. 2006 Annual Report
�

Catching your eye. It’s what we know.CBL malls grant shoppers access to the nation’s top retailers and specialty stores. Our leasing
teams keep the lineup current by identifying trend-setting merchants and making them a part of
our centers. At Park Plaza in Little Rock, AR, more than 80 shops and restaurants vie for your attention,
with Banana Republic, Hollister and XXI Forever among the new arrivals.
FACT: In �006, more than 7� percent of CBL’s total revenue was derived from tenants that individually contributed less than � percent of revenues.
CBL offers approximately 75 million square feet of department stores, specialty shops and restaurants.�

An excuse to linger. It’s what we know.The opportunity to sit down, enjoy a meal or share a cocktail with friends is a key ingredient to
attracting shoppers to our properties and extending their stay. We opened seven restaurants at
Fayette Mall alone in �006, including P.F. Chang’s China Bistro and Abuelo’s Mexican Food
Embassy. We’re partnering with Fleming’s, Claim Jumper and an array of eateries ranging from
casual to upscale as we boost the number of restaurants at our malls and open-air centers.
FACT: In �006, CBL added �5 new restaurants to centers across its portfolio.
Restaurants draw customers to our malls and energize them for extended shopping.
CBL & Associates Properties, Inc. �006 Annual ReportCBL & Associates Properties, Inc. �006 Annual Report
5
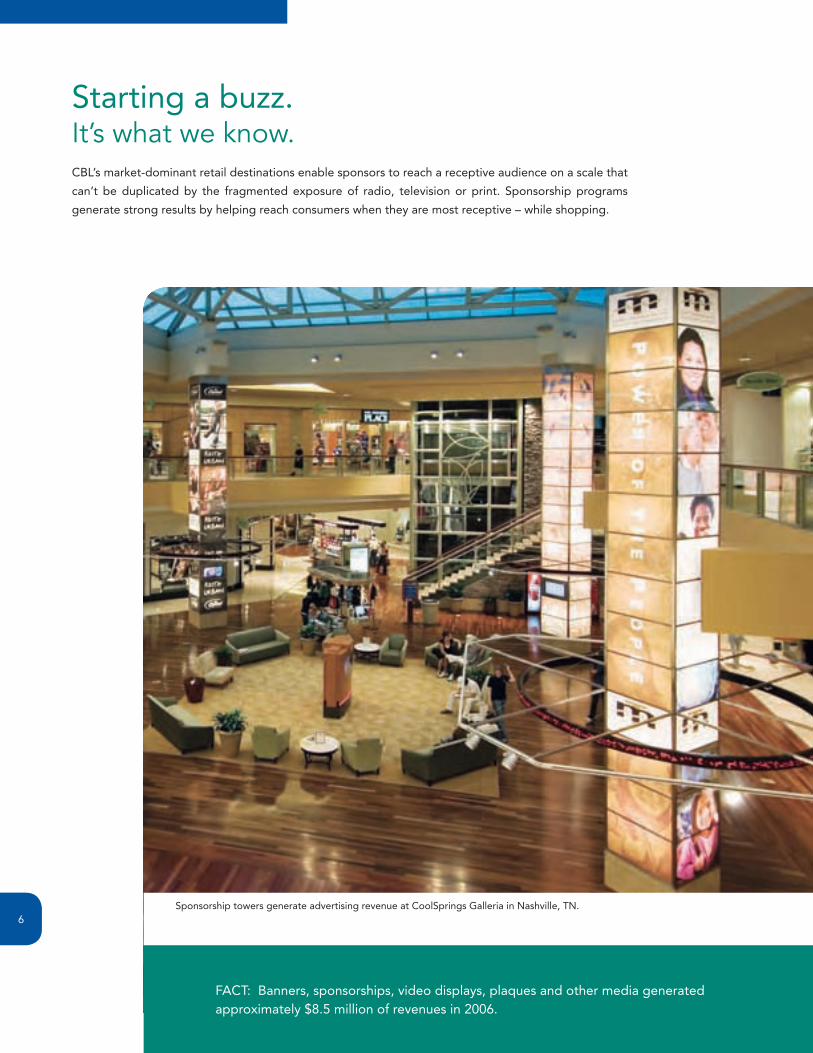
FACT: Banners, sponsorships, video displays, plaques and other media generated approximately $8.5 million of revenues in �006.
Starting a buzz. It’s what we know.CBL’s market-dominant retail destinations enable sponsors to reach a receptive audience on a scale that
can’t be duplicated by the fragmented exposure of radio, television or print. Sponsorship programs
generate strong results by helping reach consumers when they are most receptive – while shopping.
Sponsorship towers generate advertising revenue at CoolSprings Galleria in Nashville, TN.6

Thinking outside the box. It’s what we know.Tomorrow’s inline retailers are among today’s entrepreneurs. Butter Up, a supplier of natural
skin and hair products, is one of three business plans CBL and local partners selected for start-up
support during the �006 Piedmont Retail Business Challenge. CBL identifies retail trends and then
works with local entrepreneurs like Butter Up owner Dana Suggs to introduce those concepts at
our properties.
FACT: Specialty income generated nearly $80 million of revenues in �006.
Dana Suggs won CBL’s Piedmont Retail Business Challenge in �006.
CBL & Associates Properties, Inc. �006 Annual Report
7

Designs of distinction.It’s what we know.The new lifestyle wing at Cary Towne Center in Cary, NC, houses new stores while adding the
convenience-driven shopper to the mall’s existing clientele. Other initiatives to add value to our
properties include the conversion of underutilized parking fields into needed restaurants, and the
inclusion of new advertising venues with each renovation.
Drive-up convenience at the expanded Cary Towne Center in Cary, NC.
FACT: In �007, CBL is adding four lifestyle expansions to existing centers and has even more planned for the years ahead.
8

Staying on top of the game. It’s what we know.
FACT: CBL is boosting its development pipeline to more than �.� million square feet opening in �007, adding more than $��5 million to the value of its portfolio.
Consumers demand convenience and atmosphere, and CBL is delivering with lifestyle and
town centers like the �.� million-square-foot Pearland Town Center in Houston, TX. Opening
in �008, this expansive mixed-use project will blend restaurants and retail with residential,
hotel and office space in an open-air environment where shoppers can live, work and play.
Our town centers feature drive-up access, extensive landscaping and a Main Street feel.
Dillard’s and Macy’s will anchor Pearland Town Center in Houston.
CBL & Associates Properties, Inc. �006 Annual Report
9

FACT: Opening in August �007, Alamance Crossing will create �,500 jobs and generate sales tax revenue from more than $�00 million in estimated annual sales.
Being the center of attention. It’s what we know.CBL shopping centers are often the principal gathering place for the community. In Burlington,
NC, the opening later this year of Alamance Crossing will provide a rejuvenating influx of jobs and
a setting for local events. CBL worked with city officials to meet the community’s needs, switching
from a traditional big-box project to a Main Street layout with high-end retailers.
The 6��,000-square-foot first phase of Alamance Crossing will be anchored by Dillard’s, Belk, JCPenney and Barnes & Noble.�0

Making a splash.It’s what we know.Unique experiences, like the boat test-drive lake gracing the new Bass Pro Shops at Gulf Coast Town
Center in Ft. Myers, FL, draw visitors to our properties again and again. CBL’s development, leasing
and management teams provide distinctive offerings at every property. Does fashion float your
boat? Then browse the latest menswear at Road. The elite retailer recently opened its third store at
Oak Park Mall in Overland Park, KS.
FACT: Gulf Coast Town Center will bring Ft. Myers’ shoppers a number of new-to-the-market retailers and restaurants including Bass Pro Shops, Ron Jon Surf Shop, Golf Galaxy and Bar Louie.
Bass Pro Shops at Gulf Coast Town Center in Fort Myers, FL.
CBL & Associates Properties, Inc. 2006 Annual Report
11
FACT: Since �00�, CBL has invested over $�00 million to renovate more than �0 market-dominant properties.
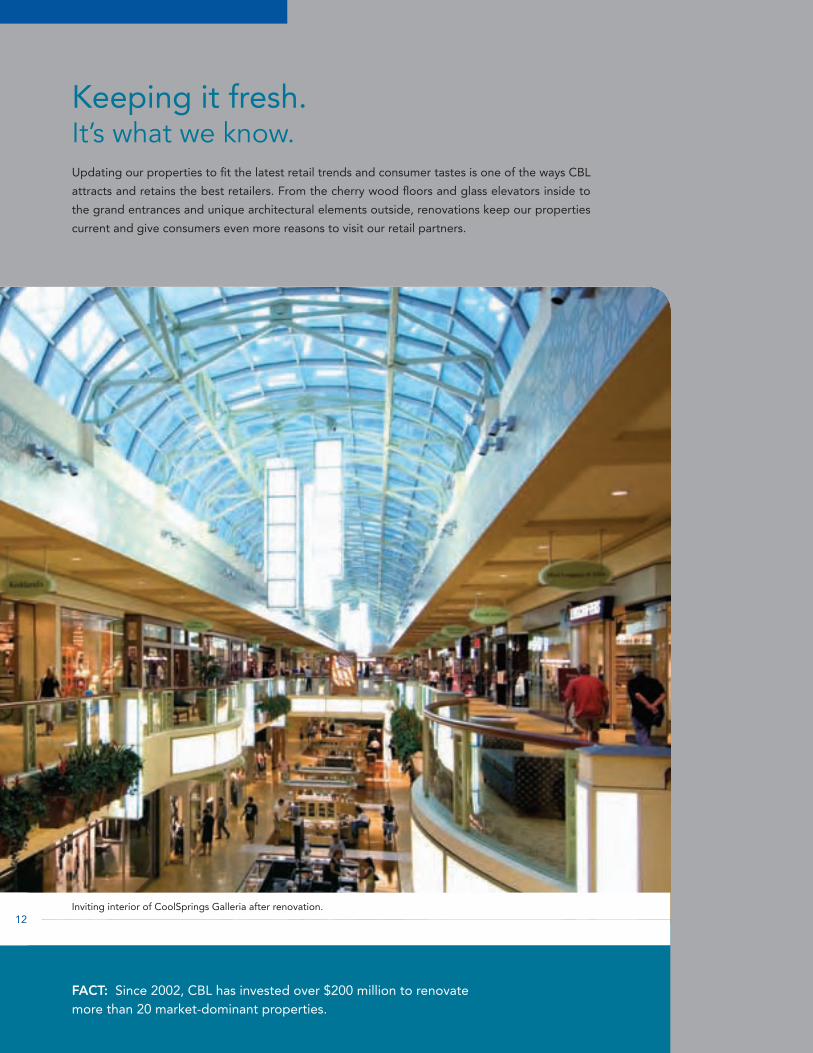
Keeping it fresh. It’s what we know.Updating our properties to fit the latest retail trends and consumer tastes is one of the ways CBL
attracts and retains the best retailers. From the cherry wood floors and glass elevators inside to
the grand entrances and unique architectural elements outside, renovations keep our properties
current and give consumers even more reasons to visit our retail partners.
Inviting interior of CoolSprings Galleria after renovation.��
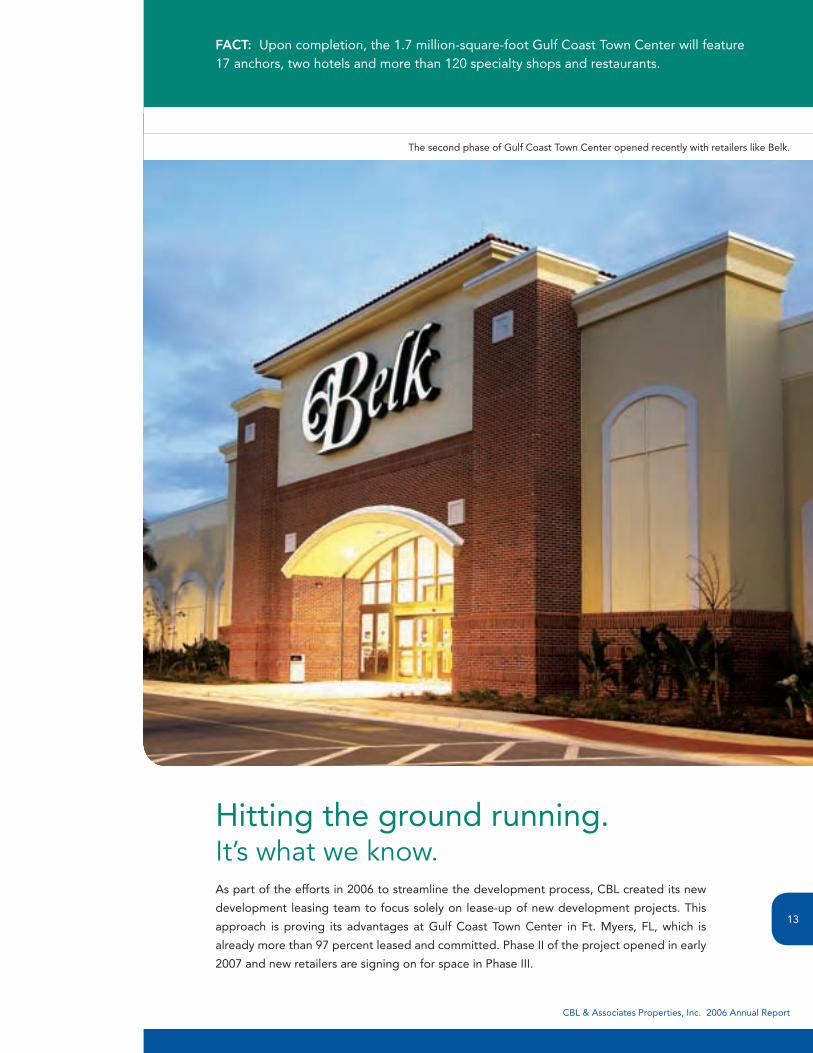
Hitting the ground running. It’s what we know.As part of the efforts in �006 to streamline the development process, CBL created its new
development leasing team to focus solely on lease-up of new development projects. This
approach is proving its advantages at Gulf Coast Town Center in Ft. Myers, FL, which is
already more than 97 percent leased and committed. Phase II of the project opened in early
�007 and new retailers are signing on for space in Phase III.
FACT: Upon completion, the �.7 million-square-foot Gulf Coast Town Center will feature �7 anchors, two hotels and more than ��0 specialty shops and restaurants.
The second phase of Gulf Coast Town Center opened recently with retailers like Belk.
CBL & Associates Properties, Inc. �006 Annual Report
��
Dear Shareholders,
CBL & Associates Properties, Inc. is far more than a portfolio of market-dominant malls and open-air centers. It’s what we know that sets us apart. Our notable expertise in management, leasing and development shows in our exciting lineup of new stores and restaurants. In 2006, the successful execution of our strategy enabled us to enter and dominate new markets while producing impressive growth in Funds From Operations and declaring our fifth consecutive double-digit dividend increase.
Our market-dominant strategy
CBL seeks to own the preeminent property in a trade area, whether that
market is a dynamic city like Madison, WI, or a growing submarket of a
larger metropolitan area, such as Douglasville in western Atlanta. Careful
site selection and rigorous attention to the mix of retail partners make
CBL’s properties the first choice both of shoppers and of retailers seeking
the ideal venue for new stores.
We’ve adhered to that market-dominant commitment with each new
property added to our portfolio and will continue that strategy as we
accelerate our development program in �007. At the same time, we
continue to seek acquisitions that are immediately accretive and also
positioned for long-term growth.
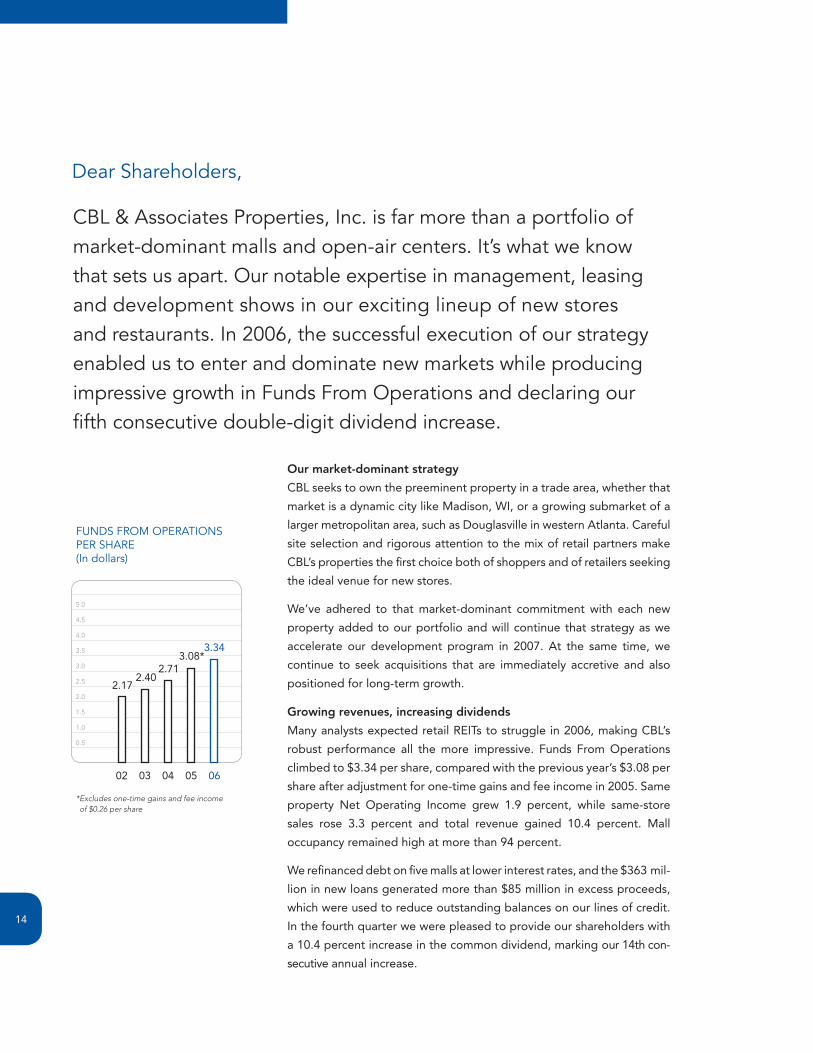
Growing revenues, increasing dividends
Many analysts expected retail REITs to struggle in �006, making CBL’s
robust performance all the more impressive. Funds From Operations
climbed to $�.�� per share, compared with the previous year’s $�.08 per
share after adjustment for one-time gains and fee income in �005. Same
property Net Operating Income grew �.9 percent, while same-store
sales rose �.� percent and total revenue gained �0.� percent. Mall
occupancy remained high at more than 9� percent.
We refinanced debt on five malls at lower interest rates, and the $�6� mil-
lion in new loans generated more than $85 million in excess proceeds,
which were used to reduce outstanding balances on our lines of credit.
In the fourth quarter we were pleased to provide our shareholders with
a �0.� percent increase in the common dividend, marking our ��th con-
secutive annual increase.
FUNDS FROM OPERATIONS PER SHARE (In dollars)
0� 0� 0� 05 06
*�Excludes�one-time�gains�and�fee�income�of�$0.26�per�share
0.5
�.0
�.5
�.0
�.5
�.0
�.5
�.0
�.5
5.0
�.���.08*
�.7��.�0
�.�7
��
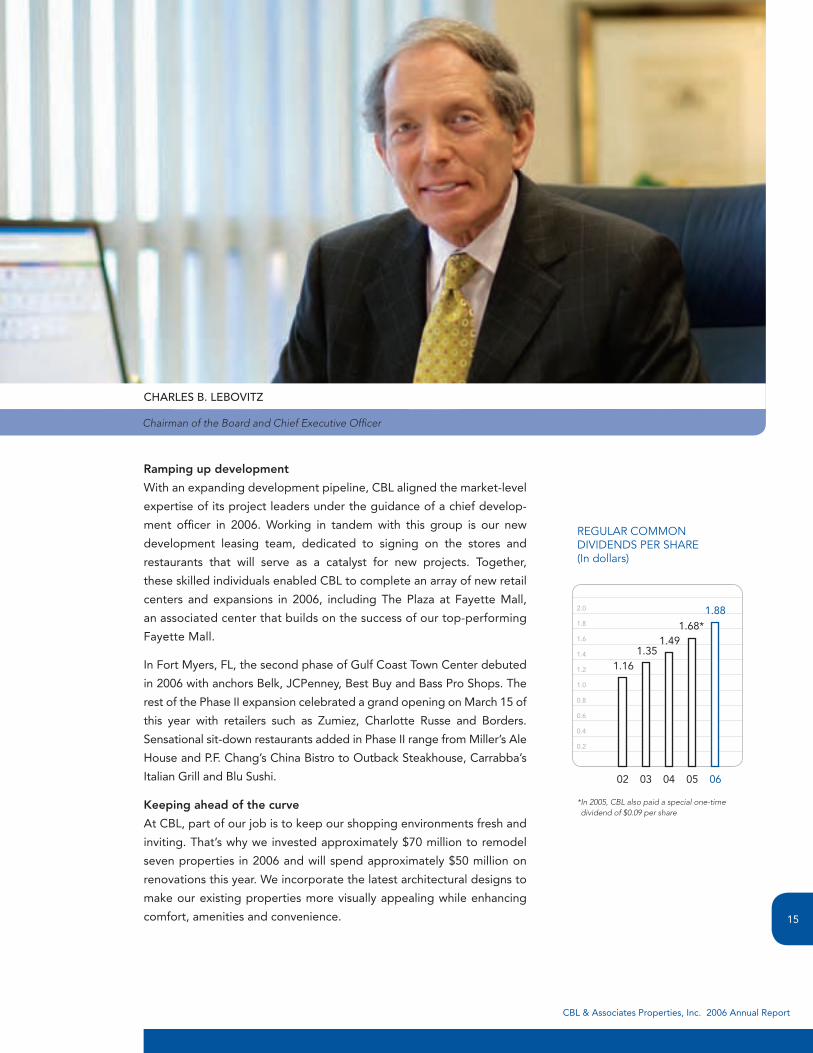
CHARLES B. LEBOVITZ
REGULAR COMMON DIVIDENDS PER SHARE (In dollars)
0� 0� 0� 05 06
*�In�2005,�CBL�also�paid�a�special�one-time�dividend�of�$0.09�per�share
0.�
0.�
0.6
0.8
�.0
�.�
�.�
�.6
�.8
�.0 �.88�.68*
�.�9�.�5
�.�6
Chairman�of�the�Board�and�Chief�Executive�Officer
Ramping up development
With an expanding development pipeline, CBL aligned the market-level
expertise of its project leaders under the guidance of a chief develop-
ment officer in �006. Working in tandem with this group is our new
development leasing team, dedicated to signing on the stores and
restaurants that will serve as a catalyst for new projects. Together,
these skilled individuals enabled CBL to complete an array of new retail
centers and expansions in �006, including The Plaza at Fayette Mall,
an associated center that builds on the success of our top-performing
Fayette Mall.
In Fort Myers, FL, the second phase of Gulf Coast Town Center debuted
in �006 with anchors Belk, JCPenney, Best Buy and Bass Pro Shops. The
rest of the Phase II expansion celebrated a grand opening on March �5 of
this year with retailers such as Zumiez, Charlotte Russe and Borders.
Sensational sit-down restaurants added in Phase II range from Miller’s Ale
House and P.F. Chang’s China Bistro to Outback Steakhouse, Carrabba’s
Italian Grill and Blu Sushi.
Keeping ahead of the curve
At CBL, part of our job is to keep our shopping environments fresh and
inviting. That’s why we invested approximately $70 million to remodel
seven properties in �006 and will spend approximately $50 million on
renovations this year. We incorporate the latest architectural designs to
make our existing properties more visually appealing while enhancing
comfort, amenities and convenience.
CBL & Associates Properties, Inc. �006 Annual Report
�5

CBL YEAR-END COMMMON STOCK PRICE PER SHARE (In dollars)
5
�0
�5
�0
�5
�0
�5
�0
�5
50
06
��.�5
05
�9.5�
0�
�8.�8
0�
�8.�5
0�
�0.0�
Yet the atmosphere at our 79 malls and open-air centers owes as much
to our retail partners as it does to masonry and glass. CBL’s property
managers and leasing specialists continue to spice up the retail mix with
popular restaurants, in-demand stores and unique experiences.
We encourage innovative thinking through our decentralized management
system, giving local teams the latitude to try new concepts, and those
ideas have generated several expanding sources of income. Specialty
leasing offers opportunities to lease carts and kiosks in common areas
and arranges temporary leases for inline locations to fill downtime
between the changing of retailers; sponsorships yield advertising
revenue from banners, video displays, special events and innovative
marketing programs. Underutilized parking areas are converted to pad
sites for new restaurants. All of these programs contributed to our bot-
tom line in �006, and we are pursuing more ways to grow revenue from
our existing portfolio, including a promising new gift card program.
The road ahead
CBL plans to deliver more than �.� million square feet of new develop-
ments in �007, investing more than $��5 million to expand and enhance
our retail portfolio. Among those new properties will be Alamance
Crossing, an open-air town center that will introduce department stores,
a bookstore, theater and restaurants in a main street setting to Burling-
ton, NC. Other projects bringing CBL to new markets this year will be
Milford Marketplace, a lifestyle center in Milford, CT, and Cobblestone
Village, a community center in Palm Coast, FL.
We also know that our existing properties must grow to maintain their
market-dominant positions. By bringing shoppers the latest retail expe-
riences, each mall fortifies its position as the top retail destination. A
good example is Brookfield Square outside Milwaukee, WI, where we
are introducing several new restaurants in a fabulous lifestyle addition to
a mall first constructed �0 years ago.
Ultimately, our success comes from listening to our shareholders, our
retailers, shoppers, city officials and town councils. And ultimately, the
success of our organization reflects the expertise and dedication of the
employees who manage our properties, interact with our retail partners
and customers, and carry out our initiatives. We couldn’t do it without
them – it’s what we know.
CHARLES B. LEBOVITZ
Chairman of the Board and
Chief Executive Officer
�6
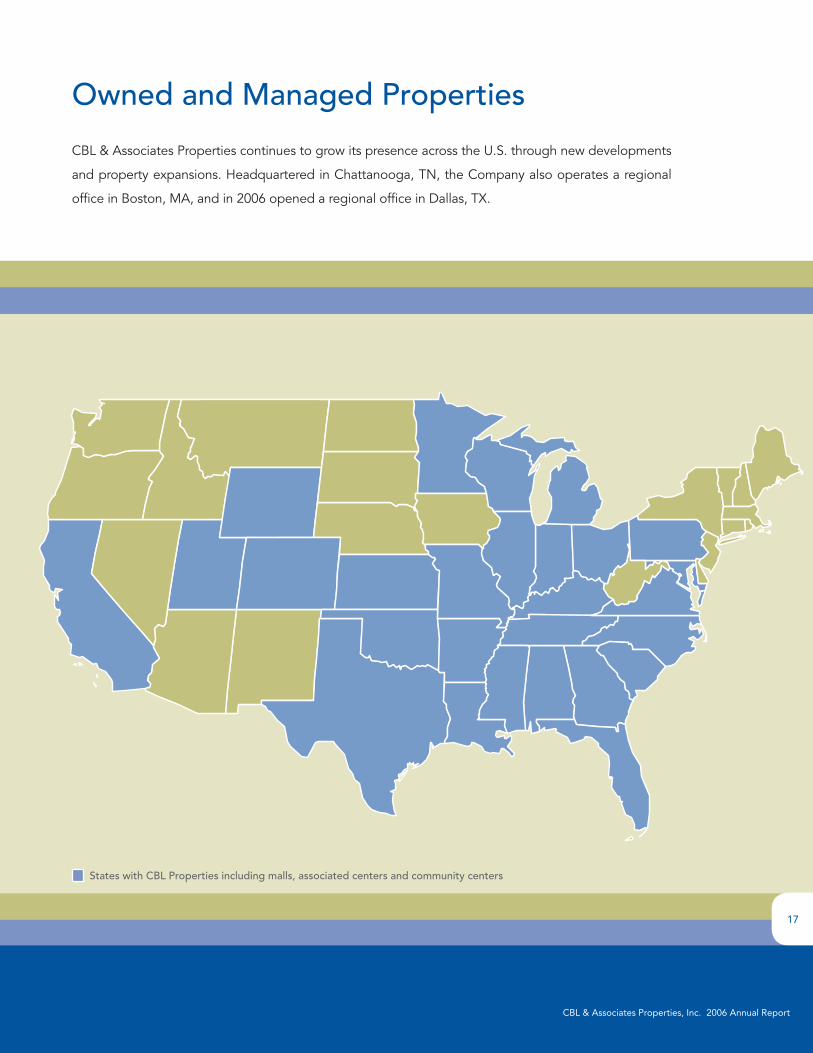
States with CBL Properties including malls, associated centers and community centers
Owned and Managed Properties
CBL & Associates Properties continues to grow its presence across the U.S. through new developments
and property expansions. Headquartered in Chattanooga, TN, the Company also operates a regional
office in Boston, MA, and in 2006 opened a regional office in Dallas, TX.
CBL & Associates Properties, Inc. �006 Annual ReportCBL & Associates Properties, Inc. �006 Annual Report
�7
CBL & Associates Properties, Inc. �006 Annual Report
Owned and Managed Properties
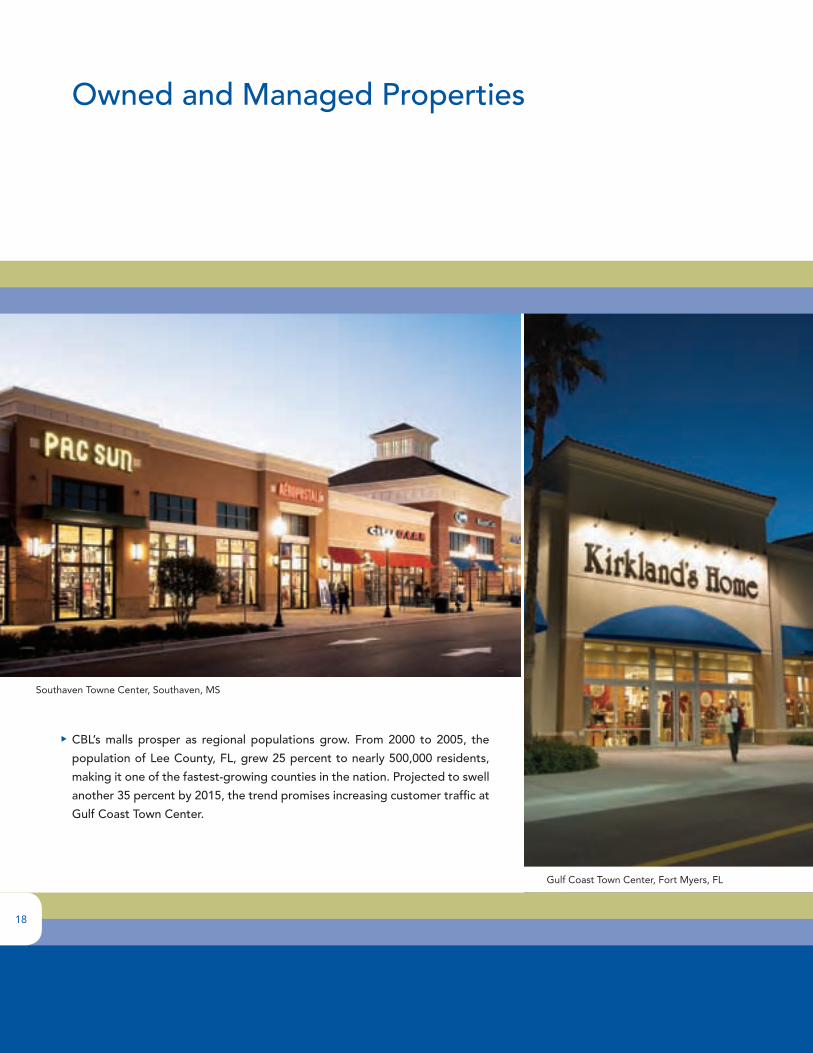
CBL’s malls prosper as regional populations grow. From 2000 to 2005, the
population of Lee County, FL, grew 25 percent to nearly 500,000 residents,
making it one of the fastest-growing counties in the nation. Projected to swell
another 35 percent by 2015, the trend promises increasing customer traffic at
Gulf Coast Town Center.
Southaven Towne Center, Southaven, MS
Gulf Coast Town Center, Fort Myers, FL
�8
ALABAMA Square Feet
HuntsvilleMadison Square 932,452Parkway Place 630,825Madison Plaza 153,085
ARKANSAS
Fort SmithMassard Crossing 300,717
Little RockPark Plaza Mall 546,500
CALIFORNIA
El CentroImperial Valley Mall 766,333
COLORAdO
LongmontTwin Peaks Mall 555,919
FLORIdA
daytona BeachVolusia Mall 1,064,768
Ft. MyersGulf Coast Town Center 1,003,507
MelbourneThe Shops at Pineda Ridge 170,009
Panama CityPanama City Mall 606,452The Shoppes at Panama City Mall 57,000
SebringLakeshore Mall 495,972
GEORGIA Square Feet
AthensGeorgia Square 673,138Georgia Square Plaza 15,393
Atlanta (douglasville)Arbor Place 1,176,244The Landing at Arbor Place 169,523
daltonWalnut Square 449,798Walnut Crossing 128,465
ILLINOIS
BloomingtonEastland Mall 755,788
decaturHickory Point Mall 823,902
Fairview HeightsSt. Clair Square 1,047,438The Shoppes at St. Clair Square 84,055
RockfordCherryVale Mall 783,167
INdIANA
Terre HauteHoney Creek Mall 680,890
KANSAS
Kansas City (Overland Park)Oak Park Mall 1,561,309
KENTuCKy Square Feet
LexingtonFayette Mall 1,233,982 Plaza at Fayette 190,164
LouisvilleJefferson Mall 923,762
PaducahKentucky Oaks Mall 1,013,822
LOuISIANA
LafayetteMall of Acadiana 997,275
MARyLANd
Bel AirHarford Mall 490,458Harford Annex 107,903
MICHIGAN
detroit (Livonia)Laurel Park Place 505,204
LansingMeridian Mall 977,085
MidlandMidland Mall 515,000
MuskegonThe Lakes Mall 593,487
SaginawFashion Square Mall 798,016
Gulf Coast Town Center, Fort Myers, FL
�9
CBL & Associates Properties, Inc. �006 Annual Report
Owned and Managed Properties
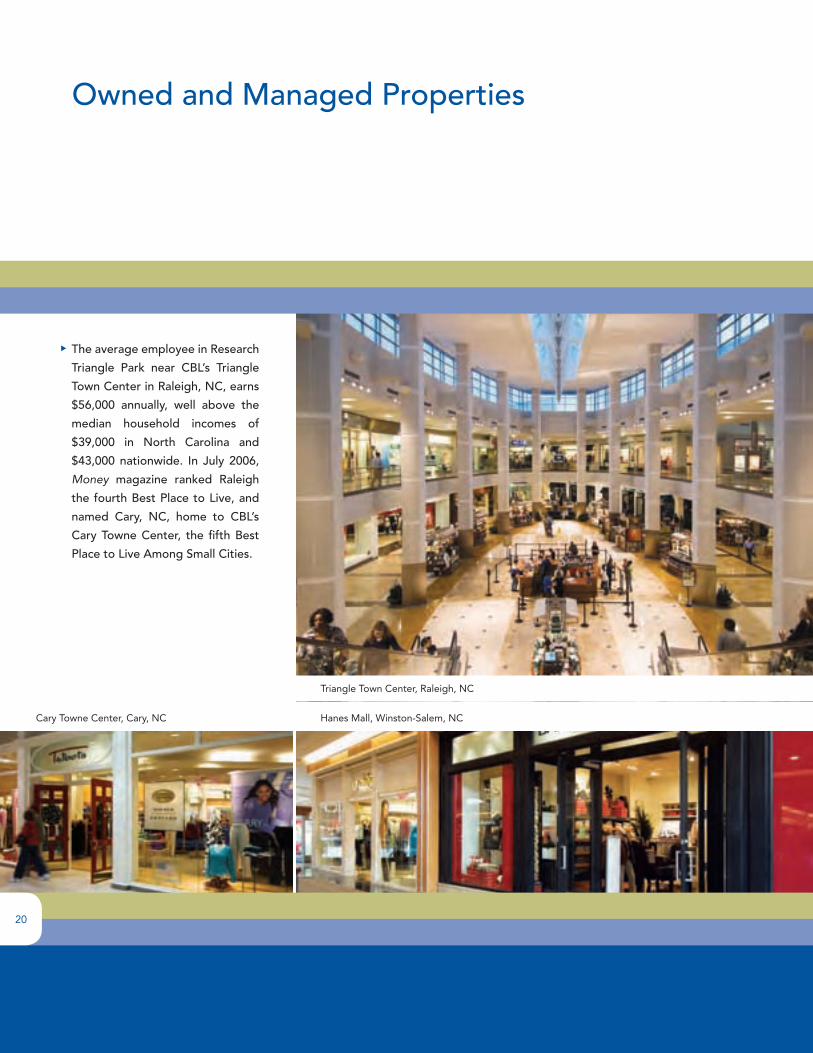
Cary Towne Center, Cary, NC Hanes Mall, Winston-Salem, NC
Triangle Town Center, Raleigh, NC
The average employee in Research
Triangle Park near CBL’s Triangle
Town Center in Raleigh, NC, earns
$56,000 annually, well above the
median household incomes of
$39,000 in North Carolina and
$43,000 nationwide. In July 2006,
Money magazine ranked Raleigh
the fourth Best Place to Live, and
named Cary, NC, home to CBL’s
Cary Towne Center, the fifth Best
Place to Live Among Small Cities.
�0
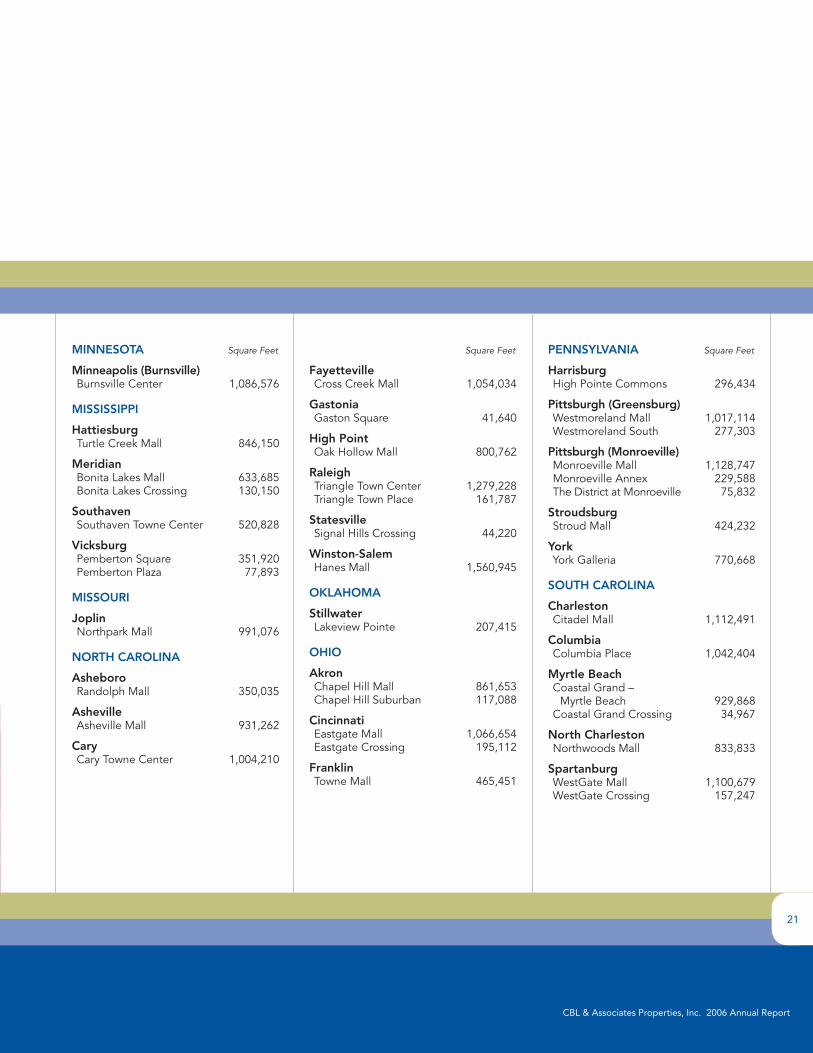
MINNESOTA Square Feet
Minneapolis (Burnsville)Burnsville Center 1,086,576
MISSISSIPPI
HattiesburgTurtle Creek Mall 846,150
MeridianBonita Lakes Mall 633,685Bonita Lakes Crossing 130,150
SouthavenSouthaven Towne Center 520,828
VicksburgPemberton Square 351,920Pemberton Plaza 77,893
MISSOuRI
JoplinNorthpark Mall 991,076
NORTH CAROLINA
AsheboroRandolph Mall 350,035
AshevilleAsheville Mall 931,262
CaryCary Towne Center 1,004,210
Square Feet
FayettevilleCross Creek Mall 1,054,034
GastoniaGaston Square 41,640
High PointOak Hollow Mall 800,762
RaleighTriangle Town Center 1,279,228Triangle Town Place 161,787
StatesvilleSignal Hills Crossing 44,220
Winston-SalemHanes Mall 1,560,945
OKLAHOMA
StillwaterLakeview Pointe 207,415
OHIO
AkronChapel Hill Mall 861,653Chapel Hill Suburban 117,088
CincinnatiEastgate Mall 1,066,654Eastgate Crossing 195,112
FranklinTowne Mall 465,451
PENNSyLVANIA Square Feet
HarrisburgHigh Pointe Commons 296,434
Pittsburgh (Greensburg)Westmoreland Mall 1,017,114Westmoreland South 277,303
Pittsburgh (Monroeville)Monroeville Mall 1,128,747Monroeville Annex 229,588The District at Monroeville 75,832
StroudsburgStroud Mall 424,232
yorkYork Galleria 770,668
SOuTH CAROLINA
CharlestonCitadel Mall 1,112,491
ColumbiaColumbia Place 1,042,404
Myrtle BeachCoastal Grand – Myrtle Beach 929,868Coastal Grand Crossing 34,967
North CharlestonNorthwoods Mall 833,833
SpartanburgWestGate Mall 1,100,679WestGate Crossing 157,247
��
CBL & Associates Properties, Inc. �006 Annual Report
Owned and Managed Properties
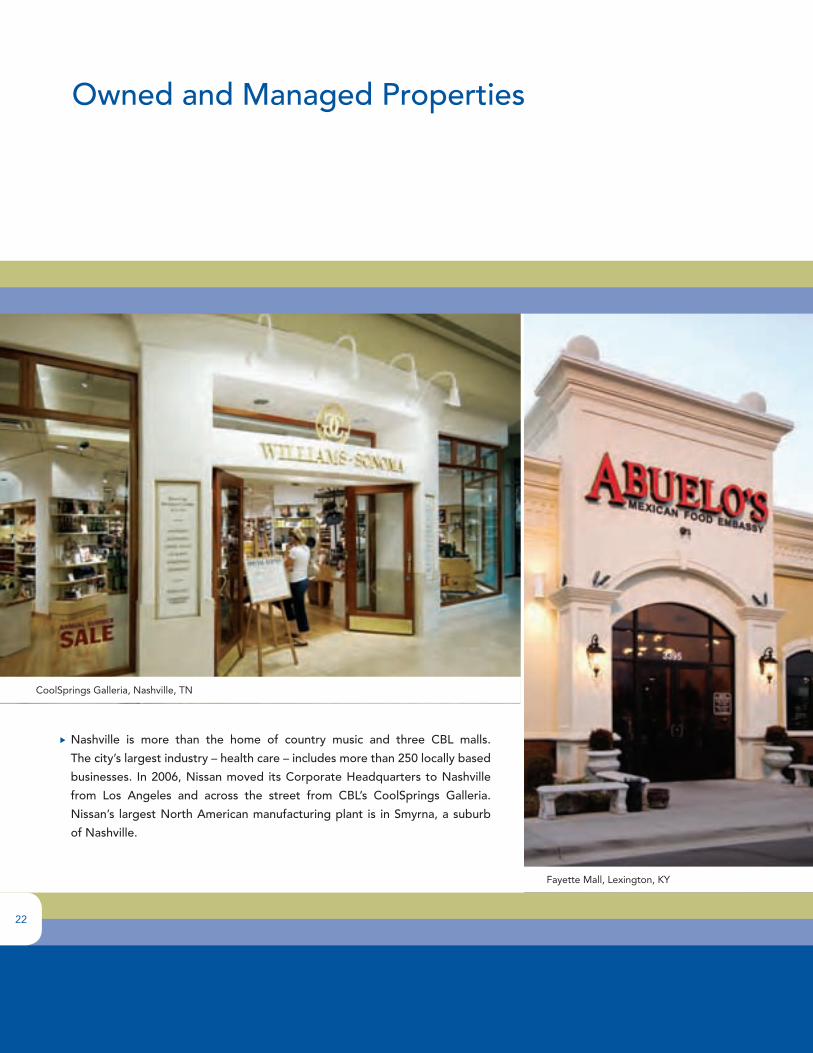
CoolSprings Galleria, Nashville, TN
Nashville is more than the home of country music and three CBL malls.
The city’s largest industry – health care – includes more than 250 locally based
businesses. In 2006, Nissan moved its Corporate Headquarters to Nashville
from Los Angeles and across the street from CBL’s CoolSprings Galleria.
Nissan’s largest North American manufacturing plant is in Smyrna, a suburb
of Nashville.
Fayette Mall, Lexington, KY
��
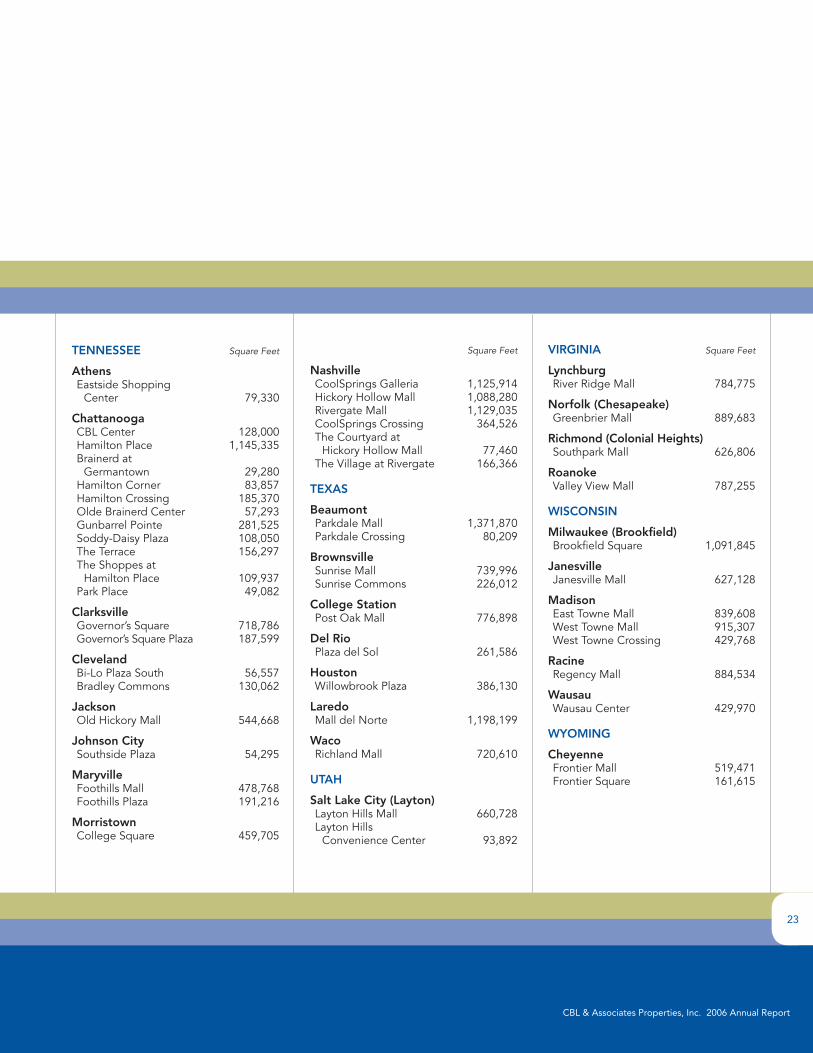
TENNESSEE Square Feet
AthensEastside Shopping Center 79,330
ChattanoogaCBL Center 128,000Hamilton Place 1,145,335Brainerd at Germantown 29,280Hamilton Corner 83,857Hamilton Crossing 185,370Olde Brainerd Center 57,293Gunbarrel Pointe 281,525Soddy-Daisy Plaza 108,050The Terrace 156,297The Shoppes at Hamilton Place 109,937Park Place 49,082
ClarksvilleGovernor’s Square 718,786Governor’s Square Plaza 187,599
ClevelandBi-Lo Plaza South 56,557Bradley Commons 130,062
JacksonOld Hickory Mall 544,668
Johnson CitySouthside Plaza 54,295
MaryvilleFoothills Mall 478,768Foothills Plaza 191,216
MorristownCollege Square 459,705
Square Feet
NashvilleCoolSprings Galleria 1,125,914Hickory Hollow Mall 1,088,280Rivergate Mall 1,129,035CoolSprings Crossing 364,526The Courtyard at Hickory Hollow Mall 77,460The Village at Rivergate 166,366
TExAS
BeaumontParkdale Mall 1,371,870Parkdale Crossing 80,209
BrownsvilleSunrise Mall 739,996Sunrise Commons 226,012
College StationPost Oak Mall 776,898
del RioPlaza del Sol 261,586
HoustonWillowbrook Plaza 386,130
LaredoMall del Norte 1,198,199
WacoRichland Mall 720,610
uTAH
Salt Lake City (Layton)Layton Hills Mall 660,728Layton Hills Convenience Center 93,892
VIRGINIA Square Feet
LynchburgRiver Ridge Mall 784,775
Norfolk (Chesapeake)Greenbrier Mall 889,683
Richmond (Colonial Heights)Southpark Mall 626,806
RoanokeValley View Mall 787,255
WISCONSIN
Milwaukee (Brookfield)Brookfield Square 1,091,845
JanesvilleJanesville Mall 627,128
MadisonEast Towne Mall 839,608West Towne Mall 915,307West Towne Crossing 429,768
RacineRegency Mall 884,534
WausauWausau Center 429,970
WyOMING
CheyenneFrontier Mall 519,471Frontier Square 161,615
��
CBL & Associates Properties, Inc. �006 Annual Report
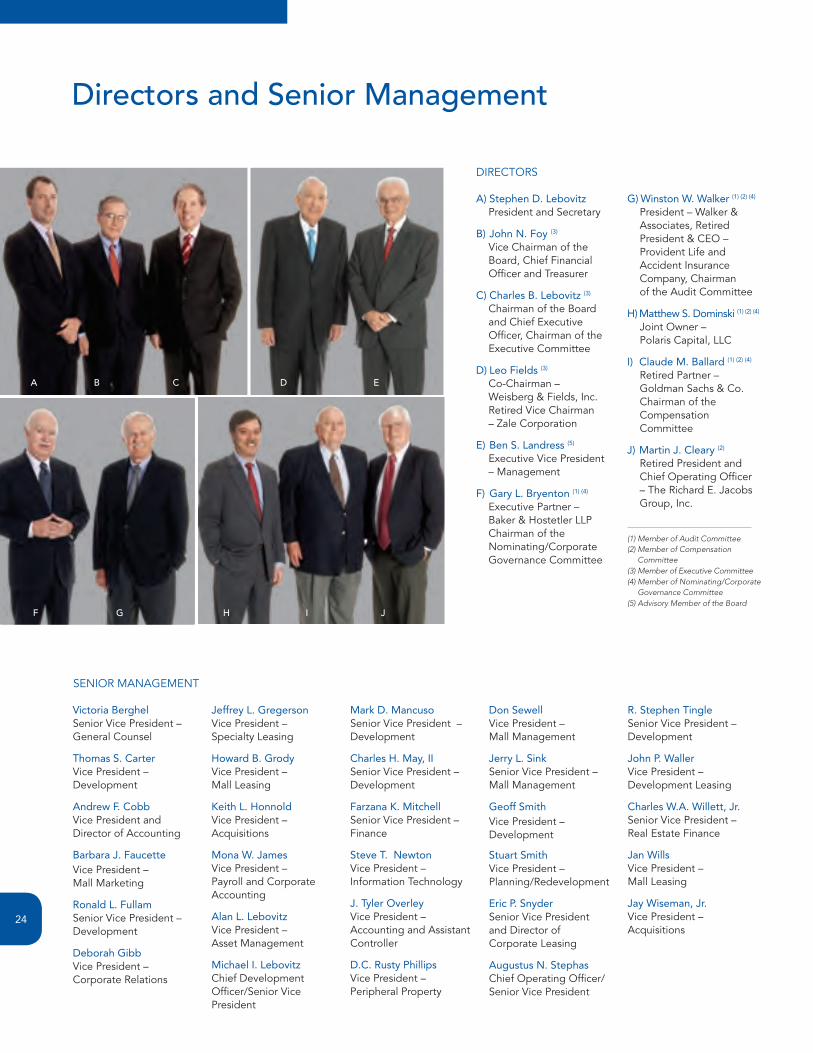
Directors and Senior Management
A C D E
F G H I J
B
Victoria BerghelSenior Vice President – General Counsel
Thomas S. CarterVice President – Development
Andrew F. CobbVice President and Director of Accounting
Barbara J. FaucetteVice President – Mall Marketing
Ronald L. FullamSenior Vice President – Development
Deborah GibbVice President – Corporate Relations
Jeffrey L. GregersonVice President – Specialty Leasing
Howard B. GrodyVice President – Mall Leasing
Keith L. HonnoldVice President – Acquisitions
Mona W. JamesVice President – Payroll and Corporate Accounting
Alan L. LebovitzVice President – Asset Management
Michael I. LebovitzChief Development Officer/Senior Vice President
Mark D. MancusoSenior Vice President – Development
Charles H. May, IISenior Vice President – Development
Farzana K. MitchellSenior Vice President – Finance
Steve T. NewtonVice President – Information Technology
J. Tyler OverleyVice President – Accounting and Assistant Controller
D.C. Rusty PhillipsVice President – Peripheral Property
Don SewellVice President – Mall Management
Jerry L. SinkSenior Vice President – Mall Management
Geoff SmithVice President – Development
Stuart SmithVice President – Planning/Redevelopment
Eric P. SnyderSenior Vice President and Director of Corporate Leasing
Augustus N. StephasChief Operating Officer/Senior Vice President
R. Stephen TingleSenior Vice President – Development
John P. WallerVice President – Development Leasing
Charles W.A. Willett, Jr.Senior Vice President – Real Estate Finance
Jan WillsVice President – Mall Leasing
Jay Wiseman, Jr.Vice President – Acquisitions
DIRECTORS
SENIOR MANAGEMENT
A) Stephen D. Lebovitz President and Secretary
B) John N. Foy (�)
Vice Chairman of the Board, Chief Financial Officer and Treasurer
C) Charles B. Lebovitz (�)
Chairman of the Board and Chief Executive Officer, Chairman of the Executive Committee
D) Leo Fields (�)
Co-Chairman – Weisberg & Fields, Inc. Retired Vice Chairman – Zale Corporation
E) Ben S. Landress (5)
Executive Vice President – Management
F) Gary L. Bryenton (�) (�)
Executive Partner – Baker & Hostetler LLP Chairman of the Nominating/Corporate Governance Committee
G) Winston W. Walker (�) (�) (�)
President – Walker & Associates, Retired President & CEO – Provident Life and Accident Insurance Company, Chairman of the Audit Committee
H) Matthew S. Dominski (�) (�) (�)
Joint Owner – Polaris Capital, LLC
I) Claude M. Ballard (�) (�) (�)
Retired Partner – Goldman Sachs & Co. Chairman of the Compensation Committee
J) Martin J. Cleary (�)
Retired President and Chief Operating Officer – The Richard E. Jacobs Group, Inc.
(1)�Member�of�Audit�Committee(2)��Member�of�Compensation��
Committee(3)��Member�of�Executive�Committee(4)��Member�of�Nominating/Corporate�
Governance�Committee(5)�Advisory�Member�of�the�Board
��
2525
CBL & Associates Properties, Inc. 2006 Annual Report
2006 Financial Data
26 Selected Financial Data
27 Management’s Discussion and Analysis of Financial Condition and Results of Operations
48 Reports of Independent Registered Public Accounting Firm
51 Consolidated Balance Sheets
52 Consolidated Statements of Operations
53 Consolidated Statement of Shareholders’ Equity
55 Consolidated Statements of Cash Flows
56 Notes to Consolidated Financial Statements
26
Selected Financial Data
Year Ended December 31,(1)
(in thousands, except per share data) 2006 2005 2004 2003 2002
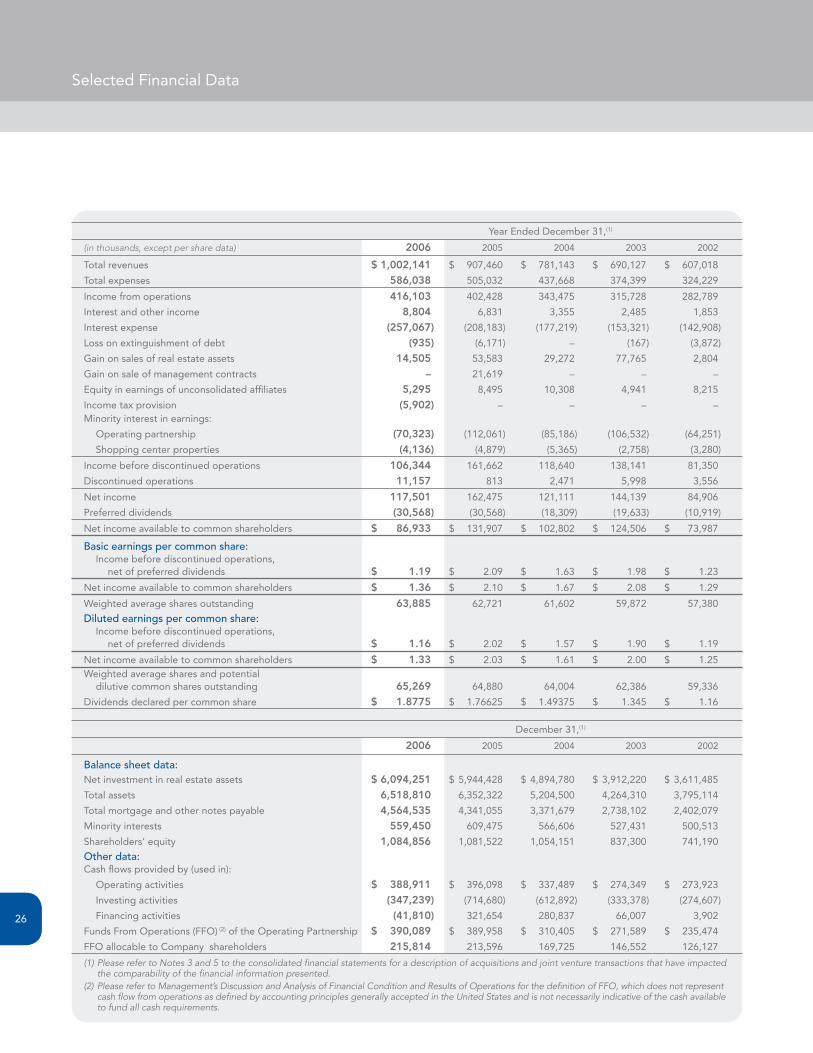
Total revenues $1,002,141 $ 907,460 $ 781,143 $ 690,127 $ 607,018
Total expenses 586,038 505,032 437,668 374,399 324,229
Income from operations 416,103 402,428 343,475 315,728 282,789
Interest and other income 8,804 6,831 3,355 2,485 1,853
Interest expense (257,067) (208,183) (177,219) (153,321) (142,908)
Loss on extinguishment of debt (935) (6,171) – (167) (3,872)
Gain on sales of real estate assets 14,505 53,583 29,272 77,765 2,804
Gain on sale of management contracts – 21,619 – – –
Equity in earnings of unconsolidated affiliates 5,295 8,495 10,308 4,941 8,215
Income tax provision (5,902) – – – –Minority interest in earnings:
Operating partnership (70,323) (112,061) (85,186) (106,532) (64,251)
Shopping center properties (4,136) (4,879) (5,365) (2,758) (3,280)
Income before discontinued operations 106,344 161,662 118,640 138,141 81,350
Discontinued operations 11,157 813 2,471 5,998 3,556
Net income 117,501 162,475 121,111 144,139 84,906
Preferred dividends (30,568) (30,568) (18,309) (19,633) (10,919)
Net income available to common shareholders $ 86,933 $ 131,907 $ 102,802 $ 124,506 $ 73,987
Basic earnings per common share: Income before discontinued operations, net of preferred dividends $ 1.19 $ 2.09 $ 1.63 $ 1.98 $ 1.23
Net income available to common shareholders $ 1.36 $ 2.10 $ 1.67 $ 2.08 $ 1.29
Weighted average shares outstanding 63,885 62,721 61,602 59,872 57,380
Diluted earnings per common share: Income before discontinued operations, net of preferred dividends $ 1.16 $ 2.02 $ 1.57 $ 1.90 $ 1.19
Net income available to common shareholders $ 1.33 $ 2.03 $ 1.61 $ 2.00 $ 1.25Weighted average shares and potential dilutive common shares outstanding 65,269 64,880 64,004 62,386 59,336
Dividends declared per common share $ 1.8775 $ 1.76625 $ 1.49375 $ 1.345 $ 1.16
December 31,(1)
2006 2005 2004 2003 2002
Balance sheet data: Net investment in real estate assets $6,094,251 $ 5,944,428 $ 4,894,780 $ 3,912,220 $ 3,611,485
Total assets 6,518,810 6,352,322 5,204,500 4,264,310 3,795,114
Total mortgage and other notes payable 4,564,535 4,341,055 3,371,679 2,738,102 2,402,079
Minority interests 559,450 609,475 566,606 527,431 500,513
Shareholders’ equity 1,084,856 1,081,522 1,054,151 837,300 741,190
Other data:Cash flows provided by (used in):
Operating activities $ 388,911 $ 396,098 $ 337,489 $ 274,349 $ 273,923
Investing activities (347,239) (714,680) (612,892) (333,378) (274,607)
Financing activities (41,810) 321,654 280,837 66,007 3,902
Funds From Operations (FFO) (2) of the Operating Partnership $ 390,089 $ 389,958 $ 310,405 $ 271,589 $ 235,474
FFO allocable to Company shareholders 215,814 213,596 169,725 146,552 126,127
(1)PleaserefertoNotes3and5totheconsolidatedfinancialstatementsforadescriptionofacquisitionsandjointventuretransactionsthathaveimpactedthecomparabilityofthefinancialinformationpresented.
(2) PleaserefertoManagement’sDiscussionandAnalysisofFinancialConditionandResultsofOperationsforthedefinitionofFFO,whichdoesnotrepresentcashflowfromoperationsasdefinedbyaccountingprinciplesgenerallyacceptedintheUnitedStatesandisnotnecessarilyindicativeofthecashavailabletofundallcashrequirements.
CBL & Associates Properties, Inc. 2006 Annual Report
27
The following discussion and analysis of financial condition
and results of operations should be read in conjunction with
the consolidated financial statements and accompanying
notes that are included in this annual report. Capitalized
terms used, but not defined, in this Management’s Discussion
and Analysis of Financial Condition and Results of Operations
have the same meanings as defined in the notes to the
consolidated financial statements. In this discussion, the terms
“we,” “us,” “our” and the “Company” refer to CBL &
Associates Properties, Inc. and its subsidiaries.
Certain statements made in this section or elsewhere in
this report may be deemed “forward-looking statements”
within the meaning of the federal securities laws. Although
we believe the expectations reflected in any forward-looking
statements are based on reasonable assumptions, we can
give no assurance that these expectations will be attained,
and it is possible that actual results may differ materially
from those indicated by these forward-looking statements
due to a variety of risks and uncertainties. In addition to the
risk factors discussed in Item 1A of our annual report on
Form 10-K for the year ending December 31, 2006, such
risks and uncertainties include, without limitation, general
industry, economic and business conditions, interest rate
fluctuations, costs of capital and capital requirements, avail-
ability of real estate properties, inability to consummate
acquisition opportunities, competition from other companies
and retail formats, changes in retail rental rates in our markets,
shifts in customer demands, tenant bankruptcies or store
closings, changes in vacancy rates at our properties, changes
in operating expenses, changes in applicable laws, rules and
regulations, the ability to obtain suitable equity and/or debt
financing and the continued availability of financing in the
amounts and on the terms necessary to support our future
business. We disclaim any obligation to update or revise any
forward-looking statements to reflect actual results or changes
in the factors affecting the forward-looking information.
ExecutiveOverviewWe are a self-managed, self-administered, fully integrated
real estate investment trust (“REIT”) that is engaged in the
ownership, development, acquisition, leasing, management
Management’s Discussion and Analysis of Financial Condition and Results of Operations
and operation of regional shopping malls and community
centers. Our shopping centers are located in 27 states, but
primarily in the southeastern and midwestern United States.
As of December 31, 2006, we owned controlling interests
in 72 regional malls (including large open-air centers),
27 associated centers (each adjacent to a regional mall),
four community centers, and our corporate office building.
We consolidate the financial statements of all entities in
which we have a controlling financial interest or where we
are the primary beneficiary of a variable interest entity. As
of December 31, 2006, we owned non-controlling interests
in seven regional malls, four associated centers and one
community center. Because major decisions such as the
acquisition, sale or refinancing of principal partnership or
joint venture assets must be approved by one or more of the
other partners, we do not control these partnerships and
joint ventures and, accordingly, account for these investments
using the equity method. At December 31, 2006, we had
seven mall/lifestyle expansions, one open-air shopping center,
one open-air shopping center expansion, one associated
center and three community centers, one of which is owned
in a joint venture, under construction.
The majority of our revenues are derived from leases
with retail tenants and generally include minimum rents,
percentage rents based on tenants’ sales volumes and
reimbursements from tenants for expenditures related to
property operating expenses, real estate taxes and mainte-
nance and repairs, as well as certain capital expenditures.
We also generate revenues from sales of peripheral land
at the properties and from sales of real estate assets when
it is determined that we can realize a premium value for the
assets. Proceeds from such sales are generally used to reduce
borrowings on our credit facilities.
We expanded our portfolio in 2006 by opening five
new developments and eight property expansions totaling
1.5 million square feet. We have approximately 3.1 million
square feet of new developments and expansions, which
represent $507.4 million of net investment, that are scheduled
to open during 2007 and 2008.
Management’s Discussion and Analysis of Financial Condition and Results of Operations
28
ResultsofOperationsComparison of the Year Ended December 31, 2006
to the Year Ended December 31, 2005
The following significant transactions impacted the
consolidated results of operations for the year ended
December 31, 2006, compared to the year ended
December 31, 2005:
n Since January 1, 2005, we have acquired or opened
eight malls, two open-air centers, three associated centers
and three community centers (collectively referred to as
the “2006 New Properties”). The 2006 New Properties are
as follows:
Date Acquired/ Property Location Opened
Acquisitions:
Laurel Park Place Livonia, MI June 2005
The Mall of Acadiana Lafayette, LA July 2005
Layton Hills Mall Layton, UT November 2005
Layton Hills Convenience Center Layton, UT November 2005
Oak Park Mall Overland Park, KS November 2005
Eastland Mall Bloomington, IL November 2005
Hickory Point Mall Forsyth, IL November 2005
Triangle Town Center (50/50 joint venture) Raleigh, NC November 2005
Triangle Town Place (50/50 joint venture) Raleigh, NC November 2005
NewDevelopments:
Imperial Valley Mall (60/40 joint venture) El Centro, CA March 2005
Southaven Towne Center Southaven, MS October 2005
Gulf Coast Town Center – Phase I & II anchors November 2005/ (50/50 joint venture) Ft. Myers, FL November 2006
The Plaza at Fayette Mall Lexington, KY October 2006
High Pointe Commons (50/50 joint venture) Harrisburg, PA October 2006
Lakeview Pointe Stillwater, OK October 2006
The Shops at Pineda Ridge Melbourne, FL November 2006
n In August 2005, Galileo America LLC (“Galileo America”)
redeemed our 8.4% ownership interest by distributing
two community centers to us and we sold our manage-
ment and advisory contracts with Galileo America to New
Plan Excel Realty Trust, Inc. (“New Plan”). See Note 5 to
the consolidated financial statements for a more thorough
discussion of these transactions.
Properties that were in operation for the entire
period during 2006 and 2005 are referred to as the
“2006 Comparable Properties” in this section.
REvENuES
The $106.0 million increase in rental revenues and
tenant reimbursements was primarily attributable to
increases of $91.2 million from the 2006 New Properties
and $14.8 million from the 2006 Comparable Properties.
These increases included $4.6 million and $2.8 million of
lease termination fees for the 2006 New Properties and
the 2006 Comparable Properties, respectively.
The increase in revenues of the 2006 Comparable
Properties was driven by our ability to maintain high occupancy
levels while achieving a weighted average increase of 8.5%
in rents from both new leases and lease renewals for compa-
rable small shop spaces, as well as an increase in percentage
rents. These increases were muted by the continued loss of
rental income from the store closures and bankruptcies that
occurred in the first quarter of 2006, which also negatively
impacted our occupancy. Our cost recovery ratio improved
to 104.0% for 2006 from 103.2% for 2005.
The decrease in management, development and leasing
fees of $15.5 million was primarily attributable to the prior
year amount including management and leasing fees received
from Galileo America prior to the redemption of our interest
in Galileo America in August 2005, plus an $8.0 million
acquisition fee received from Galileo America that was
related to Galileo America’s acquisition of an approximately
$1.0 billion portfolio of shopping center properties from
New Plan.

CBL & Associates Properties, Inc. 2006 Annual Report
29
Other revenues increased by $4.2 million due to growth
of our subsidiary that provides security and maintenance
services to third parties.
OPERAtINg ExPENSES
Property operating expenses, including real estate taxes
and maintenance and repairs, increased $27.5 million as a
result of $28.3 million of expenses attributable to the 2006
New Properties and a reduction of $0.8 million related to
the 2006 Comparable Properties.
The increase in depreciation and amortization expense
of $50.8 million resulted from increases of $39.7 million from
the 2006 New Properties and $11.2 million from the 2006
Comparable Properties. The increase attributable to the
2006 Comparable Properties is due to ongoing capital
expenditures for renovations, expansions, tenant allowances
and deferred maintenance.
General and administrative expenses increased
$0.3 million during 2006. Increases related to additional
salaries and benefits for the personnel added to manage
the 2006 New Properties combined with annual compensation
increases for existing personnel were offset by a reduction
in expenses related to individuals that were terminated in
connection with the sale of our management and advisory
contracts with Galileo America in August 2005. Additionally,
our investment in developments in progress increased as
compared to the same period a year ago, which has resulted
in a larger amount of overhead expense being capitalized,
than compared to the same period a year ago. As a percentage
of revenues, general and administrative expenses decreased
to 3.9% in 2006 compared with 4.3% in 2005.
We recognized a loss on impairment of real estate
assets of $0.5 million during 2006, which resulted from a
loss of $0.3 million on the sale of two community centers
in May 2006 and a loss of $0.2 million on the sale of land in
December 2006.
OthER INCOME AND ExPENSES
Interest expense increased $48.9 million primarily due
to the debt on the 2006 New Properties, the refinancings
that were completed on the 2006 Comparable Properties and
an increase in variable interest rates as compared to 2005.
Gain on sales of real estate assets of $14.5 million in
2006 represents gains on the sales of 13 land parcels. Gain
on sales of real estate assets of $53.6 million in 2005 includes
$44.2 million of gains related to the redemption of our
ownership interest in Galileo America, $1.0 million from the
recognition of deferred gain on properties that had been
previously sold to Galileo America and $8.4 million of gains
on the sales of 11 outparcels.
The gain on sales of management contracts of
$21.6 million in 2005 represents the gain on the sale of our
management and advisory contracts with Galileo America
to New Plan in August 2005.
Equity in earnings of unconsolidated affiliates decreased
by $3.2 million in 2006 because of reductions of $1.3 million
related to the disposition of our ownership interest in Galileo
America in August 2005, a full year of loss of $3.3 million
incurred at Triangle Town Center, in which our ownership
interest was not acquired until November 2005, and a decrease
of $1.1 million in gains on outparcel sales at Imperial Valley
Mall as compared to the prior year. These reductions were
partially offset by increases of $2.5 million in our equity in
the earnings of our other unconsolidated affiliates.
In 2006, we recorded an income tax provision of
$5.9 million as a result of taxable income that was gener-
ated by our management company, which is a taxable
REIT subsidiary.
Discontinued operations in 2006 reflect the results of
operations of five community centers that were sold during
May 2006. Discontinued operations in 2005 are related to
five community centers located throughout Michigan that
were sold in March 2005 plus the operations of the community
centers that were sold in 2006.
Management’s Discussion and Analysis of Financial Condition and Results of Operations
30
Comparison of the Year Ended December 31, 2005
to the Year Ended December 31, 2004
The following significant transactions impacted the
consolidated results of operations for the year ended
December 31, 2005, compared to the year ended
December 31, 2004:
n From January 1, 2004 through December 31, 2005, we
acquired or opened 17 malls, two open-air centers and
five associated centers (collectively referred to as the “2005
New Properties”). The 2005 New Properties are as follows:
Date Acquired / Property Location Opened
Acquisitions:
Honey Creek Mall Terre Haute, IN March 2004
Volusia Mall Daytona Beach, FL March 2004
Greenbrier Mall Chesapeake, VA April 2004
Chapel Hill Mall Akron, OH May 2004
Chapel Hill Suburban Akron, OH May 2004
Park Plaza Mall Little Rock, AR June 2004
Monroeville Mall Monroeville, PA July 2004
Monroeville Annex Monroeville, PA July 2004
Northpark Mall Joplin, MO November 2004
Mall del Norte Laredo, TX November 2004
Laurel Park Place Livonia, MI June 2005
The Mall of Acadiana Lafayette, LA July 2005
Layton Hills Mall Layton, UT November 2005
Layton Hills Convenience Center Layton, UT November 2005
Oak Park Mall Overland Park, KS November 2005
Eastland Mall Bloomington, IL November 2005
Hickory Point Mall Forsyth, IL November 2005
Triangle Town Center (50/50 joint venture) Raleigh, NC November 2005
Triangle Town Place (50/50 joint venture) Raleigh, NC November 2005
NewDevelopments:
Coastal Grand – Myrtle Beach Myrtle Beach, SC March 2004
The Shoppes at Panama City Panama City, FL March 2004
Imperial Valley Mall El Centro, CA March 2005
Southaven Towne Center Southaven, MS October 2005
Gulf Coast Town Center – Phase I (50/50 joint venture) Ft. Myers, FL November 2005
n In January 2005, two power centers, one community center
and one community center expansion were sold to Galileo
America. Since we had a continuing involvement with
these properties through our ownership interest in Galileo
America and the agreement under which we were the
exclusive manager of the properties, the results of operations
of these properties were not reflected in discontinued
operations. Therefore, the year ended December 31, 2005,
does not include a significant amount of revenues and
expenses related to these properties, whereas the year
ended December 31, 2004 includes a full period of
revenues and expenses related to these properties.
n In August 2005, Galileo America redeemed our 8.4%
ownership interest by distributing two community centers
to us: Springdale Center in Mobile, AL, and Wilkes-Barre
Township Marketplace in Wilkes-Barre Township, PA. We
also sold our management and advisory contracts with
Galileo America to New Plan. See Note 5 to the consoli-
dated financial statements for a more thorough discussion
of these transactions.
Properties that were in operation for the entire period
during 2005 and 2004 are referred to as the “2005 Comparable
Properties” in this section.
REvENuES
The $126.3 million increase in revenues was primarily
attributable to increases of $92.2 million from the 2005
New Properties and $30.4 million from the 2005 Comparable
Properties. These increases were offset by a reduction in
revenues of $7.0 million related to the community centers
that were sold to Galileo America in January 2005.
The increase in revenues of the 2005 Comparable
Properties was driven by our ability to maintain high occupancy
levels while achieving a weighted average increase of 6.5% in
rents from both new leases and lease renewals for comparable
small shop spaces, as well as an increase in percentage rents.
The increase in management, development and leasing
fees of $10.7 million was primarily attributable to management
and leasing fees received from Galileo America prior to
the redemption of our interest in Galileo America, plus an
$8.0 million acquisition fee received from Galileo America
CBL & Associates Properties, Inc. 2006 Annual Report
31
that was related to Galileo America’s acquisition of an
approximately $1.0 billion portfolio of shopping center
properties from New Plan.
OPERAtINg ExPENSES
Property operating expenses including real estate taxes
and maintenance and repairs, increased as a result of increases
of $29.7 million from the 2005 New Properties and $1.6 million
from the 2005 Comparable Properties. This was offset by a
decrease of $2.6 million related to the community centers
that were sold to Galileo America in January 2005.
The increase in depreciation and amortization expense
resulted from increases of $28.6 million from the 2005
New Properties and $8.9 million from the 2005 Comparable
Properties. The increase attributable to the 2005 Comparable
Properties is due to ongoing capital expenditures for
renovations, expansions, tenant allowances and deferred
maintenance.
General and administrative expenses increased $3.9 million
during 2005. Severance packages for individuals affected by
the sale of our management and advisory contracts with Galileo
America contributed $1.3 million to the increase. The
remainder of the increase is related to additional salaries
and benefits for the personnel added to manage the
Properties acquired during 2005 and 2004 combined with
annual compensation increases for existing personnel. As a
percentage of revenues, general and administrative expenses
decreased to 4.3% in 2005 compared with 4.5% in 2004.
We recognized a loss on impairment of real estate assets
of $1.3 million during 2005, which was related to a $1.0 million
reduction in the carrying value of assets identified as held
for sale at December 31, 2005, and an additional loss of
$0.3 million related to the properties that were sold to Galileo
America in January 2005. The additional impairment loss of
$0.3 million was related to the adjustment of certain estimated
amounts when the actual amounts became known in 2005.
We recognized a loss on impairment of real estate assets of
$3.1 million during 2004 when we reduced the carrying value
of ten community centers to their respective estimated fair
values. The ten community centers included four community
centers that were sold to Galileo America in January 2005,
five community centers that were sold to a third party during
March 2005 and one community center that was sold for a
loss during the fourth quarter of 2004.
OthER INCOME AND ExPENSES
Interest expense increased $31.0 million primarily due
to the debt on the 2005 New Properties, the refinancings
that were completed on the 2005 Comparable Properties
and an increase in variable interest rates.
Gain on sales of real estate assets of $53.6 million in
2005 includes $44.2 million of gains related to the redemption
of our ownership interest in Galileo America, $1.0 million
from the recognition of deferred gain on properties that
were previously sold to Galileo America and $8.4 million of
gains on the sales of 11 outparcels. The gain on sales of real
estate assets of $29.3 million in 2004 included $26.8 million of
gain related to the second phase of the Galileo America joint
venture and $2.5 million of gain on sales of seven outparcels
at various properties.
The gain on sales of management contracts of
$21.6 million represents the gain on the sale of our manage-
ment and advisory contracts with Galileo America to New
Plan in August 2005.
Equity in earnings of unconsolidated affiliates decreased
by $1.8 million in 2005 as a result of the redemption of our
interest in Galileo America in August 2005. Additionally,
although Coastal Grand – Myrtle Beach and Imperial Valley
Mall opened in March 2004 and March 2005, respectively,
our equity in the earnings of these two properties was flat
compared to the prior year. This was due to the mortgage
loan that was placed on Coastal Grand – Myrtle Beach in
September 2004, which is at a fixed interest rate that is
higher than the previous variable rate loan.
Discontinued operations for 2005 represent the operations
of the six community centers we sold during 2005, the
operations of the two community centers that were classified
as held for sale as of December 31, 2005 and the operations
of three community centers that were sold in May 2006.
Discontinued operations during 2004 reflect the results of
two community centers that we sold during 2004, as well as
the results of the properties described in the previous sentence.

Management’s Discussion and Analysis of Financial Condition and Results of Operations
32
OperationalReviewThe shopping center business is, to some extent,
seasonal in nature with tenants achieving the highest levels
of sales during the fourth quarter because of the holiday
season, which results in higher percentage rent income in
the fourth quarter. Additionally, the malls earn most of their
short-term rents during the holiday period. Thus, occupancy
levels and revenue production are generally the highest in
the fourth quarter of each year. Results of operations real-
ized in any one quarter may not be indicative of the results
likely to be experienced over the course of the fiscal year.
We classify our regional malls into two categories – malls
that have completed their initial lease-up are referred to as
stabilized malls and malls that are in their initial lease-up phase
and have not been open for three calendar years are referred
to as non-stabilized malls. The non-stabilized malls currently
include Coastal Grand – Myrtle Beach in Myrtle Beach, SC,
which opened in March 2004; Imperial Valley Mall in
El Centro, CA, which opened in March 2005; Southaven
Towne Center in Southaven, MS, which opened in October
2005; and Gulf Coast Town Center (Phase I) in Ft. Myers, FL,
which opened in November 2005.
We derive a significant amount of our revenues from the
mall properties. The sources of our revenues by property type
were as follows:
Year Ended December 31,
2006 2005
Malls 92.6% 91.2 %Associated centers 3.9% 3.8 %Community centers 0.7% 0.9 %Mortgages, office building and other 2.8% 4.1 %
SAlES AND OCCuPANCy COStS
Mall store sales (for those tenants who occupy
10,000 square feet or less and have reported sales) in the
stabilized malls increased 3.3% on a comparable per square
foot basis to $341 per square foot for 2006 compared with
$330 per square foot for 2005.
Occupancy costs as a percentage of sales for the stabilized
malls were 12.1% and 11.8% for 2006 and 2005, respectively.
OCCuPANCy
Our portfolio occupancy is summarized in the
following table:
December 31,
2006 2005
Total portfolio 94.1% 94.5 %Total mall portfolio 94.4% 94.4 % Stabilized malls 94.5% 94.7 % Non-stabilized malls 91.7% 89.4 %Associated centers 93.6% 94.1 %Community centers 85.6% 95.3 %
The store closures and bankruptcies that occurred during
the first quarter of 2006 continued to negatively impact
occupancy as of December 31, 2006.
lEASINg
Average annual base rents per square foot were as follows
for each property type:
December 31,
2006 2005
Stabilized malls $ 27.18 $ 26.87Non-stabilized malls 26.83 27.41Associated centers 11.32 10.55Community centers 14.21 9.61Other 19.48 19.33

CBL & Associates Properties, Inc. 2006 Annual Report
33
During 2006, we achieved positive results from new and renewal leasing of comparable small shop space for spaces
that were previously occupied as summarized in the following table:
NewInitial NewAverage PriorBase BaseRent %Change BaseRent %ChangePropertyType SquareFeet RentPSF PSF Initial PSF Average
All Property Types (1) 2,562,207 $ 25.62 $ 27.01 5.4% $ 27.81 8.5%Stabilized Malls 2,449,420 26.09 27.53 5.5% 28.35 8.7% New leases 965,563 25.90 29.70 14.7% 31.22 20.5% Renewal leases 1,483,857 26.22 26.11 (0.4)% 26.49 1.0%
(1)Includesstabilizedmalls,associatedcenters,communitycentersandother.
LiquidityandCapitalResourcesThere was $28.7 million of unrestricted cash and cash
equivalents as of December 31, 2006, a decrease of $0.1 million
from December 31, 2005. Cash flows from operations are
used to fund short-term liquidity and capital needs such as
tenant construction allowances, capital expenditures and
payments of dividends and distributions. For longer-term
liquidity needs such as acquisitions, new developments,
renovations and expansions, we typically rely on property-
specific mortgages (which are generally non-recourse),
construction and term loans, revolving lines of credit, common
stock, preferred stock, joint venture investments and a minority
interest in the Operating Partnership.
Cash provided by operating activities decreased
$7.2 million to $388.9 million for the year ended December 31,
2006. The decrease was primarily attributable to a combination
of an increase in tenant and other accounts receivable and a
reduction of our accounts payable and accrued liabilities as
compared to the corresponding amounts at December 31,
2005. Additionally, 2005 included $9.0 million of fee income
related to the Galileo America transaction. These decreases
were offset by an increase in cash from operations generated
by the 2006 New Properties.
DEBt
During 2006, we borrowed $1.0 billion under mortgage
and other notes payable and paid $776.0 million to reduce
outstanding borrowings. We paid $0.6 million prepayment fees
in connection with the extinguishment of certain mortgage
notes payable during 2006 and paid $5.6 million in financing
costs in connection with the new borrowings.
Management’s Discussion and Analysis of Financial Condition and Results of Operations
34
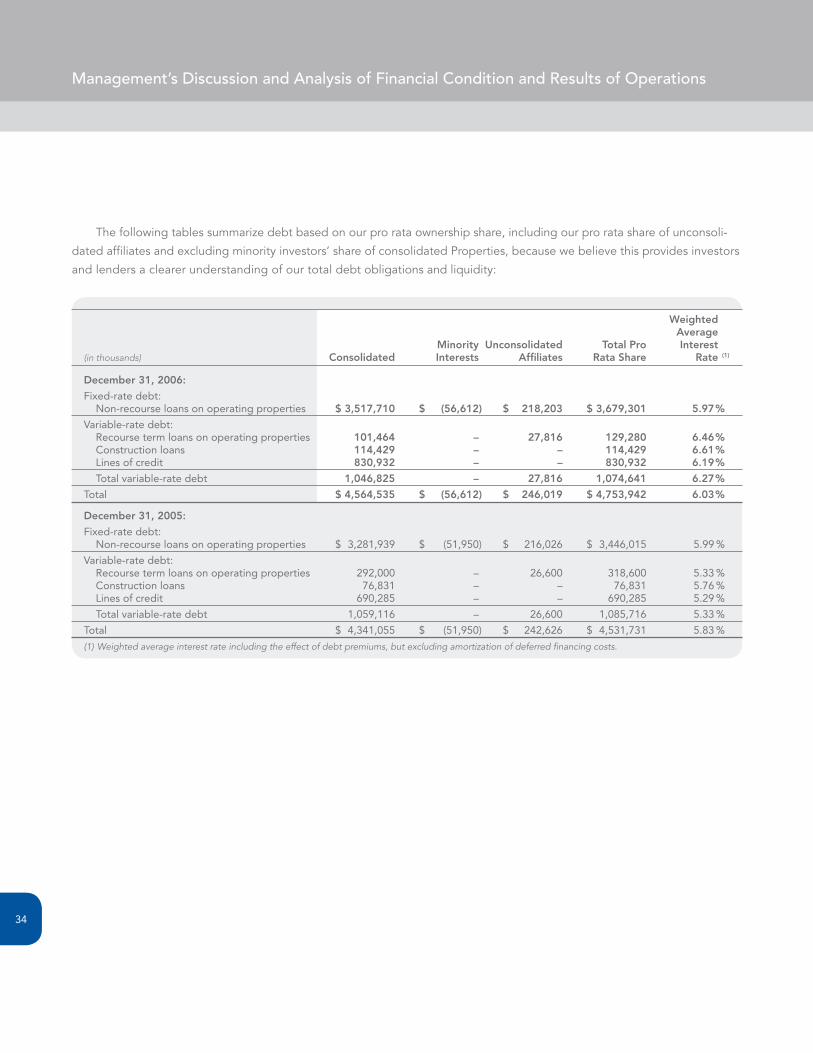
The following tables summarize debt based on our pro rata ownership share, including our pro rata share of unconsoli-
dated affiliates and excluding minority investors’ share of consolidated Properties, because we believe this provides investors
and lenders a clearer understanding of our total debt obligations and liquidity:
Weighted Average Minority Unconsolidated TotalPro Interest(in thousands) Consolidated Interests Affiliates RataShare Rate(1)
December31,2006:
Fixed-rate debt: Non-recourse loans on operating properties $3,517,710 $ (56,612) $ 218,203 $3,679,301 5.97%
Variable-rate debt: Recourse term loans on operating properties 101,464 – 27,816 129,280 6.46% Construction loans 114,429 – – 114,429 6.61% Lines of credit 830,932 – – 830,932 6.19%
Total variable-rate debt 1,046,825 – 27,816 1,074,641 6.27%
Total $4,564,535 $ (56,612) $ 246,019 $4,753,942 6.03%
December31,2005:
Fixed-rate debt: Non-recourse loans on operating properties $ 3,281,939 $ (51,950) $ 216,026 $ 3,446,015 5.99 %
Variable-rate debt: Recourse term loans on operating properties 292,000 – 26,600 318,600 5.33 % Construction loans 76,831 – – 76,831 5.76 % Lines of credit 690,285 – – 690,285 5.29 %
Total variable-rate debt 1,059,116 – 26,600 1,085,716 5.33 %
Total $ 4,341,055 $ (51,950) $ 242,626 $ 4,531,731 5.83 %
(1)Weightedaverageinterestrateincludingtheeffectofdebtpremiums,butexcludingamortizationofdeferredfinancingcosts.

CBL & Associates Properties, Inc. 2006 Annual Report
35
The secured and unsecured credit facilities contain,
among other restrictions, certain financial covenants including
the maintenance of certain coverage ratios, minimum net
worth requirements and limitations on cash flow distributions.
We were in compliance with all financial covenants and
restrictions under our credit facilities at December 31, 2006.
Additionally, certain property-specific mortgage notes payable
require the maintenance of debt service coverage ratios
on their respective properties. At December 31, 2006, the
properties subject to these mortgage notes payable were in
compliance with the applicable ratios.
In February 2006, we amended one of the secured
credit facilities to increase the maximum availability from
$373.0 million to $476.0 million, extend the maturity date
from February 26, 2006 to February 26, 2009 plus a one-year
extension option, increase the minimum tangible net worth
requirement, as defined, from $1.0 billion to $1.37 billion
and increase the limit on the maximum availability that we
may request from $500.0 million to $650.0 million. In August
2006, we amended this secured credit facility to reduce the
interest rate from London InterBank Offered Rate (“LIBOR”)
plus 0.90% to LIBOR plus 0.80% and to amend certain financial
covenants to provide us with enhanced borrowing flexibility.
In June 2006, we amended our $100.0 million secured
credit facility to change the maturity date from June 1, 2007
to June 1, 2008 and to substitute certain collateral under
the facility.
In July 2006, we obtained four separate ten-year,
non-recourse loans totaling $317.0 million that bear interest
at fixed rates ranging from 5.86% to 6.10%, with a weighted
average of 5.96%. The proceeds were used to retire
$249.8 million of mortgage notes payable that were
scheduled to mature during the next 12 months and to pay
outstanding balances on our credit facilities. The mortgage
notes payable that were retired consisted of three variable-
rate term loans totaling $189.2 million and one fixed-rate
loan of $60.6 million. We recorded a loss on extinguishment
of debt of $0.9 million related to prepayment fees and the
write-off of unamortized deferred financing costs associated
with the loans that were retired.
In August 2006, we amended one of our secured credit
facilities to increase the availability from $10.0 million to the
greater of $17.2 million or the borrowing base (as defined),
to reduce the interest rate from LIBOR plus 1.00% to LIBOR
plus 0.80%, to extend the maturity date from April 1, 2007
to April 1, 2008 and to amend certain financial covenants to
provide us with enhanced borrowing flexibility.
In August 2006, we amended our unsecured credit facility
with Wells Fargo Bank to increase the availability from
$500.0 million to $560.0 million, extend the maturity date
from August 27, 2006 to August 27, 2008 plus three one-year
extension options, amend certain financial covenants to
provide us with enhanced borrowing flexibility, increase the
limit on the maximum availability that we may request from
$600.0 million to $700.0 million and add a letter of credit
feature to the credit facility. The credit facility bears interest
at the LIBOR plus a margin of 0.75% to 1.20% based on our
leverage, as defined in the agreement. At December 31, 2006,
the outstanding borrowings of $330.0 million under the
unsecured credit facility had a weighted average interest rate
of 6.25%. Additionally, we pay an annual fee of 0.1% of the
amount of total availability under the unsecured credit facility.
We expect to refinance the majority of mortgage
and other notes payable maturing over the next year with
replacement loans. Based on our pro rata share of total
debt, there is $91.8 million of debt that is scheduled to
mature in 2007, which we expect to repay or refinance.
Management’s Discussion and Analysis of Financial Condition and Results of Operations
36
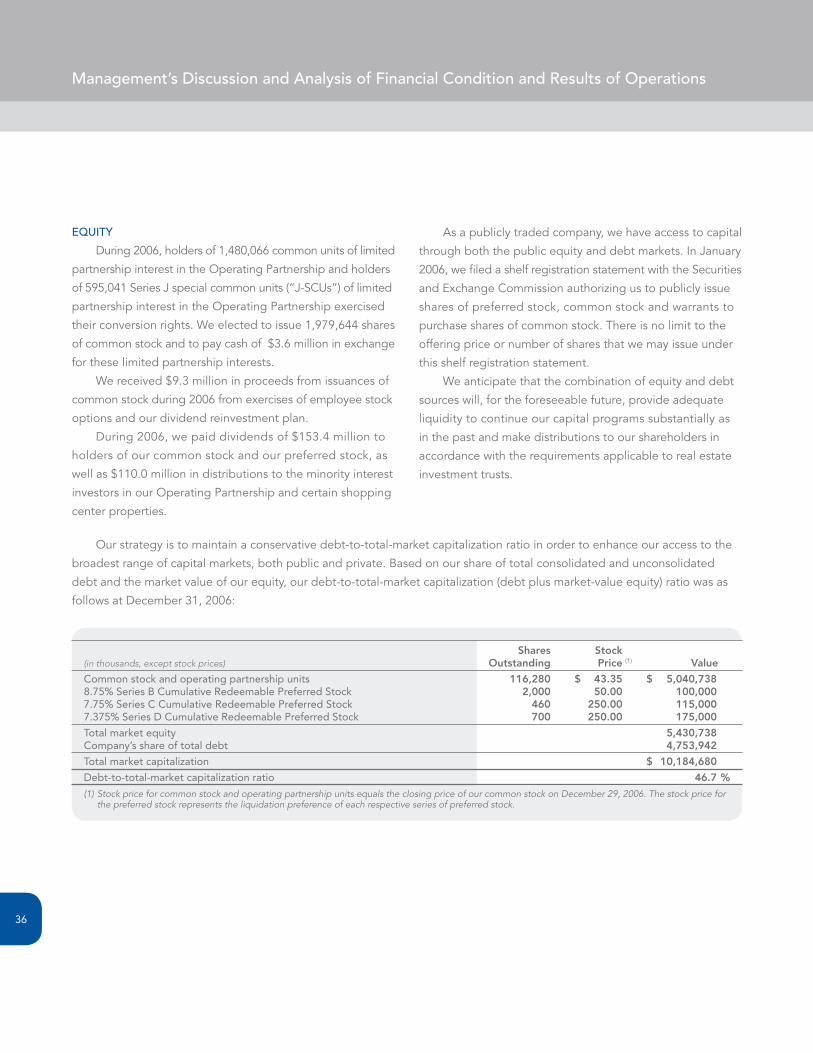
Our strategy is to maintain a conservative debt-to-total-market capitalization ratio in order to enhance our access to the
broadest range of capital markets, both public and private. Based on our share of total consolidated and unconsolidated
debt and the market value of our equity, our debt-to-total-market capitalization (debt plus market-value equity) ratio was as
follows at December 31, 2006:
Shares Stock(in thousands, except stock prices) Outstanding Price(1) Value
Common stock and operating partnership units 116,280 $ 43.35 $ 5,040,7388.75% Series B Cumulative Redeemable Preferred Stock 2,000 50.00 100,0007.75% Series C Cumulative Redeemable Preferred Stock 460 250.00 115,0007.375% Series D Cumulative Redeemable Preferred Stock 700 250.00 175,000
Total market equity 5,430,738Company’s share of total debt 4,753,942
Total market capitalization $ 10,184,680
Debt-to-total-market capitalization ratio 46.7%
(1)StockpriceforcommonstockandoperatingpartnershipunitsequalstheclosingpriceofourcommonstockonDecember29,2006.Thestockpriceforthepreferredstockrepresentstheliquidationpreferenceofeachrespectiveseriesofpreferredstock.
EquIty
During 2006, holders of 1,480,066 common units of limited
partnership interest in the Operating Partnership and holders
of 595,041 Series J special common units (“J-SCUs”) of limited
partnership interest in the Operating Partnership exercised
their conversion rights. We elected to issue 1,979,644 shares
of common stock and to pay cash of $3.6 million in exchange
for these limited partnership interests.
We received $9.3 million in proceeds from issuances of
common stock during 2006 from exercises of employee stock
options and our dividend reinvestment plan.
During 2006, we paid dividends of $153.4 million to
holders of our common stock and our preferred stock, as
well as $110.0 million in distributions to the minority interest
investors in our Operating Partnership and certain shopping
center properties.
As a publicly traded company, we have access to capital
through both the public equity and debt markets. In January
2006, we filed a shelf registration statement with the Securities
and Exchange Commission authorizing us to publicly issue
shares of preferred stock, common stock and warrants to
purchase shares of common stock. There is no limit to the
offering price or number of shares that we may issue under
this shelf registration statement.
We anticipate that the combination of equity and debt
sources will, for the foreseeable future, provide adequate
liquidity to continue our capital programs substantially as
in the past and make distributions to our shareholders in
accordance with the requirements applicable to real estate
investment trusts.
CBL & Associates Properties, Inc. 2006 Annual Report
37
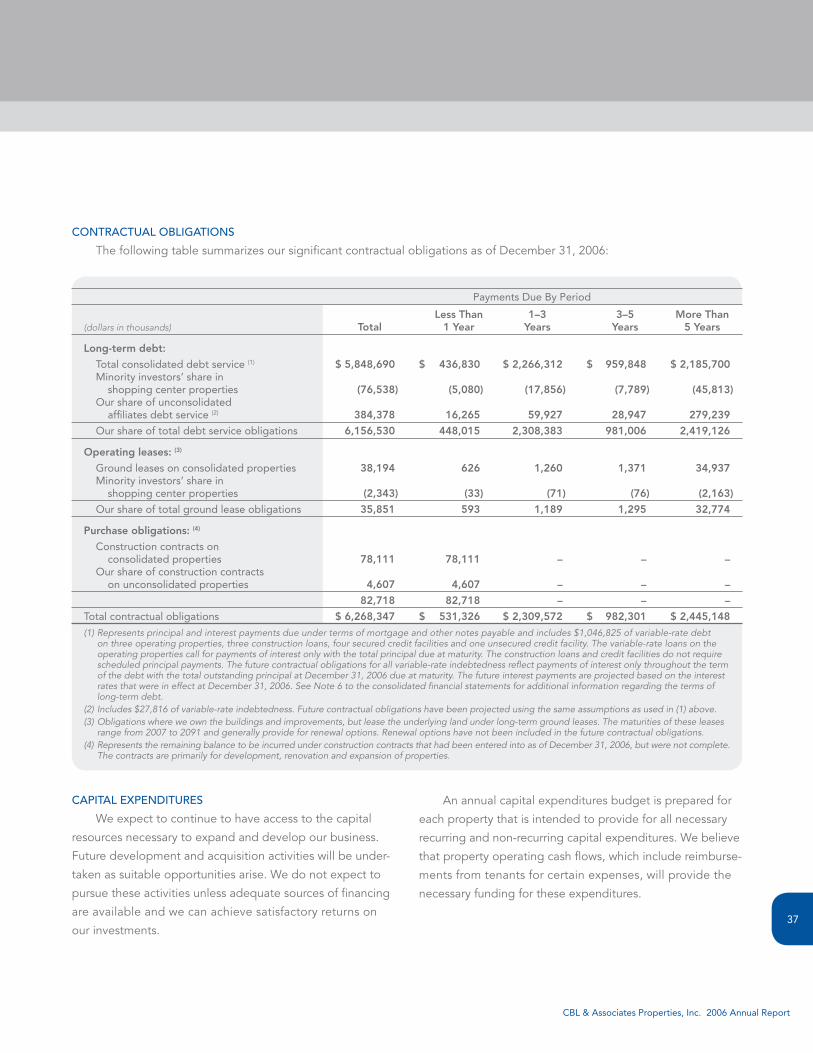
CONtRACtuAl OBlIgAtIONS
The following table summarizes our significant contractual obligations as of December 31, 2006:
Payments Due By Period
LessThan 1–3 3–5 MoreThan(dollars in thousands) Total 1Year Years Years 5Years
Long-termdebt:
Total consolidated debt service (1) $5,848,690 $ 436,830 $2,266,312 $ 959,848 $2,185,700 Minority investors’ share in shopping center properties (76,538) (5,080) (17,856) (7,789) (45,813) Our share of unconsolidated affiliates debt service (2) 384,378 16,265 59,927 28,947 279,239
Our share of total debt service obligations 6,156,530 448,015 2,308,383 981,006 2,419,126
Operatingleases: (3)
Ground leases on consolidated properties 38,194 626 1,260 1,371 34,937 Minority investors’ share in shopping center properties (2,343) (33) (71) (76) (2,163)
Our share of total ground lease obligations 35,851 593 1,189 1,295 32,774
Purchaseobligations: (4)
Construction contracts on consolidated properties 78,111 78,111 – – – Our share of construction contracts on unconsolidated properties 4,607 4,607 – – –
82,718 82,718 – – –
Total contractual obligations $6,268,347 $ 531,326 $2,309,572 $ 982,301 $2,445,148
(1)Representsprincipalandinterestpaymentsdueundertermsofmortgageandothernotespayableandincludes$1,046,825ofvariable-ratedebtonthreeoperatingproperties,threeconstructionloans,foursecuredcreditfacilitiesandoneunsecuredcreditfacility.Thevariable-rateloansontheoperatingpropertiescallforpaymentsofinterestonlywiththetotalprincipaldueatmaturity.Theconstructionloansandcreditfacilitiesdonotrequirescheduledprincipalpayments.Thefuturecontractualobligationsforallvariable-rateindebtednessreflectpaymentsofinterestonlythroughoutthetermofthedebtwiththetotaloutstandingprincipalatDecember31,2006dueatmaturity.ThefutureinterestpaymentsareprojectedbasedontheinterestratesthatwereineffectatDecember31,2006.SeeNote6totheconsolidatedfinancialstatementsforadditionalinformationregardingthetermsoflong-termdebt.
(2)Includes$27,816ofvariable-rateindebtedness.Futurecontractualobligationshavebeenprojectedusingthesameassumptionsasusedin(1)above.(3)Obligationswhereweownthebuildingsandimprovements,butleasetheunderlyinglandunderlong-termgroundleases.Thematuritiesoftheseleases
rangefrom2007to2091andgenerallyprovideforrenewaloptions.Renewaloptionshavenotbeenincludedinthefuturecontractualobligations.(4) RepresentstheremainingbalancetobeincurredunderconstructioncontractsthathadbeenenteredintoasofDecember31,2006,butwerenotcomplete.
Thecontractsareprimarilyfordevelopment,renovationandexpansionofproperties.
CAPItAl ExPENDItuRES
We expect to continue to have access to the capital
resources necessary to expand and develop our business.
Future development and acquisition activities will be under-
taken as suitable opportunities arise. We do not expect to
pursue these activities unless adequate sources of financing
are available and we can achieve satisfactory returns on
our investments.
An annual capital expenditures budget is prepared for
each property that is intended to provide for all necessary
recurring and non-recurring capital expenditures. We believe
that property operating cash flows, which include reimburse-
ments from tenants for certain expenses, will provide the
necessary funding for these expenditures.
Management’s Discussion and Analysis of Financial Condition and Results of Operations
38
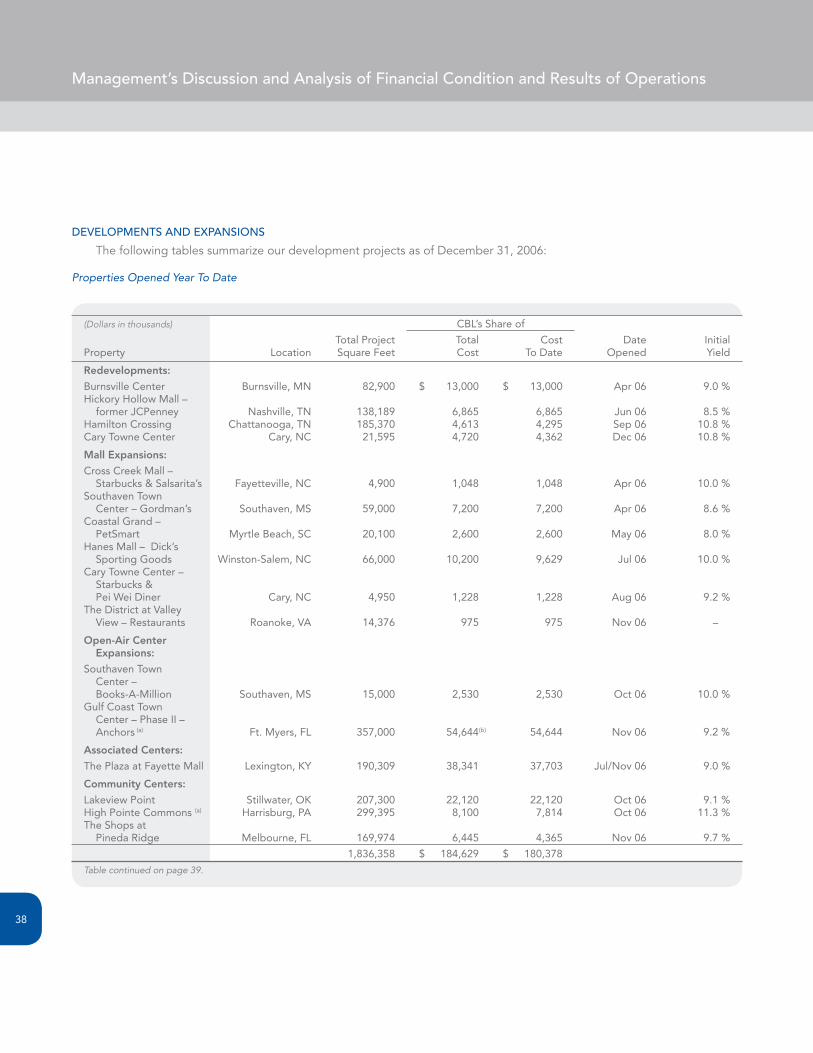
DEvElOPMENtS AND ExPANSIONS
The following tables summarize our development projects as of December 31, 2006:
Properties Opened Year To Date
(Dollars in thousands) CBL’s Share of
Total Project Total Cost Date Initial Property Location Square Feet Cost To Date Opened Yield
Redevelopments:
Burnsville Center Burnsville, MN 82,900 $ 13,000 $ 13,000 Apr 06 9.0 %Hickory Hollow Mall – former JCPenney Nashville, TN 138,189 6,865 6,865 Jun 06 8.5 %Hamilton Crossing Chattanooga, TN 185,370 4,613 4,295 Sep 06 10.8 %Cary Towne Center Cary, NC 21,595 4,720 4,362 Dec 06 10.8 %
MallExpansions:
Cross Creek Mall – Starbucks & Salsarita’s Fayetteville, NC 4,900 1,048 1,048 Apr 06 10.0 %Southaven Town Center – Gordman’s Southaven, MS 59,000 7,200 7,200 Apr 06 8.6 %Coastal Grand – PetSmart Myrtle Beach, SC 20,100 2,600 2,600 May 06 8.0 %Hanes Mall – Dick’s Sporting Goods Winston-Salem, NC 66,000 10,200 9,629 Jul 06 10.0 %Cary Towne Center – Starbucks & Pei Wei Diner Cary, NC 4,950 1,228 1,228 Aug 06 9.2 %The District at Valley View – Restaurants Roanoke, VA 14,376 975 975 Nov 06 –
Open-AirCenter Expansions:
Southaven Town Center – Books-A-Million Southaven, MS 15,000 2,530 2,530 Oct 06 10.0 %Gulf Coast Town Center – Phase II – Anchors (a) Ft. Myers, FL 357,000 54,644 (b) 54,644 Nov 06
AssociatedCenters:
The Plaza at Fayette Mall Lexington, KY 190,309 38,341 37,703 Jul/Nov 06 9.0 %
CommunityCenters:
Lakeview Point Stillwater, OK 207,300 22,120 22,120 Oct 06 9.1 %High Pointe Commons (a) Harrisburg, PA 299,395 8,100 7,814 Oct 06 11.3 %The Shops at Pineda Ridge Melbourne, FL 169,974 6,445 4,365 Nov 06 9.7 %
1,836,358 $ 184,629 $ 180,378
Tablecontinuedonpage39.
9.2 %
CBL & Associates Properties, Inc. 2006 Annual Report
39
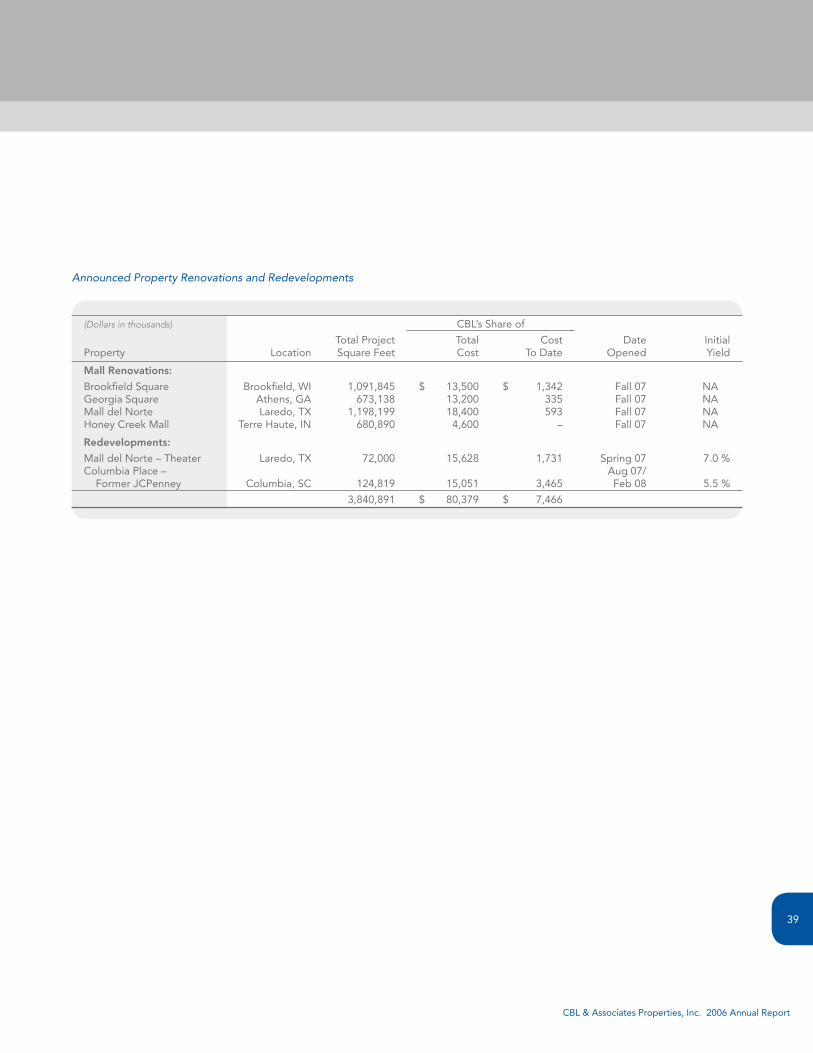
Announced Property Renovations and Redevelopments
(Dollars in thousands) CBL’s Share of
Total Project Total Cost Date Initial Property Location Square Feet Cost To Date Opened Yield
MallRenovations:
Brookfield Square Brookfield, WI 1,091,845 $ 13,500 $ 1,342 Fall 07 NAGeorgia Square Athens, GA 673,138 13,200 335 Fall 07 NAMall del Norte Laredo, TX 1,198,199 18,400 593 Fall 07 NAHoney Creek Mall Terre Haute, IN 680,890 4,600 – Fall 07 NA
Redevelopments:
Mall del Norte – Theater Laredo, TX 72,000 15,628 1,731 Spring 07 7.0 %Columbia Place – Aug 07/ Former JCPenney Columbia, SC 124,819 15,051 3,465 Feb 08 5.5 %
3,840,891 $ 80,379 $ 7,466
Management’s Discussion and Analysis of Financial Condition and Results of Operations
40
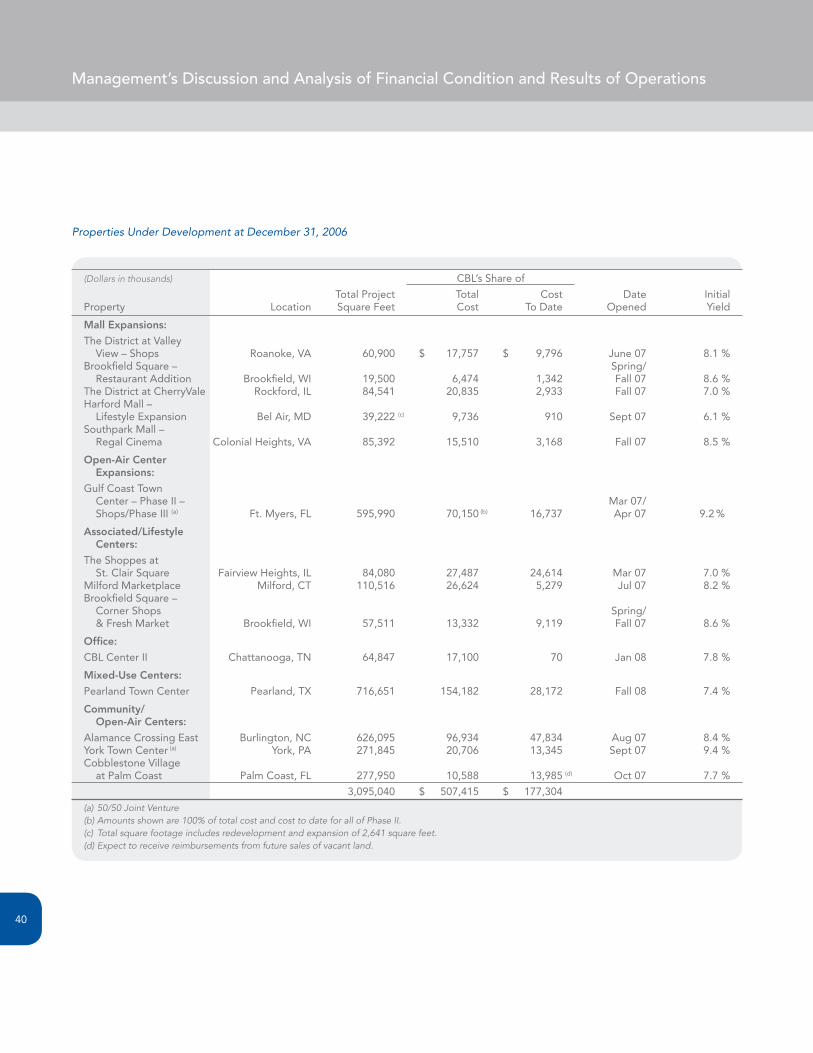
Properties Under Development at December 31, 2006
(Dollars in thousands) CBL’s Share of
Total Project Total Cost Date Initial Property Location Square Feet Cost To Date Opened Yield
MallExpansions:
The District at Valley View – Shops Roanoke, VA 60,900 $ 17,757 $ 9,796 June 07 8.1 %Brookfield Square – Spring/ Restaurant Addition Brookfield, WI 19,500 6,474 1,342 Fall 07 8.6 %The District at CherryVale Rockford, IL 84,541 20,835 2,933 Fall 07 7.0 %Harford Mall – Lifestyle Expansion Bel Air, MD 39,222 (c) 9,736 910 Sept 07 6.1 %Southpark Mall – Regal Cinema Colonial Heights, VA 85,392 15,510 3,168 Fall 07 8.5 %
Open-AirCenter Expansions:
Gulf Coast Town Center – Phase II – Mar 07/ Shops/Phase III (a) Ft. Myers, FL 595,990 70,150 (b) 16,737 Apr 07 9.2 %
Associated/Lifestyle Centers:
The Shoppes at St. Clair Square Fairview Heights, IL 84,080 27,487 24,614 Mar 07 7.0 %Milford Marketplace Milford, CT 110,516 26,624 5,279 Jul 07 8.2 %Brookfield Square – Corner Shops Spring/ & Fresh Market Brookfield, WI 57,511 13,332 9,119 Fall 07 8.6 %
Office:
CBL Center II Chattanooga, TN 64,847 17,100 70 Jan 08 7.8 %
Mixed-UseCenters:
Pearland Town Center Pearland, TX 716,651 154,182 28,172 Fall 08 7.4 %
Community/ Open-AirCenters:
Alamance Crossing East Burlington, NC 626,095 96,934 47,834 Aug 07 8.4 %York Town Center (a) York, PA 271,845 20,706 13,345 Sept 07 9.4 %Cobblestone Village at Palm Coast Palm Coast, FL 277,950 10,588 13,985 (d) Oct 07 7.7 %
3,095,040 $ 507,415 $ 177,304
(a)50/50JointVenture(b)Amountsshownare100%oftotalcostandcosttodateforallofPhaseII.(c) Totalsquarefootageincludesredevelopmentandexpansionof2,641squarefeet.(d)Expecttoreceivereimbursementsfromfuturesalesofvacantland.

CBL & Associates Properties, Inc. 2006 Annual Report
41
There are construction loans in place for the development
costs of Alamance Crossing, Gulf Coast Town Center, The
Shoppes at St. Clair and York Town Center. We expect to
obtain a construction loan for Milford Marketplace during the
first quarter of 2007. The remaining development costs will
be funded with operating cash flows and the credit facilities.
We have entered into a number of option agreements
for the development of future regional malls and community
centers. Except for the projects listed in the above table, we
do not have any other material capital commitments.
DISPOSItIONS
We received a total of $127.1 million in net cash proceeds
from the sales of real estate assets during 2006. We also
received cash proceeds of $2.5 million from the sale of
equity securities that had been classified as available for
sale, which resulted in a gain of $1.1 million.
OthER CAPItAl ExPENDItuRES
Including our share of unconsolidated affiliates’ capital
expenditures, we spent $48.3 million in 2006 for tenant
allowances, which generate increased rents from tenants
over the terms of their leases. Deferred maintenance
expenditures were $38.3 million for 2006 and included
$16.4 million for resurfacing and improved lighting of parking
lots, $12.4 million for roof repairs and replacements and
$9.5 million for various other expenditures. Renovation
expenditures were $62.3 million in 2006.
Deferred maintenance expenditures are billed to tenants
as common area maintenance expense, and most are recov-
ered over a 5- to 15-year period. Renovation expenditures
are primarily for remodeling and upgrades of malls, of
which approximately 30% is recovered from tenants over a
5- to 15-year period.
We expect to renovate four malls for a total estimated
cost of $47.9 million and to redevelop space at two additional
malls during 2007 at a total estimated cost of $30.7 million,
which will be funded from operating cash flows and availability
under our credit facilities.
Off-BalanceSheetArrangements
uNCONSOlIDAtED AFFIlIAtES
We have ownership interests in 14 unconsolidated affiliates
that are described in Note 5 to the consolidated financial
statements. The unconsolidated affiliates are accounted
for using the equity method of accounting and are reflected
in the consolidated balance sheets as “Investments in
Unconsolidated Affiliates.” The following are circumstances
when we may consider entering into a joint venture with
a third party:
n Third parties may approach us with opportunities
where they have obtained land and performed some
pre-development activities, but they may not have sufficient
access to the capital resources or the development and
leasing expertise to bring the project to fruition. We enter
into such arrangements when we determine such a proj-
ect is viable and we can achieve a satisfactory return on
our investment. We typically earn development fees from
the joint venture and provide management and leasing
services to the property for a fee once the property is
placed in operation.
n We determine that we may have the opportunity to capitalize
on the value we have created in a property by selling an
interest in the property to a third party. This provides us
with an additional source of capital that can be used to
develop or acquire additional real estate assets that we
believe will provide greater potential for growth. When
we retain an interest in an asset rather than selling a 100%
interest, it is typically because this allows us to continue to
manage the property, which provides us the ability to earn
fees for management, leasing, development, financing
and acquisition services provided to the joint venture.
Management’s Discussion and Analysis of Financial Condition and Results of Operations
42
guARANtEES
We may issue guarantees on the debt of a joint venture
primarily because it allows the joint venture to obtain funding
at a lower cost than could be obtained otherwise. This results
in a higher return for the joint venture on its investment, and
in a higher return on our investment in the joint venture. We
may receive a fee from the joint venture for providing the
guaranty. Additionally, when we issue a guaranty, the terms
of the joint venture agreement typically provide that we may
receive indemnification from the joint venture.
As of December 31, 2006, we have guaranteed 50% of
the debt of Parkway Place L.P. The total amount outstanding
at December 31, 2006, was $53.2 million, of which we have
guaranteed $26.6 million. The guaranty will expire when the
related debt matures in June 2008. We have not recorded
an obligation for this guaranty because we determined that
the fair value of the guaranty is not material.
We have guaranteed the performance of York Town
Center, LP (“YTC”), an unconsolidated affiliate in which we
own a 50% interest, under the terms of an agreement with
a third party that will own property adjacent to the shopping
center property YTC is currently developing. Under the terms
of that agreement, YTC is obligated to cause performance
of the third party’s obligations as landlord under its lease
with its sole tenant, including, but not limited to, provisions
such as co-tenancy and exclusivity requirements. Should YTC
fail to cause performance, then the tenant under the third
party landlord’s lease may pursue certain remedies ranging
from rights to terminate its lease to receiving reductions in
rent. We have guaranteed YTC’s performance under this
agreement up to a maximum of $22.0 million, which decreases
by $0.8 million annually until the guaranteed amount is
reduced to $10.0 million. We entered into an agreement with
our joint venture partner under which our partner has agreed
to reimburse us 50% of any amounts we are obligated to fund
under the guaranty. We have not recorded an obligation for
this guaranty because we determined that the fair value of the
guaranty is not material.
Our guarantees and the related accounting are more fully
described in Note 16 to the consolidated financial statements.
CriticalAccountingPoliciesOur significant accounting policies are disclosed in
Note 2 to the consolidated financial statements. The following
discussion describes our most critical accounting policies,
which are those that are both important to the presentation
of our financial condition and results of operations and that
require significant judgment or use of complex estimates.
REvENuE RECOgNItION
Minimum rental revenue from operating leases is
recognized on a straight-line basis over the initial terms
of the related leases. Certain tenants are required to pay
percentage rent if their sales volumes exceed thresholds
specified in their lease agreements. Percentage rent is
recognized as revenue when the thresholds are achieved
and the amounts become determinable.
We receive reimbursements from tenants for real estate
taxes, insurance, common area maintenance and other
recoverable operating expenses as provided in the lease
agreements. Tenant reimbursements are recognized as
revenue in the period the related operating expenses are
incurred. Tenant reimbursements related to certain capital
expenditures are billed to tenants over periods of 5 to 15 years
and are recognized as revenue when billed.
We receive management, leasing and development fees
from third parties and unconsolidated affiliates. Management
fees are charged as a percentage of revenues (as defined in the
management agreement) and are recognized as revenue when
earned. Development fees are recognized as revenue on a
pro rata basis over the development period. Leasing fees are
charged for newly executed leases and lease renewals and
are recognized as revenue when earned. Development
and leasing fees received from unconsolidated affiliates during
the development period are recognized as revenue to the
extent of the third-party partners’ ownership interest. Fees
to the extent of our ownership interest are recorded as a
reduction to our investment in the unconsolidated affiliate.
Gains on sales of real estate assets are recognized when
it is determined that the sale has been consummated, the
buyer’s initial and continuing investment is adequate, our
receivable, if any, is not subject to future subordination and
CBL & Associates Properties, Inc. 2006 Annual Report
43
the buyer has assumed the usual risks and rewards of ownership
of the asset. When we have an ownership interest in the buyer,
gain is recognized to the extent of the third-party partner’s
ownership interest and the portion of the gain attributable
to our ownership interest is deferred.
REAl EStAtE ASSEtS
We capitalize predevelopment project costs paid to
third parties. All previously capitalized predevelopment
costs are expensed when it is no longer probable that the
project will be completed. Once development of a project
commences, all direct costs incurred to construct the project,
including interest and real estate taxes, are capitalized.
Additionally, certain general and administrative expenses are
allocated to the projects and capitalized based on the amount
of time applicable personnel work on the development project.
Ordinary repairs and maintenance are expensed as incurred.
Major replacements and improvements are capitalized and
depreciated over their estimated useful lives.
All acquired real estate assets are accounted for using
the purchase method of accounting and accordingly, the
results of operations are included in the consolidated state-
ments of operations from the respective dates of acquisition.
The purchase price is allocated to (i) tangible assets, consisting
of land, buildings and improvements, as if vacant, and tenant
improvements and (ii) identifiable intangible assets and
liabilities generally consisting of above- and below-market
leases and in-place leases. We use estimates of fair value
based on estimated cash flows, using appropriate discount
rates, and other valuation methods to allocate the purchase
price to the acquired tangible and intangible assets. Liabilities
assumed generally consist of mortgage debt on the real
estate assets acquired. Assumed debt with a stated interest
rate that is significantly different from market interest rates is
recorded at its fair value based on estimated market interest
rates at the date of acquisition.
Depreciation is computed on a straight-line basis over
estimated lives of 40 years for buildings, 10 to 20 years for
certain improvements and 7 to 10 years for equipment and
fixtures. Tenant improvements are capitalized and depreciated
on a straight-line basis over the term of the related lease.
Lease-related intangibles from acquisitions of real estate
assets are amortized over the remaining terms of the related
leases. The amortization of above- and below-market leases
is recorded as an adjustment to minimum rental revenue,
while the amortization of all other lease-related intangibles
is recorded as amortization expense. Any difference between
the face value of the debt assumed and its fair value is
amortized to interest expense over the remaining term of the
debt using the effective interest method.
CARRyINg vAluE OF lONg-lIvED ASSEtS
We periodically evaluate long-lived assets to determine
if there has been any impairment in their carrying values and
record impairment losses if the undiscounted cash flows
estimated to be generated by those assets are less than their
carrying amounts or if there are other indicators of impairment.
If it is determined that an impairment has occurred, the excess
of the asset’s carrying value over its estimated fair value is
charged to operations. We recorded losses on the impairment
of real estate assets of $0.5 million, $1.3 million and $3.1 million
in 2006, 2005 and 2004, respectively, which are discussed in
Note 2 to the consolidated financial statements.
RecentAccountingPronouncementsIn June 2005, the Financial Accounting Standards Board
(“FASB”) issued Emerging Issues Task Force (“EITF”) Issue
No. 04-5, Determining Whether a General Partner, or the
General Partners as a Group, Controls a Limited Partnership
or Similar Entity When the Limited Partners Have Certain
Rights. EITF Issue No. 04-5 provides a framework for deter-
mining whether a general partner controls, and should
consolidate, a limited partnership or a similar entity. EITF
Issue No. 04-5 was effective after June 29, 2005, for all
newly formed limited partnerships and for any pre-existing
limited partnerships that modify their partnership agreements
after that date. General partners of all other limited partnerships
were required to apply the consensus no later than the
beginning of the first reporting period in fiscal years beginning
after December 15, 2005. The adoption of EITF Issue No. 04-5
did not result in any changes to the manner in which we
account for our joint ventures.
Management’s Discussion and Analysis of Financial Condition and Results of Operations
44
In June 2005, the FASB issued FSP 78-9-1, Interaction of
AICPA Statement of Position 78-9 and EITF Issue No. 04-5.
The EITF acknowledged that the consensus in EITF Issue
No. 04-5 conflicts with certain aspects of Statement of Position
(“SOP”) 78-9, Accounting for Investments in Real Estate
Ventures. The EITF agreed that the assessment of whether a
general partner, or the general partners as a group, controls
a limited partnership should be consistent for all limited
partnerships, irrespective of the industry within which the
limited partnership operates. Accordingly, the guidance in
SOP 78-9 was amended in FSP 78-9-1 to be consistent with the
guidance in EITF Issue No. 04-5. The effective dates for this FSP
are the same as those mentioned above in EITF Issue No. 04-5.
The adoption of FSP 78-9-1 did not result in any changes to
the manner in which we account for our joint ventures.
On July 13, 2006, the FASB issued Interpretation No. 48,
Accounting for Uncertainty in Income Taxes (“FIN 48”), which
is effective for fiscal years beginning after December 15, 2006.
FIN 48 clarifies the accounting for uncertainty in income taxes
recognized in the financial statements in accordance with
FASB Statement of Financial Accounting Standards (“SFAS”)
No.109, Accounting for Income Taxes, by prescribing the
minimum recognition threshold a tax position is required to
meet before being recognized in the financial statements.
FIN 48 also provides guidance on derecognition, measure-
ment, classification, interest and penalties, accounting in
interim periods, disclosure and transition. We are currently
evaluating the impact that the adoption of FIN 48 will have
on our consolidated financial statements.
In September 2006, the FASB issued SFAS No. 157,
Fair Value Measurements. SFAS No. 157 defines fair value,
establishes a framework for measuring fair value under generally
accepted accounting principles, and expands disclosures
about fair value measurements. SFAS No. 157 is effective for
financial statements issued for fiscal years beginning after
November 15, 2007, and interim periods within those fiscal
years. The transition adjustment, which is measured as the
difference between the carrying amount and the fair value
of those financial instruments at the date SFAS No. 157 is
initially applied, should be recognized as a cumulative effect
adjustment to the opening balance of retained earnings for
the fiscal year in which SFAS No. 157 is initially applied. We
will adopt the provisions of SFAS No. 157 on January 1, 2008.
The adoption of SFAS No. 157 is not expected to have a
material impact on our consolidated financial statements.
In September 2006, the Securities and Exchange
Commission’s staff issued Staff Accounting Bulletin (“SAB”)
No. 108, Considering the Effects of Prior Year Misstatements
When Quantifying Misstatements in Current Year Financial
Statements. SAB No. 108 requires companies to evaluate the
materiality of identified unadjusted errors on each financial
statement and related financial statement disclosure using
both the rollover approach and the iron curtain approach, as
those terms are defined in SAB No. 108. The rollover approach
quantifies misstatements based on the amount of the error in
the current year financial statement, whereas the iron curtain
approach quantifies misstatements based on the effects of
correcting the misstatement existing in the balance sheet at
the end of the current year, irrespective of the misstatement’s
year(s) of origin. Financial statements would require adjustment
when either approach results in quantifying a misstatement that
is material. Correcting prior year financial statements for
immaterial errors would not require previously filed reports
to be amended. If a Company determines that an adjustment
to prior year financial statements is required upon adoption
of SAB No. 108 and does not elect to restate its previous
financial statements, then it must recognize the cumulative
effect of applying SAB No. 108 in fiscal 2006 beginning
balances of the affected assets and liabilities with a corre-
sponding adjustment to the fiscal 2006 opening balance in
retained earnings. SAB No. 108 is effective for interim periods
of the first fiscal year ending after November 15, 2006. We
adopted SAB No. 108 on December 31, 2006 and, in accor-
dance with the initial application provisions of SAB No. 108,
adjusted retained earnings as of January 1, 2006. This
adjustment was considered to be immaterial individually
and in the aggregate in prior years based on the Company’s
historical method of assessing materiality. See Note 20 to
the consolidated financial statements for further discussion.
CBL & Associates Properties, Inc. 2006 Annual Report
45
ImpactofInflationIn the last three years, inflation has not had a significant
impact on our operations because of the relatively low inflation
rate. Substantially all tenant leases do, however, contain
provisions designed to protect us from the impact of inflation.
These provisions include clauses enabling us to receive
percentage rent based on tenants’ gross sales, which generally
increase as prices rise, and/or escalation clauses, which
generally increase rental rates during the terms of the leases.
In addition, many of the leases are for terms of less than
10 years which may provide us the opportunity to replace
existing leases with new leases at higher base and/or
percentage rent if rents of the existing leases are below
the then existing market rate. Most of the leases require the
tenants to pay their share of operating expenses, including
common area maintenance, real estate taxes and insurance,
which reduces our exposure to increases in costs and operating
expenses resulting from inflation.
FundsFromOperationsFunds From Operations (“FFO”) is a widely used measure
of the operating performance of real estate companies that
supplements net income determined in accordance with
generally accepted accounting principles (“GAAP”). The
National Association of Real Estate Investment Trusts
(“NAREIT”) defines FFO as net income (computed in accor-
dance with GAAP) excluding gains or losses on sales of
operating properties, plus depreciation and amortization,
and after adjustments for unconsolidated partnerships and
joint ventures and minority interests. Adjustments for uncon-
solidated partnerships and joint ventures and minority interests
are calculated on the same basis. We define FFO allocable
to common shareholders as defined above by NAREIT less
dividends on preferred stock. Our method of calculating
FFO allocable to common shareholders may be different
from methods used by other REITs and, accordingly, may
not be comparable to such other REITs.
We believe that FFO provides an additional indicator of
the operating performance of our Properties without giving
effect to real estate depreciation and amortization, which
assumes the value of real estate assets declines predictably
over time. Since values of well-maintained real estate assets
have historically risen with market conditions, we believe that
FFO enhances investors’ understanding of our operating
performance. The use of FFO as an indicator of financial
performance is influenced not only by the operations of our
properties and interest rates, but also by our capital structure.
We present both FFO of our operating partnership and
FFO allocable to common shareholders, as we believe that
both are useful performance measures. We believe FFO of
our operating partnership is a useful performance measure
since we conduct substantially all of our business through
our operating partnership and, therefore, it reflects the
performance of the properties in absolute terms regardless
of the ratio of ownership interests of our common shareholders
and the minority interest in our operating partnership. We
believe FFO allocable to common shareholders is a useful
performance measure because it is the performance measure
that is most directly comparable to net income available to
common shareholders.
In our reconciliation of net income available to common
shareholders to FFO allocable to common shareholders that
is presented below, we make an adjustment to add back
minority interest in earnings of our operating partnership
in order to arrive at FFO of our operating partnership. We
then apply a percentage to FFO of our operating partnership
to arrive at FFO allocable to common shareholders. The
percentage is computed by taking the weighted average
number of common shares outstanding for the period and
dividing it by the sum of the weighted average number of
common shares and the weighted average number of operating
partnership units outstanding during the period.
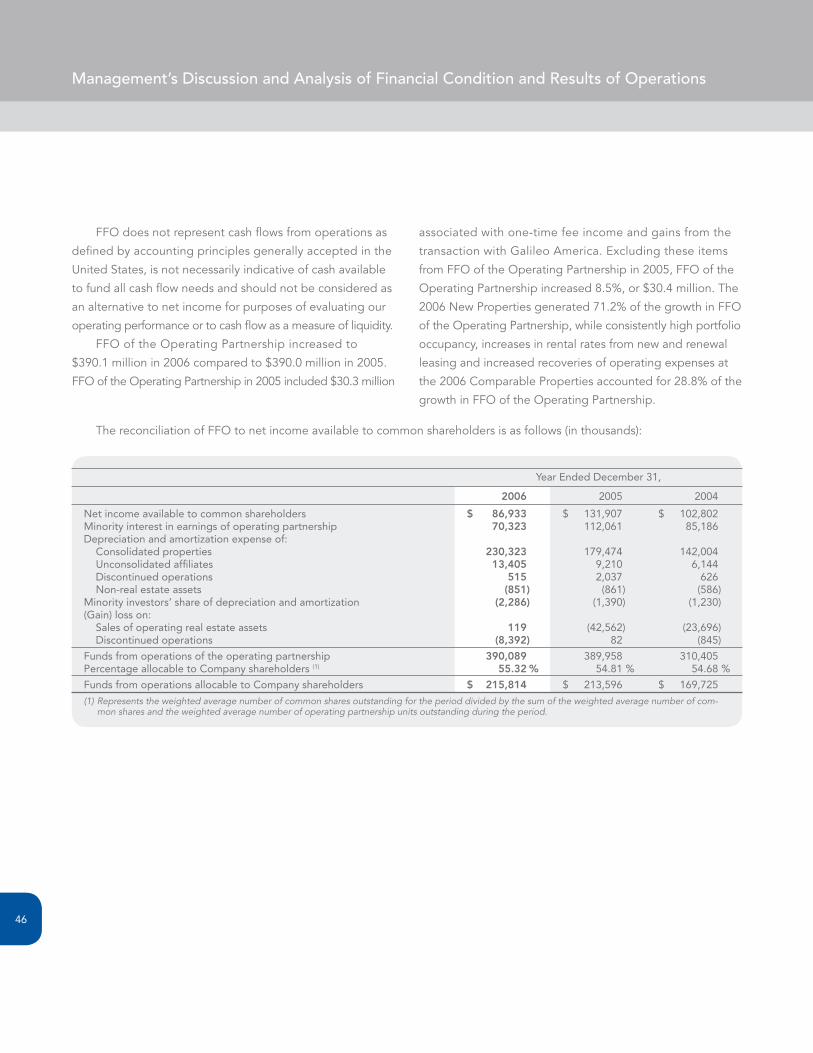
Management’s Discussion and Analysis of Financial Condition and Results of Operations
46
FFO does not represent cash flows from operations as
defined by accounting principles generally accepted in the
United States, is not necessarily indicative of cash available
to fund all cash flow needs and should not be considered as
an alternative to net income for purposes of evaluating our
operating performance or to cash flow as a measure of liquidity.
FFO of the Operating Partnership increased to
$390.1 million in 2006 compared to $390.0 million in 2005.
FFO of the Operating Partnership in 2005 included $30.3 million
associated with one-time fee income and gains from the
transaction with Galileo America. Excluding these items
from FFO of the Operating Partnership in 2005, FFO of the
Operating Partnership increased 8.5%, or $30.4 million. The
2006 New Properties generated 71.2% of the growth in FFO
of the Operating Partnership, while consistently high portfolio
occupancy, increases in rental rates from new and renewal
leasing and increased recoveries of operating expenses at
the 2006 Comparable Properties accounted for 28.8% of the
growth in FFO of the Operating Partnership.
The reconciliation of FFO to net income available to common shareholders is as follows (in thousands):
Year Ended December 31,
2006 2005 2004
Net income available to common shareholders $ 86,933 $ 131,907 $ 102,802Minority interest in earnings of operating partnership 70,323 112,061 85,186Depreciation and amortization expense of: Consolidated properties 230,323 179,474 142,004 Unconsolidated affiliates 13,405 9,210 6,144 Discontinued operations 515 2,037 626 Non-real estate assets (851) (861) (586)Minority investors’ share of depreciation and amortization (2,286) (1,390) (1,230)(Gain) loss on: Sales of operating real estate assets 119 (42,562) (23,696) Discontinued operations (8,392) 82 (845)
Funds from operations of the operating partnership 390,089 389,958 310,405Percentage allocable to Company shareholders (1) 55.32 % 54.81 % 54.68 %
Funds from operations allocable to Company shareholders $ 215,814 $ 213,596 $ 169,725
(1)Representstheweightedaveragenumberofcommonsharesoutstandingfortheperioddividedbythesumoftheweightedaveragenumberofcom-monsharesandtheweightedaveragenumberofoperatingpartnershipunitsoutstandingduringtheperiod.
CBL & Associates Properties, Inc. 2006 Annual Report
47
QuantitativeandQualitativeDisclosuresAboutMarketRisk
We are exposed to interest rate risk on our debt
obligations. Our interest rate risk management policy requires
that we use derivative financial instruments for hedging
purposes only and that, if we do enter into a derivative
financial instrument, the derivative financial instrument be
entered into with only major financial institutions based on their
credit ratings and other factors. We did not have any derivative
financial instruments at December 31, 2006 and 2005.
Based on our proportionate share of consolidated and
unconsolidated variable-rate debt at December 31, 2006,
a 0.5% increase or decrease in interest rates on variable
rate debt would increase or decrease annual cash flows by
approximately $5.4 million and, after the effect of capitalized
interest, annual earnings by approximately $4.4 million.
Based on our proportionate share of total consolidated
and unconsolidated debt at December 31, 2006, a 0.5%
increase in interest rates would decrease the fair value of
debt by approximately $79.5 million, while a 0.5% decrease
in interest rates would increase the fair value of debt by
approximately $82.1 million.
ReportofManagementonInternalControlOverFinancialReporting
Management of CBL & Associates Properties, Inc. and
its consolidated subsidiaries (the “Company”) is responsible
for establishing and maintaining adequate internal control
over financial reporting. The Company’s internal control over
financial reporting is a process designed under the supervision
of the Company’s chief executive officer and chief financial
officer to provide reasonable assurance regarding the reliability
of financial reporting and the preparation of the Company’s
financial statements for external reporting purposes in accor-
dance with U.S. generally accepted accounting principles.
As of December 31, 2006, management conducted an
assessment of the effectiveness of the Company’s internal
control over financial reporting based on the framework
established in Internal Control – Integrated Framework issued
by the Committee of Sponsoring Organizations of the Treadway
Commission. Based on this assessment, management believes
that, as of December 31, 2006, the Company did not maintain
effective internal control over financial reporting because of
the effect of a material weakness in the design and operating
effectiveness of the Company’s system of internal controls
related to the accounting and reporting for income taxes.
Specifically, the Company incorrectly recorded the realized
tax return benefits of excess stock compensation deductions
as reductions to income tax expense rather than as increases
to additional paid-in capital and minority interest liability in
accordance with SFAS No. 109, Accounting for Income Taxes.
Additionally, the Company improperly recorded deferred
income taxes. As a result the Company adjusted the consoli-
dated financial statements to comply with accounting principles
generally accepted in the United States of America.
Deloitte & Touche LLP, the Company’s independent
registered public accounting firm, has issued their attestation
report, which is included below, on management’s assessment
of our internal control over financial reporting and the
effectiveness of internal control over financial reporting as
of December 31, 2006.
Report of Independent Registered Public Accounting Firm
48
TotheBoardofDirectorsandShareholdersofCBL&AssociatesProperties,Inc.
We have audited management’s assessment, included in the accompanying Report of Management on Internal Control
over Financial Reporting, that CBL & Associates Properties, Inc. and subsidiaries (the “Company”) did not maintain effective
internal control over financial reporting as of December 31, 2006, because of the effect of the material weakness identified in
management’s assessment, based on criteria established in Internal Control – Integrated Framework issued by the Committee
of Sponsoring Organizations of the Treadway Commission. The Company’s management is responsible for maintaining effective
internal control over financial reporting and for its assessment of the effectiveness of internal control over financial reporting.
Our responsibility is to express an opinion on management’s assessment and an opinion on the effectiveness of the Company’s
internal control over financial reporting based on our audit.
We conducted our audit in accordance with the standards of the Public Company Accounting Oversight Board (United
States). Those standards require that we plan and perform the audit to obtain reasonable assurance about whether effective
internal control over financial reporting was maintained in all material respects. Our audit included obtaining an understanding of
internal control over financial reporting, evaluating management’s assessment, testing and evaluating the design and operating
effectiveness of internal control, and performing such other procedures as we considered necessary in the circumstances. We
believe that our audit provides a reasonable basis for our opinions.
A company’s internal control over financial reporting is a process designed by, or under the supervision of, the Company’s
principal executive and principal financial officers, or persons performing similar functions, and effected by the Company’s board
of directors, management, and other personnel to provide reasonable assurance regarding the reliability of financial reporting
and the preparation of financial statements for external purposes in accordance with generally accepted accounting principles.
A company’s internal control over financial reporting includes those policies and procedures that (1) pertain to the maintenance
of records that, in reasonable detail, accurately and fairly reflect the transactions and dispositions of the assets of the Company;
(2) provide reasonable assurance that transactions are recorded as necessary to permit preparation of financial statements in
accordance with generally accepted accounting principles, and that receipts and expenditures of the Company are being made
only in accordance with authorizations of management and directors of the Company; and (3) provide reasonable assurance
regarding prevention or timely detection of unauthorized acquisition, use, or disposition of the Company’s assets that could
have a material effect on the financial statements.
Because of the inherent limitations of internal control over financial reporting, including the possibility of collusion or improper
management override of controls, material misstatements due to error or fraud may not be prevented or detected on a timely
basis. Also, projections of any evaluation of the effectiveness of the internal control over financial reporting to future periods
are subject to the risk that the controls may become inadequate because of changes in conditions, or that the degree of
compliance with the policies or procedures may deteriorate.
A material weakness is a significant deficiency, or combination of significant deficiencies, that results in more than a remote
likelihood that a material misstatement of the annual or interim financial statements will not be prevented or detected. The
following material weakness has been identified and included in management’s assessment:
n As of December 31, 2006, the Company did not maintain effective internal control over the process of accounting and
reporting for income taxes due to a deficiency in the design and operating effectiveness of the Company’s internal controls
over income taxes. Specifically, the Company incorrectly recorded the realized tax return benefits of excess stock compensation
deductions as reductions to income tax expense rather than as increases to additional paid-in capital and minority interest
liability in accordance with SFAS No. 109, Accounting for Income Taxes. Additionally, the Company improperly recorded
deferred income taxes. As a result the Company adjusted the consolidated financial statements to comply with accounting
principles generally accepted in the United States of America.
CBL & Associates Properties, Inc. 2006 Annual Report
49
This material weakness was considered in determining the nature, timing and extent of audit tests applied in our audit of the
consolidated financial statements and consolidated financial statement schedules as of and for the year ended December 31,
2006, of the Company and this report does not affect our report on such consolidated financial statements and consolidated
financial statement schedules.
In our opinion, management’s assessment that the Company did not maintain effective internal control over financial
reporting as of December 31, 2006, is fairly stated, in all material respects, based on the criteria established in Internal Control –
Integrated Framework issued by the Committee of Sponsoring Organizations of the Treadway Commission. Also in our opinion,
because of the effect of the material weakness described above on the achievement of the objectives of the control criteria, the
Company has not maintained, in all material respects, effective internal control over financial reporting as of December 31, 2006,
based on the criteria established in Internal Control – Integrated Framework issued by the Committee of Sponsoring Organizations
of the Treadway Commission.
We have also audited, in accordance with the standards of the Public Company Accounting Oversight Board (United States),
the consolidated financial statements and financial statement schedules as of and for the year ended December 31, 2006 of the
Company and our report dated March 1, 2007 expressed an unqualified opinion on those financial statements and financial
statement schedules and includes explanatory paragraphs regarding the adoption of Statement of Financial Accounting
Standards No. 123(R), Share-Based Payment, on January 1, 2006, and the adoption of SEC Staff Accounting Bulletin No. 108,
Considering the Effects of Prior Year Misstatements when Quantifying Misstatements in Current Year Financial Statements,
on December 31, 2006.
Atlanta, Georgia
March 1, 2007
ChangesinInternalControlOverFinancialReportingAs a result of the material weakness described above, the Company plans to review and evaluate the design of its internal
control process over accounting and reporting for income taxes and plans to take the following actions to remediate this reported
material weakness in internal control over financial reporting:
n Review the procedures the Company has in place related to accounting and reporting for income taxes to determine if
changes are appropriate;
n Educate and train Company employees about accounting and reporting for income taxes.
50
Report of Independent Registered Public Accounting Firm
TotheBoardofDirectorsandShareholdersofCBL&AssociatesProperties,Inc.
We have audited the accompanying consolidated balance sheets of CBL & Associates Properties, Inc. and subsidiaries
(the “Company”) as of December 31, 2006 and 2005, and the related consolidated statements of operations, shareholders’
equity, and cash flows for each of the three years in the period ended December 31, 2006. Our audits also included the financial
statement schedules listed in the Index at Item 15. These financial statements and financial statement schedules are the
responsibility of the Company’s management. Our responsibility is to express an opinion on the financial statements and
financial statement schedules based on our audits.
We conducted our audits in accordance with the standards of the Public Company Accounting Oversight Board (United
States). Those standards require that we plan and perform the audit to obtain reasonable assurance about whether the financial
statements are free of material misstatement. An audit includes examining, on a test basis, evidence supporting the amounts
and disclosures in the financial statements. An audit also includes assessing the accounting principles used and significant
estimates made by management, as well as evaluating the overall financial statement presentation. We believe that our
audits provide a reasonable basis for our opinion.
In our opinion, such consolidated financial statements present fairly, in all material respects, the financial position of CBL &
Associates Properties, Inc. and subsidiaries as of December 31, 2006 and 2005, and the results of their operations and their cash
flows for each of the three years in the period ended December 31, 2006, in conformity with accounting principles generally
accepted in the United States of America. Also, in our opinion, such financial statement schedules, when considered in relation
to the basic consolidated financial statements taken as a whole, present fairly, in all material respects, the information set
forth therein.
As described in Note 18 to the consolidated financial statements, the Company adopted Statement of Financial Accounting
Standards No. 123(R), Share-Based Payment, on January 1, 2006, utilizing the modified prospective application transition method.
Also, as described in Note 20 to the consolidated financial statements, the Company adopted SEC Staff Accounting
Bulletin No. 108, Considering the Effects of Prior Year Misstatements when Quantifying Misstatements in Current Year
Financial Statements, on December 31, 2006.
We have also audited, in accordance with the standards of the Public Company Accounting Oversight Board (United
States), the effectiveness of the Company’s internal control over financial reporting as of December 31, 2006, based on the criteria
established in Internal Control – Integrated Framework issued by the Committee of Sponsoring Organizations of the Treadway
Commission and our report dated March 1, 2007 expressed an unqualified opinion on management’s assessment of the
effectiveness of the Company’s internal control over financial reporting and an adverse opinion on the effectiveness of
the Company’s internal control over financial reporting because of a material weakness.
Atlanta, Georgia
March 1, 2007

CBL & Associates Properties, Inc. 2006 Annual Report
51
(In thousands, except share data) December 31,
2006 2005
AssetsReal estate assets: Land $ 779,727 $ 776,989 Buildings and improvements 5,944,476 5,698,669
6,724,203 6,475,658 Accumulated depreciation (924,297) (727,907)
5,799,906 5,747,751 Real estate assets held for sale – 63,168 Developments in progress 294,345 133,509
Net investment in real estate assets 6,094,251 5,944,428Cash and cash equivalents 28,700 28,838Receivables: Tenant, net of allowance for doubtful accounts of $1,128 in 2006 and $3,439 in 2005 71,573 55,056 Other 9,656 6,235Mortgage notes receivable 21,559 18,117Investments in unconsolidated affiliates 78,826 84,138Other assets 214,245 215,510
$ 6,518,810 $ 6,352,322
liabilities and shareholders’ equityMortgage and other notes payable $ 4,564,535 $ 4,341,055Accounts payable and accrued liabilities 309,969 320,270
Total liabilities 4,874,504 4,661,325
Commitments and contingencies (Notes 3, 5 and 16)Minority interests 559,450 609,475
Shareholders’ equity: Preferred stock, $.01 par value, 15,000,000 shares authorized: 8.75% Series B cumulative redeemable preferred stock, 2,000,000 shares outstanding in 2006 and 2005 20 20 7.75% Series C cumulative redeemable preferred stock, 460,000 shares outstanding in 2006 and 2005 5 5 7.375% Series D cumulative redeemable preferred stock, 700,000 shares outstanding in 2006 and 2005 7 7Common stock, $.01 par value, 180,000,000 shares authorized, 65,421,311 and 62,512,816 shares issued and outstanding in 2006 and 2005, respectively 654 625Additional paid-in capital 1,074,450 1,037,764Deferred compensation – (8,895)Accumulated other comprehensive income 19 288Retained earnings 9,701 51,708
Total shareholders’ equity 1,084,856 1,081,522
$ 6,518,810 $ 6,352,322
Theaccompanyingnotesareanintegralpartofthesebalancesheets.
Consolidated Balance Sheets
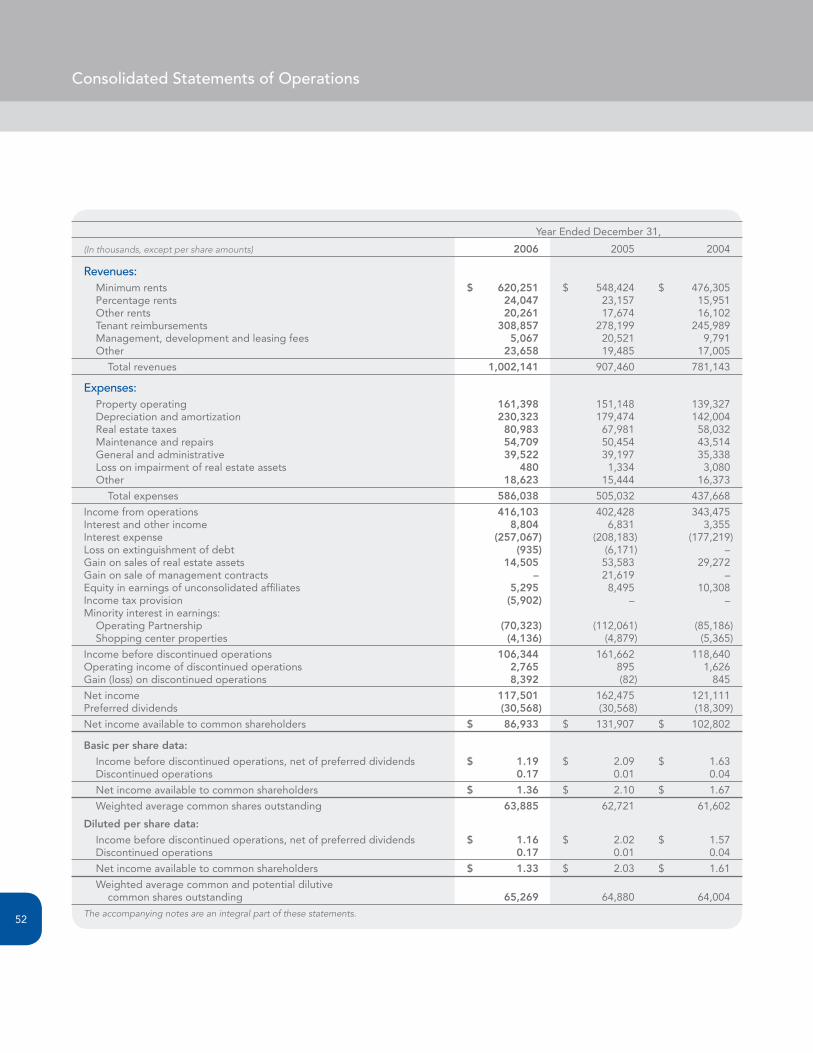
3052
Year Ended December 31,
(In thousands, except per share amounts) 2006 2005 2004
Revenues: Minimum rents $ 620,251 $ 548,424 $ 476,305 Percentage rents 24,047 23,157 15,951 Other rents 20,261 17,674 16,102 Tenant reimbursements 308,857 278,199 245,989 Management, development and leasing fees 5,067 20,521 9,791 Other 23,658 19,485 17,005
Total revenues 1,002,141 907,460 781,143
Expenses: Property operating 161,398 151,148 139,327 Depreciation and amortization 230,323 179,474 142,004 Real estate taxes 80,983 67,981 58,032 Maintenance and repairs 54,709 50,454 43,514 General and administrative 39,522 39,197 35,338 Loss on impairment of real estate assets 480 1,334 3,080 Other 18,623 15,444 16,373
Total expenses 586,038 505,032 437,668
Income from operations 416,103 402,428 343,475Interest and other income 8,804 6,831 3,355Interest expense (257,067) (208,183) (177,219)Loss on extinguishment of debt (935) (6,171) –Gain on sales of real estate assets 14,505 53,583 29,272Gain on sale of management contracts – 21,619 –Equity in earnings of unconsolidated affiliates 5,295 8,495 10,308Income tax provision (5,902) – –Minority interest in earnings: Operating Partnership (70,323) (112,061) (85,186) Shopping center properties (4,136) (4,879) (5,365)
Income before discontinued operations 106,344 161,662 118,640Operating income of discontinued operations 2,765 895 1,626Gain (loss) on discontinued operations 8,392 (82) 845
Net income 117,501 162,475 121,111Preferred dividends (30,568) (30,568) (18,309)
Net income available to common shareholders $ 86,933 $ 131,907 $ 102,802
Basicpersharedata:
Income before discontinued operations, net of preferred dividends $ 1.19 $ 2.09 $ 1.63 Discontinued operations 0.17 0.01 0.04
Net income available to common shareholders $ 1.36 $ 2.10 $ 1.67
Weighted average common shares outstanding 63,885 62,721 61,602
Dilutedpersharedata:
Income before discontinued operations, net of preferred dividends $ 1.16 $ 2.02 $ 1.57 Discontinued operations 0.17 0.01 0.04
Net income available to common shareholders $ 1.33 $ 2.03 $ 1.61
Weighted average common and potential dilutive common shares outstanding 65,269 64,880 64,004
Theaccompanyingnotesareanintegralpartofthesestatements.
Consolidated Statements of Operations
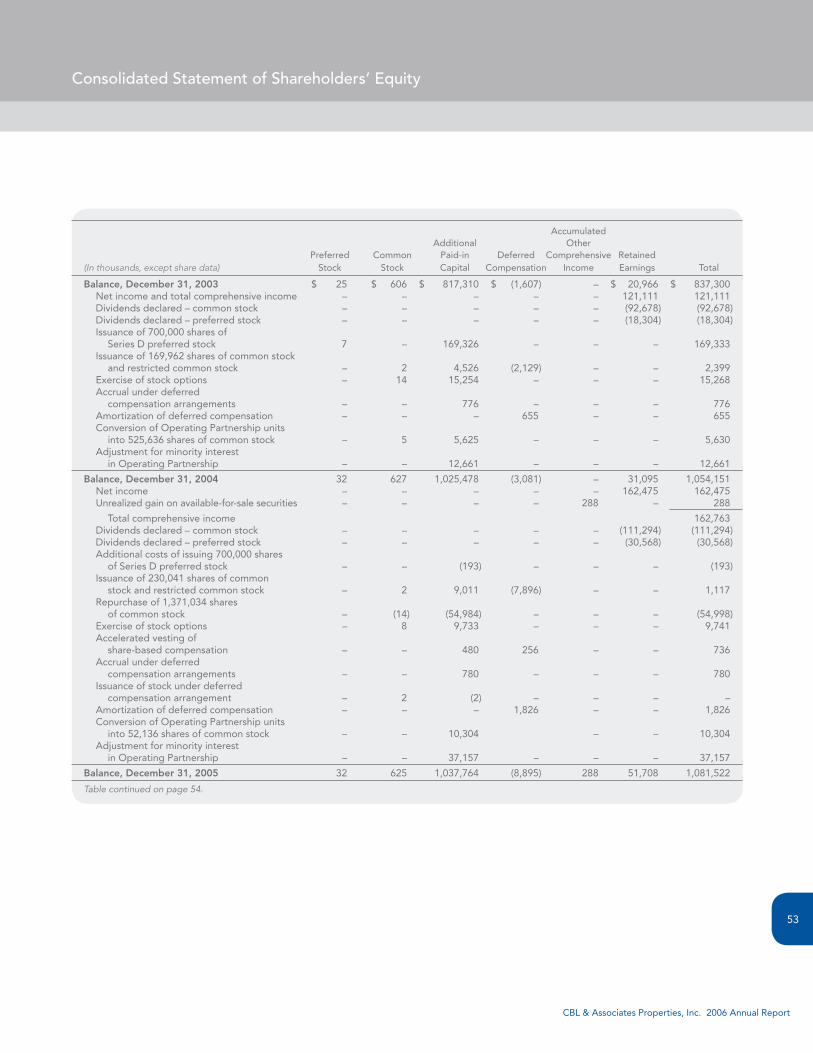
31
CBL & Associates Properties, Inc. 2006 Annual Report
53
Accumulated Additional Other Preferred Common Paid-in Deferred Comprehensive Retained (In thousands, except share data) Stock Stock Capital Compensation Income Earnings Total
Balance,December31,2003 $ 25 $ 606 $ 817,310 $ (1,607) – $ 20,966 $ 837,300 Net income and total comprehensive income – – – – – 121,111 121,111 Dividends declared – common stock – – – – – (92,678) (92,678) Dividends declared – preferred stock – – – – – (18,304) (18,304) Issuance of 700,000 shares of Series D preferred stock 7 – 169,326 – – – 169,333 Issuance of 169,962 shares of common stock and restricted common stock – 2 4,526 (2,129) – – 2,399 Exercise of stock options – 14 15,254 – – – 15,268 Accrual under deferred compensation arrangements – – 776 – – – 776 Amortization of deferred compensation – – – 655 – – 655 Conversion of Operating Partnership units into 525,636 shares of common stock – 5 5,625 – – – 5,630 Adjustment for minority interest in Operating Partnership – – 12,661 – – – 12,661
Balance,December31,2004 32 627 1,025,478 (3,081) – 31,095 1,054,151 Net income – – – – – 162,475 162,475 Unrealized gain on available-for-sale securities – – – – 288 – 288
Total comprehensive income 162,763 Dividends declared – common stock – – – – – (111,294) (111,294) Dividends declared – preferred stock – – – – – (30,568) (30,568) Additional costs of issuing 700,000 shares of Series D preferred stock – – (193) – – – (193) Issuance of 230,041 shares of common stock and restricted common stock – 2 9,011 (7,896) – – 1,117 Repurchase of 1,371,034 shares of common stock – (14) (54,984) – – – (54,998) Exercise of stock options – 8 9,733 – – – 9,741 Accelerated vesting of share-based compensation – – 480 256 – – 736 Accrual under deferred compensation arrangements – – 780 – – – 780 Issuance of stock under deferred compensation arrangement – 2 (2) – – – – Amortization of deferred compensation – – – 1,826 – – 1,826 Conversion of Operating Partnership units into 52,136 shares of common stock – – 10,304 – – 10,304 Adjustment for minority interest in Operating Partnership – – 37,157 – – – 37,157
Balance,December31,2005 32 625 1,037,764 (8,895) 288 51,708 1,081,522
Tablecontinuedonpage54.
Consolidated Statement of Shareholders’ Equity
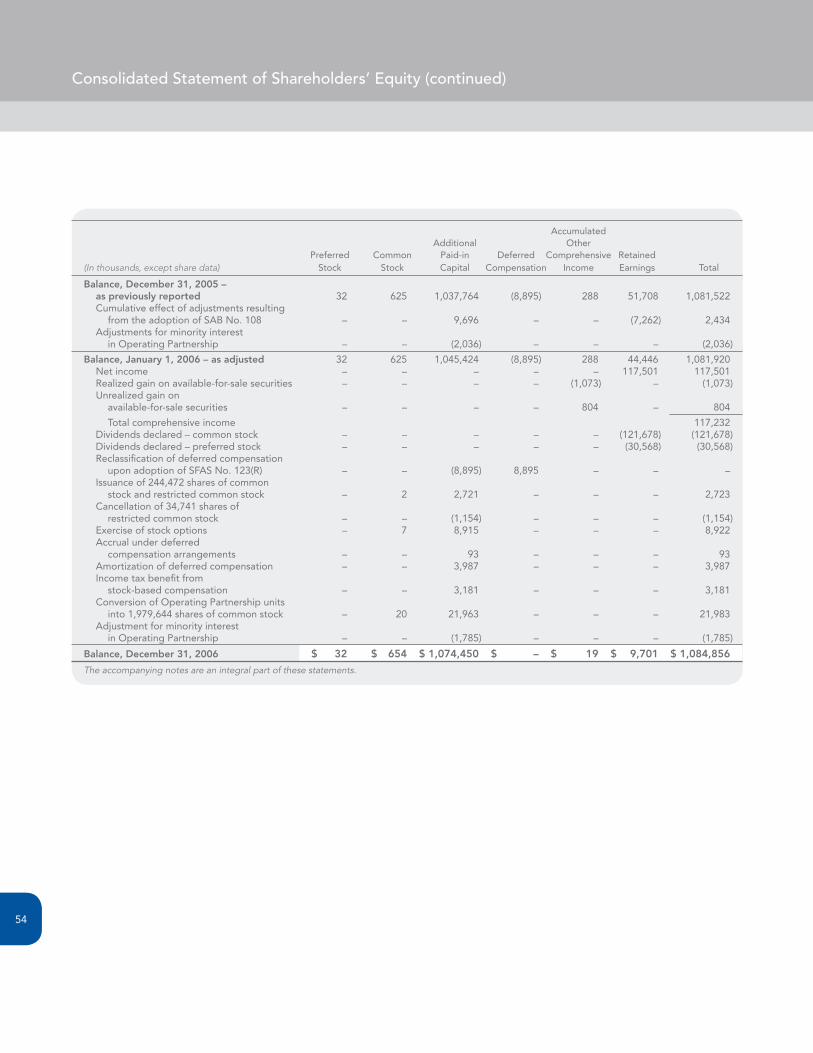
54
Consolidated Statement of Shareholders’ Equity (continued)
Accumulated Additional Other Preferred Common Paid-in Deferred Comprehensive Retained (In thousands, except share data) Stock Stock Capital Compensation Income Earnings Total
Balance,December31,2005– aspreviouslyreported 32 625 1,037,764 (8,895) 288 51,708 1,081,522 Cumulative effect of adjustments resulting from the adoption of SAB No. 108 – – 9,696 – – (7,262) 2,434 Adjustments for minority interest in Operating Partnership – – (2,036) – – – (2,036)
Balance,January1,2006–asadjusted 32 625 1,045,424 (8,895) 288 44,446 1,081,920 Net income – – – – – 117,501 117,501 Realized gain on available-for-sale securities – – – – (1,073) – (1,073) Unrealized gain on available-for-sale securities – – – – 804 – 804
Total comprehensive income 117,232 Dividends declared – common stock – – – – – (121,678) (121,678) Dividends declared – preferred stock – – – – – (30,568) (30,568) Reclassification of deferred compensation upon adoption of SFAS No. 123(R) – – (8,895) 8,895 – – – Issuance of 244,472 shares of common stock and restricted common stock – 2 2,721 – – – 2,723 Cancellation of 34,741 shares of restricted common stock – – (1,154) – – – (1,154) Exercise of stock options – 7 8,915 – – – 8,922 Accrual under deferred compensation arrangements – – 93 – – – 93 Amortization of deferred compensation – – 3,987 – – – 3,987 Income tax benefit from stock-based compensation – – 3,181 – – – 3,181 Conversion of Operating Partnership units into 1,979,644 shares of common stock – 20 21,963 – – – 21,983 Adjustment for minority interest in Operating Partnership – – (1,785) – – – (1,785)
Balance,December31,2006 $ 32 $ 654 $1,074,450 $ – $ 19 $ 9,701 $1,084,856
Theaccompanyingnotesareanintegralpartofthesestatements.
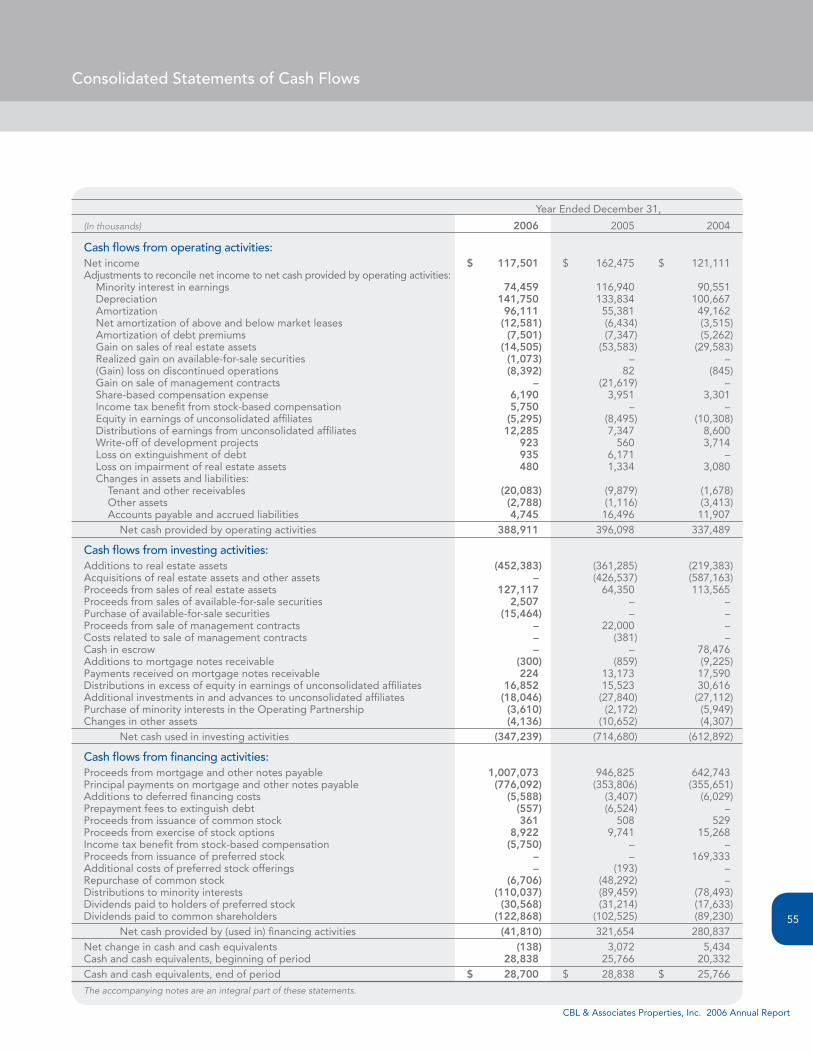
CBL & Associates Properties, Inc. 2006 Annual Report
55
Consolidated Statements of Cash Flows
Year Ended December 31,
(In thousands) 2006 2005 2004
Cash flows from operating activities:Net income $ 117,501 $ 162,475 $ 121,111Adjustments to reconcile net income to net cash provided by operating activities: Minority interest in earnings 74,459 116,940 90,551 Depreciation 141,750 133,834 100,667 Amortization 96,111 55,381 49,162 Net amortization of above and below market leases (12,581) (6,434) (3,515) Amortization of debt premiums (7,501) (7,347) (5,262) Gain on sales of real estate assets (14,505) (53,583) (29,583) Realized gain on available-for-sale securities (1,073) – – (Gain) loss on discontinued operations (8,392) 82 (845) Gain on sale of management contracts – (21,619) – Share-based compensation expense 6,190 3,951 3,301 Income tax benefit from stock-based compensation 5,750 – – Equity in earnings of unconsolidated affiliates (5,295) (8,495) (10,308) Distributions of earnings from unconsolidated affiliates 12,285 7,347 8,600 Write-off of development projects 923 560 3,714 Loss on extinguishment of debt 935 6,171 – Loss on impairment of real estate assets 480 1,334 3,080 Changes in assets and liabilities: Tenant and other receivables (20,083) (9,879) (1,678) Other assets (2,788) (1,116) (3,413) Accounts payable and accrued liabilities 4,745 16,496 11,907 Net cash provided by operating activities 388,911 396,098 337,489
Cash flows from investing activities:Additions to real estate assets (452,383) (361,285) (219,383)Acquisitions of real estate assets and other assets – (426,537) (587,163)Proceeds from sales of real estate assets 127,117 64,350 113,565Proceeds from sales of available-for-sale securities 2,507 – –Purchase of available-for-sale securities (15,464) – –Proceeds from sale of management contracts – 22,000 –Costs related to sale of management contracts – (381) –Cash in escrow – – 78,476Additions to mortgage notes receivable (300) (859) (9,225)Payments received on mortgage notes receivable 224 13,173 17,590Distributions in excess of equity in earnings of unconsolidated affiliates 16,852 15,523 30,616Additional investments in and advances to unconsolidated affiliates (18,046) (27,840) (27,112)Purchase of minority interests in the Operating Partnership (3,610) (2,172) (5,949)Changes in other assets (4,136) (10,652) (4,307) Net cash used in investing activities (347,239) (714,680) (612,892)
Cash flows from financing activities:Proceeds from mortgage and other notes payable 1,007,073 946,825 642,743Principal payments on mortgage and other notes payable (776,092) (353,806) (355,651)Additions to deferred financing costs (5,588) (3,407) (6,029)Prepayment fees to extinguish debt (557) (6,524) –Proceeds from issuance of common stock 361 508 529Proceeds from exercise of stock options 8,922 9,741 15,268Income tax benefit from stock-based compensation (5,750) – –Proceeds from issuance of preferred stock – – 169,333Additional costs of preferred stock offerings – (193) –Repurchase of common stock (6,706) (48,292) –Distributions to minority interests (110,037) (89,459) (78,493)Dividends paid to holders of preferred stock (30,568) (31,214) (17,633)Dividends paid to common shareholders (122,868) (102,525) (89,230) Net cash provided by (used in) financing activities (41,810) 321,654 280,837Net change in cash and cash equivalents (138) 3,072 5,434Cash and cash equivalents, beginning of period 28,838 25,766 20,332Cash and cash equivalents, end of period $ 28,700 $ 28,838 $ 25,766
Theaccompanyingnotesareanintegralpartofthesestatements.
3656
Note 1. OrganizationCBL & Associates Properties, Inc. (“CBL”), a Delaware corporation, is a self-managed, self-administered, fully-integrated
real estate investment trust (“REIT”) that is engaged in the ownership, development, acquisition, leasing, management and
operation of regional shopping malls and community shopping centers. CBL’s shopping center properties are located in 27 states,
but are primarily in the southeastern and midwestern United States.
CBL conducts substantially all of its business through CBL & Associates Limited Partnership (the “Operating Partnership”).
As of December 31, 2006, the Operating Partnership owned controlling interests in 72 regional malls, 27 associated centers
(each located adjacent to a regional mall), four community centers and CBL’s corporate office building. The Operating Partnership
consolidates the financial statements of all entities in which it has a controlling financial interest or where it is the primary
beneficiary of a variable interest entity. The Operating Partnership owned non-controlling interests in seven regional malls,
four associated centers and one community center. Because major decisions such as the acquisition, sale or refinancing of
principal partnership or joint venture assets must be approved by one or more of the other partners, the Operating Partnership
does not control these partnerships and joint ventures and, accordingly, accounts for these investments using the equity method.
At December 31, 2006, the Operating Partnership had seven mall/lifestyle expansions, one open-air shopping center, one
open-air shopping center expansion, one associated center and three community centers, one of which is owned in a joint
venture, under construction. The Operating Partnership also holds options to acquire certain development properties owned
by third parties.
CBL is the 100% owner of two qualified REIT subsidiaries, CBL Holdings I, Inc. and CBL Holdings II, Inc. At December 31,
2006, CBL Holdings I, Inc., the sole general partner of the Operating Partnership, owned a 1.6% general partnership interest
in the Operating Partnership and CBL Holdings II, Inc. owned a 54.7% limited partnership interest for a combined interest held
by CBL of 56.3%.
The minority interest in the Operating Partnership is held primarily by CBL & Associates, Inc. and its affiliates (collectively
“CBL’s Predecessor”) and by affiliates of The Richard E. Jacobs Group, Inc. (“Jacobs”). CBL’s Predecessor contributed their
interests in certain real estate properties and joint ventures to the Operating Partnership in exchange for a limited partnership
interest when the Operating Partnership was formed in November 1993. Jacobs contributed their interests in certain real
estate properties and joint ventures to the Operating Partnership in exchange for a limited partnership interest when the
Operating Partnership acquired the majority of Jacobs’ interests in 23 properties in January 2001 and the balance of such
interests in February 2002. At December 31, 2006, CBL’s Predecessor owned a 15.0% limited partnership interest, Jacobs
owned a 19.8% limited partnership interest and third parties owned an 8.9% limited partnership interest in the Operating
Partnership. CBL’s Predecessor also owned 6.2 million shares of CBL’s common stock at December 31, 2006, for a combined
total interest of 20.4% in the Operating Partnership.
The Operating Partnership conducts CBL’s property management and development activities through CBL & Associates
Management, Inc. (the “Management Company”) to comply with certain requirements of the Internal Revenue Code of 1986,
as amended (the “Code”). The Operating Partnership owns 100% of both of the Management Company’s preferred stock and
its common stock.
CBL, the Operating Partnership and the Management Company are collectively referred to herein as “the Company.” All
significant intercompany balances and transactions have been eliminated in the consolidated presentation.
Notes to Consolidated Financial Statements(dollars in thousands, except share data)

37
CBL & Associates Properties, Inc. 2006 Annual Report
57
Note 2. SummaryofSignificantAccountingPolicies
REAl EStAtE ASSEtS
The Company capitalizes predevelopment project costs paid to third parties. All previously capitalized predevelopment
costs are expensed when it is no longer probable that the project will be completed. Once development of a project commences,
all direct costs incurred to construct the project, including interest and real estate taxes, are capitalized. Additionally, certain
general and administrative expenses are allocated to the projects and capitalized based on the amount of time applicable
personnel work on the development project. Ordinary repairs and maintenance are expensed as incurred. Major replacements
and improvements are capitalized and depreciated over their estimated useful lives.
All acquired real estate assets have been accounted for using the purchase method of accounting and accordingly, the
results of operations are included in the consolidated statements of operations from the respective dates of acquisition.
The Company allocates the purchase price to (i) tangible assets, consisting of land, buildings and improvements, as if vacant,
and tenant improvements, and (ii) identifiable intangible assets and liabilities, generally consisting of above-market leases,
in-place leases and tenant relationships, which are included in other assets, and below-market leases, which are included in
accounts payable and accrued liabilities. The Company uses estimates of fair value based on estimated cash flows, using
appropriate discount rates, and other valuation techniques to allocate the purchase price to the acquired tangible and intangible
assets. Liabilities assumed generally consist of mortgage debt on the real estate assets acquired. Assumed debt is recorded
at its fair value based on estimated market interest rates at the date of acquisition.
Depreciation is computed on a straight-line basis over estimated lives of 40 years for buildings, 10 to 20 years for certain
improvements and 7 to 10 years for equipment and fixtures. Tenant improvements are capitalized and depreciated on a
straight-line basis over the term of the related lease. Lease-related intangibles from acquisitions of real estate assets are amortized
over the remaining terms of the related leases. The amortization of above- and below-market leases is recorded as an adjustment
to minimum rental revenue, while the amortization of all other lease-related intangibles is recorded as amortization expense. Any
difference between the face value of the debt assumed and its fair value is amortized to interest expense over the remaining
term of the debt using the effective interest method.
The Company’s acquired intangibles and their balance sheet classifications as of December 31, 2006 and 2005, are
summarized as follows:
December31,2006 December 31, 2005
Accumulated Accumulated Cost Amortization Cost Amortization
Other assets: Above-market leases $ 40,509 $ (11,579) $ 42,026 $ (4,921) In-place leases 69,615 (28,941) 72,584 (14,992) Tenant relationships 49,796 (2,320) 49,796 (53)Accounts payable and accrued liabilities: Below-market leases 86,736 (31,386) 91,148 (14,816)
The total net amortization expense of the above acquired intangibles for the next five succeeding years will be $3,981 in
2007, $3,888 in 2008, $2,689 in 2009, $2,628 in 2010 and $2,163 in 2011.
Total interest expense capitalized was $11,504, $8,385 and $4,517 in 2006, 2005 and 2004, respectively.

Notes to Consolidated Financial Statements
58
CARRyINg vAluE OF lONg-lIvED ASSEtS
The Company evaluates the carrying value of long-lived assets to be held and used when events or changes in circumstances
warrant such a review. The carrying value of a long-lived asset is considered impaired when its estimated future undiscounted
cash flows are less than its carrying value. If it is determined that an impairment has occurred, the excess of the asset’s carrying
value over its estimated fair value is charged to operations.
During 2006, the Company recognized a loss of $274 on the sale of two community centers and a loss of $206 on the sale
of land. The aggregate loss of $480 was recorded as a loss on impairment of real estate assets.
The Company determined that two community centers met the criteria to be reflected as held for sale as of December 31,
2005 and recognized a loss on impairment of $1,029.
In January 2005, the Company completed the third phase of the Galileo America joint venture transaction discussed in
Note 5. The Company recognized a loss of $1,947 on this transaction as an impairment of real estate assets in 2004 and
reduced the carrying value of the related assets, which were classified as real estate assets held for sale as of December 31,
2004. The Company recognized an additional impairment loss of $262 in the first quarter of 2005 related to these centers
when certain estimated amounts were adjusted when the actual amounts became known.
During 2004, the Company recognized a loss of $114 on the sale of one community center as a loss on impairment of
real estate assets.
During 2004, the Company determined that the carrying value of a vacant community center exceeded the community
center’s estimated fair value by $402. The Company recorded the reduction in the carrying value of the related real estate
assets to their estimated fair value as a loss on impairment of real estate assets. The Company sold this community center in
October 2005 and recognized an additional impairment of $43.
In January 2005, the Company made the decision to sell five community centers and, as a result, recognized an aggregate
loss on impairment of real estate assets of $617 on these community centers in 2004 to reduce the carrying values of these
centers to their estimated fair values based on their selling prices.
CASh AND CASh EquIvAlENtS
The Company considers all highly liquid investments with original maturities of three months or less as cash equivalents.
REStRICtED CASh
Restricted cash of $34,814 and $34,448 was included in other assets at December 31, 2006 and 2005, respectively. Restricted
cash consists primarily of cash held in escrow accounts for debt service, insurance, real estate taxes, capital improvements and
deferred maintenance as required by the terms of certain mortgage notes payable, as well as contributions from tenants to be
used for future marketing activities.
JOINt vENtuRES
Initial investments in joint ventures that are in economic substance a capital contribution to the joint venture are recorded
in an amount equal to the Company’s historical carryover basis in the real estate contributed. Initial investments in joint ventures
that are in economic substance the sale of a portion of the Company’s interest in the real estate are accounted for as a contri-
bution of real estate recorded in an amount equal to the Company’s historical carryover basis in the ownership percentage
retained and as a sale of real estate with profit recognized to the extent of the other joint venturers’ interests in the joint venture.
Profit recognition assumes the Company has no commitment to reinvest with respect to the percentage of the real estate
sold and the accounting requirements of the full accrual method under Statement of Financial Accounting Standards (“SFAS”)
No. 66, Accounting for Sales of Real Estate, are met.
The Company accounts for its investment in joint ventures where it owns a non-controlling interest or where it is not
the primary beneficiary of a variable interest entity using the equity method of accounting. Under the equity method, the
Company’s cost of investment is adjusted for its share of equity in the earnings of the unconsolidated affiliate and reduced
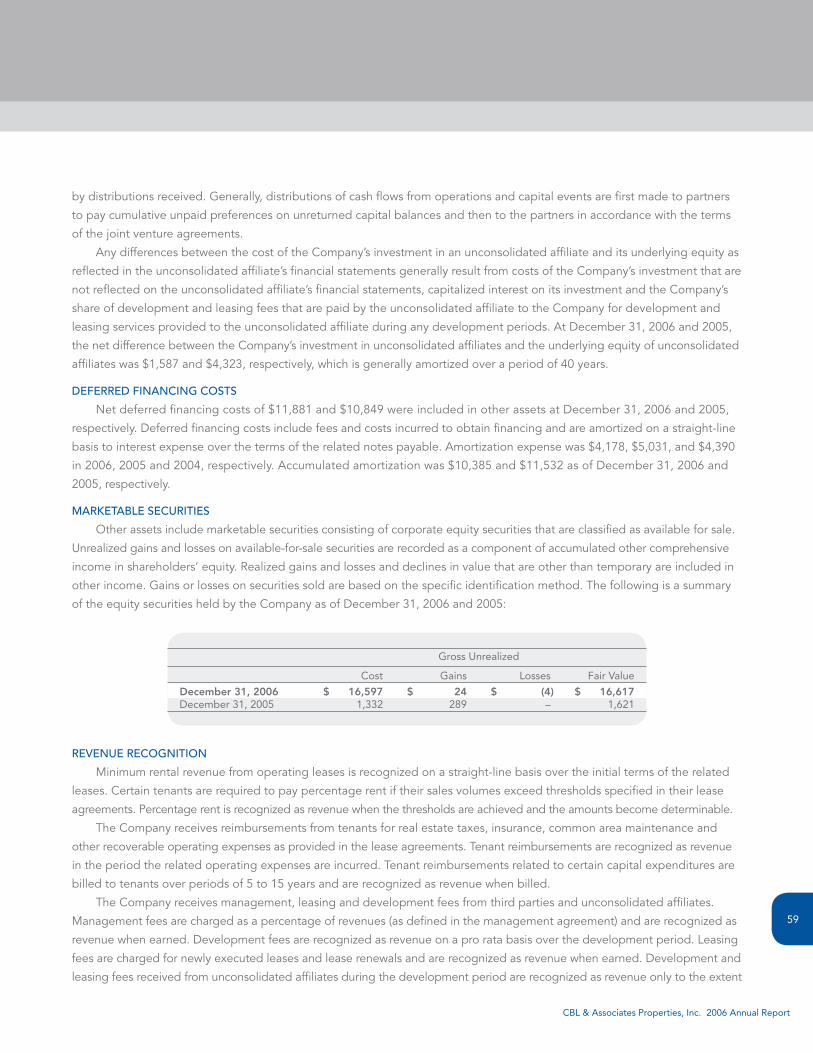
CBL & Associates Properties, Inc. 2006 Annual Report
59
by distributions received. Generally, distributions of cash flows from operations and capital events are first made to partners
to pay cumulative unpaid preferences on unreturned capital balances and then to the partners in accordance with the terms
of the joint venture agreements.
Any differences between the cost of the Company’s investment in an unconsolidated affiliate and its underlying equity as
reflected in the unconsolidated affiliate’s financial statements generally result from costs of the Company’s investment that are
not reflected on the unconsolidated affiliate’s financial statements, capitalized interest on its investment and the Company’s
share of development and leasing fees that are paid by the unconsolidated affiliate to the Company for development and
leasing services provided to the unconsolidated affiliate during any development periods. At December 31, 2006 and 2005,
the net difference between the Company’s investment in unconsolidated affiliates and the underlying equity of unconsolidated
affiliates was $1,587 and $4,323, respectively, which is generally amortized over a period of 40 years.
DEFERRED FINANCINg COStS
Net deferred financing costs of $11,881 and $10,849 were included in other assets at December 31, 2006 and 2005,
respectively. Deferred financing costs include fees and costs incurred to obtain financing and are amortized on a straight-line
basis to interest expense over the terms of the related notes payable. Amortization expense was $4,178, $5,031, and $4,390
in 2006, 2005 and 2004, respectively. Accumulated amortization was $10,385 and $11,532 as of December 31, 2006 and
2005, respectively.
MARkEtABlE SECuRItIES
Other assets include marketable securities consisting of corporate equity securities that are classified as available for sale.
Unrealized gains and losses on available-for-sale securities are recorded as a component of accumulated other comprehensive
income in shareholders’ equity. Realized gains and losses and declines in value that are other than temporary are included in
other income. Gains or losses on securities sold are based on the specific identification method. The following is a summary
of the equity securities held by the Company as of December 31, 2006 and 2005:
Gross Unrealized
Cost Gains Losses Fair Value
December31,2006 $ 16,597 $ 24 $ (4) $ 16,617December 31, 2005 1,332 289 – 1,621
REvENuE RECOgNItION
Minimum rental revenue from operating leases is recognized on a straight-line basis over the initial terms of the related
leases. Certain tenants are required to pay percentage rent if their sales volumes exceed thresholds specified in their lease
agreements. Percentage rent is recognized as revenue when the thresholds are achieved and the amounts become determinable.
The Company receives reimbursements from tenants for real estate taxes, insurance, common area maintenance and
other recoverable operating expenses as provided in the lease agreements. Tenant reimbursements are recognized as revenue
in the period the related operating expenses are incurred. Tenant reimbursements related to certain capital expenditures are
billed to tenants over periods of 5 to 15 years and are recognized as revenue when billed.
The Company receives management, leasing and development fees from third parties and unconsolidated affiliates.
Management fees are charged as a percentage of revenues (as defined in the management agreement) and are recognized as
revenue when earned. Development fees are recognized as revenue on a pro rata basis over the development period. Leasing
fees are charged for newly executed leases and lease renewals and are recognized as revenue when earned. Development and
leasing fees received from unconsolidated affiliates during the development period are recognized as revenue only to the extent

Notes to Consolidated Financial Statements
60
of the third-party partners’ ownership interest. Development and leasing fees during the development period to the extent of
the Company’s ownership interest are recorded as a reduction to the Company’s investment in the unconsolidated affiliate.
gAIN ON SAlES OF REAl EStAtE ASSEtS
Gains on sales of real estate assets are recognized when it is determined that the sale has been consummated, the buyer’s
initial and continuing investment is adequate, the Company’s receivable, if any, is not subject to future subordination, and the
buyer has assumed the usual risks and rewards of ownership of the asset. When the Company has an ownership interest in
the buyer, gain is recognized to the extent of the third party partner’s ownership interest and the portion of the gain attributable
to the Company’s ownership interest is deferred.
INCOME tAxES
The Company is qualified as a REIT under the provisions of the Code. To maintain qualification as a REIT, the Company is
required to distribute at least 90% of its taxable income to shareholders and meet certain other requirements.
As a REIT, the Company is generally not liable for federal corporate income taxes. If the Company fails to qualify as a REIT
in any taxable year, the Company will be subject to federal and state income taxes on its taxable income at regular corporate
tax rates. Even if the Company maintains its qualification as a REIT, the Company may be subject to certain state and local taxes
on its income and property, and to federal income and excise taxes on its undistributed income. State income taxes were not
material in 2006, 2005 and 2004.
The Company has also elected taxable REIT subsidiary status for some of its subsidiaries. This enables the Company to
receive income and provide services that would otherwise be impermissible for REITs. For these entities, deferred tax assets
and liabilities are established for temporary differences between the financial reporting basis and the tax basis of assets and
liabilities at the enacted tax rates expected to be in effect when the temporary differences reverse. A valuation allowance for
deferred tax assets is provided if the Company believes all or some portion of the deferred tax asset may not be realized. An
increase or decrease in the valuation allowance that results from the change in circumstances that causes a change in our
judgment about the realizability of the related deferred tax asset is included in income. The Company recorded an income tax
provision of $5,902, $0 and $0 in 2006, 2005 and 2004, respectively. The income tax provision in 2006 consisted of a current
income tax provision of $5,751 and a deferred income tax provision of $151.
The Company had a net deferred tax asset of $4,291 and $4,442 at December 31, 2006 and 2005, respectively. The net
deferred tax asset at December 31, 2006 primarily consisted of operating expense accruals and differences between book
and tax depreciation. The Company had recorded a valuation allowance to reduce the net deferred tax asset at December 31,
2005 to zero.
CONCENtRAtION OF CREDIt RISk
The Company’s tenants include national, regional and local retailers. Financial instruments that subject the Company to
concentrations of credit risk consist primarily of tenant receivables. The Company generally does not obtain collateral or other
security to support financial instruments subject to credit risk, but monitors the credit standing of tenants.
The Company derives a substantial portion of its rental income from various national and regional retail companies; however,
no single tenant collectively accounted for more than 10.0% of the Company’s total revenues in 2006, 2005 and 2004.
EARNINgS PER ShARE
Basic earnings per share (“EPS”) is computed by dividing net income available to common shareholders by the weighted
average number of unrestricted common shares outstanding for the period. Diluted EPS assumes the issuance of common
stock for all potential dilutive common shares outstanding. The limited partners’ rights to convert their minority interest in the

CBL & Associates Properties, Inc. 2006 Annual Report
61
Operating Partnership into shares of common stock are not dilutive (Note 9). The following summarizes the impact of potential
dilutive common shares on the denominator used to compute earnings per share:
Year Ended December 31,
2006 2005 2004
Weighted average common shares 64,225 63,004 61,878Effect of nonvested stock awards (340) (283) (276)
Denominator – basic earnings per share 63,885 62,721 61,602Dilutive effect of: Stock options 1,189 1,741 1,970 Nonvested stock awards 138 223 232 Deemed shares related to deferred compensation arrangements 57 195 200
Denominator – diluted earnings per share 65,269 64,880 64,004
COMPREhENSIvE INCOME
Comprehensive income includes all changes in shareholders’ equity during the period, except those resulting from
investments by shareholders and distributions to shareholders. Comprehensive income for all periods presented represents
unrealized gains (losses) on available for sale securities.
uSE OF EStIMAtES
The preparation of financial statements in conformity with accounting principles generally accepted in the United States
of America requires management to make estimates and assumptions that affect the reported amounts of assets and liabilities
and disclosure of contingent assets and liabilities at the date of the financial statements, and the reported amounts of revenues
and expenses during the reported period. Actual results could differ from those estimates.
RECENt ACCOuNtINg PRONOuNCEMENtS
In June 2005, the Financial Accounting Standards Board (“FASB”) issued Emerging Issues Task Force (“EITF”) Issue No. 04-5,
Determining Whether a General Partner, or the General Partners as a Group, Controls a Limited Partnership or Similar Entity
When the Limited Partners Have Certain Rights. EITF Issue No. 04-5 provides a framework for determining whether a general
partner controls, and should consolidate, a limited partnership or a similar entity. EITF Issue No. 04-5 was effective after June 29,
2005, for all newly formed limited partnerships and for any pre-existing limited partnerships that modify their partnership
agreements after that date. General partners of all other limited partnerships were required to apply the consensus no later
than the beginning of the first reporting period in fiscal years beginning after December 15, 2005. The adoption of EITF Issue
No. 04-5 did not result in any changes to the manner in which the Company accounts for its joint ventures.
In June 2005, the FASB issued FSP 78-9-1, Interaction of AICPA Statement of Position 78-9 and EITF Issue No. 04-5. The
EITF acknowledged that the consensus in EITF Issue No. 04-5 conflicts with certain aspects of Statement of Position (“SOP”) 78-9,
Accounting for Investments in Real Estate Ventures. The EITF agreed that the assessment of whether a general partner, or the
general partners as a group, controls a limited partnership should be consistent for all limited partnerships, irrespective of
the industry within which the limited partnership operates. Accordingly, the guidance in SOP 78-9 was amended in FSP 78-9-1
to be consistent with the guidance in EITF Issue No. 04-5. The effective dates for this FSP are the same as those mentioned
above in EITF Issue No. 04-5. The adoption of FSP 78-9-1 did not result in any changes to the manner in which the Company
accounts for its joint ventures.

Notes to Consolidated Financial Statements
62
On July 13, 2006, the FASB issued Interpretation No. 48, Accounting for Uncertainty in Income Taxes (“FIN 48”), which
is effective for fiscal years beginning after December 15, 2006. FIN 48 clarifies the accounting for uncertainty in income taxes
recognized in the financial statements in accordance with SFAS No.109, Accounting for Income Taxes, by prescribing the
minimum recognition threshold a tax position is required to meet before being recognized in the financial statements. FIN 48
also provides guidance on derecognition, measurement, classification, interest and penalties, accounting in interim periods,
disclosure and transition. The Company is currently evaluating the impact that the adoption of FIN 48 will have on its consolidated
financial statements.
In September 2006, the FASB issued SFAS No. 157, Fair Value Measurements. SFAS No. 157 defines fair value, establishes
a framework for measuring fair value under generally accepted accounting principles, and expands disclosures about fair value
measurements. SFAS No. 157 is effective for financial statements issued for fiscal years beginning after November 15, 2007, and
interim periods within those fiscal years. The transition adjustment, which is measured as the difference between the carrying
amount and the fair value of those financial instruments at the date SFAS No. 157 is initially applied, should be recognized as
a cumulative effect adjustment to the opening balance of retained earnings for the fiscal year in which SFAS No. 157 is initially
applied. The Company will adopt the provisions of SFAS No. 157 on January 1, 2008. The adoption of SFAS No. 157 is not
expected to have a material impact on the Company’s consolidated financial statements.
In September 2006, the Securities and Exchange Commission’s staff issued Staff Accounting Bulletin (“SAB”) No. 108,
Considering the Effects of Prior Year Misstatements when Quantifying Misstatements in Current Year Financial Statements.
SAB No. 108 requires companies to evaluate the materiality of identified unadjusted errors on each financial statement and
related financial statement disclosure using both the rollover approach and the iron curtain approach, as those terms are
defined in SAB No. 108. The rollover approach quantifies misstatements based on the amount of the error in the current year
financial statements, whereas the iron curtain approach quantifies misstatements based on the effects of correcting the
misstatement existing in the balance sheet at the end of the current year, irrespective of the misstatement’s year(s) of origin.
Financial statements would require adjustment when either approach results in quantifying a misstatement that is material.
Correcting prior year financial statements for immaterial errors would not require previously filed reports to be amended. If a
company determines that an adjustment to prior year financial statements is required upon adoption of SAB No. 108 and
does not elect to restate its previous financial statements, then it must recognize the cumulative effect of applying SAB No. 108 in
fiscal 2006 beginning balances of the affected assets and liabilities with a corresponding adjustment to the fiscal 2006 opening
balance in retained earnings. SAB No. 108 is effective for interim periods of the first fiscal year ending after November 15,
2006. The Company adopted SAB No. 108 on December 31, 2006 and, in accordance with the initial application provisions
of SAB No. 108, adjusted retained earnings as of January 1, 2006. This adjustment was considered to be immaterial individually
and in the aggregate in prior years based on the Company’s historical method of assessing materiality. See Note 20 for
further discussion.
REClASSIFICAtIONS
Certain amounts in the 2005 and 2004 consolidated financial statements have been reclassified to conform to the current
year presentation, including reclassifications of prior year amounts related to discontinued operations (see Note 4).
CBL & Associates Properties, Inc. 2006 Annual Report
63
Note 3.AcquisitionsThe Company includes the results of operations of real estate assets acquired in the consolidated statements of operations
from the date of the related acquisition.
The Company did not complete any acquisitions in 2006.
2005 ACquISItIONS
Effective June 1, 2005, the Company acquired a 70% interest in Laurel Park Place, a regional mall in Livonia, MI, for a
purchase price of $80,363. The purchase price consisted of $2,828 in cash, the assumption of $50,654 of non-recourse debt that
bears interest at a stated rate of 8.50% and matures in December 2012 and the issuance of 571,700 Series L special common
units (the “L-SCUs”) in the Operating Partnership with a fair value of $26,881. The Company recorded a debt premium of
$10,552, computed using an estimated market interest rate of 5.00%, since the debt assumed was at an above-market interest
rate compared to similar debt instruments at the date of acquisition. The terms of the L-SCUs are described in Note 9.
The Company may elect to acquire the remaining 30% ownership interest in Laurel Park Place, or a portion thereof, at any
time following the acquisition date for a purchase price of $14,000, which will be paid either through the issuance of common
units of limited partnership interest in the Operating Partnership or with cash, at the Company’s election. If the Company
exercises its right to acquire the remaining 30% interest, or a portion thereof, prior to December 2012 through the issuance of
common units, the common units issued will not be entitled to receive distributions until after December 2012. If the Company
does not exercise its right to acquire the remaining 30% interest by December 2012, then the partner owning that interest will
thereafter receive a preferred return equal to the greater of 12% or the 10-year treasury rate plus 800 basis points on the portion
of its joint venture interest that has not yet been acquired by the Company. The Company receives all of the profits and
losses of Laurel Park Place and is responsible for all of its debt. The $14,000 value of the minority partner’s interest has been
recorded in Accounts Payable and Accrued Liabilities.
On July 14, 2005, the Company acquired The Mall of Acadiana, a super-regional mall in Lafayette, LA, for a cash purchase
price, including transaction costs, of $175,204. The Company also entered into ten-year lease agreements for 13.4 acres of land
adjacent to The Mall of Acadiana, which provide the Company the right to purchase the land for a cash purchase price of
$3,327 during the first year of the lease term, $3,510 during the second year and amounts increasing by 10% per year for
each year of the lease term thereafter. After the first year, the seller may put the land to the Company for a price equal to the
amounts set forth in the previous sentence. The Company also obtained a ten-year option to acquire another adjacent
14.9 acre tract of land for a cash purchase price of $3,245 during the first six months of the option, which increases to $3,407
during the second six months of the option and to $3,570 during the remaining nine years of the option. The Company acquired
the 13.4 acre tract of land in 2006.
On November 7, 2005, the Company acquired Layton Hills Mall in Salt Lake City, UT, for a cash purchase price, including
transaction costs, of $120,926. The Company funded a portion of the purchase price with a new, short-term loan of $102,850
that bore interest at the London Interbank Offered Rate (“LIBOR”) plus 95 basis points. The Company retired this loan in May 2006.
On November 16, 2005, the Company acquired Oak Park Mall in Overland, KS, Hickory Point Mall in Forsyth, IL, and
Eastland Mall in Bloomington, IL, for a purchase price, including transaction costs, of $508,180, which consisted of $127,111 in
cash, the assumption of $335,100 of interest-only, non-recourse loans that bear interest at a stated rate of 5.85% and mature
in November 2015 and the issuance of 1,144,924 Series K special common units (the “K-SCUs”) of limited partnership interest
in the Operating Partnership with a fair value of $45,969. The Company funded part of the cash portion of the purchase price
with a new, non-recourse loan of $33,150 that bears interest at 5.85% and matures in November 2015. The terms of the K-SCUs
are described in Note 9.
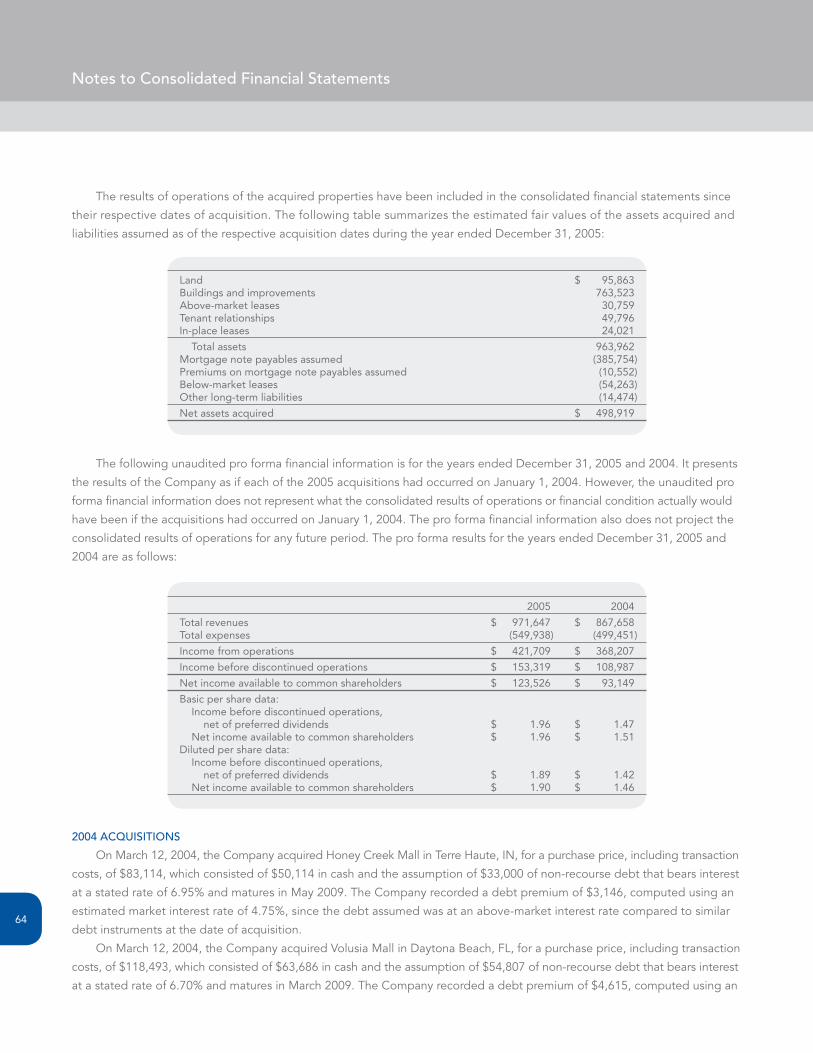
Notes to Consolidated Financial Statements
64
The results of operations of the acquired properties have been included in the consolidated financial statements since
their respective dates of acquisition. The following table summarizes the estimated fair values of the assets acquired and
liabilities assumed as of the respective acquisition dates during the year ended December 31, 2005:
Land $ 95,863Buildings and improvements 763,523Above-market leases 30,759Tenant relationships 49,796In-place leases 24,021
Total assets 963,962Mortgage note payables assumed (385,754)Premiums on mortgage note payables assumed (10,552)Below-market leases (54,263)Other long-term liabilities (14,474)
Net assets acquired $ 498,919
The following unaudited pro forma financial information is for the years ended December 31, 2005 and 2004. It presents
the results of the Company as if each of the 2005 acquisitions had occurred on January 1, 2004. However, the unaudited pro
forma financial information does not represent what the consolidated results of operations or financial condition actually would
have been if the acquisitions had occurred on January 1, 2004. The pro forma financial information also does not project the
consolidated results of operations for any future period. The pro forma results for the years ended December 31, 2005 and
2004 are as follows:
2005 2004
Total revenues $ 971,647 $ 867,658Total expenses (549,938) (499,451)
Income from operations $ 421,709 $ 368,207
Income before discontinued operations $ 153,319 $ 108,987
Net income available to common shareholders $ 123,526 $ 93,149
Basic per share data: Income before discontinued operations, net of preferred dividends $ 1.96 $ 1.47 Net income available to common shareholders $ 1.96 $ 1.51Diluted per share data: Income before discontinued operations, net of preferred dividends $ 1.89 $ 1.42 Net income available to common shareholders $ 1.90 $ 1.46
2004 ACquISItIONS
On March 12, 2004, the Company acquired Honey Creek Mall in Terre Haute, IN, for a purchase price, including transaction
costs, of $83,114, which consisted of $50,114 in cash and the assumption of $33,000 of non-recourse debt that bears interest
at a stated rate of 6.95% and matures in May 2009. The Company recorded a debt premium of $3,146, computed using an
estimated market interest rate of 4.75%, since the debt assumed was at an above-market interest rate compared to similar
debt instruments at the date of acquisition.
On March 12, 2004, the Company acquired Volusia Mall in Daytona Beach, FL, for a purchase price, including transaction
costs, of $118,493, which consisted of $63,686 in cash and the assumption of $54,807 of non-recourse debt that bears interest
at a stated rate of 6.70% and matures in March 2009. The Company recorded a debt premium of $4,615, computed using an
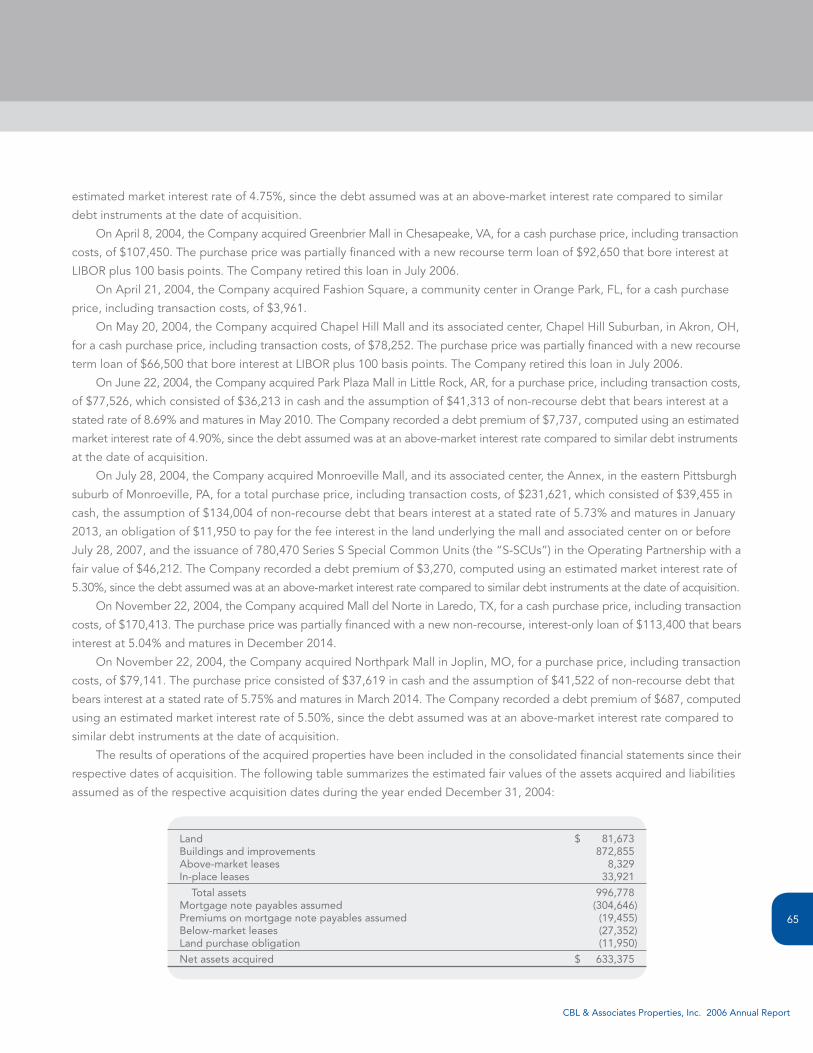
CBL & Associates Properties, Inc. 2006 Annual Report
65
estimated market interest rate of 4.75%, since the debt assumed was at an above-market interest rate compared to similar
debt instruments at the date of acquisition.
On April 8, 2004, the Company acquired Greenbrier Mall in Chesapeake, VA, for a cash purchase price, including transaction
costs, of $107,450. The purchase price was partially financed with a new recourse term loan of $92,650 that bore interest at
LIBOR plus 100 basis points. The Company retired this loan in July 2006.
On April 21, 2004, the Company acquired Fashion Square, a community center in Orange Park, FL, for a cash purchase
price, including transaction costs, of $3,961.
On May 20, 2004, the Company acquired Chapel Hill Mall and its associated center, Chapel Hill Suburban, in Akron, OH,
for a cash purchase price, including transaction costs, of $78,252. The purchase price was partially financed with a new recourse
term loan of $66,500 that bore interest at LIBOR plus 100 basis points. The Company retired this loan in July 2006.
On June 22, 2004, the Company acquired Park Plaza Mall in Little Rock, AR, for a purchase price, including transaction costs,
of $77,526, which consisted of $36,213 in cash and the assumption of $41,313 of non-recourse debt that bears interest at a
stated rate of 8.69% and matures in May 2010. The Company recorded a debt premium of $7,737, computed using an estimated
market interest rate of 4.90%, since the debt assumed was at an above-market interest rate compared to similar debt instruments
at the date of acquisition.
On July 28, 2004, the Company acquired Monroeville Mall, and its associated center, the Annex, in the eastern Pittsburgh
suburb of Monroeville, PA, for a total purchase price, including transaction costs, of $231,621, which consisted of $39,455 in
cash, the assumption of $134,004 of non-recourse debt that bears interest at a stated rate of 5.73% and matures in January
2013, an obligation of $11,950 to pay for the fee interest in the land underlying the mall and associated center on or before
July 28, 2007, and the issuance of 780,470 Series S Special Common Units (the “S-SCUs”) in the Operating Partnership with a
fair value of $46,212. The Company recorded a debt premium of $3,270, computed using an estimated market interest rate of
5.30%, since the debt assumed was at an above-market interest rate compared to similar debt instruments at the date of acquisition.
On November 22, 2004, the Company acquired Mall del Norte in Laredo, TX, for a cash purchase price, including transaction
costs, of $170,413. The purchase price was partially financed with a new non-recourse, interest-only loan of $113,400 that bears
interest at 5.04% and matures in December 2014.
On November 22, 2004, the Company acquired Northpark Mall in Joplin, MO, for a purchase price, including transaction
costs, of $79,141. The purchase price consisted of $37,619 in cash and the assumption of $41,522 of non-recourse debt that
bears interest at a stated rate of 5.75% and matures in March 2014. The Company recorded a debt premium of $687, computed
using an estimated market interest rate of 5.50%, since the debt assumed was at an above-market interest rate compared to
similar debt instruments at the date of acquisition.
The results of operations of the acquired properties have been included in the consolidated financial statements since their
respective dates of acquisition. The following table summarizes the estimated fair values of the assets acquired and liabilities
assumed as of the respective acquisition dates during the year ended December 31, 2004:
Land $ 81,673Buildings and improvements 872,855Above-market leases 8,329In-place leases 33,921
Total assets 996,778Mortgage note payables assumed (304,646)Premiums on mortgage note payables assumed (19,455)Below-market leases (27,352)Land purchase obligation (11,950)
Net assets acquired $ 633,375

Notes to Consolidated Financial Statements
66
The following unaudited pro forma financial information is for the year ended December 31, 2004. It presents the results
of the Company as if each of the 2004 acquisitions had occurred on January 1, 2004. However, the unaudited pro forma financial
information does not represent what the consolidated results of operations or financial condition actually would have been if
the acquisitions had occurred on January 1, 2004. The pro forma financial information also does not project the consolidated
results of operations for any future period. The pro forma results for the year ended December 31, 2004 are as follows:
Total revenues $ 836,672Total expenses (470,833)
Income from operations $ 365,839
Income before discontinued operations $ 120,881
Net income available to common shareholders $ 105,043
Basic per share data: Income before discontinued operations, net of preferred dividends $ 1.67 Net income available to common shareholders $ 1.71Diluted per share data: Income before discontinued operations, net of preferred dividends $ 1.60 Net income available to common shareholders $ 1.64
Note 4.DiscontinuedOperationsDuring May 2006, the Company sold three community centers for an aggregate sales price of $42,280 and recognized
a gain of $7,215. The Company also sold two community centers in May 2006 for an aggregate sales price of $63,000 and
recognized a loss on impairment of real estate assets of $274.
All five of these community centers were sold to Galileo America LLC (“Galileo America”) in connection with a put right
the Company had previously entered into with Galileo America. The Company, as tenant, entered into separate master lease
agreements with Galileo America, as landlord, covering a total of three spaces in the properties sold to Galileo America. Under
each master lease agreement, the Company is obligated to pay Galileo America an agreed-upon minimum annual rent, plus a
pro rata share of common area maintenance expenses and real estate taxes, for each designated space for a term of two years
from the closing date. The Company had a liability of $252 at December 31, 2006 for the amounts to be paid over the remaining
terms of the master lease obligations. To the extent the Company is relieved of its obligations under the master lease agreements
as a result of leasing the spaces to third parties, the Company will recognize additional gain on sale of real estate assets.
During 2005, the Company sold six community centers for an aggregate sales price of $12,600. The Company previously
recognized an aggregate loss on impairment of real estate assets of $617 on these community centers in 2004. Additionally,
the Company determined that two community centers met the criteria to be reflected as held for sale as of December 31, 2005
and recognized a loss on impairment of $1,029.
During 2004, the Company sold three community centers for a total sales price $7,250 and recognized a total gain of $845
on two of the community centers that is recorded as gain on discontinued operations. The Company recognized a loss of
$114 in December 2004 on one of the community centers, which is included in loss on impairment of real estate assets in the
consolidated statement of operations.
Total revenues of the centers described above that are included in discontinued operations were $4,934, $4,796 and
$3,004 in 2006, 2005 and 2004, respectively. All periods presented have been adjusted to reflect the operations of the centers
described above as discontinued operations.

CBL & Associates Properties, Inc. 2006 Annual Report
67
Note 5.JointVentures
uNCONSOlIDAtED AFFIlIAtES
At December 31, 2006, the Company had investments in the following 14 partnerships and joint ventures, which are
accounted for using the equity method of accounting:
Company’s JointVenture PropertyName Interest
Governor’sSquareIB Governor’sPlaza 50.00 %Governor’sSquareCompany Governor’sSquare 47.50 %HighPointeCommons,LP HighPointeCommons 50.00 %ImperialValleyMallL.P. ImperialValleyMall 60.00 %ImperialValleyPeripheralL.P. ImperialValleyMall(vacantland) 60.00 %ImperialValleyCommonsL.P. ImperialValleyCommons 60.00 %KentuckyOaksMallCompany KentuckyOaksMall 50.00 %MallofSouthCarolinaL.P. CoastalGrand–MyrtleBeach 50.00 %MallofSouthCarolinaOutparcelL.P. CoastalGrand–MyrtleBeach(vacantland)50.00 %MallShoppingCenterCompany PlazadelSol 50.60 %N.DaltonBypass,LLC HammondCreekCommons 51.00 %ParkwayPlaceL.P. ParkwayPlace 45.00 %TriangleTownMemberLLC TriangleTownCenter,TriangleTown CommonsandTriangleTownPlace 50.00 %YorkTownCenter,LP YorkTownCenter 50.00 %
Condensed combined financial statement information of the unconsolidated affiliates is presented as follows:
December 31,
2006 2005
Assets:
Net investment in real estate assets $ 588,300 $ 586,715Other assets 37,047 37,759
Total assets $ 625,347 $ 624,474
Liabilities:
Mortgage and other notes payable $ 489,811 $ 474,773Other liabilities 18,526 17,270
Total liabilities 508,337 492,043
Owners’equity:
The Company 80,413 88,461Other investors 36,597 43,970
Total owners’ equity 117,010 132,431
Total liabilities and owners’ equity $ 625,347 $ 624,474

Notes to Consolidated Financial Statements
68
Year Ended December 31,
2006 2005 2004
Total revenues $ 94,785 $ 118,823 $ 109,696Depreciation and amortization (26,488) (30,273) (24,994)Other operating expenses (28,514) (32,738) (27,479)
Income from operations 39,783 55,812 57,223Interest income 176 246 138Interest expense (34,731) (35,083) (27,353)Gain on sales of real estate assets 5,244 6,717 4,555Discontinued operations – 55 1,945
Net income $ 10,472 $ 27,747 $ 36,508
All debt on these properties is non-recourse. See Note 16 for a description of guarantees the Company has issued related
to certain unconsolidated affiliates.
In December 2006, Kentucky Oaks Mall Company obtained a ten-year, non-recourse mortgage note payable of $30,000
that has a fixed interest rate of 5.27% and matures in January 2017. The net proceeds were used to retire the outstanding
borrowings of $29,684 under the previous mortgage loan.
In September 2004, Mall of South Carolina L.P. obtained a long-term, non-recourse, fixed-rate mortgage loan totaling
$118,000. The loan is comprised of a $100,000 A-note to a financial institution that bears interest at 5.09%, which matures in
September 2014, and two ten-year B-notes of $9,000 each that bear interest at 7.75% and mature in September 2014. The
Company and its third party partner in Mall of South Carolina L.P. each hold one of the B-notes. The total net proceeds from
these loans were used to retire $80,493 of outstanding borrowings under the construction loan that partially financed the
development of Coastal Grand – Myrtle Beach.
In September 2005, Imperial Valley Mall L.P. obtained a ten-year, non-recourse mortgage note payable of $60,000 that has
a fixed interest rate of 4.985% and matures in September 2015. The proceeds of the loan were used to retire the outstanding
borrowings of $58,265 under the construction loan that was incurred to develop Imperial Valley Mall.
On November 16, 2005, the Company formed a 50/50 joint venture with Jacobs to own Triangle Town Center and its
associated and lifestyle centers, Triangle Town Place and Triangle Town Commons, in Raleigh, NC. The Company assumed
management, leasing and any future development responsibilities of the properties.
Jacobs’ initial contribution consisted of the three shopping centers and the Company made an initial cash contribution of
$1,560. Concurrent with its formation, the joint venture entered into a new ten-year, fixed rate non-recourse loan of $200,000,
secured by the collective centers. The proceeds from the loan were used to retire an existing construction loan totaling $121,828
and the balance was paid to Jacobs as a partial return of Jacobs’ equity. The joint venture equity will be equalized between
Jacobs and the Company through future contributions by the Company and through property cash flow distributions.
Under the terms of the joint venture agreement, the Company is required to fund any additional equity necessary for capital
expenditures, including future development or expansion of the property, and any operating deficits of the joint venture. The
Company has guaranteed funding of such items up to a maximum of $50,000. The joint venture’s profits are allocated 50/50 to
Jacobs and the Company. The Company receives a preferred return on its invested capital in the joint venture and will, after
payment of such preferred return and repayment of the Company’s invested capital, and repayment of the balance of Jacobs’
equity, share equally with Jacobs in the joint venture’s cash flows.
gAlIlEO AMERICA JOINt vENtuRE
On September 24, 2003, the Company formed Galileo America, a joint venture with Galileo America, Inc., the U.S. affiliate
of Australia-based Galileo America Shopping Trust, to invest in community centers throughout the United States. The arrangement
provided for the Company to sell, in three phases, its interests in 51 community centers for a total price of $516,000 plus a
10% interest in Galileo America.

CBL & Associates Properties, Inc. 2006 Annual Report
69
The first phase of the transaction closed on October 23, 2003, when the Company sold its interests in 41 community centers
to Galileo America for $393,925, which consisted of $250,705 in cash, the retirement of $24,922 of debt on one of the com-
munity centers, a note receivable of $4,813, Galileo America’s assumption of $93,037 in debt and $20,448 representing the
Company’s 10% interest in Galileo America. The Company used the net proceeds to fund escrow amounts used in like-kind
exchange acquisitions and to reduce outstanding borrowings under the Company’s credit facilities. The Company recognized
a gain of $71,886 from the first phase and recorded its investment in Galileo America at the carryover basis of the real estate
assets contributed for its 10% interest. The note receivable was paid subsequent to December 31, 2003.
The second phase of the Galileo America transaction closed on January 5, 2004, when the Company sold its interest in
six community centers for $92,375, which consisted of $62,687 in cash, the retirement of $25,953 of debt on one of the com-
munity centers, the joint venture’s assumption of $2,816 of debt and closing costs of $919. The real estate assets and related
mortgage notes payable of the properties in the second phase were reflected as held for sale from October 23, 2003, the
date that it was determined these assets met the criteria to be reflected as held for sale. There was no depreciation expense
recorded on these assets subsequent to October 23, 2003.
The Company sold a community center expansion to Galileo America during September 2004 for $3,447 in cash. The
Company recognized gain of $1,316 to the extent of the third party partner’s ownership interest and recorded an investment
of $147 in Galileo America at the carryover basis of the real estate assets contributed for its 10% interest.
In October 2004, the Company sold its interests in one community center to Galileo America for a purchase price of $17,900,
which consisted of $2,900 in cash, Galileo America’s assumption of $10,500 of debt and a limited partnership interest in Galileo
America, Inc. The community center was originally scheduled to be included in the third phase of the transaction that closed
in January 2005. The Company recognized a gain of $2,840 on the sale of this property and recorded an investment of $3,820
in Galileo America at the carryover basis of the real estate assets contributed for its 10% interest in this property.
The third phase of the joint venture closed on January 5, 2005, when the Company sold its interests in two power centers,
one community center and one community center expansion to Galileo America for $58,600, which consisted of $42,529 in
cash, the joint venture’s assumption of $12,141 of debt, $3,596 representing the Company’s interest in Galileo America and
closing costs of $334. The real estate assets and related mortgage notes payable of the properties in the third phase were
reflected as held for sale as of January 1, 2004, the date that it was determined these assets met the criteria to be reflected as
held for sale. The Company did not record any depreciation expense on these assets during 2004. The Company recognized
a loss on impairment of real estate assets of $1,947 in December 2004 and an additional loss on impairment of real estate
assets of $262 during the year ended December 31, 2005 related to the properties included in the third phase.
The Company, as tenant, entered into separate master lease agreements with Galileo America, as landlord, covering certain
spaces in certain of the properties sold to the joint venture. Under each master lease agreement, the Company was obligated
to pay Galileo America an agreed-upon minimum annual rent, plus a pro rata share of common area maintenance expenses and
real estate taxes, for each designated space for a term of five years from the applicable property’s closing date. Two properties
in the first phase and one in the second phase were subject to master lease agreements. During 2005 and 2004, the Company
recognized gain of $2,505 and $7,206, respectively, as a result of being relieved of its obligation under the master lease
arrangements as spaces were leased to third parties.
The Company also received $8,000 of additional contingent consideration since, as the exclusive manager of the properties,
it achieved certain leasing objectives related to spaces that were vacant, or projected to soon be vacant, at the time the first
phase closed. The Company earned $4,167 in 2004 for leasing objectives that were met during 2004, of which $3,750 was
recognized as gain on sales of real estate assets and $417, representing the portion attributable to the Company’s ownership
interest, was recorded as a reduction of the Company’s investment in Galileo America.
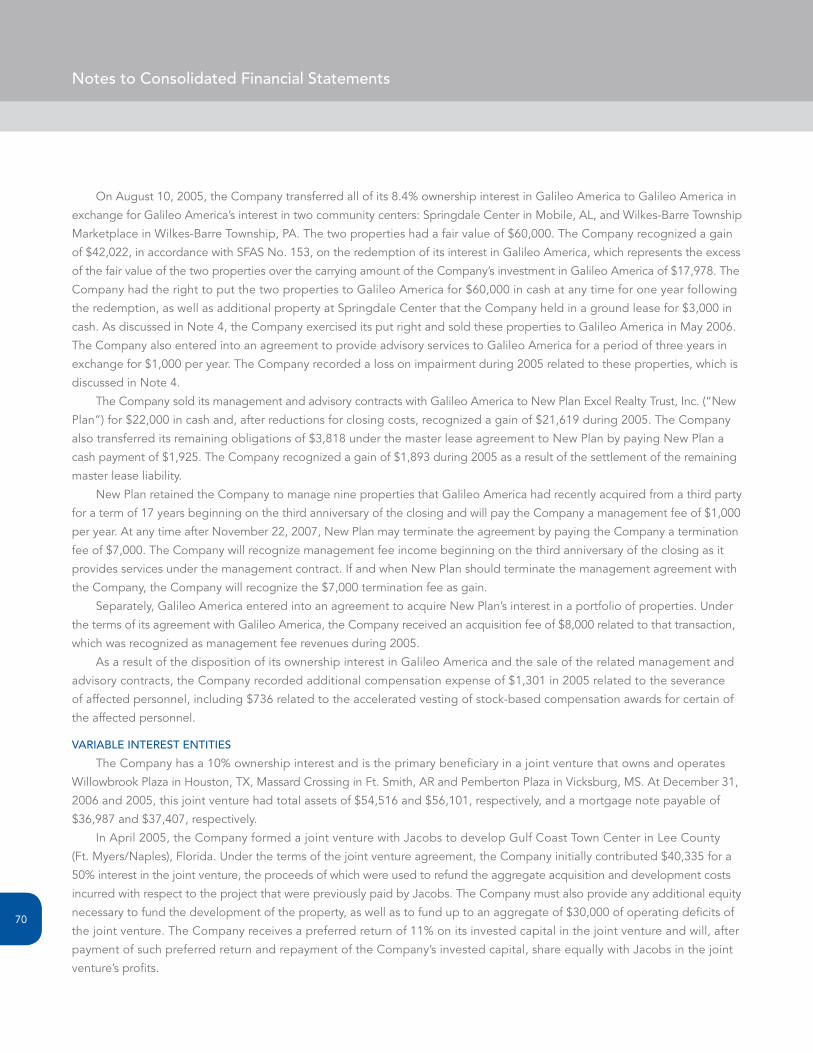
Notes to Consolidated Financial Statements
70
On August 10, 2005, the Company transferred all of its 8.4% ownership interest in Galileo America to Galileo America in
exchange for Galileo America’s interest in two community centers: Springdale Center in Mobile, AL, and Wilkes-Barre Township
Marketplace in Wilkes-Barre Township, PA. The two properties had a fair value of $60,000. The Company recognized a gain
of $42,022, in accordance with SFAS No. 153, on the redemption of its interest in Galileo America, which represents the excess
of the fair value of the two properties over the carrying amount of the Company’s investment in Galileo America of $17,978. The
Company had the right to put the two properties to Galileo America for $60,000 in cash at any time for one year following
the redemption, as well as additional property at Springdale Center that the Company held in a ground lease for $3,000 in
cash. As discussed in Note 4, the Company exercised its put right and sold these properties to Galileo America in May 2006.
The Company also entered into an agreement to provide advisory services to Galileo America for a period of three years in
exchange for $1,000 per year. The Company recorded a loss on impairment during 2005 related to these properties, which is
discussed in Note 4.
The Company sold its management and advisory contracts with Galileo America to New Plan Excel Realty Trust, Inc. (“New
Plan”) for $22,000 in cash and, after reductions for closing costs, recognized a gain of $21,619 during 2005. The Company
also transferred its remaining obligations of $3,818 under the master lease agreement to New Plan by paying New Plan a
cash payment of $1,925. The Company recognized a gain of $1,893 during 2005 as a result of the settlement of the remaining
master lease liability.
New Plan retained the Company to manage nine properties that Galileo America had recently acquired from a third party
for a term of 17 years beginning on the third anniversary of the closing and will pay the Company a management fee of $1,000
per year. At any time after November 22, 2007, New Plan may terminate the agreement by paying the Company a termination
fee of $7,000. The Company will recognize management fee income beginning on the third anniversary of the closing as it
provides services under the management contract. If and when New Plan should terminate the management agreement with
the Company, the Company will recognize the $7,000 termination fee as gain.
Separately, Galileo America entered into an agreement to acquire New Plan’s interest in a portfolio of properties. Under
the terms of its agreement with Galileo America, the Company received an acquisition fee of $8,000 related to that transaction,
which was recognized as management fee revenues during 2005.
As a result of the disposition of its ownership interest in Galileo America and the sale of the related management and
advisory contracts, the Company recorded additional compensation expense of $1,301 in 2005 related to the severance
of affected personnel, including $736 related to the accelerated vesting of stock-based compensation awards for certain of
the affected personnel.
vARIABlE INtERESt ENtItIES
The Company has a 10% ownership interest and is the primary beneficiary in a joint venture that owns and operates
Willowbrook Plaza in Houston, TX, Massard Crossing in Ft. Smith, AR and Pemberton Plaza in Vicksburg, MS. At December 31,
2006 and 2005, this joint venture had total assets of $54,516 and $56,101, respectively, and a mortgage note payable of
$36,987 and $37,407, respectively.
In April 2005, the Company formed a joint venture with Jacobs to develop Gulf Coast Town Center in Lee County
(Ft. Myers/Naples), Florida. Under the terms of the joint venture agreement, the Company initially contributed $40,335 for a
50% interest in the joint venture, the proceeds of which were used to refund the aggregate acquisition and development costs
incurred with respect to the project that were previously paid by Jacobs. The Company must also provide any additional equity
necessary to fund the development of the property, as well as to fund up to an aggregate of $30,000 of operating deficits of
the joint venture. The Company receives a preferred return of 11% on its invested capital in the joint venture and will, after
payment of such preferred return and repayment of the Company’s invested capital, share equally with Jacobs in the joint
venture’s profits.
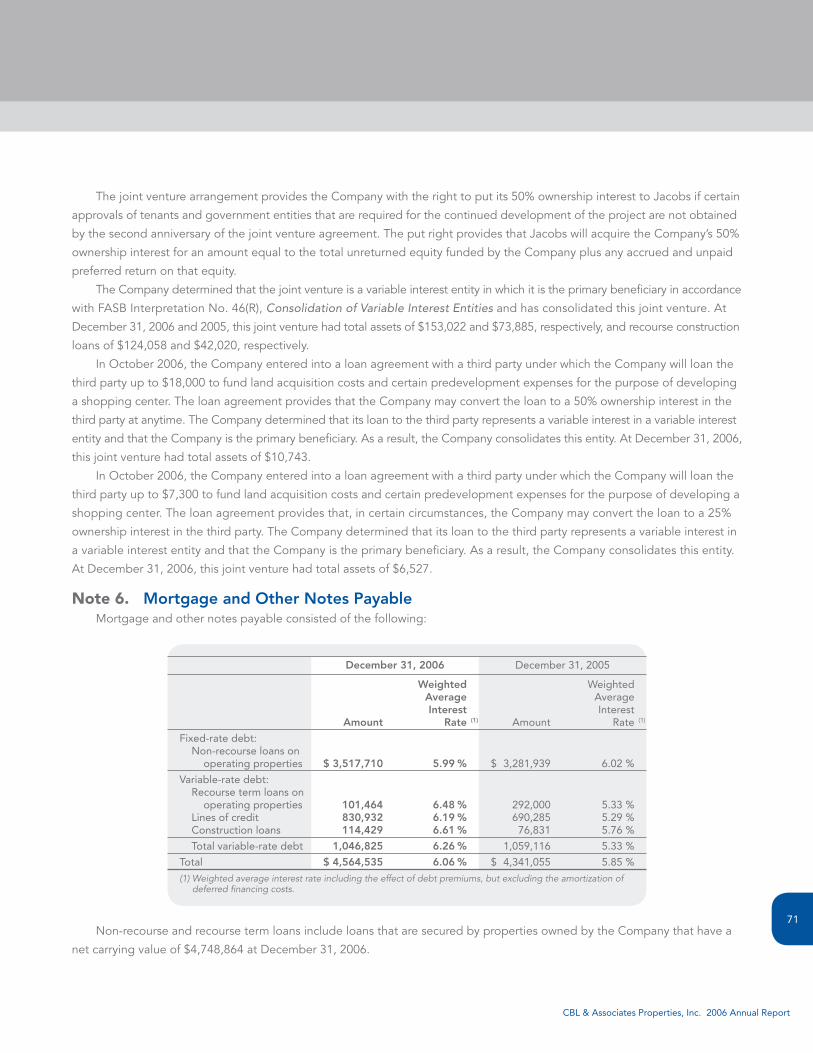
CBL & Associates Properties, Inc. 2006 Annual Report
71
The joint venture arrangement provides the Company with the right to put its 50% ownership interest to Jacobs if certain
approvals of tenants and government entities that are required for the continued development of the project are not obtained
by the second anniversary of the joint venture agreement. The put right provides that Jacobs will acquire the Company’s 50%
ownership interest for an amount equal to the total unreturned equity funded by the Company plus any accrued and unpaid
preferred return on that equity.
The Company determined that the joint venture is a variable interest entity in which it is the primary beneficiary in accordance
with FASB Interpretation No. 46(R), Consolidation of Variable Interest Entities and has consolidated this joint venture. At
December 31, 2006 and 2005, this joint venture had total assets of $153,022 and $73,885, respectively, and recourse construction
loans of $124,058 and $42,020, respectively.
In October 2006, the Company entered into a loan agreement with a third party under which the Company will loan the
third party up to $18,000 to fund land acquisition costs and certain predevelopment expenses for the purpose of developing
a shopping center. The loan agreement provides that the Company may convert the loan to a 50% ownership interest in the
third party at anytime. The Company determined that its loan to the third party represents a variable interest in a variable interest
entity and that the Company is the primary beneficiary. As a result, the Company consolidates this entity. At December 31, 2006,
this joint venture had total assets of $10,743.
In October 2006, the Company entered into a loan agreement with a third party under which the Company will loan the
third party up to $7,300 to fund land acquisition costs and certain predevelopment expenses for the purpose of developing a
shopping center. The loan agreement provides that, in certain circumstances, the Company may convert the loan to a 25%
ownership interest in the third party. The Company determined that its loan to the third party represents a variable interest in
a variable interest entity and that the Company is the primary beneficiary. As a result, the Company consolidates this entity.
At December 31, 2006, this joint venture had total assets of $6,527.
Note 6.MortgageandOtherNotesPayableMortgage and other notes payable consisted of the following:
December31,2006 December 31, 2005
Weighted Weighted Average Average Interest Interest Amount Rate(1) Amount Rate (1)
Fixed-rate debt: Non-recourse loans on operating properties $3,517,710 5.99% $ 3,281,939 6.02 %
Variable-rate debt: Recourse term loans on operating properties 101,464 6.48% 292,000 5.33 % Lines of credit 830,932 6.19% 690,285 5.29 % Construction loans 114,429 6.61% 76,831 5.76 %
Total variable-rate debt 1,046,825 6.26% 1,059,116 5.33 %
Total $4,564,535 6.06% $ 4,341,055 5.85 %
(1)Weightedaverageinterestrateincludingtheeffectofdebtpremiums,butexcludingtheamortizationofdeferredfinancingcosts.
Non-recourse and recourse term loans include loans that are secured by properties owned by the Company that have a
net carrying value of $4,748,864 at December 31, 2006.
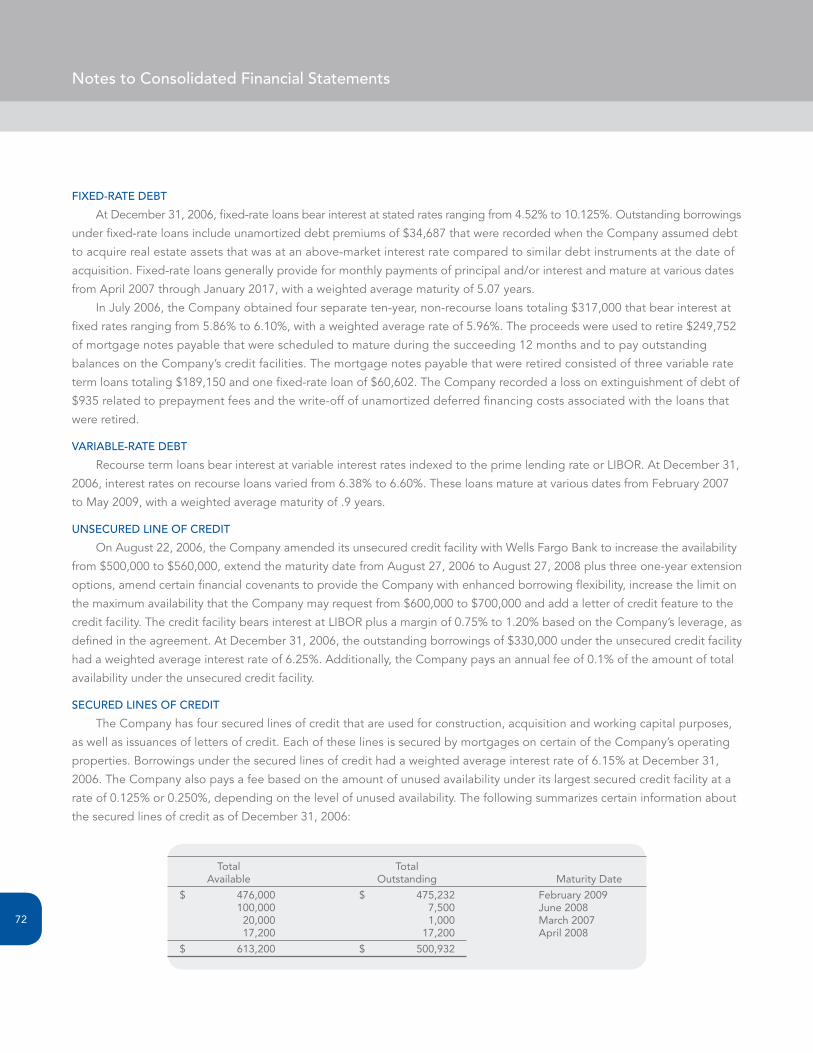
Notes to Consolidated Financial Statements
72
FIxED-RAtE DEBt
At December 31, 2006, fixed-rate loans bear interest at stated rates ranging from 4.52% to 10.125%. Outstanding borrowings
under fixed-rate loans include unamortized debt premiums of $34,687 that were recorded when the Company assumed debt
to acquire real estate assets that was at an above-market interest rate compared to similar debt instruments at the date of
acquisition. Fixed-rate loans generally provide for monthly payments of principal and/or interest and mature at various dates
from April 2007 through January 2017, with a weighted average maturity of 5.07 years.
In July 2006, the Company obtained four separate ten-year, non-recourse loans totaling $317,000 that bear interest at
fixed rates ranging from 5.86% to 6.10%, with a weighted average rate of 5.96%. The proceeds were used to retire $249,752
of mortgage notes payable that were scheduled to mature during the succeeding 12 months and to pay outstanding
balances on the Company’s credit facilities. The mortgage notes payable that were retired consisted of three variable rate
term loans totaling $189,150 and one fixed-rate loan of $60,602. The Company recorded a loss on extinguishment of debt of
$935 related to prepayment fees and the write-off of unamortized deferred financing costs associated with the loans that
were retired.
vARIABlE-RAtE DEBt
Recourse term loans bear interest at variable interest rates indexed to the prime lending rate or LIBOR. At December 31,
2006, interest rates on recourse loans varied from 6.38% to 6.60%. These loans mature at various dates from February 2007
to May 2009, with a weighted average maturity of .9 years.
uNSECuRED lINE OF CREDIt
On August 22, 2006, the Company amended its unsecured credit facility with Wells Fargo Bank to increase the availability
from $500,000 to $560,000, extend the maturity date from August 27, 2006 to August 27, 2008 plus three one-year extension
options, amend certain financial covenants to provide the Company with enhanced borrowing flexibility, increase the limit on
the maximum availability that the Company may request from $600,000 to $700,000 and add a letter of credit feature to the
credit facility. The credit facility bears interest at LIBOR plus a margin of 0.75% to 1.20% based on the Company’s leverage, as
defined in the agreement. At December 31, 2006, the outstanding borrowings of $330,000 under the unsecured credit facility
had a weighted average interest rate of 6.25%. Additionally, the Company pays an annual fee of 0.1% of the amount of total
availability under the unsecured credit facility.
SECuRED lINES OF CREDIt
The Company has four secured lines of credit that are used for construction, acquisition and working capital purposes,
as well as issuances of letters of credit. Each of these lines is secured by mortgages on certain of the Company’s operating
properties. Borrowings under the secured lines of credit had a weighted average interest rate of 6.15% at December 31,
2006. The Company also pays a fee based on the amount of unused availability under its largest secured credit facility at a
rate of 0.125% or 0.250%, depending on the level of unused availability. The following summarizes certain information about
the secured lines of credit as of December 31, 2006:
Total Total Available Outstanding Maturity Date
$ 476,000 $ 475,232 February 2009 100,000 7,500 June 2008 20,000 1,000 March 2007 17,200 17,200 April 2008
$ 613,200 $ 500,932

CBL & Associates Properties, Inc. 2006 Annual Report
73
In addition to the total borrowings outstanding on the secured credit facilities, there were letters of credit totaling $2,071
that were outstanding at December 31, 2006.
In February 2006, the Company amended one of the secured credit facilities to increase the maximum availability from
$373,000 to $476,000, extend the maturity date from February 26, 2006 to February 26, 2009 plus a one-year extension option,
increase the minimum tangible net worth requirement, as defined, from $1,000,000 to $1,370,000 and increase the limit on
the maximum availability that the Company may request from $500,000 to $650,000. In August 2006, the Company amended
this secured credit facility to reduce the interest rate from LIBOR plus 0.90% to LIBOR plus 0.80% and to amend certain financial
covenants to provide the Company with enhanced borrowing flexibility.
In June 2006, the Company amended its $100,000 secured credit facility to change the maturity date from June 1, 2007
to June 1, 2008 and to substitute certain collateral under the facility.
In August 2006, the Company amended one of its secured credit facilities to increase the availability from $10,000 to the
greater of $17,200 or the borrowing base (as defined), to reduce the interest rate from LIBOR plus 1.00% to LIBOR plus 0.80%,
to extend the maturity date from April 1, 2007 to April 1, 2008 and to amend certain financial covenants to provide the Company
with enhanced borrowing flexibility.
The secured lines of credit are secured by 22 of the Company’s properties, which had an aggregate net carrying value of
$481,390 at December 31, 2006.
lEttERS OF CREDIt
At December 31, 2006, the Company had additional secured lines of credit with a total commitment of $37,345 that can only
be used for issuing letters of credit. The total amount outstanding under these lines of credit was $16,837 at December 31, 2006.
COvENANtS AND REStRICtIONS
The secured and unsecured line of credit agreements contain, among other restrictions, certain financial covenants including
the maintenance of certain financial coverage ratios, minimum net worth requirements, and limitations on cash flow distributions.
Additionally, certain property-specific mortgage notes payable require the maintenance of debt service coverage ratios on their
respective properties. The Company was in compliance with all covenants and restrictions at December 31, 2006.
Thirty-five malls, five associated centers, three community centers and the corporate office building are owned by special
purpose entities that are included in the Company’s consolidated financial statements. The sole business purpose of the
special purpose entities is to own and operate these properties, each of which is encumbered by a commercial-mortgage-
backed-securities loan. The real estate and other assets owned by these special purpose entities are restricted under the loan
agreements in that they are not available to settle other debts of the Company. However, so long as the loans are not under
an event of default, as defined in the loan agreements, the cash flows from these properties, after payments of debt service,
operating expenses and reserves, are available for distribution to the Company.
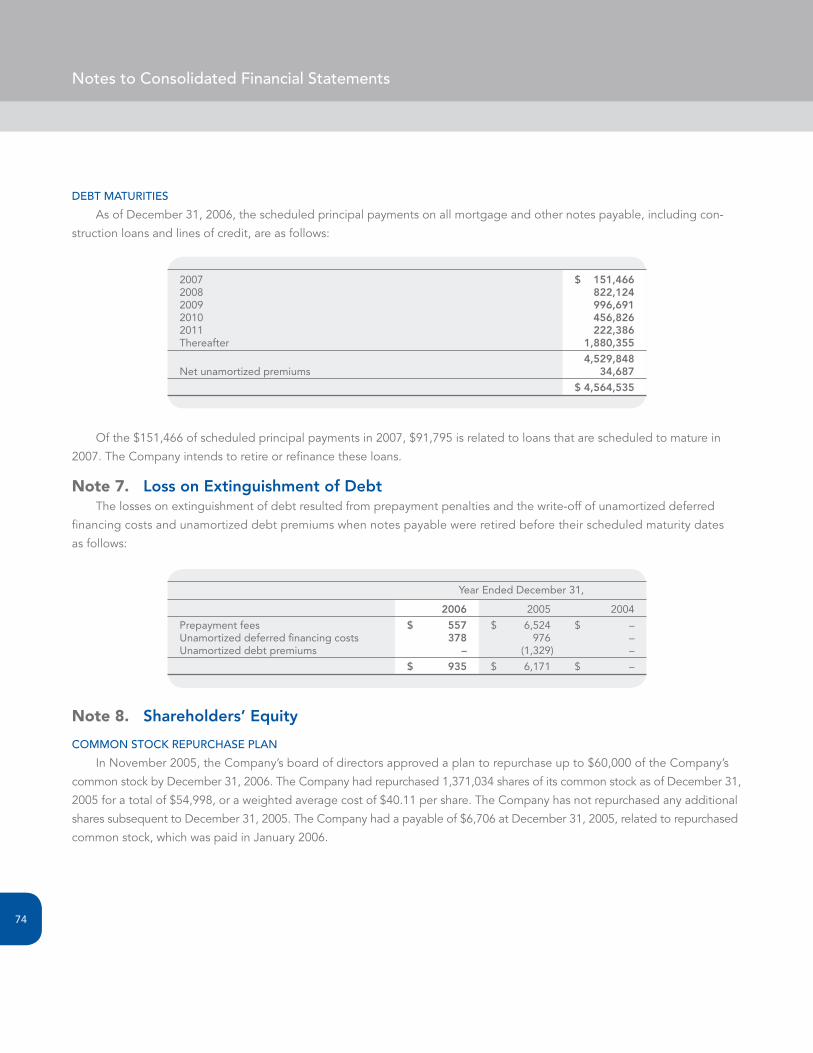
Notes to Consolidated Financial Statements
74
DEBt MAtuRItIES
As of December 31, 2006, the scheduled principal payments on all mortgage and other notes payable, including con-
struction loans and lines of credit, are as follows:
2007 $ 151,4662008 822,1242009 996,6912010 456,8262011 222,386Thereafter 1,880,355
4,529,848Net unamortized premiums 34,687
$4,564,535
Of the $151,466 of scheduled principal payments in 2007, $91,795 is related to loans that are scheduled to mature in
2007. The Company intends to retire or refinance these loans.
Note 7.LossonExtinguishmentofDebtThe losses on extinguishment of debt resulted from prepayment penalties and the write-off of unamortized deferred
financing costs and unamortized debt premiums when notes payable were retired before their scheduled maturity dates
as follows:
Year Ended December 31,
2006 2005 2004
Prepayment fees $ 557 $ 6,524 $ –Unamortized deferred financing costs 378 976 –Unamortized debt premiums – (1,329) –
$ 935 $ 6,171 $ –
Note 8.Shareholders’Equity
COMMON StOCk REPuRChASE PlAN
In November 2005, the Company’s board of directors approved a plan to repurchase up to $60,000 of the Company’s
common stock by December 31, 2006. The Company had repurchased 1,371,034 shares of its common stock as of December 31,
2005 for a total of $54,998, or a weighted average cost of $40.11 per share. The Company has not repurchased any additional
shares subsequent to December 31, 2005. The Company had a payable of $6,706 at December 31, 2005, related to repurchased
common stock, which was paid in January 2006.
CBL & Associates Properties, Inc. 2006 Annual Report
75
PREFERRED StOCk
In June 2002, the Company completed an offering of 2,000,000 shares of 8.75% Series B Cumulative Redeemable
Preferred Stock (the “Series B Preferred Stock”), having a par value of $.01 per share, at its liquidation preference of $50.00 per
share. The net proceeds of $96,370 were used to reduce outstanding balances under the Company’s credit facilities and to
retire term loans on several properties. The dividends on the Series B Preferred Stock are cumulative and accrue from the
date of issue and are payable quarterly in arrears at a rate of $4.375 per share per annum. The Series B Preferred Stock has
no stated maturity, is not subject to any sinking fund or mandatory redemption, and is not convertible into any other securities
of the Company. The Series B Preferred Stock cannot be redeemed by the Company prior to June 14, 2007. After that date,
the Company may redeem shares, in whole or in part, at any time for a cash redemption price of $50.00 per share plus accrued
and unpaid dividends.
On August 22, 2003, the Company issued 4,600,000 depositary shares in a public offering, each representing one-tenth of
a share of 7.75% Series C Cumulative Redeemable Preferred Stock (the “Series C Preferred Stock”) with a par value of $0.01 per
share. The Series C Preferred Stock has a liquidation preference of $250.00 per share ($25.00 per depositary share). The dividends
on the Series C Preferred Stock are cumulative, accrue from the date of issuance and are payable quarterly in arrears at a rate
of $19.375 per share ($1.9375 per depositary share) per annum. The Series C Preferred Stock has no stated maturity, is not
subject to any sinking fund or mandatory redemption, and is not convertible into any other securities of the Company. The
Series C Preferred Stock cannot be redeemed by the Company prior to August 22, 2008. After that date, the Company may
redeem shares, in whole or in part, at any time for a cash redemption price of $250.00 per share ($25.00 per depositary share)
plus accrued and unpaid dividends. The net proceeds of $111,227 were used to partially fund certain acquisitions discussed
in Note 3 and to reduce outstanding borrowings on the Company’s credit facilities.
On December 13, 2004, the Company issued 7,000,000 depositary shares in a public offering, each representing one-tenth
of a share of 7.375% Series D Cumulative Redeemable Preferred Stock (the “Series D Preferred Stock”) with a par value of
$0.01 per share. The Series D Preferred Stock has a liquidation preference of $250.00 per share ($25.00 per depositary share).
The dividends on the Series D Preferred Stock are cumulative, accrue from the date of issuance and are payable quarterly in
arrears at a rate of $18.4375 per share ($1.84375 per depositary share) per annum. The Series D Preferred Stock has no stated
maturity, is not subject to any sinking fund or mandatory redemption, and is not convertible into any other securities of the
Company. The Series D Preferred Stock cannot be redeemed by the Company prior to December 13, 2009. After that date,
the Company may redeem shares, in whole or in part, at any time for a cash redemption price of $250.00 per share ($25.00 per
depositary share) plus accrued and unpaid dividends. The net proceeds of $169,333 were used to reduce outstanding borrowings
on the Company’s credit facilities.
Holders of each series of preferred stock will have limited voting rights if dividends are not paid for six or more quarterly
periods and in certain other events.
DIvIDENDS
On November 2, 2006, the Company declared a cash dividend of $0.5050 per share of common stock for the quarter
ended December 31, 2006. The dividend was paid on January 16, 2007, to shareholders of record as of December 29, 2006.
The total dividend of $33,038 is included in accounts payable and accrued liabilities at December 31, 2006.
On October 5, 2005, the Company declared a special one-time cash dividend of $0.09 per share of common stock as a
result of the taxable gains generated from the sale of the Company’s management contracts with Galileo America as discussed
in Note 5. On October 27, 2005, the Company declared a cash dividend of $0.4575 per share of common stock for the quarter
ended December 31, 2005. Both dividends were paid on January 16, 2006, to shareholders of record as of December 30, 2005.
The total dividend of $34,228 is included in accounts payable and accrued liabilities at December 31, 2005.
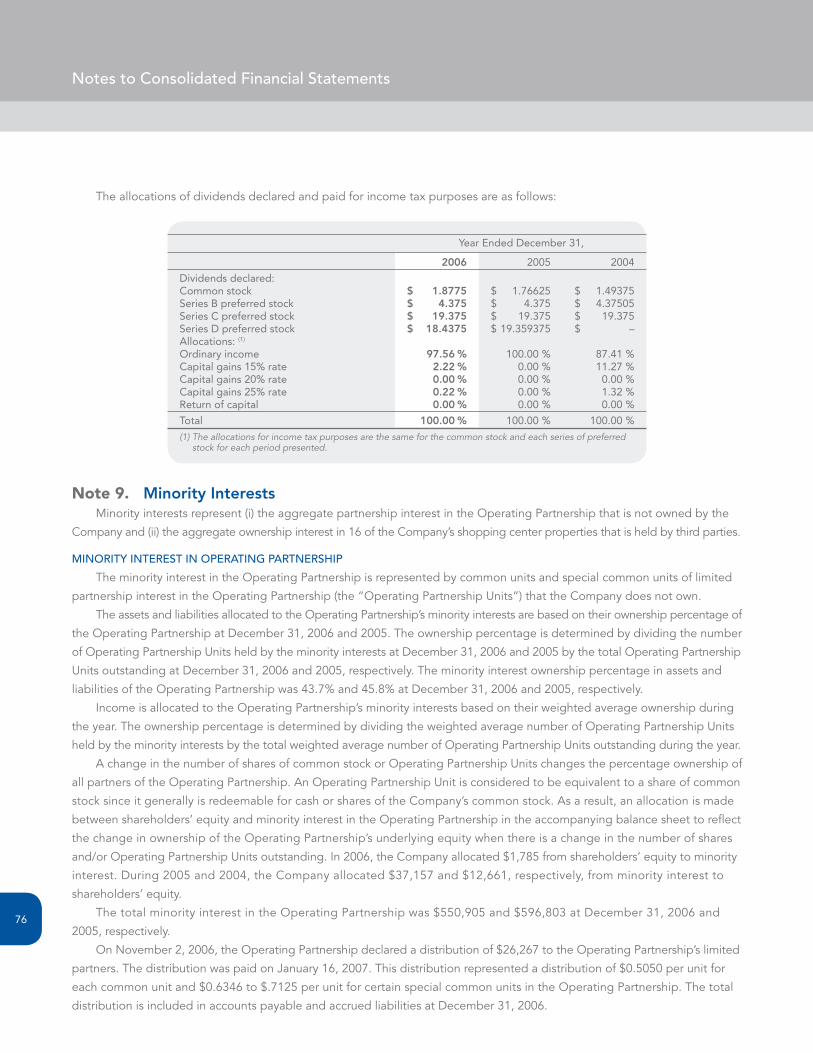
Notes to Consolidated Financial Statements
76
The allocations of dividends declared and paid for income tax purposes are as follows:
Year Ended December 31,
2006 2005 2004
Dividends declared:Common stock $ 1.8775 $ 1.76625 $ 1.49375Series B preferred stock $ 4.375 $ 4.375 $ 4.37505Series C preferred stock $ 19.375 $ 19.375 $ 19.375Series D preferred stock $ 18.4375 $ 19.359375 $ –Allocations: (1)
Ordinary income 97.56% 100.00 % 87.41 %Capital gains 15% rate 2.22% 0.00 % 11.27 %Capital gains 20% rate 0.00% 0.00 % 0.00 %Capital gains 25% rate 0.22% 0.00 % 1.32 %Return of capital 0.00% 0.00 % 0.00 %
Total 100.00% 100.00 % 100.00 %
(1)Theallocationsforincometaxpurposesarethesameforthecommonstockandeachseriesofpreferredstockforeachperiodpresented.
Note 9.MinorityInterestsMinority interests represent (i) the aggregate partnership interest in the Operating Partnership that is not owned by the
Company and (ii) the aggregate ownership interest in 16 of the Company’s shopping center properties that is held by third parties.
MINORIty INtERESt IN OPERAtINg PARtNERShIP
The minority interest in the Operating Partnership is represented by common units and special common units of limited
partnership interest in the Operating Partnership (the “Operating Partnership Units”) that the Company does not own.
The assets and liabilities allocated to the Operating Partnership’s minority interests are based on their ownership percentage of
the Operating Partnership at December 31, 2006 and 2005. The ownership percentage is determined by dividing the number
of Operating Partnership Units held by the minority interests at December 31, 2006 and 2005 by the total Operating Partnership
Units outstanding at December 31, 2006 and 2005, respectively. The minority interest ownership percentage in assets and
liabilities of the Operating Partnership was 43.7% and 45.8% at December 31, 2006 and 2005, respectively.
Income is allocated to the Operating Partnership’s minority interests based on their weighted average ownership during
the year. The ownership percentage is determined by dividing the weighted average number of Operating Partnership Units
held by the minority interests by the total weighted average number of Operating Partnership Units outstanding during the year.
A change in the number of shares of common stock or Operating Partnership Units changes the percentage ownership of
all partners of the Operating Partnership. An Operating Partnership Unit is considered to be equivalent to a share of common
stock since it generally is redeemable for cash or shares of the Company’s common stock. As a result, an allocation is made
between shareholders’ equity and minority interest in the Operating Partnership in the accompanying balance sheet to reflect
the change in ownership of the Operating Partnership’s underlying equity when there is a change in the number of shares
and/or Operating Partnership Units outstanding. In 2006, the Company allocated $1,785 from shareholders’ equity to minority
interest. During 2005 and 2004, the Company allocated $37,157 and $12,661, respectively, from minority interest to
shareholders’ equity.
The total minority interest in the Operating Partnership was $550,905 and $596,803 at December 31, 2006 and
2005, respectively.
On November 2, 2006, the Operating Partnership declared a distribution of $26,267 to the Operating Partnership’s limited
partners. The distribution was paid on January 16, 2007. This distribution represented a distribution of $0.5050 per unit for
each common unit and $0.6346 to $.7125 per unit for certain special common units in the Operating Partnership. The total
distribution is included in accounts payable and accrued liabilities at December 31, 2006.
CBL & Associates Properties, Inc. 2006 Annual Report
77
On October 27, 2005, the Operating Partnership declared a distribution of $29,014 to the Operating Partnership’s limited
partners. The distribution was paid on January 16, 2006. This distribution represented a distribution of $0.5475 per unit for
each common unit and $0.6346 to $.7125 per unit for certain special common units in the Operating Partnership. The total
distribution is included in accounts payable and accrued liabilities at December 31, 2005.
MINORIty INtERESt IN OPERAtINg PARtNERShIP-CONvERSION RIghtS
Under the terms of the Operating Partnership’s limited partnership agreement, each of the limited partners has the right
to exchange all or a portion of its partnership interests for shares of CBL’s common stock or, at CBL’s election, their cash equivalent.
When an exchange occurs, CBL assumes the limited partner’s ownership interests in the Operating Partnership. The number
of shares of common stock received by a limited partner of the Operating Partnership upon exercise of its exchange rights
will be equal, on a one-for-one basis, to the number of Operating Partnership Units exchanged by the limited partner. The
amount of cash received by the limited partner, if CBL elects to pay cash, will be based on the five-day trailing average of the
trading price at the time of exercise of the shares of common stock that would otherwise have been received by the limited
partner in the exchange. Neither the limited partnership interests in the Operating Partnership nor the shares of common stock
of CBL are subject to any right of mandatory redemption.
As of January 31, 2004, holders of 26,318,804 Series J special common units (“J-SCUs”) may exchange them for shares
of common stock or cash. The J-SCUs receive a distribution equal to that paid on the common units.
In July 2004, the Company issued 1,560,940 S-SCUs in connection with the acquisition of Monroeville Mall, which is
discussed in Note 3. The S-SCUs receive a minimum distribution of $2.53825 per unit per year for the first three years, and a
minimum distribution of $2.92875 per unit per year thereafter.
In June 2005, the Company issued 571,700 L-SCUs in connection with the acquisition of Laurel Park Place, which is discussed
in Note 3. The L-SCUs receive a minimum distribution of $0.7575 per unit per quarter ($3.03 per unit per year). Upon the earlier
to occur of June 1, 2020, or when the distribution on the common units exceeds $0.7575 per unit for four consecutive calendar
quarters, the L-SCUs will thereafter receive a distribution equal to the amount paid on the common units.
In November 2005, the Company issued 1,144,924 K-SCUs in connection with the acquisition of Oak Park Mall, Eastland Mall
and Hickory Point Mall, which is discussed in Note 3. The K-SCUs received a dividend at a rate of 6.0%, or $2.85 per K-SCU, for
the first year following the close of the transaction and will receive a dividend at a rate of 6.25%, or $2.96875 per K-SCU, thereafter.
When the quarterly distribution on the Operating Partnership’s common units exceeds the quarterly K-SCU distribution for
four consecutive quarters, the K-SCUs will receive distributions at the rate equal to that paid on the Operating Partnership’s
common units. At any time following the first anniversary of the closing date, the holders of the K-SCUs may exchange them,
on a one-for-one basis, for shares of the Company’s common stock or, at the Company’s election, their cash equivalent.
The Company issued 237,390 common units in connection with the acquisition of Panama City Mall in 2002. These common
units receive a minimum annual dividend of $1.6875 per unit until May 2012. When the distribution on the common units exceeds
$1.6875 per unit, these common units will receive a distribution equal to that paid on the common units. Additionally, if the
annual distribution on the common units should ever be less than $1.11 per unit, the $1.6875 per unit dividend will be reduced
by the amount the per unit distribution is less than $1.11 per unit. The annual distribution on the common units exceeded
$1.6875 per unit during 2005.
During 2006, holders elected to exchange 595,041 special common units and 1,480,066 common units. The Company
elected to exchange $3,610 of cash and 1,979,644 shares of common stock for these units.
During 2005, holders elected to exchange 48,618 special common units and 3,518 common units and the Company elected
to exchange $2,172 of cash for these units.
During 2004, holders elected to exchange 62,392 special common units and 683,250 common units. The Company
elected to exchange $5,949 of cash and 525,636 shares of common stock for these units.
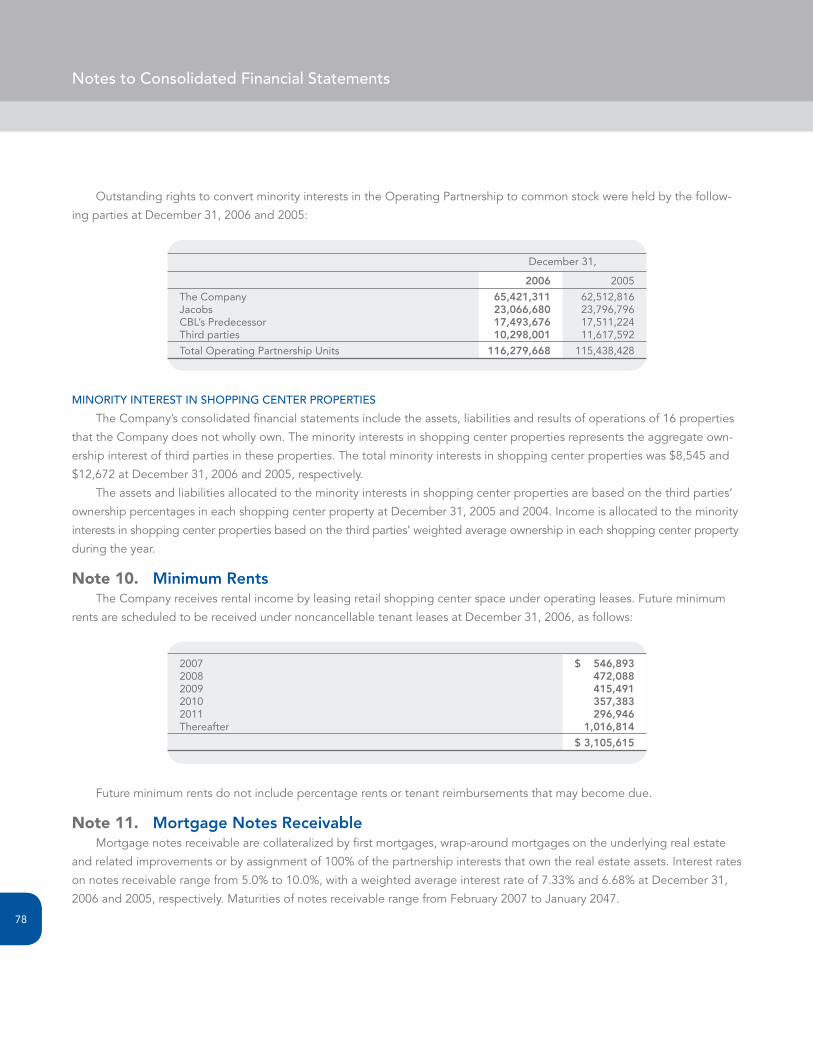
Notes to Consolidated Financial Statements
78
Outstanding rights to convert minority interests in the Operating Partnership to common stock were held by the follow-
ing parties at December 31, 2006 and 2005:
December 31,
2006 2005
The Company 65,421,311 62,512,816Jacobs 23,066,680 23,796,796CBL’s Predecessor 17,493,676 17,511,224Third parties 10,298,001 11,617,592
Total Operating Partnership Units 116,279,668 115,438,428
MINORIty INtERESt IN ShOPPINg CENtER PROPERtIES
The Company’s consolidated financial statements include the assets, liabilities and results of operations of 16 properties
that the Company does not wholly own. The minority interests in shopping center properties represents the aggregate own-
ership interest of third parties in these properties. The total minority interests in shopping center properties was $8,545 and
$12,672 at December 31, 2006 and 2005, respectively.
The assets and liabilities allocated to the minority interests in shopping center properties are based on the third parties’
ownership percentages in each shopping center property at December 31, 2005 and 2004. Income is allocated to the minority
interests in shopping center properties based on the third parties’ weighted average ownership in each shopping center property
during the year.
Note 10.MinimumRentsThe Company receives rental income by leasing retail shopping center space under operating leases. Future minimum
rents are scheduled to be received under noncancellable tenant leases at December 31, 2006, as follows:
2007 $ 546,8932008 472,0882009 415,4912010 357,3832011 296,946Thereafter 1,016,814
$3,105,615
Future minimum rents do not include percentage rents or tenant reimbursements that may become due.
Note 11.MortgageNotesReceivableMortgage notes receivable are collateralized by first mortgages, wrap-around mortgages on the underlying real estate
and related improvements or by assignment of 100% of the partnership interests that own the real estate assets. Interest rates
on notes receivable range from 5.0% to 10.0%, with a weighted average interest rate of 7.33% and 6.68% at December 31,
2006 and 2005, respectively. Maturities of notes receivable range from February 2007 to January 2047.
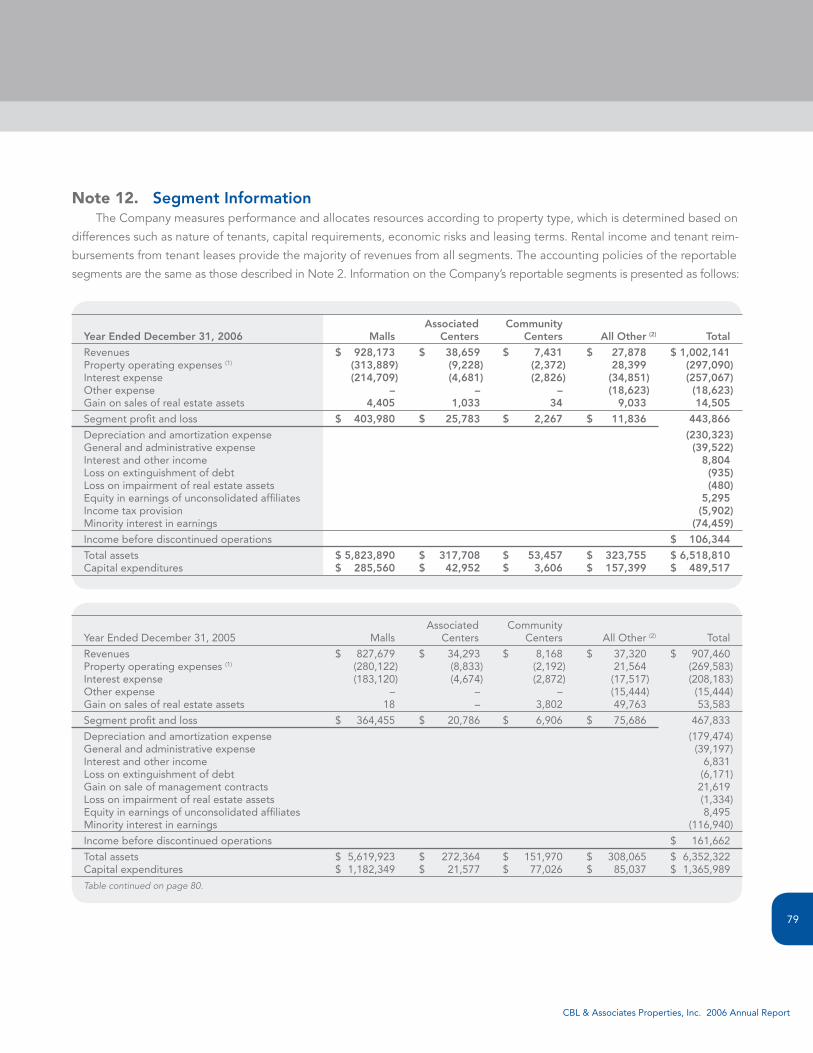
CBL & Associates Properties, Inc. 2006 Annual Report
79
Note 12.SegmentInformationThe Company measures performance and allocates resources according to property type, which is determined based on
differences such as nature of tenants, capital requirements, economic risks and leasing terms. Rental income and tenant reim-
bursements from tenant leases provide the majority of revenues from all segments. The accounting policies of the reportable
segments are the same as those described in Note 2. Information on the Company’s reportable segments is presented as follows:
Associated CommunityYearEndedDecember31,2006 Malls Centers Centers AllOther(2) Total
Revenues $ 928,173 $ 38,659 $ 7,431 $ 27,878 $1,002,141Property operating expenses (1) (313,889) (9,228) (2,372) 28,399 (297,090)Interest expense (214,709) (4,681) (2,826) (34,851) (257,067)Other expense – – – (18,623) (18,623)Gain on sales of real estate assets 4,405 1,033 34 9,033 14,505
Segment profit and loss $ 403,980 $ 25,783 $ 2,267 $ 11,836 443,866
Depreciation and amortization expense (230,323)General and administrative expense (39,522)Interest and other income 8,804Loss on extinguishment of debt (935)Loss on impairment of real estate assets (480)Equity in earnings of unconsolidated affiliates 5,295Income tax provision (5,902)Minority interest in earnings (74,459)
Income before discontinued operations $ 106,344
Total assets $5,823,890 $ 317,708 $ 53,457 $ 323,755 $6,518,810Capital expenditures $ 285,560 $ 42,952 $ 3,606 $ 157,399 $ 489,517
Associated Community Year Ended December 31, 2005 Malls Centers Centers All Other (2) Total
Revenues $ 827,679 $ 34,293 $ 8,168 $ 37,320 $ 907,460Property operating expenses (1) (280,122) (8,833) (2,192) 21,564 (269,583)Interest expense (183,120) (4,674) (2,872) (17,517) (208,183)Other expense – – – (15,444) (15,444)Gain on sales of real estate assets 18 – 3,802 49,763 53,583
Segment profit and loss $ 364,455 $ 20,786 $ 6,906 $ 75,686 467,833
Depreciation and amortization expense (179,474)General and administrative expense (39,197)Interest and other income 6,831Loss on extinguishment of debt (6,171)Gain on sale of management contracts 21,619Loss on impairment of real estate assets (1,334)Equity in earnings of unconsolidated affiliates 8,495Minority interest in earnings (116,940)
Income before discontinued operations $ 161,662
Total assets $ 5,619,923 $ 272,364 $ 151,970 $ 308,065 $ 6,352,322Capital expenditures $ 1,182,349 $ 21,577 $ 77,026 $ 85,037 $ 1,365,989
Tablecontinuedonpage80.
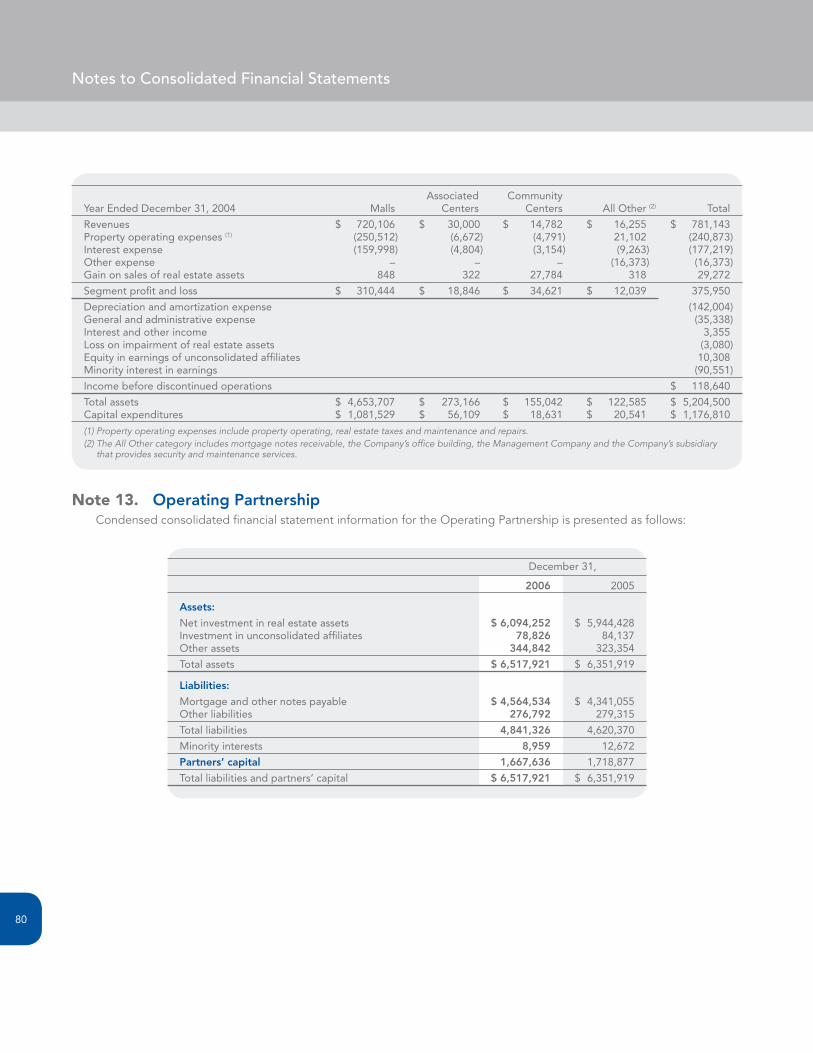
Notes to Consolidated Financial Statements
80
Associated Community Year Ended December 31, 2004 Malls Centers Centers All Other (2) Total
Revenues $ 720,106 $ 30,000 $ 14,782 $ 16,255 $ 781,143Property operating expenses (1) (250,512) (6,672) (4,791) 21,102 (240,873)Interest expense (159,998) (4,804) (3,154) (9,263) (177,219)Other expense – – – (16,373) (16,373)Gain on sales of real estate assets 848 322 27,784 318 29,272
Segment profit and loss $ 310,444 $ 18,846 $ 34,621 $ 12,039 375,950
Depreciation and amortization expense (142,004)General and administrative expense (35,338)Interest and other income 3,355Loss on impairment of real estate assets (3,080)Equity in earnings of unconsolidated affiliates 10,308Minority interest in earnings (90,551)
Income before discontinued operations $ 118,640
Total assets $ 4,653,707 $ 273,166 $ 155,042 $ 122,585 $ 5,204,500Capital expenditures $ 1,081,529 $ 56,109 $ 18,631 $ 20,541 $ 1,176,810
(1)Propertyoperatingexpensesincludepropertyoperating,realestatetaxesandmaintenanceandrepairs.(2)TheAllOthercategoryincludesmortgagenotesreceivable,theCompany’sofficebuilding,theManagementCompanyandtheCompany’ssubsidiary
thatprovidessecurityandmaintenanceservices.
Note 13.OperatingPartnershipCondensed consolidated financial statement information for the Operating Partnership is presented as follows:
December 31,
2006 2005
Assets:
Net investment in real estate assets $6,094,252 $ 5,944,428Investment in unconsolidated affiliates 78,826 84,137Other assets 344,842 323,354
Total assets $6,517,921 $ 6,351,919
Liabilities:
Mortgage and other notes payable $4,564,534 $ 4,341,055Other liabilities 276,792 279,315
Total liabilities 4,841,326 4,620,370
Minority interests 8,959 12,672
Partners’capital 1,667,636 1,718,877
Total liabilities and partners’ capital $6,517,921 $ 6,351,919
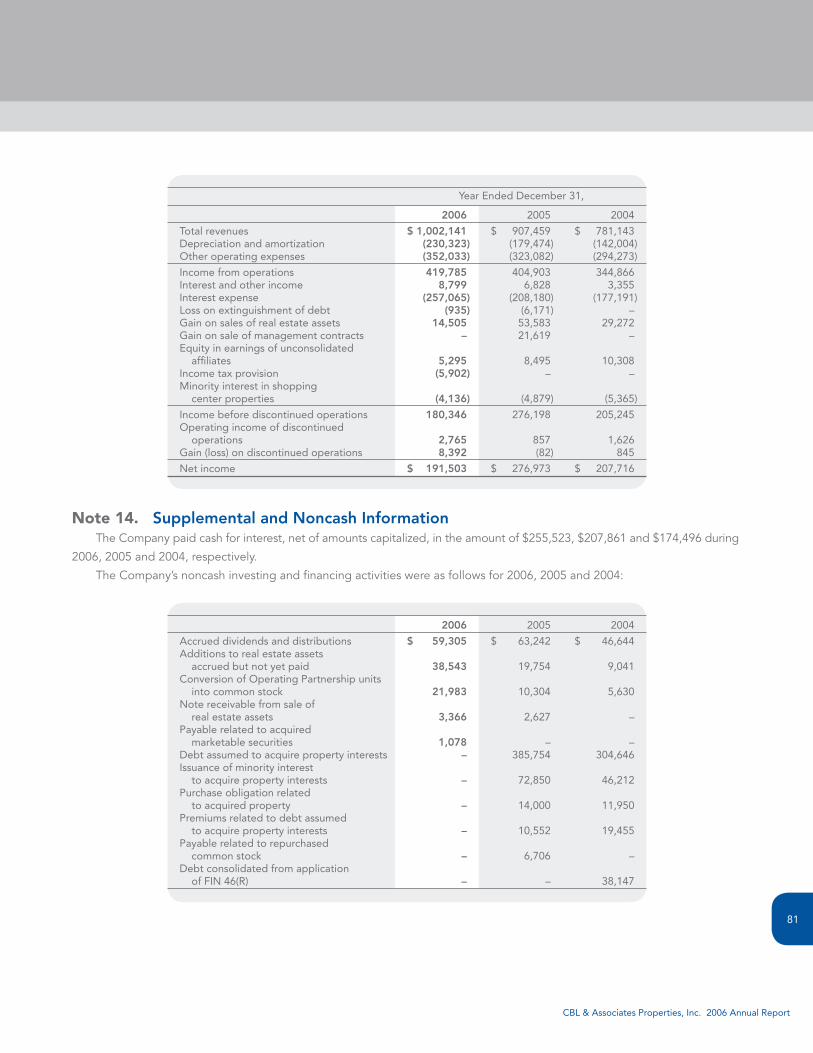
CBL & Associates Properties, Inc. 2006 Annual Report
81
Year Ended December 31,
2006 2005 2004
Total revenues $1,002,141 $ 907,459 $ 781,143Depreciation and amortization (230,323) (179,474) (142,004)Other operating expenses (352,033) (323,082) (294,273)
Income from operations 419,785 404,903 344,866Interest and other income 8,799 6,828 3,355Interest expense (257,065) (208,180) (177,191)Loss on extinguishment of debt (935) (6,171) –Gain on sales of real estate assets 14,505 53,583 29,272Gain on sale of management contracts – 21,619 –Equity in earnings of unconsolidated affiliates 5,295 8,495 10,308Income tax provision (5,902) – –Minority interest in shopping center properties (4,136) (4,879) (5,365)
Income before discontinued operations 180,346 276,198 205,245Operating income of discontinued operations 2,765 857 1,626Gain (loss) on discontinued operations 8,392 (82) 845
Net income $ 191,503 $ 276,973 $ 207,716
Note 14.SupplementalandNoncashInformationThe Company paid cash for interest, net of amounts capitalized, in the amount of $255,523, $207,861 and $174,496 during
2006, 2005 and 2004, respectively.
The Company’s noncash investing and financing activities were as follows for 2006, 2005 and 2004:
2006 2005 2004
Accrued dividends and distributions $ 59,305 $ 63,242 $ 46,644Additions to real estate assets accrued but not yet paid 38,543 19,754 9,041Conversion of Operating Partnership units into common stock 21,983 10,304 5,630Note receivable from sale of real estate assets 3,366 2,627 –Payable related to acquired marketable securities 1,078 – –Debt assumed to acquire property interests – 385,754 304,646Issuance of minority interest to acquire property interests – 72,850 46,212Purchase obligation related to acquired property – 14,000 11,950Premiums related to debt assumed to acquire property interests – 10,552 19,455Payable related to repurchased common stock – 6,706 –Debt consolidated from application of FIN 46(R) – – 38,147
Notes to Consolidated Financial Statements
82
Note 15.RelatedPartyTransactionsCBL’s Predecessor and certain officers of the Company have a significant minority interest in the construction company
that the Company engaged to build substantially all of the Company’s development properties. The Company paid approxi-
mately $221,151, $96,246 and $81,153 to the construction company in 2006, 2005 and 2004, respectively, for construction
and development activities. The Company had accounts payable to the construction company of $31,243 and $8,097 at
December 31, 2006 and 2005, respectively.
The Management Company provides management, development and leasing services to the Company’s unconsolidated
affiliates and other affiliated partnerships. Revenues recognized for these services amounted to $3,219, $14,290 and $5,970
in 2006, 2005 and 2004, respectively.
Note 16.ContingenciesThe Company is currently involved in certain litigation that arises in the ordinary course of business. It is management’s
opinion that the pending litigation will not materially affect the financial position or results of operations of the Company.
Additionally, management believes that, based on environmental studies completed to date, any exposure to environmental
cleanup will not materially affect the financial position and results of operations of the Company.
guARANtEES
The Company has guaranteed 50% of the debt of Parkway Place L.P., an unconsolidated affiliate in which the Company owns
a 45% interest. The total amount outstanding at both December 31, 2006 and 2005 was $53,200, of which the Company had
guaranteed $26,600. The guaranty will expire when the related debt matures in June 2008. The Company has not recorded
an obligation for this guaranty because it has determined that the fair value of the guaranty is not material.
The Company has guaranteed the performance of York Town Center, LP (“YTC”), an unconsolidated affiliate in which the
Company owns a 50% interest, under the terms of an agreement with a third party that will own property adjacent to the shopping
center property YTC is currently developing. Under the terms of that agreement, YTC is obligated to cause performance of
the third party’s obligations as landlord under its lease with its sole tenant, including, but not limited to, provisions such as
co-tenancy and exclusivity requirements. Should YTC fail to cause performance, then the tenant under the third-party landlord’s
lease may pursue certain remedies ranging from rights to terminate its lease to receiving reductions in rent. The Company has
guaranteed YTC’s performance under this agreement up to a maximum of $22,000, which decreases by $800 annually until
the guaranteed amount is reduced to $10,000. The Company has entered into an agreement with its joint venture partner
under which the joint venture partner has agreed to reimburse the Company 50% of any amounts the Company is obligated
to fund under the guaranty. The Company has not recorded an obligation for this guaranty because it has determined that
the fair value of the guaranty is not material.
Under the terms of the partnership agreement of Mall of South Carolina L.P., an unconsolidated affiliate in which the Company
owns a 50% interest, the Company had guaranteed 100% of the construction debt incurred to develop Coastal Grand –
Myrtle Beach in Myrtle Beach, SC. The Company received a fee of $1,572 for this guaranty when it was issued during 2003.
The Company was recognizing one-half of this fee as revenue pro rata over the term of the guaranty until its scheduled
expiration in May 2006, which represents the portion of the fee attributable to the third-party partner’s ownership interest.
As discussed in Note 5, Mall of South Carolina L.P. refinanced the construction loan with new mortgage loans in September
2004. As a result, the Company was released from the guaranty and recognized one-half of the unamortized balance of the
guaranty fee, or $328, as revenue when the construction loan was retired. The remaining $328 attributable to the Company’s
ownership interest was recorded as a reduction to the Company’s investment in the partnership. The Company recognized
total revenue of $568 related to this guaranty during 2004.
CBL & Associates Properties, Inc. 2006 Annual Report
83
PERFORMANCE BONDS
The Company has issued various bonds that it would have to satisfy in the event of non-performance. The total amount
outstanding on these bonds was $18,369 and $24,100 at December 31, 2006 and 2005, respectively.
gROuND lEASES
The Company is the lessee of land at certain of its properties under long-term operating leases, which include scheduled
increases in minimum rents. The Company recognizes these scheduled rent increases on a straight-line basis over the initial
lease terms. Most leases have initial terms of at least 20 years and contain one or more renewal options, generally for a mini-
mum of five- or ten-year periods.
The future obligations under these operating leases at December 31, 2006, are as follows:
2007 $ 6262008 6282009 6322010 6342011 737Thereafter 34,937
$ 38,194
Note 17.FairValueofFinancialInstrumentsThe carrying values of cash and cash equivalents, receivables, accounts payable and accrued liabilities are reasonable
estimates of their fair values because of the short maturity of these financial instruments. Based on the interest rates for similar
financial instruments, the carrying value of mortgage notes receivable is a reasonable estimate of fair value. The fair value of
mortgage and other notes payable was $4,608,682 and $4,336,474 at December 31, 2006 and 2005, respectively. The fair value
was calculated by discounting future cash flows for the notes payable using estimated rates at which similar loans would be
made currently.
Note 18.Share-BasedCompensationThe Company maintains the CBL & Associates Properties, Inc. Amended and Restated Stock Incentive Plan, as amended,
which permits the Company to issue stock options and common stock to selected officers, employees and directors of the
Company up to a total of 10,400,000 shares. The compensation committee of the board of directors (the “Committee”)
administers the plan.
Historically, the Company accounted for its stock-based compensation plans under the recognition and measurement
principles of Accounting Principles Board Opinion No. 25, Accounting for Stock Issued to Employees (“APB No. 25”), and
related interpretations. Effective January 1, 2003, the Company elected to begin recording the expense associated with stock
options granted after January 1, 2003, on a prospective basis in accordance with the fair value and transition provisions of
SFAS No. 123, Accounting for Stock-Based Compensation, as amended by SFAS No. 148, Accounting for Stock-Based
Compensation – Transition and Disclosure – An Amendment of FASB Statement No. 123.
Effective January 1, 2006, the Company adopted the fair value recognition provisions of SFAS No. 123(R), Share-Based
Payment, using the modified-prospective-transition method. Under that transition method, compensation cost recognized
during the year ended December 31, 2006 includes: (a) compensation cost for all share-based payments granted prior to, but
not yet vested as of January 1, 2006, based on the grant date fair value estimated in accordance with the original provisions
Notes to Consolidated Financial Statements
84
of SFAS No. 123 and (b) compensation cost for all share-based payments granted subsequent to January 1, 2006, based on
the grant-date fair value estimated in accordance with the provisions of SFAS No. 123(R). Under SFAS No. 123(R), share-based
payments are not recorded as shareholders’ equity until the related compensation expense is recognized. Accordingly, the
Company reclassified $8,895 from the deferred compensation line item in shareholders’ equity to additional paid-in capital as
of January 1, 2006. Results for prior periods have not been restated.
As a result of adopting SFAS No. 123(R) on January 1, 2006, the Company’s net income available to common shareholders
for the year ended December 31, 2006 is $302 lower than if it had continued to account for share-based compensation under
SFAS No. 123. As a result, basic EPS and diluted EPS were each $0.01 per share lower.
The compensation cost that has been charged against income for the plan was $5,632, $4,775 and $2,890 for 2006, 2005
and 2004, respectively. Compensation cost resulting from share-based awards is recorded at the Management Company, which
is a taxable entity. The income tax benefit resulting from stock-based compensation of $5,750 in 2006 has been reflected as a
financing cash flow in the consolidated statement of cash flows. As a result of recurring losses in 2005 and 2004, a full valuation
allowance had been recorded against the Management Company’s net deferred tax asset. Accordingly, the recognition of
compensation cost or the tax deduction received upon the exercise or vesting of share-based awards resulted in no tax benefits
to the Company in those years. Compensation cost capitalized as part of real estate assets was $947, $535 and $275 in 2006,
2005 and 2004, respectively.
StOCk OPtIONS
Stock options issued under the plan allow for the purchase of common stock at the fair market value of the stock on the
date of grant. Stock options granted to officers and employees vest and become exercisable in equal installments on each of
the first five anniversaries of the date of grant and expire ten years after the date of grant. Stock options granted to independent
directors are fully vested upon grant; however, the independent directors may not sell, pledge or otherwise transfer their stock
options during their board term or for one year thereafter. No stock options have been granted since 2002.
No stock-based compensation expense related to stock options granted prior to January 1, 2003, has been reflected
in net income of periods ended prior to January 1, 2006, since these awards are being accounted for under APB No. 25 and
all options granted had an exercise price equal to the fair value of the Company’s common stock on the date of grant. For
SFAS No. 123 pro forma disclosure purposes, the fair value of stock options was determined as of the date of grant using the
Black-Scholes option-pricing model.
The following table illustrates the effect on net income and earnings per share if the Company had applied the fair value
recognition provisions of SFAS No. 123(R) to all outstanding and unvested awards in 2005 and 2004:
Year Ended December 31,
2005 2004
Net income available to common shareholders, as reported $ 131,907 $ 102,802Stock-based compensation expense included in reported net income available to common shareholders 4,775 2,890Total stock-based compensation expense determined under fair value method (5,186) (3,398)
Pro forma net income available to common shareholders $ 131,496 $ 102,294
Earnings per share: Basic, as reported $ 2.10 $ 1.67 Basic, pro forma $ 2.10 $ 1.66 Diluted, as reported $ 2.03 $ 1.61 Diluted, pro forma $ 2.03 $ 1.60

CBL & Associates Properties, Inc. 2006 Annual Report
85
The Company’s stock option activity for the year ended December 31, 2006 is summarized as follows:
Weighted Weighted Average Average Remaining Aggregate Exercise Contractual Intrinsic Shares Price Term Value
Outstanding at January 1, 2006 2,208,440 $ 13.89Exercised (700,120) $ 12.74Cancelled (5,600) $ 18.27
Outstanding at December 31, 2006 1,502,720 $ 14.40 3.6 $ 43,499
Vested or expected to vest at December 31, 2006 1,502,720 $ 14.40 3.6 $ 43,499
Options exercisable at December 31, 2006 1,357,920 $ 13.99 3.5 $ 39,867
No stock options have been granted since the adoption of SFAS No. 123 on January 1, 2003. The total intrinsic value of
options exercised during 2006, 2005 and 2004 was $19,898, $23,055 and $24,471, respectively.
StOCk AwARDS
Under the plan, common stock may be awarded either alone, in addition to, or in tandem with other stock awards granted
under the plan. The Committee has the authority to determine eligible persons to whom common stock will be awarded, the
number of shares to be awarded and the duration of the vesting period, as defined. Generally, an award of common stock vests
either immediately at grant, in equal installments over a period of five years or in one installment at the end of periods up to
five years. The Committee may also provide for the issuance of common stock under the plan on a deferred basis pursuant
to deferred compensation arrangements. The fair value of common stock awarded under the plan is determined based on the
market price of the Company’s common stock on the grant date and the related compensation expense is recognized over
the vesting period on a straight-line basis.
A summary of the status of the Company’s stock awards as of December 31, 2006, and changes during the year ended
December 31, 2006, is presented below:
Weighted Average Grant-Date Shares FairValue
Nonvested at January 1, 2006 387,506 $ 30.06Granted 249,538 $ 39.73Vested (167,840) $ 32.18Forfeited (11,860) $ 35.34
Nonvested at December 31, 2006 457,344 $ 34.35
The weighted average grant-date fair value of shares granted during 2006, 2005 and 2004 was $39.73, $38.24 and $26.37,
respectively. The total fair value of shares vested during 2006, 2005 and 2004 was $6,735, $13,144 and $3,990, respectively.
As of December 31, 2006, there was $12,091 of total unrecognized compensation cost related to nonvested stock options
and stock awards granted under the plan, which is expected to be recognized over a weighted average period of 3.6 years.

Notes to Consolidated Financial Statements
86
Note 19.EmployeeBenefitPlans
401(k) PlAN
The Management Company maintains a 401(k) profit sharing plan, which is qualified under Section 401(a) and Section 401(k)
of the Code to cover employees of the Management Company. All employees who have attained the age of 21 and have
completed at least 90 days of service are eligible to participate in the plan. The plan provides for employer matching contributions
on behalf of each participant equal to 50% of the portion of such participant’s contribution that does not exceed 2.5% of such
participant’s compensation for the plan year. Additionally, the Management Company has the discretion to make additional
profit-sharing-type contributions not related to participant elective contributions. Total contributions by the Management
Company were $1,157, $727 and $657 in 2006, 2005 and 2004, respectively.
EMPlOyEE StOCk PuRChASE PlAN
The Company maintains an employee stock purchase plan that allows eligible employees to acquire shares of the Company’s
common stock in the open market without incurring brokerage or transaction fees. Under the plan, eligible employees make
payroll deductions that are used to purchase shares of the Company’s common stock. The shares are purchased by the fifth
business day of the month following the month when the deductions were withheld. The shares are purchased at the prevailing
market price of the stock at the time of purchase.
DEFERRED COMPENSAtION ARRANgEMENtS
The Company has entered into agreements with certain of its officers that allow the officers to defer receipt of selected
salary increases and/or bonus compensation for periods ranging from 5 to 10 years. For certain officers, the deferred compensation
arrangements provide that when the salary increase or bonus compensation is earned and deferred, shares of the Company’s
common stock issuable under the Amended and Restated Stock Incentive Plan are deemed set aside for the amount deferred.
The number of shares deemed set aside is determined by dividing the amount of compensation deferred by the fair value of the
Company’s common stock on the deferral date, as defined in the arrangements. The shares set aside are deemed to receive
dividends equivalent to those paid on the Company’s common stock, which are then deemed to be reinvested in the Company’s
common stock in accordance with the Company’s dividend reinvestment plan. When an arrangement terminates, the
Company will issue shares of the Company’s common stock to the officer equivalent to the number of shares deemed to have
accumulated under the officer’s arrangement. The Company accrues compensation expense related to these agreements as
the compensation is earned during the term of the agreement.
In October 2005, the Company issued 174,403 shares of common stock to one officer as a result of the termination of that
officer’s deferred compensation agreement.
In June 2006, the Company issued 13,974 shares of common stock to an officer, net of 5,026 shares surrendered to satisfy
withholding taxes, as a result of the termination of that officer’s deferred compensation agreement.
At December 31, 2006 and 2005, respectively, there were 47,813 and 63,882 shares that were deemed set aside in accordance
with these arrangements.
For other officers, the deferred compensation arrangements provide that their bonus compensation is deferred in the form
of a note payable to the officer. Interest accumulates on these notes at 7.0%. When an arrangement terminates, the note payable
plus accrued interest is paid to the officer in cash. At December 31, 2006 and 2005, respectively, the Company had notes
payable, including accrued interest, of $165 and $107 related to these arrangements.
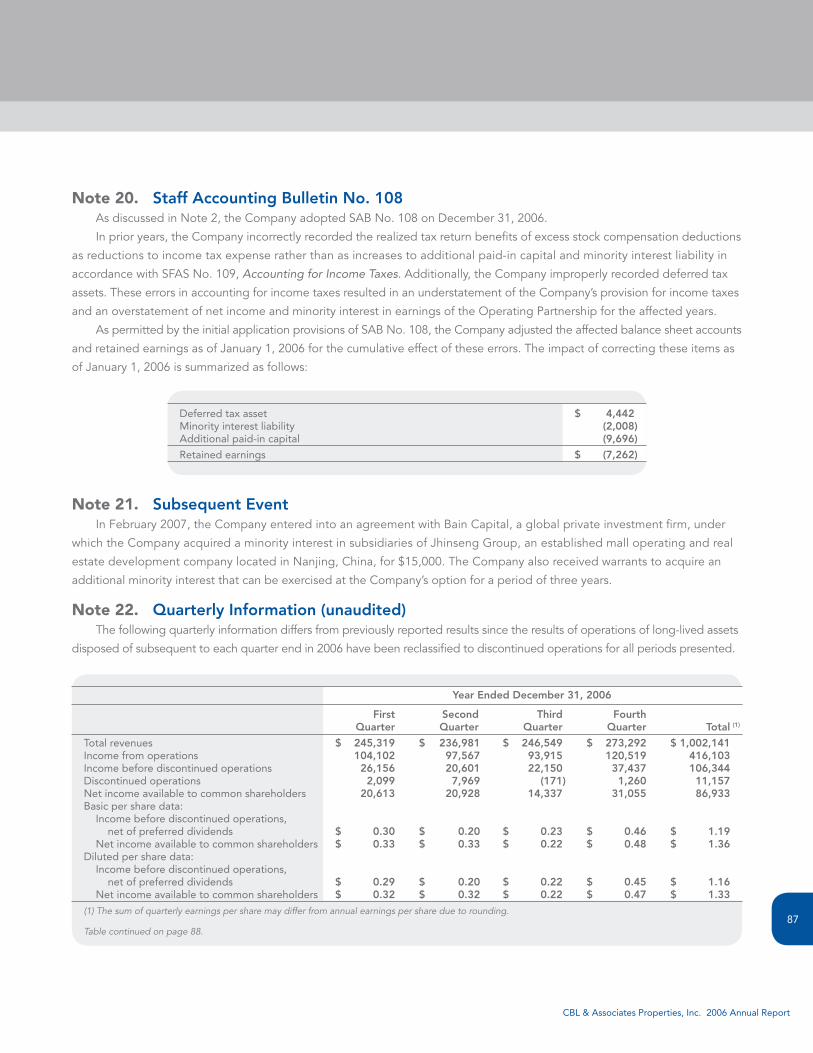
CBL & Associates Properties, Inc. 2006 Annual Report
87
Note 20.StaffAccountingBulletinNo.108As discussed in Note 2, the Company adopted SAB No. 108 on December 31, 2006.
In prior years, the Company incorrectly recorded the realized tax return benefits of excess stock compensation deductions
as reductions to income tax expense rather than as increases to additional paid-in capital and minority interest liability in
accordance with SFAS No. 109, Accounting for Income Taxes. Additionally, the Company improperly recorded deferred tax
assets. These errors in accounting for income taxes resulted in an understatement of the Company’s provision for income taxes
and an overstatement of net income and minority interest in earnings of the Operating Partnership for the affected years.
As permitted by the initial application provisions of SAB No. 108, the Company adjusted the affected balance sheet accounts
and retained earnings as of January 1, 2006 for the cumulative effect of these errors. The impact of correcting these items as
of January 1, 2006 is summarized as follows:
Deferred tax asset $ 4,442Minority interest liability (2,008)Additional paid-in capital (9,696)
Retained earnings $ (7,262)
Note 21.SubsequentEventIn February 2007, the Company entered into an agreement with Bain Capital, a global private investment firm, under
which the Company acquired a minority interest in subsidiaries of Jhinseng Group, an established mall operating and real
estate development company located in Nanjing, China, for $15,000. The Company also received warrants to acquire an
additional minority interest that can be exercised at the Company’s option for a period of three years.
Note 22.QuarterlyInformation(unaudited)The following quarterly information differs from previously reported results since the results of operations of long-lived assets
disposed of subsequent to each quarter end in 2006 have been reclassified to discontinued operations for all periods presented.
YearEndedDecember31,2006
First Second Third Fourth Quarter Quarter Quarter Quarter Total(1)
Total revenues $ 245,319 $ 236,981 $ 246,549 $ 273,292 $1,002,141Income from operations 104,102 97,567 93,915 120,519 416,103Income before discontinued operations 26,156 20,601 22,150 37,437 106,344Discontinued operations 2,099 7,969 (171) 1,260 11,157Net income available to common shareholders 20,613 20,928 14,337 31,055 86,933Basic per share data: Income before discontinued operations, net of preferred dividends $ 0.30 $ 0.20 $ 0.23 $ 0.46 $ 1.19 Net income available to common shareholders $ 0.33 $ 0.33 $ 0.22 $ 0.48 $ 1.36Diluted per share data: Income before discontinued operations, net of preferred dividends $ 0.29 $ 0.20 $ 0.22 $ 0.45 $ 1.16 Net income available to common shareholders $ 0.32 $ 0.32 $ 0.22 $ 0.47 $ 1.33
(1)Thesumofquarterlyearningspersharemaydifferfromannualearningspershareduetorounding.
Tablecontinuedonpage88.
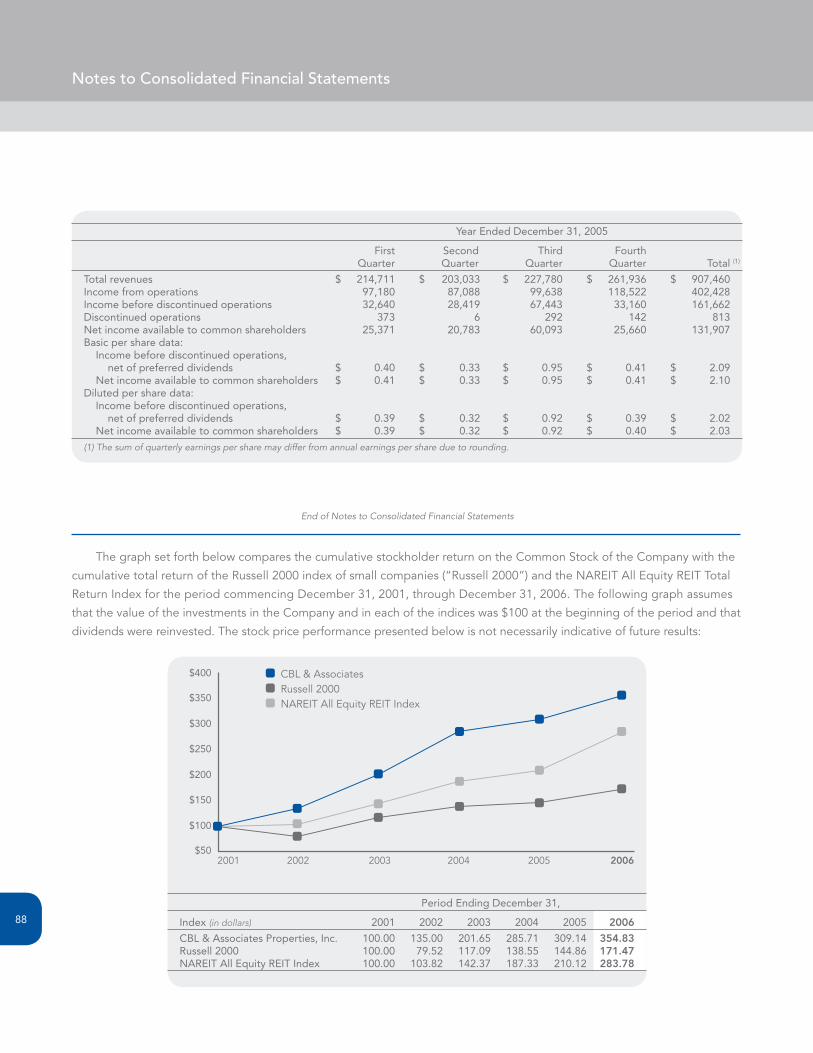
Notes to Consolidated Financial Statements
88
Year Ended December 31, 2005
First Second Third Fourth Quarter Quarter Quarter Quarter Total (1)
Total revenues $ 214,711 $ 203,033 $ 227,780 $ 261,936 $ 907,460Income from operations 97,180 87,088 99,638 118,522 402,428Income before discontinued operations 32,640 28,419 67,443 33,160 161,662Discontinued operations 373 6 292 142 813Net income available to common shareholders 25,371 20,783 60,093 25,660 131,907Basic per share data: Income before discontinued operations, net of preferred dividends $ 0.40 $ 0.33 $ 0.95 $ 0.41 $ 2.09 Net income available to common shareholders $ 0.41 $ 0.33 $ 0.95 $ 0.41 $ 2.10Diluted per share data: Income before discontinued operations, net of preferred dividends $ 0.39 $ 0.32 $ 0.92 $ 0.39 $ 2.02 Net income available to common shareholders $ 0.39 $ 0.32 $ 0.92 $ 0.40 $ 2.03
(1)Thesumofquarterlyearningspersharemaydifferfromannualearningspershareduetorounding.
The graph set forth below compares the cumulative stockholder return on the Common Stock of the Company with the
cumulative total return of the Russell 2000 index of small companies (“Russell 2000”) and the NAREIT All Equity REIT Total
Return Index for the period commencing December 31, 2001, through December 31, 2006. The following graph assumes
that the value of the investments in the Company and in each of the indices was $100 at the beginning of the period and that
dividends were reinvested. The stock price performance presented below is not necessarily indicative of future results:
Period Ending December 31,
Index (in dollars) 2001 2002 2003 2004 2005 2006
CBL & Associates Properties, Inc. 100.00 135.00 201.65 285.71 309.14 354.83Russell 2000 100.00 79.52 117.09 138.55 144.86 171.47NAREIT All Equity REIT Index 100.00 103.82 142.37 187.33 210.12 283.78
EndofNotestoConsolidatedFinancialStatements
$400
2001 2002 2003 2004 2005 2006
$350
$300
$250
$200
$150
$100
$50
CBL & Associates Russell 2000 NAREIT All Equity REIT Index
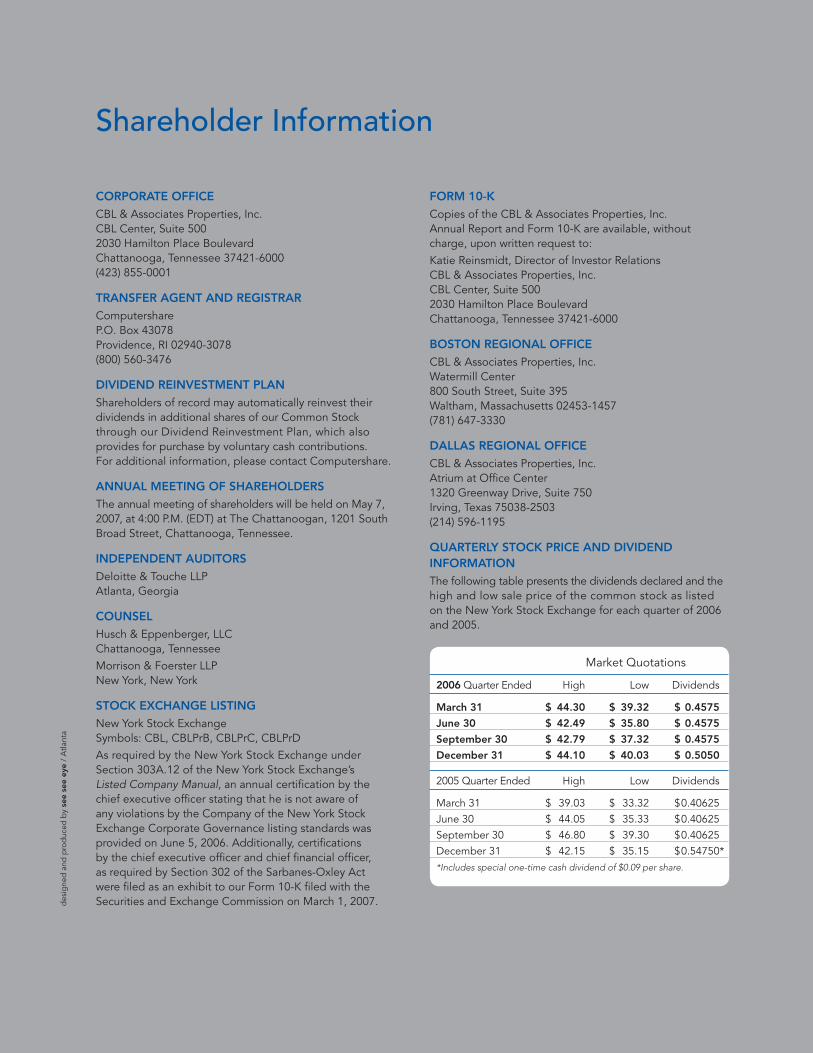
des
igne
d a
nd p
rod
uced
by
see
see
eye
/ A
tlant
a
Shareholder Information
CORPORATE OFFICECBL & Associates Properties, Inc. CBL Center, Suite 500 2030 Hamilton Place Boulevard Chattanooga, Tennessee 37421-6000(423) 855-0001
TRANSFER AGENT AND REGISTRARComputershare P.O. Box 43078Providence, RI 02940-3078(800) 560-3476
DIVIDEND REINVESTMENT PLANShareholders of record may automatically reinvest their dividends in additional shares of our Common Stock through our Dividend Reinvestment Plan, which also provides for purchase by voluntary cash contributions. For additional information, please contact Computershare.
ANNUAL MEETING OF SHAREHOLDERSThe annual meeting of shareholders will be held on May 7, 2007, at 4:00 P.M. (EDT) at The Chattanoogan, 1201 South Broad Street, Chattanooga, Tennessee.
INDEPENDENT AUDITORSDeloitte & Touche LLPAtlanta, Georgia
COUNSELHusch & Eppenberger, LLC Chattanooga, TennesseeMorrison & Foerster LLPNew York, New York
STOCK EXCHANGE LISTINGNew York Stock ExchangeSymbols: CBL, CBLPrB, CBLPrC, CBLPrDAs required by the New York Stock Exchange under Section 303A.12 of the New York Stock Exchange’s Listed Company Manual, an annual certification by the chief executive officer stating that he is not aware of any violations by the Company of the New York Stock Exchange Corporate Governance listing standards was provided on June 5, 2006. Additionally, certifications by the chief executive officer and chief financial officer, as required by Section 302 of the Sarbanes-Oxley Act were filed as an exhibit to our Form 10-K filed with the Securities and Exchange Commission on March 1, 2007.
FORM 10-KCopies of the CBL & Associates Properties, Inc. Annual Report and Form 10-K are available, without charge, upon written request to: Katie Reinsmidt, Director of Investor RelationsCBL & Associates Properties, Inc.CBL Center, Suite 5002030 Hamilton Place BoulevardChattanooga, Tennessee 37421-6000
BOSTON REGIONAL OFFICECBL & Associates Properties, Inc.Watermill Center800 South Street, Suite 395Waltham, Massachusetts 02453-1457(781) 647-3330
DALLAS REGIONAL OFFICECBL & Associates Properties, Inc.Atrium at Office Center1320 Greenway Drive, Suite 750Irving, Texas 75038-2503(214) 596-1195
QUARTERLY STOCK PRICE AND DIVIDEND INFORMATIONThe following table presents the dividends declared and the high and low sale price of the common stock as listed on the New York Stock Exchange for each quarter of 2006 and 2005.
Market Quotations
2006 Quarter Ended High Low Dividends
March 31 $ 44.30 $ 39.32 $ 0.4575
June 30 $ 42.49 $ 35.80 $ 0.4575
September 30 $ 42.79 $ 37.32 $ 0.4575
December 31 $ 44.10 $ 40.03 $ 0.5050
2005 Quarter Ended High Low Dividends
March 31 $ 39.03 $ 33.32 $ 0.40625June 30 $ 44.05 $ 35.33 $ 0.40625September 30 $ 46.80 $ 39.30 $ 0.40625December 31 $ 42.15 $ 35.15 $ 0.54750 **Includes special one-time cash dividend of $0.09 per share.

CBL & Associates Properties, Inc.
Corporate OfficeCBL CenterSuite 5002030 Hamilton Place BoulevardChattanooga, TN 37421-6000(423) 855-0001
Boston Regional OfficeWatermill CenterSuite 395800 South StreetWaltham, MA 02453-1457(781) 647-3330
Dallas Regional OfficeAtrium at Office CenterSuite 7501320 Greenway DriveIrving, TX 75038-2503(214) 596-1195
cblproperties.com