itu-t rec. q.3914 (01/2018) set of parameters of cloud ... · provides a set of parameters that...
TRANSCRIPT

I n t e r n a t i o n a l T e l e c o m m u n i c a t i o n U n i o n
ITU-T Q.3914 TELECOMMUNICATION STANDARDIZATION SECTOR OF ITU
(01/2018)
SERIES Q: SWITCHING AND SIGNALLING, AND ASSOCIATED MEASUREMENTS AND TESTS
Testing specifications – Testing specifications for next generation networks
Set of parameters of cloud computing for monitoring
Recommendation ITU-T Q.3914

ITU-T Q-SERIES RECOMMENDATIONS
SWITCHING AND SIGNALLING, AND ASSOCIATED MEASUREMENTS AND TESTS
SIGNALLING IN THE INTERNATIONAL MANUAL SERVICE Q.1–Q.3
INTERNATIONAL AUTOMATIC AND SEMI-AUTOMATIC WORKING Q.4–Q.59
FUNCTIONS AND INFORMATION FLOWS FOR SERVICES IN THE ISDN Q.60–Q.99
CLAUSES APPLICABLE TO ITU-T STANDARD SYSTEMS Q.100–Q.119
SPECIFICATIONS OF SIGNALLING SYSTEMS No. 4, 5, 6, R1 AND R2 Q.120–Q.499
DIGITAL EXCHANGES Q.500–Q.599
INTERWORKING OF SIGNALLING SYSTEMS Q.600–Q.699
SPECIFICATIONS OF SIGNALLING SYSTEM No. 7 Q.700–Q.799
Q3 INTERFACE Q.800–Q.849
DIGITAL SUBSCRIBER SIGNALLING SYSTEM No. 1 Q.850–Q.999
PUBLIC LAND MOBILE NETWORK Q.1000–Q.1099
INTERWORKING WITH SATELLITE MOBILE SYSTEMS Q.1100–Q.1199
INTELLIGENT NETWORK Q.1200–Q.1699
SIGNALLING REQUIREMENTS AND PROTOCOLS FOR IMT-2000 Q.1700–Q.1799
SPECIFICATIONS OF SIGNALLING RELATED TO BEARER INDEPENDENT CALL CONTROL (BICC)
Q.1900–Q.1999
BROADBAND ISDN Q.2000–Q.2999
SIGNALLING REQUIREMENTS AND PROTOCOLS FOR THE NGN Q.3000–Q.3709
SIGNALLING REQUIREMENTS AND PROTOCOLS FOR SDN Q.3710–Q.3899
TESTING SPECIFICATIONS Q.3900–Q.4099
Testing specifications for next generation networks Q.3900–Q.3999
Testing specifications for SIP-IMS Q.4000–Q.4039
Testing specifications for Cloud computing Q.4040–Q.4059
For further details, please refer to the list of ITU-T Recommendations.
Rec. ITU-T Q.3914 (01/2018) i
Recommendation ITU-T Q.3914
Set of parameters of cloud computing for monitoring
Summary
In accordance with the functional reference architecture of cloud computing that was defined in
Recommendation ITU-T Y.3502, Recommendation ITU-T Q.3914 specifies the functional reference
architecture of cloud computing according to Recommendation ITU-T Y.3500. This Recommendation
provides a set of parameters that indicate the status and event of a cloud computing system, including
resource layer, service layer and access layer.
History
Edition Recommendation Approval Study Group Unique ID*
1.0 ITU-T Q.3914 2018-01-13 11 11.1002/1000/13487
Keywords
Cloud computing, monitoring, parameter.
* To access the Recommendation, type the URL http://handle.itu.int/ in the address field of your web
browser, followed by the Recommendation's unique ID. For example, http://handle.itu.int/11.1002/1000/11
830-en.

ii Rec. ITU-T Q.3914 (01/2018)
FOREWORD
The International Telecommunication Union (ITU) is the United Nations specialized agency in the field of
telecommunications, information and communication technologies (ICTs). The ITU Telecommunication
Standardization Sector (ITU-T) is a permanent organ of ITU. ITU-T is responsible for studying technical,
operating and tariff questions and issuing Recommendations on them with a view to standardizing
telecommunications on a worldwide basis.
The World Telecommunication Standardization Assembly (WTSA), which meets every four years, establishes
the topics for study by the ITU-T study groups which, in turn, produce Recommendations on these topics.
The approval of ITU-T Recommendations is covered by the procedure laid down in WTSA Resolution 1.
In some areas of information technology which fall within ITU-T's purview, the necessary standards are
prepared on a collaborative basis with ISO and IEC.
NOTE
In this Recommendation, the expression "Administration" is used for conciseness to indicate both a
telecommunication administration and a recognized operating agency.
Compliance with this Recommendation is voluntary. However, the Recommendation may contain certain
mandatory provisions (to ensure, e.g., interoperability or applicability) and compliance with the
Recommendation is achieved when all of these mandatory provisions are met. The words "shall" or some other
obligatory language such as "must" and the negative equivalents are used to express requirements. The use of
such words does not suggest that compliance with the Recommendation is required of any party.
INTELLECTUAL PROPERTY RIGHTS
ITU draws attention to the possibility that the practice or implementation of this Recommendation may involve
the use of a claimed Intellectual Property Right. ITU takes no position concerning the evidence, validity or
applicability of claimed Intellectual Property Rights, whether asserted by ITU members or others outside of
the Recommendation development process.
As of the date of approval of this Recommendation, ITU had not received notice of intellectual property,
protected by patents, which may be required to implement this Recommendation. However, implementers are
cautioned that this may not represent the latest information and are therefore strongly urged to consult the TSB
patent database at http://www.itu.int/ITU-T/ipr/.
ITU 2018
All rights reserved. No part of this publication may be reproduced, by any means whatsoever, without the prior
written permission of ITU.

Rec. ITU-T Q.3914 (01/2018) iii
Table of Contents
Page
1 Scope ............................................................................................................................. 1
2 References ..................................................................................................................... 1
3 Definitions .................................................................................................................... 1
3.1 Terms defined elsewhere ................................................................................ 1
3.2 Terms defined in this Recommendation ......................................................... 2
4 Abbreviations and acronyms ........................................................................................ 2
5 Conventions .................................................................................................................. 2
6 Functional reference architecture of cloud computing ................................................. 3
7 Monitoring parameters .................................................................................................. 4
7.1 Resource layer parameters .............................................................................. 4
7.2 Service layer parameters ................................................................................. 12
7.3 Access layer parameters ................................................................................. 15


Rec. ITU-T Q.3914 (01/2018) 1
Recommendation ITU-T Q.3914
Set of parameters of cloud computing for monitoring
1 Scope
This Recommendation specifies the functional reference architecture of cloud computing according
to [ITU-T Y.3500], in accordance with the functional reference architecture of cloud computing that
was defined in [ITU-T Y.3502].
This Recommendation specifies parameters that should be monitored for the status identification of
resource, service and management within a cloud system.
The parameters specified in this Recommendation include:
– monitoring parameters of the resource layer;
– monitoring parameters of the service layer;
– monitoring parameters of the access layer.
2 References
The following ITU-T Recommendations and other references contain provisions which, through
reference in this text, constitute provisions of this Recommendation. At the time of publication, the
editions indicated were valid. All Recommendations and other references are subject to revision;
users of this Recommendation are therefore encouraged to investigate the possibility of applying the
most recent edition of the Recommendations and other references listed below. A list of the currently
valid ITU-T Recommendations is regularly published. The reference to a document within this
Recommendation does not give it, as a stand-alone document, the status of a Recommendation.
[ITU-T Y.3500] Recommendation ITU-T Y.3500 (2014) | ISO/IEC 17788:2014, Information
technology – Cloud computing – Overview and Vocabulary.
[ITU-T Y.3502] Recommendation ITU-T Y.3502 (2014) | ISO/IEC 17789:2014, Information
technology – Cloud computing – Reference architecture.
3 Definitions
3.1 Terms defined elsewhere
This Recommendation uses the following terms defined elsewhere:
3.1.1 cloud computing [ITU-T Y.3500]: Paradigm for enabling network access to a scalable and
elastic pool of shareable physical or virtual resources with self-service provisioning and
administration on-demand.
3.1.2 cloud service [ITU-T Y.3500]: One or more capabilities offered via cloud computing
invoked using a defined interface.
3.1.3 cloud service provider [ITU-T Y.3500]: Party which makes cloud services available.
3.1.4 functional component [ITU-T Y.3502]: A functional building block needed to engage in an
activity, backed by an implementation.
3.1.5 product catalogue [ITU-T Y.3502]: A listing of all the cloud service products which cloud
service providers make available to cloud service customers.

2 Rec. ITU-T Q.3914 (01/2018)
3.2 Terms defined in this Recommendation
This Recommendation defines the following term:
3.2.1 cloud service user: Natural person or entity acting on their behalf, associated with a cloud
service customer that uses cloud services.
NOTE – This definition is paraphrased from clause 8.2.1.1 of [ITU-T Y.3502].
4 Abbreviations and acronyms
This Recommendation uses the following abbreviations and acronyms:
CPU Central Processing Unit
GPU Graphics Processing Unit
IaaS Infrastructure as a Service
I/O Input/Output
IP Internet Protocol
KPI Key Performance Indicator
MDT Mean Down Time
MTBF Mean Time Between Failures
MTTR Mean Time To Repair
NF Network Function
NFS Network Function Status
OSS Operational Support System
PaaS Platform as a Service
QoS Quality of Service
RAM Random Access Memory
SC Service Chain
SDN Software-Defined Networking
SLA Service Level Agreement
TCP Transmission Control Protocol
TBF Time Between Failures
TTR Time To Repair
UPS Uninterruptible Power System
URL Uniform Resource Locator
VIP Virtual Internet Protocol
VM Virtual Machine
5 Conventions
None.

Rec. ITU-T Q.3914 (01/2018) 3
6 Functional reference architecture of cloud computing
The layering framework used in the cloud computing reference architecture has four layers, plus a set
of functions that spans across the layers. The four layers are:
– user layer;
– access layer;
– services layer;
– resources layer.
The functions that span layers are called multilayer functions.
The layering framework is shown schematically in Figure 6-1.
Figure 6-1 – Cloud computing layering framework
The function of each layer in the framework is described in clause 9.2.1 of [ITU-T Y.3502].
Figure 6-2 presents a high-level overview of the cloud computing reference architecture functional
components organized by means of the layering framework.
The relevant monitoring functional components are as follows.
– Resource abstraction and control functional component: the resource abstraction and control
functional component which resides in the resources layer enables control functionality,
enabling monitoring and management capabilities implemented in the operational support
systems functional component.
Monitoring and reporting functional component: the monitoring and reporting functional component
that is one of the multilayer operational support systems provides capabilities for the following.
– Monitoring the activities of other functional components throughout the cloud provider's
system. This includes the functional components that are involved in the direct use of cloud
services by customer cloud service users such as service access and service implementation
(e.g., the invocation of cloud service operation by a particular user). This also includes
functional components involved in the support of cloud services, such as functional
components in the operational support system (OSS) itself, like the service automation
functional component (e.g., the provisioning of a service instance for a particular customer).
– Providing reports on the behaviour of the cloud service provider's system, which may take
the form of alerts for behaviour that has a time-sensitive aspect (e.g., the occurrence of a
fault, the completion of some task) or may take the form of aggregated forms of historical
data (e.g., service usage data).
– Storage and retrieval of monitoring and event data as logging records.

4 Rec. ITU-T Q.3914 (01/2018)
Service level management functional component: the service level management functional
component, which also resides in the operational support systems, obtains monitoring information
from the monitoring and reporting functional component in order to measure and record key
performance indicators (KPIs) for the cloud service. Capacity is allocated or de-allocated based on
the basis of these KPIs.
The details of the functional components are described in clause 9.2 of [ITU-T Y.3502].
Figure 6-2 – Functional components of the cloud computing reference architecture
7 Monitoring parameters
Monitoring cloud resources and services is a key tool that helps cloud computing providers and
consumers in designing, building and improving a cloud system, eliminating performance bottlenecks
and identifying security flaws. Applications (e.g., streaming, web, indexing, compute and storage
services) are distributed across cloud layers including platform as a service (PaaS) and infrastructure
as a service (IaaS). In consequence, all parameters performed across all layers of the cloud stack need
to be metered and monitored. These include not only cloud resource and network access, but also
deployed services and applications.
7.1 Resource layer parameters
The resources layer is where the physical and virtual resources, as well as generic software, reside.
This layer includes equipment typically used in a data centre such as servers, networking switches
and routers, storage devices, in addition to the corresponding non-cloud specific software that runs
on the servers and other equipment such as host operating systems, hypervisors, device drivers and
generic systems management software.
Rec. ITU-T Q.3914 (01/2018) 5
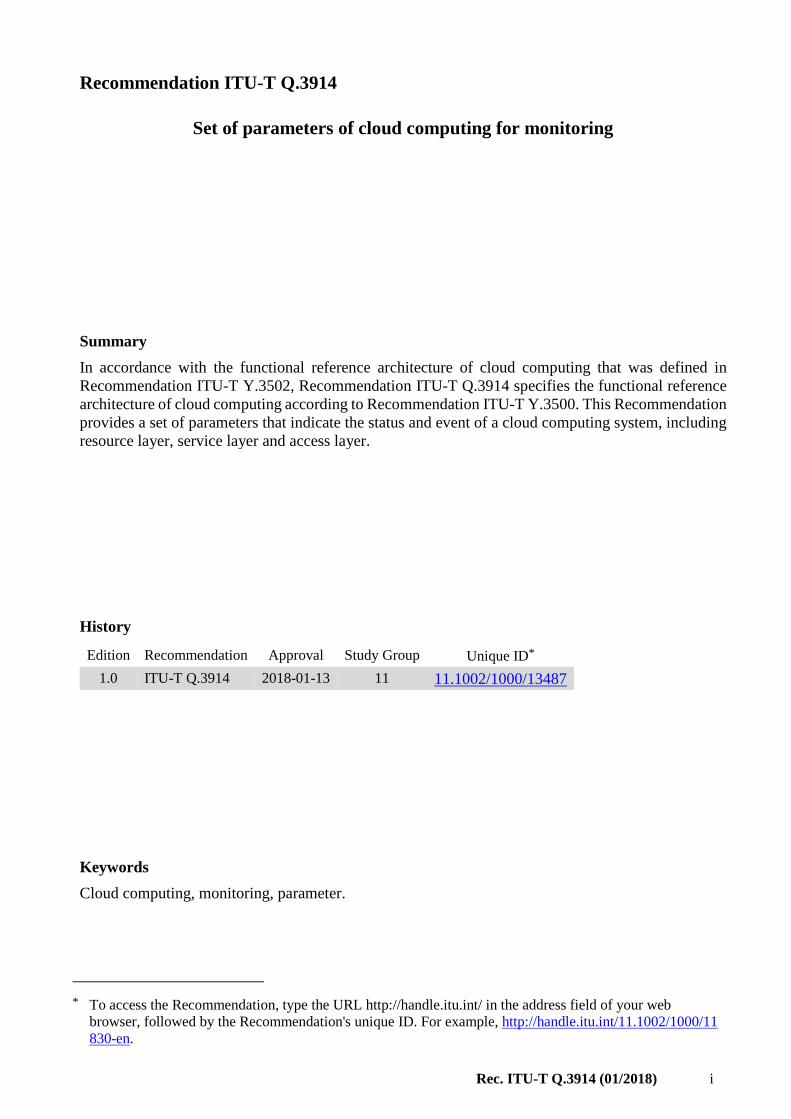
7.1.1 Physical computing resources
Physical computing resources include any hardware within a computer system for running an
operating system and software. An IaaS administrator can add physical computing resources to or
remove physical computing resources from a virtual machine (VM).
In order to ensure that the deployed software and hardware resources run at the required level to
satisfy the service level agreement (SLA), a continuous physical resource monitoring process is
desirable.
Processors, memory and disks are basic computing and storage resources. Monitoring these resources
can detect system failures or corruption before they become completely non-recoverable. So,
monitoring functions and status of these resources to ensure system availability benefits users.
See Table 7-1.
Table 7-1 – Parameters collected to monitor physical computing resources
Metric name Description Unit
Central processing unit (CPU) frequency CPU frequency MHz
CPU util Average CPU utilization %
CPU idle time Time of CPU is in idle status ns
CPU load CPUs have been loaded process
CPU input/output (I/O) wait time CPU I/O wait time ns
CPU idle percent Percent of CPU is in idle status %
CPU user percent Percent of CPU is in using status %
CPU I/O wait percent Percent of CPU I/O is in waiting status %
memory Volume of random access memory (RAM) MB
memory util Average RAM utilization %
memory used Used physical memory size kB
disk size Total size of disk GB or TB
disk size used Total size of disk used GB or TB
disk random/sequential read requests Volume of read requests request
disk random/sequential read request rate Average rate of read requests request/s
disk random/sequential read delay Average delay of read request ms
disk random/sequential read error Volume of read error kB
disk random/sequential write requests Volume of write requests request
disk random/sequential write request rate Average rate of write requests request/s
disk random/sequential write delay Average delay of write request ms
disk random/sequential write error Volume of write error kB
disk random/sequential read bytes Volume of reads MB
disk random/sequential read byte rate Average rate of reads MB/s
disk random/sequential write bytes Volume of writes MB
disk random/sequential write byte rate Average rate of writes MB/s
Graphics processing unit (GPU) util Average GPU utilization %
GPU idle time Time of GPU is in idle status ns
GPU load GPUs have been loaded process
GPU I/O wait time GPU I/O wait time ns
GPU idle percent Percent of GPU is in idle status %
GPU user percent Percent of GPU is in using status %
GPU I/O wait percent Percent of GPU I/O is in waiting status %

6 Rec. ITU-T Q.3914 (01/2018)
Table 7-1 – Parameters collected to monitor physical computing resources
Metric name Description Unit
NOTE – All metrics should be measured over different durations, e.g., 1 min, 5 min, 15 min or 30 min.
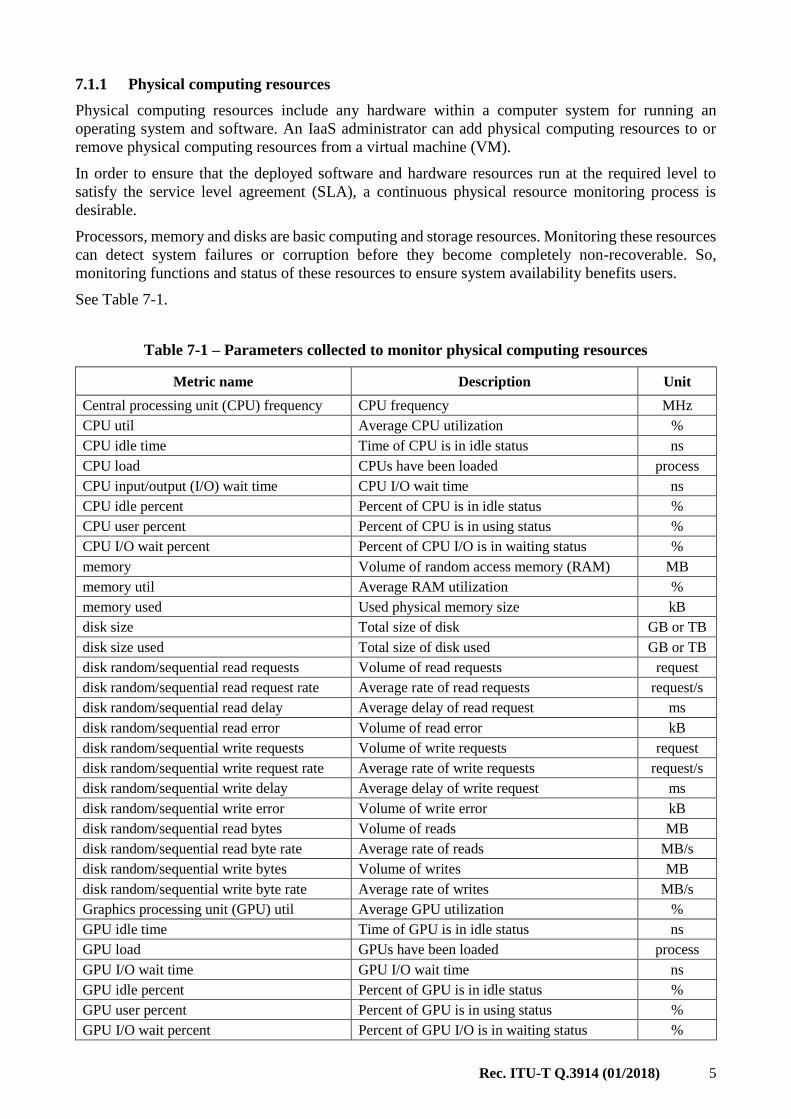
7.1.2 Virtual computing resources
Virtual computing resources include any virtual component within a virtual computer system for
running an operating system, software and applications. Similarly to physical computing resources,
running data and status of resources from VMs in which the applications are currently running require
collection. These data provide a picture of how much of the VM is being utilized and helps in analysis
and determination of the scaling requirement of applications.
See Table 7-2.
Table 7-2 – Parameters collected to monitor virtual computing resources
Metric name Description Unit
vCPUs Number of virtual CPUs allocated to the
virtual machine (VM) CPU
vCPU idle time Time of virtual CPUs is in idle status ns
vCPU idle percent Percent of vCPU is in idle status %
vCPU user percent Percent of vCPU is in using status %
vCPU load Virtual CPUs have been loaded process
vCPU I/O wait time Time of virtual CPUs I/O is in waiting
status ns
vCPU I/O wait percent Percent of virtual CPU is in using status %
vMemory Volume of virtual RAM allocated to the
VM MB
vMemory utilization Average virtual RAM utilization %
vMemory used Used virtual memory size MB
vDisk size Total size of virtual disk allocated to the
VM GB
vDisk size used Total size of virtual disk used MB
vDisk random/sequential read requests Number of read requests of virtual disk request
vDisk random/sequential read request
rate
Average rate of read requests of virtual
disk request/s
vDisk random/sequential write
requests Number of write requests of virtual disk request
vDisk random/sequential write request
rate
Average rate of write requests of virtual
disk request/s
vDisk random/sequential read bytes Volume of reads of virtual disk kB
vDisk random/sequential read byte rate Average rate of reads of virtual disk kB/s
vDisk random/sequential read delay Average delay of read request ms
vDisk random/sequential read error Volume of read error kB
vDisk random/sequential write bytes Volume of writes of virtual disk kB
Rec. ITU-T Q.3914 (01/2018) 7
Table 7-2 – Parameters collected to monitor virtual computing resources
Metric name Description Unit
VDisk random/sequential write byte
rate Average rate of writes of virtual disk kB/s
vDisk random/sequential write delay Average delay of write request ms
vDisk random/sequential write error Volume of write error kB
vGPU util Average vGPU utilization %
vGPU idle time Time of vGPU is in idle status ns
vGPU load vGPUs have been loaded process
vGPU I/O wait time vGPU I/O wait time ns
vGPU idle percent Percent of vGPU is in idle status %
vGPU user percent Percent of vGPU is in using status %
vGPU I/O wait percent Percent of vGPU I/O is in waiting status %
NOTE – All metrics should be measured over different duration, e.g., 1 min, 5 min, 15 min or 30 min.
7.1.3 Virtual machine operation and control
VM operation and control are referred to the management of physical or virtual computing resources
that allow users to create, edit, start and stop VMs.
The impetus behind cloud computing is the ever-increasing demand to manage growth and increase
computing flexibility by dynamic resource operation and control based on demand. An example of
resource control operation could be to horizontally scale a database server by migrating it from a
small CPU resource configuration to an extra-large CPU resource to improve throughput. This basic
requirement of cloud computing is supported by the resource operation and control system. An
inefficient resource operation and control system has a direct negative effect on performance. It can
also indirectly affect system functionality. Some system functions provided might become ineffective
due to poor performance.
See Table 7-3.
Table 7-3 – Parameters collected to monitor VM operation and control
Metric name Description Unit
CPU of VM start Time of CPU start s
CPU of VM stop Time of CPU stop s
CPU of VM restart Time of CPU restart s
CPU of VM select Time of CPU select s
CPU of VM scale down Time of CPU scale down s
CPU of VM scale up Time of CPU scale up s
VM start Time of VM start s
VM acquisition Time of VM acquisition s
VM release Time of VM release s
memory of VM scale down Time of memory scale down s
memory of VM scale up Time of memory scale up s
disk of VM scale down Time of disk scale down s

8 Rec. ITU-T Q.3914 (01/2018)
Table 7-3 – Parameters collected to monitor VM operation and control
Metric name Description Unit
disk of VM scale up Time of disk scale up s
upload file Time of upload file s
download file Time of download file s
allocation Internet protocol (IP) Time of allocation IP s
allocation ports Time of allocation ports s
allocation URL Time of allocation uniform resource locator
(URL) s
VM live migration Time that is needed to move a VM from two
predefined resources s
migration Interruption Time Maximum time in which a customer has no
access to migration to the resource s
VM cloning Time of VM cloning s
VM backup Time of VM backup s
VM imaging Time of VM imaging s
recovery time Time from the failure of a storage, to the
successful restore from an existing backup s
NOTE – VM backup time interval varies according to backup type, e.g., full backup or incremental
backup.
7.1.4 Network
High-performance computing requires large amounts of network bandwidth. Particularly for cloud
computing, the network has a strong meaning, as all provided resources and services are available
through a network. It has been found that poor network performance is caused by virtualization I/O
overhead. A network monitoring system helps in realization of traffic, utilization and errors and then,
based on accurate monitoring information, quality of service (QoS) policy validation, network outage
resolution, performance problem troubleshooting, and in making important capacity planning
decisions.
See Table 7-4.
Table 7-4 – Parameters collected to monitor a network
Metric name Description Unit
incoming bytes Number of bytes received by network interface KB
incoming byte rate Average rate of bytes received by network interface
per second KB/s
maximum incoming byte rate Maximum incoming byte rate during a specific period
(5 minute/15 minutes/60 minutes) KB/s
outgoing bytes Number of bytes sent by network interface KB
outgoing byte rate Average rate of bytes sent by network per second KB/s
maximum outgoing byte rate Maximum outgoing byte rate (5 minute/15 minutes/
60 minutes) KB/s
incoming packets Number of incoming packets packet

Rec. ITU-T Q.3914 (01/2018) 9
Table 7-4 – Parameters collected to monitor a network
Metric name Description Unit
incoming packet rate Average rate of incoming packets per second packet/s
average packets size incoming Average packets size incoming (1 minute/5 minutes/
15 minutes) byte
outgoing packets Number of outgoing packets packet
outgoing packet rate Average rate of outgoing packets per second packet /s
average packets size outgoing Average packets size outgoing (1 minute/5 minutes/
15 minutes) byte
outgoing errors Sending error of network interface packet
bandwidth of incoming Total capacity of the connection of the incoming Mb
utilization of incoming
interface
Percentage of incoming byte rate with respect to
bandwidth of incoming. %
bandwidth of outgoing Total capacity of the connection of the outgoing Mb/s
utilization of outgoing
interface
Percentage of outgoing byte rate with respect to
bandwidth of outgoing link. %
average latency Average of delay of data transition ms
Minimum latency Minimum time interval between submitting a packet
and arrival at its destination ms
Maximum latency Maximum time interval between submitting a packet
and arrival at its destination ms
packet loss Percentage of packets lost with respect to packets sent. %
jitter The difference in end-to-end one-way delay ms
7.1.5 Software-defined networking
Software-defined networking (SDN) is a concept that enables network operators and data centres to
flexibly manage their networking equipment using software. SDN introduces new levels of flexibility
and automation without manual interaction for networking.
7.1.5.1 Software-defined networking-based network
Network setup in SDN is now separated from a network engineer's regular activities; network issue
troubleshooting and diagnosis have become more complex. The availability, performance, utilization
and capacity of SDN monitoring can enable a cloud computing provider more confidently to adopt
SDN in cloud computing.
See Table 7-5

10 Rec. ITU-T Q.3914 (01/2018)
Table 7-5 – Parameters collected to monitor a software-defined networking controller
Metric name Description Unit
latency of topology discovery Latency of topology discovery ms
latency of connection from switch
to controller Latency of connection from switch to controller ms
number of active switches Number of active switches switch
incoming packets of the same
source addresses
Numbers of incoming packets with the same
incoming source addresses packet
incoming packets of the same
destination addresses
Numbers of incoming packets with the same
incoming destination addresses packet
outgoing packets of the same
source addresses
Numbers of outgoing packets with the same
outgoing source addresses packet
outgoing packets of destination
addresses
Numbers of outgoing packets with the same
outgoing destination addresses packet
incoming packets of the same
source port
Numbers of incoming packets with the same
incoming source port numbers packet
incoming packets of the same
destination port
Numbers of incoming packets with the same
incoming destination port number packet
outgoing packets of the same
source port
Numbers of outgoing packets with the same
outgoing source port numbers packet
outgoing packets of the same
destination port
Numbers of outgoing packets with the same
outgoing destination port numbers packet
7.1.5.2 Service chain
Cloud computing provides not only computing and storage resources to consumers as a resource pool,
but also as a network resource pool. According to appointed service logic, network traffic passes
though several service points (generally reference is made to firewall, load balance or any other
network functions (NFs)). A service chain (SC) links these service points together. A cloud
computing provider should consider the ’performance and status of an SC when it provides service
to consumers.
See Table 7-6.
Table 7-6 – Parameters collected to monitor a service chain
Metric name Description Unit
NFS Network function status normal/fail
NF start Time of network function start s
NF stop Time of network function stop s
NF migration Time that is needed to move a NF from two
predefined resources s
SC start Time of a service chain established s
SC stop Time of a service chain destroy s
7.1.6 Energy consumption
Voltage or power use out of the permissible range can damage electrical components or cause system
failure. If the fan stops working, the server overheats, is damaged and goes out of service. So, it is

Rec. ITU-T Q.3914 (01/2018) 11
important to monitor the voltage or wattage, fan and temperature to ensure that they are within safe
operating limits.
In order to handle massive amounts of data generated by consumers and businesses, cloud computing
typically needs a lot of power. A sharp increase in energy consumption can indicate server load
unbalance that leads to performance degradation. Real-time monitoring is helpful for avoiding these
consequences. Different states of the physical or VMs require different power levels. These states can
normally be divided into six types: named as shutdown, work, idle, dormant, sleep and standby.
See Table 7-7.
Table 7-7 – Parameters collected to monitor energy consumption in each state
Metric name Description Unit
power of CPU Current power of CPU consumption w
power of GPU Current power of GPU consumption w
power of Memory Current power of Memory consumption w
power of storage Current power of storage consumption w
power of network Current power of disk consumption w
power of power Systems Current power of power system consumption w
temperature of CPU Current temperature of CPU oC
7.1.7 Environment
The server room environment requires strict control processes for temperature, humidity and power
supply. A fully automated monitoring system can help prevent overheating of servers and
condensation on equipment. Keeping temperatures within range and carefully monitoring humidity
to prevent corrosion or static electricity reduce energy consumption and keep servers running
smoothly. Voltage use out of the permissible range can damage electrical components or cause system
failure. If the fan stops working, the server overheats, is damaged and goes out of service. So, it is
important to monitor the voltage or wattage, fan and temperature to ensure that they are within safe
operating limits.
See Table 7-8.
Table 7-8 – Parameters collected for the monitoring environment
Metric name Description Unit
temperature Current temperature of server room oC
voltage Current voltage of electricity supply V
electric current Electric current of electricity supply A
UPS voltage Output voltage of an uninterruptible power
system (UPS) battery V
UPS output electric current Output electric current of UPS battery A
UPS charging electric current Electric current of charging A
humidity Relative humidity of server room %
fan rotations Fan rotations per minute rotations/min
power of fan Current power of fan consumption W

12 Rec. ITU-T Q.3914 (01/2018)
7.2 Service layer parameters
7.2.1 General
One of the most important areas for provider and consumer is service performance and availability
when it comes to cloud computing. Cloud service provider and consumer need to get an entire view
of the health of service. A lot of decision making and SLA determination are driven by service
performance and availability. The monitoring system should report the service performance and
availability parameters to identify whether the QoS specified in the SLA is fulfilled.
Different cloud services can be offered with different terminologies, specifications and features.
Cloud services can achieve different levels of performance under various workloads generated by
diverse applications. For example, unlike computation and communication-intensive applications,
performance of data-intensive applications typically will be strongly affected by I/O performance and
storage access in a cloud infrastructure. The monitoring parameters of typical services are included
in this clause. Others are for further study.
See Table 7-9.
Table 7-9 – Performance metrics for monitoring general cloud services
Category Metric name Description
Availability MTBF Mean time between failures
MTTR Mean time to repair
Performance
Response time Response time for composite or atomic service
Throughput Number of transactions or requests processed per
specified unit of time
Capacity
Bandwidth Bandwidth of the connection that supports a service
Storage capacity Capacity of a temporary or persistent storage
medium, such as RAM, disk or tape
7.2.2 Service availability
Service availability is the property of being accessible and usable upon demand by an authorized
entity. Continuity is the key feature used to measure service availability, which ensures the service is
available for a certain amount of time without any interruption. Furthermore, if there is an incident,
continuity enables the service to be restarted and access to data and functionality of the service
regained within a particular period. All elements, including computing, storage, network and power
supplement, can affect service continuity. For example, for a public-cloud end user, availability of
the cloud not only refers to the services provided by the cloud service provider, but also to the
possibility of accessing those services remotely.
See Table 7-10.
Table 7-10 – Parameters collected for monitoring service availability
Metric name Description Unit
mean time between failures (MTBF) Time between inherent failures of element
or service during operation h
maximum TBF Maximum time between failures h
minimum TBF Minimum time between failures h
mean time to repair (MTTR) The average time repair a failed element or
service h

Rec. ITU-T Q.3914 (01/2018) 13
Table 7-10 – Parameters collected for monitoring service availability
Metric name Description Unit
maximum TTR Maximum time to repair h
minimum TTR Minimum time to repair h
mean down time (MDT)
The average time that an element or service
is non-operational. This includes all
downtime associated with repair
h
maximum down time Maximum time of down h
minimum down time Minimum time of down h
7.2.3 Service performance
7.2.3.1 Transaction process
Transaction process metrics can give a clear picture of the performance of an application in a cloud,
such as response time to complete service requests and transaction rate at which service requests are
executed. Latency for service requests, which calculates the time taken for the application to respond
to user requests, is the key metric.
See Table 7-11.
Table 7-11 – Parameters collected for monitoring the transaction process
Metric name Description Unit
transactions Number of transactions during a period (1 min, 5 min, 15 min) transaction
transaction rate Transaction rate at which service requests are executed per
second transaction/s
errors Number of error transactions transaction
concurrent transactions Average number of new transactions processed simultaneously transaction
time per transactions Average time necessary to process a single transactions item ms
disk throughput rate Throughput rate (input and output) for a specific service kB/s
memory throughput
rate Throughput rate (input and output) for a specific service kB/s
delay Delay of message passing between processes ms
time of task Duration of specific predefined tasks ms
7.2.3.2 Load balance
Load balancing of cloud computing is the process of distributing workloads across multiple
computing resources, which provides an efficient solution to various issues residing in cloud
computing environment usage.
See Table 7-12.

14 Rec. ITU-T Q.3914 (01/2018)
Table 7-12 – Parameters collected for monitoring the efficiency and
effectiveness of load balancing
Metric name Description Unit
load balance pool Number of load balance pools pool
load balance VIPs Number of virtual internet protocol (VIP)
addresses member
load balance member Number of load balance member member
load balance health monitor Number of Load balance health monitor monitor
load balance connections Volume of Load balance connections connection
load balance active connections Volume of Load balance active connections connection
load balance incoming bytes Volume of Load balance incoming bytes MB
load balance outgoing bytes Volume of Load balance outgoing bytes MB
7.2.3.3 Database
A cloud database is a database that typically runs on a cloud computing platform. Poor database
performance can dramatically degrade QoS. Cloud providers who offer database as a service, without
physically launching a VM instance for the database, should have a clear picture of how a database
is running and what is needed by consumers.
A relational database is organized based on the relational model of the data. A non-relational database
provides a mechanism for storage and retrieval of data that is modelled by means other than the
tabular relations used in relational databases. Non-relational databases are increasingly used in big
data and real-time web applications. The operation mechanisms of the two types of databases are
entirely different. So relational and non-relational databases should be monitored separately.
See Table 7-13.
Table 7-13 – Parameters collected for monitoring database efficiency
Metric name Description Unit
space Total space of DB kB
space used Total space used of DB kB
queries Total number of DB queries (select, insert,
update, delete, replace) query
replace request Volume of replace requests request
replace request rate Average rate of replace requests per second request/s
response time of replace request Average time of responding replace request ms
insert/set request Volume of insert/set requests request
insert/set request rate Average rate insert/set request of per second request/s
response time of insert/set request Average time of responding insert/set request ms
update request Volume of update requests request
update request rate Average rate of update requests per second request/s
response time of update request Average time of responding update request ms
delete request Volume of delete requests request
delete request rate Average rate of delete requests per second request/s
response time of delete request Average time of responding delete request ms

Rec. ITU-T Q.3914 (01/2018) 15
Table 7-13 – Parameters collected for monitoring database efficiency
Metric name Description Unit
select/get request Volume of select requests request
select/get request rate Average rate of select requests per second request/s
response time of select/get request Average time of responding select/get request ms
connect Connection number of concurrent clients request
connect rate Average rate of connections per second request/s
slow/expired query Volume of slow/expired queries query
slow/expired query rate Average rate of slow/expired queries per
second request/s
7.2.3.4 Web service performance
The main function of the web server is to provide an online information browsing service. There are
three types of performance parameter for web service: throughput, concurrent transactions and
response time.
See Table 7-14.
Table 7-14 – Parameters collected for monitoring web service performance
Metric name Description Unit
throughput Number of service request that a web service
can complete in a given period of time request/s
users Number of new connection users servicing per
second user/s
transactions per second Average number of transactions processed per
second transaction/s
connection rate Number of new transmission control protocol
(TCP) connections setting up per second link/s
response time
The time duration from receiving the request to
the web service to sending the response from the
web service
ms
round trip time Time from sending SYN to receiving SYN ACK ms
TCP setting up time Average time of TCP link setting up
simultaneous connections Number of TCP connections setting up between
client and server link/s
cumulative transactions Total number of transactions processing
processed transaction
7.3 Access layer parameters
Principally, access control involves the authentication of a user through the presentation and
validation of credentials, followed by the authorization of this authenticated user to use specific
services. Associated with this is identity management. Access behaviour and management events
should be monitored for the access layer.
See Table 7-15.

16 Rec. ITU-T Q.3914 (01/2018)
Table 7-15 – Parameters collected for monitoring the access layer
Metric name Description Unit
account entries Number of successful account logon events event
unsuccessful account entries Number of unsuccessful account logon events event
account exits Number of account logout events event
create account Number of successful account creation events event
modify account Number of successful account modification
events event
delete account Number of successful account deletion events event
unsuccessful account management Number of unsuccessful account management
events event
policy change Number of successful policy change events event
unsuccessful policy change Number of unsuccessful policy change events event
data deletions Number of successful data deletion events event
unsuccessful data deletions Number of unsuccessful data deletion events event
data access Number of successful data access events event
unsuccessful data access Number of unsuccessful data access events event
data changes Number of successful data changes events event
unsuccessful data changes Number of unsuccessful data change events event
unauthorized access, Number of unauthorized service access events event
unauthorized modification Number of unauthorized service modification
events event
unauthorized deletion Number of unauthorized service deletion
events event


Printed in Switzerland Geneva, 2018
SERIES OF ITU-T RECOMMENDATIONS
Series A Organization of the work of ITU-T
Series D Tariff and accounting principles and international telecommunication/ICT economic and
policy issues
Series E Overall network operation, telephone service, service operation and human factors
Series F Non-telephone telecommunication services
Series G Transmission systems and media, digital systems and networks
Series H Audiovisual and multimedia systems
Series I Integrated services digital network
Series J Cable networks and transmission of television, sound programme and other multimedia
signals
Series K Protection against interference
Series L Environment and ICTs, climate change, e-waste, energy efficiency; construction, installation
and protection of cables and other elements of outside plant
Series M Telecommunication management, including TMN and network maintenance
Series N Maintenance: international sound programme and television transmission circuits
Series O Specifications of measuring equipment
Series P Telephone transmission quality, telephone installations, local line networks
Series Q Switching and signalling, and associated measurements and tests
Series R Telegraph transmission
Series S Telegraph services terminal equipment
Series T Terminals for telematic services
Series U Telegraph switching
Series V Data communication over the telephone network
Series X Data networks, open system communications and security
Series Y Global information infrastructure, Internet protocol aspects, next-generation networks,
Internet of Things and smart cities
Series Z Languages and general software aspects for telecommunication systems