iupac-nist solubility data series 69. ternary alcohol ... · characteristic points on the binoidal...
TRANSCRIPT
This a
IUPAC-NIST Solubility Data Series 69. Ternary Alcohol–Hydrocarbon–WaterSystems
Adam Skrzecz a…
Institute of Physical Chemistry, Polish Academy of Sciences, Warsaw, Poland
David ShawInstitute of Marine Sciences, University of Alaska, Fairbanks, Alaska, U.S.A.
Andrzej MaczynskiInstitute of Physical Chemistry, Polish Academy of Sciences, Warsaw, Poland
Contributor and Evaluator
Adam SkrzeczInstitute of Physical Chemistry, Polish Academy of Sciences, Warsaw, Poland
Received September 12, 1998
The mutual solubilities of ternary systems containing alcohols, hydrocarbons and waterare reviewed. An exhaustive search of the literature was attempted for numerical data onall alcohols and hydrocarbons which are liquid at STP. Data were found for alcohols withup to nine carbon atoms, but mostly with fewer than four carbons. Data for a variety ofhydrocarbon structural types were found including alkane, alkene, and arene. A total of205 original studies treating 116 ternary systems which have been published through1992 are compiled. For 47 systems sufficient data were available to allow critical evalu-ation. All solubility data are expressed as mass and mole fractions as well as the origi-nally reported units. Similar reviews of the related binary systems have previously beenprepared for the Solubility Data Series. ©1999 American Institute of Physics andAmerican Chemical Society.@S0047-2689~99!00304-9#
Key words: aqueous solutions; hydrocarbons; solubility alcohols.
090
te
o
Contents1. Preface to the Volume. . . . . . . . . . . . . . . . . . . . . . . 987
1.1. References to the Preface. . . . . . . . . . . . . . . . . 9882. Introduction to the Solubility Data Series.
Solubility of Liquids in Liquids. . . . . . . . . . . . . . . 9882.1. Nature of the Project. . . . . . . . . . . . . . . . . . . . . 9882.2. Compilations and Evaluations. . . . . . . . . . . . . 988
2.2.1. Compilations. . . . . . . . . . . . . . . . . . . . . . 9882.2.2. Evaluations. . . . . . . . . . . . . . . . . . . . . . . 989
2.3. Quantities and Units Used in Compilationand Evaluation of Solubility Data. . . .. . . . . . 9902.3.1 Mixtures, Solutions, and Solubilities... 992.3.2 Physicochemical Quantities and Units.. 9
2.4. References to the Introduction. . . . . . . . . . . . . 992
a!Electronic mail: [email protected]
©1999 by the U.S. Secretary of Commerce on behalf of the United Sta
All rights reserved. This copyright is assigned to the American InstitutePhysics and the American Chemical Society.Reprints available from ACS; see Reprints List at back of issue.
0047-2689/99/28„4…/983/253/$117.00 983rticle is copyrighted as indicated in the article. Reuse of AIP content is sub
129.6.105.191 On: Fri, 0
3. Methanol1Water. . . . . . . . . . . . . . . . . . . . . . . . . . . 9933.1. 1 Propane. . . . . . . . . . . . . . . . . . . . . . . . . . . . 9933.2. 1 Butane. . . . . . . . . . . . . . . . . . . . . . . . . . . . . 9933.3. 1 2-Methyl-1,3-butadiene. . . . . . . . . . . . . . . 9943.4. 1 Benzene* . . . . . . . . . . . . . . . . . . . . . . . . . . . 9953.5. 1 Cyclohexene* . . . . . . . . . . . . . . . . . . . . . . .10023.6. 1 Cyclohexane* . . . . . . . . . . . . . . . . . . . . . . .10043.7. 1 1-Hexene. . . . . . . . . . . . . . . . . . . . . . . . . . .10083.8. 1 Hexane* . . . . . . . . . . . . . . . . . . . . . . . . . . .10083.9. 1 Toluene* . . . . . . . . . . . . . . . . . . . . . . . . . . .10113.10.1 1-Heptene. . . . . . . . . . . . . . . . . . . . . . . . . .10143.11.1 Heptane* . . . . . . . . . . . . . . . . . . . . . . . . . . .10153.12.1 p-Xylene* . . . . . . . . . . . . . . . . . . . . . . . . . .10183.13.1 Xylene. . . . . . . . . . . . . . . . . . . . . . . . . . . . .10203.14.1 2,2,4-Trimethylpentane* . . . . . . . . . . . . . . . 10213.15.1 Octane* . . . . . . . . . . . . . . . . . . . . . . . . . . . .10233.16.1 Mesitylene. . . . . . . . . . . . . . . . . . . . . . . . . .10253.17.1 Nonane. . . . . . . . . . . . . . . . . . . . . . . . . . . .10263.18.1 1-Methylnaphthalene. . . . . . . . . . . . . . . . . 1027
4. Ethanol1Water. . . . . . . . . . . . . . . . . . . . . . . . . . . . .10274.1. 1 Benzene* . . . . . . . . . . . . . . . . . . . . . . . . . . .1027
s.
f
J. Phys. Chem. Ref. Data, Vol. 28, No. 4, 1999ject to the terms at: http://scitation.aip.org/termsconditions. Downloaded to IP:
5 Sep 2014 17:51:55

984984 SKRZECZ, SHAW, AND MACZYNSKI
This a
4.2. 1 Cyclohexene* . . . . . . . . . . . . . . . . . . . . . . .10434.3. 1 Cyclohexane* . . . . . . . . . . . . . . . . . . . . . . .10454.4. 1 2,2-Dimethylbutane. . . . . . . . . . . . . . . . . . 10524.5. 1 Hexane* . . . . . . . . . . . . . . . . . . . . . . . . . . .10534.6. 1 Toluene* . . . . . . . . . . . . . . . . . . . . . . . . . . .10594.7. 1 Methylcyclohexane. . . . . . . . . . . . . . . . . . . 10664.8. 1 1-Heptene. . . . . . . . . . . . . . . . . . . . . . . . . .10664.9. 1 Heptane* . . . . . . . . . . . . . . . . . . . . . . . . . . .10674.10.1 m-Xylene* . . . . . . . . . . . . . . . . . . . . . . . . . .10724.11.1 o-Xylene* . . . . . . . . . . . . . . . . . . . . . . . . . .10774.12.1 p-Xylene* . . . . . . . . . . . . . . . . . . . . . . . . . .10804.13.1 2,4,4-Trimethyl-1-pentene. . . . . . . . . . . . . 10844.14.1 1-Octene. . . . . . . . . . . . . . . . . . . . . . . . . . .10844.15.1 2,2,4-Trimethylpentane* . . . . . . . . . . . . . . . 10854.16.1 Octane. . . . . . . . . . . . . . . . . . . . . . . . . . . . .10884.17.1 Mesitylene* . . . . . . . . . . . . . . . . . . . . . . . . .10894.18.1 Nonane. . . . . . . . . . . . . . . . . . . . . . . . . . . .10924.19.1 2,6,[email protected]#hept-2-ene.. 10934.20.1 Decahydronaphthalene~cis1trans!. . . . . . 10934.21.1 Decane. . . . . . . . . . . . . . . . . . . . . . . . . . . .1094
5. 1-Propanol1Water. .. . . . . . . . . . . . . . . . . . . . . . . .10955.1. 1 Benzene* . . . . . . . . . . . . . . . . . . . . . . . . . . .10955.2. 1 Cyclohexane* . . . . . . . . . . . . . . . . . . . . . . .11005.3. 1 Hexane* . . . . . . . . . . . . . . . . . . . . . . . . . . .11035.4. 1 Toluene* . . . . . . . . . . . . . . . . . . . . . . . . . . .11095.5. 1 1-Heptene. . . . . . . . . . . . . . . . . . . . . . . . . .11135.6. 1 Heptane* . . . . . . . . . . . . . . . . . . . . . . . . . . .11145.7. 1 p-Xylene. . . . . . . . . . . . . . . . . . . . . . . . . . .11195.8. 1 Octane* . . . . . . . . . . . . . . . . . . . . . . . . . . . .11205.9. 1 Mesitylene. . . . . . . . . . . . . . . . . . . . . . . . . .11225.10.1 Nonane* . . . . . . . . . . . . . . . . . . . . . . . . . . .11235.11.1 Decane* . . . . . . . . . . . . . . . . . . . . . . . . . . .1126
6. 2-Propanol1Water. .. . . . . . . . . . . . . . . . . . . . . . . .11306.1. 1 Benzene* . . . . . . . . . . . . . . . . . . . . . . . . . . .11306.2. 1 Cyclohexene. . . . . . . . . . . . . . . . . . . . . . . .11386.3. 1 Cyclohexane* . . . . . . . . . . . . . . . . . . . . . . .11396.4. 1 Hexane* . . . . . . . . . . . . . . . . . . . . . . . . . . .11456.5. 1 Toluene* . . . . . . . . . . . . . . . . . . . . . . . . . . .11486.6. 1 1-Heptene. . . . . . . . . . . . . . . . . . . . . . . . . .11536.7. 1 Heptane* . . . . . . . . . . . . . . . . . . . . . . . . . . .11536.8. 1 m-Xylene. . . . . . . . . . . . . . . . . . . . . . . . . . .11566.9. 1 o-Xylene. . . . . . . . . . . . . . . . . . . . . . . . . . .11576.10.1 p-Xylene. . . . . . . . . . . . . . . . . . . . . . . . . . .11586.11.1 Ethylbenzene. . . . . . . . . . . . . . . . . . . . . . . .11596.12.1 1,7-Octadiene. . . . . . . . . . . . . . . . . . . . . . .11606.13.1 2,2,4-Trimethylpentane. . . . . . . . . . . . . . . . 11616.14.1 Octane. . . . . . . . . . . . . . . . . . . . . . . . . . . . .11626.15.1 Mesitylene. . . . . . . . . . . . . . . . . . . . . . . . . .11636.16.1 Nonane. . . . . . . . . . . . . . . . . . . . . . . . . . . .1164
7. 2-Methyl-1-propanol1Water. . . . . . . . . . . . . . . . . . 11657.1. 1 Benzene* . . . . . . . . . . . . . . . . . . . . . . . . . . .11657.2. 1 Cyclohexane* . . . . . . . . . . . . . . . . . . . . . . .11677.3. 1 Toluene. . . . . . . . . . . . . . . . . . . . . . . . . . . .11707.4. 1 1-Heptene. . . . . . . . . . . . . . . . . . . . . . . . . .11717.5. 1 p-Xylene. . . . . . . . . . . . . . . . . . . . . . . . . . .11717.6. 1 Mesitylene. . . . . . . . . . . . . . . . . . . . . . . . . .1172
8. 2-Methyl-2-propanol1Water. . . . . . . . . . . . . . . . . . 1173
J. Phys. Chem. Ref. Data, Vol. 28, No. 4, 1999rticle is copyrighted as indicated in the article. Reuse of AIP content is sub
129.6.105.191 On: Fri, 0
8.1. 1 1-Butene. . . . . . . . . . . . . . . . . . . . . . . . . . .11738.2. 1 Benzene* . . . . . . . . . . . . . . . . . . . . . . . . . . .11748.3. 1 Cyclohexane* . . . . . . . . . . . . . . . . . . . . . . .11768.4. 1 Toluene. . . . . . . . . . . . . . . . . . . . . . . . . . . .11798.5. 1 1-Heptene. . . . . . . . . . . . . . . . . . . . . . . . . .11808.6. 1 Heptane. . . . . . . . . . . . . . . . . . . . . . . . . . . .11818.7. 1 p-Xylene. . . . . . . . . . . . . . . . . . . . . . . . . . .11818.8. 1 2,4,4-Trimethylpentene. . . . . . . . . . . . . . . . 11828.9. 1 2,2,4-Trimethylpentane. . . . . . . . . . . . . . . . 11838.10.1 Mesitylene. . . . . . . . . . . . . . . . . . . . . . . . . .11858.11.1 Tetradecane.. . . . . . . . . . . . . . . . . . . . . . . .1186
9. 1-Butanol1Water. . . . . . . . . . . . . . . . . . . . . . . . . . .11869.1. 1 Benzene* . . . . . . . . . . . . . . . . . . . . . . . . . . .11869.2. 1 Cyclohexane* . . . . . . . . . . . . . . . . . . . . . . .11899.3. 1 Hexane* . . . . . . . . . . . . . . . . . . . . . . . . . . .11919.4. 1 Toluene* . . . . . . . . . . . . . . . . . . . . . . . . . . .11949.5. 1 1-Heptene. . . . . . . . . . . . . . . . . . . . . . . . . .11989.6. 1 Heptane. . . . . . . . . . . . . . . . . . . . . . . . . . . .11989.7. 1 p-Xylene. . . . . . . . . . . . . . . . . . . . . . . . . . .11999.8. 1 Mesitylene. . . . . . . . . . . . . . . . . . . . . . . . . .1199
10. 2-Butanol1Water. . . . . . . . . . . . . . . . . . . . . . . . . . .120010.1.1 Butane. . . . . . . . . . . . . . . . . . . . . . . . . . . . .120010.2.1 Benzene* . . . . . . . . . . . . . . . . . . . . . . . . . . .120110.3.1 Cyclohexane* . . . . . . . . . . . . . . . . . . . . . . .120310.4.1 Toluene* . . . . . . . . . . . . . . . . . . . . . . . . . . .120610.5.1 1-Heptene. . . . . . . . . . . . . . . . . . . . . . . . . .120910.6.1 Heptane. . . . . . . . . . . . . . . . . . . . . . . . . . . .120910.7.1 p-Xylene. . . . . . . . . . . . . . . . . . . . . . . . . . .121010.8.1 Mesitylene. . . . . . . . . . . . . . . . . . . . . . . . . .1211
11. 3-Methyl-3-buten-1-ol1Water. . . . . . . . . . . . . . . . . 121211.1.1 2-Methyl-1,3-butadiene. . . . . . . . . . . . . . . 1212
12. 1-Pentanol1Water. . . . . . . . . . . . . . . . . . . . . . . . . .121212.1.1 Benzene. . . . . . . . . . . . . . . . . . . . . . . . . . . .121212.2.1 Hexane* . . . . . . . . . . . . . . . . . . . . . . . . . . .121312.3.1 Heptane. . . . . . . . . . . . . . . . . . . . . . . . . . . .1216
13. 2-Pentanol1Water. . . . . . . . . . . . . . . . . . . . . . . . . .121613.1.1 Heptane. . . . . . . . . . . . . . . . . . . . . . . . . . . .1216
14. 1-Hexanol1Water. . . . . . . . . . . . . . . . . . . . . . . . . .121714.1.1 Heptane. . . . . . . . . . . . . . . . . . . . . . . . . . . .1217
15. Benzyl alcohol1Water. . . . . . . . . . . . . . . . . . . . . . .121715.1.1 Hexane. . . . . . . . . . . . . . . . . . . . . . . . . . . .121715.2.1 Toluene. . . . . . . . . . . . . . . . . . . . . . . . . . . .121815.3.1 Heptane. . . . . . . . . . . . . . . . . . . . . . . . . . . .121915.4.1 1,2,3,4-Tetrahydronaphthalene. . . . . . . . . . 1220
16. a-Methyl-benzenemethanol1Water. . . . . . . . . . . . 122116.1.1 Ethylbenzene. . . . . . . . . . . . . . . . . . . . . . . .1221
17. 2-Ethyl-1-hexanol1Water.. . . . . . . . . . . . . . . . . . . 122117.1.1 Hexane. . . . . . . . . . . . . . . . . . . . . . . . . . . .122117.2.1 Decahydronaphthalene~cis1trans!. . . . . . 1222
18. 1-Octanol1Water. .. . . . . . . . . . . . . . . . . . . . . . . . .122218.1.1 Pentane. . . . . . . . . . . . . . . . . . . . . . . . . . . .122218.2.1 Benzene. . . . . . . . . . . . . . . . . . . . . . . . . . . .122318.3.1 Hexane* . . . . . . . . . . . . . . . . . . . . . . . . . . .122318.4.1 Heptane. . . . . . . . . . . . . . . . . . . . . . . . . . . .1225
19. 1-Nonanol1Water. . . . . . . . . . . . . . . . . . . . . . . . . .122619.1.1 Naphthalene. . .. . . . . . . . . . . . . . . . . . . . .1226
20. System Index. . . . . . . . . . . . . . . . . . . . . . . . . . . . . .1227
ject to the terms at: http://scitation.aip.org/termsconditions. Downloaded to IP:
5 Sep 2014 17:51:55

-
985985IUPAC-NIST SOLUBILITY DATA SERIES
This a
21. Registry Number Index. . . . . . . . . . . . . . . . . . . . . .123122. Author Index. . . . . . . . . . . . . . . . . . . . . . . . . . . . . . .1232
*Note: an asterisk~* ! indicates presence of a Critical Evaluation
List of Tables1. Interconversions between quantities used as
measures of solubilities. . . . . . . . . . . . . . . . . . . . . . 9912. Summary of experimental data for the system
methanol–benzene–water. . . . . . . . . . . . . . . . . . . . 9953. Characteristic points on the binoidal curve of the
system methanol–benzene–water. . . . . . . . . . . . . . 9954. Calculated compositions along the saturation
curve at 293.2 K.. .. . . . . . . . . . . . . . . . . . . . . . . . . 9955. Summary of experimental data for the system
methanol–cyclohexene–water. . . . . . . . . . . . . . . . . 10026. Summary of experimental data for the system
methanol–cyclohexane–water. . . . . . . . . . . . . . . . . 10047. Calculated compositions along the saturation
curve at 298.2 K. . . . . . . . . . . . . . . . . . . . . . . . . . . .10048. Summary of experimental data for the system
methanol–hexane–water. . . . . . . . . . . . . . . . . . . . .10089. Calculated compositions along the saturation
curve at 293.2 K~hexane-poor phase!. . . . . . . . . . 100810. Summary of experimental data for the system
methannol–toluene–water. . . . . . . . . . . . . . . . . . . . 101111. Calculated compositions along the saturation
curve at 298.2 K. . . . . . . . . . . . . . . . . . . . . . . . . . . .101212. Summary of experimental data for the system
methanol–heptane–water. . . . . . . . . . . . . . . . . . . . .101513. Summary of experimental data for the system
methanol–p-xylene–water. . . . . . . . . . . . . . . . . . . . 101814. Calculated compositions along the saturation
curve at 298.2 K. . . . . . . . . . . . . . . . . . . . . . . . . . . .101815. Summary of experimental data for the system
methanol-2,2,4-trimethylpentane–water. . . . . . . . . 102116. Summary of experimental data for the system
methanol–octane–water. . . . . . . . . . . . . . . . . . . . . .102317. Summary of experimental data for the system
ethanol–benzene–water.. . . . . . . . . . . . . . . . . . . . .102718. Characteristic points on the binoidal curve of the
system ethanol–benzene–water. . . . . . . . . . . . . . . . 102819. Calculated compositions along the saturation
curve at 298.2 K. . . . . . . . . . . . . . . . . . . . . . . . . . . .102820. Summary of experimental data for the system
ethanol–cyclohexene–water. . . . . . . . . . . . . . . . . . . 104321. Summary of experimental data for the system
ethanol–cyclohexane–water. . . . . . . . . . . . . . . . . . . 104522. Calculated compositions along the saturation
curve at 298.2 K. . . . . . . . . . . . . . . . . . . . . . . . . . . .104523. Summary of experimental data for the system
ethanol–hexane–water. . . . . . . . . . . . . . . . . . . . . . .105324. Calculated compositions along the saturation
curve at 298.2 K. . . . . . . . . . . . . . . . . . . . . . . . . . . .105325. Summary of experimental data for the system
ethanol–toluene–water. . . . . . . . . . . . . . . . . . . . . . .105926. Characteristic points on the binoidal curve of the
rticle is copyrighted as indicated in the article. Reuse of AIP content is sub
129.6.105.191 On: Fri, 0
system ethanol–toluene–water. . . . . . . . . . . . . . . . 105927. Calculated compositions along the saturation
curve at 298.2 K. . . . . . . . . . . . . . . . . . . . . . . . . . . .105928. Summary of experimental data for the system
ethanol–heptane–water. . . . . . . . . . . . . . . . . . . . . .106729. Calculated compositions along the saturation
curve at 298.2 K.. .. . . . . . . . . . . . . . . . . . . . . . . . .106830. Summary of experimental data for the system
ethanol–m-xylene–water. . . . . . . . . . . . . . . . . . . . .107231. Calculated compositions along the saturation
curve at 298.2 K. . . . . . . . . . . . . . . . . . . . . . . . . . . .107232. Characteristic points on the binoidal curve of the
system ethanol–m-xylene–water. . . . . . . . . . . . . . . 107233. Summary of experimental data for the system
ethanol–o-xylene–water. . . . . . . . . . . . . . . . . . . . . .107734. Calculated compositions along the saturation
curve at 298.2 K. . . . . . . . . . . . . . . . . . . . . . . . . . . .107735. Summary of experimental data for the system
ethanol–p-xylene–water. . . . . . . . . . . . . . . . . . . . . .108036. Calculated compositions along the saturation
curve at 298.2 K. . . . . . . . . . . . . . . . . . . . . . . . . . . .108037. Summary of experimental data for the system
ethanol–2,3,4-trimethylpentane–water. . . . . . . . . . 108538. Calculated compositions along the saturation
curve at 298.2 K. . . . . . . . . . . . . . . . . . . . . . . . . . . .108539. Summary of experimental data for the system
ethanol–mesitylene–water. . . . . . . . . . . . . . . . . . . . 108940. Calculated compositions along the saturation
curve at 298.2 K. . . . . . . . . . . . . . . . . . . . . . . . . . . .108941. Summary of experimental data for the system
1-propanol–benzene–water. . . . . . . . . . . . . . . . . . . 109542. Calculated compositions along the saturation
curve at 298.2 K. . . . . . . . . . . . . . . . . . . . . . . . . . . .109543. Characteristic points on the binoidal curve of the
system 1-propanol–benzene–water. . . . . . . . . . . . . 109544. Summary of experimental data for the system
1-propanol–cyclohexane–water. . . . . . . . . . . . . . . . 110045. Calculated compositions along the saturation
curve at 298.2 K. . . . . . . . . . . . . . . . . . . . . . . . . . . .110046. Summary of experimental data for the system
1-propanol–hexane–water. . . . . . . . . . . . . . . . . . . . 110447. Calculated compositions along the saturation
curve at 298.2 K. . . . . . . . . . . . . . . . . . . . . . . . . . . .110448. Summary of experimental data for the system
1-propanol–toluene–water. . . . . . . .. . . . . . . . . . . . 110949. Calculated compositions along the saturation
curve ~hydrocarbon-rich phase! at 298.2 K.. . . . . 110950. Summary of experimental data for the system
1-propanol–heptane–water. . . . . . . . . . . . . . . . . . . 111451. Calculated compositions along the saturation
curve at 298.2 K. . . . . . . . . . . . . . . . . . . . . . . . . . . .111452. Summary of experimental data for the system
1-propanol–octane–water. . . . . . . . . . . . . . . . . . . . 112053. Summary of experimental data for the system
1-propanol–nonane–water. . . . . . . . . . . . . . . . . . . . 112354. Summary of experimental data for the system
1-propanol–decane–water. . . . . . . . . . . . . . . . . . . . 1126
J. Phys. Chem. Ref. Data, Vol. 28, No. 4, 1999ject to the terms at: http://scitation.aip.org/termsconditions. Downloaded to IP:
5 Sep 2014 17:51:55
986986 SKRZECZ, SHAW, AND MACZYNSKI
This a
55. Calculated compositions along the saturationcurve at 293.2 K. . . . . . . . . . . . . . . . . . . . . . . . . . . .1126
56. Summary of experimental data for the system2-propanol–benzene–water. . . . . . . . . . . . . . . . . . . 1130
57. Calculated compositions along the saturationcurve at 298.2 K. . . . . . . . . . . . . . . . . . . . . . . . . . . .1130
58. Experimental plait points for the system2-propanol–benzene–water. . . . . . . . . . . . . . . . . . . 1131
59. Summary of experimental data for the system2-propanol–cyclohexane–water. . . . . . . . . . . . . . . . 1139
60. Calculated compositions along the saturationcurve at 298.2 K. . . . . . . . . . . . . . . . . . . . . . . . . . . .1139
61. Summary of experimental data for the system2-propanol–hexane–water. . . . . . . . . . . . . . . . . . . . 1145
62. Summary of experimental data for the system2-propanol–toluene–water. .. . . . . . . . . . . . . . . . . . 1148
63. Calculated compositions along the saturationcurve at 298.2 K. . . . . . . . . . . . . . . . . . . . . . . . . . . .1148
64. Summary of experimental data for the system2-propanol–heptane–water. . . . . . . . . . . . . . . . . . . 1153
65. Calculated compositions along the saturationcurve at 298.2 K. . . . . . . . . . . . . . . . . . . . . . . . . . . .1154
66. Summary of experimental data for the system2-methyl-1-propanol–benzene–water. . . . .. . . . . . 1165
67. Summary of experimental data for the system2-methyl-1-propanol–cyclohexane–water.. . . . . . . 1167
68. Calculated compositions along the saturationcurve at 298.2 K. . . . . . . . . . . . . . . . . . . . . . . . . . . .1167
69. Summary of experimental data for the system2-methyl-2-propanol–benzene–water. . . . .. . . . . . 1174
70. Summary of experimental data for the system2-methyl-2-propanol–cyclohexane–water.. . . . . . . 1176
71. Calculated compositions along the saturationcurve at 298.2 K. . . . . . . . . . . . . . . . . . . . . . . . . . . .1176
72. Summary of experimental data for the system1-butanol–benzene–water. . . . . . . . . . . . . . . . . . . . 1186
73. Summary of experimental data for the system1-butanol–cyclohexane–water. . . . . . . . . . . . . . . . . 1189
74. Calculated compositions along the saturationcurve at 298.2 K~organic-rich phase!. . . . . . . . . . . 1189
75. Summary of experimental data for the system1-butanol–hexane–water. . . . . . . . . . . . . . . . . . . . .1191
76. Calculated compositions along the saturationcurve at 298.2 K. . . . . . . . . . . . . . . . . . . . . . . . . . . .1192
77. Summary of experimental data for the system1-butanol–toluene–water. . . . . . . . . . . . . . . . . . . . .1194
78. Summary of experimental data for the system2-butanol–benzene–water. . . . . . . . . . . . . . . . . . . . 1201
79. Summary of experimental data for the system2-butanol–cyclohexane–water. . . . . . . . . . . . . . . . . 1203
80. Calculated compositions along the saturationcurve at 298.2 K. . . . . . . . . . . . . . . . . . . . . . . . . . . .1203
81. Summary of experimental data for the system2-butanol–toluene–water. . . . . . . . . . . . . . . . . . . . .1206
82. Calculated compositions along the saturationcurve at 298.2 K~organic-rich phase!. . . . . . . . . . . 1206
83. Summary of experimental data for the system
J. Phys. Chem. Ref. Data, Vol. 28, No. 4, 1999rticle is copyrighted as indicated in the article. Reuse of AIP content is sub
129.6.105.191 On: Fri, 0
1-pentanol–hexane–water. . . . . . . . . . . . . . . . . . . . 121384. Summary of experimental data for the system
1-octanol–hexane–water. . . . . . . . . . . . . . . . . . . . .1223
List of Figures1. Phase diagram of the system methanol~1!–
benzene~2!–water~3! at 293.2 K. . . . . . . . . . . . . . 9962. Phase diagram of the system methanol~1!–
cyclohexene~2!–water~3! at 293.2 K. .. . . . . . . . 10023. Phase diagram of the system methanol~1!–
cyclohexane~2!–water~3! at 298.2 K. .. . . . . . . . 10054. Phase diagram of the system methanol~1!–
hexane~2!–water~3! at 293.2 K. . . . . . . . . . . . . . . 10095. Phase diagram of the system methanol~1!–
toluene~2!–water~3! at 298.2 K. . . . . . . . . . . . . . 10126. Phase diagram of the system methanol~1!–
heptane~2!–water~3! at 293.2 K. . . . . . . . . . . . . . 10157. Phase diagram of the system methanol~1!–
p-xylene ~2!–water~3! at 298.2 K. . . . . . . . . . . . . 10188. Phase diagram of the system methanol~1!–
2,2,4-trimethylpentane~2!–water~3! at 293.2 K.. 10219. Phase diagram of the system methanol~1!–
octane~2!–water~3! at 293.2 K. . . . . . . . . . . . . . . 102310. Phase diagram of the system ethanol~1!–
benzene~2!–water~3! at 298.2 K. . . . . . . . . . . . . . 102911. Phase diagram of the system ethanol~1!–
cyclohexene~2!–water~3! at 298.2 K. .. . . . . . . . 104312. Phase diagram of the system ethanol~1!–
cyclohexane~2!–water~3! at 298.2 K. .. . . . . . . . 104613. Phase diagram of the system ethanol~1!–hexane
~2!–water~3! at 298.2 K. . . . . . . . . . . . . . . . . . . . .105414. Phase diagram of the system ethanol~1!–toluene
~2!–water~3! at 298.2 K. . . . . . . . . . . . . . . . . . . . .106015. Phase diagram of the system ethanol~1!–
heptane~2!–water~3! at 298.2 K. . . . . . . . . . . . . . 106816. Phase diagram of the system ethanol~1!–
m-xylene ~2!–water~3! at 298.2 K. . . . . . . . . . . . . 107317. Phase diagram of the system ethanol~1!–
o-xylene ~2!–water~3! at 298.2 K. . . . . . . . . . . . . 107818. Phase diagram of the system ethanol~1!–
p-xylene ~2!–water~3! at 298.2 K. . . . . . . . . . . . . 108119. Phase diagram of the system ethanol~1!–
2,2,4-trimethylpentane~2!–water~3! at 298.2 K.. 108620. Phase diagram of the system ethanol~1!–
mesitylene~2!–water~3! at 298.2 K. . . . . . . . . . . . 109021. Phase diagram of the system 1-propanol~1!–
benzene~2!–water~3! at 293.2 K. . . . . . . . . . . . . . 109622. Phase diagram of the system 1-propanol~1!–
cyclohexane~2!–water~3! at 298.2 K. .. . . . . . . . 110123. Phase diagram of the system 1-propanol~1!–
hexane~2!–water~3! at 298.2 K. . . . . . . . . . . . . . . 110524. Phase diagram of the system 1-propanol~1!–
toluene~2!–water~3! at 298.2 K. . . . . . . . . . . . . . 111025. Phase diagram of the system 1-propanol~1!–
heptane~2!–water~3! at 298.2 K. . . . . . . . . . . . . . 111526. Phase diagram of the system 1-propanol~1!–
octane~2!–water~3! at 298.2 K. . . . . . . . . . . . . . . 1120
ject to the terms at: http://scitation.aip.org/termsconditions. Downloaded to IP:
5 Sep 2014 17:51:55
ry
m1a
bo.
dan
lur
reell-
makeareareof
ns aos-ongbut
cientofin-tle.lit-e ofbeenionon
ex-nitsey
andsti-
aslitys:
uc-
ith
n–ly–ol-
ent,Fordfter
be-re-temionfor
s ofn-en-oletra-
rr
987987IUPAC-NIST SOLUBILITY DATA SERIES
This a
27. Phase diagram of the system 1-propanol~1!–nonane~2!–water~3! at 298.2 K. . . . . . . . . . . . . . . 1124
28. Phase diagram of the system 1-propanol~1!–decane~2!–water~3! at 293.2 K. . . . . . . . . . . . . . . 1127
29. Phase diagram of the system 2-propanol~1!–benzene~2!–water~3! at 298.2 K. . . . . . . . . . . . . . 1130
30. Phase diagram of the system 2-propanol~1!–cyclohexane~2!–water~3! at 298.2 K. .. . . . . . . . 1140
31. Phase diagram of the system 2-propanol~1!–hexane~2!–water~3! at 298.2 K. . . . . . . . . . . . . . . 1146
32. Phase diagram of the system 2-propanol~1!–toluene~2!–water~3! at 298.2 K. . . . . . . . . . . . . . 1149
33. Phase diagram of the system 2-propanol~1!–heptane~2!–water~3! at 298.2 K. . . . . . . . . . . . . . 1154
34. Phase diagram of the system 2-methyl-1-propanol~1!–benzene~2!–water~3! at 298.2 K. . . . . . . . . . 1165
35. Phase diagram of the system 2-methyl-1-propanol~1!–cyclohexane~2!–water~3! at 298.2 K. .. . . . . 1167
36. Phase diagram of the system 2-methyl-2-propanol~1!–benzene~2!–water~3! at 298.2 K. . . . . . . . . . 1174
37. Phase diagram of the system 2-methyl-2-propanol~1!–cyclohexane~2!–water~3! at 298.2 K. .. . . . . 1176
38. Phase diagram of the system 1-butanol~1!–benzene~2!–water~3! at 298.2 K. . . . . . . . . . . . . . 1187
39. Phase diagram of the system 1-butanol~1!–cyclohexane~2!–water~3! at 298.2 K. .. . . . . . . . 1189
40. Phase diagram of the system 1-butanol~1!–hexane~2!–water~3! at 298.2 K. . . . . . . . . . . . . . . 1192
41. Phase diagram of the system 1-butanol~1!–toluene~2!–water~3! at 298.2 K. . . . . . . . . . . . . . 1195
42. Phase diagram of the system 2-butanol~1!–benzene~2!–water~3! at 303.2 K. . . . . . . . . . . . . . 1201
43. Phase diagram of the system 2-butanol~1!–cyclohexane~2!–water~3! at 298.2 K. .. . . . . . . . 1203
44. Phase diagram of the system 2-butanol~1!–toluene~2!–water~3! at 298.2 K. . . . . . . . . . . . . . 1206
45. Phase diagram of the system 1-pentanol~1!–hexane~2!–water~3! at 298.2 K. . . . . . . . . . . . . . . 1214
46. Phase diagram of the system 1-octanol~1!–hexane~2!–water~3! at 293.2 K. . . . . . . . . . . . . . . 1223
1. Preface to the Volume
This volume of IUPAC Solubility Data Series on ternaalcohol–hydrocarbon–water systems is the continuationprevious works on binary systems. Alcohol–water systewere presented as Vol. 15 of the Series, Ref.hydrocarbon–water systems were presented as Vols. 3738 of the Series, Refs. 2 and 3 and alcohol–hydrocarsystems were presented as Vol. 56 of the Series, Ref. 4
This volume surveys solubility data~along saturationcurve and phases in equilibrium! which have been publishein the open literature up to the end of 1992. The alcoholsthose to nine carbon atoms, the most common are methaethanol, propanols, and butanols. The hydrocarbons incthose with three or more carbon atoms and of all structu
rticle is copyrighted as indicated in the article. Reuse of AIP content is sub
129.6.105.191 On: Fri, 0
ofs;ndn
reol,deal
types ~aliphatic, aromatic, unsaturated, etc.! which are liq-uids at room temperature and pressure.
A total of 205 original studies of 116 ternary systems acompiled. Components of these systems were always wdefined substances. From these, it has been possible tocritical evaluations for 47 systems. Only numerical datagiven because data published originally in graphical forminherently imprecise, especially given the high precisionthe tabulated data for many systems. The literature contailarge amount of imprecise and conflicting data. Where psible, recommended or tentative values of composition alsaturation curves and for phases in equilibrium are given,and in many cases this cannot be done because of insuffiinformation. This volume is the result of a careful searchthe chemical literature. The goal of that search was toclude all published data for the systems indicated in the tiEach Critical Evaluation includes a closing date for theerature for that system, generally December, 1992. In spitthese efforts, some published measurements may havemissed. The editors will appreciate having their attentbrought to any omitted source of solubility data for inclusiin future volumes.
For purposes of comparison, all original results arepressed in mass and mole fraction as well as in the ugiven by the original investigators. Conversions, where thhave been made, are clearly attributed to the compilerthe sources of any data not provided by the original invegators are specified. Definitions of mass and mole fractionwell as their relation to other common measures of solubiare given in the Introduction to the Solubility Data SerieSolubility of Liquids in Liquids in this volume. A table ofconversion formulas is included at the end of the Introdtion.
The reported ternary data often form miscibility gaps wone pair of partially miscible components~type 1! e.g.,ethanol–hydrocarbon–water or propanol–hydrocarbowater systems or miscibility gap with two pairs of partialmiscible components~type 2! e.g., methanol–hydrocarbonwater or 1-butanol–hydrocarbon–water systems. In this vume the alcohol is reported always as the first componthe hydrocarbon as the second, and water as the third.each group~alcohols, hydrocarbons!, substances are ordereby increasing number of carbon atoms. In brackets, aeach compound name synonyms are given. Each systemgins on a separate page; first, the critical evaluation is psented together with a graphical representation of the sysat one selected temperature. This is followed by compilatof original papers. Critical evaluations are presented onlysystems where two or more independent determinationsolubility allow comparison of experimental data. The cocentration along the saturation curve as well as the conctration of phases in equilibrium are always expressed in mand mass fractions of alcohol and hydrocarbon. Concention of water may be calculated from the mass balance~sumof concentration is always equal 1.0!. The indexes8 and 9express the phase number;8 describes organic-rich ohydrocarbon-rich phase, while9 describes water-rich o
J. Phys. Chem. Ref. Data, Vol. 28, No. 4, 1999ject to the terms at: http://scitation.aip.org/termsconditions. Downloaded to IP:
5 Sep 2014 17:51:55
e
nso
od
a
-e
reinanre, rsh
s-–
lute
ind
letaluh
nsof
rt,s,
or-
mCAb-
lt ism-po-
to:
;
ord-i-
ine
al-
of
ed
y-
on
988988 SKRZECZ, SHAW, AND MACZYNSKI
This a
hydrocarbon-poor phase. Among the references in sevevaluations occurs the Russian compilation of Kafarov~ed.!,‘‘Spravochnik po Rastvorimosti,’’5 which contains only nu-merical data without any explanatory text; the English tralation of this compilation was published as a handbooksolubility.6
The editors would like to thank Andrzej Bok~Thermo-dynamics Data Center, Warsaw, Poland! for preparing com-puter programs for presentation of the tables; Professor JW. Lorimer ~Ontario, Canada! for valuable discussions anfor preparing the addresses of translated Russian papersall members of IUPAC Commission on Solubility Data~Vol.8! for discussions.
1.1. References to the Preface
1A. F. M. Barton, ed.,Solubility Data Series, Vol. 15, Alcohols with Water~Pergamon, New York, 1984!.
2D. G. Shaw, ed.,Solubility Data Series, Vol. 37, Hydrocarbons with Wa-ter and Seawater, Part I: Hydrocarbons C5 to C7 ~Pergamon, New York,1989!.
3D. G. Shaw, ed.,Solubility Data Series, Vol. 38, Hydrocarbons with Wa-ter and Seawater, Part II: Hydrocarbons C8 to C36 ~Pergamon, New York,1989!.
4D. G. Shaw, A. Skrzecz, J. W. Lorimer, and A. Maczynski, eds.,SolubilityData Series, Vol. 56, Alcohols with Hydrocarbons~Pergamon, New York,1994!.
5V. V. Kafarov, ed., Spravochnik po Rastvorimosti, Vol. 2, Troinye,Mnogokomponentnye Sistemy, Kniga II~Izd. Akademii Nauk SSSR,Moskva, 1963!.
6H. Stephen and T. Stephen, eds.,Solubilities of Inorganic and OrganicCompounds~Pergamon, New York, 1963!.
2. Introduction to the Solubility DataSeries. Solubility of Liquids in Liquids
2.1. The Nature of the Project
The Solubility Data project~SDP! has as its aim a comprehensive review of published data for solubilities of gasliquids, and solids in liquids or solids. Data of suitable pcision are compiled for each publication on data sheetsuniform format. The data for each system are evaluatedwhere data from independent sources agree sufficiently,ommended values are proposed. The evaluation sheetsommended values, and compiled data sheets are publion consecutive pages.
This series is concerned primarily with liquid–liquid sytems, but a limited number or related solid–liquid, fluidfluid, and multicomponent~organic-water-salt! systems areincluded where it is considered logical and appropriate. Sobilities at elevated and low temperatures and at elevapressures have also been included, as it is consideredpropriate to establish artificial limits on the data presentethey are considered relevant or useful.
For some systems, the two components may be misciball proportions at certain temperatures and pressures. Dareported miscibility gaps and upper and lower critical sotion temperatures are included where appropriate and wavailable.
J. Phys. Chem. Ref. Data, Vol. 28, No. 4, 1999rticle is copyrighted as indicated in the article. Reuse of AIP content is sub
129.6.105.191 On: Fri, 0
ral
-n
hn
nd
s,-ad,c-ec-ed
-d
ap-if
inon-en
2.2. Compilations and Evaluations
The formats for the compilations and critical evaluatiohave been standardized for all volumes. A descriptionthese formats follows.
2.2.1. Compilations
The format used for the compilations is, for the most paself-explanatory. A compilation sheet is divided into boxewith detailed contents described below.
Components
Each component is listed according to IUPAC name, fmula, and Chemical Abstracts~CA! Registry Number. TheChemical Abstracts name is also included if this differs frothe IUPAC name, as are trivial names if appropriate. IUPAand common names are cross-referenced to Chemicalstracts names in the System Index.
The formula is given either in terms of the IUPAC or Hil1
system and the choice of formula is governed by whausual for most current users: i.e., IUPAC for inorganic copounds, and Hill system for organic compounds. Comnents are ordered on a given compilation sheet according
~a! saturating components;~b! nonsaturating components in alphanumerical order~c! solvents in alphanumerical order.The saturating components are arranged in order acc
ing to the IUPAC 18-column periodic table with two addtional rows:
Columns 1 and 2: H, alkali elements, ammonium, alkalearth elements
Columns 3 to 12: transition elementsColumns 13 to 17: boron, carbon, nitrogen groups; ch
cogenides, halogensColumn 18: noble gasesRow 1: Ce to LuRow 2: Th to the end of the known elements, in order
atomic number.Organic compounds within each Hill formula are order
in the following succession:~a! by degree of unsaturation~b! by order of increasing chain length in the parent h
drocarbon~c! by order of increasing chain length of hydrocarb
branches~d! numerically by position of unsaturation~e! numerically by position by substitution~f! alphabetically by IUPAC name.
Example:
C5H8 cyclopentane2-methyl-1,3-butadiene1,4-pentadiene1-pentyne
C5H10 cyclopentane3-methyl-l-butene2-methyl-2-butene
ject to the terms at: http://scitation.aip.org/termsconditions. Downloaded to IP:
5 Sep 2014 17:51:55
-
m
iteie-
er
ernrc,
on
aln
tosex
anile
led
re-ons
inities
m-thisare
de-ion
phsore
llers
Ab-e toetail
ci-
rs,ve
ed.ing
esk orare
almit-
ors.
989989IUPAC-NIST SOLUBILITY DATA SERIES
This a
1-pentene2-pentene
C5H12 2,2-dimethylpropane2-methylbutanepentane
C5H12O 2,2-dimethyl-l-propanol2-methyl-l-butanol2-methyl-2-butanol3-methyl-l-butanol3-methyl-2-butanol1-pentanol2-pentanol3-pentanol
C6H12O cyclohexanol4-methyl-l-penten-3-ol1-hexen-3-ol4-hexen-3-ol
Deuterated~2H! compounds follow immediately the corresponding H compounds.
Original Measurements
References are abbreviated in the forms given by Checal Abstracts Service Source Index~CASSI!. Names origi-nally in other than Roman alphabets are given as translated by Chemical Abstracts. In the case of multiple entr~for example, translations! an asterisk indicated the publication used for compilation of the data.
Variables
Ranges of temperature, pressure, etc., are indicated h
Prepared by
The names of all compilers are given here.
Experimental Data
Components are described as~1!, ~2!, etc., as defined inthe ‘‘Components’’ box. Data are reported in the units usin the original publication, with the exception that modenames for units and quantities are used; e.g., mass pefor weight percent; mol dm23 for molar; etc. In most casesboth mass and molar values are given. Usually, onlytype of value~e.g., mass percent! is found in the originalpaper, and the compiler has added the other type of v~e.g., mole percent! from computer calculations based o1989 atomic weights.2 Temperatures are expressed ast/°C,t/°F, or T/K as in the original; if necessary, conversionsT/K are made, sometimes in the compilations, and alwaythe critical evaluation. However, the author’s units arepressed according to IUPAC recommendations3 as far aspossible.
Errors in calculations, fitting equations, etc., are noted,where possible corrected. Material inserted by the compis identified by the word ‘‘compiler’’ or by the compiler’sname in parentheses or in a footnote. In addition, compicalculated values of mole or mass fractions are include
rticle is copyrighted as indicated in the article. Reuse of AIP content is sub
129.6.105.191 On: Fri, 0
i-
r-s
e.
d
ent
e
ue
in-
dr
r-if
the original data do not use these units. If densities areported in the original paper, conversions from concentratito mole fractions are included, but otherwise this is donethe evaluation, with the values and sources of the densbeing quoted and referenced.
Details of smoothing equations~with limits! are includedif they are present in the original publication and if the teperature or pressure ranges are wide enough to justifyprocedure and if the compiler finds that the equationsconsistent with the data.
The precision of the original data is preserved whenrived quantities are calculated, if necessary by the inclusof one additional significant figure. In some cases grahave been included, either to illustrate presented data mclearly, or if this is the only information in the original. Fugrids are not usually inserted as it is not intended that usshould read data from the graphs.
Method
The apparatus and procedure are mentioned briefly.breviations used in Chemical Abstracts are often used hersave space, reference being made to sources of further dif these are cited in the original paper.
Source and Purity of Materials
For each component, referred to as~1!, ~2!, etc., the fol-lowing information~in this order and in abbreviated form! isprovided if available in the original paper: source and spefied method of preparation; properties; degree of purity.
Estimated Error
If estimated errors were omitted by the original authoand if relevant information is available, the compilers haattempted to estimate errors~identified by ‘‘compiler’’ or thecompiler’s name in parentheses or in a footnote! from theinternal consistency of data and type of apparatus usMethods used by the compilers for estimating and reporterrors are based on Ku and Eisenhart.4
Comments and/or Additional Data
Many compilations include this section which providshort comments relevant to the general nature of the woradditional experimental and thermodynamic data whichjudged by the compiler to be of value to the reader.
References
The format for these follows the format for the OriginMeasurements box, except that final page numbers are oted. References~usually cited in the original paper! are givenwhere relevant to interpretation of the compiled data,where cross-reference can be made to other compilation
J. Phys. Chem. Ref. Data, Vol. 28, No. 4, 1999ject to the terms at: http://scitation.aip.org/termsconditions. Downloaded to IP:
5 Sep 2014 17:51:55
litre
f av
n
edsr
ton
or
nvastson
rsresuitimh
ienonit
thaountatluet
om
stillr ofanre-theto
re,ny-eir
eluesd
sences
gf the
es,
led
insig-
-be
eta-me
islity
in-
tivi-at
ic
forays,em-tingunits
990990 SKRZECZ, SHAW, AND MACZYNSKI
This a
2.2.2. Evaluations
The evaluator’s task is to assess the reliability and quaof the data, to estimate errors where necessary, and toommend ‘‘best’’ values. The evaluation takes the form osummary in which all the data supplied by the compiler habeen critically reviewed. There are only three boxes otypical evaluation sheet, and these are described below.
Components
The format is the same as on the Compilation sheets.
Evaluator
The name and affiliation of the evaluator~s! and date up towhich the literature was checked.
Critical Evaluation
~a! Critical text. The evaluator checks that the compildata are correct, assesses their reliability and quality, emates errors where necessary, and recommends numevalues based on all the published data~including theses, re-ports, and patents! for each given system. Thus, the evaluareviews the merits or shortcomings of the various data. Opublished data are considered. Documented rejectionsome published data may occur at this stage, and the csponding compilations may be removed.
The solubility of comparatively few systems is knowwith sufficient accuracy to enable a set of recommendedues to be presented. Although many systems have beenied by at least two workers, the range of temperatureoften sufficiently different to make meaningful comparisimpossible.
Occasionally, it is not clear why two groups of workeobtained very different but internally consistent sets ofsults at the same temperature, although both sets of rewere obtained by reliable methods. In such cases, a definassessment may not be possible. In some cases, two orsets of data have been classified as tentative even thougsets are mutually inconsistent.
~b! Fitting equations. If the use of a smoothing equationjustifiable the evaluator may provide an equation represing the solubility as a function of the variables reportedall the compilation sheets, stating the limits within whichshould be used.
~c! Graphical summary. In addition to~b! above, graphicalsummaries are often given.
~d! Recommended values. Data are recommended ifresults of at least two independent groups are availablethey are in good agreement, and if the evaluator has no das to the adequacy and reliability of the applied experimeand computational procedures. Data are reported as tentif only one set of measurements is available, or if the evaator considers some aspect of the computational or expmental method as mildly undesirable but estimates thashould cause only minor errors. Data are considereddoubtful if the evaluator considers some aspect of the c
J. Phys. Chem. Ref. Data, Vol. 28, No. 4, 1999rticle is copyrighted as indicated in the article. Reuse of AIP content is sub
129.6.105.191 On: Fri, 0
yc-
ea
ti-ical
rlyofre-
l-ud-is
-lts
veorethe
st-
endbt
alive-ri-itas-
putational or experimental method as undesirable butconsiders the data to have some value where the ordemagnitude of the solubility is needed. Data determined byinadequate method or under ill-defined conditions arejected. However, references to these data are included inevaluation together with a comment by the evaluator asthe reason for their rejection.
~e! References. All pertinent references are given heincluding all those publications appearing in the accompaing compilation sheets and those which, by virtue of thpoor precision, have been rejected and not compiled.
~f! Units. While the original data may be reported in thunits used by the investigators, the final recommended vaare reported in SI units3 when the data can be converteaccurately.
2.3. Quantities and Units Used in Compilation andEvaluation of Solubility Data
2.3.1. Mixtures, Solutions and Solubilities
A mixture5,6 describes a gaseous, liquid or solid phacontaining more than one substance, where the substaare all treated in the same way.
A solution5,6 describes a liquid or solid phase containinmore than one substance, when for convenience one osubstances, which is called thesolvent, and may itself be amixture, is treated differently than the other substancwhich are calledsolutes. If the sum of the mole fraction ofthe solutes is small compared to unity, the solution is cala dilute solution.
The solubility of a solute 1~solid, liquid or gas! is theanalytical composition of a saturated solution, expressedterms of the proportion of the designated solute in a denated solvent.7
‘‘Saturated’’ implies equilibrium with respect to the processes of dissolution and demixing; the equilibrium maystable or metastable. The solubility of a substance in mstable equilibrium is usually greater than that of the sasubstance in stable equilibrium.~Strictly speaking, it is theactivity of the substance in metastable equilibrium thatgreater.! Care must be taken to distinguish true metastabiform supersaturation, where equilibrium does not exist.
Either point of view, mixture or solution, may be takendescribing solubility. The two points of view find their expression in the reference states used for definition of acties, activity coefficients and osmotic coefficients. Note ththe composition of a saturated mixture~or solution! can bedescribed in terms of any suitable set of thermodynamcomponents.
2.3.2. Physicochemical Quantities and Units
Solubilities of solids have been the subject of researcha long time, and have been expressed in a great many was described below. In each case, specification of the tperature and either partial or total pressure of the saturagaseous component is necessary. The nomenclature and
ject to the terms at: http://scitation.aip.org/termsconditions. Downloaded to IP:
5 Sep 2014 17:51:55
991991IUPAC-NIST SOLUBILITY DATA SERIES
This a
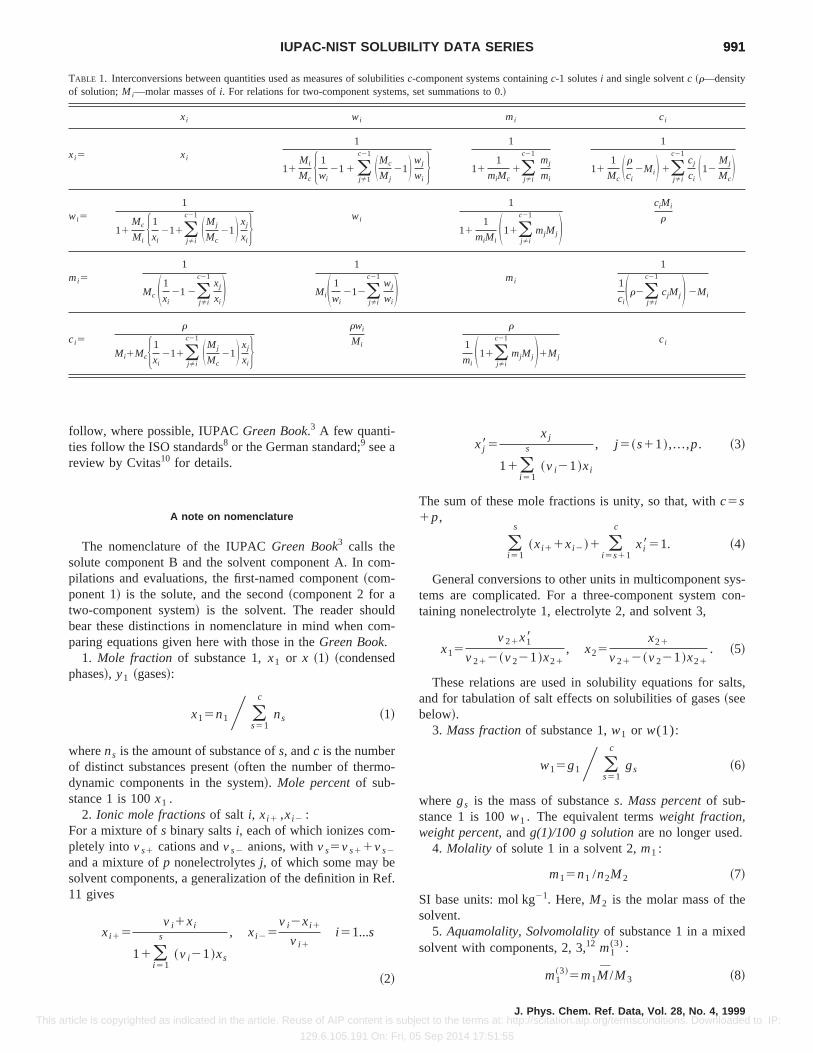
TABLE 1. Interconversions between quantities used as measures of solubilitiesc-component systems containingc-1 solutesi and single solventc ~r—densityof solution;Mi—molar masses ofi. For relations for two-component systems, set summations to 0.!
xi wi mi ci
xi5 xi
1
11Mi
McH 1
wi211 (
jÞ1
c21 SMc
Mj21D wj
wiJ
1
111
miMc1(
jÞi
c21mj
mi
1
111
McSr
ci2MiD 1(
jÞi
c21cj
ciS12
Mj
McD
wi5
1
11Mc
MiH1
xi211(
jÞi
c21 SMj
Mc21D xj
xiJ wi
1
111
miMiS11(
jÞi
c21
mjMjDciMi
r
mi5
1
Mc S1
xi212(
jÞi
c21xj
xiD
1
MiS 1
wi212(
jÞi
c21wj
wiD mi
1
1
ciSr2(
jÞi
c21
cjMjD 2Mi
ci5
r
Mi1McH1
xi211(
jÞi
c21 SMj
Mc21D xj
xiJ
rwi
Mi
r
1
miS11(
jÞi
c21
mjMjD1Mj
ci
m
ldm
-
-
e
ys-con-
lts,
follow, where possible, IUPACGreen Book.3 A few quanti-ties follow the ISO standards8 or the German standard;9 see areview by Cvitas10 for details.
A note on nomenclature
The nomenclature of the IUPACGreen Book3 calls thesolute component B and the solvent component A. In copilations and evaluations, the first-named component~com-ponent 1! is the solute, and the second~component 2 for atwo-component system! is the solvent. The reader shoubear these distinctions in nomenclature in mind when coparing equations given here with those in theGreen Book.
1. Mole fraction of substance 1,x1 or x ~1! ~condensedphases!, y1 ~gases!:
x15n1Y (s51
c
ns ~1!
wherens is the amount of substance ofs, andc is the numberof distinct substances present~often the number of thermodynamic components in the system!. Mole percentof sub-stance 1 is 100x1 .
2. Ionic mole fractionsof salt i, xi 1 ,xi 2 :For a mixture ofs binary saltsi, each of which ionizes completely intovs1 cations andvs2 anions, withvs5vs11vs2
and a mixture ofp nonelectrolytesj, of which some may besolvent components, a generalization of the definition in R11 gives
xi 15v i1xi
11(i 51
s
~v i21!xs
, xi 25v i2xi 1
v i 1i 51...s
~2!
rticle is copyrighted as indicated in the article. Reuse of AIP content is sub
129.6.105.191 On: Fri, 0
-
-
f.
xj85xj
11(i 51
s
~v i21!xi
, j 5~s11!,...,p. ~3!
The sum of these mole fractions is unity, so that, withc5s1p,
(i 51
s
~xi 11xi 2!1 (i 5s11
c
xi851. ~4!
General conversions to other units in multicomponent stems are complicated. For a three-component systemtaining nonelectrolyte 1, electrolyte 2, and solvent 3,
x15v21x18
v212~v221!x21, x25
x21
v212~v221!x21. ~5!
These relations are used in solubility equations for saand for tabulation of salt effects on solubilities of gases~seebelow!.
3. Mass fractionof substance 1,w1 or w(1):
w15g1Y (s51
c
gs ~6!
wheregs is the mass of substances. Mass percentof sub-stance 1 is 100w1 . The equivalent termsweight fraction,weight percent, andg(1)/100 g solutionare no longer used.
4. Molality of solute 1 in a solvent 2,m1 :
m15n1 /n2M2 ~7!
SI base units: mol kg21. Here,M2 is the molar mass of thesolvent.
5. Aquamolality, Solvomolalityof substance 1 in a mixedsolvent with components, 2, 3,12 m1
(3) :
m1~3!5m1M /M3 ~8!
J. Phys. Chem. Ref. Data, Vol. 28, No. 4, 1999ject to the terms at: http://scitation.aip.org/termsconditions. Downloaded to IP:
5 Sep 2014 17:51:55
he
isol
ixrenstnt
.
C,
ro-to
andted.f as.nota-toarepro-the
ure
try
re-
--
en
992992 SKRZECZ, SHAW, AND MACZYNSKI
This a
SI base units: mol kg21. Here, the average molar mass of tsolvent is
M5x28M21~12x28!M3 ~9!
and x28 is the solvent mole fraction of component 2. Thterm is used most frequently in discussing comparative sbilities in water~component 2! and heavy water~component3! and in their mixtures.
6. Amount concentrationif solute 1 in a solution of vol-umeV, c1 :
c15@ formula of solute#5n1 /V ~10!
SI base units: mol m23. The symbolc1 is preferred to@for-mula of solute#, but both are used. The old termsmolarity,molar, andmoles per unit volumeare no longer used.
7. Mass concentrationof solute 1 in a solution of volumeV, r1: SI base units: kg m23.
r15g1 /V. ~11!
8. Mole ratio, r A,B ~dimensionless!10
r A,B5n1 /n2. ~12!
Mass ratio, symbolzA,B , may be defined analogously.10
Mole and mass fractions are appropriate to either the mture or the solution point of view. The other quantities aappropriate to the solution point of view only. Conversiobetween pairs of these quantities can be carried out usingequations given in Table 1 at the end of this IntroductioOther useful quantities will be defined in the prefacesindividual volumes or on specific data sheets.
9. Density, r:r5g/V ~13!
SI base units: kg m23. Hereg is the total mass of the system10. Relative density, d5r/r°: the ratio of the density of a
mixture at temperaturet, pressurep to the density of a ref-erence substance at temperaturet8, pressurep8. For liquidsolutions, the reference substance is often water at 4 °bar.~In some cases 1 atm is used instead of 1 bar.! The termspecific gravityis no longer used.
J. Phys. Chem. Ref. Data, Vol. 28, No. 4, 1999rticle is copyrighted as indicated in the article. Reuse of AIP content is sub
129.6.105.191 On: Fri, 0
u-
-
he.o
1
Thermodynamics of Solubility
Thermodynamic analysis of solubility phenomena pvides a rational basis for the construction of functionsrepresent solubility data, and thus aids in evaluation,sometimes enables thermodynamic quantities to be extracBoth these aims are often difficult to achieve because olack of experimental or theoretical activity coefficientWhere thermodynamic quantities can be found, they areevaluated critically, since this task would involve examintion of a large body of data that is not directly relevantsolubility. Where possible, procedures for evaluationbased on established thermodynamic methods. Specificcedures used in a particular volume will be described inPreface to this volume.
2.4. References for the Introduction
1E. A. Hill, J. Am. Chem. Soc.22, 478 ~1990!.2IUPAC Commission on Atomic Weights and Isotopic Abundances, PAppl. Chem.63, 975 ~1980!.
3I. Mills et al., eds.,Quantities, Units and Symbols in Physical Chemis~TheGreen Book!. ~Blackwell Scientific Publications, Oxford, UK, 1993!.
4H. H. Ku, p. 73; C. Eisenhart, p. 69; in H. H. Ku, ed., Precision Measument and Calibration,NBS Special Publication 300, Vol. 1 ~Washington,1969!.
5J. Regaudy and S. P. Klesney,Nomenclature of Organic Chemistry~IU-PAC! ~The Blue Book! ~Pergamon, Oxford, 1979!.
6V. Gold et al., eds.,Compendium of Chemical Technology~The GoldBook! ~Blackwell Scientific Publications, Oxford, UK, 1987!.
7H. Freiser and G. H. Nancollas, eds.,Compendium of Analytical Nomenclature ~The Orange Book! ~The Blackwell Scientific Publications, Oxford, UK, 1987!, Sect. 9.1.8.
8ISO Standards Handbook,Quantities and Units~International StandardsOrganization, Geneva, 1993!.
9German Standard, DIN 1310,Zusammungsetzung von Mischphas~Beuth Verlag, Berlin, 1984!.
10T. Cvitas, Chem. Int.17, 123 ~1995!.11R. A. Robinson and R. H. Stokes,Electroyte Solutions~Butterworths,
London, 1959!, 2nd ed.12J. W. Lorimer, in R. Cohen-Adad and J. W. Lorimer,Alkali Metal and
Ammonium Chlorides in Water and Heavy Water (Binary Systems), IU-PAC Solubility Data Series, Vol. 47~Pergamon, Oxford, UK, 1991!, p.495.
This section was written by:
A. F. M. Barton Perth, WA, AustraliaG. T. Hefter Perth, WA, AustraliaF. W. Getzen Raleigh, NC, USAD. G. Shaw Fairbanks, AK, USA
December, 1995
ject to the terms at: http://scitation.aip.org/termsconditions. Downloaded to IP:
5 Sep 2014 17:51:55
areas. Care was taken to avoid contamination by the
Original Measurements:
ol!; CH4O; @67-56-1#
0; @106-97-8##
K. Noda, K. Sato, K. Nagatsuka, and K. Ishida, J. Chem. Eng.Jpn.8, 492–3~1975!.
Compiled by:A. Skrzecz
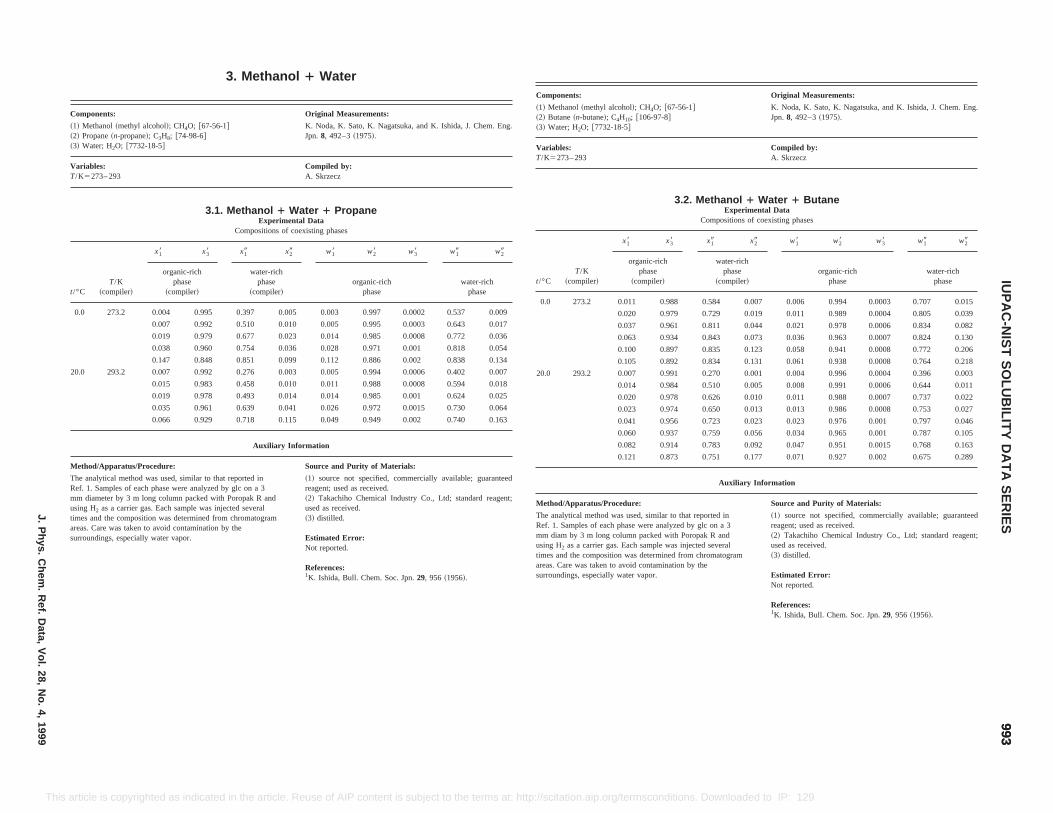
3.2. Methanol 1 Water 1 ButaneExperimental Data
Compositions of coexisting phases
x38 x19 x29 w18 w28 w38 w19 w29
organic-richphase
~compiler!
water-richphase
~compiler!organic-rich
phasewater-rich
phase
11 0.988 0.584 0.007 0.006 0.994 0.0003 0.707 0.015
20 0.979 0.729 0.019 0.011 0.989 0.0004 0.805 0.039
37 0.961 0.811 0.044 0.021 0.978 0.0006 0.834 0.082
63 0.934 0.843 0.073 0.036 0.963 0.0007 0.824 0.130
00 0.897 0.835 0.123 0.058 0.941 0.0008 0.772 0.206
05 0.892 0.834 0.131 0.061 0.938 0.0008 0.764 0.218
007 0.991 0.270 0.001 0.004 0.996 0.0004 0.396 0.003
14 0.984 0.510 0.005 0.008 0.991 0.0006 0.644 0.011
20 0.978 0.626 0.010 0.011 0.988 0.0007 0.737 0.022
23 0.974 0.650 0.013 0.013 0.986 0.0008 0.753 0.027
41 0.956 0.723 0.023 0.023 0.976 0.001 0.797 0.046
60 0.937 0.759 0.056 0.034 0.965 0.001 0.787 0.105
82 0.914 0.783 0.092 0.047 0.951 0.0015 0.768 0.163
21 0.873 0.751 0.177 0.071 0.927 0.002 0.675 0.289
Auxiliary Information
ure: Source and Purity of Materials:
used, similar to that reported inRef. 1. Samples of each phase were analyzed by glc on a 3
long column packed with Poropak R andrier gas. Each sample was injected several
position was determined from chromatogramtaken to avoid contamination by theecially water vapor.
~1! source not specified, commercially available; guaranteedreagent; used as received.~2! Takachiho Chemical Industry Co., Ltd; standard reagent;used as received.~3! distilled.
Estimated Error:Not reported.
References:1K. Ishida, Bull. Chem. Soc. Jpn.29, 956 ~1956!.
993993
IUP
AC
-NIS
TS
OLU
BILIT
YD
AT
AS
ER
IESJ.P
hys.C
hem.
Ref.
Data,
Vol.
28,N
o.4,
1999
This .org/termsconditions. Downloaded to IP: 129.6.105.191 On: Fri, 05 Sep 2014 17:51:55
surroundings, especially water vapor. Estimated Error:Not reported.
References:1K. Ishida, Bull. Chem. Soc. Jpn.29, 956 ~1956!.
mm diam by 3 musing H2 as a cartimes and the comareas. Care wassurroundings, esp
article is copyrighted as indicated in the article. Reuse of AIP content is subject to the terms at: http://scitation.aip
3. Methanol 1 Water
Components: Original Measurements:
~1! Methanol~methyl alcohol!; CH4O; @67-56-1#~2! Propane~n-propane!; C3H8; @74-98-6#~3! Water; H2O; @7732-18-5#
K. Noda, K. Sato, K. Nagatsuka, and K. Ishida, J. Chem. Eng.Jpn.8, 492–3~1975!.
Variables:T/K5273– 293
Compiled by:A. Skrzecz
3.1. Methanol 1 Water 1 PropaneExperimental Data
Compositions of coexisting phases
t/°CT/K
~compiler!
x18 x38 x19 x29 w18 w28 w38 w19 w29
organic-richphase
~compiler!
water-richphase
~compiler!organic-rich
phasewater-rich
phase
0.0 273.2 0.004 0.995 0.397 0.005 0.003 0.997 0.0002 0.537 0.009
0.007 0.992 0.510 0.010 0.005 0.995 0.0003 0.643 0.017
0.019 0.979 0.677 0.023 0.014 0.985 0.0008 0.772 0.036
0.038 0.960 0.754 0.036 0.028 0.971 0.001 0.818 0.054
0.147 0.848 0.851 0.099 0.112 0.886 0.002 0.838 0.134
20.0 293.2 0.007 0.992 0.276 0.003 0.005 0.994 0.0006 0.402 0.007
0.015 0.983 0.458 0.010 0.011 0.988 0.0008 0.594 0.018
0.019 0.978 0.493 0.014 0.014 0.985 0.001 0.624 0.025
0.035 0.961 0.639 0.041 0.026 0.972 0.0015 0.730 0.064
0.066 0.929 0.718 0.115 0.049 0.949 0.002 0.740 0.163
Auxiliary Information
Method/Apparatus/Procedure: Source and Purity of Materials:
The analytical method was used, similar to that reported inRef. 1. Samples of each phase were analyzed by glc on a 3mm diameter by 3 m long column packed with Poropak R andusing H2 as a carrier gas. Each sample was injected severaltimes and the composition was determined from chromatogram
~1! source not specified, commercially available; guaranteedreagent; used as received.~2! Takachiho Chemical Industry Co., Ltd; standard reagent;used as received.~3! distilled.
Components:
~1! Methanol~methyl alcoh~2! Butane~n-butane!; C4H1
~3! Water; H2O; @7732-18-5
Variables:T/K5273– 293
t/°CT/K
~compiler!
x18
0.0 273.2 0.0
0.0
0.0
0.0
0.1
0.1
20.0 293.2 0.
0.0
0.0
0.0
0.0
0.0
0.0
0.1
Method/Apparatus/Proced
The analytical method was
V. I. Morozova, Zh. Prikl.. @Eng. transl. Russ. J.2–5~1966!#.
w2
0.00080.0020.0020.0020.0030.0030.0030.0040.0050.0070.0110.0130.0250.0400.0570.0580.0790.0920.0940.1220.1590.1980.1990.214
0.6685 0.1090 0.652 0.226
Compositions of coexisting phases
t/°CT/K
~compiler!
x18 x28 x19 x29 w18 w28 w19 w29
hydrocarbon-rich phase~compiler!
water-richphase
~compiler!hydrocarbon-
rich phasewater-rich
phase
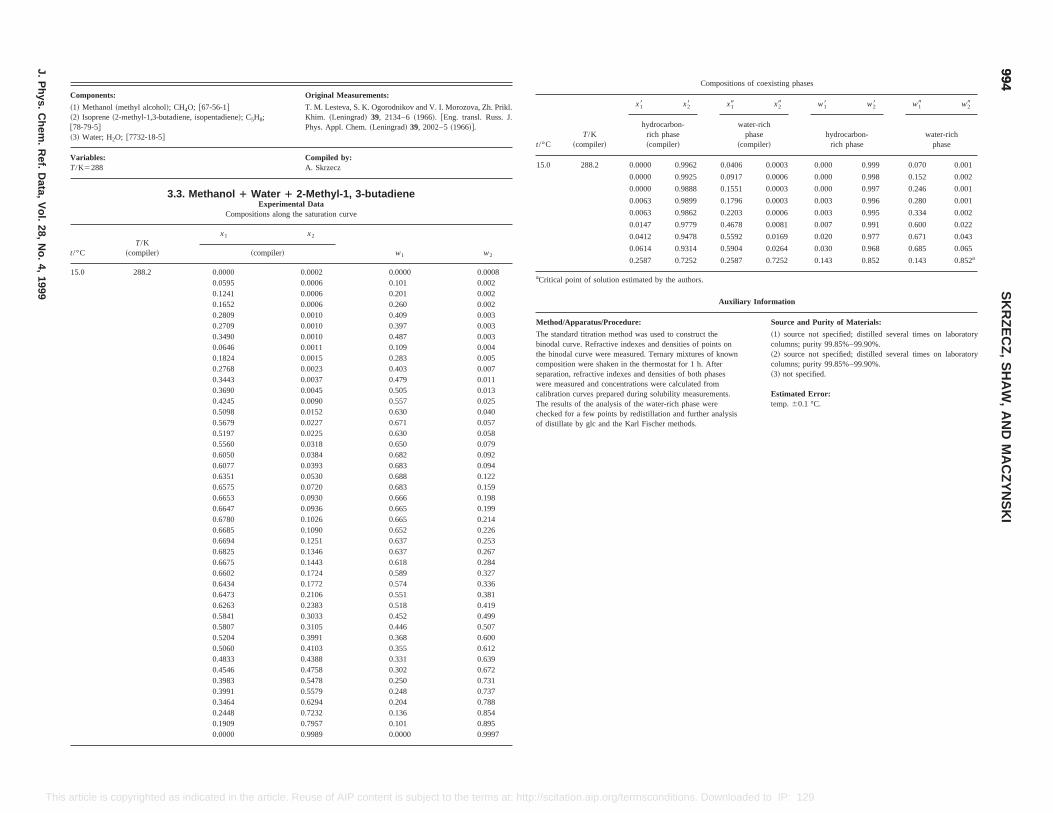
15.0 288.2 0.0000 0.9962 0.0406 0.0003 0.000 0.999 0.070 0.001
0.0000 0.9925 0.0917 0.0006 0.000 0.998 0.152 0.002
0.0000 0.9888 0.1551 0.0003 0.000 0.997 0.246 0.001
0.0063 0.9899 0.1796 0.0003 0.003 0.996 0.280 0.001
0.0063 0.9862 0.2203 0.0006 0.003 0.995 0.334 0.002
0.0147 0.9779 0.4678 0.0081 0.007 0.991 0.600 0.022
0.0412 0.9478 0.5592 0.0169 0.020 0.977 0.671 0.043
0.0614 0.9314 0.5904 0.0264 0.030 0.968 0.685 0.065
0.2587 0.7252 0.2587 0.7252 0.143 0.852 0.143 0.852a
aCritical point of solution estimated by the authors.
Auxiliary Information
Method/Apparatus/Procedure: Source and Purity of Materials:
The standard titration method was used to construct thebinodal curve. Refractive indexes and densities of points onthe binodal curve were measured. Ternary mixtures of knowncomposition were shaken in the thermostat for 1 h. Afterseparation, refractive indexes and densities of both phaseswere measured and concentrations were calculated fromcalibration curves prepared during solubility measurements.The results of the analysis of the water-rich phase werechecked for a few points by redistillation and further analysisof distillate by glc and the Karl Fischer methods.
~1! source not specified; distilled several times on laboratorycolumns; purity 99.85%–99.90%.~2! source not specified; distilled several times on laboratorycolumns; purity 99.85%–99.90%.~3! not specified.
Estimated Error:temp.60.1 °C.
994994
SK
RZ
EC
Z,
SH
AW
,A
ND
MA
CZ
YN
SK
I
J.P
hys.C
hem.
Ref.
Data,
Vol.
28,N
o.4,
1999
This to IP: 129.6.105.191 On: Fri, 05 Sep 2014 17:51:55
0.6694 0.1251 0.637 0.2530.6825 0.1346 0.637 0.2670.6675 0.1443 0.618 0.2840.6602 0.1724 0.589 0.3270.6434 0.1772 0.574 0.3360.6473 0.2106 0.551 0.3810.6263 0.2383 0.518 0.4190.5841 0.3033 0.452 0.4990.5807 0.3105 0.446 0.5070.5204 0.3991 0.368 0.6000.5060 0.4103 0.355 0.6120.4833 0.4388 0.331 0.6390.4546 0.4758 0.302 0.6720.3983 0.5478 0.250 0.7310.3991 0.5579 0.248 0.7370.3464 0.6294 0.204 0.7880.2448 0.7232 0.136 0.8540.1909 0.7957 0.101 0.8950.0000 0.9989 0.0000 0.9997
article is copyrighted as indicated in the article. Reuse of AIP content is subject to the terms at: http://scitation.aip.org/termsconditions. Downloaded
Components: Original Measurements:
~1! Methanol~methyl alcohol!; CH4O; @67-56-1#~2! Isoprene~2-methyl-1,3-butadiene, isopentadiene!; C5H8;@78-79-5#~3! Water; H2O; @7732-18-5#
T. M. Lesteva, S. K. Ogorodnikov andKhim. ~Leningrad! 39, 2134–6 ~1966!Phys. Appl. Chem.~Leningrad! 39, 200
Variables:T/K5288
Compiled by:A. Skrzecz
3.3. Methanol 1 Water 1 2-Methyl-1, 3-butadieneExperimental Data
Compositions along the saturation curve
t/°CT/K
~compiler!
x1 x2
w1~compiler!
15.0 288.2 0.0000 0.0002 0.00000.0595 0.0006 0.1010.1241 0.0006 0.2010.1652 0.0006 0.2600.2809 0.0010 0.4090.2709 0.0010 0.3970.3490 0.0010 0.4870.0646 0.0011 0.1090.1824 0.0015 0.2830.2768 0.0023 0.4030.3443 0.0037 0.4790.3690 0.0045 0.5050.4245 0.0090 0.5570.5098 0.0152 0.6300.5679 0.0227 0.6710.5197 0.0225 0.6300.5560 0.0318 0.6500.6050 0.0384 0.6820.6077 0.0393 0.6830.6351 0.0530 0.6880.6575 0.0720 0.6830.6653 0.0930 0.6660.6647 0.0936 0.6650.6780 0.1026 0.665
the binodal curve of the system methanol–benzene–water
tion Plait points
Ref.Ref. x1 x2
12 0.406 0.523 12
11 0.441 0.482 11
0.4743 0.4106 4
13 0.47 0.44 13
10 0.470 0.420 10
10 0.467 0.389 10
10 0.465 0.357 10
tion of the behavior of the system.~The temperature difference between 293.2 andalculations.! All together 72 experimental points on the saturation curve11,12 ~thegether! were used to construct the fitting equation:
825 ln~x2!20.852 77x220.122 05x22.
sitions on the saturation curve calculated by the fitting equation are presented in thesults of calculations~solid line! are presented graphically in Fig. 1 together with all
positions along the saturation curve at 293.2 K
x1 x2
0.4294 0.5000
0.4145 0.5200
0.3993 0.5400
0.3839 0.5600
0.3682 0.5800
0.3523 0.6000
0.3361 0.6200
0.3197 0.6400
0.3031 0.6600
0.2864 0.6800
0.2694 0.7000
0.2522 0.7200
0.2348 0.7400
0.2172 0.7600
0.1995 0.7800
0.1816 0.8000
0.1635 0.8200
0.1452 0.8400
0.1268 0.8600
0.1082 0.8800
0.0895 0.9000
0.0706 0.9200
0.0515 0.9400
0.0323 0.9600
0.0130 0.9800
0.0032 0.9900
0.0000 0.9975 Ref. 15
995995
IUP
AC
-NIS
TS
OLU
BILIT
YD
AT
AS
ER
IESJ.P
hys.C
hem.
Ref.
Data,
Vol.
28,N
o.4,
1999
This . Downloaded to IP: 129.6.105.191 On: Fri, 05 Sep 2014 17:51:55
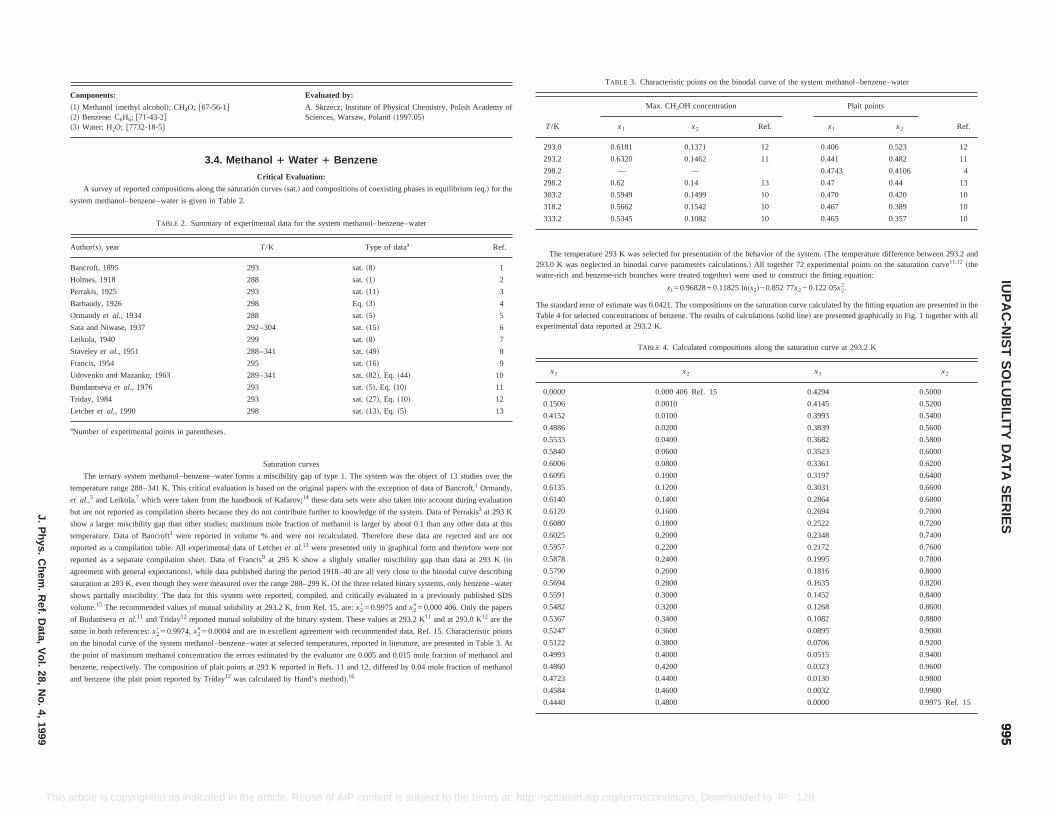
temperature. Data of Bancroft1 were reported in volume % and were not recalculated. Therefore these data are rejected and are not
reported as a compilation table. All experimental data of Letcheret al.13 were presented only in graphical form and therefore were not
reported as a separate compilation sheet. Data of Francis9 at 295 K show a slightly smaller miscibility gap than data at 293 K~in
agreement with general expectations!, while data published during the period 1918–40 are all very close to the binodal curve describing
saturation at 293 K, even though they were measured over the range 288–299 K. Of the three related binary systems, only benzene–water
shows partially miscibility. The data for this system were reported, compiled, and critically evaluated in a previously published SDS
volume.15 The recommended values of mutual solubility at 293.2 K, from Ref. 15, are:x2850.9975 andx2950.000 406. Only the papers
of Budantsevaet al.11 and Triday12 reported mutual solubility of the binary system. These values at 293.2 K11 and at 293.0 K12 are the
same in both references:x2850.9974,x2950.0004 and are in excellent agreement with recommended data, Ref. 15. Characteristic points
on the binodal curve of the system methanol–benzene–water at selected temperatures, reported in literature, are presented in Table 3. At
the point of maximum methanol concentration the errors estimated by the evaluator are 0.005 and 0.015 mole fraction of methanol and
benzene, respectively. The composition of plait points at 293 K reported in Refs. 11 and 12, differed by 0.04 mole fraction of methanol
and benzene~the plait point reported by Triday12 was calculated by Hand’s method!.16
0.6025 0.2000
0.5957 0.2200
0.5878 0.2400
0.5790 0.2600
0.5694 0.2800
0.5591 0.3000
0.5482 0.3200
0.5367 0.3400
0.5247 0.3600
0.5122 0.3800
0.4993 0.4000
0.4860 0.4200
0.4723 0.4400
0.4584 0.4600
0.4440 0.4800
article is copyrighted as indicated in the article. Reuse of AIP content is subject to the terms at: http://scitation.aip.org/termsconditions
Components: Evaluated by:
~1! Methanol~methyl alcohol!; CH4O; @67-56-1#~2! Benzene: C6H6; @71-43-2#~3! Water; H2O; @7732-18-5#
A. Skrzecz, Institute of Physical Chemistry, Polish Academy ofSciences, Warsaw, Poland~1997.05!
3.4. Methanol 1 Water 1 Benzene
Critical Evaluation:
A survey of reported compositions along the saturation curves~sat.! and compositions of coexisting phases in equilibrium~eq.! for the
system methanol–benzene–water is given in Table 2.
TABLE 2. Summary of experimental data for the system methanol–benzene–water
Author~s!, year T/K Type of dataa Ref.
Bancroft, 1895 293 sat.~8! 1
Holmes, 1918 288 sat.~1! 2
Perrakis, 1925 293 sat.~11! 3
Barbaudy, 1926 298 Eq.~3! 4
Ormandyet al., 1934 288 sat.~5! 5
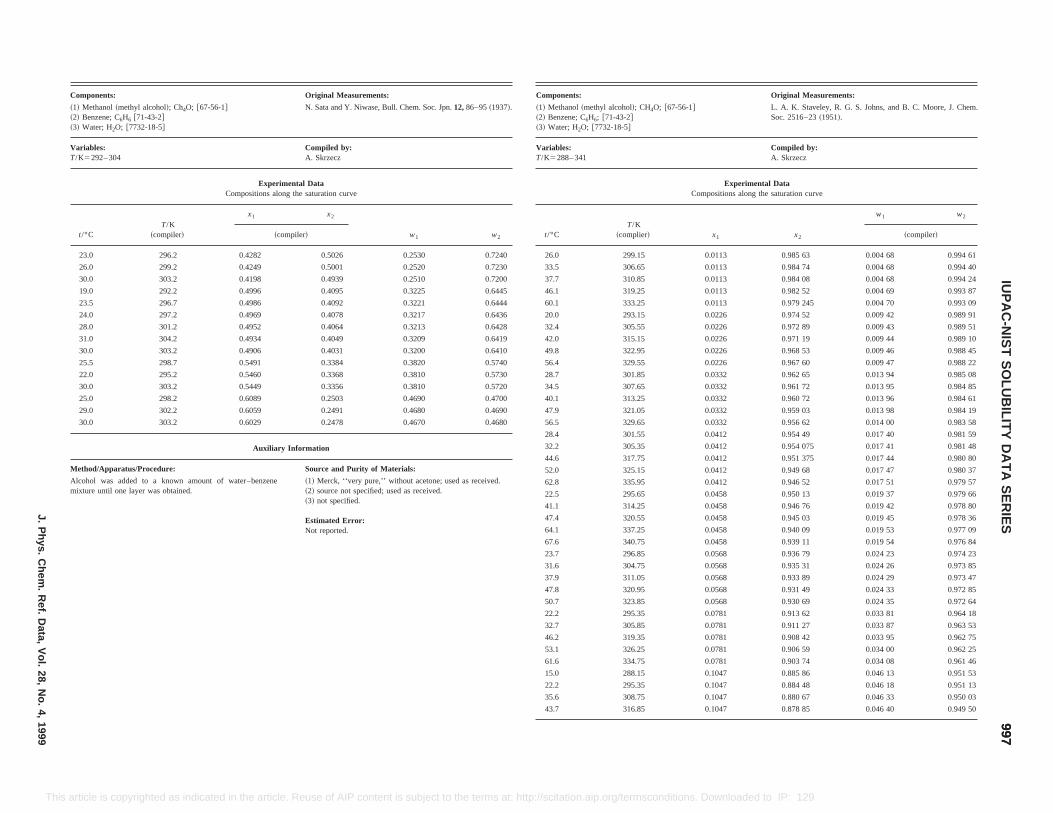
Sata and Niwase, 1937 292–304 sat.~15! 6
Leikola, 1940 299 sat.~8! 7
Staveleyet al., 1951 288–341 sat.~49! 8
Francis, 1954 295 sat.~16! 9
Udovenko and Mazanko, 1963 289–341 sat.~82!, Eq. ~44! 10
Bundantsevaet al., 1976 293 sat.~5!, Eq. ~10! 11
Triday, 1984 293 sat.~27!, Eq. ~10! 12
Letcheret al., 1990 298 sat.~13!, Eq. ~5! 13
aNumber of experimental points in parentheses.
Saturation curves
The ternary system methanol–benzene–water forms a miscibility gap of type 1. The system was the object of 13 studies over the
temperature range 288–341 K. This critical evaluation is based on the original papers with the exception of data of Bancroft,1 Ormandy,
et al.,5 and Leikola,7 which were taken from the handbook of Kafarov;14 these data sets were also taken into account during evaluation
but are not reported as compilation sheets because they do not contribute further to knowledge of the system. Data of Perrakis3 at 293 K
show a larger miscibility gap than other studies; maximum mole fraction of methanol is larger by about 0.1 than any other data at this
TABLE 3. Characteristic points on
T/K
Max. CH3OH concentra
x1 x2
293.0 0.6181 0.1371
293.2 0.6320 0.1462
298.2 — —
298.2 0.62 0.14
303.2 0.5949 0.1499
318.2 0.5662 0.1542
333.2 0.5345 0.1082
The temperature 293 K was selected for presenta293.0 K was neglected in binodal curve parameters cwater-rich and benzene-rich branches were treated to
x150.9682810.11
The standard error of estimate was 0.0421. The compoTable 4 for selected concentrations of benzene. The reexperimental data reported at 293.2 K.
TABLE 4. Calculated com
x1 x2
0.0000 0.000 406 Ref. 15
0.1506 0.0010
0.4152 0.0100
0.4886 0.0200
0.5533 0.0400
0.5840 0.0600
0.6006 0.0800
0.6095 0.1000
0.6135 0.1200
0.6140 0.1400
0.6120 0.1600
0.6080 0.1800
references asity gap. Thereonsistent withinentration in therted in Refs. 10,ne-richmixturerature arere presented in
curve,
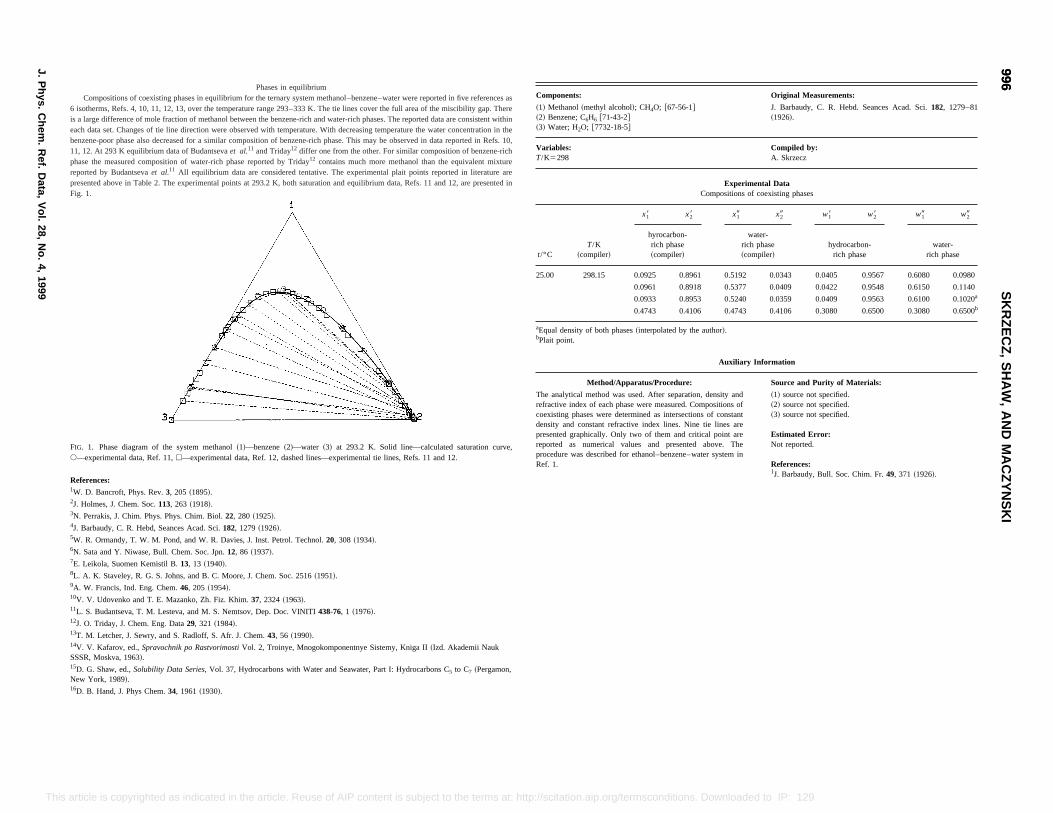
Components: Original Measurements:
~1! Methanol~methyl alcohol!; CH4O; @67-56-1#~2! Benzene; C6H6 @71-43-2#~3! Water; H2O; @7732-18-5#
J. Barbaudy, C. R. Hebd. Seances Acad. Sci.182, 1279–81~1926!.
Variables:T/K5298
Compiled by:A. Skrzecz
Experimental DataCompositions of coexisting phases
t/°CT/K
~compiler!
x18 x28 x19 x29 w18 w28 w19 w29
hyrocarbon-rich phase~compiler!
water-rich phase~compiler!
hydrocarbon-rich phase
water-rich phase
25.00 298.15 0.0925 0.8961 0.5192 0.0343 0.0405 0.9567 0.6080 0.0980
0.0961 0.8918 0.5377 0.0409 0.0422 0.9548 0.6150 0.1140
0.0933 0.8953 0.5240 0.0359 0.0409 0.9563 0.6100 0.1020a
0.4743 0.4106 0.4743 0.4106 0.3080 0.6500 0.3080 0.6500b
aEqual density of both phases~interpolated by the author!.bPlait point.
Auxiliary Information
Method/Apparatus/Procedure: Source and Purity of Materials:
The analytical method was used. After separation, density andrefractive index of each phase were measured. Compositions ofcoexisting phases were determined as intersections of constantdensity and constant refractive index lines. Nine tie lines arepresented graphically. Only two of them and critical point arereported as numerical values and presented above. Theprocedure was described for ethanol–benzene–water system inRef. 1.
~1! source not specified.~2! source not specified.~3! source not specified.
Estimated Error:Not reported.
References:1J. Barbaudy, Bull. Soc. Chim. Fr.49, 371 ~1926!.
996996
SK
RZ
EC
Z,
SH
AW
,A
ND
MA
CZ
YN
SK
I
J.P
hys.C
hem.
Ref.
Data,
Vol.
28,N
o.4,
1999
This Downloaded to IP: 129.6.105.191 On: Fri, 05 Sep 2014 17:51:55
5W. R. Ormandy, T. W. M. Pond, and W. R. Davies, J. Inst. Petrol. Technol.20, 308 ~1934!.6N. Sata and Y. Niwase, Bull. Chem. Soc. Jpn.12, 86 ~1937!.7E. Leikola, Suomen Kemistil B.13, 13 ~1940!.8L. A. K. Staveley, R. G. S. Johns, and B. C. Moore, J. Chem. Soc. 2516~1951!.9A. W. Francis, Ind. Eng. Chem.46, 205 ~1954!.10V. V. Udovenko and T. E. Mazanko, Zh. Fiz. Khim.37, 2324~1963!.11L. S. Budantseva, T. M. Lesteva, and M. S. Nemtsov, Dep. Doc. VINITI438-76, 1 ~1976!.12J. O. Triday, J. Chem. Eng. Data29, 321 ~1984!.13T. M. Letcher, J. Sewry, and S. Radloff, S. Afr. J. Chem.43, 56 ~1990!.14V. V. Kafarov, ed.,Spravochnik po RastvorimostiVol. 2, Troinye, Mnogokomponentnye Sistemy, Kniga II~Izd. Akademii NaukSSSR, Moskva, 1963!.15D. G. Shaw, ed.,Solubility Data Series, Vol. 37, Hydrocarbons with Water and Seawater, Part I: Hydrocarbons C5 to C7 ~Pergamon,New York, 1989!.16D. B. Hand, J. Phys Chem.34, 1961~1930!.
article is copyrighted as indicated in the article. Reuse of AIP content is subject to the terms at: http://scitation.aip.org/termsconditions.
Phases in equilibriumCompositions of coexisting phases in equilibrium for the ternary system methanol–benzene–water were reported in five
6 isotherms, Refs. 4, 10, 11, 12, 13, over the temperature range 293–333 K. The tie lines cover the full area of the miscibilis a large difference of mole fraction of methanol between the benzene-rich and water-rich phases. The reported data are ceach data set. Changes of tie line direction were observed with temperature. With decreasing temperature the water concbenzene-poor phase also decreased for a similar composition of benzene-rich phase. This may be observed in data repo11, 12. At 293 K equilibrium data of Budantsevaet al.11 and Triday12 differ one from the other. For similar composition of benzephase the measured composition of water-rich phase reported by Triday12 contains much more methanol than the equivalentreported by Budantsevaet al.11 All equilibrium data are considered tentative. The experimental plait points reported in litepresented above in Table 2. The experimental points at 293.2 K, both saturation and equilibrium data, Refs. 11 and 12, aFig. 1.
FIG. 1. Phase diagram of the system methanol~1!—benzene~2!—water ~3! at 293.2 K. Solid line—calculated saturations—experimental data, Ref. 11,h—experimental data, Ref. 12, dashed lines—experimental tie lines, Refs. 11 and 12.
References:1W. D. Bancroft, Phys. Rev.3, 205 ~1895!.2J. Holmes, J. Chem. Soc.113, 263 ~1918!.3N. Perrakis, J. Chim. Phys. Phys. Chim. Biol.22, 280 ~1925!.4J. Barbaudy, C. R. Hebd, Seances Acad. Sci.182, 1279~1926!.
Not reported.
Original Measurements:
L. A. K. Staveley, R. G. S. Johns, and B. C. Moore, J. Chem.Soc. 2516–23~1951!.
Compiled by:A. Skrzecz
perimental Datans along the saturation curve
x2
w1 w2
~compiler!
0.985 63 0.004 68 0.994 61
0.984 74 0.004 68 0.994 40
0.984 08 0.004 68 0.994 24
0.982 52 0.004 69 0.993 87
0.979 245 0.004 70 0.993 09
0.974 52 0.009 42 0.989 91
0.972 89 0.009 43 0.989 51
0.971 19 0.009 44 0.989 10
0.968 53 0.009 46 0.988 45
0.967 60 0.009 47 0.988 22
0.962 65 0.013 94 0.985 08
0.961 72 0.013 95 0.984 85
0.960 72 0.013 96 0.984 61
0.959 03 0.013 98 0.984 19
0.956 62 0.014 00 0.983 58
0.954 49 0.017 40 0.981 59
0.954 075 0.017 41 0.981 48
0.951 375 0.017 44 0.980 80
0.949 68 0.017 47 0.980 37
0.946 52 0.017 51 0.979 57
0.950 13 0.019 37 0.979 66
0.946 76 0.019 42 0.978 80
0.945 03 0.019 45 0.978 36
64.1 337.25 0.0458 0.940 09 0.019 53 0.977 09
67.6 340.75 0.0458 0.939 11 0.019 54 0.976 84
23.7 296.85 0.0568 0.936 79 0.024 23 0.974 23
31.6 304.75 0.0568 0.935 31 0.024 26 0.973 85
37.9 311.05 0.0568 0.933 89 0.024 29 0.973 47
47.8 320.95 0.0568 0.931 49 0.024 33 0.972 85
50.7 323.85 0.0568 0.930 69 0.024 35 0.972 64
22.2 295.35 0.0781 0.913 62 0.033 81 0.964 18
32.7 305.85 0.0781 0.911 27 0.033 87 0.963 53
46.2 319.35 0.0781 0.908 42 0.033 95 0.962 75
53.1 326.25 0.0781 0.906 59 0.034 00 0.962 25
61.6 334.75 0.0781 0.903 74 0.034 08 0.961 46
15.0 288.15 0.1047 0.885 86 0.046 13 0.951 53
22.2 295.35 0.1047 0.884 48 0.046 18 0.951 13
35.6 308.75 0.1047 0.880 67 0.046 33 0.950 03
43.7 316.85 0.1047 0.878 85 0.046 40 0.949 50
997997
IUP
AC
-NIS
TS
OLU
BILIT
YD
AT
AS
ER
IESJ.P
hys.C
hem.
Ref.
Data,
Vol.
28,N
o.4,
1999
This citation.aip.org/termsconditions. Downloaded to IP: 129.6.105.191 On: Fri, 05 Sep 2014 17:51:55
article is copyrighted as indicated in the article. Reuse of AIP content is subject to the terms at: http://sComponents: Original Measurements:
~1! Methanol~methyl alcohol!; Ch4O; @67-56-1#~2! Benzene; C6H6 @71-43-2#~3! Water; H2O; @7732-18-5#
N. Sata and Y. Niwase, Bull. Chem. Soc. Jpn.12,86–95~1937!.
Variables:T/K5292– 304
Compiled by:A. Skrzecz
Experimental DataCompositions along the saturation curve
t/°CT/K
~compiler!
x1 x2
w1 w2~compiler!
23.0 296.2 0.4282 0.5026 0.2530 0.7240
26.0 299.2 0.4249 0.5001 0.2520 0.7230
30.0 303.2 0.4198 0.4939 0.2510 0.7200
19.0 292.2 0.4996 0.4095 0.3225 0.6445
23.5 296.7 0.4986 0.4092 0.3221 0.6444
24.0 297.2 0.4969 0.4078 0.3217 0.6436
28.0 301.2 0.4952 0.4064 0.3213 0.6428
31.0 304.2 0.4934 0.4049 0.3209 0.6419
30.0 303.2 0.4906 0.4031 0.3200 0.6410
25.5 298.7 0.5491 0.3384 0.3820 0.5740
22.0 295.2 0.5460 0.3368 0.3810 0.5730
30.0 303.2 0.5449 0.3356 0.3810 0.5720
25.0 298.2 0.6089 0.2503 0.4690 0.4700
29.0 302.2 0.6059 0.2491 0.4680 0.4690
30.0 303.2 0.6029 0.2478 0.4670 0.4680
Auxiliary Information
Method/Apparatus/Procedure: Source and Purity of Materials:
Alcohol was added to a known amount of water–benzenemixture until one layer was obtained.
~1! Merck, ‘‘very pure,’’ without acetone; used as received.~2! source not specified; used as received.~3! not specified.
Estimated Error:
Components:
~1! Methanol~methyl alcohol!; CH4O; @67-56-1#~2! Benzene; C6H6; @71-43-2#~3! Water; H2O; @7732-18-5#
Variables:T/K5288– 341
ExCompositio
t/°CT/K
~complier! x1
26.0 299.15 0.0113
33.5 306.65 0.0113
37.7 310.85 0.0113
46.1 319.25 0.0113
60.1 333.25 0.0113
20.0 293.15 0.0226
32.4 305.55 0.0226
42.0 315.15 0.0226
49.8 322.95 0.0226
56.4 329.55 0.0226
28.7 301.85 0.0332
34.5 307.65 0.0332
40.1 313.25 0.0332
47.9 321.05 0.0332
56.5 329.65 0.0332
28.4 301.55 0.0412
32.2 305.35 0.0412
44.6 317.75 0.0412
52.0 325.15 0.0412
62.8 335.95 0.0412
22.5 295.65 0.0458
41.1 314.25 0.0458
47.4 320.55 0.0458
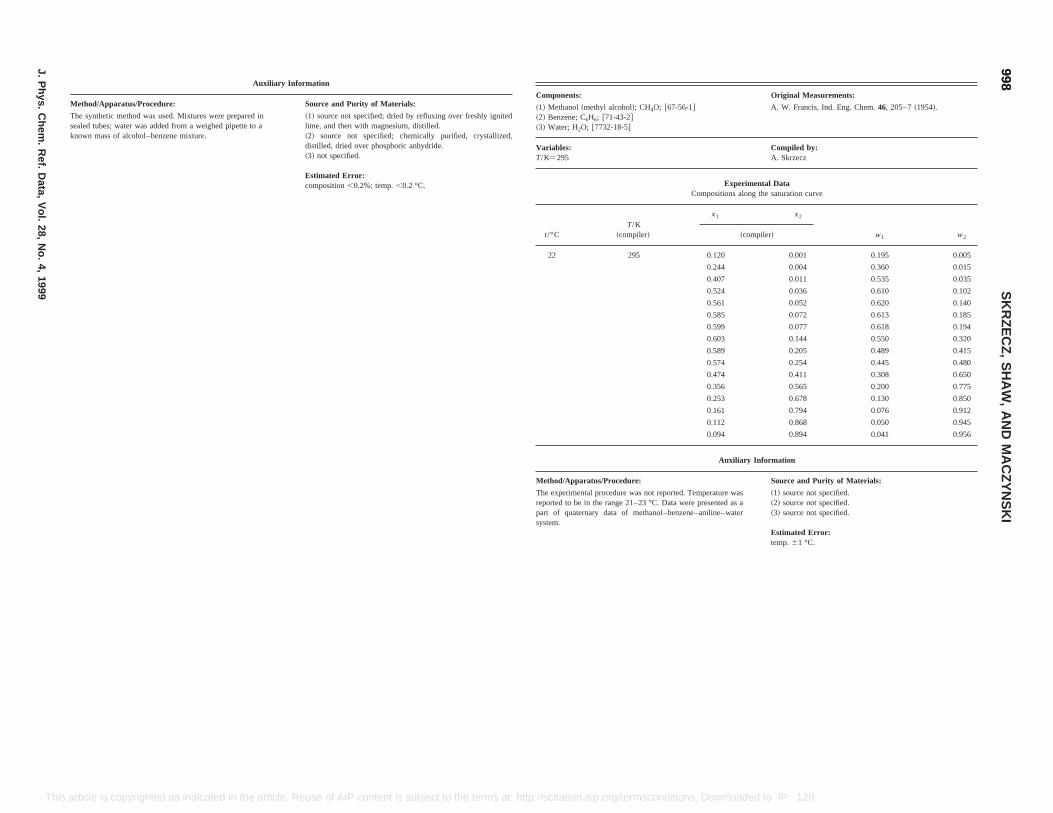
onents: Original Measurements:
ethanol~methyl alcohol!; CH4O; @67-56-1#nzene; C6H6; @71-43-2#
ater; H2O; @7732-18-5#
A. W. Francis, Ind. Eng. Chem.46, 205–7~1954!.
bles:295
Compiled by:A. Skrzecz
Experimental DataCompositions along the saturation curve
CT/K
~compiler!
x1 x2
w1 w2~compiler!
295 0.120 0.001 0.195 0.005
0.244 0.004 0.360 0.015
0.407 0.011 0.535 0.035
0.524 0.036 0.610 0.102
0.561 0.052 0.620 0.140
0.585 0.072 0.613 0.185
0.599 0.077 0.618 0.194
0.603 0.144 0.550 0.320
0.589 0.205 0.489 0.415
0.574 0.254 0.445 0.480
0.474 0.411 0.308 0.650
0.356 0.565 0.200 0.775
0.253 0.678 0.130 0.850
0.161 0.794 0.076 0.912
0.112 0.868 0.050 0.945
0.094 0.894 0.041 0.956
Auxiliary Information
od/Apparatus/Procedure: Source and Purity of Materials:
xperimental procedure was not reported. Temperature wasted to be in the range 21–23 °C. Data were presented as aof quaternary data of methanol–benzene–aniline–waterm.
~1! source not specified.~2! source not specified.~3! source not specified.
Estimated Error:temp.61 °C.
998998
SK
RZ
EC
Z,
SH
AW
,A
ND
MA
CZ
YN
SK
I
J.P
hys.C
hem.
Ref.
Data,
Vol.
28,N
o.4,
1999
This ated in the article. Reuse of AIP content is subject to the terms at: http://scitation.aip.org/termsconditions. Downloaded to IP: 129.6.105.191 On: Fri, 05 Sep 2014 17:51:55
article is copyrighted as indicAuxiliary Information
Method/Apparatus/Procedure: Source and Purity of Materials:
The synthetic method was used. Mixtures were prepared insealed tubes; water was added from a weighed pipette to aknown mass of alcohol–benzene mixture.
~1! source not specified; dried by refluxing over freshly ignitedlime, and then with magnesium, distilled.~2! source not specified; chemically purified, crystallized,distilled, dried over phosphoric anhydride.~3! not specified.
Estimated Error:composition,0.2%; temp.,0.2 °C.
Comp
~1! M~2! Be~3! W
VariaT/K5
t/°
22
Meth
The ereporpartsyste
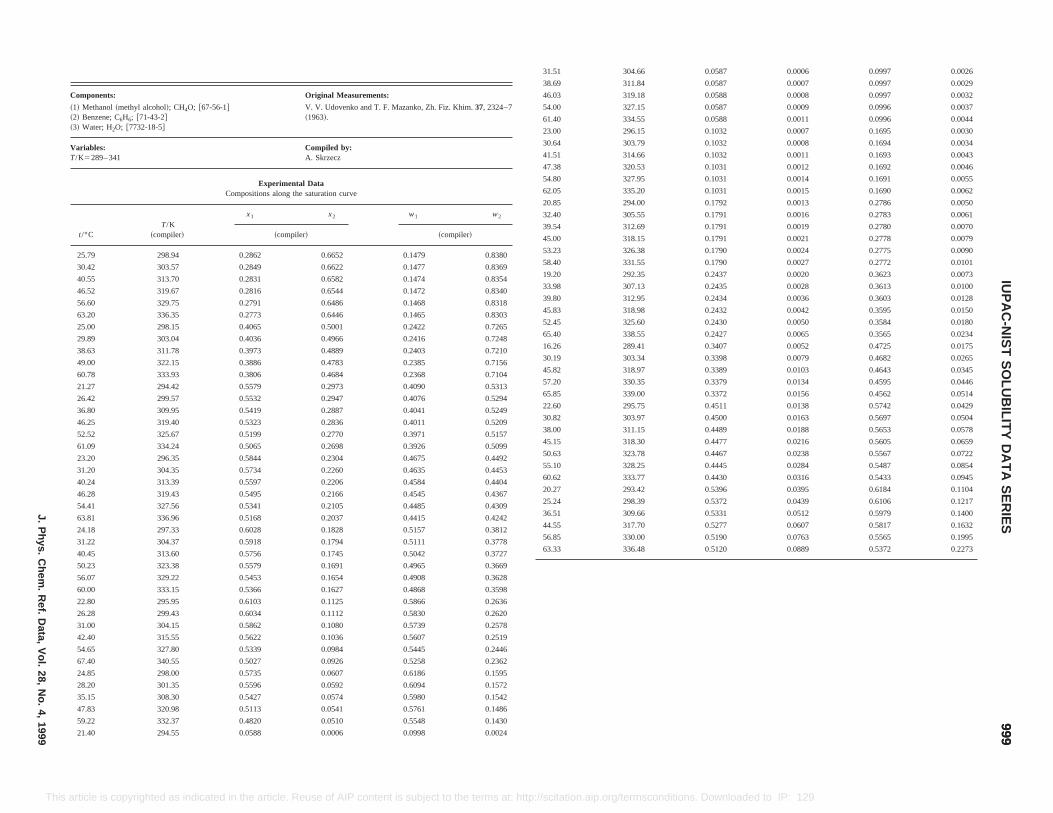
304.66 0.0587 0.0006 0.0997 0.0026
311.84 0.0587 0.0007 0.0997 0.0029
319.18 0.0588 0.0008 0.0997 0.0032
327.15 0.0587 0.0009 0.0996 0.0037
334.55 0.0588 0.0011 0.0996 0.0044
296.15 0.1032 0.0007 0.1695 0.0030
303.79 0.1032 0.0008 0.1694 0.0034
314.66 0.1032 0.0011 0.1693 0.0043
320.53 0.1031 0.0012 0.1692 0.0046
327.95 0.1031 0.0014 0.1691 0.0055
335.20 0.1031 0.0015 0.1690 0.0062
294.00 0.1792 0.0013 0.2786 0.0050
305.55 0.1791 0.0016 0.2783 0.0061
312.69 0.1791 0.0019 0.2780 0.0070
318.15 0.1791 0.0021 0.2778 0.0079
326.38 0.1790 0.0024 0.2775 0.0090
331.55 0.1790 0.0027 0.2772 0.0101
292.35 0.2437 0.0020 0.3623 0.0073
307.13 0.2435 0.0028 0.3613 0.0100
312.95 0.2434 0.0036 0.3603 0.0128
318.98 0.2432 0.0042 0.3595 0.0150
325.60 0.2430 0.0050 0.3584 0.0180
338.55 0.2427 0.0065 0.3565 0.0234
289.41 0.3407 0.0052 0.4725 0.0175
303.34 0.3398 0.0079 0.4682 0.0265
318.97 0.3389 0.0103 0.4643 0.0345
330.35 0.3379 0.0134 0.4595 0.0446
339.00 0.3372 0.0156 0.4562 0.0514
295.75 0.4511 0.0138 0.5742 0.0429
303.97 0.4500 0.0163 0.5697 0.0504
311.15 0.4489 0.0188 0.5653 0.0578
318.30 0.4477 0.0216 0.5605 0.0659
323.78 0.4467 0.0238 0.5567 0.0722
328.25 0.4445 0.0284 0.5487 0.0854
333.77 0.4430 0.0316 0.5433 0.0945
293.42 0.5396 0.0395 0.6184 0.1104
298.39 0.5372 0.0439 0.6106 0.1217
309.66 0.5331 0.0512 0.5979 0.1400
0.0607 0.5817 0.1632
0.0763 0.5565 0.1995
0.0889 0.5372 0.2273
999999
IUP
AC
-NIS
TS
OLU
BILIT
YD
AT
AS
ER
IESJ.P
hys.C
hem.
Ref.
Data,
Vol.
28,N
o.4,
1999
This ed to IP: 129.6.105.191 On: Fri, 05 Sep 2014 17:51:55
24.18 297.33 0.6028 0.1828 0.5157 0.3812
31.22 304.37 0.5918 0.1794 0.5111 0.3778
40.45 313.60 0.5756 0.1745 0.5042 0.3727
50.23 323.38 0.5579 0.1691 0.4965 0.3669
56.07 329.22 0.5453 0.1654 0.4908 0.3628
60.00 333.15 0.5366 0.1627 0.4868 0.3598
22.80 295.95 0.6103 0.1125 0.5866 0.2636
26.28 299.43 0.6034 0.1112 0.5830 0.2620
31.00 304.15 0.5862 0.1080 0.5739 0.2578
42.40 315.55 0.5622 0.1036 0.5607 0.2519
54.65 327.80 0.5339 0.0984 0.5445 0.2446
67.40 340.55 0.5027 0.0926 0.5258 0.2362
24.85 298.00 0.5735 0.0607 0.6186 0.1595
28.20 301.35 0.5596 0.0592 0.6094 0.1572
35.15 308.30 0.5427 0.0574 0.5980 0.1542
47.83 320.98 0.5113 0.0541 0.5761 0.1486
59.22 332.37 0.4820 0.0510 0.5548 0.1430
21.40 294.55 0.0588 0.0006 0.0998 0.0024
44.55 317.70 0.5277
56.85 330.00 0.5190
63.33 336.48 0.5120
article is copyrighted as indicated in the article. Reuse of AIP content is subject to the terms at: http://scitation.aip.org/termsconditions. Download
Components: Original Measurements:
~1! Methanol~methyl alcohol!; CH4O; @67-56-1#~2! Benzene; C6H6; @71-43-2#~3! Water; H2O; @7732-18-5#
V. V. Udovenko and T. F. Mazanko, Zh. Fiz. Khim.37, 2324–7~1963!.
Variables:T/K5289– 341
Compiled by:A. Skrzecz
Experimental DataCompositions along the saturation curve
t/°CT/K
~compiler!
x1 x2 w1 w2
~compiler! ~compiler!
25.79 298.94 0.2862 0.6652 0.1479 0.8380
30.42 303.57 0.2849 0.6622 0.1477 0.8369
40.55 313.70 0.2831 0.6582 0.1474 0.8354
46.52 319.67 0.2816 0.6544 0.1472 0.8340
56.60 329.75 0.2791 0.6486 0.1468 0.8318
63.20 336.35 0.2773 0.6446 0.1465 0.8303
25.00 298.15 0.4065 0.5001 0.2422 0.7265
29.89 303.04 0.4036 0.4966 0.2416 0.7248
38.63 311.78 0.3973 0.4889 0.2403 0.7210
49.00 322.15 0.3886 0.4783 0.2385 0.7156
60.78 333.93 0.3806 0.4684 0.2368 0.7104
21.27 294.42 0.5579 0.2973 0.4090 0.5313
26.42 299.57 0.5532 0.2947 0.4076 0.5294
36.80 309.95 0.5419 0.2887 0.4041 0.5249
46.25 319.40 0.5323 0.2836 0.4011 0.5209
52.52 325.67 0.5199 0.2770 0.3971 0.5157
61.09 334.24 0.5065 0.2698 0.3926 0.5099
23.20 296.35 0.5844 0.2304 0.4675 0.4492
31.20 304.35 0.5734 0.2260 0.4635 0.4453
40.24 313.39 0.5597 0.2206 0.4584 0.4404
46.28 319.43 0.5495 0.2166 0.4545 0.4367
54.41 327.56 0.5341 0.2105 0.4485 0.4309
63.81 336.96 0.5168 0.2037 0.4415 0.4242
31.51
38.69
46.03
54.00
61.40
23.00
30.64
41.51
47.38
54.80
62.05
20.85
32.40
39.54
45.00
53.23
58.40
19.20
33.98
39.80
45.83
52.45
65.40
16.26
30.19
45.82
57.20
65.85
22.60
30.82
38.00
45.15
50.63
55.10
60.62
20.27
25.24
36.51
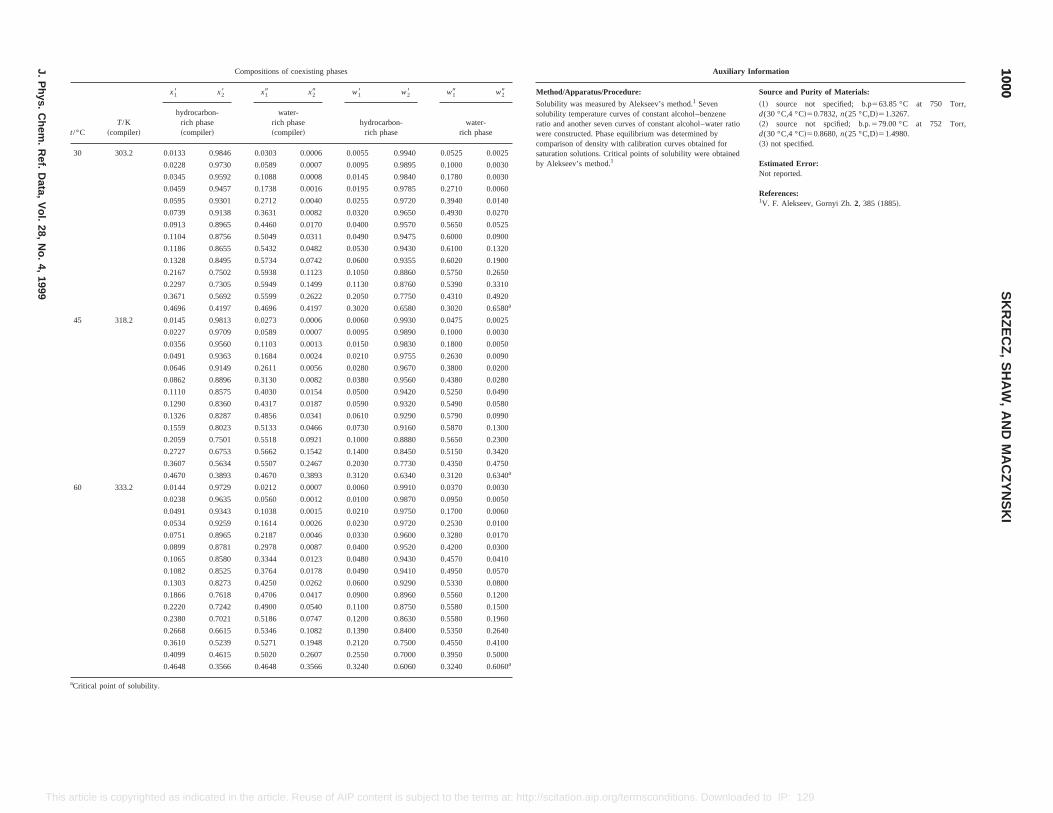
Compositions of coexisting phases
x28 x19 x29 w18 w28 w19 w29
n-e
water-rich phase~compiler!
hydrocarbon-rich phase
water-rich phase
0.9846 0.0303 0.0006 0.0055 0.9940 0.0525 0.0025
0.9730 0.0589 0.0007 0.0095 0.9895 0.1000 0.0030
0.9592 0.1088 0.0008 0.0145 0.9840 0.1780 0.0030
0.9457 0.1738 0.0016 0.0195 0.9785 0.2710 0.0060
0.9301 0.2712 0.0040 0.0255 0.9720 0.3940 0.0140
0.9138 0.3631 0.0082 0.0320 0.9650 0.4930 0.0270
0.8965 0.4460 0.0170 0.0400 0.9570 0.5650 0.0525
0.8756 0.5049 0.0311 0.0490 0.9475 0.6000 0.0900
0.8655 0.5432 0.0482 0.0530 0.9430 0.6100 0.1320
0.8495 0.5734 0.0742 0.0600 0.9355 0.6020 0.1900
0.7502 0.5938 0.1123 0.1050 0.8860 0.5750 0.2650
0.7305 0.5949 0.1499 0.1130 0.8760 0.5390 0.3310
0.5692 0.5599 0.2622 0.2050 0.7750 0.4310 0.4920
0.4197 0.4696 0.4197 0.3020 0.6580 0.3020 0.6580a
0.9813 0.0273 0.0006 0.0060 0.9930 0.0475 0.0025
0.9709 0.0589 0.0007 0.0095 0.9890 0.1000 0.0030
0.9560 0.1103 0.0013 0.0150 0.9830 0.1800 0.0050
0.9363 0.1684 0.0024 0.0210 0.9755 0.2630 0.0090
0.9149 0.2611 0.0056 0.0280 0.9670 0.3800 0.0200
0.8896 0.3130 0.0082 0.0380 0.9560 0.4380 0.0280
0.8575 0.4030 0.0154 0.0500 0.9420 0.5250 0.0490
0.8360 0.4317 0.0187 0.0590 0.9320 0.5490 0.0580
0.8287 0.4856 0.0341 0.0610 0.9290 0.5790 0.0990
0.8023 0.5133 0.0466 0.0730 0.9160 0.5870 0.1300
0.7501 0.5518 0.0921 0.1000 0.8880 0.5650 0.2300
0.6753 0.5662 0.1542 0.1400 0.8450 0.5150 0.3420
0.5634 0.5507 0.2467 0.2030 0.7730 0.4350 0.4750
0.3893 0.4670 0.3893 0.3120 0.6340 0.3120 0.6340a
0.9729 0.0212 0.0007 0.0060 0.9910 0.0370 0.0030
0.9635 0.0560 0.0012 0.0100 0.9870 0.0950 0.0050
0.9343 0.1038 0.0015 0.0210 0.9750 0.1700 0.0060
0.9259 0.1614 0.0026 0.0230 0.9720 0.2530 0.0100
Auxiliary Information
Method/Apparatus/Procedure: Source and Purity of Materials:
Solubility was measured by Alekseev’s method.1 Sevensolubility temperature curves of constant alcohol–benzeneratio and another seven curves of constant alcohol–water ratiowere constructed. Phase equilibrium was determined bycomparison of density with calibration curves obtained forsaturation solutions. Critical points of solubility were obtainedby Alekseev’s method.1
~1! source not specified; b.p563.85 °C at 750 Torr,d(30 °C,4 °C!50.7832,n(25 °C,D!51.3267.~2! source not spcified; b.p.579.00 °C at 752 Torr,d(30 °C,4 °C!50.8680,n(25 °C,D!51.4980.~3! not specified.
Estimated Error:Not reported.
References:1V. F. Alekseev, Gornyi Zh.2, 385 ~1885!.
10001000
SK
RZ
EC
Z,
SH
AW
,A
ND
MA
CZ
YN
SK
I
J.P
hys.C
hem.
Ref.
Data,
Vol.
28,N
o.4,
1999
This Downloaded to IP: 129.6.105.191 On: Fri, 05 Sep 2014 17:51:55
0.0751 0.8965 0.2187 0.0046 0.0330 0.9600 0.3280 0.0170
0.0899 0.8781 0.2978 0.0087 0.0400 0.9520 0.4200 0.0300
0.1065 0.8580 0.3344 0.0123 0.0480 0.9430 0.4570 0.0410
0.1082 0.8525 0.3764 0.0178 0.0490 0.9410 0.4950 0.0570
0.1303 0.8273 0.4250 0.0262 0.0600 0.9290 0.5330 0.0800
0.1866 0.7618 0.4706 0.0417 0.0900 0.8960 0.5560 0.1200
0.2220 0.7242 0.4900 0.0540 0.1100 0.8750 0.5580 0.1500
0.2380 0.7021 0.5186 0.0747 0.1200 0.8630 0.5580 0.1960
0.2668 0.6615 0.5346 0.1082 0.1390 0.8400 0.5350 0.2640
0.3610 0.5239 0.5271 0.1948 0.2120 0.7500 0.4550 0.4100
0.4099 0.4615 0.5020 0.2607 0.2550 0.7000 0.3950 0.5000
0.4648 0.3566 0.4648 0.3566 0.3240 0.6060 0.3240 0.6060a
aCritical point of solubility.
article is copyrighted as indicated in the article. Reuse of AIP content is subject to the terms at: http://scitation.aip.org/termsconditions.
t/°CT/K
~compiler!
x18
hydrocarborich phas~compiler!
30 303.2 0.0133
0.0228
0.0345
0.0459
0.0595
0.0739
0.0913
0.1104
0.1186
0.1328
0.2167
0.2297
0.3671
0.4696
45 318.2 0.0145
0.0227
0.0356
0.0491
0.0646
0.0862
0.1110
0.1290
0.1326
0.1559
0.2059
0.2727
0.3607
0.4670
60 333.2 0.0144
0.0238
0.0491
0.0534
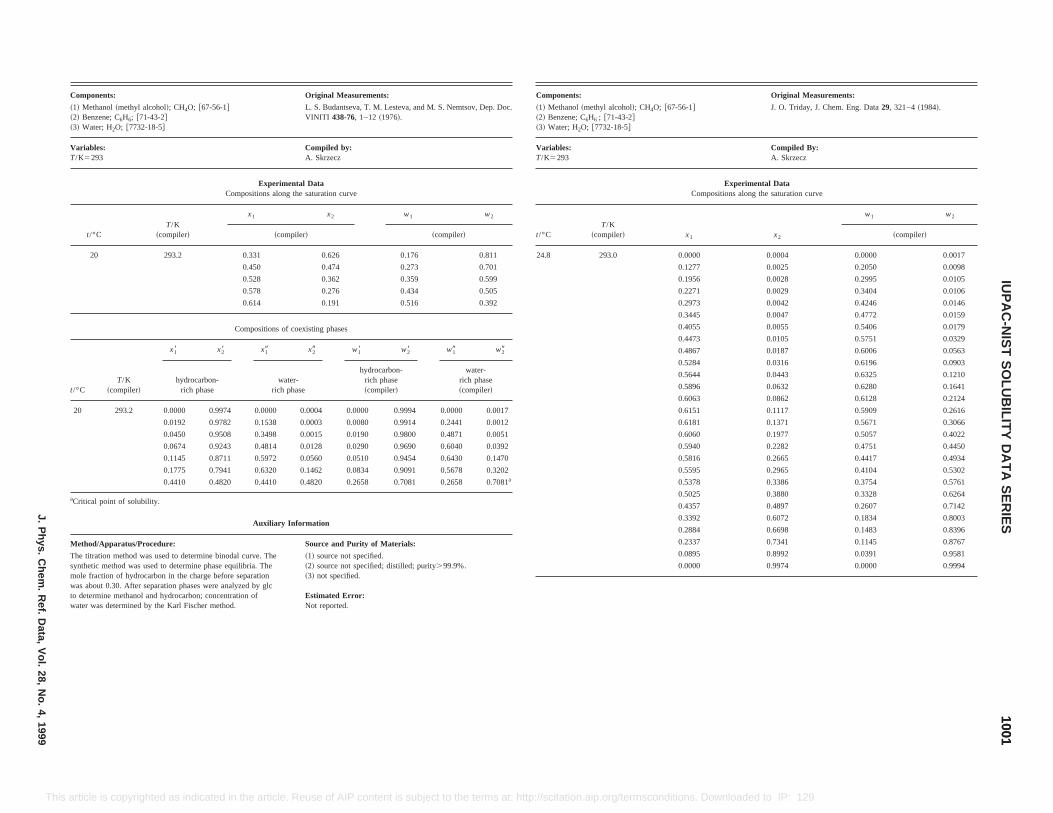
: Original Measurements:
~methyl alcohol!; CH4O; @67-56-1#C6H6 ; @71-43-2#
O; @7732-18-5#
J. O. Triday, J. Chem. Eng. Data29, 321–4~1984!.
Compiled By:A. Skrzecz
Experimental DataCompositions along the saturation curve
T/K~compiler! x1 x2
w1 w2
~compiler!
293.0 0.0000 0.0004 0.0000 0.0017
0.1277 0.0025 0.2050 0.0098
0.1956 0.0028 0.2995 0.0105
0.2271 0.0029 0.3404 0.0106
0.2973 0.0042 0.4246 0.0146
0.3445 0.0047 0.4772 0.0159
0.4055 0.0055 0.5406 0.0179
0.4473 0.0105 0.5751 0.0329
0.4867 0.0187 0.6006 0.0563
0.5284 0.0316 0.6196 0.0903
0.5644 0.0443 0.6325 0.1210
0.5896 0.0632 0.6280 0.1641
0.6063 0.0862 0.6128 0.2124
0.6151 0.1117 0.5909 0.2616
0.6181 0.1371 0.5671 0.3066
0.6060 0.1977 0.5057 0.4022
0.5940 0.2282 0.4751 0.4450
0.5816 0.2665 0.4417 0.4934
0.5595 0.2965 0.4104 0.5302
0.5378 0.3386 0.3754 0.5761
0.5025 0.3880 0.3328 0.6264
0.4357 0.4897 0.2607 0.7142
0.3392 0.6072 0.1834 0.8003
0.2884 0.6698 0.1483 0.8396
0.2337 0.7341 0.1145 0.8767
0.0895 0.8992 0.0391 0.9581
0.0000 0.9974 0.0000 0.9994
10011001
IUP
AC
-NIS
TS
OLU
BILIT
YD
AT
AS
ER
IESJ.P
hys.C
hem.
Ref.
Data,
Vol.
28,N
o.4,
1999
This ermsconditions. Downloaded to IP: 129.6.105.191 On: Fri, 05 Sep 2014 17:51:55
Method/Apparatus/Procedure: Source and Purity of Materials:
The titration method was used to determine binodal curve. Thesynthetic method was used to determine phase equilibria. Themole fraction of hydrocarbon in the charge before separationwas about 0.30. After separation phases were analyzed by glcto determine methanol and hydrocarbon; concentration ofwater was determined by the Karl Fischer method.
~1! source not specified.~2! source not specified; distilled; purity.99.9%.~3! not specified.
Estimated Error:Not reported.
article is copyrighted as indicated in the article. Reuse of AIP content is subject to the terms at: http://scitation.aip.org/t
Components: Original Measurements:
~1! Methanol~methyl alcohol!; CH4O; @67-56-1#~2! Benzene; C6H6; @71-43-2#~3! Water; H2O; @7732-18-5#
L. S. Budantseva, T. M. Lesteva, and M. S. Nemtsov, Dep. Doc.VINITI 438-76, 1–12~1976!.
Variables:T/K5293
Compiled by:A. Skrzecz
Experimental DataCompositions along the saturation curve
t/°CT/K
~compiler!
x1 x2 w1 w2
~compiler! ~compiler!
20 293.2 0.331 0.626 0.176 0.811
0.450 0.474 0.273 0.701
0.528 0.362 0.359 0.599
0.578 0.276 0.434 0.505
0.614 0.191 0.516 0.392
Compositions of coexisting phases
t/°CT/K
~compiler!
x18 x28 x19 x29 w18 w28 w19 w29
hydrocarbon-rich phase
water-rich phase
hydrocarbon-rich phase~compiler!
water-rich phase~compiler!
20 293.2 0.0000 0.9974 0.0000 0.0004 0.0000 0.9994 0.0000 0.0017
0.0192 0.9782 0.1538 0.0003 0.0080 0.9914 0.2441 0.0012
0.0450 0.9508 0.3498 0.0015 0.0190 0.9800 0.4871 0.0051
0.0674 0.9243 0.4814 0.0128 0.0290 0.9690 0.6040 0.0392
0.1145 0.8711 0.5972 0.0560 0.0510 0.9454 0.6430 0.1470
0.1775 0.7941 0.6320 0.1462 0.0834 0.9091 0.5678 0.3202
0.4410 0.4820 0.4410 0.4820 0.2658 0.7081 0.2658 0.7081a
aCritical point of solubility.
Auxiliary Information
Components
~1! Methanol~2! Benzene;~3! Water; H2
Variables:T/K5293
t/°C
24.8
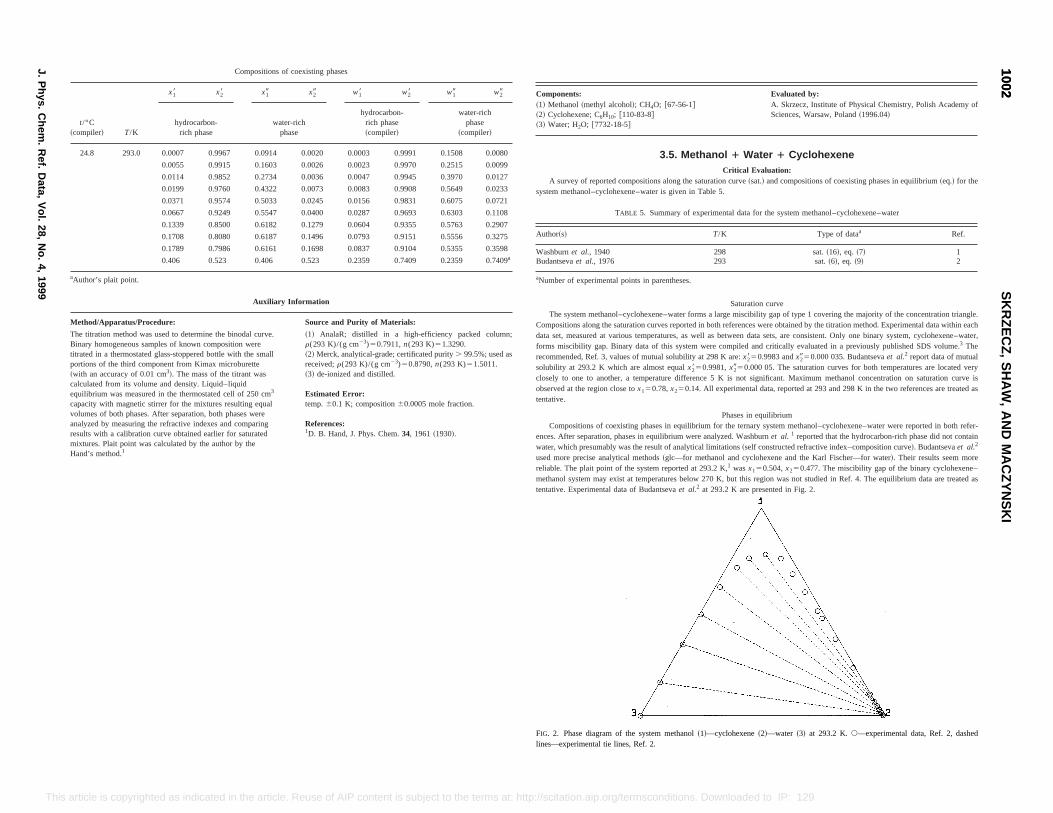
Evaluated by:. Skrzecz, Institute of Physical Chemistry, Polish Academy ofciences, Warsaw, Poland~1996.04!
1 Cyclohexenetion:d compositions of coexisting phases in equilibrium~eq.! for the
the system methanol–cyclohexene–water
Type of dataa Ref.
sat.~16!, eq. ~7! 1sat.~6!, eq. ~9! 2
urveility gap of type 1 covering the majority of the concentration triangle.s were obtained by the titration method. Experimental data within eachdata sets, are consistent. Only one binary system, cyclohexene–water,d critically evaluated in a previously published SDS volume.3 The83 andx2950.000 035. Budantsevaet al.2 report data of mutual. The saturation curves for both temperatures are located very
ant. Maximum methanol concentration on saturation curve ista, reported at 293 and 298 K in the two references are treated as
ilibriumy system methanol–cyclohexene–water were reported in both refer-hburnt al. 1 reported that the hydrocarbon-rich phase did not containstructed refractive index–composition curve!. Budantsevaet al.2
xene and the Karl Fischer—for water!. Their results seem more04,x250.477. The miscibility gap of the binary cyclohexene–region was not studied in Ref. 4. The equilibrium data are treated asented in Fig. 2.
FIG. 2. Phase diagram of the system methanol~1!—cyclohexene~2!—water ~3! at 293.2 K.s—experimental data, Ref. 2, dashedlines—experimental tie lines, Ref. 2.
10021002
SK
RZ
EC
Z,
SH
AW
,A
ND
MA
CZ
YN
SK
I
J.P
hys.C
hem.
Ref.
Data,
Vol.
28,N
o.4,
1999
This ms at: http://scitation.aip.org/termsconditions. Downloaded to IP: 129.6.105.191 On: Fri, 05 Sep 2014 17:51:55
article is copyrighted as indicated in the article. Reuse of AIP content is subject to the terCompositions of coexisting phases
t/°C~compiler! T/K
x18 x28 x19 x29 w18 w28 w19 w29
hydrocarbon-rich phase
water-richphase
hydrocarbon-rich phase~compiler!
water-richphase
~compiler!
24.8 293.0 0.0007 0.9967 0.0914 0.0020 0.0003 0.9991 0.1508 0.0080
0.0055 0.9915 0.1603 0.0026 0.0023 0.9970 0.2515 0.0099
0.0114 0.9852 0.2734 0.0036 0.0047 0.9945 0.3970 0.0127
0.0199 0.9760 0.4322 0.0073 0.0083 0.9908 0.5649 0.0233
0.0371 0.9574 0.5033 0.0245 0.0156 0.9831 0.6075 0.0721
0.0667 0.9249 0.5547 0.0400 0.0287 0.9693 0.6303 0.1108
0.1339 0.8500 0.6182 0.1279 0.0604 0.9355 0.5763 0.2907
0.1708 0.8080 0.6187 0.1496 0.0793 0.9151 0.5556 0.3275
0.1789 0.7986 0.6161 0.1698 0.0837 0.9104 0.5355 0.3598
0.406 0.523 0.406 0.523 0.2359 0.7409 0.2359 0.7409a
aAuthor’s plait point.
Auxiliary Information
Method/Apparatus/Procedure: Source and Purity of Materials:
The titration method was used to determine the binodal curve.Binary homogeneous samples of known composition weretitrated in a thermostated glass-stoppered bottle with the smallportions of the third component from Kimax microburette~with an accuracy of 0.01 cm3!. The mass of the titrant wascalculated from its volume and density. Liquid–liquidequilibrium was measured in the thermostated cell of 250 cm3
capacity with magnetic stirrer for the mixtures resulting equalvolumes of both phases. After separation, both phases wereanalyzed by measuring the refractive indexes and comparingresults with a calibration curve obtained earlier for saturatedmixtures. Plait point was calculated by the author by theHand’s method.1
~1! AnalaR; distilled in a high-efficiency packed column;r(293 K)/(g cm23)50.7911,n(293 K)51.3290.~2! Merck, analytical-grade; certificated purity. 99.5%; used asreceived;r(293 K)/(g cm23)50.8790,n(293 K)51.5011.~3! de-ionized and distilled.
Estimated Error:temp.60.1 K; composition60.0005 mole fraction.
References:1D. B. Hand, J. Phys. Chem.34, 1961~1930!.
Components:~1! Methanol~methyl alcohol!; CH4O; @67-56-1#~2! Cyclohexene; C6H10; @110-83-8#~3! Water; H2O; @7732-18-5#
AS
3.5. Methanol 1 WaterCritical Evalua
A survey of reported compositions along the saturation curve~sat.! ansystem methanol–cyclohexene–water is given in Table 5.
TABLE 5. Summary of experimental data for
Author~s! T/K
Washburnet al., 1940 298Budantsevaet al., 1976 293
aNumber of experimental points in parentheses.
Saturation cThe system methanol–cyclohexene–water forms a large miscib
Compositions along the saturation curves reported in both referencedata set, measured at various temperatures, as well as betweenforms miscibility gap. Binary data of this system were compiled anrecommended, Ref. 3, values of mutual solubility at 298 K are:x2850.99solubility at 293.2 K which are almost equalx2850.9981,x2950.000 05closely to one to another, a temperature difference 5 K is not significobserved at the region close tox150.78,x250.14. All experimental datentative.
Phases in equCompositions of coexisting phases in equilibrium for the ternar
ences. After separation, phases in equilibrium were analyzed. Wasewater, which presumably was the result of analytical limitations~self conused more precise analytical methods~glc—for methanol and cyclohereliable. The plait point of the system reported at 293.2 K,1 wasx150.5methanol system may exist at temperatures below 270 K, but thistentative. Experimental data of Budantsevaet al.2 at 293.2 K are pres
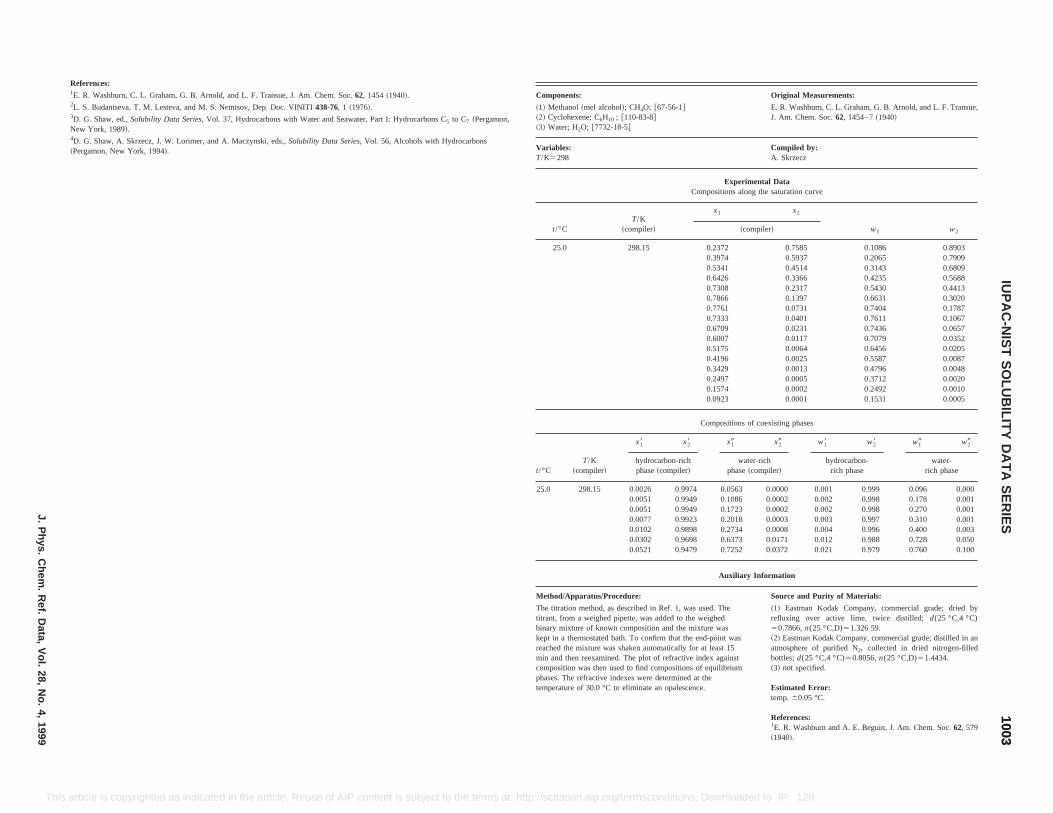
Original Measurements:
E. R. Washburn, C. L. Graham, G. B. Arnold, and L. F. Transue,J. Am. Chem. Soc.62, 1454–7~1940!
Compiled by:A. Skrzecz
ental Datang the saturation curve
x2
w1 w2mpiler!
0.7585 0.1086 0.89030.5937 0.2065 0.79090.4514 0.3143 0.68090.3366 0.4235 0.56880.2317 0.5430 0.44130.1397 0.6631 0.30200.0731 0.7404 0.17870.0401 0.7611 0.10670.0231 0.7436 0.06570.0117 0.7079 0.03520.0064 0.6456 0.02050.0025 0.5587 0.00870.0013 0.4796 0.00480.0005 0.3712 0.00200.0002 0.2492 0.00100.0001 0.1531 0.0005
of coexisting phases
x29 w18 w28 w19 w29
er-richcompiler!
hydrocarbon-rich phase
water-rich phase
0.0000 0.001 0.999 0.096 0.0000.0002 0.002 0.998 0.178 0.0010.0002 0.002 0.998 0.270 0.0010.0003 0.003 0.997 0.310 0.0010.0008 0.004 0.996 0.400 0.003
0.0302 0.9698 0.6373 0.0171 0.012 0.988 0.728 0.0500.0521 0.9479 0.7252 0.0372 0.021 0.979 0.760 0.100
Auxiliary Information
Method/Apparatus/Procedure: Source and Purity of Materials:
The titration method, as described in Ref. 1, was used. Thetitrant, from a weighed pipette, was added to the weighedbinary mixture of known composition and the mixture waskept in a thermostated bath. To confirm that the end-point wasreached the mixture was shaken automatically for at least 15min and then reexamined. The plot of refractive index againstcomposition was then used to find compositions of equilibriumphases. The refractive indexes were determined at thetemperature of 30.0 °C to eliminate an opalescence.
~1! Eastman Kodak Company, commercial grade; dried byrefluxing over active lime, twice distilled;d(25 °C,4 °C)50.7866,n(25 °C,D)51.326 59.~2! Eastman Kodak Company, commercial grade; distilled in anatmosphere of purified N2, collected in dried nitrogen-filledbottles;d(25 °C,4 °C)50.8056,n(25 °C,D)51.4434.~3! not specified.
Estimated Error:temp.60.05 °C.
References:1E. R. Washburn and A. E. Beguin, J. Am. Chem. Soc.62, 579~1940!.
10031003
IUP
AC
-NIS
TS
OLU
BILIT
YD
AT
AS
ER
IESJ.P
hys.C
hem.
Ref.
Data,
Vol.
28,N
o.4,
1999
This as indicated in the article. Reuse of AIP content is subject to the terms at: http://scitation.aip.org/termsconditions. Downloaded to IP: 129.6.105.191 On: Fri, 05 Sep 2014 17:51:55
article is copyrightedReferences:1E. R. Washburn, C. L. Graham, G. B. Arnold, and L. F. Transue, J. Am. Chem. Soc.62, 1454~1940!.2L. S. Budantseva, T. M. Lesteva, and M. S. Nemtsov, Dep. Doc. VINITI438-76, 1 ~1976!.3D. G. Shaw, ed.,Solubility Data Series, Vol. 37, Hydrocarbons with Water and Seawater, Part I: Hydrocarbons C5 to C7 ~Pergamon,New York, 1989!.4D. G. Shaw, A. Skrzecz, J. W. Lorimer, and A. Maczynski, eds.,Solubility Data Series, Vol. 56, Alcohols with Hydrocarbons~Pergamon, New York, 1994!.
Components:
~1! Methanol~mel alcohol!; CH4O; @67-56-1#~2! Cyclohexene; C6H10 ; @110-83-8#~3! Water; H2O; @7732-18-5#
Variables:T/K5298
ExperimCompositions alo
t/°CT/K
~compiler!
x1
~co
25.0 298.15 0.23720.39740.53410.64260.73080.78660.77610.73330.67090.60070.51750.41960.34290.24970.15740.0923
Compositions
t/°CT/K
~compiler!
x18 x28 x19
hydrocarbon-richphase~compiler!
watphase~
25.0 298.15 0.0026 0.9974 0.05630.0051 0.9949 0.10860.0051 0.9949 0.17230.0077 0.9923 0.20180.0102 0.9898 0.2734
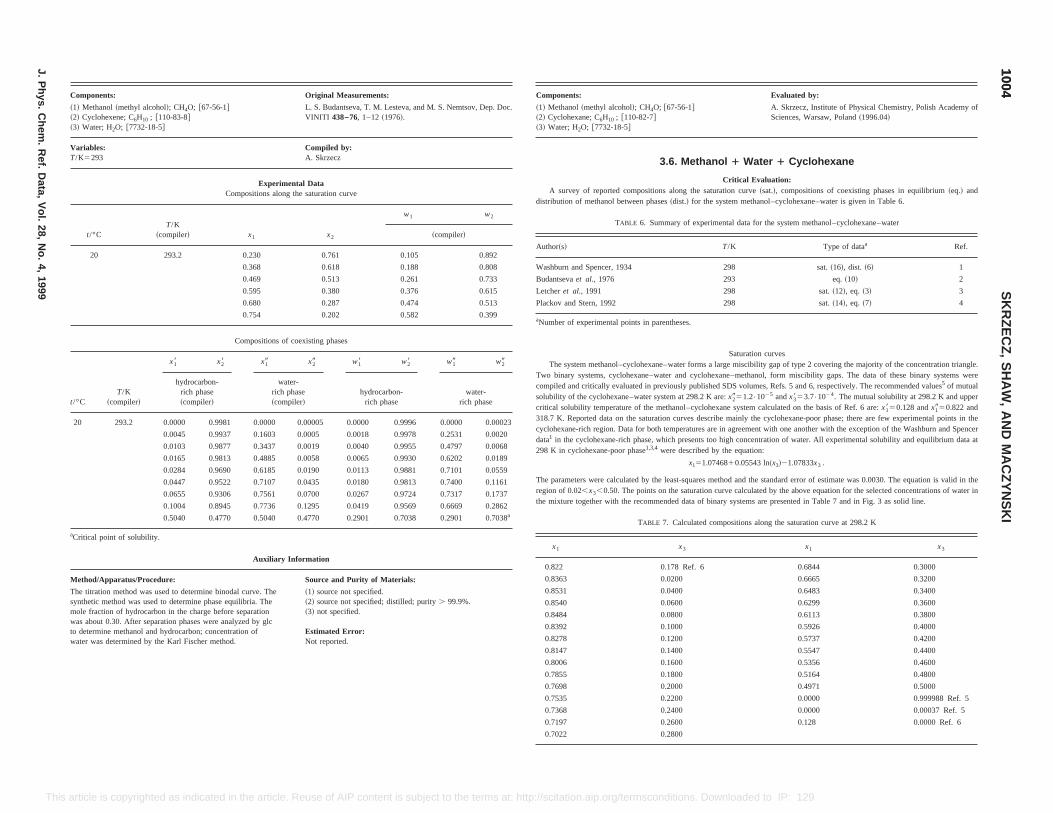
Evaluated by:
A. Skrzecz, Institute of Physical Chemistry, Polish Academy ofSciences, Warsaw, Poland~1996.04!
ater 1 Cyclohexane
valuation:curve~sat.!, compositions of coexisting phases in equilibrium~eq.! and
ethanol–cyclohexane–water is given in Table 6.
ta for the system methanol–cyclohexane–water
Type of dataa Ref.
sat.~16!, dist. ~6! 1
eq.~10! 2
sat.~12!, eq. ~3! 3
sat.~14!, eq. ~7! 4
tion curvesmiscibility gap of type 2 covering the majority of the concentration triangle.methanol, form miscibility gaps. The data of these binary systems werevolumes, Refs. 5 and 6, respectively. The recommended values5 of mutual•1025 andx3853.7•1024. The mutual solubility at 298.2 K and upperystem calculated on the basis of Ref. 6 are:x1850.128 andx1950.822 andainly the cyclohexane-poor phase; there are few experimental points in thereement with one another with the exception of the Washburn and Spencerconcentration of water. All experimental solubility and equilibrium data atuation:
543 ln~x3!21.07833x3 .
d and the standard error of estimate was 0.0030. The equation is valid in thealculated by the above equation for the selected concentrations of water inystems are presented in Table 7 and in Fig. 3 as solid line.
ns along the saturation curve at 298.2 K
x3 x1 x3
0.178 Ref. 6 0.6844 0.3000
0.0200 0.6665 0.3200
0.0400 0.6483 0.3400
0.0600 0.6299 0.3600
0.0800 0.6113 0.3800
0.1000 0.5926 0.4000
0.1200 0.5737 0.4200
0.1400 0.5547 0.4400
0.1600 0.5356 0.4600
0.1800 0.5164 0.4800
0.2000 0.4971 0.5000
0.2200 0.0000 0.999988 Ref. 5
0.2400 0.0000 0.00037 Ref. 5
0.2600 0.128 0.0000 Ref. 6
0.2800
10041004
SK
RZ
EC
Z,
SH
AW
,A
ND
MA
CZ
YN
SK
I
J.P
hys.C
hem.
Ref.
Data,
Vol.
28,N
o.4,
1999
This ditions. Downloaded to IP: 129.6.105.191 On: Fri, 05 Sep 2014 17:51:55
aCritical point of solubility.
Auxiliary Information
Method/Apparatus/Procedure: Source and Purity of Materials:
The titration method was used to determine binodal curve. Thesynthetic method was used to determine phase equilibria. Themole fraction of hydrocarbon in the charge before separationwas about 0.30. After separation phases were analyzed by glcto determine methanol and hydrocarbon; concentration ofwater was determined by the Karl Fischer method.
~1! source not specified.~2! source not specified; distilled; purity. 99.9%.~3! not specified.
Estimated Error:Not reported.
x1
0.822
0.8363
0.8531
0.8540
0.8484
0.8392
0.8278
0.8147
0.8006
0.7855
0.7698
0.7535
0.7368
0.7197
0.7022
article is copyrighted as indicated in the article. Reuse of AIP content is subject to the terms at: http://scitation.aip.org/termscon
Components: Original Measurements:
~1! Methanol~methyl alcohol!; CH4O; @67-56-1#~2! Cyclohexene; C6H10 ; @110-83-8#~3! Water; H2O; @7732-18-5#
L. S. Budantseva, T. M. Lesteva, and M. S. Nemtsov, Dep. Doc.VINITI 438–76, 1–12~1976!.
Variables:T/K5293
Compiled by:A. Skrzecz
Experimental DataCompositions along the saturation curve
t/°CT/K
~compiler! x1 x2
w1 w2
~compiler!
20 293.2 0.230 0.761 0.105 0.892
0.368 0.618 0.188 0.808
0.469 0.513 0.261 0.733
0.595 0.380 0.376 0.615
0.680 0.287 0.474 0.513
0.754 0.202 0.582 0.399
Compositions of coexisting phases
t/°CT/K
~compiler!
x18 x28 x19 x29 w18 w28 w19 w29
hydrocarbon-rich phase~compiler!
water-rich phase~compiler!
hydrocarbon-rich phase
water-rich phase
20 293.2 0.0000 0.9981 0.0000 0.00005 0.0000 0.9996 0.0000 0.00023
0.0045 0.9937 0.1603 0.0005 0.0018 0.9978 0.2531 0.0020
0.0103 0.9877 0.3437 0.0019 0.0040 0.9955 0.4797 0.0068
0.0165 0.9813 0.4885 0.0058 0.0065 0.9930 0.6202 0.0189
0.0284 0.9690 0.6185 0.0190 0.0113 0.9881 0.7101 0.0559
0.0447 0.9522 0.7107 0.0435 0.0180 0.9813 0.7400 0.1161
0.0655 0.9306 0.7561 0.0700 0.0267 0.9724 0.7317 0.1737
0.1004 0.8945 0.7736 0.1295 0.0419 0.9569 0.6669 0.2862
0.5040 0.4770 0.5040 0.4770 0.2901 0.7038 0.2901 0.7038a
Components:
~1! Methanol~methyl alcohol!; CH4O; @67-56-1#~2! Cyclohexane; C6H10 ; @110-82-7#~3! Water; H2O; @7732-18-5#
3.6. Methanol 1 W
Critical EA survey of reported compositions along the saturation
distribution of methanol between phases~dist.! for the system m
TABLE 6. Summary of experimental da
Author~s! T/K
Washburn and Spencer, 1934 298
Budantsevaet al., 1976 293
Letcheret al., 1991 298
Plackov and Stern, 1992 298
aNumber of experimental points in parentheses.
SaturaThe system methanol–cyclohexane–water forms a large
Two binary systems, cyclohexane–water and cyclohexane–compiled and critically evaluated in previously published SDSsolubility of the cyclohexane–water system at 298.2 K are:x2951.2critical solubility temperature of the methanol–cyclohexane s318.7 K. Reported data on the saturation curves describe mcyclohexane-rich region. Data for both temperatures are in agdata1 in the cyclohexane-rich phase, which presents too high298 K in cyclohexane-poor phase1,3,4 were described by the eq
x151.0746810.05
The parameters were calculated by the least-squares methoregion of 0.02,x3,0.50. The points on the saturation curve cthe mixture together with the recommended data of binary s
TABLE 7. Calculated compositio

Original Measurements:
l alcohol!; CH4O; @67-56-1#
12 ; @110-82-7#-18-5#
E. R. Washburn and H. C. Spencer, J. Am. Chem. Soc.56,361–4~1934!.
Compiled by:A. Skrzecz
Experimental DataCompositions along the saturation curve
T/K~compiler!
x1 x2 w1 w2
~compiler! ~compiler!
298.2 0.1398 0.0002 0.2241 0.0010
0.2372 0.0005 0.3556 0.0019
0.3058 0.0008 0.4383 0.0031
0.4663 0.0025 0.6043 0.0086
0.5979 0.0056 0.7156 0.0176
0.6699 0.0100 0.7645 0.0301
0.7106 0.0151 0.7857 0.0437
0.7504 0.0219 0.8018 0.0614
0.8072 0.0340 0.8188 0.0906
0.8464 0.0580 0.8041 0.1448
298.2 0.8491 0.0780 0.7754 0.1872
0.8501 0.1237 0.7145 0.2731
0.8264 0.1736 0.6445 0.3555
0.0935 0.9065 0.0378 0.9622
0.0395 0.9406 0.0157 0.9799
0.0233 0.9683 0.0091 0.9891
Distribution of methanol in methanol–cyclohexane–water system
T/K~compiler!
w18hydrocarbon-
rich phase
w19water-
rich phase
298.2 0.0005 0.032
0.0025 0.151
0.0040 0.268
0.0050 0.349
0.0065 0.388
0.0070 0.418
10051005
IUP
AC
-NIS
TS
OLU
BILIT
YD
AT
AS
ER
IESJ.P
hys.C
hem.
Ref.
Data,
Vol.
28,N
o.4,
1999
This on.aip.org/termsconditions. Downloaded to IP: 129.6.105.191 On: Fri, 05 Sep 2014 17:51:55
New York, 1989!.6D. G. Shaw, A. Skrzecz, J. W. Lorimer, and A. Maczynski, eds.,Solubility Data Series, Vol. 56, Alcohols with Hydrocarbons~Pergamon, New York, 1994!.
article is copyrighted as indicated in the article. Reuse of AIP content is subject to the terms at: http://scitati
Phases in equilibriumCompositions of coexisting phases in equilibrium for the ternary system methanol–cyclohexane–water were reported in Refs 2, 3,
and 4. In Ref. 1 the distribution of methanol between two phases~hydrocarbon-rich and hydrocarbon-poor! was reported. The linesreported by Letcheret al.3 were measured at the pressure of 94.7 kPa, but the influence of such pressure difference~6.6 kPa! onliquid–liquid equilibria may be neglected. The experimental tie lines of Budantsevaet al., Ref. 2, even they were measured at 293.2 K,are in agreement with tie lines of Plackov and Stern,4 measured at a little higher temperature of 298.2 K. The three tie lines presented byLetcheret al.3 were measured with the accuracy 0.01 mole fraction, as was reported in the paper and are not consistent with data of Ref.4. Therefore data of Plackov and Stern,4 in the opinion of evaluator, appear reliable and are considered as tentative. They are presentedin Fig. 3.
FIG. 3. Phase diagram of the system methanol~1!—cyclohexane~2!—water ~3! at 298.2 K. s—experimental data, Ref. 1,h—experimental data, Ref. 3,n—experimental data, Ref. 4, dashed lines—tie lines, Ref. 4.
References:1E. R. Washburn and H. C. Spencer, J. Am. Chem. Soc.56, 361 ~1934!.2L. S. Budantseva, T. M. Lesteva, and M. S. Nemtsov, Dep. Doc. VINITI438–76, 1 ~1976!.3T. M. Letcher, P. Siswana, and S. E. Radloff, S. Afr. J. Chem.44, 118 ~1991!.4D. Plackov and I. Stern, Fluid. Phase Equilib.71, 189 ~1992!.5D. G. Shaw, ed.,Solubility Data Series, Vol. 37, Hydrocarbons with Water and Seawater, Part I: Hydrocarbons C5 to C7 ~Pergamon
Components:
~1! Methanol~methy~2! Cyclohexane; C6H~3!Water; H2O; @7732
Variables:T/K5298
t/°C
25.0
25.0
t/°C
25.0
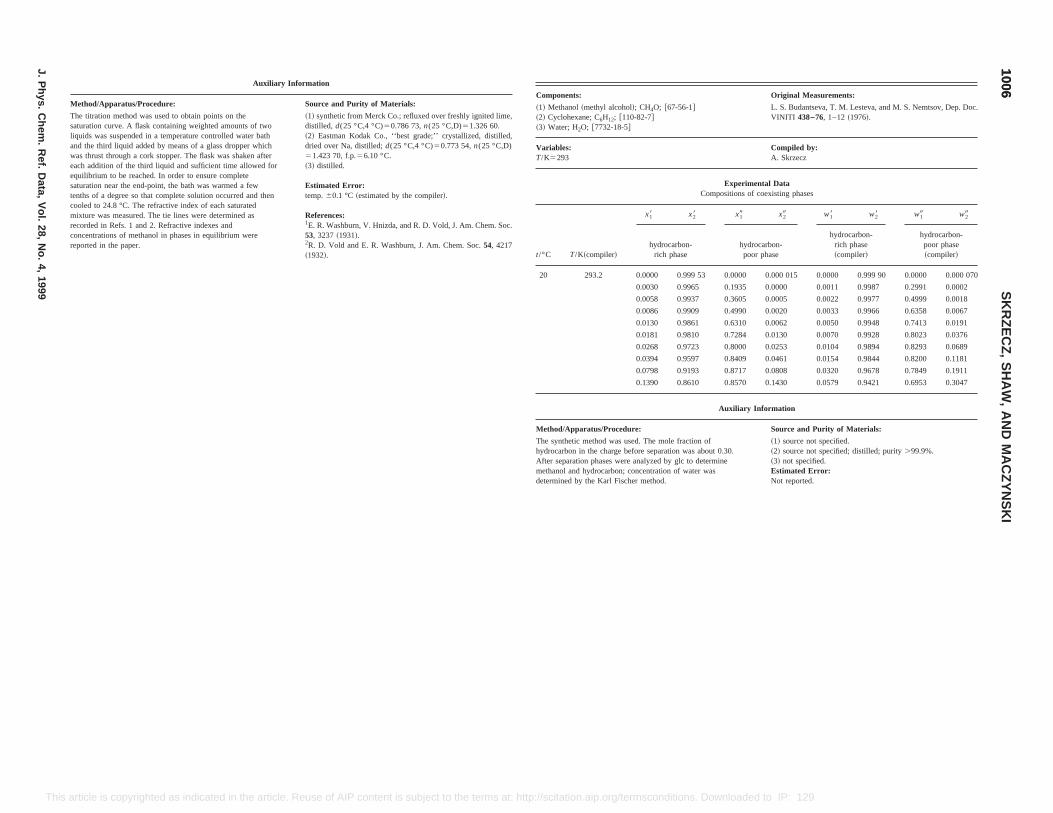
lime,
tilled,D)
. Soc.
17
Components: Original Measurements:
~1! Methanol~methyl alcohol!; CH4O; @67-56-1#~2! Cyclohexane; C6H12; @110-82-7#~3! Water; H2O; @7732-18-5#
L. S. Budantseva, T. M. Lesteva, and M. S. Nemtsov, Dep. Doc.VINITI 438–76, 1–12~1976!.
Variables:T/K5293
Compiled by:A. Skrzecz
Experimental DataCompositions of coexisting phases
t/°C T/K~compiler!
x18 x28 x19 x29 w18 w28 w19 w29
hydrocarbon-rich phase
hydrocarbon-poor phase
hydrocarbon-rich phase~compiler!
hydrocarbon-poor phase~compiler!
20 293.2 0.0000 0.999 53 0.0000 0.000 015 0.0000 0.999 90 0.0000 0.000 070
0.0030 0.9965 0.1935 0.0000 0.0011 0.9987 0.2991 0.0002
0.0058 0.9937 0.3605 0.0005 0.0022 0.9977 0.4999 0.0018
0.0086 0.9909 0.4990 0.0020 0.0033 0.9966 0.6358 0.0067
0.0130 0.9861 0.6310 0.0062 0.0050 0.9948 0.7413 0.0191
0.0181 0.9810 0.7284 0.0130 0.0070 0.9928 0.8023 0.0376
0.0268 0.9723 0.8000 0.0253 0.0104 0.9894 0.8293 0.0689
0.0394 0.9597 0.8409 0.0461 0.0154 0.9844 0.8200 0.1181
0.0798 0.9193 0.8717 0.0808 0.0320 0.9678 0.7849 0.1911
0.1390 0.8610 0.8570 0.1430 0.0579 0.9421 0.6953 0.3047
Auxiliary Information
Method/Apparatus/Procedure: Source and Purity of Materials:
The synthetic method was used. The mole fraction ofhydrocarbon in the charge before separation was about 0.30.After separation phases were analyzed by glc to determinemethanol and hydrocarbon; concentration of water wasdetermined by the Karl Fischer method.
~1! source not specified.~2! source not specified; distilled; purity.99.9%.~3! not specified.Estimated Error:Not reported.
10061006
SK
RZ
EC
Z,
SH
AW
,A
ND
MA
CZ
YN
SK
I
J.P
hys.C
hem.
Ref.
Data,
Vol.
28,N
o.4,
1999
This icle. Reuse of AIP content is subject to the terms at: http://scitation.aip.org/termsconditions. Downloaded to IP: 129.6.105.191 On: Fri, 05 Sep 2014 17:51:55
article is copyrighted as indicated in the artAuxiliary Information
Method/Apparatus/Procedure: Source and Purity of Materials:
The titration method was used to obtain points on thesaturation curve. A flask containing weighted amounts of twoliquids was suspended in a temperature controlled water bathand the third liquid added by means of a glass dropper whichwas thrust through a cork stopper. The flask was shaken aftereach addition of the third liquid and sufficient time allowed forequilibrium to be reached. In order to ensure completesaturation near the end-point, the bath was warmed a fewtenths of a degree so that complete solution occurred and thencooled to 24.8 °C. The refractive index of each saturatedmixture was measured. The tie lines were determined asrecorded in Refs. 1 and 2. Refractive indexes andconcentrations of methanol in phases in equilibrium werereported in the paper.
~1! synthetic from Merck Co.; refluxed over freshly igniteddistilled, d(25 °C,4 °C)50.786 73,n(25 °C,D)51.326 60.~2! Eastman Kodak Co., ‘‘best grade;’’ crystallized, disdried over Na, distilled;d(25 °C,4 °C)50.773 54,n(25 °C,51.423 70, f.p.56.10 °C.~3! distilled.
Estimated Error:temp.60.1 °C ~estimated by the compiler!.
References:1E. R. Washburn, V. Hnizda, and R. D. Vold, J. Am. Chem53, 3237~1931!.2R. D. Vold and E. R. Washburn, J. Am. Chem. Soc.54, 42~1932!.

Original Measurements:
D. Plackov and I. Stern, Fluid Phase Equilib.71, 189–209~1992!.
Compiled by:
A. Skrzecz
ental Datang the saturation curve
x2
w1 w2
~compiler!
0.8886 0.0456 0.9544
0.1750 0.6422 0.3578
0.1195 0.7194 0.2658
0.0760 0.7766 0.1832
0.0472 0.8023 0.1219
0.0091 0.7270 0.0280
0.0033 0.6391 0.0110
0.0019 0.5689 0.0066
0.0010 0.4729 0.0037
0.0005 0.3978 0.0019
0.0004 0.3270 0.0016
0.0003 0.2421 0.0013
0.0003 0.1589 0.0013
0.0002 0.0779 0.0009
f coexisting phases
x29 w18 w28 w19 w29
carbon-phase
hydrocarbon-rich phase~compiler!
hydrocarbon-poor phase~compiler!
0.000 0.0002 0.9996 0.165 0.0000.001 0.0007 0.9991 0.361 0.0040.001 0.0018 0.9981 0.508 0.0040.005 0.0024 0.9974 0.658 0.0160.025 0.0037 0.9962 0.774 0.0710.053 0.0107 0.9892 0.801 0.1350.106 0.0224 0.9776 0.733 0.242
Information
Source and Purity of Materials:
of
ies
~1! Kemika ~Zagreb!; analytical grade; presumably used asreceived;n51.3624,r(25 °C)5787.7 kg/m3, b.p.564.6 °C.~2! Kemika ~Zagreb!; purity not specified; presumably used asreceived;n51.4232,r(25 °C)5773.9 kg/m3, b.p.580.0 °C.~3! twice distilled in the presence of KMnO4.
Estimated Error:composition , 0.0005 mass fraction, binodal,~relative!;composition6 2%, tie line.
References:1D. Plackov and I. Stern, Fluid Phase Equilib.57, 327 ~1990!.
10071007
IUP
AC
-NIS
TS
OLU
BILIT
YD
AT
AS
ER
IESJ.P
hys.C
hem.
Ref.
Data,
Vol.
28,N
o.4,
1999
This d to IP: 129.6.105.191 On: Fri, 05 Sep 2014 17:51:55
Auxiliary Information
Method/Apparatus/Procedure: Source and Purity of Materials:
The points on the binodal curve were determined by thetitration method, as described in Ref. 1. The formation of acloudy mixture was observed visually on shaking afteraddition of a known mass of the third component; syringeswere precisely weighed. Tie line compositions weredetermined by the refractive index method,2 and acomplementary method using the Karl Fischer titration.3
Measurements were made at pressure of 94.7 kPa.
~1! Merck; AR grade; refluxed with Mg and I2, distilled; purity.99.9 mole % by glc.~2! BDH; Gold label grade; used as received; purity.99.9mole % by glc.~3! not specified.
Estimated Error:composition6 0.005 mole fraction~binodal curve!, 6 0.01 molefraction ~tie lines!.
References:1T. M. Letcher, S. Wootten, B. Shuttleworth, and C. Heyward, J.Chem. Thermodyn.18, 1037~1986!.2S. W. Briggs and F. W. Comings, Ind. Eng. Chem.35, 411~1993!.3T. M. Letcher, P. Siswana, P. van der Watt, and S. Radloff, J.Chem. Thermodyn.21, 1053~1989!.
0.0047 0.9948 0.3690.0064 0.9931 0.5290.0097 0.9898 0.7190.0276 0.9720 0.8280.0567 0.9430 0.843
Auxillary
Method/Apparatus/Procedure:
Binodal compositions were determined by titration with thecorresponding, less-soluble component until the appearanceturbidity.1 The analytical method was used for determinationof tie-lines. This was based on refractive indexes and densitof the samples, Ref. 1, combined with the oxidation of thealcohol with an excess of potassium dichromate anddetermination of unreduced dichromate with Na2S2O3. Alcoholin the organic layer was determined after extraction withwater.
article is copyrighted as indicated in the article. Reuse of AIP content is subject to the terms at: http://scitation.aip.org/termsconditions. Downloade
Components: Original Measurements:
~1! Methanol~methyl alcohol!; CH4O; @67-56-1#~2! Cyclohexane; C6H12; @110-82-7#~3! Water; H2O; @7732-18-5#
T. M. Letcher, P. Siswana, and S. E. Radloff, S. Afr. J. Chem.44, 118–21~1991!.
Variables:T/K5298
Compiled by:A. Skrzecz
Experimental DataCompositions along the saturation curve
t/°C~compiler! T/K x1 x2
w1 w2
~compiler!
25.0 298.2 0.000 0.000 0.000 0.000
0.212 0.001 0.323 0.004
0.360 0.002 0.497 0.007
0.457 0.003 0.595 0.010
0.565 0.006 0.687 0.019
0.682 0.016 0.763 0.047
0.780 0.029 0.809 0.079
0.845 0.080 0.770 0.191
0.842 0.136 0.695 0.295
0.825 0.175 0.642 0.358
0.093 0.907 0.038 0.962
0.000 0.999 0.0000 0.9998
Compositions of coexisting phases
t/°C~compiler! T/K
x18 x28 x19 x29 w18 w28 w19 w29
hydrocarbon-rich phase
hydrocarbon-poor phase
hydrocarbon-rich phase~compiler!
hydrocarbon-poor phase~compiler!
25.0 298.2 0.025 0.974 0.323 0.001 0.010 0.990 0.458 0.004
0.051 0.949 0.533 0.005 0.020 0.980 0.661 0.016
0.074 0.926 0.737 0.023 0.030 0.970 0.790 0.065
Components:
~1! Methanol~methyl alcohol!; CH4O; @67-56-1#~2! Cyclohexane; C6H12; @110-82-7#~3! Water; H2O; @7732-18-5#
Variables:
T/K5298
ExperimCompositions alo
t/°CT/K
~compiler! x1
25 298.2 0.1114
0.8250
0.8495
0.8462
0.8158
0.6196
0.5050
0.4289
0.3365
0.2713
0.2149
0.1524
0.0961
0.0454
Compositions o
t/°CT/K
~compiler!
x18 x28 x19
hydrocarbon-rich phase
hydropoor
25 298.2 0.0006 0.9988 0.1000.0019 0.9975 0.242
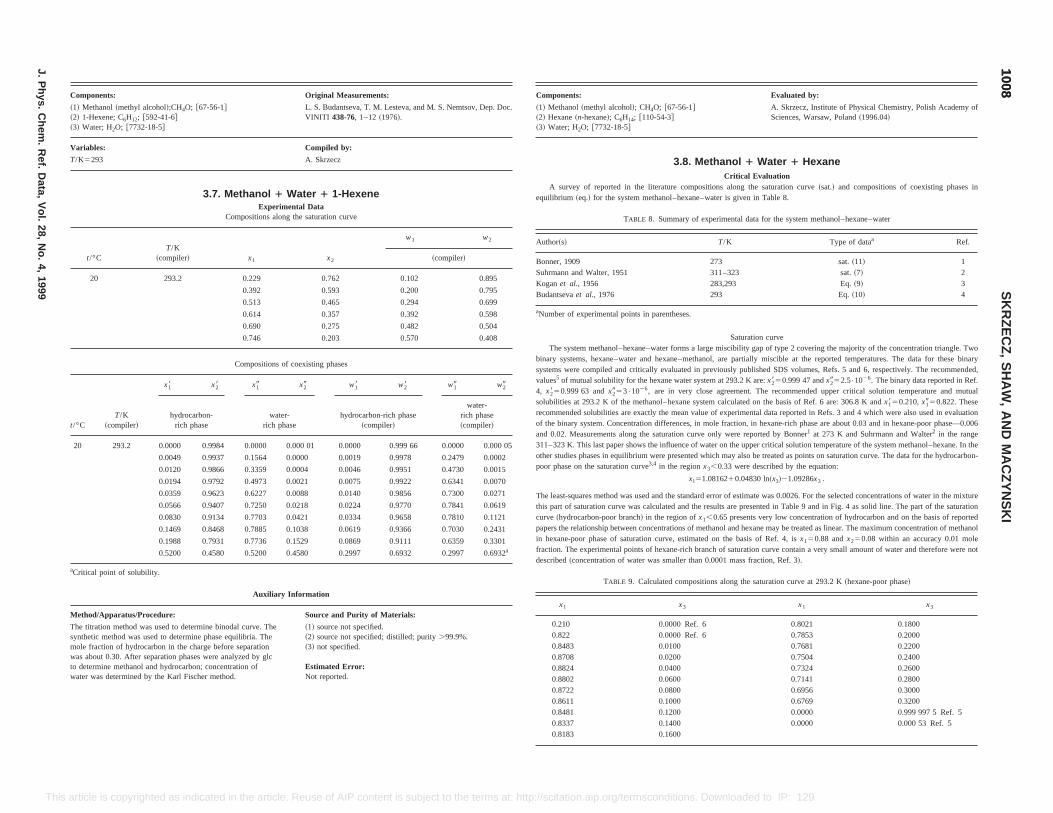
Evaluated by:
A. Skrzecz, Institute of Physical Chemistry, Polish Academy ofSciences, Warsaw, Poland~1996.04!
Water 1 Hexanevaluationg the saturation curve~sat.! and compositions of coexisting phases inen in Table 8.
ata for the system methanol–hexane–water
Type of dataa Ref.
sat.~11! 1sat.~7! 2
Eq.~9! 3Eq.~10! 4
ion curveility gap of type 2 covering the majority of the concentration triangle. Twoartially miscible at the reported temperatures. The data for these binary
published SDS volumes, Refs. 5 and 6, respectively. The recommended,K are:x2850.999 47 andx2952.5•1026. The binary data reported in Ref.
t. The recommended upper critical solution temperature and mutualted on the basis of Ref. 6 are: 306.8 K andx1850.210,x1950.822. Theseimental data reported in Refs. 3 and 4 which were also used in evaluation
on, in hexane-rich phase are about 0.03 and in hexane-poor phase—0.006e reported by Bonner1 at 273 K and Suhrmann and Walter2 in the rangeupper critical solution temperature of the system methanol–hexane. In the
also be treated as points on saturation curve. The data for the hydrocarbon-described by the equation:
30 ln~x3!21.09286x3 .
estimate was 0.0026. For the selected concentrations of water in the mixturepresented in Table 9 and in Fig. 4 as solid line. The part of the saturation
ts very low concentration of hydrocarbon and on the basis of reportedd hexane may be treated as linear. The maximum concentration of methanol
estimated on the basis of Ref. 4, isx150.88 andx250.08 within an accuracy 0.01 molerich branch of saturation curve contain a very small amount of water and therefore were notr than 0.0001 mass fraction, Ref. 3!.
positions along the saturation curve at 293.2 K~hexane-poor phase!
x1 x3
ef. 6 0.8021 0.1800ef. 6 0.7853 0.2000
0.7681 0.22000.7504 0.24000.7324 0.26000.7141 0.28000.6956 0.30000.6769 0.32000.0000 0.999 997 5 Ref. 50.0000 0.000 53 Ref. 5
10081008
SK
RZ
EC
Z,
SH
AW
,A
ND
MA
CZ
YN
SK
I
J.P
hys.C
hem.
Ref.
Data,
Vol.
28,N
o.4,
1999
This . Downloaded to IP: 129.6.105.191 On: Fri, 05 Sep 2014 17:51:55
0.1988 0.7931 0.7736 0.1529 0.0869 0.9111 0.6359 0.3301
0.5200 0.4580 0.5200 0.4580 0.2997 0.6932 0.2997 0.6932a
aCritical point of solubility.
Auxiliary Information
Method/Apparatus/Procedure: Source and Purity of Materials:
The titration method was used to determine binodal curve. Thesynthetic method was used to determine phase equilibria. Themole fraction of hydrocarbon in the charge before separationwas about 0.30. After separation phases were analyzed by glcto determine methanol and hydrocarbon; concentration ofwater was determined by the Karl Fischer method.
~1! source not specified.~2! source not specified; distilled; purity.99.9%.~3! not specified.
Estimated Error:Not reported.
in hexane-poor phase of saturation curve,fraction. The experimental points of hexane-described~concentration of water was smalle
TABLE 9. Calculated com
x1 x3
0.210 0.0000 R0.822 0.0000 R0.8483 0.01000.8708 0.02000.8824 0.04000.8802 0.06000.8722 0.08000.8611 0.10000.8481 0.12000.8337 0.14000.8183 0.1600
article is copyrighted as indicated in the article. Reuse of AIP content is subject to the terms at: http://scitation.aip.org/termsconditions
Components: Original Measurements:
~1! Methanol~methyl alcohol!;CH4O; @67-56-1#~2! 1-Hexene; C6H12; @592-41-6#~3! Water; H2O; @7732-18-5#
L. S. Budantseva, T. M. Lesteva, and M. S. Nemtsov, Dep. Doc.VINITI 438-76, 1–12~1976!.
Variables: Compiled by:
T/K5293 A. Skrzecz
3.7. Methanol 1 Water 1 1-HexeneExperimental Data
Compositions along the saturation curve
t/°CT/K
~compiler! x1 x2
w1 w2
~compiler!
20 293.2 0.229 0.762 0.102 0.895
0.392 0.593 0.200 0.795
0.513 0.465 0.294 0.699
0.614 0.357 0.392 0.598
0.690 0.275 0.482 0.504
0.746 0.203 0.570 0.408
Compositions of coexisting phases
t/°CT/K
~compiler!
x18 x28 x19 x29 w18 w28 w19 w29
hydrocarbon-rich phase
water-rich phase
hydrocarbon-rich phase~compiler!
water-rich phase~compiler!
20 293.2 0.0000 0.9984 0.0000 0.000 01 0.0000 0.999 66 0.0000 0.000 05
0.0049 0.9937 0.1564 0.0000 0.0019 0.9978 0.2479 0.0002
0.0120 0.9866 0.3359 0.0004 0.0046 0.9951 0.4730 0.0015
0.0194 0.9792 0.4973 0.0021 0.0075 0.9922 0.6341 0.0070
0.0359 0.9623 0.6227 0.0088 0.0140 0.9856 0.7300 0.0271
0.0566 0.9407 0.7250 0.0218 0.0224 0.9770 0.7841 0.0619
0.0830 0.9134 0.7703 0.0421 0.0334 0.9658 0.7810 0.1121
0.1469 0.8468 0.7885 0.1038 0.0619 0.9366 0.7030 0.2431
Components:
~1! Methanol~methyl alcohol!; CH4O; @67-56-1#~2! Hexane~n-hexane!; C6H14; @110-54-3#~3! Water; H2O; @7732-18-5#
3.8. Methanol 1
Critical EA survey of reported in the literature compositions alon
equilibrium ~eq.! for the system methanol–hexane–water is giv
TABLE 8. Summary of experimental d
Author~s! T/K
Bonner, 1909 273Suhrmann and Walter, 1951 311–323Koganet al., 1956 283,293Budantsevaet al., 1976 293
aNumber of experimental points in parentheses.
SaturatThe system methanol–hexane–water forms a large miscib
binary systems, hexane–water and hexane–methanol, are psystems were compiled and critically evaluated in previouslyvalues5 of mutual solubility for the hexane water system at 293.24, x2850.999 63 andx2953•1026, are in very close agreemensolubilities at 293.2 K of the methanol–hexane system calcularecommended solubilities are exactly the mean value of experof the binary system. Concentration differences, in mole fractiand 0.02. Measurements along the saturation curve only wer311–323 K. This last paper shows the influence of water on theother studies phases in equilibrium were presented which maypoor phase on the saturation curve3,4 in the regionx3,0.33 were
x151.0816210.048
The least-squares method was used and the standard error ofthis part of saturation curve was calculated and the results arecurve~hydrocarbon-poor branch! in the region ofx1,0.65 presenpapers the relationship between concentrations of methanol an
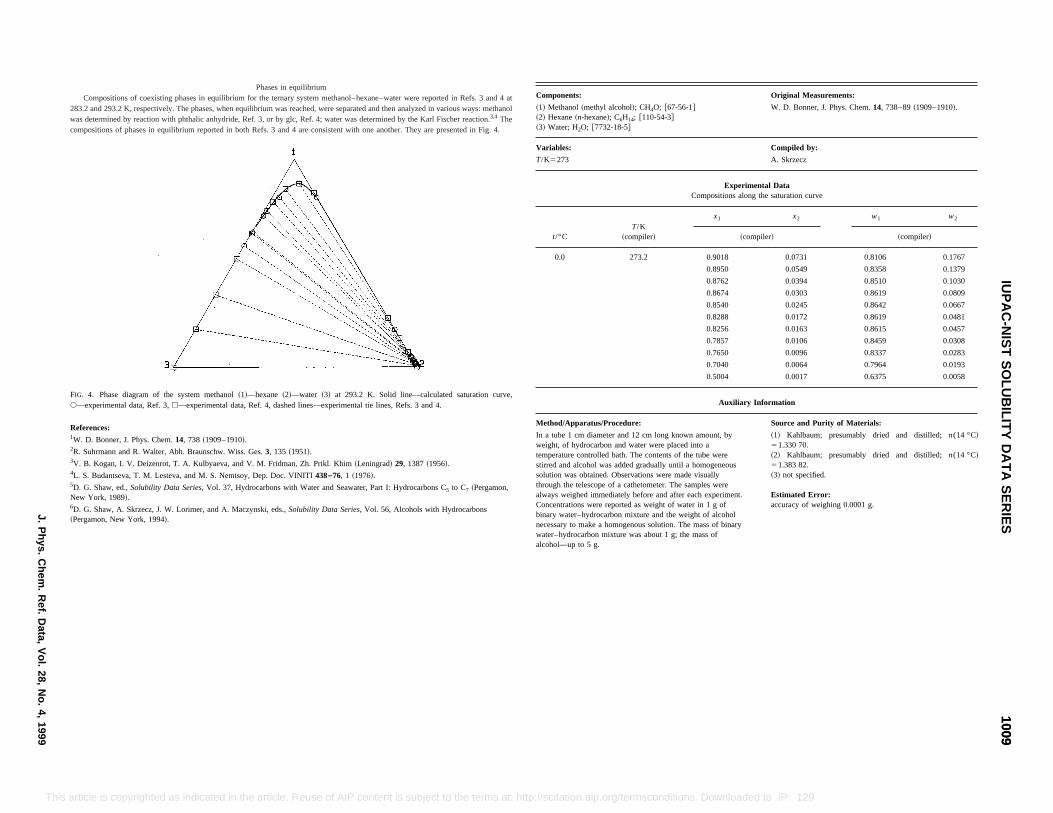
ents: Original Measurements:
anol~methyl alcohol!; CH4O; @67-56-1#ne~n-hexane!; C6H14; @110-54-3#r; H2O; @7732-18-5#
W. D. Bonner, J. Phys. Chem.14, 738–89~1909–1910!.
s: Compiled by:
3 A. Skrzecz
Experimental DataCompositions along the saturation curve
T/K~compiler!
x1 x2 w1 w2
~compiler! ~compiler!
273.2 0.9018 0.0731 0.8106 0.1767
0.8950 0.0549 0.8358 0.1379
0.8762 0.0394 0.8510 0.1030
0.8674 0.0303 0.8619 0.0809
0.8540 0.0245 0.8642 0.0667
0.8288 0.0172 0.8619 0.0481
0.8256 0.0163 0.8615 0.0457
0.7857 0.0106 0.8459 0.0308
0.7650 0.0096 0.8337 0.0283
0.7040 0.0064 0.7964 0.0193
0.5004 0.0017 0.6375 0.0058
Auxiliary Information
Apparatus/Procedure: Source and Purity of Materials:
1 cm diameter and 12 cm long known amount, byf hydrocarbon and water were placed into a
ture controlled bath. The contents of the tube werend alcohol was added gradually until a homogeneouswas obtained. Observations were made visuallythe telescope of a cathetometer. The samples wereeighed immediately before and after each experiment.
rations were reported as weight of water in 1 g ofater–hydrocarbon mixture and the weight of alcoholry to make a homogenous solution. The mass of binary
ater–hydrocarbon mixture was about 1 g; the mass oflcohol—up to 5 g.
~1! Kahlbaum; presumably dried and distilled;n(14 °C!51.330 70.~2! Kahlbaum; presumably dried and distilled;n(14 °C!51.383 82.~3! not specified.
Estimated Error:accuracy of weighing 0.0001 g.
10091009
IUP
AC
-NIS
TS
OLU
BILIT
YD
AT
AS
ER
IESJ.P
hys.C
hem.
Ref.
Data,
Vol.
28,N
o.4,
1999
This /scitation.aip.org/termsconditions. Downloaded to IP: 129.6.105.191 On: Fri, 05 Sep 2014 17:51:55
wa
article is copyrighted as indicated in the article. Reuse of AIP content is subject to the terms at: http:/
Phases in equilibriumCompositions of coexisting phases in equilibrium for the ternary system methanol–hexane–water were reported in Refs. 3 and 4 at
283.2 and 293.2 K, respectively. The phases, when equilibrium was reached, were separated and then analyzed in various ways: methanolwas determined by reaction with phthalic anhydride, Ref. 3, or by glc, Ref. 4; water was determined by the Karl Fischer reaction.3,4 Thecompositions of phases in equilibrium reported in both Refs. 3 and 4 are consistent with one another. They are presented in Fig. 4.
FIG. 4. Phase diagram of the system methanol~1!—hexane~2!—water ~3! at 293.2 K. Solid line—calculated saturation curve,s—experimental data, Ref. 3,h—experimental data, Ref. 4, dashed lines—experimental tie lines, Refs. 3 and 4.
References:1W. D. Bonner, J. Phys. Chem.14, 738 ~1909–1910!.2R. Suhrmann and R. Walter, Abh. Braunschw. Wiss. Ges.3, 135 ~1951!.3V. B. Kogan, I. V. Deizenrot, T. A. Kulbyaeva, and V. M. Fridman, Zh. Prikl. Khim~Leningrad! 29, 1387~1956!.4L. S. Budantseva, T. M. Lesteva, and M. S. Nemtsoy, Dep. Doc. VINITI438–76, 1 ~1976!.5D. G. Shaw, ed.,Solubility Data Series, Vol. 37, Hydrocarbons with Water and Seawater, Part I: Hydrocarbons C5 to C7 ~Pergamon,New York, 1989!.6D. G. Shaw, A. Skrzecz, J. W. Lorimer, and A. Maczynski, eds.,Solubility Data Series, Vol. 56, Alcohols with Hydrocarbons~Pergamon, New York, 1994!.
Compon
~1! Meth~2! Hexa~3! Wate
Variable
T/K527
t/°C
0.0
Method/
In a tubeweight, otemperastirred asolutionthroughalways wConcentbinary wnecessa
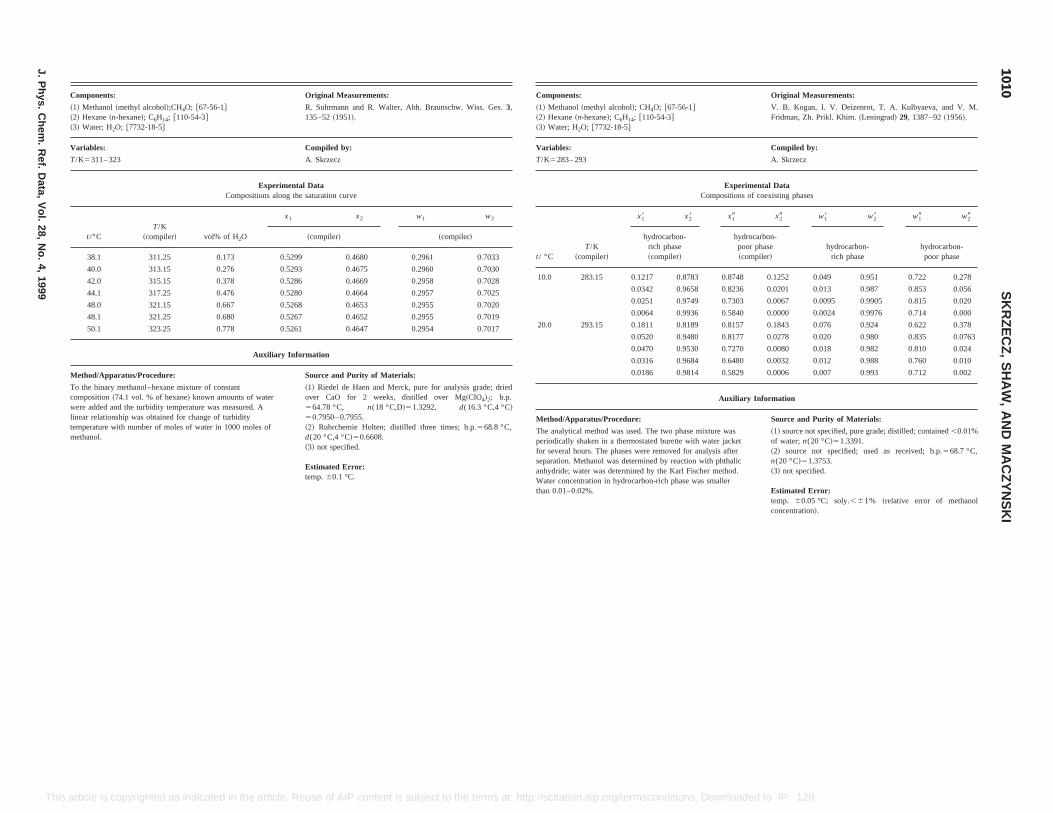
d
Components: Original Measurements:
~1! Methanol~methyl alcohol!; CH4O; @67-56-1#~2! Hexane~n-hexane!; C6H14; @110-54-3#~3! Water; H2O; @7732-18-5#
V. B. Kogan, I. V. Deizenrot, T. A. Kulbyaeva, and V. M.Fridman, Zh. Prikl. Khim.~Leningrad! 29, 1387–92~1956!.
Variables: Compiled by:
T/K5283– 293 A. Skrzecz
Experimental DataCompositions of coexisting phases
t/ °CT/K
~compiler!
x18 x28 x19 x29 w18 w28 w19 w29
hydrocarbon-rich phase~compiler!
hydrocarbon-poor phase~compiler!
hydrocarbon-rich phase
hydrocarbon-poor phase
10.0 283.15 0.1217 0.8783 0.8748 0.1252 0.049 0.951 0.722 0.278
0.0342 0.9658 0.8236 0.0201 0.013 0.987 0.853 0.056
0.0251 0.9749 0.7303 0.0067 0.0095 0.9905 0.815 0.020
0.0064 0.9936 0.5840 0.0000 0.0024 0.9976 0.714 0.000
20.0 293.15 0.1811 0.8189 0.8157 0.1843 0.076 0.924 0.622 0.378
0.0520 0.9480 0.8177 0.0278 0.020 0.980 0.835 0.0763
0.0470 0.9530 0.7270 0.0080 0.018 0.982 0.810 0.024
0.0316 0.9684 0.6480 0.0032 0.012 0.988 0.760 0.010
0.0186 0.9814 0.5829 0.0006 0.007 0.993 0.712 0.002
Auxiliary Information
Method/Apparatus/Procedure: Source and Purity of Materials:
The analytical method was used. The two phase mixture wasperiodically shaken in a thermostated burette with water jacketfor several hours. The phases were removed for analysis afterseparation. Methanol was determined by reaction with phthalicanhydride; water was determined by the Karl Fischer method.Water concentration in hydrocarbon-rich phase was smallerthan 0.01–0.02%.
~1! source not specified, pure grade; distilled; contained,0.01%of water;n(20 °C!51.3391.~2! source not specified; used as received; b.p.568.7 °C,n(20 °C!51.3753.~3! not specified.
Estimated Error:temp. 60.05 °C; soly.,61% ~relative error of methanolconcentration!.
10101010
SK
RZ
EC
Z,
SH
AW
,A
ND
MA
CZ
YN
SK
I
J.P
hys.C
hem.
Ref.
Data,
Vol.
28,N
o.4,
1999
This s at: http://scitation.aip.org/termsconditions. Downloaded to IP: 129.6.105.191 On: Fri, 05 Sep 2014 17:51:55
article is copyrighted as indicated in the article. Reuse of AIP content is subject to the termComponents: Original Measurements:
~1! Methanol~methyl alcohol!;CH4O; @67-56-1#~2! Hexane~n-hexane!; C6H14; @110-54-3#~3! Water; H2O; @7732-18-5#
R. Suhrmann and R. Walter, Abh. Braunschw. Wiss. Ges.3,135–52~1951!.
Variables: Compiled by:
T/K5311– 323 A. Skrzecz
Experimental DataCompositions along the saturation curve
t/°CT/K
~compiler! vol% of H2O
x1 x2 w1 w2
~compiler! ~compiler!
38.1 311.25 0.173 0.5299 0.4680 0.2961 0.7033
40.0 313.15 0.276 0.5293 0.4675 0.2960 0.7030
42.0 315.15 0.378 0.5286 0.4669 0.2958 0.7028
44.1 317.25 0.476 0.5280 0.4664 0.2957 0.7025
48.0 321.15 0.667 0.5268 0.4653 0.2955 0.7020
48.1 321.25 0.680 0.5267 0.4652 0.2955 0.7019
50.1 323.25 0.778 0.5261 0.4647 0.2954 0.7017
Auxiliary Information
Method/Apparatus/Procedure: Source and Purity of Materials:
To the binary methanol–hexane mixture of constantcomposition~74.1 vol. % of hexane! known amounts of waterwere added and the turbidity temperature was measured. Alinear relationship was obtained for change of turbiditytemperature with number of moles of water in 1000 moles ofmethanol.
~1! Riedel de Haen and Merck, pure for analysis grade; drieover CaO for 2 weeks, distilled over Mg~ClO4!2; b.p.564.78 °C, n(18 °C,D!51.3292, d(16.3 °C,4 °C!50.7950– 0.7955.~2! Ruhrchemie Holten; distilled three times; b.p.568.8 °C,d(20 °C,4 °C!50.6608.~3! not specified.
Estimated Error:temp.60.1 °C.
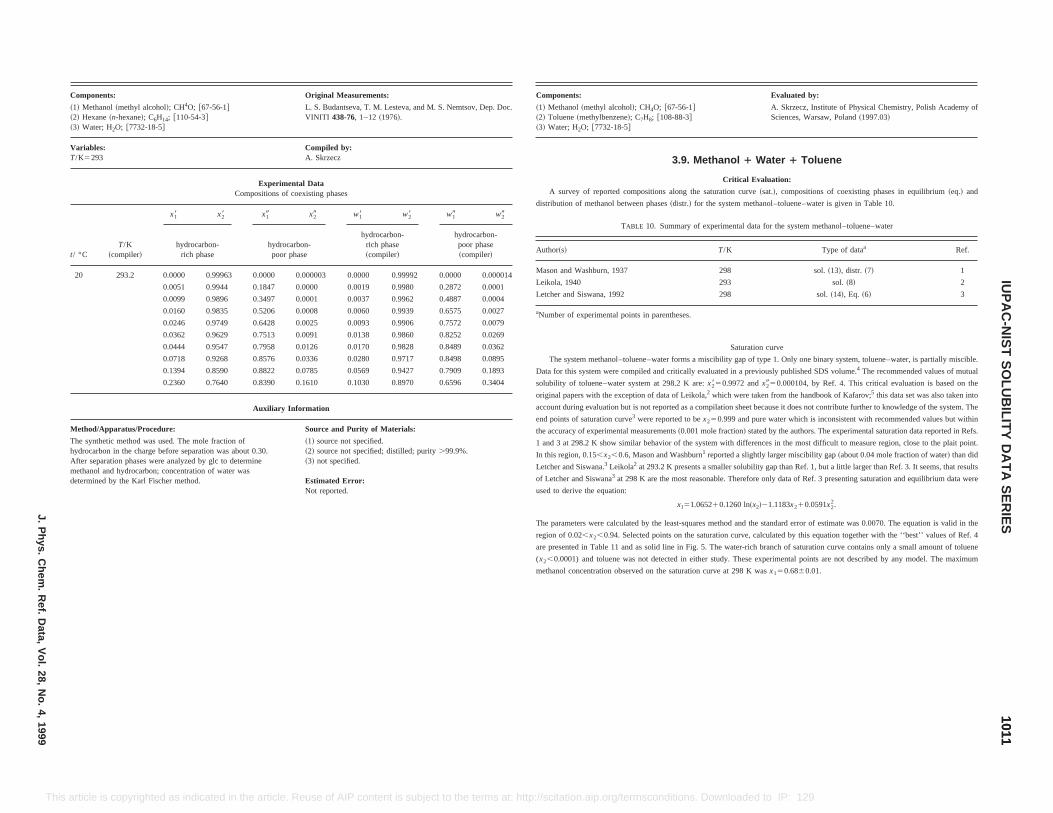
: Evaluated by:
~methyl alcohol!; CH4O; @67-56-1#ethylbenzene!; C7H8; @108-88-3#
O; @7732-18-5#
A. Skrzecz, Institute of Physical Chemistry, Polish Academy ofSciences, Warsaw, Poland~1997.03!
3.9. Methanol 1 Water 1 Toluene
Critical Evaluation:
of reported compositions along the saturation curve~sat.!, compositions of coexisting phases in equilibrium~eq.! and
f methanol between phases~distr.! for the system methanol–toluene–water is given in Table 10.
TABLE 10. Summary of experimental data for the system methanol–toluene–water
T/K Type of dataa Ref.
ashburn, 1937 298 sol.~13!, distr. ~7! 1
293 sol.~8! 2
Siswana, 1992 298 sol.~14!, Eq. ~6! 3
xperimental points in parentheses.
Saturation curve
m methanol–toluene–water forms a miscibility gap of type 1. Only one binary system, toluene–water, is partially miscible.
system were compiled and critically evaluated in a previously published SDS volume.4 The recommended values of mutual
oluene–water system at 298.2 K are:x2850.9972 andx2950.000104, by Ref. 4. This critical evaluation is based on the
rs with the exception of data of Leikola,2 which were taken from the handbook of Kafarov;5 this data set was also taken into
g evaluation but is not reported as a compilation sheet because it does not contribute further to knowledge of the system. The
saturation curve3 were reported to bex250.999 and pure water which is inconsistent with recommended values but within
of experimental measurements~0.001 mole fraction! stated by the authors. The experimental saturation data reported in Refs.
8.2 K show similar behavior of the system with differences in the most difficult to measure region, close to the plait point.
, 0.15,x2,0.6, Mason and Washburn1 reported a slightly larger miscibility gap~about 0.04 mole fraction of water! than did
Siswana.3 Leikola2 at 293.2 K presents a smaller solubility gap than Ref. 1, but a little larger than Ref. 3. It seems, that results
d Siswana3 at 298 K are the most reasonable. Therefore only data of Ref. 3 presenting saturation and equilibrium data were
e the equation:
x151.065210.1260 ln~x2!21.1183x210.0591x22.
ers were calculated by the least-squares method and the standard error of estimate was 0.0070. The equation is valid in the
region of 0.02,x2,0.94. Selected points on the saturation curve, calculated by this equation together with the ‘‘best’’ values of Ref. 4
are presented in Table 11 and as solid line in Fig. 5. The water-rich branch of saturation curve contains only a small amount of toluene
(x2,0.0001) and toluene was not detected in either study. These experimental points are not described by any model. The maximum
methanol concentration observed on the saturation curve at 298 K wasx150.6860.01.
10111011
IUP
AC
-NIS
TS
OLU
BILIT
YD
AT
AS
ER
IESJ.P
hys.C
hem.
Ref.
Data,
Vol.
28,N
o.4,
1999
This t: http://scitation.aip.org/termsconditions. Downloaded to IP: 129.6.105.191 On: Fri, 05 Sep 2014 17:51:55
article is copyrighted as indicated in the article. Reuse of AIP content is subject to the terms aComponents: Original Measurements:
~1! Methanol~methyl alcohol!; CH4O; @67-56-1#~2! Hexane~n-hexane!; C6H14; @110-54-3#~3! Water; H2O; @7732-18-5#
L. S. Budantseva, T. M. Lesteva, and M. S. Nemtsov, Dep. Doc.VINITI 438-76, 1–12~1976!.
Variables:T/K5293
Compiled by:A. Skrzecz
Experimental DataCompositions of coexisting phases
t/ °CT/K
~compiler!
x18 x28 x19 x29 w18 w28 w19 w29
hydrocarbon-rich phase
hydrocarbon-poor phase
hydrocarbon-rich phase~compiler!
hydrocarbon-poor phase~compiler!
20 293.2 0.0000 0.99963 0.0000 0.000003 0.0000 0.99992 0.0000 0.000014
0.0051 0.9944 0.1847 0.0000 0.0019 0.9980 0.2872 0.0001
0.0099 0.9896 0.3497 0.0001 0.0037 0.9962 0.4887 0.0004
0.0160 0.9835 0.5206 0.0008 0.0060 0.9939 0.6575 0.0027
0.0246 0.9749 0.6428 0.0025 0.0093 0.9906 0.7572 0.0079
0.0362 0.9629 0.7513 0.0091 0.0138 0.9860 0.8252 0.0269
0.0444 0.9547 0.7958 0.0126 0.0170 0.9828 0.8489 0.0362
0.0718 0.9268 0.8576 0.0336 0.0280 0.9717 0.8498 0.0895
0.1394 0.8590 0.8822 0.0785 0.0569 0.9427 0.7909 0.1893
0.2360 0.7640 0.8390 0.1610 0.1030 0.8970 0.6596 0.3404
Auxiliary Information
Method/Apparatus/Procedure: Source and Purity of Materials:
The synthetic method was used. The mole fraction ofhydrocarbon in the charge before separation was about 0.30.After separation phases were analyzed by glc to determinemethanol and hydrocarbon; concentration of water wasdetermined by the Karl Fischer method.
~1! source not specified.~2! source not specified; distilled; purity.99.9%.~3! not specified.
Estimated Error:Not reported.
Components
~1! Methanol~2! Toluene~m~3! Water; H2
A survey
distribution o
Author~s!
Mason and W
Leikola, 1940
Letcher and
aNumber of e
The syste
Data for this
solubility of t
original pape
account durin
end points of
the accuracy
1 and 3 at 29
In this region
Letcher and
of Letcher an
used to deriv
The paramet
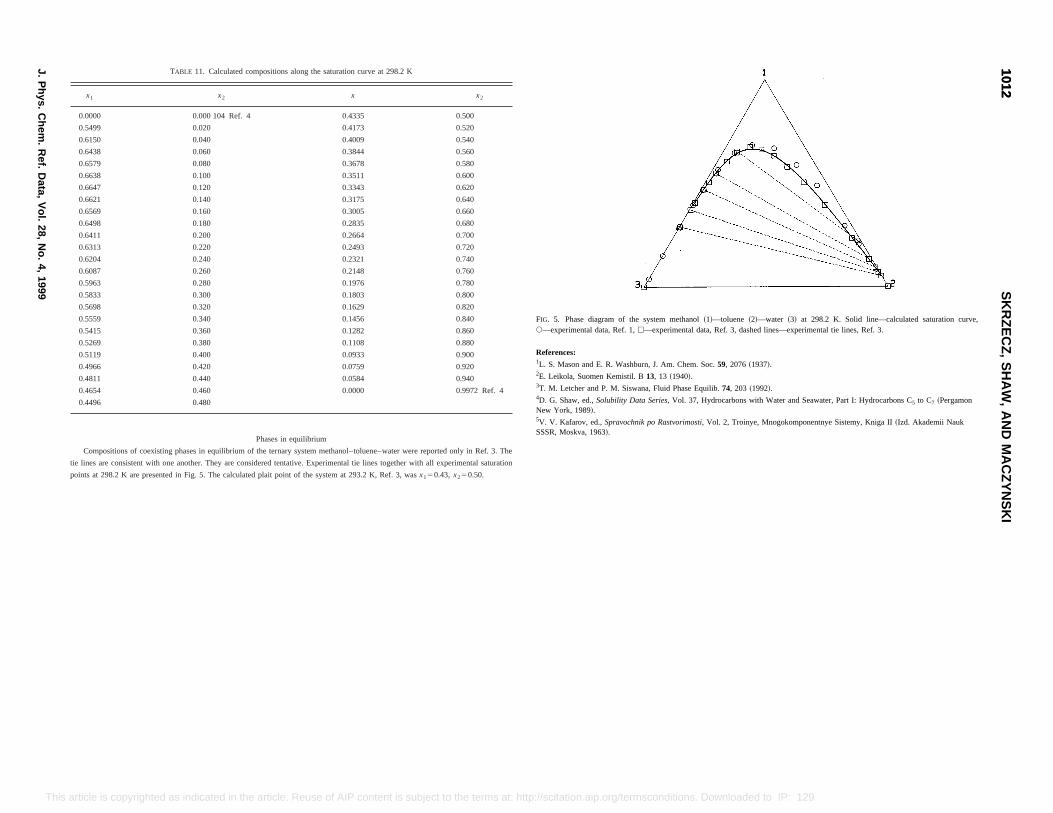
x2
0.500
0.520
0.540
0.560
0.580
0.600
0.620
0.640
0.660
0.680
0.700
0.720
0.740
0.760
0.780
0.800
0.820
0.840
0.860
0.880
0.900
0.920
0.940
0.9972 Ref. 4
orted only in Ref. 3. The
ll experimental saturation
50.50.
FIG. 5. Phase diagram of the system methanol~1!—toluene ~2!—water ~3! at 298.2 K. Solid line—calculated saturation curve,s—experimental data, Ref. 1,h—experimental data, Ref. 3, dashed lines—experimental tie lines, Ref. 3.
References:1L. S. Mason and E. R. Washburn, J. Am. Chem. Soc.59, 2076~1937!.2E. Leikola, Suomen Kemistil. B13, 13 ~1940!.3T. M. Letcher and P. M. Siswana, Fluid Phase Equilib.74, 203 ~1992!.4D. G. Shaw, ed.,Solubility Data Series, Vol. 37, Hydrocarbons with Water and Seawater, Part I: Hydrocarbons C5 to C7 ~PergamonNew York, 1989!.5V. V. Kafarov, ed.,Spravochnik po Rastvorimosti, Vol. 2, Troinye, Mnogokomponentnye Sistemy, Kniga II~Izd. Akademii NaukSSSR, Moskva, 1963!.
10121012
SK
RZ
EC
Z,
SH
AW
,A
ND
MA
CZ
YN
SK
I
J.P
hys.C
hem.
Ref.
Data,
Vol.
28,N
o.4,
1999
T at: http://scitation.aip.org/termsconditions. Downloaded to IP: 129.6.105.191 On: Fri, 05 Sep 2014 17:51:55
his article is copyrighted as indicated in the article. Reuse of AIP content is subject to the termsTABLE 11. Calculated compositions along the saturation curve at 298.2 K
x1 x2 x
0.0000 0.000 104 Ref. 4 0.4335
0.5499 0.020 0.4173
0.6150 0.040 0.4009
0.6438 0.060 0.3844
0.6579 0.080 0.3678
0.6638 0.100 0.3511
0.6647 0.120 0.3343
0.6621 0.140 0.3175
0.6569 0.160 0.3005
0.6498 0.180 0.2835
0.6411 0.200 0.2664
0.6313 0.220 0.2493
0.6204 0.240 0.2321
0.6087 0.260 0.2148
0.5963 0.280 0.1976
0.5833 0.300 0.1803
0.5698 0.320 0.1629
0.5559 0.340 0.1456
0.5415 0.360 0.1282
0.5269 0.380 0.1108
0.5119 0.400 0.0933
0.4966 0.420 0.0759
0.4811 0.440 0.0584
0.4654 0.460 0.0000
0.4496 0.480
Phases in equilibrium
Compositions of coexisting phases in equilibrium of the ternary system methanol–toluene–water were rep
tie lines are consistent with one another. They are considered tentative. Experimental tie lines together with a
points at 298.2 K are presented in Fig. 5. The calculated plait point of the system at 293.2 K, Ref. 3, wasx150.43, x2
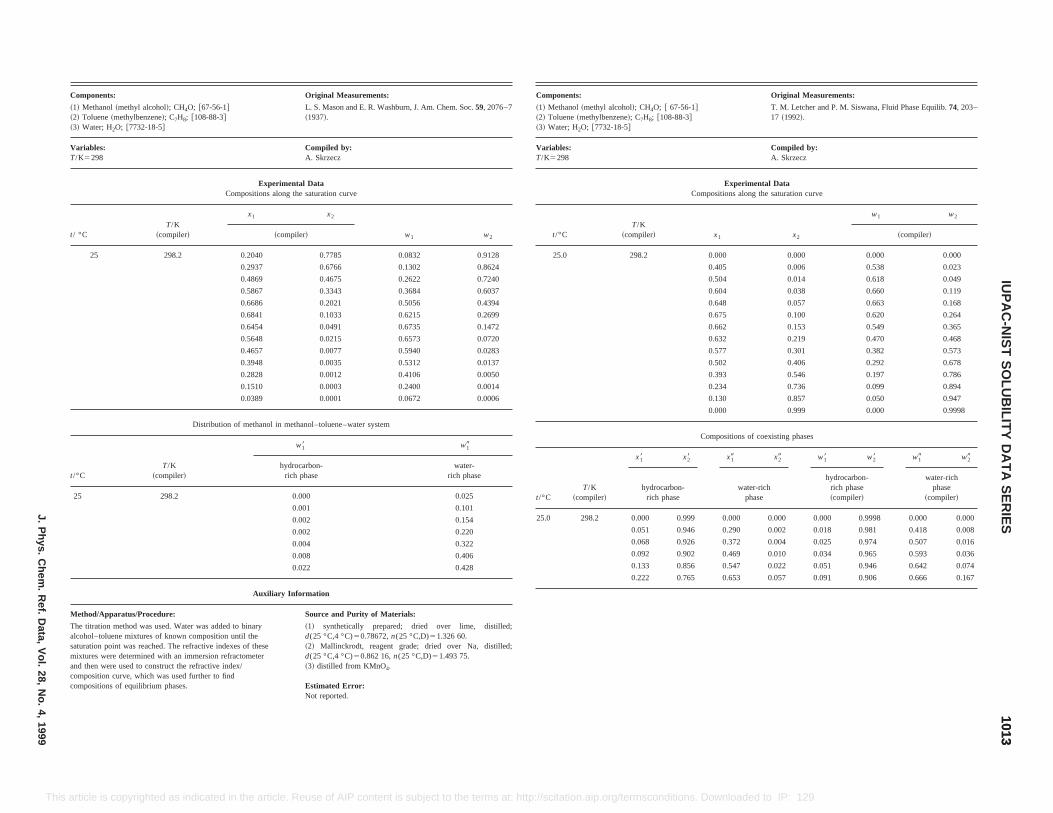
Original Measurements:
lcohol!; CH4O; @ 67-56-1#nzene!; C7H8; @108-88-3#-18-5#
T. M. Letcher and P. M. Siswana, Fluid Phase Equilib.74, 203–17 ~1992!.
Compiled by:A. Skrzecz
Experimental DataCompositions along the saturation curve
T/K~compiler! x1 x2
w1 w2
~compiler!
298.2 0.000 0.000 0.000 0.000
0.405 0.006 0.538 0.023
0.504 0.014 0.618 0.049
0.604 0.038 0.660 0.119
0.648 0.057 0.663 0.168
0.675 0.100 0.620 0.264
0.662 0.153 0.549 0.365
0.632 0.219 0.470 0.468
0.577 0.301 0.382 0.573
0.502 0.406 0.292 0.678
0.393 0.546 0.197 0.786
0.234 0.736 0.099 0.894
0.130 0.857 0.050 0.947
0.000 0.999 0.000 0.9998
Compositions of coexisting phases
x18 x28 x19 x29 w18 w28 w19 w29
hydrocarbon-rich phase
water-richphase
hydrocarbon-rich phase~compiler!
water-richphase
~compiler!
0.000 0.999 0.000 0.000 0.000 0.9998 0.000 0.000
0.051 0.946 0.290 0.002 0.018 0.981 0.418 0.008
0.372 0.004 0.025 0.974 0.507 0.016
0.469 0.010 0.034 0.965 0.593 0.036
0.547 0.022 0.051 0.946 0.642 0.074
0.653 0.057 0.091 0.906 0.666 0.167
10131013
IUP
AC
-NIS
TS
OLU
BILIT
YD
AT
AS
ER
IESJ.P
hys.C
hem.
Ref.
Data,
Vol.
28,N
o.4,
1999
This wnloaded to IP: 129.6.105.191 On: Fri, 05 Sep 2014 17:51:55
0.004 0.322
0.008 0.406
0.022 0.428
Auxiliary Information
Method/Apparatus/Procedure: Source and Purity of Materials:
The titration method was used. Water was added to binaryalcohol–toluene mixtures of known composition until thesaturation point was reached. The refractive indexes of thesemixtures were determined with an immersion refractometerand then were used to construct the refractive index/composition curve, which was used further to findcompositions of equilibrium phases.
~1! synthetically prepared; dried over lime, distilled;d(25 °C,4 °C)50.78672,n(25 °C,D)51.326 60.~2! Mallinckrodt, reagent grade; dried over Na, distilled;d(25 °C,4 °C)50.862 16,n(25 °C,D)51.493 75.~3! distilled from KMnO4.
Estimated Error:Not reported.
0.068 0.926
0.092 0.902
0.133 0.856
0.222 0.765
article is copyrighted as indicated in the article. Reuse of AIP content is subject to the terms at: http://scitation.aip.org/termsconditions. Do
Components: Original Measurements:
~1! Methanol~methyl alcohol!; CH4O; @67-56-1#~2! Toluene~methylbenzene!; C7H8; @108-88-3#~3! Water; H2O; @7732-18-5#
L. S. Mason and E. R. Washburn, J. Am. Chem. Soc.59, 2076–7~1937!.
Variables:T/K5298
Compiled by:A. Skrzecz
Experimental DataCompositions along the saturation curve
t/ °CT/K
~compiler!
x1 x2
w1 w2~compiler!
25 298.2 0.2040 0.7785 0.0832 0.9128
0.2937 0.6766 0.1302 0.8624
0.4869 0.4675 0.2622 0.7240
0.5867 0.3343 0.3684 0.6037
0.6686 0.2021 0.5056 0.4394
0.6841 0.1033 0.6215 0.2699
0.6454 0.0491 0.6735 0.1472
0.5648 0.0215 0.6573 0.0720
0.4657 0.0077 0.5940 0.0283
0.3948 0.0035 0.5312 0.0137
0.2828 0.0012 0.4106 0.0050
0.1510 0.0003 0.2400 0.0014
0.0389 0.0001 0.0672 0.0006
Distribution of methanol in methanol–toluene–water system
t/°CT/K
~compiler!
w18 w19
hydrocarbon-rich phase
water-rich phase
25 298.2 0.000 0.025
0.001 0.101
0.002 0.154
0.002 0.220
Components:
~1! Methanol~methyl a~2! Toluene~methylbe~3! Water; H2O; @7732
Variables:T/K5298
t/°C
25.0
t/°CT/K
~compiler!
25.0 298.2
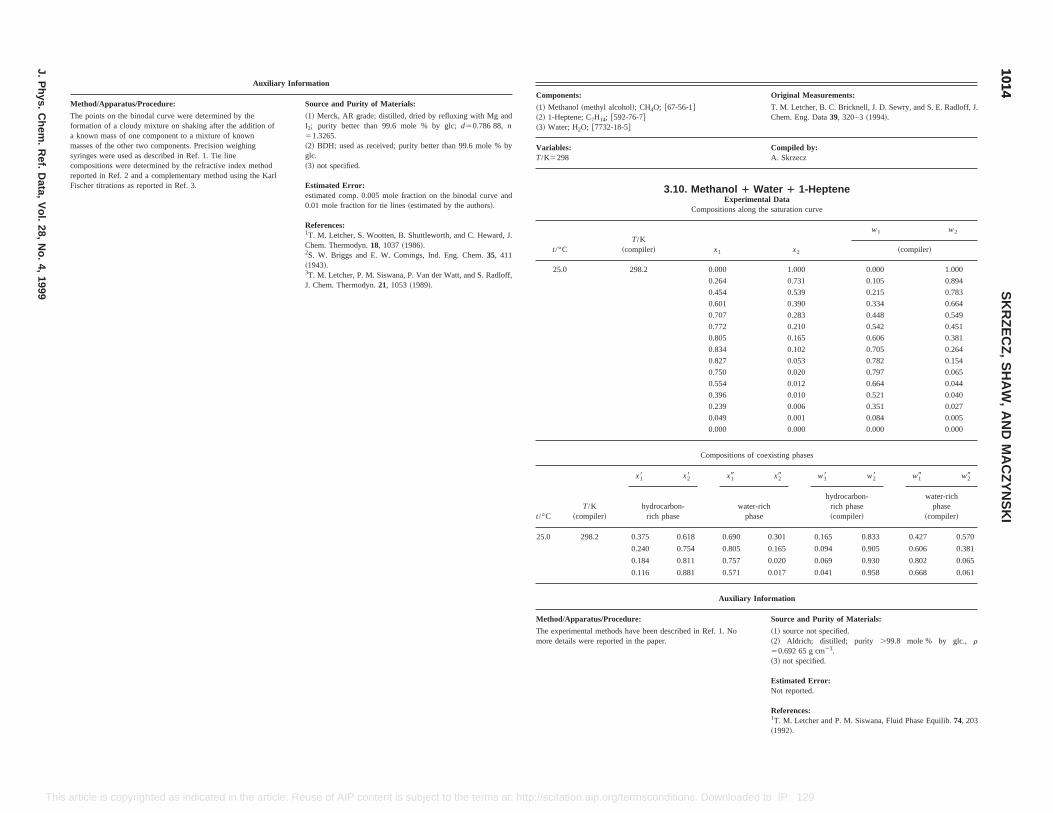
Original Measurements:
T. M. Letcher, B. C. Bricknell, J. D. Sewry, and S. E. Radloff, J.Chem. Eng. Data39, 320–3~1994!.
Compiled by:A. Skrzecz
Water 1 1-Hepteneental Datang the saturation curve
x2
w1 w2
~compiler!
1.000 0.000 1.000
0.731 0.105 0.894
0.539 0.215 0.783
0.390 0.334 0.664
0.283 0.448 0.549
0.210 0.542 0.451
0.165 0.606 0.381
0.102 0.705 0.264
0.053 0.782 0.154
0.020 0.797 0.065
0.012 0.664 0.044
0.010 0.521 0.040
0.006 0.351 0.027
0.001 0.084 0.005
0.000 0.000 0.000
of coexisting phases
x29 w18 w28 w19 w29
er-richhase
hydrocarbon-rich phase~compiler!
water-richphase
~compiler!
25.0 298.2 0.375 0.618 0.690 0.301 0.165 0.833 0.427 0.570
0.240 0.754 0.805 0.165 0.094 0.905 0.606 0.381
0.184 0.811 0.757 0.020 0.069 0.930 0.802 0.065
0.116 0.881 0.571 0.017 0.041 0.958 0.668 0.061
Auxiliary Information
Method/Apparatus/Procedure: Source and Purity of Materials:
The experimental methods have been described in Ref. 1. Nomore details were reported in the paper.
~1! source not specified.~2! Aldrich; distilled; purity .99.8 mole % by glc., r50.692 65 g cm23.~3! not specified.
Estimated Error:Not reported.
References:1T. M. Letcher and P. M. Siswana, Fluid Phase Equilib.74, 203~1992!.
10141014
SK
RZ
EC
Z,
SH
AW
,A
ND
MA
CZ
YN
SK
I
J.P
hys.C
hem.
Ref.
Data,
Vol.
28,N
o.4,
1999
This euse of AIP content is subject to the terms at: http://scitation.aip.org/termsconditions. Downloaded to IP: 129.6.105.191 On: Fri, 05 Sep 2014 17:51:55
article is copyrighted as indicated in the article. RAuxiliary Information
Method/Apparatus/Procedure: Source and Purity of Materials:
The points on the binodal curve were determined by theformation of a cloudy mixture on shaking after the addition ofa known mass of one component to a mixture of knownmasses of the other two components. Precision weighingsyringes were used as described in Ref. 1. Tie linecompositions were determined by the refractive index methodreported in Ref. 2 and a complementary method using the KarlFischer titrations as reported in Ref. 3.
~1! Merck, AR grade; distilled, dried by refluxing with Mg andI2; purity better than 99.6 mole % by glc;d50.786 88, n51.3265.~2! BDH; used as received; purity better than 99.6 mole % byglc.~3! not specified.
Estimated Error:estimated comp. 0.005 mole fraction on the binodal curve and0.01 mole fraction for tie lines~estimated by the authors!.
References:1T. M. Letcher, S. Wootten, B. Shuttleworth, and C. Heward, J.Chem. Thermodyn.18, 1037~1986!.2S. W. Briggs and E. W. Comings, Ind. Eng. Chem.35, 411~1943!.3T. M. Letcher, P. M. Siswana, P. Van der Watt, and S. Radloff,J. Chem. Thermodyn.21, 1053~1989!.
Components:
~1! Methanol~methyl alcohol!; CH4O; @67-56-1#~2! 1-Heptene; C7H14; @592-76-7#~3! Water; H2O; @7732-18-5#
Variables:T/K5298
3.10. Methanol 1Experim
Compositions alo
t/°CT/K
~compiler! x1
25.0 298.2 0.000
0.264
0.454
0.601
0.707
0.772
0.805
0.834
0.827
0.750
0.554
0.396
0.239
0.049
0.000
Compositions
t/°CT/K
~compiler!
x18 x28 x19
hydrocarbon-rich phase
watp
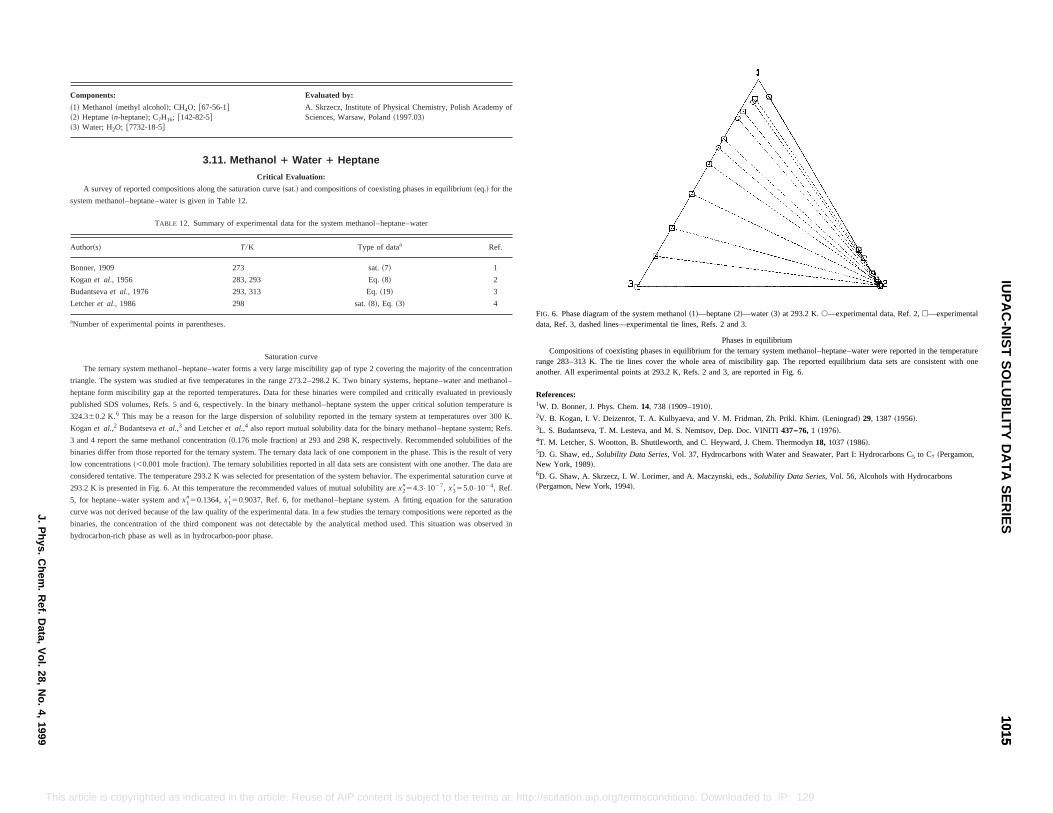
l–
is
y
at
e
n
. 6. Phase diagram of the system methanol~1!—heptane~2!—water~3! at 293.2 K.s—experimental data, Ref. 2,h—experimentala, Ref. 3, dashed lines—experimental tie lines, Refs. 2 and 3.
Phases in equilibriumCompositions of coexisting phases in equilibrium for the ternary system methanol–heptane–water were reported in the temperaturege 283–313 K. The tie lines cover the whole area of miscibility gap. The reported equilibrium data sets are consistent with onether. All experimental points at 293.2 K, Refs. 2 and 3, are reported in Fig. 6.
erences:
D. Bonner, J. Phys. Chem.14, 738 ~1909–1910!.
B. Kogan, I. V. Deizenrot, T. A. Kulbyaeva, and V. M. Fridman, Zh. Prikl. Khim.~Leningrad! 29, 1387~1956!.
S. Budantseva, T. M. Lesteva, and M. S. Nemtsov, Dep. Doc. VINITI437–76, 1 ~1976!.
M. Letcher, S. Wootton, B. Shuttleworth, and C. Heyward, J. Chem. Thermodyn18, 1037 ~1986!.
G. Shaw, ed.,Solubility Data Series, Vol. 37, Hydrocarbons with Water and Seawater, Part I: Hydrocarbons C5 to C7 ~Pergamon,York, 1989!.
G. Shaw, A. Skrzecz, I. W. Lorimer, and A. Maczynski, eds.,Solubility Data Series, Vol. 56, Alcohols with Hydrocarbonsrgamon, New York, 1994!.
10151015
IUP
AC
-NIS
TS
OLU
BILIT
YD
AT
AS
ER
IESJ.P
hys.C
hem.
Ref.
Data,
Vol.
28,N
o.4,
1999
This itation.aip.org/termsconditions. Downloaded to IP: 129.6.105.191 On: Fri, 05 Sep 2014 17:51:55
hydrocarbon-rich phase as well as in hydrocarbon-poor phase.
article is copyrighted as indicated in the article. Reuse of AIP content is subject to the terms at: http://sc
Components: Evaluated by:
~1! Methanol~methyl alcohol!; CH4O; @67-56-1#~2! Heptane~n-heptane!; C7H16; @142-82-5#~3! Water; H2O; @7732-18-5#
A. Skrzecz, Institute of Physical Chemistry, Polish Academy ofSciences, Warsaw, Poland~1997.03!
3.11. Methanol 1 Water 1 Heptane
Critical Evaluation:
A survey of reported compositions along the saturation curve~sat.! and compositions of coexisting phases in equilibrium~eq.! for the
system methanol–heptane–water is given in Table 12.
TABLE 12. Summary of experimental data for the system methanol–heptane–water
Author~s! T/K Type of dataa Ref.
Bonner, 1909 273 sat.~7! 1
Koganet al., 1956 283, 293 Eq.~8! 2
Budantsevaet al., 1976 293, 313 Eq.~19! 3
Letcheret al., 1986 298 sat.~8!, Eq. ~3! 4
aNumber of experimental points in parentheses.
Saturation curve
The ternary system methanol–heptane–water forms a very large miscibility gap of type 2 covering the majority of the concentration
triangle. The system was studied at five temperatures in the range 273.2–298.2 K. Two binary systems, heptane–water and methano
heptane form miscibility gap at the reported temperatures. Data for these binaries were compiled and critically evaluated in previously
published SDS volumes, Refs. 5 and 6, respectively. In the binary methanol–heptane system the upper critical solution temperature
324.360.2 K.6 This may be a reason for the large dispersion of solubility reported in the ternary system at temperatures over 300 K.
Koganet al.,2 Budantsevaet al.,3 and Letcheret al.,4 also report mutual solubility data for the binary methanol–heptane system; Refs.
3 and 4 report the same methanol concentration~0.176 mole fraction! at 293 and 298 K, respectively. Recommended solubilities of the
binaries differ from those reported for the ternary system. The ternary data lack of one component in the phase. This is the result of ver
low concentrations~,0.001 mole fraction!. The ternary solubilities reported in all data sets are consistent with one another. The data are
considered tentative. The temperature 293.2 K was selected for presentation of the system behavior. The experimental saturation curve
293.2 K is presented in Fig. 6. At this temperature the recommended values of mutual solubility arex2954.3•1027, x3855.0•1024, Ref.
5, for heptane–water system andx1950.1364,x1850.9037, Ref. 6, for methanol–heptane system. A fitting equation for the saturation
curve was not derived because of the law quality of the experimental data. In a few studies the ternary compositions were reported as th
binaries, the concentration of the third component was not detectable by the analytical method used. This situation was observed i
FIG
dat
ranano
Ref1W.2V.3L.4T.5D.New6D.~Pe
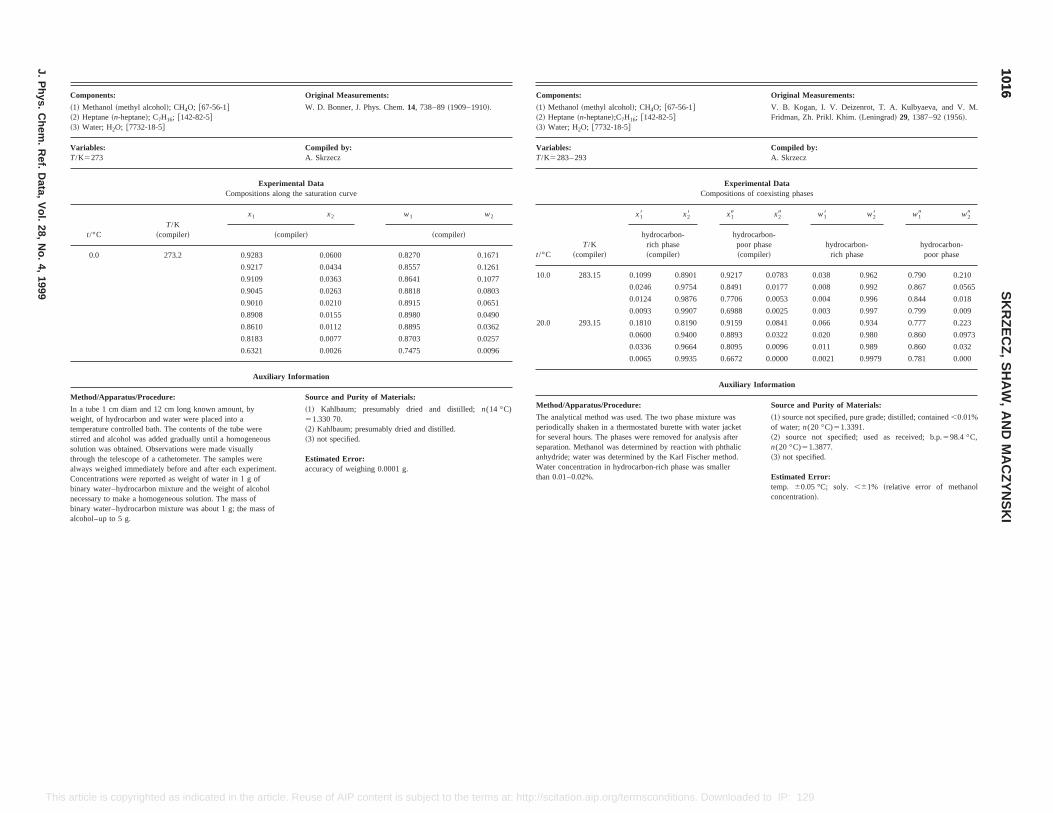
omponents: Original Measurements:
1! Methanol~methyl alcohol!; CH4O; @67-56-1#2! Heptane~n-heptane!;C7H16; @142-82-5#3! Water; H2O; @7732-18-5#
V. B. Kogan, I. V. Deizenrot, T. A. Kulbyaeva, and V. M.Fridman, Zh. Prikl. Khim.~Leningrad! 29, 1387–92~1956!.
ariables:/K5283– 293
Compiled by:A. Skrzecz
Experimental DataCompositions of coexisting phases
/°CT/K
~compiler!
x18 x28 x19 x29 w18 w28 w19 w29
hydrocarbon-rich phase~compiler!
hydrocarbon-poor phase~compiler!
hydrocarbon-rich phase
hydrocarbon-poor phase
0.0 283.15 0.1099 0.8901 0.9217 0.0783 0.038 0.962 0.790 0.210
0.0246 0.9754 0.8491 0.0177 0.008 0.992 0.867 0.0565
0.0124 0.9876 0.7706 0.0053 0.004 0.996 0.844 0.018
0.0093 0.9907 0.6988 0.0025 0.003 0.997 0.799 0.009
0.0 293.15 0.1810 0.8190 0.9159 0.0841 0.066 0.934 0.777 0.223
0.0600 0.9400 0.8893 0.0322 0.020 0.980 0.860 0.0973
0.0336 0.9664 0.8095 0.0096 0.011 0.989 0.860 0.032
0.0065 0.9935 0.6672 0.0000 0.0021 0.9979 0.781 0.000
Auxiliary Information
ethod/Apparatus/Procedure: Source and Purity of Materials:
he analytical method was used. The two phase mixture waseriodically shaken in a thermostated burette with water jacket
or several hours. The phases were removed for analysis aftereparation. Methanol was determined by reaction with phthalicnhydride; water was determined by the Karl Fischer method.ater concentration in hydrocarbon-rich phase was smaller
han 0.01–0.02%.
~1! source not specified, pure grade; distilled; contained,0.01%of water;n(20 °C)51.3391.~2! source not specified; used as received; b.p.598.4 °C,n(20 °C)51.3877.~3! not specified.
Estimated Error:temp. 60.05 °C; soly. ,61% ~relative error of methanolconcentration!.
10161016
SK
RZ
EC
Z,
SH
AW
,A
ND
MA
CZ
YN
SK
I
J.P
hys.C
hem.
Ref.
Data,
Vol.
28,N
o.4,
1999
This /scitation.aip.org/termsconditions. Downloaded to IP: 129.6.105.191 On: Fri, 05 Sep 2014 17:51:55
article is copyrighted as indicated in the article. Reuse of AIP content is subject to the terms at: http:/Components: Original Measurements:
~1! Methanol~methyl alcohol!; CH4O; @67-56-1#~2! Heptane~n-heptane!; C7H16; @142-82-5#~3! Water; H2O; @7732-18-5#
W. D. Bonner, J. Phys. Chem.14, 738–89~1909–1910!.
Variables:T/K5273
Compiled by:A. Skrzecz
Experimental DataCompositions along the saturation curve
t/°CT/K
~compiler!
x1 x2 w1 w2
~compiler! ~compiler!
0.0 273.2 0.9283 0.0600 0.8270 0.1671
0.9217 0.0434 0.8557 0.1261
0.9109 0.0363 0.8641 0.1077
0.9045 0.0263 0.8818 0.0803
0.9010 0.0210 0.8915 0.0651
0.8908 0.0155 0.8980 0.0490
0.8610 0.0112 0.8895 0.0362
0.8183 0.0077 0.8703 0.0257
0.6321 0.0026 0.7475 0.0096
Auxiliary Information
Method/Apparatus/Procedure: Source and Purity of Materials:
In a tube 1 cm diam and 12 cm long known amount, byweight, of hydrocarbon and water were placed into atemperature controlled bath. The contents of the tube werestirred and alcohol was added gradually until a homogeneoussolution was obtained. Observations were made visuallythrough the telescope of a cathetometer. The samples werealways weighed immediately before and after each experiment.Concentrations were reported as weight of water in 1 g ofbinary water–hydrocarbon mixture and the weight of alcoholnecessary to make a homogeneous solution. The mass ofbinary water–hydrocarbon mixture was about 1 g; the mass ofalcohol–up to 5 g.
~1! Kahlbaum; presumably dried and distilled;n(14 °C)51.330 70.~2! Kahlbaum; presumably dried and distilled.~3! not specified.
Estimated Error:accuracy of weighing 0.0001 g.
C
~~~
VT
t
1
2
M
TpfsaWt
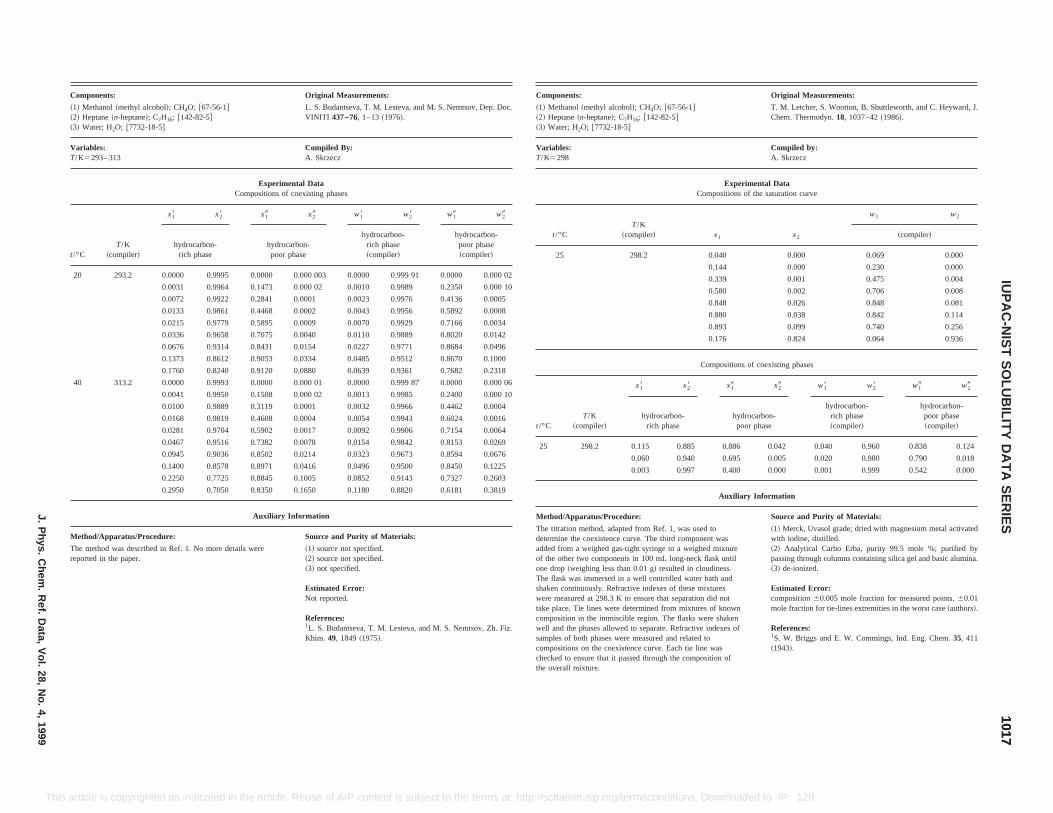
C
~~~
VT
t
M
Tr
Original Measurements:
6-1# T. M. Letcher, S. Wootton, B. Shuttleworth, and C. Heyward, J.Chem. Thermodyn.18, 1037–42~1986!.
Compiled by:A. Skrzecz
Experimental DataCompositions of the saturation curve
x1 x2
w1 w2
~compiler!
0.040 0.000 0.069 0.000
0.144 0.000 0.230 0.000
0.339 0.001 0.475 0.004
0.580 0.002 0.706 0.008
0.848 0.026 0.848 0.081
0.880 0.038 0.842 0.114
0.893 0.099 0.740 0.256
0.176 0.824 0.064 0.936
Compositions of coexisting phases
x28 x19 x29 w18 w28 w19 w29
n- hydrocarbon-poor phase
hydrocarbon-rich phase~compiler!
hydrocarbon-poor phase~compiler!
0.885 0.886 0.042 0.040 0.960 0.838 0.124
.940 0.695 0.005 0.020 0.980 0.790 0.018
.997 0.400 0.000 0.001 0.999 0.542 0.000
Auxiliary Information
Source and Purity of Materials:
The titration method, adapted from Ref. 1, was used tohe third component wasringe to a weighed mixture0 mL long-neck flask untilresulted in cloudiness.ontrolled water bath andexes of these mixtures
re that separation did noted from mixtures of knownn. The flasks were shakenarate. Refractive indexes of
sured and related tourve. Each tie line wasrough the composition of
~1! Merck, Uvasol grade; dried with magnesium metal activatedwith iodine, distilled.~2! Analytical Carbo Erba, purity 99.5 mole %; purified bypassing through columns containing silica gel and basic alumina.~3! de-ionized.
Estimated Error:composition60.005 mole fraction for measured points,60.01mole fraction for tie-lines extremities in the worst case~authors!.
References:1S. W. Briggs and E. W. Commings, Ind. Eng. Chem.35, 411~1943!.
10171017
IUP
AC
-NIS
TS
OLU
BILIT
YD
AT
AS
ER
IESJ.P
hys.C
hem.
Ref.
Data,
Vol.
28,N
o.4,
1999
This a ditions. Downloaded to IP: 129.6.105.191 On: Fri, 05 Sep 2014 17:51:55
ethod/Apparatus/Procedure: Source and Purity of Materials:
he method was described in Ref. 1. No more details wereeported in the paper.
~1! source not specified.~2! source not specified.~3! not specified.
Estimated Error:Not reported.
References:1L. S. Budantseva, T. M. Lesteva, and M. S. Nemtsov, Zh. Fiz.Khim. 49, 1849~1975!.
determine the coexistence curve. Tadded from a weighed gas-tight syof the other two components in 10one drop~weighing less than 0.01 g!The flask was immersed in a well cshaken continuously. Refractive indwere measured at 298.3 K to ensutake place. Tie lines were determincomposition in the immiscible regiowell and the phases allowed to sepsamples of both phases were meacompositions on the coexistence cchecked to ensure that it passed ththe overall mixture.
rticle is copyrighted as indicated in the article. Reuse of AIP content is subject to the terms at: http://scitation.aip.org/termscon
omponents: Original Measurements:
1! Methanol~methyl alcohol!; CH4O; @67-56-1#2! Heptane~n-heptane!; C7H16; @142-82-5#3! Water; H2O; @7732-18-5#
L. S. Budantseva, T. M. Lesteva, and M. S. Nemtsov, Dep. Doc.VINITI 437–76, 1–13~1976!.
ariables:/K5293– 313
Compiled By:A. Skrzecz
Experimental DataCompositions of coexisting phases
/°CT/K
~compiler!
x18 x28 x19 x29 w18 w28 w19 w29
hydrocarbon-rich phase
hydrocarbon-poor phase
hydrocarbon-rich phase~compiler!
hydrocarbon-poor phase~compiler!
20 293.2 0.0000 0.9995 0.0000 0.000 003 0.0000 0.999 91 0.0000 0.000 02
0.0031 0.9964 0.1473 0.000 02 0.0010 0.9989 0.2350 0.000 10
0.0072 0.9922 0.2841 0.0001 0.0023 0.9976 0.4136 0.0005
0.0133 0.9861 0.4468 0.0002 0.0043 0.9956 0.5892 0.0008
0.0215 0.9779 0.5895 0.0009 0.0070 0.9929 0.7166 0.0034
0.0336 0.9658 0.7075 0.0040 0.0110 0.9889 0.8020 0.0142
0.0676 0.9314 0.8431 0.0154 0.0227 0.9771 0.8684 0.0496
0.1373 0.8612 0.9053 0.0334 0.0485 0.9512 0.8670 0.1000
0.1760 0.8240 0.9120 0.0880 0.0639 0.9361 0.7682 0.2318
40 313.2 0.0000 0.9993 0.0000 0.000 01 0.0000 0.999 87 0.0000 0.000 06
0.0041 0.9950 0.1508 0.000 02 0.0013 0.9985 0.2400 0.000 10
0.0100 0.9889 0.3119 0.0001 0.0032 0.9966 0.4462 0.0004
0.0168 0.9819 0.4608 0.0004 0.0054 0.9943 0.6024 0.0016
0.0281 0.9704 0.5902 0.0017 0.0092 0.9906 0.7154 0.0064
0.0467 0.9516 0.7382 0.0078 0.0154 0.9842 0.8153 0.0269
0.0945 0.9036 0.8502 0.0214 0.0323 0.9673 0.8594 0.0676
0.1400 0.8578 0.8971 0.0416 0.0496 0.9500 0.8450 0.1225
0.2250 0.7725 0.8845 0.1005 0.0852 0.9143 0.7327 0.2603
0.2950 0.7050 0.8350 0.1650 0.1180 0.8820 0.6181 0.3819
Auxiliary Information
Components:
~1! Methanol~methyl alcohol!; CH4O; @67-5~2! Heptane~n-heptane!; C7H16; @142-82-5#~3! Water; H2O; @7732-18-5#
Variables:T/K5298
t/°CT/K
~compiler!
25 298.2
t/°CT/K
~compiler!
x18
hydrocarborich phase
25 298.2 0.115
0.060 0
0.003 0
Method/Apparatus/Procedure:
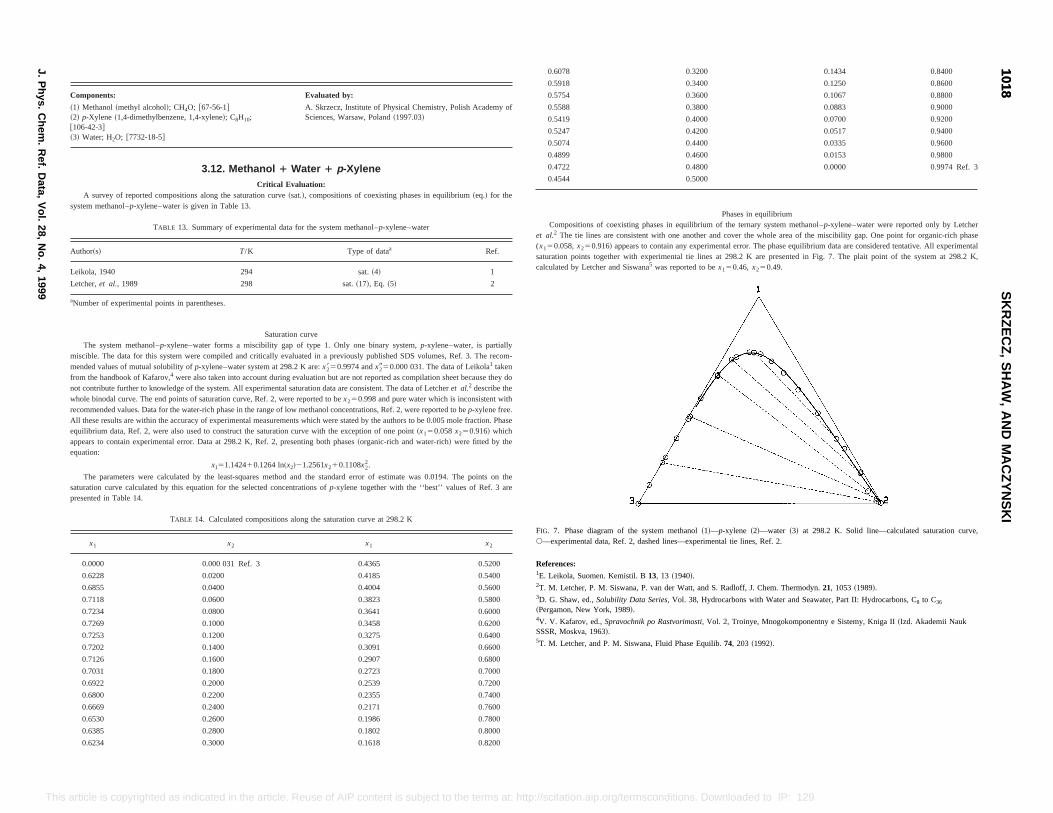
0.3200 0.1434 0.8400
0.3400 0.1250 0.8600
0.3600 0.1067 0.8800
0.3800 0.0883 0.9000
0.4000 0.0700 0.9200
0.4200 0.0517 0.9400
0.4400 0.0335 0.9600
0.4600 0.0153 0.9800
0.4800 0.0000 0.9974 Ref. 3
0.5000
Phases in equilibriumes in equilibrium of the ternary system methanol–p-xylene–water were reported only by Letcherith one another and cover the whole area of the miscibility gap. One point for organic-rich phase
ntain any experimental error. The phase equilibrium data are considered tentative. All experimentalrimental tie lines at 298.2 K are presented in Fig. 7. The plait point of the system at 298.2 K,s reported to bex150.46, x250.49.
!—water ~3! at 298.2 K. Solid line—calculated saturation curve,lines, Ref. 2.
ff, J. Chem. Thermodyn.21, 1053~1989!.
ith Water and Seawater, Part II: Hydrocarbons, C8 to C36
, Mnogokomponentny e Sistemy, Kniga II~Izd. Akademii Nauk
992!.
10181018
SK
RZ
EC
Z,
SH
AW
,A
ND
MA
CZ
YN
SK
I
J.P
hys.C
hem.
Ref.
Data,
Vol.
28,N
o.4,
1999
This to IP: 129.6.105.191 On: Fri, 05 Sep 2014 17:51:55
x1 x2 x1 x2
0.0000 0.000 031 Ref. 3 0.4365 0.5200
0.6228 0.0200 0.4185 0.5400
0.6855 0.0400 0.4004 0.5600
0.7118 0.0600 0.3823 0.5800
0.7234 0.0800 0.3641 0.6000
0.7269 0.1000 0.3458 0.6200
0.7253 0.1200 0.3275 0.6400
0.7202 0.1400 0.3091 0.6600
0.7126 0.1600 0.2907 0.6800
0.7031 0.1800 0.2723 0.7000
0.6922 0.2000 0.2539 0.7200
0.6800 0.2200 0.2355 0.7400
0.6669 0.2400 0.2171 0.7600
0.6530 0.2600 0.1986 0.7800
0.6385 0.2800 0.1802 0.8000
0.6234 0.3000 0.1618 0.8200
FIG. 7. Phase diagram of the system methanol~1!—p-xylene ~2s—experimental data, Ref. 2, dashed lines—experimental tie
References:1E. Leikola, Suomen. Kemistil. B13, 13 ~1940!.2T. M. Letcher, P. M. Siswana, P. van der Watt, and S. Radlo3D. G. Shaw, ed.,Solubility Data Series,Vol. 38, Hydrocarbons w~Pergamon, New York, 1989!.4V. V. Kafarov, ed.,Spravochnik po Rastvorimosti,Vol. 2, TroinyeSSSR, Moskva, 1963!.5T. M. Letcher, and P. M. Siswana, Fluid Phase Equilib.74, 203 ~1
article is copyrighted as indicated in the article. Reuse of AIP content is subject to the terms at: http://scitation.aip.org/termsconditions. Downloaded
Components: Evaluated by:
~1! Methanol~methyl alcohol!; CH4O; @67-56-1#~2! p-Xylene ~1,4-dimethylbenzene, 1,4-xylene!; C8H10;@106-42-3#~3! Water; H2O; @7732-18-5#
A. Skrzecz, Institute of Physical Chemistry, Polish Academy ofSciences, Warsaw, Poland~1997.03!
3.12. Methanol 1 Water 1 p-XyleneCritical Evaluation:
A survey of reported compositions along the saturation curve~sat.!, compositions of coexisting phases in equilibrium~eq.! for thesystem methanol–p-xylene–water is given in Table 13.
TABLE 13. Summary of experimental data for the system methanol–p-xylene–water
Author~s! T/K Type of dataa Ref.
Leikola, 1940 294 sat.~4! 1
Letcher,et al., 1989 298 sat.~17!, Eq. ~5! 2
aNumber of experimental points in parentheses.
Saturation curveThe system methanol–p-xylene–water forms a miscibility gap of type 1. Only one binary system,p-xylene–water, is partially
miscible. The data for this system were compiled and critically evaluated in a previously published SDS volumes, Ref. 3. The recom-mended values of mutual solubility ofp-xylene–water system at 298.2 K are:x2850.9974 andx2950.000 031. The data of Leikola1 takenfrom the handbook of Kafarov,4 were also taken into account during evaluation but are not reported as compilation sheet because they donot contribute further to knowledge of the system. All experimental saturation data are consistent. The data of Letcheret al.2 describe thewhole binodal curve. The end points of saturation curve, Ref. 2, were reported to bex250.998 and pure water which is inconsistent withrecommended values. Data for the water-rich phase in the range of low methanol concentrations, Ref. 2, were reported to bep-xylene free.All these results are within the accuracy of experimental measurements which were stated by the authors to be 0.005 mole fraction. Phaseequilibrium data, Ref. 2, were also used to construct the saturation curve with the exception of one point~x150.058x250.916! whichappears to contain experimental error. Data at 298.2 K, Ref. 2, presenting both phases~organic-rich and water-rich! were fitted by theequation:
x151.142410.1264 ln~x2!21.2561x210.1108x22.
The parameters were calculated by the least-squares method and the standard error of estimate was 0.0194. The points on thesaturation curve calculated by this equation for the selected concentrations ofp-xylene together with the ‘‘best’’ values of Ref. 3 arepresented in Table 14.
TABLE 14. Calculated compositions along the saturation curve at 298.2 K
0.6078
0.5918
0.5754
0.5588
0.5419
0.5247
0.5074
0.4899
0.4722
0.4544
Compositions of coexisting phaset al.2 The tie lines are consistent w(x150.058,x250.916! appears to cosaturation points together with expecalculated by Letcher and Siswana5 wa

Original Measurements:
H10;T. M. Letcher, P. M. Siswana, P. van der Watt, and S. Radloff,J. Chem. Thermodyn.21, 1053–60~1989!.
Compiled by:A. Skrzecz
Experimental Datampositions of the saturation curve
x1 x2
w1 w2
~compiler!
0.000 0.998 0.000 0.9997
0.150 0.840 0.051 0.947
0.263 0.716 0.099 0.896
0.433 0.523 0.198 0.791
0.548 0.385 0.294 0.685
0.629 0.285 0.388 0.582
0.686 0.207 0.479 0.479
0.721 0.145 0.565 0.376
0.730 0.095 0.639 0.275
0.707 0.053 0.695 0.173
0.615 0.021 0.692 0.078
0.508 0.005 0.636 0.021
0.407 0.003 0.544 0.013
0.315 0.001 0.448 0.005
0.224 0.001 0.338 0.005
0.090 0.000 0.150 0.000
0.000 0.000 0.000 0.000
ompositions of coexisting phases
x19 x29 w18 w28 w19 w29
hydrocarbon- water-rich
Auxiliary Information
Method/Apparatus/Procedure: Source and Purity of Materials:
The titration method was used to determine binodal curve. Abinary mixture of known composition was titrated with thethird component until cloudiness was observed. Tie linecompositions were related to the coexistence curve; water wasdetermined by the Karl Fischer titration. The methods weredescribed in Ref. 1.
~1! source not specified; used as received.~2! source not specified; recrystallized three times.~3! not specified.
Estimated Error:comp. ,0.005 mole fraction~estimated authors’ precision onbinodal curve!, ,0.01 mole fraction ~estimated authors’precision of tie lines!.
References:1T. M. Letcher, S. Wootten, B. Shuttleworth, and C. Heyward, J.Chem. Thermodyn.18, 1037~1986!.
10191019
IUP
AC
-NIS
TS
OLU
BILIT
YD
AT
AS
ER
IESJ.P
hys.C
hem.
Ref.
Data,
Vol.
28,N
o.4,
1999
This onditions. Downloaded to IP: 129.6.105.191 On: Fri, 05 Sep 2014 17:51:55
t/°C~compiler! T/K
hydrocarbon-rich phase
water-richphase
rich phase~compiler!
phase~compiler!
25.0 298.2 0.310 0.660 0.728 0.115 0.123 0.870 0.608 0.318
0.144 0.842 0.695 0.039 0.049 0.948 0.714 0.133
0.058 0.916 0.620 0.019 0.019 0.977 0.700 0.071
0.021 0.970 0.419 0.005 0.006 0.992 0.552 0.022
0.005 0.985 0.199 0.000 0.002 0.997 0.306 0.000
article is copyrighted as indicated in the article. Reuse of AIP content is subject to the terms at: http://scitation.aip.org/termsc
Components:
~1! Methanol~methyl alcohol!; CH4O; @67-56-1#~2! p-Xylene ~1,4-dimethylbenzene, 1,4-xylene!; C8
@106-42-3#~3! Water; H2O; @7732-18-5#
Variables:T/K5298
Co
t/°C T/K
25.0 298.2
C
x18 x28
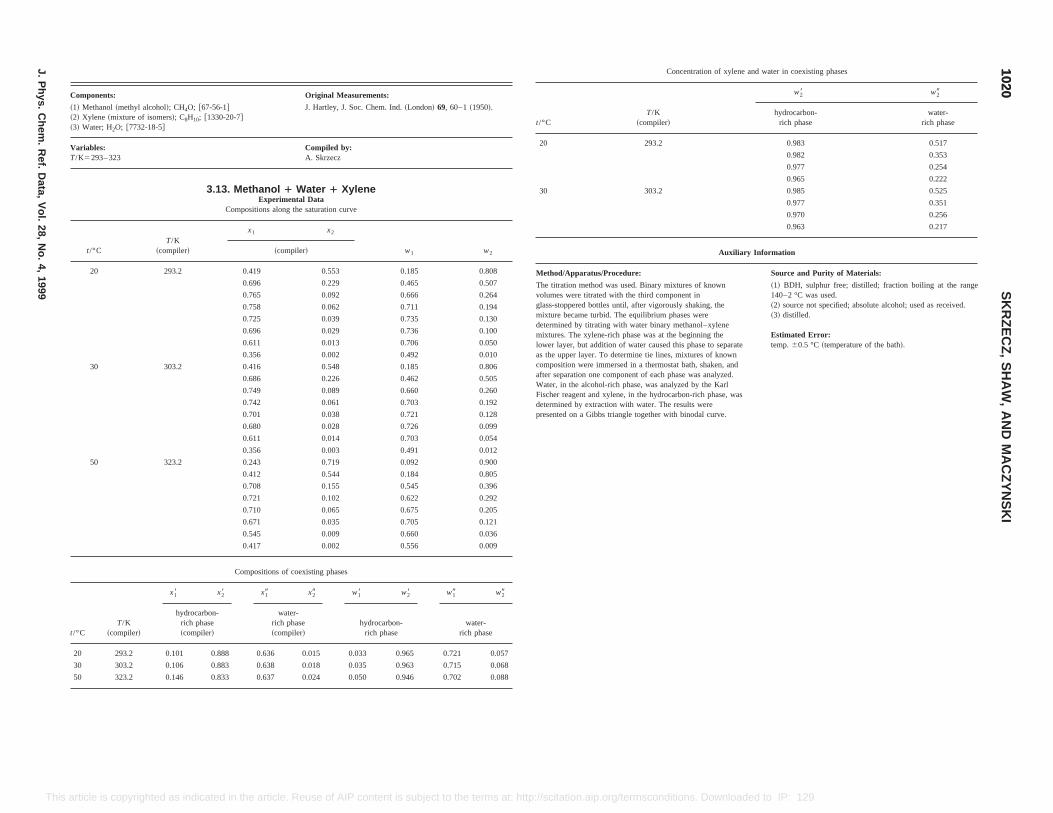
n! 69, 60–1~1950!.
w2
0.808
0.507
0.264
0.194
0.130
0.100
0.050
0.010
0.806
0.505
0.260
0.192
0.128
0.099
0.054
0.012
0.900
0.805
0.396
0.292
0.205
0.671 0.035 0.705 0.121
Concentration of xylene and water in coexisting phases
t/°CT/K
~compiler!
w28 w29
hydrocarbon-rich phase
water-rich phase
20 293.2 0.983 0.517
0.982 0.353
0.977 0.254
0.965 0.222
30 303.2 0.985 0.525
0.977 0.351
0.970 0.256
0.963 0.217
Auxiliary Information
Method/Apparatus/Procedure: Source and Purity of Materials:
The titration method was used. Binary mixtures of knownvolumes were titrated with the third component inglass-stoppered bottles until, after vigorously shaking, themixture became turbid. The equilibrium phases weredetermined by titrating with water binary methanol–xylenemixtures. The xylene-rich phase was at the beginning thelower layer, but addition of water caused this phase to separateas the upper layer. To determine tie lines, mixtures of knowncomposition were immersed in a thermostat bath, shaken, andafter separation one component of each phase was analyzed.Water, in the alcohol-rich phase, was analyzed by the KarlFischer reagent and xylene, in the hydrocarbon-rich phase, wasdetermined by extraction with water. The results werepresented on a Gibbs triangle together with binodal curve.
~1! BDH, sulphur free; distilled; fraction boiling at the range140–2 °C was used.~2! source not specified; absolute alcohol; used as received.~3! distilled.
Estimated Error:temp.60.5 °C ~temperature of the bath!.
10201020
SK
RZ
EC
Z,
SH
AW
,A
ND
MA
CZ
YN
SK
I
J.P
hys.C
hem.
Ref.
Data,
Vol.
28,N
o.4,
1999
This ownloaded to IP: 129.6.105.191 On: Fri, 05 Sep 2014 17:51:55
0.545 0.009 0.660 0.036
0.417 0.002 0.556 0.009
Compositions of coexisting phases
t/°CT/K
~compiler!
x18 x28 x19 x29 w18 w28 w19 w29
hydrocarbon-rich phase~compiler!
water-rich phase~compiler!
hydrocarbon-rich phase
water-rich phase
20 293.2 0.101 0.888 0.636 0.015 0.033 0.965 0.721 0.057
30 303.2 0.106 0.883 0.638 0.018 0.035 0.963 0.715 0.068
50 323.2 0.146 0.833 0.637 0.024 0.050 0.946 0.702 0.088
article is copyrighted as indicated in the article. Reuse of AIP content is subject to the terms at: http://scitation.aip.org/termsconditions. D
Components: Original Measurements:
~1! Methanol~methyl alcohol!; CH4O; @67-56-1#~2! Xylene ~mixture of isomers!; C8H10; @1330-20-7#~3! Water; H2O; @7732-18-5#
J. Hartley, J. Soc. Chem. Ind.~Londo
Variables:T/K5293– 323
Compiled by:A. Skrzecz
3.13. Methanol 1 Water 1 XyleneExperimental Data
Compositions along the saturation curve
t/°CT/K
~compiler!
x1 x2
w1~compiler!
20 293.2 0.419 0.553 0.185
0.696 0.229 0.465
0.765 0.092 0.666
0.758 0.062 0.711
0.725 0.039 0.735
0.696 0.029 0.736
0.611 0.013 0.706
0.356 0.002 0.492
30 303.2 0.416 0.548 0.185
0.686 0.226 0.462
0.749 0.089 0.660
0.742 0.061 0.703
0.701 0.038 0.721
0.680 0.028 0.726
0.611 0.014 0.703
0.356 0.003 0.491
50 323.2 0.243 0.719 0.092
0.412 0.544 0.184
0.708 0.155 0.545
0.721 0.102 0.622
0.710 0.065 0.675
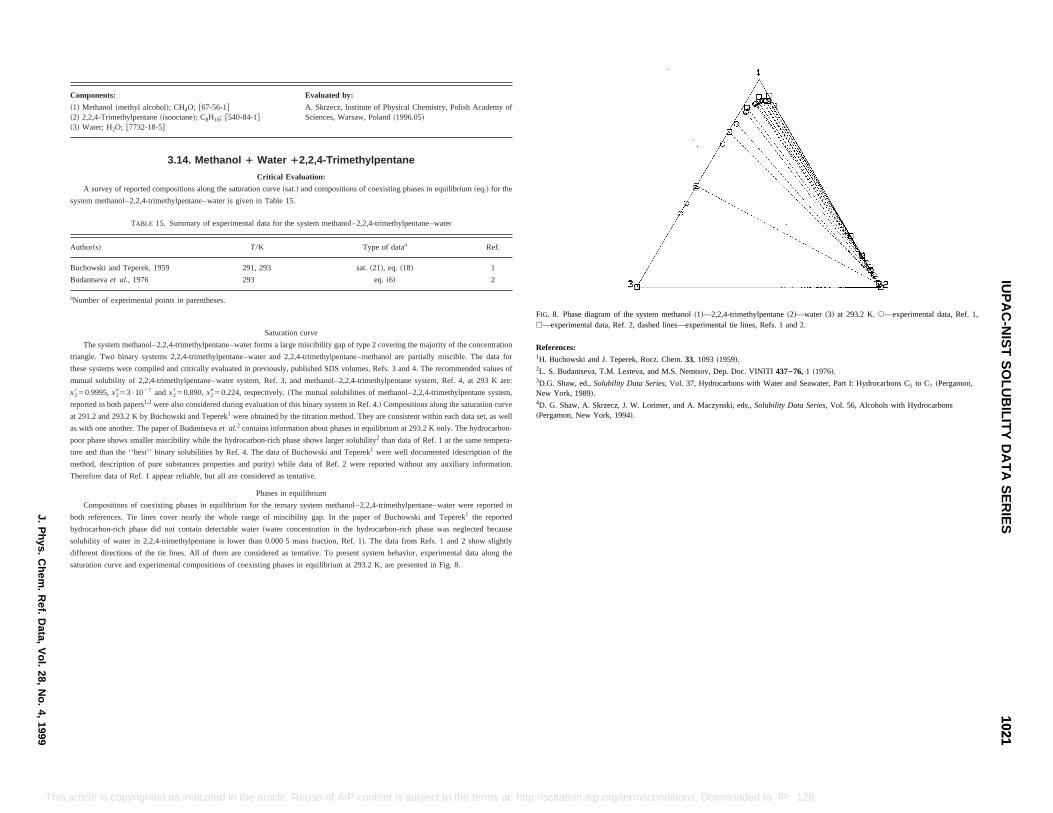
stry, Polish Academy of
equilibrium~eq.! for the
ne–water
Ref.
1
2
majority of the concentration
artially miscible. The data for
4. The recommended values of
system, Ref. 4, at 293 K are:
rimethylpentane system,
ng the saturation curve
ithin each data set, as well
K only. The hydrocarbon-
1 at the same tempera-
ted~description of the
y auxiliary information.
ntane–water were reported in
i and Teperek1 the reported
e was neglected because
FIG. 8. Phase diagram of the system methanol~1!—2,2,4-trimethylpentane~2!—water ~3! at 293.2 K.s—experimental data, Ref. 1,h—experimental data, Ref. 2, dashed lines—experimental tie lines, Refs. 1 and 2.
References:1H. Buchowski and J. Teperek, Rocz. Chem.33, 1093~1959!.2L. S. Budantseva, T.M. Lesteva, and M.S. Nemtsov, Dep. Doc. VINITI437–76, 1 ~1976!.3D.G. Shaw, ed.,Solubility Data Series, Vol. 37, Hydrocarbons with Water and Seawater, Part I: Hydrocarbons C5 to C7 ~Pergamon,New York, 1989!.4D. G. Shaw, A. Skrzecz, J. W. Lorimer, and A. Maczynski, eds.,Solubility Data Series, Vol. 56, Alcohols with Hydrocarbons~Pergamon, New York, 1994!.
10211021
IUP
AC
-NIS
TS
OLU
BILIT
YD
AT
AS
ER
IESJ.P
hys.C
hem.
Ref.
Data,
Vol.
28,N
o.4,
1999
This .org/termsconditions. Downloaded to IP: 129.6.105.191 On: Fri, 05 Sep 2014 17:51:55
solubility of water in 2,2,4-trimethylpentane is lower than 0.000 5 mass fraction, Ref. 1!. The data from Refs. 1 and 2 show slightly
different directions of the tie lines. All of them are considered as tentative. To present system behavior, experimental data along the
saturation curve and experimental compositions of coexisting phases in equilibrium at 293.2 K, are presented in Fig. 8.
article is copyrighted as indicated in the article. Reuse of AIP content is subject to the terms at: http://scitation.aip
Components: Evaluated by:
~1! Methanol~methyl alcohol!; CH4O; @67-56-1#~2! 2,2,4-Trimethylpentane~isooctane!; C8H18; @540-84-1#~3! Water; H2O; @7732-18-5#
A. Skrzecz, Institute of Physical ChemiSciences, Warsaw, Poland~1996.05!
3.14. Methanol 1 Water 12,2,4-Trimethylpentane
Critical Evaluation:
A survey of reported compositions along the saturation curve~sat.! and compositions of coexisting phases in
system methanol–2,2,4-trimethylpentane–water is given in Table 15.
TABLE 15. Summary of experimental data for the system methanol–2,2,4-trimethylpenta
Author~s! T/K Type of dataa
Buchowski and Teperek, 1959 291, 293 sat.~21!, eq. ~18!
Budantsevaet al., 1976 293 eq.~6!
aNumber of experimental points in parentheses.
Saturation curve
The system methanol–2,2,4-trimethylpentane–water forms a large miscibility gap of type 2 covering the
triangle. Two binary systems 2,2,4-trimethylpentane–water and 2,2,4-trimethylpentane–methanol are p
these systems were compiled and critically evaluated in previously, published SDS volumes, Refs. 3 and
mutual solubility of 2,2,4-trimethylpentane–water system, Ref. 3, and methanol–2,2,4-trimethylpentane
x2850.9995,x2953•1027 and x2850.890,x2950.224, respectively.~The mutual solubilities of methanol–2,2,4-t
reported in both papers1,2 were also considered during evaluation of this binary system in Ref. 4.! Compositions alo
at 291.2 and 293.2 K by Buchowski and Teperek1 were obtained by the titration method. They are consistent w
as with one another. The paper of Budantsevaet al.2 contains information about phases in equilibrium at 293.2
poor phase shows smaller miscibility while the hydrocarbon-rich phase shows larger solubility2 than data of Ref.
ture and than the ‘‘best’’ binary solubilities by Ref. 4. The data of Buchowski and Teperek1 were well documen
method, description of pure substances properties and purity! while data of Ref. 2 were reported without an
Therefore data of Ref. 1 appear reliable, but all are considered as tentative.
Phases in equilibrium
Compositions of coexisting phases in equilibrium for the ternary system methanol–2,2,4-trimethylpe
both references. Tie lines cover nearly the whole range of miscibility gap. In the paper of Buchowsk
hydrocarbon-rich phase did not contain detectable water~water concentration in the hydrocarbon-rich phas
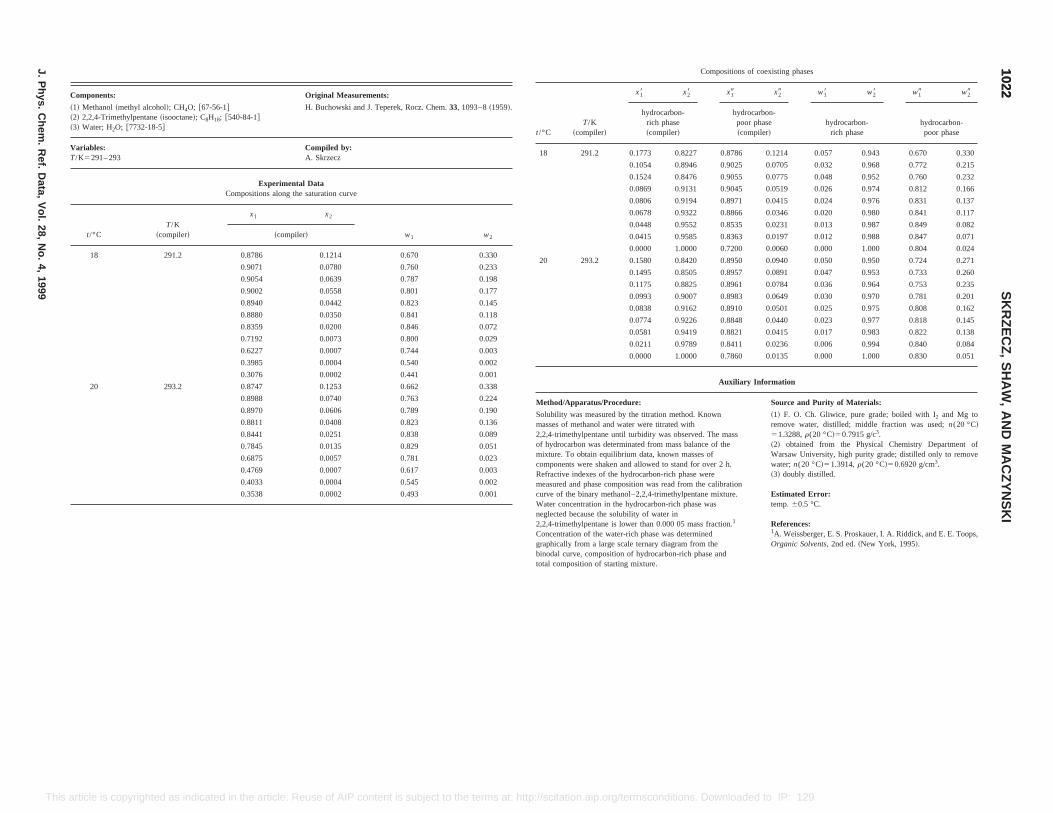
Compositions of coexisting phases
T/Kompiler!
x18 x28 x19 x29 w18 w28 w19 w29
hydrocarbon-rich phase~compiler!
hydrocarbon-poor phase~compiler!
hydrocarbon-rich phase
hydrocarbon-poor phase
291.2 0.1773 0.8227 0.8786 0.1214 0.057 0.943 0.670 0.330
0.1054 0.8946 0.9025 0.0705 0.032 0.968 0.772 0.215
0.1524 0.8476 0.9055 0.0775 0.048 0.952 0.760 0.232
0.0869 0.9131 0.9045 0.0519 0.026 0.974 0.812 0.166
0.0806 0.9194 0.8971 0.0415 0.024 0.976 0.831 0.137
0.0678 0.9322 0.8866 0.0346 0.020 0.980 0.841 0.117
0.0448 0.9552 0.8535 0.0231 0.013 0.987 0.849 0.082
0.0415 0.9585 0.8363 0.0197 0.012 0.988 0.847 0.071
0.0000 1.0000 0.7200 0.0060 0.000 1.000 0.804 0.024
293.2 0.1580 0.8420 0.8950 0.0940 0.050 0.950 0.724 0.271
0.1495 0.8505 0.8957 0.0891 0.047 0.953 0.733 0.260
0.1175 0.8825 0.8961 0.0784 0.036 0.964 0.753 0.235
0.0993 0.9007 0.8983 0.0649 0.030 0.970 0.781 0.201
0.0838 0.9162 0.8910 0.0501 0.025 0.975 0.808 0.162
0.0774 0.9226 0.8848 0.0440 0.023 0.977 0.818 0.145
0.0581 0.9419 0.8821 0.0415 0.017 0.983 0.822 0.138
0.0211 0.9789 0.8411 0.0236 0.006 0.994 0.840 0.084
0.0000 1.0000 0.7860 0.0135 0.000 1.000 0.830 0.051
Auxiliary Information
aratus/Procedure: Source and Purity of Materials:
s measured by the titration method. Knownethanol and water were titrated withylpentane until turbidity was observed. The masson was determinated from mass balance of theobtain equilibrium data, known masses ofwere shaken and allowed to stand for over 2 h.dexes of the hydrocarbon-rich phase werend phase composition was read from the calibrationbinary methanol–2,2,4-trimethylpentane mixture.ntration in the hydrocarbon-rich phase was
ecause the solubility of water inylpentane is lower than 0.000 05 mass fraction.1
Concentration of the water-rich phase was determinedgraphically from a large scale ternary diagram from thebinodal curve, composition of hydrocarbon-rich phase andtotal composition of starting mixture.
~1! F. O. Ch. Gliwice, pure grade; boiled with I2 and Mg toremove water, distilled; middle fraction was used;n(20 °C!51.3288,r(20 °C!50.7915 g/c3.~2! obtained from the Physical Chemistry Department ofWarsaw University, high purity grade; distilled only to removewater;n(20 °C!51.3914,r(20 °C!50.6920 g/cm3.~3! doubly distilled.
Estimated Error:temp.60.5 °C.
References:1A. Weissberger, E. S. Proskauer, I. A. Riddick, and E. E. Toops,Organic Solvents, 2nd ed.~New York, 1995!.
10221022
SK
RZ
EC
Z,
SH
AW
,A
ND
MA
CZ
YN
SK
I
J.P
hys.C
hem.
Ref.
Data,
Vol.
28,N
o.4,
1999
This ttp://scitation.aip.org/termsconditions. Downloaded to IP: 129.6.105.191 On: Fri, 05 Sep 2014 17:51:55
article is copyrighted as indicated in the article. Reuse of AIP content is subject to the terms at: hComponents: Original Measurements:
~1! Methanol~methyl alcohol!; CH4O; @67-56-1#~2! 2,2,4-Trimethylpentane~isooctane!; C8H18; @540-84-1#~3! Water; H2O; @7732-18-5#
H. Buchowski and J. Teperek, Rocz. Chem.33, 1093–8~1959!.
Variables:T/K5291– 293
Compiled by:A. Skrzecz
Experimental DataCompositions along the saturation curve
t/°CT/K
~compiler!
x1 x2
w1 w2~compiler!
18 291.2 0.8786 0.1214 0.670 0.330
0.9071 0.0780 0.760 0.233
0.9054 0.0639 0.787 0.198
0.9002 0.0558 0.801 0.177
0.8940 0.0442 0.823 0.145
0.8880 0.0350 0.841 0.118
0.8359 0.0200 0.846 0.072
0.7192 0.0073 0.800 0.029
0.6227 0.0007 0.744 0.003
0.3985 0.0004 0.540 0.002
0.3076 0.0002 0.441 0.001
20 293.2 0.8747 0.1253 0.662 0.338
0.8988 0.0740 0.763 0.224
0.8970 0.0606 0.789 0.190
0.8811 0.0408 0.823 0.136
0.8441 0.0251 0.838 0.089
0.7845 0.0135 0.829 0.051
0.6875 0.0057 0.781 0.023
0.4769 0.0007 0.617 0.003
0.4033 0.0004 0.545 0.002
0.3538 0.0002 0.493 0.001
t/°C ~c
18
20
Method/App
Solubility wamasses of m2,2,4-trimethof hydrocarbmixture. TocomponentsRefractive inmeasured acurve of theWater conceneglected b2,2,4-trimeth

Evaluated by:
A. Skrzecz, Institute of Physical Chemistry, Polish Academy ofSciences, Warsaw, Poland~1996.04!
ater 1 Octaneluation:ve and compositions of coexisting phases in equilibrium~eq.! for the
ta for the system methanol–octane–water
Type of dataa Ref.
eq.~12! 1
eq.~10! 2
n curve
miscibility gap of type 2 covering the majority of the concentration
eported independently in the references; the saturation curves can be
ry systems, octane–water and octane–methanol, form miscibility gaps.
d in previously published SDS volumes, Refs. 3 and 4, respectively. The
ter system at 293 K4 are: x2959.9•1028 and x2850.9995. The mutual
1850.105. The binary data reported by Budantsevaet al.2 are:x29
quilibrium
ary system methanol–octane–water were reported in both references.
paration, methanol was determined by reaction with phthalic anhydride;
ses in equilibrium reported in Refs. 1 and 2 are consistent with one
presented in Fig. 9.
FIG. 9. Phase diagram of the system methanol~1!—octane~2!—water ~3! at 293.2 K.s—experimental data, Ref. 1,h—experimentaldata, Ref. 2, dashed lines—experimental tie lines, Ref. 2.
10231023
IUP
AC
-NIS
TS
OLU
BILIT
YD
AT
AS
ER
IESJ.P
hys.C
hem.
Ref.
Data,
Vol.
28,N
o.4,
1999
This t: http://scitation.aip.org/termsconditions. Downloaded to IP: 129.6.105.191 On: Fri, 05 Sep 2014 17:51:55
article is copyrighted as indicated in the article. Reuse of AIP content is subject to the terms aComponents: Original Measurements:
~1! Methanol~methyl alcohol!; CH4O; @67-56-1#~2! 2,2,4-Trimethylpentane~isooctane!; C8H18; @540-84-1#~3! Water; H2O; @7732-18-5#
L. S. Budantseva, T. M. Lesteva, and M. S. Nemtsov, Dep. Doc.VINITI 437–76, 1–13~1976!.
Variables:T/K5293
Compiled by:A. Skrzecz
Experimental DataCompositions of coexisting phases
t/°CT/K
~compiler!
x18 x28 x19 x29 w18 w28 w19 w29
hydrocarbon-rich phase
hydrocarbon-poor phase
hydrocarbon-rich phase~compiler!
hydrocarbon-poor phase~compiler!
20 293.2 0.0000 0.999 56 0.0000 0.000 000 3 0.0000 0.999 931 0.0000 0.000 002
0.0162 0.9831 0.4855 0.0002 0.0046 0.9953 0.6262 0.0009
0.0414 0.9579 0.7456 0.0043 0.0120 0.9879 0.8270 0.0170
0.0836 0.9152 0.8636 0.0180 0.0250 0.9748 0.8685 0.0645
0.1493 0.8490 0.9158 0.0411 0.0470 0.9527 0.8428 0.1349
0.2460 0.7540 0.9220 0.0780 0.0838 0.9162 0.7683 0.2317
Auxiliary Information
Method/Apparatus/Procedure: Source and Purity of Materials:
The method was described in Ref. 1. No more details werereported in the paper.
~1! source not specified.~2! source not specified.~3! not specified.
Estimated Error:Not reported.
References:1L. S. Budantseva, T. M. Lesteva, and M. S. Nemtsov, Zh. Fiz.Khim. 49, 1849~1975!.
Components:
~1! Methanol~methyl alcohol!; CH4O; @67-56-1#~2! Octane~n-octane!; C8H18; @111-65-9#~3! Water; H2O; @7732-18-5#
3.15. Methanol 1 WCritical Eva
A survey of reported compositions along the saturation cur
system methanol–octane–water is given in Table 16.
TABLE 16. Summary of experimental da
Author~s! T/K
Koganet al., 1956 283, 293
Budantsevaet al., 1976 293
aNumber of experimental points in parentheses.
Saturatio
The ternary system methanol–octane–water forms a large
triangle. Compositions along the saturation curves were not r
constructed on the bases of equilibrium compositions. Two bina
The data for these systems were compiled and critically evaluate
recommended, Ref. 3, values of mutual solubility of octane–wa
solubility of methanol–octane system at 293 K,4 are:x1950.944 andx
52.0•1027, x2850.999 57 andx1950.960,x1850.155, respectively.
Phases in e
Compositions of coexisting phases in equilibrium for the tern
The experimental procedure was reported only in Ref. 1. After se
water—with the Karl Fischer reagent. The compositions of pha
another, they are treated as tentative and those at 293.2 K are
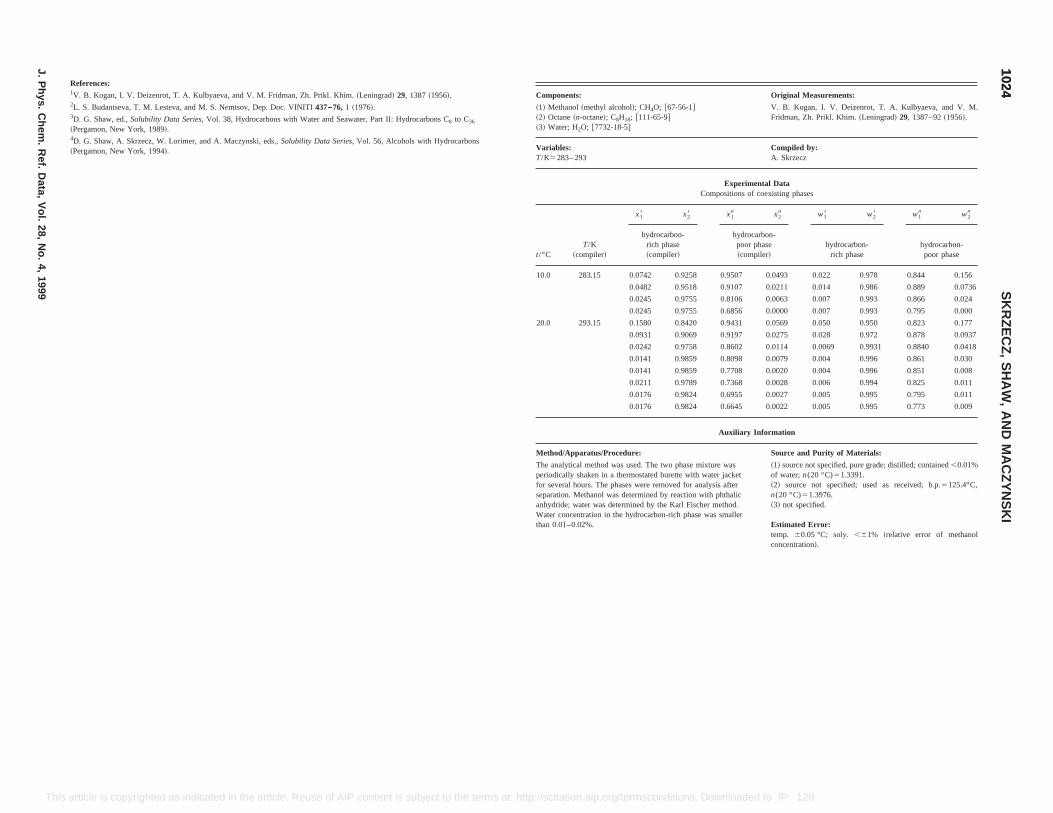
nents: Original Measurements:
hanol~methyl alcohol!; CH4O; @67-56-1#ane~n-octane!; C8H18; @111-65-9#er; H2O; @7732-18-5#
V. B. Kogan, I. V. Deizenrot, T. A. Kulbyaeva, and V. M.Fridman, Zh. Prikl. Khim.~Leningrad! 29, 1387–92~1956!.
es:83– 293
Compiled by:A. Skrzecz
Experimental DataCompositions of coexisting phases
T/K~compiler!
x18 x28 x19 x29 w18 w28 w19 w29
hydrocarbon-rich phase~compiler!
hydrocarbon-poor phase~compiler!
hydrocarbon-rich phase
hydrocarbon-poor phase
283.15 0.0742 0.9258 0.9507 0.0493 0.022 0.978 0.844 0.156
0.0482 0.9518 0.9107 0.0211 0.014 0.986 0.889 0.0736
0.0245 0.9755 0.8106 0.0063 0.007 0.993 0.866 0.024
0.0245 0.9755 0.6856 0.0000 0.007 0.993 0.795 0.000
293.15 0.1580 0.8420 0.9431 0.0569 0.050 0.950 0.823 0.177
0.0931 0.9069 0.9197 0.0275 0.028 0.972 0.878 0.0937
0.0242 0.9758 0.8602 0.0114 0.0069 0.9931 0.8840 0.0418
0.0141 0.9859 0.8098 0.0079 0.004 0.996 0.861 0.030
0.0141 0.9859 0.7708 0.0020 0.004 0.996 0.851 0.008
0.0211 0.9789 0.7368 0.0028 0.006 0.994 0.825 0.011
0.0176 0.9824 0.6955 0.0027 0.005 0.995 0.795 0.011
0.0176 0.9824 0.6645 0.0022 0.005 0.995 0.773 0.009
Auxiliary Information
/Apparatus/Procedure: Source and Purity of Materials:
alytical method was used. The two phase mixture wasally shaken in a thermostated burette with water jacket
eral hours. The phases were removed for analysis aftertion. Methanol was determined by reaction with phthalicide; water was determined by the Karl Fischer method.oncentration in the hydrocarbon-rich phase was smaller
01–0.02%.
~1! source not specified, pure grade; distilled; contained,0.01%of water;n(20 °C)51.3391.~2! source not specified; used as received; b.p.5125.4°C,n(20 °C)51.3976.~3! not specified.
Estimated Error:temp. 60.05 °C; soly. ,61% ~relative error of methanolconcentration!.
10241024
SK
RZ
EC
Z,
SH
AW
,A
ND
MA
CZ
YN
SK
I
J.P
hys.C
hem.
Ref.
Data,
Vol.
28,N
o.4,
1999
This s indicated in the article. Reuse of AIP content is subject to the terms at: http://scitation.aip.org/termsconditions. Downloaded to IP: 129.6.105.191 On: Fri, 05 Sep 2014 17:51:55
article is copyrighted aReferences:1V. B. Kogan, I. V. Deizenrot, T. A. Kulbyaeva, and V. M. Fridman, Zh. Prikl. Khim.~Leningrad! 29, 1387~1956!.2L. S. Budantseva, T. M. Lesteva, and M. S. Nemtsov, Dep. Doc. VINITI437–76, 1 ~1976!.3D. G. Shaw, ed.,Solubility Data Series,Vol. 38, Hydrocarbons with Water and Seawater, Part II: Hydrocarbons C8 to C36
~Pergamon, New York, 1989!.4D. G. Shaw, A. Skrzecz, W. Lorimer, and A. Maczynski, eds.,Solubility Data Series, Vol. 56, Alcohols with Hydrocarbons~Pergamon, New York, 1994!.
Compo
~1! Met~2! Oct~3! Wat
VariablT/K52
t/°C
10.0
20.0
Method
The anperiodicfor sevseparaanhydrWater cthan 0.
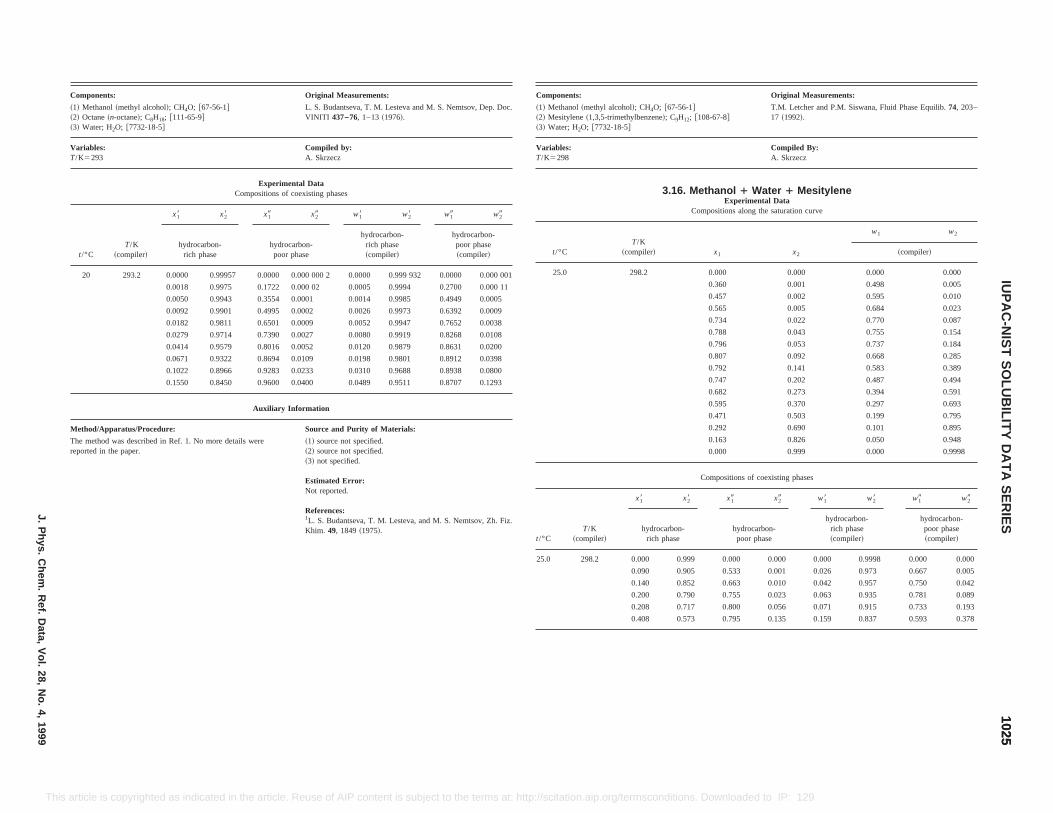
Khim. 49, 1849~1975!.
Original Measurements:
H4O; @67-56-1#nzene!; C9H12; @108-67-8#
T.M. Letcher and P.M. Siswana, Fluid Phase Equilib.74, 203–17 ~1992!.
Compiled By:A. Skrzecz
3.16. Methanol 1 Water 1 MesityleneExperimental Data
Compositions along the saturation curve
ler! x1 x2
w1 w2
~compiler!
2 0.000 0.000 0.000 0.000
0.360 0.001 0.498 0.005
0.457 0.002 0.595 0.010
0.565 0.005 0.684 0.023
0.734 0.022 0.770 0.087
0.788 0.043 0.755 0.154
0.796 0.053 0.737 0.184
0.807 0.092 0.668 0.285
0.792 0.141 0.583 0.389
0.747 0.202 0.487 0.494
0.682 0.273 0.394 0.591
0.595 0.370 0.297 0.693
0.471 0.503 0.199 0.795
0.292 0.690 0.101 0.895
0.163 0.826 0.050 0.948
0.000 0.999 0.000 0.9998
Compositions of coexisting phases
T/K~compiler!
x28 x19 x29 w18 w28 w19 w29
hydrocarbon-rich phase
hydrocarbon-poor phase
hydrocarbon-rich phase~compiler!
hydrocarbon-poor phase~compiler!
298.2 0.000 0.999 0.000 0.000 0.000 0.9998 0.000 0.000
0.090 0.905 0.533 0.001 0.026 0.973 0.667 0.005
0.140 0.852 0.663 0.010 0.042 0.957 0.750 0.042
0.200 0.790 0.755 0.023 0.063 0.935 0.781 0.089
0.208 0.717 0.800 0.056 0.071 0.915 0.733 0.193
0.408 0.573 0.795 0.135 0.159 0.837 0.593 0.378
10251025
IUP
AC
-NIS
TS
OLU
BILIT
YD
AT
AS
ER
IESJ.P
hys.C
hem.
Ref.
Data,
Vol.
28,N
o.4,
1999
This itation.aip.org/termsconditions. Downloaded to IP: 129.6.105.191 On: Fri, 05 Sep 2014 17:51:55
t/°C
25.0
article is copyrighted as indicated in the article. Reuse of AIP content is subject to the terms at: http://sc
Components: Original Measurements:
~1! Methanol~methyl alcohol!; CH4O; @67-56-1#~2! Octane~n-octane!; C8H18; @111-65-9#~3! Water; H2O; @7732-18-5#
L. S. Budantseva, T. M. Lesteva and M. S. Nemtsov, Dep. Doc.VINITI 437–76, 1–13~1976!.
Variables:T/K5293
Compiled by:A. Skrzecz
Experimental DataCompositions of coexisting phases
t/°CT/K
~compiler!
x18 x28 x19 x29 w18 w28 w19 w29
hydrocarbon-rich phase
hydrocarbon-poor phase
hydrocarbon-rich phase~compiler!
hydrocarbon-poor phase~compiler!
20 293.2 0.0000 0.99957 0.0000 0.000 000 2 0.0000 0.999 932 0.0000 0.000 001
0.0018 0.9975 0.1722 0.000 02 0.0005 0.9994 0.2700 0.000 11
0.0050 0.9943 0.3554 0.0001 0.0014 0.9985 0.4949 0.0005
0.0092 0.9901 0.4995 0.0002 0.0026 0.9973 0.6392 0.0009
0.0182 0.9811 0.6501 0.0009 0.0052 0.9947 0.7652 0.0038
0.0279 0.9714 0.7390 0.0027 0.0080 0.9919 0.8268 0.0108
0.0414 0.9579 0.8016 0.0052 0.0120 0.9879 0.8631 0.0200
0.0671 0.9322 0.8694 0.0109 0.0198 0.9801 0.8912 0.0398
0.1022 0.8966 0.9283 0.0233 0.0310 0.9688 0.8938 0.0800
0.1550 0.8450 0.9600 0.0400 0.0489 0.9511 0.8707 0.1293
Auxiliary Information
Method/Apparatus/Procedure: Source and Purity of Materials:
The method was described in Ref. 1. No more details werereported in the paper.
~1! source not specified.~2! source not specified.~3! not specified.
Estimated Error:Not reported.
References:1L. S. Budantseva, T. M. Lesteva, and M. S. Nemtsov, Zh. Fiz.
Components:
~1! Methanol~methyl alcohol!; C~2! Mesitylene~1,3,5-trimethylbe~3! Water; H2O; @7732-18-5#
Variables:T/K5298
t/°CT/K
~compi
25.0 298.
x18
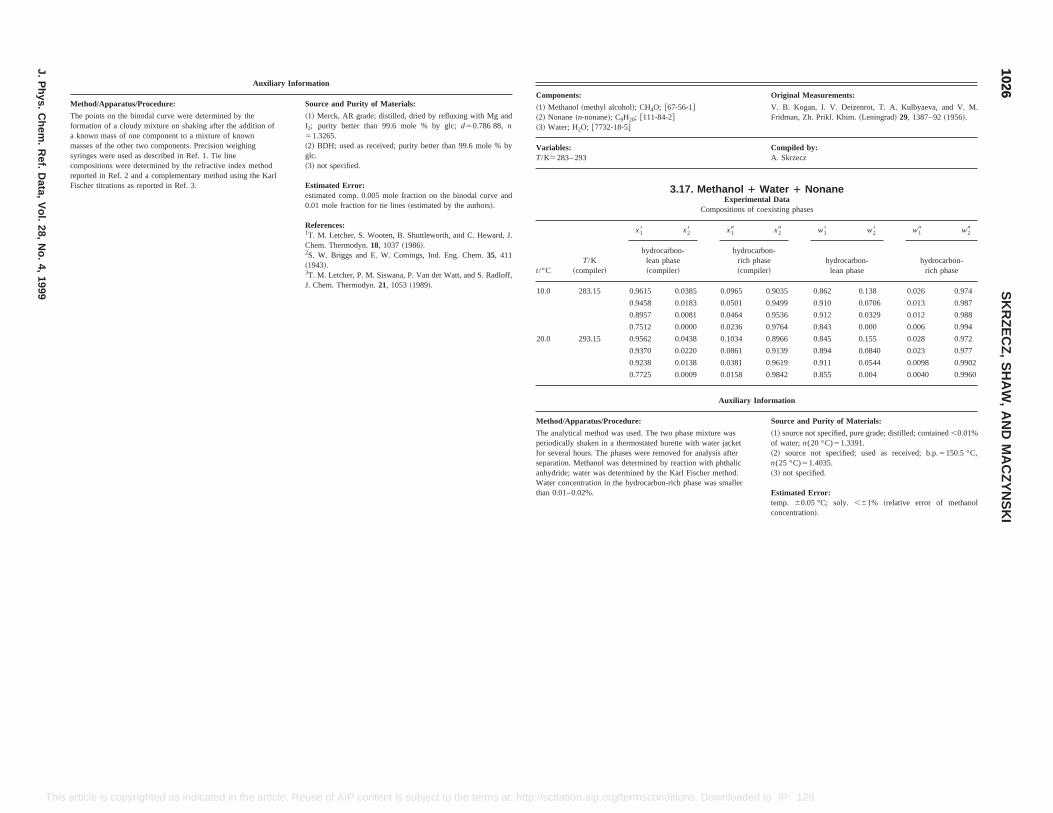
d
.
,
Components: Original Measurements:
~1! Methanol~methyl alcohol!; CH4O; @67-56-1#~2! Nonane~n-nonane!; C9H20; @111-84-2#~3! Water; H2O; @7732-18-5#
V. B. Kogan, I. V. Deizenrot, T. A. Kulbyaeva, and V. M.Fridman, Zh. Prikl. Khim.~Leningrad! 29, 1387–92~1956!.
Variables:T/K5283– 293
Compiled by:A. Skrzecz
3.17. Methanol 1 Water 1 NonaneExperimental Data
Compositions of coexisting phases
t/°CT/K
~compiler!
x18 x28 x19 x29 w18 w28 w19 w29
hydrocarbon-lean phase~compiler!
hydrocarbon-rich phase~compiler!
hydrocarbon-lean phase
hydrocarbon-rich phase
10.0 283.15 0.9615 0.0385 0.0965 0.9035 0.862 0.138 0.026 0.974
0.9458 0.0183 0.0501 0.9499 0.910 0.0706 0.013 0.987
0.8957 0.0081 0.0464 0.9536 0.912 0.0329 0.012 0.988
0.7512 0.0000 0.0236 0.9764 0.843 0.000 0.006 0.994
20.0 293.15 0.9562 0.0438 0.1034 0.8966 0.845 0.155 0.028 0.972
0.9370 0.0220 0.0861 0.9139 0.894 0.0840 0.023 0.977
0.9238 0.0138 0.0381 0.9619 0.911 0.0544 0.0098 0.9902
0.7725 0.0009 0.0158 0.9842 0.855 0.004 0.0040 0.9960
Auxiliary Information
Method/Apparatus/Procedure: Source and Purity of Materials:
The analytical method was used. The two phase mixture wasperiodically shaken in a thermostated burette with water jacketfor several hours. The phases were removed for analysis afterseparation. Methanol was determined by reaction with phthalicanhydride; water was determined by the Karl Fischer method.Water concentration in the hydrocarbon-rich phase was smallerthan 0.01–0.02%.
~1! source not specified, pure grade; distilled; contained,0.01%of water;n(20 °C)51.3391.~2! source not specified; used as received; b.p.5150.5 °C,n(25 °C)51.4035.~3! not specified.
Estimated Error:temp. 60.05 °C; soly. ,61% ~relative error of methanolconcentration!.
10261026
SK
RZ
EC
Z,
SH
AW
,A
ND
MA
CZ
YN
SK
I
J.P
hys.C
hem.
Ref.
Data,
Vol.
28,N
o.4,
1999
This e of AIP content is subject to the terms at: http://scitation.aip.org/termsconditions. Downloaded to IP: 129.6.105.191 On: Fri, 05 Sep 2014 17:51:55
article is copyrighted as indicated in the article. ReusAuxiliary Information
Method/Apparatus/Procedure: Source and Purity of Materials:
The points on the binodal curve were determined by theformation of a cloudy mixture on shaking after the addition ofa known mass of one component to a mixture of knownmasses of the other two components. Precision weighingsyringes were used as described in Ref. 1. Tie linecompositions were determined by the refractive index methodreported in Ref. 2 and a complementary method using the KarlFischer titrations as reported in Ref. 3.
~1! Merck, AR grade; distilled, dried by refluxing with Mg andI2; purity better than 99.6 mole % by glc;d50.786 88, n51.3265.~2! BDH; used as received; purity better than 99.6 mole % byglc.~3! not specified.
Estimated Error:estimated comp. 0.005 mole fraction on the binodal curve an0.01 mole fraction for tie lines~estimated by the authors!.
References:1T. M. Letcher, S. Wooten, B. Shuttleworth, and C. Heward, JChem. Thermodyn.18, 1037~1986!.2S. W. Briggs and E. W. Comings, Ind. Eng. Chem.35, 411~1943!.3T. M. Letcher, P. M. Siswana, P. Van der Watt, and S. RadloffJ. Chem. Thermodyn.21, 1053~1989!.

— — 0.5184 0.4457 — — 0.206 0.786
l 1Water
Evaluated by:
A. Skrzecz, Institute of Physical Chemistry, Polish Academy ofSciences, Warsaw, Poland~1997.05!
ater 1 Benzenevaluation:urve~sat.!, compositions of coexisting phases in equilibrium~eq.! andnol–benzene–water is given in Table 17.
data for the system ethanol–benzene–water
Type of dataa Ref.
sat.~14!, eq. ~6! 1
sat.~13! 2
sat.~12! 3
sat.~1! 4
98 sat.~32! 5
03 sat.~33! 6
sat.~11! 7
sat.~9! 8
38 sat.~26!, eq. ~13! 9
6 sat.~7! 10
42 eq.~6! 11
sat.~16!, distr. ~9! 12
eq.~6! 13
sat.~7! 14
sat.~10!, eq. ~14! 15
sat.~4!, eq. ~12! 16
2 sat.~45! 17
sat.~12!, eq. ~11! 18
337 eq.~35! 19
sat.~20!, distr. ~12! 20
eq.~9! 21
Brandaniet al., 1985 303–328 eq.~34! 22
sat.~13!, eq. ~5! 23
turation curveiscibility gap of type 1. Data for the system were reported in 23 references over
ed on the basis of the original papers. Only one binary system, benzene–water,iled and critically evaluated in a previously published SDS volume, Ref. 24.are2850.9975,x2950.000 406; at 298 K2x2850.9970,x2950.000 409 and atrbaudy, Ref. 9 at 333.2 K reported mutual solubility of the binary system:recommended values, Ref. 24. The results of Taylor,1 Lincon,2 Perrakis,7
eported as compilation tables. The data of Taylor1 and Lincon2 at 298.2 Ktios. These data were recalculated to mole fractions, and they were taken intother data sets at the same temperature. Data of Perrakis7 at 294 K present a3 K and therefore these data are rejected as are other alcohol–benzene–water
ozhentseva13 were obtained for this evaluation from Tarasenkov and Paulsen.25
m ethanol concentration of about 0.03 mole fraction of C2H5OH! which isasonable large solubility of water in benzene~solubility of benzene in water.94!. Therefore, this data set is rejected. All experimental data of Letcher
10271027
IUP
AC
-NIS
TS
OLU
BILIT
YD
AT
AS
ER
IESJ.P
hys.C
hem.
Ref.
Data,
Vol.
28,N
o.4,
1999
This ded to IP: 129.6.105.191 On: Fri, 05 Sep 2014 17:51:55
— — 0.4506 0.5494 — — 0.156 0.844
0.2021 0.7979 — — 0.054 0.946 — —
0.3376 0.6624 — — 0.103 0.897 — —
Auxiliary Information
Method/Apparatus/Procedure: Source and Purity of Materials:
The analytical method was used. Samples in 4 oz. oil samplebottles were agitated in a constant temperature bath for at least12 h before phase separation. Samples of each phase weretaken for analysis by a rubber bulb pipette. Water wasdetermined by the Karl Fischer reagent, hydrocarbons as thecaustic-insoluble fraction, methanol–by the difference.
~1! Barker C.P. analyzed absolute; purity 99.5%; water-free bythe Karl Fischer.~2! ~a! Eastman Kodak Co.; distillation range 238–240 °C,contained about 5% of 2-methylnaphtalene isomer.~b! preparedin the laboratory from the crude material; extracted with NaOHaq., refluxed with Na, distilled; fraction boiling at 240 °C wascollected; contained about 10% of 2-methylnaphtalene isomer.~3! not specified.
Estimated Error:temp.6 0.01 °C.
Letcheret al., 1990 298
aNumber of experimental points in parentheses.
SaThe ternary system ethanol–benzene–water forms a m
the temperature range 263–342 K. The system is evaluatis partially miscible. The data for this system were compThese recommended values of mutual solubility at 293 Kx333 K2x2850.991 04,x2950.000 534. Only the paper of Bax2850.9893 andx2950.0005. This is in agreement with theTarasenkov and Polozhentseva,13 and Letcheret al.23 are not rpublished at 1896 and 1899, were reported as volume raaccount for this evaluation; they are in agreement with osignificantly larger miscibility gap than any other data at 29systems presented in Ref. 7. Data of Tarasenkov and PolThese data present a much smaller miscibility gap~at maximuinconsistent with all other experimental data and an unreestimated on the basis of these data seems to rech valuex2950
article is copyrighted as indicated in the article. Reuse of AIP content is subject to the terms at: http://scitation.aip.org/termsconditions. Downloa
Components: Original Measurements
~1! Methanol~methyl alcohol!; CH4O; @67-56-1#~2! 1-Methylnaphthalene; C11H10; @90-12-0#~3! Water; H2O; @7732-18-5#
C. F. Prutton, T. J. Walsh, and A. M. Desai, Ind. Eng. Chem.42,1210–7~1950!.
Variables:T/K5298 and 308
Compiled by:A. Skrzecz
3.18. Methanol 1 Water 1 1-MethylnaphthaleneExperimental Data
Compositions of coexisting phases
t/°CT/K
~compiler!
x18 x28 x19 x29 w18 w28 w19 w29
hydrocarbon-rich phase~compiler!
water-rich phase~compiler!
hydrocarbon-rich phase
water-rich phase
25.0 298.15 0.0000 1.0000 0.0000 0.0000 0.000 1.000 0.000 0.000
0.0429 0.9571 0.2726 0.0000 0.010 0.990 0.400 0.000
0.0511 0.9489 0.3957 0.0000 0.012 0.988 0.538 0.000
0.0752 0.9248 0.6273 0.0058 0.018 0.982 0.730 0.030
0.1022 0.8978 0.6928 0.0134 0.025 0.975 0.755 0.065
0.1207 0.8793 0.7356 0.0242 0.030 0.970 0.752 0.110
— — 0.8023 0.0487 — — 0.728 0.196
— — 0.8173 0.0555 — — 0.720 0.217
— — 0.7973 0.1196 — — 0.580 0.386
— — 0.7910 0.1507 — — 0.530 0.448
35.0 308.15 0.0000 1.0000 0.0000 0.0000 0.000 1.000 0.000 0.000
0.0511 0.9489 0.3957 0.0000 0.012 0.988 0.538 0.000
0.0752 0.9248 0.6229 0.0078 0.018 0.982 0.720 0.040
0.1022 0.8978 0.6885 0.0156 0.025 0.975 0.745 0.075
— — 0.7118 0.0188 — — 0.752 0.088
— — 0.7741 0.0389 — — 0.736 0.164
— — 0.7948 0.0552 — — 0.707 0.218
— — 0.7993 0.0824 — — 0.649 0.297
— — 0.7934 0.1189 — — 0.579 0.385
— — 0.7390 0.1915 — — 0.454 0.522
— — 0.6184 0.3223 — — 0.297 0.687
4. Ethano
Components:
~1! Ethanol~ethyl alcohol!; C2H6O; @64-17-5#~2! Benzene; C6H6; @71-43-2#~3! Water; H2O; @7732-18-5#
4.1. Ethanol 1 WCritical E
A survey of reported compositions along the saturation cdistribution of ethanol between phases~distr.! for the system etha
TABLE 17. Summary of experimental
Author~s! T/K
Taylor, 1896 298
Lincoln, 1899 298
Bonner, 1909 288
Holmes, 1918 288
Sidgwick and Spurrell, 1920 273–2
Wehrmann, 1921 263–3
Perrakis, 1925 294
Barbaudy, 1926 298
Barbaudy, 1926 298–3
Wright, 1926 284–29
Barbaudy, 1927 338–3
Washburnet al., 1931 298
Tarasenkov and Polozhentseva, 1932 293
Sata and Kimura, 1935 303
Varteressian and Fenske, 1936 298
Bancroft and Hubard, 1942 298
Staveleyet al., 1951 274–34
Chang and Moulton, 1953 298
Morachevskii and Belousov, 1958 293–
Mertslin et al., 1961 299
Ross and Patterson, 1979 293
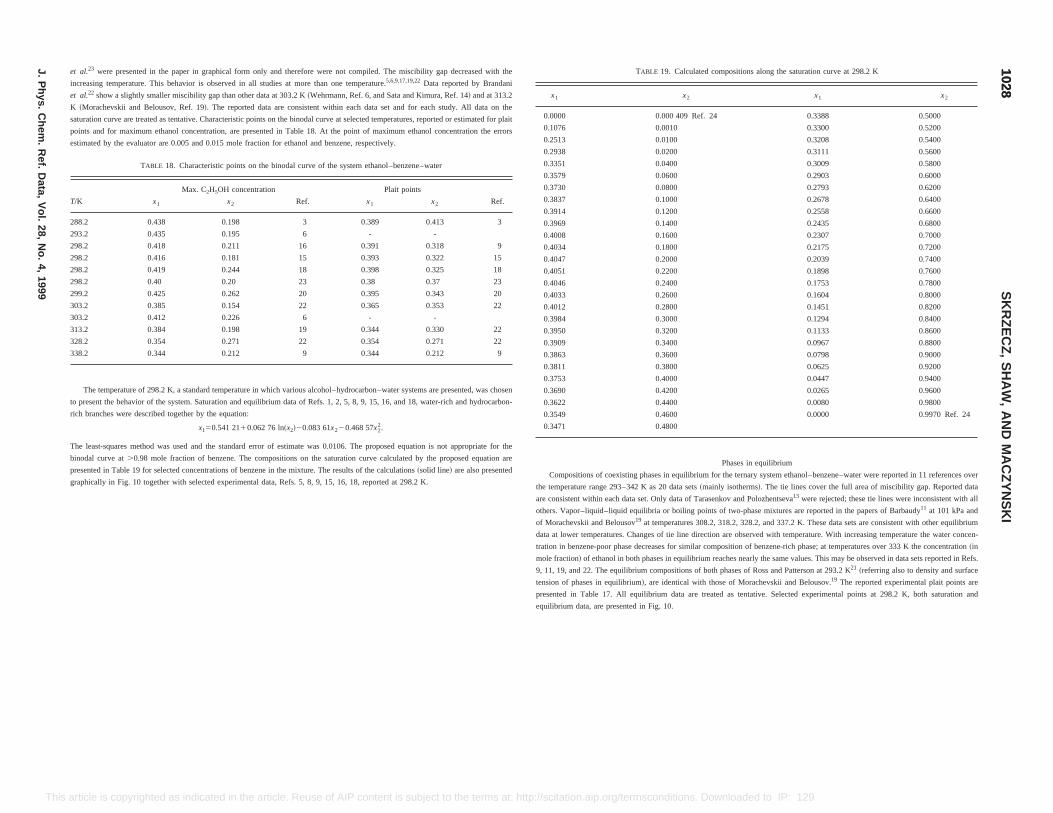
TABLE 19. Calculated compositions along the saturation curve at 298.2 K
x2 x1 x2
0.000 409 Ref. 24 0.3388 0.5000
0.0010 0.3300 0.5200
0.0100 0.3208 0.5400
0.0200 0.3111 0.5600
0.0400 0.3009 0.5800
0.0600 0.2903 0.6000
0.0800 0.2793 0.6200
0.1000 0.2678 0.6400
0.1200 0.2558 0.6600
0.1400 0.2435 0.6800
0.1600 0.2307 0.7000
0.1800 0.2175 0.7200
0.2000 0.2039 0.7400
0.2200 0.1898 0.7600
0.2400 0.1753 0.7800
0.2600 0.1604 0.8000
0.2800 0.1451 0.8200
0.3000 0.1294 0.8400
0.3200 0.1133 0.8600
0.3400 0.0967 0.8800
0.3600 0.0798 0.9000
0.3800 0.0625 0.9200
0.4000 0.0447 0.9400
0.4200 0.0265 0.9600
0.4400 0.0080 0.9800
0.4600 0.0000 0.9970 Ref. 24
0.4800
Phases in equilibrium
sting phases in equilibrium for the ternary system ethanol–benzene–water were reported in 11 references over
3–342 K as 20 data sets~mainly isotherms!. The tie lines cover the full area of miscibility gap. Reported data
data set. Only data of Tarasenkov and Polozhentseva13 were rejected; these tie lines were inconsistent with all
d equilibria or boiling points of two-phase mixtures are reported in the papers of Barbaudy11 at 101 kPa and
sov19 at temperatures 308.2, 318.2, 328.2, and 337.2 K. These data sets are consistent with other equilibrium
data at lower temperatures. Changes of tie line direction are observed with temperature. With increasing temperature the water concen-
tration in benzene-poor phase decreases for similar composition of benzene-rich phase; at temperatures over 333 K the concentration~in
mole fraction! of ethanol in both phases in equilibrium reaches nearly the same values. This may be observed in data sets reported in Refs.
9, 11, 19, and 22. The equilibrium compositions of both phases of Ross and Patterson at 293.2 K21 ~referring also to density and surface
tension of phases in equilibrium!, are identical with those of Morachevskii and Belousov.19 The reported experimental plait points are
presented in Table 17. All equilibrium data are treated as tentative. Selected experimental points at 298.2 K, both saturation and
equilibrium data, are presented in Fig. 10.
10281028
SK
RZ
EC
Z,
SH
AW
,A
ND
MA
CZ
YN
SK
I
J.P
hys.C
hem.
Ref.
Data,
Vol.
28,N
o.4,
1999
This t: http://scitation.aip.org/termsconditions. Downloaded to IP: 129.6.105.191 On: Fri, 05 Sep 2014 17:51:55
article is copyrighted as indicated in the article. Reuse of AIP content is subject to the terms aet al.23 were presented in the paper in graphical form only and therefore were not compiled. The miscibility gap decreased with the
increasing temperature. This behavior is observed in all studies at more than one temperature.5,6,9,17,19,22Data reported by Brandani
et al.22 show a slightly smaller miscibility gap than other data at 303.2 K~Wehrmann, Ref. 6, and Sata and Kimura, Ref. 14! and at 313.2
K ~Morachevskii and Belousov, Ref. 19!. The reported data are consistent within each data set and for each study. All data on the
saturation curve are treated as tentative. Characteristic points on the binodal curve at selected temperatures, reported or estimated for plait
points and for maximum ethanol concentration, are presented in Table 18. At the point of maximum ethanol concentration the errors
estimated by the evaluator are 0.005 and 0.015 mole fraction for ethanol and benzene, respectively.
TABLE 18. Characteristic points on the binodal curve of the system ethanol–benzene–water
Max. C2H5OH concentration Plait points
T/K x1 x2 Ref. x1 x2 Ref.
288.2 0.438 0.198 3 0.389 0.413 3
293.2 0.435 0.195 6 - -
298.2 0.418 0.211 16 0.391 0.318 9
298.2 0.416 0.181 15 0.393 0.322 15
298.2 0.419 0.244 18 0.398 0.325 18
298.2 0.40 0.20 23 0.38 0.37 23
299.2 0.425 0.262 20 0.395 0.343 20
303.2 0.385 0.154 22 0.365 0.353 22
303.2 0.412 0.226 6 - -
313.2 0.384 0.198 19 0.344 0.330 22
328.2 0.354 0.271 22 0.354 0.271 22
338.2 0.344 0.212 9 0.344 0.212 9
The temperature of 298.2 K, a standard temperature in which various alcohol–hydrocarbon–water systems are presented, was chosen
to present the behavior of the system. Saturation and equilibrium data of Refs. 1, 2, 5, 8, 9, 15, 16, and 18, water-rich and hydrocarbon-
rich branches were described together by the equation:
x150.541 2110.062 76 ln~x2!20.083 61x220.468 57x22.
The least-squares method was used and the standard error of estimate was 0.0106. The proposed equation is not appropriate for the
binodal curve at.0.98 mole fraction of benzene. The compositions on the saturation curve calculated by the proposed equation are
presented in Table 19 for selected concentrations of benzene in the mixture. The results of the calculations~solid line! are also presented
graphically in Fig. 10 together with selected experimental data, Refs. 5, 8, 9, 15, 16, 18, reported at 298.2 K.
x1
0.0000
0.1076
0.2513
0.2938
0.3351
0.3579
0.3730
0.3837
0.3914
0.3969
0.4008
0.4034
0.4047
0.4051
0.4046
0.4033
0.4012
0.3984
0.3950
0.3909
0.3863
0.3811
0.3753
0.3690
0.3622
0.3549
0.3471
Compositions of coexi
the temperature range 29
are consistent within each
others. Vapor–liquid–liqui
of Morachevskii and Belou
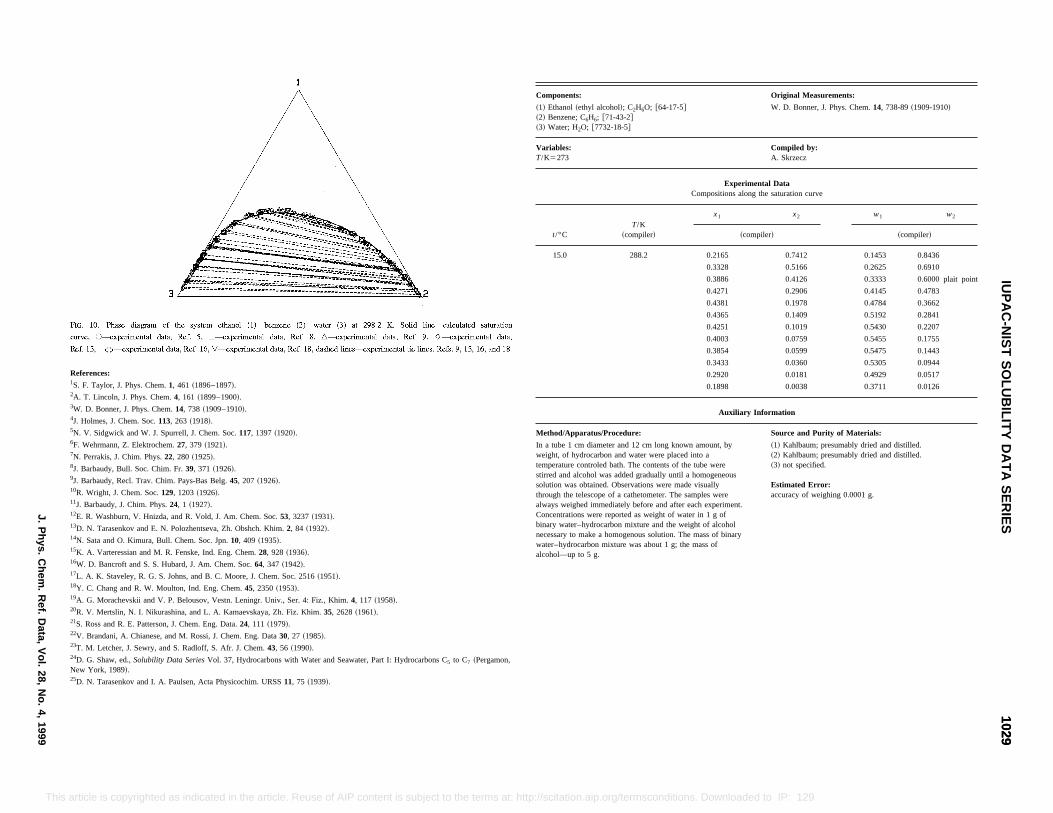
ts: Original Measurements:
l~ethyl alcohol!; C2H6O; @64-17-5#e; C6H6; @71-43-2#H2O; @7732-18-5#
W. D. Bonner, J. Phys. Chem.14, 738-89~1909-1910!
Compiled by:A. Skrzecz
Experimental DataCompositions along the saturation curve
T/K~compiler!
x1 x2 w1 w2
~compiler! ~compiler!
288.2 0.2165 0.7412 0.1453 0.8436
0.3328 0.5166 0.2625 0.6910
0.3886 0.4126 0.3333 0.6000 plait point
0.4271 0.2906 0.4145 0.4783
0.4381 0.1978 0.4784 0.3662
0.4365 0.1409 0.5192 0.2841
0.4251 0.1019 0.5430 0.2207
0.4003 0.0759 0.5455 0.1755
0.3854 0.0599 0.5475 0.1443
0.3433 0.0360 0.5305 0.0944
0.2920 0.0181 0.4929 0.0517
0.1898 0.0038 0.3711 0.0126
Auxiliary Information
paratus/Procedure: Source and Purity of Materials:
cm diameter and 12 cm long known amount, byhydrocarbon and water were placed into ae controled bath. The contents of the tube werealcohol was added gradually until a homogeneouss obtained. Observations were made visually
e telescope of a cathetometer. The samples wereighed immediately before and after each experiment.tions were reported as weight of water in 1 g ofer–hydrocarbon mixture and the weight of alcohol
e mass of binarymass of
~1! Kahlbaum; presumably dried and distilled.~2! Kahlbaum; presumably dried and distilled.~3! not specified.
Estimated Error:accuracy of weighing 0.0001 g.
10291029
IUP
AC
-NIS
TS
OLU
BILIT
YD
AT
AS
ER
IESJ.P
hys.C
hem.
Ref.
Data,
Vol.
28,N
o.4,
1999
This Downloaded to IP: 129.6.105.191 On: Fri, 05 Sep 2014 17:51:55
D. N. Tarasenkov and E. N. Polozhentseva, Zh. Obshch. Khim.2, 84 ~1932!.14N. Sata and O. Kimura, Bull. Chem. Soc. Jpn.10, 409 ~1935!.15K. A. Varteressian and M. R. Fenske, Ind. Eng. Chem.28, 928 ~1936!.16W. D. Bancroft and S. S. Hubard, J. Am. Chem. Soc.64, 347 ~1942!.17L. A. K. Staveley, R. G. S. Johns, and B. C. Moore, J. Chem. Soc. 2516~1951!.18Y. C. Chang and R. W. Moulton, Ind. Eng. Chem.45, 2350~1953!.19A. G. Morachevskii and V. P. Belousov, Vestn. Leningr. Univ., Ser. 4: Fiz., Khim.4, 117 ~1958!.20R. V. Mertslin, N. I. Nikurashina, and L. A. Kamaevskaya, Zh. Fiz. Khim.35, 2628~1961!.21S. Ross and R. E. Patterson, J. Chem. Eng. Data.24, 111 ~1979!.22V. Brandani, A. Chianese, and M. Rossi, J. Chem. Eng. Data30, 27 ~1985!.23T. M. Letcher, J. Sewry, and S. Radloff, S. Afr. J. Chem.43, 56 ~1990!.24D. G. Shaw, ed.,Solubility Data SeriesVol. 37, Hydrocarbons with Water and Seawater, Part I: Hydrocarbons C5 to C7 ~Pergamon,New York, 1989!.25D. N. Tarasenkov and I. A. Paulsen, Acta Physicochim. URSS11, 75 ~1939!.
necessary to make a homogenous solution. Thwater–hydrocarbon mixture was about 1 g; thealcohol—up to 5 g.
article is copyrighted as indicated in the article. Reuse of AIP content is subject to the terms at: http://scitation.aip.org/termsconditions.
References:1S. F. Taylor, J. Phys. Chem.1, 461 ~1896–1897!.2A. T. Lincoln, J. Phys. Chem.4, 161 ~1899–1900!.3W. D. Bonner, J. Phys. Chem.14, 738 ~1909–1910!.4J. Holmes, J. Chem. Soc.113, 263 ~1918!.5N. V. Sidgwick and W. J. Spurrell, J. Chem. Soc.117, 1397~1920!.6F. Wehrmann, Z. Elektrochem.27, 379 ~1921!.7N. Perrakis, J. Chim. Phys.22, 280 ~1925!.8J. Barbaudy, Bull. Soc. Chim. Fr.39, 371 ~1926!.9J. Barbaudy, Recl. Trav. Chim. Pays-Bas Belg.45, 207 ~1926!.10R. Wright, J. Chem. Soc.129, 1203~1926!.11J. Barbaudy, J. Chim. Phys.24, 1 ~1927!.12E. R. Washburn, V. Hnizda, and R. Vold, J. Am. Chem. Soc.53, 3237~1931!.13
Componen
~1! Ethano~2! Benzen~3! Water;
Variables:T/K5273
t/°C
15.0
Method/Ap
In a tube 1weight, oftemperaturstirred andsolution wathrough thalways weConcentrabinary wat

Compositions along the saturation curve
x1 x2 w1 w2
~compiler! ~compiler!
0.2333 0.7008 0.1612 0.8210
0.4561 0.2542 0.4559 0.4308
0.4592 0.1385 0.5393 0.2759
0.4277 0.0828 0.5631 0.1848
0.3366 0.0312 0.5286 0.0832
0.2305 0.7044 0.1590 0.8235
0.4531 0.2590 0.4510 0.4370
0.4580 0.1407 0.5366 0.2795
0.4270 0.0843 0.5611 0.1878
0.3365 0.0317 0.5279 0.0844
0.2283 0.7073 0.1572 0.8255
0.4493 0.2652 0.4446 0.4450
0.4564 0.1438 0.5328 0.2846
0.4262 0.0859 0.5589 0.1910
0.3363 0.0322 0.5273 0.0855
0.2259 0.7103 0.1553 0.8276
0.4448 0.2726 0.4372 0.4542
0.4551 0.1461 0.5299 0.2885
0.4254 0.0877 0.5564 0.1945
0.3361 0.0327 0.5266 0.0868
0.2238 0.7130 0.1536 0.8295
0.4411 0.2787 0.4311 0.4618
0.4536 0.1490 0.5264 0.2932
0.4247 0.0892 0.5544 0.1975
0.3360 0.0332 0.5258 0.0881
0.2227 0.7145 0.1527 0.8305
0.3508 0.5031 0.2782 0.6765
0.4374 0.2847 0.4252 0.4692
0.4520 0.1520 0.5228 0.2981
0.4239 0.0909 0.5521 0.2008
0.3358 0.0338 0.5250 0.0895
0.1997 0.7439 0.1346 0.8505
0.3235 0.5418 0.2498 0.7095
3944 0.3550 0.3604 0.5500
4339 0.1858 0.4834 0.3510
4158 0.1083 0.5293 0.2338
3336 0.0399 0.5162 0.1047
.1739 0.7771 0.1151 0.8722
3036 0.5701 0.2300 0.7325
3686 0.3972 0.3251 0.5941
4109 0.2291 0.4370 0.4132
4052 0.1310 0.5011 0.2746
3305 0.0488 0.5039 0.1261
1994 0.0030 0.3861 0.0100
10301030
SK
RZ
EC
Z,
SH
AW
,A
ND
MA
CZ
YN
SK
I
J.P
hys.C
hem.
Ref.
Data,
Vol.
28,N
o.4,
1999
This wnloaded to IP: 129.6.105.191 On: Fri, 05 Sep 2014 17:51:55
3.00 276.15 0.4550 0.1464 0.5296 0.2890
21.25 271.90 0.4609 0.1353 0.5434 0.2704
25.3 298.45 0.4047 0.1322 0.4997 0.2767
21.2 294.35 0.4094 0.1220 0.5120 0.2588
17.3 290.45 0.4135 0.1134 0.5229 0.2431
13.5 286.65 0.4169 0.1058 0.5325 0.2291
9.9 283.05 0.4200 0.0992 0.5411 0.2167
6.5 279.65 0.4227 0.0934 0.5488 0.2055
1.95 275.10 0.4263 0.0857 0.5591 0.1906
15.4 288.55 0.3336 0.0402 0.5159 0.1053
12.15 285.30 0.3343 0.0382 0.5187 0.1005
7.1 280.25 0.3354 0.0350 0.5233 0.0925
2.3 275.45 0.3363 0.0322 0.5272 0.0856
20.40 272.75 0.3367 0.0310 0.5289 0.0827
25.0 298.15 0.1994 0.0030 0.3861 0.0100
0.
0.
0.
0.
25.0 298.2 0
0.
0.
0.
0.
0.
0.
article is copyrighted as indicated in the article. Reuse of AIP content is subject to the terms at: http://scitation.aip.org/termsconditions. Do
Components: Original Measurements:
~1! Ethanol~ethyl alcohol!; C2H6O; @64-17-5#~2! Benzene; C6H6; @71-43-2#~3! Water; H2O; @7732-18-5#
N. V. Sidgwick and W. J. Spurrell, J. Chem. Soc.117, 1397–404~1920!.
Variables:T/K5272– 312
Compiled by:A. Skrzecz
Experimental DataCompositions along the saturation curve
t/°CT/K
~compiler!
x1 x2 w1 w2
~compiler! ~compiler!
30.7 303.85 0.1496 0.8080 0.0974 0.8918
26.1 299.25 0.1698 0.7822 0.1121 0.8755
23.9 297.05 0.1781 0.7719 0.1182 0.8688
16.1 289.25 0.1974 0.7467 0.1329 0.8524
11.0 284.15 0.2084 0.7328 0.1414 0.8430
5.2 278.35 0.2212 0.7164 0.1515 0.8318
2.0 275.15 0.2283 0.7070 0.1572 0.8254
28.3 301.45 0.2978 0.5781 0.2245 0.7389
22.7 295.85 0.3074 0.5645 0.2338 0.7281
17.6 290.75 0.3177 0.5501 0.2440 0.7163
12.9 286.05 0.3286 0.5346 0.2550 0.7035
8.5 281.65 0.3404 0.5179 0.2672 0.6893
4.5 277.65 0.3529 0.5000 0.2805 0.6738
39.2 312.35 0.3428 0.4395 0.2922 0.6352
32.1 305.25 0.3547 0.4200 0.3071 0.6166
19.6 292.75 0.3805 0.3777 0.3411 0.5741
9.2 282.35 0.4188 0.3152 0.3961 0.5055
5.2 278.35 0.4363 0.2865 0.4234 0.4714
1.6 274.75 0.4507 0.2628 0.4470 0.4419
29.5 302.65 0.3985 0.2523 0.4139 0.4443
20.3 293.45 0.4227 0.2071 0.4601 0.3823
15.2 288.35 0.4338 0.1860 0.4832 0.3512
7.75 280.90 0.4480 0.1595 0.5138 0.3102
t/°CT/K
~compiler!
0.0 273.2
1.0 274.2
2.0 275.2
3.0 276.2
4.0 277.2
5.0 278.2
15.0 288.2
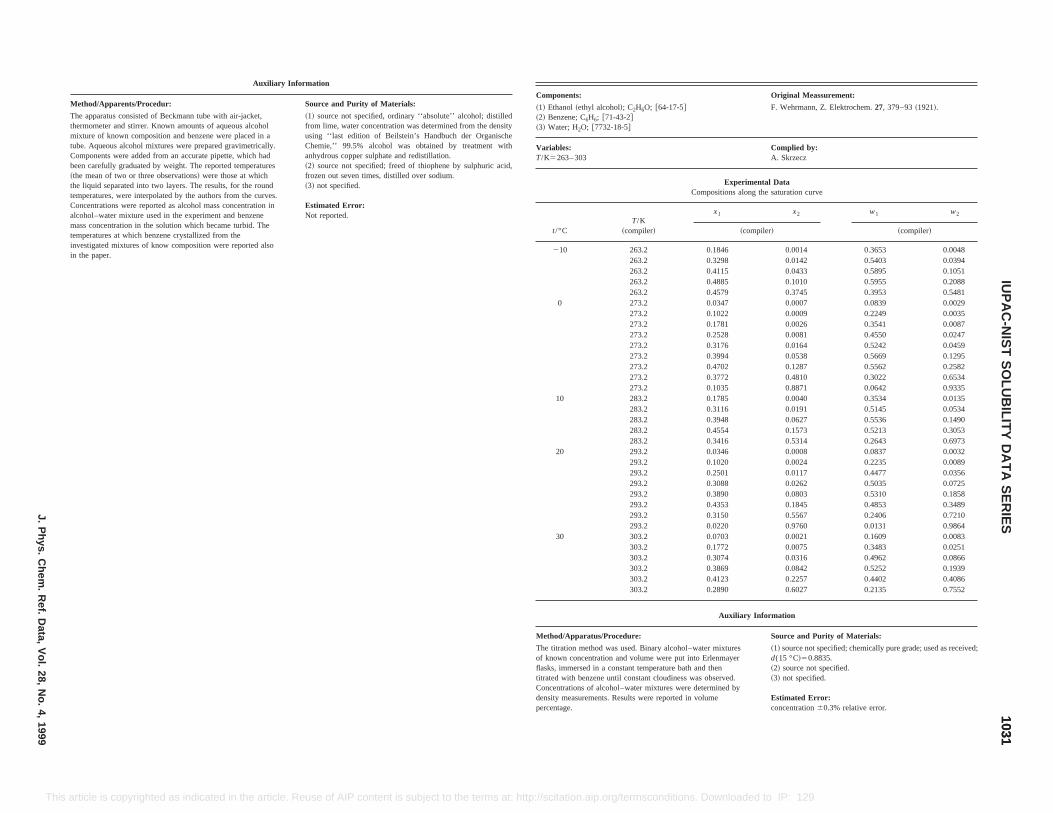
Original Meassurement:
F. Wehrmann, Z. Elektrochem.27, 379–93~1921!.
Complied by:A. Skrzecz
erimental Datas along the saturation curve
x2 w1 w2
~compiler! ~compiler!
0.0014 0.3653 0.00480.0142 0.5403 0.03940.0433 0.5895 0.10510.1010 0.5955 0.20880.3745 0.3953 0.54810.0007 0.0839 0.00290.0009 0.2249 0.00350.0026 0.3541 0.00870.0081 0.4550 0.02470.0164 0.5242 0.04590.0538 0.5669 0.12950.1287 0.5562 0.25820.4810 0.3022 0.65340.8871 0.0642 0.93350.0040 0.3534 0.01350.0191 0.5145 0.05340.0627 0.5536 0.14900.1573 0.5213 0.30530.5314 0.2643 0.69730.0008 0.0837 0.00320.0024 0.2235 0.00890.0117 0.4477 0.03560.0262 0.5035 0.07250.0803 0.5310 0.18580.1845 0.4853 0.34890.5567 0.2406 0.72100.9760 0.0131 0.9864
30 303.2 0.0703 0.0021 0.1609 0.0083303.2 0.1772 0.0075 0.3483 0.0251303.2 0.3074 0.0316 0.4962 0.0866303.2 0.3869 0.0842 0.5252 0.1939303.2 0.4123 0.2257 0.4402 0.4086303.2 0.2890 0.6027 0.2135 0.7552
Auxiliary Information
Method/Apparatus/Procedure: Source and Purity of Materials:
The titration method was used. Binary alcohol–water mixturesof known concentration and volume were put into Erlenmayerflasks, immersed in a constant temperature bath and thentitrated with benzene until constant cloudiness was observed.Concentrations of alcohol–water mixtures were determined bydensity measurements. Results were reported in volumepercentage.
~1! source not specified; chemically pure grade; used as received;d(15 °C!50.8835.~2! source not specified.~3! not specified.
Estimated Error:concentration60.3% relative error. 1031
1031IU
PA
C-N
IST
SO
LUB
ILITY
DA
TA
SE
RIE
SJ.P
hys.C
hem.
Ref.
Data,
Vol.
28,N
o.4,
1999
This le. Reuse of AIP content is subject to the terms at: http://scitation.aip.org/termsconditions. Downloaded to IP: 129.6.105.191 On: Fri, 05 Sep 2014 17:51:55
article is copyrighted as indicated in the articAuxiliary Information
Method/Apparents/Procedur: Source and Purity of Materials:
The apparatus consisted of Beckmann tube with air-jacket,thermometer and stirrer. Known amounts of aqueous alcoholmixture of known composition and benzene were placed in atube. Aqueous alcohol mixtures were prepared gravimetrically.Components were added from an accurate pipette, which hadbeen carefully graduated by weight. The reported temperatures~the mean of two or three observations! were those at whichthe liquid separated into two layers. The results, for the roundtemperatures, were interpolated by the authors from the curves.Concentrations were reported as alcohol mass concentration inalcohol–water mixture used in the experiment and benzenemass concentration in the solution which became turbid. Thetemperatures at which benzene crystallized from theinvestigated mixtures of know composition were reported alsoin the paper.
~1! source not specified, ordinary ‘‘absolute’’ alcohol; distilledfrom lime, water concentration was determined from the densityusing ‘‘last edition of Beilstein’s Handbuch der OrganischeChemie,’’ 99.5% alcohol was obtained by treatment withanhydrous copper sulphate and redistillation.~2! source not specified; freed of thiophene by sulphuric acid,frozen out seven times, distilled over sodium.~3! not specified.
Estimated Error:Not reported.
Components:
~1! Ethanol~ethyl alcohol!; C2H6O; @64-17-5#~2! Benzene; C6H6; @71-43-2#~3! Water; H2O; @7732-18-5#
Variables:T/K5263– 303
ExpComposition
t/°CT/K
~compiler!
x1
210 263.2 0.1846263.2 0.3298263.2 0.4115263.2 0.4885263.2 0.4579
0 273.2 0.0347273.2 0.1022273.2 0.1781273.2 0.2528273.2 0.3176273.2 0.3994273.2 0.4702273.2 0.3772273.2 0.1035
10 283.2 0.1785283.2 0.3116283.2 0.3948283.2 0.4554283.2 0.3416
20 293.2 0.0346293.2 0.1020293.2 0.2501293.2 0.3088293.2 0.3890293.2 0.4353293.2 0.3150293.2 0.0220
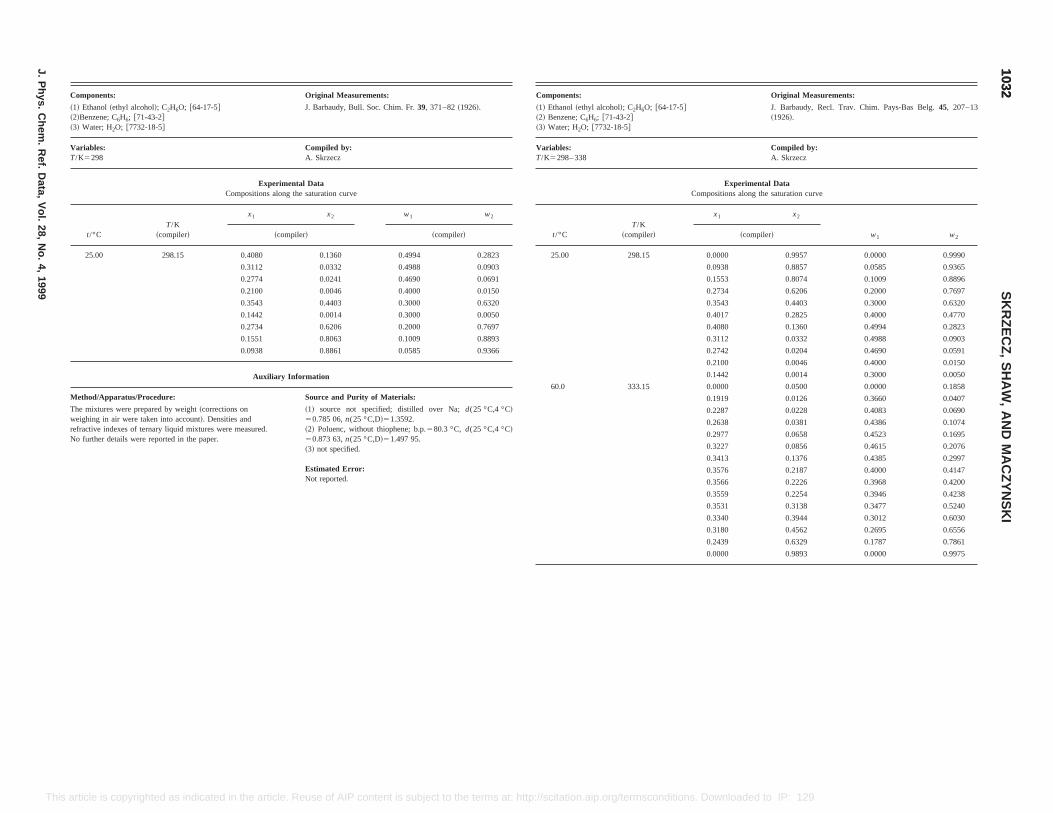
ts: Original Measurements:
~ethyl alcohol!; C2H6O; @64-17-5#e; C6H6; @71-43-2#H2O; @7732-18-5#
J. Barbaudy, Recl. Trav. Chim. Pays-Bas Belg.45, 207–13~1926!.
338Compiled by:A. Skrzecz
Experimental DataCompositions along the saturation curve
T/K~compiler!
x1 x2
w1 w2~compiler!
298.15 0.0000 0.9957 0.0000 0.9990
0.0938 0.8857 0.0585 0.9365
0.1553 0.8074 0.1009 0.8896
0.2734 0.6206 0.2000 0.7697
0.3543 0.4403 0.3000 0.6320
0.4017 0.2825 0.4000 0.4770
0.4080 0.1360 0.4994 0.2823
0.3112 0.0332 0.4988 0.0903
0.2742 0.0204 0.4690 0.0591
0.2100 0.0046 0.4000 0.0150
0.1442 0.0014 0.3000 0.0050
333.15 0.0000 0.0500 0.0000 0.1858
0.1919 0.0126 0.3660 0.0407
0.2287 0.0228 0.4083 0.0690
0.2638 0.0381 0.4386 0.1074
0.2977 0.0658 0.4523 0.1695
0.3227 0.0856 0.4615 0.2076
0.3413 0.1376 0.4385 0.2997
0.3576 0.2187 0.4000 0.4147
0.3566 0.2226 0.3968 0.4200
0.3559 0.2254 0.3946 0.4238
0.3531 0.3138 0.3477 0.5240
0.3340 0.3944 0.3012 0.6030
0.3180 0.4562 0.2695 0.6556
0.2439 0.6329 0.1787 0.7861
0.0000 0.9893 0.0000 0.9975
10321032
SK
RZ
EC
Z,
SH
AW
,A
ND
MA
CZ
YN
SK
I
J.P
hys.C
hem.
Ref.
Data,
Vol.
28,N
o.4,
1999
This at: http://scitation.aip.org/termsconditions. Downloaded to IP: 129.6.105.191 On: Fri, 05 Sep 2014 17:51:55
article is copyrighted as indicated in the article. Reuse of AIP content is subject to the termsComponents: Original Measurements:
~1! Ethanol~ethyl alcohol!; C2H6O; @64-17-5#~2!Benzene; C6H6; @71-43-2#~3! Water; H2O; @7732-18-5#
J. Barbaudy, Bull. Soc. Chim. Fr.39, 371–82~1926!.
Variables:T/K5298
Compiled by:A. Skrzecz
Experimental DataCompositions along the saturation curve
t/°CT/K
~compiler!
x1 x2 w1 w2
~compiler! ~compiler!
25.00 298.15 0.4080 0.1360 0.4994 0.2823
0.3112 0.0332 0.4988 0.0903
0.2774 0.0241 0.4690 0.0691
0.2100 0.0046 0.4000 0.0150
0.3543 0.4403 0.3000 0.6320
0.1442 0.0014 0.3000 0.0050
0.2734 0.6206 0.2000 0.7697
0.1551 0.8063 0.1009 0.8893
0.0938 0.8861 0.0585 0.9366
Auxiliary Information
Method/Apparatus/Procedure: Source and Purity of Materials:
The mixtures were prepared by weight~corrections onweighing in air were taken into account!. Densities andrefractive indexes of ternary liquid mixtures were measured.No further details were reported in the paper.
~1! source not specified; distilled over Na;d(25 °C,4 °C!50.785 06,n(25 °C,D!51.3592.~2! Poluenc, without thiophene; b.p.580.3 °C, d(25 °C,4 °C!50.873 63,n(25 °C,D!51.497 95.~3! not specified.
Estimated Error:Not reported.
Componen
~1! Ethanol~2! Benzen~3! Water;
Variables:T/K5298–
t/°C
25.00
60.0
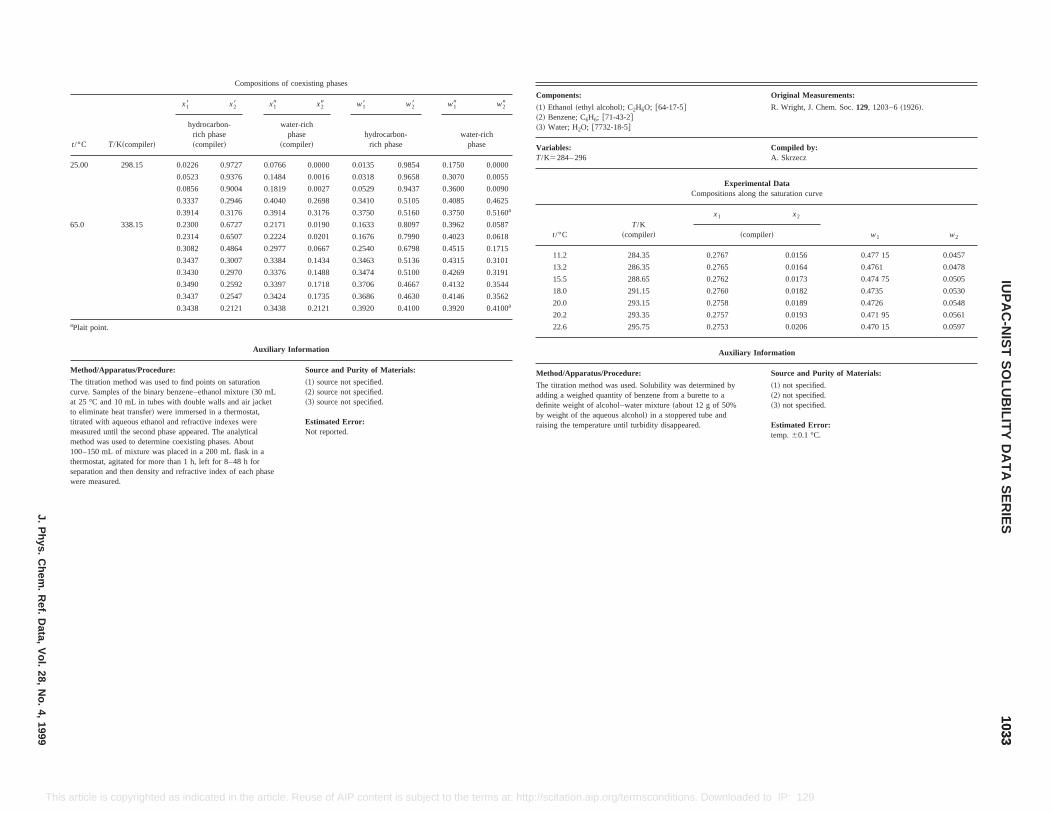
t/
w29
25 0.0000
0.0055
0.0090
0.4625
0.5160a
65 0.0587
0.0618
0.1715
0.3101
0.3191
0.3544
0.3562
0.4100a
aP
Me
Thcuattotitrmeme10thesewe
Components: Original Measurements:
~1! Ethanol~ethyl alcohol!; C2H6O; @64-17-5#~2! Benzene; C6H6; @71-43-2#~3! Water; H2O; @7732-18-5#
R. Wright, J. Chem. Soc.129, 1203–6~1926!.
Variables:T/K5284– 296
Compiled by:A. Skrzecz
Experimental DataCompositions along the saturation curve
t/°CT/K
~compiler!
x1 x2
w1 w2~compiler!
11.2 284.35 0.2767 0.0156 0.477 15 0.0457
13.2 286.35 0.2765 0.0164 0.4761 0.0478
15.5 288.65 0.2762 0.0173 0.474 75 0.0505
18.0 291.15 0.2760 0.0182 0.4735 0.0530
20.0 293.15 0.2758 0.0189 0.4726 0.0548
20.2 293.35 0.2757 0.0193 0.471 95 0.0561
22.6 295.75 0.2753 0.0206 0.470 15 0.0597
Auxiliary Information
Method/Apparatus/Procedure: Source and Purity of Materials:
The titration method was used. Solubility was determined byadding a weighed quantity of benzene from a burette to adefinite weight of alcohol–water mixture~about 12 g of 50%by weight of the aqueous alcohol! in a stoppered tube andraising the temperature until turbidity disappeared.
~1! not specified.~2! not specified.~3! not specified.
Estimated Error:temp.60.1 °C.
10331033
IUP
AC
-NIS
TS
OLU
BILIT
YD
AT
AS
ER
IESJ.P
hys.C
hem.
Ref.
Data,
Vol.
28,N
o.4,
1999
This art at: http://scitation.aip.org/termsconditions. Downloaded to IP: 129.6.105.191 On: Fri, 05 Sep 2014 17:51:55
icle is copyrighted as indicated in the article. Reuse of AIP content is subject to the termsCompositions of coexisting phases
°C T/K~compiler!
x18 x28 x19 x29 w18 w28 w19
hydrocarbon-rich phase~compiler!
water-richphase
~compiler!hydrocarbon-
rich phasewater-rich
phase
.00 298.15 0.0226 0.9727 0.0766 0.0000 0.0135 0.9854 0.1750
0.0523 0.9376 0.1484 0.0016 0.0318 0.9658 0.3070
0.0856 0.9004 0.1819 0.0027 0.0529 0.9437 0.3600
0.3337 0.2946 0.4040 0.2698 0.3410 0.5105 0.4085
0.3914 0.3176 0.3914 0.3176 0.3750 0.5160 0.3750
.0 338.15 0.2300 0.6727 0.2171 0.0190 0.1633 0.8097 0.3962
0.2314 0.6507 0.2224 0.0201 0.1676 0.7990 0.4023
0.3082 0.4864 0.2977 0.0667 0.2540 0.6798 0.4515
0.3437 0.3007 0.3384 0.1434 0.3463 0.5136 0.4315
0.3430 0.2970 0.3376 0.1488 0.3474 0.5100 0.4269
0.3490 0.2592 0.3397 0.1718 0.3706 0.4667 0.4132
0.3437 0.2547 0.3424 0.1735 0.3686 0.4630 0.4146
0.3438 0.2121 0.3438 0.2121 0.3920 0.4100 0.3920
lait point.
Auxiliary Information
thod/Apparatus/Procedure: Source and Purity of Materials:
e titration method was used to find points on saturationrve. Samples of the binary benzene–ethanol mixture~30 mL25 °C and 10 mL in tubes with double walls and air jacketeliminate heat transfer! were immersed in a thermostat,ated with aqueous ethanol and refractive indexes wereasured until the second phase appeared. The analyticalthod was used to determine coexisting phases. About0–150 mL of mixture was placed in a 200 mL flask in armostat, agitated for more than 1 h, left for 8–48 h for
paration and then density and refractive index of each phasere measured.
~1! source not specified.~2! source not specified.~3! source not specified.
Estimated Error:Not reported.
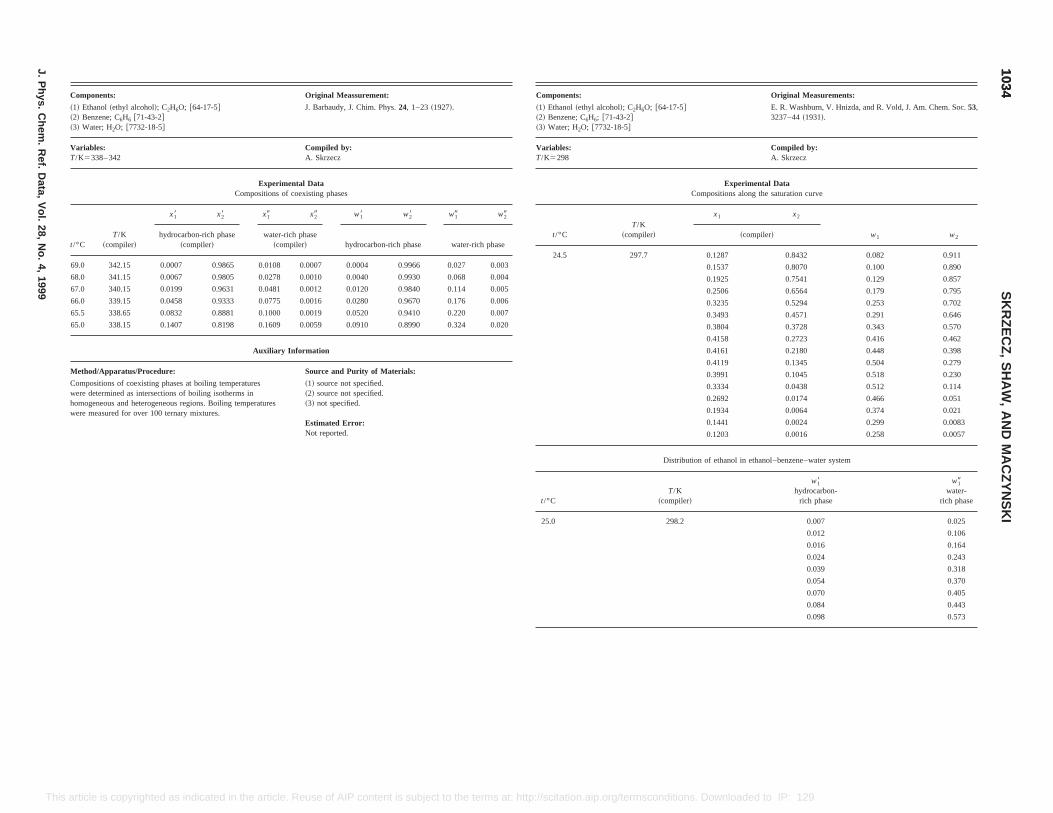
Original Measurements:
6O; @64-17-5# E. R. Washburn, V. Hnizda, and R. Vold, J. Am. Chem. Soc.53,3237–44~1931!.
Compiled by:A. Skrzecz
Experimental DataCompositions along the saturation curve
Kpiler!
x1 x2
w1 w2~compiler!
7.7 0.1287 0.8432 0.082 0.911
0.1537 0.8070 0.100 0.890
0.1925 0.7541 0.129 0.857
0.2506 0.6564 0.179 0.795
0.3235 0.5294 0.253 0.702
0.3493 0.4571 0.291 0.646
0.3804 0.3728 0.343 0.570
0.4158 0.2723 0.416 0.462
0.4161 0.2180 0.448 0.398
0.4119 0.1345 0.504 0.279
0.3991 0.1045 0.518 0.230
0.3334 0.0438 0.512 0.114
0.2692 0.0174 0.466 0.051
0.1934 0.0064 0.374 0.021
0.1441 0.0024 0.299 0.0083
0.1203 0.0016 0.258 0.0057
Distribution of ethanol in ethanol–benzene–water system
T/K~compiler!
w18hydrocarbon-
rich phase
w19water-
rich phase
298.2 0.007 0.025
0.012 0.106
0.016 0.164
0.024 0.243
0.039 0.318
0.054 0.370
0.070 0.405
0.084 0.443
0.098 0.573
10341034
SK
RZ
EC
Z,
SH
AW
,A
ND
MA
CZ
YN
SK
I
J.P
hys.C
hem.
Ref.
Data,
Vol.
28,N
o.4,
1999
This the terms at: http://scitation.aip.org/termsconditions. Downloaded to IP: 129.6.105.191 On: Fri, 05 Sep 2014 17:51:55
article is copyrighted as indicated in the article. Reuse of AIP content is subject toComponents: Original Meassurement:
~1! Ethanol~ethyl alcohol!; C2H6O; @64-17-5#~2! Benzene; C6H6 @71-43-2#~3! Water; H2O; @7732-18-5#
J. Barbaudy, J. Chim. Phys.24, 1–23~1927!.
Variables:T/K5338– 342
Compiled by:A. Skrzecz
Experimental DataCompositions of coexisting phases
t/°CT/K
~compiler!
x18 x28 x19 x29 w18 w28 w19 w29
hydrocarbon-rich phase~compiler!
water-rich phase~compiler! hydrocarbon-rich phase water-rich phase
69.0 342.15 0.0007 0.9865 0.0108 0.0007 0.0004 0.9966 0.027 0.003
68.0 341.15 0.0067 0.9805 0.0278 0.0010 0.0040 0.9930 0.068 0.004
67.0 340.15 0.0199 0.9631 0.0481 0.0012 0.0120 0.9840 0.114 0.005
66.0 339.15 0.0458 0.9333 0.0775 0.0016 0.0280 0.9670 0.176 0.006
65.5 338.65 0.0832 0.8881 0.1000 0.0019 0.0520 0.9410 0.220 0.007
65.0 338.15 0.1407 0.8198 0.1609 0.0059 0.0910 0.8990 0.324 0.020
Auxiliary Information
Method/Apparatus/Procedure: Source and Purity of Materials:
Compositions of coexisting phases at boiling temperatureswere determined as intersections of boiling isotherms inhomogeneous and heterogeneous regions. Boiling temperatureswere measured for over 100 ternary mixtures.
~1! source not specified.~2! source not specified.~3! not specified.
Estimated Error:Not reported.
Components:
~1! Ethanol~ethyl alcohol!; C2H~2! Benzene; C6H6; @71-43-2#~3! Water; H2O; @7732-18-5#
Variables:T/K5298
t/°CT/
~com
24.5 29
t/°C
25.0
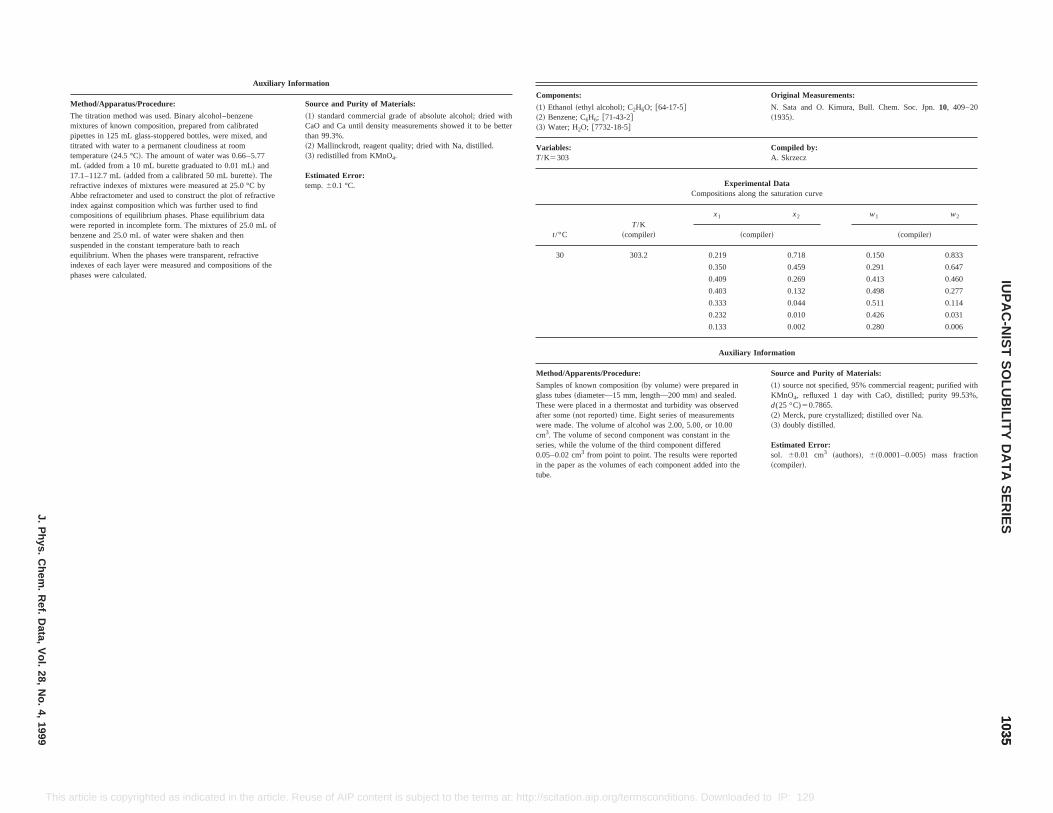
; dried withto be better
lled.
Components: Original Measurements:
~1! Ethanol~ethyl alcohol!; C2H6O; @64-17-5#~2! Benzene; C6H6; @71-43-2#~3! Water; H2O; @7732-18-5#
N. Sata and O. Kimura, Bull. Chem. Soc. Jpn.10, 409–20~1935!.
Variables:T/K5303
Compiled by:A. Skrzecz
Experimental DataCompositions along the saturation curve
t/°CT/K
~compiler!
x1 x2 w1 w2
~compiler! ~compiler!
30 303.2 0.219 0.718 0.150 0.833
0.350 0.459 0.291 0.647
0.409 0.269 0.413 0.460
0.403 0.132 0.498 0.277
0.333 0.044 0.511 0.114
0.232 0.010 0.426 0.031
0.133 0.002 0.280 0.006
Auxiliary Information
Method/Apparents/Procedure: Source and Purity of Materials:
Samples of known composition~by volume! were prepared inglass tubes~diameter—15 mm, length—200 mm! and sealed.These were placed in a thermostat and turbidity was observedafter some~not reported! time. Eight series of measurementswere made. The volume of alcohol was 2.00, 5.00, or 10.00cm3. The volume of second component was constant in theseries, while the volume of the third component differed0.05–0.02 cm3 from point to point. The results were reportedin the paper as the volumes of each component added into thetube.
~1! source not specified, 95% commercial reagent; purified withKMnO4, refluxed 1 day with CaO, distilled; purity 99.53%,d(25 °C)50.7865.~2! Merck, pure crystallized; distilled over Na.~3! doubly distilled.
Estimated Error:sol. 60.01 cm3 ~authors!, 6~0.0001–0.005! mass fraction~compiler!.
10351035
IUP
AC
-NIS
TS
OLU
BILIT
YD
AT
AS
ER
IESJ.P
hys.C
hem.
Ref.
Data,
Vol.
28,N
o.4,
1999
This use of AIP content is subject to the terms at: http://scitation.aip.org/termsconditions. Downloaded to IP: 129.6.105.191 On: Fri, 05 Sep 2014 17:51:55
article is copyrighted as indicated in the article. ReAuxiliary Information
Method/Apparatus/Procedure: Source and Purity of Materials:
The titration method was used. Binary alcohol–benzenemixtures of known composition, prepared from calibratedpipettes in 125 mL glass-stoppered bottles, were mixed, andtitrated with water to a permanent cloudiness at roomtemperature~24.5 °C!. The amount of water was 0.66–5.77mL ~added from a 10 mL burette graduated to 0.01 mL! and17.1–112.7 mL~added from a calibrated 50 mL burette!. Therefractive indexes of mixtures were measured at 25.0 °C byAbbe refractometer and used to construct the plot of refractiveindex against composition which was further used to findcompositions of equilibrium phases. Phase equilibrium datawere reported in incomplete form. The mixtures of 25.0 mL ofbenzene and 25.0 mL of water were shaken and thensuspended in the constant temperature bath to reachequilibrium. When the phases were transparent, refractiveindexes of each layer were measured and compositions of thephases were calculated.
~1! standard commercial grade of absolute alcoholCaO and Ca until density measurements showed itthan 99.3%.~2! Mallinckrodt, reagent quality; dried with Na, disti~3! redistilled from KMnO4.
Estimated Error:temp.60.1 °C.
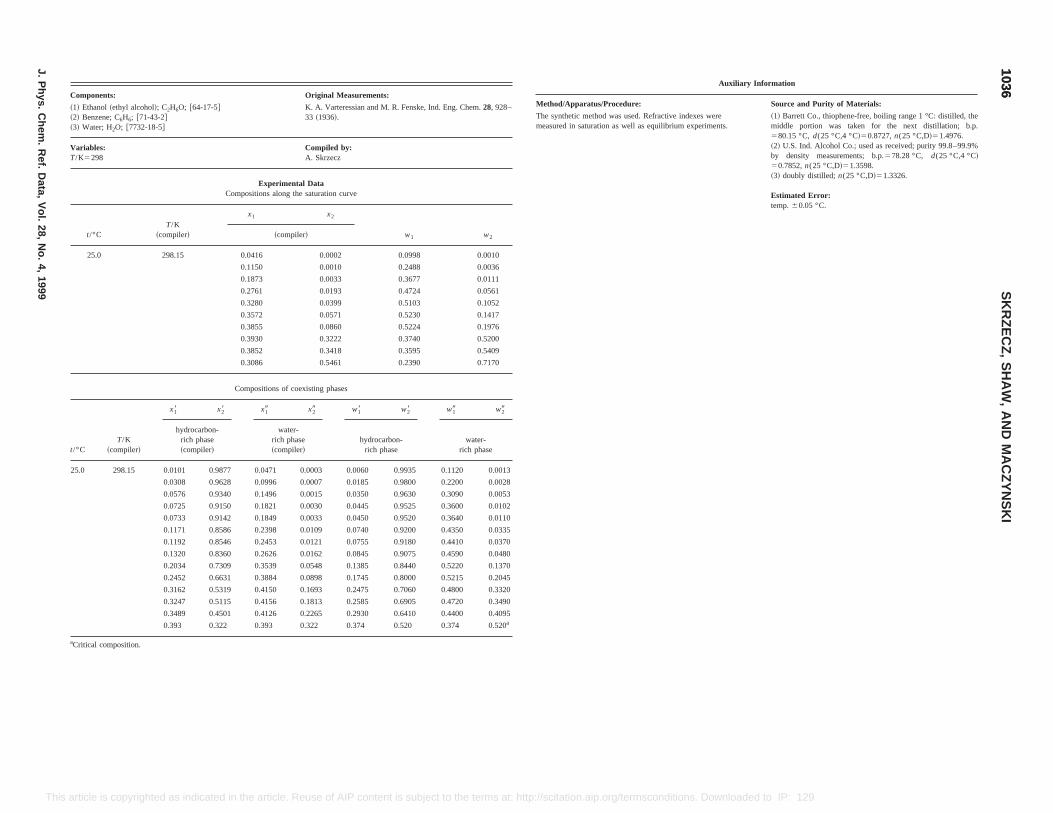
Original Measurements:
K. A. Varteressian and M. R. Fenske, Ind. Eng. Chem.28, 928–33 ~1936!.
Compiled by:A. Skrzecz
Experimental DataCompositions along the saturation curve
x1 x2
w1 w2~compiler!
0.0416 0.0002 0.0998 0.0010
0.1150 0.0010 0.2488 0.0036
0.1873 0.0033 0.3677 0.0111
0.2761 0.0193 0.4724 0.0561
0.3280 0.0399 0.5103 0.1052
0.3572 0.0571 0.5230 0.1417
0.3855 0.0860 0.5224 0.1976
0.3930 0.3222 0.3740 0.5200
0.3852 0.3418 0.3595 0.5409
0.3086 0.5461 0.2390 0.7170
Compositions of coexisting phases
x19 x29 w18 w28 w19 w29
water-rich phase~compiler!
hydrocarbon-rich phase
water-rich phase
877 0.0471 0.0003 0.0060 0.9935 0.1120 0.0013
28 0.0996 0.0007 0.0185 0.9800 0.2200 0.0028
40 0.1496 0.0015 0.0350 0.9630 0.3090 0.0053
50 0.1821 0.0030 0.0445 0.9525 0.3600 0.0102
42 0.1849 0.0033 0.0450 0.9520 0.3640 0.0110
Auxiliary Information
Method/Apparatus/Procedure: Source and Purity of Materials:
The synthetic method was used. Refractive indexes weremeasured in saturation as well as equilibrium experiments.
~1! Barrett Co., thiophene-free, boiling range 1 °C: distilled, themiddle portion was taken for the next distillation; b.p.580.15 °C,d(25 °C,4 °C!50.8727,n(25 °C,D!51.4976.~2! U.S. Ind. Alcohol Co.; used as received; purity 99.8–99.9%by density measurements; b.p.578.28 °C, d(25 °C,4 °C!50.7852,n(25 °C,D!51.3598.~3! doubly distilled;n(25 °C,D!51.3326.
Estimated Error:temp.60.05 °C.
10361036
SK
RZ
EC
Z,
SH
AW
,A
ND
MA
CZ
YN
SK
I
J.P
hys.C
hem.
Ref.
Data,
Vol.
28,N
o.4,
1999
This ditions. Downloaded to IP: 129.6.105.191 On: Fri, 05 Sep 2014 17:51:55
0.1171 0.8586 0.2398 0.0109 0.0740 0.9200 0.4350 0.0335
0.1192 0.8546 0.2453 0.0121 0.0755 0.9180 0.4410 0.0370
0.1320 0.8360 0.2626 0.0162 0.0845 0.9075 0.4590 0.0480
0.2034 0.7309 0.3539 0.0548 0.1385 0.8440 0.5220 0.1370
0.2452 0.6631 0.3884 0.0898 0.1745 0.8000 0.5215 0.2045
0.3162 0.5319 0.4150 0.1693 0.2475 0.7060 0.4800 0.3320
0.3247 0.5115 0.4156 0.1813 0.2585 0.6905 0.4720 0.3490
0.3489 0.4501 0.4126 0.2265 0.2930 0.6410 0.4400 0.4095
0.393 0.322 0.393 0.322 0.374 0.520 0.374 0.520a
aCritical composition.
article is copyrighted as indicated in the article. Reuse of AIP content is subject to the terms at: http://scitation.aip.org/termscon
Components:
~1! Ethanol~ethyl alcohol!; C2H6O; @64-17-5#~2! Benzene; C6H6; @71-43-2#~3! Water; H2O; @7732-18-5#
Variables:T/K5298
t/°CT/K
~compiler!
25.0 298.15
t/°CT/K
~compiler!
x18 x28
hydrocarbon-rich phase~compiler!
25.0 298.15 0.0101 0.9
0.0308 0.96
0.0576 0.93
0.0725 0.91
0.0733 0.91
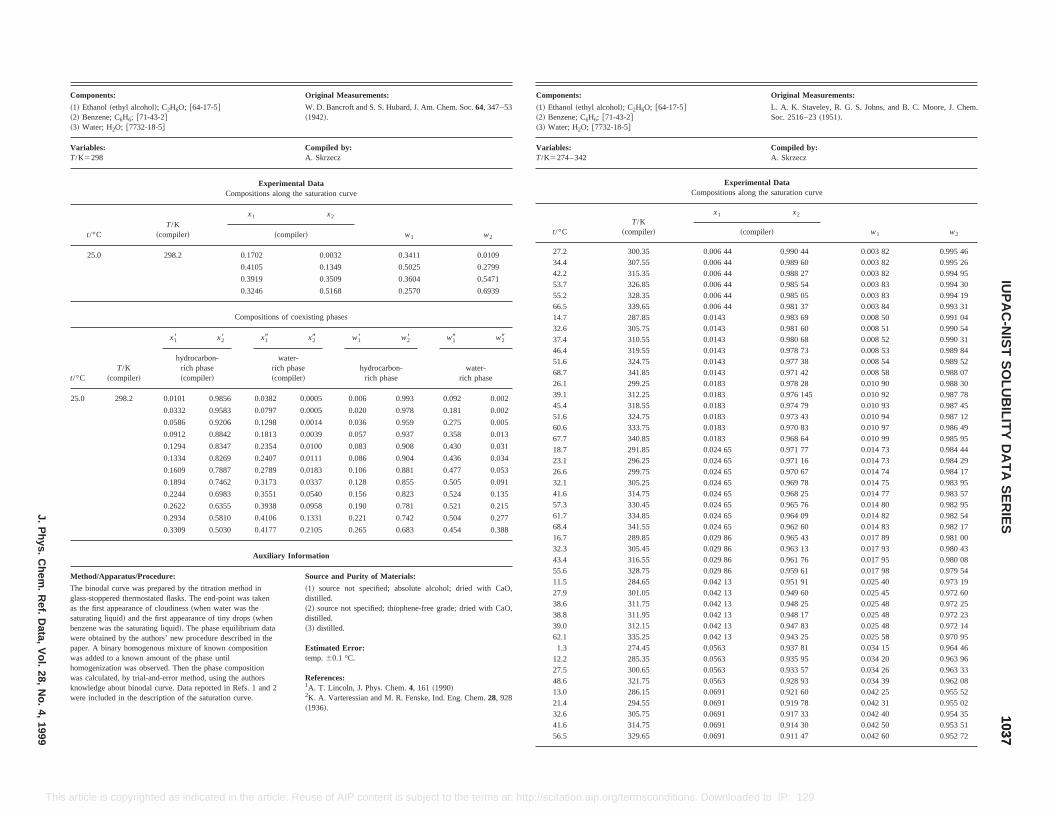
0.3309 0.5030 0.4177 0.2105 0.265 0.683 0.454 0.388
Original Measurements:
L. A. K. Staveley, R. G. S. Johns, and B. C. Moore, J. Chem.Soc. 2516–23~1951!.
Compiled by:A. Skrzecz
tal Datathe saturation curve
x2
w1 w2iler!
0.990 44 0.003 82 0.995 460.989 60 0.003 82 0.995 260.988 27 0.003 82 0.994 950.985 54 0.003 83 0.994 300.985 05 0.003 83 0.994 190.981 37 0.003 84 0.993 310.983 69 0.008 50 0.991 040.981 60 0.008 51 0.990 540.980 68 0.008 52 0.990 310.978 73 0.008 53 0.989 840.977 38 0.008 54 0.989 520.971 42 0.008 58 0.988 070.978 28 0.010 90 0.988 300.976 145 0.010 92 0.987 780.974 79 0.010 93 0.987 450.973 43 0.010 94 0.987 120.970 83 0.010 97 0.986 490.968 64 0.010 99 0.985 950.971 77 0.014 73 0.984 440.971 16 0.014 73 0.984 290.970 67 0.014 74 0.984 170.969 78 0.014 75 0.983 950.968 25 0.014 77 0.983 570.965 76 0.014 80 0.982 950.964 09 0.014 82 0.982 540.962 60 0.014 83 0.982 17
86 0.965 43 0.017 89 0.981 0086 0.963 13 0.017 93 0.980 4386 0.961 76 0.017 95 0.980 0886 0.959 61 0.017 98 0.979 5413 0.951 91 0.025 40 0.973 1913 0.949 60 0.025 45 0.972 6013 0.948 25 0.025 48 0.972 2513 0.948 17 0.025 48 0.972 2313 0.947 83 0.025 48 0.972 1413 0.943 25 0.025 58 0.970 95
3 0.937 81 0.034 15 0.964 463 0.935 95 0.034 20 0.963 963 0.933 57 0.034 26 0.963 333 0.928 93 0.034 39 0.962 081 0.921 60 0.042 25 0.955 521 0.919 78 0.042 31 0.955 021 0.917 33 0.042 40 0.954 351 0.914 30 0.042 50 0.953 511 0.911 47 0.042 60 0.952 72
10371037
IUP
AC
-NIS
TS
OLU
BILIT
YD
AT
AS
ER
IESJ.P
hys.C
hem.
Ref.
Data,
Vol.
28,N
o.4,
1999
This loaded to IP: 129.6.105.191 On: Fri, 05 Sep 2014 17:51:55
Auxiliary Information
Method/Apparatus/Procedure: Source and Purity of Materials:
The binodal curve was prepared by the titration method inglass-stoppered thermostated flasks. The end-point was takenas the first appearance of cloudiness~when water was thesaturating liquid! and the first appearance of tiny drops~whenbenzene was the saturating liquid!. The phase equilibrium datawere obtained by the authors’ new procedure described in thepaper. A binary homogenous mixture of known compositionwas added to a known amount of the phase untilhomogenization was observed. Then the phase compositionwas calculated, by trial-and-error method, using the authorsknowledge about binodal curve. Data reported in Refs. 1 and 2were included in the description of the saturation curve.
~1! source not specified; absolute alcohol; dried with CaO,distilled.~2! source not specified; thiophene-free grade; dried with CaO,distilled.~3! distilled.
Estimated Error:temp.60.1 °C.
References:1A. T. Lincoln, J. Phys. Chem.4, 161 ~1990!2K. A. Varteressian and M. R. Fenske, Ind. Eng. Chem.28, 928~1936!.
16.7 289.85 0.02932.3 305.45 0.02943.4 316.55 0.02955.6 328.75 0.02911.5 284.65 0.04227.9 301.05 0.04238.6 311.75 0.04238.8 311.95 0.04239.0 312.15 0.04262.1 335.25 0.0421.3 274.45 0.056
12.2 285.35 0.05627.5 300.65 0.05648.6 321.75 0.05613.0 286.15 0.06921.4 294.55 0.06932.6 305.75 0.06941.6 314.75 0.06956.5 329.65 0.069
article is copyrighted as indicated in the article. Reuse of AIP content is subject to the terms at: http://scitation.aip.org/termsconditions. Down
Components: Original Measurements:
~1! Ethanol~ethyl alcohol!; C2H6O; @64-17-5#~2! Benzene; C6H6; @71-43-2#~3! Water; H2O; @7732-18-5#
W. D. Bancroft and S. S. Hubard, J. Am. Chem. Soc.64, 347–53~1942!.
Variables:T/K5298
Compiled by:A. Skrzecz
Experimental DataCompositions along the saturation curve
t/°CT/K
~compiler!
x1 x2
w1 w2~compiler!
25.0 298.2 0.1702 0.0032 0.3411 0.0109
0.4105 0.1349 0.5025 0.2799
0.3919 0.3509 0.3604 0.5471
0.3246 0.5168 0.2570 0.6939
Compositions of coexisting phases
t/°CT/K
~compiler!
x18 x28 x19 x29 w18 w28 w19 w29
hydrocarbon-rich phase~compiler!
water-rich phase~compiler!
hydrocarbon-rich phase
water-rich phase
25.0 298.2 0.0101 0.9856 0.0382 0.0005 0.006 0.993 0.092 0.002
0.0332 0.9583 0.0797 0.0005 0.020 0.978 0.181 0.002
0.0586 0.9206 0.1298 0.0014 0.036 0.959 0.275 0.005
0.0912 0.8842 0.1813 0.0039 0.057 0.937 0.358 0.013
0.1294 0.8347 0.2354 0.0100 0.083 0.908 0.430 0.031
0.1334 0.8269 0.2407 0.0111 0.086 0.904 0.436 0.034
0.1609 0.7887 0.2789 0.0183 0.106 0.881 0.477 0.053
0.1894 0.7462 0.3173 0.0337 0.128 0.855 0.505 0.091
0.2244 0.6983 0.3551 0.0540 0.156 0.823 0.524 0.135
0.2622 0.6355 0.3938 0.0958 0.190 0.781 0.521 0.215
0.2934 0.5810 0.4106 0.1331 0.221 0.742 0.504 0.277
Components:
~1! Ethanol~ethyl alcohol!; C2H6O; @64-17-5#~2! Benzene; C6H6; @71-43-2#~3! Water; H2O; @7732-18-5#
Variables:T/K5274– 342
ExperimenCompositions along
t/°CT/K
~compiler!
x1
~comp
27.2 300.35 0.006 4434.4 307.55 0.006 4442.2 315.35 0.006 4453.7 326.85 0.006 4455.2 328.35 0.006 4466.5 339.65 0.006 4414.7 287.85 0.014332.6 305.75 0.014337.4 310.55 0.014346.4 319.55 0.014351.6 324.75 0.014368.7 341.85 0.014326.1 299.25 0.018339.1 312.25 0.018345.4 318.55 0.018351.6 324.75 0.018360.6 333.75 0.018367.7 340.85 0.018318.7 291.85 0.024 6523.1 296.25 0.024 6526.6 299.75 0.024 6532.1 305.25 0.024 6541.6 314.75 0.024 6557.3 330.45 0.024 6561.7 334.85 0.024 6568.4 341.55 0.024 65
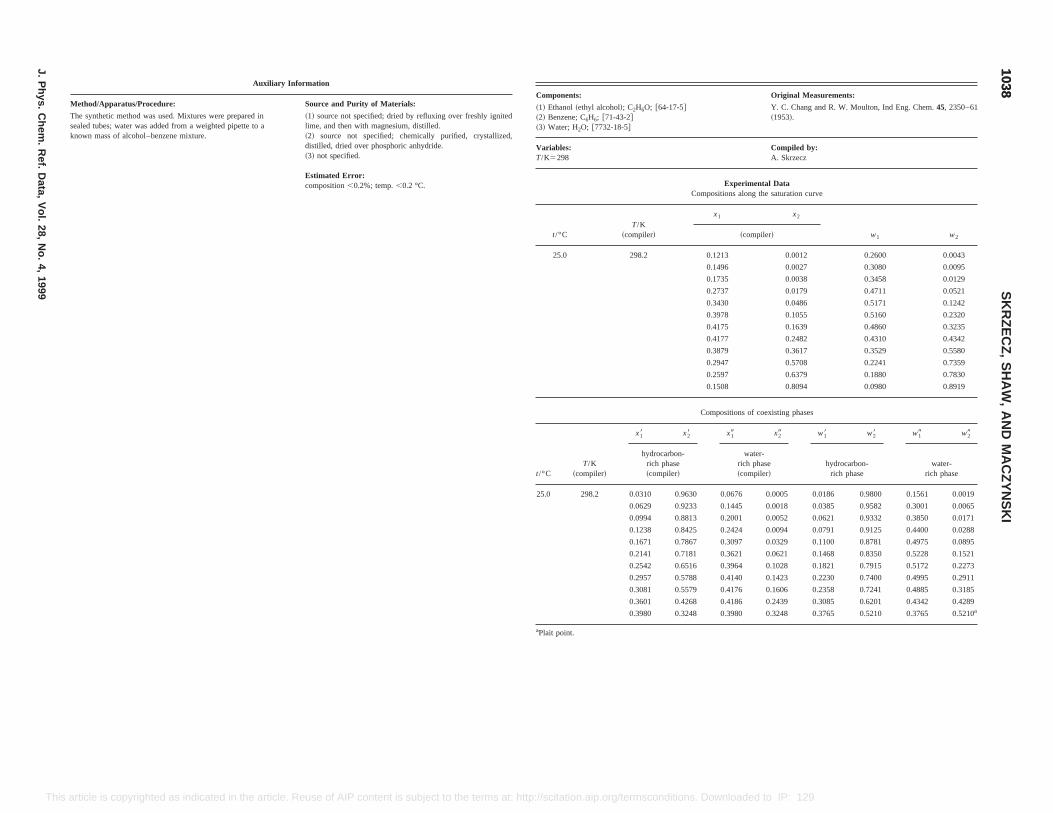
Original Measurements:
; @64-17-5# Y. C. Chang and R. W. Moulton, Ind Eng. Chem.45, 2350–61~1953!.
Compiled by:A. Skrzecz
Experimental DataCompositions along the saturation curve
r!
x1 x2
w1 w2~compiler!
0.1213 0.0012 0.2600 0.0043
0.1496 0.0027 0.3080 0.0095
0.1735 0.0038 0.3458 0.0129
0.2737 0.0179 0.4711 0.0521
0.3430 0.0486 0.5171 0.1242
0.3978 0.1055 0.5160 0.2320
0.4175 0.1639 0.4860 0.3235
0.4177 0.2482 0.4310 0.4342
0.3879 0.3617 0.3529 0.5580
0.2947 0.5708 0.2241 0.7359
0.2597 0.6379 0.1880 0.7830
0.1508 0.8094 0.0980 0.8919
Compositions of coexisting phases
x28 x19 x29 w18 w28 w19 w29
drocarbon-ich phaseompiler!
water-rich phase~compiler!
hydrocarbon-rich phase
water-rich phase
0 0.9630 0.0676 0.0005 0.0186 0.9800 0.1561 0.0019
9 0.9233 0.1445 0.0018 0.0385 0.9582 0.3001 0.0065
4 0.8813 0.2001 0.0052 0.0621 0.9332 0.3850 0.0171
0.1238 0.8425 0.2424 0.0094 0.0791 0.9125 0.4400 0.0288
0.1671 0.7867 0.3097 0.0329 0.1100 0.8781 0.4975 0.0895
0.2141 0.7181 0.3621 0.0621 0.1468 0.8350 0.5228 0.1521
0.2542 0.6516 0.3964 0.1028 0.1821 0.7915 0.5172 0.2273
0.2957 0.5788 0.4140 0.1423 0.2230 0.7400 0.4995 0.2911
0.3081 0.5579 0.4176 0.1606 0.2358 0.7241 0.4885 0.3185
0.3601 0.4268 0.4186 0.2439 0.3085 0.6201 0.4342 0.4289
0.3980 0.3248 0.3980 0.3248 0.3765 0.5210 0.3765 0.5210a
aPlait point.
10381038
SK
RZ
EC
Z,
SH
AW
,A
ND
MA
CZ
YN
SK
I
J.P
hys.C
hem.
Ref.
Data,
Vol.
28,N
o.4,
1999
This ted in the article. Reuse of AIP content is subject to the terms at: http://scitation.aip.org/termsconditions. Downloaded to IP: 129.6.105.191 On: Fri, 05 Sep 2014 17:51:55
article is copyrighted as indicaAuxiliary Information
Method/Apparatus/Procedure: Source and Purity of Materials:
The synthetic method was used. Mixtures were prepared insealed tubes; water was added from a weighted pipette to aknown mass of alcohol–benzene mixture.
~1! source not specified; dried by refluxing over freshly ignitedlime, and then with magnesium, distilled.~2! source not specified; chemically purified, crystallized,distilled, dried over phosphoric anhydride.~3! not specified.
Estimated Error:composition,0.2%; temp.,0.2 °C.
Components:
~1! Ethanol~ethyl alcohol!; C2H6O~2! Benzene; C6H6; @71-43-2#~3! Water; H2O; @7732-18-5#
Variables:T/K5298
t/°CT/K
~compile
25.0 298.2
t/°CT/K
~compiler!
x18
hyr~c
25.0 298.2 0.031
0.062
0.099
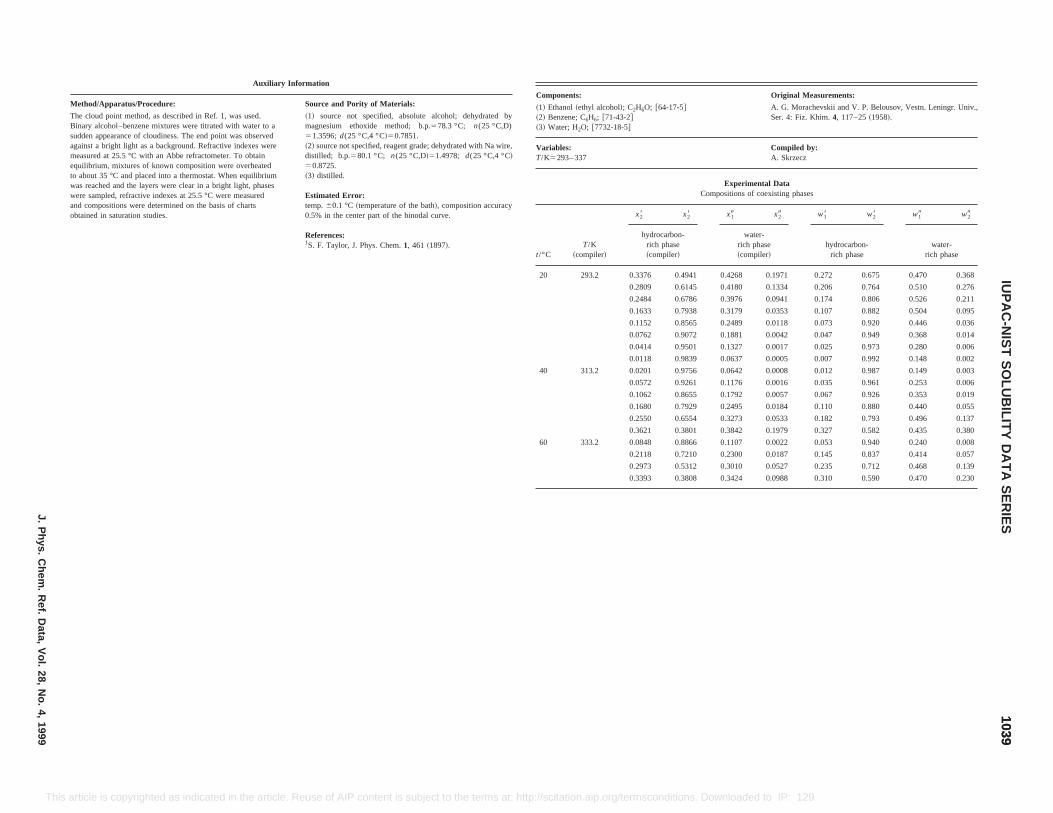
ted by,D)
Na wire,°C!
racy
Components: Original Measurements:
~1! Ethanol~ethyl alcohol!; C2H6O; @64-17-5#~2! Benzene; C6H6; @71-43-2#~3! Water; H2O; @7732-18-5#
A. G. Morachevskii and V. P. Belousov, Vestn. Leningr. Univ.,Ser. 4: Fiz. Khim.4, 117–25~1958!.
Variables:T/K5293– 337
Compiled by:A. Skrzecz
Experimental DataCompositions of coexisting phases
t/°CT/K
~compiler!
x28 x28 x19 x29 w18 w28 w19 w29
hydrocarbon-rich phase~compiler!
water-rich phase~compiler!
hydrocarbon-rich phase
water-rich phase
20 293.2 0.3376 0.4941 0.4268 0.1971 0.272 0.675 0.470 0.368
0.2809 0.6145 0.4180 0.1334 0.206 0.764 0.510 0.276
0.2484 0.6786 0.3976 0.0941 0.174 0.806 0.526 0.211
0.1633 0.7938 0.3179 0.0353 0.107 0.882 0.504 0.095
0.1152 0.8565 0.2489 0.0118 0.073 0.920 0.446 0.036
0.0762 0.9072 0.1881 0.0042 0.047 0.949 0.368 0.014
0.0414 0.9501 0.1327 0.0017 0.025 0.973 0.280 0.006
0.0118 0.9839 0.0637 0.0005 0.007 0.992 0.148 0.002
40 313.2 0.0201 0.9756 0.0642 0.0008 0.012 0.987 0.149 0.003
0.0572 0.9261 0.1176 0.0016 0.035 0.961 0.253 0.006
0.1062 0.8655 0.1792 0.0057 0.067 0.926 0.353 0.019
0.1680 0.7929 0.2495 0.0184 0.110 0.880 0.440 0.055
0.2550 0.6554 0.3273 0.0533 0.182 0.793 0.496 0.137
0.3621 0.3801 0.3842 0.1979 0.327 0.582 0.435 0.380
60 333.2 0.0848 0.8866 0.1107 0.0022 0.053 0.940 0.240 0.008
0.2118 0.7210 0.2300 0.0187 0.145 0.837 0.414 0.057
0.2973 0.5312 0.3010 0.0527 0.235 0.712 0.468 0.139
0.3393 0.3808 0.3424 0.0988 0.310 0.590 0.470 0.230
10391039
IUP
AC
-NIS
TS
OLU
BILIT
YD
AT
AS
ER
IESJ.P
hys.C
hem.
Ref.
Data,
Vol.
28,N
o.4,
1999
This ticle. Reuse of AIP content is subject to the terms at: http://scitation.aip.org/termsconditions. Downloaded to IP: 129.6.105.191 On: Fri, 05 Sep 2014 17:51:55
article is copyrighted as indicated in the arAuxiliary Information
Method/Apparatus/Procedure: Source and Pority of Materials:
The cloud point method, as described in Ref. 1, was used.Binary alcohol–benzene mixtures were titrated with water to asudden appearance of cloudiness. The end point was observedagainst a bright light as a background. Refractive indexes weremeasured at 25.5 °C with an Abbe refractometer. To obtainequilibrium, mixtures of known composition were overheatedto about 35 °C and placed into a thermostat. When equilibriumwas reached and the layers were clear in a bright light, phaseswere sampled, refractive indexes at 25.5 °C were measuredand compositions were determined on the basis of chartsobtained in saturation studies.
~1! source not specified, absolute alcohol; dehydramagnesium ethoxide method; b.p.578.3 °C; n(25 °C51.3596;d(25 °C,4 °C!50.7851.~2! source not specified, reagent grade; dehydrated withdistilled; b.p.580.1 °C; n(25 °C,D!51.4978; d(25 °C,450.8725.~3! distilled.
Estimated Error:temp.60.1 °C ~temperature of the bath!, composition accu0.5% in the center part of the binodal curve.
References:1S. F. Taylor, J. Phys. Chem.1, 461 ~1897!.
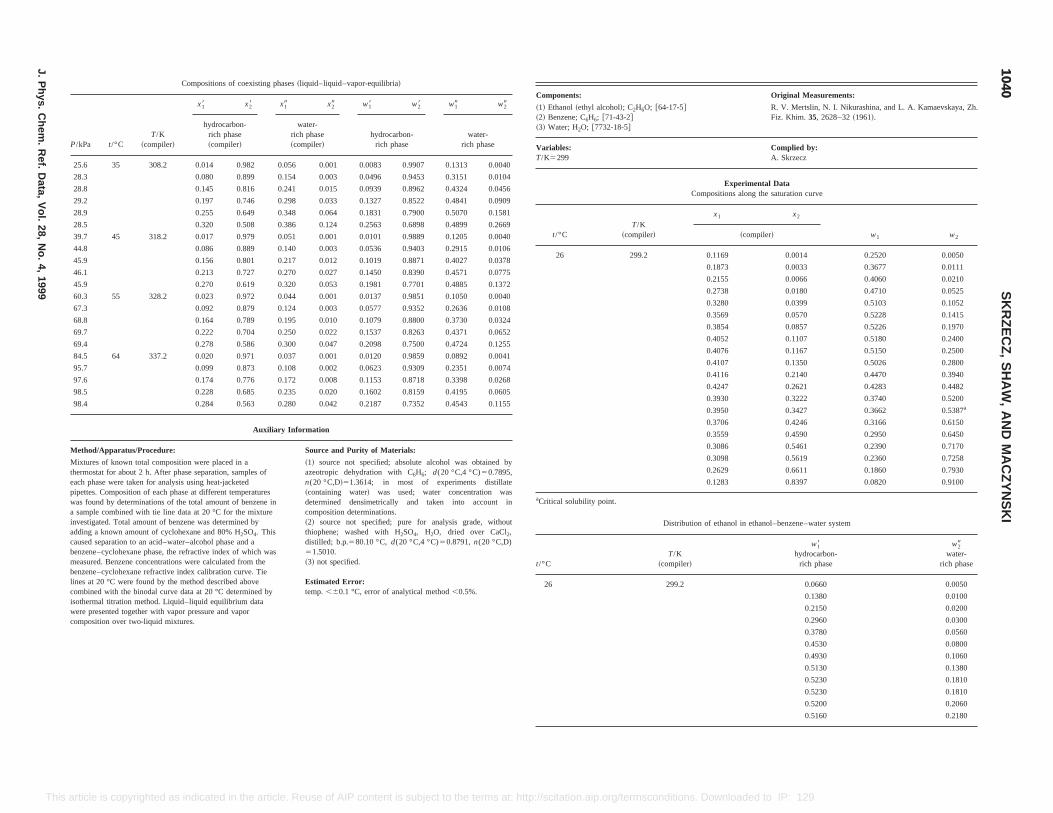
Original Measurements:
R. V. Mertslin, N. I. Nikurashina, and L. A. Kamaevskaya, Zh.Fiz. Khim. 35, 2628–32~1961!.
Complied by:A. Skrzecz
rimental Dataalong the saturation curve
x2
w1 w2compiler!
0.0014 0.2520 0.0050
0.0033 0.3677 0.0111
0.0066 0.4060 0.0210
0.0180 0.4710 0.0525
0.0399 0.5103 0.1052
0.0570 0.5228 0.1415
0.0857 0.5226 0.1970
0.1107 0.5180 0.2400
0.1167 0.5150 0.2500
0.1350 0.5026 0.2800
0.2140 0.4470 0.3940
0.2621 0.4283 0.4482
0.3222 0.3740 0.5200
0.3427 0.3662 0.5387a
0.4246 0.3166 0.6150
0.4590 0.2950 0.6450
0.5461 0.2390 0.7170
0.5619 0.2360 0.7258
0.6611 0.1860 0.7930
0.8397 0.0820 0.9100
in ethanol–benzene–water system
T/K~compiler!
w18hydrocarbon-
rich phase
w29water-
rich phase
299.2 0.0660 0.0050
0.1380 0.0100
0.2150 0.0200
0.2960 0.0300
0.3780 0.0560
0.4530 0.0800
0.4930 0.1060
0.5130 0.1380
0.5230 0.1810
0.5230 0.1810
0.5200 0.2060
0.5160 0.2180
10401040
SK
RZ
EC
Z,
SH
AW
,A
ND
MA
CZ
YN
SK
I
J.P
hys.C
hem.
Ref.
Data,
Vol.
28,N
o.4,
1999
This sconditions. Downloaded to IP: 129.6.105.191 On: Fri, 05 Sep 2014 17:51:55
adding a known amount of cyclohexane and 80% H2SO4. Thiscaused separation to an acid–water–alcohol phase and abenzene–cyclohexane phase, the refractive index of which wasmeasured. Benzene concentrations were calculated from thebenzene–cyclohexane refractive index calibration curve. Tielines at 20 °C were found by the method described abovecombined with the binodal curve data at 20 °C determined byisothermal titration method. Liquid–liquid equilibrium datawere presented together with vapor pressure and vaporcomposition over two-liquid mixtures.
thiophene; washed with H2SO4, H2O, dried over CaCl2,distilled; b.p.580.10 °C, d(20 °C,4 °C)50.8791,n(20 °C,D)51.5010.~3! not specified.
Estimated Error:temp.,60.1 °C, error of analytical method,0.5%.
t/°C
26
article is copyrighted as indicated in the article. Reuse of AIP content is subject to the terms at: http://scitation.aip.org/term
Compositions of coexisting phases~liquid–liquid–vapor-equilibria!
P/kPa t/°CT/K
~compiler!
x18 x28 x19 x29 w18 w28 w19 w29
hydrocarbon-rich phase~compiler!
water-rich phase~compiler!
hydrocarbon-rich phase
water-rich phase
25.6 35 308.2 0.014 0.982 0.056 0.001 0.0083 0.9907 0.1313 0.0040
28.3 0.080 0.899 0.154 0.003 0.0496 0.9453 0.3151 0.0104
28.8 0.145 0.816 0.241 0.015 0.0939 0.8962 0.4324 0.0456
29.2 0.197 0.746 0.298 0.033 0.1327 0.8522 0.4841 0.0909
28.9 0.255 0.649 0.348 0.064 0.1831 0.7900 0.5070 0.1581
28.5 0.320 0.508 0.386 0.124 0.2563 0.6898 0.4899 0.2669
39.7 45 318.2 0.017 0.979 0.051 0.001 0.0101 0.9889 0.1205 0.0040
44.8 0.086 0.889 0.140 0.003 0.0536 0.9403 0.2915 0.0106
45.9 0.156 0.801 0.217 0.012 0.1019 0.8871 0.4027 0.0378
46.1 0.213 0.727 0.270 0.027 0.1450 0.8390 0.4571 0.0775
45.9 0.270 0.619 0.320 0.053 0.1981 0.7701 0.4885 0.1372
60.3 55 328.2 0.023 0.972 0.044 0.001 0.0137 0.9851 0.1050 0.0040
67.3 0.092 0.879 0.124 0.003 0.0577 0.9352 0.2636 0.0108
68.8 0.164 0.789 0.195 0.010 0.1079 0.8800 0.3730 0.0324
69.7 0.222 0.704 0.250 0.022 0.1537 0.8263 0.4371 0.0652
69.4 0.278 0.586 0.300 0.047 0.2098 0.7500 0.4724 0.1255
84.5 64 337.2 0.020 0.971 0.037 0.001 0.0120 0.9859 0.0892 0.0041
95.7 0.099 0.873 0.108 0.002 0.0623 0.9309 0.2351 0.0074
97.6 0.174 0.776 0.172 0.008 0.1153 0.8718 0.3398 0.0268
98.5 0.228 0.685 0.235 0.020 0.1602 0.8159 0.4195 0.0605
98.4 0.284 0.563 0.280 0.042 0.2187 0.7352 0.4543 0.1155
Auxiliary Information
Method/Apparatus/Procedure: Source and Purity of Materials:
Mixtures of known total composition were placed in athermostat for about 2 h. After phase separation, samples ofeach phase were taken for analysis using heat-jacketedpipettes. Composition of each phase at different temperatureswas found by determinations of the total amount of benzene ina sample combined with tie line data at 20 °C for the mixtureinvestigated. Total amount of benzene was determined by
~1! source not specified; absolute alcohol was obtained byazeotropic dehydration with C6H6; d(20 °C,4 °C)50.7895,n(20 °C,D!51.3614; in most of experiments distillate~containing water! was used; water concentration wasdetermined densimetrically and taken into account incomposition determinations.~2! source not specified; pure for analysis grade, without
Components:
~1! Ethanol~ethyl alcohol!; C2H6O; @64-17-5#~2! Benzene; C6H6; @71-43-2#~3! Water; H2O; @7732-18-5#
Variables:T/K5299
ExpeCompositions
t/°CT/K
~compiler!
x1
~
26 299.2 0.1169
0.1873
0.2155
0.2738
0.3280
0.3569
0.3854
0.4052
0.4076
0.4107
0.4116
0.4247
0.3930
0.3950
0.3706
0.3559
0.3086
0.3098
0.2629
0.1283
aCritical solubility point.
Distribution of ethanol
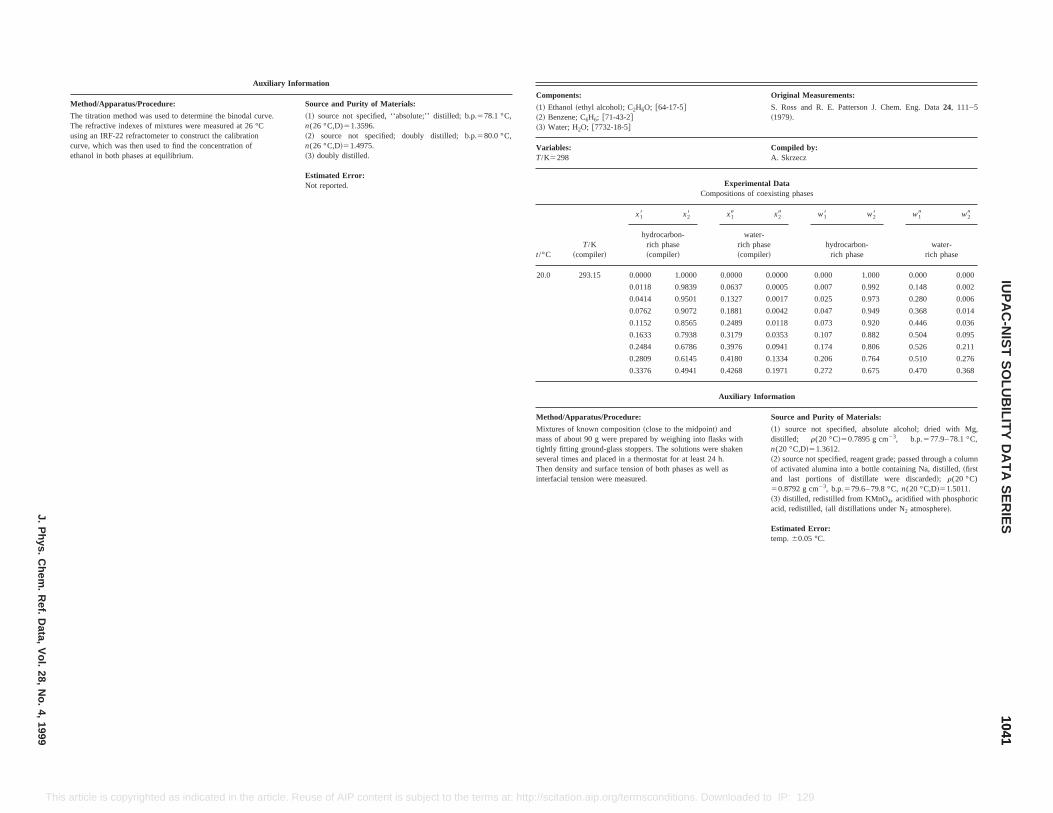
ponents: Original Measurements:
thanol~ethyl alcohol!; C2H6O; @64-17-5#enzene; C6H6; @71-43-2#ater; H2O; @7732-18-5#
S. Ross and R. E. Patterson J. Chem. Eng. Data24, 111–5~1979!.
bles:298
Compiled by:A. Skrzecz
Experimental DataCompositions of coexisting phases
T/K~compiler!
x18 x28 x19 x29 w18 w28 w19 w29
hydrocarbon-rich phase~compiler!
water-rich phase~compiler!
hydrocarbon-rich phase
water-rich phase
293.15 0.0000 1.0000 0.0000 0.0000 0.000 1.000 0.000 0.000
0.0118 0.9839 0.0637 0.0005 0.007 0.992 0.148 0.002
0.0414 0.9501 0.1327 0.0017 0.025 0.973 0.280 0.006
0.0762 0.9072 0.1881 0.0042 0.047 0.949 0.368 0.014
0.1152 0.8565 0.2489 0.0118 0.073 0.920 0.446 0.036
0.1633 0.7938 0.3179 0.0353 0.107 0.882 0.504 0.095
0.2484 0.6786 0.3976 0.0941 0.174 0.806 0.526 0.211
0.2809 0.6145 0.4180 0.1334 0.206 0.764 0.510 0.276
0.3376 0.4941 0.4268 0.1971 0.272 0.675 0.470 0.368
Auxiliary Information
od/Apparatus/Procedure: Source and Purity of Materials:
res of known composition~close to the midpoint! ands of about 90 g were prepared by weighing into flasks withly fitting ground-glass stoppers. The solutions were shakenral times and placed in a thermostat for at least 24 h.density and surface tension of both phases as well as
facial tension were measured.
~1! source not specified, absolute alcohol; dried with Mg,distilled; r(20 °C!50.7895 g cm23, b.p.577.9– 78.1 °C,n(20 °C,D!51.3612.~2! source not specified, reagent grade; passed through a columnof activated alumina into a bottle containing Na, distilled,~firstand last portions of distillate were discarded!; r(20 °C)50.8792 g cm23, b.p.579.6– 79.8 °C,n(20 °C,D!51.5011.~3! distilled, redistilled from KMnO4, acidified with phosphoricacid, redistilled,~all distillations under N2 atmosphere!.
Estimated Error:temp.60.05 °C.
10411041
IUP
AC
-NIS
TS
OLU
BILIT
YD
AT
AS
ER
IESJ.P
hys.C
hem.
Ref.
Data,
Vol.
28,N
o.4,
1999
This ated in the article. Reuse of AIP content is subject to the terms at: http://scitation.aip.org/termsconditions. Downloaded to IP: 129.6.105.191 On: Fri, 05 Sep 2014 17:51:55
article is copyrighted as indicAuxiliary Information
Method/Apparatus/Procedure: Source and Purity of Materials:
The titration method was used to determine the binodal curve.The refractive indexes of mixtures were measured at 26 °Cusing an IRF-22 refractometer to construct the calibrationcurve, which was then used to find the concentration ofethanol in both phases at equilibrium.
~1! source not specified, ‘‘absolute;’’ distilled; b.p.578.1 °C,n(26 °C,D)51.3596.~2! source not specified; doubly distilled; b.p.580.0 °C,n(26 °C,D!51.4975.~3! doubly distilled.
Estimated Error:Not reported.
Com
~1! E~2! B~3! W
VariaT/K5
t/°C
20.0
Meth
MixtumastightseveTheninter

Original Measurements:
-5# V. Brandani, A. Chianese, and M. Rossi, J. Chem. Eng. Data30,27–9 ~1985!.
Complied by:A. Skrzecz
Experimental DataCompositions of coexisting phases
x28 x19 x29 w18 w28 w19 w29
on-se
water-rich phase
hydrocarbon-rich phase~compiler!
water-rich phase~compiler!
0.971 0.055 0.001 0.009 0.988 0.129 0.004
0.935 0.133 0.003 0.032 0.965 0.279 0.011
0.846 0.233 0.015 0.078 0.914 0.422 0.046
0.816 0.243 0.015 0.090 0.899 0.435 0.046
0.781 0.273 0.025 0.110 0.876 0.463 0.072
0.725 0.315 0.039 0.133 0.845 0.497 0.104
0.712 0.314 0.051 0.141 0.836 0.484 0.133
0.662 0.343 0.082 0.173 0.801 0.485 0.197
0.595 0.370 0.127 0.205 0.756 0.473 0.275
0.555 0.376 0.162 0.223 0.729 0.452 0.330
0.545 0.385 0.154 0.235 0.719 0.466 0.316
0.526 0.377 0.179 0.239 0.707 0.441 0.355
0.415 0.378 0.256 0.305 0.615 0.396 0.454
0.353 0.365 0.353 0.340 0.557 0.340 0.557a
0.971 0.052 0.001 0.011 0.986 0.123 0.004
0.918 0.129 0.004 0.040 0.956 0.272 0.014
0.806 0.210 0.014 0.097 0.891 0.391 0.044
0.776 0.233 0.016 0.108 0.876 0.421 0.049
0.709 0.270 0.025 0.139 0.836 0.459 0.072
0.674 0.305 0.039 0.162 0.811 0.486 0.105
0.670 0.306 0.054 0.164 0.808 0.472 0.141
Auxiliary Information
Method/Apparatus/Procedure: Source and Purity of Materials:
The analytical method was used. Mixtures were stirred in anequilibrium cell fitted with a jacket for the circulating fluidand equipped with a mechanical stirrer. After equilibrium wasreached each layer was withdrawn with a syringe and thecomposition was determined by glc~Carlo Erba Fractovap2400 T, 2 m Poropak column, thermal conductivity detector;peak areas were measured with S-3380 Hewlett–Packardintegrator!. Calibration curves were prepared for thecompositions closed to solubility curve at 20 °C. Each reportedresult is a mean of four analysis.
~1! source not specified, reagent grade; used as received.~2! source not specified, reagent grade; used as received.~3! doubly distilled.
Estimated Error:temp.60.05 °C; composition accuracy61%.
10421042
SK
RZ
EC
Z,
SH
AW
,A
ND
MA
CZ
YN
SK
I
J.P
hys.C
hem.
Ref.
Data,
Vol.
28,N
o.4,
1999
This ded to IP: 129.6.105.191 On: Fri, 05 Sep 2014 17:51:55
0.265 0.592 0.324 0.094 0.200 0.758 0.456 0.224
0.316 0.472 0.357 0.197 0.264 0.667 0.413 0.386
0.324 0.436 0.356 0.237 0.280 0.639 0.388 0.438
0.344 0.330 0.344 0.330 0.334 0.543 0.334 0.543a
55.00 328.15 0.026 0.960 0.046 0.002 0.016 0.981 0.109 0.008
0.029 0.957 0.049 0.002 0.017 0.979 0.116 0.008
0.094 0.875 0.125 0.005 0.059 0.933 0.264 0.018
0.181 0.755 0.197 0.014 0.122 0.861 0.372 0.045
0.183 0.747 0.209 0.017 0.124 0.858 0.387 0.053
0.203 0.711 0.223 0.016 0.141 0.836 0.407 0.050
0.241 0.643 0.256 0.024 0.175 0.792 0.443 0.070
0.267 0.596 0.293 0.034 0.201 0.759 0.477 0.094
0.268 0.581 0.287 0.060 0.204 0.751 0.446 0.158
0.302 0.476 0.316 0.127 0.253 0.675 0.422 0.287
0.344 0.351 0.343 0.151 0.325 0.562 0.430 0.321
0.354 0.271 0.354 0.271 0.369 0.479 0.369 0.479a
aPlait point estimated by the authors.
article is copyrighted as indicated in the article. Reuse of AIP content is subject to the terms at: http://scitation.aip.org/termsconditions. Downloa
Components:
~1! Ethanol~ethyl alcohol!; C2H6O; @64-17~2! Benzene; C6H6; @71-43-2#~3! Water; H2O; @7732-18-5#
Variables:T/K5303– 328
t/°CT/K
~compiler!
x18
hydrocarbrich pha
30.00 303.15 0.015
0.053
0.123
0.138
0.166
0.194
0.203
0.242
0.274
0.288
0.302
0.302
0.349
0.365
40.00 313.15 0.019
0.065
0.149
0.163
0.200
0.228
0.230
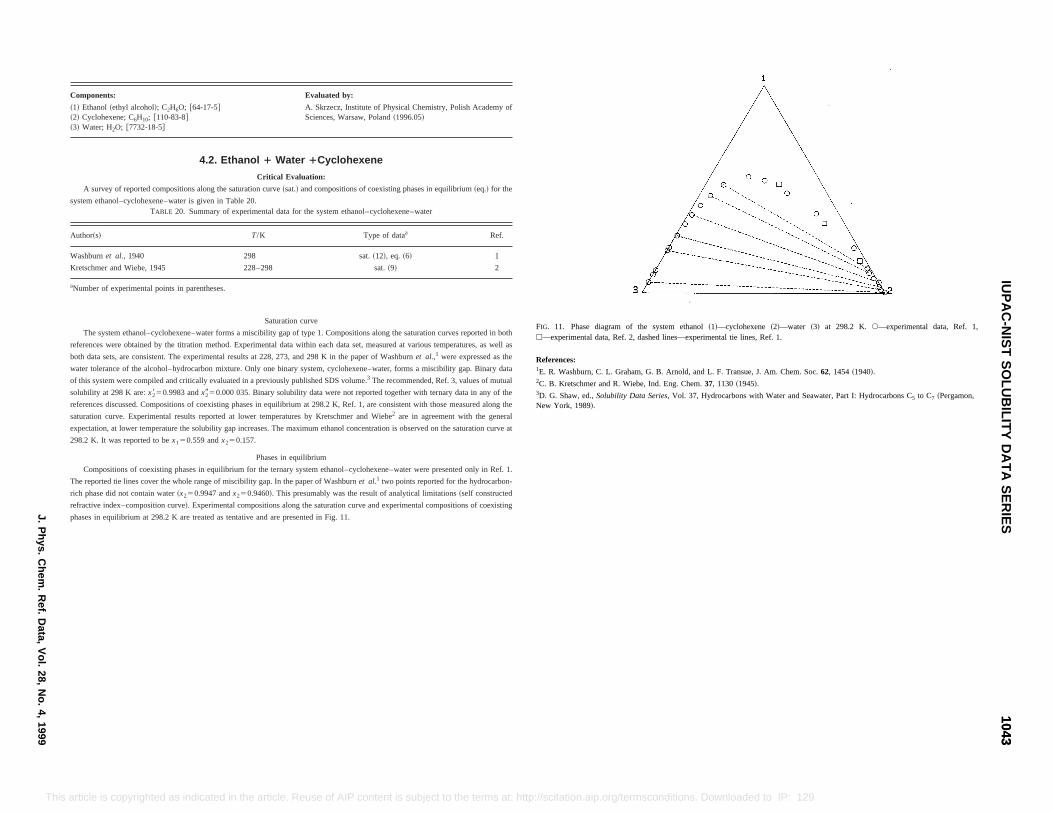
hemistry, Polish Academy of
es in equilibrium~eq.! for the
e–water
Ref.
1
2
saturation curves reported in both
at various temperatures, as well as
hburnal.,1 were expressed as the
rms a miscibility gap. Binary data
ed, Ref. 3, values of mutual
with ternary data in any of the
stent with those measured along the
greement with the general
observed on the saturation curve at
ater were presented only in Ref. 1.
ported for the hydrocarbon-
al limitations~self constructed
ental compositions of coexisting
FIG. 11. Phase diagram of the system ethanol~1!—cyclohexene~2!—water ~3! at 298.2 K. s—experimental data, Ref. 1,h—experimental data, Ref. 2, dashed lines—experimental tie lines, Ref. 1.
References:1E. R. Washburn, C. L. Graham, G. B. Arnold, and L. F. Transue, J. Am. Chem. Soc.62, 1454~1940!.2C. B. Kretschmer and R. Wiebe, Ind. Eng. Chem.37, 1130~1945!.3D. G. Shaw, ed.,Solubility Data Series, Vol. 37, Hydrocarbons with Water and Seawater, Part I: Hydrocarbons C5 to C7 ~Pergamon,New York, 1989!.
10431043
IUP
AC
-NIS
TS
OLU
BILIT
YD
AT
AS
ER
IESJ.P
hys.C
hem.
Ref.
Data,
Vol.
28,N
o.4,
1999
This a p://scitation.aip.org/termsconditions. Downloaded to IP: 129.6.105.191 On: Fri, 05 Sep 2014 17:51:55
rticle is copyrighted as indicated in the article. Reuse of AIP content is subject to the terms at: httComponents: Evaluated by:
~1! Ethanol~ethyl alcohol!; C2H6O; @64-17-5#~2! Cyclohexene; C6H10; @110-83-8#~3! Water; H2O; @7732-18-5#
A. Skrzecz, Institute of Physical CSciences, Warsaw, Poland~1996.05!
4.2. Ethanol 1 Water 1Cyclohexene
Critical Evaluation:
A survey of reported compositions along the saturation curve~sat.! and compositions of coexisting phas
system ethanol–cyclohexene–water is given in Table 20.TABLE 20. Summary of experimental data for the system ethanol–cyclohexen
Author~s! T/K Type of dataa
Washburnet al., 1940 298 sat.~12!, eq. ~6!
Kretschmer and Wiebe, 1945 228–298 sat.~9!
aNumber of experimental points in parentheses.
Saturation curve
The system ethanol–cyclohexene–water forms a miscibility gap of type 1. Compositions along the
references were obtained by the titration method. Experimental data within each data set, measured
both data sets, are consistent. The experimental results at 228, 273, and 298 K in the paper of Waset
water tolerance of the alcohol–hydrocarbon mixture. Only one binary system, cyclohexene–water, fo
of this system were compiled and critically evaluated in a previously published SDS volume.3 The recommend
solubility at 298 K are:x2850.9983 andx2950.000 035. Binary solubility data were not reported together
references discussed. Compositions of coexisting phases in equilibrium at 298.2 K, Ref. 1, are consi
saturation curve. Experimental results reported at lower temperatures by Kretschmer and Wiebe2 are in a
expectation, at lower temperature the solubility gap increases. The maximum ethanol concentration is
298.2 K. It was reported to bex150.559 andx250.157.
Phases in equilibrium
Compositions of coexisting phases in equilibrium for the ternary system ethanol–cyclohexene–w
The reported tie lines cover the whole range of miscibility gap. In the paper of Washburnet al.1 two points re
rich phase did not contain water~x250.9947 andx250.9460!. This presumably was the result of analytic
refractive index–composition curve!. Experimental compositions along the saturation curve and experim
phases in equilibrium at 298.2 K are treated as tentative and are presented in Fig. 11.

Original Measurements:
64-17-5# C. B. Kretschmer and R. Wiebe, Ind. Eng. Chem.37, 1130–2~1945!.
Compiled by:A. Skrzecz
Experimental DataCompositions along the saturation curve
x1 x2 w1 w2
~compiler! ~compiler!
0.5967 0.3420 0.4849 0.4956
0.3586 0.6166 0.2443 0.7491
0.1610 0.8304 0.0979 0.9001
0.5531 0.3170 0.4731 0.4835
0.3463 0.5954 0.2420 0.7420
0.1593 0.8218 0.0976 0.8979
0.5234 0.3000 0.4643 0.4745
0.3371 0.5797 0.2403 0.7366
0.1581 0.8156 0.0974 0.8962
Comments and Additional Dataed with probable error,0.5% at the range245–25 °C by the equation: log(S)5a2b/(T/K!. The
om plots. Water tolerance was defined as:S5H2O% by volume•~100 - Hydrocarbon % by volume in
vol %hydrocarbon a b
90 1.312 477.5
75 2.051 530.4
50 2.332 487.6
Auxiliary Information
Method/Apparatus/Procedure: Source and Purity of Materials:
saried.pettesntthe
rbond as
~1! source not specified; anhydrous ethanol.~2! source not specified; b.p.582.55– 82.65 °C.~3! not specified.
Estimated Error:temp. within about 0.3 °C ~duplicate determinations!;composition,0.2% relative of volume fraction.
10441044
SK
RZ
EC
Z,
SH
AW
,A
ND
MA
CZ
YN
SK
I
J.P
hys.C
hem.
Ref.
Data,
Vol.
28,N
o.4,
1999
This ded to IP: 129.6.105.191 On: Fri, 05 Sep 2014 17:51:55
0.0992 0.8836 0.4689 0.0461 0.059 0.937 0.633 0.111
0.1219 0.8653 0.5209 0.0731 0.073 0.924 0.643 0.161
Auxiliary Information
Method/Apparatus/Procedure: Source and Purity of Materials:
The titration method, as described in Ref. 1, was used. Thetitrant, from a weighed pipette, was added to the weighedbinary mixture of known composition and the mixture waskept in a thermostated bath. To confirm that the end-point wasreached the mixture was shaken automatically for at least 15min and then reexamined. The plot of refractive index againstcomposition was then used to find compositions of equilibriumphases. The refractive indexes were determinated at thetemperature of 30.0 °C to eliminate an opalescence.
~1! Eastman Kodak Company, commercial grade; dried byrefluxing over active lime, twice distilled;d(25 °C,4 °C!50.7851,n(25 °C,D!51.359 42.~2! Eastman Kodak Company, commercial grade; distilled in anatmosphere of purified N2, collected in dried nitrogen-filledbottles;d(25 °C,4 °C!50.8056,n(25 °C,D!51.4434.~3! not specified.
Estimated Error:temp.60.05 °C.
References:1E. R. Washburn and A. E. Beguin, J. Am. Chem. Soc.62, 579~1940!.
A glass tube with stirrer containing the ternary mixture waimmersed in a bath, the temperature of which could be vMixtures were prepared directly in the tube, by special piat 15.5 °C. Precautions to exclude moisture and to preveevaporation were observed. No correction was made forslight expansion in volume when alcohol was mixed withhydrocarbon. In the paper the experimental results wereexpressed as the water tolerance of the alcohol–hydrocablend. For practical purposes water tolerance was definethe volume per cent of water which can be added beforeseparation occurs.
article is copyrighted as indicated in the article. Reuse of AIP content is subject to the terms at: http://scitation.aip.org/termsconditions. Downloa
Components: Original Measurements:
~1! Ethanol~ethyl alcohol!; C2H6O; @64-17-5#~2! Cyclohexene; C6H10; @110-83-8#~3! Water; H2O; @7732-18-5#
E. R. Washburn, C. L. Graham, G. B. Arnold, and L. F. Transue,J. Am. Chem. Soc.62, 1454–7~1940!.
Variables:T/K5298
Compiled by:A. Skrzecz
Experimental DataCompositions along the saturation curve
t/°CT/K
~compiler!
x1 x2
w1 w2~compiler!
25.0 298.15 0.0727 0.9155 0.0425 0.9548
0.2195 0.7607 0.1386 0.8565
0.3827 0.5229 0.2831 0.6896
0.4811 0.3537 0.4090 0.5361
0.5415 0.2315 0.5192 0.3957
0.5592 0.1570 0.5886 0.2946
0.5213 0.0733 0.6431 0.1613
0.4215 0.0285 0.6132 0.0739
0.3313 0.0105 0.5454 0.0308
0.2189 0.0017 0.4156 0.0059
0.1098 0.0004 0.2394 0.0017
0.0884 0.0003 0.1985 0.0012
Compositions of coexisting phases
t/°CT/K
~compiler!
x18 x28 x19 x29 w18 w28 w19 w29
hydrocarbon-rich phase~compiler!
water-rich phase~compiler! hydrocarbon-rich phase water-rich phase
25.0 298.15 0.0053 0.9947 0.0521 0.0007 0.003 0.997 0.123 0.003
0.0176 0.9734 0.2054 0.0009 0.010 0.988 0.397 0.003
0.0314 0.9596 0.2762 0.0057 0.018 0.980 0.487 0.018
0.0540 0.9460 0.3753 0.0166 0.031 0.969 0.584 0.046
Components:
~1! Ethanol~ethyl alcohol!; C2H6O; @~2! Cyclohexene; C6H10; @110-83-8#~3! Water; H2O; @7732-18-5#
Variables:T/K52282298
t/°CT/K
~compiler!
245.0 228.2
0.0 273.2
25.0 298.2
Water tolerance~S! was describparameters~a,b! were determined frthe blend!/100
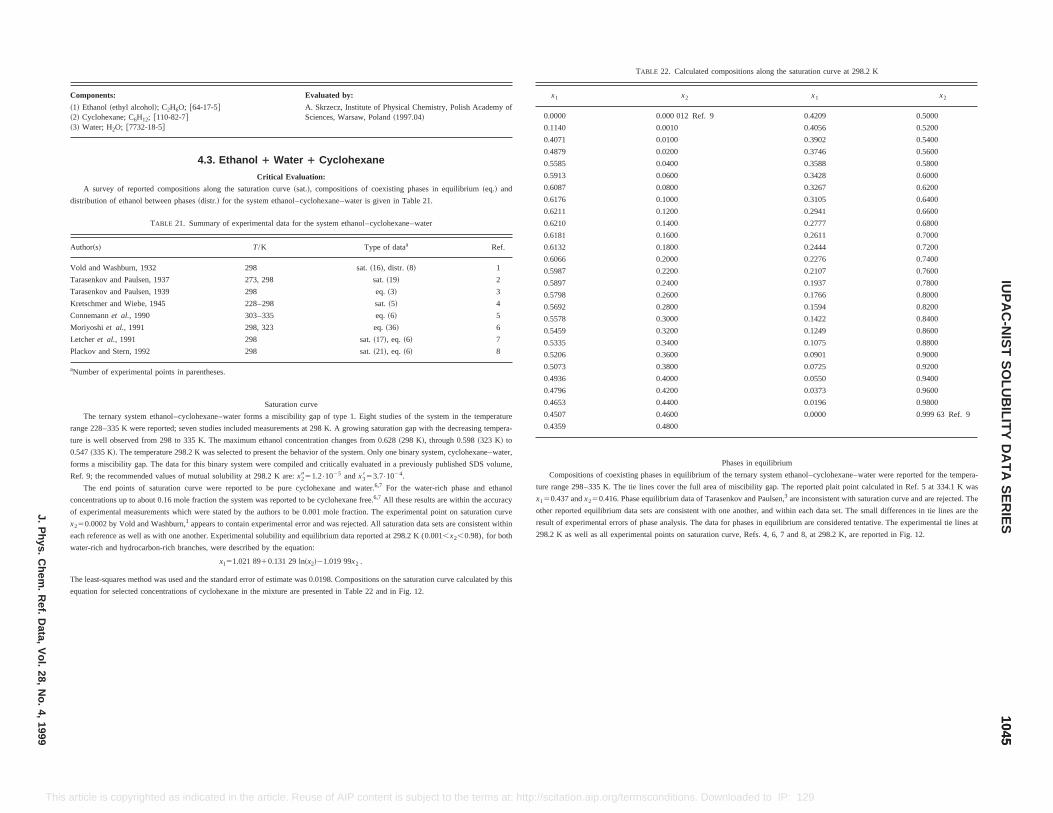
a-
r,
e
TABLE 22. Calculated compositions along the saturation curve at 298.2 K
x1 x2 x1 x2
.0000 0.000 012 Ref. 9 0.4209 0.5000
.1140 0.0010 0.4056 0.5200
.4071 0.0100 0.3902 0.5400
.4879 0.0200 0.3746 0.5600
.5585 0.0400 0.3588 0.5800
.5913 0.0600 0.3428 0.6000
.6087 0.0800 0.3267 0.6200
.6176 0.1000 0.3105 0.6400
.6211 0.1200 0.2941 0.6600
.6210 0.1400 0.2777 0.6800
.6181 0.1600 0.2611 0.7000
.6132 0.1800 0.2444 0.7200
.6066 0.2000 0.2276 0.7400
.5987 0.2200 0.2107 0.7600
.5897 0.2400 0.1937 0.7800
.5798 0.2600 0.1766 0.8000
.5692 0.2800 0.1594 0.8200
.5578 0.3000 0.1422 0.8400
.5459 0.3200 0.1249 0.8600
.5335 0.3400 0.1075 0.8800
.5206 0.3600 0.0901 0.9000
.5073 0.3800 0.0725 0.9200
.4936 0.4000 0.0550 0.9400
.4796 0.4200 0.0373 0.9600
.4653 0.4400 0.0196 0.9800
.4507 0.4600 0.0000 0.999 63 Ref. 9
.4359 0.4800
Phases in equilibrium
Compositions of coexisting phases in equilibrium of the ternary system ethanol–cyclohexane–water were reported for the tempera-
range 298–335 K. The tie lines cover the full area of miscibility gap. The reported plait point calculated in Ref. 5 at 334.1 K was
0.437 andx250.416. Phase equilibrium data of Tarasenkov and Paulsen,3 are inconsistent with saturation curve and are rejected. The
er reported equilibrium data sets are consistent with one another, and within each data set. The small differences in tie lines are the
ult of experimental errors of phase analysis. The data for phases in equilibrium are considered tentative. The experimental tie lines at
ll experimental points on saturation curve, Refs. 4, 6, 7 and 8, at 298.2 K, are reported in Fig. 12.
10451045
IUP
AC
-NIS
TS
OLU
BILIT
YD
AT
AS
ER
IESJ.P
hys.C
hem.
Ref.
Data,
Vol.
28,N
o.4,
1999
This rg/termsconditions. Downloaded to IP: 129.6.105.191 On: Fri, 05 Sep 2014 17:51:55
each reference as well as with one another. Experimental solubility and equilibrium data reported at 298.2 K (0.001,x2,0.98), for both
water-rich and hydrocarbon-rich branches, were described by the equation:
x151.021 8910.131 29 ln~x2!21.019 99x2 .
The least-squares method was used and the standard error of estimate was 0.0198. Compositions on the saturation curve calculated by this
equation for selected concentrations of cyclohexane in the mixture are presented in Table 22 and in Fig. 12.
298.2 K as well as a
article is copyrighted as indicated in the article. Reuse of AIP content is subject to the terms at: http://scitation.aip.o
Components: Evaluated by:
~1! Ethanol~ethyl alcohol!; C2H6O; @64-17-5#~2! Cyclohexane; C6H12; @110-82-7#~3! Water; H2O; @7732-18-5#
A. Skrzecz, Institute of Physical Chemistry, Polish Academy ofSciences, Warsaw, Poland~1997.04!
4.3. Ethanol 1 Water 1 Cyclohexane
Critical Evaluation:
A survey of reported compositions along the saturation curve~sat.!, compositions of coexisting phases in equilibrium~eq.! and
distribution of ethanol between phases~distr.! for the system ethanol–cyclohexane–water is given in Table 21.
TABLE 21. Summary of experimental data for the system ethanol–cyclohexane–water
Author~s! T/K Type of dataa Ref.
Vold and Washburn, 1932 298 sat.~16!, distr. ~8! 1
Tarasenkov and Paulsen, 1937 273, 298 sat.~19! 2
Tarasenkov and Paulsen, 1939 298 eq.~3! 3
Kretschmer and Wiebe, 1945 228–298 sat.~5! 4
Connemannet al., 1990 303–335 eq.~6! 5
Moriyoshi et al., 1991 298, 323 eq.~36! 6
Letcheret al., 1991 298 sat.~17!, eq. ~6! 7
Plackov and Stern, 1992 298 sat.~21!, eq. ~6! 8
aNumber of experimental points in parentheses.
Saturation curve
The ternary system ethanol–cyclohexane–water forms a miscibility gap of type 1. Eight studies of the system in the temperature
range 228–335 K were reported; seven studies included measurements at 298 K. A growing saturation gap with the decreasing temper
ture is well observed from 298 to 335 K. The maximum ethanol concentration changes from 0.628~298 K!, through 0.598~323 K! to
0.547~335 K!. The temperature 298.2 K was selected to present the behavior of the system. Only one binary system, cyclohexane–wate
forms a miscibility gap. The data for this binary system were compiled and critically evaluated in a previously published SDS volume,
Ref. 9; the recommended values of mutual solubility at 298.2 K are:x2951.2•1025 andx3853.7•1024.
The end points of saturation curve were reported to be pure cyclohexane and water.6,7 For the water-rich phase and ethanol
concentrations up to about 0.16 mole fraction the system was reported to be cyclohexane free.6,7 All these results are within the accuracy
of experimental measurements which were stated by the authors to be 0.001 mole fraction. The experimental point on saturation curv
x250.0002 by Vold and Washburn,1 appears to contain experimental error and was rejected. All saturation data sets are consistent within
0
0
0
0
0
0
0
0
0
0
0
0
0
0
0
0
0
0
0
0
0
0
0
0
0
0
0
ture
x15
oth
res
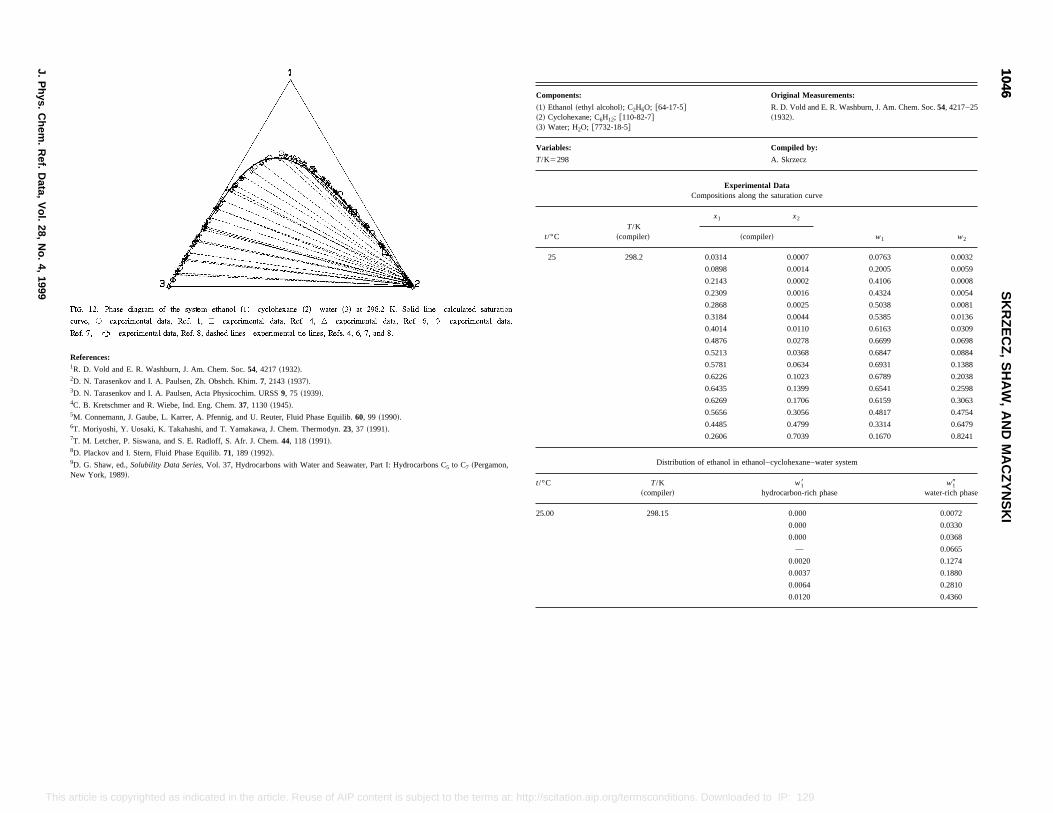
Original Measurements:
C2H6O; @64-17-5#10-82-7#
-5#
R. D. Vold and E. R. Washburn, J. Am. Chem. Soc.54, 4217–25~1932!.
Compiled by:
A. Skrzecz
Experimental DataCompositions along the saturation curve
T/Kmpiler!
x1 x2
w1 w2~compiler!
298.2 0.0314 0.0007 0.0763 0.0032
0.0898 0.0014 0.2005 0.0059
0.2143 0.0002 0.4106 0.0008
0.2309 0.0016 0.4324 0.0054
0.2868 0.0025 0.5038 0.0081
0.3184 0.0044 0.5385 0.0136
0.4014 0.0110 0.6163 0.0309
0.4876 0.0278 0.6699 0.0698
0.5213 0.0368 0.6847 0.0884
0.5781 0.0634 0.6931 0.1388
0.6226 0.1023 0.6789 0.2038
0.6435 0.1399 0.6541 0.2598
0.6269 0.1706 0.6159 0.3063
0.5656 0.3056 0.4817 0.4754
0.4485 0.4799 0.3314 0.6479
0.2606 0.7039 0.1670 0.8241
Distribution of ethanol in ethanol–cyclohexane–water system
T/K~compiler!
w18hydrocarbon-rich phase
w19water-rich phase
298.15 0.000 0.0072
0.000 0.0330
0.000 0.0368
— 0.0665
0.0020 0.1274
0.0037 0.1880
0.0064 0.2810
0.0120 0.4360
10461046
SK
RZ
EC
Z,
SH
AW
,A
ND
MA
CZ
YN
SK
I
J.P
hys.C
hem.
Ref.
Data,
Vol.
28,N
o.4,
1999
This s at: http://scitation.aip.org/termsconditions. Downloaded to IP: 129.6.105.191 On: Fri, 05 Sep 2014 17:51:55
article is copyrighted as indicated in the article. Reuse of AIP content is subject to the termReferences:1R. D. Vold and E. R. Washburn, J. Am. Chem. Soc.54, 4217~1932!.2D. N. Tarasenkov and I. A. Paulsen, Zh. Obshch. Khim.7, 2143~1937!.3D. N. Tarasenkov and I. A. Paulsen, Acta Physicochim. URSS9, 75 ~1939!.4C. B. Kretschmer and R. Wiebe, Ind. Eng. Chem.37, 1130~1945!.5M. Connemann, J. Gaube, L. Karrer, A. Pfennig, and U. Reuter, Fluid Phase Equilib.60, 99 ~1990!.6T. Moriyoshi, Y. Uosaki, K. Takahashi, and T. Yamakawa, J. Chem. Thermodyn.23, 37 ~1991!.7T. M. Letcher, P. Siswana, and S. E. Radloff, S. Afr. J. Chem.44, 118 ~1991!.8D. Plackov and I. Stern, Fluid Phase Equilib.71, 189 ~1992!.9D. G. Shaw, ed.,Solubility Data Series, Vol. 37, Hydrocarbons with Water and Seawater, Part I: Hydrocarbons C5 to C7 ~Pergamon,New York, 1989!.
Components:
~1! Ethanol~ethyl alcohol!;~2! Cyclohexane; C6H12; @1~3! Water; H2O; @7732-18
Variables:
T/K5298
t/°C ~co
25
t/°C
25.00
Original Measurements:
4-17-5# D. N. Tarasenkov and I. A. Paulsen, Zh. Obshch. Khim.7,2143–8~1937!.
Compiled by:A. Skrzecz
Experimental DataCompositions along the saturation curve
x1 x2
w1 w2~compiler!
0.2316 0.7426 0.1449 0.8488
0.3521 0.5680 0.2478 0.7302
0.4245 0.5131 0.3062 0.6762
0.6001 0.3085 0.5003 0.4699
0.6636 0.1900 0.6214 0.3250
0.6298 0.0699 0.7198 0.1460
0.5971 0.0533 0.7184 0.1171
0.4920 0.0182 0.6863 0.0465
0.4288 0.0090 0.6447 0.0247
0.3228 0.0040 0.5441 0.0122
0.1682 0.0006 0.3402 0.0023
0.4477 0.4797 0.3310 0.6480
0.5658 0.3056 0.4818 0.4754
0.6110 0.2388 0.5524 0.3945
0.6329 0.2050 0.5911 0.3497
0.6357 0.1401 0.6491 0.2614
0.6004 0.0773 0.6920 0.1627
0.5212 0.0369 0.6845 0.0885
0.3806 0.0075 0.6007 0.0217
Auxiliary Information
Source and Purity of Materials:
A titration method similar to that in Ref. 1 was used. A flaskof 100 mL capacity containing a binary cyclohexane–alcoholmixture of known composition, by weight, was placed in athermostat. The mixture was titrated with water from amicroburette with a scale of 0.01 mL, until opalescence,emulsion or turbidity was observed. Samples of the samebinary composition were titrated several times.
~1! source not specified; purity of 99.97% for 3 points of thelower alcohol concentration at each temperature and purity of92.64% for all other points.~2! source not specified; distilled; b.p.580.9 °C,d(20 °C,4 °C!50.7744.~3! source not specified.
Estimated Error:temp.60.05 °C.
References:1R. E. Washburn, J. Am. Soc.53, 3237 ~1931!.
10471047
IUP
AC
-NIS
TS
OLU
BILIT
YD
AT
AS
ER
IESJ.P
hys.C
hem.
Ref.
Data,
Vol.
28,N
o.4,
1999
This se of AIP content is subject to the terms at: http://scitation.aip.org/termsconditions. Downloaded to IP: 129.6.105.191 On: Fri, 05 Sep 2014 17:51:55
article is copyrighted as indicated in the article. ReuAuxiliary Information
Method/Apparatus/Procedure: Source and Purity of Materials:
The titration method was used to obtain points on thesaturation curve. A 100 mL flask containing weighed amountsof ethanol and cyclohexane was suspended in a temperaturecontrolled water bath at 24.8 °C and water was added from aweighed pipette until phase separation occurred. Theappearance of a second phase was taken as the end-point.After each addition of water the flask was shaken for 30 s andthen allowed to stand for at least 5 min. The flask was openonly during addition of water from the pipette. The change ofweight due to evaporation was no larger than 0.3%. Refractiveindex of each saturated mixture was measured at 25.0 °C,0.2 °C above the titration temperature in order to assurehomogeneous solutions. To determine the distribution ofethanol between water and organic phases, mixtures of 10 mLof water and different amounts of ethanol were prepared inglass-stoppered bottles, suspended in a thermostat 25.00 °C for12 h and then the refractive indexes of both phases weremeasured and compared with those obtained for saturationmixtures.
~1! source not specified; absolute-standard commercial grade;refluxed over freshly ignited lime, distilled from an all-glassapparatus until density showed it to be 99.91% alcohol by Ref. 1.~2! Eastman Kodak Co.; the best grade; fractionally crystallized,distilled, dried over Na, distilled;r50.773 79 g/cm3, f.p.56.20 °C.~3! double distilled over KMnO4.
Estimated Error:temp.60.2 K ~estimated by the compiler!.
References:1International Critical Tables, Vol. 3 ~McGraw Hill, New York,1929!.
Components:
~1! Ethanol~ethyl alcohol!; C2H6O; @6~2! Cyclohexane; C6H12; @110-82-7#~3! Water; H2O; @7732-18-5#
Variables:T/K5273– 298
t/°CT/K
~compiler!
0.0 273.15
20.0 298.15
Method/Apparatus/Procedure:
Original Measurements:
O; @64-17-5#-7#
C. B. Kretschmer and R. Wiebe, Ind. Eng. Chem.37, 1130–2~1945!.
Compiled by:
A. Skrzecz
Experimental DataCompositions along the saturation curve
iler!
x1 x2 w1 w2
~compiler! ~compiler!
.2 0.8347 0.1495 0.7493 0.2452a
.2 0.6991 0.1252 0.7015 0.2295a
.2 0.5680 0.3052 0.4834 0.4745
0.3604 0.5809 0.2495 0.7346
0.1662 0.8037 0.1010 0.8919
lid cyclohexane.
Comments and Additional Datacribed with probable error, 0.5% at the range245–25 °C by the equation: log(S)5a2b/(T/K). Thed from plots. Water tolerance was defined as:S5H2O % by volume•~100-Hydrocarbon % by volume in
vol %hydrocarbon a b
90 1.856 628.7
75 2.421 693.4
50 2.850 693.4
25 6.328 1526.0
in equilibrium with solid cylohexane.
Auxiliary Information
Source and Purity of Materials:
A glass tube with stirrer containing the ternary mixture wasimmersed in a bath, the temperature of which could be varied.Mixtures were prepared directly in the tube, by special pipettesat 15.5 °C. Precautions to exclude moisture and to preventevaporation were observed. No correction was made for theslight expansion in volume when alcohol was mixed withhydrocarbon. In the paper the experimental results wereexpressed as the water tolerance of the alcohol–hydrocarbonblend. For practical purposes water tolerance was defined asthe volume per cent of water which can be added beforeseparation occurs.
~1! source not specified; anhydrous ethanol.~2! source not specified; b.p.578– 81 °C.~3! not specified.
Estimated Error:temp. within about 0.3 °C ~duplicate determinations!;composition,0.2% relative of volume fraction.
10481048
SK
RZ
EC
Z,
SH
AW
,A
ND
MA
CZ
YN
SK
I
J.P
hys.C
hem.
Ref.
Data,
Vol.
28,N
o.4,
1999
This erms at: http://scitation.aip.org/termsconditions. Downloaded to IP: 129.6.105.191 On: Fri, 05 Sep 2014 17:51:55
article is copyrighted as indicated in the article. Reuse of AIP content is subject to the tComponents: Original Measurements:
~1! Ethanol~ethyl alcohol!; C2H6O; @64-17-5#~2! Cyclohexane; C6H12; @110-82-7#~3! Water; H2O; @7732-18-5#
D. N. Tarasenkov and I. A. Paulsen, Acta Physicochim. URSS9,75–86~1939!.
Variables: Compiled by:
T/K5298 A. Skrzecz
Experimental DataCompositions of coexisting phases
t/°CT/K
~compiler!
x18 x28 x19 x29 w18 w28 w19 w29
hydrocarbon-rich phase~compiler!
water-rich phase~compiler! hydrocarbon-rich phase water-rich phase
25.0 298.2 0.0110 0.9743 0.2530 0.0036 0.0061 0.9907 0.4598 0.0119
0.0278 0.9563 0.3284 0.0044 0.0156 0.9809 0.5498 0.0135
0.1607 0.7915 0.6135 0.1125 0.0989 0.8896 0.6624 0.2219
Auxiliary Information
Method/Apparatus/Procedure: Source and Purity of Materials:
Not described. The data were also reported in Refs. 1 and 2. ~1! source not specified.~2! source not specified.~3! source not specified.
Estimated Error:Not reported.
References:1D. N. Tarasenkov and I. A. Paulsen, Zh. Obshch. Khim.7, 2143~1937!.2D. N. Tarasenkov and I. A. Paulsen, Zh. Obshch. Khim.8, 76~1938!.
Components:
~1! Ethanol~ethyl alcohol!; C2H6
~2! Cyclohexane; C6H12; @110-82~3! Water; H2O; @7732-18-5#
Variables:
T/K5298
t/°CT/K
~comp
245.0 228
0.0 273
25.0 298
aSolution in equilibrium with so
Water tolerance~S! was desparameters~a,b! were determinethe blend!/100
at the range245–0 °C; solution
Method/Apparatus/Procedure:
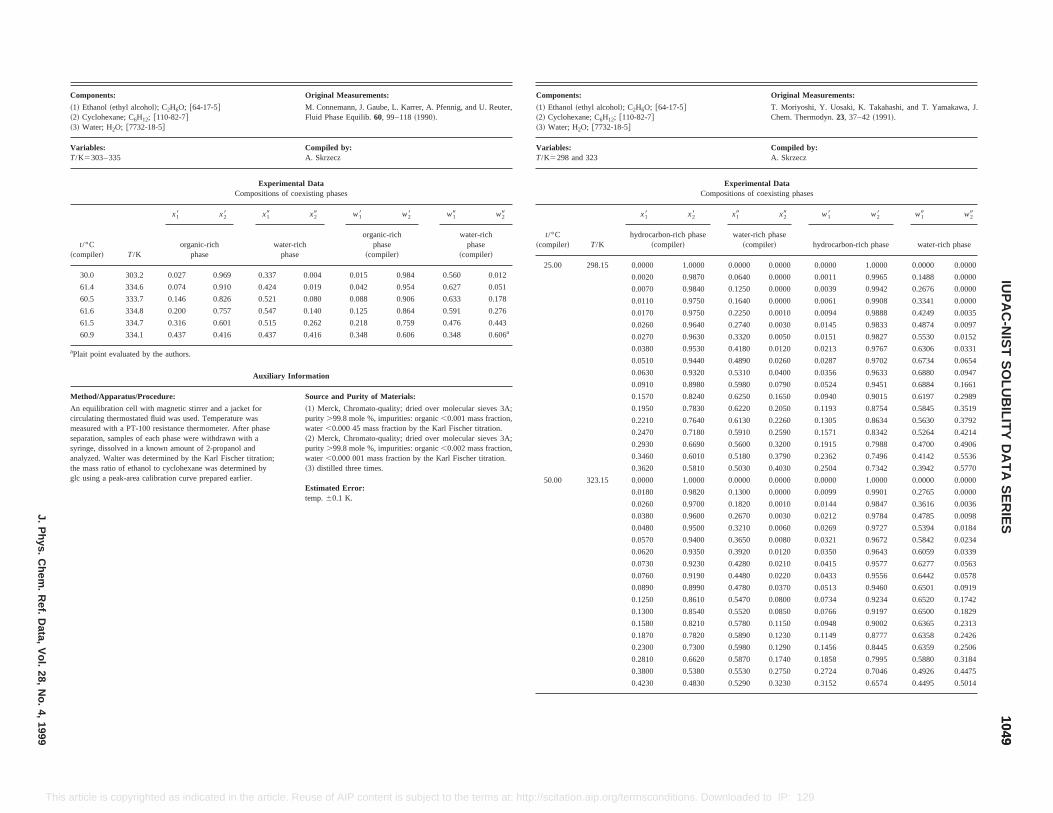
Original Measurements:
T. Moriyoshi, Y. Uosaki, K. Takahashi, and T. Yamakawa, J.Chem. Thermodyn.23, 37–42~1991!.
Compiled by:A. Skrzecz
Experimental Datampositions of coexisting phases
x19 x29 w18 w28 w19 w29
e water-rich phase~compiler! hydrocarbon-rich phase water-rich phase
0 0.0000 0.0000 0.0000 1.0000 0.0000 0.0000
0.0640 0.0000 0.0011 0.9965 0.1488 0.0000
0.1250 0.0000 0.0039 0.9942 0.2676 0.0000
0.1640 0.0000 0.0061 0.9908 0.3341 0.0000
0.2250 0.0010 0.0094 0.9888 0.4249 0.0035
0.2740 0.0030 0.0145 0.9833 0.4874 0.0097
0.3320 0.0050 0.0151 0.9827 0.5530 0.0152
0.4180 0.0120 0.0213 0.9767 0.6306 0.0331
0.4890 0.0260 0.0287 0.9702 0.6734 0.0654
0.5310 0.0400 0.0356 0.9633 0.6880 0.0947
0.5980 0.0790 0.0524 0.9451 0.6884 0.1661
0.6250 0.1650 0.0940 0.9015 0.6197 0.2989
0.6220 0.2050 0.1193 0.8754 0.5845 0.3519
0.6130 0.2260 0.1305 0.8634 0.5630 0.3792
0.5910 0.2590 0.1571 0.8342 0.5264 0.4214
0.5600 0.3200 0.1915 0.7988 0.4700 0.4906
0.5180 0.3790 0.2362 0.7496 0.4142 0.5536
0.5030 0.4030 0.2504 0.7342 0.3942 0.5770
0 0.0000 0.0000 0.0000 1.0000 0.0000 0.0000
0.1300 0.0000 0.0099 0.9901 0.2765 0.0000
0.1820 0.0010 0.0144 0.9847 0.3616 0.0036
0.2670 0.0030 0.0212 0.9784 0.4785 0.0098
0.3210 0.0060 0.0269 0.9727 0.5394 0.0184
0.0570 0.9400 0.3650 0.0080 0.0321 0.9672 0.5842 0.0234
0.0620 0.9350 0.3920 0.0120 0.0350 0.9643 0.6059 0.0339
0.0730 0.9230 0.4280 0.0210 0.0415 0.9577 0.6277 0.0563
0.0760 0.9190 0.4480 0.0220 0.0433 0.9556 0.6442 0.0578
0.0890 0.8990 0.4780 0.0370 0.0513 0.9460 0.6501 0.0919
0.1250 0.8610 0.5470 0.0800 0.0734 0.9234 0.6520 0.1742
0.1300 0.8540 0.5520 0.0850 0.0766 0.9197 0.6500 0.1829
0.1580 0.8210 0.5780 0.1150 0.0948 0.9002 0.6365 0.2313
0.1870 0.7820 0.5890 0.1230 0.1149 0.8777 0.6358 0.2426
0.2300 0.7300 0.5980 0.1290 0.1456 0.8445 0.6359 0.2506
0.2810 0.6620 0.5870 0.1740 0.1858 0.7995 0.5880 0.3184
0.3800 0.5380 0.5530 0.2750 0.2724 0.7046 0.4926 0.4475
0.4230 0.4830 0.5290 0.3230 0.3152 0.6574 0.4495 0.5014
10491049
IUP
AC
-NIS
TS
OLU
BILIT
YD
AT
AS
ER
IESJ.P
hys.C
hem.
Ref.
Data,
Vol.
28,N
o.4,
1999
This http://scitation.aip.org/termsconditions. Downloaded to IP: 129.6.105.191 On: Fri, 05 Sep 2014 17:51:55
article is copyrighted as indicated in the article. Reuse of AIP content is subject to the terms at:Components: Original Measurements:
~1! Ethanol~ethyl alcohol!; C2H6O; @64-17-5#~2! Cyclohexane; C6H12; @110-82-7#~3! Water; H2O; @7732-18-5#
M. Connemann, J. Gaube, L. Karrer, A. Pfennig, and U. Reuter,Fluid Phase Equilib.60, 99–118~1990!.
Variables:T/K5303– 335
Compiled by:A. Skrzecz
Experimental DataCompositions of coexisting phases
t/°C~compiler! T/K
x18 x28 x19 x29 w18 w28 w19 w29
organic-richphase
water-richphase
organic-richphase
~compiler!
water-richphase
~compiler!
30.0 303.2 0.027 0.969 0.337 0.004 0.015 0.984 0.560 0.012
61.4 334.6 0.074 0.910 0.424 0.019 0.042 0.954 0.627 0.051
60.5 333.7 0.146 0.826 0.521 0.080 0.088 0.906 0.633 0.178
61.6 334.8 0.200 0.757 0.547 0.140 0.125 0.864 0.591 0.276
61.5 334.7 0.316 0.601 0.515 0.262 0.218 0.759 0.476 0.443
60.9 334.1 0.437 0.416 0.437 0.416 0.348 0.606 0.348 0.606a
aPlait point evaluated by the authors.
Auxiliary Information
Method/Apparatus/Procedure: Source and Purity of Materials:
An equilibration cell with magnetic stirrer and a jacket forcirculating thermostated fluid was used. Temperature wasmeasured with a PT-100 resistance thermometer. After phaseseparation, samples of each phase were withdrawn with asyringe, dissolved in a known amount of 2-propanol andanalyzed. Walter was determined by the Karl Fischer titration;the mass ratio of ethanol to cyclohexane was determined byglc using a peak-area calibration curve prepared earlier.
~1! Merck, Chromato-quality; dried over molecular sieves 3A;purity .99.8 mole %, impurities: organic,0.001 mass fraction,water,0.000 45 mass fraction by the Karl Fischer titration.~2! Merck, Chromato-quality; dried over molecular sieves 3A;purity .99.8 mole %, impurities: organic,0.002 mass fraction,water,0.000 001 mass fraction by the Karl Fischer titration.~3! distilled three times.
Estimated Error:temp.60.1 K.
Components:
~1! Ethanol~ethyl alcohol!; C2H6O; @64-17-5#~2! Cyclohexane; C6H12; @110-82-7#~3! Water; H2O; @7732-18-5#
Variables:T/K5298 and 323
Co
t/°C~compiler! T/K
x18 x28
hydrocarbon-rich phas~compiler!
25.00 298.15 0.0000 1.000
0.0020 0.9870
0.0070 0.9840
0.0110 0.9750
0.0170 0.9750
0.0260 0.9640
0.0270 0.9630
0.0380 0.9530
0.0510 0.9440
0.0630 0.9320
0.0910 0.8980
0.1570 0.8240
0.1950 0.7830
0.2210 0.7640
0.2470 0.7180
0.2930 0.6690
0.3460 0.6010
0.3620 0.5810
50.00 323.15 0.0000 1.000
0.0180 0.9820
0.0260 0.9700
0.0380 0.9600
0.0480 0.9500
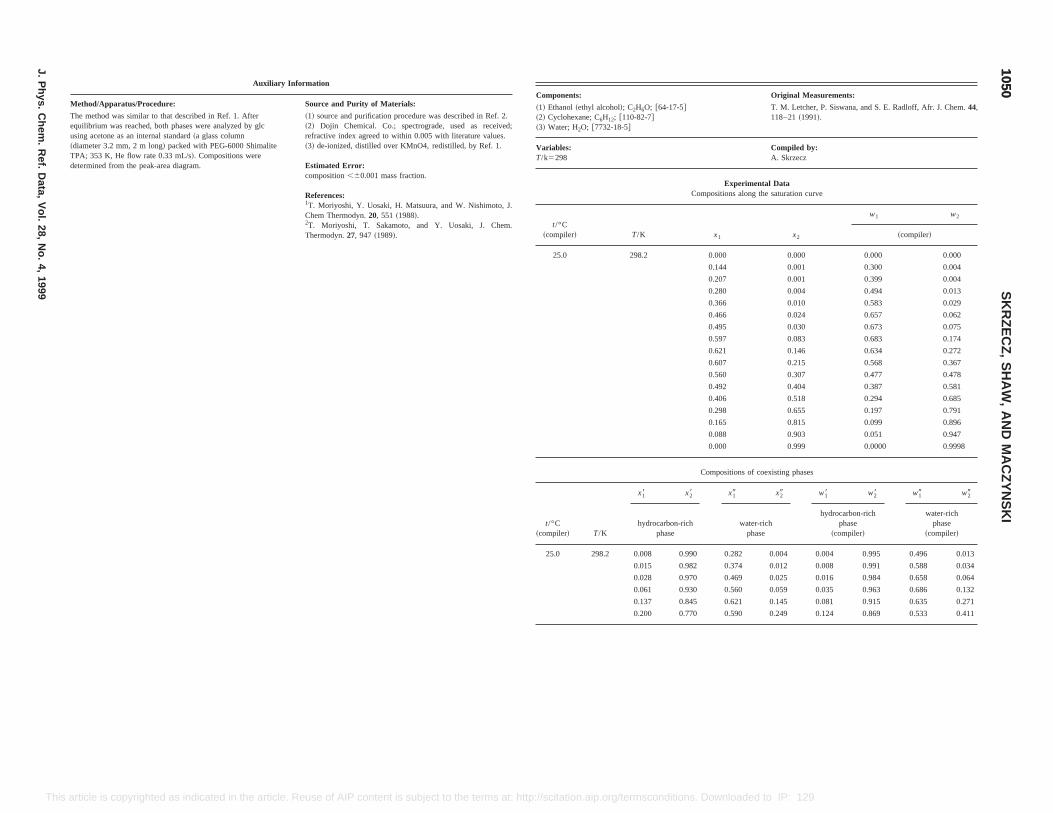
Original Measurements:
6O; @64-17-5#2-7#
T. M. Letcher, P. Siswana, and S. E. Radloff, Afr. J. Chem.44,118–21~1991!.
Compiled by:A. Skrzecz
Experimental DataCompositions along the saturation curve
K x1 x2
w1 w2
~compiler!
8.2 0.000 0.000 0.000 0.000
0.144 0.001 0.300 0.004
0.207 0.001 0.399 0.004
0.280 0.004 0.494 0.013
0.366 0.010 0.583 0.029
0.466 0.024 0.657 0.062
0.495 0.030 0.673 0.075
0.597 0.083 0.683 0.174
0.621 0.146 0.634 0.272
0.607 0.215 0.568 0.367
0.560 0.307 0.477 0.478
0.492 0.404 0.387 0.581
0.406 0.518 0.294 0.685
0.298 0.655 0.197 0.791
0.165 0.815 0.099 0.896
0.088 0.903 0.051 0.947
0.000 0.999 0.0000 0.9998
Compositions of coexisting phases
~compiler! T/K
18 x28 x19 x29 w18 w28 w19 w29
ydrocarbon-richphase
water-richphase
hydrocarbon-richphase
~compiler!
water-richphase
~compiler!
25.0 298.2 0.008 0.990 0.282 0.004 0.004 0.995 0.496 0.013
0.015 0.982 0.374 0.012 0.008 0.991 0.588 0.034
0.028 0.970 0.469 0.025 0.016 0.984 0.658 0.064
0.061 0.930 0.560 0.059 0.035 0.963 0.686 0.132
0.137 0.845 0.621 0.145 0.081 0.915 0.635 0.271
0.200 0.770 0.590 0.249 0.124 0.869 0.533 0.411
10501050
SK
RZ
EC
Z,
SH
AW
,A
ND
MA
CZ
YN
SK
I
J.P
hys.C
hem.
Ref.
Data,
Vol.
28,N
o.4,
1999
This article. Reuse of AIP content is subject to the terms at: http://scitation.aip.org/termsconditions. Downloaded to IP: 129.6.105.191 On: Fri, 05 Sep 2014 17:51:55
article is copyrighted as indicated in theAuxiliary Information
Method/Apparatus/Procedure: Source and Purity of Materials:
The method was similar to that described in Ref. 1. Afterequilibrium was reached, both phases were analyzed by glcusing acetone as an internal standard~a glass column~diameter 3.2 mm, 2 m long! packed with PEG-6000 ShimaliteTPA; 353 K, He flow rate 0.33 mL/s!. Compositions weredetermined from the peak-area diagram.
~1! source and purification procedure was described in Ref. 2.~2! Dojin Chemical. Co.; spectrograde, used as received;refractive index agreed to within 0.005 with literature values.~3! de-ionized, distilled over KMnO4, redistilled, by Ref. 1.
Estimated Error:composition,60.001 mass fraction.
References:1T. Moriyoshi, Y. Uosaki, H. Matsuura, and W. Nishimoto, J.Chem Thermodyn.20, 551 ~1988!.2T. Moriyoshi, T. Sakamoto, and Y. Uosaki, J. Chem.Thermodyn.27, 947 ~1989!.
Components:
~1! Ethanol~ethyl alcohol!; C2H~2! Cyclohexane; C6H12; @110-8~3! Water; H2O; @7732-18-5#
Variables:T/k5298
t/°C~compiler! T/
25.0 29
t/°C
x
h
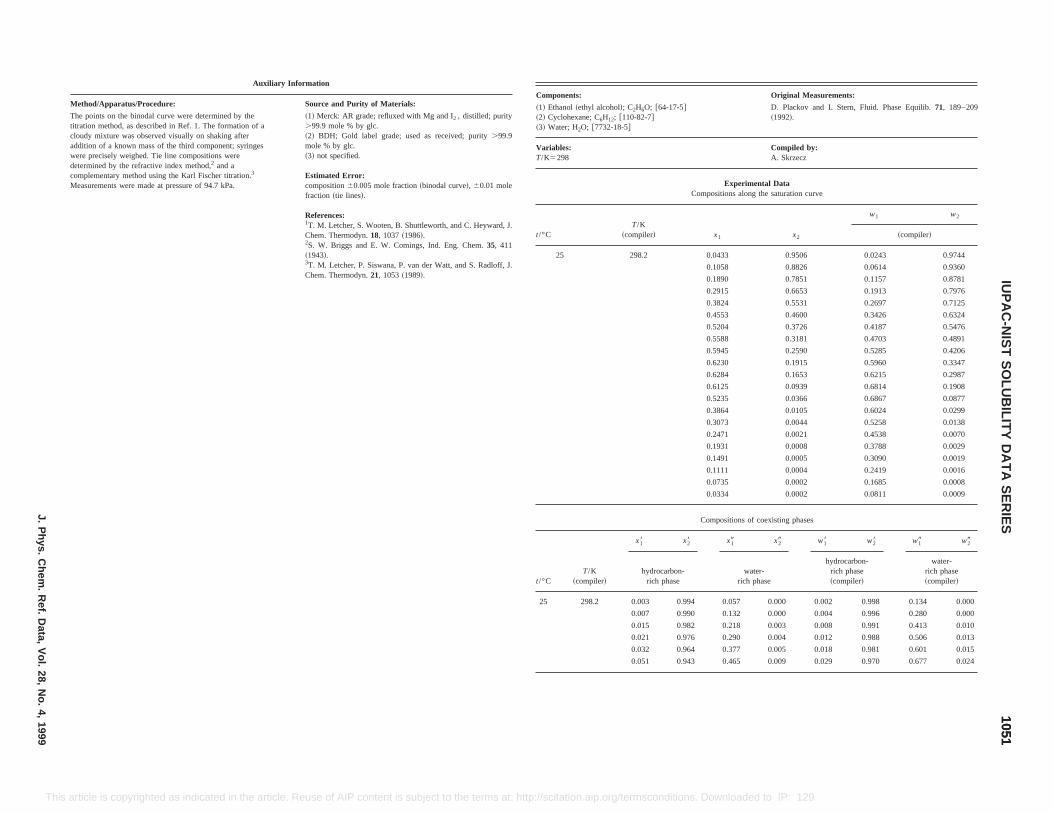
Original Measurements:
D. Plackov and I. Stern, Fluid. Phase Equilib.71, 189–209~1992!.
Compiled by:A. Skrzecz
Experimental DataCompositions along the saturation curve
x1 x2
w1 w2
~compiler!
0.0433 0.9506 0.0243 0.9744
0.1058 0.8826 0.0614 0.9360
0.1890 0.7851 0.1157 0.8781
0.2915 0.6653 0.1913 0.7976
0.3824 0.5531 0.2697 0.7125
0.4553 0.4600 0.3426 0.6324
0.5204 0.3726 0.4187 0.5476
0.5588 0.3181 0.4703 0.4891
0.5945 0.2590 0.5285 0.4206
0.6230 0.1915 0.5960 0.3347
0.6284 0.1653 0.6215 0.2987
0.6125 0.0939 0.6814 0.1908
0.5235 0.0366 0.6867 0.0877
0.3864 0.0105 0.6024 0.0299
0.3073 0.0044 0.5258 0.0138
0.2471 0.0021 0.4538 0.0070
0.1931 0.0008 0.3788 0.0029
0.1491 0.0005 0.3090 0.0019
0.1111 0.0004 0.2419 0.0016
0.0735 0.0002 0.1685 0.0008
0.0334 0.0002 0.0811 0.0009
Compositions of coexisting phases
t/°CT/K
~compiler!
x18 x28 x19 x29 w18 w28 w19 w29
hydrocarbon-rich phase
water-rich phase
hydrocarbon-rich phase~compiler!
water-rich phase~compiler!
25 298.2 0.003 0.994 0.057 0.000 0.002 0.998 0.134 0.000
0.007 0.990 0.132 0.000 0.004 0.996 0.280 0.000
0.015 0.982 0.218 0.003 0.008 0.991 0.413 0.010
0.021 0.976 0.290 0.004 0.012 0.988 0.506 0.013
0.032 0.964 0.377 0.005 0.018 0.981 0.601 0.015
0.051 0.943 0.465 0.009 0.029 0.970 0.677 0.024
10511051
IUP
AC
-NIS
TS
OLU
BILIT
YD
AT
AS
ER
IESJ.P
hys.C
hem.
Ref.
Data,
Vol.
28,N
o.4,
1999
This euse of AIP content is subject to the terms at: http://scitation.aip.org/termsconditions. Downloaded to IP: 129.6.105.191 On: Fri, 05 Sep 2014 17:51:55
article is copyrighted as indicated in the article. RAuxiliary Information
Method/Apparatus/Procedure: Source and Purity of Materials:
The points on the binodal curve were determined by thetitration method, as described in Ref. 1. The formation of acloudy mixture was observed visually on shaking afteraddition of a known mass of the third component; syringeswere precisely weighed. Tie line compositions weredetermined by the refractive index method,2 and acomplementary method using the Karl Fischer titration.3
Measurements were made at pressure of 94.7 kPa.
~1! Merck: AR grade; refluxed with Mg and I2 , distilled; purity.99.9 mole % by glc.~2! BDH; Gold label grade; used as received; purity.99.9mole % by glc.~3! not specified.
Estimated Error:composition60.005 mole fraction~binodal curve!, 60.01 molefraction ~tie lines!.
References:1T. M. Letcher, S. Wooten, B. Shuttleworth, and C. Heyward, J.Chem. Thermodyn.18, 1037~1986!.2S. W. Briggs and E. W. Comings, Ind. Eng. Chem.35, 411~1943!.3T. M. Letcher, P. Siswana, P. van der Watt, and S. Radloff, J.Chem. Thermodyn.21, 1053~1989!.
Components:
~1! Ethanol~ethyl alcohol!; C2H6O; @64-17-5#~2! Cyclohexane; C6H12; @110-82-7#~3! Water; H2O; @7732-18-5#
Variables:T/K5298
t/°CT/K
~compiler!
25 298.2

Original Measurements:
7-5#
4; @75-83-2#C. B. Kretschmer and R. Wiebe, Ind. Eng. Chem.37, 1130–2~1945!.
Compiled by:A. Skrzecz
thanol 1 Water 1 2,2-DimethylbutaneExperimental Data
Compositions along the saturation curve
x1 x2 w1 w2
~compiler! ~compiler!
0.6168 0.3178 0.4987 0.4806
0.3824 0.5911 0.2552 0.7379
0.1759 0.8158 0.1032 0.8949
0.5814 0.2996 0.4893 0.4716
0.3713 0.5740 0.2532 0.7322
0.1742 0.8078 0.1029 0.8929
0.5596 0.2883 0.4831 0.4656
0.3640 0.5627 0.2519 0.7283
0.1730 0.8021 0.1028 0.8914
Comments and Additional Dataith probable error,0.5% at the range245–25 °C by the equation: log(S)5a2b/(T/K). The
plots. Water tolerance was defined as:S5H2O by volume•~1002Hydrocarbon % by volume in
vol %hydrocarbon a b
90 1.235 473.1
75 1.679 444.9
50 1.911 388.5
Auxiliary Information
Method/Apparatus/Procedure: Source and Purity of Materials:
A glass tube with stirrer containing the ternary mixture wasimmersed in a bath, the temperature of which could be varied.Mixtures were prepared directly in the tube, by special pipettesat 15.5 °C. Precautions to exclude moisture and to preventevaporation were observed. No correction was made for theslight expansion in volume when alcohol was mixed withhydrocarbon. In the paper the experimental results wereexpressed as the water tolerance of the alcohol–hydrocarbonblend. For practical purposes water tolerance was defined asthe volume percent of water which can be added beforeseparation occurs.
~1! source not specified; anhydrous ethanol.~2! source not specified; b.p.549.7 °C.~3! not specified.
Estimated Error:temp. within about 0.3 °C ~duplicate determinations!,composition,0.2% relative of volume fraction.
10521052
SK
RZ
EC
Z,
SH
AW
,A
ND
MA
CZ
YN
SK
I
J.P
hys.C
hem.
Ref.
Data,
Vol.
28,N
o.4,
1999
This e article. Reuse of AIP content is subject to the terms at: http://scitation.aip.org/termsconditions. Downloaded to IP: 129.6.105.191 On: Fri, 05 Sep 2014 17:51:55
article is copyrighted as indicated in thAuxiliary Information
Method/Apparatus/Procedure Source and Purity of Materials:
Binodal compositions were determined by titration with thecorresponding, less-soluble component until the appearance ofturbidity, Ref. 1. The analytical method was used fordetermination of tie-lines. This was based on refractiveindexes and densities of the samples, Ref. 1, combined withthe oxidation of the alcohol with an excess of potassiumdichromate and determination of unreduced dichromate withNa2S2O3. Alcohol in the organic layer was determined afterextraction with water.
~1! Kemika ~Zagreb!; analytical grade; presumably used asreceived;n51.3593,r(25 °C!5787.0 kg/m3, b.p.579.1 °C.~2! Kemika ~Zagreb!; purity not specified; presumably used asreceived;n51.4232,r(25 °C!5773.9 kg/m3, b.p.580.0 °C.~3! twice distilled in the presence of KMnO4.
Estimated Error:composition ,0.0005 mass fraction, binodal,~relative!;composition62%, tie line.
References:1D. Plackov and I. Stern, Fluid Phase Equilib.57, 327 ~1990!.
Components:
~1! Ethanol~ethyl alcohol!; C2H6O; @64-1~2! 2,2-Dimethylbutane~neohexane!; C6H1
~3! Water; H2O; @7732-18-5#
Variables:T/K5228– 298
4.4. E
t/°CT/K
~compiler!
245.0 228.2
0.0 273.2
25.0 298.2
Water tolerance~S! was described wparameters~a, b! were determined fromthe blend!/100
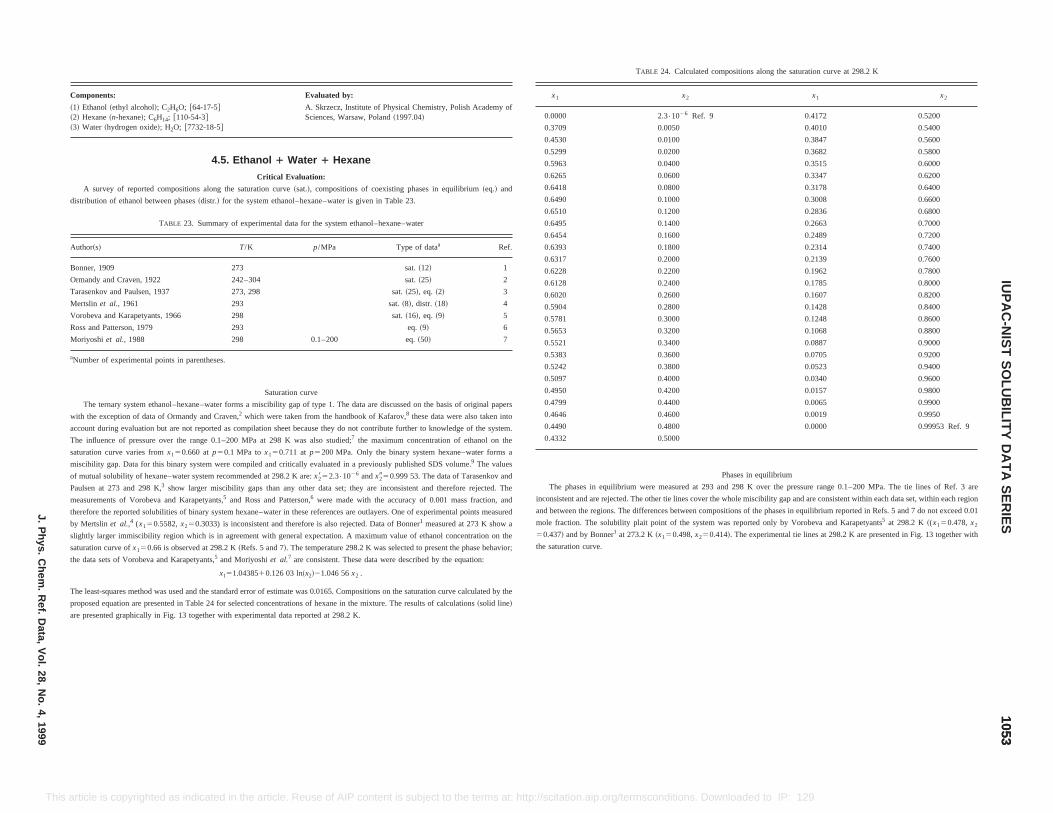
TABLE 24. Calculated compositions along the saturation curve at 298.2 K
x2 x1 x2
0 2.3•1026 Ref. 9 0.4172 0.5200
9 0.0050 0.4010 0.5400
0 0.0100 0.3847 0.5600
9 0.0200 0.3682 0.5800
3 0.0400 0.3515 0.6000
5 0.0600 0.3347 0.6200
8 0.0800 0.3178 0.6400
0 0.1000 0.3008 0.6600
0 0.1200 0.2836 0.6800
5 0.1400 0.2663 0.7000
4 0.1600 0.2489 0.7200
3 0.1800 0.2314 0.7400
7 0.2000 0.2139 0.7600
8 0.2200 0.1962 0.7800
8 0.2400 0.1785 0.8000
0 0.2600 0.1607 0.8200
4 0.2800 0.1428 0.8400
1 0.3000 0.1248 0.8600
3 0.3200 0.1068 0.8800
1 0.3400 0.0887 0.9000
3 0.3600 0.0705 0.9200
2 0.3800 0.0523 0.9400
7 0.4000 0.0340 0.9600
0 0.4200 0.0157 0.9800
9 0.4400 0.0065 0.9900
6 0.4600 0.0019 0.9950
0 0.4800 0.0000 0.99953 Ref. 9
2 0.5000
Phases in equilibrium
phases in equilibrium were measured at 293 and 298 K over the pressure range 0.1–200 MPa. The tie lines of Ref. 3 are
tent and are rejected. The other tie lines cover the whole miscibility gap and are consistent within each data set, within each region
een the regions. The differences between compositions of the phases in equilibrium reported in Refs. 5 and 7 do not exceed 0.01
ction. The solubility plait point of the system was reported only by Vorobeva and Karapetyants5 at 298.2 K~(x150.478,x2
73.2 K~x150.498,x250.414!. The experimental tie lines at 298.2 K are presented in Fig. 13 together with
10531053
IUP
AC
-NIS
TS
OLU
BILIT
YD
AT
AS
ER
IESJ.P
hys.C
hem.
Ref.
Data,
Vol.
28,N
o.4,
1999
This msconditions. Downloaded to IP: 129.6.105.191 On: Fri, 05 Sep 2014 17:51:55
slightly larger immiscibility region which is in agreement with general expectation. A maximum value of ethanol concentration on the
saturation curve ofx150.66 is observed at 298.2 K~Refs. 5 and 7!. The temperature 298.2 K was selected to present the phase behavior;
the data sets of Vorobeva and Karapetyants,5 and Moriyoshiet al.7 are consistent. These data were described by the equation:
x151.0438510.126 03 ln~x2!21.046 56x2 .
The least-squares method was used and the standard error of estimate was 0.0165. Compositions on the saturation curve calculated by the
proposed equation are presented in Table 24 for selected concentrations of hexane in the mixture. The results of calculations~solid line!
are presented graphically in Fig. 13 together with experimental data reported at 298.2 K.
50.437! and by Bonner1 at 2
the saturation curve.
article is copyrighted as indicated in the article. Reuse of AIP content is subject to the terms at: http://scitation.aip.org/ter
Components: Evaluated by:
~1! Ethanol~ethyl alcohol!; C2H6O; @64-17-5#~2! Hexane~n-hexane!; C6H14; @110-54-3#~3! Water ~hydrogen oxide!; H2O; @7732-18-5#
A. Skrzecz, Institute of Physical Chemistry, Polish Academy ofSciences, Warsaw, Poland~1997.04!
4.5. Ethanol 1 Water 1 Hexane
Critical Evaluation:
A survey of reported compositions along the saturation curve~sat.!, compositions of coexisting phases in equilibrium~eq.! and
distribution of ethanol between phases~distr.! for the system ethanol–hexane–water is given in Table 23.
TABLE 23. Summary of experimental data for the system ethanol–hexane–water
Author~s! T/K p/MPa Type of dataa Ref.
Bonner, 1909 273 sat.~12! 1
Ormandy and Craven, 1922 242–304 sat.~25! 2
Tarasenkov and Paulsen, 1937 273, 298 sat.~25!, eq. ~2! 3
Mertslin et al., 1961 293 sat.~8!, distr. ~18! 4
Vorobeva and Karapetyants, 1966 298 sat.~16!, eq. ~9! 5
Ross and Patterson, 1979 293 eq.~9! 6
Moriyoshi et al., 1988 298 0.1–200 eq.~50! 7
aNumber of experimental points in parentheses.
Saturation curve
The ternary system ethanol–hexane–water forms a miscibility gap of type 1. The data are discussed on the basis of original papers
with the exception of data of Ormandy and Craven,2 which were taken from the handbook of Kafarov,8 these data were also taken into
account during evaluation but are not reported as compilation sheet because they do not contribute further to knowledge of the system.
The influence of pressure over the range 0.1–200 MPa at 298 K was also studied;7 the maximum concentration of ethanol on the
saturation curve varies fromx150.660 atp50.1 MPa tox150.711 atp5200 MPa. Only the binary system hexane–water forms a
miscibility gap. Data for this binary system were compiled and critically evaluated in a previously published SDS volume.9 The values
of mutual solubility of hexane–water system recommended at 298.2 K are:x2852.3•1026 andx2950.999 53. The data of Tarasenkov and
Paulsen at 273 and 298 K,3 show larger miscibility gaps than any other data set; they are inconsistent and therefore rejected. The
measurements of Vorobeva and Karapetyants,5 and Ross and Patterson,6 were made with the accuracy of 0.001 mass fraction, and
therefore the reported solubilities of binary system hexane–water in these references are outlayers. One of experimental points measured
by Mertslin et al.,4 (x150.5582,x250.3033) is inconsistent and therefore is also rejected. Data of Bonner1 measured at 273 K show a
x1
0.000
0.370
0.453
0.529
0.596
0.626
0.641
0.649
0.651
0.649
0.645
0.639
0.631
0.622
0.612
0.602
0.590
0.578
0.565
0.552
0.538
0.524
0.509
0.495
0.479
0.464
0.449
0.433
The
inconsis
and betw
mole fra
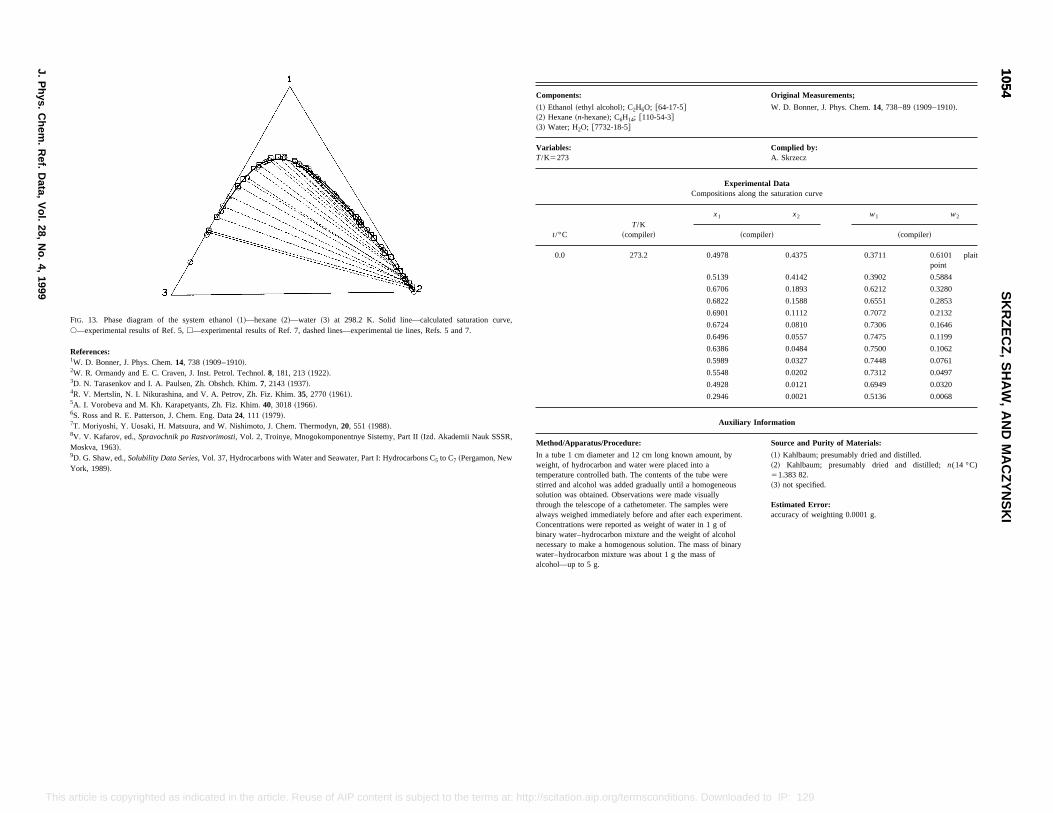
s: Original Measurements;
ethyl alcohol!; C2H6O; @64-17-5#n-hexane!; C6H14; @110-54-3#
2O; @7732-18-5#
W. D. Bonner, J. Phys. Chem.14, 738–89~1909–1910!.
Complied by:A. Skrzecz
Experimental DataCompositions along the saturation curve
T/K~compiler!
x1 x2 w1 w2
~compiler! ~compiler!
273.2 0.4978 0.4375 0.3711 0.6101 plaitpoint
0.5139 0.4142 0.3902 0.5884
0.6706 0.1893 0.6212 0.3280
0.6822 0.1588 0.6551 0.2853
0.6901 0.1112 0.7072 0.2132
0.6724 0.0810 0.7306 0.1646
0.6496 0.0557 0.7475 0.1199
0.6386 0.0484 0.7500 0.1062
0.5989 0.0327 0.7448 0.0761
0.5548 0.0202 0.7312 0.0497
0.4928 0.0121 0.6949 0.0320
0.2946 0.0021 0.5136 0.0068
Auxiliary Information
aratus/Procedure: Source and Purity of Materials:
cm diameter and 12 cm long known amount, byydrocarbon and water were placed into acontrolled bath. The contents of the tube were
alcohol was added gradually until a homogeneouss obtained. Observations were made visuallytelescope of a cathetometer. The samples werehed immediately before and after each experiment.
Concentrations were reported as weight of water in 1 g ofbinary water–hydrocarbon mixture and the weight of alcoholnecessary to make a homogenous solution. The mass of binarywater–hydrocarbon mixture was about 1 g the mass ofalcohol—up to 5 g.
~1! Kahlbaum; presumably dried and distilled.~2! Kahlbaum; presumably dried and distilled;n(14 °C)51.383 82.~3! not specified.
Estimated Error:accuracy of weighting 0.0001 g.
10541054
SK
RZ
EC
Z,
SH
AW
,A
ND
MA
CZ
YN
SK
I
J.P
hys.C
hem.
Ref.
Data,
Vol.
28,N
o.4,
1999
This erms at: http://scitation.aip.org/termsconditions. Downloaded to IP: 129.6.105.191 On: Fri, 05 Sep 2014 17:51:55
article is copyrighted as indicated in the article. Reuse of AIP content is subject to the tFIG. 13. Phase diagram of the system ethanol~1!—hexane ~2!—water ~3! at 298.2 K. Solid line—calculated saturation curve,s—experimental results of Ref. 5,h—experimental results of Ref. 7, dashed lines—experimental tie lines, Refs. 5 and 7.
References:1W. D. Bonner, J. Phys. Chem.14, 738 ~1909–1910!.2W. R. Ormandy and E. C. Craven, J. Inst. Petrol. Technol.8, 181, 213~1922!.3D. N. Tarasenkov and I. A. Paulsen, Zh. Obshch. Khim.7, 2143~1937!.4R. V. Mertslin, N. I. Nikurashina, and V. A. Petrov, Zh. Fiz. Khim.35, 2770~1961!.5A. I. Vorobeva and M. Kh. Karapetyants, Zh. Fiz. Khim.40, 3018~1966!.6S. Ross and R. E. Patterson, J. Chem. Eng. Data24, 111 ~1979!.7T. Moriyoshi, Y. Uosaki, H. Matsuura, and W. Nishimoto, J. Chem. Thermodyn,20, 551 ~1988!.8V. V. Kafarov, ed.,Spravochnik po Rastvorimosti, Vol. 2, Troinye, Mnogokomponentnye Sistemy, Part II~Izd. Akademii Nauk SSSR,Moskva, 1963!.9D. G. Shaw, ed.,Solubility Data Series, Vol. 37, Hydrocarbons with Water and Seawater, Part I: Hydrocarbons C5 to C7 ~Pergamon, NewYork, 1989!.
Component
~1! Ethanol~~2! Hexane~~3! Water; H
Variables:T/K5273
t/°C
0.0
Method/App
In a tube 1weight, of htemperaturestirred andsolution wathrough thealways weig
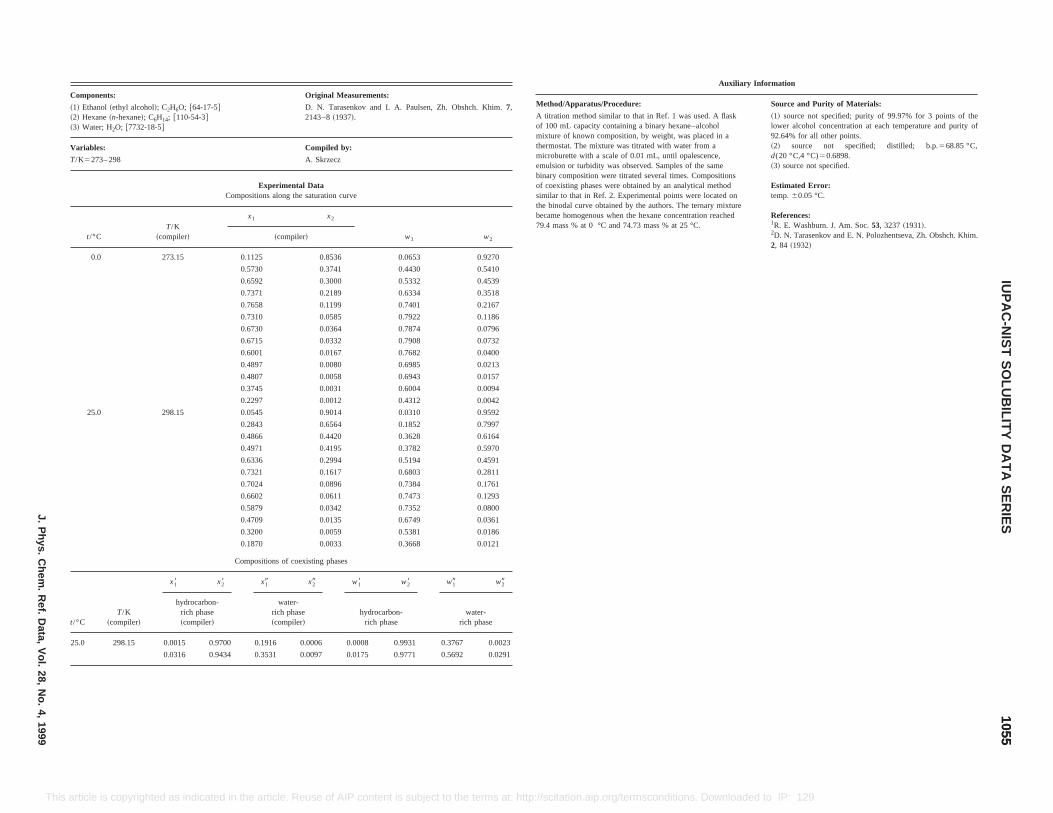
Original Measurements:
D. N. Tarasenkov and I. A. Paulsen, Zh. Obshch. Khim.7,2143–8~1937!.
Compiled by:
A. Skrzecz
xperimental Datans along the saturation curve
x2
w1 w2~compiler!
5 0.8536 0.0653 0.9270
0.3741 0.4430 0.5410
0.3000 0.5332 0.4539
0.2189 0.6334 0.3518
0.1199 0.7401 0.2167
0.0585 0.7922 0.1186
0.0364 0.7874 0.0796
0.0332 0.7908 0.0732
0.0167 0.7682 0.0400
0.0080 0.6985 0.0213
0.0058 0.6943 0.0157
0.0031 0.6004 0.0094
0.0012 0.4312 0.0042
5 0.9014 0.0310 0.9592
0.6564 0.1852 0.7997
0.4420 0.3628 0.6164
0.4195 0.3782 0.5970
0.2994 0.5194 0.4591
0.1617 0.6803 0.2811
0.0896 0.7384 0.1761
0.0611 0.7473 0.1293
0.0342 0.7352 0.0800
0.0135 0.6749 0.0361
Auxiliary Information
Method/Apparatus/Procedure: Source and Purity of Materials:
A titration method similar to that in Ref. 1 was used. A flaskof 100 mL capacity containing a binary hexane–alcoholmixture of known composition, by weight, was placed in athermostat. The mixture was titrated with water from amicroburette with a scale of 0.01 mL, until opalescence,emulsion or turbidity was observed. Samples of the samebinary composition were titrated several times. Compositionsof coexisting phases were obtained by an analytical methodsimilar to that in Ref. 2. Experimental points were located onthe binodal curve obtained by the authors. The ternary mixturebecame homogenous when the hexane concentration reached79.4 mass % at 0 °C and 74.73 mass % at 25 °C.
~1! source not specified; purity of 99.97% for 3 points of thelower alcohol concentration at each temperature and purity of92.64% for all other points.~2! source not specified; distilled; b.p.568.85 °C,d(20 °C,4 °C)50.6898.~3! source not specified.
Estimated Error:temp.60.05 °C.
References:1R. E. Washburn. J. Am. Soc.53, 3237~1931!.2D. N. Tarasenkov and E. N. Polozhentseva, Zh. Obshch. Khim.2, 84 ~1932!
10551055
IUP
AC
-NIS
TS
OLU
BILIT
YD
AT
AS
ER
IESJ.P
hys.C
hem.
Ref.
Data,
Vol.
28,N
o.4,
1999
This s. Downloaded to IP: 129.6.105.191 On: Fri, 05 Sep 2014 17:51:55
0.3200 0.0059 0.5381 0.0186
0.1870 0.0033 0.3668 0.0121
Compositions of coexisting phases
t/°CT/K
~compiler!
x18 x28 x19 x29 w18 w28 w19 w29
hydrocarbon-rich phase~compiler!
water-rich phase~compiler!
hydrocarbon-rich phase
water-rich phase
25.0 298.15 0.0015 0.9700 0.1916 0.0006 0.0008 0.9931 0.3767 0.0023
0.0316 0.9434 0.3531 0.0097 0.0175 0.9771 0.5692 0.0291
article is copyrighted as indicated in the article. Reuse of AIP content is subject to the terms at: http://scitation.aip.org/termscondition
Components:
~1! Ethanol~ethyl alcohol!; C2H6O; @64-17-5#~2! Hexane~n-hexane!; C6H14; @110-54-3#~3! Water; H2O; @7732-18-5#
Variables:
T/K5273– 298
ECompositio
t/°CT/K
~compiler!
x1
0.0 273.15 0.112
0.5730
0.6592
0.7371
0.7658
0.7310
0.6730
0.6715
0.6001
0.4897
0.4807
0.3745
0.2297
25.0 298.15 0.054
0.2843
0.4866
0.4971
0.6336
0.7321
0.7024
0.6602
0.5879
0.4709
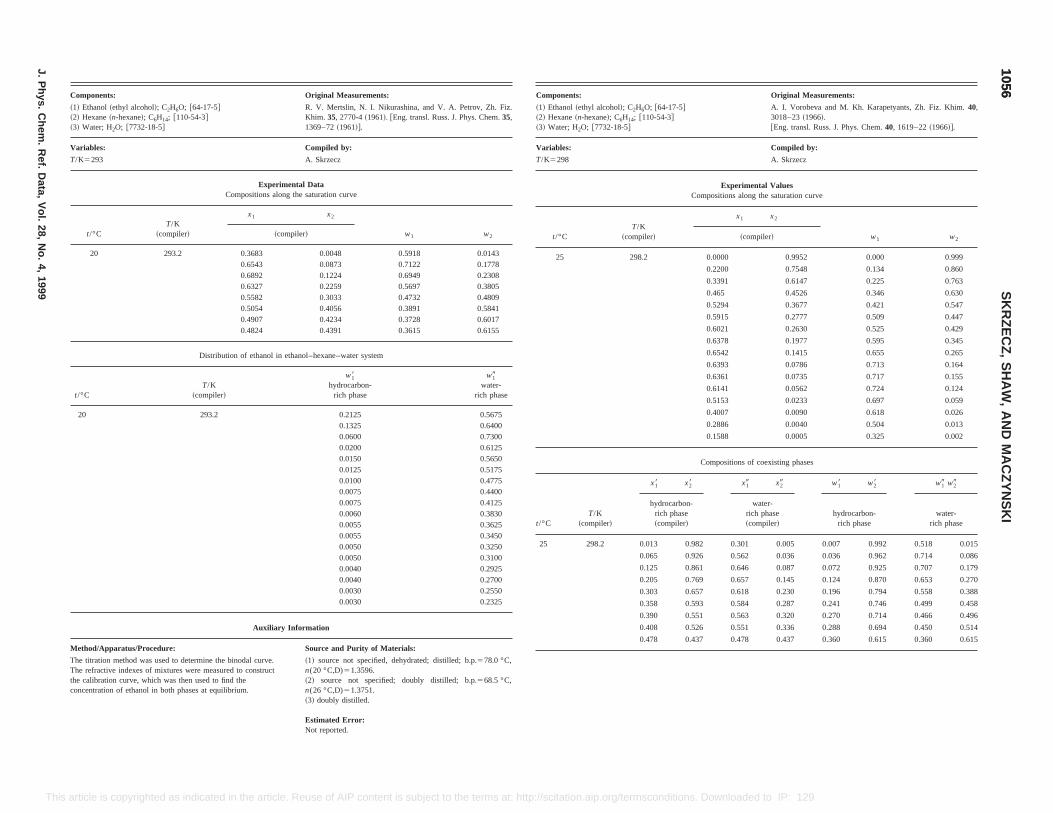
C
~1~2~3
V
T
M
ThThthco
Original Measurements:
-17-5#-3#
A. I. Vorobeva and M. Kh. Karapetyants, Zh. Fiz. Khim.40,3018–23~1966!.@Eng. transl. Russ. J. Phys. Chem.40, 1619–22~1966!#.
Compiled by:
A. Skrzecz
Experimental ValuesCompositions along the saturation curve
x1 x2
w1 w2~compiler!
0.0000 0.9952 0.000 0.999
0.2200 0.7548 0.134 0.860
0.3391 0.6147 0.225 0.763
0.465 0.4526 0.346 0.630
0.5294 0.3677 0.421 0.547
0.5915 0.2777 0.509 0.447
0.6021 0.2630 0.525 0.429
0.6378 0.1977 0.595 0.345
0.6542 0.1415 0.655 0.265
0.6393 0.0786 0.713 0.164
0.6361 0.0735 0.717 0.155
0.6141 0.0562 0.724 0.124
0.5153 0.0233 0.697 0.059
0.4007 0.0090 0.618 0.026
0.2886 0.0040 0.504 0.013
0.1588 0.0005 0.325 0.002
Compositions of coexisting phases
x28 x19 x29 w18 w28 w19 w29
rocarbon-h phasempiler!
water-rich phase~compiler!
hydrocarbon-rich phase
water-rich phase
1 0.005 0.007 0.992 0.518 0.015
2 0.036 0.036 0.962 0.714 0.086
6 0.087 0.072 0.925 0.707 0.179
7 0.145 0.124 0.870 0.653 0.270
8 0.230 0.196 0.794 0.558 0.388
4 0.287 0.241 0.746 0.499 0.458
3 0.320 0.270 0.714 0.466 0.496
1 0.336 0.288 0.694 0.450 0.514
8 0.437 0.360 0.615 0.360 0.615
10561056
SK
RZ
EC
Z,
SH
AW
,A
ND
MA
CZ
YN
SK
I
J.P
hys.C
hem.
Ref.
Data,
Vol.
28,N
o.4,
1999
This ar d to IP: 129.6.105.191 On: Fri, 05 Sep 2014 17:51:55
0.0055 0.34500.0050 0.32500.0050 0.31000.0040 0.29250.0040 0.27000.0030 0.25500.0030 0.2325
Auxiliary Information
ethod/Apparatus/Procedure: Source and Purity of Materials:
e titration method was used to determine the binodal curve.e refractive indexes of mixtures were measured to construct
e calibration curve, which was then used to find thencentration of ethanol in both phases at equilibrium.
~1! source not specified, dehydrated; distilled; b.p.578.0 °C,n(20 °C,D)51.3596.~2! source not specified; doubly distilled; b.p.568.5 °C,n(26 °C,D)51.3751.~3! doubly distilled.
Estimated Error:Not reported.
25 298.2 0.013 0.982 0.30
0.065 0.926 0.56
0.125 0.861 0.64
0.205 0.769 0.65
0.303 0.657 0.61
0.358 0.593 0.58
0.390 0.551 0.56
0.408 0.526 0.55
0.478 0.437 0.47
ticle is copyrighted as indicated in the article. Reuse of AIP content is subject to the terms at: http://scitation.aip.org/termsconditions. Downloade
omponents: Original Measurements:
! Ethanol~ethyl alcohol!; C2H6O; @64-17-5#! Hexane~n-hexane!; C6H14; @110-54-3#! Water; H2O; @7732-18-5#
R. V. Mertslin, N. I. Nikurashina, and V. A. Petrov, Zh. Fiz.Khim. 35, 2770-4~1961!. @Eng. transl. Russ. J. Phys. Chem.35,1369–72~1961!#.
ariables: Compiled by:
/K5293 A. Skrzecz
Experimental DataCompositions along the saturation curve
t/°CT/K
~compiler!
x1 x2
w1 w2~compiler!
20 293.2 0.3683 0.0048 0.5918 0.01430.6543 0.0873 0.7122 0.17780.6892 0.1224 0.6949 0.23080.6327 0.2259 0.5697 0.38050.5582 0.3033 0.4732 0.48090.5054 0.4056 0.3891 0.58410.4907 0.4234 0.3728 0.60170.4824 0.4391 0.3615 0.6155
Distribution of ethanol in ethanol–hexane–water system
t/°CT/K
~compiler!
w18hydrocarbon-
rich phase
w19water-
rich phase
20 293.2 0.2125 0.56750.1325 0.64000.0600 0.73000.0200 0.61250.0150 0.56500.0125 0.51750.0100 0.47750.0075 0.44000.0075 0.41250.0060 0.38300.0055 0.3625
Components:
~1! Ethanol~ethyl alcohol!; C2H6O; @64~2! Hexane~n-hexane!; C6H14; @110-54~3! Water; H2O; @7732-18-5#
Variables:
T/K5298
t/°CT/K
~compiler!
25 298.2
t/°CT/K
~compiler!
x18
hydric~co
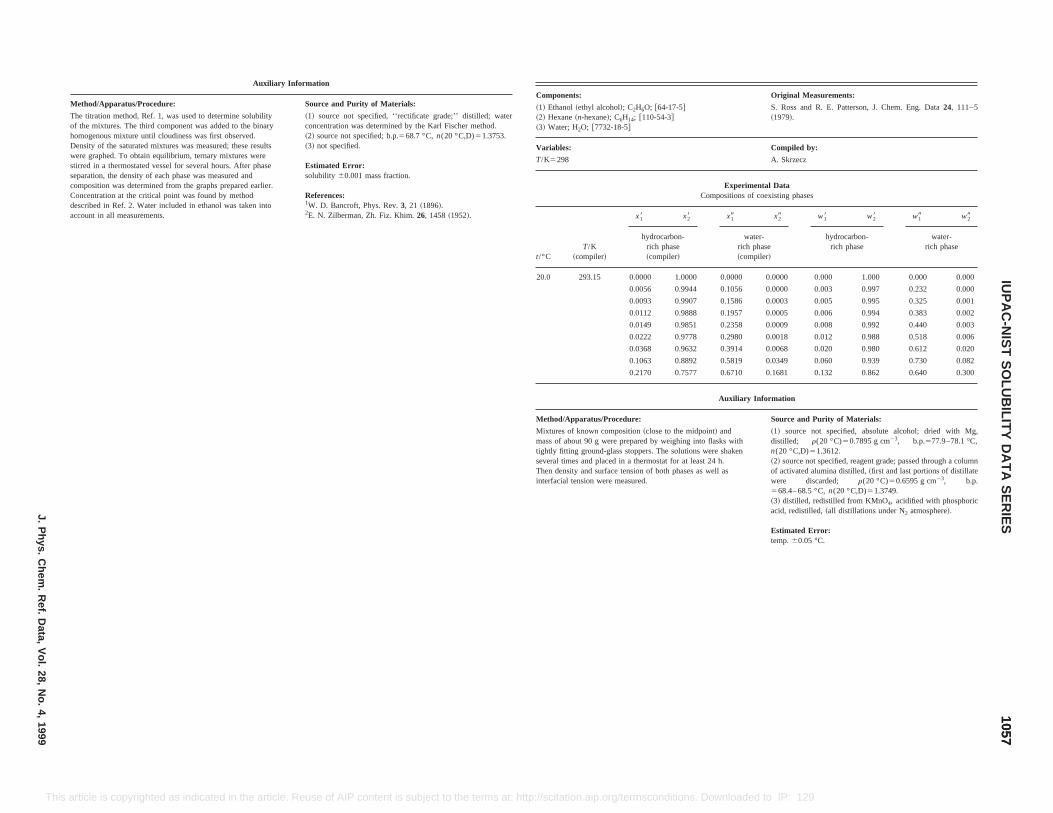
ponents: Original Measurements:
thanol~ethyl alcohol!; C2H6O; @64-17-5#exane~n-hexane!; C6H14; @110-54-3#ater; H2O; @7732-18-5#
S. Ross and R. E. Patterson, J. Chem. Eng. Data24, 111–5~1979!.
bles: Compiled by:
298 A. Skrzecz
Experimental DataCompositions of coexisting phases
T/K~compiler!
x18 x28 x19 x29 w18 w28 w19 w29
hydrocarbon-rich phase~compiler!
water-rich phase~compiler!
hydrocarbon-rich phase
water-rich phase
293.15 0.0000 1.0000 0.0000 0.0000 0.000 1.000 0.000 0.000
0.0056 0.9944 0.1056 0.0000 0.003 0.997 0.232 0.000
0.0093 0.9907 0.1586 0.0003 0.005 0.995 0.325 0.001
0.0112 0.9888 0.1957 0.0005 0.006 0.994 0.383 0.002
0.0149 0.9851 0.2358 0.0009 0.008 0.992 0.440 0.003
0.0222 0.9778 0.2980 0.0018 0.012 0.988 0.518 0.006
0.0368 0.9632 0.3914 0.0068 0.020 0.980 0.612 0.020
0.1063 0.8892 0.5819 0.0349 0.060 0.939 0.730 0.082
0.2170 0.7577 0.6710 0.1681 0.132 0.862 0.640 0.300
Auxiliary Information
od/Apparatus/Procedure: Source and Purity of Materials:
res of known composition~close to the midpoint! andof about 90 g were prepared by weighing into flasks with
y fitting ground-glass stoppers. The solutions were shakenral times and placed in a thermostat for at least 24 h.density and surface tension of both phases as well as
acial tension were measured.
~1! source not specified, absolute alcohol; dried with Mg,distilled; r(20 °C)50.7895 g cm23, b.p.577.9–78.1 °C,n(20 °C,D)51.3612.~2! source not specified, reagent grade; passed through a columnof activated alumina distilled,~first and last portions of distillatewere discarded; r(20 °C)50.6595 g cm23, b.p.568.4– 68.5 °C,n(20 °C,D)51.3749.~3! distilled, redistilled from KMnO4, acidified with phosphoricacid, redistilled,~all distillations under N2 atmosphere!.
Estimated Error:temp.60.05 °C.
10571057
IUP
AC
-NIS
TS
OLU
BILIT
YD
AT
AS
ER
IESJ.P
hys.C
hem.
Ref.
Data,
Vol.
28,N
o.4,
1999
This the article. Reuse of AIP content is subject to the terms at: http://scitation.aip.org/termsconditions. Downloaded to IP: 129.6.105.191 On: Fri, 05 Sep 2014 17:51:55
article is copyrighted as indicated inAuxiliary Information
Method/Apparatus/Procedure: Source and Purity of Materials:
The titration method, Ref. 1, was used to determine solubilityof the mixtures. The third component was added to the binaryhomogenous mixture until cloudiness was first observed.Density of the saturated mixtures was measured; these resultswere graphed. To obtain equilibrium, ternary mixtures werestirred in a thermostated vessel for several hours. After phaseseparation, the density of each phase was measured andcomposition was determined from the graphs prepared earlier.Concentration at the critical point was found by methoddescribed in Ref. 2. Water included in ethanol was taken intoaccount in all measurements.
~1! source not specified, ‘‘rectificate grade;’’ distilled; waterconcentration was determined by the Karl Fischer method.~2! source not specified; b.p.568.7 °C,n(20 °C,D)51.3753.~3! not specified.
Estimated Error:solubility 60.001 mass fraction.
References:1W. D. Bancroft, Phys. Rev.3, 21 ~1896!.2E. N. Zilberman, Zh. Fiz. Khim.26, 1458~1952!.
Com
~1! E~2! H~3! W
Varia
T/K5
t/°C
20.0
Meth
MixtumasstightlseveTheninterf
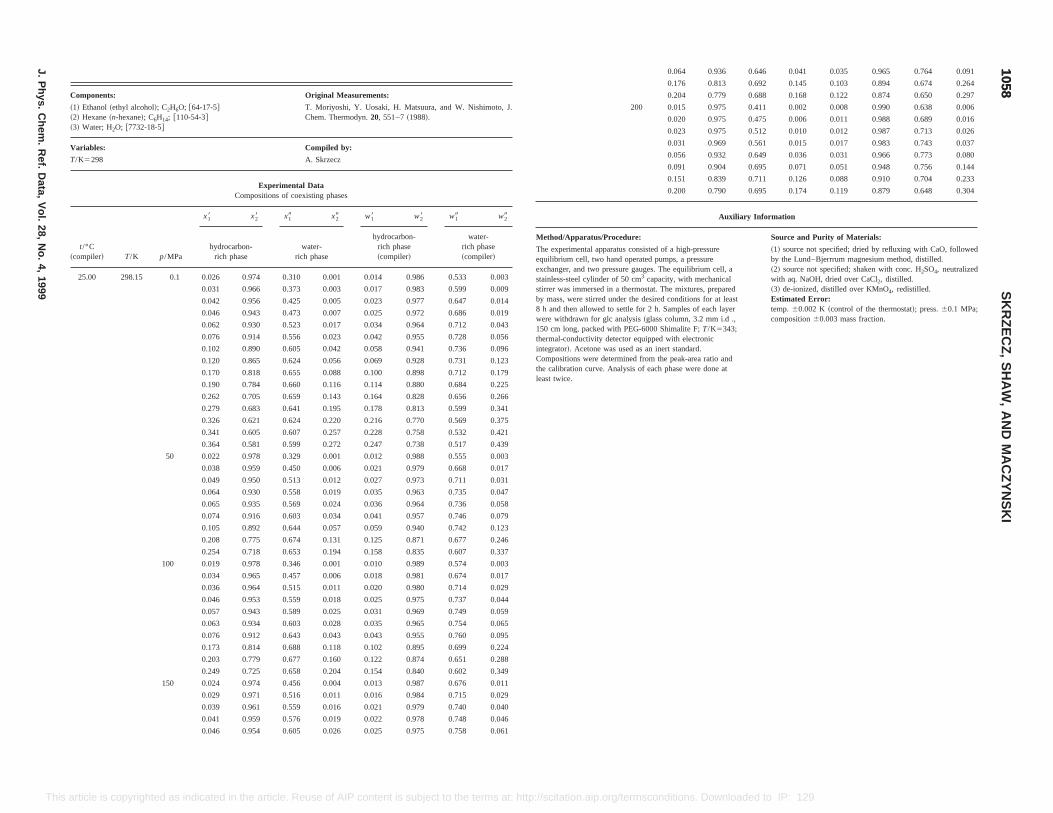
H. Matsuura, and W. Nishimoto, J.–7~1988!.
w28 w19 w29
arbon-hase
piler!
water-rich phase~compiler!
0.986 0.533 0.003
0.983 0.599 0.009
0.977 0.647 0.014
0.972 0.686 0.019
0.964 0.712 0.043
0.955 0.728 0.056
0.941 0.736 0.096
0.928 0.731 0.123
0.898 0.712 0.179
0.880 0.684 0.225
0.828 0.656 0.266
0.813 0.599 0.341
0.770 0.569 0.375
0.758 0.532 0.421
0.738 0.517 0.439
0.988 0.555 0.003
0.979 0.668 0.017
0.973 0.711 0.031
0.963 0.735 0.047
0.964 0.736 0.058
0.957 0.746 0.079
0.064 0.936 0.646 0.041 0.035 0.965 0.764 0.091
0.176 0.813 0.692 0.145 0.103 0.894 0.674 0.264
0.204 0.779 0.688 0.168 0.122 0.874 0.650 0.297
200 0.015 0.975 0.411 0.002 0.008 0.990 0.638 0.006
0.020 0.975 0.475 0.006 0.011 0.988 0.689 0.016
0.023 0.975 0.512 0.010 0.012 0.987 0.713 0.026
0.031 0.969 0.561 0.015 0.017 0.983 0.743 0.037
0.056 0.932 0.649 0.036 0.031 0.966 0.773 0.080
0.091 0.904 0.695 0.071 0.051 0.948 0.756 0.144
0.151 0.839 0.711 0.126 0.088 0.910 0.704 0.233
0.200 0.790 0.695 0.174 0.119 0.879 0.648 0.304
Auxiliary Information
Method/Apparatus/Procedure: Source and Purity of Materials:
The experimental apparatus consisted of a high-pressureequilibrium cell, two hand operated pumps, a pressureexchanger, and two pressure gauges. The equilibrium cell, astainless-steel cylinder of 50 cm3 capacity, with mechanicalstirrer was immersed in a thermostat. The mixtures, preparedby mass, were stirred under the desired conditions for at least8 h and then allowed to settle for 2 h. Samples of each layerwere withdrawn for glc analysis~glass column, 3.2 mm i.d .,150 cm long, packed with PEG-6000 Shimalite F;T/K5343;thermal-conductivity detector equipped with electronicintegrator!. Acetone was used as an inert standard.Compositions were determined from the peak-area ratio andthe calibration curve. Analysis of each phase were done atleast twice.
~1! source not specified; dried by refluxing with CaO, followedby the Lund–Bjerrrum magnesium method, distilled.~2! source not specified; shaken with conc. H2SO4, neutralizedwith aq. NaOH, dried over CaCl2, distilled.~3! de-ionized, distilled over KMnO4, redistilled.Estimated Error:temp.60.002 K ~control of the thermostat!; press.60.1 MPa;composition60.003 mass fraction.
10581058
SK
RZ
EC
Z,
SH
AW
,A
ND
MA
CZ
YN
SK
I
J.P
hys.C
hem.
Ref.
Data,
Vol.
28,N
o.4,
1999
This d to IP: 129.6.105.191 On: Fri, 05 Sep 2014 17:51:55
0.105 0.892 0.644 0.057 0.059 0.940 0.742 0.123
0.208 0.775 0.674 0.131 0.125 0.871 0.677 0.246
0.254 0.718 0.653 0.194 0.158 0.835 0.607 0.337
100 0.019 0.978 0.346 0.001 0.010 0.989 0.574 0.003
0.034 0.965 0.457 0.006 0.018 0.981 0.674 0.017
0.036 0.964 0.515 0.011 0.020 0.980 0.714 0.029
0.046 0.953 0.559 0.018 0.025 0.975 0.737 0.044
0.057 0.943 0.589 0.025 0.031 0.969 0.749 0.059
0.063 0.934 0.603 0.028 0.035 0.965 0.754 0.065
0.076 0.912 0.643 0.043 0.043 0.955 0.760 0.095
0.173 0.814 0.688 0.118 0.102 0.895 0.699 0.224
0.203 0.779 0.677 0.160 0.122 0.874 0.651 0.288
0.249 0.725 0.658 0.204 0.154 0.840 0.602 0.349
150 0.024 0.974 0.456 0.004 0.013 0.987 0.676 0.011
0.029 0.971 0.516 0.011 0.016 0.984 0.715 0.029
0.039 0.961 0.559 0.016 0.021 0.979 0.740 0.040
0.041 0.959 0.576 0.019 0.022 0.978 0.748 0.046
0.046 0.954 0.605 0.026 0.025 0.975 0.758 0.061
article is copyrighted as indicated in the article. Reuse of AIP content is subject to the terms at: http://scitation.aip.org/termsconditions. Downloade
Components: Original Measurements:
~1! Ethanol~ethyl alcohol!; C2H6O; @64-17-5#~2! Hexane~n-hexane!; C6H14; @110-54-3#~3! Water; H2O; @7732-18-5#
T. Moriyoshi, Y. Uosaki,Chem. Thermodyn.20, 551
Variables: Compiled by:
T/K5298 A. Skrzecz
Experimental DataCompositions of coexisting phases
t/°C~compiler! T/K p/MPa
x18 x28 x19 x29 w18
hydrocarbon-rich phase
water-rich phase
hydrocrich p~com
25.00 298.15 0.1 0.026 0.974 0.310 0.001 0.014
0.031 0.966 0.373 0.003 0.017
0.042 0.956 0.425 0.005 0.023
0.046 0.943 0.473 0.007 0.025
0.062 0.930 0.523 0.017 0.034
0.076 0.914 0.556 0.023 0.042
0.102 0.890 0.605 0.042 0.058
0.120 0.865 0.624 0.056 0.069
0.170 0.818 0.655 0.088 0.100
0.190 0.784 0.660 0.116 0.114
0.262 0.705 0.659 0.143 0.164
0.279 0.683 0.641 0.195 0.178
0.326 0.621 0.624 0.220 0.216
0.341 0.605 0.607 0.257 0.228
0.364 0.581 0.599 0.272 0.247
50 0.022 0.978 0.329 0.001 0.012
0.038 0.959 0.450 0.006 0.021
0.049 0.950 0.513 0.012 0.027
0.064 0.930 0.558 0.019 0.035
0.065 0.935 0.569 0.024 0.036
0.074 0.916 0.603 0.034 0.041
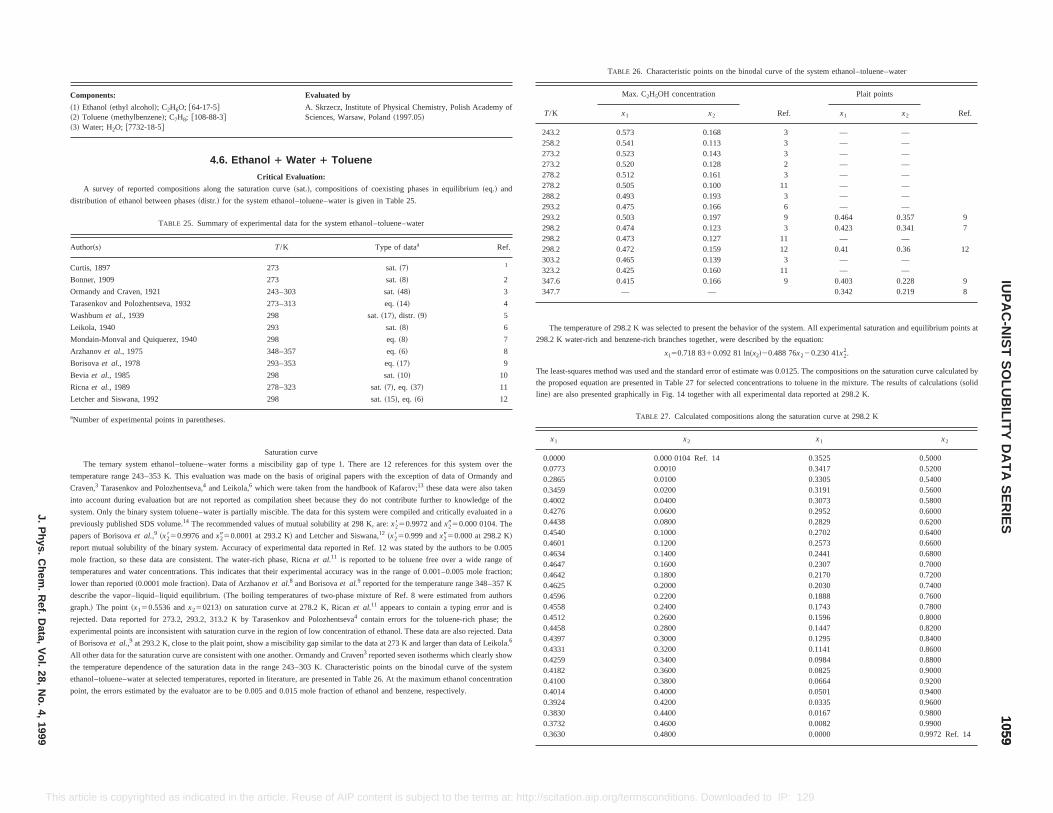
2 2
odal curve of the system ethanol–toluene–water
Plait points
Ref.Ref. x1 x2
3 — —3 — —3 — —2 — —3 — —
11 — —3 — —6 — —9 0.464 0.357 93 0.423 0.341 7
11 — —12 0.41 0.36 123 — —
11 — —9 0.403 0.228 9
0.342 0.219 8
avior of the system. All experimental saturation and equilibrium points at
described by the equation:
!20.488 76x220.230 41x22.
stimate was 0.0125. The compositions on the saturation curve calculated by
concentrations to toluene in the mixture. The results of calculations~solid
experimental data reported at 298.2 K.
s along the saturation curve at 298.2 K
x1 x2
0.3525 0.50000.3417 0.52000.3305 0.54000.3191 0.56000.3073 0.58000.2952 0.60000.2829 0.62000.2702 0.64000.2573 0.66000.2441 0.68000.2307 0.70000.2170 0.72000.2030 0.74000.1888 0.76000.1743 0.78000.1596 0.80000.1447 0.82000.1295 0.84000.1141 0.86000.0984 0.88000.0825 0.90000.0664 0.92000.0501 0.94000.0335 0.96000.0167 0.98000.0082 0.99000.0000 0.9972 Ref. 14
10591059
IUP
AC
-NIS
TS
OLU
BILIT
YD
AT
AS
ER
IESJ.P
hys.C
hem.
Ref.
Data,
Vol.
28,N
o.4,
1999
This ownloaded to IP: 129.6.105.191 On: Fri, 05 Sep 2014 17:51:55
papers of Borisovaet al.,9 ~x2850.9976 andx2950.0001 at 293.2 K! and Letcher and Siswana,12 ~x2850.999 andx2950.000 at 298.2 K!
report mutual solubility of the binary system. Accuracy of experimental data reported in Ref. 12 was stated by the authors to be 0.005
mole fraction, so these data are consistent. The water-rich phase, Ricnaet al.11 is reported to be toluene free over a wide range of
temperatures and water concentrations. This indicates that their experimental accuracy was in the range of 0.001–0.005 mole fraction;
lower than reported~0.0001 mole fraction!. Data of Arzhanovet al.8 and Borisovaet al.9 reported for the temperature range 348–357 K
describe the vapor–liquid–liquid equilibrium.~The boiling temperatures of two-phase mixture of Ref. 8 were estimated from authors
graph.! The point ~x150.5536 andx250213! on saturation curve at 278.2 K, Ricanet al.11 appears to contain a typing error and is
rejected. Data reported for 273.2, 293.2, 313.2 K by Tarasenkov and Polozhentseva4 contain errors for the toluene-rich phase; the
experimental points are inconsistent with saturation curve in the region of low concentration of ethanol. These data are also rejected. Data
of Borisovaet al.,9 at 293.2 K, close to the plait point, show a miscibility gap similar to the data at 273 K and larger than data of Leikola.6
All other data for the saturation curve are consistent with one another. Ormandy and Craven3 reported seven isotherms which clearly show
the temperature dependence of the saturation data in the range 243–303 K. Characteristic points on the binodal curve of the system
ethanol–toluene–water at selected temperatures, reported in literature, are presented in Table 26. At the maximum ethanol concentration
point, the errors estimated by the evaluator are to be 0.005 and 0.015 mole fraction of ethanol and benzene, respectively.
0.4540 0.10000.4601 0.12000.4634 0.14000.4647 0.16000.4642 0.18000.4625 0.20000.4596 0.22000.4558 0.24000.4512 0.26000.4458 0.28000.4397 0.30000.4331 0.32000.4259 0.34000.4182 0.36000.4100 0.38000.4014 0.40000.3924 0.42000.3830 0.44000.3732 0.46000.3630 0.4800
article is copyrighted as indicated in the article. Reuse of AIP content is subject to the terms at: http://scitation.aip.org/termsconditions. D
Components: Evaluated by
~1! Ethanol~ethyl alcohol!; C2H6O; @64-17-5#~2! Toluene~methylbenzene!; C7H8; @108-88-3#~3! Water; H2O; @7732-18-5#
A. Skrzecz, Institute of Physical Chemistry, Polish Academy ofSciences, Warsaw, Poland~1997.05!
4.6. Ethanol 1 Water 1 Toluene
Critical Evaluation:
A survey of reported compositions along the saturation curve~sat.!, compositions of coexisting phases in equilibrium~eq.! and
distribution of ethanol between phases~distr.! for the system ethanol–toluene–water is given in Table 25.
TABLE 25. Summary of experimental data for the system ethanol–toluene–water
Author~s! T/K Type of dataa Ref.
Curtis, 1897 273 sat.~7! 1
Bonner, 1909 273 sat.~8! 2
Ormandy and Craven, 1921 243–303 sat.~48! 3
Tarasenkov and Polozhentseva, 1932 273–313 eq.~14! 4
Washburnet al., 1939 298 sat.~17!, distr. ~9! 5
Leikola, 1940 293 sat.~8! 6
Mondain-Monval and Quiquerez, 1940 298 eq.~8! 7
Arzhanovet al., 1975 348–357 eq.~6! 8
Borisovaet al., 1978 293–353 eq.~17! 9
Bevia et al., 1985 298 sat.~10! 10
Ricnaet al., 1989 278–323 sat.~7!, eq. ~37! 11
Letcher and Siswana, 1992 298 sat.~15!, eq. ~6! 12
aNumber of experimental points in parentheses.
Saturation curve
The ternary system ethanol–toluene–water forms a miscibility gap of type 1. There are 12 references for this system over the
temperature range 243–353 K. This evaluation was made on the basis of original papers with the exception of data of Ormandy and
Craven,3 Tarasenkov and Polozhentseva,4 and Leikola,6 which were taken from the handbook of Kafarov;13 these data were also taken
into account during evaluation but are not reported as compilation sheet because they do not contribute further to knowledge of the
system. Only the binary system toluene–water is partially miscible. The data for this system were compiled and critically evaluated in a
previously published SDS volume.14 The recommended values of mutual solubility at 298 K, are:x850.9972 andx950.000 0104. The
TABLE 26. Characteristic points on the bin
T/K
Max. C2H5OH concentration
x1 x2
243.2 0.573 0.168258.2 0.541 0.113273.2 0.523 0.143273.2 0.520 0.128278.2 0.512 0.161278.2 0.505 0.100288.2 0.493 0.193293.2 0.475 0.166293.2 0.503 0.197298.2 0.474 0.123298.2 0.473 0.127298.2 0.472 0.159303.2 0.465 0.139323.2 0.425 0.160347.6 0.415 0.166347.7 — —
The temperature of 298.2 K was selected to present the beh
298.2 K water-rich and benzene-rich branches together, were
x150.718 8310.092 81 ln~x2
The least-squares method was used and the standard error of e
the proposed equation are presented in Table 27 for selected
line! are also presented graphically in Fig. 14 together with all
TABLE 27. Calculated composition
x1 x2
0.0000 0.000 0104 Ref. 140.0773 0.00100.2865 0.01000.3459 0.02000.4002 0.04000.4276 0.06000.4438 0.0800
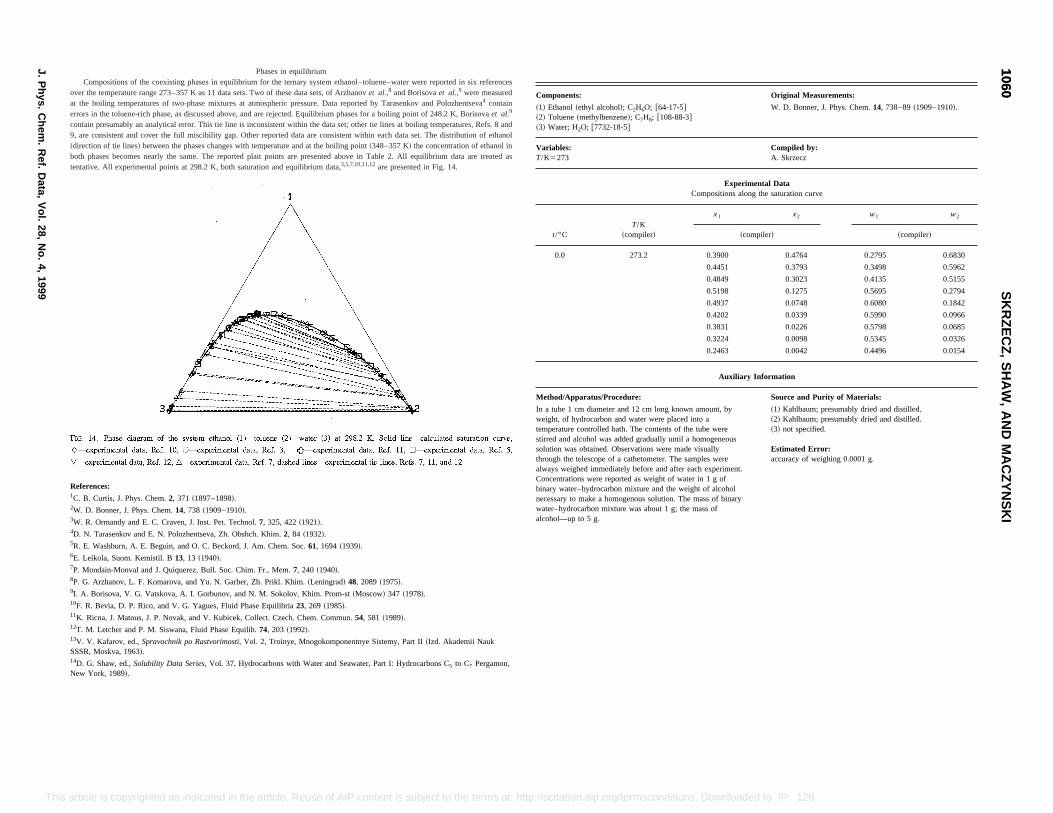
es
dol
as
mponents: Original Measurements:
Ethanol~ethyl alcohol!; C2H6O; @64-17-5#Toluene~methylbenzene!; C7H8; @108-88-3#Water; H2O; @7732-18-5#
W. D. Bonner, J. Phys. Chem.14, 738–89~1909–1910!.
riables:K5273
Compiled by:A. Skrzecz
Experimental DataCompositions along the saturation curve
t/°CT/K
~compiler!
x1 x2 w1 w2
~compiler! ~compiler!
0.0 273.2 0.3900 0.4764 0.2795 0.6830
0.4451 0.3793 0.3498 0.5962
0.4849 0.3023 0.4135 0.5155
0.5198 0.1275 0.5695 0.2794
0.4937 0.0748 0.6080 0.1842
0.4202 0.0339 0.5990 0.0966
0.3831 0.0226 0.5798 0.0685
0.3224 0.0098 0.5345 0.0326
0.2463 0.0042 0.4496 0.0154
Auxiliary Information
thod/Apparatus/Procedure: Source and Purity of Materials:
a tube 1 cm diameter and 12 cm long known amount, byight, of hydrocarbon and water were placed into aperature controlled bath. The contents of the tube were
rred and alcohol was added gradually until a homogeneouslution was obtained. Observations were made visuallyough the telescope of a cathetometer. The samples wereays weighed immediately before and after each experiment.ncentrations were reported as weight of water in 1 g ofary water–hydrocarbon mixture and the weight of alcoholcessary to make a homogenous solution. The mass of binaryter–hydrocarbon mixture was about 1 g; the mass ofohol—up to 5 g.
~1! Kahlbaum; presumably dried and distilled.~2! Kahlbaum; presumably dried and distilled.~3! not specified.
Estimated Error:accuracy of weighing 0.0001 g.
10601060
SK
RZ
EC
Z,
SH
AW
,A
ND
MA
CZ
YN
SK
I
J.P
hys.C
hem.
Ref.
Data,
Vol.
28,N
o.4,
1999
This . Downloaded to IP: 129.6.105.191 On: Fri, 05 Sep 2014 17:51:55
4D. N. Tarasenkov and E. N. Polozhentseva, Zh. Obshch. Khim.2, 84 ~1932!.5R. E. Washburn, A. E. Beguin, and O. C. Beckord, J. Am. Chem. Soc.61, 1694~1939!.6E. Leikola, Suom. Kemistil. B13, 13 ~1940!.7P. Mondain-Monval and J. Quiquerez, Bull. Soc. Chim. Fr., Mem.7, 240 ~1940!.8P. G. Arzhanov, L. F. Komarova, and Yu. N. Garber, Zh. Prikl. Khim.~Leningrad! 48, 2089~1975!.9I. A. Borisova, V. G. Vatskova, A. I. Gorbunov, and N. M. Sokolov, Khim. Prom-st~Moscow! 347 ~1978!.10F. R. Bevia, D. P. Rico, and V. G. Yagues, Fluid Phase Equilibria23, 269 ~1985!.11K. Ricna, J. Matous, J. P. Novak, and V. Kubicek, Collect. Czech. Chem. Commun.54, 581 ~1989!.12T. M. Letcher and P. M. Siswana, Fluid Phase Equilib.74, 203 ~1992!.13V. V. Kafarov, ed.,Spravochnik po Rastvorimosti, Vol. 2, Troinye, Mnogokomponentnye Sistemy, Part II~Izd. Akademii NaukSSSR, Moskva, 1963!.14D. G. Shaw, ed.,Solubility Data Series, Vol. 37, Hydrocarbons with Water and Seawater, Part I: Hydrocarbons C5 to C7 Pergamon,New York, 1989!.
article is copyrighted as indicated in the article. Reuse of AIP content is subject to the terms at: http://scitation.aip.org/termsconditions
Phases in equilibriumCompositions of the coexisting phases in equilibrium for the ternary system ethanol–toluene–water were reported in six referenc
over the temperature range 273–357 K as 11 data sets. Two of these data sets, of Arzhanovet al.,8 and Borisovaet al.,9 were measuredat the boiling temperatures of two-phase mixtures at atmospheric pressure. Data reported by Tarasenkov and Polozhentseva4 containerrors in the toluene-rich phase, as discussed above, and are rejected. Equilibrium phases for a boiling point of 248.2 K, Borisovaet al.9
contain presumably an analytical error. This tie line is inconsistent within the data set; other tie lines at boiling temperatures, Refs. 8 an9, are consistent and cover the full miscibility gap. Other reported data are consistent within each data set. The distribution of ethan~direction of tie lines! between the phases changes with temperature and at the boiling point~348–357 K! the concentration of ethanol inboth phases becomes nearly the same. The reported plait points are presented above in Table 2. All equilibrium data are treatedtentative. All experimental points at 298.2 K, both saturation and equilibrium data,3,5,7,10,11,12are presented in Fig. 14.
References:1C. B. Curtis, J. Phys. Chem.2, 371 ~1897–1898!.2W. D. Bonner, J. Phys. Chem.14, 738 ~1909–1910!.3W. R. Ormandy and E. C. Craven, J. Inst. Pet. Technol.7, 325, 422~1921!.
Co
~1!~2!~3!
VaT/
Me
InwetemstisothralwCobinnewaalc
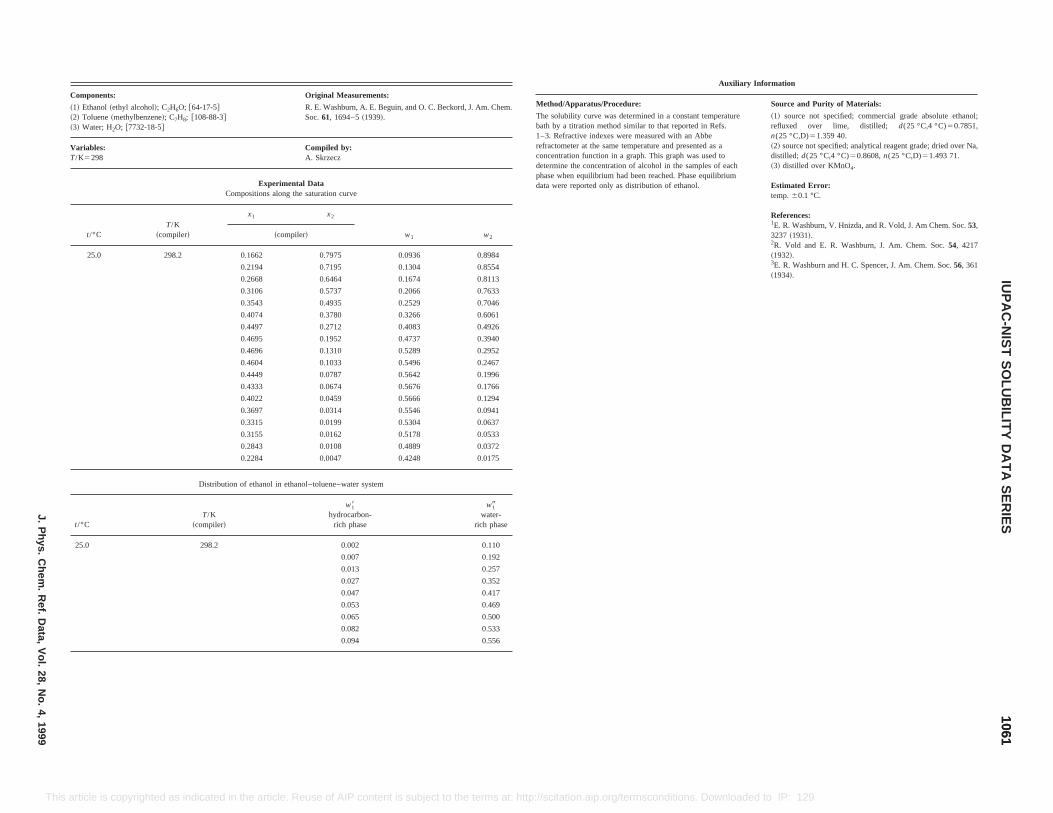
Original Measurements:
R. E. Washburn, A. E. Beguin, and O. C. Beckord, J. Am. Chem.Soc.61, 1694–5~1939!.
Compiled by:A. Skrzecz
ental Datang the saturation curve
x2
w1 w2mpiler!
0.7975 0.0936 0.8984
0.7195 0.1304 0.8554
0.6464 0.1674 0.8113
0.5737 0.2066 0.7633
0.4935 0.2529 0.7046
0.3780 0.3266 0.6061
0.2712 0.4083 0.4926
0.1952 0.4737 0.3940
0.1310 0.5289 0.2952
0.1033 0.5496 0.2467
0.0787 0.5642 0.1996
0.0674 0.5676 0.1766
0.0459 0.5666 0.1294
0.0314 0.5546 0.0941
0.0199 0.5304 0.0637
0.0162 0.5178 0.0533
0.0108 0.4889 0.0372
0.0047 0.4248 0.0175
ethanol–toluene–water system
w18hydrocarbon-
rich phase
w19water-
rich phase
Auxiliary Information
Method/Apparatus/Procedure: Source and Purity of Materials:
The solubility curve was determined in a constant temperaturebath by a titration method similar to that reported in Refs.1–3. Refractive indexes were measured with an Abberefractometer at the same temperature and presented as aconcentration function in a graph. This graph was used todetermine the concentration of alcohol in the samples of eachphase when equilibrium had been reached. Phase equilibriumdata were reported only as distribution of ethanol.
~1! source not specified; commercial grade absolute ethanol;refluxed over lime, distilled; d(25 °C,4 °C)50.7851,n(25 °C,D)51.359 40.~2! source not specified; analytical reagent grade; dried over Na,distilled; d(25 °C,4 °C)50.8608,n(25 °C,D)51.493 71.~3! distilled over KMnO4.
Estimated Error:temp.60.1 °C.
References:1E. R. Washburn, V. Hnizda, and R. Vold, J. Am Chem. Soc.53,3237 ~1931!.2R. Vold and E. R. Washburn, J. Am. Chem. Soc.54, 4217~1932!.3E. R. Washburn and H. C. Spencer, J. Am. Chem. Soc.56, 361~1934!.
10611061
IUP
AC
-NIS
TS
OLU
BILIT
YD
AT
AS
ER
IESJ.P
hys.C
hem.
Ref.
Data,
Vol.
28,N
o.4,
1999
This ditions. Downloaded to IP: 129.6.105.191 On: Fri, 05 Sep 2014 17:51:55
25.0 298.2 0.002 0.110
0.007 0.192
0.013 0.257
0.027 0.352
0.047 0.417
0.053 0.469
0.065 0.500
0.082 0.533
0.094 0.556
article is copyrighted as indicated in the article. Reuse of AIP content is subject to the terms at: http://scitation.aip.org/termscon
Components:
~1! Ethanol~ethyl alcohol!; C2H6O; @64-17-5#~2! Toluene~methylbenzene!; C7H8; @108-88-3#~3! Water; H2O; @7732-18-5#
Variables:T/K5298
ExperimCompositions alo
t/°CT/K
~compiler!
x1
~co
25.0 298.2 0.1662
0.2194
0.2668
0.3106
0.3543
0.4074
0.4497
0.4695
0.4696
0.4604
0.4449
0.4333
0.4022
0.3697
0.3315
0.3155
0.2843
0.2284
Distribution of ethanol in
t/°CT/K
~compiler!
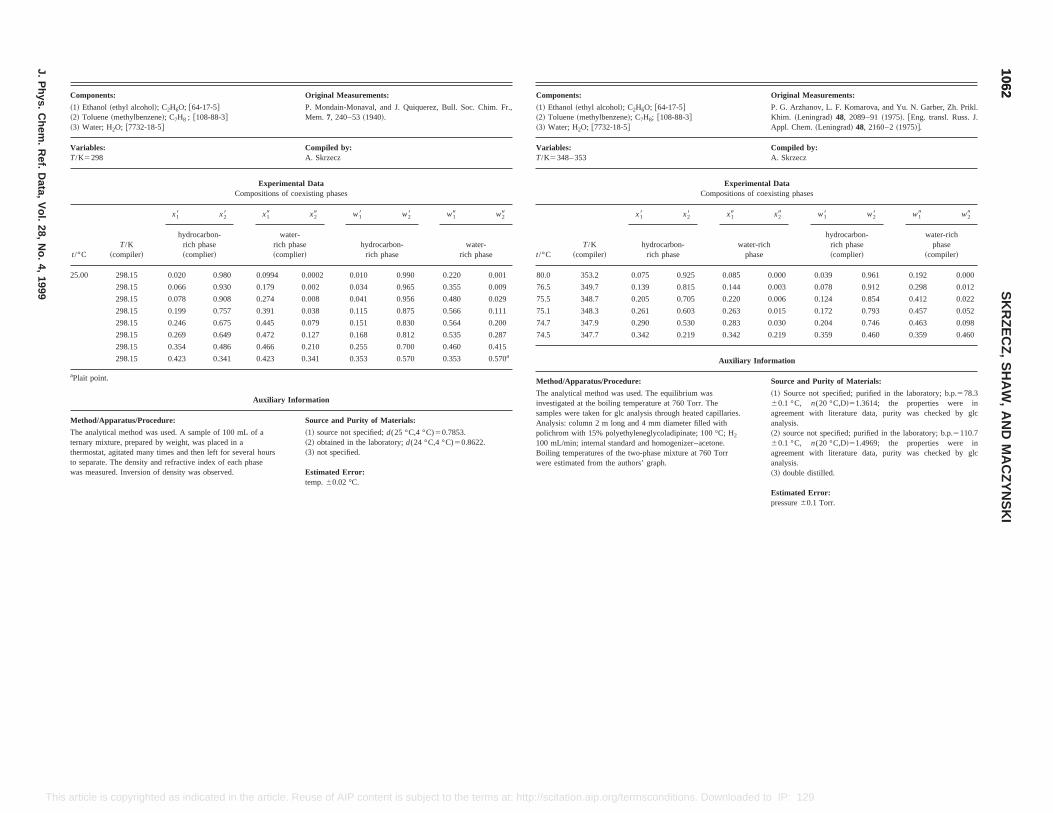
Fr.,
01
09
29
11
00
87
15
70
Components: Original Measurements:
~1! Ethanol~ethyl alcohol!; C2H6O; @64-17-5#~2! Toluene~methylbenzene!; C7H8; @108-88-3#~3! Water; H2O; @7732-18-5#
P. G. Arzhanov, L. F. Komarova, and Yu. N. Garber, Zh. Prikl.Khim. ~Leningrad! 48, 2089–91~1975!. @Eng. transl. Russ. J.Appl. Chem.~Leningrad! 48, 2160–2~1975!#.
Variables:T/K5348– 353
Compiled by:A. Skrzecz
Experimental DataCompositions of coexisting phases
t/°CT/K
~compiler!
x18 x28 x19 x29 w18 w28 w19 w29
hydrocarbon-rich phase
water-richphase
hydrocarbon-rich phase~complier!
water-richphase
~compiler!
80.0 353.2 0.075 0.925 0.085 0.000 0.039 0.961 0.192 0.000
76.5 349.7 0.139 0.815 0.144 0.003 0.078 0.912 0.298 0.012
75.5 348.7 0.205 0.705 0.220 0.006 0.124 0.854 0.412 0.022
75.1 348.3 0.261 0.603 0.263 0.015 0.172 0.793 0.457 0.052
74.7 347.9 0.290 0.530 0.283 0.030 0.204 0.746 0.463 0.098
74.5 347.7 0.342 0.219 0.342 0.219 0.359 0.460 0.359 0.460
Auxiliary Information
Method/Apparatus/Procedure: Source and Purity of Materials:
The analytical method was used. The equilibrium wasinvestigated at the boiling temperature at 760 Torr. Thesamples were taken for glc analysis through heated capillaries.Analysis: column 2 m long and 4 mm diameter filled withpolichrom with 15% polyethyleneglycoladipinate; 100 °C; H2
100 mL/min; internal standard and homogenizer–acetone.Boiling temperatures of the two-phase mixture at 760 Torrwere estimated from the authors’ graph.
~1! Source not specified; purified in the laboratory; b.p.578.360.1 °C, n(20 °C,D!51.3614; the properties were inagreement with literature data, purity was checked by glcanalysis.~2! source not specified; purified in the laboratory; b.p.5110.760.1 °C, n(20 °C,D!51.4969; the properties were inagreement with literature data, purity was checked by glcanalysis.~3! double distilled.
Estimated Error:pressure60.1 Torr.
10621062
SK
RZ
EC
Z,
SH
AW
,A
ND
MA
CZ
YN
SK
I
J.P
hys.C
hem.
Ref.
Data,
Vol.
28,N
o.4,
1999
This at: http://scitation.aip.org/termsconditions. Downloaded to IP: 129.6.105.191 On: Fri, 05 Sep 2014 17:51:55
article is copyrighted as indicated in the article. Reuse of AIP content is subject to the termsComponents: Original Measurements:
~1! Ethanol~ethyl alcohol!; C2H6O; @64-17-5#~2! Toluene~methylbenzene!; C7H8 ; @108-88-3#~3! Water; H2O; @7732-18-5#
P. Mondain-Monaval, and J. Quiquerez, Bull. Soc. Chim.Mem. 7, 240–53~1940!.
Variables:T/K5298
Compiled by:A. Skrzecz
Experimental DataCompositions of coexisting phases
t/°CT/K
~compiler!
x18 x28 x19 x29 w18 w28 w19 w29
hydrocarbon-rich phase~complier!
water-rich phase~complier!
hydrocarbon-rich phase
water-rich phase
25.00 298.15 0.020 0.980 0.0994 0.0002 0.010 0.990 0.220 0.0
298.15 0.066 0.930 0.179 0.002 0.034 0.965 0.355 0.0
298.15 0.078 0.908 0.274 0.008 0.041 0.956 0.480 0.0
298.15 0.199 0.757 0.391 0.038 0.115 0.875 0.566 0.1
298.15 0.246 0.675 0.445 0.079 0.151 0.830 0.564 0.2
298.15 0.269 0.649 0.472 0.127 0.168 0.812 0.535 0.2
298.15 0.354 0.486 0.466 0.210 0.255 0.700 0.460 0.4
298.15 0.423 0.341 0.423 0.341 0.353 0.570 0.353 0.5a
aPlait point.
Auxiliary Information
Method/Apparatus/Procedure: Source and Purity of Materials:
The analytical method was used. A sample of 100 mL of aternary mixture, prepared by weight, was placed in athermostat, agitated many times and then left for several hoursto separate. The density and refractive index of each phasewas measured. Inversion of density was observed.
~1! source not specified;d(25 °C,4 °C)50.7853.~2! obtained in the laboratory;d(24 °C,4 °C)50.8622.~3! not specified.
Estimated Error:temp.60.02 °C.
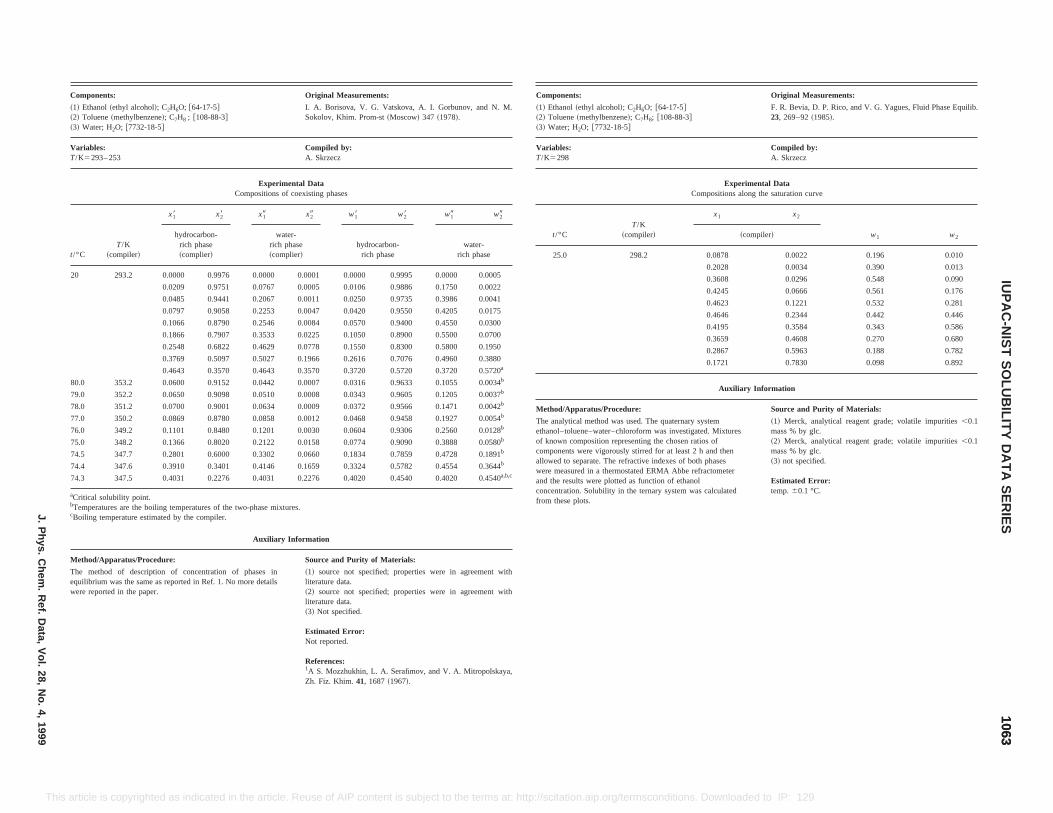
.
5
4
7
2
4
8
0
1
4
0
Components: Original Measurements:
~1! Ethanol~ethyl alcohol!; C2H6O; @64-17-5#~2! Toluene~methylbenzene!; C7H8; @108-88-3#~3! Water; H2O; @7732-18-5#
F. R. Bevia, D. P. Rico, and V. G. Yagues, Fluid Phase Equilib.23, 269–92~1985!.
Variables:T/K5298
Compiled by:A. Skrzecz
Experimental DataCompositions along the saturation curve
t/°CT/K
~compiler!
x1 x2
w1 w2~compiler!
25.0 298.2 0.0878 0.0022 0.196 0.010
0.2028 0.0034 0.390 0.013
0.3608 0.0296 0.548 0.090
0.4245 0.0666 0.561 0.176
0.4623 0.1221 0.532 0.281
0.4646 0.2344 0.442 0.446
0.4195 0.3584 0.343 0.586
0.3659 0.4608 0.270 0.680
0.2867 0.5963 0.188 0.782
0.1721 0.7830 0.098 0.892
Auxiliary Information
Method/Apparatus/Procedure: Source and Purity of Materials:
The analytical method was used. The quaternary systemethanol–toluene–water–chloroform was investigated. Mixturesof known composition representing the chosen ratios ofcomponents were vigorously stirred for at least 2 h and thenallowed to separate. The refractive indexes of both phaseswere measured in a thermostated ERMA Abbe refractometerand the results were plotted as function of ethanolconcentration. Solubility in the ternary system was calculatedfrom these plots.
~1! Merck, analytical reagent grade; volatile impurities,0.1mass % by glc.~2! Merck, analytical reagent grade; volatile impurities,0.1mass % by glc.~3! not specified.
Estimated Error:temp.60.1 °C.
10631063
IUP
AC
-NIS
TS
OLU
BILIT
YD
AT
AS
ER
IESJ.P
hys.C
hem.
Ref.
Data,
Vol.
28,N
o.4,
1999
This . Downloaded to IP: 129.6.105.191 On: Fri, 05 Sep 2014 17:51:55
Auxiliary Information
Method/Apparatus/Procedure: Source and Purity of Materials:
The method of description of concentration of phases inequilibrium was the same as reported in Ref. 1. No more detailswere reported in the paper.
~1! source not specified; properties were in agreement withliterature data.~2! source not specified; properties were in agreement withliterature data.~3! Not specified.
Estimated Error:Not reported.
References:1A S. Mozzhukhin, L. A. Serafimov, and V. A. Mitropolskaya,Zh. Fiz. Khim.41, 1687~1967!.
article is copyrighted as indicated in the article. Reuse of AIP content is subject to the terms at: http://scitation.aip.org/termsconditions
Components: Original Measurements:
~1! Ethanol~ethyl alcohol!; C2H6O; @64-17-5#~2! Toluene~methylbenzene!; C7H8 ; @108-88-3#~3! Water; H2O; @7732-18-5#
I. A. Borisova, V. G. Vatskova, A. I. Gorbunov, and N. MSokolov, Khim. Prom-st~Moscow! 347 ~1978!.
Variables:T/K5293– 253
Compiled by:A. Skrzecz
Experimental DataCompositions of coexisting phases
t/°CT/K
~compiler!
x18 x28 x19 x29 w18 w28 w19 w29
hydrocarbon-rich phase~complier!
water-rich phase~complier!
hydrocarbon-rich phase
water-rich phase
20 293.2 0.0000 0.9976 0.0000 0.0001 0.0000 0.9995 0.0000 0.000
0.0209 0.9751 0.0767 0.0005 0.0106 0.9886 0.1750 0.0022
0.0485 0.9441 0.2067 0.0011 0.0250 0.9735 0.3986 0.0041
0.0797 0.9058 0.2253 0.0047 0.0420 0.9550 0.4205 0.0175
0.1066 0.8790 0.2546 0.0084 0.0570 0.9400 0.4550 0.0300
0.1866 0.7907 0.3533 0.0225 0.1050 0.8900 0.5500 0.0700
0.2548 0.6822 0.4629 0.0778 0.1550 0.8300 0.5800 0.1950
0.3769 0.5097 0.5027 0.1966 0.2616 0.7076 0.4960 0.3880
0.4643 0.3570 0.4643 0.3570 0.3720 0.5720 0.3720 0.5720a
80.0 353.2 0.0600 0.9152 0.0442 0.0007 0.0316 0.9633 0.1055 0.003b
79.0 352.2 0.0650 0.9098 0.0510 0.0008 0.0343 0.9605 0.1205 0.003b
78.0 351.2 0.0700 0.9001 0.0634 0.0009 0.0372 0.9566 0.1471 0.004b
77.0 350.2 0.0869 0.8780 0.0858 0.0012 0.0468 0.9458 0.1927 0.005b
76.0 349.2 0.1101 0.8480 0.1201 0.0030 0.0604 0.9306 0.2560 0.012b
75.0 348.2 0.1366 0.8020 0.2122 0.0158 0.0774 0.9090 0.3888 0.058b
74.5 347.7 0.2801 0.6000 0.3302 0.0660 0.1834 0.7859 0.4728 0.189b
74.4 347.6 0.3910 0.3401 0.4146 0.1659 0.3324 0.5782 0.4554 0.364b
74.3 347.5 0.4031 0.2276 0.4031 0.2276 0.4020 0.4540 0.4020 0.454a,b,c
aCritical solubility point.bTemperatures are the boiling temperatures of the two-phase mixtures.cBoiling temperature estimated by the compiler.
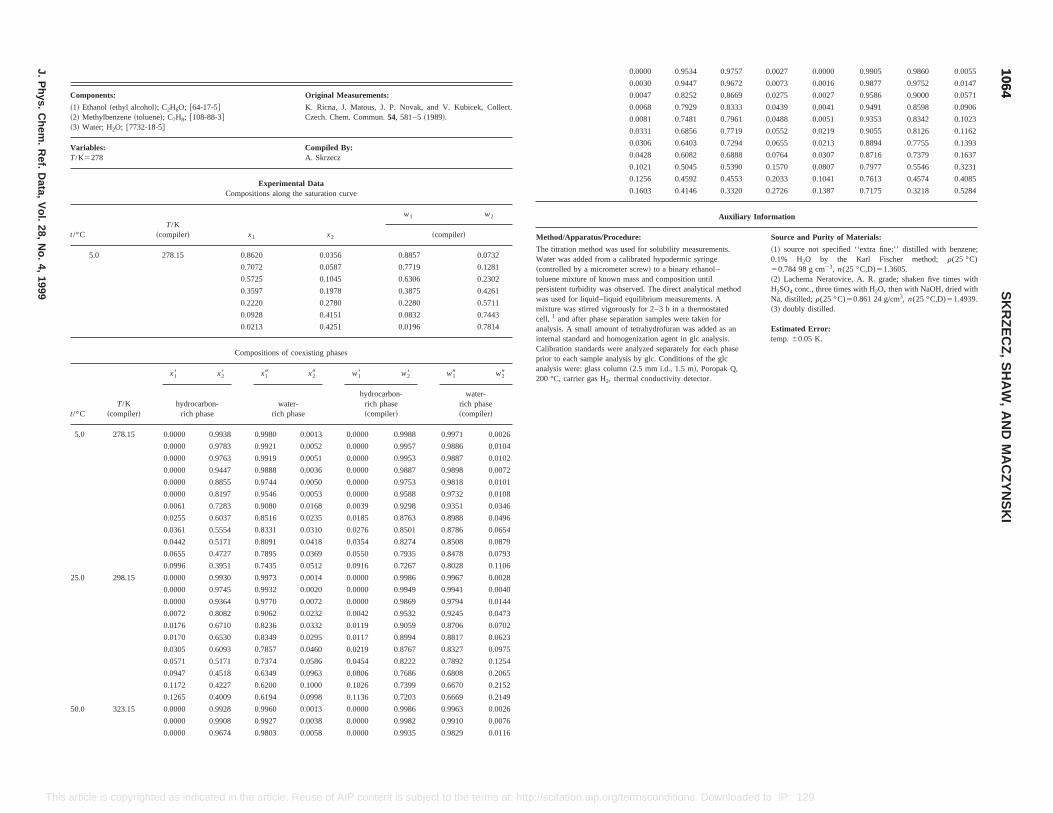
, and V. Kubicek, Collect.989!.
w2
~compiler!
0.0732
0.1281
0.2302
0.4261
0.5711
0.7443
0.7814
w19 w29
water-rich phase~compiler!
8 0.9971 0.0026
0.9886 0.0104
0.9887 0.0102
0.9898 0.0072
0.9818 0.0101
0.9732 0.0108
0.9351 0.0346
0.8988 0.0496
0.0000 0.9534 0.9757 0.0027 0.0000 0.9905 0.9860 0.0055
0.0030 0.9447 0.9672 0.0073 0.0016 0.9877 0.9752 0.0147
0.0047 0.8252 0.8669 0.0275 0.0027 0.9586 0.9000 0.0571
0.0068 0.7929 0.8333 0.0439 0.0041 0.9491 0.8598 0.0906
0.0081 0.7481 0.7961 0.0488 0.0051 0.9353 0.8342 0.1023
0.0331 0.6856 0.7719 0.0552 0.0219 0.9055 0.8126 0.1162
0.0306 0.6403 0.7294 0.0655 0.0213 0.8894 0.7755 0.1393
0.0428 0.6082 0.6888 0.0764 0.0307 0.8716 0.7379 0.1637
0.1021 0.5045 0.5390 0.1570 0.0807 0.7977 0.5546 0.3231
0.1256 0.4592 0.4553 0.2033 0.1041 0.7613 0.4574 0.4085
0.1603 0.4146 0.3320 0.2726 0.1387 0.7175 0.3218 0.5284
Auxiliary Information
Method/Apparatus/Procedure: Source and Purity of Materials:
The titration method was used for solubility measurements.Water was added from a calibrated hypodermic syringe~controlled by a micrometer screw! to a binary ethanol–toluene mixture of known mass and composition untilpersistent turbidity was observed. The direct analytical methodwas used for liquid–liquid equilibrium measurements. Amixture was stirred vigorously for 2–3 h in a thermostatedcell, 1 and after phase separation samples were taken foranalysis. A small amount of tetrahydrofuran was added as aninternal standard and homogenization agent in glc analysis.Calibration standards were analyzed separately for each phaseprior to each sample analysis by glc. Conditions of the glcanalysis were: glass column~2.5 mm i.d., 1.5 m!, Poropak Q,200 °C, carrier gas H2, thermal conductivity detector.
~1! source not specified ‘‘extra fine;’’ distilled with benzene;0.1% H2O by the Karl Fischer method; r(25 °C)50.784 98 g cm23, n(25 °C,D)51.3605.~2! Lachema Neratovice, A. R. grade; shaken five times withH2SO4 conc., three times with H2O, then with NaOH, dried withNa, distilled;r(25 °C)50.861 24 g/cm3, n(25 °C,D)51.4939.~3! doubly distilled.
Estimated Error:temp.60.05 K.
10641064
SK
RZ
EC
Z,
SH
AW
,A
ND
MA
CZ
YN
SK
I
J.P
hys.C
hem.
Ref.
Data,
Vol.
28,N
o.4,
1999
This ed to IP: 129.6.105.191 On: Fri, 05 Sep 2014 17:51:55
0.0361 0.5554 0.8331 0.0310 0.0276 0.8501 0.8786 0.0654
0.0442 0.5171 0.8091 0.0418 0.0354 0.8274 0.8508 0.0879
0.0655 0.4727 0.7895 0.0369 0.0550 0.7935 0.8478 0.0793
0.0996 0.3951 0.7435 0.0512 0.0916 0.7267 0.8028 0.1106
25.0 298.15 0.0000 0.9930 0.9973 0.0014 0.0000 0.9986 0.9967 0.0028
0.0000 0.9745 0.9932 0.0020 0.0000 0.9949 0.9941 0.0040
0.0000 0.9364 0.9770 0.0072 0.0000 0.9869 0.9794 0.0144
0.0072 0.8082 0.9062 0.0232 0.0042 0.9532 0.9245 0.0473
0.0176 0.6710 0.8236 0.0332 0.0119 0.9059 0.8706 0.0702
0.0170 0.6530 0.8349 0.0295 0.0117 0.8994 0.8817 0.0623
0.0305 0.6093 0.7857 0.0460 0.0219 0.8767 0.8327 0.0975
0.0571 0.5171 0.7374 0.0586 0.0454 0.8222 0.7892 0.1254
0.0947 0.4518 0.6349 0.0963 0.0806 0.7686 0.6808 0.2065
0.1172 0.4227 0.6200 0.1000 0.1026 0.7399 0.6670 0.2152
0.1265 0.4009 0.6194 0.0998 0.1136 0.7203 0.6669 0.2149
50.0 323.15 0.0000 0.9928 0.9960 0.0013 0.0000 0.9986 0.9963 0.0026
0.0000 0.9908 0.9927 0.0038 0.0000 0.9982 0.9910 0.0076
0.0000 0.9674 0.9803 0.0058 0.0000 0.9935 0.9829 0.0116
article is copyrighted as indicated in the article. Reuse of AIP content is subject to the terms at: http://scitation.aip.org/termsconditions. Download
Components: Original Measurements:
~1! Ethanol~ethyl alcohol!; C2H6O; @64-17-5#~2! Methylbenzene~toluene!; C7H8; @108-88-3#~3! Water; H2O; @7732-18-5#
K. Ricna, J. Matous, J. P. NovakCzech. Chem. Commun.54, 581–5~1
Variables:T/K5278
Compiled By:A. Skrzecz
Experimental DataCompositions along the saturation curve
t/°CT/K
~compiler! x1 x2
w1
5.0 278.15 0.8620 0.0356 0.8857
0.7072 0.0587 0.7719
0.5725 0.1045 0.6306
0.3597 0.1978 0.3875
0.2220 0.2780 0.2280
0.0928 0.4151 0.0832
0.0213 0.4251 0.0196
Compositions of coexisting phases
t/°CT/K
~compiler!
x18 x28 x19 x29 w18 w28
hydrocarbon-rich phase
water-rich phase
hydrocarbon-rich phase~compiler!
5.0 278.15 0.0000 0.9938 0.9980 0.0013 0.0000 0.998
0.0000 0.9783 0.9921 0.0052 0.0000 0.9957
0.0000 0.9763 0.9919 0.0051 0.0000 0.9953
0.0000 0.9447 0.9888 0.0036 0.0000 0.9887
0.0000 0.8855 0.9744 0.0050 0.0000 0.9753
0.0000 0.8197 0.9546 0.0053 0.0000 0.9588
0.0061 0.7283 0.9080 0.0168 0.0039 0.9298
0.0255 0.6037 0.8516 0.0235 0.0185 0.8763

Original Measurements:
T. M. Letcher and P. M. Siswana, Fluid Phase Equilib.74, 203–17 ~1992!.
Complied by:A. Skrzecz
tal Datathe saturation curve
x2
w1 w2
~compiler!
0.000 0.000 0.000
0.001 0.349 0.004
0.003 0.445 0.011
0.014 0.525 0.046
0.041 0.575 0.117
0.053 0.577 0.144
0.099 0.554 0.238
0.159 0.505 0.340
0.228 0.440 0.440
0.323 0.367 0.551
0.441 0.284 0.663
0.591 0.194 0.777
0.785 0.099 0.892
0.889 0.050 0.946
0.999 0.000 0.9998
coexisting phases
x29 w18 w28 w19 w29
ter-richphase
hydrocarbon-rich phase~compiler!
water-richphase
~compiler!
Auxiliary Information
Method/Apparatus/Procedure: Source and Purity of Materials:
The points on the binodal curve were determined by theformation of a cloudy mixture on shaking after the addition ofa known mass of one component to a mixture of knownmasses of the other two components. Precision weighingsyringes were used as described in Ref. 1. Tie linecompositions were determined by the refractive index methodreported in Ref. 2 and a complementary method using the KarlFischer titrations as reported in Ref. 3.
~1! Merck, AR grade; AR grade; distilled, dried by refluxingwith Mg and I2; purity better than 99.6 mole % by glc;d50.78524,n51.3594.~2! BDH; used as received; purity better than 99.6 mole % byglc.~3! not specified.
Estimated Error:estimated comp. 0.005 mole fraction on the binodal curve and0.01 mole fraction for tie lines~estimated by the authors!.
References:1T. M. Letcher, S. Wooten, B. Shuttleworth, and C. Heward, J.Chem. Thermodyn.18, 1037 ~1986!.2S. W. Briggs and E. W. Comings, Ind. Eng. Chem.35, 411~1943!.3T. M. Letcher, P. M. Siswana, P. Van der Watt, and S. Radloff,J. Chem. Thermodyn.21, 1053~1989!.
10651065
IUP
AC
-NIS
TS
OLU
BILIT
YD
AT
AS
ER
IESJ.P
hys.C
hem.
Ref.
Data,
Vol.
28,N
o.4,
1999
This rmsconditions. Downloaded to IP: 129.6.105.191 On: Fri, 05 Sep 2014 17:51:55
25.0 298.2 0.000 0.999 0.000 0.000 0.000 0.9998 0.000 0.000
0.341 0.510 0.470 0.170 0.240 0.719 0.494 0.358
0.285 0.610 0.466 0.112 0.184 0.789 0.545 0.262
0.230 0.697 0.445 0.070 0.139 0.844 0.572 0.185
0.178 0.778 0.410 0.042 0.102 0.889 0.579 0.119
0.090 0.890 0.315 0.012 0.048 0.940 0.523 0.040
article is copyrighted as indicated in the article. Reuse of AIP content is subject to the terms at: http://scitation.aip.org/te
Components:
~1! Ethanol~ethyl alcohol!; C2H6O; @64-17-5#~2! Toluene~methylbenzene!; C7H8; @108-88-3#~3! Water; H2O; @7732-18-5#
Variables:T/K5298
ExperimenCompositions along
t/°CT/K
~compiler! x1
25.0 298.2 0.000
0.174
0.242
0.319
0.404
0.424
0.460
0.472
0.456
0.430
0.378
0.296
0.174
0.094
0.000
Compositions of
t/°C T/K~compiler!
x18 x28 x19
hydrocarbon-rich phase
wa
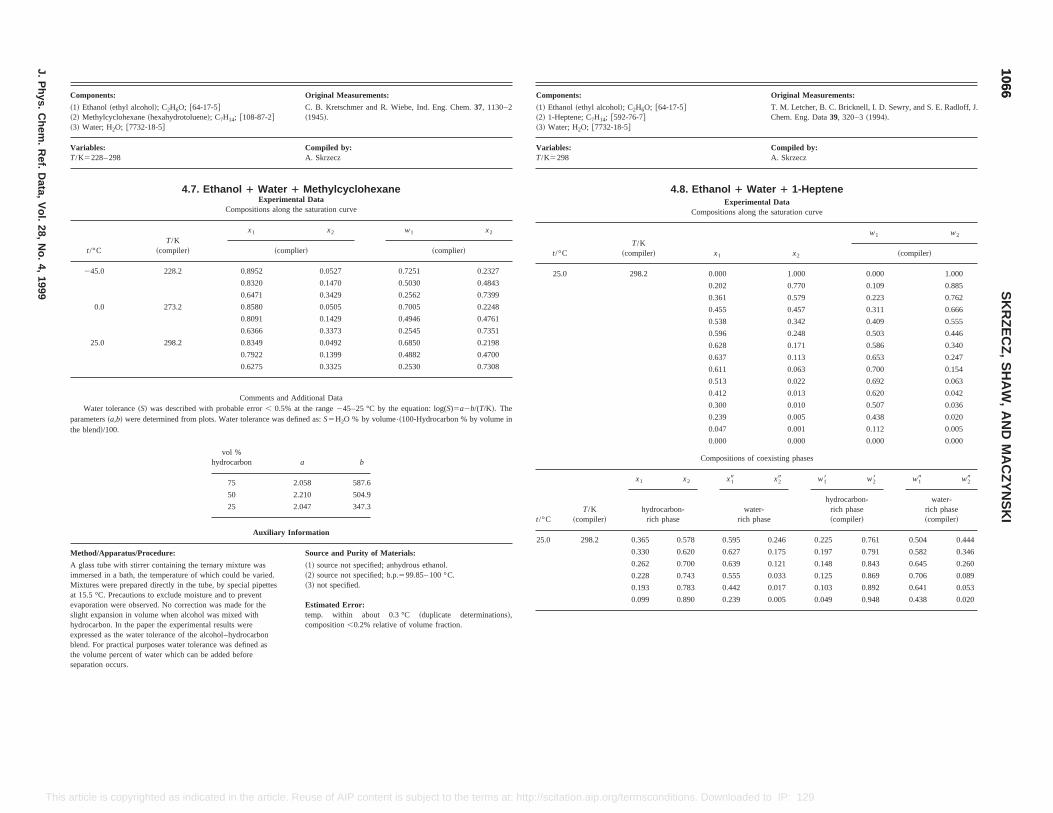
Original Measurements:
C2H6O; @64-17-5#-76-7#5#
T. M. Letcher, B. C. Bricknell, I. D. Sewry, and S. E. Radloff, J.Chem. Eng. Data39, 320–3~1994!.
Compiled by:A. Skrzecz
4.8. Ethanol 1 Water 1 1-HepteneExperimental Data
Compositions along the saturation curve
T/Kompiler! x1 x2
w1 w2
~compiler!
298.2 0.000 1.000 0.000 1.000
0.202 0.770 0.109 0.885
0.361 0.579 0.223 0.762
0.455 0.457 0.311 0.666
0.538 0.342 0.409 0.555
0.596 0.248 0.503 0.446
0.628 0.171 0.586 0.340
0.637 0.113 0.653 0.247
0.611 0.063 0.700 0.154
0.513 0.022 0.692 0.063
0.412 0.013 0.620 0.042
0.300 0.010 0.507 0.036
0.239 0.005 0.438 0.020
0.047 0.001 0.112 0.005
0.000 0.000 0.000 0.000
Compositions of coexisting phases
x1 x2 x19 x29 w18 w28 w19 w29
hydrocarbon-rich phase
water-rich phase
hydrocarbon-rich phase~compiler!
water-rich phase~compiler!
0.578 0.595 0.246 0.225 0.761 0.504 0.444
.620 0.627 0.175 0.197 0.791 0.582 0.346
.700 0.639 0.121 0.148 0.843 0.645 0.260
.743 0.555 0.033 0.125 0.869 0.706 0.089
.783 0.442 0.017 0.103 0.892 0.641 0.053
.890 0.239 0.005 0.049 0.948 0.438 0.020
10661066
SK
RZ
EC
Z,
SH
AW
,A
ND
MA
CZ
YN
SK
I
J.P
hys.C
hem.
Ref.
Data,
Vol.
28,N
o.4,
1999
This ns. Downloaded to IP: 129.6.105.191 On: Fri, 05 Sep 2014 17:51:55
Auxiliary Information
Method/Apparatus/Procedure: Source and Purity of Materials:
A glass tube with stirrer containing the ternary mixture wasimmersed in a bath, the temperature of which could be varied.Mixtures were prepared directly in the tube, by special pipettesat 15.5 °C. Precautions to exclude moisture and to preventevaporation were observed. No correction was made for theslight expansion in volume when alcohol was mixed withhydrocarbon. In the paper the experimental results wereexpressed as the water tolerance of the alcohol–hydrocarbonblend. For practical purposes water tolerance was defined asthe volume percent of water which can be added beforeseparation occurs.
~1! source not specified; anhydrous ethanol.~2! source not specified; b.p.599.85– 100 °C.~3! not specified.
Estimated Error:temp. within about 0.3 °C ~duplicate determinations!,composition,0.2% relative of volume fraction.
25.0 298.2 0.365
0.330 0
0.262 0
0.228 0
0.193 0
0.099 0
article is copyrighted as indicated in the article. Reuse of AIP content is subject to the terms at: http://scitation.aip.org/termsconditio
Components: Original Measurements:
~1! Ethanol~ethyl alcohol!; C2H6O; @64-17-5#~2! Methylcyclohexane~hexahydrotoluene!; C7H14; @108-87-2#~3! Water; H2O; @7732-18-5#
C. B. Kretschmer and R. Wiebe, Ind. Eng. Chem.37, 1130–2~1945!.
Variables:T/K5228– 298
Compiled by:A. Skrzecz
4.7. Ethanol 1 Water 1 MethylcyclohexaneExperimental Data
Compositions along the saturation curve
t/°CT/K
~compiler!
x1 x2 w1 x2
~complier! ~complier!
245.0 228.2 0.8952 0.0527 0.7251 0.2327
0.8320 0.1470 0.5030 0.4843
0.6471 0.3429 0.2562 0.7399
0.0 273.2 0.8580 0.0505 0.7005 0.2248
0.8091 0.1429 0.4946 0.4761
0.6366 0.3373 0.2545 0.7351
25.0 298.2 0.8349 0.0492 0.6850 0.2198
0.7922 0.1399 0.4882 0.4700
0.6275 0.3325 0.2530 0.7308
Comments and Additional DataWater tolerance~S! was described with probable error, 0.5% at the range245–25 °C by the equation: log(S)5a2b/(T/K!. The
parameters~a,b! were determined from plots. Water tolerance was defined as:S5H2O % by volume•~100-Hydrocarbon % by volume inthe blend!/100.
vol %hydrocarbon a b
75 2.058 587.6
50 2.210 504.9
25 2.047 347.3
Components:
~1! Ethanol~ethyl alcohol!;~2! 1-Heptene; C7H14; @592~3! Water; H2O; @7732-18-
Variables:T/K5298
t/°C ~c
25.0
t/°CT/K
~compiler!
Components: Evaluted by:
~1! Ethanol~ethyl alcohol!; C2H6O; @64-17-5#~2! Heptane~n-heptane!; C7H16; @142-82-5#~3! Water ~hydrogen oxide!; H2O; @7732-18-5#
A. Skrzecz, Institute of Physical Chemistry, Polish Academy ofSciences, Warsaw, Poland~1997.03!
4.9. Ethanol 1 Water 1 Heptane
Critical Evaluation:
A survey of reported compositions along the saturation curve~sat.!, compositions of coexisting phases in equilibrium~eq.! and
distribution of ethanol between phases~distr.! for the system ethanol–heptane–water is given in Table 28.
TABLE 28. Summary of experimental data for the system ethanol–heptane–water
Author~s! T/K Type of dataa Ref.
Bonner, 1909 273 sat.~9! 1
Schweppe and Lorah, 1954 303 sat.~24!, distr. ~7! 2
Vorobeva and Karapetyants, 1966 298 sat.~15!, eq.~9! 3
Letcheret al., 1986 298 sat.~8!, eq.~3! 4
aNumber of experimental points in parentheses.
Saturation curve
The ternary system ethanol–heptane–water forms a large miscibility gap of type 1 covering the majority of the concentration triangle.
The system was investigated by four groups over the temperature range 273–303 K; the saturation data are consistent with one another.
Only the heptane–water binary system forms a miscibility gap. The data of this system were compiled and critically evaluated in a
previously published SDS volume,5 the recommended values at 298 K are:x2954.3•1027 and x3855.6•1024. The data reported by
Schweppe and Lorah,2 at 303 K, and Vorobeva and Karapetyants,3 at 298 K, include solubility of the binary system heptane–water;
x2950.0003 andx38,0.005, respectively. These values are less precise and do not agree with the recommended data reported in Ref. 5. All
experimental solubility and equilibrium data reported at 298 K in Refs. 3 and 4, were described by the equation:
x151.113610.1319 ln~x2!21.2083x210.0932x22.
The parameters were calculated by the least-squares method and the standard error of estimate was 0.0087. The selected points on the
saturation curve, calculated by the above equation together with the ‘‘best’’ values of Ref. 5 are presented in Table 29 as in Fig. 1 as solid
line.
10671067
IUP
AC
-NIS
TS
OLU
BILIT
YD
AT
AS
ER
IESJ.P
hys.C
hem.
Ref.
Data,
Vol.
28,N
o.4,
1999
This article. Reuse of AIP content is subject to the terms at: http://scitation.aip.org/termsconditions. Downloaded to IP: 129.6.105.191 On: Fri, 05 Sep 2014 17:51:55
article is copyrighted as indicated in theAuxiliary Information
Method/Apparatus/Procedure: Source and Purity of Materials:
The experimental methods have been described in Ref. 1. Nomore details were reported in the paper.
~1! source not specified.~2! Aldrich; distilled; purity .99.8 mole % by glc, r50.692 65 g cm23.~3! not specified.
Estimated Error:Not reported.
References:1T. M. Letcher and P. M. Siswana, Fluid Phase Equilib.74, 203~1992!.
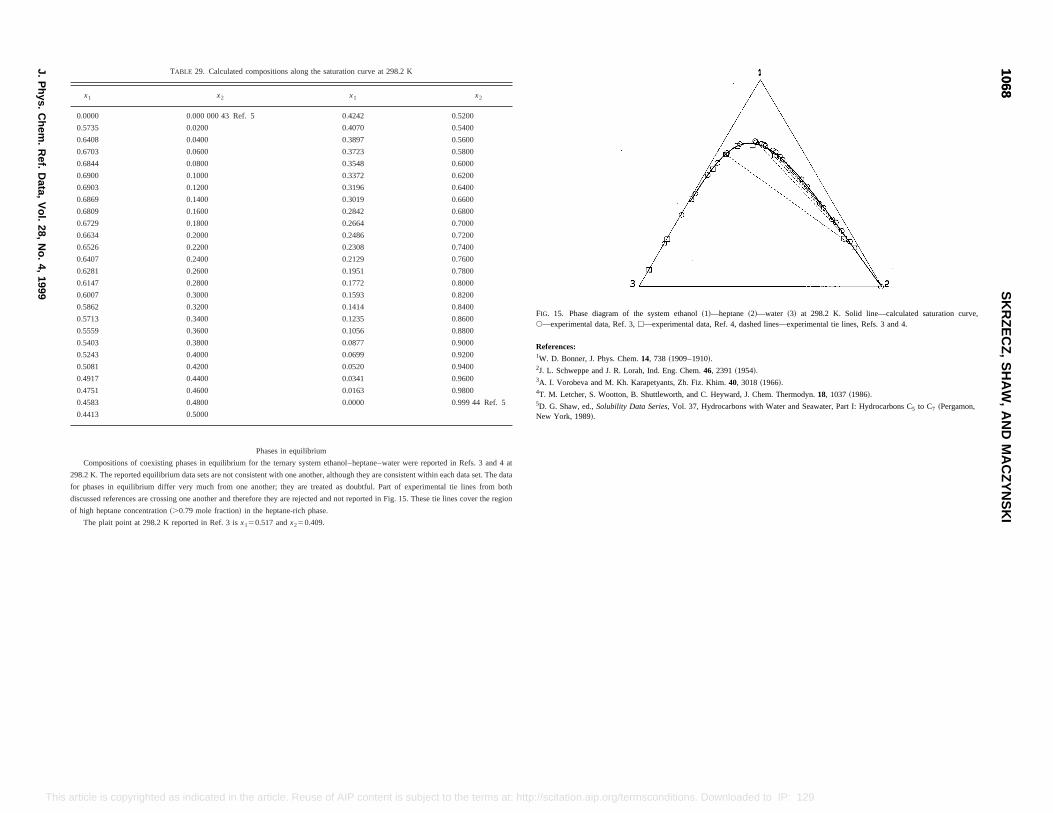
x2
0.5200
0.5400
0.5600
0.5800
0.6000
0.6200
0.6400
0.6600
0.6800
0.7000
0.7200
0.7400
0.7600
0.7800
0.8000
0.8200
0.8400
0.8600
0.8800
0.9000
0.9200
0.9400
0.9600
0.9800
0.999 44 Ref. 5
re reported in Refs. 3 and 4 at
nt within each data set. The data
erimental tie lines from both
. These tie lines cover the region
FIG. 15. Phase diagram of the system ethanol~1!—heptane~2!—water ~3! at 298.2 K. Solid line—calculated saturation curve,s—experimental data, Ref. 3,h—experimental data, Ref. 4, dashed lines—experimental tie lines, Refs. 3 and 4.
References:1W. D. Bonner, J. Phys. Chem.14, 738 ~1909–1910!.2J. L. Schweppe and J. R. Lorah, Ind. Eng. Chem.46, 2391~1954!.3A. I. Vorobeva and M. Kh. Karapetyants, Zh. Fiz. Khim.40, 3018~1966!.4T. M. Letcher, S. Wootton, B. Shuttleworth, and C. Heyward, J. Chem. Thermodyn.18, 1037~1986!.5D. G. Shaw, ed.,Solubility Data Series,Vol. 37, Hydrocarbons with Water and Seawater, Part I: Hydrocarbons C5 to C7 ~Pergamon,New York, 1989!.
10681068
SK
RZ
EC
Z,
SH
AW
,A
ND
MA
CZ
YN
SK
I
J.P
hys.C
hem.
Ref.
Data,
Vol.
28,N
o.4,
1999
This scitation.aip.org/termsconditions. Downloaded to IP: 129.6.105.191 On: Fri, 05 Sep 2014 17:51:55
article is copyrighted as indicated in the article. Reuse of AIP content is subject to the terms at: http://TABLE 29. Calculated compositions along the saturation curve at 298.2 K
x1 x2 x1
0.0000 0.000 000 43 Ref. 5 0.4242
0.5735 0.0200 0.4070
0.6408 0.0400 0.3897
0.6703 0.0600 0.3723
0.6844 0.0800 0.3548
0.6900 0.1000 0.3372
0.6903 0.1200 0.3196
0.6869 0.1400 0.3019
0.6809 0.1600 0.2842
0.6729 0.1800 0.2664
0.6634 0.2000 0.2486
0.6526 0.2200 0.2308
0.6407 0.2400 0.2129
0.6281 0.2600 0.1951
0.6147 0.2800 0.1772
0.6007 0.3000 0.1593
0.5862 0.3200 0.1414
0.5713 0.3400 0.1235
0.5559 0.3600 0.1056
0.5403 0.3800 0.0877
0.5243 0.4000 0.0699
0.5081 0.4200 0.0520
0.4917 0.4400 0.0341
0.4751 0.4600 0.0163
0.4583 0.4800 0.0000
0.4413 0.5000
Phases in equilibrium
Compositions of coexisting phases in equilibrium for the ternary system ethanol–heptane–water we
298.2 K. The reported equilibrium data sets are not consistent with one another, although they are consiste
for phases in equilibrium differ very much from one another; they are treated as doubtful. Part of exp
discussed references are crossing one another and therefore they are rejected and not reported in Fig. 15
of high heptane concentration~.0.79 mole fraction! in the heptane-rich phase.
The plait point at 298.2 K reported in Ref. 3 isx150.517 andx250.409.
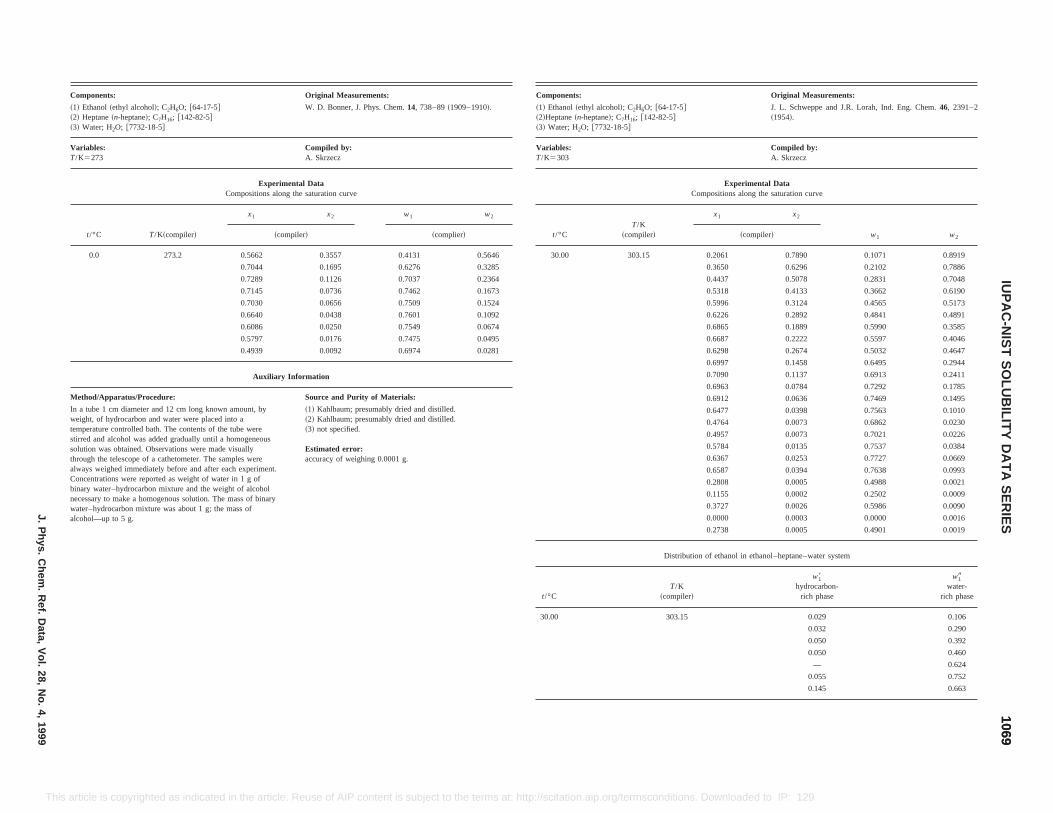
Original Measurements:
J. L. Schweppe and J.R. Lorah, Ind. Eng. Chem.46, 2391–2~1954!.
Compiled by:A. Skrzecz
Experimental Dataositions along the saturation curve
x1 x2
w1 w2~compiler!
0.2061 0.7890 0.1071 0.8919
.3650 0.6296 0.2102 0.7886
.4437 0.5078 0.2831 0.7048
.5318 0.4133 0.3662 0.6190
.5996 0.3124 0.4565 0.5173
.6226 0.2892 0.4841 0.4891
.6865 0.1889 0.5990 0.3585
.6687 0.2222 0.5597 0.4046
.6298 0.2674 0.5032 0.4647
.6997 0.1458 0.6495 0.2944
.7090 0.1137 0.6913 0.2411
.6963 0.0784 0.7292 0.1785
.6912 0.0636 0.7469 0.1495
.6477 0.0398 0.7563 0.1010
.4764 0.0073 0.6862 0.0230
.4957 0.0073 0.7021 0.0226
.5784 0.0135 0.7537 0.0384
.6367 0.0253 0.7727 0.0669
.6587 0.0394 0.7638 0.0993
.2808 0.0005 0.4988 0.0021
.1155 0.0002 0.2502 0.0009
.3727 0.0026 0.5986 0.0090
.0000 0.0003 0.0000 0.0016
0.2738 0.0005 0.4901 0.0019
Distribution of ethanol in ethanol–heptane–water system
°CT/K
~compiler!
w18hydrocarbon-
rich phase
w19water-
rich phase
.00 303.15 0.029 0.106
0.032 0.290
0.050 0.392
0.050 0.460
— 0.624
0.055 0.752
0.145 0.663
10691069
IUP
AC
-NIS
TS
OLU
BILIT
YD
AT
AS
ER
IESJ.P
hys.C
hem.
Ref.
Data,
Vol.
28,N
o.4,
1999
This citation.aip.org/termsconditions. Downloaded to IP: 129.6.105.191 On: Fri, 05 Sep 2014 17:51:55
t/
30
article is copyrighted as indicated in the article. Reuse of AIP content is subject to the terms at: http://s
Components: Original Measurements:
~1! Ethanol~ethyl alcohol!; C2H6O; @64-17-5#~2! Heptane~n-heptane!; C7H16; @142-82-5#~3! Water; H2O; @7732-18-5#
W. D. Bonner, J. Phys. Chem.14, 738–89~1909–1910!.
Variables:T/K5273
Compiled by:A. Skrzecz
Experimental DataCompositions along the saturation curve
t/°C T/K~compiler!
x1 x2 w1 w2
~compiler! ~complier!
0.0 273.2 0.5662 0.3557 0.4131 0.5646
0.7044 0.1695 0.6276 0.3285
0.7289 0.1126 0.7037 0.2364
0.7145 0.0736 0.7462 0.1673
0.7030 0.0656 0.7509 0.1524
0.6640 0.0438 0.7601 0.1092
0.6086 0.0250 0.7549 0.0674
0.5797 0.0176 0.7475 0.0495
0.4939 0.0092 0.6974 0.0281
Auxiliary Information
Method/Apparatus/Procedure: Source and Purity of Materials:
In a tube 1 cm diameter and 12 cm long known amount, byweight, of hydrocarbon and water were placed into atemperature controlled bath. The contents of the tube werestirred and alcohol was added gradually until a homogeneoussolution was obtained. Observations were made visuallythrough the telescope of a cathetometer. The samples werealways weighed immediately before and after each experiment.Concentrations were reported as weight of water in 1 g ofbinary water–hydrocarbon mixture and the weight of alcoholnecessary to make a homogenous solution. The mass of binarywater–hydrocarbon mixture was about 1 g; the mass ofalcohol—up to 5 g.
~1! Kahlbaum; presumably dried and distilled.~2! Kahlbaum; presumably dried and distilled.~3! not specified.
Estimated error:accuracy of weighing 0.0001 g.
Components:
~1! Ethanol~ethyl alcohol!; C2H6O; @64-17-5#~2!Heptane~n-heptane!; C7H16; @142-82-5#~3! Water; H2O; @7732-18-5#
Variables:T/K5303
Comp
t/°CT/K
~compiler!
30.00 303.15
0
0
0
0
0
0
0
0
0
0
0
0
0
0
0
0
0
0
0
0
0
0
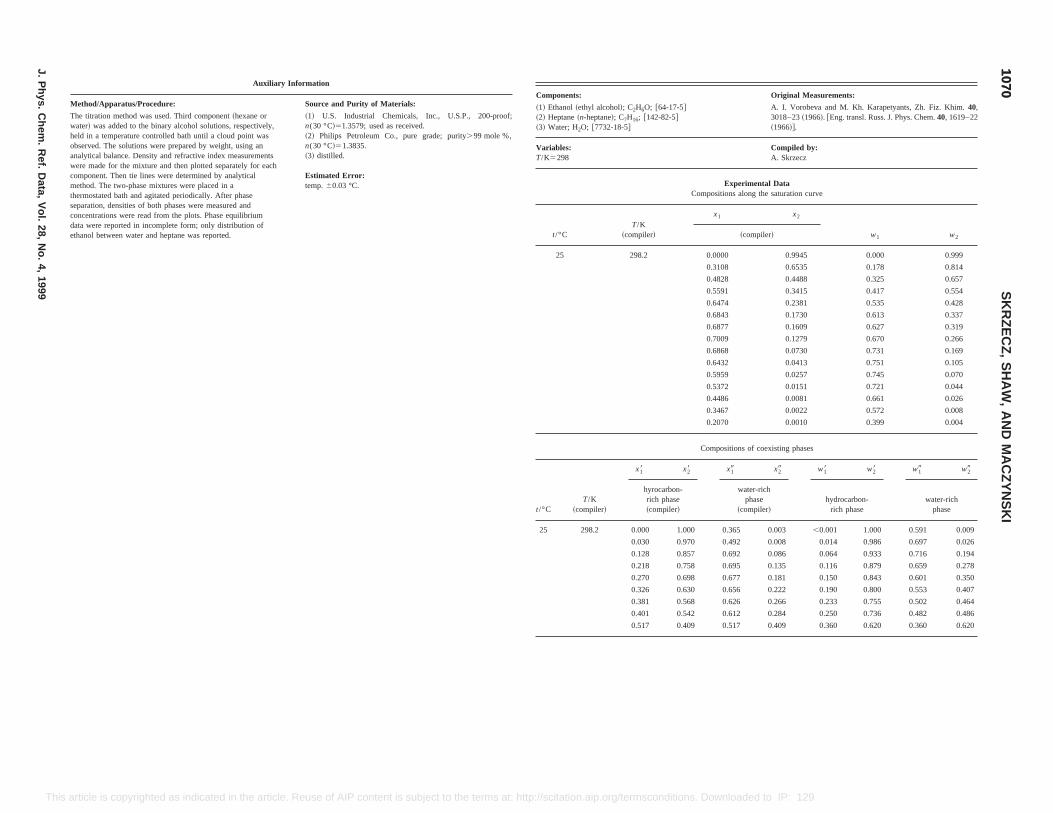
Original Measurements:
; @64-17-5#42-82-5#
A. I. Vorobeva and M. Kh. Karapetyants, Zh. Fiz. Khim.40,3018–23~1966!. @Eng. transl. Russ. J. Phys. Chem.40, 1619–22~1966!#.
Compiled by:A. Skrzecz
Experimental DataCompositions along the saturation curve
r!
x1 x2
w1 w2~compiler!
0.0000 0.9945 0.000 0.999
0.3108 0.6535 0.178 0.814
0.4828 0.4488 0.325 0.657
0.5591 0.3415 0.417 0.554
0.6474 0.2381 0.535 0.428
0.6843 0.1730 0.613 0.337
0.6877 0.1609 0.627 0.319
0.7009 0.1279 0.670 0.266
0.6868 0.0730 0.731 0.169
0.6432 0.0413 0.751 0.105
0.5959 0.0257 0.745 0.070
0.5372 0.0151 0.721 0.044
0.4486 0.0081 0.661 0.026
0.3467 0.0022 0.572 0.008
0.2070 0.0010 0.399 0.004
Compositions of coexisting phases
x28 x19 x29 w18 w28 w19 w29
rocarbon-ich phaseompiler!
water-richphase
~compiler!hydrocarbon-
rich phasewater-rich
phase
25 298.2 0.000 1.000 0.365 0.003 ,0.001 1.000 0.591 0.009
0.030 0.970 0.492 0.008 0.014 0.986 0.697 0.026
0.128 0.857 0.692 0.086 0.064 0.933 0.716 0.194
0.218 0.758 0.695 0.135 0.116 0.879 0.659 0.278
0.270 0.698 0.677 0.181 0.150 0.843 0.601 0.350
0.326 0.630 0.656 0.222 0.190 0.800 0.553 0.407
0.381 0.568 0.626 0.266 0.233 0.755 0.502 0.464
0.401 0.542 0.612 0.284 0.250 0.736 0.482 0.486
0.517 0.409 0.517 0.409 0.360 0.620 0.360 0.620
10701070
SK
RZ
EC
Z,
SH
AW
,A
ND
MA
CZ
YN
SK
I
J.P
hys.C
hem.
Ref.
Data,
Vol.
28,N
o.4,
1999
This article. Reuse of AIP content is subject to the terms at: http://scitation.aip.org/termsconditions. Downloaded to IP: 129.6.105.191 On: Fri, 05 Sep 2014 17:51:55
article is copyrighted as indicated in theAuxiliary Information
Method/Apparatus/Procedure: Source and Purity of Materials:
The titration method was used. Third component~hexane orwater! was added to the binary alcohol solutions, respectively,held in a temperature controlled bath until a cloud point wasobserved. The solutions were prepared by weight, using ananalytical balance. Density and refractive index measurementswere made for the mixture and then plotted separately for eachcomponent. Then tie lines were determined by analyticalmethod. The two-phase mixtures were placed in athermostated bath and agitated periodically. After phaseseparation, densities of both phases were measured andconcentrations were read from the plots. Phase equilibriumdata were reported in incomplete form; only distribution ofethanol between water and heptane was reported.
~1! U.S. Industrial Chemicals, Inc., U.S.P., 200-proof;n(30 °C!51.3579; used as received.~2! Philips Petroleum Co., pure grade; purity.99 mole %,n(30 °C!51.3835.~3! distilled.
Estimated Error:temp.60.03 °C.
Components:
~1! Ethanol~ethyl alcohol!; C2H6O~2! Heptane~n-heptane!; C7H16; @1~3! Water; H2O; @7732-18-5#
Variables:T/K5298
t/°CT/K
~compile
25 298.2
t/°CT/K
~compiler!
x18
hyr~c
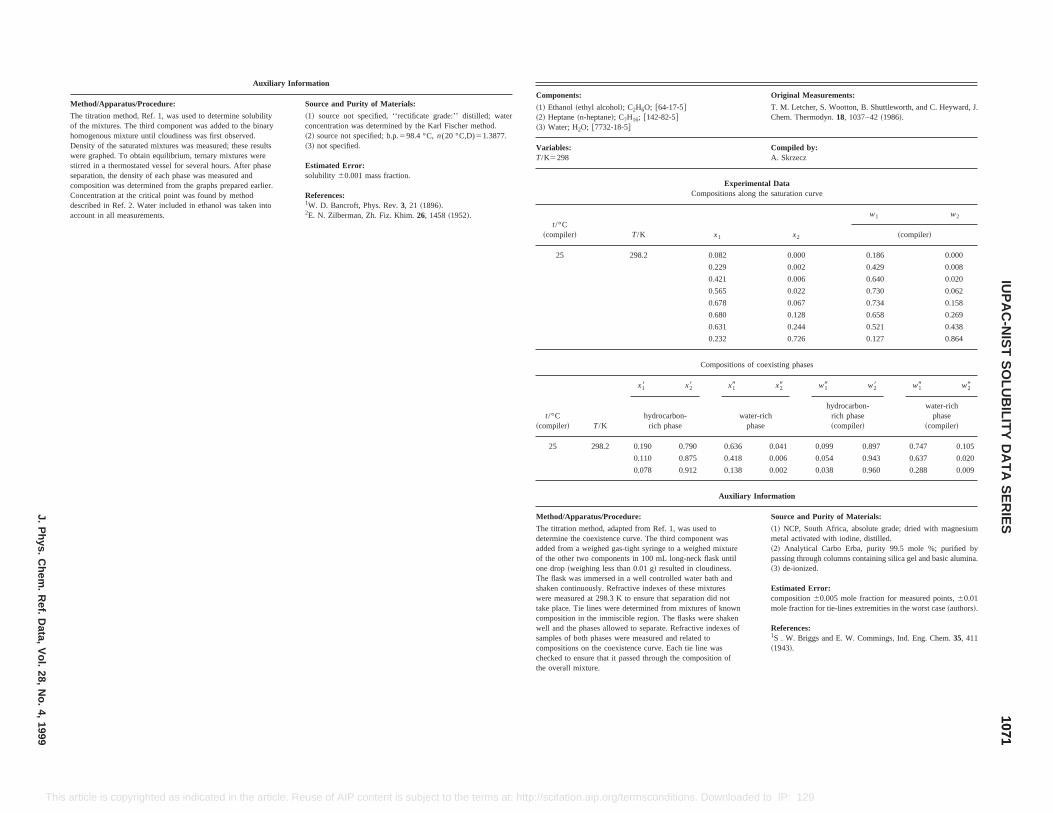
M
TohDwsscCda
Original Measurements:
-5# T. M. Letcher, S. Wootton, B. Shuttleworth, and C. Heyward, J.Chem. Thermodyn.18, 1037–42~1986!.
Compiled by:A. Skrzecz
Experimental DataCompositions along the saturation curve
x1 x2
w1 w2
~compiler!
0.082 0.000 0.186 0.000
0.229 0.002 0.429 0.008
0.421 0.006 0.640 0.020
0.565 0.022 0.730 0.062
0.678 0.067 0.734 0.158
0.680 0.128 0.658 0.269
0.631 0.244 0.521 0.438
0.232 0.726 0.127 0.864
Compositions of coexisting phases
x28 x19 x29 w19 w28 w19 w29
on-se
water-richphase
hydrocarbon-rich phase~compiler!
water-richphase
~compiler!
0.790 0.636 0.041 0.099 0.897 0.747 0.105
0.875 0.418 0.006 0.054 0.943 0.637 0.020
0.912 0.138 0.002 0.038 0.960 0.288 0.009
Auxiliary Information
Source and Purity of Materials:
The titration method, adapted from Ref. 1, was used todetermine the coexistence curve. The third component wasadded from a weighed gas-tight syringe to a weighed mixtureof the other two components in 100 mL long-neck flask untilone drop~weighing less than 0.01 g! resulted in cloudiness.The flask was immersed in a well controlled water bath andshaken continuously. Refractive indexes of these mixtureswere measured at 298.3 K to ensure that separation did nottake place. Tie lines were determined from mixtures of knowncomposition in the immiscible region. The flasks were shakenwell and the phases allowed to separate. Refractive indexes ofsamples of both phases were measured and related tocompositions on the coexistence curve. Each tie line waschecked to ensure that it passed through the composition ofthe overall mixture.
~1! NCP, South Africa, absolute grade; dried with magnesiummetal activated with iodine, distilled.~2! Analytical Carbo Erba, purity 99.5 mole %; purified bypassing through columns containing silica gel and basic alumina.~3! de-ionized.
Estimated Error:composition60.005 mole fraction for measured points,60.01mole fraction for tie-lines extremities in the worst case~authors!.
References:1S . W. Briggs and E. W. Commings, Ind. Eng. Chem.35, 411~1943!.
10711071
IUP
AC
-NIS
TS
OLU
BILIT
YD
AT
AS
ER
IESJ.P
hys.C
hem.
Ref.
Data,
Vol.
28,N
o.4,
1999
This a the article. Reuse of AIP content is subject to the terms at: http://scitation.aip.org/termsconditions. Downloaded to IP: 129.6.105.191 On: Fri, 05 Sep 2014 17:51:55
rticle is copyrighted as indicated inAuxiliary Information
ethod/Apparatus/Procedure: Source and Purity of Materials:
he titration method, Ref. 1, was used to determine solubilityf the mixtures. The third component was added to the binaryomogenous mixture until cloudiness was first observed.ensity of the saturated mixtures was measured; these resultsere graphed. To obtain equilibrium, ternary mixtures weretirred in a thermostated vessel for several hours. After phaseeparation, the density of each phase was measured andomposition was determined from the graphs prepared earlier.oncentration at the critical point was found by methodescribed in Ref. 2. Water included in ethanol was taken intoccount in all measurements.
~1! source not specified, ‘‘rectificate grade:’’ distilled; waterconcentration was determined by the Karl Fischer method.~2! source not specified; b.p.598.4 °C,n(20 °C,D)51.3877.~3! not specified.
Estimated Error:solubility 60.001 mass fraction.
References:1W. D. Bancroft, Phys. Rev.3, 21 ~1896!.2E. N. Zilberman, Zh. Fiz. Khim.26, 1458~1952!.
Components:
~1! Ethanol~ethyl alcohol!; C2H6O; @64-17~2! Heptane~n-heptane!; C7H16; @142-82-5#~3! Water; H2O; @7732-18-5#
Variables:T/K5298
t/°C~compiler! T/K
25 298.2
t/°C~compiler! T/K
x18
hydrocarbrich pha
25 298.2 0.190
0.110
0.078
Method/Apparatus/Procedure:
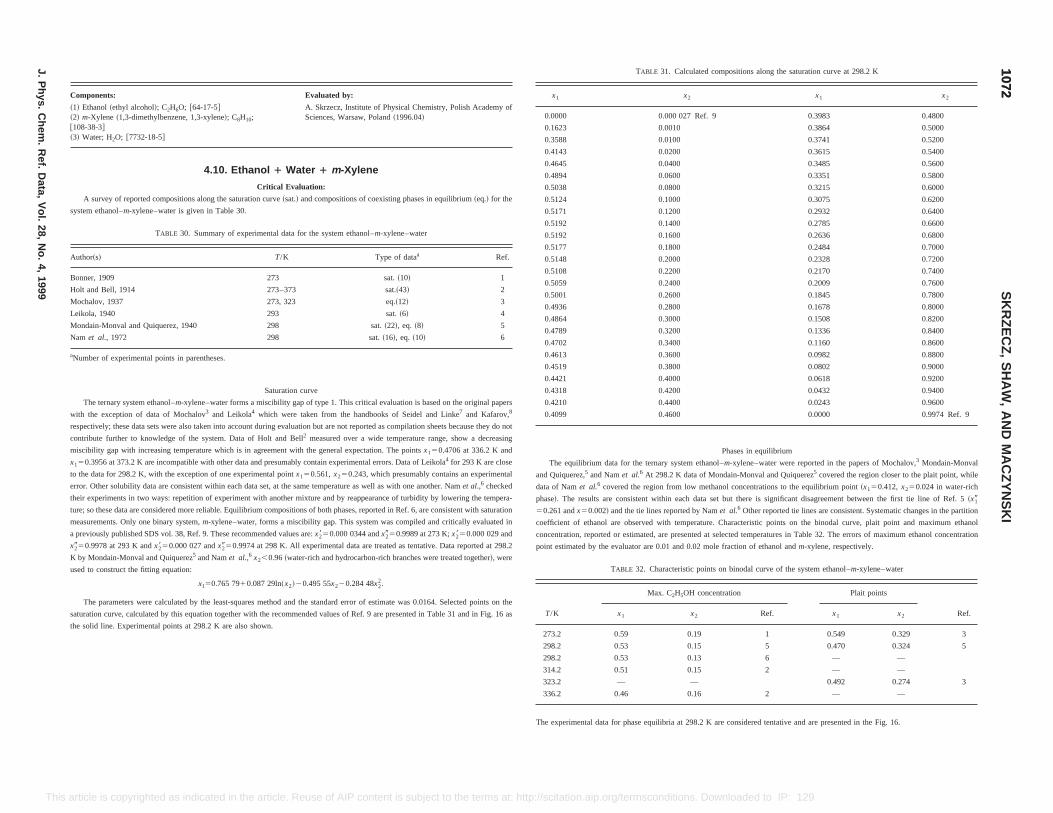
ositions along the saturation curve at 298.2 K
x1 x2
0.3983 0.4800
0.3864 0.5000
0.3741 0.5200
0.3615 0.5400
0.3485 0.5600
0.3351 0.5800
0.3215 0.6000
0.3075 0.6200
0.2932 0.6400
0.2785 0.6600
0.2636 0.6800
0.2484 0.7000
0.2328 0.7200
0.2170 0.7400
0.2009 0.7600
0.1845 0.7800
0.1678 0.8000
0.1508 0.8200
0.1336 0.8400
0.1160 0.8600
0.0982 0.8800
0.0802 0.9000
0.0618 0.9200
0.0432 0.9400
0.0243 0.9600
0.0000 0.9974 Ref. 9
ses in equilibrium
–ylene–water were reported in the papers of Mochalov,3 Mondain-Monval
in-Monval and Quiquerez5 covered the region closer to the plait point, while
l concentrations to the equilibrium point~x150.412,x250.024 in water-rich
t but there is significant disagreement between the first tie line of Ref. 5~x19
l.6 Other reported tie lines are consistent. Systematic changes in the partition
Characteristic points on the binodal curve, plait point and maximum ethanol
ated, are presented at selected temperatures in Table 32. The errors of maximum ethanol concentration
r are 0.01 and 0.02 mole fraction of ethanol andm-xylene, respectively.
. Characteristic points on binodal curve of the system ethanol–m-xylene–water
Max. C2H5OH concentration Plait points
x2 Ref. x1 x2 Ref.
0.19 1 0.549 0.329 3
0.15 5 0.470 0.324 5
0.13 6 — —
0.15 2 — —
— 0.492 0.274 3
0.16 2 — —
se equilibria at 298.2 K are considered tentative and are presented in the Fig. 16.
10721072
SK
RZ
EC
Z,
SH
AW
,A
ND
MA
CZ
YN
SK
I
J.P
hys.C
hem.
Ref.
Data,
Vol.
28,N
o.4,
1999
This conditions. Downloaded to IP: 129.6.105.191 On: Fri, 05 Sep 2014 17:51:55
a previously published SDS vol. 38, Ref. 9. These recommended values are:x2850.000 0344 andx2950.9989 at 273 K;x2850.000 029 and
x2950.9978 at 293 K andx2850.000 027 andx2950.9974 at 298 K. All experimental data are treated as tentative. Data reported at 298.2
K by Mondain-Monval and Quiquerez5 and Namet al.,6 x2,0.96~water-rich and hydrocarbon-rich branches were treated together!, were
used to construct the fitting equation:
x150.765 7910.087 29ln~x2!20.495 55x220.284 48x22.
The parameters were calculated by the least-squares method and the standard error of estimate was 0.0164. Selected points on the
saturation curve, calculated by this equation together with the recommended values of Ref. 9 are presented in Table 31 and in Fig. 16 as
the solid line. Experimental points at 298.2 K are also shown.
concentration, reported or estim
point estimated by the evaluato
TABLE 32
T/K x1
273.2 0.59
298.2 0.53
298.2 0.53
314.2 0.51
323.2 —
336.2 0.46
The experimental data for pha
article is copyrighted as indicated in the article. Reuse of AIP content is subject to the terms at: http://scitation.aip.org/terms
Components: Evaluated by:
~1! Ethanol~ethyl alcohol!; C2H6O; @64-17-5#~2! m-Xylene ~1,3-dimethylbenzene, 1,3-xylene!; C8H10;@108-38-3#~3! Water; H2O; @7732-18-5#
A. Skrzecz, Institute of Physical Chemistry, Polish Academy ofSciences, Warsaw, Poland~1996.04!
4.10. Ethanol 1 Water 1 m-Xylene
Critical Evaluation:
A survey of reported compositions along the saturation curve~sat.! and compositions of coexisting phases in equilibrium~eq.! for the
system ethanol–m-xylene–water is given in Table 30.
TABLE 30. Summary of experimental data for the system ethanol–m-xylene–water
Author~s! T/K Type of dataa Ref.
Bonner, 1909 273 sat.~10! 1
Holt and Bell, 1914 273–373 sat.~43! 2
Mochalov, 1937 273, 323 eq.~12! 3
Leikola, 1940 293 sat.~6! 4
Mondain-Monval and Quiquerez, 1940 298 sat.~22!, eq. ~8! 5
Nam et al., 1972 298 sat.~16!, eq. ~10! 6
aNumber of experimental points in parentheses.
Saturation curve
The ternary system ethanol–m-xylene–water forms a miscibility gap of type 1. This critical evaluation is based on the original papers
with the exception of data of Mochalov3 and Leikola4 which were taken from the handbooks of Seidel and Linke7 and Kafarov,8
respectively; these data sets were also taken into account during evaluation but are not reported as compilation sheets because they do not
contribute further to knowledge of the system. Data of Holt and Bell2 measured over a wide temperature range, show a decreasing
miscibility gap with increasing temperature which is in agreement with the general expectation. The pointsx150.4706 at 336.2 K and
x150.3956 at 373.2 K are incompatible with other data and presumably contain experimental errors. Data of Leikola4 for 293 K are close
to the data for 298.2 K, with the exception of one experimental pointx150.561,x250.243, which presumably contains an experimental
error. Other solubility data are consistent within each data set, at the same temperature as well as with one another. Namet al.,6 checked
their experiments in two ways: repetition of experiment with another mixture and by reappearance of turbidity by lowering the tempera-
ture; so these data are considered more reliable. Equilibrium compositions of both phases, reported in Ref. 6, are consistent with saturation
measurements. Only one binary system,m-xylene–water, forms a miscibility gap. This system was compiled and critically evaluated in
TABLE 31. Calculated comp
x1 x2
0.0000 0.000 027 Ref. 9
0.1623 0.0010
0.3588 0.0100
0.4143 0.0200
0.4645 0.0400
0.4894 0.0600
0.5038 0.0800
0.5124 0.1000
0.5171 0.1200
0.5192 0.1400
0.5192 0.1600
0.5177 0.1800
0.5148 0.2000
0.5108 0.2200
0.5059 0.2400
0.5001 0.2600
0.4936 0.2800
0.4864 0.3000
0.4789 0.3200
0.4702 0.3400
0.4613 0.3600
0.4519 0.3800
0.4421 0.4000
0.4318 0.4200
0.4210 0.4400
0.4099 0.4600
Pha
The equilibrium data for the ternary system ethanolm-x
and Quiquerez,5 and Namet al.6 At 298.2 K data of Monda
data of Namet al.6 covered the region from low methano
phase!. The results are consistent within each data se
50.261 andx50.002! and the tie lines reported by Namet a
coefficient of ethanol are observed with temperature.
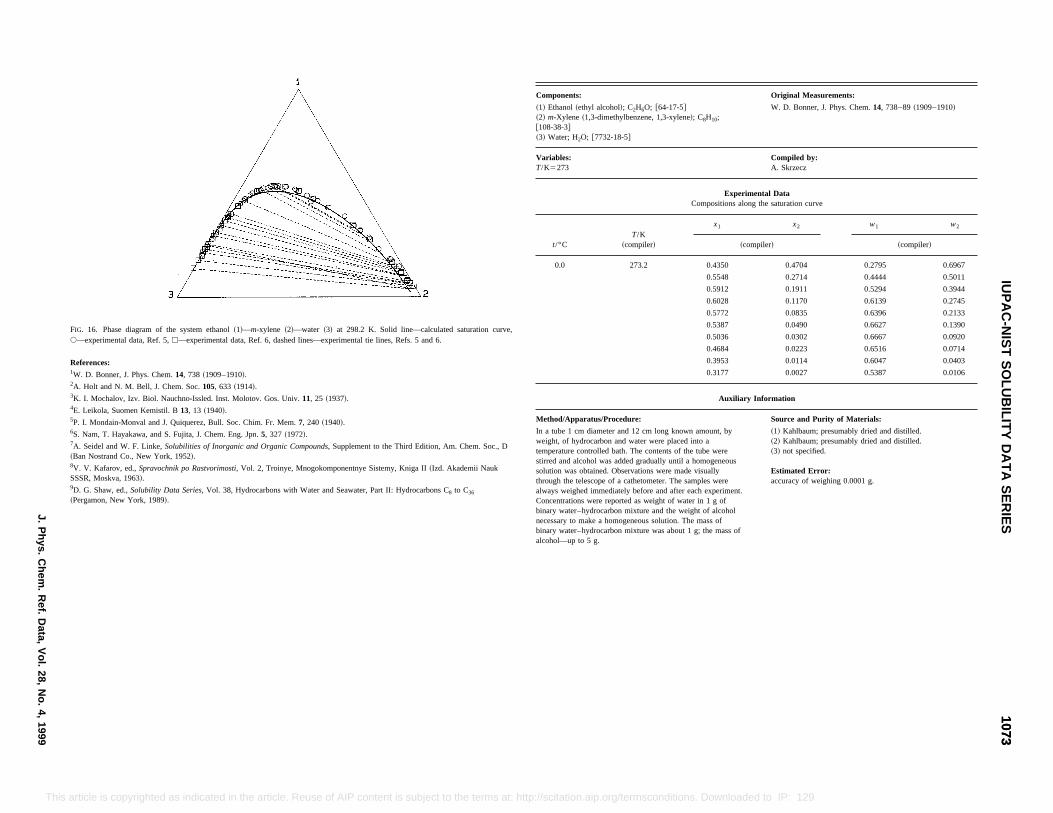
ponents: Original Measurements:
thanol~ethyl alcohol!; C2H6O; @64-17-5#-Xylene ~1,3-dimethylbenzene, 1,3-xylene!; C8H10;-38-3#ater; H2O; @7732-18-5#
W. D. Bonner, J. Phys. Chem.14, 738–89~1909–1910!
bles:273
Compiled by:A. Skrzecz
Experimental DataCompositions along the saturation curve
t/°CT/K
~compiler!
x1 x2 w1 w2
~compiler! ~compiler!
0.0 273.2 0.4350 0.4704 0.2795 0.6967
0.5548 0.2714 0.4444 0.5011
0.5912 0.1911 0.5294 0.3944
0.6028 0.1170 0.6139 0.2745
0.5772 0.0835 0.6396 0.2133
0.5387 0.0490 0.6627 0.1390
0.5036 0.0302 0.6667 0.0920
0.4684 0.0223 0.6516 0.0714
0.3953 0.0114 0.6047 0.0403
0.3177 0.0027 0.5387 0.0106
Auxiliary Information
od/Apparatus/Procedure: Source and Purity of Materials:
tube 1 cm diameter and 12 cm long known amount, byht, of hydrocarbon and water were placed into aerature controlled bath. The contents of the tube wered and alcohol was added gradually until a homogeneousion was obtained. Observations were made visuallygh the telescope of a cathetometer. The samples wereys weighed immediately before and after each experiment.entrations were reported as weight of water in 1 g of
ry water–hydrocarbon mixture and the weight of alcoholssary to make a homogeneous solution. The mass of
binary water–hydrocarbon mixture was about 1 g; the mass ofalcohol—up to 5 g.
~1! Kahlbaum; presumably dried and distilled.~2! Kahlbaum; presumably dried and distilled.~3! not specified.
Estimated Error:accuracy of weighing 0.0001 g.
10731073
IUP
AC
-NIS
TS
OLU
BILIT
YD
AT
AS
ER
IESJ.P
hys.C
hem.
Ref.
Data,
Vol.
28,N
o.4,
1999
This ttp://scitation.aip.org/termsconditions. Downloaded to IP: 129.6.105.191 On: Fri, 05 Sep 2014 17:51:55
article is copyrighted as indicated in the article. Reuse of AIP content is subject to the terms at: hFIG. 16. Phase diagram of the system ethanol~1!—m-xylene ~2!—water ~3! at 298.2 K. Solid line—calculated saturation curve,s—experimental data, Ref. 5,h—experimental data, Ref. 6, dashed lines—experimental tie lines, Refs. 5 and 6.
References:1W. D. Bonner, J. Phys. Chem.14, 738 ~1909–1910!.2A. Holt and N. M. Bell, J. Chem. Soc.105, 633 ~1914!.3K. I. Mochalov, Izv. Biol. Nauchno-Issled. Inst. Molotov. Gos. Univ.11, 25 ~1937!.4E. Leikola, Suomen Kemistil. B13, 13 ~1940!.5P. I. Mondain-Monval and J. Quiquerez, Bull. Soc. Chim. Fr. Mem.7, 240 ~1940!.6S. Nam, T. Hayakawa, and S. Fujita, J. Chem. Eng. Jpn.5, 327 ~1972!.7A. Seidel and W. F. Linke,Solubilities of Inorganic and Organic Compounds, Supplement to the Third Edition, Am. Chem. Soc., D~Ban Nostrand Co., New York, 1952!.8V. V. Kafarov, ed.,Spravochnik po Rastvorimosti, Vol. 2, Troinye, Mnogokomponentnye Sistemy, Kniga II~Izd. Akademii NaukSSSR, Moskva, 1963!.9D. G. Shaw, ed.,Solubility Data Series, Vol. 38, Hydrocarbons with Water and Seawater, Part II: Hydrocarbons C8 to C36
~Pergamon, New York, 1989!.
Com
~1! E~2! m@108~3! W
VariaT/K5
Meth
In aweigtempstirresolutthroualwaConcbinanece
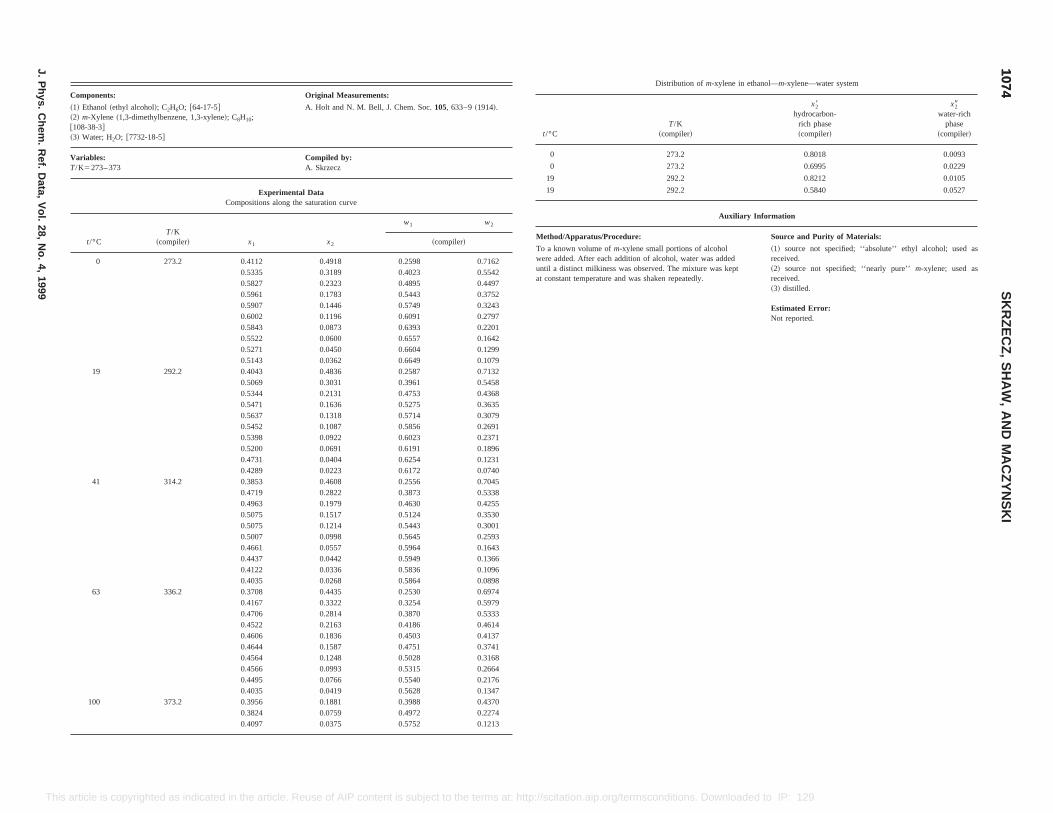
Measurements:
nd N. M. Bell, J. Chem. Soc.105, 633–9~1914!.
by:cz
ion curve
w1 w2
~compiler!
918 0.2598 0.716289 0.4023 0.554223 0.4895 0.449783 0.5443 0.375246 0.5749 0.324396 0.6091 0.279773 0.6393 0.220100 0.6557 0.164250 0.6604 0.129962 0.6649 0.1079836 0.2587 0.713231 0.3961 0.545831 0.4753 0.436836 0.5275 0.363518 0.5714 0.307987 0.5856 0.269122 0.6023 0.237191 0.6191 0.189604 0.6254 0.123123 0.6172 0.0740608 0.2556 0.704522 0.3873 0.533879 0.4630 0.425517 0.5124 0.353014 0.5443 0.3001
Distribution of m-xylene in ethanol—m-xylene—water system
t/°CT/K
~compiler!
x28hydrocarbon-
rich phase~compiler!
x29water-rich
phase~compiler!
0 273.2 0.8018 0.0093
0 273.2 0.6995 0.0229
19 292.2 0.8212 0.0105
19 292.2 0.5840 0.0527
Auxiliary Information
Method/Apparatus/Procedure: Source and Purity of Materials:
To a known volume ofm-xylene small portions of alcoholwere added. After each addition of alcohol, water was addeduntil a distinct milkiness was observed. The mixture was keptat constant temperature and was shaken repeatedly.
~1! source not specified; ‘‘absolute’’ ethyl alcohol; used asreceived.~2! source not specified; ‘‘nearly pure’’m-xylene; used asreceived.~3! distilled.
Estimated Error:Not reported.
10741074
SK
RZ
EC
Z,
SH
AW
,A
ND
MA
CZ
YN
SK
I
J.P
hys.C
hem.
Ref.
Data,
Vol.
28,N
o.4,
1999
This ed to IP: 129.6.105.191 On: Fri, 05 Sep 2014 17:51:55
0.5007 0.0998 0.5645 0.25930.4661 0.0557 0.5964 0.16430.4437 0.0442 0.5949 0.13660.4122 0.0336 0.5836 0.10960.4035 0.0268 0.5864 0.0898
63 336.2 0.3708 0.4435 0.2530 0.69740.4167 0.3322 0.3254 0.59790.4706 0.2814 0.3870 0.53330.4522 0.2163 0.4186 0.46140.4606 0.1836 0.4503 0.41370.4644 0.1587 0.4751 0.37410.4564 0.1248 0.5028 0.31680.4566 0.0993 0.5315 0.26640.4495 0.0766 0.5540 0.21760.4035 0.0419 0.5628 0.1347
100 373.2 0.3956 0.1881 0.3988 0.43700.3824 0.0759 0.4972 0.22740.4097 0.0375 0.5752 0.1213
article is copyrighted as indicated in the article. Reuse of AIP content is subject to the terms at: http://scitation.aip.org/termsconditions. Download
Components: Original
~1! Ethanol~ethyl alcohol!; C2H6O; @64-17-5#~2! m-Xylene ~1,3-dimethylbenzene, 1,3-xylene!; C8H10;@108-38-3#~3! Water; H2O; @7732-18-5#
A. Holt a
Variables:T/K5273– 373
CompiledA. Skrze
Experimental DataCompositions along the saturat
t/°CT/K
~compiler! x1 x2
0 273.2 0.4112 0.40.5335 0.310.5827 0.230.5961 0.170.5907 0.140.6002 0.110.5843 0.080.5522 0.060.5271 0.040.5143 0.03
19 292.2 0.4043 0.40.5069 0.300.5344 0.210.5471 0.160.5637 0.130.5452 0.100.5398 0.090.5200 0.060.4731 0.040.4289 0.02
41 314.2 0.3853 0.40.4719 0.280.4963 0.190.5075 0.150.5075 0.12
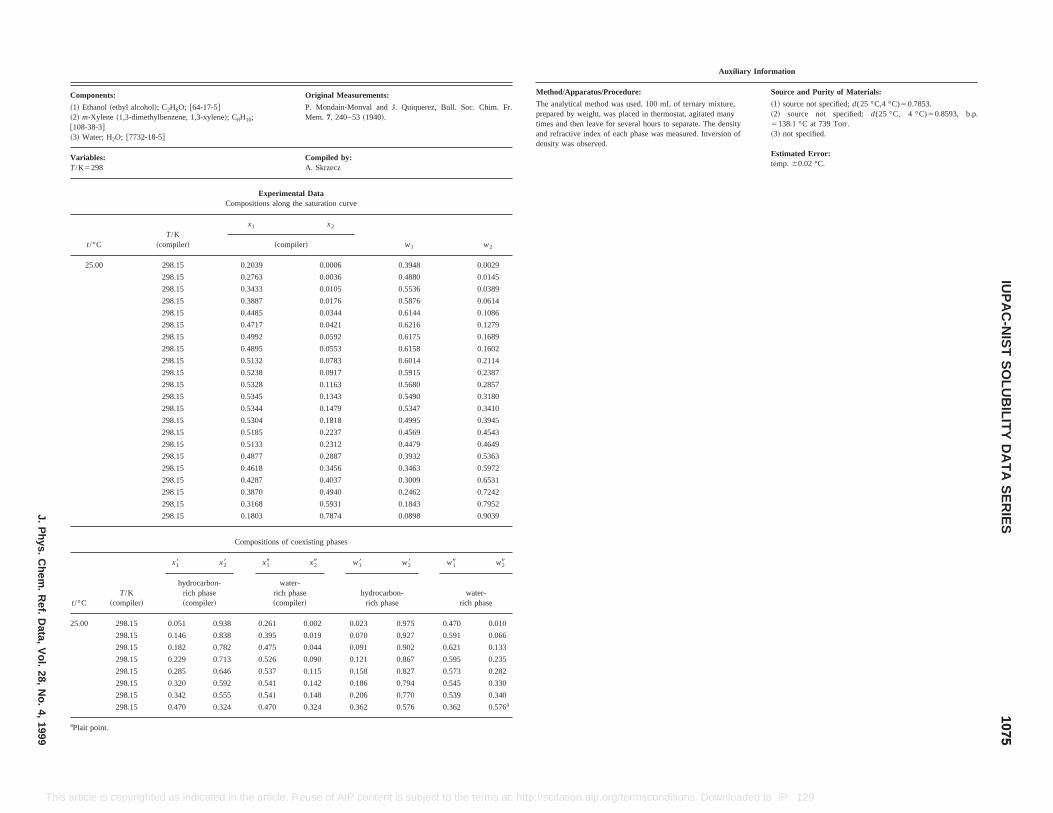
Original Measurements:
; @64-17-5#ne, 1,3-xylene!; C8H10;
P. Mondain-Monval and J. Quiquerez, Bull. Soc. Chim. Fr.Mem. 7, 240–53~1940!.
Compiled by:A. Skrzecz
Experimental DataCompositions along the saturation curve
ler!
x1 x2
w1 w2~compiler!
5 0.2039 0.0006 0.3948 0.0029
5 0.2763 0.0036 0.4880 0.0145
5 0.3433 0.0105 0.5536 0.0389
5 0.3887 0.0176 0.5876 0.0614
5 0.4485 0.0344 0.6144 0.1086
5 0.4717 0.0421 0.6216 0.1279
5 0.4992 0.0592 0.6175 0.1689
5 0.4895 0.0553 0.6158 0.1602
5 0.5132 0.0783 0.6014 0.2114
5 0.5238 0.0917 0.5915 0.2387
5 0.5328 0.1163 0.5680 0.2857
5 0.5345 0.1343 0.5490 0.3180
5 0.5344 0.1479 0.5347 0.3410
5 0.5304 0.1818 0.4995 0.3945
5 0.5185 0.2237 0.4569 0.4543
5 0.5133 0.2312 0.4479 0.4649
5 0.4877 0.2887 0.3932 0.5363
5 0.4618 0.3456 0.3463 0.5972
5 0.4287 0.4037 0.3009 0.6531
5 0.3870 0.4940 0.2462 0.7242
5 0.3168 0.5931 0.1843 0.7952
5 0.1803 0.7874 0.0898 0.9039
Auxiliary Information
Method/Apparatus/Procedure: Source and Purity of Materials:
The analytical method was used. 100 mL of ternary mixture,prepared by weight, was placed in thermostat, agitated manytimes and then leave for several hours to separate. The densityand refractive index of each phase was measured. Inversion ofdensity was observed.
~1! source not specified;d(25 °C,4 °C)50.7853.~2! source not specified;d(25 °C, 4 °C)50.8593, b.p.5138.1 °C at 739 Torr.~3! not specified.
Estimated Error:temp.60.02 °C.
10751075
IUP
AC
-NIS
TS
OLU
BILIT
YD
AT
AS
ER
IESJ.P
hys.C
hem.
Ref.
Data,
Vol.
28,N
o.4,
1999
Th aded to IP: 129.6.105.191 On: Fri, 05 Sep 2014 17:51:55
Compositions of coexisting phases
t/°CT/K
~compiler!
x18 x28 x19 x29 w18 w28 w19 w29
hydrocarbon-rich phase~compiler!
water-rich phase~compiler!
hydrocarbon-rich phase
water-rich phase
25.00 298.15 0.051 0.938 0.261 0.002 0.023 0.975 0.470 0.010
298.15 0.146 0.838 0.395 0.019 0.070 0.927 0.591 0.066
298.15 0.182 0.782 0.475 0.044 0.091 0.902 0.621 0.133
298.15 0.229 0.713 0.526 0.090 0.121 0.867 0.595 0.235
298.15 0.285 0.646 0.537 0.115 0.158 0.827 0.573 0.282
298.15 0.320 0.592 0.541 0.142 0.186 0.794 0.545 0.330
298.15 0.342 0.555 0.541 0.148 0.206 0.770 0.539 0.340
298.15 0.470 0.324 0.470 0.324 0.362 0.576 0.362 0.576a
aPlait point.
is article is copyrighted as indicated in the article. Reuse of AIP content is subject to the terms at: http://scitation.aip.org/termsconditions. Downlo
Components:
~1! Ethanol~ethyl alcohol!; C2H6O~2! m-Xylene ~1,3-dimethylbenze@108-38-3#~3! Water; H2O; @7732-18-5#
Variables:T/K5298
t/°CT/K
~compi
25.00 298.1
298.1
298.1
298.1
298.1
298.1
298.1
298.1
298.1
298.1
298.1
298.1
298.1
298.1
298.1
298.1
298.1
298.1
298.1
298.1
298.1
298.1
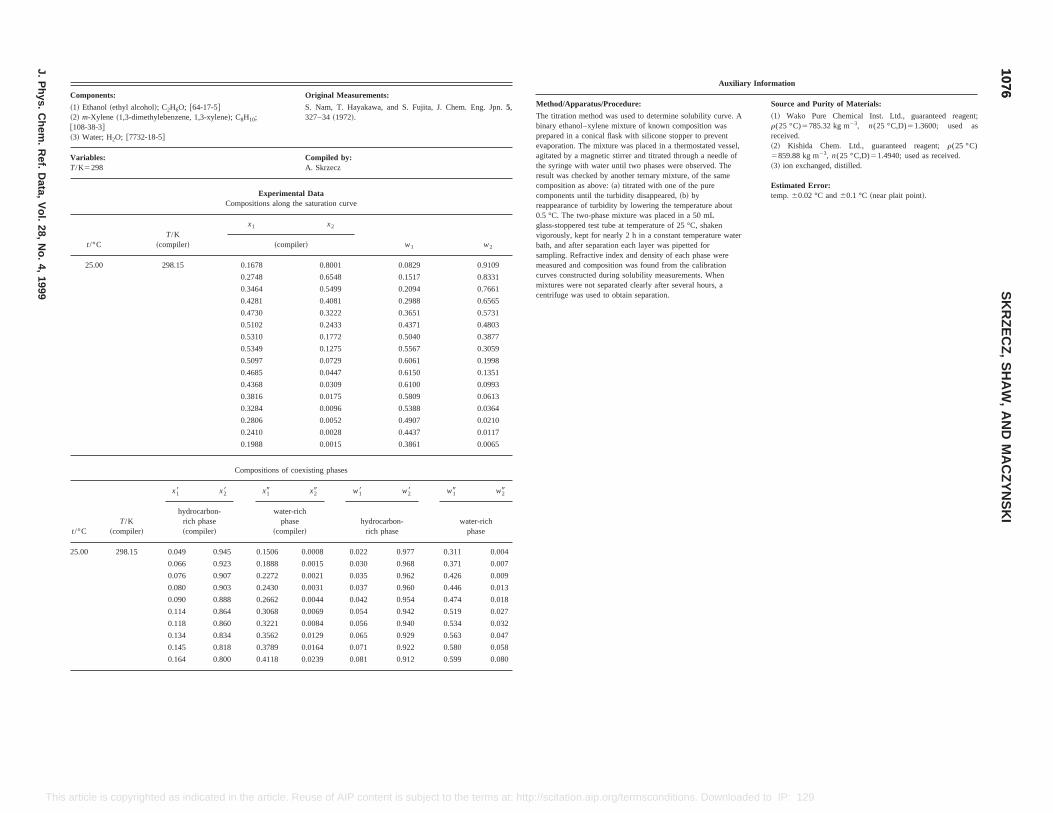
inal Measurements:
am, T. Hayakawa, and S. Fujita, J. Chem. Eng. Jpn.5,34~1972!.
piled by:krzecz
turation curve
x2
w1 w2
0.8001 0.0829 0.9109
0.6548 0.1517 0.8331
0.5499 0.2094 0.7661
0.4081 0.2988 0.6565
0.3222 0.3651 0.5731
0.2433 0.4371 0.4803
0.1772 0.5040 0.3877
0.1275 0.5567 0.3059
0.0729 0.6061 0.1998
0.0447 0.6150 0.1351
0.0309 0.6100 0.0993
0.0175 0.5809 0.0613
0.0096 0.5388 0.0364
0.0052 0.4907 0.0210
0.0028 0.4437 0.0117
0.0015 0.3861 0.0065
ng phases
w18 w28 w19 w29
hydrocarbon- water-rich
Auxiliary Information
Method/Apparatus/Procedure: Source and Purity of Materials:
The titration method was used to determine solubility curve. Abinary ethanol–xylene mixture of known composition wasprepared in a conical flask with silicone stopper to preventevaporation. The mixture was placed in a thermostated vessel,agitated by a magnetic stirrer and titrated through a needle ofthe syringe with water until two phases were observed. Theresult was checked by another ternary mixture, of the samecomposition as above:~a! titrated with one of the purecomponents until the turbidity disappeared,~b! byreappearance of turbidity by lowering the temperature about0.5 °C. The two-phase mixture was placed in a 50 mLglass-stoppered test tube at temperature of 25 °C, shakenvigorously, kept for nearly 2 h in aconstant temperature waterbath, and after separation each layer was pipetted forsampling. Refractive index and density of each phase weremeasured and composition was found from the calibrationcurves constructed during solubility measurements. Whenmixtures were not separated clearly after several hours, acentrifuge was used to obtain separation.
~1! Wako Pure Chemical Inst. Ltd., guaranteed reagent;r(25 °C)5785.32 kg m23, n(25 °C,D)51.3600; used asreceived.~2! Kishida Chem. Ltd., guaranteed reagent;r(25 °C)5859.88 kg m23, n(25 °C,D)51.4940; used as received.~3! ion exchanged, distilled.
Estimated Error:temp.60.02 °C and60.1 °C ~near plait point!.
10761076
SK
RZ
EC
Z,
SH
AW
,A
ND
MA
CZ
YN
SK
I
J.P
hys.C
hem.
Ref.
Data,
Vol.
28,N
o.4,
1999
This ns. Downloaded to IP: 129.6.105.191 On: Fri, 05 Sep 2014 17:51:55
t/°C ~compiler! ~compiler! ~compiler! rich phase phase
25.00 298.15 0.049 0.945 0.1506 0.0008 0.022 0.977 0.311 0.004
0.066 0.923 0.1888 0.0015 0.030 0.968 0.371 0.007
0.076 0.907 0.2272 0.0021 0.035 0.962 0.426 0.009
0.080 0.903 0.2430 0.0031 0.037 0.960 0.446 0.013
0.090 0.888 0.2662 0.0044 0.042 0.954 0.474 0.018
0.114 0.864 0.3068 0.0069 0.054 0.942 0.519 0.027
0.118 0.860 0.3221 0.0084 0.056 0.940 0.534 0.032
0.134 0.834 0.3562 0.0129 0.065 0.929 0.563 0.047
0.145 0.818 0.3789 0.0164 0.071 0.922 0.580 0.058
0.164 0.800 0.4118 0.0239 0.081 0.912 0.599 0.080
article is copyrighted as indicated in the article. Reuse of AIP content is subject to the terms at: http://scitation.aip.org/termsconditio
Components: Orig
~1! Ethanol~ethyl alcohol!; C2H6O; @64-17-5#~2! m-Xylene ~1,3-dimethylebenzene, 1,3-xylene!; C8H10;@108-38-3#~3! Water; H2O; @7732-18-5#
S. N327–
Variables:T/K5298
ComA. S
Experimental DataCompositions along the sa
t/°CT/K
~compiler!
x1
~compiler!
25.00 298.15 0.1678
0.2748
0.3464
0.4281
0.4730
0.5102
0.5310
0.5349
0.5097
0.4685
0.4368
0.3816
0.3284
0.2806
0.2410
0.1988
Compositions of coexisti
T/K
x18 x28 x19 x29
hydrocarbon-rich phase
water-richphase

298
ces
lso
is
gh they
treated
f high
for
TABLE 34. Calculated compositions along the saturation curve at 298.2 K
x1 x2 x1 x2
0.0000 0.000 0293 Ref. 3 0.3861 0.5000
0.1468 0.0010 0.3741 0.5200
0.3424 0.0100 0.3617 0.5400
0.3981 0.0200 0.3489 0.5600
0.4490 0.0400 0.3358 0.5800
0.4748 0.0600 0.3223 0.6000
0.4901 0.0800 0.3085 0.6200
0.4995 0.1000 0.2943 0.6400
0.5052 0.1200 0.2797 0.6600
0.5081 0.1400 0.2648 0.6800
0.5090 0.1600 0.2496 0.7000
0.5082 0.1800 0.2341 0.7200
0.5061 0.2000 0.2182 0.7400
0.5029 0.2200 0.2020 0.7600
0.4987 0.2400 0.1855 0.7800
0.4937 0.2600 0.1686 0.8000
0.4878 0.2800 0.1515 0.8200
0.4813 0.3000 0.1340 0.8400
0.4741 0.3200 0.1162 0.8600
0.4663 0.3400 0.0981 0.8800
0.4580 0.3600 0.0797 0.9000
0.4491 0.3800 0.0611 0.9200
0.4397 0.4000 0.0421 0.9400
0.4299 0.4200 0.0228 0.9600
0.4196 0.4400 0.0032 0.9800
0.4088 0.4600 0.0000 0.9974 Ref. 3
0.3976 0.4800
Phases in equilibrium
For the ternary system ethanol–o-xylene–water, phases, in equilibrium were measured only in Ref. 2 at temperature 298.2 K. The tie
lines cover the middle area of miscibility gap and are consistent with one another. They are considered tentative. The plait point was not
reported. All experimental data reported at 298.2 K, Ref. 2, are presented in Fig. 17.
10771077
IUP
AC
-NIS
TS
OLU
BILIT
YD
AT
AS
ER
IESJ.P
hys.C
hem.
Ref.
Data,
Vol.
28,N
o.4,
1999
This itation.aip.org/termsconditions. Downloaded to IP: 129.6.105.191 On: Fri, 05 Sep 2014 17:51:55
article is copyrighted as indicated in the article. Reuse of AIP content is subject to the terms at: http://scComponents: Evaluated by:
~1! Ethanol~ethyl alcohol!; C2H6O; @64-17-5#~2! o-Xylene ~1,2-dimethylbenzene, 1,2-xylene!; C8H10;@95-47-6#~3! Water; H2O; @7732-18-5#
A. Skrzecz~1995.04!
4.11. Ethanol 1 Water 1 o-Xylene
Critical Evaluation:
A survey of reported compositions along the saturation curve~sat.! and compositions of coexisting phases in equilibrium~eq.! for the
system ethanol–o-xylene–water is given in Table 33.
TABLE 33. Summary of experimental data for the system ethanol–o-xylene–water
Author~s! T/K Type of dataa Ref.
Bonner, 1909 273 sat.~10! 1
Nam et al., 1972 298 sat.~16!, eq. ~10! 2
aNumber of experimental points in parentheses.
Saturation curve
The ternary system ethanol–o-xylene–water forms a miscibility gap of type 1. The system was measured at temperatures 273 and
K in two references. Only one binary system,o-xylene–water, forms a miscibility gap. Binary data were compiled and critically evaluated
in a previously published SDS volume.3 The recommended values of mutual solubility of theo-xylene–water system at 298 K are:x28
50.9974 andx2950.000 029 3.3 Binary data were not reported together with the ternary system and data reported in the both referen
are far from the binary systems. Experimental errors were60.05 mass %~estimated by the evaluator! for data reported in Ref. 1 and60.1
mass %~estimated by the authors! for data reported in Ref. 2. Experimental data for phases in equilibrium, reported in Ref. 2, were a
used to construct the binodal curve. Although the composition of theo-xylene-rich phase is outside the saturation measurements and
scattered, the data appear to be consistent within one another. The data reported from both references appear consistent althou
were measured at different temperatures. The system shows increasing solubility with temperature. Data at both temperatures are
as tentative. The data at 298.2 K~Ref. 2! were described by the equation:
x150.746 1510.086 71 ln~x2!20.437 11x220.325 75x22.
The least-squares method was used. The standard error of estimate was 0.0127. The model is not valid in the region o
concentration ofo-xylene (x2.0.98). Compositions on the saturation curve calculated by the equation are presented in Table 34
selected concentrations ofo-xylene in the mixture. The results of calculations~solid line! are presented also graphically~Fig. 17! together
with all experimental data reported at 298.2 K.
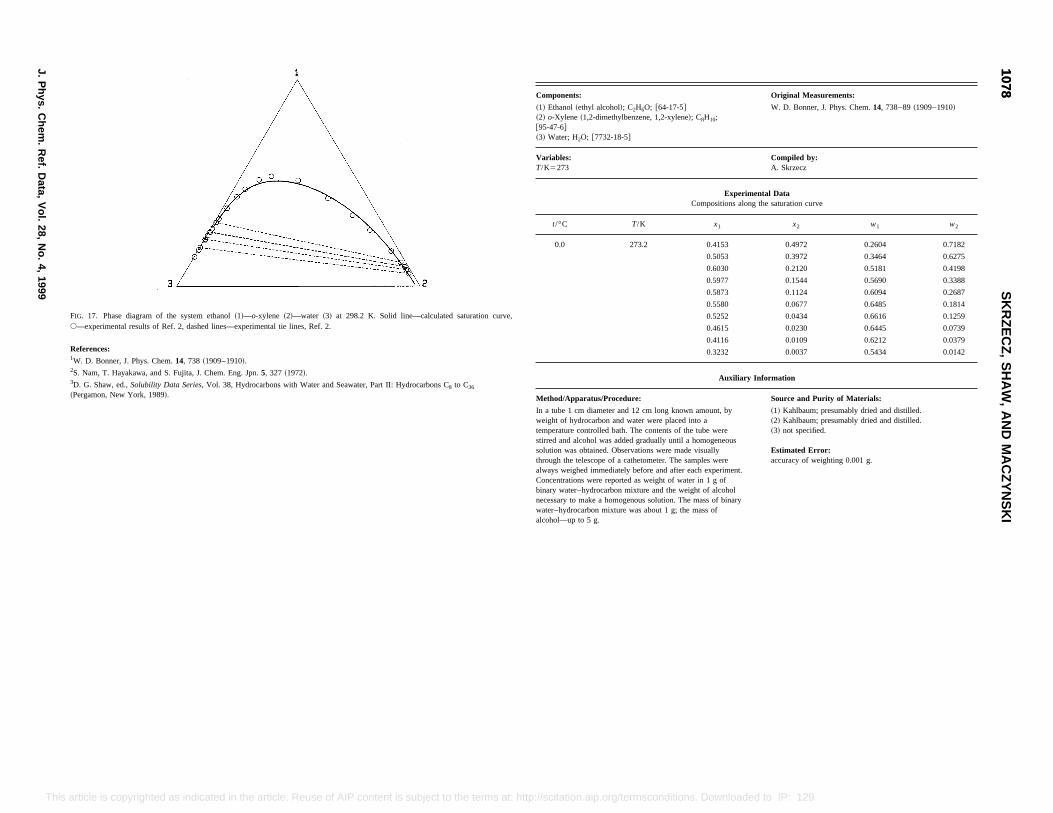
Components: Original Measurements:
~1! Ethanol~ethyl alcohol!; C2H6O; @64-17-5#~2! o-Xylene ~1,2-dimethylbenzene, 1,2-xylene!; C8H10;@95-47-6#~3! Water; H2O; @7732-18-5#
W. D. Bonner, J. Phys. Chem.14, 738–89~1909–1910!
Variables:T/K5273
Compiled by:A. Skrzecz
Experimental DataCompositions along the saturation curve
t/°C T/K x1 x2 w1 w2
0.0 273.2 0.4153 0.4972 0.2604 0.7182
0.5053 0.3972 0.3464 0.6275
0.6030 0.2120 0.5181 0.4198
0.5977 0.1544 0.5690 0.3388
0.5873 0.1124 0.6094 0.2687
0.5580 0.0677 0.6485 0.1814
0.5252 0.0434 0.6616 0.1259
0.4615 0.0230 0.6445 0.0739
0.4116 0.0109 0.6212 0.0379
0.3232 0.0037 0.5434 0.0142
Auxiliary Information
Method/Apparatus/Procedure: Source and Purity of Materials:
In a tube 1 cm diameter and 12 cm long known amount, byweight of hydrocarbon and water were placed into atemperature controlled bath. The contents of the tube werestirred and alcohol was added gradually until a homogeneoussolution was obtained. Observations were made visuallythrough the telescope of a cathetometer. The samples werealways weighed immediately before and after each experiment.Concentrations were reported as weight of water in 1 g ofbinary water–hydrocarbon mixture and the weight of alcoholnecessary to make a homogenous solution. The mass of binarywater–hydrocarbon mixture was about 1 g; the mass ofalcohol—up to 5 g.
~1! Kahlbaum; presumably dried and distilled.~2! Kahlbaum; presumably dried and distilled.~3! not specified.
Estimated Error:accuracy of weighting 0.001 g.
10781078
SK
RZ
EC
Z,
SH
AW
,A
ND
MA
CZ
YN
SK
I
J.P
hys.C
hem.
Ref.
Data,
Vol.
28,N
o.4,
1999
This at: http://scitation.aip.org/termsconditions. Downloaded to IP: 129.6.105.191 On: Fri, 05 Sep 2014 17:51:55
article is copyrighted as indicated in the article. Reuse of AIP content is subject to the termsFIG. 17. Phase diagram of the system ethanol~1!—o-xylene ~2!—water ~3! at 298.2 K. Solid line—calculated saturation curve,s—experimental results of Ref. 2, dashed lines—experimental tie lines, Ref. 2.
References:1W. D. Bonner, J. Phys. Chem.14, 738 ~1909–1910!.2S. Nam, T. Hayakawa, and S. Fujita, J. Chem. Eng. Jpn.5, 327 ~1972!.3D. G. Shaw, ed.,Solubility Data Series, Vol. 38, Hydrocarbons with Water and Seawater, Part II: Hydrocarbons C8 to C36
~Pergamon, New York, 1989!.
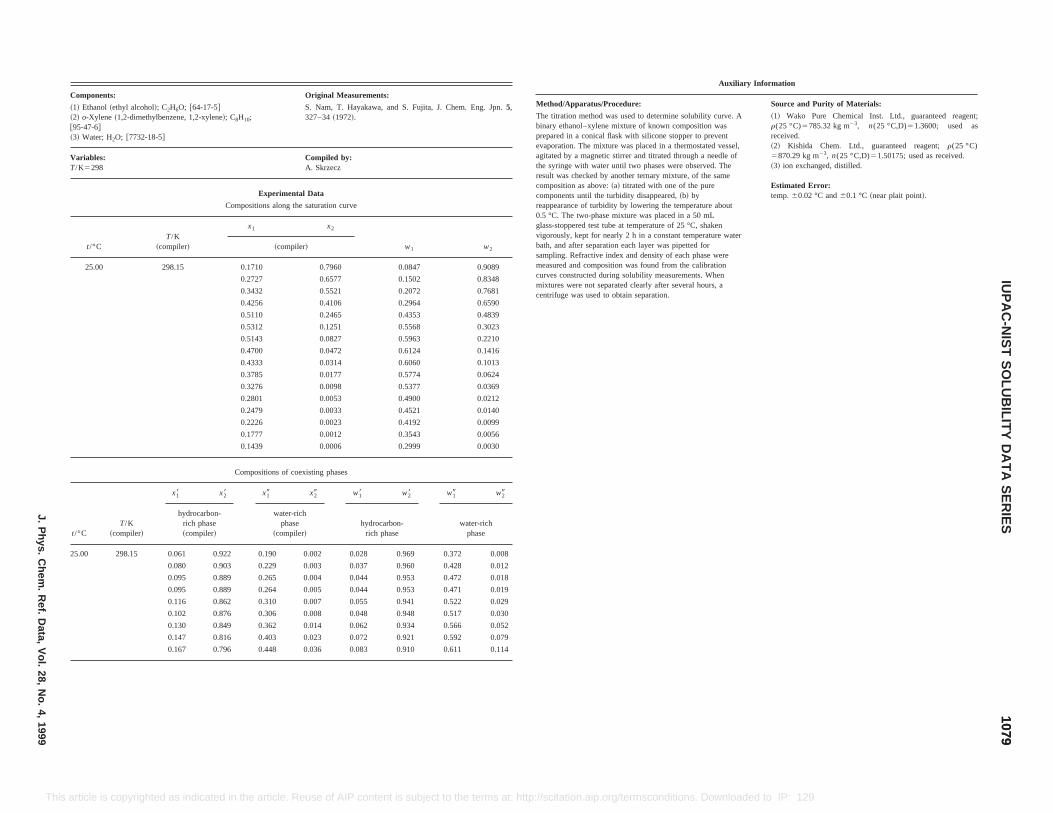
riginal Measurements:
Nam, T. Hayakawa, and S. Fujita, J. Chem. Eng. Jpn.5,7–34~1972!.
mpiled by:Skrzecz
ata
aturation curve
x2
w1 w2
0.7960 0.0847 0.9089
0.6577 0.1502 0.8348
0.5521 0.2072 0.7681
0.4106 0.2964 0.6590
0.2465 0.4353 0.4839
0.1251 0.5568 0.3023
0.0827 0.5963 0.2210
0.0472 0.6124 0.1416
0.0314 0.6060 0.1013
0.0177 0.5774 0.0624
0.0098 0.5377 0.0369
0.0053 0.4900 0.0212
0.0033 0.4521 0.0140
0.0023 0.4192 0.0099
0.0012 0.3543 0.0056
0.0006 0.2999 0.0030
sting phases
29 w18 w28 w19 w29
hydrocarbon- water-rich
Auxiliary Information
Method/Apparatus/Procedure: Source and Purity of Materials:
The titration method was used to determine solubility curve. Abinary ethanol–xylene mixture of known composition wasprepared in a conical flask with silicone stopper to preventevaporation. The mixture was placed in a thermostated vessel,agitated by a magnetic stirrer and titrated through a needle ofthe syringe with water until two phases were observed. Theresult was checked by another ternary mixture, of the samecomposition as above:~a! titrated with one of the purecomponents until the turbidity disappeared,~b! byreappearance of turbidity by lowering the temperature about0.5 °C. The two-phase mixture was placed in a 50 mLglass-stoppered test tube at temperature of 25 °C, shakenvigorously, kept for nearly 2 h in aconstant temperature waterbath, and after separation each layer was pipetted forsampling. Refractive index and density of each phase weremeasured and composition was found from the calibrationcurves constructed during solubility measurements. Whenmixtures were not separated clearly after several hours, acentrifuge was used to obtain separation.
~1! Wako Pure Chemical Inst. Ltd., guaranteed reagent;r(25 °C)5785.32 kg m23, n(25 °C,D)51.3600; used asreceived.~2! Kishida Chem. Ltd., guaranteed reagent;r(25 °C)5870.29 kg m23, n(25 °C,D)51.50175; used as received.~3! ion exchanged, distilled.
Estimated Error:temp.60.02 °C and60.1 °C ~near plait point!.
10791079
IUP
AC
-NIS
TS
OLU
BILIT
YD
AT
AS
ER
IESJ.P
hys.C
hem.
Ref.
Data,
Vol.
28,N
o.4,
1999
This ons. Downloaded to IP: 129.6.105.191 On: Fri, 05 Sep 2014 17:51:55
t/°C ~compiler! ~compiler! ~compiler! rich phase phase
25.00 298.15 0.061 0.922 0.190 0.002 0.028 0.969 0.372 0.008
0.080 0.903 0.229 0.003 0.037 0.960 0.428 0.012
0.095 0.889 0.265 0.004 0.044 0.953 0.472 0.018
0.095 0.889 0.264 0.005 0.044 0.953 0.471 0.019
0.116 0.862 0.310 0.007 0.055 0.941 0.522 0.029
0.102 0.876 0.306 0.008 0.048 0.948 0.517 0.030
0.130 0.849 0.362 0.014 0.062 0.934 0.566 0.052
0.147 0.816 0.403 0.023 0.072 0.921 0.592 0.079
0.167 0.796 0.448 0.036 0.083 0.910 0.611 0.114
article is copyrighted as indicated in the article. Reuse of AIP content is subject to the terms at: http://scitation.aip.org/termsconditi
Components: O
~1! Ethanol~ethyl alcohol!; C2H6O; @64-17-5#~2! o-Xylene ~1,2-dimethylbenzene, 1,2-xylene!; C8H10;@95-47-6#~3! Water; H2O; @7732-18-5#
S.32
Variables:T/K5298
CoA.
Experimental D
Compositions along the s
t/°CT/K
~compiler!
x1
~compiler!
25.00 298.15 0.1710
0.2727
0.3432
0.4256
0.5110
0.5312
0.5143
0.4700
0.4333
0.3785
0.3276
0.2801
0.2479
0.2226
0.1777
0.1439
Compositions of coexi
T/K
x18 x28 x19 x
hydrocarbon-rich phase
water-richphase
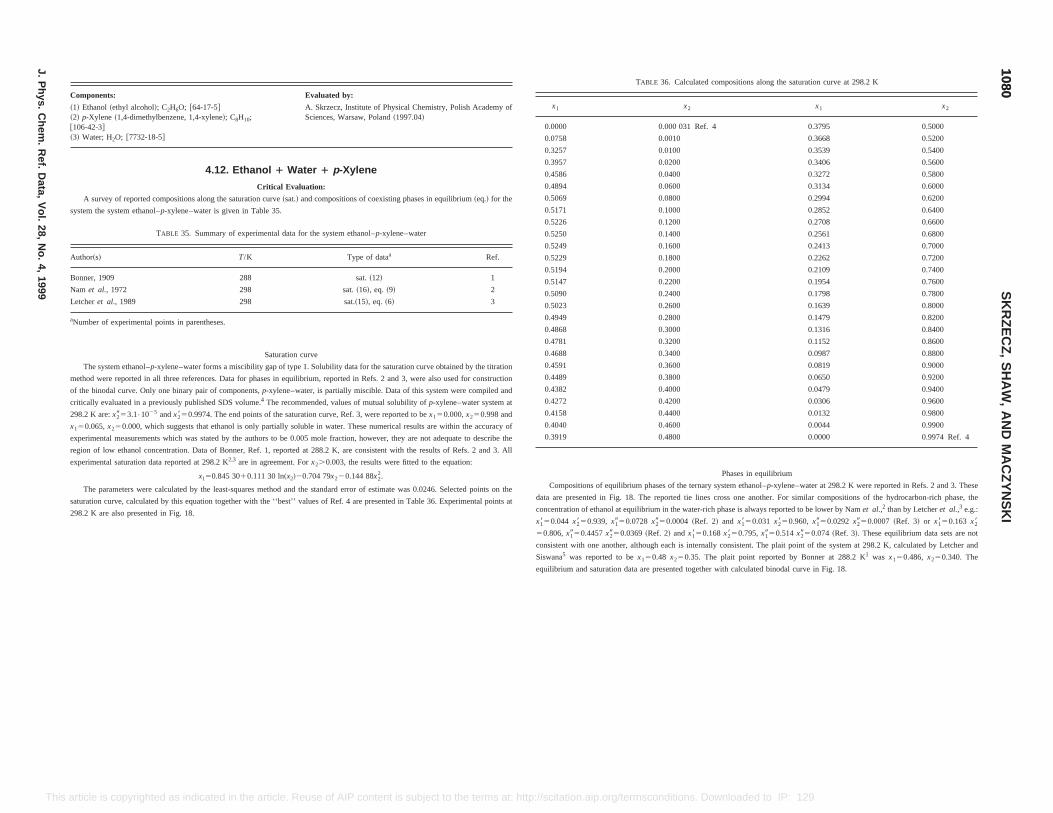
TABLE 36. Calculated compositions along the saturation curve at 298.2 K
x2 x1 x2
0.000 031 Ref. 4 0.3795 0.5000
0.0010 0.3668 0.5200
0.0100 0.3539 0.5400
0.0200 0.3406 0.5600
0.0400 0.3272 0.5800
0.0600 0.3134 0.6000
0.0800 0.2994 0.6200
0.1000 0.2852 0.6400
0.1200 0.2708 0.6600
0.1400 0.2561 0.6800
0.1600 0.2413 0.7000
0.1800 0.2262 0.7200
0.2000 0.2109 0.7400
0.2200 0.1954 0.7600
0.2400 0.1798 0.7800
0.2600 0.1639 0.8000
0.2800 0.1479 0.8200
0.3000 0.1316 0.8400
0.3200 0.1152 0.8600
0.3400 0.0987 0.8800
0.3600 0.0819 0.9000
0.3800 0.0650 0.9200
0.4000 0.0479 0.9400
0.4200 0.0306 0.9600
0.4400 0.0132 0.9800
0.4600 0.0044 0.9900
0.4800 0.0000 0.9974 Ref. 4
Phases in equilibrium
ns of equilibrium phases of the ternary system ethanol–p-xylene–water at 298.2 K were reported in Refs. 2 and 3. These
nted in Fig. 18. The reported tie lines cross one another. For similar compositions of the hydrocarbon-rich phase, the
f ethanol at equilibrium in the water-rich phase is always reported to be lower by Namet al.,2 than by Letcheret al.,3 e.g.:
.939, x1950.0728 x2950.0004 ~Ref. 2! and x1850.031 x2850.960, x1950.0292 x2950.0007 ~Ref. 3! or x1850.163 x28
50.806,x1950.4457x2950.0369~Ref. 2! andx1850.168x2850.795,x1950.514x2950.074 ~Ref. 3!. These equilibrium data sets are not
consistent with one another, although each is internally consistent. The plait point of the system at 298.2 K, calculated by Letcher and
Siswana5 was reported to bex150.48 x250.35. The plait point reported by Bonner at 288.2 K1 was x150.486, x250.340. The
equilibrium and saturation data are presented together with calculated binodal curve in Fig. 18.
10801080
SK
RZ
EC
Z,
SH
AW
,A
ND
MA
CZ
YN
SK
I
J.P
hys.C
hem.
Ref.
Data,
Vol.
28,N
o.4,
1999
This ://scitation.aip.org/termsconditions. Downloaded to IP: 129.6.105.191 On: Fri, 05 Sep 2014 17:51:55
article is copyrighted as indicated in the article. Reuse of AIP content is subject to the terms at: httpComponents: Evaluated by:
~1! Ethanol~ethyl alcohol!; C2H6O; @64-17-5#~2! p-Xylene ~1,4-dimethylbenzene, 1,4-xylene!; C8H10;@106-42-3#~3! Water; H2O; @7732-18-5#
A. Skrzecz, Institute of Physical Chemistry, Polish Academy ofSciences, Warsaw, Poland~1997.04!
4.12. Ethanol 1 Water 1 p-Xylene
Critical Evaluation:
A survey of reported compositions along the saturation curve~sat.! and compositions of coexisting phases in equilibrium~eq.! for the
system the system ethanol–p-xylene–water is given in Table 35.
TABLE 35. Summary of experimental data for the system ethanol–p-xylene–water
Author~s! T/K Type of dataa Ref.
Bonner, 1909 288 sat.~12! 1
Nam et al., 1972 298 sat.~16!, eq. ~9! 2
Letcheret al., 1989 298 sat.~15!, eq. ~6! 3
aNumber of experimental points in parentheses.
Saturation curve
The system ethanol–p-xylene–water forms a miscibility gap of type 1. Solubility data for the saturation curve obtained by the titration
method were reported in all three references. Data for phases in equilibrium, reported in Refs. 2 and 3, were also used for construction
of the binodal curve. Only one binary pair of components,p-xylene–water, is partially miscible. Data of this system were compiled and
critically evaluated in a previously published SDS volume.4 The recommended, values of mutual solubility ofp-xylene–water system at
298.2 K are:x2953.1•1025 andx2850.9974. The end points of the saturation curve, Ref. 3, were reported to bex150.000,x250.998 and
x150.065,x250.000, which suggests that ethanol is only partially soluble in water. These numerical results are within the accuracy of
experimental measurements which was stated by the authors to be 0.005 mole fraction, however, they are not adequate to describe the
region of low ethanol concentration. Data of Bonner, Ref. 1, reported at 288.2 K, are consistent with the results of Refs. 2 and 3. All
experimental saturation data reported at 298.2 K2,3 are in agreement. Forx2.0.003, the results were fitted to the equation:
x150.845 3010.111 30 ln~x2!20.704 79x220.144 88x22.
The parameters were calculated by the least-squares method and the standard error of estimate was 0.0246. Selected points on the
saturation curve, calculated by this equation together with the ‘‘best’’ values of Ref. 4 are presented in Table 36. Experimental points at
298.2 K are also presented in Fig. 18.
x1
0.0000
0.0758
0.3257
0.3957
0.4586
0.4894
0.5069
0.5171
0.5226
0.5250
0.5249
0.5229
0.5194
0.5147
0.5090
0.5023
0.4949
0.4868
0.4781
0.4688
0.4591
0.4489
0.4382
0.4272
0.4158
0.4040
0.3919
Compositio
data are prese
concentration o
x1850.044 x2850

nts: Original Measurements:
ol~ethyl alcohol!; C2H6O; @64-17-5#ne ~1,4-dimethylbenzene, 1,4-xylene!; C8H10;
; H2O; @7732-18-5#
W. D. Bonner, J. Phys. Chem.14, 738–89~1909–1910!.
: Compiled by:A. Skrzecz
Experimental DataCompositions along the saturation curve
T/K~compiler!
x1 x2 w1 w2
~compiler! ~compiler!
288.2 0.3768 0.5161 0.2343 0.7397
0.4732 0.3581 0.3468 0.6048
0.4856 0.3401 0.3631 0.5860 plait point
0.5238 0.2629 0.4318 0.4994
0.5532 0.1734 0.5220 0.3772
0.5572 0.1318 0.5671 0.3091
0.5280 0.0630 0.6337 0.1744
0.5040 0.0464 0.6407 0.1358
0.4753 0.0353 0.6354 0.1086
0.4308 0.0222 0.6190 0.0735
0.3625 0.0103 0.5741 0.0375
Auxiliary Information
pparatus/Procedure: Source and Purity of Materials:
1 cm diameter and 12 cm long known amount, byf hydrocarbon and water were placed into are controlled bath. The contents of the tube were
d alcohol was added gradually until a homogeneousas obtained. Observations were made visuallye telescope of a cathetometer. The samples were
eighed immediately before and after each experiment.ations were reported as weight of water in 1 g ofter–hydrocarbon mixture and the weight of alcohol
ecessary to make a homogenous solution. The mass of binaryater–hydrocarbon mixture was about 1 g; the mass oflcohol—up to 5 g.
~1! Kahlbaum; presumably dried and distilled.~2! Kahlbaum; presumably dried and distilled.~3! not specified.
Estimated Error:accuracy of weighing 0.0001 g.
10811081
IUP
AC
-NIS
TS
OLU
BILIT
YD
AT
AS
ER
IESJ.P
hys.C
hem.
Ref.
Data,
Vol.
28,N
o.4,
1999
This scitation.aip.org/termsconditions. Downloaded to IP: 129.6.105.191 On: Fri, 05 Sep 2014 17:51:55
nwa
article is copyrighted as indicated in the article. Reuse of AIP content is subject to the terms at: http://
FIG. 18. Phase diagram of the system ethanol~1!—p-xylene ~2!—water ~3! at 298.2 K. Solid line—calculated binodal curve,s—experimental results of Ref. 2,h—experimental results of Ref. 3, dashed lines—experimental tie lines, Refs. 2 and 3.
References:1W. D. Bonner, J. Phys. Chem.14, 738 ~1909–1910!.2S. Nam, T. Hayakawa, and S. Fujita, J. Chem. Eng. Jpn.5, 327 ~1972!.3T. M. Letcher, P. M. Siswana, P. van der Watt, and S. Radloff, J. Chem. Thermodyn.21, 1053~1989!.4D. G. Shaw, ed.,Solubility Data Series, Vol. 38, Hydrocarbons with Water and Seawater, Part II: Hydrocarbons C8 to C36
~Pergamon, New York, 1989!.5T. M. Letcher and P. M. Siswana, Fluid Phase Equilib.74, 203 ~1992!.
Compone
~1! Ethan~2! p-Xyle@106-42-3#~3! Water
VariablesT/K5273
t/°C
15.0
Method/A
In a tubeweight, otemperatustirred ansolution wthrough thalways wConcentrbinary wa
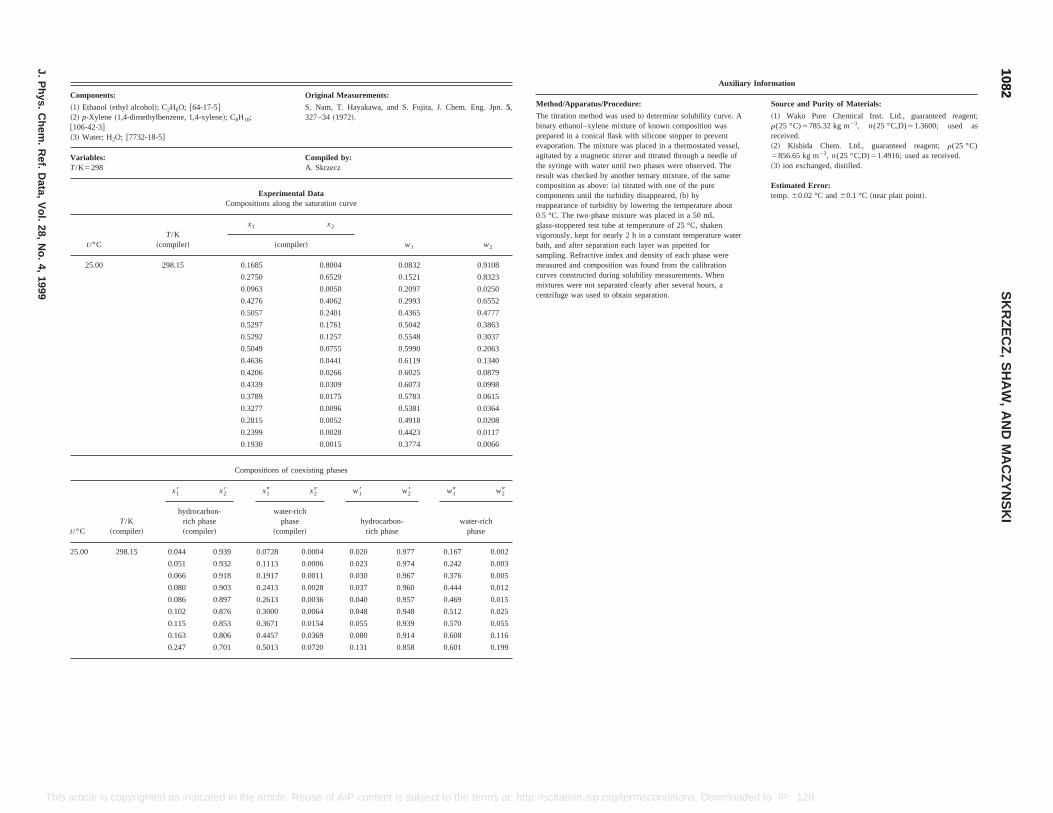
riginal Measurements:
. Nam, T. Hayakawa, and S. Fujita, J. Chem. Eng. Jpn.5,27–34~1972!.
ompiled by:. Skrzecz
atasaturation curve
x2
w1 w2
0.8004 0.0832 0.9108
0.6529 0.1521 0.8323
0.0050 0.2097 0.0250
0.4062 0.2993 0.6552
0.2401 0.4365 0.4777
0.1761 0.5042 0.3863
0.1257 0.5548 0.3037
0.0755 0.5990 0.2063
0.0441 0.6119 0.1340
0.0266 0.6025 0.0879
0.0309 0.6073 0.0998
0.0175 0.5783 0.0615
0.0096 0.5381 0.0364
0.0052 0.4918 0.0208
0.0028 0.4423 0.0117
0.0015 0.3774 0.0066
isting phases
x29 w18 w28 w19 w29
hydrocarbon- water-rich
Auxiliary Information
Method/Apparatus/Procedure: Source and Purity of Materials:
The titration method was used to determine solubility curve. Abinary ethanol–xylene mixture of known composition wasprepared in a conical flask with silicone stopper to preventevaporation. The mixture was placed in a thermostated vessel,agitated by a magnetic stirrer and titrated through a needle ofthe syringe with water until two phases were observed. Theresult was checked by another ternary mixture, of the samecomposition as above:~a! titrated with one of the purecomponents until the turbidity disappeared,~b! byreappearance of turbidity by lowering the temperature about0.5 °C. The two-phase mixture was placed in a 50 mLglass-stoppered test tube at temperature of 25 °C, shakenvigorously, kept for nearly 2 h in aconstant temperature waterbath, and after separation each layer was pipetted forsampling. Refractive index and density of each phase weremeasured and composition was found from the calibrationcurves constructed during solubility measurements. Whenmixtures were not separated clearly after several hours, acentrifuge was used to obtain separation.
~1! Wako Pure Chemical Inst. Ltd., guaranteed reagent;r(25 °C)5785.32 kg m23, n(25 °C,D)51.3600; used asreceived.~2! Kishida Chem. Ltd., guaranteed reagent;r(25 °C)5856.65 kg m23, n(25 °C,D)51.4916; used as received.~3! ion exchanged, distilled.
Estimated Error:temp.60.02 °C and60.1 °C ~near plait point!.
10821082
SK
RZ
EC
Z,
SH
AW
,A
ND
MA
CZ
YN
SK
I
J.P
hys.C
hem.
Ref.
Data,
Vol.
28,N
o.4,
1999
This a ns. Downloaded to IP: 129.6.105.191 On: Fri, 05 Sep 2014 17:51:55
t/°C ~compiler! ~compiler! ~compiler! rich phase phase
25.00 298.15 0.044 0.939 0.0728 0.0004 0.020 0.977 0.167 0.002
0.051 0.932 0.1113 0.0006 0.023 0.974 0.242 0.003
0.066 0.918 0.1917 0.0011 0.030 0.967 0.376 0.005
0.080 0.903 0.2413 0.0028 0.037 0.960 0.444 0.012
0.086 0.897 0.2613 0.0036 0.040 0.957 0.469 0.015
0.102 0.876 0.3000 0.0064 0.048 0.948 0.512 0.025
0.115 0.853 0.3671 0.0154 0.055 0.939 0.570 0.055
0.163 0.806 0.4457 0.0369 0.080 0.914 0.608 0.116
0.247 0.701 0.5013 0.0720 0.131 0.858 0.601 0.199
rticle is copyrighted as indicated in the article. Reuse of AIP content is subject to the terms at: http://scitation.aip.org/termsconditio
Components: O
~1! Ethanol~ethyl alcohol!; C2H6O; @64-17-5#~2! p-Xylene ~1,4-dimethylbenzene, 1,4-xylene!; C8H10;@106-42-3#~3! Water; H2O; @7732-18-5#
S3
Variables:T/K5298
CA
Experimental DCompositions along the
t/°CT/K
~compiler!
x1
~compiler!
25.00 298.15 0.1685
0.2750
0.0963
0.4276
0.5057
0.5297
0.5292
0.5049
0.4636
0.4206
0.4339
0.3789
0.3277
0.2815
0.2399
0.1930
Compositions of coex
T/K
x18 x28 x19
hydrocarbon-rich phase
water-richphase
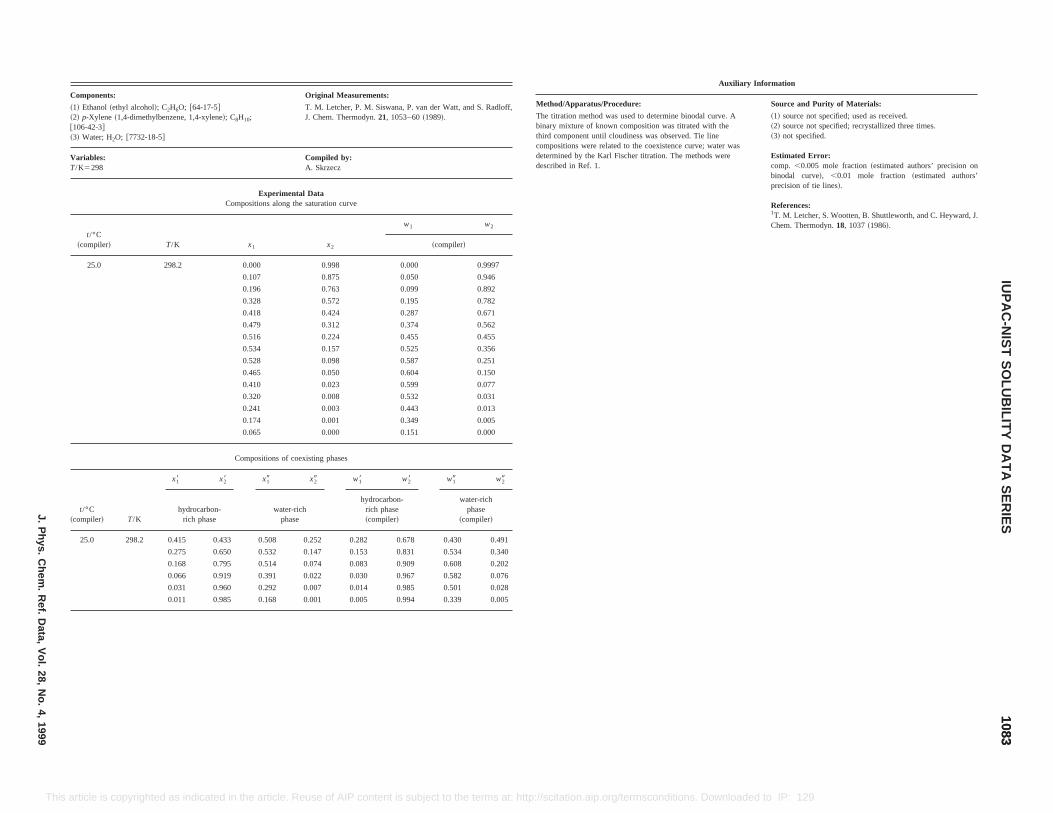
Original Measurements:
H10;T. M. Letcher, P. M. Siswana, P. van der Watt, and S. Radloff,J. Chem. Thermodyn.21, 1053–60~1989!.
Compiled by:A. Skrzecz
Experimental Datapositions along the saturation curve
x1 x2
w1 w2
~compiler!
0.000 0.998 0.000 0.9997
0.107 0.875 0.050 0.946
0.196 0.763 0.099 0.892
0.328 0.572 0.195 0.782
0.418 0.424 0.287 0.671
0.479 0.312 0.374 0.562
0.516 0.224 0.455 0.455
0.534 0.157 0.525 0.356
0.528 0.098 0.587 0.251
0.465 0.050 0.604 0.150
0.410 0.023 0.599 0.077
0.320 0.008 0.532 0.031
0.241 0.003 0.443 0.013
0.174 0.001 0.349 0.005
0.065 0.000 0.151 0.000
ompositions of coexisting phases
x19 x29 w18 w28 w19 w29
water-richphase
hydrocarbon-rich phase~compiler!
water-richphase
~compiler!
Auxiliary Information
Method/Apparatus/Procedure: Source and Purity of Materials:
The titration method was used to determine binodal curve. Abinary mixture of known composition was titrated with thethird component until cloudiness was observed. Tie linecompositions were related to the coexistence curve; water wasdetermined by the Karl Fischer titration. The methods weredescribed in Ref. 1.
~1! source not specified; used as received.~2! source not specified; recrystallized three times.~3! not specified.
Estimated Error:comp. ,0.005 mole fraction~estimated authors’ precision onbinodal curve!, ,0.01 mole fraction ~estimated authors’precision of tie lines!.
References:1T. M. Letcher, S. Wootten, B. Shuttleworth, and C. Heyward, J.Chem. Thermodyn.18, 1037~1986!.
10831083
IUP
AC
-NIS
TS
OLU
BILIT
YD
AT
AS
ER
IESJ.P
hys.C
hem.
Ref.
Data,
Vol.
28,N
o.4,
1999
This sconditions. Downloaded to IP: 129.6.105.191 On: Fri, 05 Sep 2014 17:51:55
25.0 298.2 0.415 0.433 0.508 0.252 0.282 0.678 0.430 0.491
0.275 0.650 0.532 0.147 0.153 0.831 0.534 0.340
0.168 0.795 0.514 0.074 0.083 0.909 0.608 0.202
0.066 0.919 0.391 0.022 0.030 0.967 0.582 0.076
0.031 0.960 0.292 0.007 0.014 0.985 0.501 0.028
0.011 0.985 0.168 0.001 0.005 0.994 0.339 0.005
article is copyrighted as indicated in the article. Reuse of AIP content is subject to the terms at: http://scitation.aip.org/term
Components:
~1! Ethanol~ethyl alcohol!; C2H6O; @64-17-5#~2! p-Xylene ~1,4-dimethylbenzene, 1,4-xylene!; C8
@106-42-3#~3! Water; H2O; @7732-18-5#
Variables:T/K5298
Com
t/°C~compiler! T/K
25.0 298.2
C
t/°C~compiler! T/K
x18 x28
hydrocarbon-rich phase
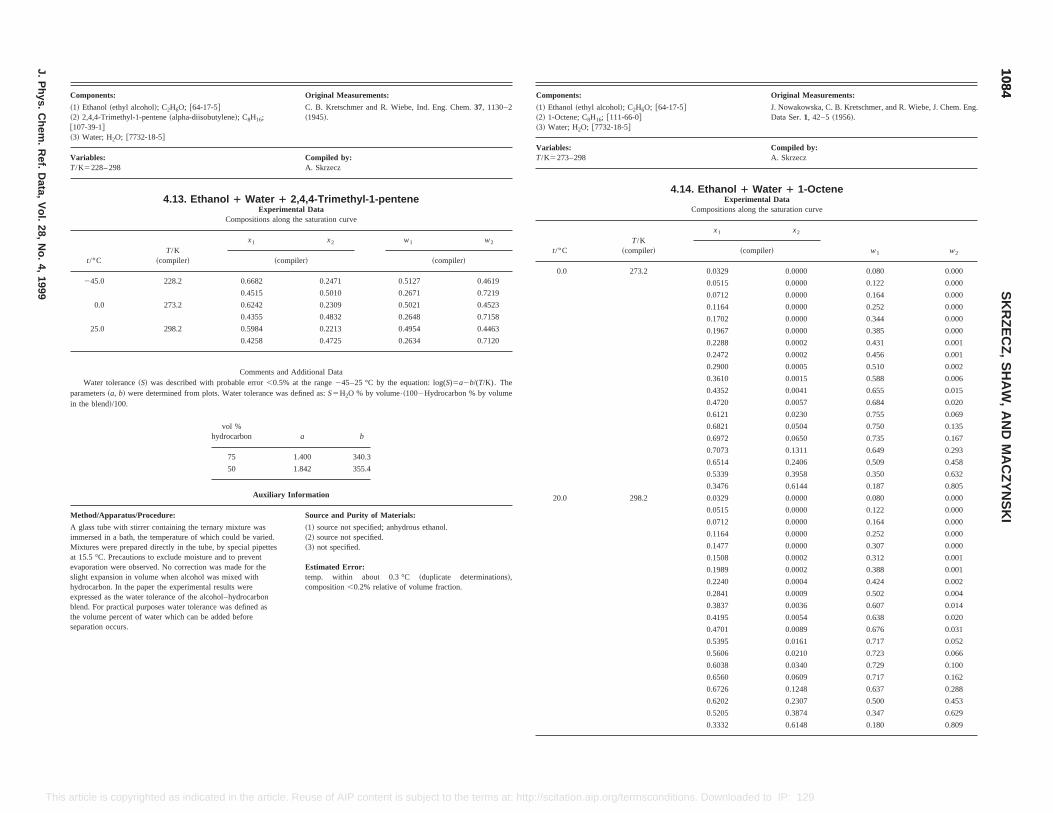
A glass tube with stirrer containing the ternary mixture was ~1! source not specified; anhydrous ethanol.
Original Measurements:
J. Nowakowska, C. B. Kretschmer, and R. Wiebe, J. Chem. Eng.Data Ser.1, 42–5~1956!.
Compiled by:A. Skrzecz
ater 1 1-Octenental Datag the saturation curve
x2
w1 w2piler!
0.0000 0.080 0.000
0.0000 0.122 0.000
0.0000 0.164 0.000
0.0000 0.252 0.000
0.0000 0.344 0.000
0.0000 0.385 0.000
0.0002 0.431 0.001
0.0002 0.456 0.001
0.0005 0.510 0.002
0.0015 0.588 0.006
0.0041 0.655 0.015
0.0057 0.684 0.020
0.0230 0.755 0.069
0.0504 0.750 0.135
0.0650 0.735 0.167
0.1311 0.649 0.293
0.2406 0.509 0.458
0.3958 0.350 0.632
0.6144 0.187 0.805
0.0000 0.080 0.000
0.0000 0.122 0.000
0.0000 0.164 0.000
0.1164 0.0000 0.252 0.000
0.1477 0.0000 0.307 0.000
0.1508 0.0002 0.312 0.001
0.1989 0.0002 0.388 0.001
0.2240 0.0004 0.424 0.002
0.2841 0.0009 0.502 0.004
0.3837 0.0036 0.607 0.014
0.4195 0.0054 0.638 0.020
0.4701 0.0089 0.676 0.031
0.5395 0.0161 0.717 0.052
0.5606 0.0210 0.723 0.066
0.6038 0.0340 0.729 0.100
0.6560 0.0609 0.717 0.162
0.6726 0.1248 0.637 0.288
0.6202 0.2307 0.500 0.453
0.5205 0.3874 0.347 0.629
0.3332 0.6148 0.180 0.809
10841084
SK
RZ
EC
Z,
SH
AW
,A
ND
MA
CZ
YN
SK
I
J.P
hys.C
hem.
Ref.
Data,
Vol.
28,N
o.4,
1999
This nditions. Downloaded to IP: 129.6.105.191 On: Fri, 05 Sep 2014 17:51:55
immersed in a bath, the temperature of which could be varied.Mixtures were prepared directly in the tube, by special pipettesat 15.5 °C. Precautions to exclude moisture and to preventevaporation were observed. No correction was made for theslight expansion in volume when alcohol was mixed withhydrocarbon. In the paper the experimental results wereexpressed as the water tolerance of the alcohol–hydrocarbonblend. For practical purposes water tolerance was defined asthe volume percent of water which can be added beforeseparation occurs.
~2! source not specified.~3! not specified.
Estimated Error:temp. within about 0.3 °C ~duplicate determinations!,composition,0.2% relative of volume fraction.
article is copyrighted as indicated in the article. Reuse of AIP content is subject to the terms at: http://scitation.aip.org/termsco
Components: Original Measurements:
~1! Ethanol~ethyl alcohol!; C2H6O; @64-17-5#~2! 2,4,4-Trimethyl-1-pentene~alpha-diisobutylene!; C8H16;@107-39-1#~3! Water; H2O; @7732-18-5#
C. B. Kretschmer and R. Wiebe, Ind. Eng. Chem.37, 1130–2~1945!.
Variables:T/K5228– 298
Compiled by:A. Skrzecz
4.13. Ethanol 1 Water 1 2,4,4-Trimethyl-1-penteneExperimental Data
Compositions along the saturation curve
t/°CT/K
~compiler!
x1 x2 w1 w2
~compiler! ~compiler!
245.0 228.2 0.6682 0.2471 0.5127 0.4619
0.4515 0.5010 0.2671 0.7219
0.0 273.2 0.6242 0.2309 0.5021 0.4523
0.4355 0.4832 0.2648 0.7158
25.0 298.2 0.5984 0.2213 0.4954 0.4463
0.4258 0.4725 0.2634 0.7120
Comments and Additional DataWater tolerance~S! was described with probable error,0.5% at the range245–25 °C by the equation: log(S)5a2b/(T/K). The
parameters~a, b! were determined from plots. Water tolerance was defined as:S5H2O % by volume•~1002Hydrocarbon % by volumein the blend!/100.
vol %hydrocarbon a b
75 1.400 340.3
50 1.842 355.4
Auxiliary Information
Method/Apparatus/Procedure: Source and Purity of Materials:
Components:
~1! Ethanol~ethyl alcohol!; C2H6O; @64-17-5#~2! 1-Octene; C8H16; @111-66-0#~3! Water; H2O; @7732-18-5#
Variables:T/K5273–298
4.14. Ethanol 1 WExperime
Compositions alon
t/°CT/K
~compiler!
x1
~com
0.0 273.2 0.0329
0.0515
0.0712
0.1164
0.1702
0.1967
0.2288
0.2472
0.2900
0.3610
0.4352
0.4720
0.6121
0.6821
0.6972
0.7073
0.6514
0.5339
0.3476
20.0 298.2 0.0329
0.0515
0.0712
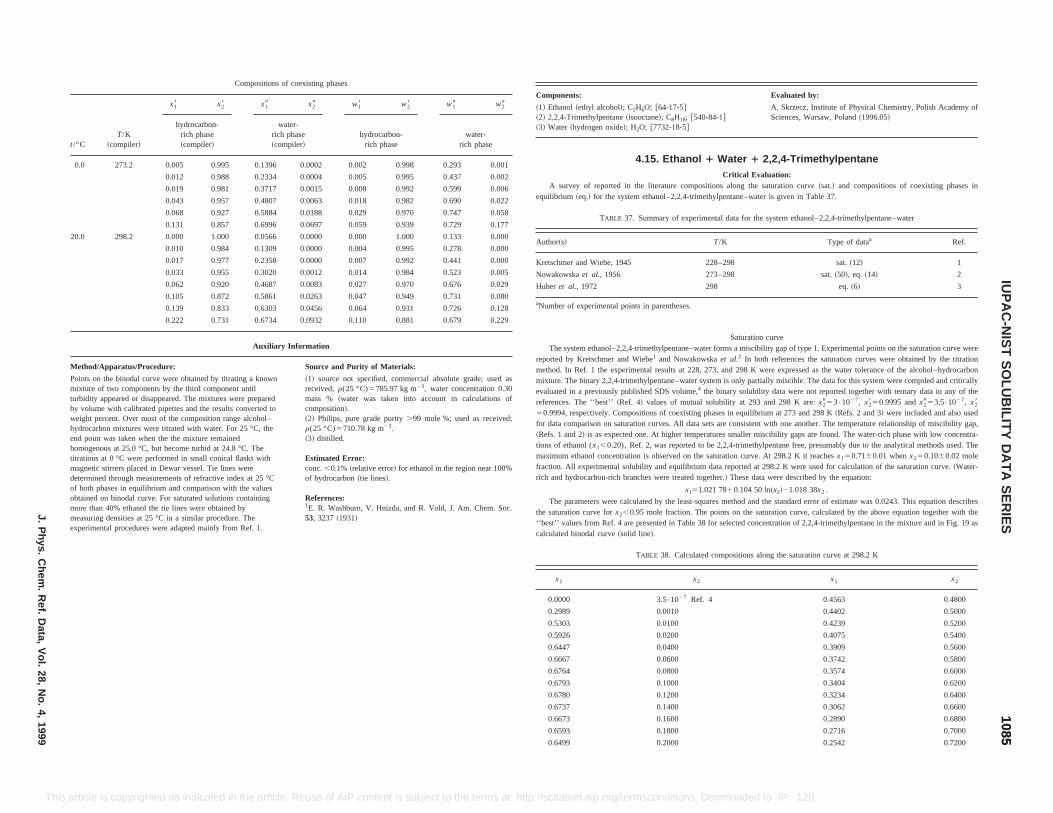
t/
2
M
Pmtubwhehtitmdoomme
Evaluated by:
A. Skrzecz, Institute of Physical Chemistry, Polish Academy ofSciences, Warsaw, Poland~1996.05!
2,2,4-Trimethylpentaneluation:the saturation curve~sat.! and compositions of coexisting phases inwater is given in Table 37.
the system ethanol–2,2,4-trimethylpentane–water
Type of dataa Ref.
sat.~12! 1
sat.~50!, eq. ~14! 2
eq.~6! 3
n curveiscibility gap of type 1. Experimental points on the saturation curve wereth references the saturation curves were obtained by the titration8 K were expressed as the water tolerance of the alcohol–hydrocarbonpartially miscible. The data for this system were compiled and critically
ility data were not reported together with ternary data in any of the3 and 298 K are:x2953•1027, x2850.9995 andx2953.5•1027, x28uilibrium at 273 and 298 K~Refs. 2 and 3! were included and also usedsistent with one another. The temperature relationship of miscibility gap,er miscibility gaps are found. The water-rich phase with low concentra-thylpentane free, presumably due to the analytical methods used. Theurve. At 298.2 K it reachesx150.7160.01 whenx250.1060.02 moleat 298.2 K were used for calculation of the saturation curve.~Water-
ta were described by the equation:
ln~x2!21.018 38x2 .
d and the standard error of estimate was 0.0243. This equation describessaturation curve, calculated by the above equation together with theconcentration of 2,2,4-trimethylpentane in the mixture and in Fig. 19 as
rve~solid line!.
TABLE 38. Calculated compositions along the saturation curve at 298.2 K
x2 x1 x2
3.5•1027 Ref. 4 0.4563 0.4800
0.0010 0.4402 0.5000
0.0100 0.4239 0.5200
0.0200 0.4075 0.5400
0.0400 0.3909 0.5600
0.0600 0.3742 0.5800
0.0800 0.3574 0.6000
0.1000 0.3404 0.6200
0.1200 0.3234 0.6400
0.1400 0.3062 0.6600
0.1600 0.2890 0.6800
0.1800 0.2716 0.7000
0.2000 0.2542 0.7200
10851085
IUP
AC
-NIS
TS
OLU
BILIT
YD
AT
AS
ER
IESJ.P
hys.C
hem.
Ref.
Data,
Vol.
28,N
o.4,
1999
This a g/termsconditions. Downloaded to IP: 129.6.105.191 On: Fri, 05 Sep 2014 17:51:55
calculated binodal cu
x1
0.0000
0.2989
0.5303
0.5926
0.6447
0.6667
0.6764
0.6793
0.6780
0.6737
0.6673
0.6593
0.6499
rticle is copyrighted as indicated in the article. Reuse of AIP content is subject to the terms at: http://scitation.aip.or
Compositions of coexisting phases
°CT/K
~compiler!
x18 x28 x19 x29 w18 w28 w19 w29
hydrocarbon-rich phase~compiler!
water-rich phase~compiler!
hydrocarbon-rich phase
water-rich phase
0.0 273.2 0.005 0.995 0.1396 0.0002 0.002 0.998 0.293 0.001
0.012 0.988 0.2334 0.0004 0.005 0.995 0.437 0.002
0.019 0.981 0.3717 0.0015 0.008 0.992 0.599 0.006
0.043 0.957 0.4807 0.0063 0.018 0.982 0.690 0.022
0.068 0.927 0.5884 0.0188 0.029 0.970 0.747 0.058
0.131 0.857 0.6996 0.0697 0.059 0.939 0.729 0.177
0.0 298.2 0.000 1.000 0.0566 0.0000 0.000 1.000 0.133 0.000
0.010 0.984 0.1309 0.0000 0.004 0.995 0.278 0.000
0.017 0.977 0.2358 0.0000 0.007 0.992 0.441 0.000
0.033 0.955 0.3020 0.0012 0.014 0.984 0.523 0.005
0.062 0.920 0.4687 0.0083 0.027 0.970 0.676 0.029
0.105 0.872 0.5861 0.0263 0.047 0.949 0.731 0.080
0.139 0.833 0.6303 0.0456 0.064 0.931 0.726 0.128
0.222 0.731 0.6734 0.0932 0.110 0.881 0.679 0.229
Auxiliary Information
ethod/Apparatus/Procedure: Source and Purity of Materials:
oints on the binodal curve were obtained by titrating a knownixture of two components by the third component untilrbidity appeared or disappeared. The mixtures were prepared
y volume with calibrated pipettes and the results converted toeight percent. Over most of the composition range alcohol–ydrocarbon mixtures were titrated with water. For 25 °C, thend point was taken when the the mixture remainedomogenous at 25.0 °C, but become turbid at 24.8 °C. Therations at 0 °C were performed in small conical flasks withagnetic stirrers placed in Dewar vessel. Tie lines wereetermined through measurements of refractive index at 25 °Cf both phases in equilibrium and comparison with the valuesbtained on binodal curve. For saturated solutions containingore than 40% ethanol the tie lines were obtained byeasuring densities at 25 °C in a similar procedure. Thexperimental procedures were adapted mainly from Ref. 1.
~1! source not specified, commercial absolute grade; used asreceived;r(25 °C)5785.97 kg m23, water concentration 0.30mass % ~water was taken into account in calculations ofcomposition!.~2! Philips, pure grade purity.99 mole %; used as received;r(25 °C)5710.78 kg m23.~3! distilled.
Estimated Error:conc.,0.1%~relative error! for ethanol in the region near 100%of hydrocarbon~tie lines!.
References:1E. R. Washburn, V. Hnizda, and R. Vold, J. Am. Chem. Soc.53, 3237~1931!
Components:
~1! Ethanol~ethyl alcohol!; C2H6O; @64-17-5#~2! 2,2,4-Trimethylpentane~isooctane!; C8H18; @540-84-1#~3! Water ~hydrogen oxide!; H2O; @7732-18-5#
4.15. Ethanol 1 Water 1
Critical EvaA survey of reported in the literature compositions along
equilibrium ~eq.! for the system ethanol–2,2,4-trimethylpentane–
TABLE 37. Summary of experimental data for
Author~s! T/K
Kretschmer and Wiebe, 1945 228–298
Nowakowskaet al., 1956 273–298
Huberet al., 1972 298
aNumber of experimental points in parentheses.
SaturatioThe system ethanol–2,2,4-trimethylpentane–water forms a m
reported by Kretschmer and Wiebe1 and Nowakowskaet al.2 In bomethod. In Ref. 1 the experimental results at 228, 273, and 29mixture. The binary 2,2,4-trimethylpentane–water system is onlyevaluated in a previously published SDS volume,4 the binary solubreferences. The ‘‘best’’~Ref. 4! values of mutual solubility at 2950.9994, respectively. Compositions of coexisting phases in eqfor data comparison on saturation curves. All data sets are con~Refs. 1 and 2! is as expected one. At higher temperatures smalltions of ethanol (x1,0.20), Ref. 2, was reported to be 2,2,4-trimemaximum ethanol concentration is observed on the saturation cfraction. All experimental solubility and equilibrium data reportedrich and hydrocarbon-rich branches were treated together.! These da
x151.021 7810.104 50
The parameters were calculated by the least-squares methothe saturation curve forx2,0.95 mole fraction. The points on the‘‘best’’ values from Ref. 4 are presented in Table 38 for selected
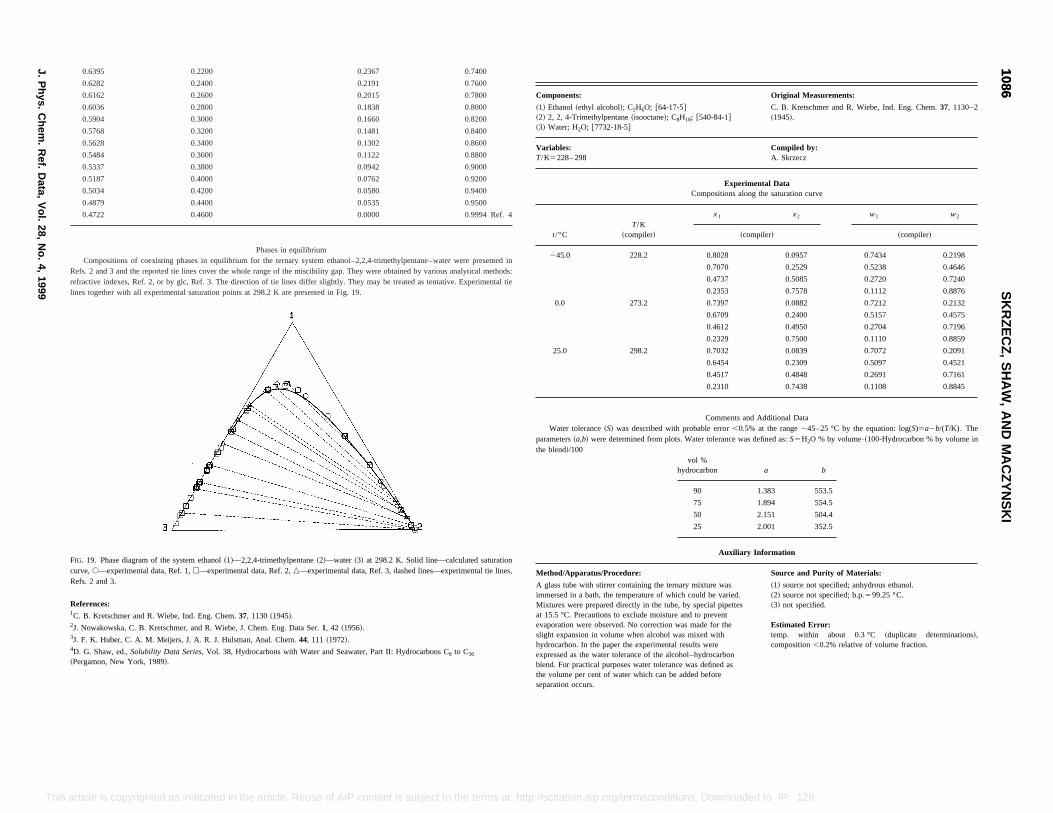
Original Measurements:
40-84-1#C. B. Kretschmer and R. Wiebe, Ind. Eng. Chem.37, 1130–2~1945!.
Compiled by:A. Skrzecz
Experimental Datampositions along the saturation curve
x1 x2 w1 w2
~compiler! ~compiler!
0.8028 0.0957 0.7434 0.2198
0.7070 0.2529 0.5238 0.4646
0.4737 0.5085 0.2720 0.7240
0.2353 0.7578 0.1112 0.8876
0.7397 0.0882 0.7212 0.2132
0.6709 0.2400 0.5157 0.4575
0.4612 0.4950 0.2704 0.7196
0.2329 0.7500 0.1110 0.8859
0.7032 0.0839 0.7072 0.2091
0.6454 0.2309 0.5097 0.4521
0.4517 0.4848 0.2691 0.7161
0.2310 0.7438 0.1108 0.8845
Comments and Additional Dataable error,0.5% at the range245–25 °C by the equation: log(S)5a2b/(T/K). Theter tolerance was defined as:S5H2O % by volume•~100-Hydrocarbon % by volume in
arbon a b
1.383 553.5
1.894 554.5
2.151 504.4
2.001 352.5
Auxiliary Information
Source and Purity of Materials:
ry mixture wasch could be varied.by special pipettesand to preventas made for thes mixed withresults were
ohol–hydrocarbone was defined asadded before
~1! source not specified; anhydrous ethanol.~2! source not specified; b.p.599.25 °C.~3! not specified.
Estimated Error:temp. within about 0.3 °C ~duplicate determinations!,composition,0.2% relative of volume fraction.
10861086
SK
RZ
EC
Z,
SH
AW
,A
ND
MA
CZ
YN
SK
I
J.P
hys.C
hem.
Ref.
Data,
Vol.
28,N
o.4,
1999
T . Downloaded to IP: 129.6.105.191 On: Fri, 05 Sep 2014 17:51:55
FIG. 19. Phase diagram of the system ethanol~1!—2,2,4-trimethylpentane~2!—water ~3! at 298.2 K. Solid line—calculated saturationcurve,s—experimental data, Ref. 1,h—experimental data, Ref. 2,n—experimental data, Ref. 3, dashed lines—experimental tie lines,Refs. 2 and 3.
References:1C. B. Kretschmer and R. Wiebe, Ind. Eng. Chem.37, 1130~1945!.2J. Nowakowska, C. B. Kretschmer, and R. Wiebe, J. Chem. Eng. Data Ser.1, 42 ~1956!.3J. F. K. Huber, C. A. M. Meijers, J. A. R. J. Hulsman, Anal. Chem.44, 111 ~1972!.4D. G. Shaw, ed.,Solubility Data Series, Vol. 38, Hydrocarbons with Water and Seawater, Part II: Hydrocarbons C8 to C36
~Pergamon, New York, 1989!.
Method/Apparatus/Procedure:
A glass tube with stirrer containing the ternaimmersed in a bath, the temperature of whiMixtures were prepared directly in the tube,at 15.5 °C. Precautions to exclude moistureevaporation were observed. No correction wslight expansion in volume when alcohol wahydrocarbon. In the paper the experimentalexpressed as the water tolerance of the alcblend. For practical purposes water tolerancthe volume per cent of water which can beseparation occurs.
his article is copyrighted as indicated in the article. Reuse of AIP content is subject to the terms at: http://scitation.aip.org/termsconditions
0.6395 0.2200 0.2367 0.7400
0.6282 0.2400 0.2191 0.7600
0.6162 0.2600 0.2015 0.7800
0.6036 0.2800 0.1838 0.8000
0.5904 0.3000 0.1660 0.8200
0.5768 0.3200 0.1481 0.8400
0.5628 0.3400 0.1302 0.8600
0.5484 0.3600 0.1122 0.8800
0.5337 0.3800 0.0942 0.9000
0.5187 0.4000 0.0762 0.9200
0.5034 0.4200 0.0580 0.9400
0.4879 0.4400 0.0535 0.9500
0.4722 0.4600 0.0000 0.9994 Ref. 4
Phases in equilibriumCompositions of coexisting phases in equilibrium for the ternary system ethanol–2,2,4-trimethylpentane–water were presented in
Refs. 2 and 3 and the reported tie lines cover the whole range of the miscibility gap. They were obtained by various analytical methods:refractive indexes, Ref. 2, or by glc, Ref. 3. The direction of tie lines differ slightly. They may be treated as tentative. Experimental tielines together with all experimental saturation points at 298.2 K are presented in Fig. 19.
Components:
~1! Ethanol~ethyl alcohol!; C2H6O; @64-17-5#~2! 2, 2, 4-Trimethylpentane~isooctane!; C8H18; @5~3! Water; H2O; @7732-18-5#
Variables:T/K5228– 298
Co
t/°CT/K
~compiler!
245.0 228.2
0.0 273.2
25.0 298.2
Water tolerance~S! was described with probparameters~a,b! were determined from plots. Wathe blend!/100
vol %hydroc
90
75
50
25
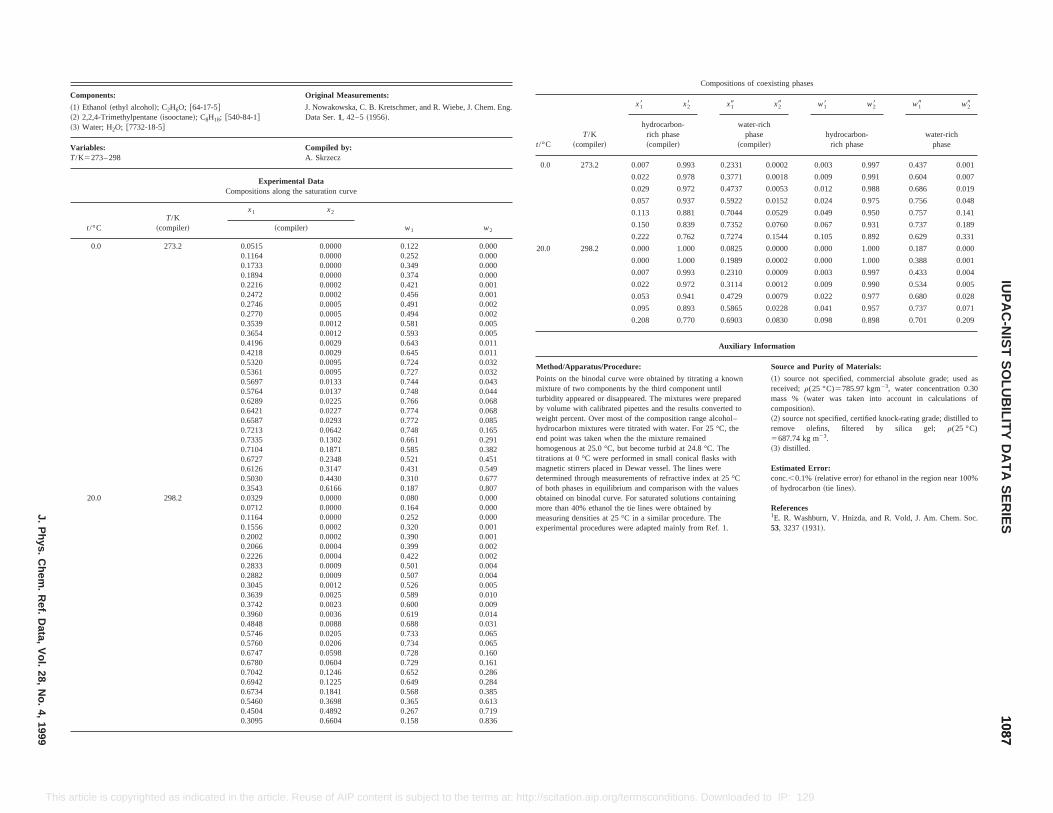
0.1556 0.0002 0.320 0.001
Compositions of coexisting phases
CT/K
~compiler!
x18 x28 x19 x29 w18 w28 w19 w29
hydrocarbon-rich phase~compiler!
water-richphase
~compiler!hydrocarbon-
rich phasewater-rich
phase
0 273.2 0.007 0.993 0.2331 0.0002 0.003 0.997 0.437 0.001
0.022 0.978 0.3771 0.0018 0.009 0.991 0.604 0.007
0.029 0.972 0.4737 0.0053 0.012 0.988 0.686 0.019
0.057 0.937 0.5922 0.0152 0.024 0.975 0.756 0.048
0.113 0.881 0.7044 0.0529 0.049 0.950 0.757 0.141
0.150 0.839 0.7352 0.0760 0.067 0.931 0.737 0.189
0.222 0.762 0.7274 0.1544 0.105 0.892 0.629 0.331
0 298.2 0.000 1.000 0.0825 0.0000 0.000 1.000 0.187 0.000
0.000 1.000 0.1989 0.0002 0.000 1.000 0.388 0.001
0.007 0.993 0.2310 0.0009 0.003 0.997 0.433 0.004
0.022 0.972 0.3114 0.0012 0.009 0.990 0.534 0.005
0.053 0.941 0.4729 0.0079 0.022 0.977 0.680 0.028
0.095 0.893 0.5865 0.0228 0.041 0.957 0.737 0.071
0.208 0.770 0.6903 0.0830 0.098 0.898 0.701 0.209
Auxiliary Information
thod/Apparatus/Procedure: Source and Purity of Materials:
ints on the binodal curve were obtained by titrating a knownture of two components by the third component untilidity appeared or disappeared. The mixtures were prepared
volume with calibrated pipettes and the results converted toight percent. Over most of the composition range alcohol–rocarbon mixtures were titrated with water. For 25 °C, thepoint was taken when the the mixture remainedogenous at 25.0 °C, but become turbid at 24.8 °C. The
tions at 0 °C were performed in small conical flasks withgnetic stirrers placed in Dewar vessel. The lines wereermined through measurements of refractive index at 25 °Coth phases in equilibrium and comparison with the values
ained on binodal curve. For saturated solutions containingre than 40% ethanol the tie lines were obtained byasuring densities at 25 °C in a similar procedure. The
experimental procedures were adapted mainly from Ref. 1.
~1! source not specified, commercial absolute grade; used asreceived;r(25 °C)5785.97 kgm23, water concentration 0.30mass % ~water was taken into account in calculations ofcomposition!.~2! source not specified, certified knock-rating grade; distilled toremove olefins, filtered by silica gel; r(25 °C)5687.74 kg m23.~3! distilled.
Estimated Error:conc.,0.1% ~relative error! for ethanol in the region near 100%of hydrocarbon~tie lines!.
References1E. R. Washburn, V. Hnizda, and R. Vold, J. Am. Chem. Soc.53, 3237~1931!.
10871087
IUP
AC
-NIS
TS
OLU
BILIT
YD
AT
AS
ER
IESJ.P
hys.C
hem.
Ref.
Data,
Vol.
28,N
o.4,
1999
This d to IP: 129.6.105.191 On: Fri, 05 Sep 2014 17:51:55
0.2002 0.0002 0.390 0.0010.2066 0.0004 0.399 0.0020.2226 0.0004 0.422 0.0020.2833 0.0009 0.501 0.0040.2882 0.0009 0.507 0.0040.3045 0.0012 0.526 0.0050.3639 0.0025 0.589 0.0100.3742 0.0023 0.600 0.0090.3960 0.0036 0.619 0.0140.4848 0.0088 0.688 0.0310.5746 0.0205 0.733 0.0650.5760 0.0206 0.734 0.0650.6747 0.0598 0.728 0.1600.6780 0.0604 0.729 0.1610.7042 0.1246 0.652 0.2860.6942 0.1225 0.649 0.2840.6734 0.1841 0.568 0.3850.5460 0.3698 0.365 0.6130.4504 0.4892 0.267 0.7190.3095 0.6604 0.158 0.836
article is copyrighted as indicated in the article. Reuse of AIP content is subject to the terms at: http://scitation.aip.org/termsconditions. Downloade
Components: Original Measurements:
~1! Ethanol~ethyl alcohol!; C2H6O; @64-17-5#~2! 2,2,4-Trimethylpentane~isooctane!; C8H18; @540-84-1#~3! Water; H2O; @7732-18-5#
J. Nowakowska, C. B. Kretschmer, and R. Wiebe, J. Chem. Eng.Data Ser.1, 42–5~1956!.
Variables:T/K5273– 298
Compiled by:A. Skrzecz
Experimental DataCompositions along the saturation curve
t/°CT/K
~compiler!
x1 x2
w1 w2~compiler!
0.0 273.2 0.0515 0.0000 0.122 0.0000.1164 0.0000 0.252 0.0000.1733 0.0000 0.349 0.0000.1894 0.0000 0.374 0.0000.2216 0.0002 0.421 0.0010.2472 0.0002 0.456 0.0010.2746 0.0005 0.491 0.0020.2770 0.0005 0.494 0.0020.3539 0.0012 0.581 0.0050.3654 0.0012 0.593 0.0050.4196 0.0029 0.643 0.0110.4218 0.0029 0.645 0.0110.5320 0.0095 0.724 0.0320.5361 0.0095 0.727 0.0320.5697 0.0133 0.744 0.0430.5764 0.0137 0.748 0.0440.6289 0.0225 0.766 0.0680.6421 0.0227 0.774 0.0680.6587 0.0293 0.772 0.0850.7213 0.0642 0.748 0.1650.7335 0.1302 0.661 0.2910.7104 0.1871 0.585 0.3820.6727 0.2348 0.521 0.4510.6126 0.3147 0.431 0.5490.5030 0.4430 0.310 0.6770.3543 0.6166 0.187 0.807
20.0 298.2 0.0329 0.0000 0.080 0.0000.0712 0.0000 0.164 0.0000.1164 0.0000 0.252 0.000
t/°
0.
20.
Me
Pomixturbbywehydendhomtitramadetof bobtmome
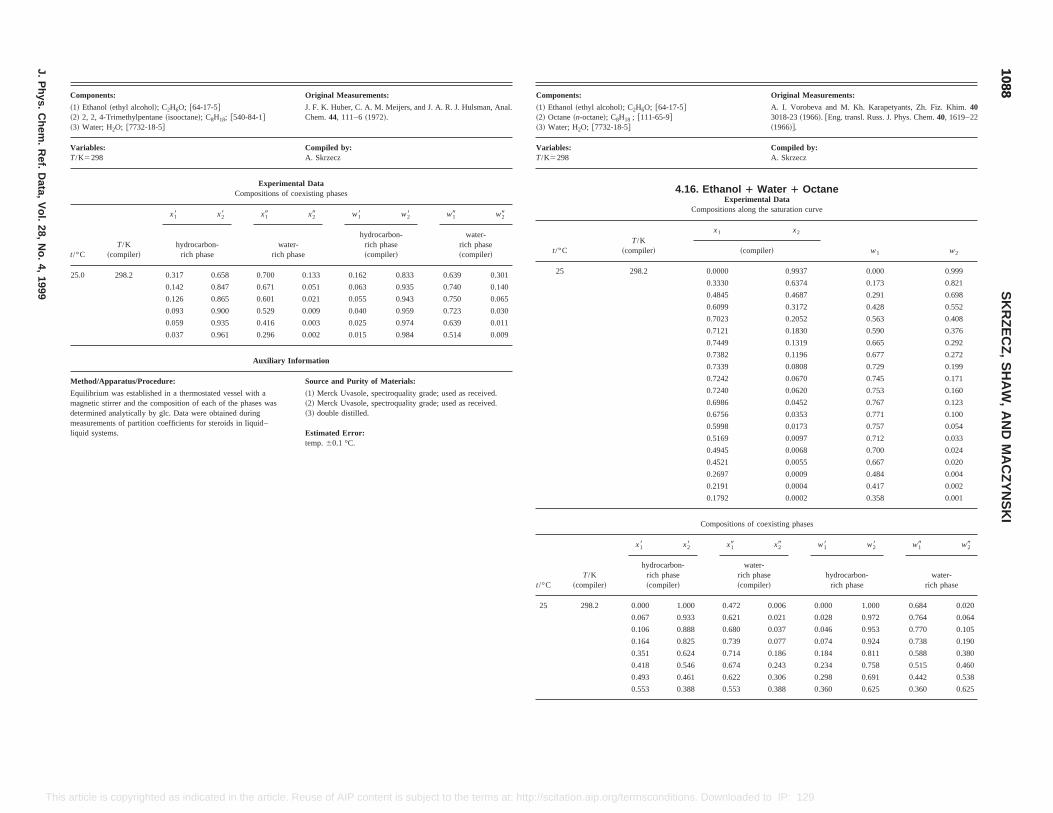
Original Measurements:
A. I. Vorobeva and M. Kh. Karapetyants, Zh. Fiz. Khim.403018-23~1966!. @Eng. transl. Russ. J. Phys. Chem.40, 1619–22~1966!#.
Compiled by:A. Skrzecz
anol 1 Water 1 OctaneExperimental Data
sitions along the saturation curve
1 x2
w1 w2~compiler!
0000 0.9937 0.000 0.999
330 0.6374 0.173 0.821
845 0.4687 0.291 0.698
099 0.3172 0.428 0.552
023 0.2052 0.563 0.408
121 0.1830 0.590 0.376
449 0.1319 0.665 0.292
382 0.1196 0.677 0.272
339 0.0808 0.729 0.199
242 0.0670 0.745 0.171
240 0.0620 0.753 0.160
986 0.0452 0.767 0.123
756 0.0353 0.771 0.100
998 0.0173 0.757 0.054
169 0.0097 0.712 0.033
945 0.0068 0.700 0.024
521 0.0055 0.667 0.020
697 0.0009 0.484 0.004
191 0.0004 0.417 0.002
792 0.0002 0.358 0.001
positions of coexisting phases
t/°CT/K
~compiler!
x18 x28 x19 x29 w18 w28 w19 w29
hydrocarbon-rich phase~compiler!
water-rich phase~compiler!
hydrocarbon-rich phase
water-rich phase
25 298.2 0.000 1.000 0.472 0.006 0.000 1.000 0.684 0.020
0.067 0.933 0.621 0.021 0.028 0.972 0.764 0.064
0.106 0.888 0.680 0.037 0.046 0.953 0.770 0.105
0.164 0.825 0.739 0.077 0.074 0.924 0.738 0.190
0.351 0.624 0.714 0.186 0.184 0.811 0.588 0.380
0.418 0.546 0.674 0.243 0.234 0.758 0.515 0.460
0.493 0.461 0.622 0.306 0.298 0.691 0.442 0.538
0.553 0.388 0.553 0.388 0.360 0.625 0.360 0.625
10881088
SK
RZ
EC
Z,
SH
AW
,A
ND
MA
CZ
YN
SK
I
J.P
hys.C
hem.
Ref.
Data,
Vol.
28,N
o.4,
1999
This s at: http://scitation.aip.org/termsconditions. Downloaded to IP: 129.6.105.191 On: Fri, 05 Sep 2014 17:51:55
article is copyrighted as indicated in the article. Reuse of AIP content is subject to the termComponents: Original Measurements:
~1! Ethanol~ethyl alcohol!; C2H6O; @64-17-5#~2! 2, 2, 4-Trimethylpentane~isooctane!; C8H18; @540-84-1#~3! Water; H2O; @7732-18-5#
J. F. K. Huber, C. A. M. Meijers, and J. A. R. J. Hulsman, Anal.Chem.44, 111–6~1972!.
Variables:T/K5298
Compiled by:A. Skrzecz
Experimental DataCompositions of coexisting phases
t/°CT/K
~compiler!
x18 x28 x19 x29 w18 w28 w19 w29
hydrocarbon-rich phase
water-rich phase
hydrocarbon-rich phase~compiler!
water-rich phase~compiler!
25.0 298.2 0.317 0.658 0.700 0.133 0.162 0.833 0.639 0.301
0.142 0.847 0.671 0.051 0.063 0.935 0.740 0.140
0.126 0.865 0.601 0.021 0.055 0.943 0.750 0.065
0.093 0.900 0.529 0.009 0.040 0.959 0.723 0.030
0.059 0.935 0.416 0.003 0.025 0.974 0.639 0.011
0.037 0.961 0.296 0.002 0.015 0.984 0.514 0.009
Auxiliary Information
Method/Apparatus/Procedure: Source and Purity of Materials:
Equilibrium was established in a thermostated vessel with amagnetic stirrer and the composition of each of the phases wasdetermined analytically by glc. Data were obtained duringmeasurements of partition coefficients for steroids in liquid–liquid systems.
~1! Merck Uvasole, spectroquality grade; used as received.~2! Merck Uvasole, spectroquality grade; used as received.~3! double distilled.
Estimated Error:temp.60.1 °C.
Components:
~1! Ethanol~ethyl alcohol!; C2H6O; @64-17-5#~2! Octane~n-octane!; C8H18 ; @111-65-9#~3! Water; H2O; @7732-18-5#
Variables:T/K5298
4.16. Eth
Compo
t/°CT/K
~compiler!
x
25 298.2 0.
0.3
0.4
0.6
0.7
0.7
0.7
0.7
0.7
0.7
0.7
0.6
0.6
0.5
0.5
0.4
0.4
0.2
0.2
0.1
Com
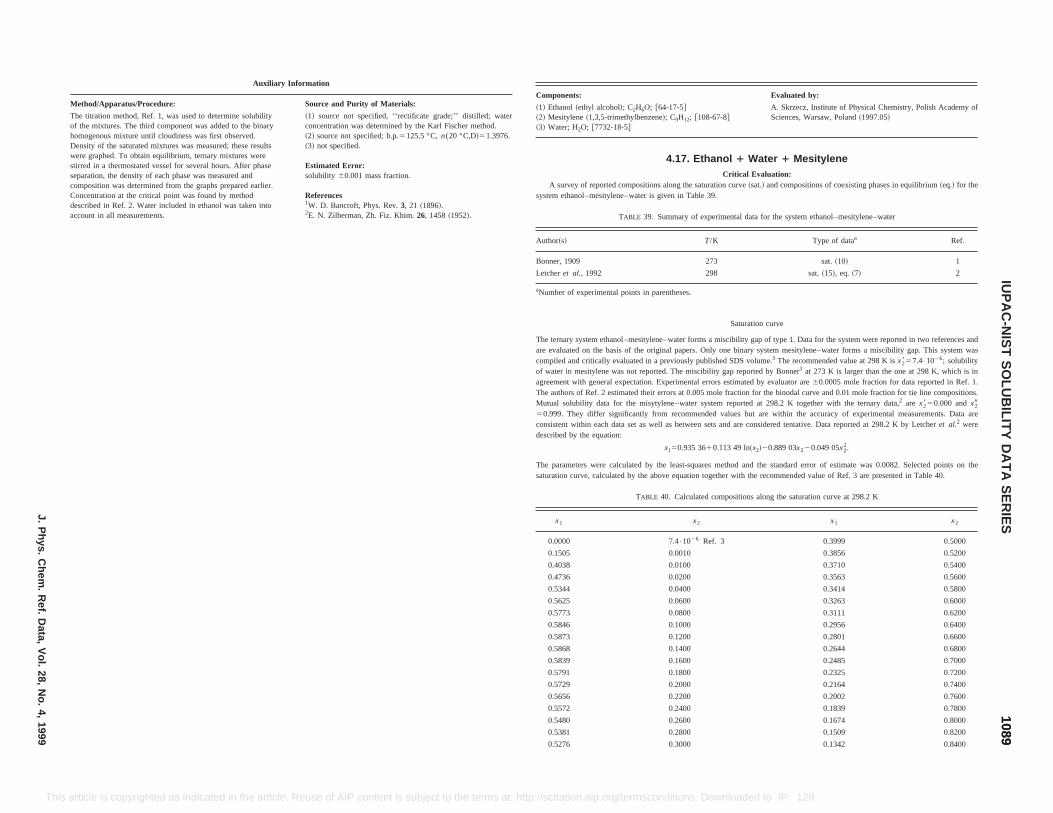
Evaluated by:
A. Skrzecz, Institute of Physical Chemistry, Polish Academy ofSciences, Warsaw, Poland~1997.05!
ter 1 Mesityleneluation:and compositions of coexisting phases in equilibrium~eq.! for the
a for the system ethanol–mesitylene–water
Type of dataa Ref.
sat.~10! 1
sat.~15!, eq. ~7! 2
n curve
y gap of type 1. Data for the system were reported in two references andary system mesitylene–water forms a miscibility gap. This system wasvolume.3 The recommended value at 298 K isx2857.4•1026; solubilityorted by Bonner1 at 273 K is larger than the one at 298 K, which is inted by evaluator are60.0005 mole fraction for data reported in Ref. 1.n for the binodal curve and 0.01 mole fraction for tie line compositions.d at 298.2 K together with the ternary data,2 are x2850.000 andx29ut are within the accuracy of experimental measurements. Data aree considered tentative. Data reported at 298.2 K by Letcheret al.2 were
0.889 03x220.049 05x22.
and the standard error of estimate was 0.0082. Selected points on thethe recommended value of Ref. 3 are presented in Table 40.
along the saturation curve at 298.2 K
x1 x2
0.0000 7.4•1026 Ref. 3 0.3999 0.5000
0.1505 0.0010 0.3856 0.5200
0.4038 0.0100 0.3710 0.5400
0.4736 0.0200 0.3563 0.5600
0.5344 0.0400 0.3414 0.5800
0.5625 0.0600 0.3263 0.6000
0.5773 0.0800 0.3111 0.6200
0.5846 0.1000 0.2956 0.6400
0.5873 0.1200 0.2801 0.6600
0.5868 0.1400 0.2644 0.6800
0.5839 0.1600 0.2485 0.7000
0.5791 0.1800 0.2325 0.7200
0.5729 0.2000 0.2164 0.7400
0.5656 0.2200 0.2002 0.7600
0.5572 0.2400 0.1839 0.7800
0.5480 0.2600 0.1674 0.8000
0.5381 0.2800 0.1509 0.8200
0.5276 0.3000 0.1342 0.8400
10891089
IUP
AC
-NIS
TS
OLU
BILIT
YD
AT
AS
ER
IESJ.P
hys.C
hem.
Ref.
Data,
Vol.
28,N
o.4,
1999
This . Reuse of AIP content is subject to the terms at: http://scitation.aip.org/termsconditions. Downloaded to IP: 129.6.105.191 On: Fri, 05 Sep 2014 17:51:55
article is copyrighted as indicated in the articleAuxiliary Information
Method/Apparatus/Procedure: Source and Purity of Materials:
The titration method, Ref. 1, was used to determine solubilityof the mixtures. The third component was added to the binaryhomogenous mixture until cloudiness was first observed.Density of the saturated mixtures was measured; these resultswere graphed. To obtain equilibrium, ternary mixtures werestirred in a thermostated vessel for several hours. After phaseseparation, the density of each phase was measured andcomposition was determined from the graphs prepared earlier.Concentration at the critical point was found by methoddescribed in Ref. 2. Water included in ethanol was taken intoaccount in all measurements.
~1! source not specified, ‘‘rectificate grade;’’ distilled; waterconcentration was determined by the Karl Fischer method.~2! source not specified; b.p.5125.5 °C,n(20 °C,D!51.3976.~3! not specified.
Estimated Error:solubility 60.001 mass fraction.
References1W. D. Bancroft, Phys. Rev.3, 21 ~1896!.2E. N. Zilberman, Zh. Fiz. Khim.26, 1458~1952!.
Components:
~1! Ethanol~ethyl alcohol!; C2H6O; @64-17-5#~2! Mesitylene~1,3,5-trimethylbenzene!; C9H12; @108-67-8#~3! Water; H2O; @7732-18-5#
4.17. Ethanol 1 WaCritical Eva
A survey of reported compositions along the saturation curve~sat.!system ethanol–mesitylene–water is given in Table 39.
TABLE 39. Summary of experimental dat
Author~s! T/K
Bonner, 1909 273
Letcheret al., 1992 298
aNumber of experimental points in parentheses.
Saturatio
The ternary system ethanol–mesitylene–water forms a miscibilitare evaluated on the basis of the original papers. Only one bincompiled and critically evaluated in a previously published SDSof water in mesitylene was not reported. The miscibility gap repagreement with general expectation. Experimental errors estimaThe authors of Ref. 2 estimated their errors at 0.005 mole fractioMutual solubility data for the misytylene–water system reporte50.999. They differ significantly from recommended values bconsistent within each data set as well as between sets and ardescribed by the equation:
x150.935 3610.113 49 ln~x2!2
The parameters were calculated by the least-squares methodsaturation curve, calculated by the above equation together with
TABLE 40. Calculated compositions
x1 x2
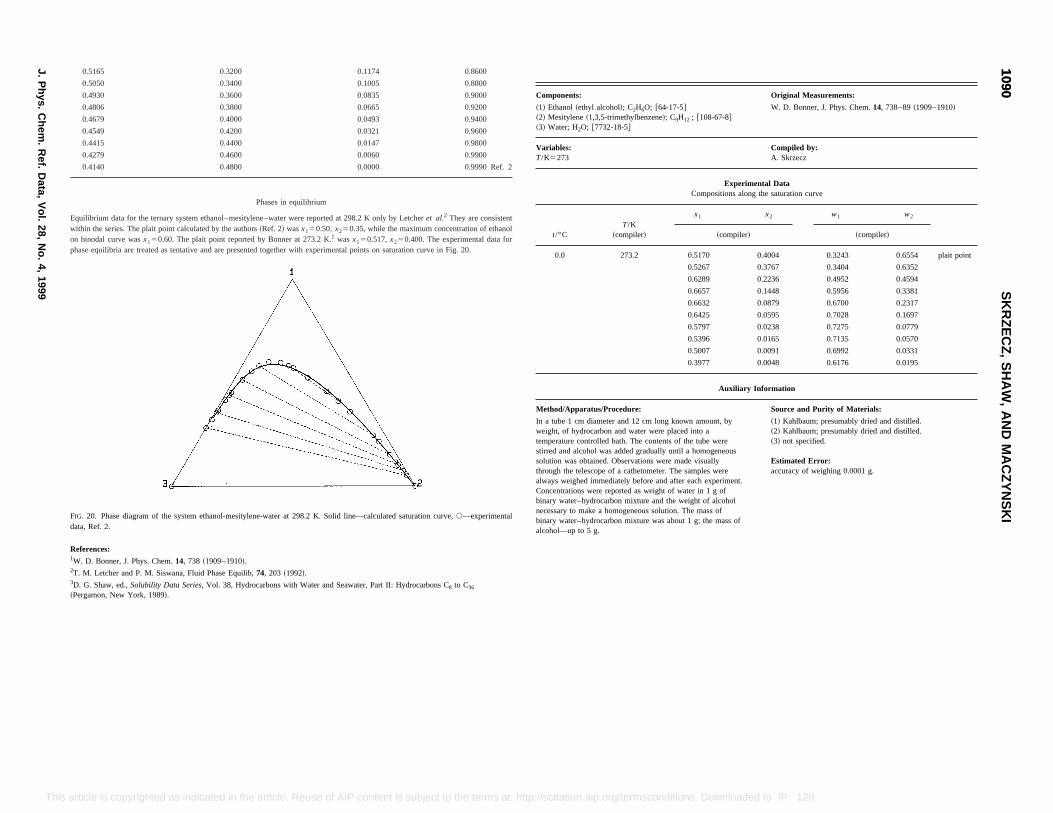
data, Ref. 2.
ponents: Original Measurements:
thanol~ethyl alcohol!; C2H6O; @64-17-5#esitylene~1,3,5-trimethylbenzene!; C9H12 ; @108-67-8#ater; H2O; @7732-18-5#
W. D. Bonner, J. Phys. Chem.14, 738–89~1909–1910!
iables:5273
Compiled by:A. Skrzecz
Experimental DataCompositions along the saturation curve
t/°CT/K
~compiler!
x1 x2 w1 w2
~compiler! ~compiler!
0.0 273.2 0.5170 0.4004 0.3243 0.6554 plait point
0.5267 0.3767 0.3404 0.6352
0.6289 0.2236 0.4952 0.4594
0.6657 0.1448 0.5956 0.3381
0.6632 0.0879 0.6700 0.2317
0.6425 0.0595 0.7028 0.1697
0.5797 0.0238 0.7275 0.0779
0.5396 0.0165 0.7135 0.0570
0.5007 0.0091 0.6992 0.0331
0.3977 0.0048 0.6176 0.0195
Auxiliary Information
hod/Apparatus/Procedure: Source and Purity of Materials:
tube 1 cm diameter and 12 cm long known amount, byht, of hydrocarbon and water were placed into a
perature controlled bath. The contents of the tube wereed and alcohol was added gradually until a homogeneoustion was obtained. Observations were made visuallyugh the telescope of a cathetometer. The samples wereys weighed immediately before and after each experiment.centrations were reported as weight of water in 1 g ofry water–hydrocarbon mixture and the weight of alcohol
essary to make a homogeneous solution. The mass ofry water–hydrocarbon mixture was about 1 g; the mass of
~1! Kahlbaum; presumably dried and distilled.~2! Kahlbaum; presumably dried and distilled.~3! not specified.
Estimated Error:accuracy of weighing 0.0001 g.
10901090
SK
RZ
EC
Z,
SH
AW
,A
ND
MA
CZ
YN
SK
I
J.P
hys.C
hem.
Ref.
Data,
Vol.
28,N
o.4,
1999
This /termsconditions. Downloaded to IP: 129.6.105.191 On: Fri, 05 Sep 2014 17:51:55
References:1W. D. Bonner, J. Phys. Chem.14, 738 ~1909–1910!.2T. M. Letcher and P. M. Siswana, Fluid Phase Equilib,74, 203 ~1992!.3D. G. Shaw, ed.,Solubility Data Series, Vol. 38, Hydrocarbons with Water and Seawater, Part II: Hydrocarbons C8 to C36
~Pergamon, New York, 1989!.
alcohol—up to 5 g.
article is copyrighted as indicated in the article. Reuse of AIP content is subject to the terms at: http://scitation.aip.org
0.5165 0.3200 0.1174 0.8600
0.5050 0.3400 0.1005 0.8800
0.4930 0.3600 0.0835 0.9000
0.4806 0.3800 0.0665 0.9200
0.4679 0.4000 0.0493 0.9400
0.4549 0.4200 0.0321 0.9600
0.4415 0.4400 0.0147 0.9800
0.4279 0.4600 0.0060 0.9900
0.4140 0.4800 0.0000 0.9990 Ref. 2
Phases in equilibrium
Equilibrium data for the ternary system ethanol–mesitylene–water were reported at 298.2 K only by Letcheret al.2 They are consistentwithin the series. The plait point calculated by the authors~Ref. 2! wasx150.50, x250.35, while the maximum concentration of ethanolon binodal curve wasx150.60. The plait point reported by Bonner at 273.2 K.1 wasx150.517,x250.400. The experimental data forphase equilibria are treated as tentative and are presented together with experimental points on saturation curve in Fig. 20.
FIG. 20. Phase diagram of the system ethanol-mesitylene-water at 298.2 K. Solid line—calculated saturation curve,s—experimental
Com
~1! E~2! M~3! W
VarT/K
Met
In aweigtemstirrsoluthroalwaConbinanecbina
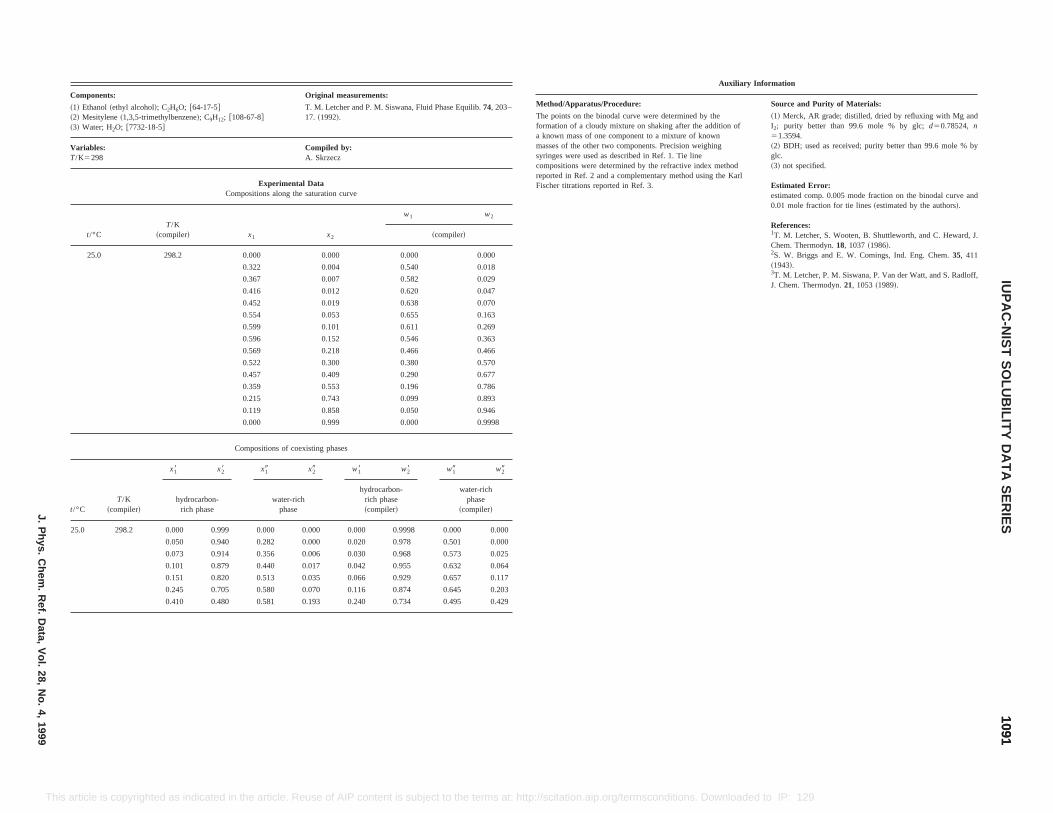
Original measurements:
T. M. Letcher and P. M. Siswana, Fluid Phase Equilib.74, 203–17. ~1992!.
Compiled by:A. Skrzecz
tal Datathe saturation curve
x2
w1 w2
~compiler!
0.000 0.000 0.000
0.004 0.540 0.018
0.007 0.582 0.029
0.012 0.620 0.047
0.019 0.638 0.070
0.053 0.655 0.163
0.101 0.611 0.269
0.152 0.546 0.363
0.218 0.466 0.466
0.300 0.380 0.570
0.409 0.290 0.677
0.553 0.196 0.786
0.743 0.099 0.893
0.858 0.050 0.946
0.999 0.000 0.9998
coexisting phases
x29 w18 w28 w19 w29
riche
hydrocarbon-rich phase~compiler!
water-richphase
~compiler!
Auxiliary Information
Method/Apparatus/Procedure: Source and Purity of Materials:
The points on the binodal curve were determined by theformation of a cloudy mixture on shaking after the addition ofa known mass of one component to a mixture of knownmasses of the other two components. Precision weighingsyringes were used as described in Ref. 1. Tie linecompositions were determined by the refractive index methodreported in Ref. 2 and a complementary method using the KarlFischer titrations reported in Ref. 3.
~1! Merck, AR grade; distilled, dried by refluxing with Mg andI2; purity better than 99.6 mole % by glc;d50.78524, n51.3594.~2! BDH; used as received; purity better than 99.6 mole % byglc.~3! not specified.
Estimated Error:estimated comp. 0.005 mode fraction on the binodal curve and0.01 mole fraction for tie lines~estimated by the authors!.
References:1T. M. Letcher, S. Wooten, B. Shuttleworth, and C. Heward, J.Chem. Thermodyn.18, 1037~1986!.2S. W. Briggs and E. W. Comings, Ind. Eng. Chem.35, 411~1943!.3T. M. Letcher, P. M. Siswana, P. Van der Watt, and S. Radloff,J. Chem. Thermodyn.21, 1053~1989!.
10911091
IUP
AC
-NIS
TS
OLU
BILIT
YD
AT
AS
ER
IESJ.P
hys.C
hem.
Ref.
Data,
Vol.
28,N
o.4,
1999
This sconditions. Downloaded to IP: 129.6.105.191 On: Fri, 05 Sep 2014 17:51:55
25.0 298.2 0.000 0.999 0.000 0.000 0.000 0.9998 0.000 0.000
0.050 0.940 0.282 0.000 0.020 0.978 0.501 0.000
0.073 0.914 0.356 0.006 0.030 0.968 0.573 0.025
0.101 0.879 0.440 0.017 0.042 0.955 0.632 0.064
0.151 0.820 0.513 0.035 0.066 0.929 0.657 0.117
0.245 0.705 0.580 0.070 0.116 0.874 0.645 0.203
0.410 0.480 0.581 0.193 0.240 0.734 0.495 0.429
article is copyrighted as indicated in the article. Reuse of AIP content is subject to the terms at: http://scitation.aip.org/term
Components:
~1! Ethanol~ethyl alcohol!; C2H6O; @64-17-5#~2! Mesitylene~1,3,5-trimethylbenzene!; C9H12; @108-67-8#~3! Water; H2O; @7732-18-5#
Variables:T/K5298
ExperimenCompositions along
t/°CT/K
~compiler! x1
25.0 298.2 0.000
0.322
0.367
0.416
0.452
0.554
0.599
0.596
0.569
0.522
0.457
0.359
0.215
0.119
0.000
Compositions of
t/°CT/K
~compiler!
x18 x28 x19
hydrocarbon-rich phase
water-phas
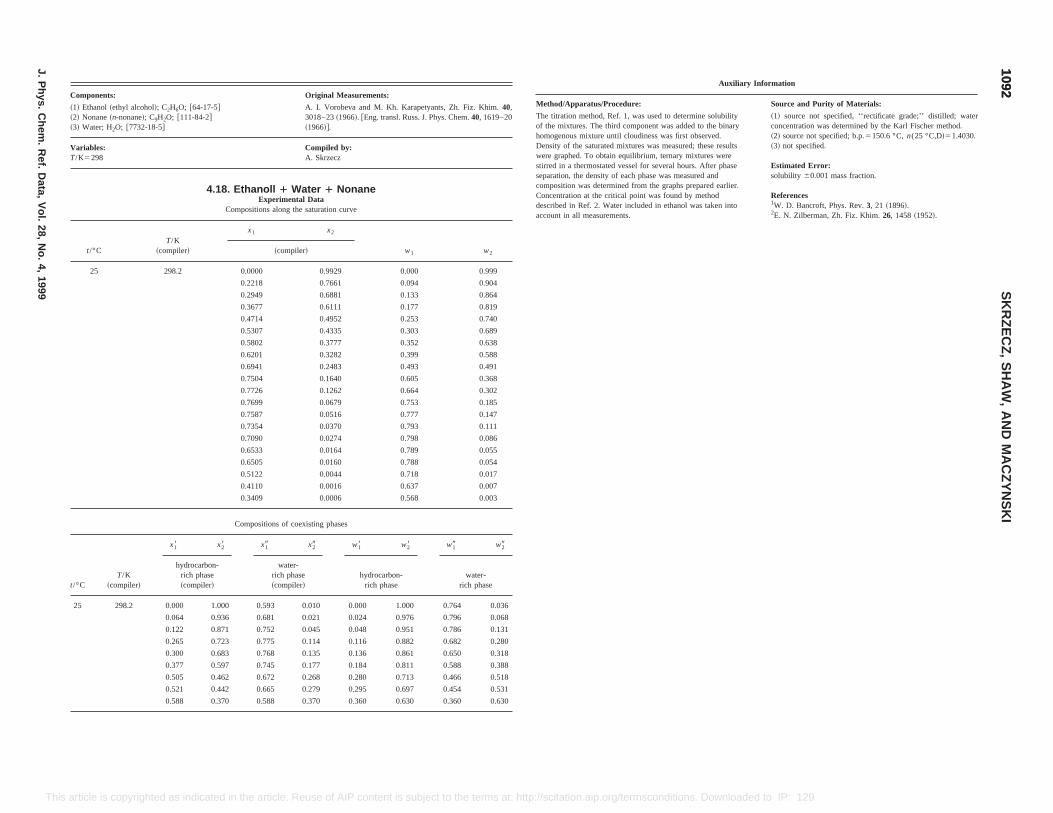
Original Measurements:
A. I. Vorobeva and M. Kh. Karapetyants, Zh. Fiz. Khim.40,3018–23~1966!. @Eng. transl. Russ. J. Phys. Chem.40, 1619–20~1966!#.
Compiled by:A. Skrzecz
thanoll 1 Water 1 NonaneExperimental Data
mpositions along the saturation curve
x1 x2
w1 w2~compiler!
0.0000 0.9929 0.000 0.999
0.2218 0.7661 0.094 0.904
0.2949 0.6881 0.133 0.864
0.3677 0.6111 0.177 0.819
0.4714 0.4952 0.253 0.740
0.5307 0.4335 0.303 0.689
0.5802 0.3777 0.352 0.638
0.6201 0.3282 0.399 0.588
0.6941 0.2483 0.493 0.491
0.7504 0.1640 0.605 0.368
0.7726 0.1262 0.664 0.302
0.7699 0.0679 0.753 0.185
0.7587 0.0516 0.777 0.147
0.7354 0.0370 0.793 0.111
0.7090 0.0274 0.798 0.086
0.6533 0.0164 0.789 0.055
0.6505 0.0160 0.788 0.054
0.5122 0.0044 0.718 0.017
0.4110 0.0016 0.637 0.007
0.3409 0.0006 0.568 0.003
Compositions of coexisting phases
Auxiliary Information
Method/Apparatus/Procedure: Source and Purity of Materials:
The titration method, Ref. 1, was used to determine solubilityof the mixtures. The third component was added to the binaryhomogenous mixture until cloudiness was first observed.Density of the saturated mixtures was measured; these resultswere graphed. To obtain equilibrium, ternary mixtures werestirred in a thermostated vessel for several hours. After phaseseparation, the density of each phase was measured andcomposition was determined from the graphs prepared earlier.Concentration at the critical point was found by methoddescribed in Ref. 2. Water included in ethanol was taken intoaccount in all measurements.
~1! source not specified, ‘‘rectificate grade;’’ distilled; waterconcentration was determined by the Karl Fischer method.~2! source not specified; b.p.5150.6 °C,n(25 °C,D!51.4030.~3! not specified.
Estimated Error:solubility 60.001 mass fraction.
References1W. D. Bancroft, Phys. Rev.3, 21 ~1896!.2E. N. Zilberman, Zh. Fiz. Khim.26, 1458~1952!.
10921092
SK
RZ
EC
Z,
SH
AW
,A
ND
MA
CZ
YN
SK
I
J.P
hys.C
hem.
Ref.
Data,
Vol.
28,N
o.4,
1999
This aded to IP: 129.6.105.191 On: Fri, 05 Sep 2014 17:51:55
t/°CT/K
~compiler!
x18 x28 x19 x29 w18 w28 w19 w29
hydrocarbon-rich phase~compiler!
water-rich phase~compiler!
hydrocarbon-rich phase
water-rich phase
25 298.2 0.000 1.000 0.593 0.010 0.000 1.000 0.764 0.036
0.064 0.936 0.681 0.021 0.024 0.976 0.796 0.068
0.122 0.871 0.752 0.045 0.048 0.951 0.786 0.131
0.265 0.723 0.775 0.114 0.116 0.882 0.682 0.280
0.300 0.683 0.768 0.135 0.136 0.861 0.650 0.318
0.377 0.597 0.745 0.177 0.184 0.811 0.588 0.388
0.505 0.462 0.672 0.268 0.280 0.713 0.466 0.518
0.521 0.442 0.665 0.279 0.295 0.697 0.454 0.531
0.588 0.370 0.588 0.370 0.360 0.630 0.360 0.630
article is copyrighted as indicated in the article. Reuse of AIP content is subject to the terms at: http://scitation.aip.org/termsconditions. Downlo
Components:
~1! Ethanol~ethyl alcohol!; C2H6O; @64-17-5#~2! Nonane~n-nonane!; C9H2O; @111-84-2#~3! Water; H2O; @7732-18-5#
Variables:T/K5298
4.18. E
Co
t/°CT/K
~compiler!
25 298.2
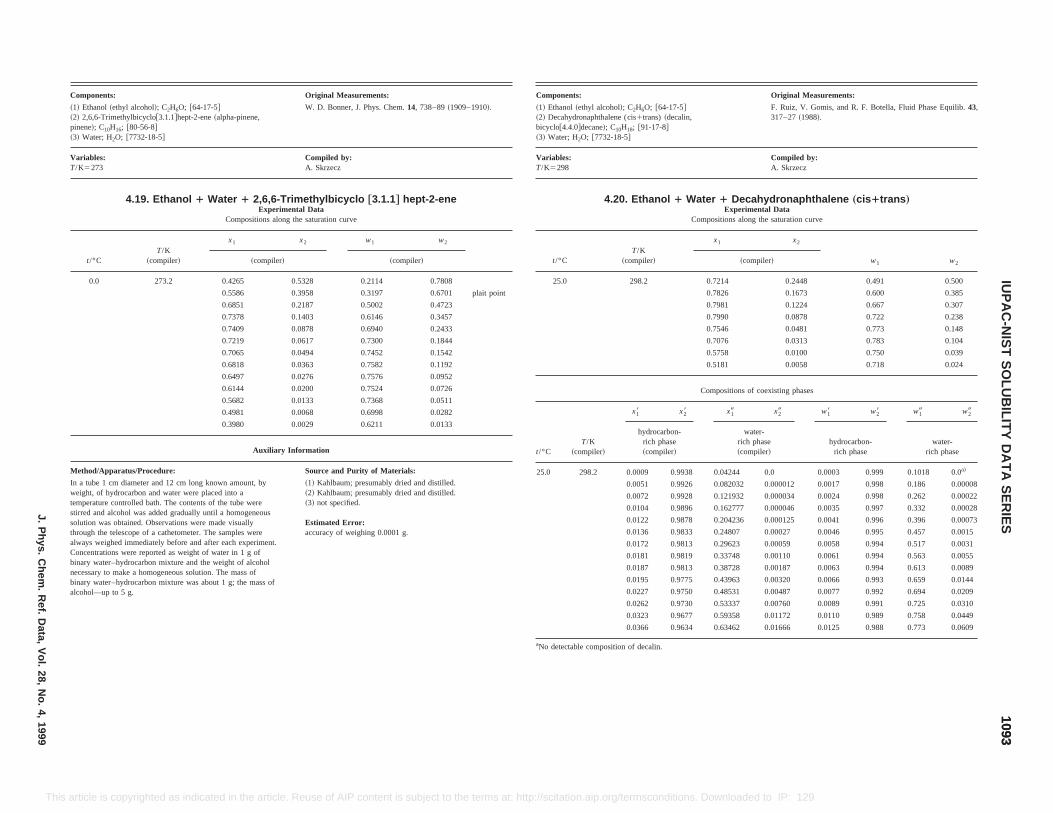
Original Measurements:
-17-5#~decalin,8#
F. Ruiz, V. Gomis, and R. F. Botella, Fluid Phase Equilib.43,317–27~1988!.
Compiled by:A. Skrzecz
l 1 Water 1 Decahydronaphthalene „cis 1trans …
Experimental DataCompositions along the saturation curve
x1 x2
w1 w2~compiler!
0.7214 0.2448 0.491 0.500
0.7826 0.1673 0.600 0.385
0.7981 0.1224 0.667 0.307
0.7990 0.0878 0.722 0.238
0.7546 0.0481 0.773 0.148
0.7076 0.0313 0.783 0.104
0.5758 0.0100 0.750 0.039
0.5181 0.0058 0.718 0.024
Compositions of coexisting phases
x28 x19 x29 w18 w28 w19 w29
rbon-ase
iler!
water-rich phase~compiler!
hydrocarbon-rich phase
water-rich phase
0.9938 0.04244 0.0 0.0003 0.999 0.1018 0.0a!
0.9926 0.082032 0.000012 0.0017 0.998 0.186 0.00008
0.9928 0.121932 0.000034 0.0024 0.998 0.262 0.00022
0.9896 0.162777 0.000046 0.0035 0.997 0.332 0.00028
0.9878 0.204236 0.000125 0.0041 0.996 0.396 0.00073
0.0136 0.9833 0.24807 0.00027 0.0046 0.995 0.457 0.0015
0.0172 0.9813 0.29623 0.00059 0.0058 0.994 0.517 0.0031
0.0181 0.9819 0.33748 0.00110 0.0061 0.994 0.563 0.0055
0.0187 0.9813 0.38728 0.00187 0.0063 0.994 0.613 0.0089
0.0195 0.9775 0.43963 0.00320 0.0066 0.993 0.659 0.0144
0.0227 0.9750 0.48531 0.00487 0.0077 0.992 0.694 0.0209
0.0262 0.9730 0.53337 0.00760 0.0089 0.991 0.725 0.0310
0.0323 0.9677 0.59358 0.01172 0.0110 0.989 0.758 0.0449
0.0366 0.9634 0.63462 0.01666 0.0125 0.988 0.773 0.0609
sition of decalin.
10931093
IUP
AC
-NIS
TS
OLU
BILIT
YD
AT
AS
ER
IESJ.P
hys.C
hem.
Ref.
Data,
Vol.
28,N
o.4,
1999
This /termsconditions. Downloaded to IP: 129.6.105.191 On: Fri, 05 Sep 2014 17:51:55
through the telescope of a cathetometer. The samples werealways weighed immediately before and after each experiment.Concentrations were reported as weight of water in 1 g ofbinary water–hydrocarbon mixture and the weight of alcoholnecessary to make a homogeneous solution. The mass ofbinary water–hydrocarbon mixture was about 1 g; the mass ofalcohol—up to 5 g.
accuracy of weighing 0.0001 g.
aNo detectable compo
article is copyrighted as indicated in the article. Reuse of AIP content is subject to the terms at: http://scitation.aip.org
Components: Original Measurements:
~1! Ethanol~ethyl alcohol!; C2H6O; @64-17-5#~2! 2,6,[email protected]#hept-2-ene~alpha-pinene,pinene!; C10H16; @80-56-8#~3! Water; H2O; @7732-18-5#
W. D. Bonner, J. Phys. Chem.14, 738–89~1909–1910!.
Variables:T/K5273
Compiled by:A. Skrzecz
4.19. Ethanol 1 Water 1 2,6,6-Trimethylbicyclo †3.1.1‡ hept-2-eneExperimental Data
Compositions along the saturation curve
t/°CT/K
~compiler!
x1 x2 w1 w2
~compiler! ~compiler!
0.0 273.2 0.4265 0.5328 0.2114 0.7808
0.5586 0.3958 0.3197 0.6701 plait point
0.6851 0.2187 0.5002 0.4723
0.7378 0.1403 0.6146 0.3457
0.7409 0.0878 0.6940 0.2433
0.7219 0.0617 0.7300 0.1844
0.7065 0.0494 0.7452 0.1542
0.6818 0.0363 0.7582 0.1192
0.6497 0.0276 0.7576 0.0952
0.6144 0.0200 0.7524 0.0726
0.5682 0.0133 0.7368 0.0511
0.4981 0.0068 0.6998 0.0282
0.3980 0.0029 0.6211 0.0133
Auxiliary Information
Method/Apparatus/Procedure: Source and Purity of Materials:
In a tube 1 cm diameter and 12 cm long known amount, byweight, of hydrocarbon and water were placed into atemperature controlled bath. The contents of the tube werestirred and alcohol was added gradually until a homogeneoussolution was obtained. Observations were made visually
~1! Kahlbaum; presumably dried and distilled.~2! Kahlbaum; presumably dried and distilled.~3! not specified.
Estimated Error:
Components:
~1! Ethanol~ethyl alcohol!; C2H6O; @64~2! Decahydronaphthalene (cis1trans)[email protected]#decane!; C10H18; @91-17-~3! Water; H2O; @7732-18-5#
Variables:T/K5298
4.20. Ethano
t/°CT/K
~compiler!
25.0 298.2
t/°CT/K
~compiler!
x18
hydrocarich ph~comp
25.0 298.2 0.0009
0.0051
0.0072
0.0104
0.0122
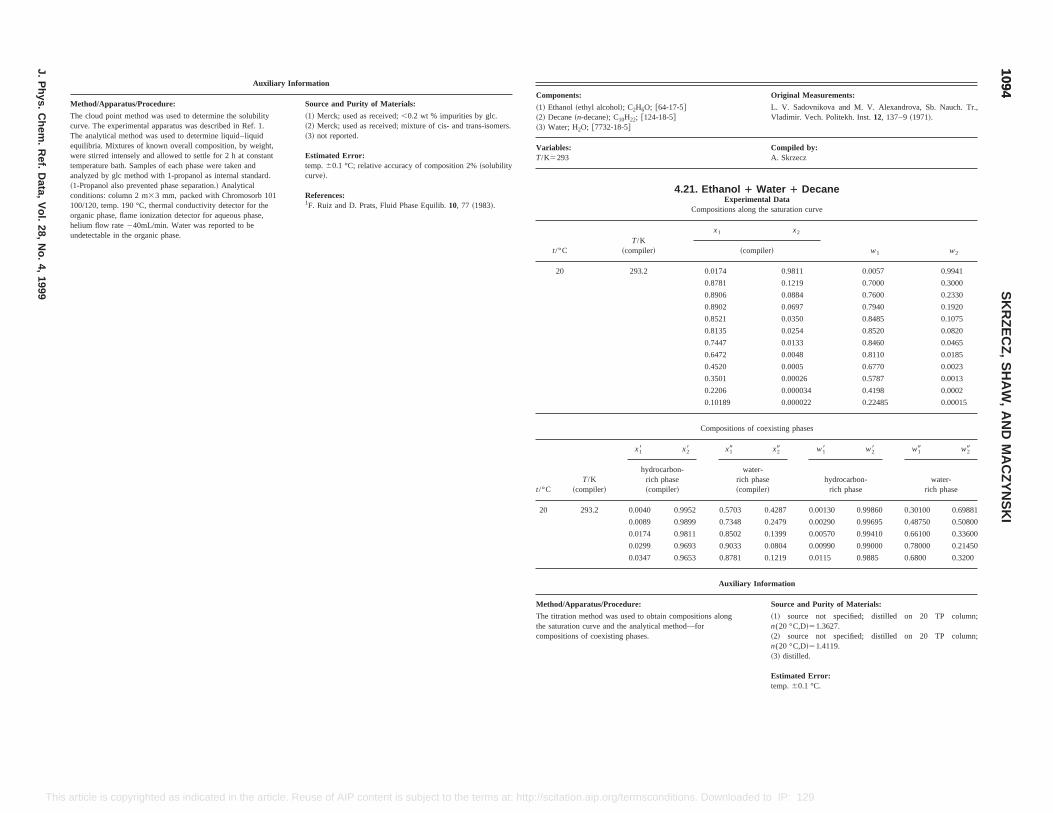
Original Measurements:
L. V. Sadovnikova and M. V. Alexandrova, Sb. Nauch. Tr.,Vladimir. Vech. Politekh. Inst.12, 137–9~1971!.
Compiled by:A. Skrzecz
ol 1 Water 1 DecaneExperimental Dataions along the saturation curve
x2
w1 w2~compiler!
4 0.9811 0.0057 0.9941
1 0.1219 0.7000 0.3000
6 0.0884 0.7600 0.2330
2 0.0697 0.7940 0.1920
1 0.0350 0.8485 0.1075
5 0.0254 0.8520 0.0820
7 0.0133 0.8460 0.0465
2 0.0048 0.8110 0.0185
0 0.0005 0.6770 0.0023
1 0.00026 0.5787 0.0013
6 0.000034 0.4198 0.0002
89 0.000022 0.22485 0.00015
sitions of coexisting phases
x19 x29 w18 w28 w19 w29
water-rich phase~compiler!
hydrocarbon-rich phase
water-rich phase
0.5703 0.4287 0.00130 0.99860 0.30100 0.69881
0.7348 0.2479 0.00290 0.99695 0.48750 0.50800
0.0174 0.9811 0.8502 0.1399 0.00570 0.99410 0.66100 0.33600
0.0299 0.9693 0.9033 0.0804 0.00990 0.99000 0.78000 0.21450
0.0347 0.9653 0.8781 0.1219 0.0115 0.9885 0.6800 0.3200
Auxiliary Information
Method/Apparatus/Procedure: Source and Purity of Materials:
The titration method was used to obtain compositions alongthe saturation curve and the analytical method—forcompositions of coexisting phases.
~1! source not specified; distilled on 20 TP column;n(20 °C,D!51.3627.~2! source not specified; distilled on 20 TP column;n(20 °C,D!51.4119.~3! distilled.
Estimated Error:temp.60.1 °C.
10941094
SK
RZ
EC
Z,
SH
AW
,A
ND
MA
CZ
YN
SK
I
J.P
hys.C
hem.
Ref.
Data,
Vol.
28,N
o.4,
1999
This a Reuse of AIP content is subject to the terms at: http://scitation.aip.org/termsconditions. Downloaded to IP: 129.6.105.191 On: Fri, 05 Sep 2014 17:51:55
rticle is copyrighted as indicated in the article.Auxiliary Information
Method/Apparatus/Procedure: Source and Purity of Materials:
The cloud point method was used to determine the solubilitycurve. The experimental apparatus was described in Ref. 1.The analytical method was used to determine liquid–liquidequilibria. Mixtures of known overall composition, by weight,were stirred intensely and allowed to settle for 2 h atconstanttemperature bath. Samples of each phase were taken andanalyzed by glc method with 1-propanol as internal standard.~1-Propanol also prevented phase separation.! Analyticalconditions: column 2 m33 mm, packed with Chromosorb 101100/120, temp. 190 °C, thermal conductivity detector for theorganic phase, flame ionization detector for aqueous phase,helium flow rate240mL/min. Water was reported to beundetectable in the organic phase.
~1! Merck; used as received;,0.2 wt % impurities by glc.~2! Merck; used as received; mixture of cis- and trans-isomers.~3! not reported.
Estimated Error:temp.60.1 °C; relative accuracy of composition 2%~solubilitycurve!.
References:1F. Ruiz and D. Prats, Fluid Phase Equilib.10, 77 ~1983!.
Components:
~1! Ethanol~ethyl alcohol!; C2H6O; @64-17-5#~2! Decane~n-decane!; C10H22; @124-18-5#~3! Water; H2O; @7732-18-5#
Variables:T/K5293
4.21. Ethan
Composit
t/°CT/K
~compiler!
x1
20 293.2 0.017
0.878
0.890
0.890
0.852
0.813
0.744
0.647
0.452
0.350
0.220
0.101
Compo
t/°CT/K
~compiler!
x18 x28
hydrocarbon-rich phase~compiler!
20 293.2 0.0040 0.9952
0.0089 0.9899
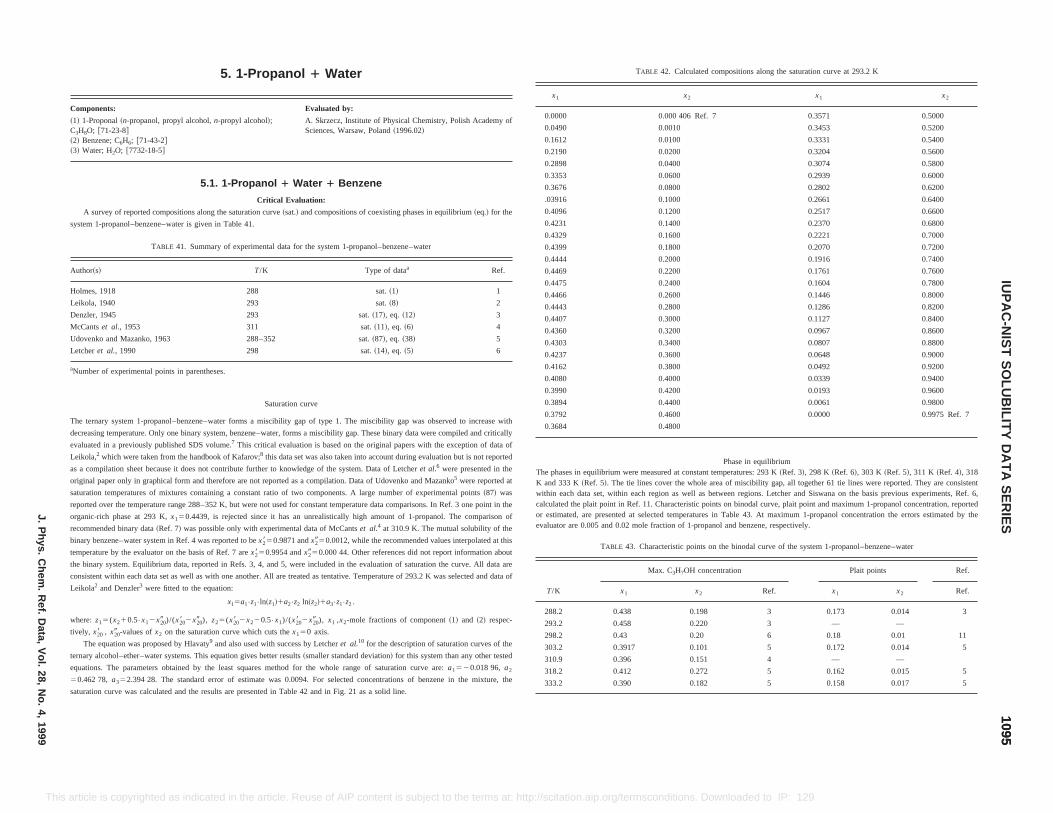
recommended binary data~Ref. 7! was possible only with experimental data of McCantset al. at 310.9 K. The mutual solubility of the
ompositions along the saturation curve at 293.2 K
x1 x2
0.3571 0.5000
0.3453 0.5200
0.3331 0.5400
0.3204 0.5600
0.3074 0.5800
0.2939 0.6000
0.2802 0.6200
0.2661 0.6400
0.2517 0.6600
0.2370 0.6800
0.2221 0.7000
0.2070 0.7200
0.1916 0.7400
0.1761 0.7600
0.1604 0.7800
0.1446 0.8000
0.1286 0.8200
0.1127 0.8400
0.0967 0.8600
0.0807 0.8800
0.0648 0.9000
0.0492 0.9200
0.0339 0.9400
0.0193 0.9600
0.0061 0.9800
0.0000 0.9975 Ref. 7
Phase in equilibriumnt temperatures: 293 K~Ref. 3!, 298 K ~Ref. 6!, 303 K ~Ref. 5!, 311 K ~Ref. 4!, 318rea of miscibility gap, all together 61 tie lines were reported. They are consistentbetween regions. Letcher and Siswana on the basis previous experiments, Ref. 6,ints on binodal curve, plait point and maximum 1-propanol concentration, reportedes in Table 43. At maximum 1-propanol concentration the errors estimated by theanol and benzene, respectively.
n the binodal curve of the system 1-propanol–benzene–water
ntration Plait points Ref.
Ref. x1 x2 Ref.
3 0.173 0.014 3
3 — —
6 0.18 0.01 11
5 0.172 0.014 5
4 — —
5 0.162 0.015 5
5 0.158 0.017 5
10951095
IUP
AC
-NIS
TS
OLU
BILIT
YD
AT
AS
ER
IESJ.P
hys.C
hem.
Ref.
Data,
Vol.
28,N
o.4,
1999
This nloaded to IP: 129.6.105.191 On: Fri, 05 Sep 2014 17:51:55
binary benzene–water system in Ref. 4 was reported to bex2850.9871 andx2950.0012, while the recommended values interpolated at this
temperature by the evaluator on the basis of Ref. 7 arex2850.9954 andx2950.000 44. Other references did not report information about
the binary system. Equilibrium data, reported in Refs. 3, 4, and 5, were included in the evaluation of saturation the curve. All data are
consistent within each data set as well as with one another. All are treated as tentative. Temperature of 293.2 K was selected and data of
Leikola2 and Denzler3 were fitted to the equation:
x15a1•z1•ln~z1!1a2•z2 ln~z2!1a3•z1•z2 .
where: z15(x210.5•x12x209 )/(x208 2x209 ), z25(x208 2x220.5•x1)/(x208 2x209 ), x1 ,x2-mole fractions of component~1! and ~2! respec-
tively, x208 , x209 -values ofx2 on the saturation curve which cuts thex150 axis.
The equation was proposed by Hlavaty9 and also used with success by Letcheret al.10 for the description of saturation curves of the
ternary alcohol–ether–water systems. This equation gives better results~smaller standard deviation! for this system than any other tested
equations. The parameters obtained by the least squares method for the whole range of saturation curve are:a1520.018 96,a2
50.462 78,a352.394 28. The standard error of estimate was 0.0094. For selected concentrations of benzene in the mixture, the
saturation curve was calculated and the results are presented in Table 42 and in Fig. 21 as a solid line.
TABLE 43. Characteristic points o
T/K
Max. C3H7OH conce
x1 x2
288.2 0.438 0.198
293.2 0.458 0.220
298.2 0.43 0.20
303.2 0.3917 0.101
310.9 0.396 0.151
318.2 0.412 0.272
333.2 0.390 0.182
article is copyrighted as indicated in the article. Reuse of AIP content is subject to the terms at: http://scitation.aip.org/termsconditions. Dow
5. 1-Propanol 1 Water
Components: Evaluated by:
~1! 1-Proponal~n-propanol, propyl alcohol,n-propyl alcohol!;C3H8O; @71-23-8#~2! Benzene; C6H6; @71-43-2#~3! Water; H2O; @7732-18-5#
A. Skrzecz, Institute of Physical Chemistry, Polish Academy ofSciences, Warsaw, Poland~1996.02!
5.1. 1-Propanol 1 Water 1 Benzene
Critical Evaluation:
A survey of reported compositions along the saturation curve~sat.! and compositions of coexisting phases in equilibrium~eq.! for the
system 1-propanol–benzene–water is given in Table 41.
TABLE 41. Summary of experimental data for the system 1-propanol–benzene–water
Author~s! T/K Type of dataa Ref.
Holmes, 1918 288 sat.~1! 1
Leikola, 1940 293 sat.~8! 2
Denzler, 1945 293 sat.~17!, eq. ~12! 3
McCantset al., 1953 311 sat.~11!, eq. ~6! 4
Udovenko and Mazanko, 1963 288–352 sat.~87!, eq. ~38! 5
Letcheret al., 1990 298 sat.~14!, eq. ~5! 6
aNumber of experimental points in parentheses.
Saturation curve
The ternary system 1-propanol–benzene–water forms a miscibility gap of type 1. The miscibility gap was observed to increase with
decreasing temperature. Only one binary system, benzene–water, forms a miscibility gap. These binary data were compiled and critically
evaluated in a previously published SDS volume.7 This critical evaluation is based on the original papers with the exception of data of
Leikola,2 which were taken from the handbook of Kafarov;8 this data set was also taken into account during evaluation but is not reported
as a compilation sheet because it does not contribute further to knowledge of the system. Data of Letcheret al.6 were presented in the
original paper only in graphical form and therefore are not reported as a compilation. Data of Udovenko and Mazanko5 were reported at
saturation temperatures of mixtures containing a constant ratio of two components. A large number of experimental points~87! was
reported over the temperature range 288–352 K, but were not used for constant temperature data comparisons. In Ref. 3 one point in the
organic-rich phase at 293 K,x150.4439, is rejected since it has an unrealistically high amount of 1-propanol. The comparison of4
TABLE 42. Calculated c
x1 x2
0.0000 0.000 406 Ref. 7
0.0490 0.0010
0.1612 0.0100
0.2190 0.0200
0.2898 0.0400
0.3353 0.0600
0.3676 0.0800
.03916 0.1000
0.4096 0.1200
0.4231 0.1400
0.4329 0.1600
0.4399 0.1800
0.4444 0.2000
0.4469 0.2200
0.4475 0.2400
0.4466 0.2600
0.4443 0.2800
0.4407 0.3000
0.4360 0.3200
0.4303 0.3400
0.4237 0.3600
0.4162 0.3800
0.4080 0.4000
0.3990 0.4200
0.3894 0.4400
0.3792 0.4600
0.3684 0.4800
The phases in equilibrium were measured at constaK and 333 K~Ref. 5!. The tie lines cover the whole awithin each data set, within each region as well ascalculated the plait point in Ref. 11. Characteristic poor estimated, are presented at selected temperaturevaluator are 0.005 and 0.02 mole fraction of 1-prop
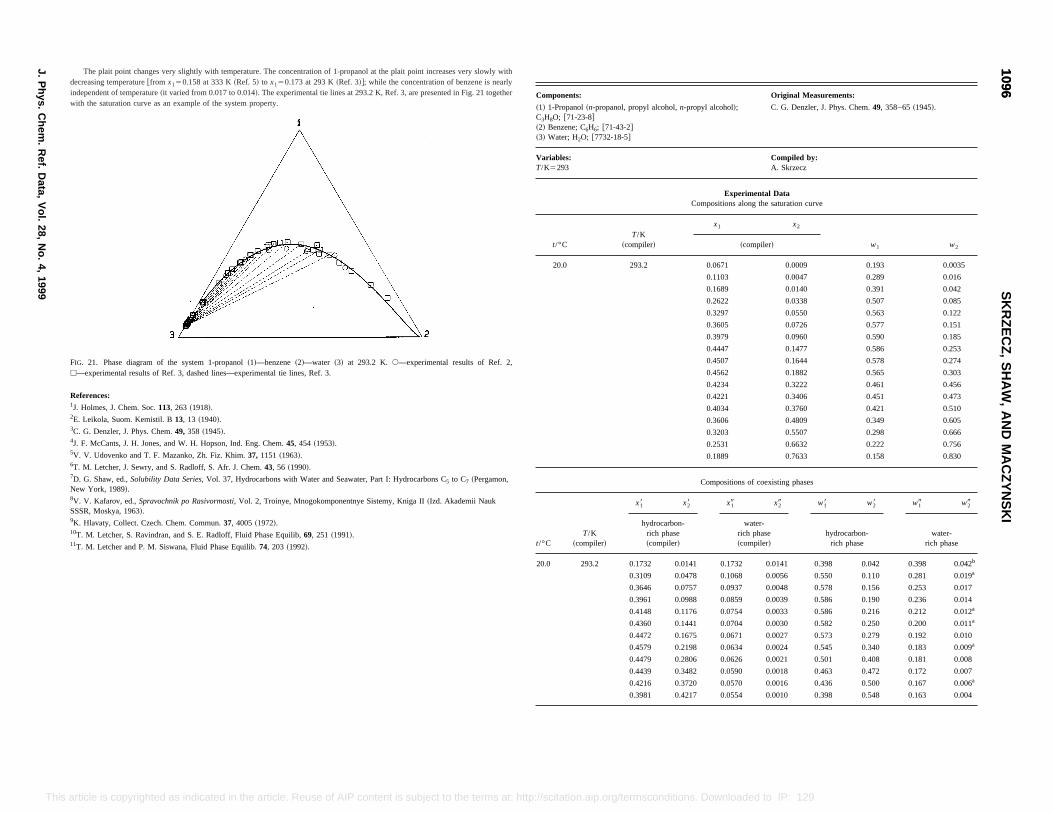
Original Measurements:
hol!; C. G. Denzler, J. Phys. Chem.49, 358–65~1945!.
Compiled by:A. Skrzecz
xperimental Dataions along the saturation curve
x2
w1 w2~compiler!
71 0.0009 0.193 0.0035
3 0.0047 0.289 0.016
9 0.0140 0.391 0.042
2 0.0338 0.507 0.085
7 0.0550 0.563 0.122
5 0.0726 0.577 0.151
9 0.0960 0.590 0.185
7 0.1477 0.586 0.253
7 0.1644 0.578 0.274
2 0.1882 0.565 0.303
4 0.3222 0.461 0.456
1 0.3406 0.451 0.473
4 0.3760 0.421 0.510
6 0.4809 0.349 0.605
3 0.5507 0.298 0.666
1 0.6632 0.222 0.756
9 0.7633 0.158 0.830
sitions of coexisting phases
T/K~compiler!
x19 x29 w18 w28 w19 w29
rich phase~compiler!
water-rich phase~compiler!
hydrocarbon-rich phase
water-rich phase
293.2 0.1732 0.0141 0.1732 0.0141 0.398 0.042 0.398 0.042b
0.3109 0.0478 0.1068 0.0056 0.550 0.110 0.281 0.019a
0.3646 0.0757 0.0937 0.0048 0.578 0.156 0.253 0.017
0.3961 0.0988 0.0859 0.0039 0.586 0.190 0.236 0.014
0.4148 0.1176 0.0754 0.0033 0.586 0.216 0.212 0.012a
0.4360 0.1441 0.0704 0.0030 0.582 0.250 0.200 0.011a
0.4472 0.1675 0.0671 0.0027 0.573 0.279 0.192 0.010
0.4579 0.2198 0.0634 0.0024 0.545 0.340 0.183 0.009a
0.4479 0.2806 0.0626 0.0021 0.501 0.408 0.181 0.008
0.4439 0.3482 0.0590 0.0018 0.463 0.472 0.172 0.007
0.4216 0.3720 0.0570 0.0016 0.436 0.500 0.167 0.006a
0.3981 0.4217 0.0554 0.0010 0.398 0.548 0.163 0.004
10961096
SK
RZ
EC
Z,
SH
AW
,A
ND
MA
CZ
YN
SK
I
J.P
hys.C
hem.
Ref.
Data,
Vol.
28,N
o.4,
1999
This ion.aip.org/termsconditions. Downloaded to IP: 129.6.105.191 On: Fri, 05 Sep 2014 17:51:55
10T. M. Letcher, S. Ravindran, and S. E. Radloff, Fluid Phase Equilib,69, 251 ~1991!.11T. M. Letcher and P. M. Siswana, Fluid Phase Equilib.74, 203 ~1992!. t/°C
20.0
article is copyrighted as indicated in the article. Reuse of AIP content is subject to the terms at: http://scitat
The plait point changes very slightly with temperature. The concentration of 1-propanol at the plait point increases very slowly withdecreasing temperature@from x150.158 at 333 K~Ref. 5! to x150.173 at 293 K~Ref. 3!#; while the concentration of benzene is nearlyindependent of temperature~it varied from 0.017 to 0.014!. The experimental tie lines at 293.2 K, Ref. 3, are presented in Fig. 21 togetherwith the saturation curve as an example of the system property.
FIG. 21. Phase diagram of the system 1-propanol~1!—benzene~2!—water ~3! at 293.2 K. s—experimental results of Ref. 2,h—experimental results of Ref. 3, dashed lines—experimental tie lines, Ref. 3.
References:1J. Holmes, J. Chem. Soc.113, 263 ~1918!.2E. Leikola, Suom. Kemistil. B13, 13 ~1940!.3C. G. Denzler, J. Phys. Chem.49, 358 ~1945!.4J. F. McCants, J. H. Jones, and W. H. Hopson, Ind. Eng. Chem.45, 454 ~1953!.5V. V. Udovenko and T. F. Mazanko, Zh. Fiz. Khim.37, 1151 ~1963!.6T. M. Letcher, J. Sewry, and S. Radloff, S. Afr. J. Chem.43, 56 ~1990!.7D. G. Shaw, ed.,Solubility Data Series, Vol. 37, Hydrocarbons with Water and Seawater, Part I: Hydrocarbons C5 to C7 ~Pergamon,New York, 1989!.8V. V. Kafarov, ed.,Spravochnik po Rasivormosti, Vol. 2, Troinye, Mnogokomponentnye Sistemy, Kniga II~Izd. Akademii NaukSSSR, Moskya, 1963!.9K. Hlavaty, Collect. Czech. Chem. Commun.37, 4005~1972!.
Components:
~1! 1-Propanol~n-propanol, propyl alcohol,n-propyl alcoC3H8O; @71-23-8#~2! Benzene; C6H6; @71-43-2#~3! Water; H2O; @7732-18-5#
Variables:T/K5293
EComposit
t/°CT/K
~compiler!
x1
20.0 293.2 0.06
0.110
0.168
0.262
0.329
0.360
0.397
0.444
0.450
0.456
0.423
0.422
0.403
0.360
0.320
0.253
0.188
Compo
x18 x28
hydrocarbon-
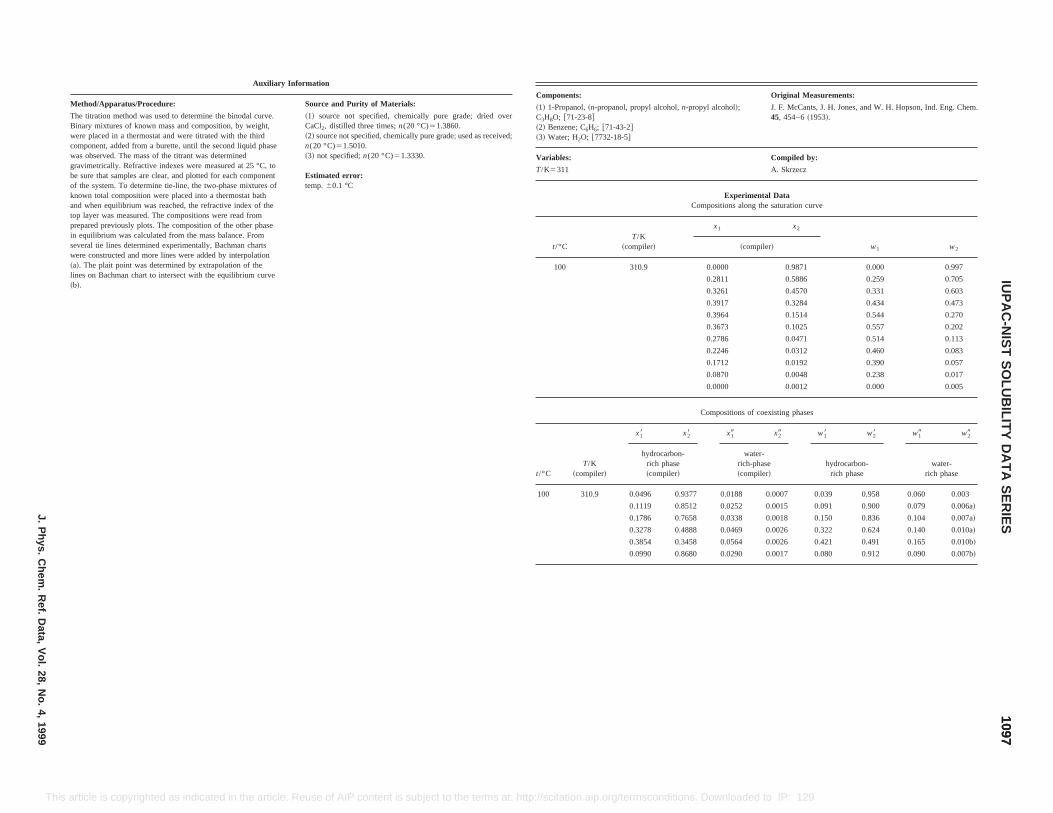
Original Measurements:
,~n-propanol, propyl alcohol,n-propyl alcohol!;-8#H6; @71-43-2#; @7732-18-5#
J. F. McCants, J. H. Jones, and W. H. Hopson, Ind. Eng. Chem.45, 454–6~1953!.
Compiled by:
A. Skrzecz
Experimental DataCompositions along the saturation curve
T/K~compiler!
x1 x2
w1 w2~compiler!
310.9 0.0000 0.9871 0.000 0.997
0.2811 0.5886 0.259 0.705
0.3261 0.4570 0.331 0.603
0.3917 0.3284 0.434 0.473
0.3964 0.1514 0.544 0.270
0.3673 0.1025 0.557 0.202
0.2786 0.0471 0.514 0.113
0.2246 0.0312 0.460 0.083
0.1712 0.0192 0.390 0.057
0.0870 0.0048 0.238 0.017
0.0000 0.0012 0.000 0.005
Compositions of coexisting phases
/Kpiler!
x18 x28 x19 x29 w18 w28 w19 w29
hydrocarbon-rich phase~compiler!
water-rich-phase~compiler!
hydrocarbon-rich phase
water-rich phase
0.9 0.0496 0.9377 0.0188 0.0007 0.039 0.958 0.060 0.003
0.1119 0.8512 0.0252 0.0015 0.091 0.900 0.079 0.006a!
0.1786 0.7658 0.0338 0.0018 0.150 0.836 0.104 0.007a!
0.3278 0.4888 0.0469 0.0026 0.322 0.624 0.140 0.010a!
0.3854 0.3458 0.0564 0.0026 0.421 0.491 0.165 0.010b!
0.0990 0.8680 0.0290 0.0017 0.080 0.912 0.090 0.007b!
10971097
IUP
AC
-NIS
TS
OLU
BILIT
YD
AT
AS
ER
IESJ.P
hys.C
hem.
Ref.
Data,
Vol.
28,N
o.4,
1999
This of AIP content is subject to the terms at: http://scitation.aip.org/termsconditions. Downloaded to IP: 129.6.105.191 On: Fri, 05 Sep 2014 17:51:55
article is copyrighted as indicated in the article. ReuseAuxiliary Information
Method/Apparatus/Procedure: Source and Purity of Materials:
The titration method was used to determine the binodal curve.Binary mixtures of known mass and composition, by weight,were placed in a thermostat and were titrated with the thirdcomponent, added from a burette, until the second liquid phasewas observed. The mass of the titrant was determinedgravimetrically. Refractive indexes were measured at 25 °C, tobe sure that samples are clear, and plotted for each componentof the system. To determine tie-line, the two-phase mixtures ofknown total composition were placed into a thermostat bathand when equilibrium was reached, the refractive index of thetop layer was measured. The compositions were read fromprepared previously plots. The composition of the other phasein equilibrium was calculated from the mass balance. Fromseveral tie lines determined experimentally, Bachman chartswere constructed and more lines were added by interpolation~a!. The plait point was determined by extrapolation of thelines on Bachman chart to intersect with the equilibrium curve~b!.
~1! source not specified, chemically pure grade; dried overCaCl2, distilled three times;n(20 °C)51.3860.~2! source not specified, chemically pure grade; used as received;n(20 °C)51.5010.~3! not specified;n(20 °C)51.3330.
Estimated error:temp.60.1 °C
Components:
~1! 1-PropanolC3H8O; @71-23~2! Benzene; C6~3! Water; H2O
Variables:
T/K5311
t/°C
100
t/°CT
~com
100 31
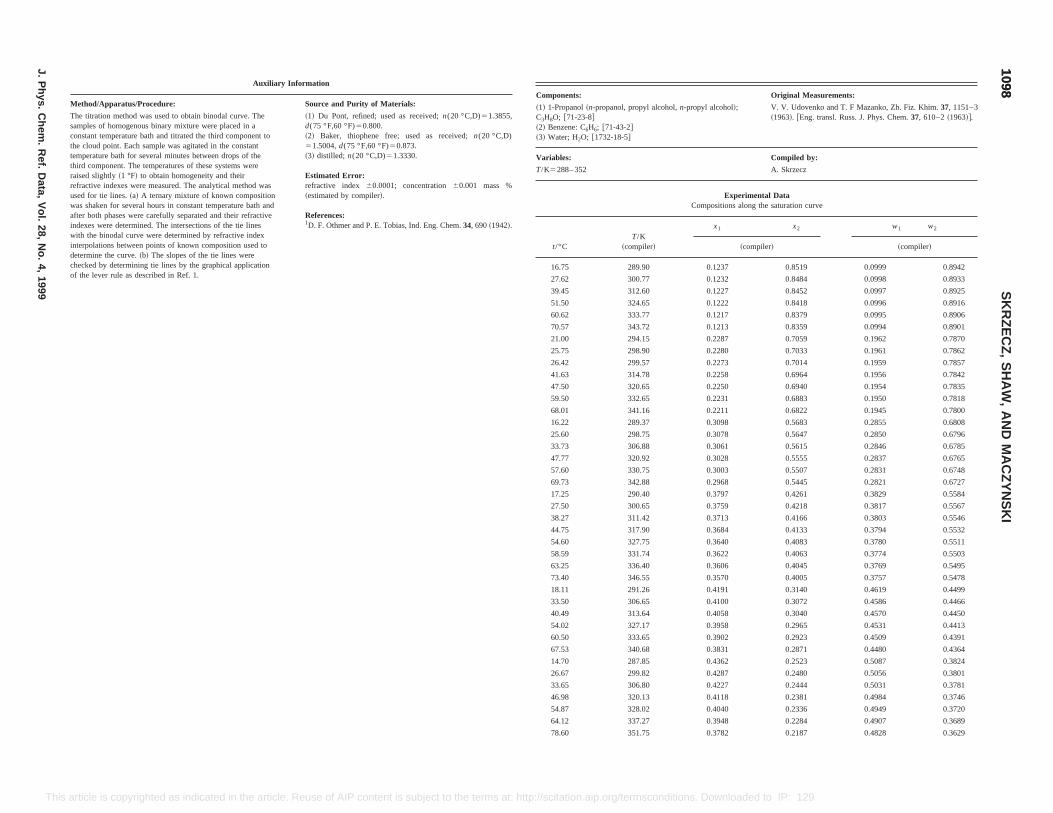
Original Measurements:
V. V. Udovenko and T. F Mazanko, Zh. Fiz. Khim.37, 1151–3~1963!. @Eng. transl. Russ. J. Phys. Chem.37, 610–2~1963!#.
Compiled by:
A. Skrzecz
ental Dataong the saturation curve
x2 w1 w2
mpiler! ~compiler!
0.8519 0.0999 0.8942
0.8484 0.0998 0.8933
0.8452 0.0997 0.8925
0.8418 0.0996 0.8916
0.8379 0.0995 0.8906
0.8359 0.0994 0.8901
0.7059 0.1962 0.7870
0.7033 0.1961 0.7862
0.7014 0.1959 0.7857
0.6964 0.1956 0.7842
0.6940 0.1954 0.7835
0.6883 0.1950 0.7818
0.6822 0.1945 0.7800
0.5683 0.2855 0.6808
0.5647 0.2850 0.6796
0.5615 0.2846 0.6785
0.5555 0.2837 0.6765
0.5507 0.2831 0.6748
0.5445 0.2821 0.6727
0.4261 0.3829 0.5584
0.4218 0.3817 0.5567
0.4166 0.3803 0.5546
44.75 317.90 0.3684 0.4133 0.3794 0.5532
54.60 327.75 0.3640 0.4083 0.3780 0.5511
58.59 331.74 0.3622 0.4063 0.3774 0.5503
63.25 336.40 0.3606 0.4045 0.3769 0.5495
73.40 346.55 0.3570 0.4005 0.3757 0.5478
18.11 291.26 0.4191 0.3140 0.4619 0.4499
33.50 306.65 0.4100 0.3072 0.4586 0.4466
40.49 313.64 0.4058 0.3040 0.4570 0.4450
54.02 327.17 0.3958 0.2965 0.4531 0.4413
60.50 333.65 0.3902 0.2923 0.4509 0.4391
67.53 340.68 0.3831 0.2871 0.4480 0.4364
14.70 287.85 0.4362 0.2523 0.5087 0.3824
26.67 299.82 0.4287 0.2480 0.5056 0.3801
33.65 306.80 0.4227 0.2444 0.5031 0.3781
46.98 320.13 0.4118 0.2381 0.4984 0.3746
54.87 328.02 0.4040 0.2336 0.4949 0.3720
64.12 337.27 0.3948 0.2284 0.4907 0.3689
78.60 351.75 0.3782 0.2187 0.4828 0.3629
10981098
SK
RZ
EC
Z,
SH
AW
,A
ND
MA
CZ
YN
SK
I
J.P
hys.C
hem.
Ref.
Data,
Vol.
28,N
o.4,
1999
This euse of AIP content is subject to the terms at: http://scitation.aip.org/termsconditions. Downloaded to IP: 129.6.105.191 On: Fri, 05 Sep 2014 17:51:55
article is copyrighted as indicated in the article. RAuxiliary Information
Method/Apparatus/Procedure: Source and Purity of Materials:
The titration method was used to obtain binodal curve. Thesamples of homogenous binary mixture were placed in aconstant temperature bath and titrated the third component tothe cloud point. Each sample was agitated in the constanttemperature bath for several minutes between drops of thethird component. The temperatures of these systems wereraised slightly~1 °F! to obtain homogeneity and theirrefractive indexes were measured. The analytical method wasused for tie lines.~a! A ternary mixture of known compositionwas shaken for several hours in constant temperature bath andafter both phases were carefully separated and their refractiveindexes were determined. The intersections of the tie lineswith the binodal curve were determined by refractive indexinterpolations between points of known composition used todetermine the curve.~b! The slopes of the tie lines werechecked by determining tie lines by the graphical applicationof the lever rule as described in Ref. 1.
~1! Du Pont, refined; used as received;n(20 °C,D)51.3855,d(75 °F,60 °F)50.800.~2! Baker, thiophene free; used as received;n(20 °C,D)51.5004,d(75 °F,60 °F)50.873.~3! distilled; n(20 °C,D)51.3330.
Estimated Error:refractive index 60.0001; concentration60.001 mass %~estimated by compiler!.
References:1D. F. Othmer and P. E. Tobias, Ind. Eng. Chem.34, 690~1942!.
Components:
~1! 1-Propanol~n-propanol, propyl alcohol,n-propyl alcohol!;C3H8O; @71-23-8#~2! Benzene: C6H6; @71-43-2#~3! Water; H2O; @1732-18-5#
Variables:
T/K5288– 352
ExperimCompositions al
t/°CT/K
~compiler!
x1
~co
16.75 289.90 0.1237
27.62 300.77 0.1232
39.45 312.60 0.1227
51.50 324.65 0.1222
60.62 333.77 0.1217
70.57 343.72 0.1213
21.00 294.15 0.2287
25.75 298.90 0.2280
26.42 299.57 0.2273
41.63 314.78 0.2258
47.50 320.65 0.2250
59.50 332.65 0.2231
68.01 341.16 0.2211
16.22 289.37 0.3098
25.60 298.75 0.3078
33.73 306.88 0.3061
47.77 320.92 0.3028
57.60 330.75 0.3003
69.73 342.88 0.2968
17.25 290.40 0.3797
27.50 300.65 0.3759
38.27 311.42 0.3713

Compositions of coexisting phases
x28 x19 x29 w18 w28 w19 w29
ydrocarbon-rich phase~compiler!
water-rich phase~compiler!
hydrocarbon-rich phase
water-rich phase
68 0.9789 0.0108 0.0002 0.0130 0.9860 0.0350 0.0010
7 0.9467 0.0214 0.0004 0.0350 0.9630 0.0680 0.0015
1 0.8611 0.0330 0.0005 0.0950 0.9000 0.1020 0.0020
9 0.7292 0.0372 0.0008 0.1800 0.8050 0.1140 0.0030
7 0.5366 0.0412 0.0009 0.3030 0.6570 0.1250 0.0035
4 0.3999 0.0448 0.0010 0.3900 0.5400 0.1350 0.0040
3 0.2916 0.0475 0.0012 0.4700 0.4300 0.1420 0.0045
9 0.1814 0.0539 0.0013 0.5480 0.3020 0.1590 0.0050
7 0.1013 0.0625 0.0019 0.5800 0.1950 0.1810 0.0070
6 0.0718 0.0744 0.0025 0.5750 0.1500 0.2100 0.0090
7 0.0593 0.0753 0.0027 0.5630 0.1300 0.2120 0.0100
9 0.0433 0.0953 0.0043 0.5400 0.1020 0.2570 0.0150
1 0.0144 0.1721 0.0144 0.3960 0.0430 0.3960 0.0430a
90 0.9866 0.0083 0.0005 0.0070 0.9920 0.0270 0.0020
9 0.9645 0.0205 0.0007 0.0210 0.9770 0.0650 0.0030
3 0.8241 0.0296 0.0010 0.1110 0.8790 0.0920 0.0040
6 0.7039 0.0334 0.0012 0.1920 0.7890 0.1030 0.0050
9 0.5382 0.0370 0.0015 0.2990 0.6600 0.1130 0.0060
5 0.4073 0.0413 0.0018 0.3810 0.5490 0.1250 0.0070
2 0.2721 0.0435 0.0020 0.4790 0.4110 0.1310 0.0080
0 0.1602 0.0510 0.0023 0.5480 0.2790 0.1510 0.0090
6 0.0839 0.0619 0.0029 0.5640 0.1720 0.1790 0.0110
0 0.0538 0.0786 0.0041 0.5400 0.1230 0.2190 0.0150
4 0.0317 0.1118 0.0074 0.4850 0.0820 0.2900 0.0250
3 0.0148 0.1623 0.0148 0.3790 0.0450 0.3790 0.0450a
53 0.9453 0.0092 0.0002 0.0200 0.9730 0.0300 0.0010
2 0.9104 0.0140 0.0005 0.0450 0.9470 0.0450 0.0020
2 0.7864 0.0238 0.0010 0.1230 0.8600 0.0750 0.0040
0 0.6684 0.0285 0.0010 0.2090 0.7660 0.0890 0.0040
5 0.5379 0.0324 0.0012 0.2920 0.6640 0.1000 0.0050
2 0.3928 0.0388 0.0020 0.3820 0.5400 0.1180 0.0080
59 0.3070 0.0436 0.0023 0.4400 0.4550 0.1310 0.0090
02 0.1818 0.0514 0.0026 0.5170 0.3130 0.1520 0.0100
82 0.1019 0.0653 0.0035 0.5490 0.2030 0.1870 0.0130
94 0.0842 0.0707 0.0041 0.5460 0.1760 0.2000 0.0150
98 0.0581 0.0780 0.0050 0.5280 0.1330 0.2170 0.0180
15 0.0327 0.1035 0.0082 0.4680 0.0860 0.2720 0.0280
81 0.0168 0.1581 0.0168 0.3700 0.0510 0.3700 0.0510a
10991099
IUP
AC
-NIS
TS
OLU
BILIT
YD
AT
AS
ER
IESJ.P
hys.C
hem.
Ref.
Data,
Vol.
28,N
o.4,
1999
Th sconditions. Downloaded to IP: 129.6.105.191 On: Fri, 05 Sep 2014 17:51:55
70.15 343.30 0.2190 0.0339 0.4497 0.0904
18.45 291.60 0.2993 0.0390 0.5458 0.0924
28.80 301.95 0.2984 0.0419 0.5419 0.0989
37.67 310.82 0.2975 0.0447 0.5381 0.1052
48.20 321.35 0.2963 0.0487 0.5330 0.1138
61.25 334.40 0.2943 0.0549 0.5249 0.1272
69.28 342.43 0.2927 0.0603 0.5180 0.1387
0.38
0.39
0.35
0.33
0.29
0.23
0.15
aCritical point of solubility.
is article is copyrighted as indicated in the article. Reuse of AIP content is subject to the terms at: http://scitation.aip.org/term
19.12 292.27 0.4364 0.1828 0.5537 0.3015
23.38 296.53 0.4325 0.1811 0.5518 0.3004
30.27 303.42 0.4255 0.1782 0.5484 0.2985
45.63 318.78 0.4104 0.1718 0.5407 0.2943
55.58 328.73 0.2962 0.1241 0.4692 0.2555
63.95 337.10 0.3889 0.1629 0.5291 0.2881
76.25 349.40 0.3746 0.1569 0.5210 0.2837
18.90 292.05 0.4134 0.1150 0.5870 0.2122
32.78 305.93 0.3958 0.1101 0.5761 0.2083
46.35 319.50 0.3784 0.1052 0.5648 0.2041
53.83 326.98 0.3665 0.1019 0.5567 0.2012
61.87 335.02 0.3548 0.0986 0.5485 0.1982
71.60 344.75 0.3357 0.0934 0.5344 0.1932
20.00 293.15 0.3571 0.0696 0.5765 0.1461
37.75 310.90 0.3316 0.0647 0.5558 0.1409
50.49 323.64 0.3083 0.0601 0.5355 0.1357
63.00 336.15 0.2822 0.0550 0.5108 0.1295
69.09 342.24 0.2662 0.0519 0.4947 0.1254
28.38 301.53 0.0724 0.0019 0.2055 0.0070
41.88 315.03 0.0724 0.0025 0.2050 0.0092
48.35 321.50 0.0723 0.0030 0.2046 0.0109
65.52 338.67 0.0723 0.0038 0.2040 0.0141
73.32 346.47 0.0722 0.0046 0.2034 0.0170
20.25 293.40 0.1131 0.0051 0.2945 0.0174
33.23 306.38 0.1130 0.0062 0.2935 0.0208
41.00 314.15 0.1129 0.0070 0.2927 0.0235
56.45 329.60 0.1127 0.0086 0.2911 0.0288
67.95 341.10 0.1125 0.0102 0.2895 0.0340
21.08 294.23 0.1668 0.0121 0.3891 0.0367
32.35 305.50 0.1666 0.0135 0.3875 0.0407
46.12 319.27 0.1662 0.0154 0.3851 0.0465
53.61 326.76 0.1660 0.0164 0.3839 0.0494
65.40 338.55 0.1656 0.0193 0.3806 0.0577
73.81 346.96 0.1653 0.0210 0.3786 0.0626
18.12 291.27 0.2217 0.0217 0.4651 0.0592
23.50 296.65 0.2216 0.0225 0.4641 0.0612
35.48 308.63 0.2212 0.0245 0.4616 0.0664
50.71 323.86 0.2204 0.0277 0.4574 0.0748
62.30 335.45 0.2197 0.0310 0.4533 0.0832
t/°CT/K
~compiler!
x18
h
30 303.2 0.01
0.044
0.118
0.211
0.321
0.375
0.414
0.427
0.391
0.357
0.333
0.297
0.172
45 318.2 0.00
0.026
0.135
0.222
0.316
0.367
0.412
0.409
0.357
0.307
0.243
0.162
60 333.2 0.02
0.056
0.146
0.237
0.307
0.361
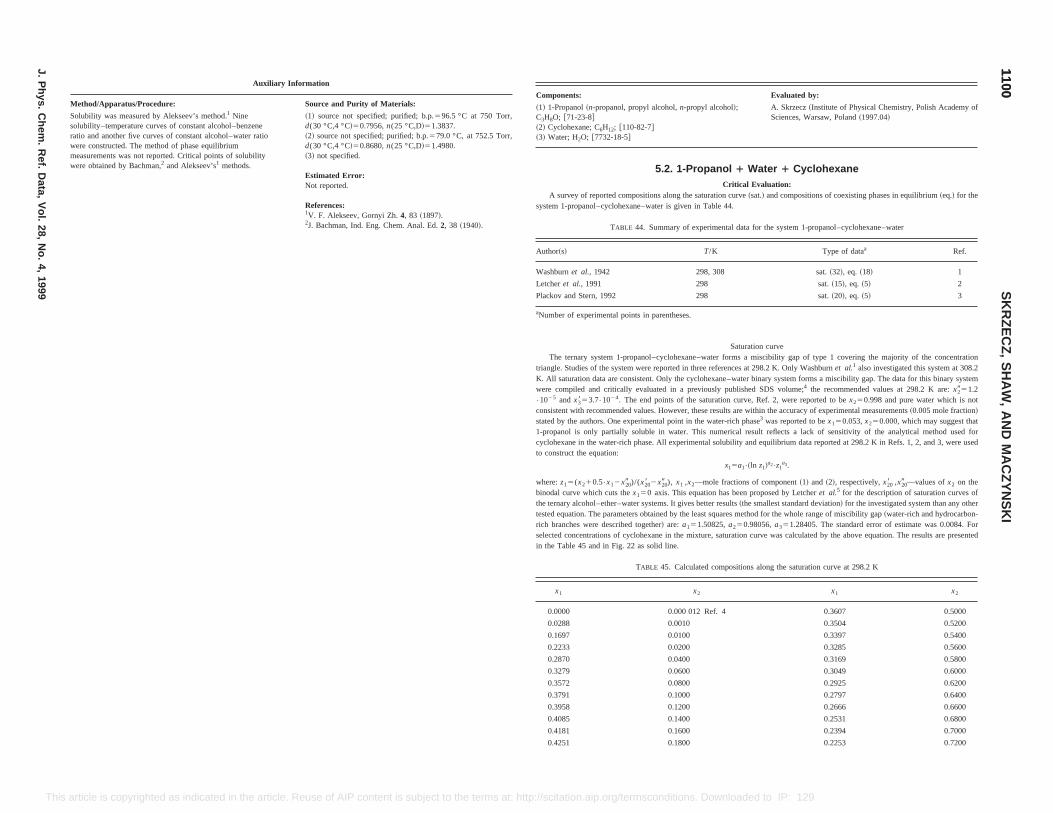
Evaluated by:
A. Skrzecz~Institute of Physical Chemistry, Polish Academy ofSciences, Warsaw, Poland~1997.04!
ter 1 Cyclohexaneluation:and compositions of coexisting phases in equilibrium~eq.! for the
for the system 1-propanol–cyclohexane–water
Type of dataa Ref.
sat.~32!, eq. ~18! 1
sat.~15!, eq. ~5! 2
sat.~20!, eq. ~5! 3
n curvea miscibility gap of type 1 covering the majority of the concentrationat 298.2 K. Only Washburnet al.1 also investigated this system at 308.2r binary system forms a miscibility gap. The data for this binary system
ed SDS volume;4 the recommended values at 298.2 K are:x2951.2, Ref. 2, were reported to bex250.998 and pure water which is not
within the accuracy of experimental measurements~0.005 mole fraction!hasewas reported to bex150.053,x250.000, which may suggest thatsult reflects a lack of sensitivity of the analytical method used fornd equilibrium data reported at 298.2 K in Refs. 1, 2, and 3, were used
1!a2•z1
a3.
component~1! and ~2!, respectively,x208 ,x209 —values ofx2 on theroposed by Letcheret al.5 for the description of saturation curves ofallest standard deviation! for the investigated system than any otherethod for the whole range of miscibility gap~water-rich and hydrocarbon-
56,a351.28405. The standard error of estimate was 0.0084. Forselected concentrations of cyclohexane in the mixture, saturation curve was calculated by the above equation. The results are presentedin the Table 45 and in Fig. 22 as solid line.
TABLE 45. Calculated compositions along the saturation curve at 298.2 K
x1 x2 x1 x2
0.0000 0.000 012 Ref. 4 0.3607 0.5000
0.0288 0.0010 0.3504 0.5200
0.1697 0.0100 0.3397 0.5400
0.2233 0.0200 0.3285 0.5600
0.2870 0.0400 0.3169 0.5800
0.3279 0.0600 0.3049 0.6000
0.3572 0.0800 0.2925 0.6200
0.3791 0.1000 0.2797 0.6400
0.3958 0.1200 0.2666 0.6600
0.4085 0.1400 0.2531 0.6800
0.4181 0.1600 0.2394 0.7000
0.4251 0.1800 0.2253 0.7200
11001100
SK
RZ
EC
Z,
SH
AW
,A
ND
MA
CZ
YN
SK
I
J.P
hys.C
hem.
Ref.
Data,
Vol.
28,N
o.4,
1999
This article. Reuse of AIP content is subject to the terms at: http://scitation.aip.org/termsconditions. Downloaded to IP: 129.6.105.191 On: Fri, 05 Sep 2014 17:51:55
article is copyrighted as indicated in theAuxiliary Information
Method/Apparatus/Procedure: Source and Purity of Materials:
Solubility was measured by Alekseev’s method.1 Ninesolubility–temperature curves of constant alcohol–benzeneratio and another five curves of constant alcohol–water ratiowere constructed. The method of phase equilibriummeasurements was not reported. Critical points of solubilitywere obtained by Bachman,2 and Alekseev’s1 methods.
~1! source not specified; purified; b.p.596.5 °C at 750 Torr,d(30 °C,4 °C!50.7956,n(25 °C,D!51.3837.~2! source not specified; purified; b.p.579.0 °C, at 752.5 Torr,d(30 °C,4 °C!50.8680,n(25 °C,D!51.4980.~3! not specified.
Estimated Error:Not reported.
References:1V. F. Alekseev, Gornyi Zh.4, 83 ~1897!.2J. Bachman, Ind. Eng. Chem. Anal. Ed.2, 38 ~1940!.
Components:
~1! 1-Propanol~n-propanol, propyl alcohol,n-propyl alcohol!;C3H8O; @71-23-8#~2! Cyclohexane; C6H12; @110-82-7#~3! Water; H2O; @7732-18-5#
5.2. 1-Propanol 1 WaCritical Eva
A survey of reported compositions along the saturation curve~sat.!system 1-propanol–cyclohexane–water is given in Table 44.
TABLE 44. Summary of experimental data
Author~s! T/K
Washburnet al., 1942 298, 308
Letcheret al., 1991 298
Plackov and Stern, 1992 298
aNumber of experimental points in parentheses.
SaturatioThe ternary system 1-propanol–cyclohexane–water forms
triangle. Studies of the system were reported in three referencesK. All saturation data are consistent. Only the cyclohexane–watewere compiled and critically evaluated in a previously publish•1025 and x3853.7•1024. The end points of the saturation curveconsistent with recommended values. However, these results arestated by the authors. One experimental point in the water-rich p3
1-propanol is only partially soluble in water. This numerical recyclohexane in the water-rich phase. All experimental solubility ato construct the equation:
x15a1•~ln z
where:z15(x210.5•x12x209 )/(x208 2x209 ), x1 ,x2—mole fractions ofbinodal curve which cuts thex150 axis. This equation has been pthe ternary alcohol–ether–water systems. It gives better results~the smtested equation. The parameters obtained by the least squares mrich branches were described together! are: a151.50825,a250.980
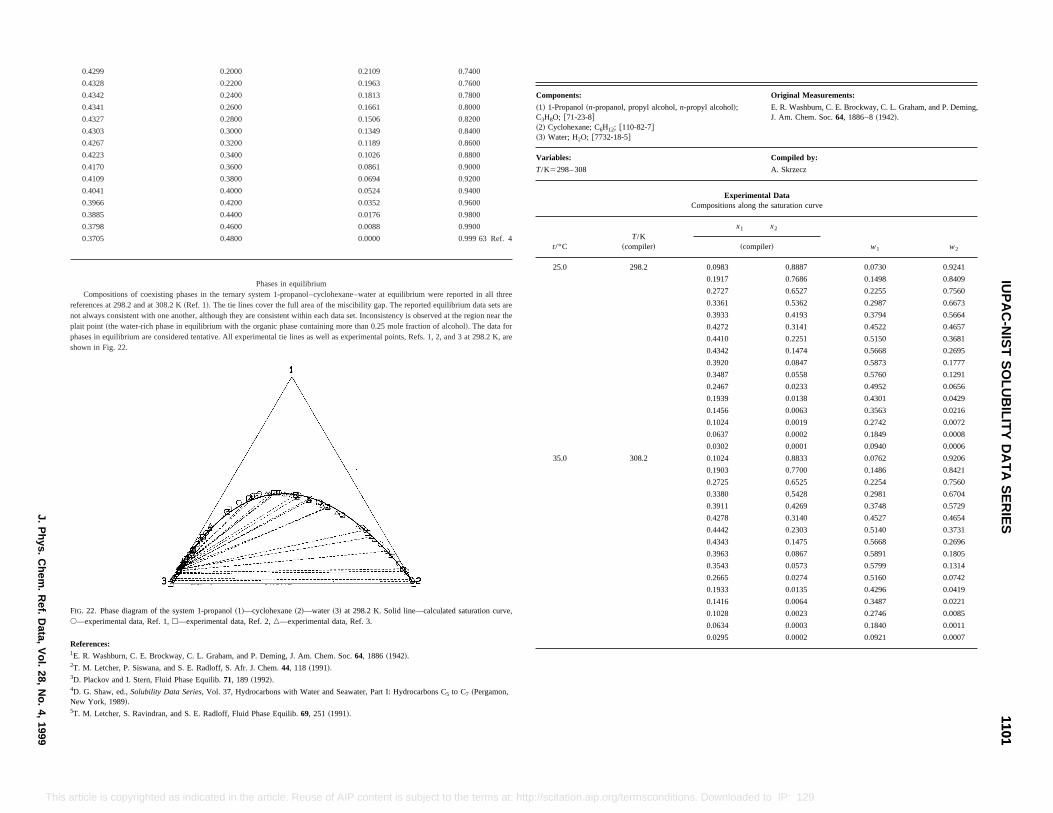
Original Measurements:
propyl alcohol!; E. R. Washburn, C. E. Brockway, C. L. Graham, and P. Deming,J. Am. Chem. Soc.64, 1886–8~1942!.
Compiled by:
A. Skrzecz
Experimental DataCompositions along the saturation curve
x1 x2
w1 w2~compiler!
0.0983 0.8887 0.0730 0.9241
0.1917 0.7686 0.1498 0.8409
0.2727 0.6527 0.2255 0.7560
0.3361 0.5362 0.2987 0.6673
0.3933 0.4193 0.3794 0.5664
0.4272 0.3141 0.4522 0.4657
0.4410 0.2251 0.5150 0.3681
0.4342 0.1474 0.5668 0.2695
0.3920 0.0847 0.5873 0.1777
0.3487 0.0558 0.5760 0.1291
0.2467 0.0233 0.4952 0.0656
0.1939 0.0138 0.4301 0.0429
0.1456 0.0063 0.3563 0.0216
0.1024 0.0019 0.2742 0.0072
0.0637 0.0002 0.1849 0.0008
0.0302 0.0001 0.0940 0.0006
0.1024 0.8833 0.0762 0.9206
0.1903 0.7700 0.1486 0.8421
0.2725 0.6525 0.2254 0.7560
0.3380 0.5428 0.2981 0.6704
0.3911 0.4269 0.3748 0.5729
0.4278 0.3140 0.4527 0.4654
0.2303 0.5140 0.3731
0.1475 0.5668 0.2696
0.0867 0.5891 0.1805
0.0573 0.5799 0.1314
0.0274 0.5160 0.0742
0.0135 0.4296 0.0419
0.0064 0.3487 0.0221
0.0023 0.2746 0.0085
0.0003 0.1840 0.0011
0.0002 0.0921 0.0007
11011101
IUP
AC
-NIS
TS
OLU
BILIT
YD
AT
AS
ER
IESJ.P
hys.C
hem.
Ref.
Data,
Vol.
28,N
o.4,
1999
Thi oaded to IP: 129.6.105.191 On: Fri, 05 Sep 2014 17:51:55
FIG. 22. Phase diagram of the system 1-propanol~1!—cyclohexane~2!—water ~3! at 298.2 K. Solid line—calculated saturation curve,s—experimental data, Ref. 1,h—experimental data, Ref. 2,n—experimental data, Ref. 3.
References:1E. R. Washburn, C. E. Brockway, C. L. Graham, and P. Deming, J. Am. Chem. Soc.64, 1886~1942!.2T. M. Letcher, P. Siswana, and S. E. Radloff, S. Afr. J. Chem.44, 118 ~1991!.3D. Plackov and I. Stern, Fluid Phase Equilib.71, 189 ~1992!.4D. G. Shaw, ed.,Solubility Data Series, Vol. 37, Hydrocarbons with Water and Seawater, Part I: Hydrocarbons C5 to C7 ~Pergamon,New York, 1989!.5T. M. Letcher, S. Ravindran, and S. E. Radloff, Fluid Phase Equilib.69, 251 ~1991!.
0.4442
0.4343
0.3963
0.3543
0.2665
0.1933
0.1416
0.1028
0.0634
0.0295
s article is copyrighted as indicated in the article. Reuse of AIP content is subject to the terms at: http://scitation.aip.org/termsconditions. Downl
0.4299 0.2000 0.2109 0.7400
0.4328 0.2200 0.1963 0.7600
0.4342 0.2400 0.1813 0.7800
0.4341 0.2600 0.1661 0.8000
0.4327 0.2800 0.1506 0.8200
0.4303 0.3000 0.1349 0.8400
0.4267 0.3200 0.1189 0.8600
0.4223 0.3400 0.1026 0.8800
0.4170 0.3600 0.0861 0.9000
0.4109 0.3800 0.0694 0.9200
0.4041 0.4000 0.0524 0.9400
0.3966 0.4200 0.0352 0.9600
0.3885 0.4400 0.0176 0.9800
0.3798 0.4600 0.0088 0.9900
0.3705 0.4800 0.0000 0.999 63 Ref. 4
Phases in equilibriumCompositions of coexisting phases in the ternary system 1-propanol–cyclohexane–water at equilibrium were reported in all three
references at 298.2 and at 308.2 K~Ref. 1!. The tie lines cover the full area of the miscibility gap. The reported equilibrium data sets arenot always consistent with one another, although they are consistent within each data set. Inconsistency is observed at the region near theplait point ~the water-rich phase in equilibrium with the organic phase containing more than 0.25 mole fraction of alcohol!. The data forphases in equilibrium are considered tentative. All experimental tie lines as well as experimental points, Refs. 1, 2, and 3 at 298.2 K, areshown in Fig. 22.
Components:
~1! 1-Propanol~n-propanol, propyl alcohol,n-C3H8O; @71-23-8#~2! Cyclohexane; C6H12; @110-82-7#~3! Water; H2O; @7732-18-5#
Variables:
T/K5298– 308
t/°CT/K
~compiler!
25.0 298.2
35.0 308.2
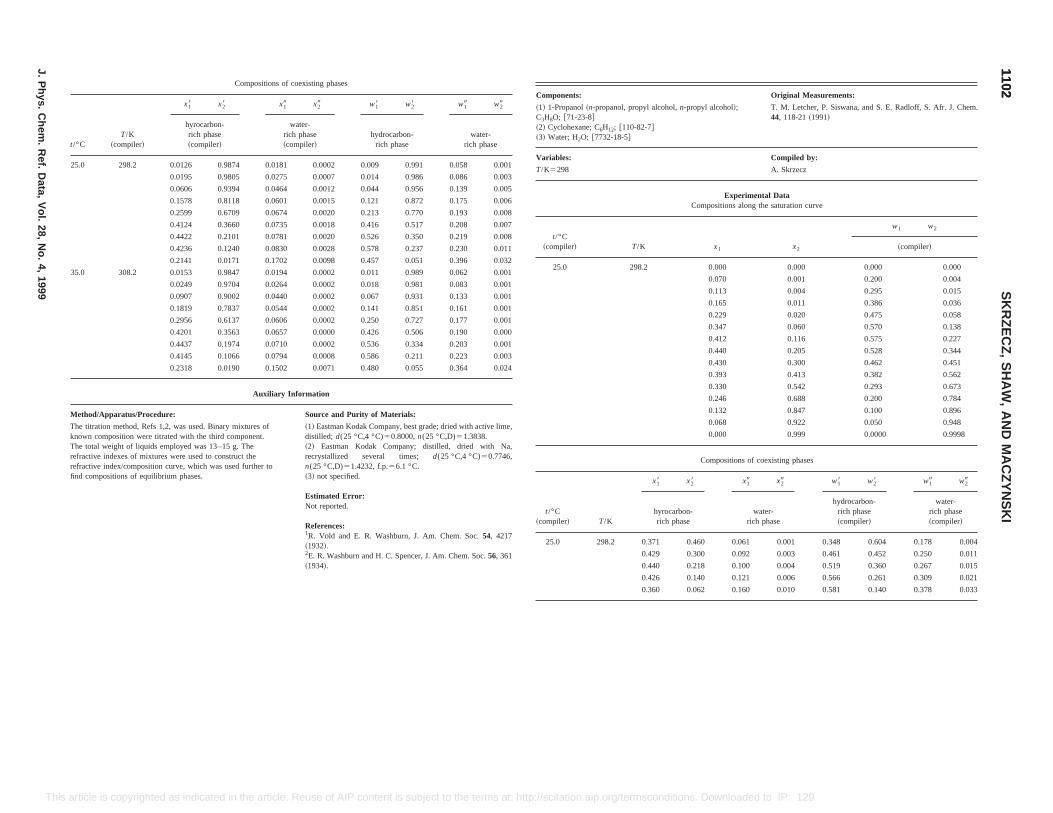
Original Measurements:
ol, propyl alcohol,n-propyl alcohol!;
@110-82-7#8-5#
T. M. Letcher, P. Siswana, and S. E. Radloff, S. Afr. J. Chem.44, 118-21~1991!
Compiled by:
A. Skrzecz
Experimental DataCompositions along the saturation curve
T/K x1 x2
w1 w2
~compiler!
298.2 0.000 0.000 0.000 0.000
0.070 0.001 0.200 0.004
0.113 0.004 0.295 0.015
0.165 0.011 0.386 0.036
0.229 0.020 0.475 0.058
0.347 0.060 0.570 0.138
0.412 0.116 0.575 0.227
0.440 0.205 0.528 0.344
0.430 0.300 0.462 0.451
0.393 0.413 0.382 0.562
0.330 0.542 0.293 0.673
0.246 0.688 0.200 0.784
0.132 0.847 0.100 0.896
0.068 0.922 0.050 0.948
0.000 0.999 0.0000 0.9998
Compositions of coexisting phases
x18 x28 x19 x29 w18 w28 w19 w29
hyrocarbon-rich phase
water-rich phase
hydrocarbon-rich phase~compiler!
water-rich phase~compiler!
298.2 0.371 0.460 0.061 0.001 0.348 0.604 0.178 0.004
0.429 0.300 0.092 0.003 0.461 0.452 0.250 0.011
0.440 0.218 0.100 0.004 0.519 0.360 0.267 0.015
0.426 0.140 0.121 0.006 0.566 0.261 0.309 0.021
0.360 0.062 0.160 0.010 0.581 0.140 0.378 0.033
11021102
SK
RZ
EC
Z,
SH
AW
,A
ND
MA
CZ
YN
SK
I
J.P
hys.C
hem.
Ref.
Data,
Vol.
28,N
o.4,
1999
This aip.org/termsconditions. Downloaded to IP: 129.6.105.191 On: Fri, 05 Sep 2014 17:51:55
1R. Vold and E. R. Washburn, J. Am. Chem. Soc.54, 4217~1932!.2E. R. Washburn and H. C. Spencer, J. Am. Chem. Soc.56, 361~1934!.
25.0
article is copyrighted as indicated in the article. Reuse of AIP content is subject to the terms at: http://scitation.
Compositions of coexisting phases
t/°CT/K
~compiler!
x18 x28 x19 x29 w18 w28 w19 w29
hyrocarbon-rich phase~compiler!
water-rich phase~compiler!
hydrocarbon-rich phase
water-rich phase
25.0 298.2 0.0126 0.9874 0.0181 0.0002 0.009 0.991 0.058 0.001
0.0195 0.9805 0.0275 0.0007 0.014 0.986 0.086 0.003
0.0606 0.9394 0.0464 0.0012 0.044 0.956 0.139 0.005
0.1578 0.8118 0.0601 0.0015 0.121 0.872 0.175 0.006
0.2599 0.6709 0.0674 0.0020 0.213 0.770 0.193 0.008
0.4124 0.3660 0.0735 0.0018 0.416 0.517 0.208 0.007
0.4422 0.2101 0.0781 0.0020 0.526 0.350 0.219 0.008
0.4236 0.1240 0.0830 0.0028 0.578 0.237 0.230 0.011
0.2141 0.0171 0.1702 0.0098 0.457 0.051 0.396 0.032
35.0 308.2 0.0153 0.9847 0.0194 0.0002 0.011 0.989 0.062 0.001
0.0249 0.9704 0.0264 0.0002 0.018 0.981 0.083 0.001
0.0907 0.9002 0.0440 0.0002 0.067 0.931 0.133 0.001
0.1819 0.7837 0.0544 0.0002 0.141 0.851 0.161 0.001
0.2956 0.6137 0.0606 0.0002 0.250 0.727 0.177 0.001
0.4201 0.3563 0.0657 0.0000 0.426 0.506 0.190 0.000
0.4437 0.1974 0.0710 0.0002 0.536 0.334 0.203 0.001
0.4145 0.1066 0.0794 0.0008 0.586 0.211 0.223 0.003
0.2318 0.0190 0.1502 0.0071 0.480 0.055 0.364 0.024
Auxiliary Information
Method/Apparatus/Procedure: Source and Purity of Materials:
The titration method, Refs 1,2, was used. Binary mixtures ofknown composition were titrated with the third component.The total weight of liquids employed was 13–15 g. Therefractive indexes of mixtures were used to construct therefractive index/composition curve, which was used further tofind compositions of equilibrium phases.
~1! Eastman Kodak Company, best grade; dried with active lime,distilled; d(25 °C,4 °C)50.8000,n(25 °C,D)51.3838.~2! Eastman Kodak Company; distilled, dried with Na,recrystallized several times; d(25 °C,4 °C)50.7746,n(25 °C,D)51.4232, f.p.56.1 °C.~3! not specified.
Estimated Error:Not reported.
References:
Components:
~1! 1-Propanol~n-propanC3H8O; @71-23-8#~2! Cyclohexane; C6H12;~3! Water; H2O; @7732-1
Variables:
T/K5298
t/°C~compiler!
25.0
t/°C~compiler! T/K
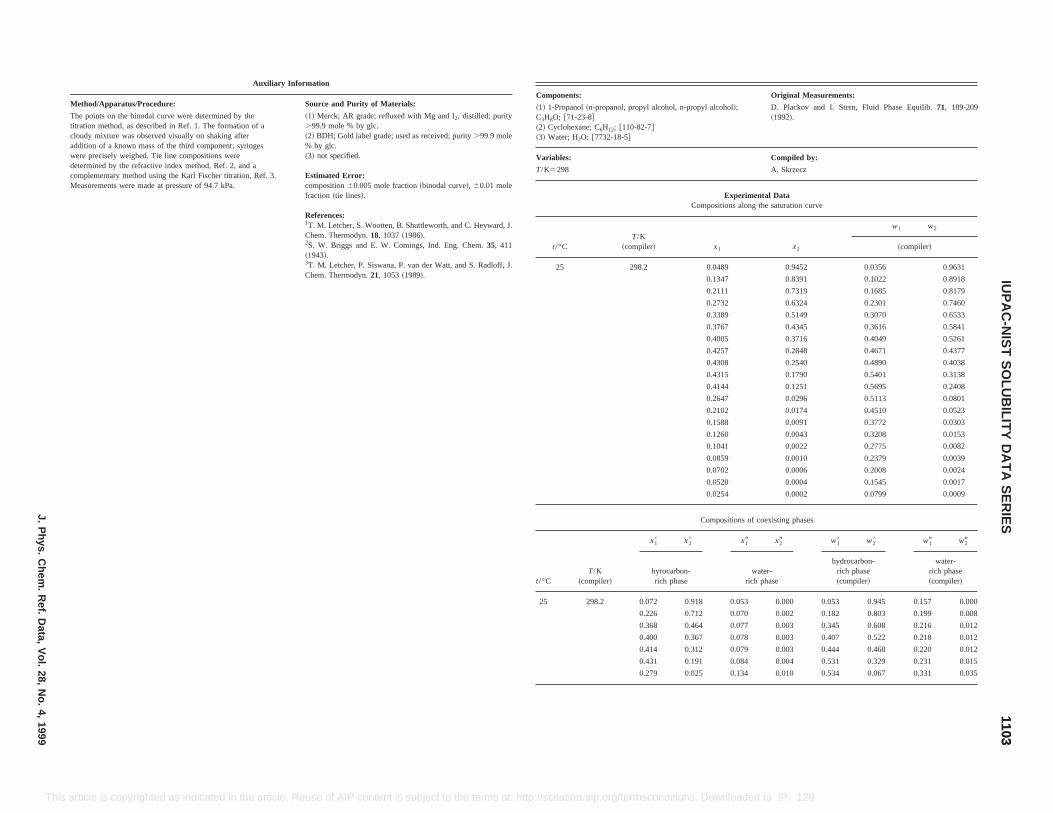
Original Measurements:
yl alcohol!; D. Plackov and I. Stern, Fluid Phase Equilib.71, 189-209~1992!.
Compiled by:
A. Skrzecz
Experimental Datapositions along the saturation curve
x1 x2
w1 w2
~compiler!
0.0489 0.9452 0.0356 0.9631
0.1347 0.8391 0.1022 0.8918
0.2111 0.7319 0.1685 0.8179
0.2732 0.6324 0.2301 0.7460
0.3389 0.5149 0.3070 0.6533
0.3767 0.4345 0.3616 0.5841
0.4005 0.3716 0.4049 0.5261
0.4257 0.2848 0.4671 0.4377
0.4308 0.2540 0.4890 0.4038
0.4315 0.1790 0.5401 0.3138
0.4144 0.1251 0.5695 0.2408
0.2647 0.0296 0.5113 0.0801
0.2102 0.0174 0.4510 0.0523
0.1588 0.0091 0.3772 0.0303
0.1260 0.0043 0.3208 0.0153
0.1041 0.0022 0.2775 0.0082
0.0859 0.0010 0.2379 0.0039
0.0702 0.0006 0.2008 0.0024
0.0520 0.0004 0.1545 0.0017
0.0254 0.0002 0.0799 0.0009
ompositions of coexisting phases
t/°CT/K
~compiler!
x18 x28 x19 x29 w18 w28 w19 w29
hyrocarbon-rich phase
water-rich phase
hydrocarbon-rich phase~compiler!
water-rich phase~compiler!
25 298.2 0.072 0.918 0.053 0.000 0.053 0.945 0.157 0.000
0.226 0.712 0.070 0.002 0.182 0.803 0.199 0.008
0.368 0.464 0.077 0.003 0.345 0.608 0.216 0.012
0.400 0.367 0.078 0.003 0.407 0.522 0.218 0.012
0.414 0.312 0.079 0.003 0.444 0.468 0.220 0.012
0.431 0.191 0.084 0.004 0.531 0.329 0.231 0.015
0.279 0.025 0.134 0.010 0.534 0.067 0.331 0.035
11031103
IUP
AC
-NIS
TS
OLU
BILIT
YD
AT
AS
ER
IESJ.P
hys.C
hem.
Ref.
Data,
Vol.
28,N
o.4,
1999
This Reuse of AIP content is subject to the terms at: http://scitation.aip.org/termsconditions. Downloaded to IP: 129.6.105.191 On: Fri, 05 Sep 2014 17:51:55
article is copyrighted as indicated in the article.Auxiliary Information
Method/Apparatus/Procedure: Source and Purity of Materials:
The points on the binodal curve were determined by thetitration method, as described in Ref. 1. The formation of acloudy mixture was observed visually on shaking afteraddition of a known mass of the third component; syringeswere precisely weighed. Tie line compositions weredetermined by the refractive index method, Ref. 2, and acomplementary method using the Karl Fischer titration, Ref. 3.Measurements were made at pressure of 94.7 kPa.
~1! Merck; AR grade; refluxed with Mg and I2, distilled; purity.99.9 mole % by glc.~2! BDH; Gold label grade; used as received; purity.99.9 mole% by glc.~3! not specified.
Estimated Error:composition60.005 mole fraction~binodal curve!, 60.01 molefraction ~tie lines!.
References:1T. M. Letcher, S. Wootten, B. Shuttleworth, and C. Heyward, J.Chem. Thermodyn.18, 1037~1986!.2S. W. Briggs and E. W. Comings, Ind. Eng. Chem.35, 411~1943!.3T. M. Letcher, P. Siswana, P. van der Watt, and S. Radloff, J.Chem. Thermodyn.21, 1053~1989!.
Components:
~1! 1-Propanol~n-propanol, propyl alcohol,n-propC3H8O; @71-23-8#~2! Cyclohexane; C6H12; @110-82-7#~3! Water; H2O; @7732-18-5#
Variables:
T/K5298
Com
t/°CT/K
~compiler!
25 298.2
C
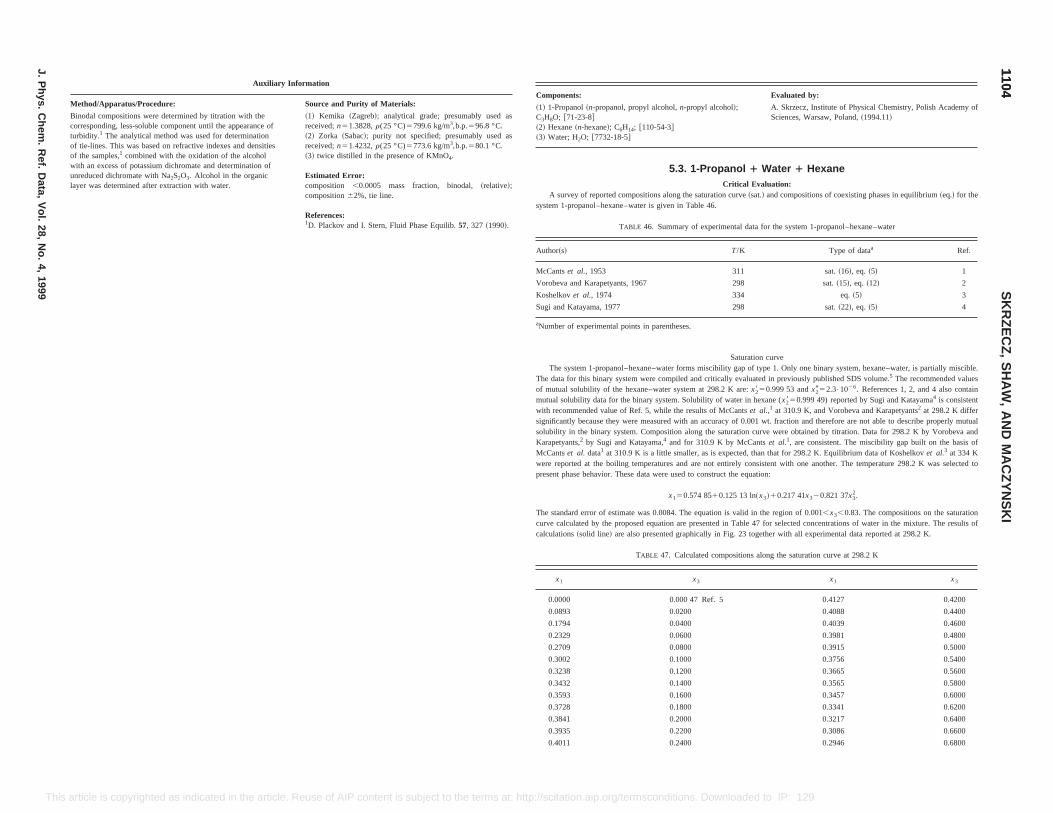
Evaluated by:
A. Skrzecz, Institute of Physical Chemistry, Polish Academy ofSciences, Warsaw, Poland,~1994.11!
ater 1 Hexaneuation:and compositions of coexisting phases in equilibrium~eq.! for the
for the system 1-propanol–hexane–water
Type of dataa Ref.
sat.~16!, eq. ~5! 1
sat.~15!, eq. ~12! 2
eq.~5! 3
sat.~22!, eq. ~5! 4
curvef type 1. Only one binary system, hexane–water, is partially miscible.ated in previously published SDS volume.5 The recommended values
0.999 53 andx2952.3•1026. References 1, 2, and 4 also containhexane (x2850.999 49) reported by Sugi and Katayama4 is consistent.,1 at 310.9 K, and Vorobeva and Karapetyants2 at 298.2 K differ.001 wt. fraction and therefore are not able to describe properly mutualcurve were obtained by titration. Data for 298.2 K by Vorobeva and
tset al.1, are consistent. The miscibility gap built on the basis ofhan that for 298.2 K. Equilibrium data of Koshelkovet al.3 at 334 Konsistent with one another. The temperature 298.2 K was selected toequation:
!10.217 41x320.821 37x32.
in the region of 0.001,x3,0.83. The compositions on the saturationle 47 for selected concentrations of water in the mixture. The results of
calculations~solid line! are also presented graphically in Fig. 23 together with all experimental data reported at 298.2 K.
TABLE 47. Calculated compositions along the saturation curve at 298.2 K
x1 x3 x1 x3
0.0000 0.000 47 Ref. 5 0.4127 0.4200
0.0893 0.0200 0.4088 0.4400
0.1794 0.0400 0.4039 0.4600
0.2329 0.0600 0.3981 0.4800
0.2709 0.0800 0.3915 0.5000
0.3002 0.1000 0.3756 0.5400
0.3238 0.1200 0.3665 0.5600
0.3432 0.1400 0.3565 0.5800
0.3593 0.1600 0.3457 0.6000
0.3728 0.1800 0.3341 0.6200
0.3841 0.2000 0.3217 0.6400
0.3935 0.2200 0.3086 0.6600
0.4011 0.2400 0.2946 0.6800
11041104
SK
RZ
EC
Z,
SH
AW
,A
ND
MA
CZ
YN
SK
I
J.P
hys.C
hem.
Ref.
Data,
Vol.
28,N
o.4,
1999
This he article. Reuse of AIP content is subject to the terms at: http://scitation.aip.org/termsconditions. Downloaded to IP: 129.6.105.191 On: Fri, 05 Sep 2014 17:51:55
article is copyrighted as indicated in tAuxiliary Information
Method/Apparatus/Procedure: Source and Purity of Materials:
Binodal compositions were determined by titration with thecorresponding, less-soluble component until the appearance ofturbidity.1 The analytical method was used for determinationof tie-lines. This was based on refractive indexes and densitiesof the samples,1 combined with the oxidation of the alcoholwith an excess of potassium dichromate and determination ofunreduced dichromate with Na2S2O3. Alcohol in the organiclayer was determined after extraction with water.
~1! Kemika ~Zagreb!; analytical grade; presumably used asreceived;n51.3828,r(25 °C)5799.6 kg/m3,b.p.596.8 °C.~2! Zorka ~Sabac!; purity not specified; presumably used asreceived;n51.4232,r(25 °C)5773.6 kg/m3,b.p.580.1 °C.~3! twice distilled in the presence of KMnO4.
Estimated Error:composition ,0.0005 mass fraction, binodal,~relative!;composition62%, tie line.
References:1D. Plackov and I. Stern, Fluid Phase Equilib.57, 327 ~1990!.
Components:
~1! 1-Propanol~n-propanol, propyl alcohol,n-propyl alcohol!;C3H8O; @71-23-8#~2! Hexane~n-hexane!; C6H14; @110-54-3#~3! Water; H2O; @7732-18-5#
5.3. 1-Propanol 1 WCritical Eval
A survey of reported compositions along the saturation curve~sat.!system 1-propanol–hexane–water is given in Table 46.
TABLE 46. Summary of experimental data
Author~s! T/K
McCantset al., 1953 311
Vorobeva and Karapetyants, 1967 298
Koshelkovet al., 1974 334
Sugi and Katayama, 1977 298
aNumber of experimental points in parentheses.
SaturationThe system 1-propanol–hexane–water forms miscibility gap o
The data for this binary system were compiled and critically evaluof mutual solubility of the hexane–water system at 298.2 K are:x285
mutual solubility data for the binary system. Solubility of water inwith recommended value of Ref. 5, while the results of McCantset alsignificantly because they were measured with an accuracy of 0solubility in the binary system. Composition along the saturationKarapetyants,2 by Sugi and Katayama,4 and for 310.9 K by McCanMcCantset al. data1 at 310.9 K is a little smaller, as is expected, twere reported at the boiling temperatures and are not entirely cpresent phase behavior. These data were used to construct the
x150.574 8510.125 13 ln~x3
The standard error of estimate was 0.0084. The equation is validcurve calculated by the proposed equation are presented in Tab
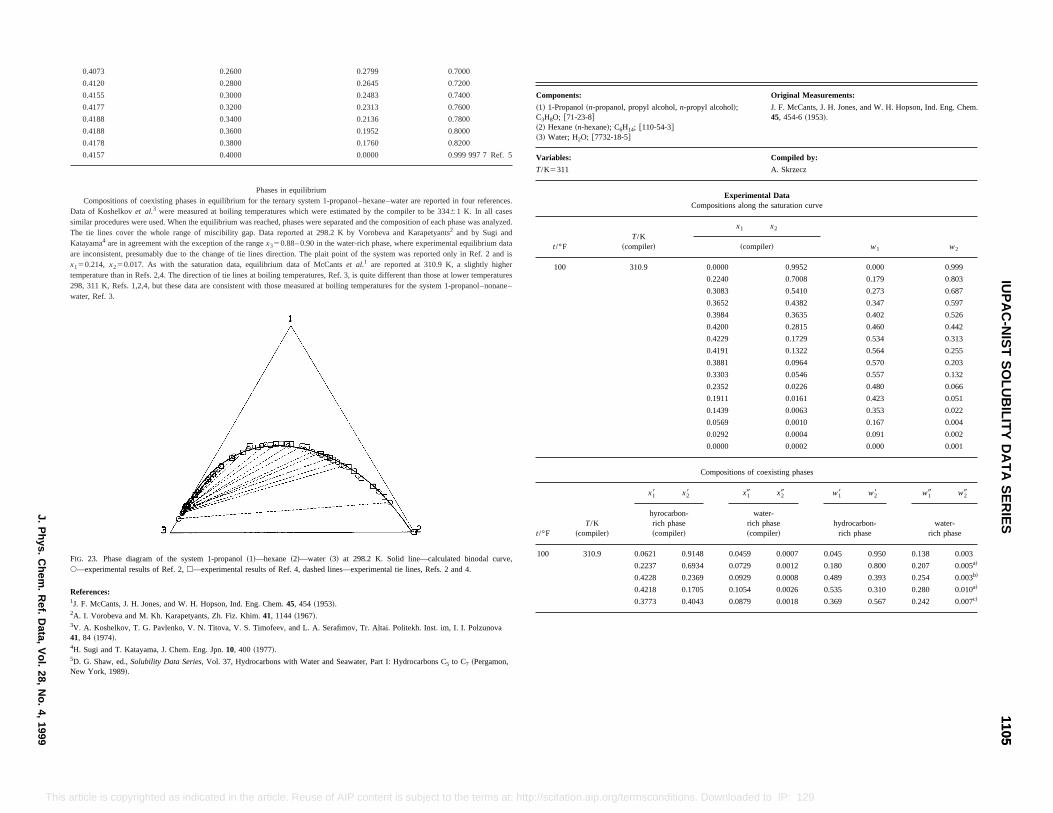
Original Measurements:
pyl alcohol,n-propyl alcohol!;
110-54-3#
J. F. McCants, J. H. Jones, and W. H. Hopson, Ind. Eng. Chem.45, 454-6~1953!.
Compiled by:
A. Skrzecz
Experimental DataCompositions along the saturation curve
iler!
x1 x2
w1 w2~compiler!
.9 0.0000 0.9952 0.000 0.999
0.2240 0.7008 0.179 0.803
0.3083 0.5410 0.273 0.687
0.3652 0.4382 0.347 0.597
0.3984 0.3635 0.402 0.526
0.4200 0.2815 0.460 0.442
0.4229 0.1729 0.534 0.313
0.4191 0.1322 0.564 0.255
0.3881 0.0964 0.570 0.203
0.3303 0.0546 0.557 0.132
0.2352 0.0226 0.480 0.066
0.1911 0.0161 0.423 0.051
0.1439 0.0063 0.353 0.022
0.0569 0.0010 0.167 0.004
0.0292 0.0004 0.091 0.002
0.0000 0.0002 0.000 0.001
Compositions of coexisting phases
x18 x28 x19 x29 w18 w28 w19 w29
hyrocarbon-rich phase
water-rich phase~compiler!
hydrocarbon-rich phase
water-rich phase
.9148 0.0459 0.0007 0.045 0.950 0.138 0.003
6934 0.0729 0.0012 0.180 0.800 0.207 0.005a!
2369 0.0929 0.0008 0.489 0.393 0.254 0.003b!
1705 0.1054 0.0026 0.535 0.310 0.280 0.010a!
4043 0.0879 0.0018 0.369 0.567 0.242 0.007c!
11051105
IUP
AC
-NIS
TS
OLU
BILIT
YD
AT
AS
ER
IESJ.P
hys.C
hem.
Ref.
Data,
Vol.
28,N
o.4,
1999
Thi s. Downloaded to IP: 129.6.105.191 On: Fri, 05 Sep 2014 17:51:55
FIG. 23. Phase diagram of the system 1-propanol~1!—hexane~2!—water ~3! at 298.2 K. Solid line—calculated binodal curve,s—experimental results of Ref. 2,h—experimental results of Ref. 4, dashed lines—experimental tie lines, Refs. 2 and 4.
References:1J. F. McCants, J. H. Jones, and W. H. Hopson, Ind. Eng. Chem.45, 454 ~1953!.2A. I. Vorobeva and M. Kh. Karapetyants, Zh. Fiz. Khim.41, 1144~1967!.3V. A. Koshelkov, T. G. Pavlenko, V. N. Titova, V. S. Timofeev, and L. A. Serafimov, Tr. Altai. Politekh. Inst. im, I. I. Polzunova41, 84 ~1974!.4H. Sugi and T. Katayama, J. Chem. Eng. Jpn.10, 400 ~1977!.5D. G. Shaw, ed.,Solubility Data Series, Vol. 37, Hydrocarbons with Water and Seawater, Part I: Hydrocarbons C5 to C7 ~Pergamon,New York, 1989!.
t/°F ~compiler! ~compiler!
100 310.9 0.0621 0
0.2237 0.
0.4228 0.
0.4218 0.
0.3773 0.
s article is copyrighted as indicated in the article. Reuse of AIP content is subject to the terms at: http://scitation.aip.org/termscondition
0.4073 0.2600 0.2799 0.7000
0.4120 0.2800 0.2645 0.7200
0.4155 0.3000 0.2483 0.7400
0.4177 0.3200 0.2313 0.7600
0.4188 0.3400 0.2136 0.7800
0.4188 0.3600 0.1952 0.8000
0.4178 0.3800 0.1760 0.8200
0.4157 0.4000 0.0000 0.999 997 7 Ref. 5
Phases in equilibriumCompositions of coexisting phases in equilibrium for the ternary system 1-propanol–hexane–water are reported in four references.
Data of Koshelkovet al.3 were measured at boiling temperatures which were estimated by the compiler to be 33461 K. In all casessimilar procedures were used. When the equilibrium was reached, phases were separated and the composition of each phase was analyzed.The tie lines cover the whole range of miscibility gap. Data reported at 298.2 K by Vorobeva and Karapetyants2 and by Sugi andKatayama4 are in agreement with the exception of the rangex350.88– 0.90 in the water-rich phase, where experimental equilibrium dataare inconsistent, presumably due to the change of tie lines direction. The plait point of the system was reported only in Ref. 2 and isx150.214, x250.017. As with the saturation data, equilibrium data of McCantset al.1 are reported at 310.9 K, a slightly highertemperature than in Refs. 2,4. The direction of tie lines at boiling temperatures, Ref. 3, is quite different than those at lower temperatures298, 311 K, Refs. 1,2,4, but these data are consistent with those measured at boiling temperatures for the system 1-propanol–nonane–water, Ref. 3.
Components:
~1! 1-Propanol~n-propanol, proC3H8O; @71-23-8#~2! Hexane~n-hexane!; C6H14; @~3! Water; H2O; @7732-18-5#
Variables:
T/K5311
t/°FT/K
~comp
100 310
T/K
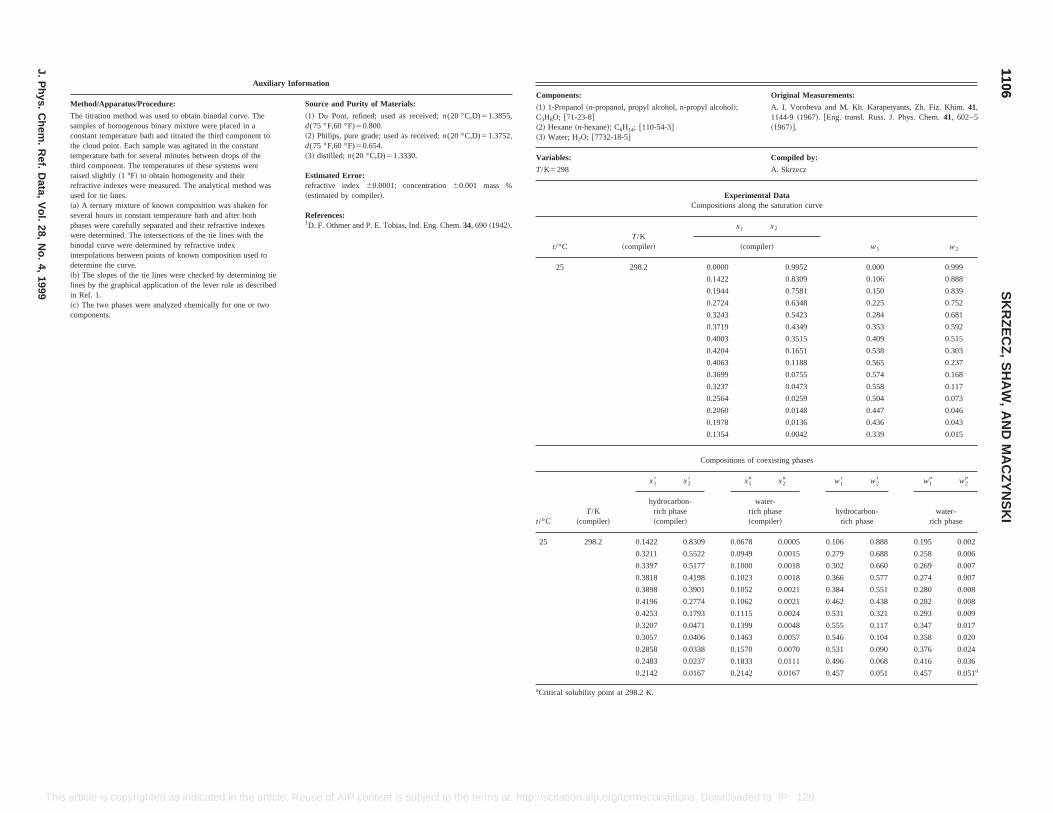
Original Measurements:
hol!; A. I. Vorobeva and M. Kh. Karapetyants, Zh. Fiz. Khim.41,1144-9 ~1967!. @Eng. transl. Russ. J. Phys. Chem.41, 602–5~1967!#.
Compiled by:
A. Skrzecz
Experimental Datations along the saturation curve
x1 x2
w1 w2~compiler!
00 0.9952 0.000 0.999
2 0.8309 0.106 0.888
4 0.7581 0.150 0.839
4 0.6348 0.225 0.752
3 0.5423 0.284 0.681
9 0.4349 0.353 0.592
3 0.3515 0.409 0.515
4 0.1651 0.538 0.303
3 0.1188 0.565 0.237
9 0.0755 0.574 0.168
7 0.0473 0.558 0.117
4 0.0259 0.504 0.073
0 0.0148 0.447 0.046
8 0.0136 0.436 0.043
4 0.0042 0.339 0.015
sitions of coexisting phases
x19 x29 w18 w28 w19 w29
water-rich phase~compiler!
hydrocarbon-rich phase
water-rich phase
25 298.2 0.1422 0.8309 0.0678 0.0005 0.106 0.888 0.195 0.002
0.3211 0.5522 0.0949 0.0015 0.279 0.688 0.258 0.006
0.3397 0.5177 0.1000 0.0018 0.302 0.660 0.269 0.007
0.3818 0.4198 0.1023 0.0018 0.366 0.577 0.274 0.007
0.3898 0.3901 0.1052 0.0021 0.384 0.551 0.280 0.008
0.4196 0.2774 0.1062 0.0021 0.462 0.438 0.282 0.008
0.4253 0.1793 0.1115 0.0024 0.531 0.321 0.293 0.009
0.3207 0.0471 0.1399 0.0048 0.555 0.117 0.347 0.017
0.3057 0.0406 0.1463 0.0057 0.546 0.104 0.358 0.020
0.2858 0.0338 0.1570 0.0070 0.531 0.090 0.376 0.024
0.2483 0.0237 0.1833 0.0111 0.496 0.068 0.416 0.036
0.2142 0.0167 0.2142 0.0167 0.457 0.051 0.457 0.051a
aCritical solubility point at 298.2 K.
11061106
SK
RZ
EC
Z,
SH
AW
,A
ND
MA
CZ
YN
SK
I
J.P
hys.C
hem.
Ref.
Data,
Vol.
28,N
o.4,
1999
This f AIP content is subject to the terms at: http://scitation.aip.org/termsconditions. Downloaded to IP: 129.6.105.191 On: Fri, 05 Sep 2014 17:51:55
article is copyrighted as indicated in the article. Reuse oAuxiliary Information
Method/Apparatus/Procedure: Source and Purity of Materials:
The titration method was used to obtain binodal curve. Thesamples of homogenous binary mixture were placed in aconstant temperature bath and titrated the third component tothe cloud point. Each sample was agitated in the constanttemperature bath for several minutes between drops of thethird component. The temperatures of these systems wereraised slightly~1 °F! to obtain homogeneity and theirrefractive indexes were measured. The analytical method wasused for tie lines.~a! A ternary mixture of known composition was shaken forseveral hours in constant temperature bath and after bothphases were carefully separated and their refractive indexeswere determined. The intersections of the tie lines with thebinodal curve were determined by refractive indexinterpolations between points of known composition used todetermine the curve.~b! The slopes of the tie lines were checked by determining tielines by the graphical application of the lever rule as describedin Ref. 1.~c! The two phases were analyzed chemically for one or twocomponents.
~1! Du Pont, refined; used as received;n(20 °C,D)51.3855,d(75 °F,60 °F)50.800.~2! Philips, pure grade; used as received;n(20 °C,D)51.3752,d(75 °F,60 °F)50.654.~3! distilled; n(20 °C,D)51.3330.
Estimated Error:refractive index 60.0001; concentration60.001 mass %~estimated by compiler!.
References:1D. F. Othmer and P. E. Tobias, Ind. Eng. Chem.34, 690~1942!.
Components:
~1! 1-Propanol~n-propanol, propyl alcohol,n-propyl alcoC3H8O; @71-23-8#~2! Hexane~n-hexane!; C6H14; @110-54-3#~3! Water; H2O; @7732-18-5#
Variables:
T/K5298
Composi
t/°CT/K
~compiler!
25 298.2 0.00
0.142
0.194
0.272
0.324
0.371
0.400
0.420
0.406
0.369
0.323
0.256
0.206
0.197
0.135
Compo
t/°CT/K
~compiler!
x18 x28
hydrocarbon-rich phase~compiler!
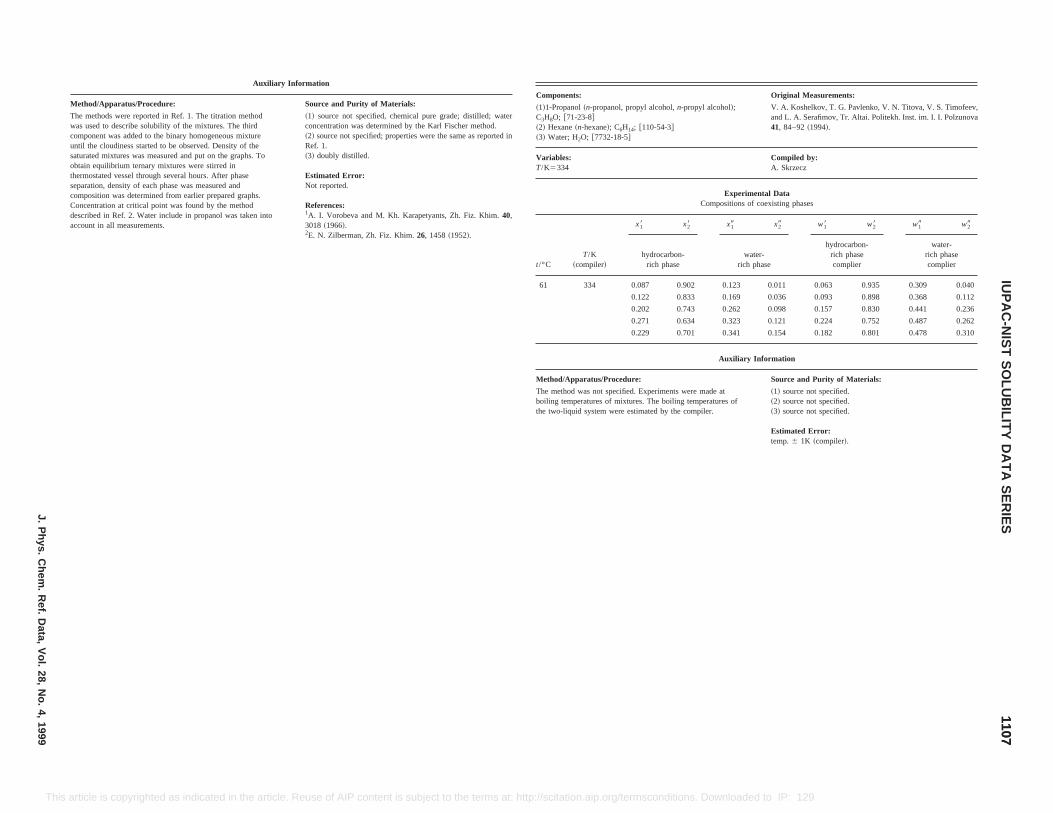
e; distilled; watercher method.ame as reported in
. Fiz. Khim.40,
!.
Components: Original Measurements:
~1!1-Propanol~n-propanol, propyl alcohol,n-propyl alcohol!;C3H8O; @71-23-8#~2! Hexane~n-hexane!; C6H14; @110-54-3#~3! Water; H2O; @7732-18-5#
V. A. Koshelkov, T. G. Pavlenko, V. N. Titova, V. S. Timofeev,and L. A. Serafimov, Tr. Altai. Politekh. Inst. im. I. I. Polzunova41, 84–92~1994!.
Variables:T/K5334
Compiled by:A. Skrzecz
Experimental DataCompositions of coexisting phases
t/°CT/K
~compiler!
x18 x28 x19 x29 w18 w28 w19 w29
hydrocarbon-rich phase
water-rich phase
hydrocarbon-rich phasecomplier
water-rich phasecomplier
61 334 0.087 0.902 0.123 0.011 0.063 0.935 0.309 0.040
0.122 0.833 0.169 0.036 0.093 0.898 0.368 0.112
0.202 0.743 0.262 0.098 0.157 0.830 0.441 0.236
0.271 0.634 0.323 0.121 0.224 0.752 0.487 0.262
0.229 0.701 0.341 0.154 0.182 0.801 0.478 0.310
Auxiliary Information
Method/Apparatus/Procedure: Source and Purity of Materials:
The method was not specified. Experiments were made atboiling temperatures of mixtures. The boiling temperatures ofthe two-liquid system were estimated by the compiler.
~1! source not specified.~2! source not specified.~3! source not specified.
Estimated Error:temp.6 1K ~compiler!.
11071107
IUP
AC
-NIS
TS
OLU
BILIT
YD
AT
AS
ER
IESJ.P
hys.C
hem.
Ref.
Data,
Vol.
28,N
o.4,
1999
This rticle. Reuse of AIP content is subject to the terms at: http://scitation.aip.org/termsconditions. Downloaded to IP: 129.6.105.191 On: Fri, 05 Sep 2014 17:51:55
article is copyrighted as indicated in the aAuxiliary Information
Method/Apparatus/Procedure: Source and Purity of Materials:
The methods were reported in Ref. 1. The titration methodwas used to describe solubility of the mixtures. The thirdcomponent was added to the binary homogeneous mixtureuntil the cloudiness started to be observed. Density of thesaturated mixtures was measured and put on the graphs. Toobtain equilibrium ternary mixtures were stirred inthermostated vessel through several hours. After phaseseparation, density of each phase was measured andcomposition was determined from earlier prepared graphs.Concentration at critical point was found by the methoddescribed in Ref. 2. Water include in propanol was taken intoaccount in all measurements.
~1! source not specified, chemical pure gradconcentration was determined by the Karl Fis~2! source not specified; properties were the sRef. 1.~3! doubly distilled.
Estimated Error:Not reported.
References:1A. I. Vorobeva and M. Kh. Karapetyants, Zh3018 ~1966!.2E. N. Zilberman, Zh. Fiz. Khim.26, 1458~1952
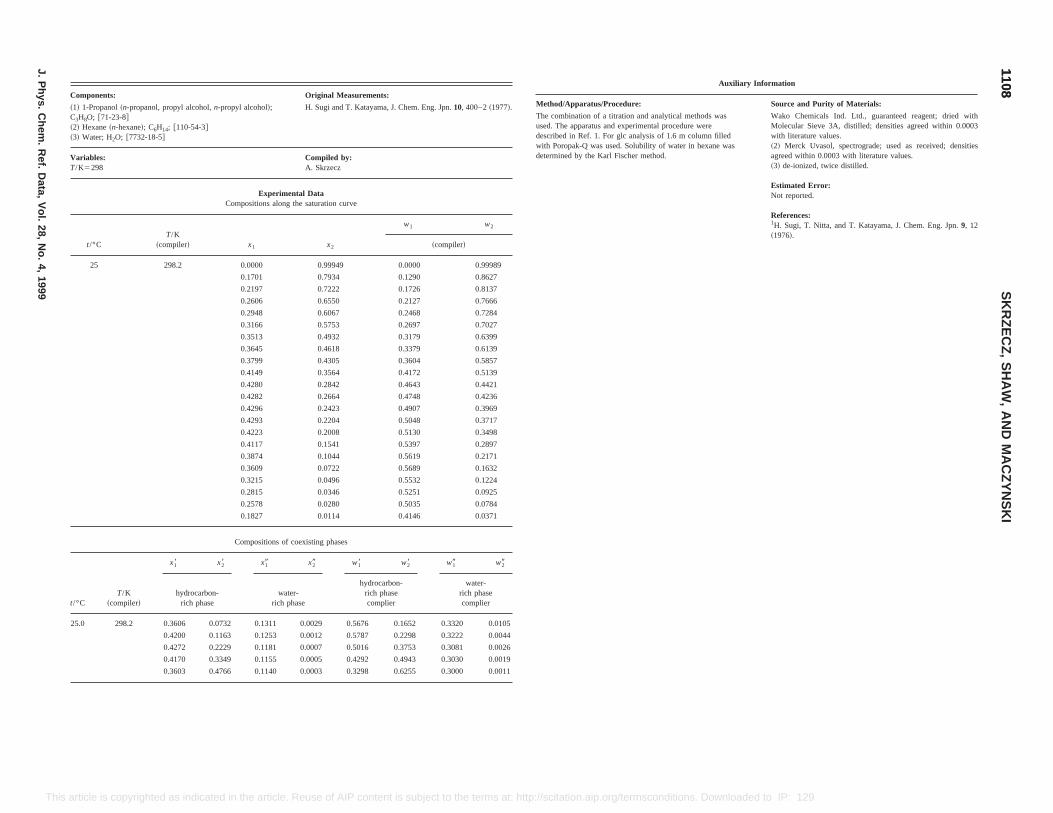
Original Measurements:
lcohol!; H. Sugi and T. Katayama, J. Chem. Eng. Jpn.10, 400–2~1977!.
Compiled by:A. Skrzecz
Experimental Datasitions along the saturation curve
x1 x2
w1 w2
~compiler!
.0000 0.99949 0.0000 0.99989
1701 0.7934 0.1290 0.8627
2197 0.7222 0.1726 0.8137
2606 0.6550 0.2127 0.7666
2948 0.6067 0.2468 0.7284
3166 0.5753 0.2697 0.7027
3513 0.4932 0.3179 0.6399
3645 0.4618 0.3379 0.6139
3799 0.4305 0.3604 0.5857
4149 0.3564 0.4172 0.5139
4280 0.2842 0.4643 0.4421
4282 0.2664 0.4748 0.4236
4296 0.2423 0.4907 0.3969
4293 0.2204 0.5048 0.3717
4223 0.2008 0.5130 0.3498
4117 0.1541 0.5397 0.2897
3874 0.1044 0.5619 0.2171
3609 0.0722 0.5689 0.1632
3215 0.0496 0.5532 0.1224
2815 0.0346 0.5251 0.0925
2578 0.0280 0.5035 0.0784
1827 0.0114 0.4146 0.0371
Auxiliary Information
Method/Apparatus/Procedure: Source and Purity of Materials:
The combination of a titration and analytical methods wasused. The apparatus and experimental procedure weredescribed in Ref. 1. For glc analysis of 1.6 m column filledwith Poropak-Q was used. Solubility of water in hexane wasdetermined by the Karl Fischer method.
Wako Chemicals Ind. Ltd., guaranteed reagent; dried withMolecular Sieve 3A, distilled; densities agreed within 0.0003with literature values.~2! Merck Uvasol, spectrograde; used as received; densitiesagreed within 0.0003 with literature values.~3! de-ionized, twice distilled.
Estimated Error:Not reported.
References:1H. Sugi, T. Nitta, and T. Katayama, J. Chem. Eng. Jpn.9, 12~1976!.
11081108
SK
RZ
EC
Z,
SH
AW
,A
ND
MA
CZ
YN
SK
I
J.P
hys.C
hem.
Ref.
Data,
Vol.
28,N
o.4,
1999
This Downloaded to IP: 129.6.105.191 On: Fri, 05 Sep 2014 17:51:55
Compositions of coexisting phases
t/°CT/K
~compiler!
x18 x28 x19 x29 w18 w28 w19 w29
hydrocarbon-rich phase
water-rich phase
hydrocarbon-rich phasecomplier
water-rich phasecomplier
25.0 298.2 0.3606 0.0732 0.1311 0.0029 0.5676 0.1652 0.3320 0.0105
0.4200 0.1163 0.1253 0.0012 0.5787 0.2298 0.3222 0.0044
0.4272 0.2229 0.1181 0.0007 0.5016 0.3753 0.3081 0.0026
0.4170 0.3349 0.1155 0.0005 0.4292 0.4943 0.3030 0.0019
0.3603 0.4766 0.1140 0.0003 0.3298 0.6255 0.3000 0.0011
article is copyrighted as indicated in the article. Reuse of AIP content is subject to the terms at: http://scitation.aip.org/termsconditions.
Components:
~1! 1-Propanol~n-propanol, propyl alcohol,n-propyl aC3H8O; @71-23-8#~2! Hexane~n-hexane!; C6H14; @110-54-3#~3! Water; H2O; @7732-18-5#
Variables:T/K5298
Compo
t/°CT/K
~compiler!
25 298.2 0
0.
0.
0.
0.
0.
0.
0.
0.
0.
0.
0.
0.
0.
0.
0.
0.
0.
0.
0.
0.
0.
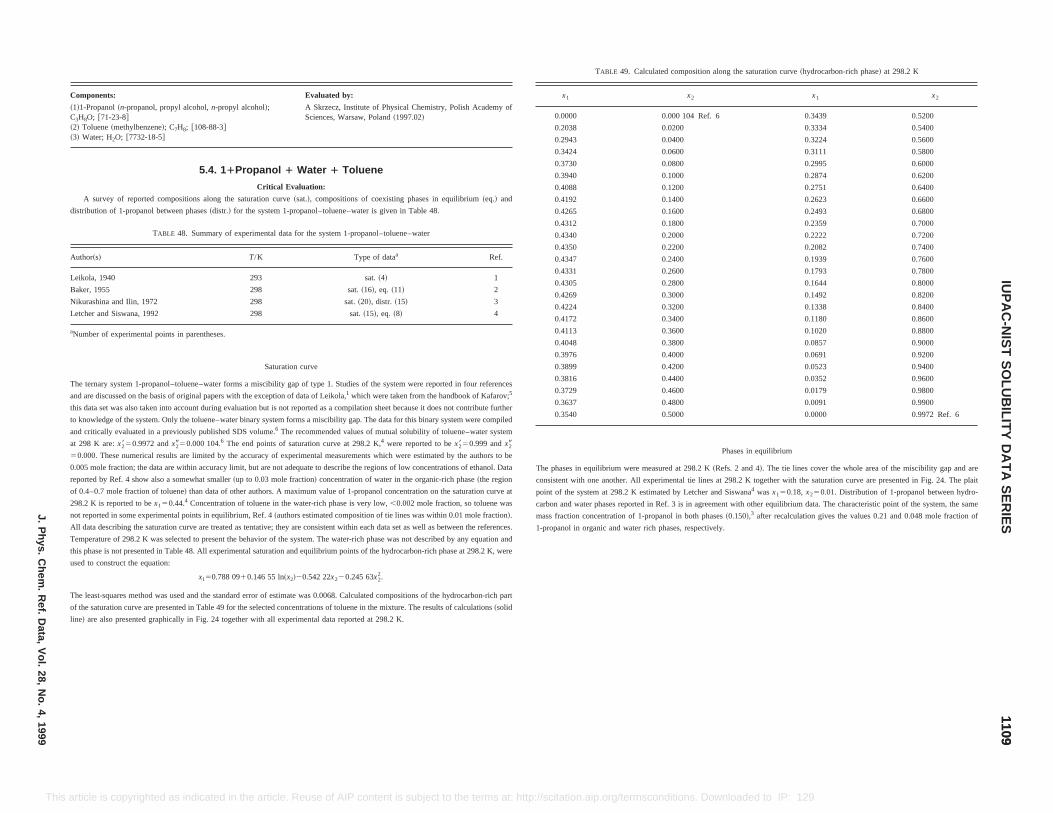
er
e
s.
TABLE 49. Calculated composition along the saturation curve~hydrocarbon-rich phase! at 298.2 K
x1 x2 x1 x2
0.0000 0.000 104 Ref. 6 0.3439 0.5200
0.2038 0.0200 0.3334 0.5400
0.2943 0.0400 0.3224 0.5600
0.3424 0.0600 0.3111 0.5800
0.3730 0.0800 0.2995 0.6000
0.3940 0.1000 0.2874 0.6200
0.4088 0.1200 0.2751 0.6400
0.4192 0.1400 0.2623 0.6600
0.4265 0.1600 0.2493 0.6800
0.4312 0.1800 0.2359 0.7000
0.4340 0.2000 0.2222 0.7200
0.4350 0.2200 0.2082 0.7400
0.4347 0.2400 0.1939 0.7600
0.4331 0.2600 0.1793 0.7800
0.4305 0.2800 0.1644 0.8000
0.4269 0.3000 0.1492 0.8200
0.4224 0.3200 0.1338 0.8400
0.4172 0.3400 0.1180 0.8600
0.4113 0.3600 0.1020 0.8800
0.4048 0.3800 0.0857 0.9000
0.3976 0.4000 0.0691 0.9200
0.3899 0.4200 0.0523 0.9400
0.3816 0.4400 0.0352 0.9600
0.3729 0.4600 0.0179 0.9800
0.3637 0.4800 0.0091 0.9900
0.3540 0.5000 0.0000 0.9972 Ref. 6
Phases in equilibrium
phases in equilibrium were measured at 298.2 K~Refs. 2 and 4!. The tie lines cover the whole area of the miscibility gap and are
istent with one another. All experimental tie lines at 298.2 K together with the saturation curve are presented in Fig. 24. The plait
t of the system at 298.2 K estimated by Letcher and Siswana4 wasx150.18, x250.01. Distribution of 1-propanol between hydro-
on and water phases reported in Ref. 3 is in agreement with other equilibrium data. The characteristic point of the system, the same
s fraction concentration of 1-propanol in both phases~0.150!,3 after recalculation gives the values 0.21 and 0.048 mole fraction of
opanol in organic and water rich phases, respectively.
11091109
IUP
AC
-NIS
TS
OLU
BILIT
YD
AT
AS
ER
IESJ.P
hys.C
hem.
Ref.
Data,
Vol.
28,N
o.4,
1999
This sconditions. Downloaded to IP: 129.6.105.191 On: Fri, 05 Sep 2014 17:51:55
Temperature of 298.2 K was selected to present the behavior of the system. The water-rich phase was not described by any equation and
this phase is not presented in Table 48. All experimental saturation and equilibrium points of the hydrocarbon-rich phase at 298.2 K, were
used to construct the equation:
x150.788 0910.146 55 ln~x2!20.542 22x220.245 63x22.
The least-squares method was used and the standard error of estimate was 0.0068. Calculated compositions of the hydrocarbon-rich part
of the saturation curve are presented in Table 49 for the selected concentrations of toluene in the mixture. The results of calculations~solid
line! are also presented graphically in Fig. 24 together with all experimental data reported at 298.2 K.
article is copyrighted as indicated in the article. Reuse of AIP content is subject to the terms at: http://scitation.aip.org/term
Components: Evaluated by:
~1!1-Propanol~n-propanol, propyl alcohol,n-propyl alcohol!;C3H8O; @71-23-8#~2! Toluene~methylbenzene!; C7H8; @108-88-3#~3! Water; H2O; @7732-18-5#
A Skrzecz, Institute of Physical Chemistry, Polish Academy ofSciences, Warsaw, Poland~1997.02!
5.4. 11Propanol 1 Water 1 Toluene
Critical Evaluation:
A survey of reported compositions along the saturation curve~sat.!, compositions of coexisting phases in equilibrium~eq.! and
distribution of 1-propanol between phases~distr.! for the system 1-propanol–toluene–water is given in Table 48.
TABLE 48. Summary of experimental data for the system 1-propanol–toluene–water
Author~s! T/K Type of dataa Ref.
Leikola, 1940 293 sat.~4! 1
Baker, 1955 298 sat.~16!, eq. ~11! 2
Nikurashina and Ilin, 1972 298 sat.~20!, distr. ~15! 3
Letcher and Siswana, 1992 298 sat.~15!, eq. ~8! 4
aNumber of experimental points in parentheses.
Saturation curve
The ternary system 1-propanol–toluene–water forms a miscibility gap of type 1. Studies of the system were reported in four references
and are discussed on the basis of original papers with the exception of data of Leikola,1 which were taken from the handbook of Kafarov;5
this data set was also taken into account during evaluation but is not reported as a compilation sheet because it does not contribute furth
to knowledge of the system. Only the toluene–water binary system forms a miscibility gap. The data for this binary system were compiled
and critically evaluated in a previously published SDS volume.6 The recommended values of mutual solubility of toluene–water system
at 298 K are:x2850.9972 andx2950.000 104.6 The end points of saturation curve at 298.2 K,4 were reported to bex2850.999 andx29
50.000. These numerical results are limited by the accuracy of experimental measurements which were estimated by the authors to b
0.005 mole fraction; the data are within accuracy limit, but are not adequate to describe the regions of low concentrations of ethanol. Data
reported by Ref. 4 show also a somewhat smaller~up to 0.03 mole fraction! concentration of water in the organic-rich phase~the region
of 0.4–0.7 mole fraction of toluene! than data of other authors. A maximum value of 1-propanol concentration on the saturation curve at
298.2 K is reported to bex150.44.4 Concentration of toluene in the water-rich phase is very low,,0.002 mole fraction, so toluene was
not reported in some experimental points in equilibrium, Ref. 4~authors estimated composition of tie lines was within 0.01 mole fraction!.
All data describing the saturation curve are treated as tentative; they are consistent within each data set as well as between the reference
The
cons
poin
carb
mas
1-pr
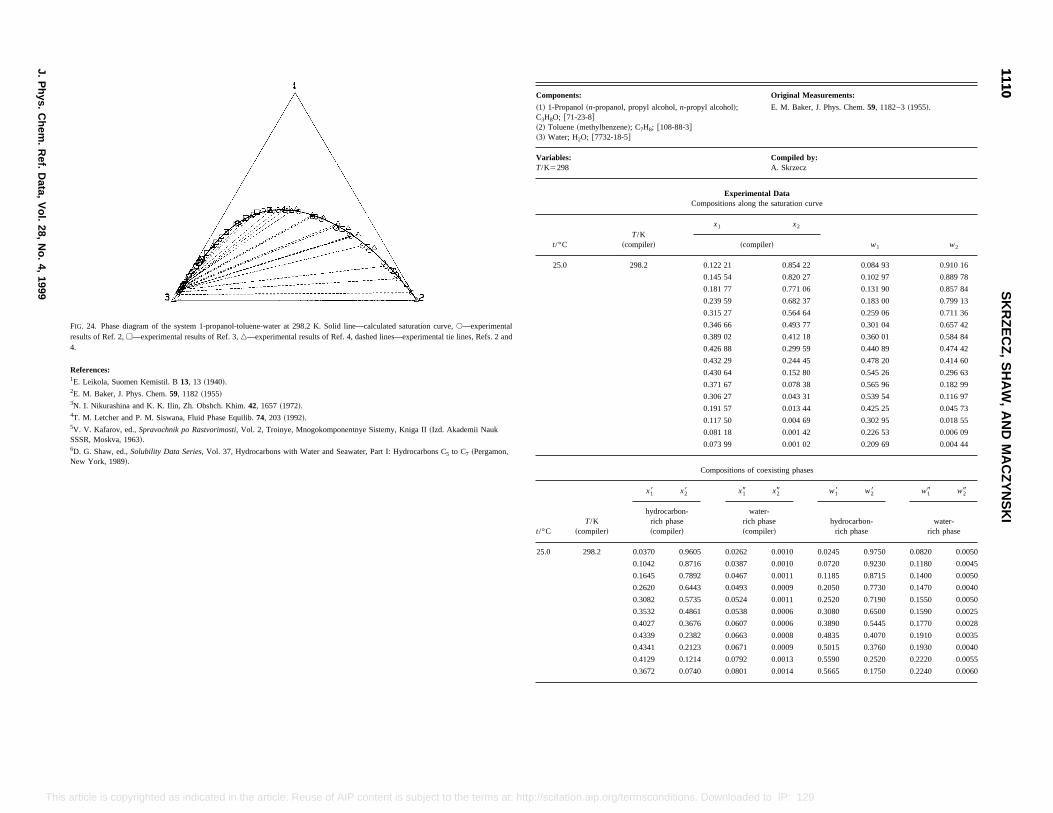
Original Measurements:
yl alcohol!; E. M. Baker, J. Phys. Chem.59, 1182–3~1955!.
Compiled by:A. Skrzecz
Experimental Datapositions along the saturation curve
x1 x2
w1 w2~compiler!
0.122 21 0.854 22 0.084 93 0.910 16
0.145 54 0.820 27 0.102 97 0.889 78
0.181 77 0.771 06 0.131 90 0.857 84
0.239 59 0.682 37 0.183 00 0.799 13
0.315 27 0.564 64 0.259 06 0.711 36
0.346 66 0.493 77 0.301 04 0.657 42
0.389 02 0.412 18 0.360 01 0.584 84
0.426 88 0.299 59 0.440 89 0.474 42
0.432 29 0.244 45 0.478 20 0.414 60
0.430 64 0.152 80 0.545 26 0.296 63
0.371 67 0.078 38 0.565 96 0.182 99
0.306 27 0.043 31 0.539 54 0.116 97
0.191 57 0.013 44 0.425 25 0.045 73
0.117 50 0.004 69 0.302 95 0.018 55
0.081 18 0.001 42 0.226 53 0.006 09
0.073 99 0.001 02 0.209 69 0.004 44
ompositions of coexisting phases
t/°C ~compiler!
x19 x29 w18 w28 w19 w29
~compiler!
water-rich phase~compiler!
hydrocarbon-rich phase
water-rich phase
25.0 298.2 0.0370 0.9605 0.0262 0.0010 0.0245 0.9750 0.0820 0.0050
0.1042 0.8716 0.0387 0.0010 0.0720 0.9230 0.1180 0.0045
0.1645 0.7892 0.0467 0.0011 0.1185 0.8715 0.1400 0.0050
0.2620 0.6443 0.0493 0.0009 0.2050 0.7730 0.1470 0.0040
0.3082 0.5735 0.0524 0.0011 0.2520 0.7190 0.1550 0.0050
0.3532 0.4861 0.0538 0.0006 0.3080 0.6500 0.1590 0.0025
0.4027 0.3676 0.0607 0.0006 0.3890 0.5445 0.1770 0.0028
0.4339 0.2382 0.0663 0.0008 0.4835 0.4070 0.1910 0.0035
0.4341 0.2123 0.0671 0.0009 0.5015 0.3760 0.1930 0.0040
0.4129 0.1214 0.0792 0.0013 0.5590 0.2520 0.2220 0.0055
0.3672 0.0740 0.0801 0.0014 0.5665 0.1750 0.2240 0.0060
11101110
SK
RZ
EC
Z,
SH
AW
,A
ND
MA
CZ
YN
SK
I
J.P
hys.C
hem.
Ref.
Data,
Vol.
28,N
o.4,
1999
This s at: http://scitation.aip.org/termsconditions. Downloaded to IP: 129.6.105.191 On: Fri, 05 Sep 2014 17:51:55
article is copyrighted as indicated in the article. Reuse of AIP content is subject to the termFIG. 24. Phase diagram of the system 1-propanol-toluene-water at 298.2 K. Solid line—calculated saturation curve,s—experimentalresults of Ref. 2,h—experimental results of Ref. 3,n—experimental results of Ref. 4, dashed lines—experimental tie lines, Refs. 2 and4.
References:1E. Leikola, Suomen Kemistil. B13, 13 ~1940!.2E. M. Baker, J. Phys. Chem.59, 1182~1955!3N. I. Nikurashina and K. K. Ilin, Zh. Obshch. Khim.42, 1657~1972!.4T. M. Letcher and P. M. Siswana, Fluid Phase Equilib.74, 203 ~1992!.5V. V. Kafarov, ed.,Spravochnik po Rastvorimosti, Vol. 2, Troinye, Mnogokomponentnye Sistemy, Kniga II~Izd. Akademii NaukSSSR, Moskva, 1963!.6D. G. Shaw, ed.,Solubility Data Series, Vol. 37, Hydrocarbons with Water and Seawater, Part I: Hydrocarbons C5 to C7 ~Pergamon,New York, 1989!.
Components:
~1! 1-Propanol~n-propanol, propyl alcohol,n-propC3H8O; @71-23-8#~2! Toluene~methylbenzene!; C7H8; @108-88-3#~3! Water; H2O; @7732-18-5#
Variables:T/K5298
Com
t/°CT/K
~compiler!
25.0 298.2
C
T/K
x18 x28
hydrocarbon-rich phase
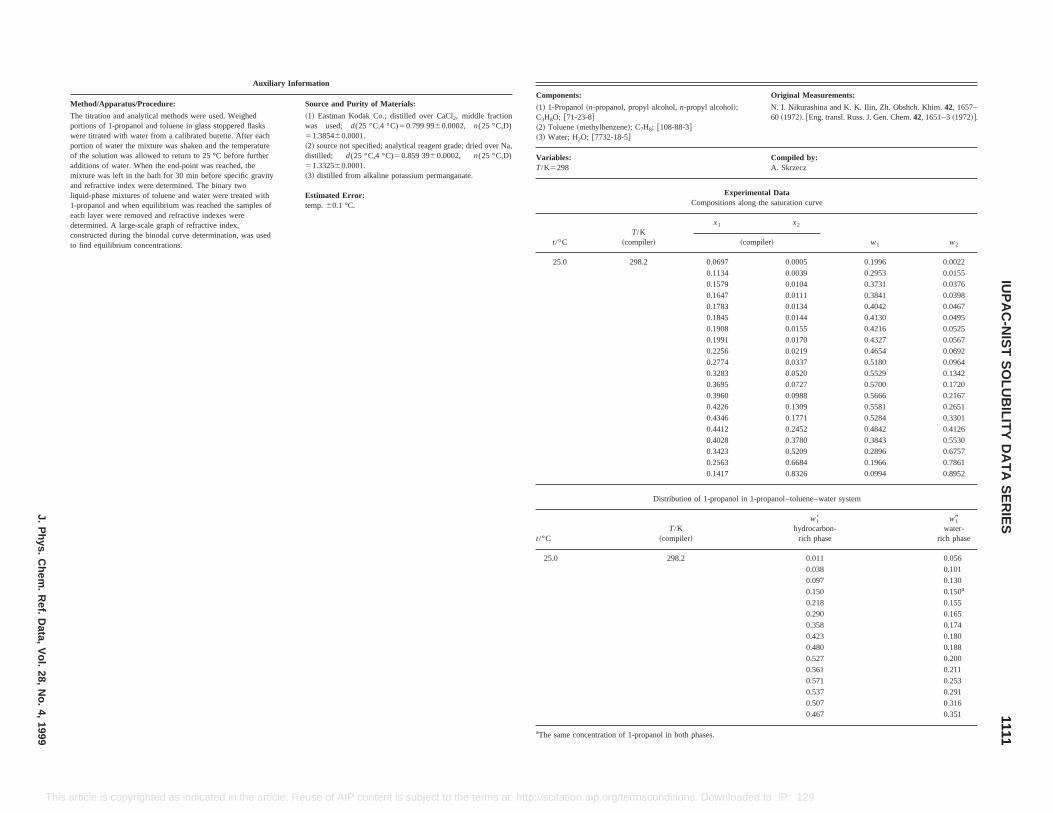
Original Measurements:
N. I. Nikurashina and K. K. Ilin, Zh. Obshch. Khim.42, 1657–60 ~1972!. @Eng. transl. Russ. J. Gen. Chem.42, 1651–3~1972!#.
Compiled by:A. Skrzecz
ental Datang the saturation curve
x2
w1 w2piler!
0.0005 0.1996 0.0022
0.0039 0.2953 0.0155
0.0104 0.3731 0.0376
0.0111 0.3841 0.0398
0.0134 0.4042 0.0467
0.0144 0.4130 0.0495
0.0155 0.4216 0.0525
0.0170 0.4327 0.0567
0.0219 0.4654 0.0692
0.0337 0.5180 0.0964
0.0520 0.5529 0.1342
0.0727 0.5700 0.1720
0.0988 0.5666 0.2167
0.1309 0.5581 0.2651
0.1771 0.5284 0.3301
0.2452 0.4842 0.4126
0.3780 0.3843 0.5530
0.5209 0.2896 0.6757
0.6684 0.1966 0.7861
0.8326 0.0994 0.8952
1-propanol–toluene–water system
t/°CT/K
~compiler!
w18hydrocarbon-
rich phase
w19water-
rich phase
25.0 298.2 0.011 0.056
0.038 0.101
0.097 0.130
0.150 0.150a
0.218 0.155
0.290 0.165
0.358 0.174
0.423 0.180
0.480 0.188
0.527 0.200
0.561 0.211
0.571 0.253
0.537 0.291
0.507 0.316
0.467 0.351
aThe same concentration of 1-propanol in both phases.
11111111
IUP
AC
-NIS
TS
OLU
BILIT
YD
AT
AS
ER
IESJ.P
hys.C
hem.
Ref.
Data,
Vol.
28,N
o.4,
1999
This rticle. Reuse of AIP content is subject to the terms at: http://scitation.aip.org/termsconditions. Downloaded to IP: 129.6.105.191 On: Fri, 05 Sep 2014 17:51:55
article is copyrighted as indicated in the aAuxiliary Information
Method/Apparatus/Procedure: Source and Purity of Materials:
The titration and analytical methods were used. Weighedportions of 1-propanol and toluene in glass stoppered flaskswere titrated with water from a calibrated burette. After eachportion of water the mixture was shaken and the temperatureof the solution was allowed to return to 25 °C before furtheradditions of water. When the end-point was reached, themixture was left in the bath for 30 min before specific gravityand refractive index were determined. The binary twoliquid-phase mixtures of toluene and water were treated with1-propanol and when equilibrium was reached the samples ofeach layer were removed and refractive indexes weredetermined. A large-scale graph of refractive index,constructed during the binodal curve determination, was usedto find equilibrium concentrations.
~1! Eastman Kodak Co.; distilled over CaCl2, middle fractionwas used; d(25 °C,4 °C)50.799 9960.0002, n(25 °C,D)51.385460.0001.~2! source not specified; analytical reagent grade; dried over Na,distilled; d(25 °C,4 °C)50.859 3960.0002, n(25 °C,D)51.332560.0001.~3! distilled from alkaline potassium permanganate.
Estimated Error:temp.60.1 °C.
Components:
~1! 1-Propanol~n-propanol, propyl alcohol,n-propyl alcohol!;C3H8O; @71-23-8#~2! Toluene~methylbenzene!; C7H8; @108-88-3#~3! Water; H2O; @7732-18-5#
Variables:T/K5298
ExperimCompositions alo
t/°CT/K
~compiler!
x1
~com
25.0 298.2 0.0697
0.1134
0.1579
0.1647
0.1783
0.1845
0.1908
0.1991
0.2256
0.2774
0.3283
0.3695
0.3960
0.4226
0.4346
0.4412
0.4028
0.3423
0.2563
0.1417
Distribution of 1-propanol in
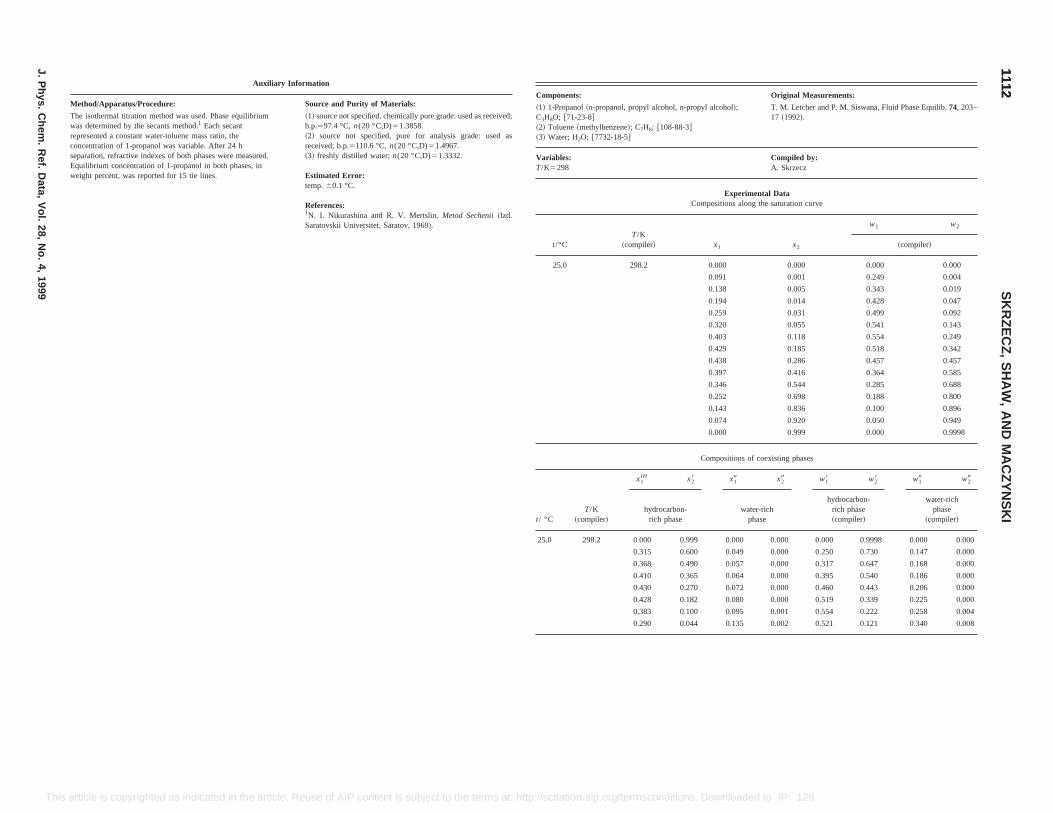
Original Measurements:
alcohol,n-propyl alcohol!;
@108-88-3#
T. M. Letcher and P. M. Siswana, Fluid Phase Equilib.74, 203–17 ~1992!.
Compiled by:A. Skrzecz
Experimental DataCompositions along the saturation curve
x1 x2
w1 w2
~compiler!
0.000 0.000 0.000 0.000
0.091 0.001 0.249 0.004
0.138 0.005 0.343 0.019
0.194 0.014 0.428 0.047
0.259 0.031 0.499 0.092
0.320 0.055 0.541 0.143
0.403 0.118 0.554 0.249
0.429 0.185 0.518 0.342
0.438 0.286 0.457 0.457
0.397 0.416 0.364 0.585
0.346 0.544 0.285 0.688
0.252 0.698 0.188 0.800
0.143 0.836 0.100 0.896
0.074 0.920 0.050 0.949
0.000 0.999 0.000 0.9998
Compositions of coexisting phases
x28 x19 x29 w18 w28 w19 w29
rocarbon-ch phase
water-richphase
hydrocarbon-rich phase~compiler!
water-richphase
~compiler!
25.0 298.2 0.000 0.999 0.000 0.000 0.000 0.9998 0.000 0.000
0.315 0.600 0.049 0.000 0.250 0.730 0.147 0.000
0.368 0.490 0.057 0.000 0.317 0.647 0.168 0.000
0.410 0.365 0.064 0.000 0.395 0.540 0.186 0.000
0.430 0.270 0.072 0.000 0.460 0.443 0.206 0.000
0.428 0.182 0.080 0.000 0.519 0.339 0.225 0.000
0.383 0.100 0.095 0.001 0.554 0.222 0.258 0.004
0.290 0.044 0.135 0.002 0.521 0.121 0.340 0.008
11121112
SK
RZ
EC
Z,
SH
AW
,A
ND
MA
CZ
YN
SK
I
J.P
hys.C
hem.
Ref.
Data,
Vol.
28,N
o.4,
1999
This the article. Reuse of AIP content is subject to the terms at: http://scitation.aip.org/termsconditions. Downloaded to IP: 129.6.105.191 On: Fri, 05 Sep 2014 17:51:55
article is copyrighted as indicated inAuxiliary Information
Method/Apparatus/Procedure: Source and Purity of Materials:
The isothermal titration method was used. Phase equilibriumwas determined by the secants method.1 Each secantrepresented a constant water-toluene mass ratio, theconcentration of 1-propanol was variable. After 24 hseparation, refractive indexes of both phases were measured.Equilibrium concentration of 1-propanol in both phases, inweight percent, was reported for 15 tie lines.
~1! source not specified, chemically pure grade: used as received;b.p.597.4 °C,n(20 °C,D)51.3858.~2! source not specified, pure for analysis grade: used asreceived; b.p.5110.6 °C,n(20 °C,D)51.4967.~3! freshly distilled water;n(20 °C,D)51.3332.
Estimated Error:temp.60.1 °C.
References:1N. I. Nikurashina and R. V. Mertslin,Metod Sechenii~Izd.Saratovskii Universitet, Saratov, 1969!.
Components:
~1! 1-Propanol~n-propanol, propylC3H8O; @71-23-8#~2! Toluene~methylbenzene!; C7H8;~3! Water; H2O; @7732-18-5#
Variables:T/K5298
t/°CT/K
~compiler!
25.0 298.2
t/ °CT/K
~compiler!
x1IH
hydri
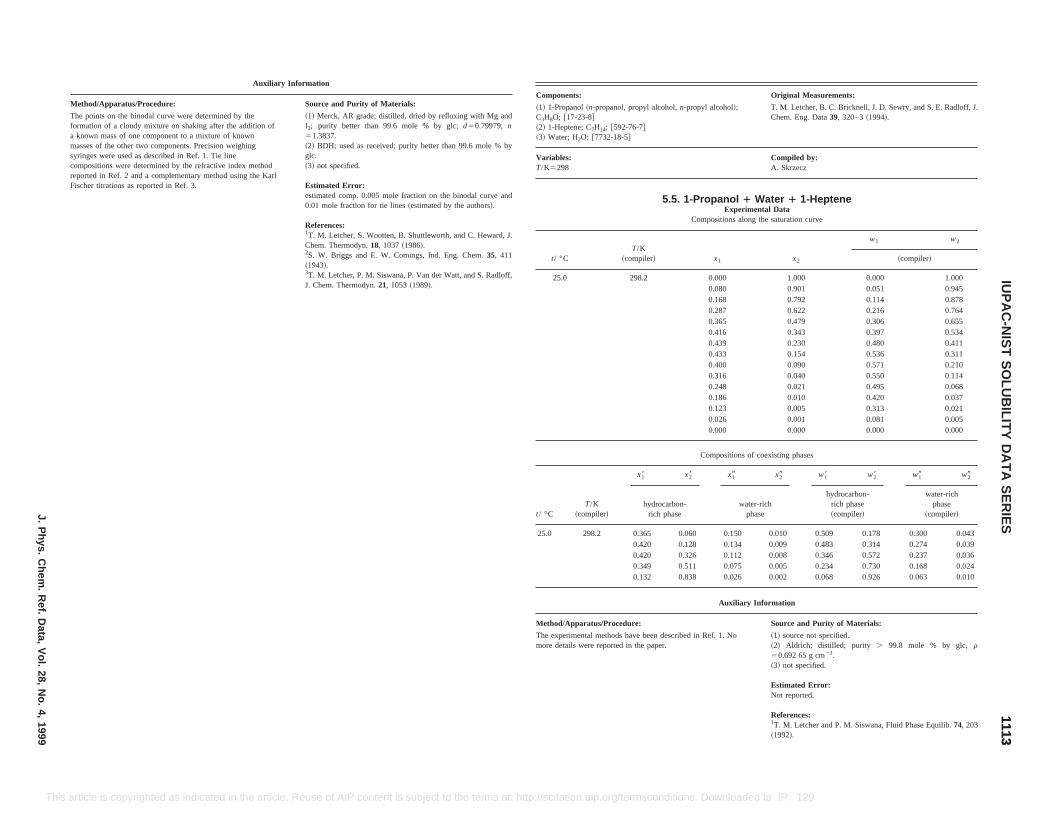
Original Measurements:
T. M. Letcher, B. C. Bricknell, J. D. Sewry, and S. E. Radloff, J.Chem. Eng. Data39, 320–3~1994!.
Compiled by:A. Skrzecz
Water 1 1-Hepteneental Data
ong the saturation curve
x2
w1 w2
~compiler!
1.000 0.000 1.0000.901 0.051 0.9450.792 0.114 0.8780.622 0.216 0.7640.479 0.306 0.6550.343 0.397 0.5340.230 0.480 0.4110.154 0.536 0.3110.090 0.571 0.2100.040 0.550 0.1140.021 0.495 0.0680.010 0.420 0.0370.005 0.313 0.0210.001 0.081 0.0050.000 0.000 0.000
of coexisting phases
x29 w18 w28 w19 w29
ter-richhase
hydrocarbon-rich phase~compiler!
water-richphase
~compiler!
25.0 298.2 0.365 0.060 0.150 0.010 0.509 0.178 0.300 0.0430.420 0.128 0.134 0.009 0.483 0.314 0.274 0.0390.420 0.326 0.112 0.008 0.346 0.572 0.237 0.0360.349 0.511 0.075 0.005 0.234 0.730 0.168 0.0240.132 0.838 0.026 0.002 0.068 0.926 0.063 0.010
Auxiliary Information
Method/Apparatus/Procedure: Source and Purity of Materials:
The experimental methods have been described in Ref. 1. Nomore details were reported in the paper.
~1! source not specified.~2! Aldrich; distilled; purity . 99.8 mole % by glc, r50.692 65 g cm23.~3! not specified.
Estimated Error:Not reported.
References:1T. M. Letcher and P. M. Siswana, Fluid Phase Equilib.74, 203~1992!.
11131113
IUP
AC
-NIS
TS
OLU
BILIT
YD
AT
AS
ER
IESJ.P
hys.C
hem.
Ref.
Data,
Vol.
28,N
o.4,
1999
This use of AIP content is subject to the terms at: http://scitation.aip.org/termsconditions. Downloaded to IP: 129.6.105.191 On: Fri, 05 Sep 2014 17:51:55
article is copyrighted as indicated in the article. ReAuxiliary Information
Method/Apparatus/Procedure: Source and Purity of Materials:
The points on the binodal curve were determined by theformation of a cloudy mixture on shaking after the addition ofa known mass of one component to a mixture of knownmasses of the other two components. Precision weighingsyringes were used as described in Ref. 1. Tie linecompositions were determined by the refractive index methodreported in Ref. 2 and a complementary method using the KarlFischer titrations as reported in Ref. 3.
~1! Merck, AR grade; distilled, dried by refluxing with Mg andI2; purity better than 99.6 mole % by glc;d50.79979, n51.3837.~2! BDH; used as received; purity better than 99.6 mole % byglc.~3! not specified.
Estimated Error:estimated comp. 0.005 mole fraction on the binodal curve and0.01 mole fraction for tie lines~estimated by the authors!.
References:1T. M. Letcher, S. Wootten, B. Shuttleworth, and C. Heward, J.Chem. Thermodyn.18, 1037~1986!.2S. W. Briggs and E. W. Comings, Ind. Eng. Chem.35, 411~1943!.3T. M. Letcher, P. M. Siswana, P. Van der Watt, and S. Radloff,J. Chem. Thermodyn.21, 1053~1989!.
Components:
~1! 1-Propanol~n-propanol, propyl alcohol,n-propyl alcohol!;C3H8O; @17-23-8#~2! 1-Heptene; C7H14; @592-76-7#~3! Water; H2O; @7732-18-5#
Variables:T/K5298
5.5. 1-Propanol 1Experim
Compositions al
t/ °CT/K
~compiler! x1
25.0 298.2 0.0000.0800.1680.2870.3650.4160.4390.4330.4000.3160.2480.1860.1230.0260.000
Compositions
t/ °CT/K
~compiler!
x18 x28 x19
hydrocarbon-rich phase
wap
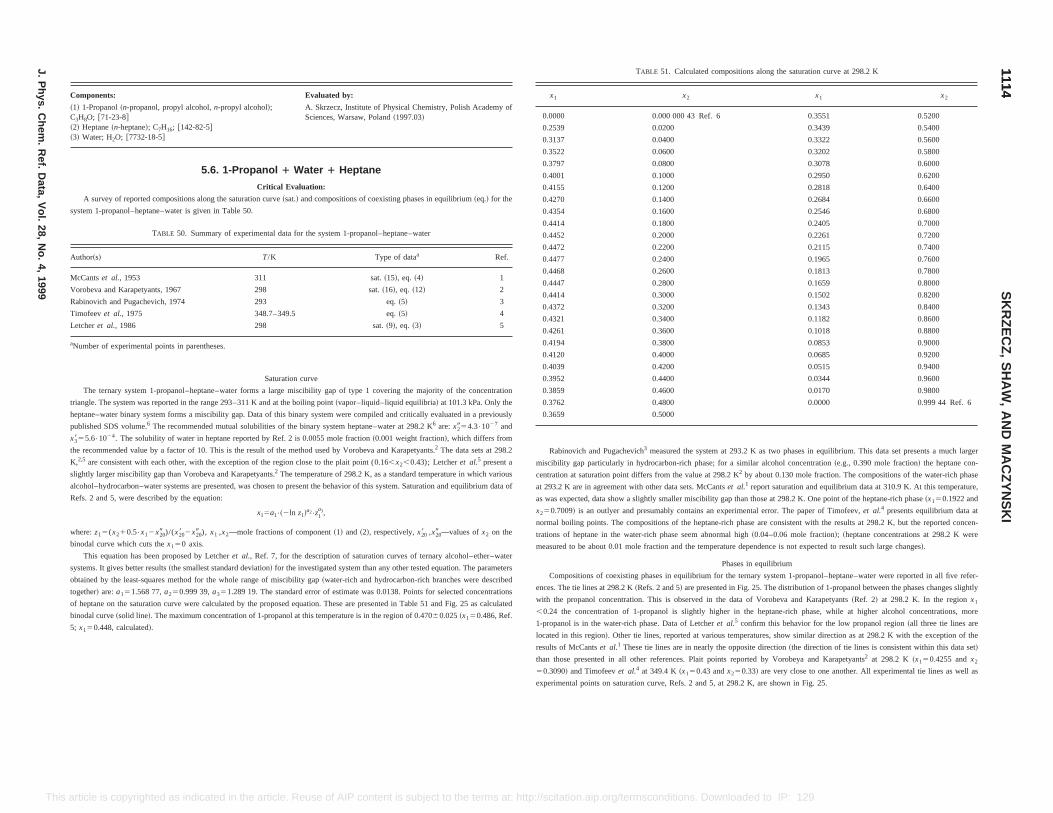
lated compositions along the saturation curve at 298.2 K
x1 x2
3 Ref. 6 0.3551 0.5200
0.3439 0.5400
0.3322 0.5600
0.3202 0.5800
0.3078 0.6000
0.2950 0.6200
0.2818 0.6400
0.2684 0.6600
0.2546 0.6800
0.2405 0.7000
0.2261 0.7200
0.2115 0.7400
0.1965 0.7600
0.1813 0.7800
0.1659 0.8000
0.1502 0.8200
0.1343 0.8400
0.1182 0.8600
0.1018 0.8800
0.0853 0.9000
0.0685 0.9200
0.0515 0.9400
0.0344 0.9600
0.0170 0.9800
0.0000 0.999 44 Ref. 6
e system at 293.2 K as two phases in equilibrium. This data set presents a much larger
h phase; for a similar alcohol concentration~e.g., 0.390 mole fraction! the heptane con-
value at 298.2 K2 by about 0.130 mole fraction. The compositions of the water-rich phase
ets. McCantset al.1 report saturation and equilibrium data at 310.9 K. At this temperature,
r miscibility gap than those at 298.2 K. One point of the heptane-rich phase~x150.1922 and
tains an experimental error. The paper of Timofeev,et al.4 presents equilibrium data at
e heptane-rich phase are consistent with the results at 298.2 K, but the reported concen-
ter-rich phase seem abnormal high~0.04–0.06 mole fraction!; ~heptane concentrations at 298.2 K were
ole fraction and the temperature dependence is not expected to result such large changes!.
Phases in equilibrium
phases in equilibrium for the ternary system 1-propanol–heptane–water were reported in all five refer-
efs. 2 and 5! are presented in Fig. 25. The distribution of 1-propanol between the phases changes slightly
on. This is observed in the data of Vorobeva and Karapetyants~Ref. 2! at 298.2 K. In the regionx1
-propanol is slightly higher in the heptane-rich phase, while at higher alcohol concentrations, more
phase. Data of Letcheret al.5 confirm this behavior for the low propanol region~all three tie lines are
lines, reported at various temperatures, show similar direction as at 298.2 K with the exception of the
tie lines are in nearly the opposite direction~the direction of tie lines is consistent within this data set!
ther references. Plait points reported by Vorobeya and Karapetyants2 at 298.2 K ~x150.4255 andx2
at 349.4 K~x150.43 andx250.33! are very close to one another. All experimental tie lines as well as
tion curve, Refs. 2 and 5, at 298.2 K, are shown in Fig. 25.
11141114
SK
RZ
EC
Z,
SH
AW
,A
ND
MA
CZ
YN
SK
I
J.P
hys.C
hem.
Ref.
Data,
Vol.
28,N
o.4,
1999
This sconditions. Downloaded to IP: 129.6.105.191 On: Fri, 05 Sep 2014 17:51:55
where:z15(x210.5•x12x209 )/(x208 2x209 ), x1 ,x2—mole fractions of component~1! and ~2!, respectively,x208 ,x209 —values ofx2 on the
binodal curve which cuts thex150 axis.
This equation has been proposed by Letcheret al., Ref. 7, for the description of saturation curves of ternary alcohol–ether–water
systems. It gives better results~the smallest standard deviation! for the investigated system than any other tested equation. The parameters
obtained by the least-squares method for the whole range of miscibility gap~water-rich and hydrocarbon-rich branches were described
together! are:a151.568 77,a250.999 39,a351.289 19. The standard error of estimate was 0.0138. Points for selected concentrations
of heptane on the saturation curve were calculated by the proposed equation. These are presented in Table 51 and Fig. 25 as calculated
binodal curve~solid line!. The maximum concentration of 1-propanol at this temperature is in the region of 0.47060.025~x150.486, Ref.
5; x150.448, calculated!.
trations of heptane in the wa
measured to be about 0.01 m
Compositions of coexisting
ences. The tie lines at 298.2 K~R
with the propanol concentrati
,0.24 the concentration of 1
1-propanol is in the water-rich
located in this region!. Other tie
results of McCantset al.1 These
than those presented in all o
50.3090! and Timofeevet al.4
experimental points on satura
article is copyrighted as indicated in the article. Reuse of AIP content is subject to the terms at: http://scitation.aip.org/term
Components: Evaluated by:
~1! 1-Propanol~n-propanol, propyl alcohol,n-propyl alcohol!;C3H8O; @71-23-8#~2! Heptane~n-heptane!; C7H16; @142-82-5#~3! Water; H2O; @7732-18-5#
A. Skrzecz, Institute of Physical Chemistry, Polish Academy ofSciences, Warsaw, Poland~1997.03!
5.6. 1-Propanol 1 Water 1 Heptane
Critical Evaluation:
A survey of reported compositions along the saturation curve~sat.! and compositions of coexisting phases in equilibrium~eq.! for the
system 1-propanol–heptane–water is given in Table 50.
TABLE 50. Summary of experimental data for the system 1-propanol–heptane–water
Author~s! T/K Type of dataa Ref.
McCantset al., 1953 311 sat.~15!, eq. ~4! 1
Vorobeva and Karapetyants, 1967 298 sat.~16!, eq. ~12! 2
Rabinovich and Pugachevich, 1974 293 eq.~5! 3
Timofeevet al., 1975 348.7–349.5 eq.~5! 4
Letcheret al., 1986 298 sat.~9!, eq. ~3! 5
aNumber of experimental points in parentheses.
Saturation curve
The ternary system 1-propanol–heptane–water forms a large miscibility gap of type 1 covering the majority of the concentration
triangle. The system was reported in the range 293–311 K and at the boiling point~vapor–liquid–liquid equilibria! at 101.3 kPa. Only the
heptane–water binary system forms a miscibility gap. Data of this binary system were compiled and critically evaluated in a previously
published SDS volume.6 The recommended mutual solubilities of the binary system heptane–water at 298.2 K6 are:x2954.3•1027 and
x3855.6•1024. The solubility of water in heptane reported by Ref. 2 is 0.0055 mole fraction~0.001 weight fraction!, which differs from
the recommended value by a factor of 10. This is the result of the method used by Vorobeva and Karapetyants.2 The data sets at 298.2
K,2,5 are consistent with each other, with the exception of the region close to the plait point (0.16,x2,0.43); Letcheret al.5 present a
slightly larger miscibility gap than Vorobeva and Karapetyants.2 The temperature of 298.2 K, as a standard temperature in which various
alcohol–hydrocarbon–water systems are presented, was chosen to present the behavior of this system. Saturation and equilibrium data of
Refs. 2 and 5, were described by the equation:
x15a1•~2ln z1!a2•z1
a3,
TABLE 51. Calcu
x1 x2
0.0000 0.000 000 4
0.2539 0.0200
0.3137 0.0400
0.3522 0.0600
0.3797 0.0800
0.4001 0.1000
0.4155 0.1200
0.4270 0.1400
0.4354 0.1600
0.4414 0.1800
0.4452 0.2000
0.4472 0.2200
0.4477 0.2400
0.4468 0.2600
0.4447 0.2800
0.4414 0.3000
0.4372 0.3200
0.4321 0.3400
0.4261 0.3600
0.4194 0.3800
0.4120 0.4000
0.4039 0.4200
0.3952 0.4400
0.3859 0.4600
0.3762 0.4800
0.3659 0.5000
Rabinovich and Pugachevich3 measured th
miscibility gap particularly in hydrocarbon-ric
centration at saturation point differs from the
at 293.2 K are in agreement with other data s
as was expected, data show a slightly smalle
x250.7009! is an outlyer and presumably con
normal boiling points. The compositions of th

Original Measurements:
panol, propyl alcohol,n-propyl alcohol!;
e!; C7H16; @142-82-5#2-18-5#
J. F. McCants, J. H. Jones, and W. H. Hopson, Ind. Eng. Chem.45, 454–6~1953!.
Compiled by:A. Skrzecz
Experimental DataCompositions along the saturation curve
T/K~compiler!
x1 x2
w1 w2~compiler!
310.9 0.0000 0.9945 0.000 0.999
0.2283 0.7007 0.161 0.824
0.3107 0.5645 0.241 0.730
0.3598 0.4592 0.305 0.649
0.4070 0.2983 0.410 0.501
0.4312 0.2197 0.478 0.406
0.4289 0.1314 0.550 0.281
0.4072 0.0911 0.574 0.214
0.3243 0.0413 0.556 0.118
0.2689 0.0227 0.518 0.073
0.1821 0.0092 0.414 0.035
0.1193 0.0030 0.308 0.013
0.0928 0.0015 0.253 0.007
0.0448 0.0006 0.135 0.003
0.0000 0.0002 0.000 0.001
Compositions of coexisting phases
x18 x28 x19 x29 w18 w28 w19 w29
hydrocarbon-rich phase~compiler!
water-rich phase~compiler!
hydrocarbon-rich phase
water-rich phase
100 310.9 0.1922 0.7009 0.1443 0.0024 0.138 0.839 0.357 0.010
0.3240 0.5227 0.2526 0.0209 0.261 0.702 0.500 0.069a!
0.3064 0.5574 0.2385 0.0183 0.240 0.728 0.485 0.062b!
0.1912 0.7503 0.0883 0.0013 0.131 0.857 0.243 0.006c!
11151115
IUP
AC
-NIS
TS
OLU
BILIT
YD
AT
AS
ER
IESJ.P
hys.C
hem.
Ref.
Data,
Vol.
28,N
o.4,
1999
This terms at: http://scitation.aip.org/termsconditions. Downloaded to IP: 129.6.105.191 On: Fri, 05 Sep 2014 17:51:55
article is copyrighted as indicated in the article. Reuse of AIP content is subject to theFIG. 25. Phase diagram of the system 1-propanol~1!—heptane~2!—water ~3! at 298.2 K. Solid line—calculated saturation curve,s—experimental data, Ref. 2,h—experimental data, Ref. 5, dashed lines—experimental tie lines, Refs. 2 and 5.
References:1J. F. McCants, J. H. Jones, and W. H. Hopson, Ind. Eng. Chem.45, 454 ~1953!.2A. I. Vorobeva and M. Kh. Karapetyants, Zh. Fiz. Khim.41, 1144~1969!.3I. I. Rabinovich and P. P. Pugachevich, Zh. Fiz. Khim.48, 2525~1974!.4V. S. Timofeev, V. Yu. Aristovich, I. I. Sabylin, V. A. Koshel’kov, T. G. Pavlenko, and L. A. Serafimov, Izv. Vyssh, Uchebn.Zaved., Khim. Khim. Tekhnol.18, 1219~1975!.5T. M. Letcher, S. Wootton, B. Shuttleworth, and C. Heyward, J. Chem. Thermodyn.18, 1037~1986!.6D. G. Shaw, ed.,Solubility Data Series,Vol. 37, Hydrocarbons with Water and Seawater, Part I. Hydrocarbons C5 to C7 ~Pergamon,New York, 1989!.7T. M. Letcher, S. Ravindran, and S. E. Radloff, Fluid Phase Equilib.69, 251 ~1991!.
Components:
~1! 1-Propanol~n-proC3H8O; @71-23-8#~2! Heptane~n-heptan~3! Water; H2O; @773
Variables:T/K5311
t/ °F
100
t/ °FT/K
~compiler!
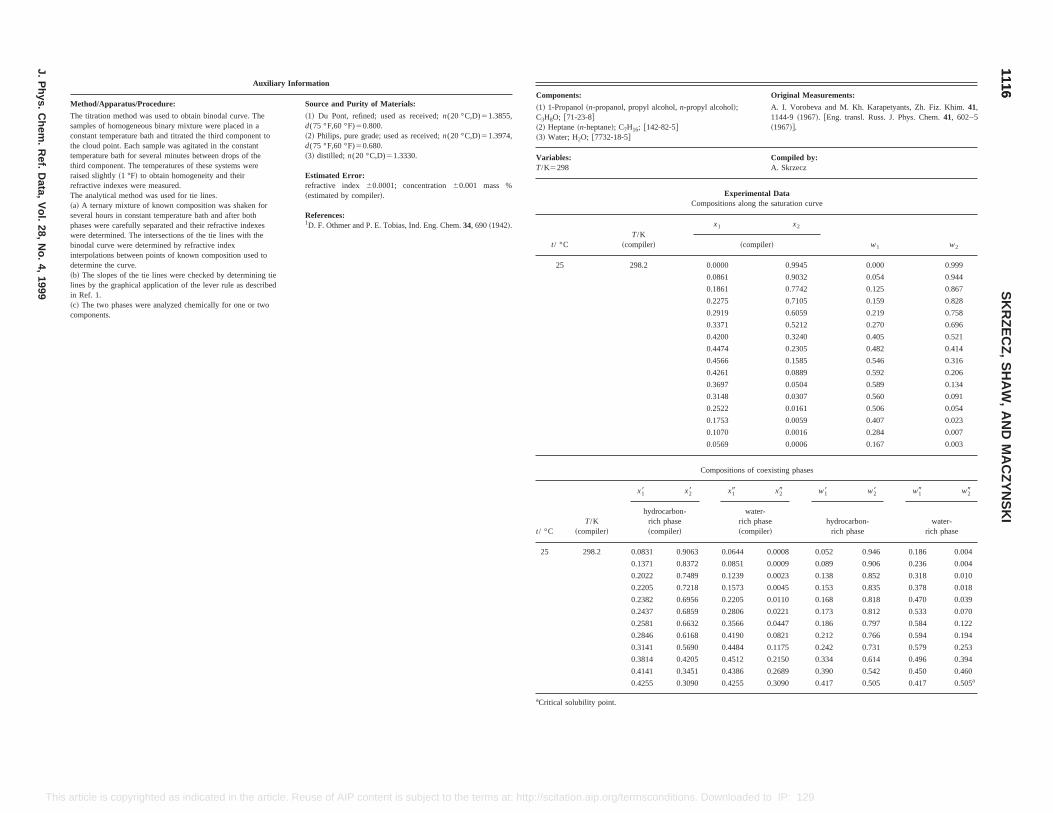
Original Measurements:
hol!; A. I. Vorobeva and M. Kh. Karapetyants, Zh. Fiz. Khim.41,1144-9 ~1967!. @Eng. transl. Russ. J. Phys. Chem.41, 602–5~1967!#.
Compiled by:A. Skrzecz
Experimental Datations along the saturation curve
x2
w1 w2~compiler!
00 0.9945 0.000 0.999
1 0.9032 0.054 0.944
1 0.7742 0.125 0.867
5 0.7105 0.159 0.828
9 0.6059 0.219 0.758
1 0.5212 0.270 0.696
0 0.3240 0.405 0.521
4 0.2305 0.482 0.414
6 0.1585 0.546 0.316
1 0.0889 0.592 0.206
7 0.0504 0.589 0.134
8 0.0307 0.560 0.091
2 0.0161 0.506 0.054
3 0.0059 0.407 0.023
0 0.0016 0.284 0.007
9 0.0006 0.167 0.003
sitions of coexisting phases
t/ °C ~compiler!
x19 x29 w18 w28 w19 w29
~compiler!
water-rich phase~compiler!
hydrocarbon-rich phase
water-rich phase
25 298.2 0.0831 0.9063 0.0644 0.0008 0.052 0.946 0.186 0.004
0.1371 0.8372 0.0851 0.0009 0.089 0.906 0.236 0.004
0.2022 0.7489 0.1239 0.0023 0.138 0.852 0.318 0.010
0.2205 0.7218 0.1573 0.0045 0.153 0.835 0.378 0.018
0.2382 0.6956 0.2205 0.0110 0.168 0.818 0.470 0.039
0.2437 0.6859 0.2806 0.0221 0.173 0.812 0.533 0.070
0.2581 0.6632 0.3566 0.0447 0.186 0.797 0.584 0.122
0.2846 0.6168 0.4190 0.0821 0.212 0.766 0.594 0.194
0.3141 0.5690 0.4484 0.1175 0.242 0.731 0.579 0.253
0.3814 0.4205 0.4512 0.2150 0.334 0.614 0.496 0.394
0.4141 0.3451 0.4386 0.2689 0.390 0.542 0.450 0.460
0.4255 0.3090 0.4255 0.3090 0.417 0.505 0.417 0.505a
aCritical solubility point.
11161116
SK
RZ
EC
Z,
SH
AW
,A
ND
MA
CZ
YN
SK
I
J.P
hys.C
hem.
Ref.
Data,
Vol.
28,N
o.4,
1999
This IP content is subject to the terms at: http://scitation.aip.org/termsconditions. Downloaded to IP: 129.6.105.191 On: Fri, 05 Sep 2014 17:51:55
article is copyrighted as indicated in the article. Reuse of AAuxiliary Information
Method/Apparatus/Procedure: Source and Purity of Materials:
The titration method was used to obtain binodal curve. Thesamples of homogeneous binary mixture were placed in aconstant temperature bath and titrated the third component tothe cloud point. Each sample was agitated in the constanttemperature bath for several minutes between drops of thethird component. The temperatures of these systems wereraised slightly~1 °F! to obtain homogeneity and theirrefractive indexes were measured.The analytical method was used for tie lines.~a! A ternary mixture of known composition was shaken forseveral hours in constant temperature bath and after bothphases were carefully separated and their refractive indexeswere determined. The intersections of the tie lines with thebinodal curve were determined by refractive indexinterpolations between points of known composition used todetermine the curve.~b! The slopes of the tie lines were checked by determining tielines by the graphical application of the lever rule as describedin Ref. 1.~c! The two phases were analyzed chemically for one or twocomponents.
~1! Du Pont, refined; used as received;n(20 °C,D)51.3855,d(75 °F,60 °F)50.800.~2! Philips, pure grade; used as received;n(20 °C,D)51.3974,d(75 °F,60 °F)50.680.~3! distilled; n(20 °C,D)51.3330.
Estimated Error:refractive index 60.0001; concentration60.001 mass %~estimated by compiler!.
References:1D. F. Othmer and P. E. Tobias, Ind. Eng. Chem.34, 690~1942!.
Components:
~1! 1-Propanol~n-propanol, propyl alcohol,n-propyl alcoC3H8O; @71-23-8#~2! Heptane~n-heptane!; C7H16; @142-82-5#~3! Water; H2O; @7732-18-5#
Variables:T/K5298
Composi
t/ °CT/K
~compiler!
x1
25 298.2 0.00
0.086
0.186
0.227
0.291
0.337
0.420
0.447
0.456
0.426
0.369
0.314
0.252
0.175
0.107
0.056
Compo
T/K
x18 x28
hydrocarbon-rich phase
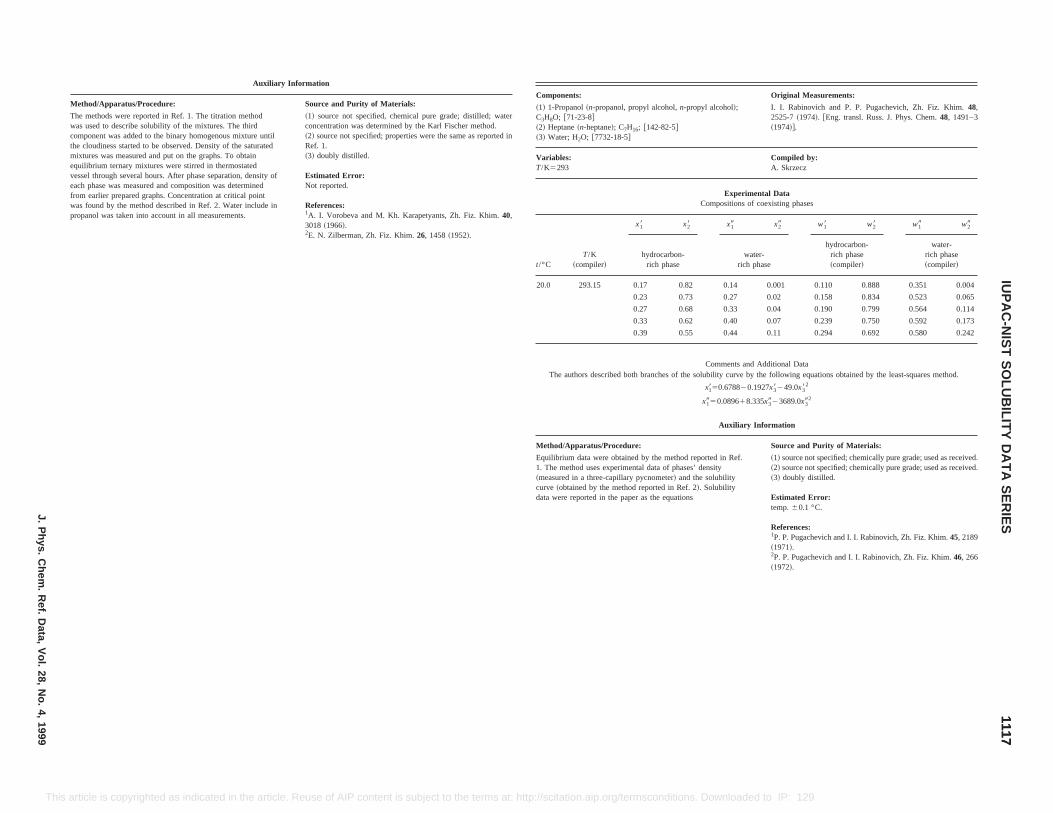
Original Measurements:
n-propanol, propyl alcohol,n-propyl alcohol!;8#eptane!; C7H16; @142-82-5#@7732-18-5#
I. I. Rabinovich and P. P. Pugachevich, Zh. Fiz. Khim.48,2525-7 ~1974!. @Eng. transl. Russ. J. Phys. Chem.48, 1491–3~1974!#.
Compiled by:A. Skrzecz
Experimental DataCompositions of coexisting phases
/Kpiler!
x18 x28 x19 x29 w18 w28 w19 w29
hydrocarbon-rich phase
water-rich phase
hydrocarbon-rich phase~compiler!
water-rich phase~compiler!
3.15 0.17 0.82 0.14 0.001 0.110 0.888 0.351 0.004
0.23 0.73 0.27 0.02 0.158 0.834 0.523 0.065
0.27 0.68 0.33 0.04 0.190 0.799 0.564 0.114
0.33 0.62 0.40 0.07 0.239 0.750 0.592 0.173
0.39 0.55 0.44 0.11 0.294 0.692 0.580 0.242
Comments and Additional Datas described both branches of the solubility curve by the following equations obtained by the least-squares method.
x1850.678820.1927x38249.0x382
x1950.089618.335x3923689.0x392
Auxiliary Information
tus/Procedure: Source and Purity of Materials:
a were obtained by the method reported in Ref.uses experimental data of phases’ densitythree-capillary pycnometer! and the solubilityby the method reported in Ref. 2!. Solubilityrted in the paper as the equations
~1! source not specified; chemically pure grade; used as received.~2! source not specified; chemically pure grade; used as received.~3! doubly distilled.
Estimated Error:temp.60.1 °C.
References:1P. P. Pugachevich and I. I. Rabinovich, Zh. Fiz. Khim.45, 2189~1971!.2P. P. Pugachevich and I. I. Rabinovich, Zh. Fiz. Khim.46, 266~1972!.
11171117
IUP
AC
-NIS
TS
OLU
BILIT
YD
AT
AS
ER
IESJ.P
hys.C
hem.
Ref.
Data,
Vol.
28,N
o.4,
1999
This article. Reuse of AIP content is subject to the terms at: http://scitation.aip.org/termsconditions. Downloaded to IP: 129.6.105.191 On: Fri, 05 Sep 2014 17:51:55
article is copyrighted as indicated in theAuxiliary Information
Method/Apparatus/Procedure: Source and Purity of Materials:
The methods were reported in Ref. 1. The titration methodwas used to describe solubility of the mixtures. The thirdcomponent was added to the binary homogenous mixture untilthe cloudiness started to be observed. Density of the saturatedmixtures was measured and put on the graphs. To obtainequilibrium ternary mixtures were stirred in thermostatedvessel through several hours. After phase separation, density ofeach phase was measured and composition was determinedfrom earlier prepared graphs. Concentration at critical pointwas found by the method described in Ref. 2. Water include inpropanol was taken into account in all measurements.
~1! source not specified, chemical pure grade; distilled; waterconcentration was determined by the Karl Fischer method.~2! source not specified; properties were the same as reported inRef. 1.~3! doubly distilled.
Estimated Error:Not reported.
References:1A. I. Vorobeva and M. Kh. Karapetyants, Zh. Fiz. Khim.40,3018 ~1966!.2E. N. Zilberman, Zh. Fiz. Khim.26, 1458~1952!.
Components:
~1! 1-Propanol~C3H8O; @71-23-~2! Heptane~n-h~3! Water; H2O;
Variables:T/K5293
t/°CT
~com
20.0 29
The author
Method/Appara
Equilibrium dat1. The method~measured in acurve ~obtaineddata were repo
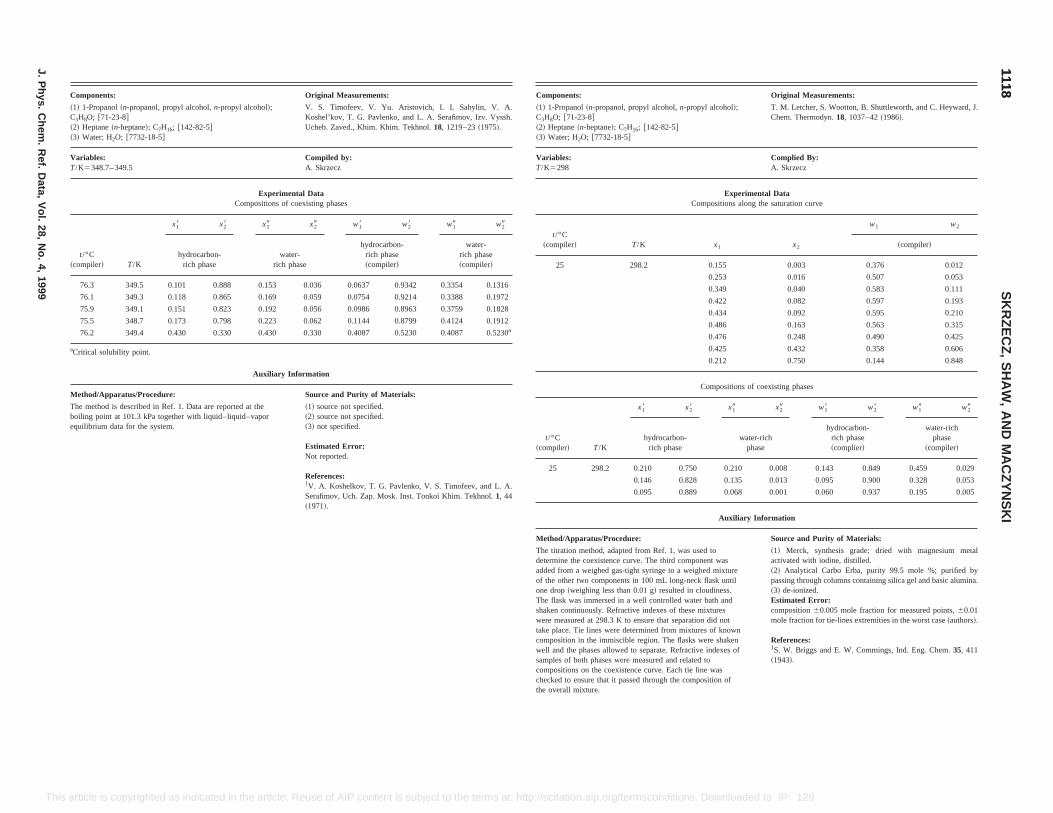
C
~1C3
~2~3
VaT/
~c
aC
M
Thboeq
Original Measurements:
yl alcohol!; T. M. Letcher, S. Wootton, B. Shuttleworth, and C. Heyward, J.Chem. Thermodyn.18, 1037–42~1986!.
Complied By:A. Skrzecz
Experimental Datampositions along the saturation curve
x1 x2
w1 w2
~compiler!
0.155 0.003 0.376 0.012
0.253 0.016 0.507 0.053
0.349 0.040 0.583 0.111
0.422 0.082 0.597 0.193
0.434 0.092 0.595 0.210
0.486 0.163 0.563 0.315
0.476 0.248 0.490 0.425
0.425 0.432 0.358 0.606
0.212 0.750 0.144 0.848
Compositions of coexisting phases
x19 x29 w18 w28 w19 w29
water-richphase
hydrocarbon-rich phase~complier!
water-richphase
~compiler!
0 0.210 0.008 0.143 0.849 0.459 0.029
0.135 0.013 0.095 0.900 0.328 0.053
0.068 0.001 0.060 0.937 0.195 0.005
Auxiliary Information
Method/Apparatus/Procedure: Source and Purity of Materials:
The titration method, adapted from Ref. 1, was used todetermine the coexistence curve. The third component wasadded from a weighed gas-tight syringe to a weighed mixtureof the other two components in 100 mL long-neck flask untilone drop~weighing less than 0.01 g! resulted in cloudiness.The flask was immersed in a well controlled water bath andshaken continuously. Refractive indexes of these mixtureswere measured at 298.3 K to ensure that separation did nottake place. Tie lines were determined from mixtures of knowncomposition in the immiscible region. The flasks were shakenwell and the phases allowed to separate. Refractive indexes ofsamples of both phases were measured and related tocompositions on the coexistence curve. Each tie line waschecked to ensure that it passed through the composition ofthe overall mixture.
~1! Merck, synthesis grade; dried with magnesium metalactivated with iodine, distilled.~2! Analytical Carbo Erba, purity 99.5 mole %; purified bypassing through columns containing silica gel and basic alumina.~3! de-ionized.Estimated Error:composition60.005 mole fraction for measured points,60.01mole fraction for tie-lines extremities in the worst case~authors!.
References:1S. W. Briggs and E. W. Commings, Ind. Eng. Chem.35, 411~1943!.
11181118
SK
RZ
EC
Z,
SH
AW
,A
ND
MA
CZ
YN
SK
I
J.P
hys.C
hem.
Ref.
Data,
Vol.
28,N
o.4,
1999
This a ttp://scitation.aip.org/termsconditions. Downloaded to IP: 129.6.105.191 On: Fri, 05 Sep 2014 17:51:55
rticle is copyrighted as indicated in the article. Reuse of AIP content is subject to the terms at: homponents: Original Measurements:
! 1-Propanol~n-propanol, propyl alcohol,n-propyl alcohol!;H8O; @71-23-8#! Heptane~n-heptane!; C7H16; @142-82-5#! Water; H2O; @7732-18-5#
V. S. Timofeev, V. Yu. Aristovich, I. I. Sabylin, V. A.Koshel’kov, T. G. Pavlenko, and L. A. Serafimov, Izv. Vyssh.Ucheb. Zaved., Khim. Khim. Tekhnol.18, 1219–23~1975!.
riables:K5348.7– 349.5
Compiled by:A. Skrzecz
Experimental DataCompositions of coexisting phases
t/°Compiler! T/K
x18 x28 x19 x29 w18 w28 w19 w29
hydrocarbon-rich phase
water-rich phase
hydrocarbon-rich phase~compiler!
water-rich phase~compiler!
76.3 349.5 0.101 0.888 0.153 0.036 0.0637 0.9342 0.3354 0.1316
76.1 349.3 0.118 0.865 0.169 0.059 0.0754 0.9214 0.3388 0.1972
75.9 349.1 0.151 0.823 0.192 0.056 0.0986 0.8963 0.3759 0.1828
75.5 348.7 0.173 0.798 0.223 0.062 0.1144 0.8799 0.4124 0.1912
76.2 349.4 0.430 0.330 0.430 0.330 0.4087 0.5230 0.4087 0.5230a
ritical solubility point.
Auxiliary Information
ethod/Apparatus/Procedure: Source and Purity of Materials:
e method is described in Ref. 1. Data are reported at theiling point at 101.3 kPa together with liquid–liquid–vaporuilibrium data for the system.
~1! source not specified.~2! source not specified.~3! not specified.
Estimated Error:Not reported.
References:1V. A. Koshelkov, T. G. Pavlenko, V. S. Timofeev, and L. A.Serafimov, Uch. Zap. Mosk. Inst. Tonkoi Khim. Tekhnol.1, 44~1971!.
Components:
~1! 1-Propanol~n-propanol, propyl alcohol,n-propC3H8O; @71-23-8#~2! Heptane~n-heptane!; C7H16; @142-82-5#~3! Water; H2O; @7732-18-5#
Variables:T/K5298
Co
t/°C~compiler! T/K
25 298.2
t/°C~compiler! T/K
x18 x28
hydrocarbon-rich phase
25 298.2 0.210 0.75
0.146 0.828
0.095 0.889
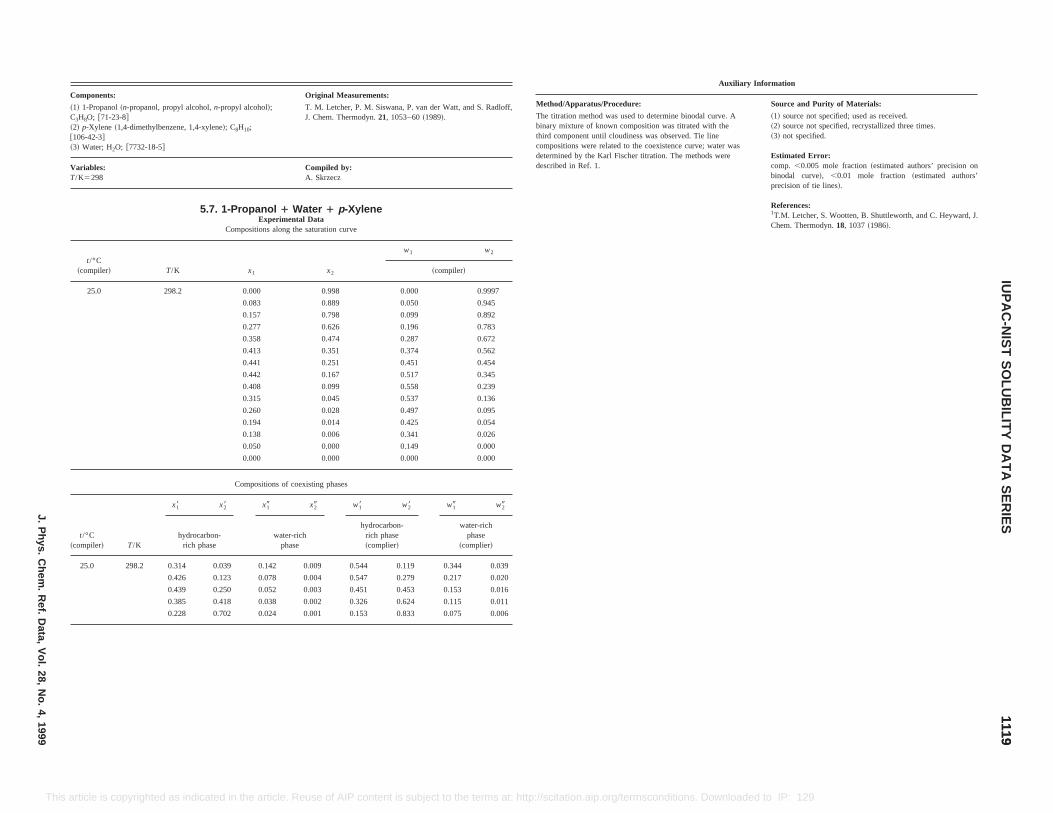
Original Measurements:
l alcohol!;
10;
T. M. Letcher, P. M. Siswana, P. van der Watt, and S. Radloff,J. Chem. Thermodyn.21, 1053–60~1989!.
Compiled by:A. Skrzecz
opanol 1 Water 1 p-XyleneExperimental Data
positions along the saturation curve
x1 x2
w1 w2
~compiler!
0.000 0.998 0.000 0.9997
0.083 0.889 0.050 0.945
0.157 0.798 0.099 0.892
0.277 0.626 0.196 0.783
0.358 0.474 0.287 0.672
0.413 0.351 0.374 0.562
0.441 0.251 0.451 0.454
0.442 0.167 0.517 0.345
0.408 0.099 0.558 0.239
0.315 0.045 0.537 0.136
0.260 0.028 0.497 0.095
0.194 0.014 0.425 0.054
0.138 0.006 0.341 0.026
0.050 0.000 0.149 0.000
0.000 0.000 0.000 0.000
ompositions of coexisting phases
x19 x29 w18 w28 w19 w29
hydrocarbon- water-rich
Auxiliary Information
Method/Apparatus/Procedure: Source and Purity of Materials:
The titration method was used to determine binodal curve. Abinary mixture of known composition was titrated with thethird component until cloudiness was observed. Tie linecompositions were related to the coexistence curve; water wasdetermined by the Karl Fischer titration. The methods weredescribed in Ref. 1.
~1! source not specified; used as received.~2! source not specified, recrystallized three times.~3! not specified.
Estimated Error:comp. ,0.005 mole fraction~estimated authors’ precision onbinodal curve!, ,0.01 mole fraction ~estimated authors’precision of tie lines!.
References:1T.M. Letcher, S. Wootten, B. Shuttleworth, and C. Heyward, J.Chem. Thermodyn.18, 1037~1986!.
11191119
IUP
AC
-NIS
TS
OLU
BILIT
YD
AT
AS
ER
IESJ.P
hys.C
hem.
Ref.
Data,
Vol.
28,N
o.4,
1999
This conditions. Downloaded to IP: 129.6.105.191 On: Fri, 05 Sep 2014 17:51:55
t/°C~compiler! T/K
hydrocarbon-rich phase
water-richphase
rich phase~complier!
phase~complier!
25.0 298.2 0.314 0.039 0.142 0.009 0.544 0.119 0.344 0.039
0.426 0.123 0.078 0.004 0.547 0.279 0.217 0.020
0.439 0.250 0.052 0.003 0.451 0.453 0.153 0.016
0.385 0.418 0.038 0.002 0.326 0.624 0.115 0.011
0.228 0.702 0.024 0.001 0.153 0.833 0.075 0.006
article is copyrighted as indicated in the article. Reuse of AIP content is subject to the terms at: http://scitation.aip.org/terms
Components:
~1! 1-Propanol~n-propanol, propyl alcohol,n-propyC3H8O; @71-23-8#~2! p-Xylene ~1,4-dimethylbenzene, 1,4-xylene!; C8H@106-42-3#~3! Water; H2O; @7732-18-5#
Variables:T/K5298
5.7. 1-Pr
Com
t/°C~compiler! T/K
25.0 298.2
C
x18 x28
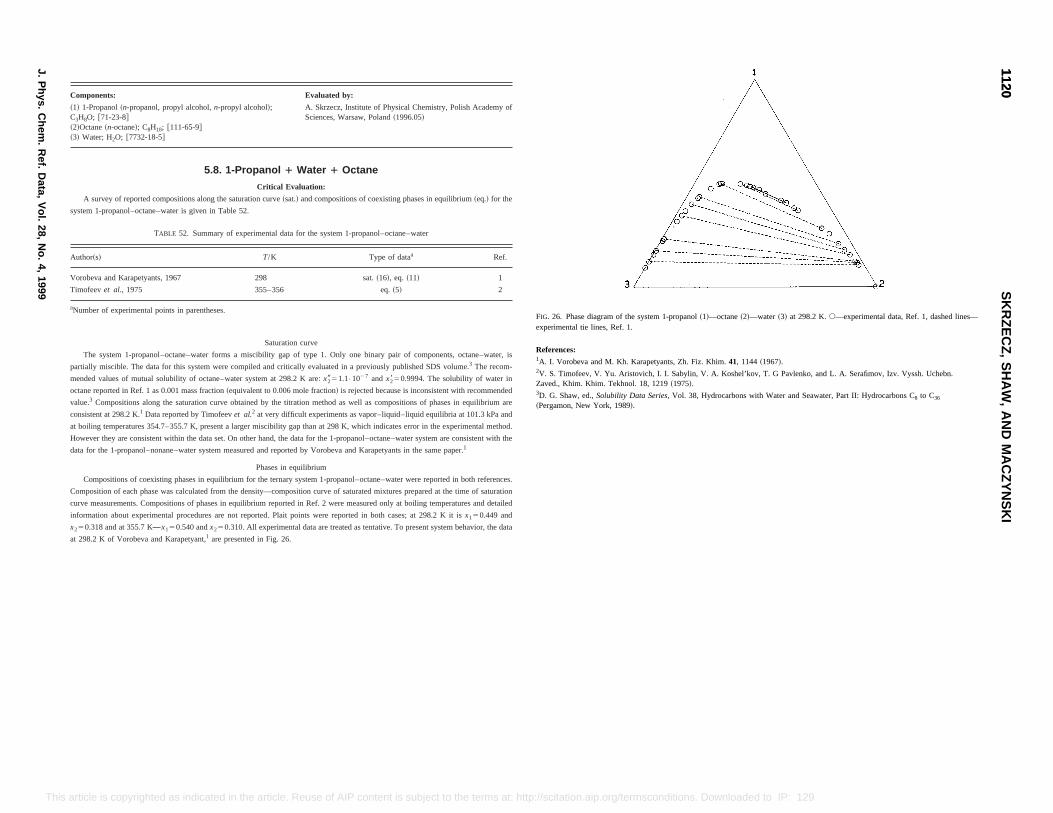
hemistry, Polish Academy of
ses in equilibrium~eq.! for the
–water
Ref.
1
2
of components, octane–water, is
blished SDS volume.3 The recom-
. The solubility of water in
consistent with recommended
itions of phases in equilibrium are
id equilibria at 101.3 kPa and
s error in the experimental method.
water system are consistent with the
nts in the same paper.1
r were reported in both references.
s prepared at the time of saturation
at boiling temperatures and detailed
es; at 298.2 K it isx150.449 and
x 50.318 and at 355.7 K—x 50.540 andx 50.310. All experimental data are treated as tentative. To present system behavior, the data
FIG. 26. Phase diagram of the system 1-propanol~1!—octane~2!—water ~3! at 298.2 K.s—experimental data, Ref. 1, dashed lines—experimental tie lines, Ref. 1.
References:1A. I. Vorobeva and M. Kh. Karapetyants, Zh. Fiz. Khim.41, 1144~1967!.2V. S. Timofeev, V. Yu. Aristovich, I. I. Sabylin, V. A. Koshel’kov, T. G Pavlenko, and L. A. Serafimov, Izv. Vyssh. Uchebn.Zaved., Khim. Khim. Tekhnol. 18, 1219~1975!.3D. G. Shaw, ed.,Solubility Data Series, Vol. 38, Hydrocarbons with Water and Seawater, Part II: Hydrocarbons C8 to C36
~Pergamon, New York, 1989!.
11201120
SK
RZ
EC
Z,
SH
AW
,A
ND
MA
CZ
YN
SK
I
J.P
hys.C
hem.
Ref.
Data,
Vol.
28,N
o.4,
1999
This tation.aip.org/termsconditions. Downloaded to IP: 129.6.105.191 On: Fri, 05 Sep 2014 17:51:55
2 1 2
at 298.2 K of Vorobeva and Karapetyant,1 are presented in Fig. 26.
article is copyrighted as indicated in the article. Reuse of AIP content is subject to the terms at: http://sci
Components: Evaluated by:
~1! 1-Propanol~n-propanol, propyl alcohol,n-propyl alcohol!;C3H8O; @71-23-8#~2!Octane~n-octane!; C8H18; @111-65-9#~3! Water; H2O; @7732-18-5#
A. Skrzecz, Institute of Physical CSciences, Warsaw, Poland~1996.05!
5.8. 1-Propanol 1 Water 1 Octane
Critical Evaluation:
A survey of reported compositions along the saturation curve~sat.! and compositions of coexisting pha
system 1-propanol–octane–water is given in Table 52.
TABLE 52. Summary of experimental data for the system 1-propanol–octane
Author~s! T/K Type of dataa
Vorobeva and Karapetyants, 1967 298 sat.~16!, eq. ~11!
Timofeevet al., 1975 355–356 eq.~5!
aNumber of experimental points in parentheses.
Saturation curve
The system 1-propanol–octane–water forms a miscibility gap of type 1. Only one binary pair
partially miscible. The data for this system were compiled and critically evaluated in a previously pu
mended values of mutual solubility of octane–water system at 298.2 K are:x2951.1•1027 and x2850.9994
octane reported in Ref. 1 as 0.001 mass fraction~equivalent to 0.006 mole fraction! is rejected because is in
value.3 Compositions along the saturation curve obtained by the titration method as well as compos
consistent at 298.2 K.1 Data reported by Timofeevet al.2 at very difficult experiments as vapor–liquid–liqu
at boiling temperatures 354.7–355.7 K, present a larger miscibility gap than at 298 K, which indicate
However they are consistent within the data set. On other hand, the data for the 1-propanol–octane–
data for the 1-propanol–nonane–water system measured and reported by Vorobeva and Karapetya
Phases in equilibrium
Compositions of coexisting phases in equilibrium for the ternary system 1-propanol–octane–wate
Composition of each phase was calculated from the density—composition curve of saturated mixture
curve measurements. Compositions of phases in equilibrium reported in Ref. 2 were measured only
information about experimental procedures are not reported. Plait points were reported in both cas
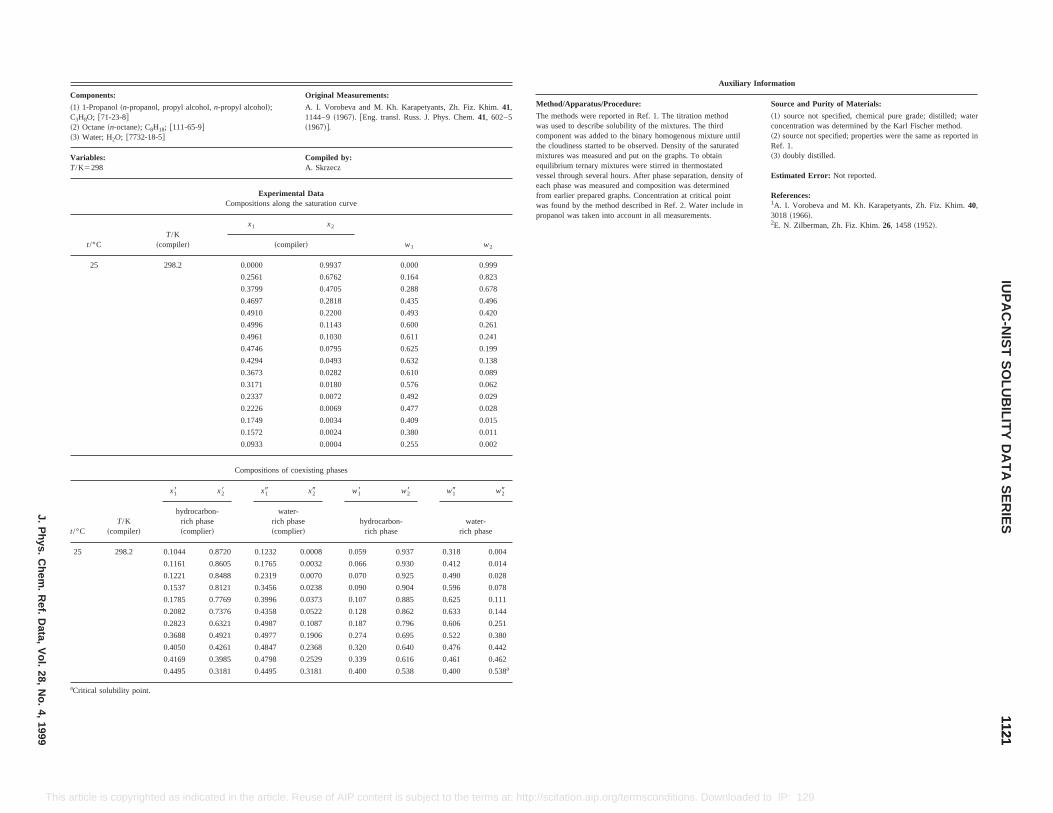
Original Measurements:
l alcohol!; A. I. Vorobeva and M. Kh. Karapetyants, Zh. Fiz. Khim.41,1144–9~1967!. @Eng. transl. Russ. J. Phys. Chem.41, 602–5~1967!#.
Compiled by:A. Skrzecz
Experimental Datapositions along the saturation curve
x1 x2
w1 w2~compiler!
0.0000 0.9937 0.000 0.999
0.2561 0.6762 0.164 0.823
0.3799 0.4705 0.288 0.678
0.4697 0.2818 0.435 0.496
0.4910 0.2200 0.493 0.420
0.4996 0.1143 0.600 0.261
0.4961 0.1030 0.611 0.241
0.4746 0.0795 0.625 0.199
0.4294 0.0493 0.632 0.138
0.3673 0.0282 0.610 0.089
0.3171 0.0180 0.576 0.062
0.2337 0.0072 0.492 0.029
0.2226 0.0069 0.477 0.028
0.1749 0.0034 0.409 0.015
0.1572 0.0024 0.380 0.011
0.0933 0.0004 0.255 0.002
ompositions of coexisting phases
x19 x29 w18 w28 w19 w29
water-rich phase hydrocarbon- water-
Auxiliary Information
Method/Apparatus/Procedure: Source and Purity of Materials:
The methods were reported in Ref. 1. The titration methodwas used to describe solubility of the mixtures. The thirdcomponent was added to the binary homogenous mixture untilthe cloudiness started to be observed. Density of the saturatedmixtures was measured and put on the graphs. To obtainequilibrium ternary mixtures were stirred in thermostatedvessel through several hours. After phase separation, density ofeach phase was measured and composition was determinedfrom earlier prepared graphs. Concentration at critical pointwas found by the method described in Ref. 2. Water include inpropanol was taken into account in all measurements.
~1! source not specified, chemical pure grade; distilled; waterconcentration was determined by the Karl Fischer method.~2! source not specified; properties were the same as reported inRef. 1.~3! doubly distilled.
Estimated Error: Not reported.
References:1A. I. Vorobeva and M. Kh. Karapetyants, Zh. Fiz. Khim.40,3018 ~1966!.2E. N. Zilberman, Zh. Fiz. Khim.26, 1458~1952!.
11211121
IUP
AC
-NIS
TS
OLU
BILIT
YD
AT
AS
ER
IESJ.P
hys.C
hem.
Ref.
Data,
Vol.
28,N
o.4,
1999
This ownloaded to IP: 129.6.105.191 On: Fri, 05 Sep 2014 17:51:55
t/°C ~compiler! ~complier! ~complier! rich phase rich phase
25 298.2 0.1044 0.8720 0.1232 0.0008 0.059 0.937 0.318 0.004
0.1161 0.8605 0.1765 0.0032 0.066 0.930 0.412 0.014
0.1221 0.8488 0.2319 0.0070 0.070 0.925 0.490 0.028
0.1537 0.8121 0.3456 0.0238 0.090 0.904 0.596 0.078
0.1785 0.7769 0.3996 0.0373 0.107 0.885 0.625 0.111
0.2082 0.7376 0.4358 0.0522 0.128 0.862 0.633 0.144
0.2823 0.6321 0.4987 0.1087 0.187 0.796 0.606 0.251
0.3688 0.4921 0.4977 0.1906 0.274 0.695 0.522 0.380
0.4050 0.4261 0.4847 0.2368 0.320 0.640 0.476 0.442
0.4169 0.3985 0.4798 0.2529 0.339 0.616 0.461 0.462
0.4495 0.3181 0.4495 0.3181 0.400 0.538 0.400 0.538a
aCritical solubility point.
article is copyrighted as indicated in the article. Reuse of AIP content is subject to the terms at: http://scitation.aip.org/termsconditions. D
Components:
~1! 1-Propanol~n-propanol, propyl alcohol,n-propyC3H8O; @71-23-8#~2! Octane~n-octane!; C8H18; @111-65-9#~3! Water; H2O; @7732-18-5#
Variables:T/K5298
Com
t/°CT/K
~compiler!
25 298.2
C
T/K
x18 x28
hydrocarbon-rich phase
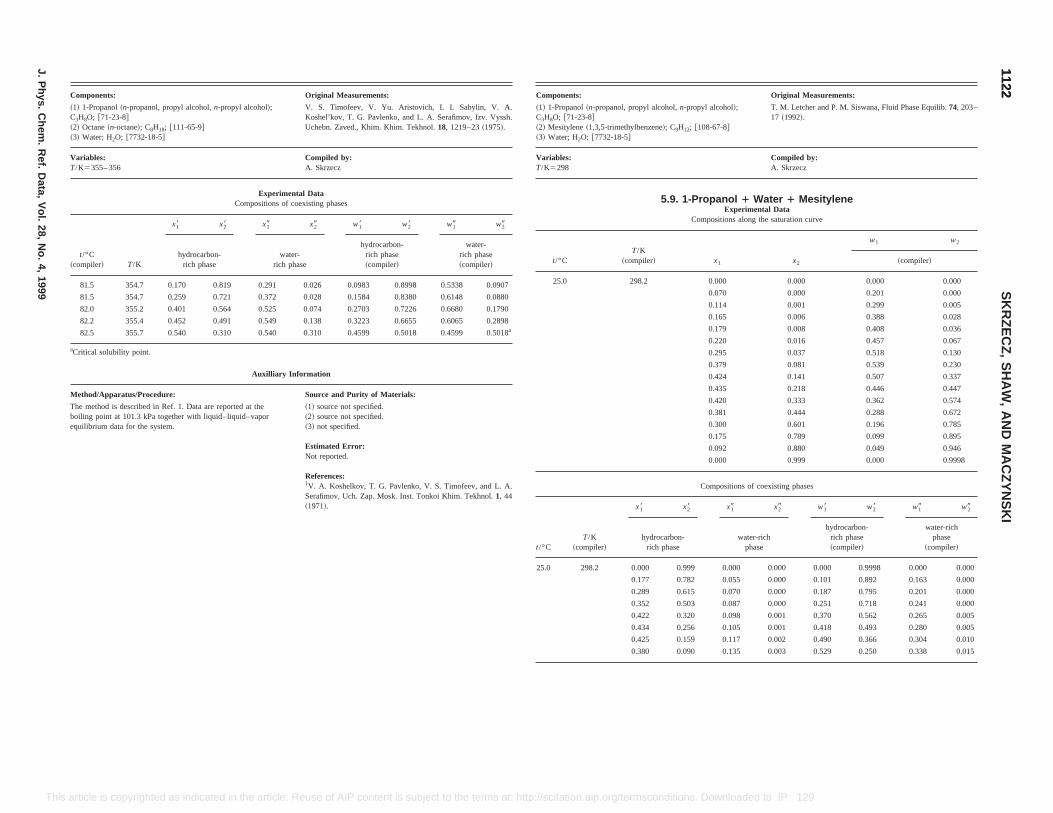
Original Measurements:
ol,n-propyl alcohol!;
9H12; @108-67-8#
T. M. Letcher and P. M. Siswana, Fluid Phase Equilib.74, 203–17 ~1992!.
Compiled by:A. Skrzecz
. 1-Propanol 1 Water 1 MesityleneExperimental Data
Compositions along the saturation curve
x1 x2
w1 w2
~compiler!
0.000 0.000 0.000 0.000
0.070 0.000 0.201 0.000
0.114 0.001 0.299 0.005
0.165 0.006 0.388 0.028
0.179 0.008 0.408 0.036
0.220 0.016 0.457 0.067
0.295 0.037 0.518 0.130
0.379 0.081 0.539 0.230
0.424 0.141 0.507 0.337
0.435 0.218 0.446 0.447
0.420 0.333 0.362 0.574
0.381 0.444 0.288 0.672
0.300 0.601 0.196 0.785
0.175 0.789 0.099 0.895
0.092 0.880 0.049 0.946
0.000 0.999 0.000 0.9998
Compositions of coexisting phases
t/°CT/K
~compiler!
x28 x19 x29 w18 w28 w19 w29
hydrocarbon-rich phase
water-richphase
hydrocarbon-rich phase~compiler!
water-richphase
~compiler!
25.0 298.2 0.000 0.999 0.000 0.000 0.000 0.9998 0.000 0.000
0.177 0.782 0.055 0.000 0.101 0.892 0.163 0.000
0.289 0.615 0.070 0.000 0.187 0.795 0.201 0.000
0.352 0.503 0.087 0.000 0.251 0.718 0.241 0.000
0.422 0.320 0.098 0.001 0.370 0.562 0.265 0.005
0.434 0.256 0.105 0.001 0.418 0.493 0.280 0.005
0.425 0.159 0.117 0.002 0.490 0.366 0.304 0.010
0.380 0.090 0.135 0.003 0.529 0.250 0.338 0.015
11221122
SK
RZ
EC
Z,
SH
AW
,A
ND
MA
CZ
YN
SK
I
J.P
hys.C
hem.
Ref.
Data,
Vol.
28,N
o.4,
1999
This ttp://scitation.aip.org/termsconditions. Downloaded to IP: 129.6.105.191 On: Fri, 05 Sep 2014 17:51:55
article is copyrighted as indicated in the article. Reuse of AIP content is subject to the terms at: hComponents: Original Measurements:
~1! 1-Propanol~n-propanol, propyl alcohol,n-propyl alcohol!;C3H8O; @71-23-8#~2! Octane~n-octane!; C8H18; @111-65-9#~3! Water; H2O; @7732-18-5#
V. S. Timofeev, V. Yu. Aristovich, I. I. Sabylin, V. A.Koshel’kov, T. G. Pavlenko, and L. A. Serafimov, Izv. Vyssh.Uchebn. Zaved., Khim. Khim. Tekhnol.18, 1219–23~1975!.
Variables:T/K5355– 356
Compiled by:A. Skrzecz
Experimental DataCompositions of coexisting phases
t/°C~compiler! T/K
x18 x28 x19 x29 w18 w28 w19 w29
hydrocarbon-rich phase
water-rich phase
hydrocarbon-rich phase~compiler!
water-rich phase~compiler!
81.5 354.7 0.170 0.819 0.291 0.026 0.0983 0.8998 0.5338 0.0907
81.5 354.7 0.259 0.721 0.372 0.028 0.1584 0.8380 0.6148 0.0880
82.0 355.2 0.401 0.564 0.525 0.074 0.2703 0.7226 0.6680 0.1790
82.2 355.4 0.452 0.491 0.549 0.138 0.3223 0.6655 0.6065 0.2898
82.5 355.7 0.540 0.310 0.540 0.310 0.4599 0.5018 0.4599 0.5018a
aCritical solubility point.
Auxilliary Information
Method/Apparatus/Procedure: Source and Purity of Materials:
The method is described in Ref. 1. Data are reported at theboiling point at 101.3 kPa together with liquid–liquid–vaporequilibrium data for the system.
~1! source not specified.~2! source not specified.~3! not specified.
Estimated Error:Not reported.
References:1V. A. Koshelkov, T. G. Pavlenko, V. S. Timofeev, and L. A.Serafimov, Uch. Zap. Mosk. Inst. Tonkoi Khim. Tekhnol.1, 44~1971!.
Components:
~1! 1-Propanol~n-propanol, propyl alcohC3H8O; @71-23-8#~2! Mesitylene~1,3,5-trimethylbenzene!; C~3! Water; H2O; @7732-18-5#
Variables:T/K5298
5.9
t/°CT/K
~compiler!
25.0 298.2
x18
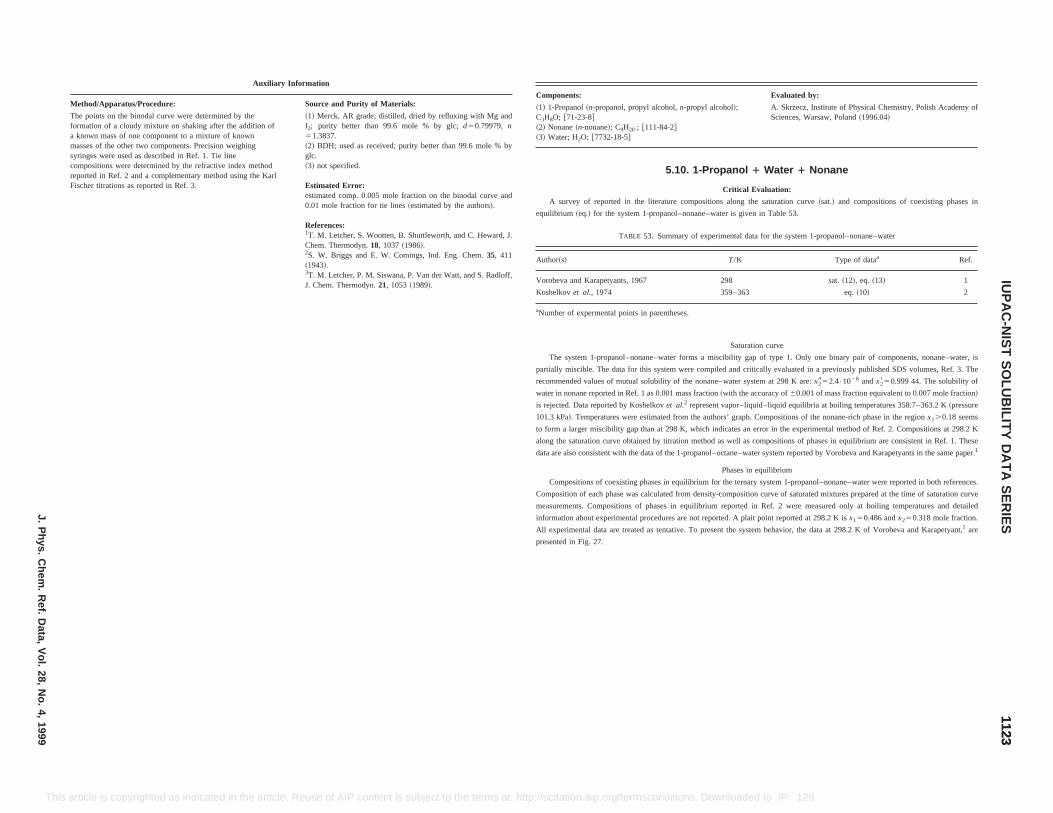
nents: Evaluated by:
ropanol~n-propanol, propyl alcohol,n-propyl alcohol!;; @71-23-8#nane~n-nonane!; C9H20 ; @111-84-2#ter; H2O; @7732-18-5#
A. Skrzecz, Institute of Physical Chemistry, Polish Academy ofSciences, Warsaw, Poland~1996.04!
5.10. 1-Propanol 1 Water 1 Nonane
Critical Evaluation:
survey of reported in the literature compositions along the saturation curve~sat.! and compositions of coexisting phases in
rium ~eq.! for the system 1-propanol–nonane–water is given in Table 53.
TABLE 53. Summary of experimental data for the system 1-propanol–nonane–water
~s! T/K Type of dataa Ref.
va and Karapetyants, 1967 298 sat.~12!, eq. ~13! 1
lkovet al., 1974 359–363 eq.~10! 2
er of expermental points in parentheses.
Saturation curve
e system 1-propanol–nonane–water forms a miscibility gap of type 1. Only one binary pair of components, nonane–water, is
ly miscible. The data for this system were compiled and critically evaluated in a previously published SDS volumes, Ref. 3. The
mended values of mutual solubility of the nonane–water system at 298 K are:x2952.4•1028 andx2850.999 44. The solubility of
in nonane reported in Ref. 1 as 0.001 mass fraction~with the accuracy of60.001 of mass fraction equivalent to 0.007 mole fraction!
cted. Data reported by Koshelkovet al.2 represent vapor–liquid–liquid equilibria at boiling temperatures 358.7–363.2 K~pressure
kPa!. Temperatures were estimated from the authors’ graph. Compositions of the nonane-rich phase in the regionx1.0.18 seems
a larger miscibility gap than at 298 K, which indicates an error in the experimental method of Ref. 2. Compositions at 298.2 K
the saturation curve obtained by titration method as well as compositions of phases in equilibrium are consistent in Ref. 1. These
re also consistent with the data of the 1-propanol–octane–water system reported by Vorobeva and Karapetyants in the same paper.1
Phases in equilibrium
mpositions of coexisting phases in equilibrium for the ternary system 1-propanol–nonane–water were reported in both references.
sition of each phase was calculated from density-composition curve of saturated mixtures prepared at the time of saturation curve
rements. Compositions of phases in equilibrium reported in Ref. 2 were measured only at boiling temperatures and detailed
ation about experimental procedures are not reported. A plait point reported at 298.2 K isx150.486 andx250.318 mole fraction.
All experimental data are treated as tentative. To present the system behavior, the data at 298.2 K of Vorobeva and Karapetyant,1 are
presented in Fig. 27.
11231123
IUP
AC
-NIS
TS
OLU
BILIT
YD
AT
AS
ER
IESJ.P
hys.C
hem.
Ref.
Data,
Vol.
28,N
o.4,
1999
This se of AIP content is subject to the terms at: http://scitation.aip.org/termsconditions. Downloaded to IP: 129.6.105.191 On: Fri, 05 Sep 2014 17:51:55
article is copyrighted as indicated in the article. ReuAuxiliary Information
Method/Apparatus/Procedure: Source and Purity of Materials:
The points on the binodal curve were determined by theformation of a cloudy mixture on shaking after the addition ofa known mass of one component to a mixture of knownmasses of the other two components. Precision weighingsyringes were used as described in Ref. 1. Tie linecompositions were determined by the refractive index methodreported in Ref. 2 and a complementary method using the KarlFischer titrations as reported in Ref. 3.
~1! Merck, AR grade; distilled, dried by refluxing with Mg andI2; purity better than 99.6 mole % by glc;d50.79979, n51.3837.~2! BDH; used as received; purity better than 99.6 mole % byglc.~3! not specified.
Estimated Error:estimated comp. 0.005 mole fraction on the binodal curve and0.01 mole fraction for tie lines~estimated by the authors!.
References:1T. M. Letcher, S. Wootten, B. Shuttleworth, and C. Heward, J.Chem. Thermodyn.18, 1037~1986!.2S. W. Briggs and E. W. Comings, Ind. Eng. Chem.35, 411~1943!.3T. M. Letcher, P. M. Siswana, P. Van der Watt, and S. Radloff,J. Chem. Thermodyn.21, 1053~1989!.
Compo
~1! 1-PC3H8O~2! No~3! Wa
A
equilib
Author
Vorobe
Koshe
aNumb
Th
partial
recom
water
is reje
101.3
to form
along
data a
Co
Compo
measu
inform
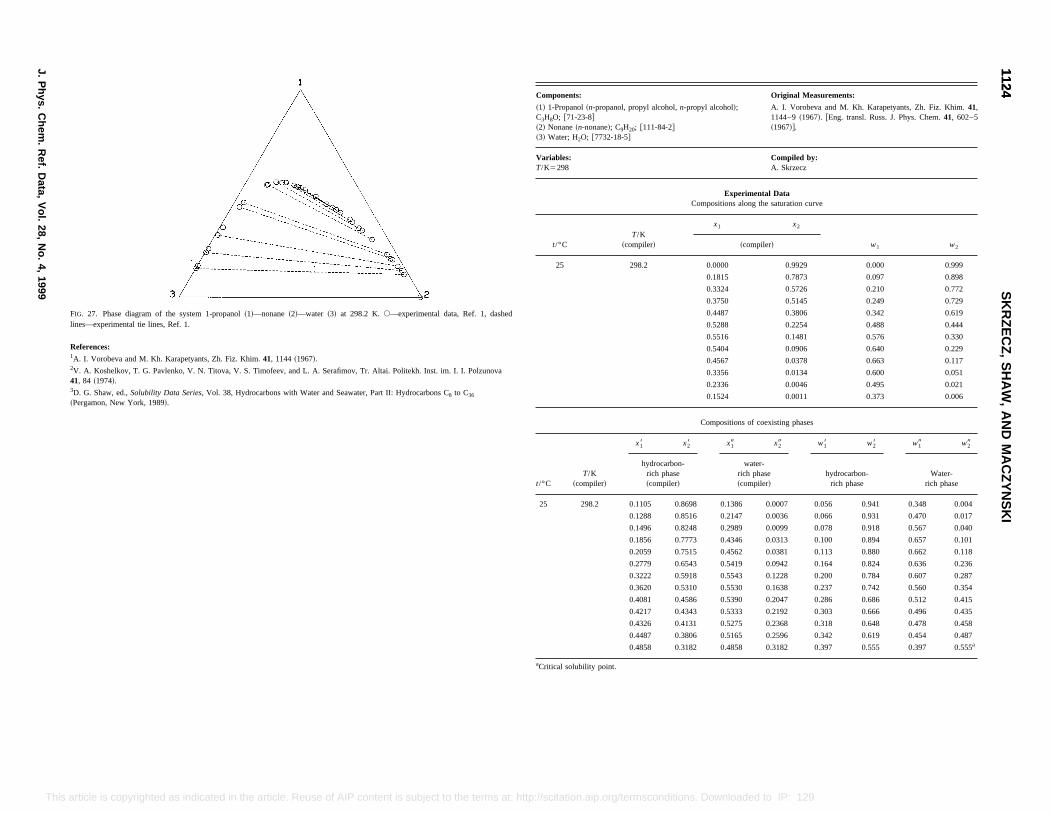
Original Measurements:
propyl alcohol!; A. I. Vorobeva and M. Kh. Karapetyants, Zh. Fiz. Khim.41,1144–9~1967!. @Eng. transl. Russ. J. Phys. Chem.41, 602–5~1967!#.
Compiled by:A. Skrzecz
Experimental DataCompositions along the saturation curve
x1 x2
w1 w2~compiler!
0.0000 0.9929 0.000 0.999
0.1815 0.7873 0.097 0.898
0.3324 0.5726 0.210 0.772
0.3750 0.5145 0.249 0.729
0.4487 0.3806 0.342 0.619
0.5288 0.2254 0.488 0.444
0.5516 0.1481 0.576 0.330
0.5404 0.0906 0.640 0.229
0.4567 0.0378 0.663 0.117
0.3356 0.0134 0.600 0.051
0.2336 0.0046 0.495 0.021
0.1524 0.0011 0.373 0.006
Compositions of coexisting phases
28 x19 x29 w18 w28 w19 w29
water-rich phase~compiler!
hydrocarbon-rich phase
Water-rich phase
8698 0.1386 0.0007 0.056 0.941 0.348 0.004
516 0.2147 0.0036 0.066 0.931 0.470 0.017
248 0.2989 0.0099 0.078 0.918 0.567 0.040
0.1856 0.7773 0.4346 0.0313 0.100 0.894 0.657 0.101
0.2059 0.7515 0.4562 0.0381 0.113 0.880 0.662 0.118
0.2779 0.6543 0.5419 0.0942 0.164 0.824 0.636 0.236
0.3222 0.5918 0.5543 0.1228 0.200 0.784 0.607 0.287
0.3620 0.5310 0.5530 0.1638 0.237 0.742 0.560 0.354
0.4081 0.4586 0.5390 0.2047 0.286 0.686 0.512 0.415
0.4217 0.4343 0.5333 0.2192 0.303 0.666 0.496 0.435
0.4326 0.4131 0.5275 0.2368 0.318 0.648 0.478 0.458
0.4487 0.3806 0.5165 0.2596 0.342 0.619 0.454 0.487
0.4858 0.3182 0.4858 0.3182 0.397 0.555 0.397 0.555a
aCritical solubility point.
11241124
SK
RZ
EC
Z,
SH
AW
,A
ND
MA
CZ
YN
SK
I
J.P
hys.C
hem.
Ref.
Data,
Vol.
28,N
o.4,
1999
This ect to the terms at: http://scitation.aip.org/termsconditions. Downloaded to IP: 129.6.105.191 On: Fri, 05 Sep 2014 17:51:55
article is copyrighted as indicated in the article. Reuse of AIP content is subjFIG. 27. Phase diagram of the system 1-propanol~1!—nonane~2!—water ~3! at 298.2 K. s—experimental data, Ref. 1, dashedlines—experimental tie lines, Ref. 1.
References:1A. I. Vorobeva and M. Kh. Karapetyants, Zh. Fiz. Khim.41, 1144~1967!.2V. A. Koshelkov, T. G. Pavlenko, V. N. Titova, V. S. Timofeev, and L. A. Serafimov, Tr. Altai. Politekh. Inst. im. I. I. Polzunova41, 84 ~1974!.3D. G. Shaw, ed.,Solubility Data Series, Vol. 38, Hydrocarbons with Water and Seawater, Part II: Hydrocarbons C8 to C36
~Pergamon, New York, 1989!.
Components:
~1! 1-Propanol~n-propanol, propyl alcohol,n-C3H8O; @71-23-8#~2! Nonane~n-nonane!; C9H20; @111-84-2#~3! Water; H2O; @7732-18-5#
Variables:T/K5298
t/°CT/K
~compiler!
25 298.2
t/°CT/K
~compiler!
x18 x
hydrocarbon-rich phase~compiler!
25 298.2 0.1105 0.
0.1288 0.8
0.1496 0.8
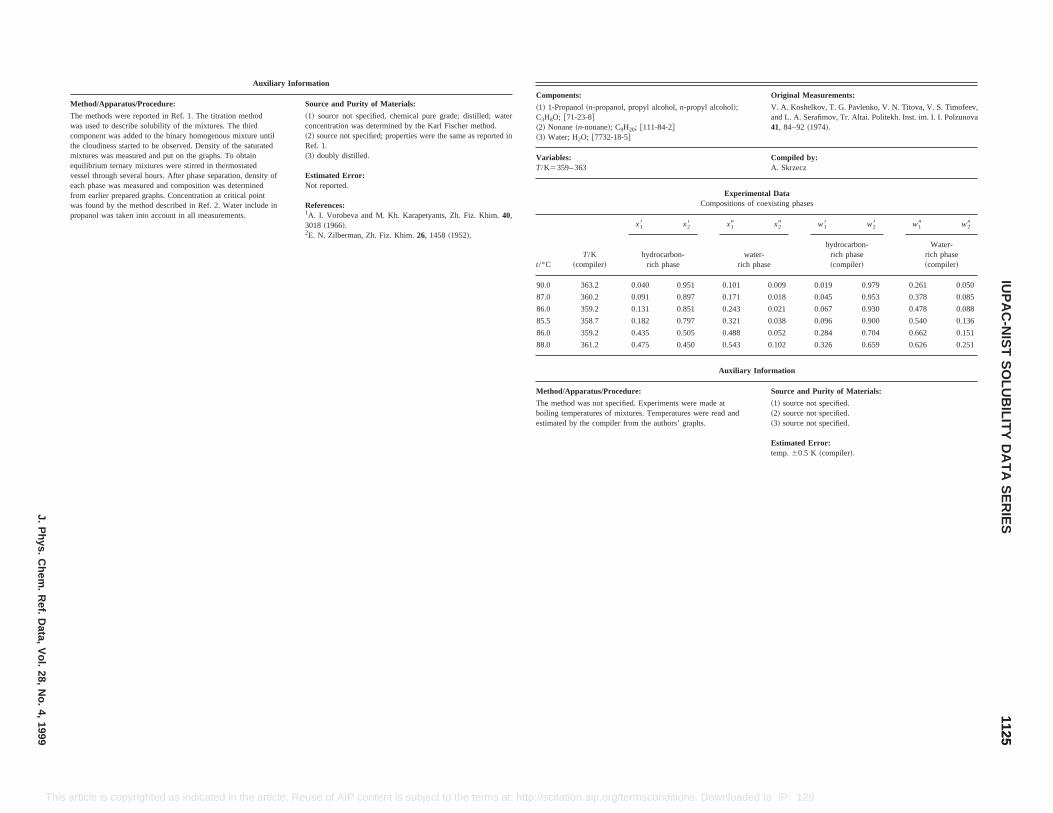
distilled; waterer method.e as reported in
iz. Khim.40,
Components: Original Measurements:
~1! 1-Propanol~n-propanol, propyl alcohol,n-propyl alcohol!;C3H8O; @71-23-8#~2! Nonane~n-nonane!; C9H20; @111-84-2#~3! Water; H2O; @7732-18-5#
V. A. Koshelkov, T. G. Pavlenko, V. N. Titova, V. S. Timofeev,and L. A. Serafimov, Tr. Altai. Politekh. Inst. im. I. I. Polzunova41, 84–92~1974!.
Variables:T/K5359– 363
Compiled by:A. Skrzecz
Experimental DataCompositions of coexisting phases
t/°CT/K
~compiler!
x18 x28 x19 x29 w18 w28 w19 w29
hydrocarbon-rich phase
water-rich phase
hydrocarbon-rich phase~compiler!
Water-rich phase~compiler!
90.0 363.2 0.040 0.951 0.101 0.009 0.019 0.979 0.261 0.050
87.0 360.2 0.091 0.897 0.171 0.018 0.045 0.953 0.378 0.085
86.0 359.2 0.131 0.851 0.243 0.021 0.067 0.930 0.478 0.088
85.5 358.7 0.182 0.797 0.321 0.038 0.096 0.900 0.540 0.136
86.0 359.2 0.435 0.505 0.488 0.052 0.284 0.704 0.662 0.151
88.0 361.2 0.475 0.450 0.543 0.102 0.326 0.659 0.626 0.251
Auxiliary Information
Method/Apparatus/Procedure: Source and Purity of Materials:
The method was not specified. Experiments were made atboiling temperatures of mixtures. Temperatures were read andestimated by the compiler from the authors’ graphs.
~1! source not specified.~2! source not specified.~3! source not specified.
Estimated Error:temp.60.5 K ~compiler!.
11251125
IUP
AC
-NIS
TS
OLU
BILIT
YD
AT
AS
ER
IESJ.P
hys.C
hem.
Ref.
Data,
Vol.
28,N
o.4,
1999
This article. Reuse of AIP content is subject to the terms at: http://scitation.aip.org/termsconditions. Downloaded to IP: 129.6.105.191 On: Fri, 05 Sep 2014 17:51:55
article is copyrighted as indicated in theAuxiliary Information
Method/Apparatus/Procedure: Source and Purity of Materials:
The methods were reported in Ref. 1. The titration methodwas used to describe solubility of the mixtures. The thirdcomponent was added to the binary homogenous mixture untilthe cloudiness started to be observed. Density of the saturatedmixtures was measured and put on the graphs. To obtainequilibrium ternary mixtures were stirred in thermostatedvessel through several hours. After phase separation, density ofeach phase was measured and composition was determinedfrom earlier prepared graphs. Concentration at critical pointwas found by the method described in Ref. 2. Water include inpropanol was taken into account in all measurements.
~1! source not specified, chemical pure grade;concentration was determined by the Karl Fisch~2! source not specified; properties were the samRef. 1.~3! doubly distilled.
Estimated Error:Not reported.
References:1A. I. Vorobeva and M. Kh. Karapetyants, Zh. F3018 ~1966!.2E. N. Zilberman, Zh. Fiz. Khim.26, 1458~1952!.
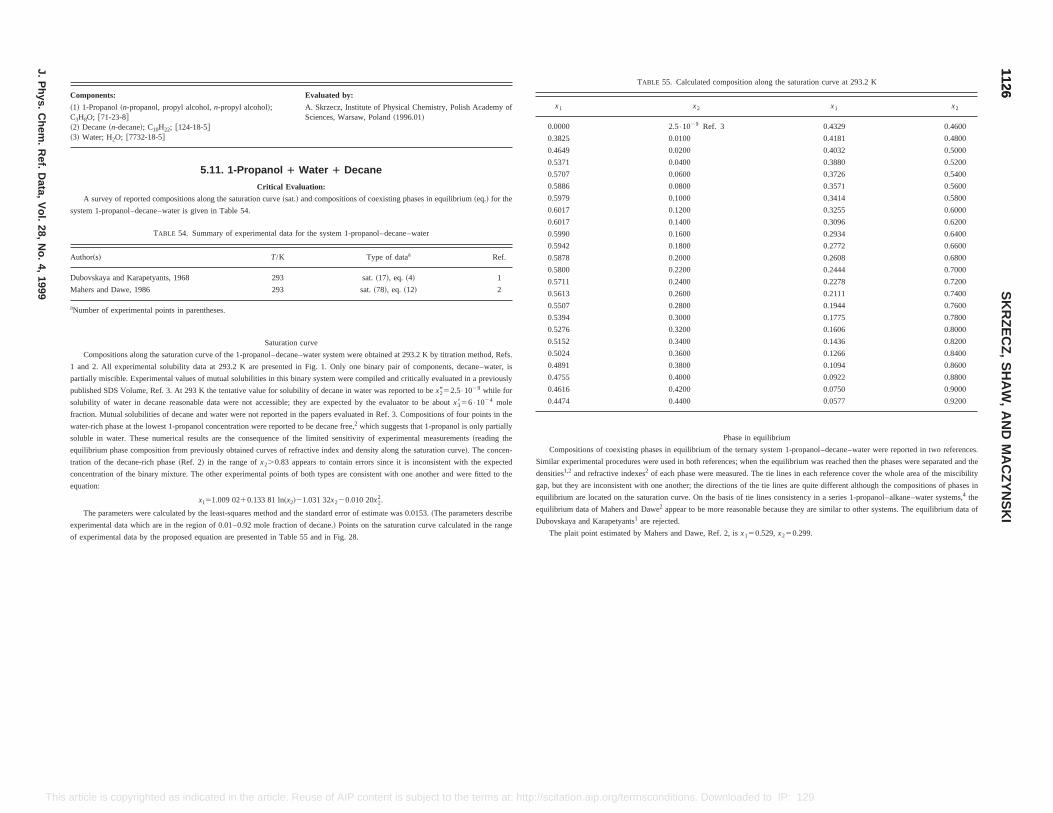
TABLE 55. Calculated composition along the saturation curve at 293.2 K
x1 x2 x1 x2
.0000 2.5•1029 Ref. 3 0.4329 0.4600
.3825 0.0100 0.4181 0.4800
.4649 0.0200 0.4032 0.5000
.5371 0.0400 0.3880 0.5200
.5707 0.0600 0.3726 0.5400
.5886 0.0800 0.3571 0.5600
.5979 0.1000 0.3414 0.5800
.6017 0.1200 0.3255 0.6000
.6017 0.1400 0.3096 0.6200
.5990 0.1600 0.2934 0.6400
.5942 0.1800 0.2772 0.6600
.5878 0.2000 0.2608 0.6800
.5800 0.2200 0.2444 0.7000
.5711 0.2400 0.2278 0.7200
.5613 0.2600 0.2111 0.7400
.5507 0.2800 0.1944 0.7600
.5394 0.3000 0.1775 0.7800
.5276 0.3200 0.1606 0.8000
.5152 0.3400 0.1436 0.8200
.5024 0.3600 0.1266 0.8400
.4891 0.3800 0.1094 0.8600
.4755 0.4000 0.0922 0.8800
.4616 0.4200 0.0750 0.9000
.4474 0.4400 0.0577 0.9200
Phase in equilibrium
ompositions of coexisting phases in equilibrium of the ternary system 1-propanol–decane–water were reported in two references.
ar experimental procedures were used in both references; when the equilibrium was reached then the phases were separated and the
ities1,2 and refractive indexes2 of each phase were measured. The tie lines in each reference cover the whole area of the miscibility
but they are inconsistent with one another; the directions of the tie lines are quite different although the compositions of phases in
ibrium are located on the saturation curve. On the basis of tie lines consistency in a series 1-propanol–alkane–water systems,4 the
ibrium data of Mahers and Dawe2 appear to be more reasonable because they are similar to other systems. The equilibrium data of
vskaya and Karapetyants1 are rejected.
he plait point estimated by Mahers and Dawe, Ref. 2, isx150.529,x250.299.
11261126
SK
RZ
EC
Z,
SH
AW
,A
ND
MA
CZ
YN
SK
I
J.P
hys.C
hem.
Ref.
Data,
Vol.
28,N
o.4,
1999
This itation.aip.org/termsconditions. Downloaded to IP: 129.6.105.191 On: Fri, 05 Sep 2014 17:51:55
of experimental data by the proposed equation are presented in Table 55 and in Fig. 28. T
article is copyrighted as indicated in the article. Reuse of AIP content is subject to the terms at: http://sc
Components: Evaluated by:
~1! 1-Propanol~n-propanol, propyl alcohol,n-propyl alcohol!;C3H8O; @71-23-8#~2! Decane~n-decane!; C10H22; @124-18-5#~3! Water; H2O; @7732-18-5#
A. Skrzecz, Institute of Physical Chemistry, Polish Academy ofSciences, Warsaw, Poland~1996.01!
5.11. 1-Propanol 1 Water 1 Decane
Critical Evaluation:
A survey of reported compositions along the saturation curve~sat.! and compositions of coexisting phases in equilibrium~eq.! for the
system 1-propanol–decane–water is given in Table 54.
TABLE 54. Summary of experimental data for the system 1-propanol–decane–water
Author~s! T/K Type of dataa Ref.
Dubovskaya and Karapetyants, 1968 293 sat.~17!, eq. ~4! 1
Mahers and Dawe, 1986 293 sat.~78!, eq. ~12! 2
aNumber of experimental points in parentheses.
Saturation curve
Compositions along the saturation curve of the 1-propanol–decane–water system were obtained at 293.2 K by titration method, Refs.
1 and 2. All experimental solubility data at 293.2 K are presented in Fig. 1. Only one binary pair of components, decane–water, is
partially miscible. Experimental values of mutual solubilities in this binary system were compiled and critically evaluated in a previously
published SDS Volume, Ref. 3. At 293 K the tentative value for solubility of decane in water was reported to bex2952.5•1029 while for
solubility of water in decane reasonable data were not accessible; they are expected by the evaluator to be aboutx3856•1024 mole
fraction. Mutual solubilities of decane and water were not reported in the papers evaluated in Ref. 3. Compositions of four points in the
water-rich phase at the lowest 1-propanol concentration were reported to be decane free,2 which suggests that 1-propanol is only partially
soluble in water. These numerical results are the consequence of the limited sensitivity of experimental measurements~reading the
equilibrium phase composition from previously obtained curves of refractive index and density along the saturation curve!. The concen-
tration of the decane-rich phase~Ref. 2! in the range ofx2.0.83 appears to contain errors since it is inconsistent with the expected
concentration of the binary mixture. The other experimental points of both types are consistent with one another and were fitted to the
equation:
x151.009 0210.133 81 ln~x2!21.031 32x220.010 20x22.
The parameters were calculated by the least-squares method and the standard error of estimate was 0.0153.~The parameters describe
experimental data which are in the region of 0.01–0.92 mole fraction of decane.! Points on the saturation curve calculated in the range
0
0
0
0
0
0
0
0
0
0
0
0
0
0
0
0
0
0
0
0
0
0
0
0
C
Simil
dens
gap,
equil
equil
Dubo
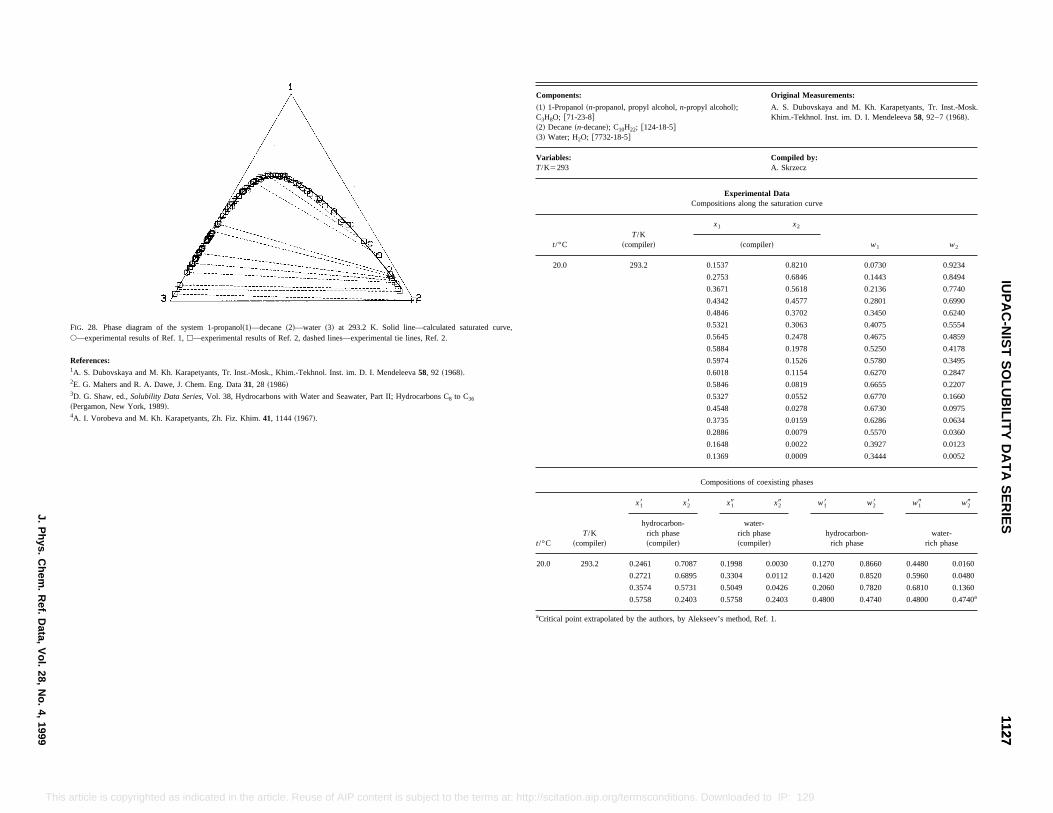
Original Measurements:
ropyl alcohol,n-propyl alcohol!;
; @124-18-5#
A. S. Dubovskaya and M. Kh. Karapetyants, Tr. Inst.-Mosk.Khim.-Tekhnol. Inst. im. D. I. Mendeleeva58, 92–7~1968!.
Compiled by:A. Skrzecz
Experimental DataCompositions along the saturation curve
/Kpiler!
x1 x2
w1 w2~compiler!
93.2 0.1537 0.8210 0.0730 0.9234
0.2753 0.6846 0.1443 0.8494
0.3671 0.5618 0.2136 0.7740
0.4342 0.4577 0.2801 0.6990
0.4846 0.3702 0.3450 0.6240
0.5321 0.3063 0.4075 0.5554
0.5645 0.2478 0.4675 0.4859
0.5884 0.1978 0.5250 0.4178
0.5974 0.1526 0.5780 0.3495
0.6018 0.1154 0.6270 0.2847
0.5846 0.0819 0.6655 0.2207
0.5327 0.0552 0.6770 0.1660
0.4548 0.0278 0.6730 0.0975
0.3735 0.0159 0.6286 0.0634
0.2886 0.0079 0.5570 0.0360
0.1648 0.0022 0.3927 0.0123
0.1369 0.0009 0.3444 0.0052
Compositions of coexisting phases
t/°CT/K
~compiler!
x18 x28 x19 x29 w18 w28 w19 w29
hydrocarbon-rich phase~compiler!
water-rich phase~compiler!
hydrocarbon-rich phase
water-rich phase
20.0 293.2 0.2461 0.7087 0.1998 0.0030 0.1270 0.8660 0.4480 0.0160
0.2721 0.6895 0.3304 0.0112 0.1420 0.8520 0.5960 0.0480
0.3574 0.5731 0.5049 0.0426 0.2060 0.7820 0.6810 0.1360
0.5758 0.2403 0.5758 0.2403 0.4800 0.4740 0.4800 0.4740a
aCritical point extrapolated by the authors, by Alekseev’s method, Ref. 1.
11271127
IUP
AC
-NIS
TS
OLU
BILIT
YD
AT
AS
ER
IESJ.P
hys.C
hem.
Ref.
Data,
Vol.
28,N
o.4,
1999
This t to the terms at: http://scitation.aip.org/termsconditions. Downloaded to IP: 129.6.105.191 On: Fri, 05 Sep 2014 17:51:55
article is copyrighted as indicated in the article. Reuse of AIP content is subjecFIG. 28. Phase diagram of the system 1-propanol~1!—decane~2!—water ~3! at 293.2 K. Solid line—calculated saturated curve,s—experimental results of Ref. 1,h—experimental results of Ref. 2, dashed lines—experimental tie lines, Ref. 2.
References:1A. S. Dubovskaya and M. Kh. Karapetyants, Tr. Inst.-Mosk., Khim.-Tekhnol. Inst. im. D. I. Mendeleeva58, 92 ~1968!.2E. G. Mahers and R. A. Dawe, J. Chem. Eng. Data31, 28 ~1986!3D. G. Shaw, ed.,Solubility Data Series, Vol. 38, Hydrocarbons with Water and Seawater, Part II; Hydrocarbons C8 to C36
~Pergamon, New York, 1989!.4A. I. Vorobeva and M. Kh. Karapetyants, Zh. Fiz. Khim.41, 1144~1967!.
Components:
~1! 1-Propanol~n-propanol, pC3H8O; @71-23-8#~2! Decane~n-decane!; C10H22
~3! Water; H2O; @7732-18-5#
Variables:T/K5293
t/°CT
~com
20.0 2
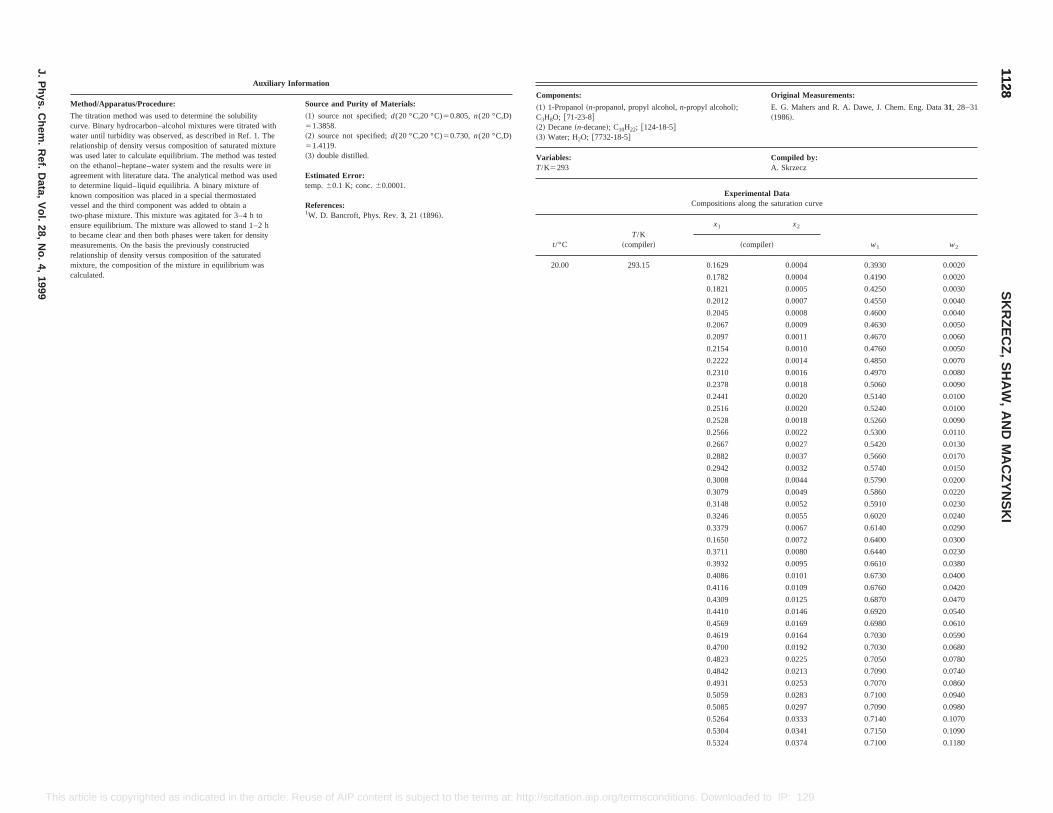
Original Measurements:
E. G. Mahers and R. A. Dawe, J. Chem. Eng. Data31, 28–31~1986!.
Compiled by:A. Skrzecz
ntal Datag the saturation curve
x2
w1 w2piler!
0.0004 0.3930 0.0020
0.0004 0.4190 0.0020
0.0005 0.4250 0.0030
0.0007 0.4550 0.0040
0.0008 0.4600 0.0040
0.0009 0.4630 0.0050
0.0011 0.4670 0.0060
0.0010 0.4760 0.0050
0.0014 0.4850 0.0070
0.0016 0.4970 0.0080
0.0018 0.5060 0.0090
0.0020 0.5140 0.0100
0.0020 0.5240 0.0100
0.0018 0.5260 0.0090
0.0022 0.5300 0.0110
0.0027 0.5420 0.0130
0.0037 0.5660 0.0170
0.0032 0.5740 0.0150
0.0044 0.5790 0.0200
0.0049 0.5860 0.0220
0.0052 0.5910 0.0230
0.0055 0.6020 0.0240
0.0067 0.6140 0.0290
0.1650 0.0072 0.6400 0.0300
0.3711 0.0080 0.6440 0.0230
0.3932 0.0095 0.6610 0.0380
0.4086 0.0101 0.6730 0.0400
0.4116 0.0109 0.6760 0.0420
0.4309 0.0125 0.6870 0.0470
0.4410 0.0146 0.6920 0.0540
0.4569 0.0169 0.6980 0.0610
0.4619 0.0164 0.7030 0.0590
0.4700 0.0192 0.7030 0.0680
0.4823 0.0225 0.7050 0.0780
0.4842 0.0213 0.7090 0.0740
0.4931 0.0253 0.7070 0.0860
0.5059 0.0283 0.7100 0.0940
0.5085 0.0297 0.7090 0.0980
0.5264 0.0333 0.7140 0.1070
0.5304 0.0341 0.7150 0.1090
0.5324 0.0374 0.7100 0.1180
11281128
SK
RZ
EC
Z,
SH
AW
,A
ND
MA
CZ
YN
SK
I
J.P
hys.C
hem.
Ref.
Data,
Vol.
28,N
o.4,
1999
This use of AIP content is subject to the terms at: http://scitation.aip.org/termsconditions. Downloaded to IP: 129.6.105.191 On: Fri, 05 Sep 2014 17:51:55
article is copyrighted as indicated in the article. ReAuxiliary Information
Method/Apparatus/Procedure: Source and Purity of Materials:
The titration method was used to determine the solubilitycurve. Binary hydrocarbon–alcohol mixtures were titrated withwater until turbidity was observed, as described in Ref. 1. Therelationship of density versus composition of saturated mixturewas used later to calculate equilibrium. The method was testedon the ethanol–heptane–water system and the results were inagreement with literature data. The analytical method was usedto determine liquid–liquid equilibria. A binary mixture ofknown composition was placed in a special thermostatedvessel and the third component was added to obtain atwo-phase mixture. This mixture was agitated for 3–4 h toensure equilibrium. The mixture was allowed to stand 1–2 hto became clear and then both phases were taken for densitymeasurements. On the basis the previously constructedrelationship of density versus composition of the saturatedmixture, the composition of the mixture in equilibrium wascalculated.
~1! source not specified;d(20 °C,20 °C)50.805, n(20 °C,D)51.3858.~2! source not specified;d(20 °C,20 °C)50.730, n(20 °C,D)51.4119.~3! double distilled.
Estimated Error:temp.60.1 K; conc.60.0001.
References:1W. D. Bancroft, Phys. Rev.3, 21 ~1896!.
Components:
~1! 1-Propanol~n-propanol, propyl alcohol,n-propyl alcohol!;C3H8O; @71-23-8#~2! Decane~n-decane!; C10H22; @124-18-5#~3! Water; H2O; @7732-18-5#
Variables:T/K5293
ExperimeCompositions alon
t/°CT/K
~compiler!
x1
~com
20.00 293.15 0.1629
0.1782
0.1821
0.2012
0.2045
0.2067
0.2097
0.2154
0.2222
0.2310
0.2378
0.2441
0.2516
0.2528
0.2566
0.2667
0.2882
0.2942
0.3008
0.3079
0.3148
0.3246
0.3379
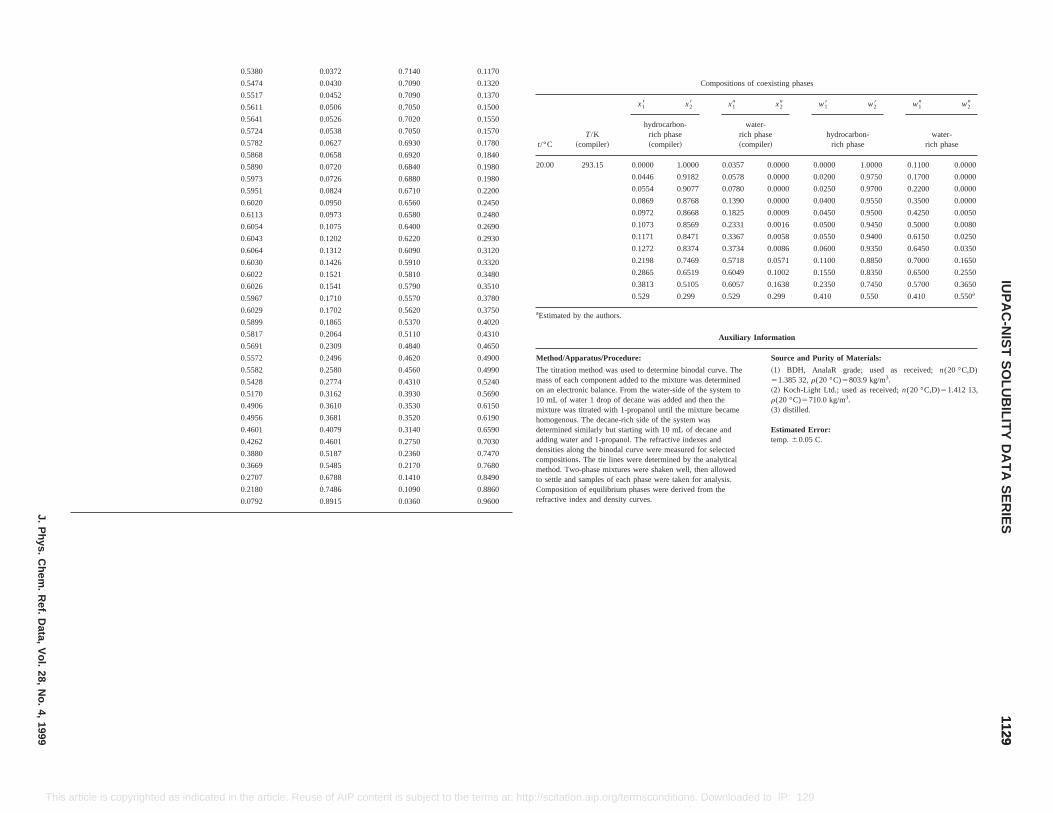
Compositions of coexisting phases
t/°CT/K
~compiler!
x18 x28 x19 x29 w18 w28 w19 w29
hydrocarbon-rich phase~compiler!
water-rich phase~compiler!
hydrocarbon-rich phase
water-rich phase
20.00 293.15 0.0000 1.0000 0.0357 0.0000 0.0000 1.0000 0.1100 0.0000
0.0446 0.9182 0.0578 0.0000 0.0200 0.9750 0.1700 0.0000
0.0554 0.9077 0.0780 0.0000 0.0250 0.9700 0.2200 0.0000
0.0869 0.8768 0.1390 0.0000 0.0400 0.9550 0.3500 0.0000
0.0972 0.8668 0.1825 0.0009 0.0450 0.9500 0.4250 0.0050
0.1073 0.8569 0.2331 0.0016 0.0500 0.9450 0.5000 0.0080
0.1171 0.8471 0.3367 0.0058 0.0550 0.9400 0.6150 0.0250
0.1272 0.8374 0.3734 0.0086 0.0600 0.9350 0.6450 0.0350
0.2198 0.7469 0.5718 0.0571 0.1100 0.8850 0.7000 0.1650
0.2865 0.6519 0.6049 0.1002 0.1550 0.8350 0.6500 0.2550
0.3813 0.5105 0.6057 0.1638 0.2350 0.7450 0.5700 0.3650
0.529 0.299 0.529 0.299 0.410 0.550 0.410 0.550a
aEstimated by the authors.
Auxiliary Information
Method/Apparatus/Procedure: Source and Purity of Materials:
The titration method was used to determine binodal curve. Themass of each component added to the mixture was determinedon an electronic balance. From the water-side of the system to10 mL of water 1 drop of decane was added and then themixture was titrated with 1-propanol until the mixture becamehomogenous. The decane-rich side of the system wasdetermined similarly but starting with 10 mL of decane andadding water and 1-propanol. The refractive indexes anddensities along the binodal curve were measured for selectedcompositions. The tie lines were determined by the analyticalmethod. Two-phase mixtures were shaken well, then allowedto settle and samples of each phase were taken for analysis.Composition of equilibrium phases were derived from therefractive index and density curves.
~1! BDH, AnalaR grade; used as received;n(20 °C,D)51.385 32,r(20 °C)5803.9 kg/m3.~2! Koch-Light Ltd.; used as received;n(20 °C,D)51.412 13,r(20 °C)5710.0 kg/m3.~3! distilled.
Estimated Error:temp.60.05 C.
11291129
IUP
AC
-NIS
TS
OLU
BILIT
YD
AT
AS
ER
IESJ.P
hys.C
hem.
Ref.
Data,
Vol.
28,N
o.4,
1999
This ttp://scitation.aip.org/termsconditions. Downloaded to IP: 129.6.105.191 On: Fri, 05 Sep 2014 17:51:55
article is copyrighted as indicated in the article. Reuse of AIP content is subject to the terms at: h0.5380 0.0372 0.7140 0.1170
0.5474 0.0430 0.7090 0.1320
0.5517 0.0452 0.7090 0.1370
0.5611 0.0506 0.7050 0.1500
0.5641 0.0526 0.7020 0.1550
0.5724 0.0538 0.7050 0.1570
0.5782 0.0627 0.6930 0.1780
0.5868 0.0658 0.6920 0.1840
0.5890 0.0720 0.6840 0.1980
0.5973 0.0726 0.6880 0.1980
0.5951 0.0824 0.6710 0.2200
0.6020 0.0950 0.6560 0.2450
0.6113 0.0973 0.6580 0.2480
0.6054 0.1075 0.6400 0.2690
0.6043 0.1202 0.6220 0.2930
0.6064 0.1312 0.6090 0.3120
0.6030 0.1426 0.5910 0.3320
0.6022 0.1521 0.5810 0.3480
0.6026 0.1541 0.5790 0.3510
0.5967 0.1710 0.5570 0.3780
0.6029 0.1702 0.5620 0.3750
0.5899 0.1865 0.5370 0.4020
0.5817 0.2064 0.5110 0.4310
0.5691 0.2309 0.4840 0.4650
0.5572 0.2496 0.4620 0.4900
0.5582 0.2580 0.4560 0.4990
0.5428 0.2774 0.4310 0.5240
0.5170 0.3162 0.3930 0.5690
0.4906 0.3610 0.3530 0.6150
0.4956 0.3681 0.3520 0.6190
0.4601 0.4079 0.3140 0.6590
0.4262 0.4601 0.2750 0.7030
0.3880 0.5187 0.2360 0.7470
0.3669 0.5485 0.2170 0.7680
0.2707 0.6788 0.1410 0.8490
0.2180 0.7486 0.1090 0.8860
0.0792 0.8915 0.0360 0.9600
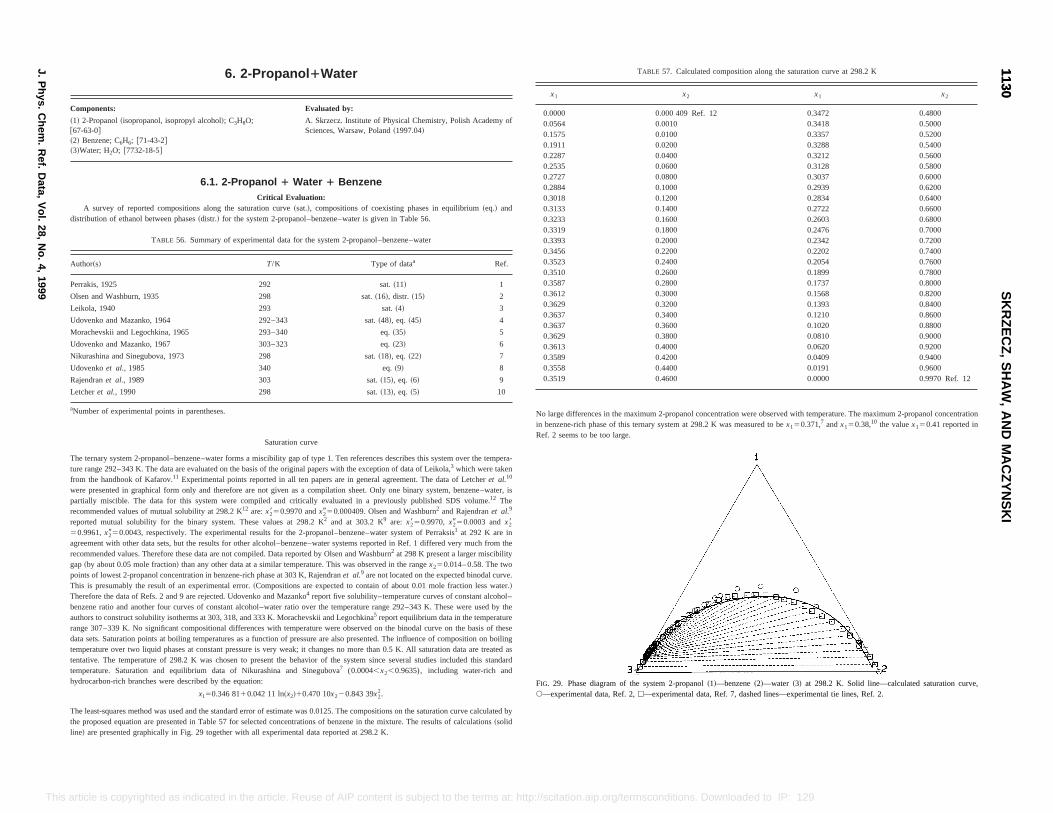
composition along the saturation curve at 298.2 K
x1 x2
2 0.3472 0.48000.3418 0.50000.3357 0.52000.3288 0.54000.3212 0.56000.3128 0.58000.3037 0.60000.2939 0.62000.2834 0.64000.2722 0.66000.2603 0.68000.2476 0.70000.2342 0.72000.2202 0.74000.2054 0.76000.1899 0.78000.1737 0.80000.1568 0.82000.1393 0.84000.1210 0.86000.1020 0.88000.0810 0.90000.0620 0.92000.0409 0.94000.0191 0.96000.0000 0.9970 Ref. 12
centration were observed with temperature. The maximum 2-propanol concentration.2 K was measured to bex150.371,7 andx150.38,10 the valuex150.41 reported in
e~2!—water ~3! at 298.2 K. Solid line—calculated saturation curve,ashed lines—experimental tie lines, Ref. 2.
11301130
SK
RZ
EC
Z,
SH
AW
,A
ND
MA
CZ
YN
SK
I
J.P
hys.C
hem.
Ref.
Data,
Vol.
28,N
o.4,
1999
This d to IP: 129.6.105.191 On: Fri, 05 Sep 2014 17:51:55
50.9961,x2950.0043, respectively. The experimental results for the 2-propanol–benzene–water system of Perraksisat 292 K are inagreement with other data sets, but the results for other alcohol–benzene–water systems reported in Ref. 1 differed very much from therecommended values. Therefore these data are not compiled. Data reported by Olsen and Washburn2 at 298 K present a larger miscibilitygap~by about 0.05 mole fraction! than any other data at a similar temperature. This was observed in the rangex250.014– 0.58. The twopoints of lowest 2-propanol concentration in benzene-rich phase at 303 K, Rajendranet al.9 are not located on the expected binodal curve.This is presumably the result of an experimental error.~Compositions are expected to contain of about 0.01 mole fraction less water.!
Therefore the data of Refs. 2 and 9 are rejected. Udovenko and Mazanko4 report five solubility–temperature curves of constant alcohol–benzene ratio and another four curves of constant alcohol–water ratio over the temperature range 292–343 K. These were used by theauthors to construct solubility isotherms at 303, 318, and 333 K. Morachevskii and Legochkina5 report equilibrium data in the temperaturerange 307–339 K. No significant compositional differences with temperature were observed on the binodal curve on the basis of thesedata sets. Saturation points at boiling temperatures as a function of pressure are also presented. The influence of composition on boilingtemperature over two liquid phases at constant pressure is very weak; it changes no more than 0.5 K. All saturation data are treated astentative. The temperature of 298.2 K was chosen to present the behavior of the system since several studies included this standardtemperature. Saturation and equilibrium data of Nikurashina and Sinegubova7 (0.0004,x2,0.9635), including water-rich andhydrocarbon-rich branches were described by the equation:
x150.346 8110.042 11 ln~x2!10.470 10x220.843 39x22.
The least-squares method was used and the standard error of estimate was 0.0125. The compositions on the saturation curve calculated bythe proposed equation are presented in Table 57 for selected concentrations of benzene in the mixture. The results of calculations~solidline! are presented graphically in Fig. 29 together with all experimental data reported at 298.2 K.
FIG. 29. Phase diagram of the system 2-propanol~1!—benzens—experimental data, Ref. 2,h—experimental data, Ref. 7, d
article is copyrighted as indicated in the article. Reuse of AIP content is subject to the terms at: http://scitation.aip.org/termsconditions. Downloade
6. 2-Propanol 1Water
Components: Evaluated by:
~1! 2-Propanol~isopropanol, isopropyl alcohol!; C3H8O;@67-63-0#~2! Benzene; C6H6; @71-43-2#~3!Water; H2O; @7732-18-5#
A. Skrzecz. Institute of Physical Chemistry, Polish Academy ofSciences, Warsaw, Poland~1997.04!
6.1. 2-Propanol 1 Water 1 BenzeneCritical Evaluation:
A survey of reported compositions along the saturation curve~sat.!, compositions of coexisting phases in equilibrium~eq.! anddistribution of ethanol between phases~distr.! for the system 2-propanol–benzene–water is given in Table 56.
TABLE 56. Summary of experimental data for the system 2-propanol–benzene–water
Author~s! T/K Type of dataa Ref.
Perrakis, 1925 292 sat.~11! 1
Olsen and Washburn, 1935 298 sat.~16!, distr. ~15! 2
Leikola, 1940 293 sat.~4! 3
Udovenko and Mazanko, 1964 292–343 sat.~48!, eq. ~45! 4
Morachevskii and Legochkina, 1965 293–340 eq.~35! 5
Udovenko and Mazanko, 1967 303–323 eq.~23! 6
Nikurashina and Sinegubova, 1973 298 sat.~18!, eq. ~22! 7
Udovenkoet al., 1985 340 eq.~9! 8
Rajendranet al., 1989 303 sat.~15!, eq. ~6! 9
Letcheret al., 1990 298 sat.~13!, eq. ~5! 10
aNumber of experimental points in parentheses.
Saturation curve
The ternary system 2-propanol–benzene–water forms a miscibility gap of type 1. Ten references describes this system over the tempera-ture range 292–343 K. The data are evaluated on the basis of the original papers with the exception of data of Leikola,3 which were takenfrom the handbook of Kafarov.11 Experimental points reported in all ten papers are in general agreement. The data of Letcheret al.10
were presented in graphical form only and therefore are not given as a compilation sheet. Only one binary system, benzene–water, ispartially miscible. The data for this system were compiled and critically evaluated in a previously published SDS volume.12 Therecommended values of mutual solubility at 298.2 K12 are:x2850.9970 andx2950.000409. Olsen and Washburn2 and Rajendranet al.9
reported mutual solubility for the binary system. These values at 298.2 K2 and at 303.2 K9 are: x2850.9970, x2950.0003 andx281
TABLE 57. Calculated
x1 x2
0.0000 0.000 409 Ref. 10.0564 0.00100.1575 0.01000.1911 0.02000.2287 0.04000.2535 0.06000.2727 0.08000.2884 0.10000.3018 0.12000.3133 0.14000.3233 0.16000.3319 0.18000.3393 0.20000.3456 0.22000.3523 0.24000.3510 0.26000.3587 0.28000.3612 0.30000.3629 0.32000.3637 0.34000.3637 0.36000.3629 0.38000.3613 0.40000.3589 0.42000.3558 0.44000.3519 0.4600
No large differences in the maximum 2-propanol conin benzene-rich phase of this ternary system at 298Ref. 2 seems to be too large.
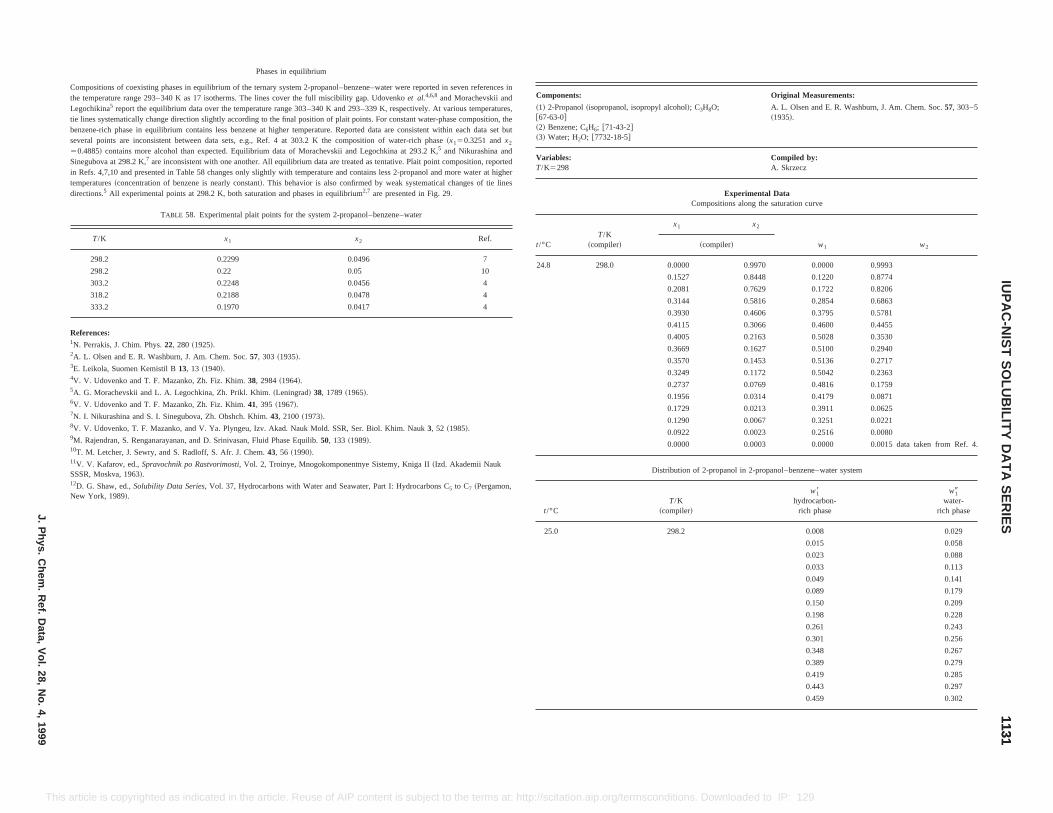
Original Measurements:
A. L. Olsen and E. R. Washburn, J. Am. Chem. Soc.57, 303–5~1935!.
Compiled by:A. Skrzecz
Experimental Datations along the saturation curve
x2
w1 w2ler!
0.9970 0.0000 0.9993
0.8448 0.1220 0.8774
0.7629 0.1722 0.8206
0.5816 0.2854 0.6863
0.4606 0.3795 0.5781
0.3066 0.4600 0.4455
0.2163 0.5028 0.3530
0.1627 0.5100 0.2940
0.1453 0.5136 0.2717
0.1172 0.5042 0.2363
0.0769 0.4816 0.1759
0.0314 0.4179 0.0871
0.0213 0.3911 0.0625
0.0067 0.3251 0.0221
0.0023 0.2516 0.0080
0.0003 0.0000 0.0015 data taken from Ref. 4.
anol in 2-propanol–benzene–water system
w18hydrocarbon-
rich phase
w19water-
rich phase
25.0 298.2 0.008 0.029
0.015 0.058
0.023 0.088
0.033 0.113
0.049 0.141
0.089 0.179
0.150 0.209
0.198 0.228
0.261 0.243
0.301 0.256
0.348 0.267
0.389 0.279
0.419 0.285
0.443 0.297
0.459 0.302
11311131
IUP
AC
-NIS
TS
OLU
BILIT
YD
AT
AS
ER
IESJ.P
hys.C
hem.
Ref.
Data,
Vol.
28,N
o.4,
1999
This p://scitation.aip.org/termsconditions. Downloaded to IP: 129.6.105.191 On: Fri, 05 Sep 2014 17:51:55
article is copyrighted as indicated in the article. Reuse of AIP content is subject to the terms at: httPhases in equilibrium
Compositions of coexisting phases in equilibrium of the ternary system 2-propanol–benzene–water were reported in seven references inthe temperature range 293–340 K as 17 isotherms. The lines cover the full miscibility gap. Udovenkoet al.4,6,8 and Morachevskii andLegochikina5 report the equilibrium data over the temperature range 303–340 K and 293–339 K, respectively. At various temperatures,tie lines systematically change direction slightly according to the final position of plait points. For constant water-phase composition, thebenzene-rich phase in equilibrium contains less benzene at higher temperature. Reported data are consistent within each data set butseveral points are inconsistent between data sets, e.g., Ref. 4 at 303.2 K the composition of water-rich phase~x150.3251 andx2
50.4885! contains more alcohol than expected. Equilibrium data of Morachevskii and Legochkina at 293.2 K,5 and Nikurashina andSinegubova at 298.2 K,7 are inconsistent with one another. All equilibrium data are treated as tentative. Plait point composition, reportedin Refs. 4,7,10 and presented in Table 58 changes only slightly with temperature and contains less 2-propanol and more water at highertemperatures~concentration of benzene is nearly constant!. This behavior is also confirmed by weak systematical changes of tie linesdirections.5 All experimental points at 298.2 K, both saturation and phases in equilibrium2,7 are presented in Fig. 29.
TABLE 58. Experimental plait points for the system 2-propanol–benzene–water
T/K x1 x2 Ref.
298.2 0.2299 0.0496 7
298.2 0.22 0.05 10
303.2 0.2248 0.0456 4
318.2 0.2188 0.0478 4
333.2 0.1970 0.0417 4
References:1N. Perrakis, J. Chim. Phys.22, 280 ~1925!.2A. L. Olsen and E. R. Washburn, J. Am. Chem. Soc.57, 303 ~1935!.3E. Leikola, Suomen Kemistil B13, 13 ~1940!.4V. V. Udovenko and T. F. Mazanko, Zh. Fiz. Khim.38, 2984~1964!.5A. G. Morachevskii and L. A. Legochkina, Zh. Prikl. Khim.~Leningrad! 38, 1789~1965!.6V. V. Udovenko and T. F. Mazanko, Zh. Fiz. Khim.41, 395 ~1967!.7N. I. Nikurashina and S. I. Sinegubova, Zh. Obshch. Khim.43, 2100~1973!.8V. V. Udovenko, T. F. Mazanko, and V. Ya. Plyngeu, Izv. Akad. Nauk Mold. SSR, Ser. Biol. Khim. Nauk3, 52 ~1985!.9M. Rajendran, S. Renganarayanan, and D. Srinivasan, Fluid Phase Equilib.50, 133 ~1989!.10T. M. Letcher, J. Sewry, and S. Radloff, S. Afr. J. Chem.43, 56 ~1990!.11V. V. Kafarov, ed.,Spravochnik po Rastvorimosti,Vol. 2, Troinye, Mnogokomponentnye Sistemy, Kniga II~Izd. Akademii NaukSSSR, Moskva, 1963!.12D. G. Shaw, ed.,Solubility Data Series,Vol. 37, Hydrocarbons with Water and Seawater, Part I: Hydrocarbons C5 to C7 ~Pergamon,New York, 1989!.
Components:
~1! 2-Propanol~isopropanol, isopropyl alcohol!; C3H8O;@67-63-0#~2! Benzene; C6H6; @71-43-2#~3! Water; H2O; @7732-18-5#
Variables:T/K5298
Composi
t/°CT/K
~compiler!
x1
~compi
24.8 298.0 0.0000
0.1527
0.2081
0.3144
0.3930
0.4115
0.4005
0.3669
0.3570
0.3249
0.2737
0.1956
0.1729
0.1290
0.0922
0.0000
Distribution of 2-prop
t/°CT/K
~compiler!
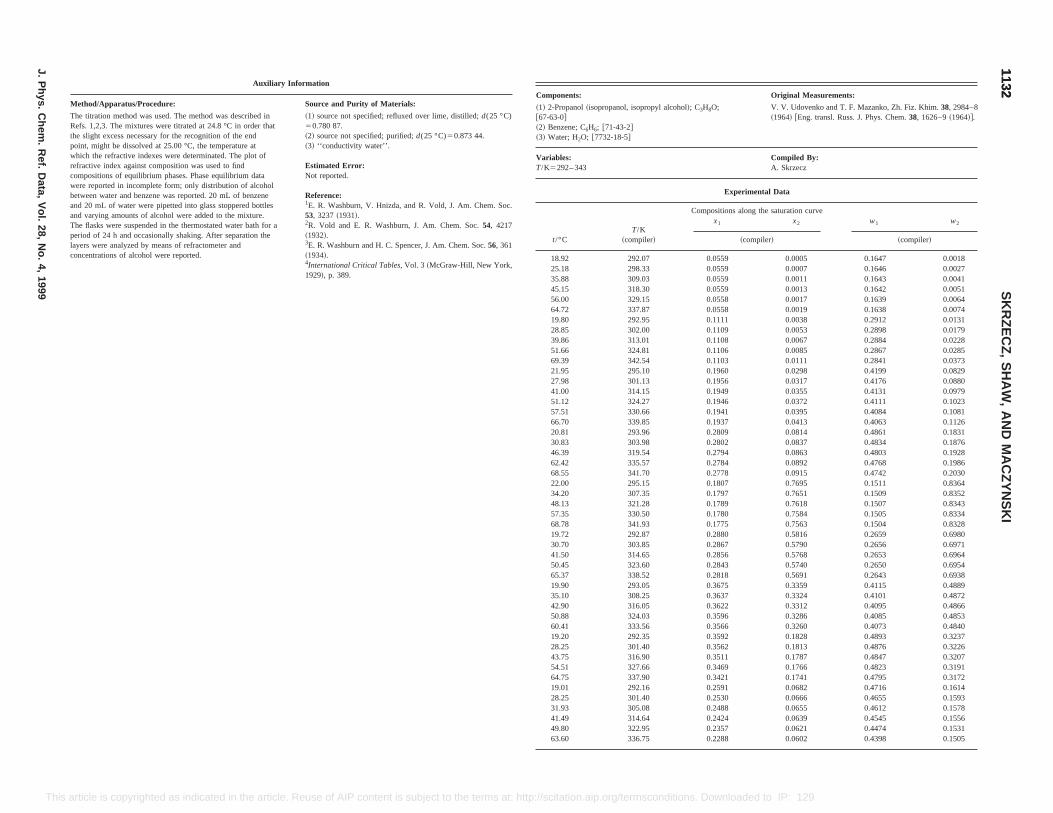
Original Measurements:
V. V. Udovenko and T. F. Mazanko, Zh. Fiz. Khim.38, 2984–8~1964! @Eng. transl. Russ. J. Phys. Chem.38, 1626–9~1964!#.
Compiled By:A. Skrzecz
Data
e saturation curvex2 w1 w2
r! ~compiler!
0.0005 0.1647 0.00180.0007 0.1646 0.00270.0011 0.1643 0.00410.0013 0.1642 0.00510.0017 0.1639 0.00640.0019 0.1638 0.00740.0038 0.2912 0.01310.0053 0.2898 0.01790.0067 0.2884 0.02280.0085 0.2867 0.02850.0111 0.2841 0.03730.0298 0.4199 0.08290.0317 0.4176 0.08800.0355 0.4131 0.09790.0372 0.4111 0.10230.0395 0.4084 0.10810.0413 0.4063 0.11260.0814 0.4861 0.18310.0837 0.4834 0.18760.0863 0.4803 0.19280.0892 0.4768 0.19860.0915 0.4742 0.20300.7695 0.1511 0.83640.7651 0.1509 0.83520.7618 0.1507 0.83430.7584 0.1505 0.83340.7563 0.1504 0.8328
19.72 292.87 0.2880 0.5816 0.2659 0.698030.70 303.85 0.2867 0.5790 0.2656 0.697141.50 314.65 0.2856 0.5768 0.2653 0.696450.45 323.60 0.2843 0.5740 0.2650 0.695465.37 338.52 0.2818 0.5691 0.2643 0.693819.90 293.05 0.3675 0.3359 0.4115 0.488935.10 308.25 0.3637 0.3324 0.4101 0.487242.90 316.05 0.3622 0.3312 0.4095 0.486650.88 324.03 0.3596 0.3286 0.4085 0.485360.41 333.56 0.3566 0.3260 0.4073 0.484019.20 292.35 0.3592 0.1828 0.4893 0.323728.25 301.40 0.3562 0.1813 0.4876 0.322643.75 316.90 0.3511 0.1787 0.4847 0.320754.51 327.66 0.3469 0.1766 0.4823 0.319164.75 337.90 0.3421 0.1741 0.4795 0.317219.01 292.16 0.2591 0.0682 0.4716 0.161428.25 301.40 0.2530 0.0666 0.4655 0.159331.93 305.08 0.2488 0.0655 0.4612 0.157841.49 314.64 0.2424 0.0639 0.4545 0.155649.80 322.95 0.2357 0.0621 0.4474 0.153163.60 336.75 0.2288 0.0602 0.4398 0.1505
11321132
SK
RZ
EC
Z,
SH
AW
,A
ND
MA
CZ
YN
SK
I
J.P
hys.C
hem.
Ref.
Data,
Vol.
28,N
o.4,
1999
This Reuse of AIP content is subject to the terms at: http://scitation.aip.org/termsconditions. Downloaded to IP: 129.6.105.191 On: Fri, 05 Sep 2014 17:51:55
article is copyrighted as indicated in the article.Auxiliary Information
Method/Apparatus/Procedure: Source and Purity of Materials:
The titration method was used. The method was described inRefs. 1,2,3. The mixtures were titrated at 24.8 °C in order thatthe slight excess necessary for the recognition of the endpoint, might be dissolved at 25.00 °C, the temperature atwhich the refractive indexes were determinated. The plot ofrefractive index against composition was used to findcompositions of equilibrium phases. Phase equilibrium datawere reported in incomplete form; only distribution of alcoholbetween water and benzene was reported. 20 mL of benzeneand 20 mL of water were pipetted into glass stoppered bottlesand varying amounts of alcohol were added to the mixture.The flasks were suspended in the thermostated water bath for aperiod of 24 h and occasionally shaking. After separation thelayers were analyzed by means of refractometer andconcentrations of alcohol were reported.
~1! source not specified; refluxed over lime, distilled;d(25 °C)50.780 87.~2! source not specified; purified;d(25 °C)50.873 44.~3! ‘‘conductivity water’’.
Estimated Error:Not reported.
Reference:1E. R. Washburn, V. Hnizda, and R. Vold, J. Am. Chem. Soc.53, 3237~1931!.2R. Vold and E. R. Washburn, J. Am. Chem. Soc.54, 4217~1932!.3E. R. Washburn and H. C. Spencer, J. Am. Chem. Soc.56, 361~1934!.4International Critical Tables, Vol. 3 ~McGraw-Hill, New York,1929!, p. 389.
Components:
~1! 2-Propanol~isopropanol, isopropyl alcohol!; C3H8O;@67-63-0#~2! Benzene; C6H6; @71-43-2#~3! Water; H2O; @7732-18-5#
Variables:T/K5292– 343
Experimental
Compositions along th
t/°CT/K
~compiler!
x1
~compile
18.92 292.07 0.055925.18 298.33 0.055935.88 309.03 0.055945.15 318.30 0.055956.00 329.15 0.055864.72 337.87 0.055819.80 292.95 0.111128.85 302.00 0.110939.86 313.01 0.110851.66 324.81 0.110669.39 342.54 0.110321.95 295.10 0.196027.98 301.13 0.195641.00 314.15 0.194951.12 324.27 0.194657.51 330.66 0.194166.70 339.85 0.193720.81 293.96 0.280930.83 303.98 0.280246.39 319.54 0.279462.42 335.57 0.278468.55 341.70 0.277822.00 295.15 0.180734.20 307.35 0.179748.13 321.28 0.178957.35 330.50 0.178068.78 341.93 0.1775
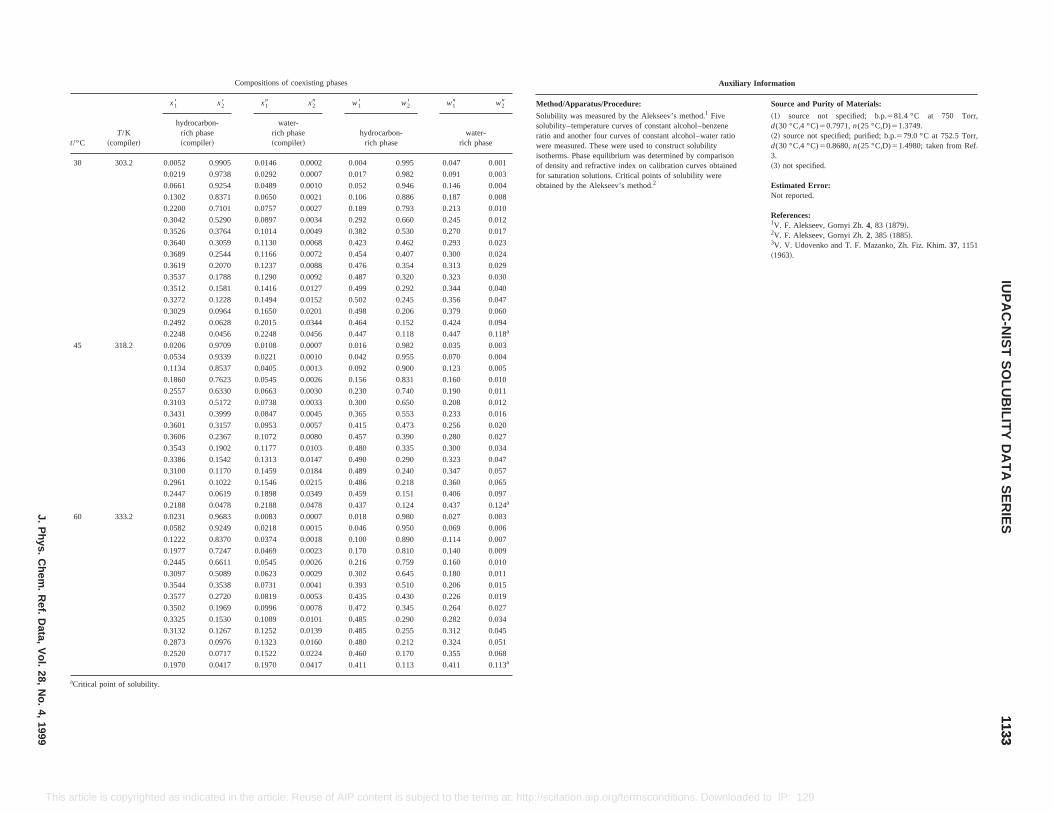
tions of coexisting phases
x29 w18 w28 w19 w29
water-rich phase~compiler!
hydrocarbon-rich phase
water-rich phase
.0146 0.0002 0.004 0.995 0.047 0.001
0292 0.0007 0.017 0.982 0.091 0.003
0489 0.0010 0.052 0.946 0.146 0.004
0650 0.0021 0.106 0.886 0.187 0.008
0757 0.0027 0.189 0.793 0.213 0.010
0897 0.0034 0.292 0.660 0.245 0.012
1014 0.0049 0.382 0.530 0.270 0.017
1130 0.0068 0.423 0.462 0.293 0.023
1166 0.0072 0.454 0.407 0.300 0.024
1237 0.0088 0.476 0.354 0.313 0.029
1290 0.0092 0.487 0.320 0.323 0.030
1416 0.0127 0.499 0.292 0.344 0.040
1494 0.0152 0.502 0.245 0.356 0.047
1650 0.0201 0.498 0.206 0.379 0.060
2015 0.0344 0.464 0.152 0.424 0.094
2248 0.0456 0.447 0.118 0.447 0.118a
.0108 0.0007 0.016 0.982 0.035 0.003
0221 0.0010 0.042 0.955 0.070 0.004
0405 0.0013 0.092 0.900 0.123 0.005
0545 0.0026 0.156 0.831 0.160 0.010
0663 0.0030 0.230 0.740 0.190 0.011
0738 0.0033 0.300 0.650 0.208 0.012
0847 0.0045 0.365 0.553 0.233 0.016
0953 0.0057 0.415 0.473 0.256 0.020
1072 0.0080 0.457 0.390 0.280 0.027
1177 0.0103 0.480 0.335 0.300 0.034
1313 0.0147 0.490 0.290 0.323 0.047
1459 0.0184 0.489 0.240 0.347 0.057
1546 0.0215 0.486 0.218 0.360 0.065
1898 0.0349 0.459 0.151 0.406 0.097
2188 0.0478 0.437 0.124 0.437 0.124a
.0083 0.0007 0.018 0.980 0.027 0.003
0218 0.0015 0.046 0.950 0.069 0.006
Auxiliary Information
Method/Apparatus/Procedure: Source and Purity of Materials:
Solubility was measured by the Alekseev’s method.1 Fivesolubility–temperature curves of constant alcohol–benzeneratio and another four curves of constant alcohol–water ratiowere measured. These were used to construct solubilityisotherms. Phase equilibrium was determined by comparisonof density and refractive index on calibration curves obtainedfor saturation solutions. Critical points of solubility wereobtained by the Alekseev’s method.2
~1! source not specified; b.p.581.4 °C at 750 Torr,d(30 °C,4 °C)50.7971,n(25 °C,D)51.3749.~2! source not specified; purified; b.p.579.0 °C at 752.5 Torr,d(30 °C,4 °C)50.8680,n(25 °C,D)51.4980; taken from Ref.3.~3! not specified.
Estimated Error:Not reported.
References:1V. F. Alekseev, Gornyi Zh.4, 83 ~1879!.2V. F. Alekseev, Gornyi Zh.2, 385 ~1885!.3V. V. Udovenko and T. F. Mazanko, Zh. Fiz. Khim.37, 1151~1963!.
11331133
IUP
AC
-NIS
TS
OLU
BILIT
YD
AT
AS
ER
IESJ.P
hys.C
hem.
Ref.
Data,
Vol.
28,N
o.4,
1999
This nloaded to IP: 129.6.105.191 On: Fri, 05 Sep 2014 17:51:55
0.1222 0.8370 0.0374 0.0018 0.100 0.890 0.114 0.007
0.1977 0.7247 0.0469 0.0023 0.170 0.810 0.140 0.009
0.2445 0.6611 0.0545 0.0026 0.216 0.759 0.160 0.010
0.3097 0.5089 0.0623 0.0029 0.302 0.645 0.180 0.011
0.3544 0.3538 0.0731 0.0041 0.393 0.510 0.206 0.015
0.3577 0.2720 0.0819 0.0053 0.435 0.430 0.226 0.019
0.3502 0.1969 0.0996 0.0078 0.472 0.345 0.264 0.027
0.3325 0.1530 0.1089 0.0101 0.485 0.290 0.282 0.034
0.3132 0.1267 0.1252 0.0139 0.485 0.255 0.312 0.045
0.2873 0.0976 0.1323 0.0160 0.480 0.212 0.324 0.051
0.2520 0.0717 0.1522 0.0224 0.460 0.170 0.355 0.068
0.1970 0.0417 0.1970 0.0417 0.411 0.113 0.411 0.113a
aCritical point of solubility.
article is copyrighted as indicated in the article. Reuse of AIP content is subject to the terms at: http://scitation.aip.org/termsconditions. Dow
Composi
t/°CT/K
~compiler!
x18 x28 x19
hydrocarbon-rich phase~compiler!
30 303.2 0.0052 0.9905 0
0.0219 0.9738 0.
0.0661 0.9254 0.
0.1302 0.8371 0.
0.2200 0.7101 0.
0.3042 0.5290 0.
0.3526 0.3764 0.
0.3640 0.3059 0.
0.3689 0.2544 0.
0.3619 0.2070 0.
0.3537 0.1788 0.
0.3512 0.1581 0.
0.3272 0.1228 0.
0.3029 0.0964 0.
0.2492 0.0628 0.
0.2248 0.0456 0.
45 318.2 0.0206 0.9709 0
0.0534 0.9339 0.
0.1134 0.8537 0.
0.1860 0.7623 0.
0.2557 0.6330 0.
0.3103 0.5172 0.
0.3431 0.3999 0.
0.3601 0.3157 0.
0.3606 0.2367 0.
0.3543 0.1902 0.
0.3386 0.1542 0.
0.3100 0.1170 0.
0.2961 0.1022 0.
0.2447 0.0619 0.
0.2188 0.0478 0.
60 333.2 0.0231 0.9683 0
0.0582 0.9249 0.
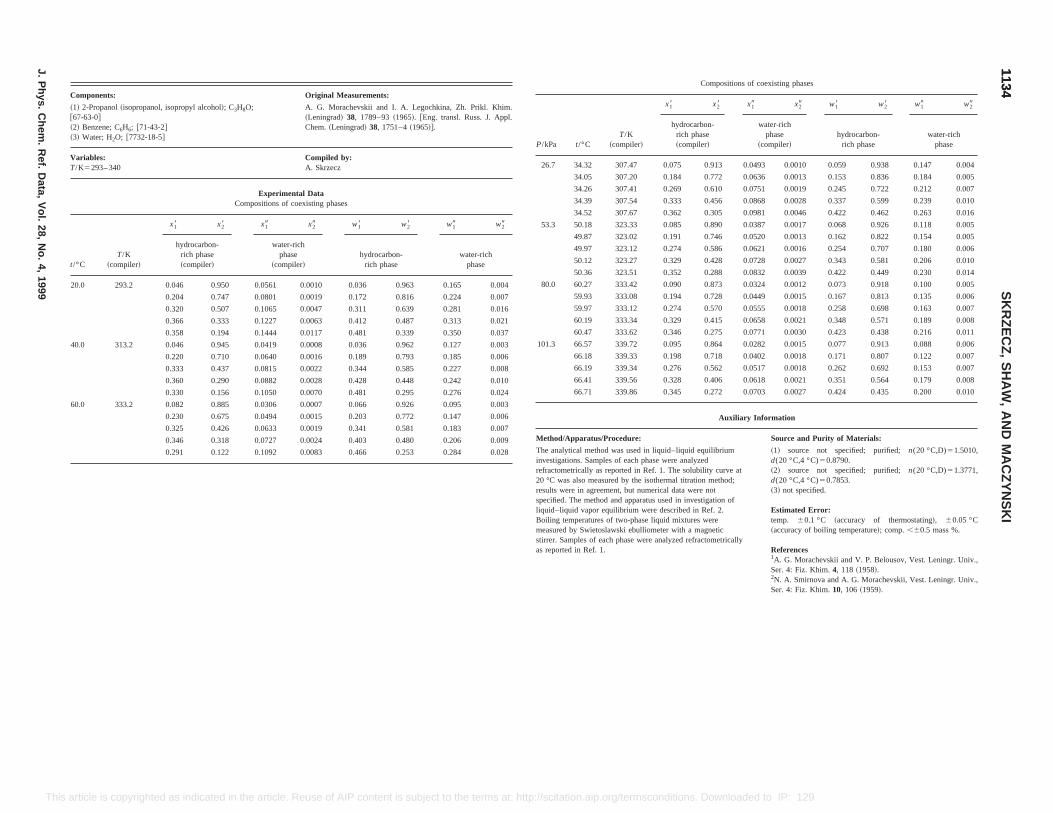
Compositions of coexisting phases
T/K~compiler!
x18 x28 x19 x29 w18 w28 w19 w29
hydrocarbon-rich phase~compiler!
water-richphase
~compiler!hydrocarbon-
rich phasewater-rich
phase
307.47 0.075 0.913 0.0493 0.0010 0.059 0.938 0.147 0.004
307.20 0.184 0.772 0.0636 0.0013 0.153 0.836 0.184 0.005
307.41 0.269 0.610 0.0751 0.0019 0.245 0.722 0.212 0.007
307.54 0.333 0.456 0.0868 0.0028 0.337 0.599 0.239 0.010
307.67 0.362 0.305 0.0981 0.0046 0.422 0.462 0.263 0.016
323.33 0.085 0.890 0.0387 0.0017 0.068 0.926 0.118 0.005
323.02 0.191 0.746 0.0520 0.0013 0.162 0.822 0.154 0.005
323.12 0.274 0.586 0.0621 0.0016 0.254 0.707 0.180 0.006
323.27 0.329 0.428 0.0728 0.0027 0.343 0.581 0.206 0.010
323.51 0.352 0.288 0.0832 0.0039 0.422 0.449 0.230 0.014
333.42 0.090 0.873 0.0324 0.0012 0.073 0.918 0.100 0.005
333.08 0.194 0.728 0.0449 0.0015 0.167 0.813 0.135 0.006
333.12 0.274 0.570 0.0555 0.0018 0.258 0.698 0.163 0.007
333.34 0.329 0.415 0.0658 0.0021 0.348 0.571 0.189 0.008
333.62 0.346 0.275 0.0771 0.0030 0.423 0.438 0.216 0.011
339.72 0.095 0.864 0.0282 0.0015 0.077 0.913 0.088 0.006
339.33 0.198 0.718 0.0402 0.0018 0.171 0.807 0.122 0.007
339.34 0.276 0.562 0.0517 0.0018 0.262 0.692 0.153 0.007
339.56 0.328 0.406 0.0618 0.0021 0.351 0.564 0.179 0.008
339.86 0.345 0.272 0.0703 0.0027 0.424 0.435 0.200 0.010
Auxiliary Information
Procedure: Source and Purity of Materials:
hod was used in liquid–liquid equilibriumples of each phase were analyzeds reported in Ref. 1. The solubility curve atasured by the isothermal titration method;eement, but numerical data were nothod and apparatus used in investigation ofequilibrium were described in Ref. 2.s of two-phase liquid mixtures were
measured by Swietoslawski ebulliometer with a magneticstirrer. Samples of each phase were analyzed refractometricallyas reported in Ref. 1.
~1! source not specified; purified;n(20 °C,D)51.5010,d(20 °C,4 °C)50.8790.~2! source not specified; purified;n(20 °C,D)51.3771,d(20 °C,4 °C)50.7853.~3! not specified.
Estimated Error:temp. 60.1 °C ~accuracy of thermostating!, 60.05 °C~accuracy of boiling temperature!; comp.,60.5 mass %.
References1A. G. Morachevskii and V. P. Belousov, Vest. Leningr. Univ.,Ser. 4: Fiz. Khim.4, 118 ~1958!.2N. A. Smirnova and A. G. Morachevskii, Vest. Leningr. Univ.,Ser. 4: Fiz. Khim.10, 106 ~1959!.
11341134
SK
RZ
EC
Z,
SH
AW
,A
ND
MA
CZ
YN
SK
I
J.P
hys.C
hem.
Ref.
Data,
Vol.
28,N
o.4,
1999
This ms at: http://scitation.aip.org/termsconditions. Downloaded to IP: 129.6.105.191 On: Fri, 05 Sep 2014 17:51:55
article is copyrighted as indicated in the article. Reuse of AIP content is subject to the terComponents: Original Measurements:
~1! 2-Propanol~isopropanol, isopropyl alcohol!; C3H8O;@67-63-0#~2! Benzene; C6H6; @71-43-2#~3! Water; H2O; @7732-18-5#
A. G. Morachevskii and I. A. Legochkina, Zh. Prikl. Khim.~Leningrad! 38, 1789–93~1965!. @Eng. transl. Russ. J. Appl.Chem.~Leningrad! 38, 1751–4~1965!#.
Variables:T/K5293– 340
Compiled by:A. Skrzecz
Experimental DataCompositions of coexisting phases
t/°CT/K
~compiler!
x18 x28 x19 x29 w18 w28 w19 w29
hydrocarbon-rich phase~compiler!
water-richphase
~compiler!hydrocarbon-
rich phasewater-rich
phase
20.0 293.2 0.046 0.950 0.0561 0.0010 0.036 0.963 0.165 0.004
0.204 0.747 0.0801 0.0019 0.172 0.816 0.224 0.007
0.320 0.507 0.1065 0.0047 0.311 0.639 0.281 0.016
0.366 0.333 0.1227 0.0063 0.412 0.487 0.313 0.021
0.358 0.194 0.1444 0.0117 0.481 0.339 0.350 0.037
40.0 313.2 0.046 0.945 0.0419 0.0008 0.036 0.962 0.127 0.003
0.220 0.710 0.0640 0.0016 0.189 0.793 0.185 0.006
0.333 0.437 0.0815 0.0022 0.344 0.585 0.227 0.008
0.360 0.290 0.0882 0.0028 0.428 0.448 0.242 0.010
0.330 0.156 0.1050 0.0070 0.481 0.295 0.276 0.024
60.0 333.2 0.082 0.885 0.0306 0.0007 0.066 0.926 0.095 0.003
0.230 0.675 0.0494 0.0015 0.203 0.772 0.147 0.006
0.325 0.426 0.0633 0.0019 0.341 0.581 0.183 0.007
0.346 0.318 0.0727 0.0024 0.403 0.480 0.206 0.009
0.291 0.122 0.1092 0.0083 0.466 0.253 0.284 0.028
P/kPa t/°C
26.7 34.32
34.05
34.26
34.39
34.52
53.3 50.18
49.87
49.97
50.12
50.36
80.0 60.27
59.93
59.97
60.19
60.47
101.3 66.57
66.18
66.19
66.41
66.71
Method/Apparatus/
The analytical metinvestigations. Samrefractometrically a20 °C was also meresults were in agrspecified. The metliquid–liquid vaporBoiling temperature
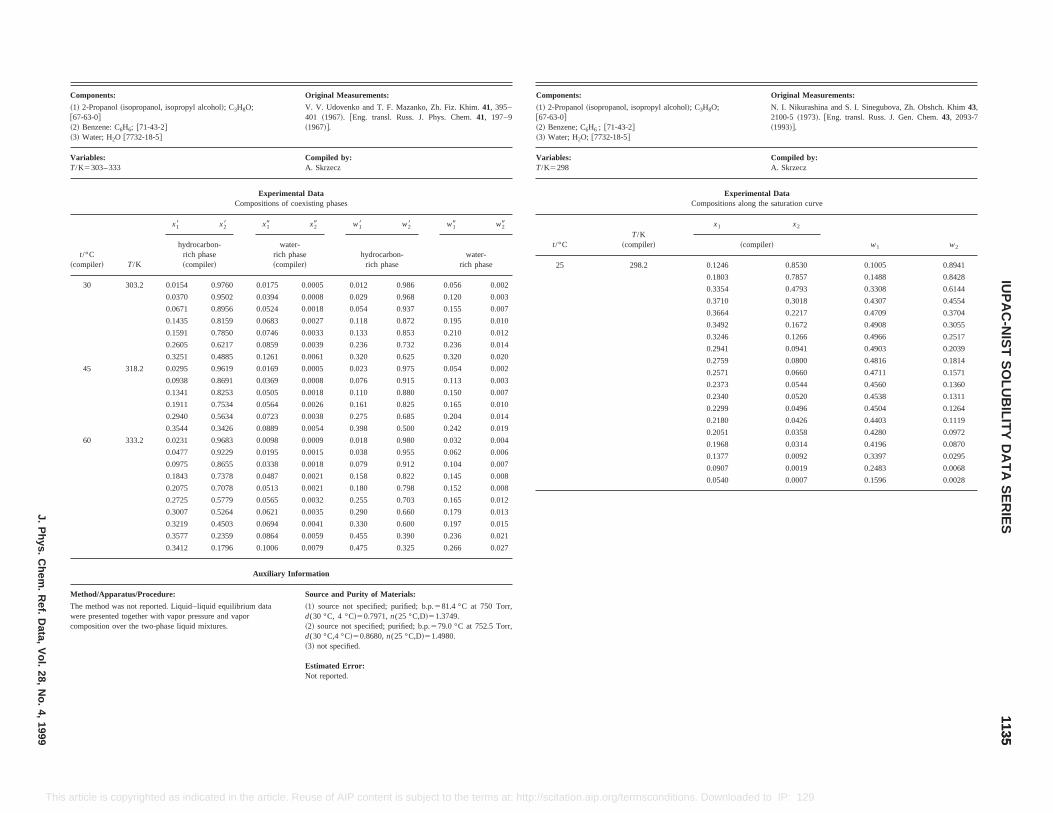
02
3
7
0
2
4
0
02
3
7
0
4
9
04
6
7
8
8
2
3
5
Components: Original Measurements:
~1! 2-Propanol~isopropanol, isopropyl alcohol!; C3H8O;@67-63-0#~2! Benzene; C6H6 ; @71-43-2#~3! Water; H2O; @7732-18-5#
N. I. Nikurashina and S. I. Sinegubova, Zh. Obshch. Khim43,2100-5 ~1973!. @Eng. transl. Russ. J. Gen. Chem.43, 2093-7~1993!#.
Variables:T/K5298
Compiled by:A. Skrzecz
Experimental DataCompositions along the saturation curve
t/°CT/K
~compiler!
x1 x2
w1 w2~compiler!
25 298.2 0.1246 0.8530 0.1005 0.8941
0.1803 0.7857 0.1488 0.8428
0.3354 0.4793 0.3308 0.6144
0.3710 0.3018 0.4307 0.4554
0.3664 0.2217 0.4709 0.3704
0.3492 0.1672 0.4908 0.3055
0.3246 0.1266 0.4966 0.2517
0.2941 0.0941 0.4903 0.2039
0.2759 0.0800 0.4816 0.1814
0.2571 0.0660 0.4711 0.1571
0.2373 0.0544 0.4560 0.1360
0.2340 0.0520 0.4538 0.1311
0.2299 0.0496 0.4504 0.1264
0.2180 0.0426 0.4403 0.1119
0.2051 0.0358 0.4280 0.0972
0.1968 0.0314 0.4196 0.0870
0.1377 0.0092 0.3397 0.0295
0.0907 0.0019 0.2483 0.0068
0.0540 0.0007 0.1596 0.0028
11351135
IUP
AC
-NIS
TS
OLU
BILIT
YD
AT
AS
ER
IESJ.P
hys.C
hem.
Ref.
Data,
Vol.
28,N
o.4,
1999
This s. Downloaded to IP: 129.6.105.191 On: Fri, 05 Sep 2014 17:51:55
0.3577 0.2359 0.0864 0.0059 0.455 0.390 0.236 0.021
0.3412 0.1796 0.1006 0.0079 0.475 0.325 0.266 0.027
Auxiliary Information
Method/Apparatus/Procedure: Source and Purity of Materials:
The method was not reported. Liquid–liquid equilibrium datawere presented together with vapor pressure and vaporcomposition over the two-phase liquid mixtures.
~1! source not specified; purified; b.p.581.4 °C at 750 Torr,d(30 °C, 4 °C!50.7971,n(25 °C,D!51.3749.~2! source not specified; purified; b.p.579.0 °C at 752.5 Torr,d(30 °C,4 °C!50.8680,n(25 °C,D!51.4980.~3! not specified.
Estimated Error:Not reported.
article is copyrighted as indicated in the article. Reuse of AIP content is subject to the terms at: http://scitation.aip.org/termscondition
Components: Original Measurements:
~1! 2-Propanol~isopropanol, isopropyl alcohol!; C3H8O;@67-63-0#~2! Benzene: C6H6; @71-43-2#~3! Water; H2O @7732-18-5#
V. V. Udovenko and T. F. Mazanko, Zh. Fiz. Khim.41, 395–401 ~1967!. @Eng. transl. Russ. J. Phys. Chem.41, 197–9~1967!#.
Variables:T/K5303– 333
Compiled by:A. Skrzecz
Experimental DataCompositions of coexisting phases
t/°C~compiler! T/K
x18 x28 x19 x29 w18 w28 w19 w29
hydrocarbon-rich phase~compiler!
water-rich phase~compiler!
hydrocarbon-rich phase
water-rich phase
30 303.2 0.0154 0.9760 0.0175 0.0005 0.012 0.986 0.056 0.0
0.0370 0.9502 0.0394 0.0008 0.029 0.968 0.120 0.00
0.0671 0.8956 0.0524 0.0018 0.054 0.937 0.155 0.00
0.1435 0.8159 0.0683 0.0027 0.118 0.872 0.195 0.01
0.1591 0.7850 0.0746 0.0033 0.133 0.853 0.210 0.01
0.2605 0.6217 0.0859 0.0039 0.236 0.732 0.236 0.01
0.3251 0.4885 0.1261 0.0061 0.320 0.625 0.320 0.02
45 318.2 0.0295 0.9619 0.0169 0.0005 0.023 0.975 0.054 0.0
0.0938 0.8691 0.0369 0.0008 0.076 0.915 0.113 0.00
0.1341 0.8253 0.0505 0.0018 0.110 0.880 0.150 0.00
0.1911 0.7534 0.0564 0.0026 0.161 0.825 0.165 0.01
0.2940 0.5634 0.0723 0.0038 0.275 0.685 0.204 0.01
0.3544 0.3426 0.0889 0.0054 0.398 0.500 0.242 0.01
60 333.2 0.0231 0.9683 0.0098 0.0009 0.018 0.980 0.032 0.0
0.0477 0.9229 0.0195 0.0015 0.038 0.955 0.062 0.00
0.0975 0.8655 0.0338 0.0018 0.079 0.912 0.104 0.00
0.1843 0.7378 0.0487 0.0021 0.158 0.822 0.145 0.00
0.2075 0.7078 0.0513 0.0021 0.180 0.798 0.152 0.00
0.2725 0.5779 0.0565 0.0032 0.255 0.703 0.165 0.01
0.3007 0.5264 0.0621 0.0035 0.290 0.660 0.179 0.01
0.3219 0.4503 0.0694 0.0041 0.330 0.600 0.197 0.01
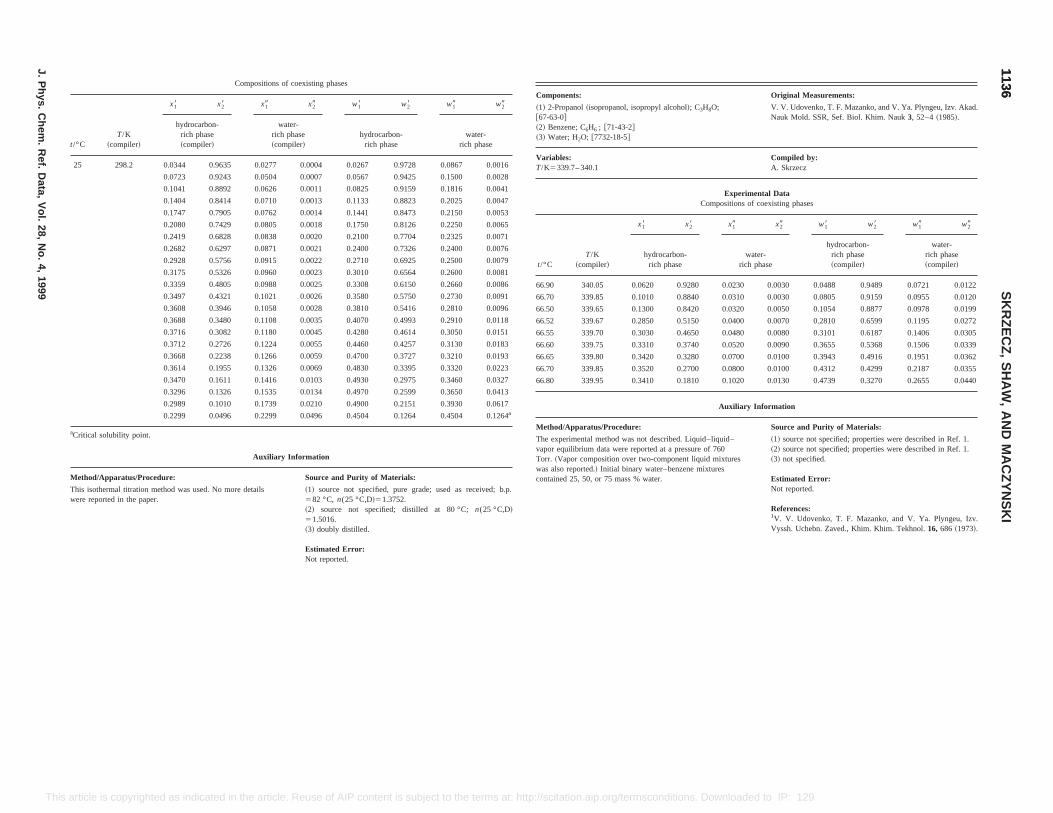
nents: Original Measurements:
ropanol~isopropanol, isopropyl alcohol!; C3H8O;-0#zene; C6H6 ; @71-43-2#
ter; H2O; @7732-18-5#
V. V. Udovenko, T. F. Mazanko, and V. Ya. Plyngeu, Izv. Akad.Nauk Mold. SSR, Sef. Biol. Khim. Nauk3, 52–4~1985!.
les:39.7– 340.1
Compiled by:A. Skrzecz
Experimental DataCompositions of coexisting phases
T/K~compiler!
x18 x28 x19 x29 w18 w28 w19 w29
hydrocarbon-rich phase
water-rich phase
hydrocarbon-rich phase~compiler!
water-rich phase~compiler!
340.05 0.0620 0.9280 0.0230 0.0030 0.0488 0.9489 0.0721 0.0122
339.85 0.1010 0.8840 0.0310 0.0030 0.0805 0.9159 0.0955 0.0120
339.65 0.1300 0.8420 0.0320 0.0050 0.1054 0.8877 0.0978 0.0199
339.67 0.2850 0.5150 0.0400 0.0070 0.2810 0.6599 0.1195 0.0272
339.70 0.3030 0.4650 0.0480 0.0080 0.3101 0.6187 0.1406 0.0305
339.75 0.3310 0.3740 0.0520 0.0090 0.3655 0.5368 0.1506 0.0339
339.80 0.3420 0.3280 0.0700 0.0100 0.3943 0.4916 0.1951 0.0362
339.85 0.3520 0.2700 0.0800 0.0100 0.4312 0.4299 0.2187 0.0355
339.95 0.3410 0.1810 0.1020 0.0130 0.4739 0.3270 0.2655 0.0440
Auxiliary Information
/Apparatus/Procedure: Source and Purity of Materials:
perimental method was not described. Liquid–liquid–quilibrium data were reported at a pressure of 760apor composition over two-component liquid mixtures
so reported.! Initial binary water–benzene mixturesed 25, 50, or 75 mass % water.
~1! source not specified; properties were described in Ref. 1.~2! source not specified; properties were described in Ref. 1.~3! not specified.
Estimated Error:Not reported.
References:1V. V. Udovenko, T. F. Mazanko, and V. Ya. Plyngeu, Izv.Vyssh. Uchebn. Zaved., Khim. Khim. Tekhnol.16, 686 ~1973!.
11361136
SK
RZ
EC
Z,
SH
AW
,A
ND
MA
CZ
YN
SK
I
J.P
hys.C
hem.
Ref.
Data,
Vol.
28,N
o.4,
1999
This n.aip.org/termsconditions. Downloaded to IP: 129.6.105.191 On: Fri, 05 Sep 2014 17:51:55
~3! doubly distilled.
Estimated Error:Not reported.
article is copyrighted as indicated in the article. Reuse of AIP content is subject to the terms at: http://scitatio
Compositions of coexisting phases
t/°CT/K
~compiler!
x18 x28 x19 x29 w18 w28 w19 w29
hydrocarbon-rich phase~compiler!
water-rich phase~compiler!
hydrocarbon-rich phase
water-rich phase
25 298.2 0.0344 0.9635 0.0277 0.0004 0.0267 0.9728 0.0867 0.0016
0.0723 0.9243 0.0504 0.0007 0.0567 0.9425 0.1500 0.0028
0.1041 0.8892 0.0626 0.0011 0.0825 0.9159 0.1816 0.0041
0.1404 0.8414 0.0710 0.0013 0.1133 0.8823 0.2025 0.0047
0.1747 0.7905 0.0762 0.0014 0.1441 0.8473 0.2150 0.0053
0.2080 0.7429 0.0805 0.0018 0.1750 0.8126 0.2250 0.0065
0.2419 0.6828 0.0838 0.0020 0.2100 0.7704 0.2325 0.0071
0.2682 0.6297 0.0871 0.0021 0.2400 0.7326 0.2400 0.0076
0.2928 0.5756 0.0915 0.0022 0.2710 0.6925 0.2500 0.0079
0.3175 0.5326 0.0960 0.0023 0.3010 0.6564 0.2600 0.0081
0.3359 0.4805 0.0988 0.0025 0.3308 0.6150 0.2660 0.0086
0.3497 0.4321 0.1021 0.0026 0.3580 0.5750 0.2730 0.0091
0.3608 0.3946 0.1058 0.0028 0.3810 0.5416 0.2810 0.0096
0.3688 0.3480 0.1108 0.0035 0.4070 0.4993 0.2910 0.0118
0.3716 0.3082 0.1180 0.0045 0.4280 0.4614 0.3050 0.0151
0.3712 0.2726 0.1224 0.0055 0.4460 0.4257 0.3130 0.0183
0.3668 0.2238 0.1266 0.0059 0.4700 0.3727 0.3210 0.0193
0.3614 0.1955 0.1326 0.0069 0.4830 0.3395 0.3320 0.0223
0.3470 0.1611 0.1416 0.0103 0.4930 0.2975 0.3460 0.0327
0.3296 0.1326 0.1535 0.0134 0.4970 0.2599 0.3650 0.0413
0.2989 0.1010 0.1739 0.0210 0.4900 0.2151 0.3930 0.0617
0.2299 0.0496 0.2299 0.0496 0.4504 0.1264 0.4504 0.1264a
aCritical solubility point.
Auxiliary Information
Method/Apparatus/Procedure: Source and Purity of Materials:
This isothermal titration method was used. No more detailswere reported in the paper.
~1! source not specified, pure grade; used as received; b.p.582 °C, n(25 °C,D!51.3752.~2! source not specified; distilled at 80 °C;n(25 °C,D!51.5016.
Compo
~1! 2-P@67-63~2! Ben~3! Wa
VariabT/K53
t/°C
66.90
66.70
66.50
66.52
66.55
66.60
66.65
66.70
66.80
Method
The exvapor eTorr. ~Vwas alcontain
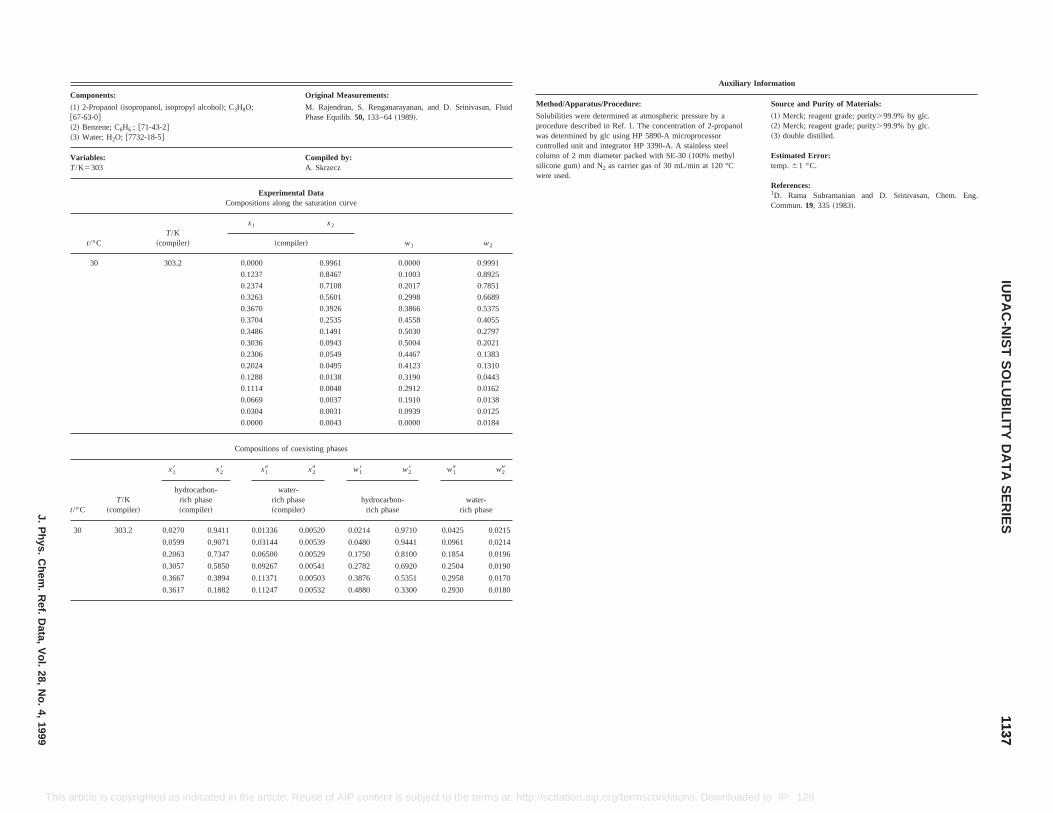
Original Measurements:
hol!; C3H8O; M. Rajendran, S. Renganarayanan, and D. Srinivasan, FluidPhase Equilib.50, 133–64~1989!.
Compiled by:A. Skrzecz
Experimental DataCompositions along the saturation curve
x1 x2
w1 w2~compiler!
0.0000 0.9961 0.0000 0.9991
0.1237 0.8467 0.1003 0.8925
0.2374 0.7108 0.2017 0.7851
0.3263 0.5601 0.2998 0.6689
0.3670 0.3926 0.3866 0.5375
0.3704 0.2535 0.4558 0.4055
0.3486 0.1491 0.5030 0.2797
0.3036 0.0943 0.5004 0.2021
0.2306 0.0549 0.4467 0.1383
0.2024 0.0495 0.4123 0.1310
0.1288 0.0138 0.3190 0.0443
0.1114 0.0048 0.2912 0.0162
0.0669 0.0037 0.1910 0.0138
0.0304 0.0031 0.0939 0.0125
0.0000 0.0043 0.0000 0.0184
Compositions of coexisting phases
x28 x19 x29 w18 w28 w19 w29
n- water-rich phase~compiler!
hydrocarbon-rich phase
water-rich phase
Auxiliary Information
Method/Apparatus/Procedure: Source and Purity of Materials:
Solubilities were determined at atmospheric pressure by aprocedure described in Ref. 1. The concentration of 2-propanolwas determined by glc using HP 5890-A microprocessorcontrolled unit and integrator HP 3390-A. A stainless steelcolumn of 2 mm diameter packed with SE-30~100% methylsilicone gum! and N2 as carrier gas of 30 mL/min at 120 °Cwere used.
~1! Merck; reagent grade; purity.99.9% by glc.~2! Merck; reagent grade; purity.99.9% by glc.~3! double distilled.
Estimated Error:temp.61 °C.
References:1D. Rama Subramanian and D. Srinivasan, Chem. Eng.Commun.19, 335 ~1983!.
11371137
IUP
AC
-NIS
TS
OLU
BILIT
YD
AT
AS
ER
IESJ.P
hys.C
hem.
Ref.
Data,
Vol.
28,N
o.4,
1999
This termsconditions. Downloaded to IP: 129.6.105.191 On: Fri, 05 Sep 2014 17:51:55
30 303.2 0.0270 0.9411 0.01336 0.00520 0.0214 0.9710 0.0425 0.0215
0.0599 0.9071 0.03144 0.00539 0.0480 0.9441 0.0961 0.0214
0.2063 0.7347 0.06500 0.00529 0.1750 0.8100 0.1854 0.0196
0.3057 0.5850 0.09267 0.00541 0.2782 0.6920 0.2504 0.0190
0.3667 0.3894 0.11371 0.00503 0.3876 0.5351 0.2958 0.0170
0.3617 0.1882 0.11247 0.00532 0.4880 0.3300 0.2930 0.0180
article is copyrighted as indicated in the article. Reuse of AIP content is subject to the terms at: http://scitation.aip.org/
Components:
~1! 2-Propanol~isopropanol, isopropyl alco@67-63-0#~2! Benzene; C6H6 ; @71-43-2#~3! Water; H2O; @7732-18-5#
Variables:T/K5303
t/°CT/K
~compiler!
30 303.2
t/°CT/K
~compiler!
x18
hydrocarborich phase~compiler!
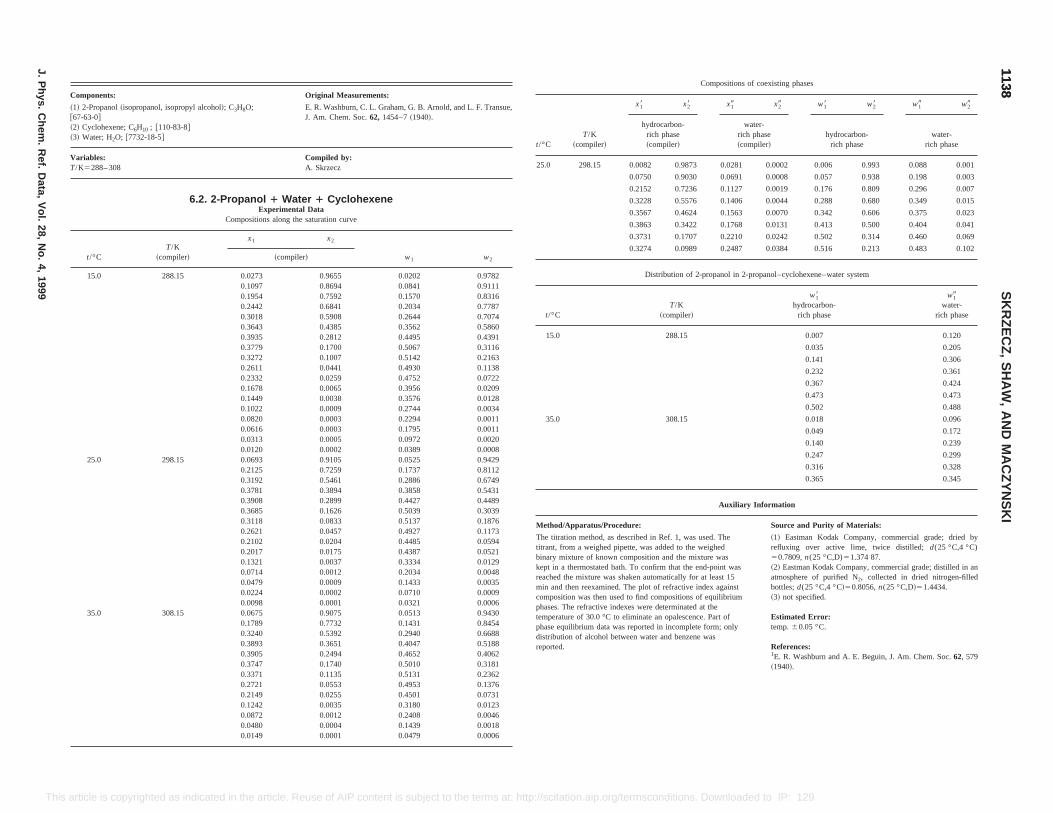
C
~1@6~2~3
VT
Compositions of coexisting phases
x19 x29 w18 w28 w19 w29
water-rich phase~compiler!
hydrocarbon-rich phase
water-rich phase
873 0.0281 0.0002 0.006 0.993 0.088 0.001
30 0.0691 0.0008 0.057 0.938 0.198 0.003
36 0.1127 0.0019 0.176 0.809 0.296 0.007
76 0.1406 0.0044 0.288 0.680 0.349 0.015
24 0.1563 0.0070 0.342 0.606 0.375 0.023
22 0.1768 0.0131 0.413 0.500 0.404 0.041
07 0.2210 0.0242 0.502 0.314 0.460 0.069
89 0.2487 0.0384 0.516 0.213 0.483 0.102
f 2-propanol in 2-propanol–cyclohexene–water system
w18hydrocarbon-
rich phase
w19water-
rich phase
0.007 0.120
0.035 0.205
0.141 0.306
0.232 0.361
0.367 0.424
0.473 0.473
0.502 0.488
0.018 0.096
0.049 0.172
0.140 0.239
0.247 0.299
0.316 0.328
0.365 0.345
Auxiliary Information
Source and Purity of Materials:
~1! Eastman Kodak Company, commercial grade; dried byrefluxing over active lime, twice distilled;d(25 °C,4 °C)50.7809,n(25 °C,D)51.374 87.~2! Eastman Kodak Company, commercial grade; distilled in anatmosphere of purified N2, collected in dried nitrogen-filledbottles;d(25 °C,4 °C!50.8056,n(25 °C,D!51.4434.~3! not specified.
Estimated Error:temp.60.05 °C.
References:1E. R. Washburn and A. E. Beguin, J. Am. Chem. Soc.62, 579~1940!.
11381138
SK
RZ
EC
Z,
SH
AW
,A
ND
MA
CZ
YN
SK
I
J.P
hys.C
hem.
Ref.
Data,
Vol.
28,N
o.4,
1999
This a IP: 129.6.105.191 On: Fri, 05 Sep 2014 17:51:55
0.2621 0.0457 0.4927 0.11730.2102 0.0204 0.4485 0.05940.2017 0.0175 0.4387 0.05210.1321 0.0037 0.3334 0.01290.0714 0.0012 0.2034 0.00480.0479 0.0009 0.1433 0.00350.0224 0.0002 0.0710 0.00090.0098 0.0001 0.0321 0.0006
35.0 308.15 0.0675 0.9075 0.0513 0.94300.1789 0.7732 0.1431 0.84540.3240 0.5392 0.2940 0.66880.3893 0.3651 0.4047 0.51880.3905 0.2494 0.4652 0.40620.3747 0.1740 0.5010 0.31810.3371 0.1135 0.5131 0.23620.2721 0.0553 0.4953 0.13760.2149 0.0255 0.4501 0.07310.1242 0.0035 0.3180 0.01230.0872 0.0012 0.2408 0.00460.0480 0.0004 0.1439 0.00180.0149 0.0001 0.0479 0.0006
The titration method, as described in Ref. 1, was used. Thetitrant, from a weighed pipette, was added to the weighedbinary mixture of known composition and the mixture waskept in a thermostated bath. To confirm that the end-point wasreached the mixture was shaken automatically for at least 15min and then reexamined. The plot of refractive index againstcomposition was then used to find compositions of equilibriumphases. The refractive indexes were determinated at thetemperature of 30.0 °C to eliminate an opalescence. Part ofphase equilibrium data was reported in incomplete form; onlydistribution of alcohol between water and benzene wasreported.
rticle is copyrighted as indicated in the article. Reuse of AIP content is subject to the terms at: http://scitation.aip.org/termsconditions. Downloaded to
omponents: Original Measurements:
! 2-Propanol~isopropanol, isopropyl alcohol!; C3H8O;7-63-0#! Cyclohexene; C6H10 ; @110-83-8#! Water; H2O; @7732-18-5#
E. R. Washburn, C. L. Graham, G. B. Arnold, and L. F. Transue,J. Am. Chem. Soc.62, 1454–7~1940!.
ariables:/K5288– 308
Compiled by:A. Skrzecz
6.2. 2-Propanol 1 Water 1 CyclohexeneExperimental Data
Compositions along the saturation curve
t/°CT/K
~compiler!
x1 x2
w1 w2~compiler!
15.0 288.15 0.0273 0.9655 0.0202 0.97820.1097 0.8694 0.0841 0.91110.1954 0.7592 0.1570 0.83160.2442 0.6841 0.2034 0.77870.3018 0.5908 0.2644 0.70740.3643 0.4385 0.3562 0.58600.3935 0.2812 0.4495 0.43910.3779 0.1700 0.5067 0.31160.3272 0.1007 0.5142 0.21630.2611 0.0441 0.4930 0.11380.2332 0.0259 0.4752 0.07220.1678 0.0065 0.3956 0.02090.1449 0.0038 0.3576 0.01280.1022 0.0009 0.2744 0.00340.0820 0.0003 0.2294 0.00110.0616 0.0003 0.1795 0.00110.0313 0.0005 0.0972 0.00200.0120 0.0002 0.0389 0.0008
25.0 298.15 0.0693 0.9105 0.0525 0.94290.2125 0.7259 0.1737 0.81120.3192 0.5461 0.2886 0.67490.3781 0.3894 0.3858 0.54310.3908 0.2899 0.4427 0.44890.3685 0.1626 0.5039 0.30390.3118 0.0833 0.5137 0.1876
t/°CT/K
~compiler!
x18 x28
hydrocarbon-rich phase~compiler!
25.0 298.15 0.0082 0.9
0.0750 0.90
0.2152 0.72
0.3228 0.55
0.3567 0.46
0.3863 0.34
0.3731 0.17
0.3274 0.09
Distribution o
t/°CT/K
~compiler!
15.0 288.15
35.0 308.15
Method/Apparatus/Procedure:
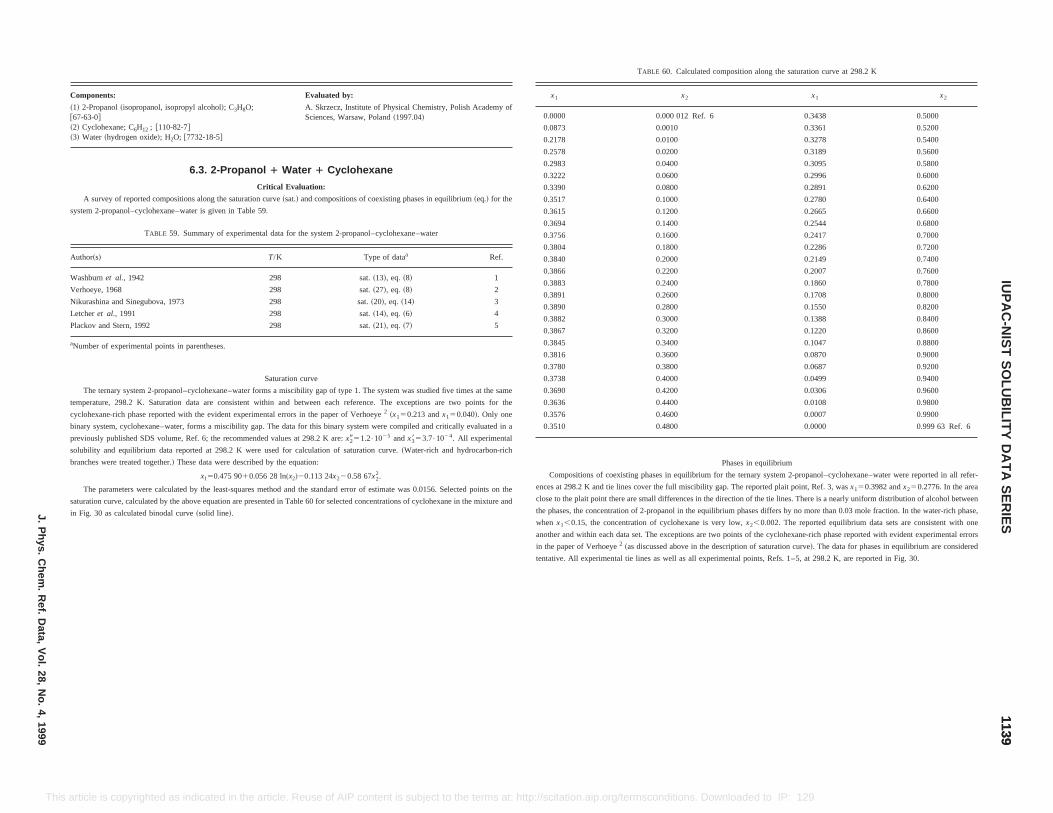
TABLE 60. Calculated composition along the saturation curve at 298.2 K
x2 x1 x2
0.000 012 Ref. 6 0.3438 0.5000
0.0010 0.3361 0.5200
0.0100 0.3278 0.5400
0.0200 0.3189 0.5600
0.0400 0.3095 0.5800
0.0600 0.2996 0.6000
0.0800 0.2891 0.6200
0.1000 0.2780 0.6400
0.1200 0.2665 0.6600
0.1400 0.2544 0.6800
0.1600 0.2417 0.7000
0.1800 0.2286 0.7200
0.2000 0.2149 0.7400
0.2200 0.2007 0.7600
0.2400 0.1860 0.7800
0.2600 0.1708 0.8000
0.2800 0.1550 0.8200
0.3000 0.1388 0.8400
0.3200 0.1220 0.8600
0.3400 0.1047 0.8800
0.3600 0.0870 0.9000
0.3800 0.0687 0.9200
0.4000 0.0499 0.9400
0.4200 0.0306 0.9600
0.4400 0.0108 0.9800
0.4600 0.0007 0.9900
0.4800 0.0000 0.999 63 Ref. 6
Phases in equilibrium
sitions of coexisting phases in equilibrium for the ternary system 2-propanol–cyclohexane–water were reported in all refer-
8.2 K and tie lines cover the full miscibility gap. The reported plait point, Ref. 3, wasx150.3982 andx250.2776. In the area
plait point there are small differences in the direction of the tie lines. There is a nearly uniform distribution of alcohol between
, the concentration of 2-propanol in the equilibrium phases differs by no more than 0.03 mole fraction. In the water-rich phase,
.15, the concentration of cyclohexane is very low,x2,0.002. The reported equilibrium data sets are consistent with one
another and within each data set. The exceptions are two points of the cyclohexane-rich phase reported with evident experimental errors
in the paper of Verhoeye2 ~as discussed above in the description of saturation curve!. The data for phases in equilibrium are considered
tentative. All experimental tie lines as well as all experimental points, Refs. 1–5, at 298.2 K, are reported in Fig. 30.
11391139
IUP
AC
-NIS
TS
OLU
BILIT
YD
AT
AS
ER
IESJ.P
hys.C
hem.
Ref.
Data,
Vol.
28,N
o.4,
1999
This ://scitation.aip.org/termsconditions. Downloaded to IP: 129.6.105.191 On: Fri, 05 Sep 2014 17:51:55
article is copyrighted as indicated in the article. Reuse of AIP content is subject to the terms at: httpComponents: Evaluated by:
~1! 2-Propanol~isopropanol, isopropyl alcohol!; C3H8O;@67-63-0#~2! Cyclohexane; C6H12 ; @110-82-7#~3! Water ~hydrogen oxide!; H2O; @7732-18-5#
A. Skrzecz, Institute of Physical Chemistry, Polish Academy ofSciences, Warsaw, Poland~1997.04!
6.3. 2-Propanol 1 Water 1 Cyclohexane
Critical Evaluation:
A survey of reported compositions along the saturation curve~sat.! and compositions of coexisting phases in equilibrium~eq.! for the
system 2-propanol–cyclohexane–water is given in Table 59.
TABLE 59. Summary of experimental data for the system 2-propanol–cyclohexane–water
Author~s! T/K Type of dataa Ref.
Washburnet al., 1942 298 sat.~13!, eq. ~8! 1
Verhoeye, 1968 298 sat.~27!, eq. ~8! 2
Nikurashina and Sinegubova, 1973 298 sat.~20!, eq. ~14! 3
Letcheret al., 1991 298 sat.~14!, eq. ~6! 4
Plackov and Stern, 1992 298 sat.~21!, eq. ~7! 5
aNumber of experimental points in parentheses.
Saturation curve
The ternary system 2-propanol–cyclohexane–water forms a miscibility gap of type 1. The system was studied five times at the same
temperature, 298.2 K. Saturation data are consistent within and between each reference. The exceptions are two points for the
cyclohexane-rich phase reported with the evident experimental errors in the paper of Verhoeye2 ~x150.213 andx150.040!. Only one
binary system, cyclohexane–water, forms a miscibility gap. The data for this binary system were compiled and critically evaluated in a
previously published SDS volume, Ref. 6; the recommended values at 298.2 K are:x2951.2•1025 andx3853.7•1024. All experimental
solubility and equilibrium data reported at 298.2 K were used for calculation of saturation curve.~Water-rich and hydrocarbon-rich
branches were treated together.! These data were described by the equation:
x150.475 9010.056 28 ln~x2!20.113 24x220.58 67x22.
The parameters were calculated by the least-squares method and the standard error of estimate was 0.0156. Selected points on the
saturation curve, calculated by the above equation are presented in Table 60 for selected concentrations of cyclohexane in the mixture and
in Fig. 30 as calculated binodal curve~solid line!.
x1
0.0000
0.0873
0.2178
0.2578
0.2983
0.3222
0.3390
0.3517
0.3615
0.3694
0.3756
0.3804
0.3840
0.3866
0.3883
0.3891
0.3890
0.3882
0.3867
0.3845
0.3816
0.3780
0.3738
0.3690
0.3636
0.3576
0.3510
Compo
ences at 29
close to the
the phases
when x1,0
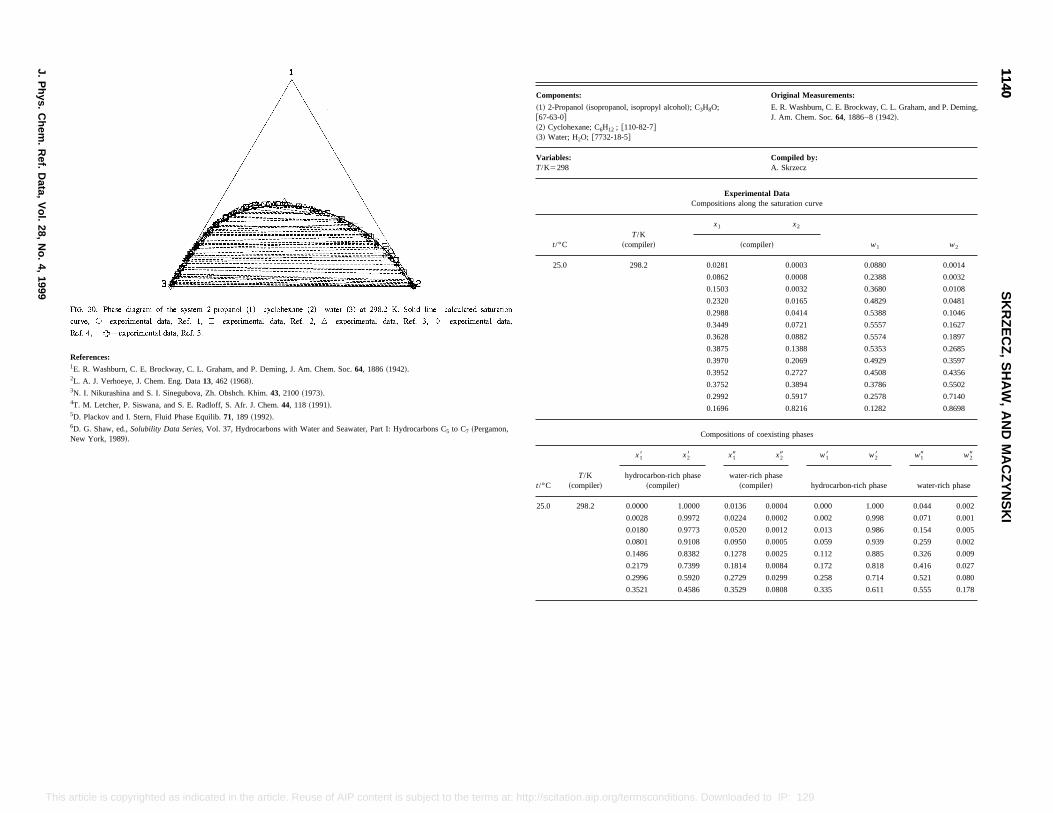
Original Measurements:
anol, isopropyl alcohol!; C3H8O;
; @110-82-7#18-5#
E. R. Washburn, C. E. Brockway, C. L. Graham, and P. Deming,J. Am. Chem. Soc.64, 1886–8~1942!.
Compiled by:A. Skrzecz
Experimental DataCompositions along the saturation curve
T/K~compiler!
x1 x2
w1 w2~compiler!
298.2 0.0281 0.0003 0.0880 0.0014
0.0862 0.0008 0.2388 0.0032
0.1503 0.0032 0.3680 0.0108
0.2320 0.0165 0.4829 0.0481
0.2988 0.0414 0.5388 0.1046
0.3449 0.0721 0.5557 0.1627
0.3628 0.0882 0.5574 0.1897
0.3875 0.1388 0.5353 0.2685
0.3970 0.2069 0.4929 0.3597
0.3952 0.2727 0.4508 0.4356
0.3752 0.3894 0.3786 0.5502
0.2992 0.5917 0.2578 0.7140
0.1696 0.8216 0.1282 0.8698
Compositions of coexisting phases
x18 x28 x19 x29 w18 w28 w19 w29
hydrocarbon-rich phase~compiler!
water-rich phase~compiler! hydrocarbon-rich phase water-rich phase
0.0000 1.0000 0.0136 0.0004 0.000 1.000 0.044 0.002
0.0028 0.9972 0.0224 0.0002 0.002 0.998 0.071 0.001
0.0180 0.9773 0.0520 0.0012 0.013 0.986 0.154 0.005
0.0801 0.9108 0.0950 0.0005 0.059 0.939 0.259 0.002
0.1486 0.8382 0.1278 0.0025 0.112 0.885 0.326 0.009
0.2179 0.7399 0.1814 0.0084 0.172 0.818 0.416 0.027
0.2996 0.5920 0.2729 0.0299 0.258 0.714 0.521 0.080
0.3521 0.4586 0.3529 0.0808 0.335 0.611 0.555 0.178
11401140
SK
RZ
EC
Z,
SH
AW
,A
ND
MA
CZ
YN
SK
I
J.P
hys.C
hem.
Ref.
Data,
Vol.
28,N
o.4,
1999
This the terms at: http://scitation.aip.org/termsconditions. Downloaded to IP: 129.6.105.191 On: Fri, 05 Sep 2014 17:51:55
article is copyrighted as indicated in the article. Reuse of AIP content is subject toReferences:1E. R. Washburn, C. E. Brockway, C. L. Graham, and P. Deming, J. Am. Chem. Soc.64, 1886~1942!.2L. A. J. Verhoeye, J. Chem. Eng. Data13, 462 ~1968!.3N. I. Nikurashina and S. I. Sinegubova, Zh. Obshch. Khim.43, 2100~1973!.4T. M. Letcher, P. Siswana, and S. E. Radloff, S. Afr. J. Chem.44, 118 ~1991!.5D. Plackov and I. Stern, Fluid Phase Equilib.71, 189 ~1992!.6D. G. Shaw, ed.,Solubility Data Series, Vol. 37, Hydrocarbons with Water and Seawater, Part I: Hydrocarbons C5 to C7 ~Pergamon,New York, 1989!.
Components:
~1! 2-Propanol~isoprop@67-63-0#~2! Cyclohexane; C6H12
~3! Water; H2O; @7732-
Variables:T/K5298
t/°C
25.0
t/°CT/K
~compiler!
25.0 298.2
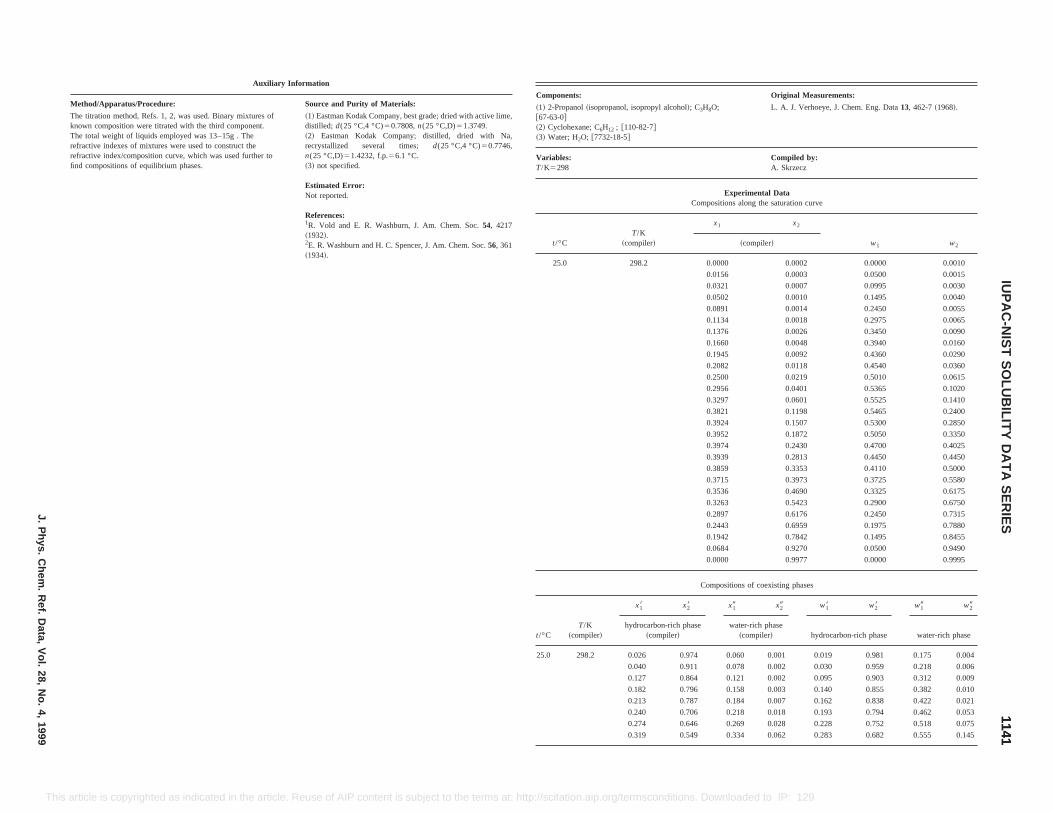
Original Measurements:
L. A. J. Verhoeye, J. Chem. Eng. Data13, 462-7~1968!.
Compiled by:A. Skrzecz
l Datahe saturation curve
x2
w1 w2er!
0.0002 0.0000 0.0010
0.0003 0.0500 0.0015
0.0007 0.0995 0.0030
0.0010 0.1495 0.0040
0.0014 0.2450 0.0055
0.0018 0.2975 0.0065
0.0026 0.3450 0.0090
0.0048 0.3940 0.0160
0.0092 0.4360 0.0290
0.0118 0.4540 0.0360
0.0219 0.5010 0.0615
0.0401 0.5365 0.1020
0.0601 0.5525 0.1410
0.1198 0.5465 0.2400
0.1507 0.5300 0.2850
0.1872 0.5050 0.3350
0.2430 0.4700 0.4025
0.2813 0.4450 0.4450
0.3353 0.4110 0.5000
0.3973 0.3725 0.5580
0.4690 0.3325 0.6175
0.5423 0.2900 0.6750
0.6176 0.2450 0.7315
0.6959 0.1975 0.7880
0.1942 0.7842 0.1495 0.8455
0.0684 0.9270 0.0500 0.9490
0.0000 0.9977 0.0000 0.9995
Compositions of coexisting phases
t/°CT/K
~compiler!
x18 x28 x19 x29 w18 w28 w19 w29
hydrocarbon-rich phase~compiler!
water-rich phase~compiler! hydrocarbon-rich phase water-rich phase
25.0 298.2 0.026 0.974 0.060 0.001 0.019 0.981 0.175 0.004
0.040 0.911 0.078 0.002 0.030 0.959 0.218 0.006
0.127 0.864 0.121 0.002 0.095 0.903 0.312 0.009
0.182 0.796 0.158 0.003 0.140 0.855 0.382 0.010
0.213 0.787 0.184 0.007 0.162 0.838 0.422 0.021
0.240 0.706 0.218 0.018 0.193 0.794 0.462 0.053
0.274 0.646 0.269 0.028 0.228 0.752 0.518 0.075
0.319 0.549 0.334 0.062 0.283 0.682 0.555 0.145
11411141
IUP
AC
-NIS
TS
OLU
BILIT
YD
AT
AS
ER
IESJ.P
hys.C
hem.
Ref.
Data,
Vol.
28,N
o.4,
1999
This icle. Reuse of AIP content is subject to the terms at: http://scitation.aip.org/termsconditions. Downloaded to IP: 129.6.105.191 On: Fri, 05 Sep 2014 17:51:55
article is copyrighted as indicated in the artAuxiliary Information
Method/Apparatus/Procedure: Source and Purity of Materials:
The titration method, Refs. 1, 2, was used. Binary mixtures ofknown composition were titrated with the third component.The total weight of liquids employed was 13–15g . Therefractive indexes of mixtures were used to construct therefractive index/composition curve, which was used further tofind compositions of equilibrium phases.
~1! Eastman Kodak Company, best grade; dried with active lime,distilled; d(25 °C,4 °C)50.7808,n(25 °C,D)51.3749.~2! Eastman Kodak Company; distilled, dried with Na,recrystallized several times; d(25 °C,4 °C)50.7746,n(25 °C,D)51.4232, f.p.56.1 °C.~3! not specified.
Estimated Error:Not reported.
References:1R. Vold and E. R. Washburn, J. Am. Chem. Soc.54, 4217~1932!.2E. R. Washburn and H. C. Spencer, J. Am. Chem. Soc.56, 361~1934!.
Components:
~1! 2-Propanol~isopropanol, isopropyl alcohol!; C3H8O;@67-63-0#~2! Cyclohexane; C6H12 ; @110-82-7#~3! Water; H2O; @7732-18-5#
Variables:T/K5298
ExperimentaCompositions along t
t/°CT/K
~compiler!
x1
~compil
25.0 298.2 0.0000
0.0156
0.0321
0.0502
0.0891
0.1134
0.1376
0.1660
0.1945
0.2082
0.2500
0.2956
0.3297
0.3821
0.3924
0.3952
0.3974
0.3939
0.3859
0.3715
0.3536
0.3263
0.2897
0.2443
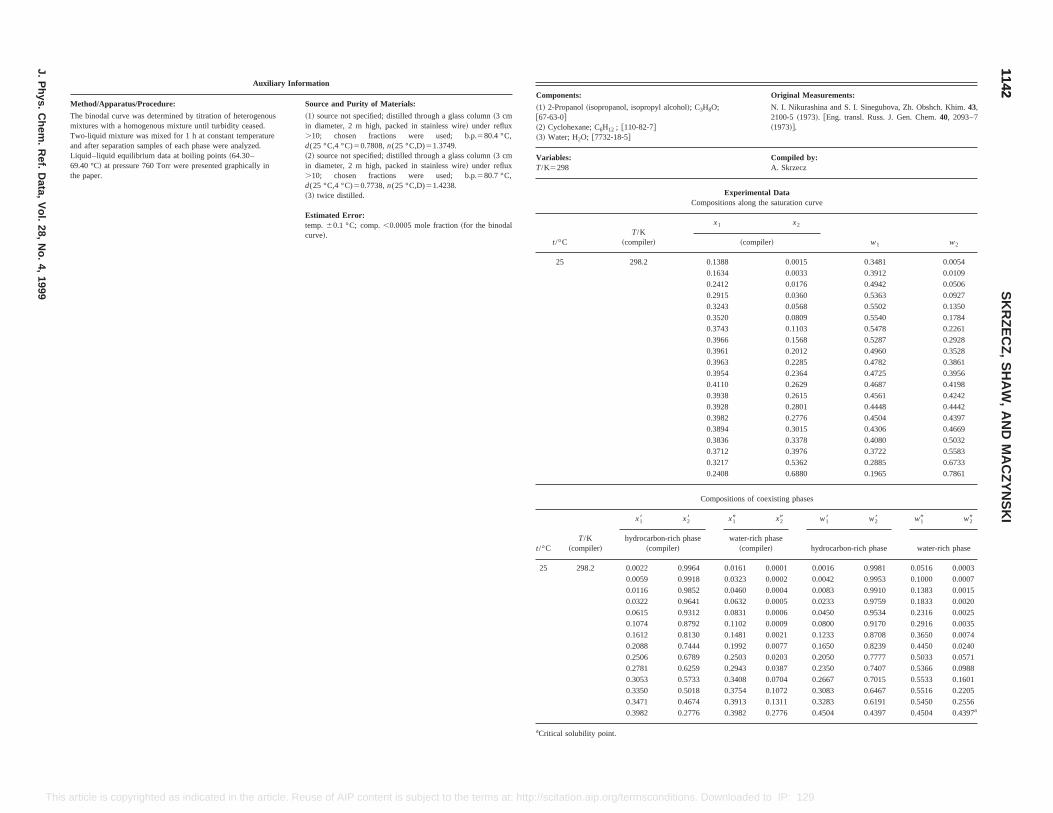
Original Measurements:
N. I. Nikurashina and S. I. Sinegubova, Zh. Obshch. Khim.43,2100-5 ~1973!. @Eng. transl. Russ. J. Gen. Chem.40, 2093–7~1973!#.
Compiled by:A. Skrzecz
tal Datathe saturation curve
x2
w1 w2iler!
0.0015 0.3481 0.0054
0.0033 0.3912 0.0109
0.0176 0.4942 0.0506
0.0360 0.5363 0.0927
0.0568 0.5502 0.1350
0.0809 0.5540 0.1784
0.1103 0.5478 0.2261
0.1568 0.5287 0.2928
0.2012 0.4960 0.3528
0.2285 0.4782 0.3861
0.2364 0.4725 0.3956
0.2629 0.4687 0.4198
0.2615 0.4561 0.4242
0.2801 0.4448 0.4442
0.2776 0.4504 0.4397
0.3015 0.4306 0.4669
0.3378 0.4080 0.5032
0.3976 0.3722 0.5583
0.5362 0.2885 0.6733
0.6880 0.1965 0.7861
coexisting phases
t/°CT/K
~compiler!
x29 w18 w28 w19 w29
hydrocarbon-rich phase~compiler!
water-rich phase~compiler! hydrocarbon-rich phase water-rich phase
25 298.2 0.0022 0.9964 0.0161 0.0001 0.0016 0.9981 0.0516 0.0003
0.0059 0.9918 0.0323 0.0002 0.0042 0.9953 0.1000 0.0007
0.0116 0.9852 0.0460 0.0004 0.0083 0.9910 0.1383 0.0015
0.0322 0.9641 0.0632 0.0005 0.0233 0.9759 0.1833 0.0020
0.0615 0.9312 0.0831 0.0006 0.0450 0.9534 0.2316 0.0025
0.1074 0.8792 0.1102 0.0009 0.0800 0.9170 0.2916 0.0035
0.1612 0.8130 0.1481 0.0021 0.1233 0.8708 0.3650 0.0074
0.2088 0.7444 0.1992 0.0077 0.1650 0.8239 0.4450 0.0240
0.2506 0.6789 0.2503 0.0203 0.2050 0.7777 0.5033 0.0571
0.2781 0.6259 0.2943 0.0387 0.2350 0.7407 0.5366 0.0988
0.3053 0.5733 0.3408 0.0704 0.2667 0.7015 0.5533 0.1601
0.3350 0.5018 0.3754 0.1072 0.3083 0.6467 0.5516 0.2205
0.3471 0.4674 0.3913 0.1311 0.3283 0.6191 0.5450 0.2556
0.3982 0.2776 0.3982 0.2776 0.4504 0.4397 0.4504 0.4397a
aCritical solubility point.
11421142
SK
RZ
EC
Z,
SH
AW
,A
ND
MA
CZ
YN
SK
I
J.P
hys.C
hem.
Ref.
Data,
Vol.
28,N
o.4,
1999
This e article. Reuse of AIP content is subject to the terms at: http://scitation.aip.org/termsconditions. Downloaded to IP: 129.6.105.191 On: Fri, 05 Sep 2014 17:51:55
article is copyrighted as indicated in thAuxiliary Information
Method/Apparatus/Procedure: Source and Purity of Materials:
The binodal curve was determined by titration of heterogenousmixtures with a homogenous mixture until turbidity ceased.Two-liquid mixture was mixed for 1 h atconstant temperatureand after separation samples of each phase were analyzed.Liquid–liquid equilibrium data at boiling points~64.30–69.40 °C! at pressure 760 Torr were presented graphically inthe paper.
~1! source not specified; distilled through a glass column~3 cmin diameter, 2 m high, packed in stainless wire! under reflux.10; chosen fractions were used; b.p.580.4 °C,d(25 °C,4 °C)50.7808,n(25 °C,D)51.3749.~2! source not specified; distilled through a glass column~3 cmin diameter, 2 m high, packed in stainless wire! under reflux.10; chosen fractions were used; b.p.580.7 °C,d(25 °C,4 °C)50.7738,n(25 °C,D)51.4238.~3! twice distilled.
Estimated Error:temp.60.1 °C; comp.,0.0005 mole fraction~for the binodalcurve!.
Components:
~1! 2-Propanol~isopropanol, isopropyl alcohol!; C3H8O;@67-63-0#~2! Cyclohexane; C6H12 ; @110-82-7#~3! Water; H2O; @7732-18-5#
Variables:T/K5298
ExperimenCompositions along
t/°CT/K
~compiler!
x1
~comp
25 298.2 0.1388
0.1634
0.2412
0.2915
0.3243
0.3520
0.3743
0.3966
0.3961
0.3963
0.3954
0.4110
0.3938
0.3928
0.3982
0.3894
0.3836
0.3712
0.3217
0.2408
Compositions of
x18 x28 x19
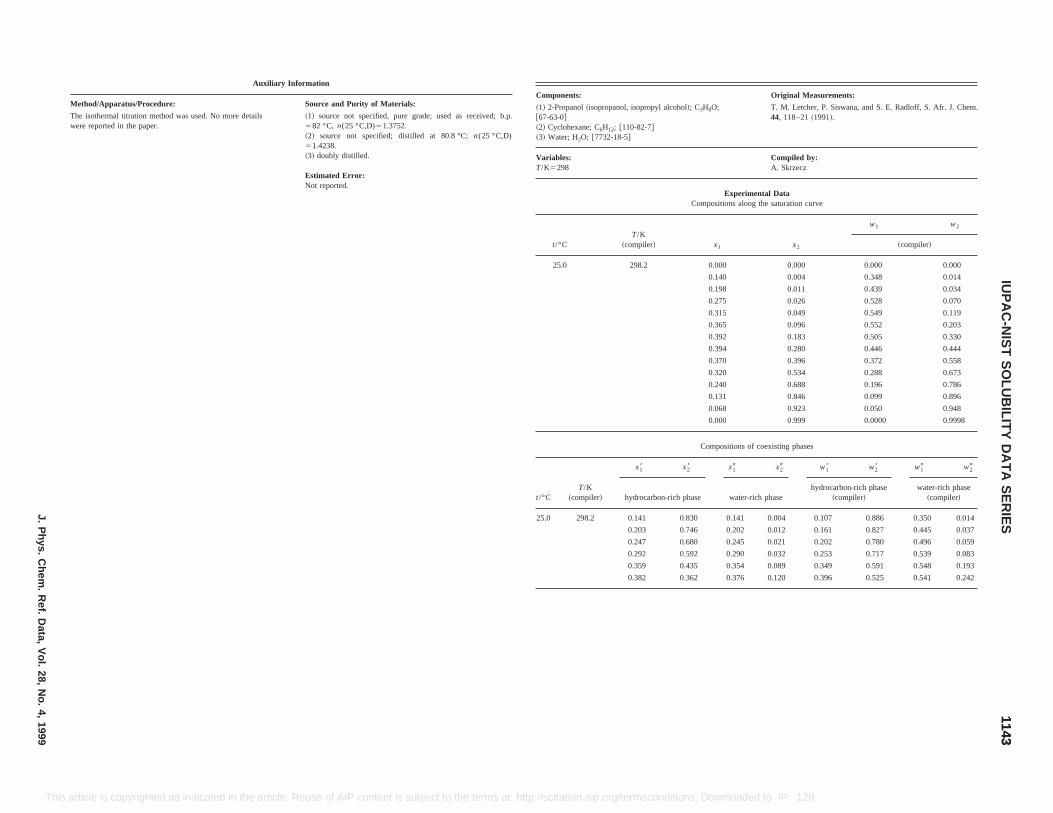
Original Measurements:
opanol, isopropyl alcohol!; C3H8O;
12; @110-82-7#2-18-5#
T. M. Letcher, P. Siswana, and S. E. Radloff, S. Afr. J. Chem.44, 118–21~1991!.
Compiled by:A. Skrzecz
Experimental DataCompositions along the saturation curve
T/K~compiler! x1 x2
w1 w2
~compiler!
298.2 0.000 0.000 0.000 0.000
0.140 0.004 0.348 0.014
0.198 0.011 0.439 0.034
0.275 0.026 0.528 0.070
0.315 0.049 0.549 0.119
0.365 0.096 0.552 0.203
0.392 0.183 0.505 0.330
0.394 0.280 0.446 0.444
0.370 0.396 0.372 0.558
0.320 0.534 0.288 0.673
0.240 0.688 0.196 0.786
0.131 0.846 0.099 0.896
0.068 0.923 0.050 0.948
0.000 0.999 0.0000 0.9998
Compositions of coexisting phases
x18 x28 x19 x29 w18 w28 w19 w29
hydrocarbon-rich phase water-rich phasehydrocarbon-rich phase
~compiler!water-rich phase
~compiler!
0.141 0.830 0.141 0.004 0.107 0.886 0.350 0.014
0.203 0.746 0.202 0.012 0.161 0.827 0.445 0.037
0.247 0.680 0.245 0.021 0.202 0.780 0.496 0.059
0.292 0.592 0.290 0.032 0.253 0.717 0.539 0.083
0.359 0.435 0.354 0.089 0.349 0.591 0.548 0.193
0.382 0.362 0.376 0.120 0.396 0.525 0.541 0.242
11431143
IUP
AC
-NIS
TS
OLU
BILIT
YD
AT
AS
ER
IESJ.P
hys.C
hem.
Ref.
Data,
Vol.
28,N
o.4,
1999
This ated in the article. Reuse of AIP content is subject to the terms at: http://scitation.aip.org/termsconditions. Downloaded to IP: 129.6.105.191 On: Fri, 05 Sep 2014 17:51:55
article is copyrighted as indicAuxiliary Information
Method/Apparatus/Procedure: Source and Purity of Materials:
The isothermal titration method was used. No more detailswere reported in the paper.
~1! source not specified, pure grade; used as received; b.p.582 °C, n(25 °C,D)51.3752.~2! source not specified; distilled at 80.8 °C;n(25 °C,D)51.4238.~3! doubly distilled.
Estimated Error:Not reported.
Components:
~1! 2-Propanol~isopr@67-63-0#~2! Cyclohexane; C6H~3! Water; H2O; @773
Variables:T/K5298
t/°C
25.0
t/°CT/K
~compiler!
25.0 298.2
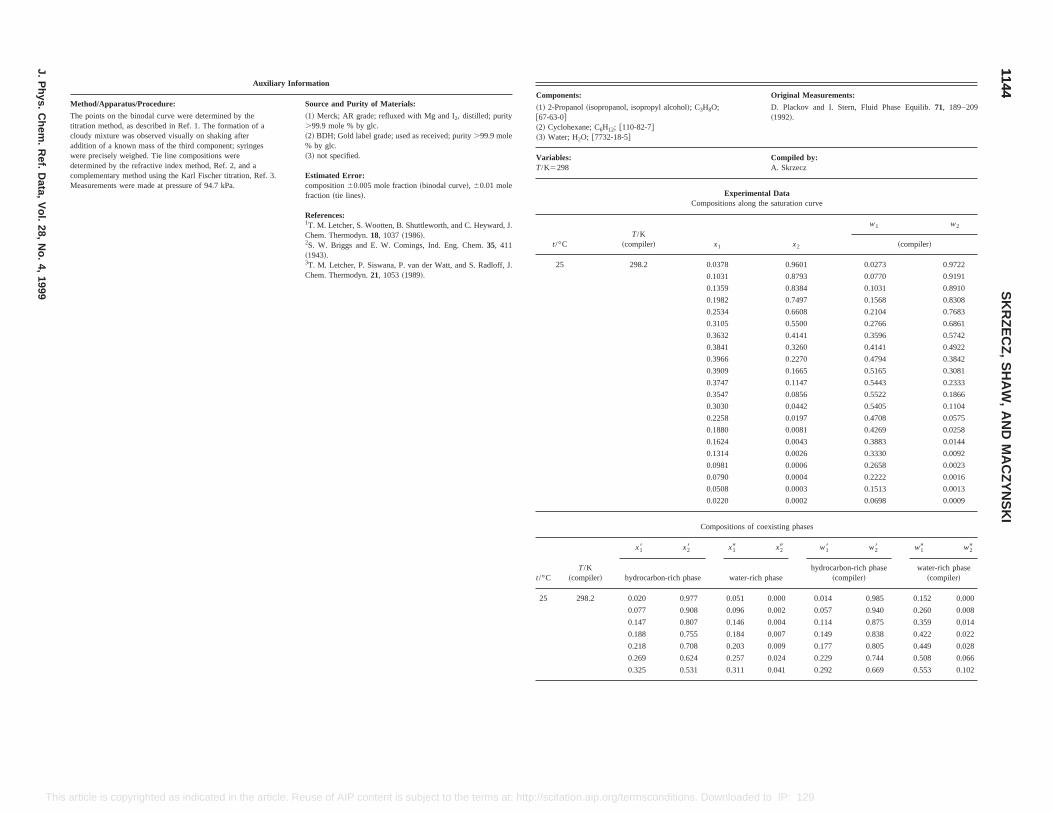
Original Measurements:
lC3H8O; D. Plackov and I. Stern, Fluid Phase Equilib.71, 189–209~1992!.
Compiled by:A. Skrzecz
Experimental Dataompositions along the saturation curve
x1 x2
w1 w2
~compiler!
0.0378 0.9601 0.0273 0.9722
0.1031 0.8793 0.0770 0.9191
0.1359 0.8384 0.1031 0.8910
0.1982 0.7497 0.1568 0.8308
0.2534 0.6608 0.2104 0.7683
0.3105 0.5500 0.2766 0.6861
0.3632 0.4141 0.3596 0.5742
0.3841 0.3260 0.4141 0.4922
0.3966 0.2270 0.4794 0.3842
0.3909 0.1665 0.5165 0.3081
0.3747 0.1147 0.5443 0.2333
0.3547 0.0856 0.5522 0.1866
0.3030 0.0442 0.5405 0.1104
0.2258 0.0197 0.4708 0.0575
0.1880 0.0081 0.4269 0.0258
0.1624 0.0043 0.3883 0.0144
0.1314 0.0026 0.3330 0.0092
0.0981 0.0006 0.2658 0.0023
0.0790 0.0004 0.2222 0.0016
0.0508 0.0003 0.1513 0.0013
0.0220 0.0002 0.0698 0.0009
Compositions of coexisting phases
t/°CT/K
~compiler!
x18 x28 x19 x29 w18 w28 w19 w29
hydrocarbon-rich phase water-rich phasehydrocarbon-rich phase
~compiler!water-rich phase
~compiler!
25 298.2 0.020 0.977 0.051 0.000 0.014 0.985 0.152 0.000
0.077 0.908 0.096 0.002 0.057 0.940 0.260 0.008
0.147 0.807 0.146 0.004 0.114 0.875 0.359 0.014
0.188 0.755 0.184 0.007 0.149 0.838 0.422 0.022
0.218 0.708 0.203 0.009 0.177 0.805 0.449 0.028
0.269 0.624 0.257 0.024 0.229 0.744 0.508 0.066
0.325 0.531 0.311 0.041 0.292 0.669 0.553 0.102
11441144
SK
RZ
EC
Z,
SH
AW
,A
ND
MA
CZ
YN
SK
I
J.P
hys.C
hem.
Ref.
Data,
Vol.
28,N
o.4,
1999
This Reuse of AIP content is subject to the terms at: http://scitation.aip.org/termsconditions. Downloaded to IP: 129.6.105.191 On: Fri, 05 Sep 2014 17:51:55
article is copyrighted as indicated in the article.Auxiliary Information
Method/Apparatus/Procedure: Source and Purity of Materials:
The points on the binodal curve were determined by thetitration method, as described in Ref. 1. The formation of acloudy mixture was observed visually on shaking afteraddition of a known mass of the third component; syringeswere precisely weighed. Tie line compositions weredetermined by the refractive index method, Ref. 2, and acomplementary method using the Karl Fischer titration, Ref. 3.Measurements were made at pressure of 94.7 kPa.
~1! Merck; AR grade; refluxed with Mg and I2, distilled; purity.99.9 mole % by glc.~2! BDH; Gold label grade; used as received; purity.99.9 mole% by glc.~3! not specified.
Estimated Error:composition60.005 mole fraction~binodal curve!, 60.01 molefraction ~tie lines!.
References:1T. M. Letcher, S. Wootten, B. Shuttleworth, and C. Heyward, J.Chem. Thermodyn.18, 1037~1986!.2S. W. Briggs and E. W. Comings, Ind. Eng. Chem.35, 411~1943!.3T. M. Letcher, P. Siswana, P. van der Watt, and S. Radloff, J.Chem. Thermodyn.21, 1053~1989!.
Components:
~1! 2-Propanol~isopropanol, isopropyl alcoho!;@67-63-0#~2! Cyclohexane; C6H12; @110-82-7#~3! Water; H2O; @7732-18-5#
Variables:T/K5298
C
t/°CT/K
~compiler!
25 298.2
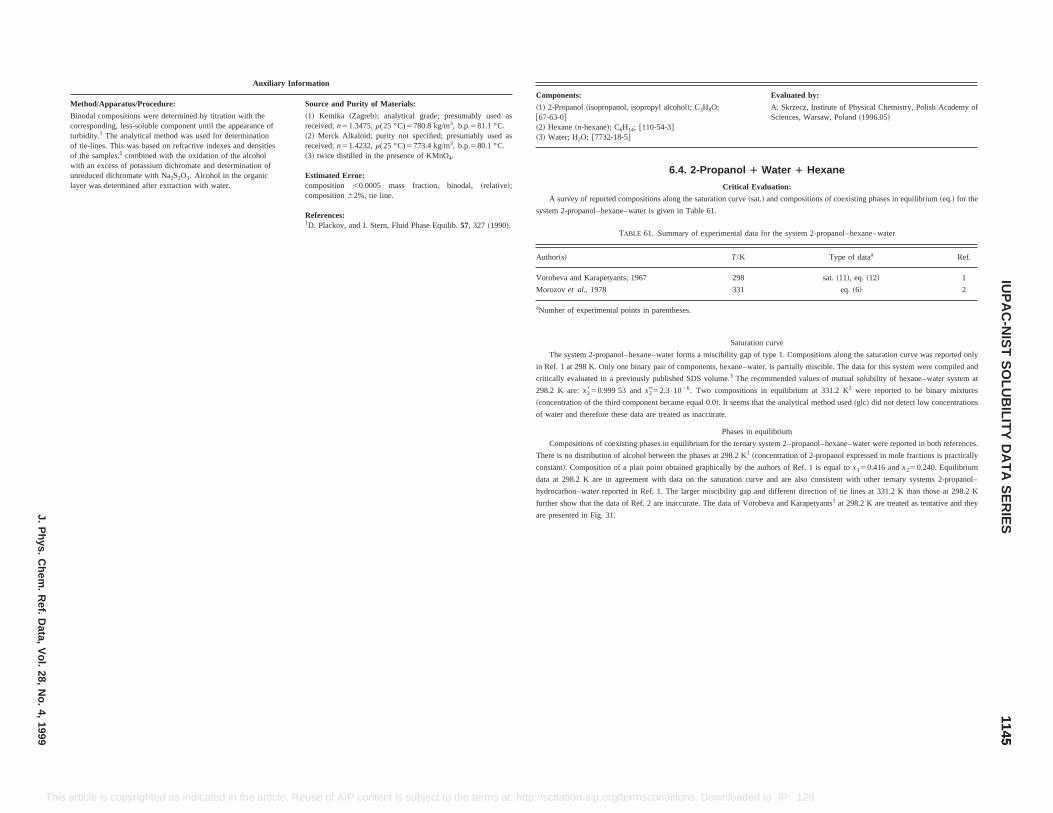
omponents: Evaluated by:
1! 2-Propanol~isopropanol, isopropyl alcohol!; C3H8O;67-63-0#2! Hexane~n-hexane!; C6H14; @110-54-3#3! Water; H2O; @7732-18-5#
A. Skrzecz, Institute of Physical Chemistry, Polish Academy ofSciences, Warsaw, Poland~1996.05!
6.4. 2-Propanol 1 Water 1 Hexane
Critical Evaluation:
A survey of reported compositions along the saturation curve~sat.! and compositions of coexisting phases in equilibrium~eq.! for the
ystem 2-propanol–hexane–water is given in Table 61.
TABLE 61. Summary of experimental data for the system 2-propanol–hexane–water
uthor~s! T/K Type of dataa Ref.
orobeva and Karapetyants, 1967 298 sat.~11!, eq. ~12! 1
orozov et al., 1978 331 eq.~6! 2
Number of experimental points in parentheses.
Saturation curve
The system 2-propanol–hexane–water forms a miscibility gap of type 1. Compositions along the saturation curve was reported only
n Ref. 1 at 298 K. Only one binary pair of components, hexane–water, is partially miscible. The data for this system were compiled and
ritically evaluated in a previously published SDS volume.3 The recommended values of mutual solubility of hexane–water system at
98.2 K are:x2850.999 53 andx2952.3•1026. Two compositions in equilibrium at 331.2 K2 were reported to be binary mixtures
concentration of the third component became equal 0.0!. It seems that the analytical method used~glc! did not detect low concentrations
f water and therefore these data are treated as inaccurate.
Phases in equilibrium
Compositions of coexisting phases in equilibrium for the ternary system 2–propanol–hexane–water were reported in both references.
here is no distribution of alcohol between the phases at 298.2 K1 ~concentration of 2-propanol expressed in mole fractions is practically
onstant!. Composition of a plait point obtained graphically by the authors of Ref. 1 is equal tox150.416 andx250.240. Equilibrium
ata at 298.2 K are in agreement with data on the saturation curve and are also consistent with other ternary systems 2-propanol–
ydrocarbon–water reported in Ref. 1. The larger miscibility gap and different direction of tie lines at 331.2 K than those at 298.2 K
urther show that the data of Ref. 2 are inaccurate. The data of Vorobeva and Karapetyants1 at 298.2 K are treated as tentative and they
re presented in Fig. 31.
11451145
IUP
AC
-NIS
TS
OLU
BILIT
YD
AT
AS
ER
IESJ.P
hys.C
hem.
Ref.
Data,
Vol.
28,N
o.4,
1999
This e article. Reuse of AIP content is subject to the terms at: http://scitation.aip.org/termsconditions. Downloaded to IP: 129.6.105.191 On: Fri, 05 Sep 2014 17:51:55
article is copyrighted as indicated in thAuxiliary Information
Method/Apparatus/Procedure: Source and Purity of Materials:
Binodal compositions were determined by titration with thecorresponding, less-soluble component until the appearance ofturbidity.1 The analytical method was used for determinationof tie-lines. This was based on refractive indexes and densitiesof the samples,1 combined with the oxidation of the alcoholwith an excess of potassium dichromate and determination ofunreduced dichromate with Na2S2O3. Alcohol in the organiclayer was determined after extraction with water.
~1! Kemika ~Zagreb!; analytical grade; presumably used asreceived;n51.3475,r(25 °C)5780.8 kg/m3, b.p.581.1 °C.~2! Merck Alkaloid; purity not specified; presumably used asreceived;n51.4232,r(25 °C)5773.4 kg/m3, b.p.580.1 °C.~3! twice distilled in the presence of KMnO4.
Estimated Error:composition ,0.0005 mass fraction, binodal,~relative!;composition62%, tie line.
References:1D. Plackov, and I. Stern, Fluid Phase Equilib.57, 327 ~1990!.
C
~@~~
s
A
V
M
a
i
c
2
~
o
T
c
d
h
f
a
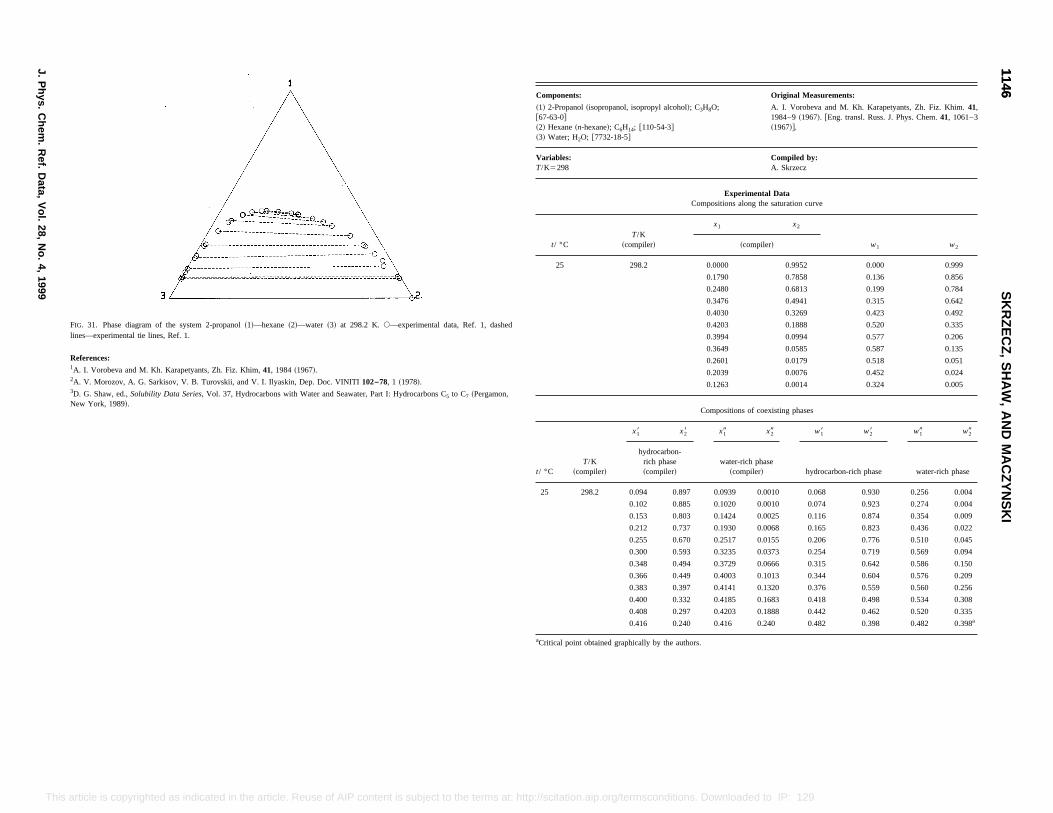
Original Measurements:
yl alcohol!; C3H8O;
4-3#
A. I. Vorobeva and M. Kh. Karapetyants, Zh. Fiz. Khim.41,1984–9~1967!. @Eng. transl. Russ. J. Phys. Chem.41, 1061–3~1967!#.
Compiled by:A. Skrzecz
Experimental DataCompositions along the saturation curve
x1 x2
w1 w2~compiler!
0.0000 0.9952 0.000 0.999
0.1790 0.7858 0.136 0.856
0.2480 0.6813 0.199 0.784
0.3476 0.4941 0.315 0.642
0.4030 0.3269 0.423 0.492
0.4203 0.1888 0.520 0.335
0.3994 0.0994 0.577 0.206
0.3649 0.0585 0.587 0.135
0.2601 0.0179 0.518 0.051
0.2039 0.0076 0.452 0.024
0.1263 0.0014 0.324 0.005
Compositions of coexisting phases
x28 x19 x29 w18 w28 w19 w29
arbon-hase
piler!water-rich phase
~compiler! hydrocarbon-rich phase water-rich phase
0.897 0.0939 0.0010 0.068 0.930 0.256 0.004
0.885 0.1020 0.0010 0.074 0.923 0.274 0.004
0.803 0.1424 0.0025 0.116 0.874 0.354 0.009
0.212 0.737 0.1930 0.0068 0.165 0.823 0.436 0.022
0.255 0.670 0.2517 0.0155 0.206 0.776 0.510 0.045
0.300 0.593 0.3235 0.0373 0.254 0.719 0.569 0.094
0.348 0.494 0.3729 0.0666 0.315 0.642 0.586 0.150
0.366 0.449 0.4003 0.1013 0.344 0.604 0.576 0.209
0.383 0.397 0.4141 0.1320 0.376 0.559 0.560 0.256
0.400 0.332 0.4185 0.1683 0.418 0.498 0.534 0.308
0.408 0.297 0.4203 0.1888 0.442 0.462 0.520 0.335
0.416 0.240 0.416 0.240 0.482 0.398 0.482 0.398a
aCritical point obtained graphically by the authors.
11461146
SK
RZ
EC
Z,
SH
AW
,A
ND
MA
CZ
YN
SK
I
J.P
hys.C
hem.
Ref.
Data,
Vol.
28,N
o.4,
1999
This ect to the terms at: http://scitation.aip.org/termsconditions. Downloaded to IP: 129.6.105.191 On: Fri, 05 Sep 2014 17:51:55
article is copyrighted as indicated in the article. Reuse of AIP content is subjFIG. 31. Phase diagram of the system 2-propanol~1!—hexane~2!—water ~3! at 298.2 K. s—experimental data, Ref. 1, dashedlines—experimental tie lines, Ref. 1.
References:1A. I. Vorobeva and M. Kh. Karapetyants, Zh. Fiz. Khim,41, 1984~1967!.2A. V. Morozov, A. G. Sarkisov, V. B. Turovskii, and V. I. Ilyaskin, Dep. Doc. VINITI102–78, 1 ~1978!.3D. G. Shaw, ed.,Solubility Data Series, Vol. 37, Hydrocarbons with Water and Seawater, Part I: Hydrocarbons C5 to C7 ~Pergamon,New York, 1989!.
Components:
~1! 2-Propanol~isopropanol, isoprop@67-63-0#~2! Hexane~n-hexane!; C6H14; @110-5~3! Water; H2O; @7732-18-5#
Variables:T/K5298
t/ °CT/K
~compiler!
25 298.2
t/ °CT/K
~compiler!
x18
hydrocrich p~com
25 298.2 0.094
0.102
0.153

in Ref. 1.ed; waterthod.
Khim.40,
Components: Original Measurements:
~1! 2-Propanol~isopropanol, isopropyl alcohol!; C3H8O;@67-63-0#~2! Hexane~n-hexane!; C6H14; @110-54-3#~3! Water; H2O; @7732-18-5#
A. V. Morozov, A. G. Sarkisov, V. B. Turovskii, and V. I.Ilyaskin, Dep. Doc. VINITI102–78, 1–9 ~1978!.
Variables:T/K5331
Compiled by:A. Skrzecz
Experimental DataCompositions of coexisting phases
t/ °CT/K
~compiler!
x18 x28 x19 x29 w18 w28 w19 w29
hydrocarbon-rich phase~compiler!
water-rich phase~compiler! hydrocarbon-rich phase water-rich phase
58 331.2 0.123 0.877 0.0425 0.0000 0.089 0.911 0.129 0.000
0.171 0.829 0.1046 0.0004 0.126 0.874 0.280 0.0015
0.289 0.601 0.1635 0.0035 0.244 0.728 0.391 0.012
0.332 0.487 0.2880 0.0255 0.306 0.644 0.543 0.069
0.399 0.341 0.3744 0.1113 0.413 0.506 0.544 0.232
0.396 0.178 0.3957 0.1782 0.508 0.328 0.508 0.328
Auxiliary Information
Method/Apparatus/Procedure: Source and Purity of Materials:
The analytical method was used. The compositions of bothphases were determined by glc.
~1! source not specified; dried, distilled,n(20 °C,D)51.3771,d(25 °C,4 °C)50.7829.~2! source not specified; twice distilled,n(20 °C,D)51.3748,d(25 °C,4 °C)50.6544.~3! doubly distilled.
Estimated Error:comp.,5% relative, max. for water.
11471147
IUP
AC
-NIS
TS
OLU
BILIT
YD
AT
AS
ER
IESJ.P
hys.C
hem.
Ref.
Data,
Vol.
28,N
o.4,
1999
This a e article. Reuse of AIP content is subject to the terms at: http://scitation.aip.org/termsconditions. Downloaded to IP: 129.6.105.191 On: Fri, 05 Sep 2014 17:51:55
rticle is copyrighted as indicated in thAuxiliary Information
Method/Apparatus/Procedure: Source and Purity of Materials:
The experimental methods were described in Ref. 1. Waterimpurities in alcohol were taken into account in themeasurements. Critical point of liquid–liquid equilibrium wasobtained graphically by the method reported in Ref. 2.
~1! source and method of preparation were reported~2! source not specified; pure grade; distillconcentration was analyzed by the Karl Fischer me~3! doubly distilled.
Estimated Error:Not specified.
References:1A. I. Vorobeva and M. Kh. Karapetyants, Zh. Fiz.3018 ~1966!.2E. F. Zilberman, Zh. Fiz. Khim.26, 1458~1952!.
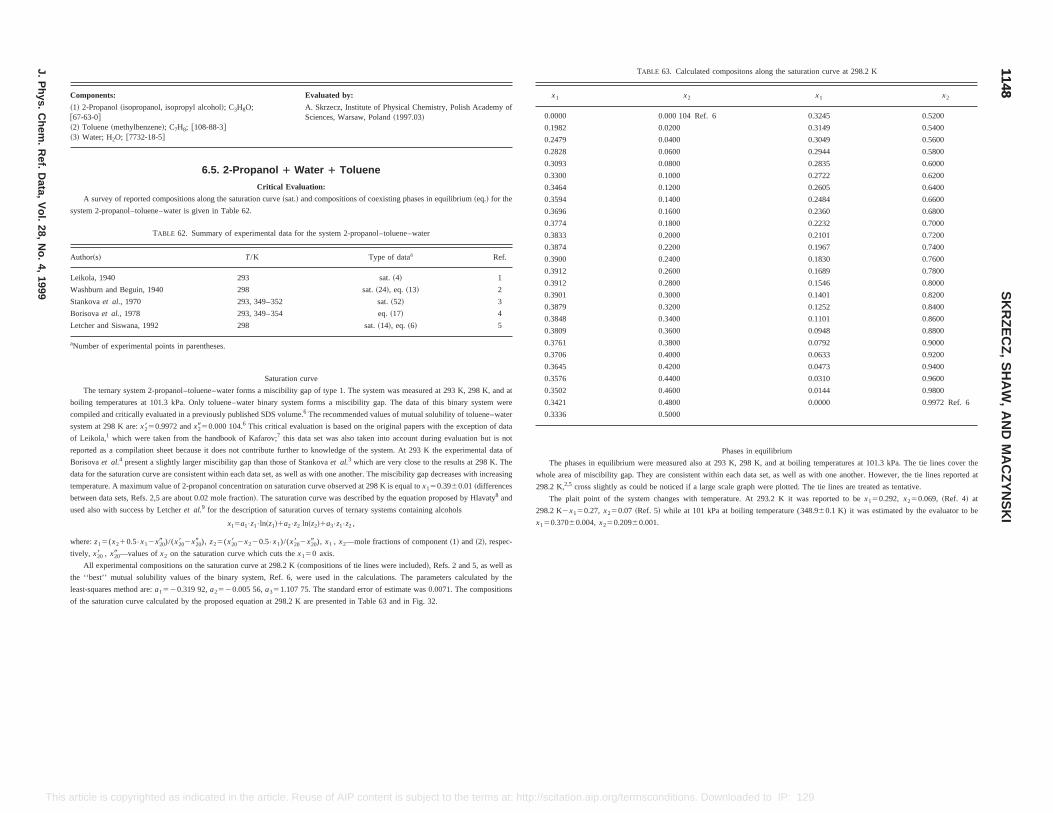
t
f
ng
x 5a •z •ln~z !1a •z ln~z !1a •z •z ,
TABLE 63. Calculated compositons along the saturation curve at 298.2 K
x1 x2 x1 x2
.0000 0.000 104 Ref. 6 0.3245 0.5200
.1982 0.0200 0.3149 0.5400
.2479 0.0400 0.3049 0.5600
.2828 0.0600 0.2944 0.5800
.3093 0.0800 0.2835 0.6000
.3300 0.1000 0.2722 0.6200
.3464 0.1200 0.2605 0.6400
.3594 0.1400 0.2484 0.6600
.3696 0.1600 0.2360 0.6800
.3774 0.1800 0.2232 0.7000
.3833 0.2000 0.2101 0.7200
.3874 0.2200 0.1967 0.7400
.3900 0.2400 0.1830 0.7600
.3912 0.2600 0.1689 0.7800
.3912 0.2800 0.1546 0.8000
.3901 0.3000 0.1401 0.8200
.3879 0.3200 0.1252 0.8400
.3848 0.3400 0.1101 0.8600
.3809 0.3600 0.0948 0.8800
.3761 0.3800 0.0792 0.9000
.3706 0.4000 0.0633 0.9200
.3645 0.4200 0.0473 0.9400
.3576 0.4400 0.0310 0.9600
.3502 0.4600 0.0144 0.9800
.3421 0.4800 0.0000 0.9972 Ref. 6
.3336 0.5000
Phases in equilibrium
The phases in equilibrium were measured also at 293 K, 298 K, and at boiling temperatures at 101.3 kPa. The tie lines cover the
ole area of miscibility gap. They are consistent within each data set, as well as with one another. However, the tie lines reported at
.2 K,2,5 cross slightly as could be noticed if a large scale graph were plotted. The tie lines are treated as tentative.
The plait point of the system changes with temperature. At 293.2 K it was reported to bex150.292, x250.069, ~Ref. 4! at
.2 K2x150.27, x250.07 ~Ref. 5! while at 101 kPa at boiling temperature (348.960.1 K) it was estimated by the evaluator to be
0.37060.004,x 50.20960.001.
11481148
SK
RZ
EC
Z,
SH
AW
,A
ND
MA
CZ
YN
SK
I
J.P
hys.C
hem.
Ref.
Data,
Vol.
28,N
o.4,
1999
This /termsconditions. Downloaded to IP: 129.6.105.191 On: Fri, 05 Sep 2014 17:51:55
1 1 1 1 2 2 2 3 1 2
where:z15(x210.5•x12x209 )/(x208 2x209 ), z25(x208 2x220.5•x1)/(x208 2x209 ), x1 , x2—mole fractions of component~1! and~2!, respec-
tively, x208 , x209 —values ofx2 on the saturation curve which cuts thex150 axis.
All experimental compositions on the saturation curve at 298.2 K~compositions of tie lines were included!, Refs. 2 and 5, as well as
the ‘‘best’’ mutual solubility values of the binary system, Ref. 6, were used in the calculations. The parameters calculated by the
least-squares method are:a1520.319 92,a2520.005 56,a351.107 75. The standard error of estimate was 0.0071. The compositions
of the saturation curve calculated by the proposed equation at 298.2 K are presented in Table 63 and in Fig. 32.
1 2
article is copyrighted as indicated in the article. Reuse of AIP content is subject to the terms at: http://scitation.aip.org
Components: Evaluated by:
~1! 2-Propanol~isopropanol, isopropyl alcohol!; C3H8O;@67-63-0#~2! Toluene~methylbenzene!; C7H8; @108-88-3#~3! Water; H2O; @7732-18-5#
A. Skrzecz, Institute of Physical Chemistry, Polish Academy ofSciences, Warsaw, Poland~1997.03!
6.5. 2-Propanol 1 Water 1 Toluene
Critical Evaluation:
A survey of reported compositions along the saturation curve~sat.! and compositions of coexisting phases in equilibrium~eq.! for the
system 2-propanol–toluene–water is given in Table 62.
TABLE 62. Summary of experimental data for the system 2-propanol–toluene–water
Author~s! T/K Type of dataa Ref.
Leikola, 1940 293 sat.~4! 1
Washburn and Beguin, 1940 298 sat.~24!, eq. ~13! 2
Stankovaet al., 1970 293, 349–352 sat.~52! 3
Borisovaet al., 1978 293, 349–354 eq.~17! 4
Letcher and Siswana, 1992 298 sat.~14!, eq. ~6! 5
aNumber of experimental points in parentheses.
Saturation curve
The ternary system 2-propanol–toluene–water forms a miscibility gap of type 1. The system was measured at 293 K, 298 K, and a
boiling temperatures at 101.3 kPa. Only toluene–water binary system forms a miscibility gap. The data of this binary system were
compiled and critically evaluated in a previously published SDS volume.6 The recommended values of mutual solubility of toluene–water
system at 298 K are:x2850.9972 andx2950.000 104.6 This critical evaluation is based on the original papers with the exception of data
of Leikola,1 which were taken from the handbook of Kafarov;7 this data set was also taken into account during evaluation but is not
reported as a compilation sheet because it does not contribute further to knowledge of the system. At 293 K the experimental data o
Borisovaet al.4 present a slightly larger miscibility gap than those of Stankovaet al.3 which are very close to the results at 298 K. The
data for the saturation curve are consistent within each data set, as well as with one another. The miscibility gap decreases with increasi
temperature. A maximum value of 2-propanol concentration on saturation curve observed at 298 K is equal tox150.3960.01~differences
between data sets, Refs. 2,5 are about 0.02 mole fraction!. The saturation curve was described by the equation proposed by Hlavaty8 and
used also with success by Letcheret al.9 for the description of saturation curves of ternary systems containing alcohols
0
0
0
0
0
0
0
0
0
0
0
0
0
0
0
0
0
0
0
0
0
0
0
0
0
0
wh
298
298
x 5
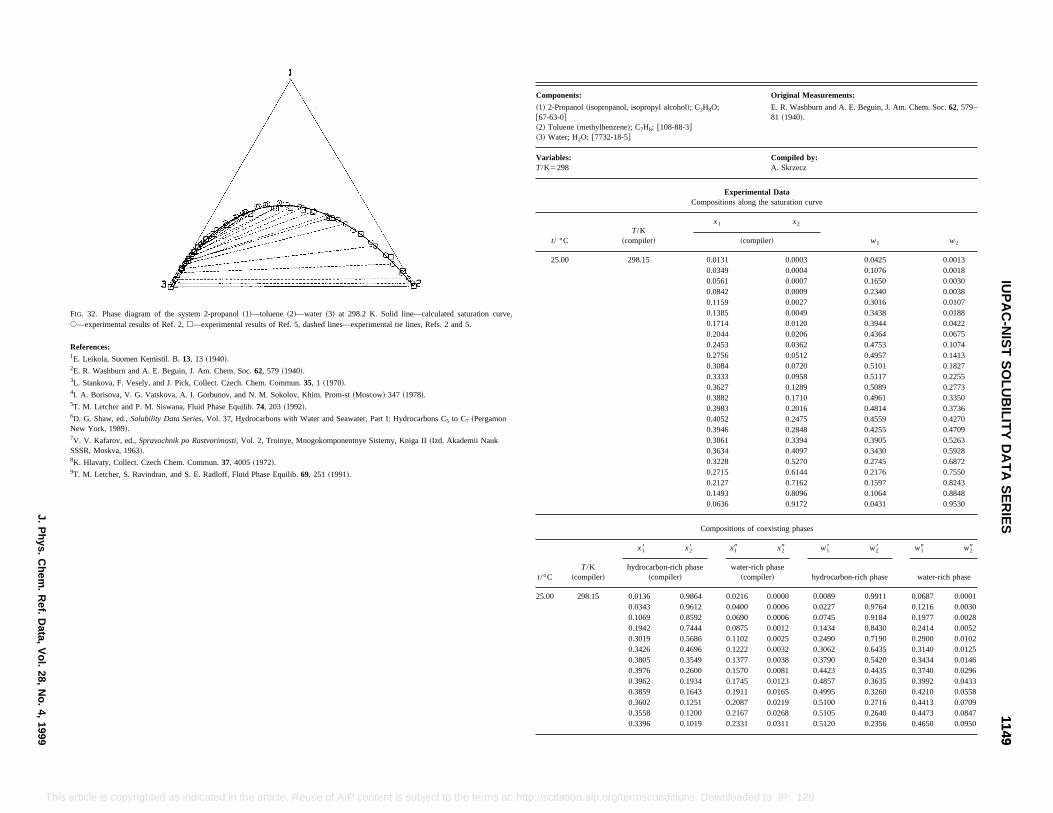
Original Measurements:
E. R. Washburn and A. E. Beguin, J. Am. Chem. Soc.62, 579–81 ~1940!.
Compiled by:A. Skrzecz
ental Dataong the saturation curve
x2
w1 w2mpiler!
0.0003 0.0425 0.00130.0004 0.1076 0.00180.0007 0.1650 0.00300.0009 0.2340 0.00380.0027 0.3016 0.01070.0049 0.3438 0.01880.0120 0.3944 0.04220.0206 0.4364 0.06750.0362 0.4753 0.10740.0512 0.4957 0.14130.0720 0.5101 0.18270.0958 0.5117 0.22550.1289 0.5089 0.27730.1710 0.4961 0.33500.2016 0.4814 0.37360.2475 0.4559 0.42700.2848 0.4255 0.47090.3394 0.3905 0.52630.4097 0.3430 0.59280.5270 0.2745 0.68720.6144 0.2176 0.75500.7162 0.1597 0.82430.8096 0.1064 0.88480.9172 0.0431 0.9530
of coexisting phases
t/°CT/K
~compiler!
x18 x28 x19 x29 w18 w28 w19 w29
hydrocarbon-rich phase~compiler!
water-rich phase~compiler! hydrocarbon-rich phase water-rich phase
25.00 298.15 0.0136 0.9864 0.0216 0.0000 0.0089 0.9911 0.0687 0.00010.0343 0.9612 0.0400 0.0006 0.0227 0.9764 0.1216 0.00300.1069 0.8592 0.0690 0.0006 0.0745 0.9184 0.1977 0.00280.1942 0.7444 0.0875 0.0012 0.1434 0.8430 0.2414 0.00520.3019 0.5686 0.1102 0.0025 0.2490 0.7190 0.2900 0.01020.3426 0.4696 0.1222 0.0032 0.3062 0.6435 0.3140 0.01250.3805 0.3549 0.1377 0.0038 0.3790 0.5420 0.3434 0.01460.3976 0.2600 0.1570 0.0081 0.4423 0.4435 0.3740 0.02960.3962 0.1934 0.1745 0.0123 0.4857 0.3635 0.3992 0.04330.3859 0.1643 0.1911 0.0165 0.4995 0.3260 0.4210 0.05580.3602 0.1251 0.2087 0.0219 0.5100 0.2716 0.4413 0.07090.3558 0.1200 0.2167 0.0268 0.5105 0.2640 0.4473 0.08470.3396 0.1019 0.2331 0.0311 0.5120 0.2356 0.4650 0.0950
11491149
IUP
AC
-NIS
TS
OLU
BILIT
YD
AT
AS
ER
IESJ.P
hys.C
hem.
Ref.
Data,
Vol.
28,N
o.4,
1999
This at: http://scitation.aip.org/termsconditions. Downloaded to IP: 129.6.105.191 On: Fri, 05 Sep 2014 17:51:55
article is copyrighted as indicated in the article. Reuse of AIP content is subject to the termsFIG. 32. Phase diagram of the system 2-propanol~1!—toluene ~2!—water ~3! at 298.2 K. Solid line—calculated saturation curve,s—experimental results of Ref. 2,h—experimental results of Ref. 5, dashed lines—experimental tie lines, Refs. 2 and 5.
References:1E. Leikola, Suomen Kemistil. B.13, 13 ~1940!.2E. R. Washburn and A. E. Beguin, J. Am. Chem. Soc.62, 579 ~1940!.3L. Stankova, F. Vesely, and J. Pick, Collect. Czech. Chem. Commun.35, 1 ~1970!.4I. A. Borisova, V. G. Vatskova, A. I. Gorbunov, and N. M. Sokolov, Khim. Prom-st~Moscow! 347 ~1978!.5T. M. Letcher and P. M. Siswana, Fluid Phase Equilib.74, 203 ~1992!.6D. G. Shaw, ed.,Solubility Data Series, Vol. 37, Hydrocarbons with Water and Seawater, Part I: Hydrocarbons C5 to C7 ~PergamonNew York, 1989!.7V. V. Kafarov, ed.,Spravochnik po Rastvorimosti, Vol. 2, Troinye, Mnogokomponentnye Sistemy, Kniga II~Izd. Akademii NaukSSSR, Moskva, 1963!.8K. Hlavaty, Collect. Czech Chem. Commun.37, 4005~1972!.9T. M. Letcher, S. Ravindran, and S. E. Radloff, Fluid Phase Equilib.69, 251 ~1991!.
Components:
~1! 2-Propanol~isopropanol, isopropyl alcohol!; C3H8O;@67-63-0#~2! Toluene~methylbenzene!; C7H8; @108-88-3#~3! Water; H2O; @7732-18-5#
Variables:T/K5298
ExperimCompositions al
t/ °CT/K
~compiler!
x1
~co
25.00 298.15 0.01310.03490.05610.08420.11590.13850.17140.20440.24530.27560.30840.33330.36270.38820.39830.40520.39460.38610.36340.32280.27150.21270.14930.0636
Compositions
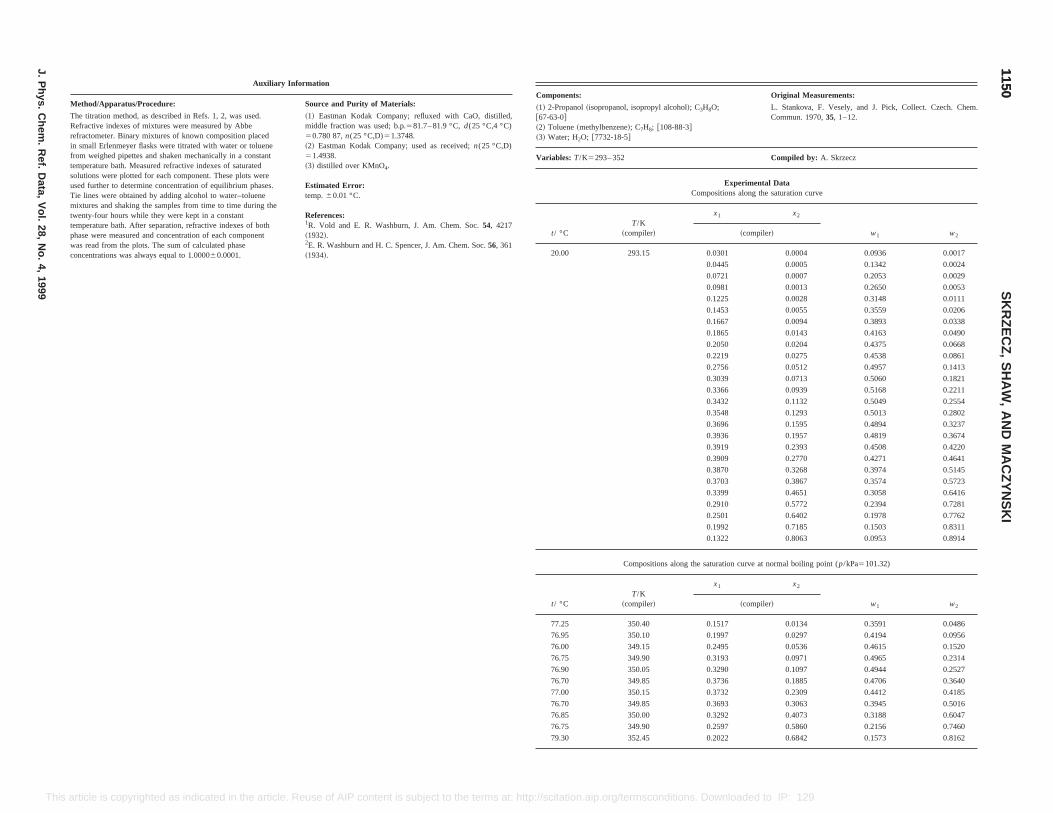
Original Measurements:
L. Stankova, F. Vesely, and J. Pick, Collect. Czech. Chem.Commun. 1970,35, 1–12.
Compiled by: A. Skrzecz
tal Datathe saturation curve
x2
w1 w2iler!
0.0004 0.0936 0.0017
0.0005 0.1342 0.0024
0.0007 0.2053 0.0029
0.0013 0.2650 0.0053
0.0028 0.3148 0.0111
0.0055 0.3559 0.0206
0.0094 0.3893 0.0338
0.0143 0.4163 0.0490
0.0204 0.4375 0.0668
0.0275 0.4538 0.0861
0.0512 0.4957 0.1413
0.0713 0.5060 0.1821
0.0939 0.5168 0.2211
0.1132 0.5049 0.2554
0.1293 0.5013 0.2802
0.1595 0.4894 0.3237
0.1957 0.4819 0.3674
0.2393 0.4508 0.4220
0.2770 0.4271 0.4641
0.3268 0.3974 0.5145
0.3867 0.3574 0.5723
0.4651 0.3058 0.6416
0.5772 0.2394 0.7281
0.6402 0.1978 0.7762
0.1992 0.7185 0.1503 0.8311
0.1322 0.8063 0.0953 0.8914
Compositions along the saturation curve at normal boiling point (p/kPa5101.32)
t/ °CT/K
~compiler!
x1 x2
w1 w2~compiler!
77.25 350.40 0.1517 0.0134 0.3591 0.0486
76.95 350.10 0.1997 0.0297 0.4194 0.0956
76.00 349.15 0.2495 0.0536 0.4615 0.1520
76.75 349.90 0.3193 0.0971 0.4965 0.2314
76.90 350.05 0.3290 0.1097 0.4944 0.2527
76.70 349.85 0.3736 0.1885 0.4706 0.3640
77.00 350.15 0.3732 0.2309 0.4412 0.4185
76.70 349.85 0.3693 0.3063 0.3945 0.5016
76.85 350.00 0.3292 0.4073 0.3188 0.6047
76.75 349.90 0.2597 0.5860 0.2156 0.7460
79.30 352.45 0.2022 0.6842 0.1573 0.8162
11501150
SK
RZ
EC
Z,
SH
AW
,A
ND
MA
CZ
YN
SK
I
J.P
hys.C
hem.
Ref.
Data,
Vol.
28,N
o.4,
1999
This Reuse of AIP content is subject to the terms at: http://scitation.aip.org/termsconditions. Downloaded to IP: 129.6.105.191 On: Fri, 05 Sep 2014 17:51:55
article is copyrighted as indicated in the article.Auxiliary Information
Method/Apparatus/Procedure: Source and Purity of Materials:
The titration method, as described in Refs. 1, 2, was used.Refractive indexes of mixtures were measured by Abberefractometer. Binary mixtures of known composition placedin small Erlenmeyer flasks were titrated with water or toluenefrom weighed pipettes and shaken mechanically in a constanttemperature bath. Measured refractive indexes of saturatedsolutions were plotted for each component. These plots wereused further to determine concentration of equilibrium phases.Tie lines were obtained by adding alcohol to water–toluenemixtures and shaking the samples from time to time during thetwenty-four hours while they were kept in a constanttemperature bath. After separation, refractive indexes of bothphase were measured and concentration of each componentwas read from the plots. The sum of calculated phaseconcentrations was always equal to 1.000060.0001.
~1! Eastman Kodak Company; refluxed with CaO, distilled,middle fraction was used; b.p.581.7– 81.9 °C,d(25 °C,4 °C)50.780 87,n(25 °C,D)51.3748.~2! Eastman Kodak Company; used as received;n(25 °C,D)51.4938.~3! distilled over KMnO4.
Estimated Error:temp.60.01 °C.
References:1R. Vold and E. R. Washburn, J. Am. Chem. Soc.54, 4217~1932!.2E. R. Washburn and H. C. Spencer, J. Am. Chem. Soc.56, 361~1934!.
Components:
~1! 2-Propanol~isopropanol, isopropyl alcohol!; C3H8O;@67-63-0#~2! Toluene~methylbenzene!; C7H8; @108-88-3#~3! Water; H2O; @7732-18-5#
Variables: T/K5293– 352
ExperimenCompositions along
t/ °CT/K
~compiler!
x1
~comp
20.00 293.15 0.0301
0.0445
0.0721
0.0981
0.1225
0.1453
0.1667
0.1865
0.2050
0.2219
0.2756
0.3039
0.3366
0.3432
0.3548
0.3696
0.3936
0.3919
0.3909
0.3870
0.3703
0.3399
0.2910
0.2501
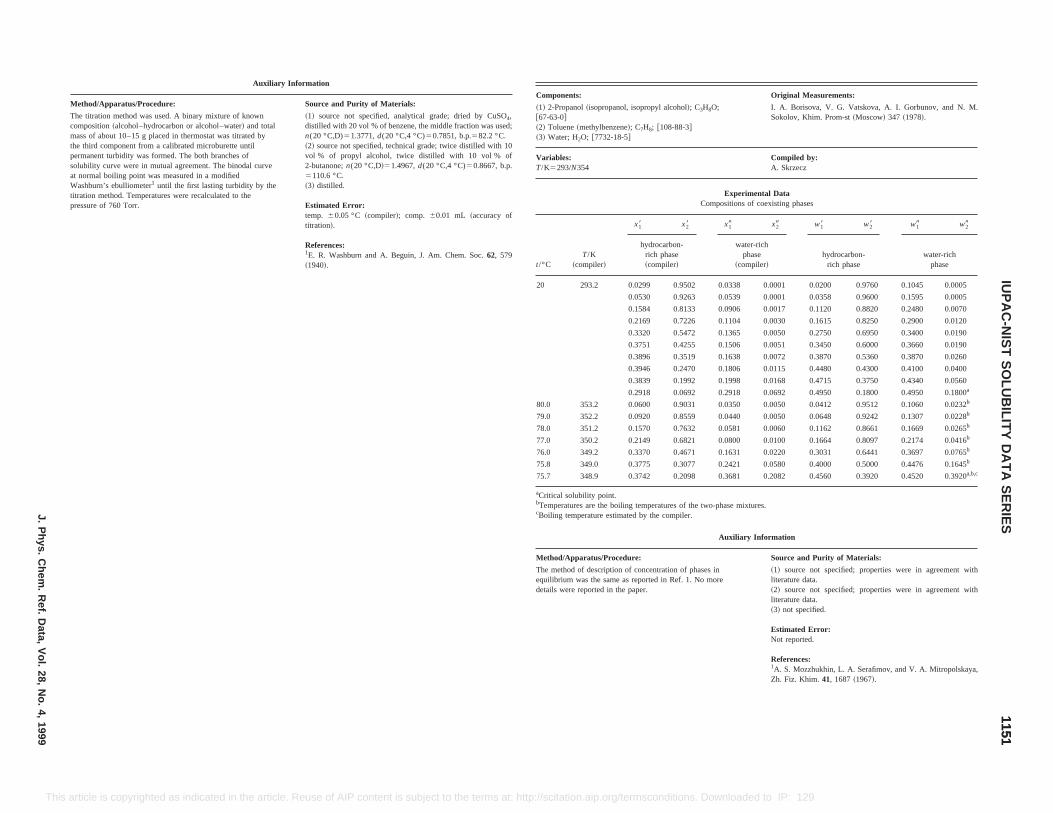
Original Measurements:
3H8O; I. A. Borisova, V. G. Vatskova, A. I. Gorbunov, and N. M.Sokolov, Khim. Prom-st~Moscow! 347 ~1978!.
Compiled by:A. Skrzecz
Experimental DataCompositions of coexisting phases
x19 x29 w18 w28 w19 w29
water-richphase
~compiler!hydrocarbon-
rich phasewater-rich
phase
0.0338 0.0001 0.0200 0.9760 0.1045 0.0005
0.0539 0.0001 0.0358 0.9600 0.1595 0.0005
0.0906 0.0017 0.1120 0.8820 0.2480 0.0070
0.1104 0.0030 0.1615 0.8250 0.2900 0.0120
0.1365 0.0050 0.2750 0.6950 0.3400 0.0190
0.1506 0.0051 0.3450 0.6000 0.3660 0.0190
0.1638 0.0072 0.3870 0.5360 0.3870 0.0260
0.1806 0.0115 0.4480 0.4300 0.4100 0.0400
0.1998 0.0168 0.4715 0.3750 0.4340 0.0560
0.2918 0.0692 0.4950 0.1800 0.4950 0.1800a
0.0350 0.0050 0.0412 0.9512 0.1060 0.0232b
0.0440 0.0050 0.0648 0.9242 0.1307 0.0228b
0.0581 0.0060 0.1162 0.8661 0.1669 0.0265b
0.0800 0.0100 0.1664 0.8097 0.2174 0.0416b
0.1631 0.0220 0.3031 0.6441 0.3697 0.0765b
0.2421 0.0580 0.4000 0.5000 0.4476 0.1645b
0.3681 0.2082 0.4560 0.3920 0.4520 0.3920a,b,c
the two-phase mixtures.r.
Auxiliary Information
Method/Apparatus/Procedure: Source and Purity of Materials:
The method of description of concentration of phases inequilibrium was the same as reported in Ref. 1. No moredetails were reported in the paper.
~1! source not specified; properties were in agreement withliterature data.~2! source not specified; properties were in agreement withliterature data.~3! not specified.
Estimated Error:Not reported.
References:1A. S. Mozzhukhin, L. A. Serafimov, and V. A. Mitropolskaya,Zh. Fiz. Khim.41, 1687~1967!.
11511151
IUP
AC
-NIS
TS
OLU
BILIT
YD
AT
AS
ER
IESJ.P
hys.C
hem.
Ref.
Data,
Vol.
28,N
o.4,
1999
This . Reuse of AIP content is subject to the terms at: http://scitation.aip.org/termsconditions. Downloaded to IP: 129.6.105.191 On: Fri, 05 Sep 2014 17:51:55
article is copyrighted as indicated in the articleAuxiliary Information
Method/Apparatus/Procedure: Source and Purity of Materials:
The titration method was used. A binary mixture of knowncomposition~alcohol–hydrocarbon or alcohol–water! and totalmass of about 10–15 g placed in thermostat was titrated bythe third component from a calibrated microburette untilpermanent turbidity was formed. The both branches ofsolubility curve were in mutual agreement. The binodal curveat normal boiling point was measured in a modifiedWashburn’s ebulliometer1 until the first lasting turbidity by thetitration method. Temperatures were recalculated to thepressure of 760 Torr.
~1! source not specified, analytical grade; dried by CuSO4,distilled with 20 vol % of benzene, the middle fraction was used;n(20 °C,D)51.3771,d(20 °C,4 °C)50.7851, b.p.582.2 °C.~2! source not specified, technical grade; twice distilled with 10vol % of propyl alcohol, twice distilled with 10 vol % of2-butanone;n(20 °C,D!51.4967,d(20 °C,4 °C)50.8667, b.p.5110.6 °C.~3! distilled.
Estimated Error:temp. 60.05 °C ~compiler!; comp. 60.01 mL ~accuracy oftitration!.
References:1E. R. Washburn and A. Beguin, J. Am. Chem. Soc.62, 579~1940!.
Components:
~1! 2-Propanol~isopropanol, isopropyl alcohol!; C@67-63-0#~2! Toluene~methylbenzene!; C7H8; @108-88-3#~3! Water; H2O; @7732-18-5#
Variables:T/K5293/N354
t/°CT/K
~compiler!
x18 x28
hydrocarbon-rich phase~compiler!
20 293.2 0.0299 0.9502
0.0530 0.9263
0.1584 0.8133
0.2169 0.7226
0.3320 0.5472
0.3751 0.4255
0.3896 0.3519
0.3946 0.2470
0.3839 0.1992
0.2918 0.0692
80.0 353.2 0.0600 0.9031
79.0 352.2 0.0920 0.8559
78.0 351.2 0.1570 0.7632
77.0 350.2 0.2149 0.6821
76.0 349.2 0.3370 0.4671
75.8 349.0 0.3775 0.3077
75.7 348.9 0.3742 0.2098
aCritical solubility point.bTemperatures are the boiling temperatures ofcBoiling temperature estimated by the compile

Original Measurements:
T. M. Letcher and P. M. Siswana, Fluid Phase Equilib.74, 203–17 ~1992!.
Compiled by:A. Skrzecz
l Datahe saturation curve
x2
w1 w2
~compiler!
0.000 0.000 0.000
0.001 0.249 0.004
0.005 0.343 0.019
0.019 0.421 0.064
0.049 0.473 0.139
0.083 0.488 0.208
0.154 0.479 0.320
0.247 0.435 0.436
0.362 0.369 0.552
0.500 0.287 0.668
0.656 0.196 0.782
0.834 0.099 0.896
0.918 0.049 0.949
0.999 0.000 0.9998
existing phases
x29 w18 w28 w19 w29
hhydrocarbon-
rich phase~compiler!
water-richphase
~compiler!
Auxiliary Information
Method/Apparatus/Procedure: Source and Purity of Materials:
The points on the binodal curve were determined by theformation of a cloudy mixture on shaking after the addition ofa known mass of one component to a mixture of knownmasses of the other two components. Precision weighingsyringes were used as described in Ref. 1. Tie linecompositions were determined by the refractive index methodreported in Ref. 2 and a complementary method using the KarlFischer titrations as reported in Ref. 3.
~1! Merck, AR grade; distilled, dried by refluxing with Mg andI2 ; purity better than 99.6 mole % by glc;d50.781 51, n51.3752.~2! BDH; used as received; purity better than 99.6 mole % byglc.~3! not specified.
Estimated Error:estimated comp. 0.005 mole fraction on the binodal curve and0.01 mole fraction for tie lines~estimated by the authors!.
References:1T. M. Letcher, S. Wootten, B. Shuttleworth, and C. Heward, J.Chem. Thermodyn.18, 1037~1986!.2S. W. Briggs and E. W. Comings, Ind. Eng. Chem.35, 411~1943!.3T. M. Letcher, P. M. Siswana, P. Van der Watt, and S. Radloff,J. Chem. Thermodyn.21, 1053~1989!.
11521152
SK
RZ
EC
Z,
SH
AW
,A
ND
MA
CZ
YN
SK
I
J.P
hys.C
hem.
Ref.
Data,
Vol.
28,N
o.4,
1999
This ermsconditions. Downloaded to IP: 129.6.105.191 On: Fri, 05 Sep 2014 17:51:55
25.0 298.2 0.000 0.999 0.000 0.000 0.000 0.9998 0.000 0.000
0.330 0.488 0.125 0.008 0.291 0.661 0.315 0.031
0.360 0.405 0.150 0.010 0.342 0.591 0.360 0.037
0.380 0.305 0.170 0.012 0.403 0.496 0.392 0.042
0.377 0.238 0.192 0.016 0.440 0.426 0.423 0.054
0.351 0.154 0.230 0.030 0.477 0.321 0.462 0.092
article is copyrighted as indicated in the article. Reuse of AIP content is subject to the terms at: http://scitation.aip.org/t
Components:
~1! 2-Propanol~isopropanol, isopropyl alcohol!; C3H8O;@67-63-0#~2! Toluene~methylbenzene!; C7H8; @108-88-3#~3! Water; H2O; @7732-18-5#
Variables:T/K5298
ExperimentaCompositions along t
t/°CT/K
~compiler! x1
25.0 298.2 0.000
0.091
0.138
0.193
0.255
0.298
0.353
0.378
0.371
0.329
0.252
0.142
0.073
0.000
Compositions of co
t/°CT/K
~compiler!
x18 x28 x19
hyrocarbon-rich phase
water-ricphase
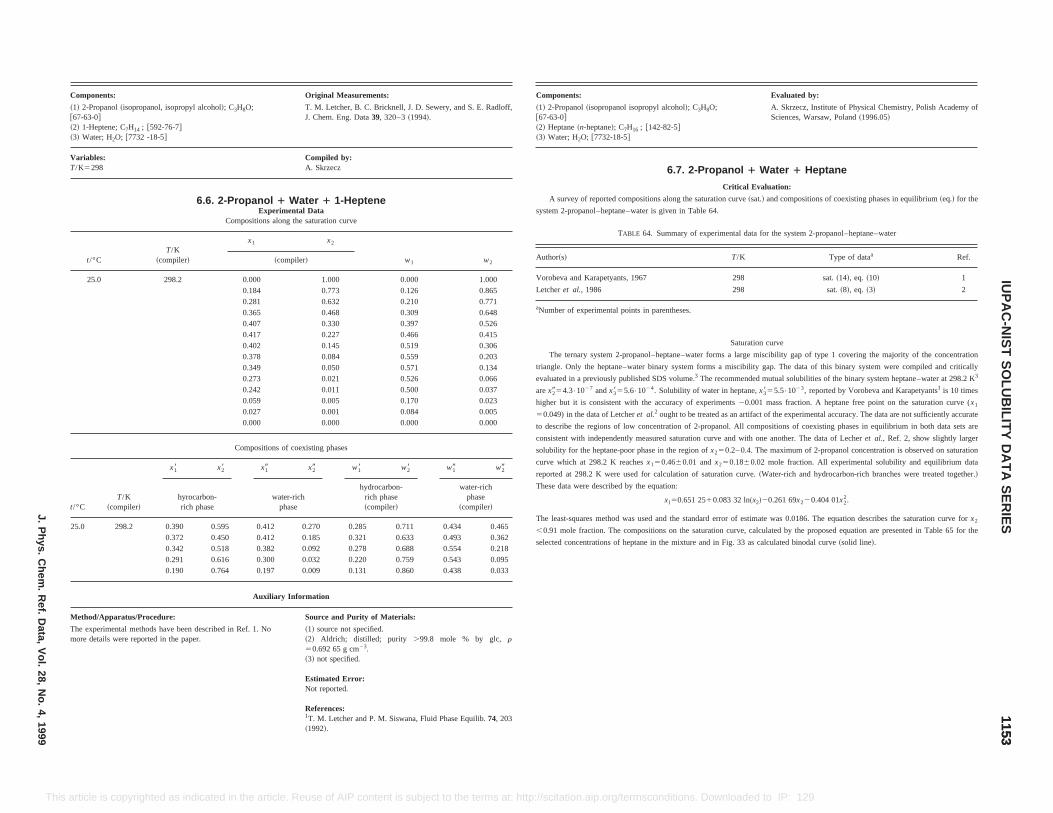
ents: Evaluated by:
panol~isopropanol isopropyl alcohol!; C3H8O;
ne~n-heptane!; C7H16 ; @142-82-5#r; H2O; @7732-18-5#
A. Skrzecz, Institute of Physical Chemistry, Polish Academy ofSciences, Warsaw, Poland~1996.05!
6.7. 2-Propanol 1 Water 1 Heptane
Critical Evaluation:
vey of reported compositions along the saturation curve~sat.! and compositions of coexisting phases in equilibrium~eq.! for the
-propanol–heptane–water is given in Table 64.
TABLE 64. Summary of experimental data for the system 2-propanol–heptane–water
T/K Type of dataa Ref.
a and Karapetyants, 1967 298 sat.~14!, eq. ~10! 1
t al., 1986 298 sat.~8!, eq. ~3! 2
of experimental points in parentheses.
Saturation curve
ternary system 2-propanol–heptane–water forms a large miscibility gap of type 1 covering the majority of the concentration
Only the heptane–water binary system forms a miscibility gap. The data of this binary system were compiled and critically
d in a previously published SDS volume.3 The recommended mutual solubilities of the binary system heptane–water at 298.2 K3
.3•1027 andx3855.6•1024. Solubility of water in heptane,x3855.5•1023, reported by Vorobeva and Karapetyants1 is 10 times
ut it is consistent with the accuracy of experiments20.001 mass fraction. A heptane free point on the saturation curve (x1
in the data of Letcheret al.2 ought to be treated as an artifact of the experimental accuracy. The data are not sufficiently accurate
be the regions of low concentration of 2-propanol. All compositions of coexisting phases in equilibrium in both data sets are
t with independently measured saturation curve and with one another. The data of Lecheret al., Ref. 2, show slightly larger
for the heptane-poor phase in the region ofx250.2– 0.4. The maximum of 2-propanol concentration is observed on saturation
ich at 298.2 K reachesx150.4660.01 andx250.1860.02 mole fraction. All experimental solubility and equilibrium data
at 298.2 K were used for calculation of saturation curve.~Water-rich and hydrocarbon-rich branches were treated together.!
ta were described by the equation:
x150.651 2510.083 32 ln~x2!20.261 69x220.404 01x22.
t-squares method was used and the standard error of estimate was 0.0186. The equation describes the saturation curve forx2
curve, calculated by the proposed equation are presented in Table 65 for the
ig. 33 as calculated binodal curve~solid line!.
11531153
IUP
AC
-NIS
TS
OLU
BILIT
YD
AT
AS
ER
IESJ.P
hys.C
hem.
Ref.
Data,
Vol.
28,N
o.4,
1999
This ded to IP: 129.6.105.191 On: Fri, 05 Sep 2014 17:51:55
25.0 298.2 0.390 0.595 0.412 0.270 0.285 0.711 0.434 0.4650.372 0.450 0.412 0.185 0.321 0.633 0.493 0.3620.342 0.518 0.382 0.092 0.278 0.688 0.554 0.2180.291 0.616 0.300 0.032 0.220 0.759 0.543 0.0950.190 0.764 0.197 0.009 0.131 0.860 0.438 0.033
Auxiliary Information
Method/Apparatus/Procedure: Source and Purity of Materials:
The experimental methods have been described in Ref. 1. Nomore details were reported in the paper.
~1! source not specified.~2! Aldrich; distilled; purity .99.8 mole % by glc, r50.692 65 g cm23.~3! not specified.
Estimated Error:Not reported.
References:1T. M. Letcher and P. M. Siswana, Fluid Phase Equilib.74, 203~1992!.
,0.91 mole fraction. The compositions on the saturation
selected concentrations of heptane in the mixture and in F
article is copyrighted as indicated in the article. Reuse of AIP content is subject to the terms at: http://scitation.aip.org/termsconditions. Downloa
Components: Original Measurements:
~1! 2-Propanol~isopropanol, isopropyl alcohol!; C3H8O;@67-63-0#~2! 1-Heptene; C7H14 ; @592-76-7#~3! Water; H2O; @7732 -18-5#
T. M. Letcher, B. C. Bricknell, J. D. Sewery, and S. E. Radloff,J. Chem. Eng. Data39, 320–3~1994!.
Variables:T/K5298
Compiled by:A. Skrzecz
6.6. 2-Propanol 1 Water 1 1-HepteneExperimental Data
Compositions along the saturation curve
t/°CT/K
~compiler!
x1 x2
w1 w2~compiler!
25.0 298.2 0.000 1.000 0.000 1.0000.184 0.773 0.126 0.8650.281 0.632 0.210 0.7710.365 0.468 0.309 0.6480.407 0.330 0.397 0.5260.417 0.227 0.466 0.4150.402 0.145 0.519 0.3060.378 0.084 0.559 0.2030.349 0.050 0.571 0.1340.273 0.021 0.526 0.0660.242 0.011 0.500 0.0370.059 0.005 0.170 0.0230.027 0.001 0.084 0.0050.000 0.000 0.000 0.000
Compositions of coexisting phases
t/°CT/K
~compiler!
x18 x28 x19 x29 w18 w28 w19 w29
hyrocarbon-rich phase
water-richphase
hydrocarbon-rich phase~compiler!
water-richphase
~compiler!
Compon
~1! 2-Pro@67-63-0#~2! Hepta~3! Wate
A sur
system 2
Author~s!
Vorobev
Letchere
aNumber
The
triangle.
evaluate
arex2954
higher b
50.049)
to descri
consisten
solubility
curve wh
reported
These da
The leas
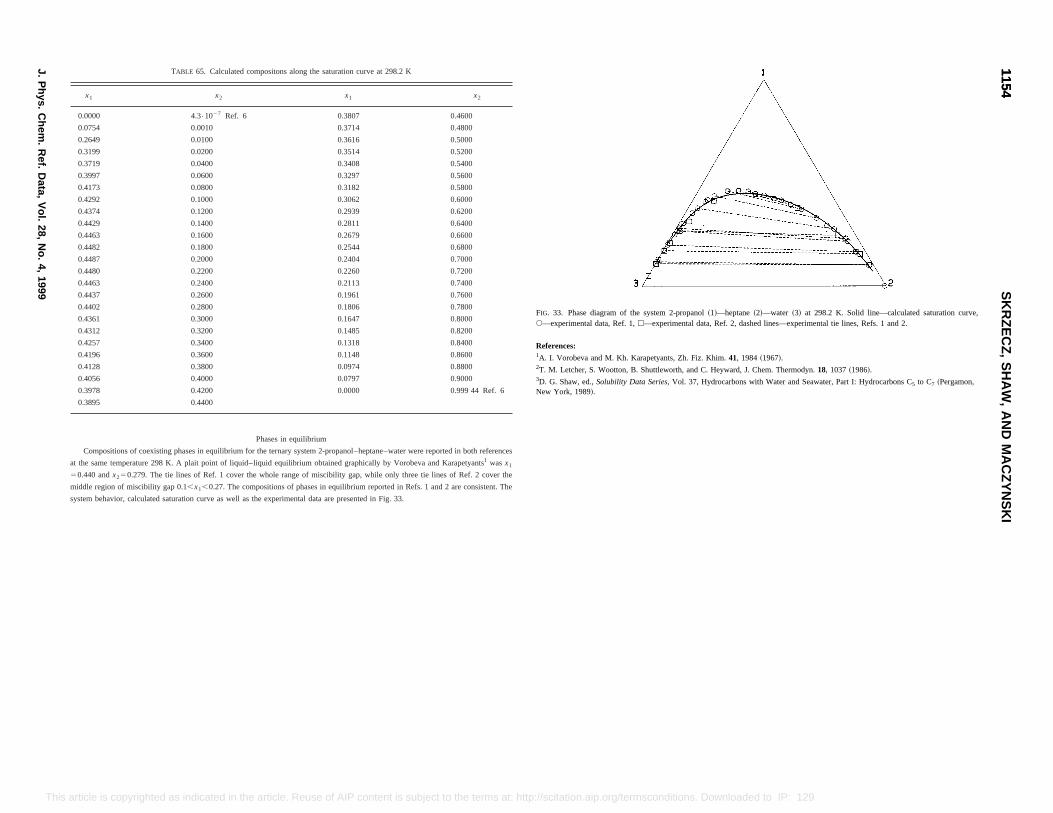
x2
0.4600
0.4800
0.5000
0.5200
0.5400
0.5600
0.5800
0.6000
0.6200
0.6400
0.6600
0.6800
0.7000
0.7200
0.7400
0.7600
0.7800
0.8000
0.8200
0.8400
0.8600
0.8800
0.9000
0.999 44 Ref. 6
r were reported in both references
beva and Karapetyants1 wasx1
e tie lines of Ref. 2 cover the
fs. 1 and 2 are consistent. The
3.
FIG. 33. Phase diagram of the system 2-propanol~1!—heptane~2!—water ~3! at 298.2 K. Solid line—calculated saturation curve,s—experimental data, Ref. 1,h—experimental data, Ref. 2, dashed lines—experimental tie lines, Refs. 1 and 2.
References:1A. I. Vorobeva and M. Kh. Karapetyants, Zh. Fiz. Khim.41, 1984~1967!.2T. M. Letcher, S. Wootton, B. Shuttleworth, and C. Heyward, J. Chem. Thermodyn.18, 1037~1986!.3D. G. Shaw, ed.,Solubility Data Series,Vol. 37, Hydrocarbons with Water and Seawater, Part I: Hydrocarbons C5 to C7 ~Pergamon,New York, 1989!.
11541154
SK
RZ
EC
Z,
SH
AW
,A
ND
MA
CZ
YN
SK
I
J.P
hys.C
hem.
Ref.
Data,
Vol.
28,N
o.4,
1999
This http://scitation.aip.org/termsconditions. Downloaded to IP: 129.6.105.191 On: Fri, 05 Sep 2014 17:51:55
article is copyrighted as indicated in the article. Reuse of AIP content is subject to the terms at:TABLE 65. Calculated compositons along the saturation curve at 298.2 K
x1 x2 x1
0.0000 4.3•1027 Ref. 6 0.3807
0.0754 0.0010 0.3714
0.2649 0.0100 0.3616
0.3199 0.0200 0.3514
0.3719 0.0400 0.3408
0.3997 0.0600 0.3297
0.4173 0.0800 0.3182
0.4292 0.1000 0.3062
0.4374 0.1200 0.2939
0.4429 0.1400 0.2811
0.4463 0.1600 0.2679
0.4482 0.1800 0.2544
0.4487 0.2000 0.2404
0.4480 0.2200 0.2260
0.4463 0.2400 0.2113
0.4437 0.2600 0.1961
0.4402 0.2800 0.1806
0.4361 0.3000 0.1647
0.4312 0.3200 0.1485
0.4257 0.3400 0.1318
0.4196 0.3600 0.1148
0.4128 0.3800 0.0974
0.4056 0.4000 0.0797
0.3978 0.4200 0.0000
0.3895 0.4400
Phases in equilibrium
Compositions of coexisting phases in equilibrium for the ternary system 2-propanol–heptane–wate
at the same temperature 298 K. A plait point of liquid–liquid equilibrium obtained graphically by Voro
50.440 andx250.279. The tie lines of Ref. 1 cover the whole range of miscibility gap, while only thre
middle region of miscibility gap 0.1,x1,0.27. The compositions of phases in equilibrium reported in Re
system behavior, calculated saturation curve as well as the experimental data are presented in Fig. 3

Original Measurements:
; A. I. Vorobeva and M. Kh. Karapetyants, Zh. Fiz. Khim.41,1984–9~1967!. @Eng. transl. Russ. J. Phys. Chem.41, 1061–3~1967!#.
Compiled by:A. Skrzecz
Experimental Dataositions along the saturation curve
x1 x2
w1 w2~compiler!
.0000 0.9945 0.000 0.999
2315 0.7202 0.160 0.830
2940 0.6119 0.219 0.760
3932 0.4129 0.345 0.604
4236 0.3287 0.405 0.524
4467 0.2397 0.475 0.425
4629 0.1637 0.546 0.322
4584 0.1200 0.584 0.255
4168 0.0598 0.619 0.148
4091 0.0538 0.620 0.136
3540 0.0281 0.604 0.080
3043 0.0160 0.569 0.050
2494 0.0079 0.514 0.027
1740 0.0020 0.410 0.008
positions of coexisting phases
x19 x29 w18 w28 w19 w29
water-richphase
~compiler!hydrocarbon-
rich phasewater-rich
phase
Auxiliary Information
Method/Apparatus/Procedure: Source and Purity of Materials:
The experimental methods were described in Ref. 1. Waterimpurities in alcohol were taken into account in themeasurements. Critical point of liquid–liquid equilibrium wasobtained graphically by the method reported in Ref. 2.
~1! source and method of preparation were reported in Ref. 1.~2! source not specified; pure grade; distilled; waterconcentration was analyzed by the Karl Fischer method.~3! doubly distilled.
Estimated Error:Not specified.
References:1A. I. Vorobeva and M. Kh. Karapetyants, Zh. Fiz. Khim.40,3018 ~1966!.2E. F. Zilberman, Zh. Fiz. Khim.26, 1458~1952!.
11551155
IUP
AC
-NIS
TS
OLU
BILIT
YD
AT
AS
ER
IESJ.P
hys.C
hem.
Ref.
Data,
Vol.
28,N
o.4,
1999
This ns. Downloaded to IP: 129.6.105.191 On: Fri, 05 Sep 2014 17:51:55
25 298.2 0.101 0.883 0.119 0.001 0.064 0.933 0.310 0.004
0.165 0.795 0.200 0.004 0.110 0.882 0.450 0.014
0.216 0.736 0.267 0.010 0.148 0.842 0.533 0.034
0.229 0.718 0.281 0.012 0.159 0.830 0.547 0.040
0.276 0.650 0.377 0.038 0.200 0.784 0.612 0.104
0.330 0.550 0.436 0.077 0.257 0.715 0.614 0.180
0.372 0.468 0.460 0.120 0.310 0.650 0.585 0.255
0.396 0.410 0.461 0.163 0.348 0.601 0.545 0.322
0.415 0.363 0.459 0.205 0.382 0.557 0.509 0.379
0.440 0.279 0.440 0.279 0.445 0.470 0.445 0.470a
aCritical point obtained graphically by the authors.
article is copyrighted as indicated in the article. Reuse of AIP content is subject to the terms at: http://scitation.aip.org/termsconditio
Components:
~1! 2-Propanol~isopropanol, isopropyl alcohol!; C3H8O@67-63-0#~2! Heptane~n-heptane!; C7H16 ; @142-82-5#~3! Water; H2O; @7732-18-5#
Variables:T/K5298
Comp
t/°CT/K
~compiler!
25 298.2 0
0.
0.
0.
0.
0.
0.
0.
0.
0.
0.
0.
0.
0.
Com
t/°CT/K
~compiler!
x18 x28
hyrocarbon-rich phase~compiler!
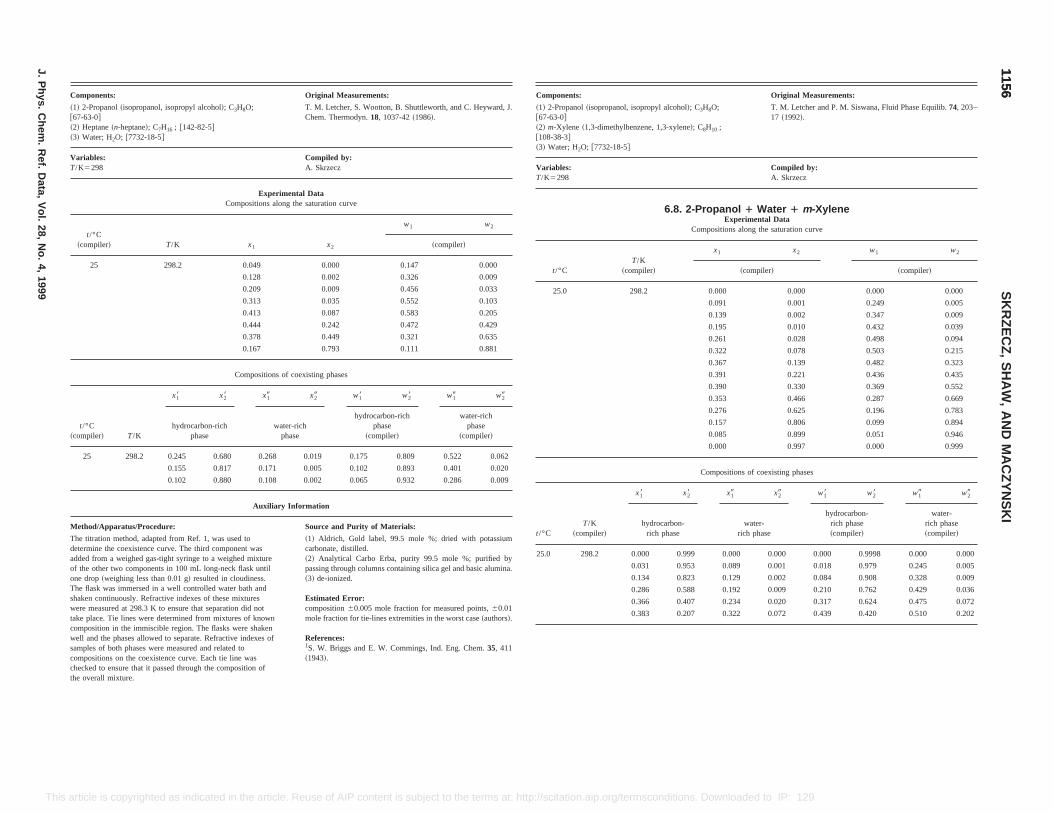
Original Measurements:
C3H8O;
eC8H10 ;
T. M. Letcher and P. M. Siswana, Fluid Phase Equilib.74, 203–17 ~1992!.
Compiled by:A. Skrzecz
Propanol 1 Water 1 m-XyleneExperimental Data
ompositions along the saturation curve
x1 x2 w1 w2
~compiler! ~compiler!
0.000 0.000 0.000 0.000
0.091 0.001 0.249 0.005
0.139 0.002 0.347 0.009
0.195 0.010 0.432 0.039
0.261 0.028 0.498 0.094
0.322 0.078 0.503 0.215
0.367 0.139 0.482 0.323
0.391 0.221 0.436 0.435
0.390 0.330 0.369 0.552
0.353 0.466 0.287 0.669
0.276 0.625 0.196 0.783
0.157 0.806 0.099 0.894
0.085 0.899 0.051 0.946
0.000 0.997 0.000 0.999
Compositions of coexisting phases
x19 x29 w18 w28 w19 w29
water-rich phase
hydrocarbon-rich phase~compiler!
water-rich phase~compiler!
9 0.000 0.000 0.000 0.9998 0.000 0.000
3 0.089 0.001 0.018 0.979 0.245 0.005
3 0.129 0.002 0.084 0.908 0.328 0.009
8 0.192 0.009 0.210 0.762 0.429 0.036
7 0.234 0.020 0.317 0.624 0.475 0.072
7 0.322 0.072 0.439 0.420 0.510 0.202
11561156
SK
RZ
EC
Z,
SH
AW
,A
ND
MA
CZ
YN
SK
I
J.P
hys.C
hem.
Ref.
Data,
Vol.
28,N
o.4,
1999
This . Downloaded to IP: 129.6.105.191 On: Fri, 05 Sep 2014 17:51:55
Method/Apparatus/Procedure: Source and Purity of Materials:
The titration method, adapted from Ref. 1, was used todetermine the coexistence curve. The third component wasadded from a weighed gas-tight syringe to a weighed mixtureof the other two components in 100 mL long-neck flask untilone drop~weighing less than 0.01 g! resulted in cloudiness.The flask was immersed in a well controlled water bath andshaken continuously. Refractive indexes of these mixtureswere measured at 298.3 K to ensure that separation did nottake place. Tie lines were determined from mixtures of knowncomposition in the immiscible region. The flasks were shakenwell and the phases allowed to separate. Refractive indexes ofsamples of both phases were measured and related tocompositions on the coexistence curve. Each tie line waschecked to ensure that it passed through the composition ofthe overall mixture.
~1! Aldrich, Gold label, 99.5 mole %; dried with potassiumcarbonate, distilled.~2! Analytical Carbo Erba, purity 99.5 mole %; purified bypassing through columns containing silica gel and basic alumina.~3! de-ionized.
Estimated Error:composition60.005 mole fraction for measured points,60.01mole fraction for tie-lines extremities in the worst case~authors!.
References:1S. W. Briggs and E. W. Commings, Ind. Eng. Chem.35, 411~1943!.
t/°CT/K
~compiler!hydrocarbon-
rich phase
25.0 298.2 0.000 0.99
0.031 0.95
0.134 0.82
0.286 0.58
0.366 0.40
0.383 0.20
article is copyrighted as indicated in the article. Reuse of AIP content is subject to the terms at: http://scitation.aip.org/termsconditions
Components: Original Measurements:
~1! 2-Propanol~isopropanol, isopropyl alcohol!; C3H8O;@67-63-0#~2! Heptane~n-heptane!; C7H16 ; @142-82-5#~3! Water; H2O; @7732-18-5#
T. M. Letcher, S. Wootton, B. Shuttleworth, and C. Heyward, J.Chem. Thermodyn.18, 1037-42~1986!.
Variables:T/K5298
Compiled by:A. Skrzecz
Experimental DataCompositions along the saturation curve
t/°C~compiler! T/K x1 x2
w1 w2
~compiler!
25 298.2 0.049 0.000 0.147 0.000
0.128 0.002 0.326 0.009
0.209 0.009 0.456 0.033
0.313 0.035 0.552 0.103
0.413 0.087 0.583 0.205
0.444 0.242 0.472 0.429
0.378 0.449 0.321 0.635
0.167 0.793 0.111 0.881
Compositions of coexisting phases
t/°C~compiler! T/K
x18 x28 x19 x29 w18 w28 w19 w29
hydrocarbon-richphase
water-richphase
hydrocarbon-richphase
~compiler!
water-richphase
~compiler!
25 298.2 0.245 0.680 0.268 0.019 0.175 0.809 0.522 0.062
0.155 0.817 0.171 0.005 0.102 0.893 0.401 0.020
0.102 0.880 0.108 0.002 0.065 0.932 0.286 0.009
Auxiliary Information
Components:
~1! 2-Propanol~isopropanol, isopropyl alcohol!;@67-63-0#~2! m-Xylene ~1,3-dimethylbenzene, 1,3-xylen!;@108-38-3#~3! Water; H2O; @7732-18-5#
Variables:T/K5298
6.8. 2-
C
t/°CT/K
~compiler!
25.0 298.2
x18 x28
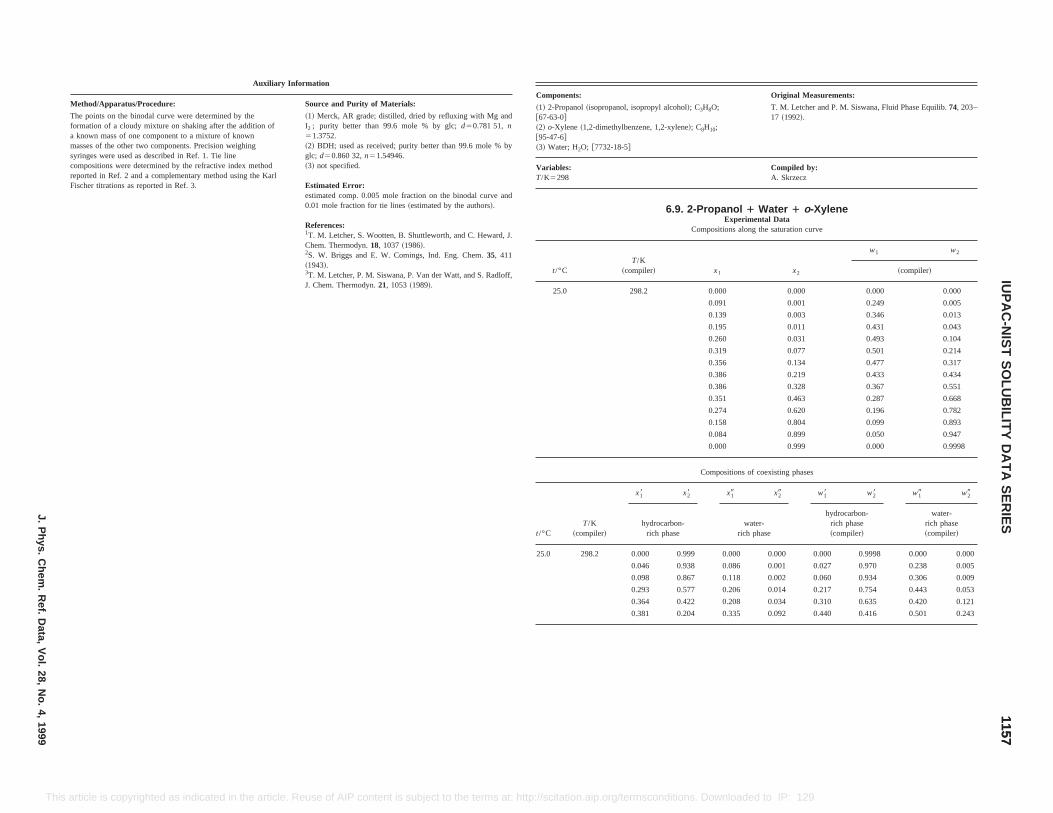
Original Measurements:
isopropyl alcohol!; C3H8O;
nzene, 1,2-xylene!; C8H10;
T. M. Letcher and P. M. Siswana, Fluid Phase Equilib.74, 203–17 ~1992!.
Compiled by:A. Skrzecz
6.9. 2-Propanol 1 Water 1 o-XyleneExperimental Data
Compositions along the saturation curve
/Kpiler! x1 x2
w1 w2
~compiler!
98.2 0.000 0.000 0.000 0.000
0.091 0.001 0.249 0.005
0.139 0.003 0.346 0.013
0.195 0.011 0.431 0.043
0.260 0.031 0.493 0.104
0.319 0.077 0.501 0.214
0.356 0.134 0.477 0.317
0.386 0.219 0.433 0.434
0.386 0.328 0.367 0.551
0.351 0.463 0.287 0.668
0.274 0.620 0.196 0.782
0.158 0.804 0.099 0.893
0.084 0.899 0.050 0.947
0.000 0.999 0.000 0.9998
Compositions of coexisting phases
t/°C ~compiler!
x18 x28 x19 x29 w18 w28 w19 w29
hydrocarbon-rich phase
water-rich phase
hydrocarbon-rich phase~compiler!
water-rich phase~compiler!
25.0 298.2 0.000 0.999 0.000 0.000 0.000 0.9998 0.000 0.000
0.046 0.938 0.086 0.001 0.027 0.970 0.238 0.005
0.098 0.867 0.118 0.002 0.060 0.934 0.306 0.009
0.293 0.577 0.206 0.014 0.217 0.754 0.443 0.053
0.364 0.422 0.208 0.034 0.310 0.635 0.420 0.121
0.381 0.204 0.335 0.092 0.440 0.416 0.501 0.243
11571157
IUP
AC
-NIS
TS
OLU
BILIT
YD
AT
AS
ER
IESJ.P
hys.C
hem.
Ref.
Data,
Vol.
28,N
o.4,
1999
This a se of AIP content is subject to the terms at: http://scitation.aip.org/termsconditions. Downloaded to IP: 129.6.105.191 On: Fri, 05 Sep 2014 17:51:55
rticle is copyrighted as indicated in the article. ReuAuxiliary Information
Method/Apparatus/Procedure: Source and Purity of Materials:
The points on the binodal curve were determined by theformation of a cloudy mixture on shaking after the addition ofa known mass of one component to a mixture of knownmasses of the other two components. Precision weighingsyringes were used as described in Ref. 1. Tie linecompositions were determined by the refractive index methodreported in Ref. 2 and a complementary method using the KarlFischer titrations as reported in Ref. 3.
~1! Merck, AR grade; distilled, dried by refluxing with Mg andI2 ; purity better than 99.6 mole % by glc;d50.781 51, n51.3752.~2! BDH; used as received; purity better than 99.6 mole % byglc; d50.860 32,n51.54946.~3! not specified.
Estimated Error:estimated comp. 0.005 mole fraction on the binodal curve and0.01 mole fraction for tie lines~estimated by the authors!.
References:1T. M. Letcher, S. Wootten, B. Shuttleworth, and C. Heward, J.Chem. Thermodyn.18, 1037~1986!.2S. W. Briggs and E. W. Comings, Ind. Eng. Chem.35, 411~1943!.3T. M. Letcher, P. M. Siswana, P. Van der Watt, and S. Radloff,J. Chem. Thermodyn.21, 1053~1989!.
Components:
~1! 2-Propanol~isopropanol,@67-63-0#~2! o-Xylene ~1,2-dimethylbe@95-47-6#~3! Water; H2O; @7732-18-5#
Variables:T/K5298
t/°CT
~com
25.0 2
T/K
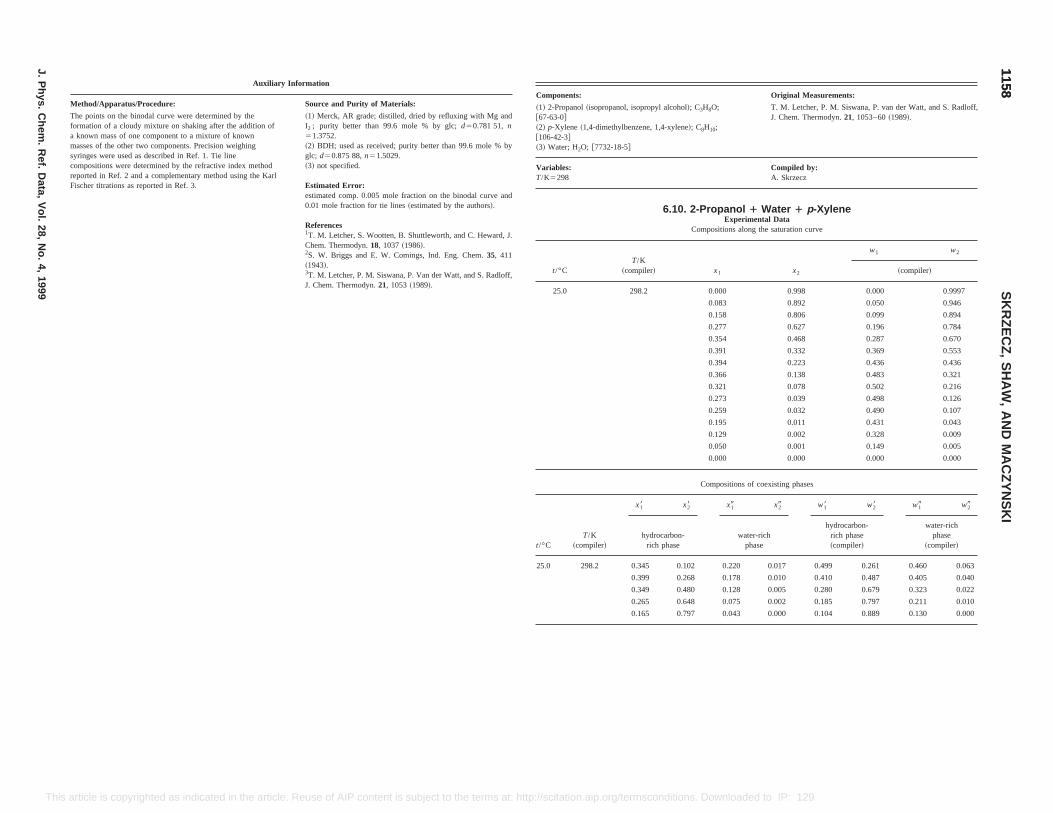
Original Measurements:
propyl alcohol!; C3H8O;
ne, 1,4-xylene!; C8H10;
T. M. Letcher, P. M. Siswana, P. van der Watt, and S. Radloff,J. Chem. Thermodyn.21, 1053–60~1989!.
Compiled by:A. Skrzecz
6.10. 2-Propanol 1 Water 1 p-XyleneExperimental Data
Compositions along the saturation curve
iler! x1 x2
w1 w2
~compiler!
.2 0.000 0.998 0.000 0.9997
0.083 0.892 0.050 0.946
0.158 0.806 0.099 0.894
0.277 0.627 0.196 0.784
0.354 0.468 0.287 0.670
0.391 0.332 0.369 0.553
0.394 0.223 0.436 0.436
0.366 0.138 0.483 0.321
0.321 0.078 0.502 0.216
0.273 0.039 0.498 0.126
0.259 0.032 0.490 0.107
0.195 0.011 0.431 0.043
0.129 0.002 0.328 0.009
0.050 0.001 0.149 0.005
0.000 0.000 0.000 0.000
Compositions of coexisting phases
t/°CT/K
~compiler!
x28 x19 x29 w18 w28 w19 w29
hydrocarbon-rich phase
water-richphase
hydrocarbon-rich phase~compiler!
water-richphase
~compiler!
25.0 298.2 0.345 0.102 0.220 0.017 0.499 0.261 0.460 0.063
0.399 0.268 0.178 0.010 0.410 0.487 0.405 0.040
0.349 0.480 0.128 0.005 0.280 0.679 0.323 0.022
0.265 0.648 0.075 0.002 0.185 0.797 0.211 0.010
0.165 0.797 0.043 0.000 0.104 0.889 0.130 0.000
11581158
SK
RZ
EC
Z,
SH
AW
,A
ND
MA
CZ
YN
SK
I
J.P
hys.C
hem.
Ref.
Data,
Vol.
28,N
o.4,
1999
This euse of AIP content is subject to the terms at: http://scitation.aip.org/termsconditions. Downloaded to IP: 129.6.105.191 On: Fri, 05 Sep 2014 17:51:55
article is copyrighted as indicated in the article. RAuxiliary Information
Method/Apparatus/Procedure: Source and Purity of Materials:
The points on the binodal curve were determined by theformation of a cloudy mixture on shaking after the addition ofa known mass of one component to a mixture of knownmasses of the other two components. Precision weighingsyringes were used as described in Ref. 1. Tie linecompositions were determined by the refractive index methodreported in Ref. 2 and a complementary method using the KarlFischer titrations as reported in Ref. 3.
~1! Merck, AR grade; distilled, dried by refluxing with Mg andI2 ; purity better than 99.6 mole % by glc;d50.781 51, n51.3752.~2! BDH; used as received; purity better than 99.6 mole % byglc; d50.875 88,n51.5029.~3! not specified.
Estimated Error:estimated comp. 0.005 mole fraction on the binodal curve and0.01 mole fraction for tie lines~estimated by the authors!.
References1T. M. Letcher, S. Wootten, B. Shuttleworth, and C. Heward, J.Chem. Thermodyn.18, 1037~1986!.2S. W. Briggs and E. W. Comings, Ind. Eng. Chem.35, 411~1943!.3T. M. Letcher, P. M. Siswana, P. Van der Watt, and S. Radloff,J. Chem. Thermodyn.21, 1053~1989!.
Components:
~1! 2-Propanol~isopropanol, iso@67-63-0#~2! p-Xylene ~1,4-dimethylbenze@106-42-3#~3! Water; H2O; @7732-18-5#
Variables:T/K5298
t/°CT/K
~comp
25.0 298
x18
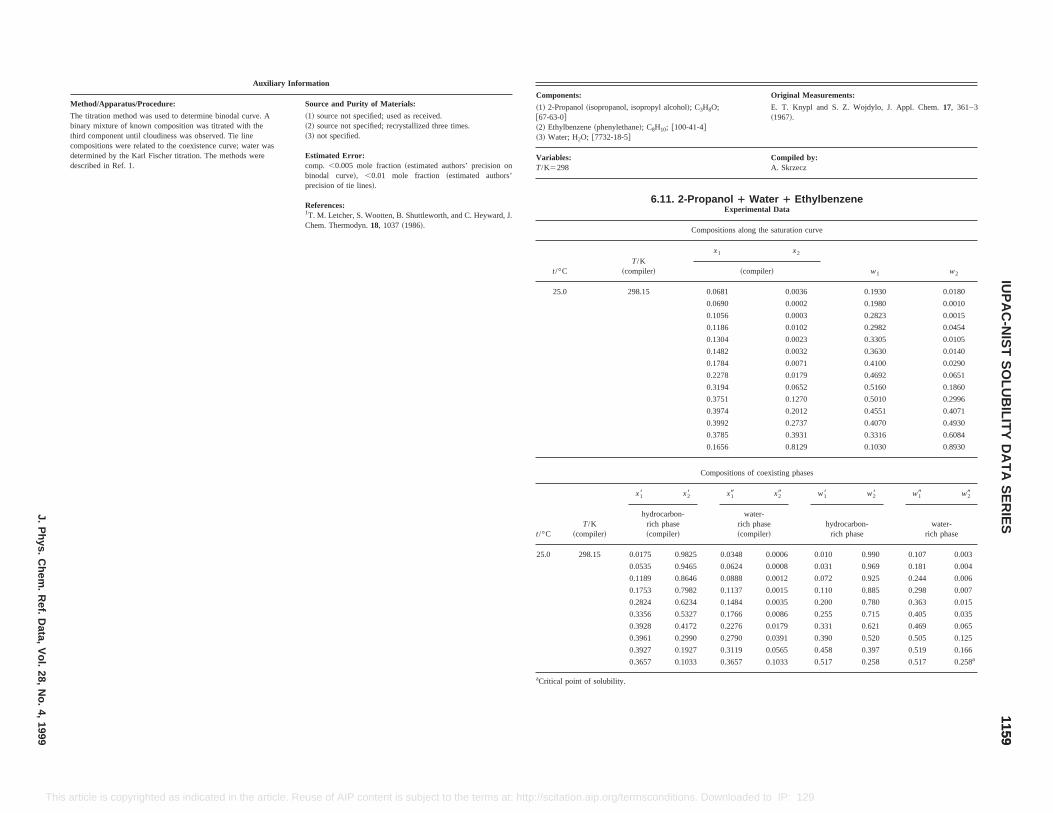
Original Measurements:
H8O;
4#
E. T. Knypl and S. Z. Wojdylo, J. Appl. Chem.17, 361–3~1967!.
Compiled by:A. Skrzecz
panol 1 Water 1 EthylbenzeneExperimental Data
mpositions along the saturation curve
x1 x2
w1 w2~compiler!
0.0681 0.0036 0.1930 0.0180
0.0690 0.0002 0.1980 0.0010
0.1056 0.0003 0.2823 0.0015
0.1186 0.0102 0.2982 0.0454
0.1304 0.0023 0.3305 0.0105
0.1482 0.0032 0.3630 0.0140
0.1784 0.0071 0.4100 0.0290
0.2278 0.0179 0.4692 0.0651
0.3194 0.0652 0.5160 0.1860
0.3751 0.1270 0.5010 0.2996
0.3974 0.2012 0.4551 0.4071
0.3992 0.2737 0.4070 0.4930
0.3785 0.3931 0.3316 0.6084
0.1656 0.8129 0.1030 0.8930
ompositions of coexisting phases
t/°C ~compiler!
x19 x29 w18 w28 w19 w29
~compiler!
water-rich phase~compiler!
hydrocarbon-rich phase
water-rich phase
25.0 298.15 0.0175 0.9825 0.0348 0.0006 0.010 0.990 0.107 0.003
0.0535 0.9465 0.0624 0.0008 0.031 0.969 0.181 0.004
0.1189 0.8646 0.0888 0.0012 0.072 0.925 0.244 0.006
0.1753 0.7982 0.1137 0.0015 0.110 0.885 0.298 0.007
0.2824 0.6234 0.1484 0.0035 0.200 0.780 0.363 0.015
0.3356 0.5327 0.1766 0.0086 0.255 0.715 0.405 0.035
0.3928 0.4172 0.2276 0.0179 0.331 0.621 0.469 0.065
0.3961 0.2990 0.2790 0.0391 0.390 0.520 0.505 0.125
0.3927 0.1927 0.3119 0.0565 0.458 0.397 0.519 0.166
0.3657 0.1033 0.3657 0.1033 0.517 0.258 0.517 0.258a
aCritical point of solubility.
11591159
IUP
AC
-NIS
TS
OLU
BILIT
YD
AT
AS
ER
IESJ.P
hys.C
hem.
Ref.
Data,
Vol.
28,N
o.4,
1999
This e article. Reuse of AIP content is subject to the terms at: http://scitation.aip.org/termsconditions. Downloaded to IP: 129.6.105.191 On: Fri, 05 Sep 2014 17:51:55
article is copyrighted as indicated in thAuxiliary Information
Method/Apparatus/Procedure: Source and Purity of Materials:
The titration method was used to determine binodal curve. Abinary mixture of known composition was titrated with thethird component until cloudiness was observed. Tie linecompositions were related to the coexistence curve; water wasdetermined by the Karl Fischer titration. The methods weredescribed in Ref. 1.
~1! source not specified; used as received.~2! source not specified; recrystallized three times.~3! not specified.
Estimated Error:comp. ,0.005 mole fraction~estimated authors’ precision onbinodal curve!, ,0.01 mole fraction ~estimated authors’precision of tie lines!.
References:1T. M. Letcher, S. Wootten, B. Shuttleworth, and C. Heyward, J.Chem. Thermodyn.18, 1037~1986!.
Components:
~1! 2-Propanol~isopropanol, isopropyl alcohol!; C3
@67-63-0#~2! Ethylbenzene~phenylethane!; C8H10; @100-41-~3! Water; H2O; @7732-18-5#
Variables:T/K5298
6.11. 2-Pro
Co
t/°CT/K
~compiler!
25.0 298.15
C
T/K
x18 x28
hydrocarbon-rich phase

Original Measurements:
A. O. Emelyanov, L. V. Melnik, and B. N. Bobylev, Zh. Prikl.Khim. ~Leningrad! 64, 1700–4 ~1991!. @Eng. transl. Russ. J.Appl. Chem.~Leningrad! 64, 1555–8~1991!#.
Compiled by:A. Skrzecz
ater 1 1,7-Octadienental Datag the saturation curve
x2
w1 w2
~compiler!
0.0003 0.0000 0.0018
0.0045 0.4952 0.0176
0.0668 0.5654 0.1840
0.1155 0.5292 0.2795
0.1787 0.4761 0.3806
0.2466 0.4250 0.4684
0.3632 0.3454 0.5892
0.6409 0.1936 0.7919
0.8351 0.0864 0.9101
0.9998 0.0000 0.99997
0.0149 0.0000 0.0847
0.9995 0.0000 0.99992
f coexisting phases
x29 w18 w28 w19 w29
ter-hase
hydrocarbon-rich phase~compiler!
water-rich phase~compiler!
0.0005 0.0204 0.9790 0.1463 0.0027
0.0005 0.0649 0.9325 0.2796 0.0025
0.1687 0.8052 0.1368 0.0005 0.1021 0.8932 0.3452 0.0023
0.2415 0.7097 0.1792 0.8199 0.1551 0.8356 0.1065 0.8934
0.2849 0.6449 0.2066 0.0019 0.1914 0.7945 0.4618 0.0078
0.3342 0.5439 0.2407 0.0032 0.2443 0.7290 0.5086 0.0124
0.3681 0.4404 0.2865 0.0098 0.2985 0.6549 0.5559 0.0349
0.3898 0.3647 0.3062 0.0217 0.3443 0.5907 0.5593 0.0727
0.4000 0.1130 0.4000 0.1130 0.5311 0.2751 0.5311 0.2751
Auxiliary Information
Method/Apparatus/Procedure: Source and Purity of Materials:
Mutual solubility was determined by the standard isothermictitration method until turbidity was observed. Phaseequilibrium was measured in the thermostated separator.Concentrations of 2-propanol and 1,7-octadiene in theequilibrium phases were determined by the glc analysis~FIDdetector!. Water was analyzed by the Karl Fischer method.
~1! source not specified, pure grade; dried, distilled; b.p.5355.54 K.~2! synthesized in the laboratory; distilled; purity.99.5%;b.p.5390.65 K.~3! doubly distilled.
Estimated Error:Not reported.
11601160
SK
RZ
EC
Z,
SH
AW
,A
ND
MA
CZ
YN
SK
I
J.P
hys.C
hem.
Ref.
Data,
Vol.
28,N
o.4,
1999
This in the article. Reuse of AIP content is subject to the terms at: http://scitation.aip.org/termsconditions. Downloaded to IP: 129.6.105.191 On: Fri, 05 Sep 2014 17:51:55
article is copyrighted as indicatedAuxiliary Information
Method/Apparatus/Procedure: Source and Purity of Materials:
The saturation isotherm was obtained by cloud-point titrationmethod. Liquid–liquid equilibrium was determined by thesynthetic method. Physical properties of phases in equilibrium,refractive index and density, were measured and compositionswere found from relationships obtained in the isothermalmeasurements.
~1! Chemical Works ‘‘Oswiecim’’ ~Poland!, laboratory grade;used as received; d(20 °C,4 °C)50.7864, n(20 °C,D)51.3768.~2! Chemical Works ‘‘Oswiecim’’ ~Poland!, laboratory grade;used as received; d(20 °C,4 °C)50.8665, n(20 °C,D)51.4958.~3! distilled.
Estimated Error:temp.60.05 °C~estimated by the compiler!.
Components:
~1! 2-Propanol~isopropanol, isopropyl alcohol!; C3H8O;@67-63-0#~2! 1,7-Octadiene; C8H14; @3710-30-3#~3! Water; H2O; @7732-18-5#
Variables:T/K5293– 360
6.12. 2-Propanol 1 WExperime
Compositions alon
t/°CT/K
~compiler! x1
25.00 293.15 0.0000
0.2325
0.3765
0.4010
0.4099
0.4103
0.3904
0.2874
0.1453
0.0000
87.00 360.15 0.0000
0.0000
Compositions o
t/°CT/K
~compiler!
x18 x28 x19
hydrocarbon-rich phase
warich p
20.00 293.15 0.0366 0.9595 0.0490
0.1115 0.8736 0.1045

Compositions of coexisting phase
T/K~compiler!
x18 x28 x19 x29 w18 w28 w19 w29
hydrocarbon-rich phase~compiler!
water-richphase
~compiler!hydrocarbon-
rich phasewater-rich
phase
293.2 0.3752 0.3983 0.3595 0.0266 0.3126 0.6308 0.6051 0.0852
0.3207 0.4931 0.3199 0.0172 0.2441 0.7134 0.5802 0.0594
0.2851 0.5706 0.2709 0.0124 0.2018 0.7676 0.5320 0.0461
0.2517 0.6497 0.2337 0.0080 0.1660 0.8145 0.4908 0.0319
0.2094 0.6888 0.2079 0.0082 0.1352 0.8451 0.4535 0.0339
0.1761 0.7329 0.1684 0.0056 0.1103 0.8726 0.3947 0.0251
0.1691 0.7342 0.1499 0.0064 0.1061 0.8757 0.3613 0.0293
0.1489 0.7587 0.1277 0.0060 0.0920 0.8909 0.3202 0.0288
0.1152 0.7848 0.0985 0.0057 0.0704 0.9113 0.2607 0.0285
0.1022 0.8078 0.0867 0.0040 0.0614 0.9224 0.2363 0.0207
0.0672 0.8481 0.0518 0.0029 0.0394 0.9457 0.1521 0.0164
0.0562 0.8623 0.0430 0.0029 0.0327 0.9531 0.1287 0.0162
0.0378 0.8903 0.0277 0.0019 0.0216 0.9661 0.0859 0.0110
0.0198 0.9104 0.0140 0.0004 0.0112 0.9770 0.0450 0.0022
Auxiliary Information
Apparatus/Procedure: Source and Purity of Materials:
measurements were made in an equilibrium cellirrer1 by titration of binary mixtures of knowntion with the third component. This was done usingol for heterogeneous hydrocarbon–water mixtures,turbidity had disappeared and 2,2,4-trimethylpentanegeneous alcohol–water mixtures until cloudiness was
d. Tie lines were measured in the same cell filled witheterogeneous mixtures of known composition.were stirred for 1 h and after separation the samples
phase were twice analyzed; 2-propanol concentrationrmined by glc using Supelco Carbopack-C 0.2%,
0, 60/80 column on Aerograph Hydrogen-Flame,00-C~N2, 12–13 mL/s, 373 K!. Water wased by the Karl Fischer method.
~1! Merck; dried over anhydrous K2CO3, distilled, with themiddle 80% collected; impurities,0.1% by glc; b.p.5355.760.1 K, n(293 K,D)51.375660.0005, r(293 K)5783.260.1 kg m23.~2! Merck; dried over anhydrous K2CO3, distilled, with themiddle 60% collected; impurities,0.2% by glc; b.p.5372.960.1 K, n(293 K,D)51.389060.0005, r(293 K)5695.860.1 kg m23.~3! not specified.
Estimated Error:temp.60.1 K; solubility curve60.0025 mass fraction, analysis:2-propanol 60.0050 mass fraction, water60.0025 massfraction.
References:1A. A. Sayar, J. Chem. Eng. Data36, 61 ~1991!.
11611161
IUP
AC
-NIS
TS
OLU
BILIT
YD
AT
AS
ER
IESJ.P
hys.C
hem.
Ref.
Data,
Vol.
28,N
o.4,
1999
This s. Downloaded to IP: 129.6.105.191 On: Fri, 05 Sep 2014 17:51:55
0.4283 0.1496 0.5104 0.3388
0.4385 0.1615 0.5067 0.3547
0.4355 0.2121 0.4612 0.4269
0.4102 0.2588 0.4096 0.4913
0.3916 0.3179 0.3616 0.5580
0.3389 0.4632 0.2650 0.6886
0.2737 0.5775 0.1933 0.7752
0.0995 0.8318 0.0585 0.9294
0.0478 0.8823 0.0274 0.9606
0.0000 0.9519 0.0000 0.9921
article is copyrighted as indicated in the article. Reuse of AIP content is subject to the terms at: http://scitation.aip.org/termscondition
Components: Original Measurements:
~1! 2-Propanol~isopropanol, isopropyl alcohol!; C3H8O;@67-63-0#~2! 2,2,4-Trimethylpentane~isooctane!; C8H18; @540-84-1#~3! Water; H2O; @7732-18-5#
N. Arda and A. A. Sayar, Fluid Phase Equilib.73, 129–38~1992!.
Variables:T/K5293
Compiled by:A. Skrzecz
6.13. 2-Propanol 1 Water 1 2,2,4-TrimethylpentaneExperimental Data
Compositions along the saturation curve
t/°CT/K
~compiler!
x1 x2
w1 w2~compiler!
25.0 293.2 0.0000 0.0004 0.0000 0.0028
0.0044 0.0010 0.0145 0.0060
0.0126 0.0015 0.0406 0.0094
0.0380 0.0022 0.1152 0.0125
0.0541 0.0027 0.1582 0.0151
0.0673 0.0038 0.1907 0.0207
0.0969 0.0038 0.2593 0.0193
0.1074 0.0044 0.2811 0.0218
0.1313 0.0044 0.3292 0.0210
0.1641 0.0056 0.3874 0.0251
0.1965 0.0070 0.4380 0.0297
0.2138 0.0076 0.4632 0.0312
0.2471 0.0082 0.5086 0.0320
0.3077 0.0163 0.5684 0.0573
0.3364 0.0222 0.5893 0.0739
0.3921 0.0380 0.6173 0.1137
0.4151 0.0489 0.6208 0.1389
0.4306 0.0613 0.6156 0.1667
0.4401 0.0838 0.5930 0.2147
0.4467 0.1031 0.5744 0.2521
0.4392 0.1333 0.5351 0.3088
t/°C
25.0
Method/
Solubilitywith a stcomposi2-propanuntil thefor homoobserveternary hMixturesof eachwas deteCW-150Model 6determin
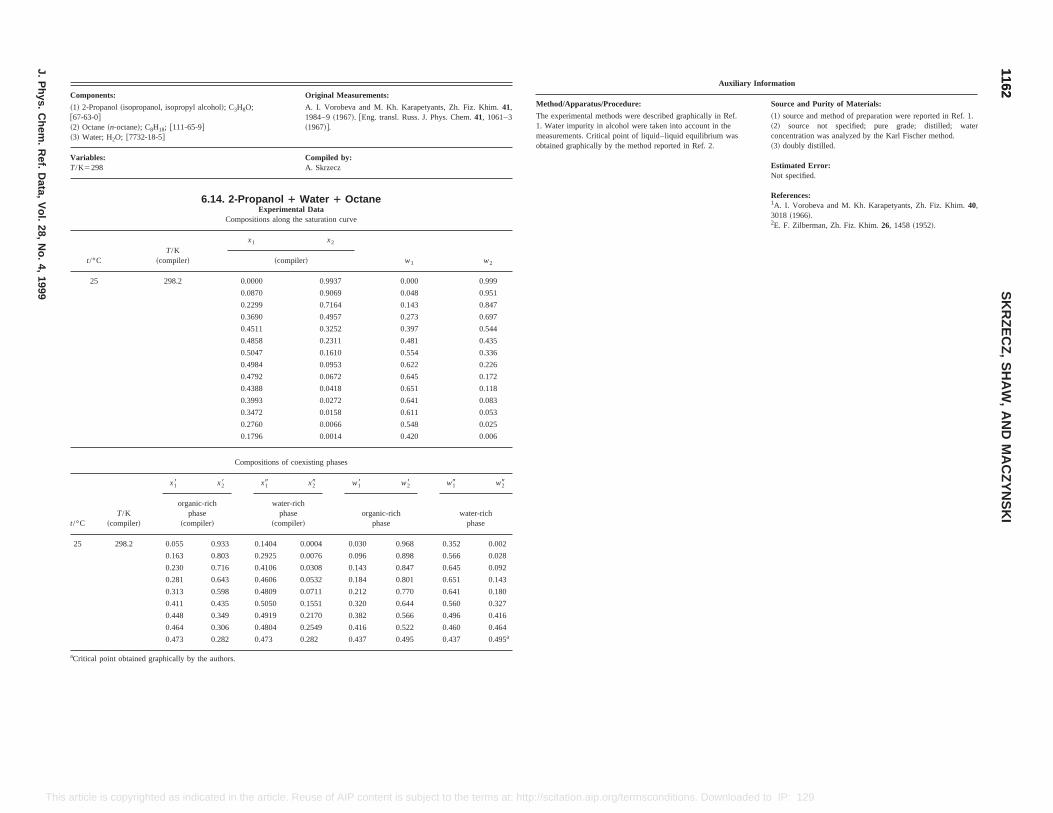
Original Measurements:
8O; A. I. Vorobeva and M. Kh. Karapetyants, Zh. Fiz. Khim.41,1984–9~1967!. @Eng. transl. Russ. J. Phys. Chem.41, 1061–3~1967!#.
Compiled by:A. Skrzecz
ropanol 1 Water 1 OctaneExperimental Data
positions along the saturation curve
x1 x2
w1 w2~compiler!
0.0000 0.9937 0.000 0.999
0.0870 0.9069 0.048 0.951
0.2299 0.7164 0.143 0.847
0.3690 0.4957 0.273 0.697
0.4511 0.3252 0.397 0.544
0.4858 0.2311 0.481 0.435
0.5047 0.1610 0.554 0.336
0.4984 0.0953 0.622 0.226
0.4792 0.0672 0.645 0.172
0.4388 0.0418 0.651 0.118
0.3993 0.0272 0.641 0.083
0.3472 0.0158 0.611 0.053
0.2760 0.0066 0.548 0.025
0.1796 0.0014 0.420 0.006
ompositions of coexisting phases
x19 x29 w18 w28 w19 w29
water-richphase
~compiler!organic-rich
phasewater-rich
phase
Auxiliary Information
Method/Apparatus/Procedure: Source and Purity of Materials:
The experimental methods were described graphically in Ref.1. Water impurity in alcohol were taken into account in themeasurements. Critical point of liquid–liquid equilibrium wasobtained graphically by the method reported in Ref. 2.
~1! source and method of preparation were reported in Ref. 1.~2! source not specified; pure grade; distilled; waterconcentration was analyzed by the Karl Fischer method.~3! doubly distilled.
Estimated Error:Not specified.
References:1A. I. Vorobeva and M. Kh. Karapetyants, Zh. Fiz. Khim.40,3018 ~1966!.2E. F. Zilberman, Zh. Fiz. Khim.26, 1458~1952!.
11621162
SK
RZ
EC
Z,
SH
AW
,A
ND
MA
CZ
YN
SK
I
J.P
hys.C
hem.
Ref.
Data,
Vol.
28,N
o.4,
1999
This ions. Downloaded to IP: 129.6.105.191 On: Fri, 05 Sep 2014 17:51:55
25 298.2 0.055 0.933 0.1404 0.0004 0.030 0.968 0.352 0.002
0.163 0.803 0.2925 0.0076 0.096 0.898 0.566 0.028
0.230 0.716 0.4106 0.0308 0.143 0.847 0.645 0.092
0.281 0.643 0.4606 0.0532 0.184 0.801 0.651 0.143
0.313 0.598 0.4809 0.0711 0.212 0.770 0.641 0.180
0.411 0.435 0.5050 0.1551 0.320 0.644 0.560 0.327
0.448 0.349 0.4919 0.2170 0.382 0.566 0.496 0.416
0.464 0.306 0.4804 0.2549 0.416 0.522 0.460 0.464
0.473 0.282 0.473 0.282 0.437 0.495 0.437 0.495a
aCritical point obtained graphically by the authors.
article is copyrighted as indicated in the article. Reuse of AIP content is subject to the terms at: http://scitation.aip.org/termscondit
Components:
~1! 2-Propanol~isopropanol, isopropyl alcohol!; C3H@67-63-0#~2! Octane~n-octane!; C8H18; @111-65-9#~3! Water; H2O; @7732-18-5#
Variables:T/K5298
6.14. 2-P
Com
t/°CT/K
~compiler!
25 298.2
C
t/°CT/K
~compiler!
x18 x28
organic-richphase
~compiler!
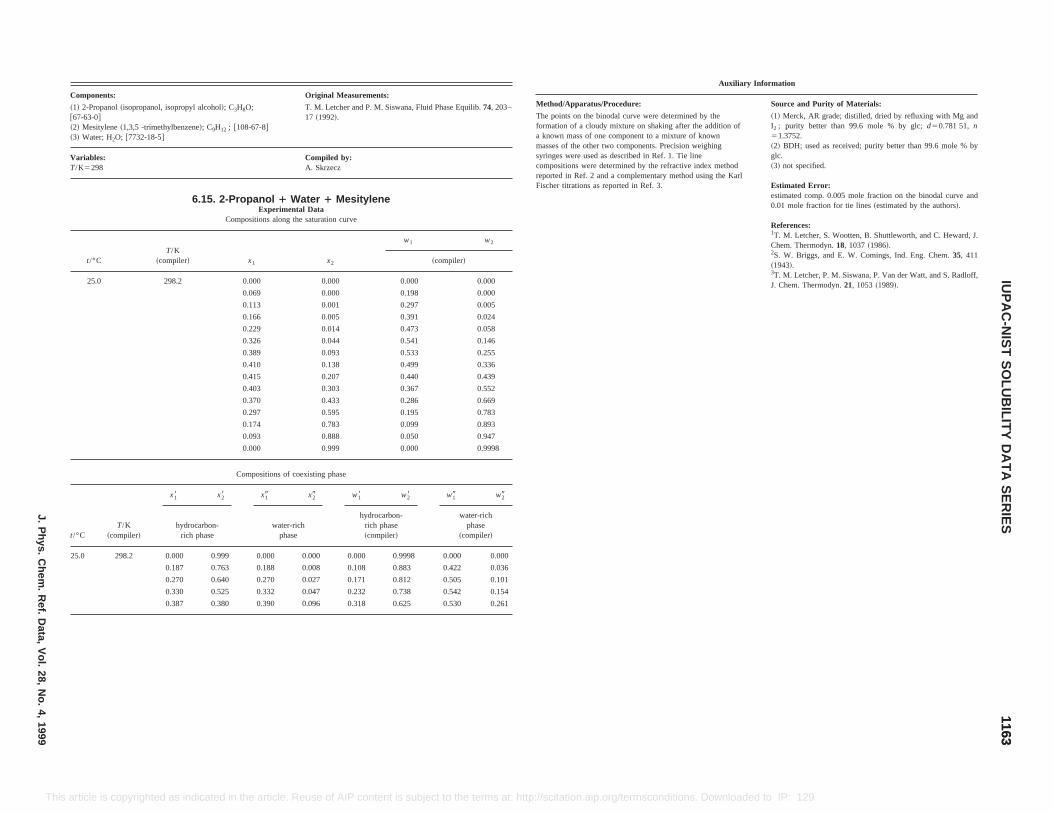
Original Measurements:
T. M. Letcher and P. M. Siswana, Fluid Phase Equilib.74, 203–17 ~1992!.
Compiled by:A. Skrzecz
ter 1 Mesitylenel Datae saturation curve
x2
w1 w2
~compiler!
0.000 0.000 0.000
0.000 0.198 0.000
0.001 0.297 0.005
0.005 0.391 0.024
0.014 0.473 0.058
0.044 0.541 0.146
0.093 0.533 0.255
0.138 0.499 0.336
0.207 0.440 0.439
0.303 0.367 0.552
0.433 0.286 0.669
0.595 0.195 0.783
0.783 0.099 0.893
0.888 0.050 0.947
0.999 0.000 0.9998
existing phase
T/K
x29 w18 w28 w19 w29
hydrocarbon- water-richhydrocarbon-
rich phasewater-rich
phase
Auxiliary Information
Method/Apparatus/Procedure: Source and Purity of Materials:
The points on the binodal curve were determined by theformation of a cloudy mixture on shaking after the addition ofa known mass of one component to a mixture of knownmasses of the other two components. Precision weighingsyringes were used as described in Ref. 1. Tie linecompositions were determined by the refractive index methodreported in Ref. 2 and a complementary method using the KarlFischer titrations as reported in Ref. 3.
~1! Merck, AR grade; distilled, dried by refluxing with Mg andI2 ; purity better than 99.6 mole % by glc;d50.781 51, n51.3752.~2! BDH; used as received; purity better than 99.6 mole % byglc.~3! not specified.
Estimated Error:estimated comp. 0.005 mole fraction on the binodal curve and0.01 mole fraction for tie lines~estimated by the authors!.
References:1T. M. Letcher, S. Wootten, B. Shuttleworth, and C. Heward, J.Chem. Thermodyn.18, 1037~1986!.2S. W. Briggs, and E. W. Comings, Ind. Eng. Chem.35, 411~1943!.3T. M. Letcher, P. M. Siswana, P. Van der Watt, and S. Radloff,J. Chem. Thermodyn.21, 1053~1989!.
11631163
IUP
AC
-NIS
TS
OLU
BILIT
YD
AT
AS
ER
IESJ.P
hys.C
hem.
Ref.
Data,
Vol.
28,N
o.4,
1999
This sconditions. Downloaded to IP: 129.6.105.191 On: Fri, 05 Sep 2014 17:51:55
t/°C ~compiler! rich phase phase ~compiler! ~compiler!
25.0 298.2 0.000 0.999 0.000 0.000 0.000 0.9998 0.000 0.000
0.187 0.763 0.188 0.008 0.108 0.883 0.422 0.036
0.270 0.640 0.270 0.027 0.171 0.812 0.505 0.101
0.330 0.525 0.332 0.047 0.232 0.738 0.542 0.154
0.387 0.380 0.390 0.096 0.318 0.625 0.530 0.261
article is copyrighted as indicated in the article. Reuse of AIP content is subject to the terms at: http://scitation.aip.org/term
Components:
~1! 2-Propanol~isopropanol, isopropyl alcohol!; C3H8O;@67-63-0#~2! Mesitylene~1,3,5 -trimethylbenzene!; C9H12 ; @108-67-8#~3! Water; H2O; @7732-18-5#
Variables:T/K5298
6.15. 2-Propanol 1 WaExperimenta
Compositions along th
t/°CT/K
~compiler! x1
25.0 298.2 0.000
0.069
0.113
0.166
0.229
0.326
0.389
0.410
0.415
0.403
0.370
0.297
0.174
0.093
0.000
Compositions of co
x18 x28 x19
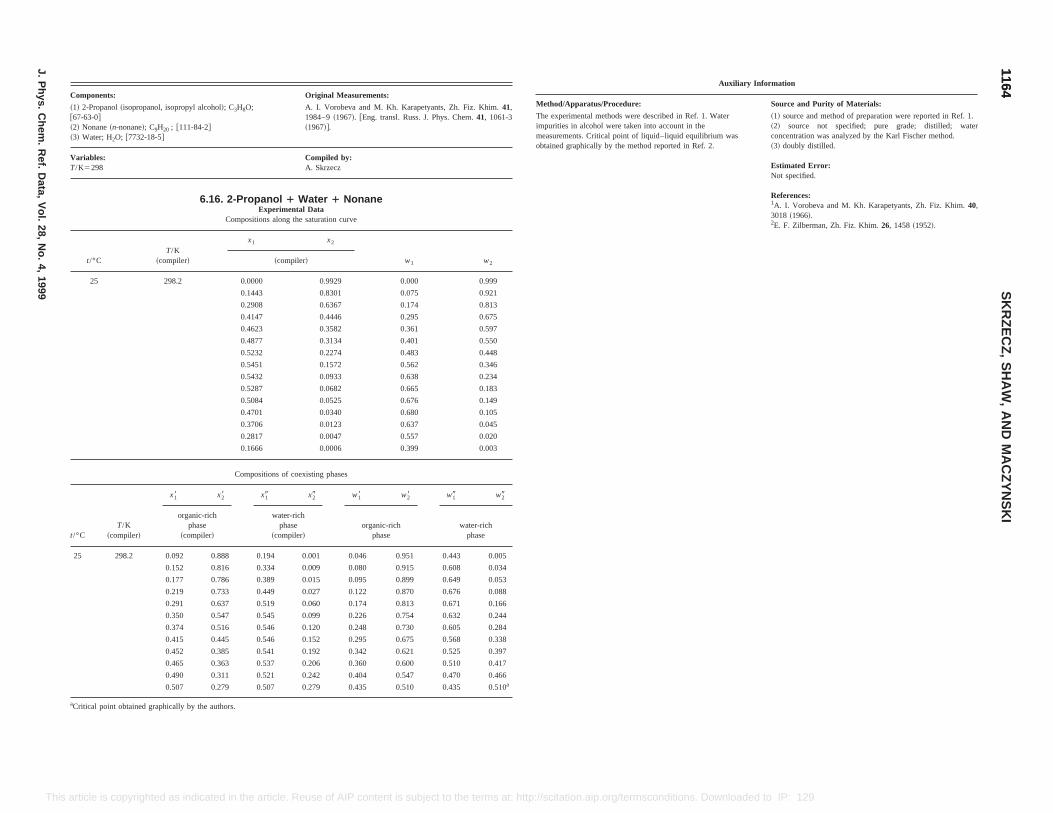
Original Measurements:
8O; A. I. Vorobeva and M. Kh. Karapetyants, Zh. Fiz. Khim.41,1984–9~1967!. @Eng. transl. Russ. J. Phys. Chem.41, 1061-3~1967!#.
Compiled by:A. Skrzecz
ropanol 1 Water 1 NonaneExperimental Data
positions along the saturation curve
x1 x2
w1 w2~compiler!
0.0000 0.9929 0.000 0.999
0.1443 0.8301 0.075 0.921
0.2908 0.6367 0.174 0.813
0.4147 0.4446 0.295 0.675
0.4623 0.3582 0.361 0.597
0.4877 0.3134 0.401 0.550
0.5232 0.2274 0.483 0.448
0.5451 0.1572 0.562 0.346
0.5432 0.0933 0.638 0.234
0.5287 0.0682 0.665 0.183
0.5084 0.0525 0.676 0.149
0.4701 0.0340 0.680 0.105
0.3706 0.0123 0.637 0.045
0.2817 0.0047 0.557 0.020
0.1666 0.0006 0.399 0.003
ompositions of coexisting phases
x19 x29 w18 w28 w19 w29
water-richphase organic-rich water-rich
Auxiliary Information
Method/Apparatus/Procedure: Source and Purity of Materials:
The experimental methods were described in Ref. 1. Waterimpurities in alcohol were taken into account in themeasurements. Critical point of liquid–liquid equilibrium wasobtained graphically by the method reported in Ref. 2.
~1! source and method of preparation were reported in Ref. 1.~2! source not specified; pure grade; distilled; waterconcentration was analyzed by the Karl Fischer method.~3! doubly distilled.
Estimated Error:Not specified.
References:1A. I. Vorobeva and M. Kh. Karapetyants, Zh. Fiz. Khim.40,3018 ~1966!.2E. F. Zilberman, Zh. Fiz. Khim.26, 1458~1952!.
11641164
SK
RZ
EC
Z,
SH
AW
,A
ND
MA
CZ
YN
SK
I
J.P
hys.C
hem.
Ref.
Data,
Vol.
28,N
o.4,
1999
This nloaded to IP: 129.6.105.191 On: Fri, 05 Sep 2014 17:51:55
t/°C ~compiler! ~compiler! ~compiler! phase phase
25 298.2 0.092 0.888 0.194 0.001 0.046 0.951 0.443 0.005
0.152 0.816 0.334 0.009 0.080 0.915 0.608 0.034
0.177 0.786 0.389 0.015 0.095 0.899 0.649 0.053
0.219 0.733 0.449 0.027 0.122 0.870 0.676 0.088
0.291 0.637 0.519 0.060 0.174 0.813 0.671 0.166
0.350 0.547 0.545 0.099 0.226 0.754 0.632 0.244
0.374 0.516 0.546 0.120 0.248 0.730 0.605 0.284
0.415 0.445 0.546 0.152 0.295 0.675 0.568 0.338
0.452 0.385 0.541 0.192 0.342 0.621 0.525 0.397
0.465 0.363 0.537 0.206 0.360 0.600 0.510 0.417
0.490 0.311 0.521 0.242 0.404 0.547 0.470 0.466
0.507 0.279 0.507 0.279 0.435 0.510 0.435 0.510a
aCritical point obtained graphically by the authors.
article is copyrighted as indicated in the article. Reuse of AIP content is subject to the terms at: http://scitation.aip.org/termsconditions. Dow
Components:
~1! 2-Propanol~isopropanol, isopropyl alcohol!; C3H@67-63-0#~2! Nonane~n-nonane!; C9H20 ; @111-84-2#~3! Water; H2O; @7732-18-5#
Variables:T/K5298
6.16. 2-P
Com
t/°CT/K
~compiler!
25 298.2
C
T/K
x18 x28
organic-richphase
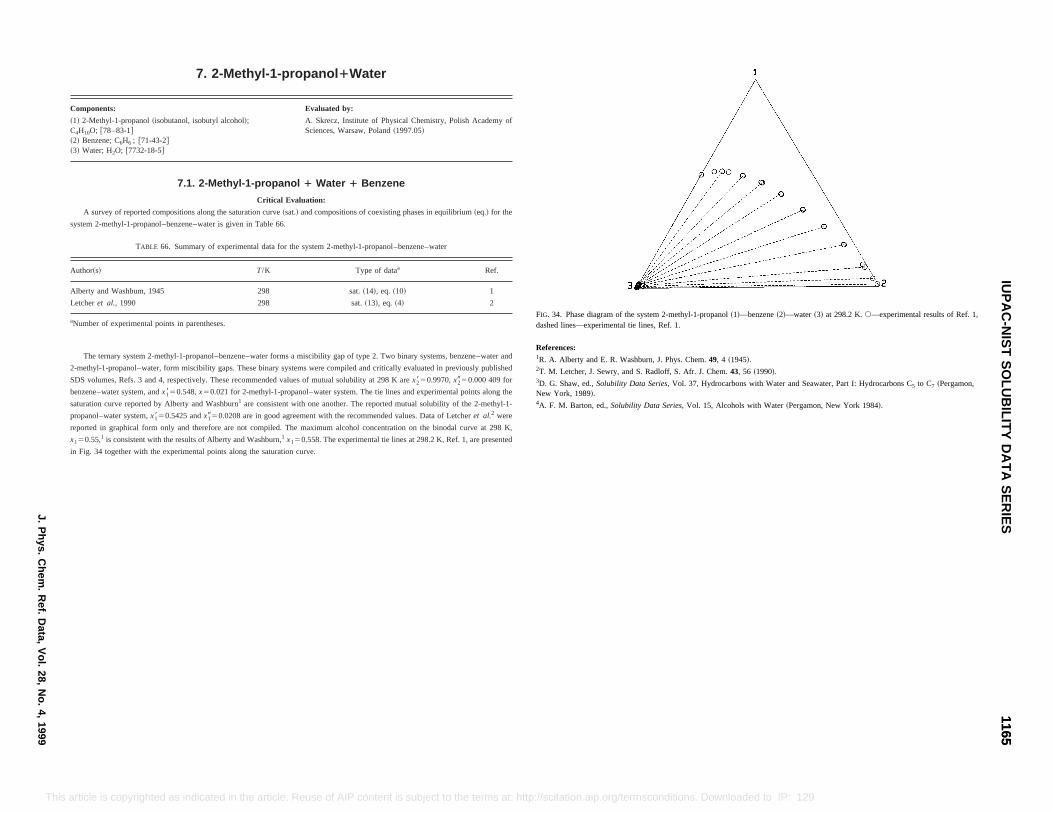
sh Academy of
ium~eq.! for the
r
Ref.
1
2
s, benzene–water and
previously published
.000 409 for
tal points along the
f the 2-methyl-1-
etcheret al.2 were
odal curve at 298 K,
1, are presented
FIG. 34. Phase diagram of the system 2-methyl-1-propanol~1!—benzene~2!—water~3! at 298.2 K.s—experimental results of Ref. 1,dashed lines—experimental tie lines, Ref. 1.
References:1R. A. Alberty and E. R. Washburn, J. Phys. Chem.49, 4 ~1945!.2T. M. Letcher, J. Sewry, and S. Radloff, S. Afr. J. Chem.43, 56 ~1990!.3D. G. Shaw, ed.,Solubility Data Series, Vol. 37, Hydrocarbons with Water and Seawater, Part I: Hydrocarbons C5 to C7 ~Pergamon,New York, 1989!.4A. F. M. Barton, ed.,Solubility Data Series, Vol. 15, Alcohols with Water~Pergamon, New York 1984!.
11651165
IUP
AC
-NIS
TS
OLU
BILIT
YD
AT
AS
ER
IESJ.P
hys.C
hem.
Ref.
Data,
Vol.
28,N
o.4,
1999
This terms at: http://scitation.aip.org/termsconditions. Downloaded to IP: 129.6.105.191 On: Fri, 05 Sep 2014 17:51:55
article is copyrighted as indicated in the article. Reuse of AIP content is subject to the7. 2-Methyl-1-propanol 1Water
Components: Evaluated by:
~1! 2-Methyl-1-propanol~isobutanol, isobutyl alcohol!;C4H10O; @78–83-1#~2! Benzene; C6H6 ; @71-43-2#~3! Water; H2O; @7732-18-5#
A. Skrecz, Institute of Physical Chemistry, PoliSciences, Warsaw, Poland~1997.05!
7.1. 2-Methyl-1-propanol 1 Water 1 Benzene
Critical Evaluation:
A survey of reported compositions along the saturation curve~sat.! and compositions of coexisting phases in equilibr
system 2-methyl-1-propanol–benzene–water is given in Table 66.
TABLE 66. Summary of experimental data for the system 2-methyl-1-propanol–benzene–wate
Author~s! T/K Type of dataa
Alberty and Washbum, 1945 298 sat.~14!, eq. ~10!
Letcheret al., 1990 298 sat.~13!, eq. ~4!
aNumber of experimental points in parentheses.
The ternary system 2-methyl-1-propanol–benzene–water forms a miscibility gap of type 2. Two binary system
2-methyl-1-propanol–water, form miscibility gaps. These binary systems were compiled and critically evaluated in
SDS volumes, Refs. 3 and 4, respectively. These recommended values of mutual solubility at 298 K arex2850.9970,x2950
benzene–water system, andx1850.548,x50.021 for 2-methyl-1-propanol–water system. The tie lines and experimen
saturation curve reported by Alberty and Washburn1 are consistent with one another. The reported mutual solubility o
propanol–water system,x1850.5425 andx1950.0208 are in good agreement with the recommended values. Data of L
reported in graphical form only and therefore are not compiled. The maximum alcohol concentration on the bin
x150.55,1 is consistent with the results of Alberty and Washburn,1 x150.558. The experimental tie lines at 298.2 K, Ref.
in Fig. 34 together with the experimental points along the saturation curve.
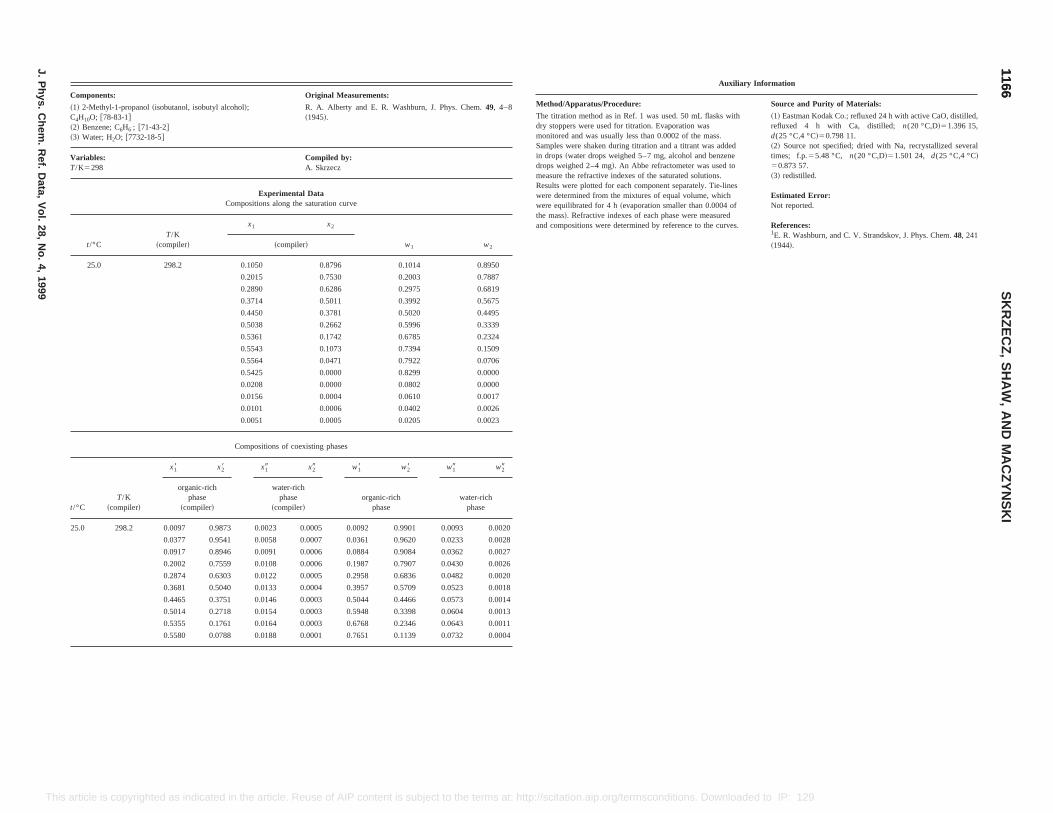
Original Measurements:
R. A. Alberty and E. R. Washburn, J. Phys. Chem.49, 4–8~1945!.
Compiled by:A. Skrzecz
Experimental Datations along the saturation curve
x2
w1 w2~compiler!
050 0.8796 0.1014 0.8950
15 0.7530 0.2003 0.7887
90 0.6286 0.2975 0.6819
14 0.5011 0.3992 0.5675
50 0.3781 0.5020 0.4495
38 0.2662 0.5996 0.3339
61 0.1742 0.6785 0.2324
43 0.1073 0.7394 0.1509
64 0.0471 0.7922 0.0706
25 0.0000 0.8299 0.0000
08 0.0000 0.0802 0.0000
56 0.0004 0.0610 0.0017
01 0.0006 0.0402 0.0026
51 0.0005 0.0205 0.0023
ositions of coexisting phases
x19 x29 w18 w28 w19 w29
water-richphase
~compiler!organic-rich
phasewater-rich
phase
Auxiliary Information
Method/Apparatus/Procedure: Source and Purity of Materials:
The titration method as in Ref. 1 was used. 50 mL flasks withdry stoppers were used for titration. Evaporation wasmonitored and was usually less than 0.0002 of the mass.Samples were shaken during titration and a titrant was addedin drops~water drops weighed 5–7 mg, alcohol and benzenedrops weighed 2–4 mg!. An Abbe refractometer was used tomeasure the refractive indexes of the saturated solutions.Results were plotted for each component separately. Tie-lineswere determined from the mixtures of equal volume, whichwere equilibrated for 4 h~evaporation smaller than 0.0004 ofthe mass!. Refractive indexes of each phase were measuredand compositions were determined by reference to the curves.
~1! Eastman Kodak Co.; refluxed 24 h with active CaO, distilled,refluxed 4 h with Ca, distilled; n(20 °C,D!51.396 15,d(25 °C,4 °C!50.798 11.~2! Source not specified; dried with Na, recrystallized severaltimes; f.p.55.48 °C, n(20 °C,D!51.501 24, d(25 °C,4 °C!50.873 57.~3! redistilled.
Estimated Error:Not reported.
References:1E. R. Washburn, and C. V. Strandskov, J. Phys. Chem.48, 241~1944!.
11661166
SK
RZ
EC
Z,
SH
AW
,A
ND
MA
CZ
YN
SK
I
J.P
hys.C
hem.
Ref.
Data,
Vol.
28,N
o.4,
1999
This onditions. Downloaded to IP: 129.6.105.191 On: Fri, 05 Sep 2014 17:51:55
25.0 298.2 0.0097 0.9873 0.0023 0.0005 0.0092 0.9901 0.0093 0.0020
0.0377 0.9541 0.0058 0.0007 0.0361 0.9620 0.0233 0.0028
0.0917 0.8946 0.0091 0.0006 0.0884 0.9084 0.0362 0.0027
0.2002 0.7559 0.0108 0.0006 0.1987 0.7907 0.0430 0.0026
0.2874 0.6303 0.0122 0.0005 0.2958 0.6836 0.0482 0.0020
0.3681 0.5040 0.0133 0.0004 0.3957 0.5709 0.0523 0.0018
0.4465 0.3751 0.0146 0.0003 0.5044 0.4466 0.0573 0.0014
0.5014 0.2718 0.0154 0.0003 0.5948 0.3398 0.0604 0.0013
0.5355 0.1761 0.0164 0.0003 0.6768 0.2346 0.0643 0.0011
0.5580 0.0788 0.0188 0.0001 0.7651 0.1139 0.0732 0.0004
article is copyrighted as indicated in the article. Reuse of AIP content is subject to the terms at: http://scitation.aip.org/termsc
Components:
~1! 2-Methyl-1-propanol~isobutanol, isobutyl alcohol!;C4H10O; @78-83-1#~2! Benzene; C6H6 ; @71-43-2#~3! Water; H2O; @7732-18-5#
Variables:T/K5298
Composi
t/°CT/K
~compiler!
x1
25.0 298.2 0.1
0.20
0.28
0.37
0.44
0.50
0.53
0.55
0.55
0.54
0.02
0.01
0.01
0.00
Comp
t/°CT/K
~compiler!
x18 x28
organic-richphase
~compiler!
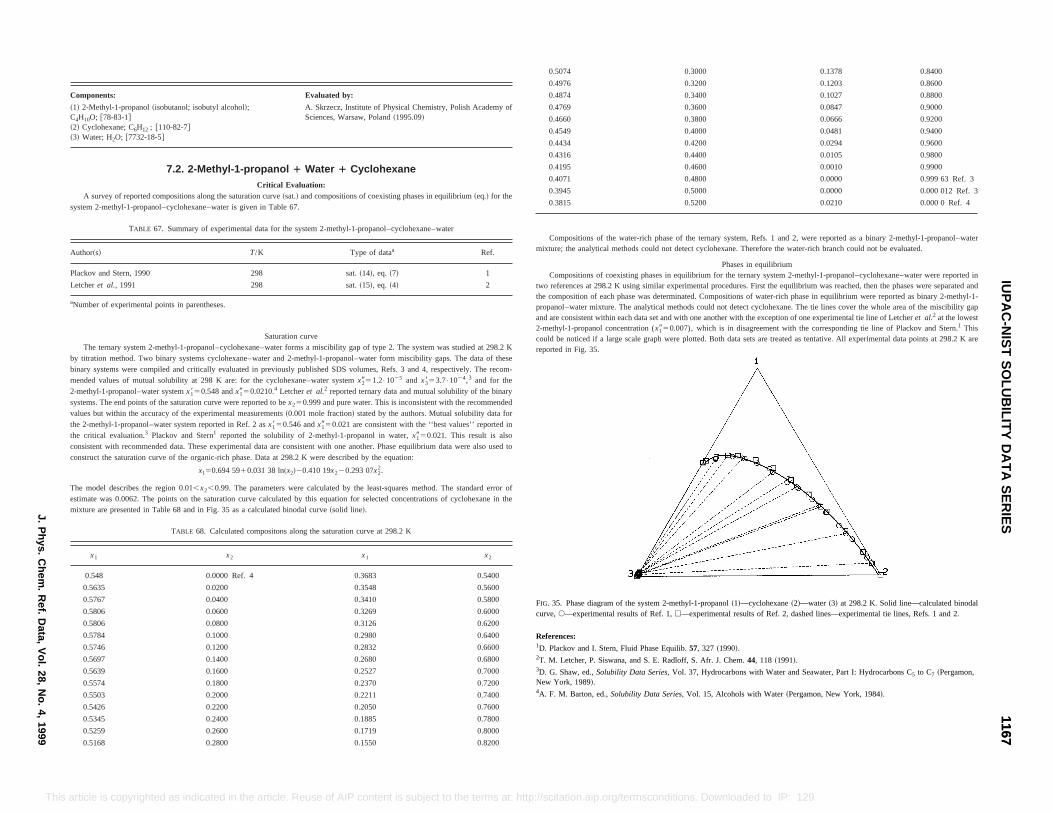
0.1378 0.8400
0.1203 0.8600
0.1027 0.8800
0.0847 0.9000
0.0666 0.9200
0.0481 0.9400
0.0294 0.9600
0.0105 0.9800
0.0010 0.9900
0.0000 0.999 63 Ref. 3
0.0000 0.000 012 Ref. 3
0.0210 0.000 0 Ref. 4
system, Refs. 1 and 2, were reported as a binary 2-methyl-1-propanol–waterxane. Therefore the water-rich branch could not be evaluated.
ses in equilibriumthe ternary system 2-methyl-1-propanol–cyclohexane–water were reported incedures. First the equilibrium was reached, then the phases were separated andositions of water-rich phase in equilibrium were reported as binary 2-methyl-1-ot detect cyclohexane. The tie lines cover the whole area of the miscibility gapther with the exception of one experimental tie line of Letcheret al.2 at the lowest
disagreement with the corresponding tie line of Plackov and Stern.1 Thisth data sets are treated as tentative. All experimental data points at 298.2 K are
lohexane~2!—water ~3! at 298.2 K. Solid line—calculated binodals of Ref. 2, dashed lines—experimental tie lines, Refs. 1 and 2.
.118 ~1991!.
ith Water and Seawater, Part I: Hydrocarbons C5 to C7 ~Pergamon,
th Water~Pergamon, New York, 1984!.
11671167
IUP
AC
-NIS
TS
OLU
BILIT
YD
AT
AS
ER
IESJ.P
hys.C
hem.
Ref.
Data,
Vol.
28,N
o.4,
1999
This to IP: 129.6.105.191 On: Fri, 05 Sep 2014 17:51:55
TABLE 68. Calculated compositons along the saturation curve at 298.2 K
x1 x2 x1 x2
0.548 0.0000 Ref. 4 0.3683 0.5400
0.5635 0.0200 0.3548 0.5600
0.5767 0.0400 0.3410 0.5800
0.5806 0.0600 0.3269 0.6000
0.5806 0.0800 0.3126 0.6200
0.5784 0.1000 0.2980 0.6400
0.5746 0.1200 0.2832 0.6600
0.5697 0.1400 0.2680 0.6800
0.5639 0.1600 0.2527 0.7000
0.5574 0.1800 0.2370 0.7200
0.5503 0.2000 0.2211 0.7400
0.5426 0.2200 0.2050 0.7600
0.5345 0.2400 0.1885 0.7800
0.5259 0.2600 0.1719 0.8000
0.5168 0.2800 0.1550 0.8200
FIG. 35. Phase diagram of the system 2-methyl-1-propanol~1!—cyccurve,s—experimental results of Ref. 1,h—experimental result
References:1D. Plackov and I. Stern, Fluid Phase Equilib.57, 327 ~1990!.2T. M. Letcher, P. Siswana, and S. E. Radloff, S. Afr. J. Chem44,3D. G. Shaw, ed.,Solubility Data Series, Vol. 37, Hydrocarbons wNew York, 1989!.4A. F. M. Barton, ed.,Solubility Data Series, Vol. 15, Alcohols wi
article is copyrighted as indicated in the article. Reuse of AIP content is subject to the terms at: http://scitation.aip.org/termsconditions. Downloaded
Components: Evaluated by:
~1! 2-Methyl-1-propanol~isobutanol; isobutyl alcohol!;C4H10O; @78-83-1#~2! Cyclohexane; C6H12 ; @110-82-7#~3! Water; H2O; @7732-18-5#
A. Skrzecz, Institute of Physical Chemistry, Polish Academy ofSciences, Warsaw, Poland~1995.09!
7.2. 2-Methyl-1-propanol 1 Water 1 CyclohexaneCritical Evaluation:
A survey of reported compositions along the saturation curve~sat.! and compositions of coexisting phases in equilibrium~eq.! for thesystem 2-methyl-1-propanol–cyclohexane–water is given in Table 67.
TABLE 67. Summary of experimental data for the system 2-methyl-1-propanol–cyclohexane–water
Author~s! T/K Type of dataa Ref.
Plackov and Stern, 1990 298 sat.~14!, eq. ~7! 1
Letcheret al., 1991 298 sat.~15!, eq. ~4! 2
aNumber of experimental points in parentheses.
Saturation curveThe ternary system 2-methyl-1-propanol–cyclohexane–water forms a miscibility gap of type 2. The system was studied at 298.2 K
by titration method. Two binary systems cyclohexane–water and 2-methyl-1-propanol–water form miscibility gaps. The data of thesebinary systems were compiled and critically evaluated in previously published SDS volumes, Refs. 3 and 4, respectively. The recom-mended values of mutual solubility at 298 K are: for the cyclohexane–water systemx2951.2•1025 and x3853.7•1024,3 and for the2-methyl-1-propanol–water systemx1850.548 andx1950.0210.4 Letcheret al.2 reported ternary data and mutual solubility of the binarysystems. The end points of the saturation curve were reported to bex250.999 and pure water. This is inconsistent with the recommendedvalues but within the accuracy of the experimental measurements~0.001 mole fraction! stated by the authors. Mutual solubility data forthe 2-methyl-1-propanol–water system reported in Ref. 2 asx1850.546 andx1950.021 are consistent with the ‘‘best values’’ reported inthe critical evaluation.3 Plackov and Stern1 reported the solubility of 2-methyl-1-propanol in water,x1950.021. This result is alsoconsistent with recommended data. These experimental data are consistent with one another. Phase equilibrium data were also used toconstruct the saturation curve of the organic-rich phase. Data at 298.2 K were described by the equation:
x150.694 5910.031 38 ln~x2!20.410 19x220.293 07x22.
The model describes the region 0.01,x2,0.99. The parameters were calculated by the least-squares method. The standard error ofestimate was 0.0062. The points on the saturation curve calculated by this equation for selected concentrations of cyclohexane in themixture are presented in Table 68 and in Fig. 35 as a calculated binodal curve~solid line!.
0.5074 0.3000
0.4976 0.3200
0.4874 0.3400
0.4769 0.3600
0.4660 0.3800
0.4549 0.4000
0.4434 0.4200
0.4316 0.4400
0.4195 0.4600
0.4071 0.4800
0.3945 0.5000
0.3815 0.5200
Compositions of the water-rich phase of the ternarymixture; the analytical methods could not detect cyclohe
PhaCompositions of coexisting phases in equilibrium for
two references at 298.2 K using similar experimental prothe composition of each phase was determinated. Comppropanol–water mixture. The analytical methods could nand are consistent within each data set and with one ano2-methyl-1-propanol concentration (x1950.007), which is incould be noticed if a large scale graph were plotted. Boreported in Fig. 35.
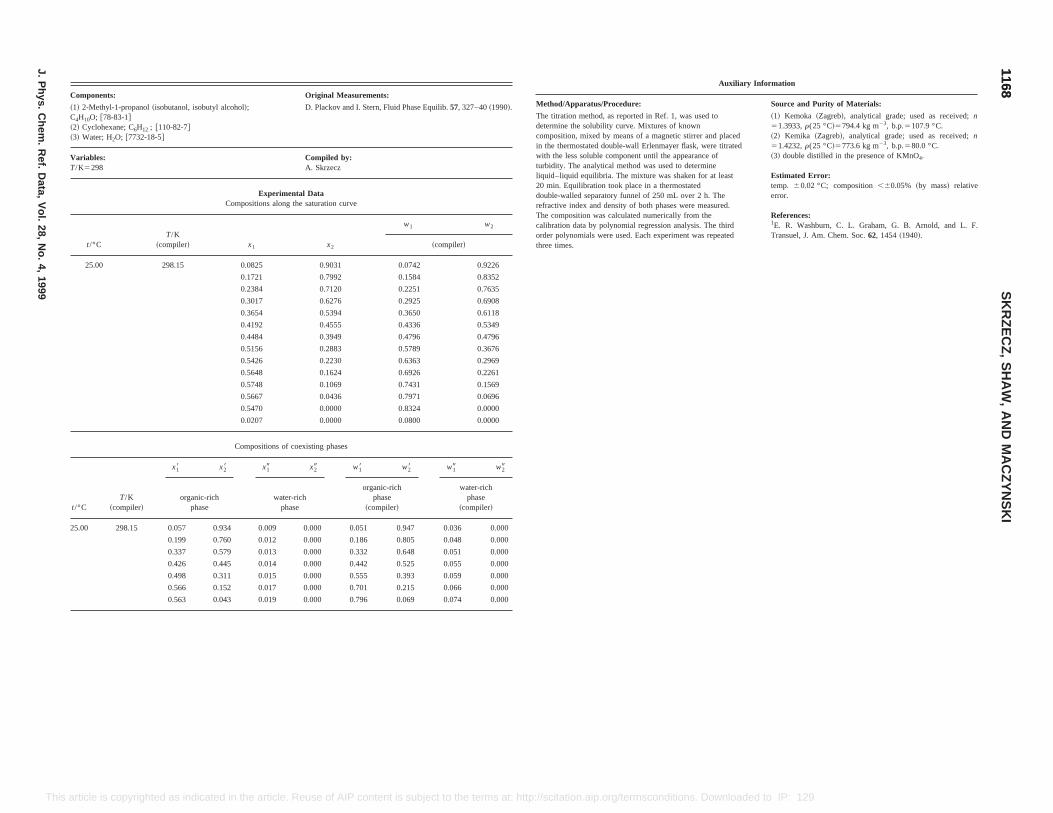
Original Measurements:
D. Plackov and I. Stern, Fluid Phase Equilib.57, 327–40~1990!.
Compiled by:A. Skrzecz
xperimental Dataons along the saturation curve
x2
w1 w2
~compiler!
25 0.9031 0.0742 0.9226
0.7992 0.1584 0.8352
0.7120 0.2251 0.7635
0.6276 0.2925 0.6908
0.5394 0.3650 0.6118
0.4555 0.4336 0.5349
0.3949 0.4796 0.4796
0.2883 0.5789 0.3676
0.2230 0.6363 0.2969
0.1624 0.6926 0.2261
0.1069 0.7431 0.1569
0.0436 0.7971 0.0696
0.0000 0.8324 0.0000
0.0000 0.0800 0.0000
itions of coexisting phases
x19 x29 w18 w28 w19 w29
water-richphase
organic-richphase
~compiler!
water-richphase
~compiler!
Auxiliary Information
Method/Apparatus/Procedure: Source and Purity of Materials:
The titration method, as reported in Ref. 1, was used todetermine the solubility curve. Mixtures of knowncomposition, mixed by means of a magnetic stirrer and placedin the thermostated double-wall Erlenmayer flask, were titratedwith the less soluble component until the appearance ofturbidity. The analytical method was used to determineliquid–liquid equilibria. The mixture was shaken for at least20 min. Equilibration took place in a thermostateddouble-walled separatory funnel of 250 mL over 2 h. Therefractive index and density of both phases were measured.The composition was calculated numerically from thecalibration data by polynomial regression analysis. The thirdorder polynomials were used. Each experiment was repeatedthree times.
~1! Kemoka ~Zagreb!, analytical grade; used as received;n51.3933,r(25 °C!5794.4 kg m23, b.p.5107.9 °C.~2! Kemika ~Zagreb!, analytical grade; used as received;n51.4232,r(25 °C!5773.6 kg m23, b.p.580.0 °C.~3! double distilled in the presence of KMnO4.
Estimated Error:temp. 60.02 °C; composition,60.05% ~by mass! relativeerror.
References:1E. R. Washburn, C. L. Graham, G. B. Arnold, and L. F.Transuel, J. Am. Chem. Soc.62, 1454~1940!.
11681168
SK
RZ
EC
Z,
SH
AW
,A
ND
MA
CZ
YN
SK
I
J.P
hys.C
hem.
Ref.
Data,
Vol.
28,N
o.4,
1999
Th sconditions. Downloaded to IP: 129.6.105.191 On: Fri, 05 Sep 2014 17:51:55
25.00 298.15 0.057 0.934 0.009 0.000 0.051 0.947 0.036 0.000
0.199 0.760 0.012 0.000 0.186 0.805 0.048 0.000
0.337 0.579 0.013 0.000 0.332 0.648 0.051 0.000
0.426 0.445 0.014 0.000 0.442 0.525 0.055 0.000
0.498 0.311 0.015 0.000 0.555 0.393 0.059 0.000
0.566 0.152 0.017 0.000 0.701 0.215 0.066 0.000
0.563 0.043 0.019 0.000 0.796 0.069 0.074 0.000
is article is copyrighted as indicated in the article. Reuse of AIP content is subject to the terms at: http://scitation.aip.org/term
Components:
~1! 2-Methyl-1-propanol~isobutanol, isobutyl alcohol!;C4H10O; @78-83-1#~2! Cyclohexane; C6H12 ; @110-82-7#~3! Water; H2O; @7732-18-5#
Variables:T/K5298
ECompositi
t/°CT/K
~compiler! x1
25.00 298.15 0.08
0.1721
0.2384
0.3017
0.3654
0.4192
0.4484
0.5156
0.5426
0.5648
0.5748
0.5667
0.5470
0.0207
Compos
t/°CT/K
~compiler!
x18 x28
organic-richphase

Original Measurements:
T. M. Letcher, P. Siswana, and S. E. Radloff, S. Afr. J. Chem.44, 118–21~1991!.
Compiled by:A. Skrzecz
ental Datag the saturation curve
x2
w1 w2
~compiler!
0.000 0.000 0.000
0.000 0.081 0.000
0.000 0.832 0.000
0.009 0.827 0.015
0.042 0.803 0.067
0.127 0.729 0.181
0.211 0.654 0.281
0.304 0.571 0.381
0.405 0.483 0.483
0.513 0.391 0.585
0.629 0.295 0.689
0.752 0.198 0.794
0.874 0.099 0.897
0.937 0.049 0.949
0.999 0.0000 0.9998
f coexisting phases
x29 w18 w28 w19 w29
r-richase
organic-richphase
~compiler!
water-richphase
~compiler!
Auxiliary Information
Method/Apparatus/Procedure: Source and Purity of Materials:
The points on the binodal curve were determined by thetitration method, as described in Ref. 1. The formation of acloudy mixture was observed visually on shaking afteraddition of a known mass of the third component; syringeswere precisely weighed. Tie line compositions weredetermined by the refractive index method,2 and acomplementary method using the Karl Fischer titration.3
Measurements were made at pressure of 94.7 kPa.
~1! Merck; AR grade; dried by addition of anhydrous K2CO3,distilled; purity . 99.9 mole % by glc.~2! BDH; Gold label grade; used as received; purity. 99.9 mole% by glc.~3! not specified.
Estimated Error:composition6 0.005 mole fraction~binodal curve!, 60.01 molefraction ~tie lines!.
Reference1T. M. Letcher, S. Wootten, B. Shuttleworth, and C. Heyward, J.Chem. Thermodyn.18, 1037~1986!.2S. W. Briggs and E. W. Comings, Ind. Eng. Chem.35, 411~1943!.3T. M. Letcher, P. Siswana, P. van der Watt, and S. Radloff, J.Chem. Thermodyn.21, 1053~1989!.
11691169
IUP
AC
-NIS
TS
OLU
BILIT
YD
AT
AS
ER
IESJ.P
hys.C
hem.
Ref.
Data,
Vol.
28,N
o.4,
1999
This /termsconditions. Downloaded to IP: 129.6.105.191 On: Fri, 05 Sep 2014 17:51:55
25.0 298.2 0.546 0.000 0.021 0.000 0.832 0.000 0.081 0.000
0.580 0.086 0.018 0.000 0.764 0.129 0.070 0.000
0.467 0.395 0.014 0.000 0.492 0.473 0.055 0.000
0.330 0.592 0.007 0.000 0.323 0.658 0.028 0.000
article is copyrighted as indicated in the article. Reuse of AIP content is subject to the terms at: http://scitation.aip.org
Components:
~1! 2-Methyl-1-propanol~isobutanol, isobutyl alcohol!;C4H10O; @78-83-1#~2! Cyclohexane; C6H12 ; @110-82-7#~3! Water; H2O; @7732-18-5#
Variables:T/K5298
ExperimCompositions alon
t/°C~compiler! T/K x1
25.0 298.2 0.000
0.021
0.546
0.555
0.574
0.579
0.558
0.517
0.460
0.389
0.306
0.213
0.110
0.055
0.000
Compositions o
t/°C~compiler! T/K
x18 x28 x19
organic-richphase
wateph
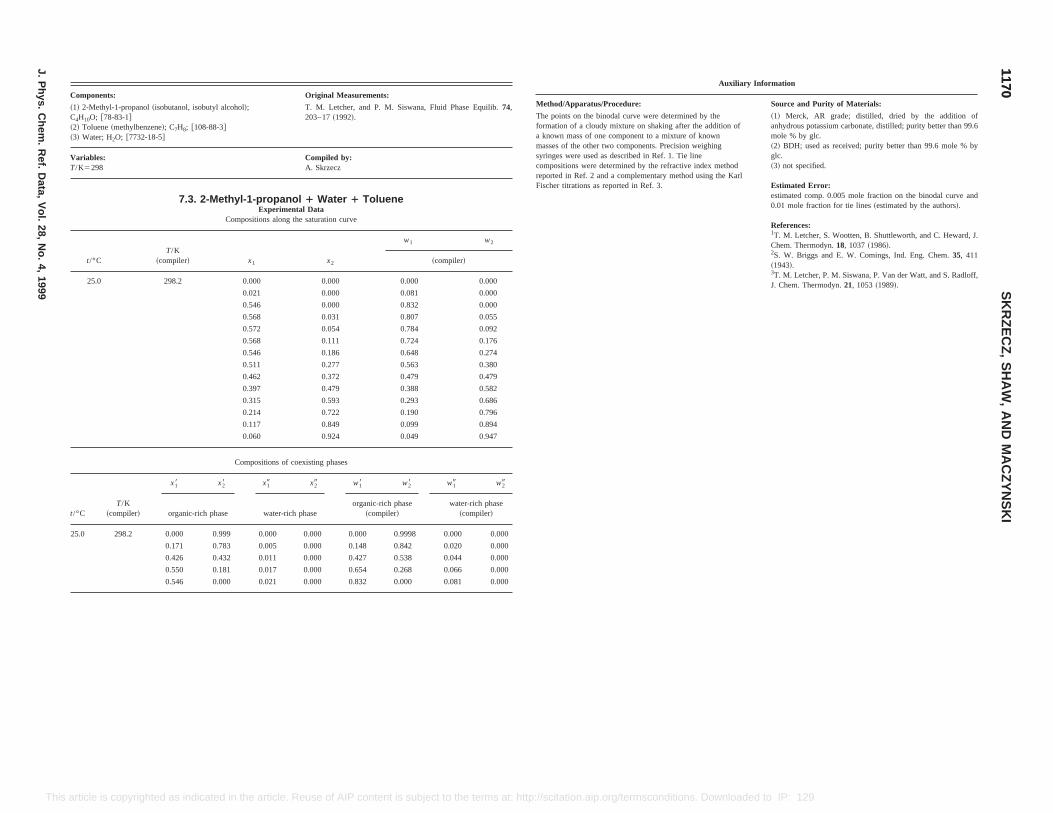
Original Measurements:
T. M. Letcher, and P. M. Siswana, Fluid Phase Equilib.74,203–17~1992!.
Compiled by:A. Skrzecz
1 Water 1 Tolueneal Datathe saturation curve
x2
w1 w2
~compiler!
0.000 0.000 0.000
0.000 0.081 0.000
0.000 0.832 0.000
0.031 0.807 0.055
0.054 0.784 0.092
0.111 0.724 0.176
0.186 0.648 0.274
0.277 0.563 0.380
0.372 0.479 0.479
0.479 0.388 0.582
0.593 0.293 0.686
0.722 0.190 0.796
0.849 0.099 0.894
0.924 0.049 0.947
oexisting phases
x29 w18 w28 w19 w29
h phaseorganic-rich phase
~compiler!water-rich phase
~compiler!
Auxiliary Information
Method/Apparatus/Procedure: Source and Purity of Materials:
The points on the binodal curve were determined by theformation of a cloudy mixture on shaking after the addition ofa known mass of one component to a mixture of knownmasses of the other two components. Precision weighingsyringes were used as described in Ref. 1. Tie linecompositions were determined by the refractive index methodreported in Ref. 2 and a complementary method using the KarlFischer titrations as reported in Ref. 3.
~1! Merck, AR grade; distilled, dried by the addition ofanhydrous potassium carbonate, distilled; purity better than 99.6mole % by glc.~2! BDH; used as received; purity better than 99.6 mole % byglc.~3! not specified.
Estimated Error:estimated comp. 0.005 mole fraction on the binodal curve and0.01 mole fraction for tie lines~estimated by the authors!.
References:1T. M. Letcher, S. Wootten, B. Shuttleworth, and C. Heward, J.Chem. Thermodyn.18, 1037~1986!.2S. W. Briggs and E. W. Comings, Ind. Eng. Chem.35, 411~1943!.3T. M. Letcher, P. M. Siswana, P. Van der Watt, and S. Radloff,J. Chem. Thermodyn.21, 1053~1989!.
11701170
SK
RZ
EC
Z,
SH
AW
,A
ND
MA
CZ
YN
SK
I
J.P
hys.C
hem.
Ref.
Data,
Vol.
28,N
o.4,
1999
This rg/termsconditions. Downloaded to IP: 129.6.105.191 On: Fri, 05 Sep 2014 17:51:55
25.0 298.2 0.000 0.999 0.000 0.000 0.000 0.9998 0.000 0.000
0.171 0.783 0.005 0.000 0.148 0.842 0.020 0.000
0.426 0.432 0.011 0.000 0.427 0.538 0.044 0.000
0.550 0.181 0.017 0.000 0.654 0.268 0.066 0.000
0.546 0.000 0.021 0.000 0.832 0.000 0.081 0.000
article is copyrighted as indicated in the article. Reuse of AIP content is subject to the terms at: http://scitation.aip.o
Components:
~1! 2-Methyl-1-propanol~isobutanol, isobutyl alcohol!;C4H10O; @78-83-1#~2! Toluene~methylbenzene!; C7H8; @108-88-3#~3! Water; H2O; @7732-18-5#
Variables:T/K5298
7.3. 2-Methyl-1-propanolExperiment
Compositions along
t/°CT/K
~compiler! x1
25.0 298.2 0.000
0.021
0.546
0.568
0.572
0.568
0.546
0.511
0.462
0.397
0.315
0.214
0.117
0.060
Compositions of c
t/°CT/K
~compiler!
x18 x28 x19
organic-rich phase water-ric

Original Measurements:
T. M. Letcher, P. M. Siswana, P. van der Watt, and S. Radloff,J. Chem. Thermodyn.21, 1053–60~1989!.
Compiled by:A. Skrzecz
l 1 Water 1 p-Xyleneental Datang the saturation curve
x2
w1 w2
~compiler!
0.998 0.000 0.9997
0.916 0.050 0.948
0.843 0.100 0.896
0.695 0.198 0.791
0.561 0.295 0.686
0.444 0.387 0.583
0.247 0.565 0.377
0.167 0.646 0.277
0.105 0.714 0.188
0.011 0.830 0.023
0.000 0.833 0.000
0.000 0.081 0.000
f coexisting phases
x29 w18 w28 w19 w29
r-richase
organic-richphase
~compiler!
water-richphase
~compiler!
1 0.000 0.833 0.000 0.081 0.000
0.000 0.529 0.419 0.055 0.000
0.000 0.205 0.784 0.032 0.000
0.000 0.000 0.9997 0.000 0.000
Information
Source and Purity of Materials:
A
was
~1! source not specified; used as received.~2! source not specified; recrystallized three times.~3! not specified.
Estimated Error:comp. ,0.005 mole fraction~estimated authors’ precision onbinodal curve!, ,0.01 mole fraction ~estimated authors’precision of tie lines!.
References:1T. M. Letcher, S. Wootten, B. Shuttleworth, and C. Heyward, J.Chem. Thermodyn.18, 1037~1986!.
11711171
IUP
AC
-NIS
TS
OLU
BILIT
YD
AT
AS
ER
IESJ.P
hys.C
hem.
Ref.
Data,
Vol.
28,N
o.4,
1999
This ed to IP: 129.6.105.191 On: Fri, 05 Sep 2014 17:51:55
t/°C ~compiler! organic-rich phase water-rich phase ~compiler! ~compiler!
25.0 298.2 0.595 0.111 0.018 0.000 0.731 0.181 0.070 0.0000.549 0.271 0.015 0.000 0.577 0.377 0.059 0.0000.424 0.480 0.010 0.000 0.391 0.587 0.040 0.000
Auxiliary Information
Method/Apparatus/Procedure: Source and Purity of Materials:
The experimental methods have been described in Ref. 1. Nomore details were reported in the paper.
~1! source not specified.~2! Aldrich; distilled; purity .99.8 mole % by glc, r50.692 65 gcm23.~3! not specified.
Estimated Error:Not reported.
References:1T. M. Letcher and P. M. Siswana, Fluid Phase Equilib.74, 203~1992!.
25.0 298.2 0.548 0.000 0.02
0.510 0.282 0.014
0.257 0.685 0.008
0.000 0.998 0.000
Auxiliary
Method/Apparatus/Procedure:
The titration method was used to determine binodal curve.binary mixture of known composition was titrated with thethird component until cloudiness was observed. Tie linecompositions were related to the coexistence curve; waterdetermined by the Karl Fischer titration. The methods weredescribed in Ref. 1.
article is copyrighted as indicated in the article. Reuse of AIP content is subject to the terms at: http://scitation.aip.org/termsconditions. Download
Components: Original Measurements:
~1! 2-Methyl-1-propanol~isobutanol, isobutyl alcohol!;C4H10O; @78-83-1#~2! 1-Heptene; C7H14; @592-76-7#~3! Water; H2O, @7732-18-5#
T. M. Letcher, B. C. Bricknell, J. D. Sewry, and S. E. Radloff, J.Chem. Eng. Data39, 320–3~1994!.
Variables:T/K5298
Compiled by:A. Skrzecz
7.4. 2-Methyl-1-propanol 1 Water 1 1-HepteneExperimental Data
Compositions along the saturation curve
t/°CT/K
~compiler! x1 x2
w1 w2
~compiler!
25.0 298.2 0.000 1.000 0.000 1.0000.134 0.848 0.106 0.8900.235 0.725 0.195 0.7970.365 0.565 0.323 0.6620.450 0.440 0.425 0.5500.492 0.372 0.483 0.4840.519 0.326 0.525 0.4370.540 0.285 0.562 0.3930.560 0.239 0.605 0.3420.576 0.201 0.643 0.2970.587 0.162 0.680 0.2490.596 0.121 0.722 0.1940.599 0.106 0.738 0.1730.594 0.071 0.772 0.1220.584 0.043 0.798 0.0780.548 0.000 0.833 0.0000.021 0.000 0.081 0.0000.000 0.000 0.000 0.000
Compositions of coexisting phases
T/K
x18 x28 x19 x29 w18 w28 w19 w29
organic-rich phase water-rich phase
Components:
~1! 2-Methyl-1-propanol~isobutanol, isobutyl alcohol!;C4H10O; @78-83-1#~2! p-Xylene ~1,4-dimethylbenzene, 1,4-xylene!; C8H10;@106-42-3#~3! Water; H2O; @7732-18-5#
Variables:T/K5298
7.5. 2-Methyl-1-propanoExperim
Compositions alo
t/°C~compiler! T/K x1
25.0 298.2 0.000
0.069
0.135
0.249
0.345
0.422
0.530
0.558
0.571
0.572
0.548
0.021
Compositions o
t/°C~compiler! T/K
x18 x28 x19
organic-richphase
wateph

Original Measurements:
T. M. Letcher and P. M. Siswana, Fluid Phase Equilib.74, 203–17 ~1992!.
Compiled by:A. Skrzecz
1 Water 1 Mesitylenetal Datathe saturation curve
x2
w1 w2
~compiler!
0.000 0.000 0.000
0.000 0.081 0.000
0.000 0.832 0.000
0.021 0.805 0.049
0.089 0.719 0.180
0.150 0.646 0.276
0.226 0.566 0.378
0.311 0.479 0.479
0.413 0.387 0.583
0.531 0.294 0.687
0.670 0.198 0.792
0.825 0.100 0.896
0.906 0.050 0.948
0.999 0.000 0.9998
oexisting phases
t/°C ~compiler!
x29 w18 w28 w19 w29
organic-rich phaserich
phase
organic-richphase
~compiler!water-rich phase
~compiler!
2
Auxiliary Information
Method/Apparatus/Procedure: Source and Purity of Materials:
The points on the binodal curve were determined by theformation of a cloudy mixture on shaking after the addition ofa known mass of one component to a mixture of knownmasses of the other two components. Precision weighingsyringes were used as described in Ref. 1. Tie linecompositions were determined by the refractive index methodreported in Ref. 2 and a complementary method using the KarlFischer titrations as reported in Ref. 3.
~1! Merck, AR grade; distilled, dried by the addition ofanhydrous potassium carbonate, distilled; purity better than 99.6mole % by glc.~2! BDH; used as received; purity better than 99.6 mole % byglc.~3! not specified.
Estimated Error:estimated comp. 0.005 mole fraction on the binodal curve and0.01 mole fraction for tie lines~estimated by the authors!.
Referencs:1T. M. Letcher, S. Wootten, B. Shuttleworth, and C.Heward, J. Chem. Thermodyn.18, 1037~1986!.2S. W. Briggs and E. W. Comings, Ind. Eng. Chem.35, 411~1943!.3T. M. Letcher, P. M. Siswana, P. Van der Watt, and S. Radolff,J. Chem. Thermodyn.21, 1053~1989!.
11721172
SK
RZ
EC
Z,
SH
AW
,A
ND
MA
CZ
YN
SK
I
J.P
hys.C
hem.
Ref.
Data,
Vol.
28,N
o.4,
1999
This a /termsconditions. Downloaded to IP: 129.6.105.191 On: Fri, 05 Sep 2014 17:51:55
5.0 298.2 0.000 0.999 0.000 0.000 0.000 0.9998 0.000 0.000
0.205 0.752 0.007 0.000 0.143 0.850 0.028 0.000
0.382 0.509 0.011 0.000 0.310 0.669 0.044 0.000
0.503 0.312 0.016 0.000 0.477 0.480 0.063 0.000
0.546 0.000 0.021 0.000 0.832 0.000 0.081 0.000
rticle is copyrighted as indicated in the article. Reuse of AIP content is subject to the terms at: http://scitation.aip.org
Components:
~1! 2-Methyl-1-propanol~isobutanol, isobutyl alcohol!;C4H10O; @78-83-1#~2! Mesitylene~1,3,5-trimethylbenzene!; C9H12; @108-67-8#~3! Water; H2O; @7732-18-5#
Variables:T/K5298
7.6. 2-Methyl-1-propanolExperimen
Compositions along
t/°CT/K
~compiler! x1
25.0 298.2 0.000
0.021
0.546
0.560
0.577
0.568
0.549
0.504
0.445
0.368
0.271
0.149
0.077
0.000
Compositions of c
T/K
x18 x28 x19
water-

. Tyvina, V..Leningrad!.Leningrad!
w2
0.0032
0.0136
0.0091
0.0091
0.0248
0.0120
0.0150
0.0157
0.0460
0.0220
0.0230
0.0314
0.0401
0.0401
0.0828
0.0791
0.0791
0.1011
0.1481
0.3504
Compositions of coexisting phases
t/°CT/K
~compiler!
x18 x28 x19 x29 w18 w28 w19 w29
p/kPahydrocarbon-
rich phasewater-
rich phase
hydrocarbon-rich phase~compiler!
water-rich phase~compiler!
80 353.2 0.0000 0.9916 0.0000 0.000 27 0.0000 0.9973 0.000 00 0.000 84 1200
0.0149 0.9753 0.0019 0.000 27 0.0197 0.9771 0.007 77 0.000 84 1160
0.0615 0.9123 0.0068 0.000 30 0.0811 0.9105 0.027 38 0.000 91 1080
0.3384 0.0709 0.0452 0.000 73 0.6318 0.1002 0.162 80 0.001 99 690
0.1389 0.0070 0.1389 0.0070 0.3948 0.0151 0.3948 0.0151 390a
138 411.2 0.0000 0.9575 0.000 00 0.000 58 0.0000 0.9859 0.000 00 0.001 80 3790
0.1068 0.8255 0.003 90 0.000 58 0.1428 0.8352 0.015 83 0.001 78 3230
0.4102 0.3232 0.015 80 0.007 60 0.5700 0.3400 0.061 02 0.022 22 2450
0.3323 0.0584 0.042 50 0.001 09 0.6334 0.0843 0.154 11 0.002 99 1530
0.1389 0.0070 0.1389 0.0070 0.3948 0.0151 0.3948 0.0151 1000a
154 427.2 0.1396 0.0093 0.1396 0.0093 0.3949 0.0199 0.3949 0.0199 1840a
180 453.2 0.1384 0.0141 0.1384 0.0141 0.3898 0.0301 0.3898 0.0301 2500a
aPlait point.
Auxiliary Information
Method/Apparatus/Procedure: Source and Purity of Materials:
The synthetic method with glass ampoules, described in Ref.1, was used to visually determine the phase transition~mass ofcomponents in the vapor phase was neglected!. Temperaturewas measured with a mercury thermometer. Compositions ofcoexisting phases in equilibrium~two liquids and vapor! weredetermined in a static apparatus. The liquid phases wereanalyzed by glc.~The pressure was reported during themeasurements at temperatures higher than 353.2 K!.
~1! source not specified.~2! source not specified.~3! not specified.
Estimated Error:temp. 60.2 °C ~saturation curve! and 60.5 °C ~phaseequilibrium!.
References:1C. M. Khodeeva, and E. C. Lebedeva, Zh. Fiz. Khim.40, 3105~1966!.
11731173
IUP
AC
-NIS
TS
OLU
BILIT
YD
AT
AS
ER
IESJ.P
hys.C
hem.
Ref.
Data,
Vol.
28,N
o.4,
1999
This oaded to IP: 129.6.105.191 On: Fri, 05 Sep 2014 17:51:55
143.0 416.15 0.3780 0.4415 0.5000 0.4420
180.0 453.15 0.3152 0.4680 0.4365 0.4906
Compositions of coexisting phases
t/°CT/K
~compiler!
x18 x28 x19 x29 w18 w28 w19 w29
hydrocarbon-rich phase
water-rich phase
hydrocarbon-rich phase~compiler!
water-rich phase~compiler!
20 293.2 0.000 00 0.999 906 0.000 00 0.000 23 0.000 00 0.999 97 0.000 00 0.000 72
0.000 70 0.998 10 0.002 90 0.000 23 0.000 93 0.998 69 0.011 82 0.000 71
0.0204 0.9774 0.010 80 0.000 27 0.0268 0.9725 0.042 97 0.000 81
0.0347 0.9624 0.016 00 0.000 27 0.0454 0.9536 0.062 67 0.000 80
0.1389 0.0070 0.1389 0.0070 0.3948 0.0151 0.3948 0.0151a
40 313.2 0.1389 0.0070 0.1389 0.0070 0.3948 0.0151 0.3948 0.0151a
article is copyrighted as indicated in the article. Reuse of AIP content is subject to the terms at: http://scitation.aip.org/termsconditions. Downl
8. 2-Methyl-2-propanol 1Water
Components: Original Measurements:
~1! 2-Methyl-2-propanol~tert-butanol, tert-butyl alcohol!;C4H10O; @75-65-0#~2! 1-Butene; C4H8; @106-98-9#~3! Water; H2O; @7732-18-5#
I. I. Vasileva, A. A. Naymova, A. A. Polyakov, T. NV. Fokina, and N. G. Khrabrova, Zh. Prikl. Khim~63, 1432-6 1990.@Eng. transl. Russ. J. Appl. Chem~63, 589–95~1990!#.
Variables:T/K52932453
Compiled by:A. Skrzecz
8.1. 2-Methyl-2-propanol 1 Water 1 1-ButeneExperimental Data
Compositions along the saturation curve
t/°CT/K
~compiler! x1 x2
w1
~compiler!
48.0 321.15 0.0582 0.0012 0.2023
174.6 447.75 0.0944 0.0057 0.2974
137.8 410.95 0.1030 0.0039 0.3189
10.0 283.15 0.1034 0.0039 0.3198
180.8 453.95 0.1156 0.0110 0.3438
126.2 399.35 0.1161 0.0053 0.3480
136.4 409.55 0.1399 0.0070 0.3968
39.0 312.15 0.1399 0.0073 0.3967
182.0 455.15 0.1652 0.0231 0.4348
133.8 406.95 0.1662 0.0109 0.4438
40.5 313.65 0.1664 0.0114 0.4439
138.6 411.75 0.2155 0.0172 0.5193
79.9 353.05 0.2542 0.0237 0.5679
107.0 380.15 0.2542 0.0237 0.5679
129.2 402.35 0.3220 0.0564 0.6243
118.0 391.15 0.3271 0.0542 0.6309
57.0 330.15 0.3271 0.0542 0.6309
100.0 373.15 0.3559 0.0735 0.6468
135.6 408.75 0.3875 0.1167 0.6498
105.0 378.15 0.4374 0.3487 0.5806
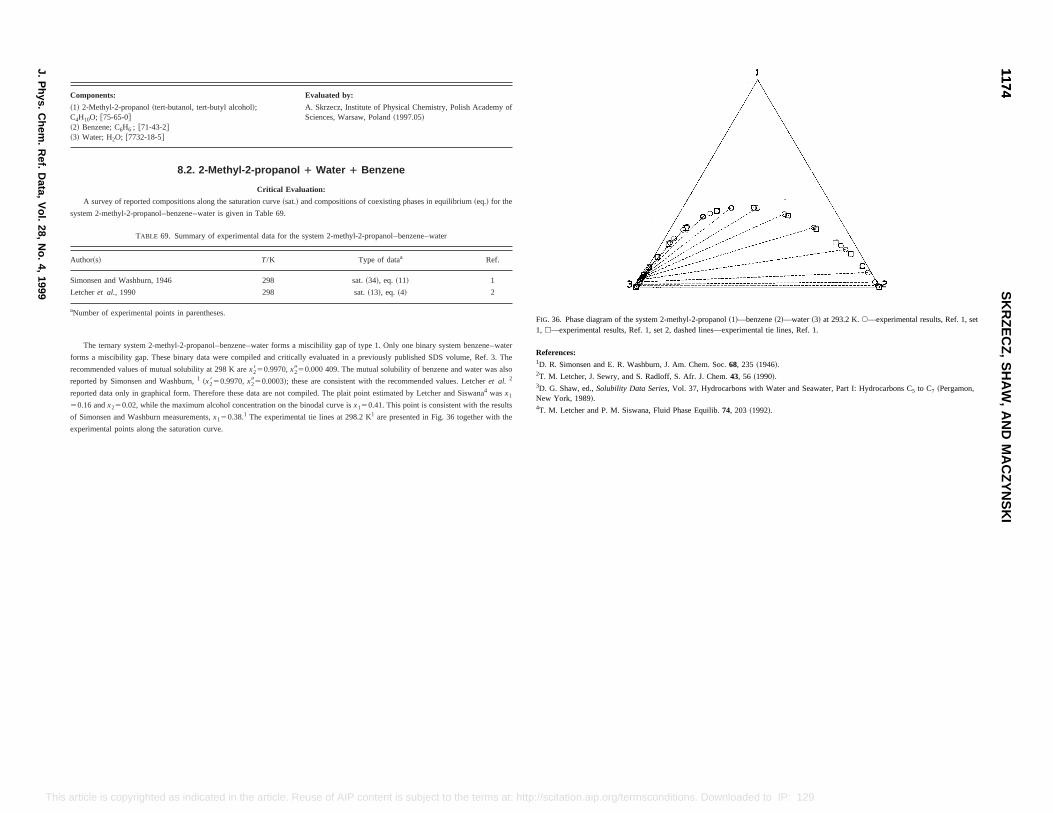
emistry, Polish Academy of
s in equilibrium~eq.! for the
zene–water
Ref.
1
2
ne binary system benzene–water
lished SDS volume, Ref. 3. The
enzene and water was also
nded values. Letcheret al. 2
by Letcher and Siswana4 wasx1
consistent with the results
n Fig. 36 together with the
FIG. 36. Phase diagram of the system 2-methyl-2-propanol~1!—benzene~2!—water~3! at 293.2 K.s—experimental results, Ref. 1, set1, h—experimental results, Ref. 1, set 2, dashed lines—experimental tie lines, Ref. 1.
References:1D. R. Simonsen and E. R. Washburn, J. Am. Chem. Soc.68, 235 ~1946!.2T. M. Letcher, J. Sewry, and S. Radloff, S. Afr. J. Chem.43, 56 ~1990!.3D. G. Shaw, ed.,Solubility Data Series, Vol. 37, Hydrocarbons with Water and Seawater, Part I: Hydrocarbons C5 to C7 ~Pergamon,New York, 1989!.4T. M. Letcher and P. M. Siswana, Fluid Phase Equilib.74, 203 ~1992!.
11741174
SK
RZ
EC
Z,
SH
AW
,A
ND
MA
CZ
YN
SK
I
J.P
hys.C
hem.
Ref.
Data,
Vol.
28,N
o.4,
1999
This e terms at: http://scitation.aip.org/termsconditions. Downloaded to IP: 129.6.105.191 On: Fri, 05 Sep 2014 17:51:55
article is copyrighted as indicated in the article. Reuse of AIP content is subject to thComponents: Evaluated by:
~1! 2-Methyl-2-propanol~tert-butanol, tert-butyl alcohol!;C4H10O; @75-65-0#~2! Benzene; C6H6 ; @71-43-2#~3! Water; H2O; @7732-18-5#
A. Skrzecz, Institute of Physical ChSciences, Warsaw, Poland~1997.05!
8.2. 2-Methyl-2-propanol 1 Water 1 Benzene
Critical Evaluation:
A survey of reported compositions along the saturation curve~sat.! and compositions of coexisting phase
system 2-methyl-2-propanol–benzene–water is given in Table 69.
TABLE 69. Summary of experimental data for the system 2-methyl-2-propanol–ben
Author~s! T/K Type of dataa
Simonsen and Washburn, 1946 298 sat.~34!, eq. ~11!
Letcheret al., 1990 298 sat.~13!, eq. ~4!
aNumber of experimental points in parentheses.
The ternary system 2-methyl-2-propanol–benzene–water forms a miscibility gap of type 1. Only o
forms a miscibility gap. These binary data were compiled and critically evaluated in a previously pub
recommended values of mutual solubility at 298 K arex2850.9970,x2950.000 409. The mutual solubility of b
reported by Simonsen and Washburn,1 ~x2850.9970,x2950.0003!; these are consistent with the recomme
reported data only in graphical form. Therefore these data are not compiled. The plait point estimated
50.16 andx250.02, while the maximum alcohol concentration on the binodal curve isx150.41. This point is
of Simonsen and Washburn measurements,x150.38.1 The experimental tie lines at 298.2 K1 are presented i
experimental points along the saturation curve.
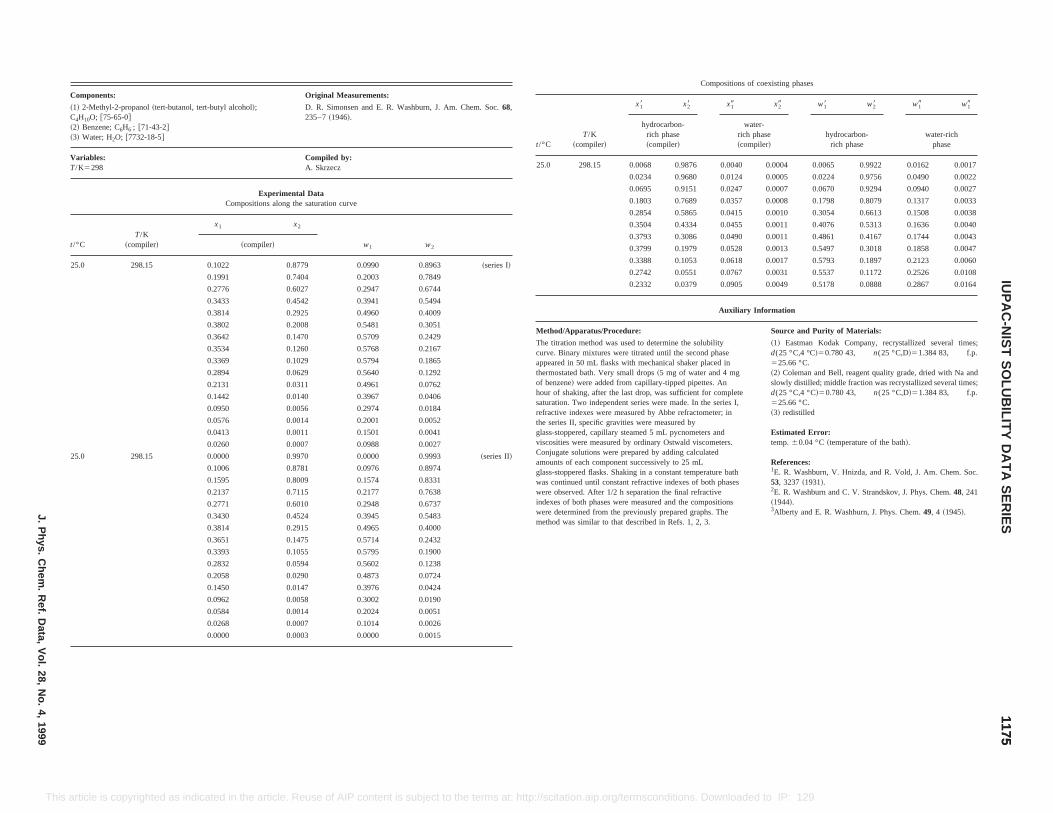
Compositions of coexisting phases
t/°CT/K
~compiler!
x18 x28 x19 x29 w18 w28 w19 w19
hydrocarbon-rich phase~compiler!
water-rich phase~compiler!
hydrocarbon-rich phase
water-richphase
25.0 298.15 0.0068 0.9876 0.0040 0.0004 0.0065 0.9922 0.0162 0.0017
0.0234 0.9680 0.0124 0.0005 0.0224 0.9756 0.0490 0.0022
0.0695 0.9151 0.0247 0.0007 0.0670 0.9294 0.0940 0.0027
0.1803 0.7689 0.0357 0.0008 0.1798 0.8079 0.1317 0.0033
0.2854 0.5865 0.0415 0.0010 0.3054 0.6613 0.1508 0.0038
0.3504 0.4334 0.0455 0.0011 0.4076 0.5313 0.1636 0.0040
0.3793 0.3086 0.0490 0.0011 0.4861 0.4167 0.1744 0.0043
0.3799 0.1979 0.0528 0.0013 0.5497 0.3018 0.1858 0.0047
0.3388 0.1053 0.0618 0.0017 0.5793 0.1897 0.2123 0.0060
0.2742 0.0551 0.0767 0.0031 0.5537 0.1172 0.2526 0.0108
0.2332 0.0379 0.0905 0.0049 0.5178 0.0888 0.2867 0.0164
Auxiliary Information
Method/Apparatus/Procedure: Source and Purity of Materials:
The titration method was used to determine the solubilitycurve. Binary mixtures were titrated until the second phaseappeared in 50 mL flasks with mechanical shaker placed inthermostated bath. Very small drops~5 mg of water and 4 mgof benzene! were added from capillary-tipped pipettes. Anhour of shaking, after the last drop, was sufficient for completesaturation. Two independent series were made. In the series I,refractive indexes were measured by Abbe refractometer; inthe series II, specific gravities were measured byglass-stoppered, capillary steamed 5 mL pycnometers andviscosities were measured by ordinary Ostwald viscometers.Conjugate solutions were prepared by adding calculatedamounts of each component successively to 25 mLglass-stoppered flasks. Shaking in a constant temperature bathwas continued until constant refractive indexes of both phaseswere observed. After 1/2 h separation the final refractiveindexes of both phases were measured and the compositionswere determined from the previously prepared graphs. Themethod was similar to that described in Refs. 1, 2, 3.
~1! Eastman Kodak Company, recrystallized several times;d(25 °C,4 °C!50.780 43, n(25 °C,D!51.384 83, f.p.525.66 °C.~2! Coleman and Bell, reagent quality grade, dried with Na andslowly distilled; middle fraction was recrystallized several times;d(25 °C,4 °C!50.780 43, n(25 °C,D!51.384 83, f.p.525.66 °C.~3! redistilled
Estimated Error:temp.60.04 °C~temperature of the bath!.
References:1E. R. Washburn, V. Hnizda, and R. Vold, J. Am. Chem. Soc.53, 3237~1931!.2E. R. Washburn and C. V. Strandskov, J. Phys. Chem.48, 241~1944!.3Alberty and E. R. Washburn, J. Phys. Chem.49, 4 ~1945!.
11751175
IUP
AC
-NIS
TS
OLU
BILIT
YD
AT
AS
ER
IESJ.P
hys.C
hem.
Ref.
Data,
Vol.
28,N
o.4,
1999
This ditions. Downloaded to IP: 129.6.105.191 On: Fri, 05 Sep 2014 17:51:55
0.3814 0.2915 0.4965 0.4000
0.3651 0.1475 0.5714 0.2432
0.3393 0.1055 0.5795 0.1900
0.2832 0.0594 0.5602 0.1238
0.2058 0.0290 0.4873 0.0724
0.1450 0.0147 0.3976 0.0424
0.0962 0.0058 0.3002 0.0190
0.0584 0.0014 0.2024 0.0051
0.0268 0.0007 0.1014 0.0026
0.0000 0.0003 0.0000 0.0015
article is copyrighted as indicated in the article. Reuse of AIP content is subject to the terms at: http://scitation.aip.org/termscon
Components: Original Measurements:
~1! 2-Methyl-2-propanol~tert-butanol, tert-butyl alcohol!;C4H10O; @75-65-0#~2! Benzene; C6H6 ; @71-43-2#~3! Water; H2O; @7732-18-5#
D. R. Simonsen and E. R. Washburn, J. Am. Chem. Soc.68,235–7~1946!.
Variables:T/K5298
Compiled by:A. Skrzecz
Experimental DataCompositions along the saturation curve
t/°CT/K
~compiler!
x1 x2
w1 w2~compiler!
25.0 298.15 0.1022 0.8779 0.0990 0.8963 ~series I!
0.1991 0.7404 0.2003 0.7849
0.2776 0.6027 0.2947 0.6744
0.3433 0.4542 0.3941 0.5494
0.3814 0.2925 0.4960 0.4009
0.3802 0.2008 0.5481 0.3051
0.3642 0.1470 0.5709 0.2429
0.3534 0.1260 0.5768 0.2167
0.3369 0.1029 0.5794 0.1865
0.2894 0.0629 0.5640 0.1292
0.2131 0.0311 0.4961 0.0762
0.1442 0.0140 0.3967 0.0406
0.0950 0.0056 0.2974 0.0184
0.0576 0.0014 0.2001 0.0052
0.0413 0.0011 0.1501 0.0041
0.0260 0.0007 0.0988 0.0027
25.0 298.15 0.0000 0.9970 0.0000 0.9993 ~series II!
0.1006 0.8781 0.0976 0.8974
0.1595 0.8009 0.1574 0.8331
0.2137 0.7115 0.2177 0.7638
0.2771 0.6010 0.2948 0.6737
0.3430 0.4524 0.3945 0.5483
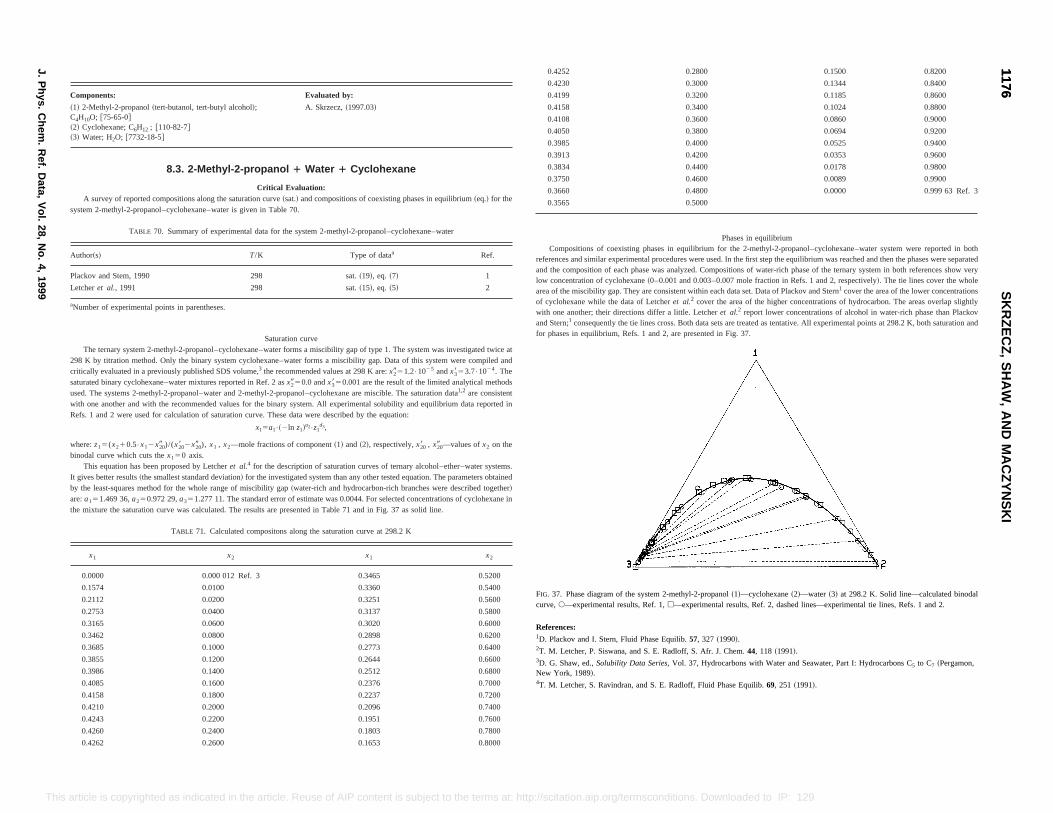
0.1500 0.8200
0.1344 0.8400
0.1185 0.8600
0.1024 0.8800
0.0860 0.9000
0.0694 0.9200
0.0525 0.9400
0.0353 0.9600
0.0178 0.9800
0.0089 0.9900
0.0000 0.999 63 Ref. 3
Phases in equilibriumium for the 2-methyl-2-propanol–cyclohexane–water system were reported in bothre used. In the first step the equilibrium was reached and then the phases were separated
. Compositions of water-rich phase of the ternary system in both references show very3–0.007 mole fraction in Refs. 1 and 2, respectively!. The tie lines cover the wholein each data set. Data of Plackov and Stern1 cover the area of the lower concentrationsr the area of the higher concentrations of hydrocarbon. The areas overlap slightlycheret al.2 report lower concentrations of alcohol in water-rich phase than Plackovata sets are treated as tentative. All experimental points at 298.2 K, both saturation andented in Fig. 37.
clohexane~2!—water ~3! at 298.2 K. Solid line—calculated binodal, Ref. 2, dashed lines—experimental tie lines, Refs. 1 and 2.
., 118 ~1991!.
with Water and Seawater, Part I: Hydrocarbons C5 to C7 ~Pergamon,
Equilib.69, 251 ~1991!.
11761176
SK
RZ
EC
Z,
SH
AW
,A
ND
MA
CZ
YN
SK
I
J.P
hys.C
hem.
Ref.
Data,
Vol.
28,N
o.4,
1999
This d to IP: 129.6.105.191 On: Fri, 05 Sep 2014 17:51:55
TABLE 71. Calculated compositons along the saturation curve at 298.2 K
x1 x2 x1 x2
0.0000 0.000 012 Ref. 3 0.3465 0.5200
0.1574 0.0100 0.3360 0.5400
0.2112 0.0200 0.3251 0.5600
0.2753 0.0400 0.3137 0.5800
0.3165 0.0600 0.3020 0.6000
0.3462 0.0800 0.2898 0.6200
0.3685 0.1000 0.2773 0.6400
0.3855 0.1200 0.2644 0.6600
0.3986 0.1400 0.2512 0.6800
0.4085 0.1600 0.2376 0.7000
0.4158 0.1800 0.2237 0.7200
0.4210 0.2000 0.2096 0.7400
0.4243 0.2200 0.1951 0.7600
0.4260 0.2400 0.1803 0.7800
0.4262 0.2600 0.1653 0.8000
FIG. 37. Phase diagram of the system 2-methyl-2-propanol~1!—cycurve,s—experimental results, Ref. 1,h—experimental results
References:1D. Plackov and I. Stern, Fluid Phase Equilib.57, 327 ~1990!.2T. M. Letcher, P. Siswana, and S. E. Radloff, S. Afr. J. Chem443D. G. Shaw, ed.,Solubility Data Series, Vol. 37, HydrocarbonsNew York, 1989!.4T. M. Letcher, S. Ravindran, and S. E. Radloff, Fluid Phase
article is copyrighted as indicated in the article. Reuse of AIP content is subject to the terms at: http://scitation.aip.org/termsconditions. Downloade
Components: Evaluated by:
~1! 2-Methyl-2-propanol~tert-butanol, tert-butyl alcohol!;C4H10O; @75-65-0#~2! Cyclohexane; C6H12 ; @110-82-7#~3! Water; H2O; @7732-18-5#
A. Skrzecz,~1997.03!
8.3. 2-Methyl-2-propanol 1 Water 1 Cyclohexane
Critical Evaluation:A survey of reported compositions along the saturation curve~sat.! and compositions of coexisting phases in equilibrium~eq.! for the
system 2-methyl-2-propanol–cyclohexane–water is given in Table 70.
TABLE 70. Summary of experimental data for the system 2-methyl-2-propanol–cyclohexane–water
Author~s! T/K Type of dataa Ref.
Plackov and Stem, 1990 298 sat.~19!, eq. ~7! 1
Letcheret al., 1991 298 sat.~15!, eq. ~5! 2
aNumber of experimental points in parentheses.
Saturation curveThe ternary system 2-methyl-2-propanol–cyclohexane–water forms a miscibility gap of type 1. The system was investigated twice at
298 K by titration method. Only the binary system cyclohexane–water forms a miscibility gap. Data of this system were compiled andcritically evaluated in a previously published SDS volume,3 the recommended values at 298 K are:x2951.2•1025 andx3853.7•1024. Thesaturated binary cyclohexane–water mixtures reported in Ref. 2 asx2950.0 andx3850.001 are the result of the limited analytical methodsused. The systems 2-methyl-2-propanol–water and 2-methyl-2-propanol–cyclohexane are miscible. The saturation data1,2 are consistentwith one another and with the recommended values for the binary system. All experimental solubility and equilibrium data reported inRefs. 1 and 2 were used for calculation of saturation curve. These data were described by the equation:
x15a1•~2ln z1!a2•z1
d3,
where:z15(x210.5•x12x209 )/(x208 2x209 ), x1 , x2—mole fractions of component~1! and~2!, respectively,x208 , x209 —values ofx2 on thebinodal curve which cuts thex150 axis.
This equation has been proposed by Letcheret al.4 for the description of saturation curves of ternary alcohol–ether–water systems.It gives better results~the smallest standard deviation! for the investigated system than any other tested equation. The parameters obtainedby the least-squares method for the whole range of miscibility gap~water-rich and hydrocarbon-rich branches were described together!
are:a151.469 36,a250.972 29,a351.277 11. The standard error of estimate was 0.0044. For selected concentrations of cyclohexane inthe mixture the saturation curve was calculated. The results are presented in Table 71 and in Fig. 37 as solid line.
0.4252 0.2800
0.4230 0.3000
0.4199 0.3200
0.4158 0.3400
0.4108 0.3600
0.4050 0.3800
0.3985 0.4000
0.3913 0.4200
0.3834 0.4400
0.3750 0.4600
0.3660 0.4800
0.3565 0.5000
Compositions of coexisting phases in equilibrreferences and similar experimental procedures weand the composition of each phase was analyzedlow concentration of cyclohexane~0–0.001 and 0.00area of the miscibility gap. They are consistent withof cyclohexane while the data of Letcheret al.2 covewith one another; their directions differ a little. Letand Stern;1 consequently the tie lines cross. Both dfor phases in equilibrium, Refs. 1 and 2, are pres
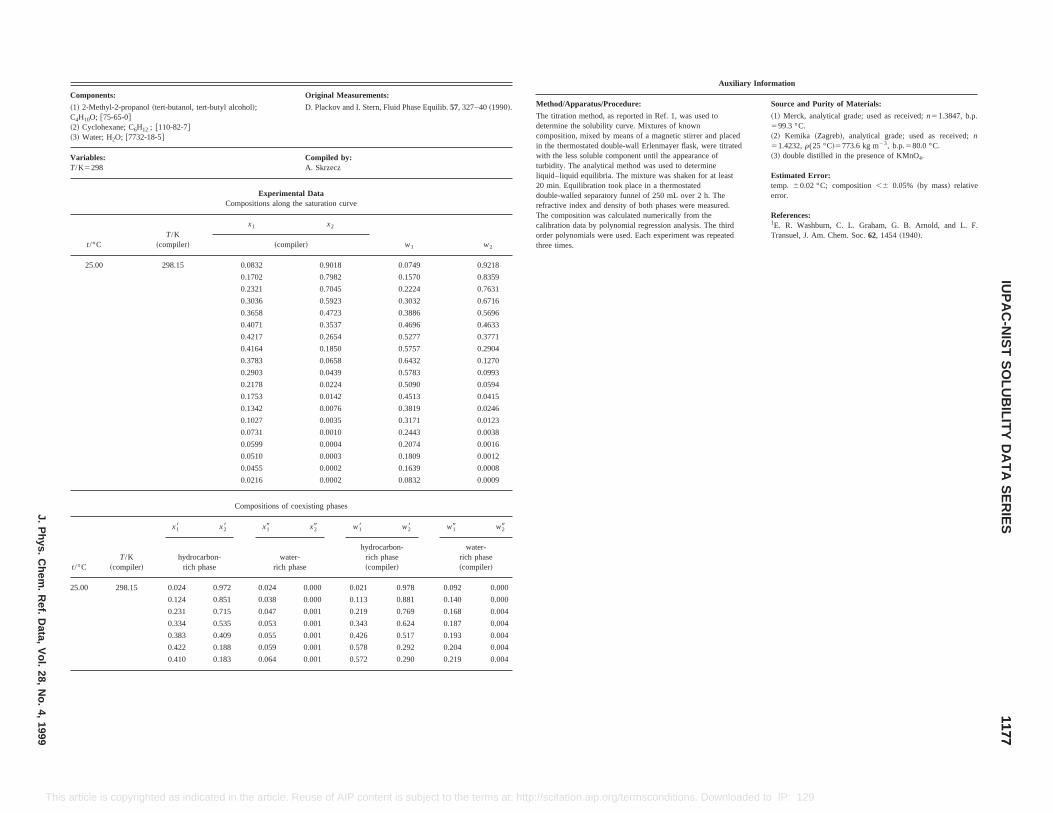
Original Measurements:
D. Plackov and I. Stern, Fluid Phase Equilib.57, 327–40~1990!.
Compiled by:A. Skrzecz
Experimental Dataions along the saturation curve
x2
w1 w2~compiler!
32 0.9018 0.0749 0.9218
2 0.7982 0.1570 0.8359
1 0.7045 0.2224 0.7631
6 0.5923 0.3032 0.6716
8 0.4723 0.3886 0.5696
1 0.3537 0.4696 0.4633
7 0.2654 0.5277 0.3771
4 0.1850 0.5757 0.2904
3 0.0658 0.6432 0.1270
3 0.0439 0.5783 0.0993
8 0.0224 0.5090 0.0594
3 0.0142 0.4513 0.0415
2 0.0076 0.3819 0.0246
7 0.0035 0.3171 0.0123
1 0.0010 0.2443 0.0038
9 0.0004 0.2074 0.0016
0 0.0003 0.1809 0.0012
5 0.0002 0.1639 0.0008
6 0.0002 0.0832 0.0009
sitions of coexisting phases
x19 x29 w18 w28 w19 w29
Auxiliary Information
Method/Apparatus/Procedure: Source and Purity of Materials:
The titration method, as reported in Ref. 1, was used todetermine the solubility curve. Mixtures of knowncomposition, mixed by means of a magnetic stirrer and placedin the thermostated double-wall Erlenmayer flask, were titratedwith the less soluble component until the appearance ofturbidity. The analytical method was used to determineliquid–liquid equilibria. The mixture was shaken for at least20 min. Equilibration took place in a thermostateddouble-walled separatory funnel of 250 mL over 2 h. Therefractive index and density of both phases were measured.The composition was calculated numerically from thecalibration data by polynomial regression analysis. The thirdorder polynomials were used. Each experiment was repeatedthree times.
~1! Merck, analytical grade; used as received;n51.3847, b.p.599.3 °C.~2! Kemika ~Zagreb!, analytical grade; used as received;n51.4232,r(25 °C!5773.6 kg m23, b.p.580.0 °C.~3! double distilled in the presence of KMnO4.
Estimated Error:temp. 60.02 °C; composition,6 0.05% ~by mass! relativeerror.
References:1E. R. Washburn, C. L. Graham, G. B. Arnold, and L. F.Transuel, J. Am. Chem. Soc.62, 1454~1940!.
11771177
IUP
AC
-NIS
TS
OLU
BILIT
YD
AT
AS
ER
IESJ.P
hys.C
hem.
Ref.
Data,
Vol.
28,N
o.4,
1999
This ns. Downloaded to IP: 129.6.105.191 On: Fri, 05 Sep 2014 17:51:55
t/°CT/K
~compiler!hydrocarbon-
rich phasewater-
rich phase
hydrocarbon-rich phase~compiler!
water-rich phase~compiler!
25.00 298.15 0.024 0.972 0.024 0.000 0.021 0.978 0.092 0.000
0.124 0.851 0.038 0.000 0.113 0.881 0.140 0.000
0.231 0.715 0.047 0.001 0.219 0.769 0.168 0.004
0.334 0.535 0.053 0.001 0.343 0.624 0.187 0.004
0.383 0.409 0.055 0.001 0.426 0.517 0.193 0.004
0.422 0.188 0.059 0.001 0.578 0.292 0.204 0.004
0.410 0.183 0.064 0.001 0.572 0.290 0.219 0.004
article is copyrighted as indicated in the article. Reuse of AIP content is subject to the terms at: http://scitation.aip.org/termsconditio
Components:
~1! 2-Methyl-2-propanol~tert-butanol, tert-butyl alcohol!;C4H10O; @75-65-0#~2! Cyclohexane; C6H12 ; @110-82-7#~3! Water; H2O; @7732-18-5#
Variables:T/K5298
Composit
t/°CT/K
~compiler!
x1
25.00 298.15 0.08
0.170
0.232
0.303
0.365
0.407
0.421
0.416
0.378
0.290
0.217
0.175
0.134
0.102
0.073
0.059
0.051
0.045
0.021
Compo
x18 x28
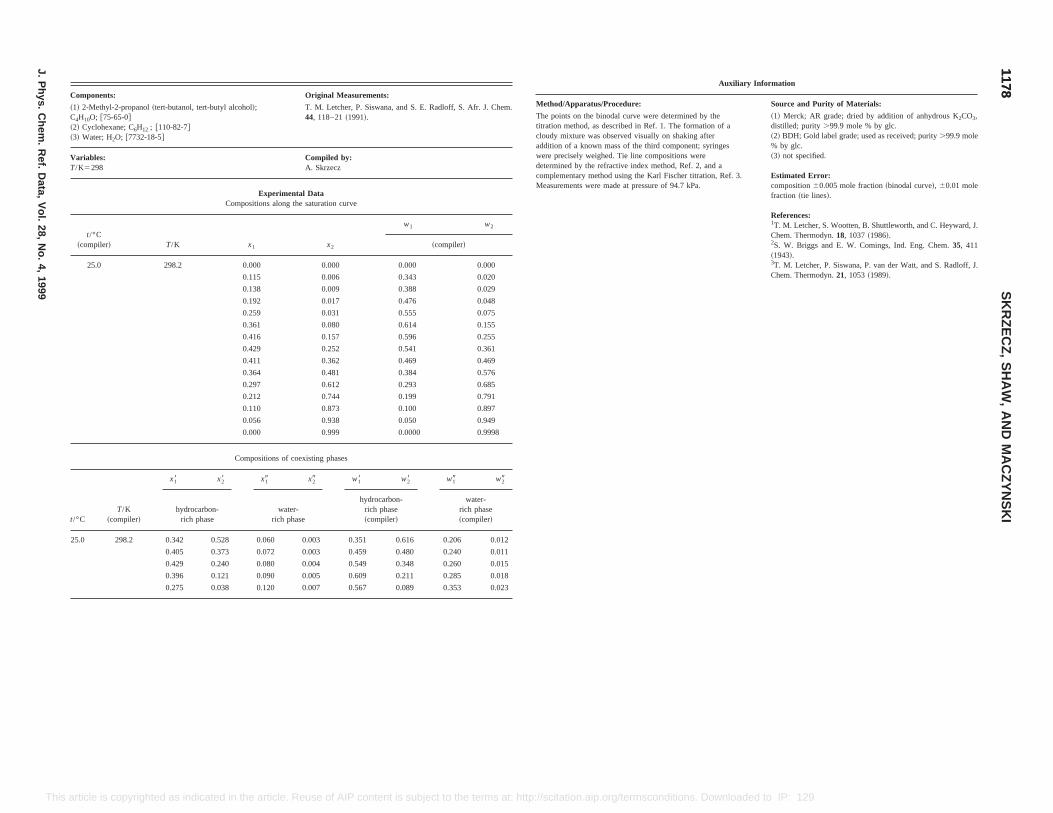
Original Measurements:
T. M. Letcher, P. Siswana, and S. E. Radloff, S. Afr. J. Chem.44, 118–21~1991!.
Compiled by:A. Skrzecz
ental Datag the saturation curve
x2
w1 w2
~compiler!
0.000 0.000 0.000
0.006 0.343 0.020
0.009 0.388 0.029
0.017 0.476 0.048
0.031 0.555 0.075
0.080 0.614 0.155
0.157 0.596 0.255
0.252 0.541 0.361
0.362 0.469 0.469
0.481 0.384 0.576
0.612 0.293 0.685
0.744 0.199 0.791
0.873 0.100 0.897
0.938 0.050 0.949
0.999 0.0000 0.9998
f coexisting phases
x29 w18 w28 w19 w29
ter-hase
hydrocarbon-rich phase~compiler!
water-rich phase~compiler!
Auxiliary Information
Method/Apparatus/Procedure: Source and Purity of Materials:
The points on the binodal curve were determined by thetitration method, as described in Ref. 1. The formation of acloudy mixture was observed visually on shaking afteraddition of a known mass of the third component; syringeswere precisely weighed. Tie line compositions weredetermined by the refractive index method, Ref. 2, and acomplementary method using the Karl Fischer titration, Ref. 3.Measurements were made at pressure of 94.7 kPa.
~1! Merck; AR grade; dried by addition of anhydrous K2CO3,distilled; purity .99.9 mole % by glc.~2! BDH; Gold label grade; used as received; purity.99.9 mole% by glc.~3! not specified.
Estimated Error:composition60.005 mole fraction~binodal curve!, 60.01 molefraction ~tie lines!.
References:1T. M. Letcher, S. Wootten, B. Shuttleworth, and C. Heyward, J.Chem. Thermodyn.18, 1037~1986!.2S. W. Briggs and E. W. Comings, Ind. Eng. Chem.35, 411~1943!.3T. M. Letcher, P. Siswana, P. van der Watt, and S. Radloff, J.Chem. Thermodyn.21, 1053~1989!.
11781178
SK
RZ
EC
Z,
SH
AW
,A
ND
MA
CZ
YN
SK
I
J.P
hys.C
hem.
Ref.
Data,
Vol.
28,N
o.4,
1999
This rg/termsconditions. Downloaded to IP: 129.6.105.191 On: Fri, 05 Sep 2014 17:51:55
25.0 298.2 0.342 0.528 0.060 0.003 0.351 0.616 0.206 0.012
0.405 0.373 0.072 0.003 0.459 0.480 0.240 0.011
0.429 0.240 0.080 0.004 0.549 0.348 0.260 0.015
0.396 0.121 0.090 0.005 0.609 0.211 0.285 0.018
0.275 0.038 0.120 0.007 0.567 0.089 0.353 0.023
article is copyrighted as indicated in the article. Reuse of AIP content is subject to the terms at: http://scitation.aip.o
Components:
~1! 2-Methyl-2-propanol~tert-butanol, tert-butyl alcohol!;C4H10O; @75-65-0#~2! Cyclohexane; C6H12 ; @110-82-7#~3! Water; H2O; @7732-18-5#
Variables:T/K5298
ExperimCompositions alon
t/°C~compiler! T/K x1
25.0 298.2 0.000
0.115
0.138
0.192
0.259
0.361
0.416
0.429
0.411
0.364
0.297
0.212
0.110
0.056
0.000
Compositions o
t/°CT/K
~compiler!
x18 x28 x19
hydrocarbon-rich phase
warich p

Original Measurements:
T. M. Letcher and P. M. Siswana, Fluid Phase Equilib.74, 203–17 ~1992!.
Compiled by:A. Skrzecz
1 Water 1 Toluenel Data
he saturation curve
x2
w1 w2
~compiler!
0.000 0.000 0.000
0.002 0.198 0.009
0.010 0.386 0.035
0.021 0.467 0.064
0.038 0.540 0.099
0.062 0.571 0.143
0.129 0.572 0.244
0.205 0.541 0.336
0.319 0.456 0.462
0.438 0.380 0.570
0.573 0.291 0.680
0.707 0.197 0.787
0.855 0.098 0.896
0.928 0.049 0.948
existing phase
t/°C ~compiler!
x29 w18 w28 w19 w29
rich phaseh
phase
hydrocarbon-rich phase~compiler!
water-richphase
~compiler!
Auxiliary Information
Method/Apparatus/Procedure: Source and Purity of Materials:
The points on the binodal curve were determined by theformation of a cloudy mixture on shaking after the addition ofa known mass of one component to a mixture of knownmasses of the other two components. Precision weighingsyringes were used as described in Ref. 1. Tie linecompositions were determined by the refractive index methodreported in Ref. 2 and a complementary method using the KarlFischer titrations as reported in Ref. 3.
~1! Merck, AR grade; distilled, dried by the addition ofanhydrous potassium carbonate, distilled; purity better than 99.6mole % by glc.~2! BDH; used as received; purity better than 99.6 mole % byglc.~3! not specified.
Estimated Error:estimated comp. 0.005 mole fraction on the binodal curve and0.01 mole fraction for tie lines~estimated by the authors!.
References:1T. M. Letcher, S. Wootten, B. Shuttleworth, and C. Heward, J.Chem. Thermodyn.18, 1037~1986!.2S. W. Briggs and E. W. Comings, Ind. Eng. Chem.35, 411~1943!.3T. M. Letcher, P. M. Siswana, P. Van der Watt, and S. Radloff,J. Chem. Thermodyn.21, 1053~1989!.
11791179
IUP
AC
-NIS
TS
OLU
BILIT
YD
AT
AS
ER
IESJ.P
hys.C
hem.
Ref.
Data,
Vol.
28,N
o.4,
1999
This nditions. Downloaded to IP: 129.6.105.191 On: Fri, 05 Sep 2014 17:51:55
25.0 298.2 0.000 0.999 0.000 0.000 0.000 0.9998 0.000 0.000
0.140 0.835 0.025 0.001 0.118 0.877 0.095 0.005
0.256 0.653 0.040 0.002 0.235 0.745 0.145 0.009
0.361 0.416 0.058 0.003 0.387 0.555 0.200 0.013
0.398 0.203 0.077 0.004 0.533 0.338 0.252 0.016
0.372 0.127 0.090 0.006 0.571 0.242 0.284 0.024
0.298 0.060 0.114 0.009 0.564 0.141 0.337 0.033
article is copyrighted as indicated in the article. Reuse of AIP content is subject to the terms at: http://scitation.aip.org/termsco
Components:
~1! 2-Methyl-2-propanol~tert-butanol, tert-butyl alcohol!;C4H10O; @75-65-0#~2! Toluene~methylbenzene!; C7H8; @108-88-3#~3! Water; H2O; @7732-18-5#
Variables:T/K5298
8.4. 2-Methyl-2-propanolExperimenta
Compositions along t
t/°CT/K
~compiler! x1
25.0 298.2 0.000
0.057
0.138
0.191
0.257
0.307
0.375
0.411
0.391
0.363
0.305
0.220
0.116
0.060
Compositions of co
T/K
x18 x28 x19
hydrocarbon- water-ric
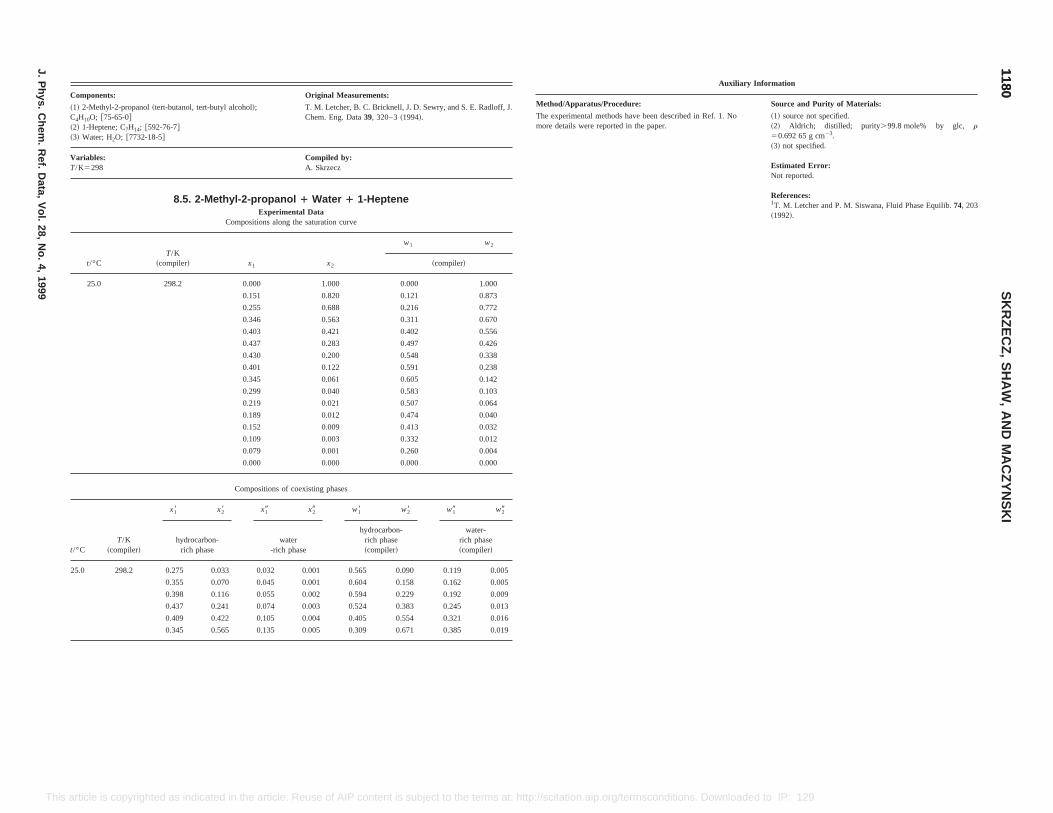
Original Measurements:
alcohol!; T. M. Letcher, B. C. Bricknell, J. D. Sewry, and S. E. Radloff, J.Chem. Eng. Data39, 320–3~1994!.
Compiled by:A. Skrzecz
l-2-propanol 1 Water 1 1-HepteneExperimental Data
ompositions along the saturation curve
x1 x2
w1 w2
~compiler!
0.000 1.000 0.000 1.000
0.151 0.820 0.121 0.873
0.255 0.688 0.216 0.772
0.346 0.563 0.311 0.670
0.403 0.421 0.402 0.556
0.437 0.283 0.497 0.426
0.430 0.200 0.548 0.338
0.401 0.122 0.591 0.238
0.345 0.061 0.605 0.142
0.299 0.040 0.583 0.103
0.219 0.021 0.507 0.064
0.189 0.012 0.474 0.040
0.152 0.009 0.413 0.032
0.109 0.003 0.332 0.012
0.079 0.001 0.260 0.004
0.000 0.000 0.000 0.000
Compositions of coexisting phases
x19 x29 w18 w28 w19 w29
Auxiliary Information
Method/Apparatus/Procedure: Source and Purity of Materials:
The experimental methods have been described in Ref. 1. Nomore details were reported in the paper.
~1! source not specified.~2! Aldrich; distilled; purity.99.8 mole% by glc, r50.692 65 g cm23.~3! not specified.
Estimated Error:Not reported.
References:1T. M. Letcher and P. M. Siswana, Fluid Phase Equilib.74, 203~1992!.
11801180
SK
RZ
EC
Z,
SH
AW
,A
ND
MA
CZ
YN
SK
I
J.P
hys.C
hem.
Ref.
Data,
Vol.
28,N
o.4,
1999
This onditions. Downloaded to IP: 129.6.105.191 On: Fri, 05 Sep 2014 17:51:55
t/°CT/K
~compiler!hydrocarbon-
rich phasewater
-rich phase
hydrocarbon-rich phase~compiler!
water-rich phase~compiler!
25.0 298.2 0.275 0.033 0.032 0.001 0.565 0.090 0.119 0.005
0.355 0.070 0.045 0.001 0.604 0.158 0.162 0.005
0.398 0.116 0.055 0.002 0.594 0.229 0.192 0.009
0.437 0.241 0.074 0.003 0.524 0.383 0.245 0.013
0.409 0.422 0.105 0.004 0.405 0.554 0.321 0.016
0.345 0.565 0.135 0.005 0.309 0.671 0.385 0.019
article is copyrighted as indicated in the article. Reuse of AIP content is subject to the terms at: http://scitation.aip.org/termsc
Components:
~1! 2-Methyl-2-propanol~tert-butanol, tert-butylC4H10O; @75-65-0#~2! 1-Heptene; C7H14; @592-76-7#~3! Water; H2O; @7732-18-5#
Variables:T/K5298
8.5. 2-Methy
C
t/°CT/K
~compiler!
25.0 298.2
x18 x28
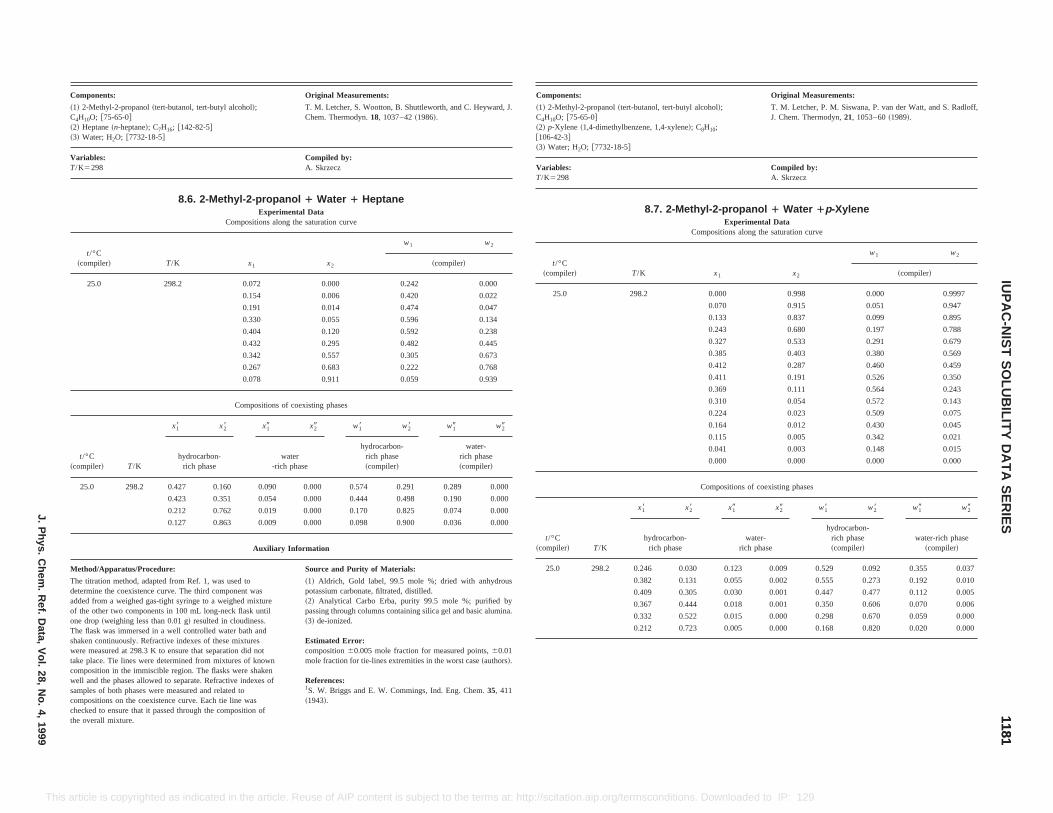
Original Measurements:
ol, tert-butyl alcohol!;
e, 1,4-xylene!; C8H10;
T. M. Letcher, P. M. Siswana, P. van der Watt, and S. Radloff,J. Chem. Thermodyn,21, 1053–60~1989!.
Compiled by:A. Skrzecz
7. 2-Methyl-2-propanol 1 Water 1p-XyleneExperimental Data
Compositions along the saturation curve
x1 x2
w1 w2
~compiler!
0.000 0.998 0.000 0.9997
0.070 0.915 0.051 0.947
0.133 0.837 0.099 0.895
0.243 0.680 0.197 0.788
0.327 0.533 0.291 0.679
0.385 0.403 0.380 0.569
0.412 0.287 0.460 0.459
0.411 0.191 0.526 0.350
0.369 0.111 0.564 0.243
0.310 0.054 0.572 0.143
0.224 0.023 0.509 0.075
0.164 0.012 0.430 0.045
0.115 0.005 0.342 0.021
0.041 0.003 0.148 0.015
0.000 0.000 0.000 0.000
Compositions of coexisting phases
x28 x19 x29 w18 w28 w19 w29
water-rich phase
hydrocarbon-rich phase~compiler!
water-rich phase~compiler!
0.123 0.009 0.529 0.092 0.355 0.037
.055 0.002 0.555 0.273 0.192 0.010
.030 0.001 0.447 0.477 0.112 0.005
.018 0.001 0.350 0.606 0.070 0.006
.015 0.000 0.298 0.670 0.059 0.000
.005 0.000 0.168 0.820 0.020 0.000
11811181
IUP
AC
-NIS
TS
OLU
BILIT
YD
AT
AS
ER
IESJ.P
hys.C
hem.
Ref.
Data,
Vol.
28,N
o.4,
1999
This aded to IP: 129.6.105.191 On: Fri, 05 Sep 2014 17:51:55
Auxiliary Information
Method/Apparatus/Procedure: Source and Purity of Materials:
The titration method, adapted from Ref. 1, was used todetermine the coexistence curve. The third component wasadded from a weighed gas-tight syringe to a weighed mixtureof the other two components in 100 mL long-neck flask untilone drop~weighing less than 0.01 g! resulted in cloudiness.The flask was immersed in a well controlled water bath andshaken continuously. Refractive indexes of these mixtureswere measured at 298.3 K to ensure that separation did nottake place. Tie lines were determined from mixtures of knowncomposition in the immiscible region. The flasks were shakenwell and the phases allowed to separate. Refractive indexes ofsamples of both phases were measured and related tocompositions on the coexistence curve. Each tie line waschecked to ensure that it passed through the composition ofthe overall mixture.
~1! Aldrich, Gold label, 99.5 mole %; dried with anhydrouspotassium carbonate, filtrated, distilled.~2! Analytical Carbo Erba, purity 99.5 mole %; purified bypassing through columns containing silica gel and basic alumina.~3! de-ionized.
Estimated Error:composition60.005 mole fraction for measured points,60.01mole fraction for tie-lines extremities in the worst case~authors!.
References:1S. W. Briggs and E. W. Commings, Ind. Eng. Chem.35, 411~1943!.
t/°C~compiler! T/K
hydrocarbon-rich phase
25.0 298.2 0.246 0.030
0.382 0.131 0
0.409 0.305 0
0.367 0.444 0
0.332 0.522 0
0.212 0.723 0
article is copyrighted as indicated in the article. Reuse of AIP content is subject to the terms at: http://scitation.aip.org/termsconditions. Downlo
Components: Original Measurements:
~1! 2-Methyl-2-propanol~tert-butanol, tert-butyl alcohol!;C4H10O; @75-65-0#~2! Heptane~n-heptane!; C7H16; @142-82-5#~3! Water; H2O; @7732-18-5#
T. M. Letcher, S. Wootton, B. Shuttleworth, and C. Heyward, J.Chem. Thermodyn.18, 1037–42~1986!.
Variables:T/K5298
Compiled by:A. Skrzecz
8.6. 2-Methyl-2-propanol 1 Water 1 HeptaneExperimental Data
Compositions along the saturation curve
t/°C~compiler! T/K x1 x2
w1 w2
~compiler!
25.0 298.2 0.072 0.000 0.242 0.000
0.154 0.006 0.420 0.022
0.191 0.014 0.474 0.047
0.330 0.055 0.596 0.134
0.404 0.120 0.592 0.238
0.432 0.295 0.482 0.445
0.342 0.557 0.305 0.673
0.267 0.683 0.222 0.768
0.078 0.911 0.059 0.939
Compositions of coexisting phases
t/°C~compiler! T/K
x18 x28 x19 x29 w18 w28 w19 w29
hydrocarbon-rich phase
water-rich phase
hydrocarbon-rich phase~compiler!
water-rich phase~compiler!
25.0 298.2 0.427 0.160 0.090 0.000 0.574 0.291 0.289 0.000
0.423 0.351 0.054 0.000 0.444 0.498 0.190 0.000
0.212 0.762 0.019 0.000 0.170 0.825 0.074 0.000
0.127 0.863 0.009 0.000 0.098 0.900 0.036 0.000
Components:
~1! 2-Methyl-2-propanol~tert-butanC4H10O; @75-65-0#~2! p-Xylene ~1,4-dimethylbenzen@106-42-3#~3! Water; H2O; @7732-18-5#
Variables:T/K5298
8.
t/°C~compiler! T/K
25.0 298.2
x18
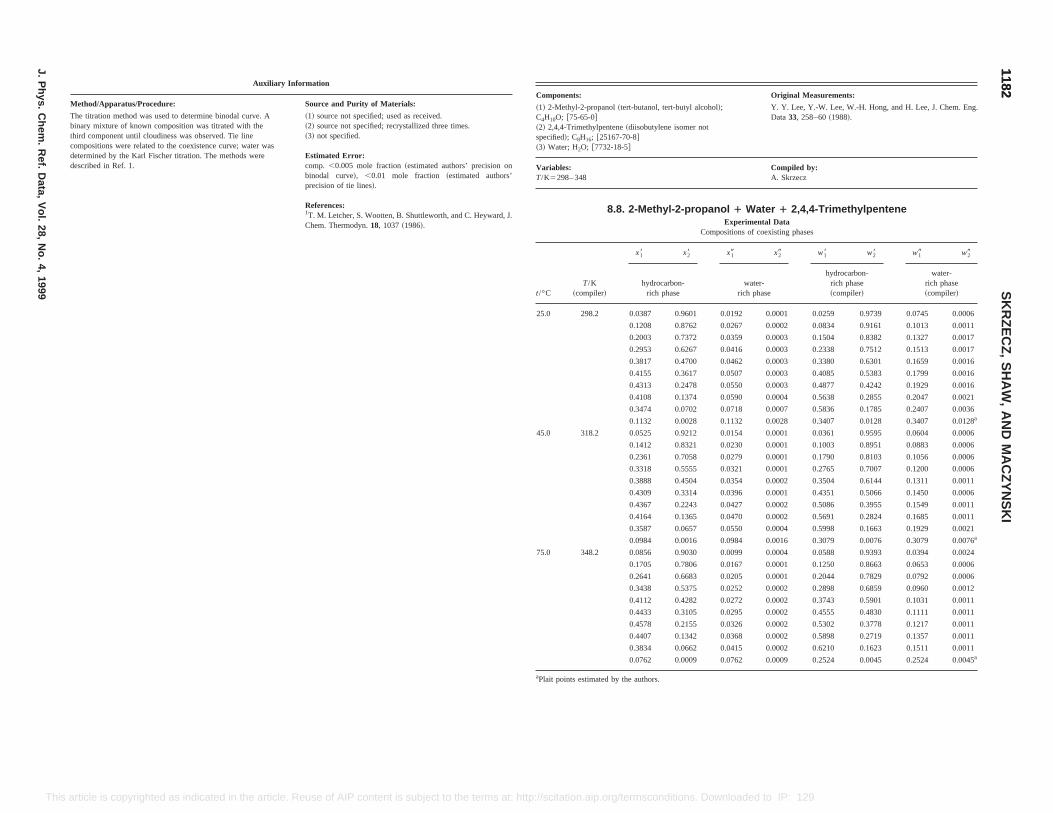
Original Measurements:
alcohol!;
r not
Y. Y. Lee, Y.-W. Lee, W.-H. Hong, and H. Lee, J. Chem. Eng.Data33, 258–60~1988!.
Compiled by:A. Skrzecz
panol 1 Water 1 2,4,4-TrimethylpenteneExperimental Data
Compositions of coexisting phases
x19 x29 w18 w28 w19 w29
water-rich phase
hydrocarbon-rich phase~compiler!
water-rich phase~compiler!
1 0.0192 0.0001 0.0259 0.9739 0.0745 0.0006
2 0.0267 0.0002 0.0834 0.9161 0.1013 0.0011
2 0.0359 0.0003 0.1504 0.8382 0.1327 0.0017
7 0.0416 0.0003 0.2338 0.7512 0.1513 0.0017
0 0.0462 0.0003 0.3380 0.6301 0.1659 0.0016
7 0.0507 0.0003 0.4085 0.5383 0.1799 0.0016
8 0.0550 0.0003 0.4877 0.4242 0.1929 0.0016
4 0.0590 0.0004 0.5638 0.2855 0.2047 0.0021
2 0.0718 0.0007 0.5836 0.1785 0.2407 0.0036
8 0.1132 0.0028 0.3407 0.0128 0.3407 0.0128a
2 0.0154 0.0001 0.0361 0.9595 0.0604 0.0006
1 0.0230 0.0001 0.1003 0.8951 0.0883 0.0006
8 0.0279 0.0001 0.1790 0.8103 0.1056 0.0006
5 0.0321 0.0001 0.2765 0.7007 0.1200 0.0006
4 0.0354 0.0002 0.3504 0.6144 0.1311 0.0011
4 0.0396 0.0001 0.4351 0.5066 0.1450 0.0006
3 0.0427 0.0002 0.5086 0.3955 0.1549 0.0011
5 0.0470 0.0002 0.5691 0.2824 0.1685 0.0011
0.3587 0.0657 0.0550 0.0004 0.5998 0.1663 0.1929 0.0021
0.0984 0.0016 0.0984 0.0016 0.3079 0.0076 0.3079 0.0076a
75.0 348.2 0.0856 0.9030 0.0099 0.0004 0.0588 0.9393 0.0394 0.0024
0.1705 0.7806 0.0167 0.0001 0.1250 0.8663 0.0653 0.0006
0.2641 0.6683 0.0205 0.0001 0.2044 0.7829 0.0792 0.0006
0.3438 0.5375 0.0252 0.0002 0.2898 0.6859 0.0960 0.0012
0.4112 0.4282 0.0272 0.0002 0.3743 0.5901 0.1031 0.0011
0.4433 0.3105 0.0295 0.0002 0.4555 0.4830 0.1111 0.0011
0.4578 0.2155 0.0326 0.0002 0.5302 0.3778 0.1217 0.0011
0.4407 0.1342 0.0368 0.0002 0.5898 0.2719 0.1357 0.0011
0.3834 0.0662 0.0415 0.0002 0.6210 0.1623 0.1511 0.0011
0.0762 0.0009 0.0762 0.0009 0.2524 0.0045 0.2524 0.0045a
aPlait points estimated by the authors.
11821182
SK
RZ
EC
Z,
SH
AW
,A
ND
MA
CZ
YN
SK
I
J.P
hys.C
hem.
Ref.
Data,
Vol.
28,N
o.4,
1999
This he article. Reuse of AIP content is subject to the terms at: http://scitation.aip.org/termsconditions. Downloaded to IP: 129.6.105.191 On: Fri, 05 Sep 2014 17:51:55
article is copyrighted as indicated in tAuxiliary Information
Method/Apparatus/Procedure: Source and Purity of Materials:
The titration method was used to determine binodal curve. Abinary mixture of known composition was titrated with thethird component until cloudiness was observed. Tie linecompositions were related to the coexistence curve; water wasdetermined by the Karl Fischer titration. The methods weredescribed in Ref. 1.
~1! source not specified; used as received.~2! source not specified; recrystallized three times.~3! not specified.
Estimated Error:comp. ,0.005 mole fraction~estimated authors’ precision onbinodal curve!, ,0.01 mole fraction ~estimated authors’precision of tie lines!.
References:1T. M. Letcher, S. Wootten, B. Shuttleworth, and C. Heyward, J.Chem. Thermodyn.18, 1037~1986!.
Components:
~1! 2-Methyl-2-propanol~tert-butanol, tert-butylC4H10O; @75-65-0#~2! 2,4,4-Trimethylpentene~diisobutylene isomespecified!; C8H16; @25167-70-8#~3! Water; H2O; @7732-18-5#
Variables:T/K5298– 348
8.8. 2-Methyl-2-pro
t/°CT/K
~compiler!
x18 x28
hydrocarbon-rich phase
25.0 298.2 0.0387 0.960
0.1208 0.876
0.2003 0.737
0.2953 0.626
0.3817 0.470
0.4155 0.361
0.4313 0.247
0.4108 0.137
0.3474 0.070
0.1132 0.002
45.0 318.2 0.0525 0.921
0.1412 0.832
0.2361 0.705
0.3318 0.555
0.3888 0.450
0.4309 0.331
0.4367 0.224
0.4164 0.136
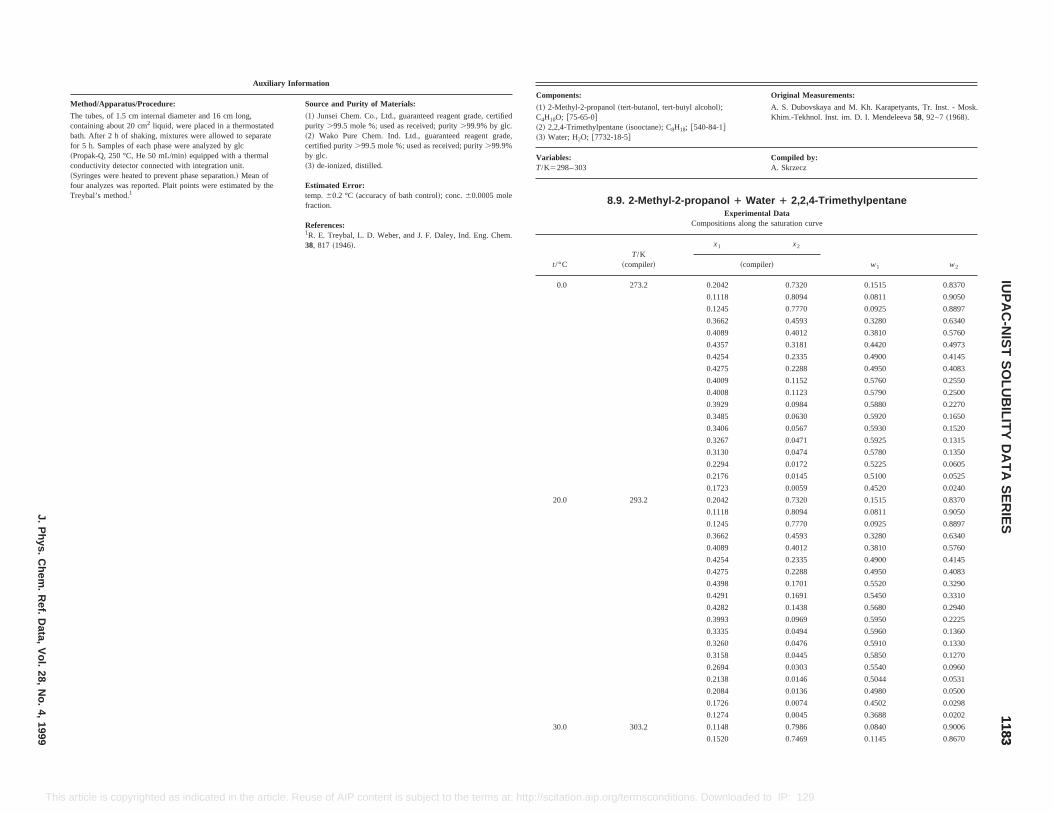
Original Measurements:
A. S. Dubovskaya and M. Kh. Karapetyants, Tr. Inst. - Mosk.Khim.-Tekhnol. Inst. im. D. I. Mendeleeva58, 92–7~1968!.
Compiled by:A. Skrzecz
ater 1 2,2,4-Trimethylpentaneental Datang the saturation curve
x2
w1 w2mpiler!
0.7320 0.1515 0.8370
0.8094 0.0811 0.9050
0.7770 0.0925 0.8897
0.4593 0.3280 0.6340
0.4012 0.3810 0.5760
0.3181 0.4420 0.4973
0.2335 0.4900 0.4145
0.2288 0.4950 0.4083
0.1152 0.5760 0.2550
0.1123 0.5790 0.2500
0.0984 0.5880 0.2270
0.0630 0.5920 0.1650
0.0567 0.5930 0.1520
0.0471 0.5925 0.1315
0.0474 0.5780 0.1350
0.0172 0.5225 0.0605
0.0145 0.5100 0.0525
0.0059 0.4520 0.0240
0.7320 0.1515 0.8370
0.8094 0.0811 0.9050
0.7770 0.0925 0.8897
0.3662 0.4593 0.3280 0.6340
0.4089 0.4012 0.3810 0.5760
0.4254 0.2335 0.4900 0.4145
0.4275 0.2288 0.4950 0.4083
0.4398 0.1701 0.5520 0.3290
0.4291 0.1691 0.5450 0.3310
0.4282 0.1438 0.5680 0.2940
0.3993 0.0969 0.5950 0.2225
0.3335 0.0494 0.5960 0.1360
0.3260 0.0476 0.5910 0.1330
0.3158 0.0445 0.5850 0.1270
0.2694 0.0303 0.5540 0.0960
0.2138 0.0146 0.5044 0.0531
0.2084 0.0136 0.4980 0.0500
0.1726 0.0074 0.4502 0.0298
0.1274 0.0045 0.3688 0.0202
30.0 303.2 0.1148 0.7986 0.0840 0.9006
0.1520 0.7469 0.1145 0.8670
11831183
IUP
AC
-NIS
TS
OLU
BILIT
YD
AT
AS
ER
IESJ.P
hys.C
hem.
Ref.
Data,
Vol.
28,N
o.4,
1999
This ticle. Reuse of AIP content is subject to the terms at: http://scitation.aip.org/termsconditions. Downloaded to IP: 129.6.105.191 On: Fri, 05 Sep 2014 17:51:55
article is copyrighted as indicated in the arAuxiliary Information
Method/Apparatus/Procedure: Source and Purity of Materials:
The tubes, of 1.5 cm internal diameter and 16 cm long,containing about 20 cm2 liquid, were placed in a thermostatedbath. After 2 h ofshaking, mixtures were allowed to separatefor 5 h. Samples of each phase were analyzed by glc~Propak-Q, 250 °C, He 50 mL/min! equipped with a thermalconductivity detector connected with integration unit.~Syringes were heated to prevent phase separation.! Mean offour analyzes was reported. Plait points were estimated by theTreybal’s method.1
~1! Junsei Chem. Co., Ltd., guaranteed reagent grade, certifiedpurity .99.5 mole %; used as received; purity.99.9% by glc.~2! Wako Pure Chem. Ind. Ltd., guaranteed reagent grade,certified purity.99.5 mole %; used as received; purity.99.9%by glc.~3! de-ionized, distilled.
Estimated Error:temp.60.2 °C ~accuracy of bath control!; conc.60.0005 molefraction.
References:1R. E. Treybal, L. D. Weber, and J. F. Daley, Ind. Eng. Chem.38, 817 ~1946!.
Components:
~1! 2-Methyl-2-propanol~tert-butanol, tert-butyl alcohol!;C4H10O; @75-65-0#~2! 2,2,4-Trimethylpentane~isooctane!; C8H18; @540-84-1#~3! Water; H2O; @7732-18-5#
Variables:T/K5298– 303
8.9. 2-Methyl-2-propanol 1 WExperim
Compositions alo
t/°CT/K
~compiler!
x1
~co
0.0 273.2 0.2042
0.1118
0.1245
0.3662
0.4089
0.4357
0.4254
0.4275
0.4009
0.4008
0.3929
0.3485
0.3406
0.3267
0.3130
0.2294
0.2176
0.1723
20.0 293.2 0.2042
0.1118
0.1245

0.2155 0.7650
0.1206 0.8580
0.4050 0.5425
0.4800 0.4400
0.5550 0.3260
0.6015 0.2290
0.5990 0.2300
0.6055 0.1395
0.6030 0.1380
0.6080 0.1385
0.5630 0.0980
0.5185 0.0685
0.5085 0.0515
0.4990 0.0535
0.4550 0.0300
0.4140 0.0195
0.4100 0.0178
0.4070 0.0190
0.3916 0.0144
0.3526 0.0074
0.3160 0.0019
0.2850 0.0000
es
w18 w28 w19 w29
hydrocarbon-rich phase
water-rich phase
0.1040 0.8800 0.1020 ,0.0010
0.2480 0.7280 0.1400 ,0.0010
0.3360 0.6280 0.1640 ,0.0010
0.4500 0.4800 0.1960 ,0.0010
0.5320 0.3600 0.2180 0.0020
0.5880 0.2580 0.2480 0.0020
0.5960 0.2320 0.2640 ,0.0010
0.6080 0.1900 0.2740 ,0.0010
0.6080 0.1480 0.2900 ,0.0010
Auxiliary Information
Method/Apparatus/Procedure: Source and Purity of Materials:
The titration method was used to determine the solubilitycurve. Binary hydrocarbon–alcohol mixtures were titrated withwater until turbidity was observed, as described in Ref. 4. Thetitration was repeated several times to eliminate errors. Therelationship of density versus composition of saturated mixturewas used later to calculate equilibrium. The method was testedon the ethanol–heptane–water system and the results were inagreement with literature data. The analytical method was usedto determine liquid–liquid equilibria. A binary mixture ofknown composition was placed in a special thermostatedvessel and the third component was added to obtain atwo-phase mixture. This mixture was agitated for 3–4 h toensure equilibrium. The mixture was allowed to stand 1–2 hto become clear and then both phases were taken for densitymeasurements. On the basis the previously constructedrelationship of density versus composition of the saturatedmixture, the composition of the mixture in equilibrium wascalculated. Concentrations of 2,2,4-trimethylpentane in thewater-rich phase were reported in the paper for severalexperimental points as,0.0010 of mass fraction while thesums of water and alcohol concentrations were equal to1.0000. Recalculations to mole fraction were made treatingthem as real values.
~1! source not specified;d(20 °C,20 °C)50.7894,n(25 °C,D)51.3860, m.p.525 °C; used as received.~2! source not specified;d(20 °C,20 °C)50.6890,n(25 °C,D)51.3890.~3! doubly distilled.
Estimated Error:temp.60.1 K; conc.60.0001.
References:1V. F. Alekseev, Gorn. Zh.2, 385 ~1985!.2N. A. Izmajlov and A. K. Franke, Zh. Fiz. Khim.29, 120~1955!.3E. N. Zilberman Zh. Fiz. Khim.28, 1458~1952!.4W. D. Bancroft, Phys. Rev.3, 21 ~1896!.
11841184
SK
RZ
EC
Z,
SH
AW
,A
ND
MA
CZ
YN
SK
I
J.P
hys.C
hem.
Ref.
Data,
Vol.
28,N
o.4,
1999
This termsconditions. Downloaded to IP: 129.6.105.191 On: Fri, 05 Sep 2014 17:51:55
0.2829 0.0275 0.1172 0.0009 0.5740 0.0860 0.3520 0.0040
0.1844 0.0087 0.1844 0.0087 0.468 0.034 0.468 0.034a
0.1839 0.0082 0.1839 0.0082 0.468 0.032 0.468 0.032b
0.1797 0.0055 0.1797 0.0055 0.465 0.022 0.465 0.022c
The authors calculated critical points:~a! by Alekseev’s, Ref. 1,~b! by Izmailov’s, Ref. 2, and~c! by Zilberman’s, Ref. 3, methods,respectively.
article is copyrighted as indicated in the article. Reuse of AIP content is subject to the terms at: http://scitation.aip.org/
0.2721 0.6267
0.1576 0.7274
0.4162 0.3618
0.4385 0.2608
0.4418 0.1684
0.4155 0.1027
0.4126 0.1028
0.3470 0.0519
0.3430 0.0509
0.3492 0.0516
0.2785 0.0315
0.2292 0.0196
0.2162 0.0142
0.2101 0.0146
0.1754 0.0075
0.1501 0.0046
0.1477 0.0042
0.1463 0.0044
0.1376 0.0033
0.1179 0.0016
0.1012 0.0004
0.0883 0.0000
Compositions of coexisting phas
t/°CT/K
~compiler!
x18 x28 x19 x29
hydrocarbon-rich phase~compiler!
water-rich phase~compiler!
30.0 303.2 0.1404 0.7708 0.0269 0.0002
0.3028 0.5767 0.0381 0.0002
0.3768 0.4570 0.0456 0.0002
0.4288 0.2968 0.0560 0.0002
0.4397 0.1931 0.0636 0.0004
0.4233 0.1205 0.0744 0.0004
0.4098 0.1035 0.0803 0.0002
0.3891 0.0789 0.0841 0.0002
0.3560 0.0562 0.0904 0.0002
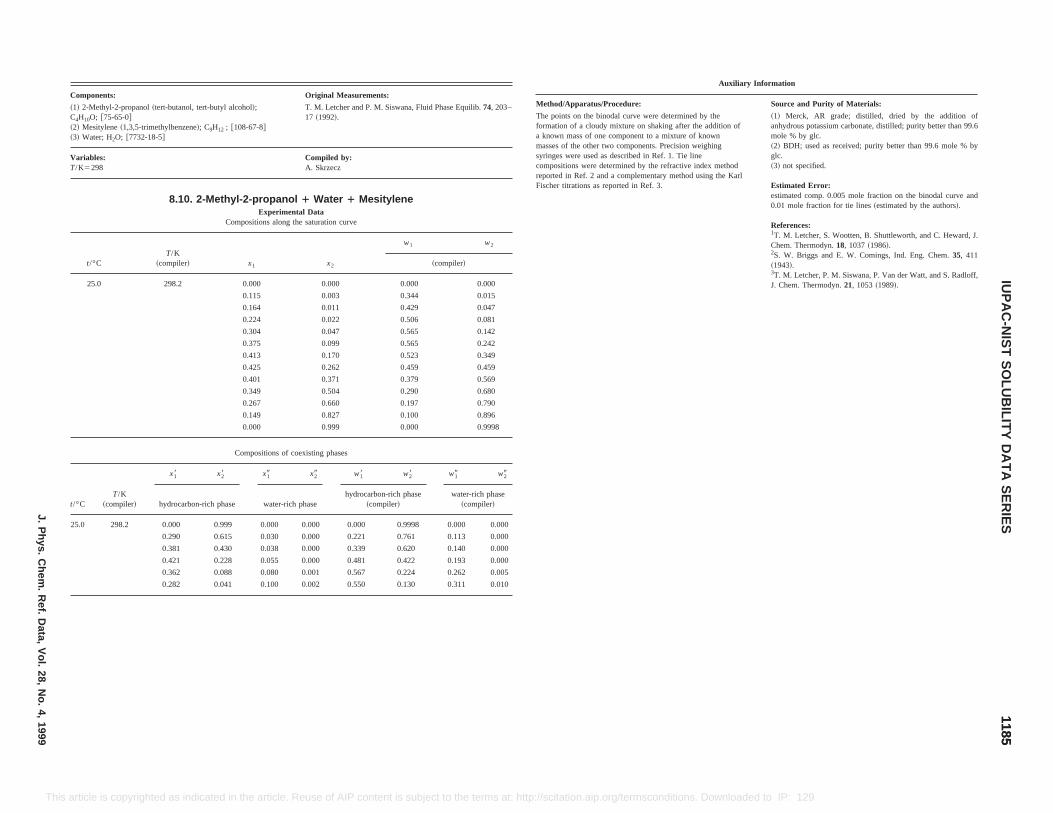
Original Measurements:
T. M. Letcher and P. M. Siswana, Fluid Phase Equilib.74, 203–17 ~1992!.
Compiled by:A. Skrzecz
1 Water 1 Mesitylenel Data
he saturation curve
x2
w1 w2
~compiler!
0.000 0.000 0.000
0.003 0.344 0.015
0.011 0.429 0.047
0.022 0.506 0.081
0.047 0.565 0.142
0.099 0.565 0.242
0.170 0.523 0.349
0.262 0.459 0.459
0.371 0.379 0.569
0.504 0.290 0.680
0.660 0.197 0.790
0.827 0.100 0.896
0.999 0.000 0.9998
existing phases
x29 w18 w28 w19 w29
h phasehydrocarbon-rich phase
~compiler!water-rich phase
~compiler!
25.0 298.2 0.000 0.999 0.000 0.000 0.000 0.9998 0.000 0.000
Auxiliary Information
Method/Apparatus/Procedure: Source and Purity of Materials:
The points on the binodal curve were determined by theformation of a cloudy mixture on shaking after the addition ofa known mass of one component to a mixture of knownmasses of the other two components. Precision weighingsyringes were used as described in Ref. 1. Tie linecompositions were determined by the refractive index methodreported in Ref. 2 and a complementary method using the KarlFischer titrations as reported in Ref. 3.
~1! Merck, AR grade; distilled, dried by the addition ofanhydrous potassium carbonate, distilled; purity better than 99.6mole % by glc.~2! BDH; used as received; purity better than 99.6 mole % byglc.~3! not specified.
Estimated Error:estimated comp. 0.005 mole fraction on the binodal curve and0.01 mole fraction for tie lines~estimated by the authors!.
References:1T. M. Letcher, S. Wootten, B. Shuttleworth, and C. Heward, J.Chem. Thermodyn.18, 1037~1986!.2S. W. Briggs and E. W. Comings, Ind. Eng. Chem.35, 411~1943!.3T. M. Letcher, P. M. Siswana, P. Van der Watt, and S. Radloff,J. Chem. Thermodyn.21, 1053~1989!.
11851185
IUP
AC
-NIS
TS
OLU
BILIT
YD
AT
AS
ER
IESJ.P
hys.C
hem.
Ref.
Data,
Vol.
28,N
o.4,
1999
This rg/termsconditions. Downloaded to IP: 129.6.105.191 On: Fri, 05 Sep 2014 17:51:55
0.290 0.615 0.030 0.000 0.221 0.761 0.113 0.000
0.381 0.430 0.038 0.000 0.339 0.620 0.140 0.000
0.421 0.228 0.055 0.000 0.481 0.422 0.193 0.000
0.362 0.088 0.080 0.001 0.567 0.224 0.262 0.005
0.282 0.041 0.100 0.002 0.550 0.130 0.311 0.010
article is copyrighted as indicated in the article. Reuse of AIP content is subject to the terms at: http://scitation.aip.o
Components:
~1! 2-Methyl-2-propanol~tert-butanol, tert-butyl alcohol!;C4H10O; @75-65-0#~2! Mesitylene~1,3,5-trimethylbenzene!; C9H12 ; @108-67-8#~3! Water; H2O; @7732-18-5#
Variables:T/K5298
8.10. 2-Methyl-2-propanolExperimenta
Compositions along t
t/°CT/K
~compiler! x1
25.0 298.2 0.000
0.115
0.164
0.224
0.304
0.375
0.413
0.425
0.401
0.349
0.267
0.149
0.000
Compositions of co
t/°CT/K
~compiler!
x18 x28 x19
hydrocarbon-rich phase water-ric
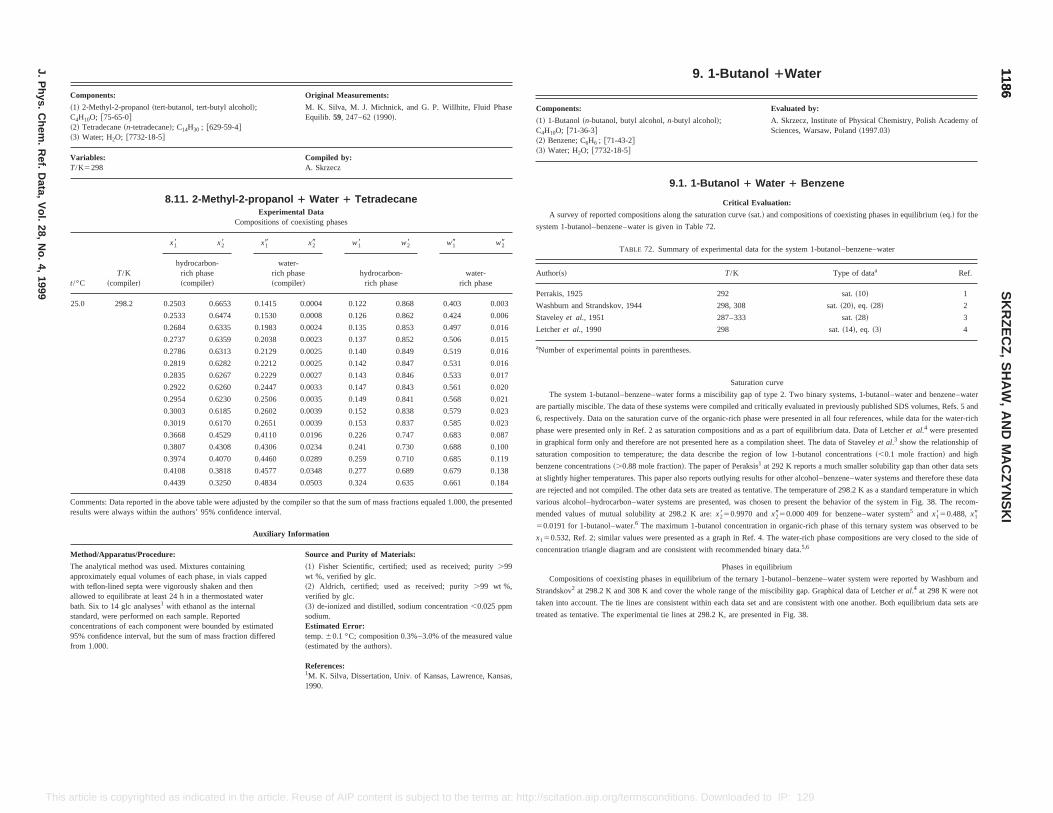
9. 1-Butanol 1Water
Evaluated by:
cohol,n-butyl alcohol!; A. Skrzecz, Institute of Physical Chemistry, Polish Academy ofSciences, Warsaw, Poland~1997.03!
9.1. 1-Butanol 1 Water 1 Benzene
Critical Evaluation:
itions along the saturation curve~sat.! and compositions of coexisting phases in equilibrium~eq.! for the
ter is given in Table 72.
2. Summary of experimental data for the system 1-butanol–benzene–water
T/K Type of dataa Ref.
292 sat.~10! 1
4 298, 308 sat.~20!, eq. ~28! 2
287–333 sat.~28! 3
298 sat.~14!, eq. ~3! 4
in parentheses.
Saturation curve
ene–water forms a miscibility gap of type 2. Two binary systems, 1-butanol–water and benzene–water
f these systems were compiled and critically evaluated in previously published SDS volumes, Refs. 5 and
ration curve of the organic-rich phase were presented in all four references, while data for the water-rich
ef. 2 as saturation compositions and as a part of equilibrium data. Data of Letcheret al.4 were presented
fore are not presented here as a compilation sheet. The data of Staveleyet al.3 show the relationship of
erature; the data describe the region of low 1-butanol concentrations~,0.1 mole fraction! and high
le fraction!. The paper of Peraksis1 at 292 K reports a much smaller solubility gap than other data sets
his paper also reports outlying results for other alcohol–benzene–water systems and therefore these data
he other data sets are treated as tentative. The temperature of 298.2 K as a standard temperature in which
ater systems are presented, was chosen to present the behavior of the system in Fig. 38. The recom-
bility at 298.2 K are:x2850.9970 andx2950.000 409 for benzene–water system5 and x1850.488, x19
e maximum 1-butanol concentration in organic-rich phase of this ternary system was observed to be
as a graph in Ref. 4. The water-rich phase compositions are very closed to the side of
nt with recommended binary data.5,6
Phases in equilibrium
rium of the ternary 1-butanol–benzene–water system were reported by Washburn and
whole range of the miscibility gap. Graphical data of Letcheret al.4 at 298 K were not
within each data set and are consistent with one another. Both equilibrium data sets are
t 298.2 K, are presented in Fig. 38.
11861186
SK
RZ
EC
Z,
SH
AW
,A
ND
MA
CZ
YN
SK
I
J.P
hys.C
hem.
Ref.
Data,
Vol.
28,N
o.4,
1999
This ownloaded to IP: 129.6.105.191 On: Fri, 05 Sep 2014 17:51:55
Auxiliary Information
Method/Apparatus/Procedure: Source and Purity of Materials:
The analytical method was used. Mixtures containingapproximately equal volumes of each phase, in vials cappedwith teflon-lined septa were vigorously shaken and thenallowed to equilibrate at least 24 h in a thermostated waterbath. Six to 14 glc analyses1 with ethanol as the internalstandard, were performed on each sample. Reportedconcentrations of each component were bounded by estimated95% confidence interval, but the sum of mass fraction differedfrom 1.000.
~1! Fisher Scientific, certified; used as received; purity.99wt %, verified by glc.~2! Aldrich, certified; used as received; purity.99 wt %,verified by glc.~3! de-ionized and distilled, sodium concentration,0.025 ppmsodium.Estimated Error:temp.60.1 °C; composition 0.3%–3.0% of the measured value~estimated by the authors!.
References:1M. K. Silva, Dissertation, Univ. of Kansas, Lawrence, Kansas,1990.
x150.532, Ref. 2; similar values were presented
concentration triangle diagram and are consiste
Compositions of coexisting phases in equilib
Strandskov2 at 298.2 K and 308 K and cover the
taken into account. The tie lines are consistent
treated as tentative. The experimental tie lines a
article is copyrighted as indicated in the article. Reuse of AIP content is subject to the terms at: http://scitation.aip.org/termsconditions. D
Components: Original Measurements:
~1! 2-Methyl-2-propanol~tert-butanol, tert-butyl alcohol!;C4H10O; @75-65-0#~2! Tetradecane~n-tetradecane!; C14H30 ; @629-59-4#~3! Water; H2O; @7732-18-5#
M. K. Silva, M. J. Michnick, and G. P. Willhite, Fluid PhaseEquilib. 59, 247–62~1990!.
Variables:T/K5298
Compiled by:A. Skrzecz
8.11. 2-Methyl-2-propanol 1 Water 1 TetradecaneExperimental Data
Compositions of coexisting phases
t/°CT/K
~compiler!
x18 x28 x19 x29 w18 w28 w19 w29
hydrocarbon-rich phase~compiler!
water-rich phase~compiler!
hydrocarbon-rich phase
water-rich phase
25.0 298.2 0.2503 0.6653 0.1415 0.0004 0.122 0.868 0.403 0.003
0.2533 0.6474 0.1530 0.0008 0.126 0.862 0.424 0.006
0.2684 0.6335 0.1983 0.0024 0.135 0.853 0.497 0.016
0.2737 0.6359 0.2038 0.0023 0.137 0.852 0.506 0.015
0.2786 0.6313 0.2129 0.0025 0.140 0.849 0.519 0.016
0.2819 0.6282 0.2212 0.0025 0.142 0.847 0.531 0.016
0.2835 0.6267 0.2229 0.0027 0.143 0.846 0.533 0.017
0.2922 0.6260 0.2447 0.0033 0.147 0.843 0.561 0.020
0.2954 0.6230 0.2506 0.0035 0.149 0.841 0.568 0.021
0.3003 0.6185 0.2602 0.0039 0.152 0.838 0.579 0.023
0.3019 0.6170 0.2651 0.0039 0.153 0.837 0.585 0.023
0.3668 0.4529 0.4110 0.0196 0.226 0.747 0.683 0.087
0.3807 0.4308 0.4306 0.0234 0.241 0.730 0.688 0.100
0.3974 0.4070 0.4460 0.0289 0.259 0.710 0.685 0.119
0.4108 0.3818 0.4577 0.0348 0.277 0.689 0.679 0.138
0.4439 0.3250 0.4834 0.0503 0.324 0.635 0.661 0.184
Comments: Data reported in the above table were adjusted by the compiler so that the sum of mass fractions equaled 1.000, the presentedresults were always within the authors’ 95% confidence interval.
Components:
~1! 1-Butanol~n-butanol, butyl alC4H10O; @71-36-3#~2! Benzene; C6H6 ; @71-43-2#~3! Water; H2O; @7732-18-5#
A survey of reported compos
system 1-butanol–benzene–wa
TABLE 7
Author~s!
Perrakis, 1925
Washburn and Strandskov, 194
Staveleyet al., 1951
Letcheret al., 1990
aNumber of experimental points
The system 1-butanol–benz
are partially miscible. The data o
6, respectively. Data on the satu
phase were presented only in R
in graphical form only and there
saturation composition to temp
benzene concentrations~.0.88 mo
at slightly higher temperatures. T
are rejected and not compiled. T
various alcohol–hydrocarbon–w
mended values of mutual solu
50.0191 for 1-butanol–water.6 Th
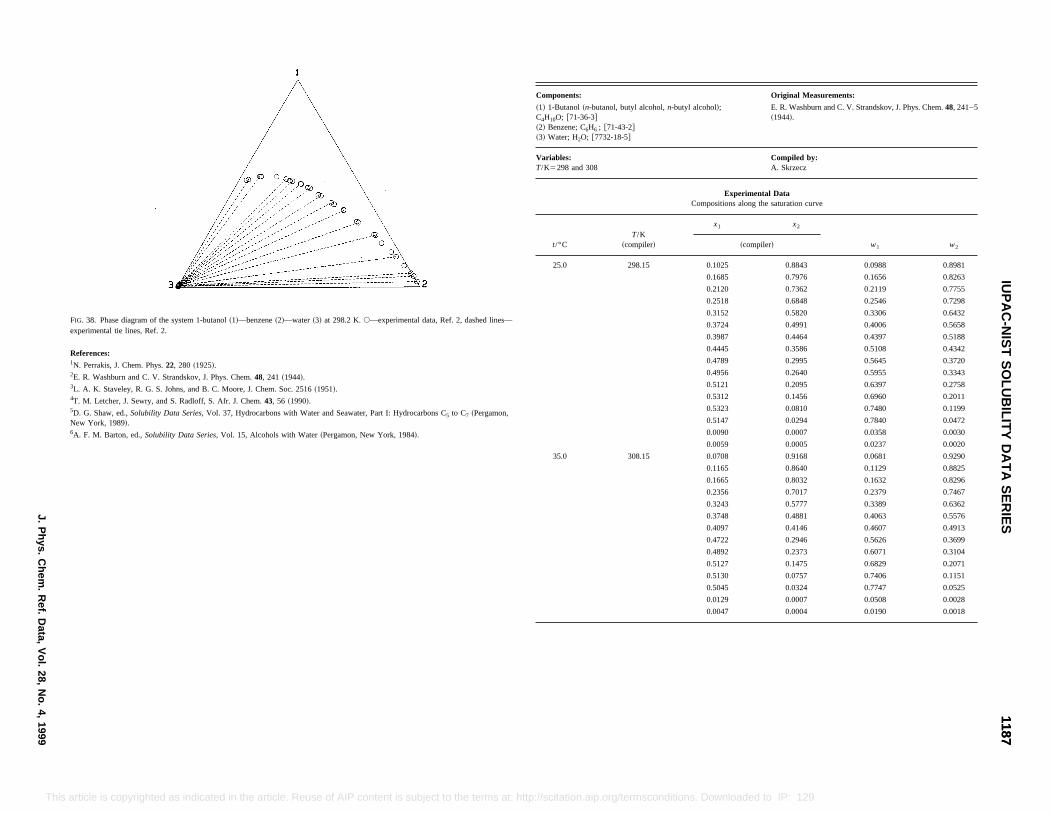
Original Measurements:
utyl alcohol!; E. R. Washburn and C. V. Strandskov, J. Phys. Chem.48, 241–5~1944!.
Compiled by:A. Skrzecz
Experimental DataCompositions along the saturation curve
x1 x2
w1 w2~compiler!
0.1025 0.8843 0.0988 0.8981
0.1685 0.7976 0.1656 0.8263
0.2120 0.7362 0.2119 0.7755
0.2518 0.6848 0.2546 0.7298
0.3152 0.5820 0.3306 0.6432
0.3724 0.4991 0.4006 0.5658
0.3987 0.4464 0.4397 0.5188
0.4445 0.3586 0.5108 0.4342
0.4789 0.2995 0.5645 0.3720
0.4956 0.2640 0.5955 0.3343
0.5121 0.2095 0.6397 0.2758
0.5312 0.1456 0.6960 0.2011
0.5323 0.0810 0.7480 0.1199
0.5147 0.0294 0.7840 0.0472
0.0090 0.0007 0.0358 0.0030
0.0059 0.0005 0.0237 0.0020
0.0708 0.9168 0.0681 0.9290
0.1165 0.8640 0.1129 0.8825
0.1665 0.8032 0.1632 0.8296
0.2356 0.7017 0.2379 0.7467
0.3243 0.5777 0.3389 0.6362
0.3748 0.4881 0.4063 0.5576
0.4097 0.4146 0.4607 0.4913
0.4722 0.2946 0.5626 0.3699
0.4892 0.2373 0.6071 0.3104
0.5127 0.1475 0.6829 0.2071
0.5130 0.0757 0.7406 0.1151
0.5045 0.0324 0.7747 0.0525
0.0129 0.0007 0.0508 0.0028
0.0047 0.0004 0.0190 0.0018
11871187
IUP
AC
-NIS
TS
OLU
BILIT
YD
AT
AS
ER
IESJ.P
hys.C
hem.
Ref.
Data,
Vol.
28,N
o.4,
1999
This terms at: http://scitation.aip.org/termsconditions. Downloaded to IP: 129.6.105.191 On: Fri, 05 Sep 2014 17:51:55
article is copyrighted as indicated in the article. Reuse of AIP content is subject to theFIG. 38. Phase diagram of the system 1-butanol~1!—benzene~2!—water~3! at 298.2 K.s—experimental data, Ref. 2, dashed lines—experimental tie lines, Ref. 2.
References:1N. Perrakis, J. Chem. Phys.22, 280 ~1925!.2E. R. Washburn and C. V. Strandskov, J. Phys. Chem.48, 241 ~1944!.3L. A. K. Staveley, R. G. S. Johns, and B. C. Moore, J. Chem. Soc. 2516~1951!.4T. M. Letcher, J. Sewry, and S. Radloff, S. Afr. J. Chem.43, 56 ~1990!.5D. G. Shaw, ed.,Solubility Data Series, Vol. 37, Hydrocarbons with Water and Seawater, Part I: Hydrocarbons C5 to C7 ~Pergamon,New York, 1989!.6A. F. M. Barton, ed.,Solubility Data Series, Vol. 15, Alcohols with Water~Pergamon, New York, 1984!.
Components:
~1! 1-Butanol~n-butanol, butyl alcohol,n-bC4H10O; @71-36-3#~2! Benzene; C6H6 ; @71-43-2#~3! Water; H2O; @7732-18-5#
Variables:T/K5298 and 308
t/°CT/K
~compiler!
25.0 298.15
35.0 308.15
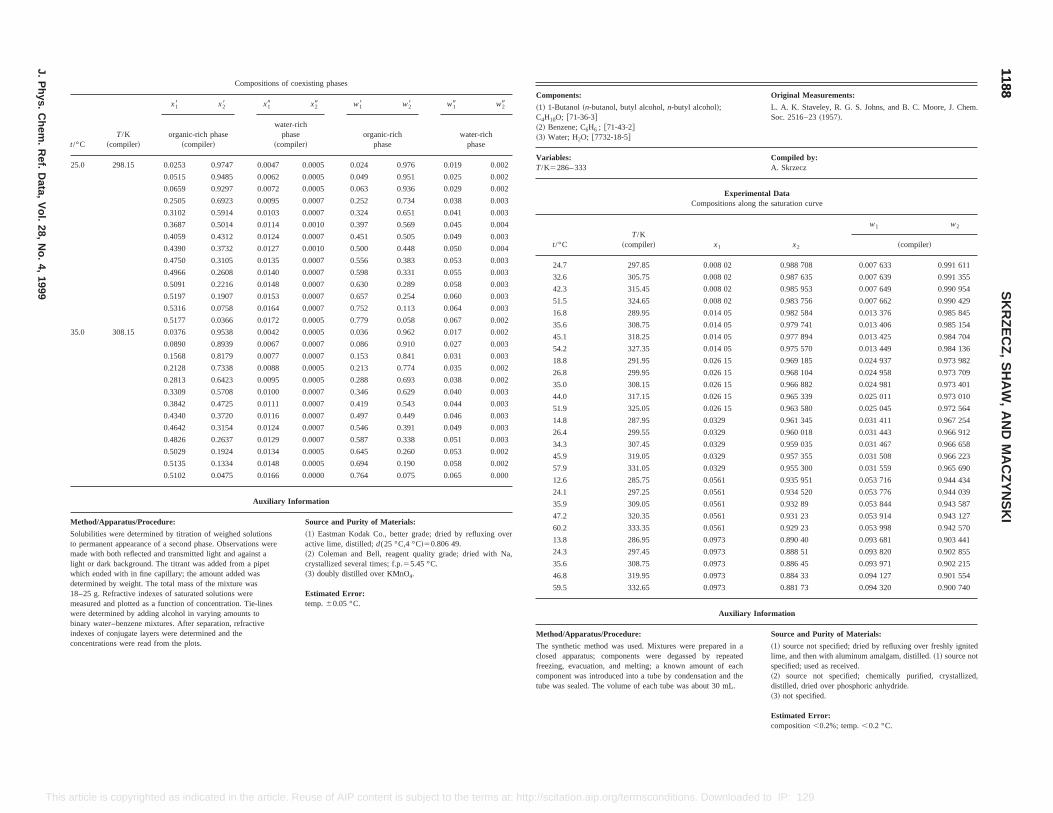
Original Measurements:
L. A. K. Staveley, R. G. S. Johns, and B. C. Moore, J. Chem.Soc. 2516–23~1957!.
Compiled by:A. Skrzecz
imental Datalong the saturation curve
x2
w1 w2
~compiler!
0.988 708 0.007 633 0.991 611
0.987 635 0.007 639 0.991 355
0.985 953 0.007 649 0.990 954
0.983 756 0.007 662 0.990 429
0.982 584 0.013 376 0.985 845
0.979 741 0.013 406 0.985 154
0.977 894 0.013 425 0.984 704
0.975 570 0.013 449 0.984 136
0.969 185 0.024 937 0.973 982
0.968 104 0.024 958 0.973 709
0.966 882 0.024 981 0.973 401
0.965 339 0.025 011 0.973 010
0.963 580 0.025 045 0.972 564
0.961 345 0.031 411 0.967 254
0.960 018 0.031 443 0.966 912
0.959 035 0.031 467 0.966 658
0.957 355 0.031 508 0.966 223
0.955 300 0.031 559 0.965 690
0.935 951 0.053 716 0.944 434
0.934 520 0.053 776 0.944 039
0.932 89 0.053 844 0.943 587
0.931 23 0.053 914 0.943 127
0.929 23 0.053 998 0.942 570
0.0973 0.890 40 0.093 681 0.903 441
0.0973 0.888 51 0.093 820 0.902 855
0.0973 0.886 45 0.093 971 0.902 215
0.0973 0.884 33 0.094 127 0.901 554
0.0973 0.881 73 0.094 320 0.900 740
Auxiliary Information
Source and Purity of Materials:
Mixtures were prepared in awere degassed by repeated; a known amount of eachtube by condensation and theach tube was about 30 mL.
~1! source not specified; dried by refluxing over freshly ignitedlime, and then with aluminum amalgam, distilled.~1! source notspecified; used as received.~2! source not specified; chemically purified, crystallized,distilled, dried over phosphoric anhydride.~3! not specified.
Estimated Error:composition,0.2%; temp.,0.2 °C.
11881188
SK
RZ
EC
Z,
SH
AW
,A
ND
MA
CZ
YN
SK
I
J.P
hys.C
hem.
Ref.
Data,
Vol.
28,N
o.4,
1999
This nditions. Downloaded to IP: 129.6.105.191 On: Fri, 05 Sep 2014 17:51:55
Solubilities were determined by titration of weighed solutionsto permanent appearance of a second phase. Observations weremade with both reflected and transmitted light and against alight or dark background. The titrant was added from a pipetwhich ended with in fine capillary; the amount added wasdetermined by weight. The total mass of the mixture was18–25 g. Refractive indexes of saturated solutions weremeasured and plotted as a function of concentration. Tie-lineswere determined by adding alcohol in varying amounts tobinary water–benzene mixtures. After separation, refractiveindexes of conjugate layers were determined and theconcentrations were read from the plots.
~1! Eastman Kodak Co., better grade; dried by refluxing overactive lime, distilled;d(25 °C,4 °C!50.806 49.~2! Coleman and Bell, reagent quality grade; dried with Na,crystallized several times; f.p.55.45 °C.~3! doubly distilled over KMnO4.
Estimated Error:temp.60.05 °C.
13.8 286.95
24.3 297.45
35.6 308.75
46.8 319.95
59.5 332.65
Method/Apparatus/Procedure:
The synthetic method was used.closed apparatus; componentsfreezing, evacuation, and meltingcomponent was introduced into atube was sealed. The volume of e
article is copyrighted as indicated in the article. Reuse of AIP content is subject to the terms at: http://scitation.aip.org/termsco
Compositions of coexisting phases
t/°CT/K
~compiler!
x18 x28 x19 x29 w18 w28 w19 w29
organic-rich phase~compiler!
water-richphase
~compiler!organic-rich
phasewater-rich
phase
25.0 298.15 0.0253 0.9747 0.0047 0.0005 0.024 0.976 0.019 0.002
0.0515 0.9485 0.0062 0.0005 0.049 0.951 0.025 0.002
0.0659 0.9297 0.0072 0.0005 0.063 0.936 0.029 0.002
0.2505 0.6923 0.0095 0.0007 0.252 0.734 0.038 0.003
0.3102 0.5914 0.0103 0.0007 0.324 0.651 0.041 0.003
0.3687 0.5014 0.0114 0.0010 0.397 0.569 0.045 0.004
0.4059 0.4312 0.0124 0.0007 0.451 0.505 0.049 0.003
0.4390 0.3732 0.0127 0.0010 0.500 0.448 0.050 0.004
0.4750 0.3105 0.0135 0.0007 0.556 0.383 0.053 0.003
0.4966 0.2608 0.0140 0.0007 0.598 0.331 0.055 0.003
0.5091 0.2216 0.0148 0.0007 0.630 0.289 0.058 0.003
0.5197 0.1907 0.0153 0.0007 0.657 0.254 0.060 0.003
0.5316 0.0758 0.0164 0.0007 0.752 0.113 0.064 0.003
0.5177 0.0366 0.0172 0.0005 0.779 0.058 0.067 0.002
35.0 308.15 0.0376 0.9538 0.0042 0.0005 0.036 0.962 0.017 0.002
0.0890 0.8939 0.0067 0.0007 0.086 0.910 0.027 0.003
0.1568 0.8179 0.0077 0.0007 0.153 0.841 0.031 0.003
0.2128 0.7338 0.0088 0.0005 0.213 0.774 0.035 0.002
0.2813 0.6423 0.0095 0.0005 0.288 0.693 0.038 0.002
0.3309 0.5708 0.0100 0.0007 0.346 0.629 0.040 0.003
0.3842 0.4725 0.0111 0.0007 0.419 0.543 0.044 0.003
0.4340 0.3720 0.0116 0.0007 0.497 0.449 0.046 0.003
0.4642 0.3154 0.0124 0.0007 0.546 0.391 0.049 0.003
0.4826 0.2637 0.0129 0.0007 0.587 0.338 0.051 0.003
0.5029 0.1924 0.0134 0.0005 0.645 0.260 0.053 0.002
0.5135 0.1334 0.0148 0.0005 0.694 0.190 0.058 0.002
0.5102 0.0475 0.0166 0.0000 0.764 0.075 0.065 0.000
Auxiliary Information
Method/Apparatus/Procedure: Source and Purity of Materials:
Components:
~1! 1-Butanol~n-butanol, butyl alcohol,n-butyl alcohol!;C4H10O; @71-36-3#~2! Benzene; C6H6 ; @71-43-2#~3! Water; H2O; @7732-18-5#
Variables:T/K5286– 333
ExperCompositions a
t/°CT/K
~compiler! x1
24.7 297.85 0.008 02
32.6 305.75 0.008 02
42.3 315.45 0.008 02
51.5 324.65 0.008 02
16.8 289.95 0.014 05
35.6 308.75 0.014 05
45.1 318.25 0.014 05
54.2 327.35 0.014 05
18.8 291.95 0.026 15
26.8 299.95 0.026 15
35.0 308.15 0.026 15
44.0 317.15 0.026 15
51.9 325.05 0.026 15
14.8 287.95 0.0329
26.4 299.55 0.0329
34.3 307.45 0.0329
45.9 319.05 0.0329
57.9 331.05 0.0329
12.6 285.75 0.0561
24.1 297.25 0.0561
35.9 309.05 0.0561
47.2 320.35 0.0561
60.2 333.35 0.0561
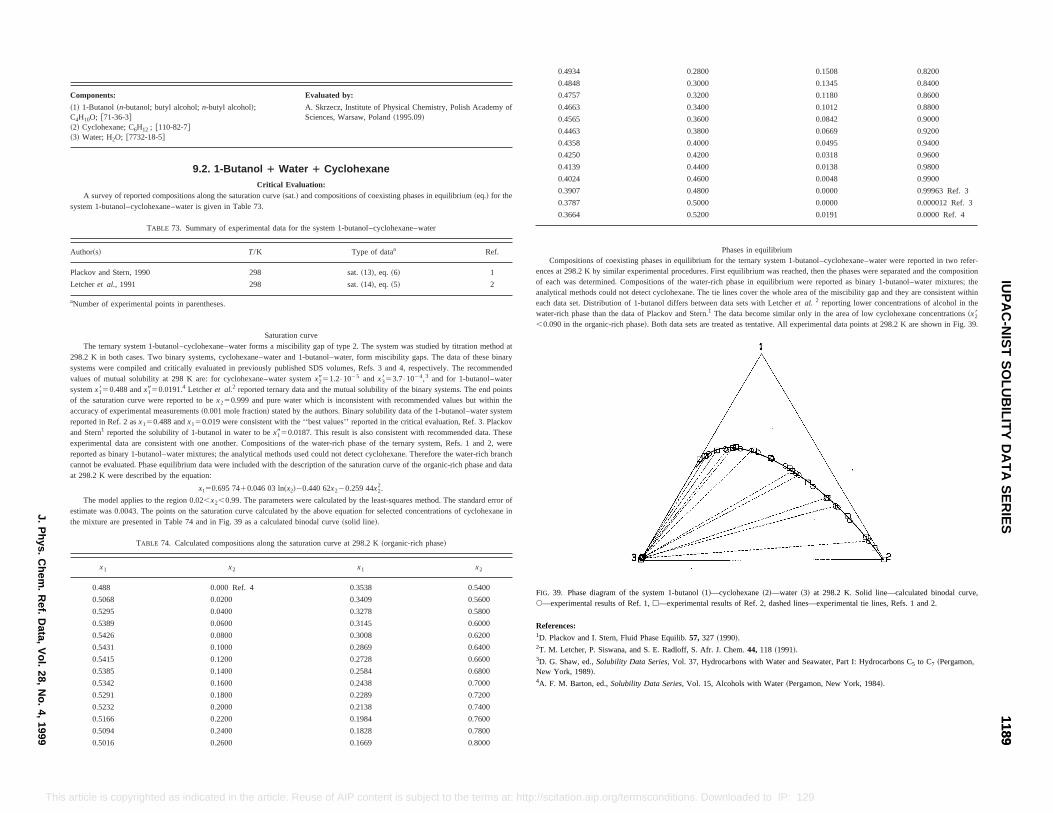
0.1508 0.8200
0.1345 0.8400
0.1180 0.8600
0.1012 0.8800
0.0842 0.9000
0.0669 0.9200
0.0495 0.9400
0.0318 0.9600
0.0138 0.9800
0.0048 0.9900
0.0000 0.99963 Ref. 3
0.0000 0.000012 Ref. 3
0.0191 0.0000 Ref. 4
Phases in equilibriumfor the ternary system 1-butanol–cyclohexane–water were reported in two refer-
s. First equilibrium was reached, then the phases were separated and the compositionr-rich phase in equilibrium were reported as binary 1-butanol–water mixtures; thee tie lines cover the whole area of the miscibility gap and they are consistent within
een data sets with Letcheret al. 2 reporting lower concentrations of alcohol in then.he data become similar only in the area of low cyclohexane concentrations~x28treated as tentative. All experimental data points at 298.2 K are shown in Fig. 39.
~2!—water ~3! at 298.2 K. Solid line—calculated binodal curve,f. 2, dashed lines—experimental tie lines, Refs. 1 and 2.
118 ~1991!.
ith Water and Seawater, Part I: Hydrocarbons C5 to C7 ~Pergamon,
Water~Pergamon, New York, 1984!.
11891189
IUP
AC
-NIS
TS
OLU
BILIT
YD
AT
AS
ER
IESJ.P
hys.C
hem.
Ref.
Data,
Vol.
28,N
o.4,
1999
This to IP: 129.6.105.191 On: Fri, 05 Sep 2014 17:51:55
TABLE 74. Calculated compositions along the saturation curve at 298.2 K~organic-rich phase!
x1 x2 x1 x2
0.488 0.000 Ref. 4 0.3538 0.5400
0.5068 0.0200 0.3409 0.5600
0.5295 0.0400 0.3278 0.5800
0.5389 0.0600 0.3145 0.6000
0.5426 0.0800 0.3008 0.6200
0.5431 0.1000 0.2869 0.6400
0.5415 0.1200 0.2728 0.6600
0.5385 0.1400 0.2584 0.6800
0.5342 0.1600 0.2438 0.7000
0.5291 0.1800 0.2289 0.7200
0.5232 0.2000 0.2138 0.7400
0.5166 0.2200 0.1984 0.7600
0.5094 0.2400 0.1828 0.7800
0.5016 0.2600 0.1669 0.8000
FIG. 39. Phase diagram of the system 1-butanol~1!—cyclohexanes—experimental results of Ref. 1,h—experimental results of Re
References:1D. Plackov and I. Stern, Fluid Phase Equilib.57, 327 ~1990!.2T. M. Letcher, P. Siswana, and S. E. Radloff, S. Afr. J. Chem.44,3D. G. Shaw, ed.,Solubility Data Series, Vol. 37, Hydrocarbons wNew York, 1989!.4A. F. M. Barton, ed.,Solubility Data Series,Vol. 15, Alcohols with
article is copyrighted as indicated in the article. Reuse of AIP content is subject to the terms at: http://scitation.aip.org/termsconditions. Downloaded
Components: Evaluated by:
~1! 1-Butanol~n-butanol; butyl alcohol;n-butyl alcohol!;C4H10O; @71-36-3#~2! Cyclohexane; C6H12 ; @110-82-7#~3! Water; H2O; @7732-18-5#
A. Skrzecz, Institute of Physical Chemistry, Polish Academy ofSciences, Warsaw, Poland~1995.09!
9.2. 1-Butanol 1 Water 1 CyclohexaneCritical Evaluation:
A survey of reported compositions along the saturation curve~sat.! and compositions of coexisting phases in equilibrium~eq.! for thesystem 1-butanol–cyclohexane–water is given in Table 73.
TABLE 73. Summary of experimental data for the system 1-butanol–cyclohexane–water
Author~s! T/K Type of dataa Ref.
Plackov and Stern, 1990 298 sat.~13!, eq. ~6! 1
Letcheret al., 1991 298 sat.~14!, eq. ~5! 2
aNumber of experimental points in parentheses.
Saturation curveThe ternary system 1-butanol–cyclohexane–water forms a miscibility gap of type 2. The system was studied by titration method at
298.2 K in both cases. Two binary systems, cyclohexane–water and 1-butanol–water, form miscibility gaps. The data of these binarysystems were compiled and critically evaluated in previously published SDS volumes, Refs. 3 and 4, respectively. The recommendedvalues of mutual solubility at 298 K are: for cyclohexane–water systemx2951.2•1025 and x3853.7•1024,3 and for 1-butanol–watersystemx1850.488 andx1950.0191.4 Letcheret al.2 reported ternary data and the mutual solubility of the binary systems. The end pointsof the saturation curve were reported to bex250.999 and pure water which is inconsistent with recommended values but within theaccuracy of experimental measurements~0.001 mole fraction! stated by the authors. Binary solubility data of the 1-butanol–water systemreported in Ref. 2 asx150.488 andx150.019 were consistent with the ‘‘best values’’ reported in the critical evaluation, Ref. 3. Plackovand Stern1 reported the solubility of 1-butanol in water to bex1950.0187. This result is also consistent with recommended data. Theseexperimental data are consistent with one another. Compositions of the water-rich phase of the ternary system, Refs. 1 and 2, werereported as binary 1-butanol–water mixtures; the analytical methods used could not detect cyclohexane. Therefore the water-rich branchcannot be evaluated. Phase equilibrium data were included with the description of the saturation curve of the organic-rich phase and dataat 298.2 K were described by the equation:
x150.695 7410.046 03 ln~x2!20.440 62x220.259 44x22.
The model applies to the region 0.02,x2,0.99. The parameters were calculated by the least-squares method. The standard error ofestimate was 0.0043. The points on the saturation curve calculated by the above equation for selected concentrations of cyclohexane inthe mixture are presented in Table 74 and in Fig. 39 as a calculated binodal curve~solid line!.
0.4934 0.2800
0.4848 0.3000
0.4757 0.3200
0.4663 0.3400
0.4565 0.3600
0.4463 0.3800
0.4358 0.4000
0.4250 0.4200
0.4139 0.4400
0.4024 0.4600
0.3907 0.4800
0.3787 0.5000
0.3664 0.5200
Compositions of coexisting phases in equilibriumences at 298.2 K by similar experimental procedureof each was determined. Compositions of the wateanalytical methods could not detect cyclohexane. Theach data set. Distribution of 1-butanol differs betwwater-rich phase than the data of Plackov and Ster1 T,0.090 in the organic-rich phase!. Both data sets are
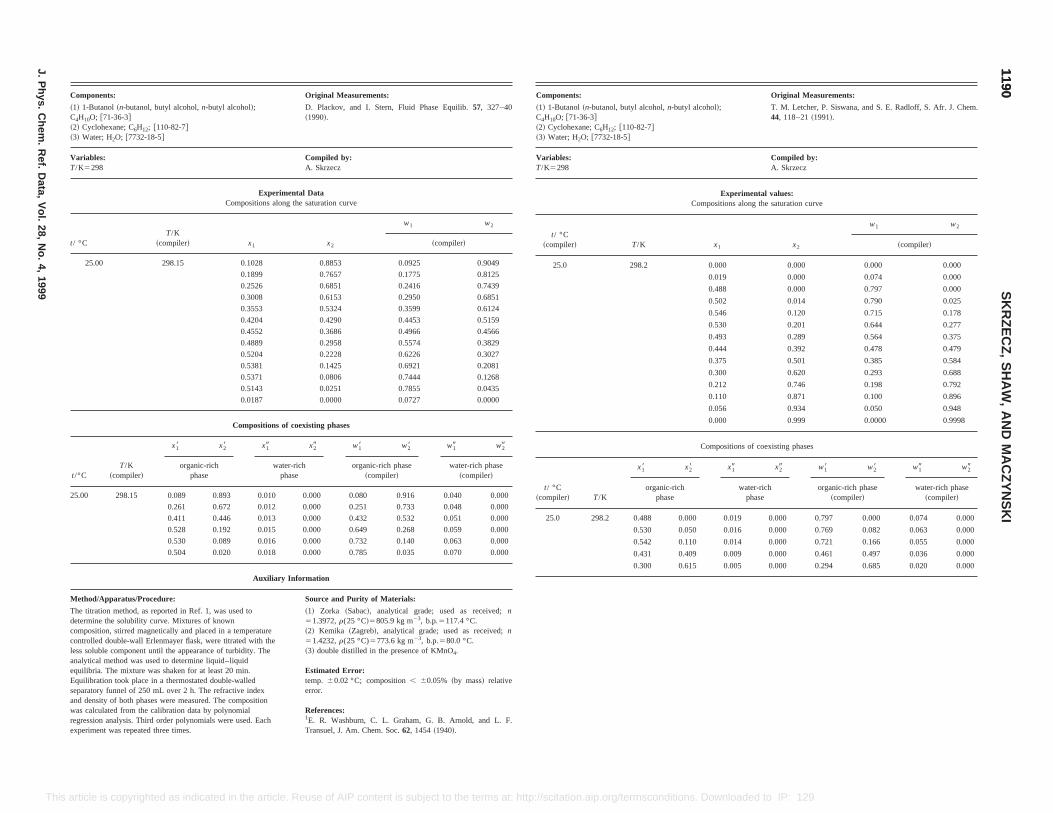
Original Measurements:
utanol, butyl alcohol,n-butyl alcohol!;#; C6H12; @110-82-7#7732-18-5#
T. M. Letcher, P. Siswana, and S. E. Radloff, S. Afr. J. Chem.44, 118–21~1991!.
Compiled by:A. Skrzecz
Experimental values:Compositions along the saturation curve
T/K x1 x2
w1 w2
~compiler!
298.2 0.000 0.000 0.000 0.000
0.019 0.000 0.074 0.000
0.488 0.000 0.797 0.000
0.502 0.014 0.790 0.025
0.546 0.120 0.715 0.178
0.530 0.201 0.644 0.277
0.493 0.289 0.564 0.375
0.444 0.392 0.478 0.479
0.375 0.501 0.385 0.584
0.300 0.620 0.293 0.688
0.212 0.746 0.198 0.792
0.110 0.871 0.100 0.896
0.056 0.934 0.050 0.948
0.000 0.999 0.0000 0.9998
Compositions of coexisting phases
T/K
x18 x28 x19 x29 w18 w28 w19 w29
organic-richphase
water-richphase
organic-rich phase~compiler!
water-rich phase~compiler!
298.2 0.488 0.000 0.019 0.000 0.797 0.000 0.074 0.000
6 0.000 0.769 0.082 0.063 0.000
4 0.000 0.721 0.166 0.055 0.000
9 0.000 0.461 0.497 0.036 0.000
5 0.000 0.294 0.685 0.020 0.000
11901190
SK
RZ
EC
Z,
SH
AW
,A
ND
MA
CZ
YN
SK
I
J.P
hys.C
hem.
Ref.
Data,
Vol.
28,N
o.4,
1999
This ded to IP: 129.6.105.191 On: Fri, 05 Sep 2014 17:51:55
0.528 0.192 0.015 0.000 0.649 0.268 0.059 0.000
0.530 0.089 0.016 0.000 0.732 0.140 0.063 0.000
0.504 0.020 0.018 0.000 0.785 0.035 0.070 0.000
Auxiliary Information
Method/Apparatus/Procedure: Source and Purity of Materials:
The titration method, as reported in Ref. 1, was used todetermine the solubility curve. Mixtures of knowncomposition, stirred magnetically and placed in a temperaturecontrolled double-wall Erlenmayer flask, were titrated with theless soluble component until the appearance of turbidity. Theanalytical method was used to determine liquid–liquidequilibria. The mixture was shaken for at least 20 min.Equilibration took place in a thermostated double-walledseparatory funnel of 250 mL over 2 h. The refractive indexand density of both phases were measured. The compositionwas calculated from the calibration data by polynomialregression analysis. Third order polynomials were used. Eachexperiment was repeated three times.
~1! Zorka ~Sabac!, analytical grade; used as received;n51.3972,r(25 °C!5805.9 kg m23, b.p.5117.4 °C.~2! Kemika ~Zagreb!, analytical grade; used as received;n51.4232,r(25 °C)5773.6 kg m23, b.p.580.0 °C.~3! double distilled in the presence of KMnO4.
Estimated Error:temp. 60.02 °C; composition, 60.05% ~by mass! relativeerror.
References:1E. R. Washburn, C. L. Graham, G. B. Arnold, and L. F.Transuel, J. Am. Chem. Soc.62, 1454~1940!.
0.530 0.050 0.01
0.542 0.110 0.01
0.431 0.409 0.00
0.300 0.615 0.00
article is copyrighted as indicated in the article. Reuse of AIP content is subject to the terms at: http://scitation.aip.org/termsconditions. Downloa
Components: Original Measurements:
~1! 1-Butanol~n-butanol, butyl alcohol,n-butyl alcohol!;C4H10O; @71-36-3#~2! Cyclohexane; C6H12; @110-82-7#~3! Water; H2O; @7732-18-5#
D. Plackov, and I. Stern, Fluid Phase Equilib.57, 327–40~1990!.
Variables:T/K5298
Compiled by:A. Skrzecz
Experimental DataCompositions along the saturation curve
t/ °CT/K
~compiler! x1 x2
w1 w2
~compiler!
25.00 298.15 0.1028 0.8853 0.0925 0.9049
0.1899 0.7657 0.1775 0.8125
0.2526 0.6851 0.2416 0.7439
0.3008 0.6153 0.2950 0.6851
0.3553 0.5324 0.3599 0.6124
0.4204 0.4290 0.4453 0.5159
0.4552 0.3686 0.4966 0.4566
0.4889 0.2958 0.5574 0.3829
0.5204 0.2228 0.6226 0.3027
0.5381 0.1425 0.6921 0.2081
0.5371 0.0806 0.7444 0.1268
0.5143 0.0251 0.7855 0.0435
0.0187 0.0000 0.0727 0.0000
Compositions of coexisting phases
t/°CT/K
~compiler!
x18 x28 x19 x29 w18 w28 w19 w29
organic-richphase
water-richphase
organic-rich phase~compiler!
water-rich phase~compiler!
25.00 298.15 0.089 0.893 0.010 0.000 0.080 0.916 0.040 0.000
0.261 0.672 0.012 0.000 0.251 0.733 0.048 0.000
0.411 0.446 0.013 0.000 0.432 0.532 0.051 0.000
Components:
~1! 1-Butanol~n-bC4H10O; @71-36-3~2! Cyclohexane~3! Water; H2O; @
Variables:T/K5298
t/ °C~compiler!
25.0
t/ °C~compiler!
25.0
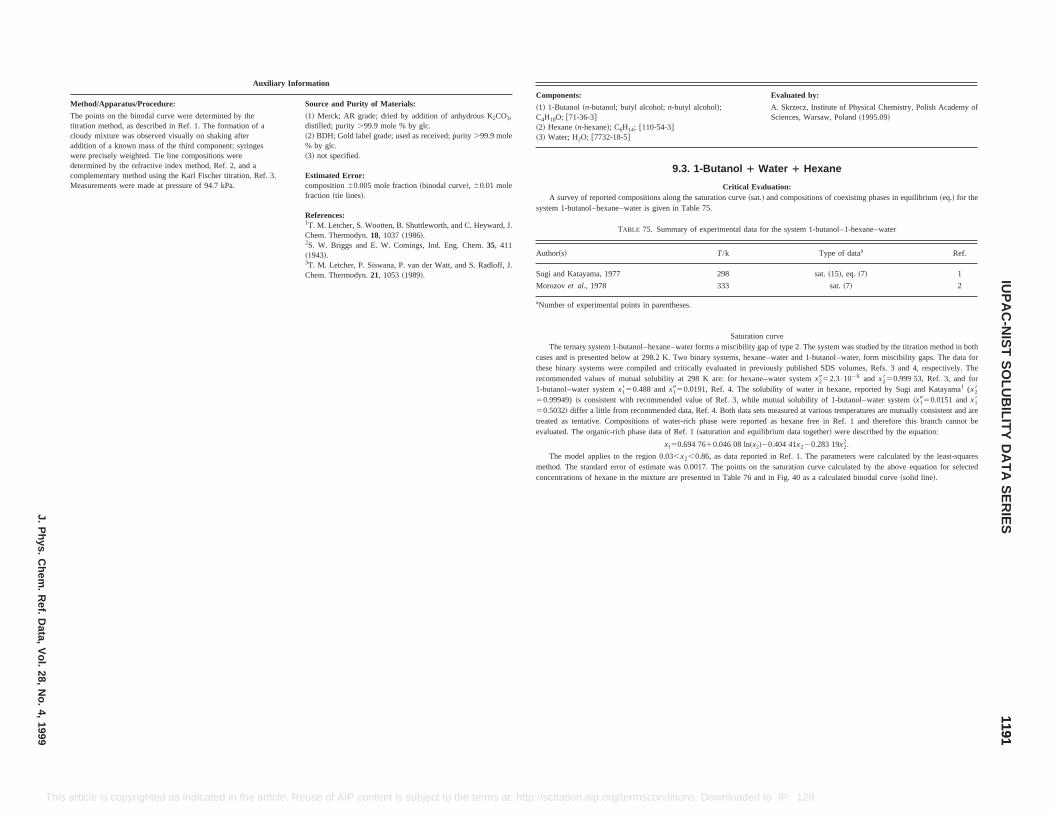
KCO3,
mole
mole
yward, J.
., 411
adloff, J.
Components: Evaluated by:
~1! 1-Butanol~n-butanol; butyl alcohol;n-butyl alcohol!;C4H10O; @71-36-3#~2! Hexane~n-hexane!; C6H14; @110-54-3#~3! Water; H2O; @7732-18-5#
A. Skrzecz, Institute of Physical Chemistry, Polish Academy ofSciences, Warsaw, Poland~1995.09!
9.3. 1-Butanol 1 Water 1 Hexane
Critical Evaluation:A survey of reported compositions along the saturation curve~sat.! and compositions of coexisting phases in equilibrium~eq.! for the
system 1-butanol–hexane–water is given in Table 75.
TABLE 75. Summary of experimental data for the system 1-butanol–1-hexane–water
Author~s! T/k Type of dataa Ref.
Sugi and Katayama, 1977 298 sat.~15!, eq. ~7! 1
Morozov et al., 1978 333 sat.~7! 2
aNumber of experimental points in parentheses.
Saturation curveThe ternary system 1-butanol–hexane–water forms a miscibility gap of type 2. The system was studied by the titration method in both
cases and is presented below at 298.2 K. Two binary systems, hexane–water and 1-butanol–water, form miscibility gaps. The data forthese binary systems were compiled and critically evaluated in previously published SDS volumes, Refs. 3 and 4, respectively. Therecommended values of mutual solubility at 298 K are: for hexane–water systemx2952.3•1026 and x2850.999 53, Ref. 3, and for1-butanol–water systemx1850.488 andx1950.0191, Ref. 4. The solubility of water in hexane, reported by Sugi and Katayama1 (x2850.99949) is consistent with recommended value of Ref. 3, while mutual solubility of 1-butanol–water system~x1950.0151 andx1850.5032! differ a little from recommended data, Ref. 4. Both data sets measured at various temperatures are mutually consistent and aretreated as tentative. Compositions of water-rich phase were reported as hexane free in Ref. 1 and therefore this branch cannot beevaluated. The organic-rich phase data of Ref. 1~saturation and equilibrium data together! were described by the equation:
x150.694 7610.046 08 ln~x2!20.404 41x220.283 19x22.
The model applies to the region 0.03,x2,0.86, as data reported in Ref. 1. The parameters were calculated by the least-squaresmethod. The standard error of estimate was 0.0017. The points on the saturation curve calculated by the above equation for selectedconcentrations of hexane in the mixture are presented in Table 76 and in Fig. 40 as a calculated binodal curve~solid line!.
11911191
IUP
AC
-NIS
TS
OLU
BILIT
YD
AT
AS
ER
IESJ.P
hys.C
hem.
Ref.
Data,
Vol.
28,N
o.4,
1999
This euse of AIP content is subject to the terms at: http://scitation.aip.org/termsconditions. Downloaded to IP: 129.6.105.191 On: Fri, 05 Sep 2014 17:51:55
article is copyrighted as indicated in the article. RAuxiliary Information
Method/Apparatus/Procedure: Source and Purity of Materials:
The points on the binodal curve were determined by thetitration method, as described in Ref. 1. The formation of acloudy mixture was observed visually on shaking afteraddition of a known mass of the third component; syringeswere precisely weighted. Tie line compositions weredetermined by the refractive index method, Ref. 2, and acomplementary method using the Karl Fischer titration, Ref. 3.Measurements were made at pressure of 94.7 kPa.
~1! Merck; AR grade; dried by addition of anhydrous2distilled; purity .99.9 mole % by glc.~2! BDH; Gold label grade; used as received; purity.99.9% by glc.~3! not specified.
Estimated Error:composition60.005 mole fraction~binodal curve!, 60.01fraction ~tie lines!.
References:1T. M. Letcher, S. Wootten, B. Shuttleworth, and C. HeChem. Thermodyn.18, 1037~1986!.2S. W. Briggs and E. W. Comings, Ind. Eng. Chem35~1943!.3T. M. Letcher, P. Siswana, P. van der Watt, and S. RChem. Thermodyn.21, 1053~1989!.
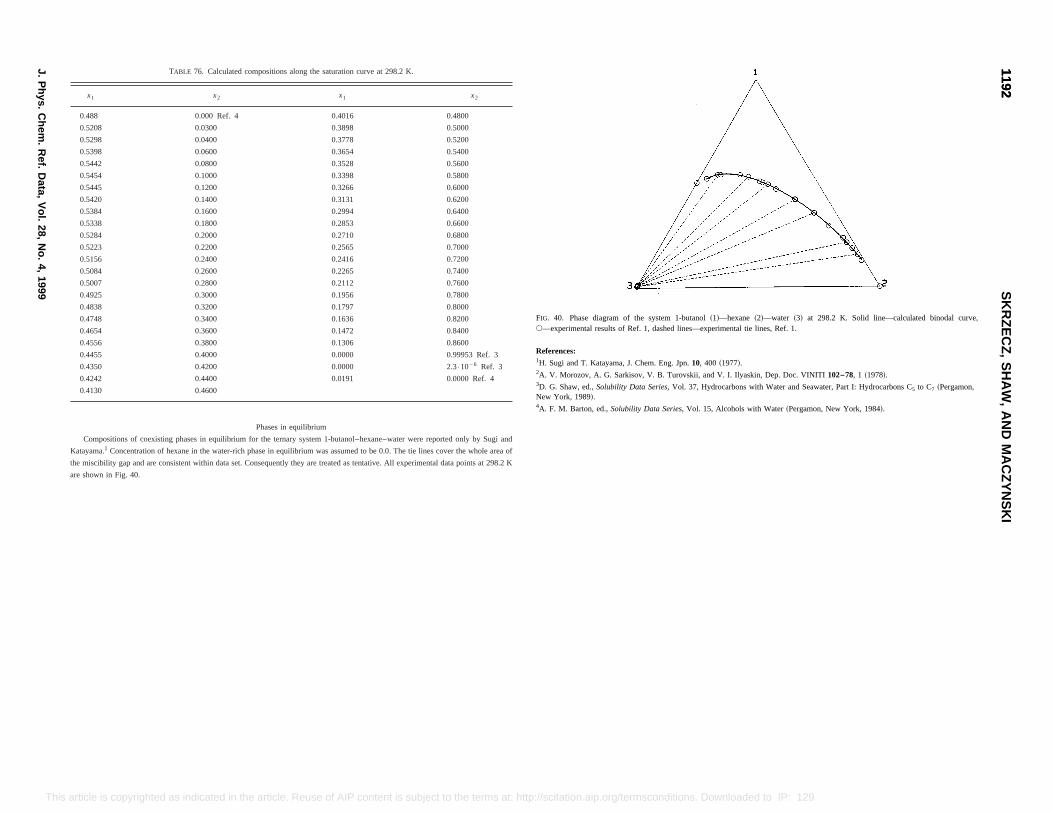
x2
0.4800
0.5000
0.5200
0.5400
0.5600
0.5800
0.6000
0.6200
0.6400
0.6600
0.6800
0.7000
0.7200
0.7400
0.7600
0.7800
0.8000
0.8200
0.8400
0.8600
0.99953 Ref. 3
2.3•1026 Ref. 3
0.0000 Ref. 4
re reported only by Sugi and
lines cover the whole area of
imental data points at 298.2 K
FIG. 40. Phase diagram of the system 1-butanol~1!—hexane ~2!—water ~3! at 298.2 K. Solid line—calculated binodal curve,s—experimental results of Ref. 1, dashed lines—experimental tie lines, Ref. 1.
References:1H. Sugi and T. Katayama, J. Chem. Eng. Jpn.10, 400 ~1977!.2A. V. Morozov, A. G. Sarkisov, V. B. Turovskii, and V. I. Ilyaskin, Dep. Doc. VINITI102–78, 1 ~1978!.3D. G. Shaw, ed.,Solubility Data Series, Vol. 37, Hydrocarbons with Water and Seawater, Part I: Hydrocarbons C5 to C7 ~Pergamon,New York, 1989!.4A. F. M. Barton, ed.,Solubility Data Series, Vol. 15, Alcohols with Water~Pergamon, New York, 1984!.
11921192
SK
RZ
EC
Z,
SH
AW
,A
ND
MA
CZ
YN
SK
I
J.P
hys.C
hem.
Ref.
Data,
Vol.
28,N
o.4,
1999
T s at: http://scitation.aip.org/termsconditions. Downloaded to IP: 129.6.105.191 On: Fri, 05 Sep 2014 17:51:55
his article is copyrighted as indicated in the article. Reuse of AIP content is subject to the termTABLE 76. Calculated compositions along the saturation curve at 298.2 K.
x1 x2 x1
0.488 0.000 Ref. 4 0.4016
0.5208 0.0300 0.3898
0.5298 0.0400 0.3778
0.5398 0.0600 0.3654
0.5442 0.0800 0.3528
0.5454 0.1000 0.3398
0.5445 0.1200 0.3266
0.5420 0.1400 0.3131
0.5384 0.1600 0.2994
0.5338 0.1800 0.2853
0.5284 0.2000 0.2710
0.5223 0.2200 0.2565
0.5156 0.2400 0.2416
0.5084 0.2600 0.2265
0.5007 0.2800 0.2112
0.4925 0.3000 0.1956
0.4838 0.3200 0.1797
0.4748 0.3400 0.1636
0.4654 0.3600 0.1472
0.4556 0.3800 0.1306
0.4455 0.4000 0.0000
0.4350 0.4200 0.0000
0.4242 0.4400 0.0191
0.4130 0.4600
Phases in equilibrium
Compositions of coexisting phases in equilibrium for the ternary system 1-butanol–hexane–water we
Katayama.1 Concentration of hexane in the water-rich phase in equilibrium was assumed to be 0.0. The tie
the miscibility gap and are consistent within data set. Consequently they are treated as tentative. All exper
are shown in Fig. 40.
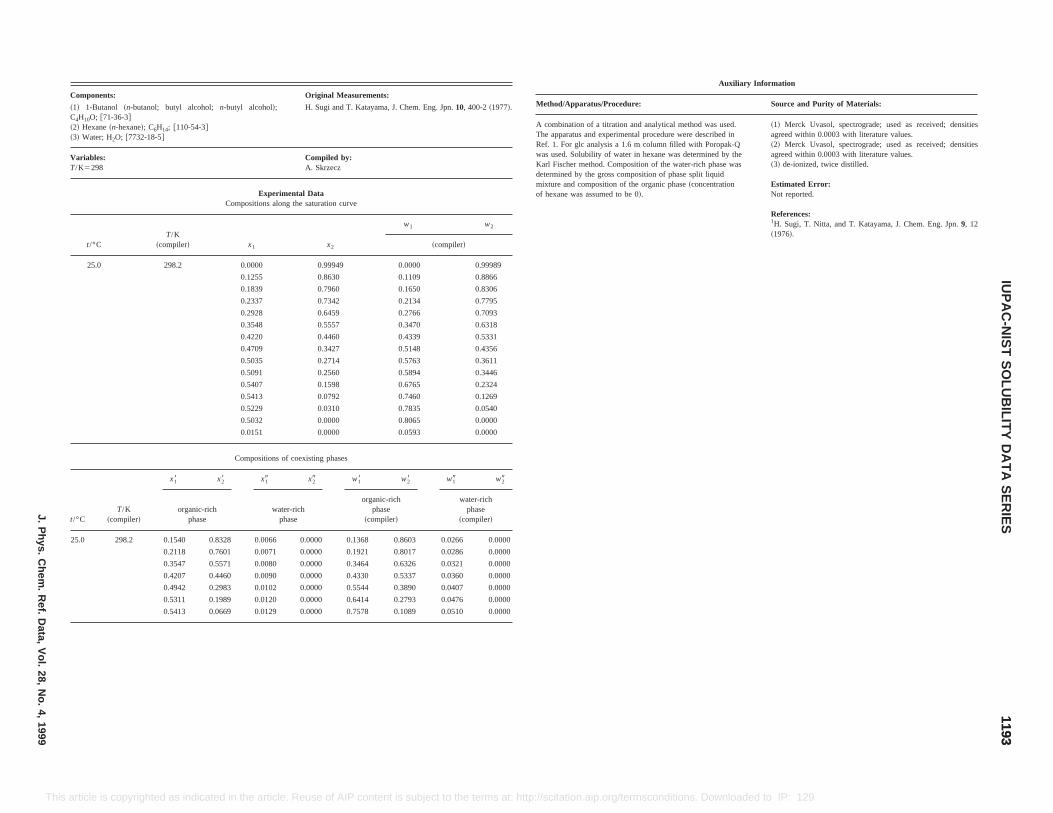
Original Measurements:
alcohol!; H. Sugi and T. Katayama, J. Chem. Eng. Jpn.10, 400-2~1977!.
Compiled by:A. Skrzecz
Experimental Datasitions along the saturation curve
1 x2
w1 w2
~compiler!
.0000 0.99949 0.0000 0.99989
255 0.8630 0.1109 0.8866
839 0.7960 0.1650 0.8306
337 0.7342 0.2134 0.7795
928 0.6459 0.2766 0.7093
548 0.5557 0.3470 0.6318
220 0.4460 0.4339 0.5331
709 0.3427 0.5148 0.4356
035 0.2714 0.5763 0.3611
091 0.2560 0.5894 0.3446
407 0.1598 0.6765 0.2324
413 0.0792 0.7460 0.1269
229 0.0310 0.7835 0.0540
032 0.0000 0.8065 0.0000
151 0.0000 0.0593 0.0000
positions of coexisting phases
x19 x29 w18 w28 w19 w29
water-richphase
organic-richphase
~compiler!
water-richphase
~compiler!
Auxiliary Information
Method/Apparatus/Procedure: Source and Purity of Materials:
A combination of a titration and analytical method was used.The apparatus and experimental procedure were described inRef. 1. For glc analysis a 1.6 m column filled with Poropak-Qwas used. Solubility of water in hexane was determined by theKarl Fischer method. Composition of the water-rich phase wasdetermined by the gross composition of phase split liquidmixture and composition of the organic phase~concentrationof hexane was assumed to be 0!.
~1! Merck Uvasol, spectrograde; used as received; densitiesagreed within 0.0003 with literature values.~2! Merck Uvasol, spectrograde; used as received; densitiesagreed within 0.0003 with literature values.~3! de-ionized, twice distilled.
Estimated Error:Not reported.
References:1H. Sugi, T. Nitta, and T. Katayama, J. Chem. Eng. Jpn.9, 12~1976!.
11931193
IUP
AC
-NIS
TS
OLU
BILIT
YD
AT
AS
ER
IESJ.P
hys.C
hem.
Ref.
Data,
Vol.
28,N
o.4,
1999
This conditions. Downloaded to IP: 129.6.105.191 On: Fri, 05 Sep 2014 17:51:55
25.0 298.2 0.1540 0.8328 0.0066 0.0000 0.1368 0.8603 0.0266 0.0000
0.2118 0.7601 0.0071 0.0000 0.1921 0.8017 0.0286 0.0000
0.3547 0.5571 0.0080 0.0000 0.3464 0.6326 0.0321 0.0000
0.4207 0.4460 0.0090 0.0000 0.4330 0.5337 0.0360 0.0000
0.4942 0.2983 0.0102 0.0000 0.5544 0.3890 0.0407 0.0000
0.5311 0.1989 0.0120 0.0000 0.6414 0.2793 0.0476 0.0000
0.5413 0.0669 0.0129 0.0000 0.7578 0.1089 0.0510 0.0000
article is copyrighted as indicated in the article. Reuse of AIP content is subject to the terms at: http://scitation.aip.org/terms
Components:
~1! 1-Butanol ~n-butanol; butyl alcohol; n-butylC4H10O; @71-36-3#~2! Hexane~n-hexane!; C6H14; @110-54-3#~3! Water; H2O; @7732-18-5#
Variables:T/K5298
Compo
t/°CT/K
~compiler! x
25.0 298.2 0
0.1
0.1
0.2
0.2
0.3
0.4
0.4
0.5
0.5
0.5
0.5
0.5
0.5
0.0
Com
t/°CT/K
~compiler!
x18 x28
organic-richphase
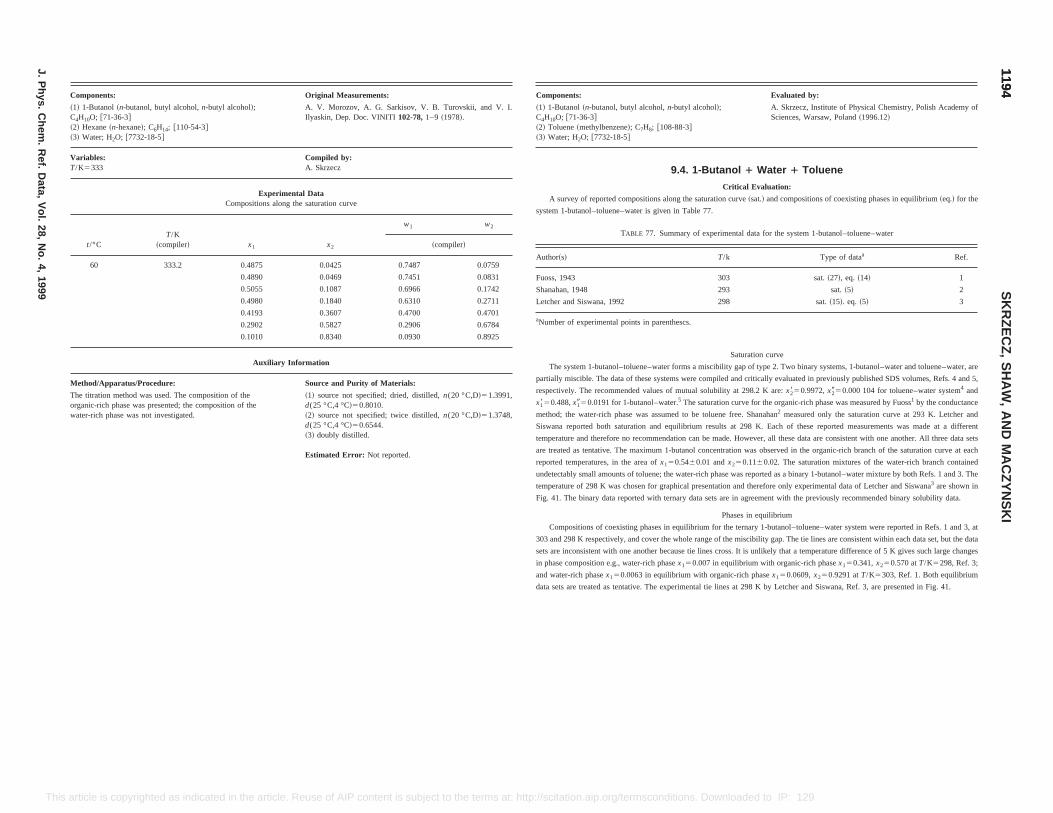
Evaluated by:
nol, butyl alcohol,n-butyl alcohol!;
enzene!; C7H8; @108-88-3#2-18-5#
A. Skrzecz, Institute of Physical Chemistry, Polish Academy ofSciences, Warsaw, Poland~1996.12!
9.4. 1-Butanol 1 Water 1 Toluene
Critical Evaluation:
rted compositions along the saturation curve~sat.! and compositions of coexisting phases in equilibrium~eq.! for the
oluene–water is given in Table 77.
TABLE 77. Summary of experimental data for the system 1-butanol–toluene–water
T/k Type of dataa Ref.
303 sat.~27!, eq. ~14! 1
293 sat.~5! 2
a, 1992 298 sat.~15!. eq. ~5! 3
ental points in parenthescs.
Saturation curve
utanol–toluene–water forms a miscibility gap of type 2. Two binary systems, 1-butanol–water and toluene–water, are
e data of these systems were compiled and critically evaluated in previously published SDS volumes, Refs. 4 and 5,
commended values of mutual solubility at 298.2 K are:x2850.9972,x2950.000 104 for toluene–water system4 and
1 for 1-butanol–water.5 The saturation curve for the organic-rich phase was measured by Fuoss1 by the conductance
rich phase was assumed to be toluene free. Shanahan2 measured only the saturation curve at 293 K. Letcher and
oth saturation and equilibrium results at 298 K. Each of these reported measurements was made at a different
erefore no recommendation can be made. However, all these data are consistent with one another. All three data sets
tive. The maximum 1-butanol concentration was observed in the organic-rich branch of the saturation curve at each
res, in the area ofx150.5460.01 andx250.1160.02. The saturation mixtures of the water-rich branch contained
amounts of toluene; the water-rich phase was reported as a binary 1-butanol–water mixture by both Refs. 1 and 3. The
K was chosen for graphical presentation and therefore only experimental data of Letcher and Siswana3 are shown in
data reported with ternary data sets are in agreement with the previously recommended binary solubility data.
Phases in equilibrium
f coexisting phases in equilibrium for the ternary 1-butanol–toluene–water system were reported in Refs. 1 and 3, at
303 and 298 K respectively, and cover the whole range of the miscibility gap. The tie lines are consistent within each data set, but the data
sets are inconsistent with one another because tie lines cross. It is unlikely that a temperature difference of 5 K gives such largechanges
in phase composition e.g., water-rich phasex150.007 in equilibrium with organic-rich phasex150.341,x250.570 atT/K5298, Ref. 3;
and water-rich phasex150.0063 in equilibrium with organic-rich phasex150.0609,x250.9291 atT/K5303, Ref. 1. Both equilibrium
data sets are treated as tentative. The experimental tie lines at 298 K by Letcher and Siswana, Ref. 3, are presented in Fig. 41.
11941194
SK
RZ
EC
Z,
SH
AW
,A
ND
MA
CZ
YN
SK
I
J.P
hys.C
hem.
Ref.
Data,
Vol.
28,N
o.4,
1999
This ms at: http://scitation.aip.org/termsconditions. Downloaded to IP: 129.6.105.191 On: Fri, 05 Sep 2014 17:51:55
article is copyrighted as indicated in the article. Reuse of AIP content is subject to the terComponents: Original Measurements:
~1! 1-Butanol~n-butanol, butyl alcohol,n-butyl alcohol!;C4H10O; @71-36-3#~2! Hexane~n-hexane!; C6H14; @110-54-3#~3! Water; H2O; @7732-18-5#
A. V. Morozov, A. G. Sarkisov, V. B. Turovskii, and V. I.Ilyaskin, Dep. Doc. VINITI102-78,1–9 ~1978!.
Variables:T/K5333
Compiled by:A. Skrzecz
Experimental DataCompositions along the saturation curve
t/°CT/K
~compiler! x1 x2
w1 w2
~compiler!
60 333.2 0.4875 0.0425 0.7487 0.0759
0.4890 0.0469 0.7451 0.0831
0.5055 0.1087 0.6966 0.1742
0.4980 0.1840 0.6310 0.2711
0.4193 0.3607 0.4700 0.4701
0.2902 0.5827 0.2906 0.6784
0.1010 0.8340 0.0930 0.8925
Auxiliary Information
Method/Apparatus/Procedure: Source and Purity of Materials:
The titration method was used. The composition of theorganic-rich phase was presented; the composition of thewater-rich phase was not investigated.
~1! source not specified; dried, distilled,n(20 °C,D!51.3991,d(25 °C,4 °C!50.8010.~2! source not specified; twice distilled,n(20 °C,D!51.3748,d(25 °C,4 °C!50.6544.~3! doubly distilled.
Estimated Error: Not reported.
Components:
~1! 1-Butanol~n-butaC4H10O; @71-36-3#~2! Toluene~methylb~3! Water; H2O; @773
A survey of repo
system 1-butanol–t
Author~s!
Fuoss, 1943
Shanahan, 1948
Letcher and Siswan
aNumber of experim
The system 1-b
partially miscible. Th
respectively. The re
x1850.488,x1950.019
method; the water-
Siswana reported b
temperature and th
are treated as tenta
reported temperatu
undetectably small
temperature of 298
Fig. 41. The binary
Compositions o
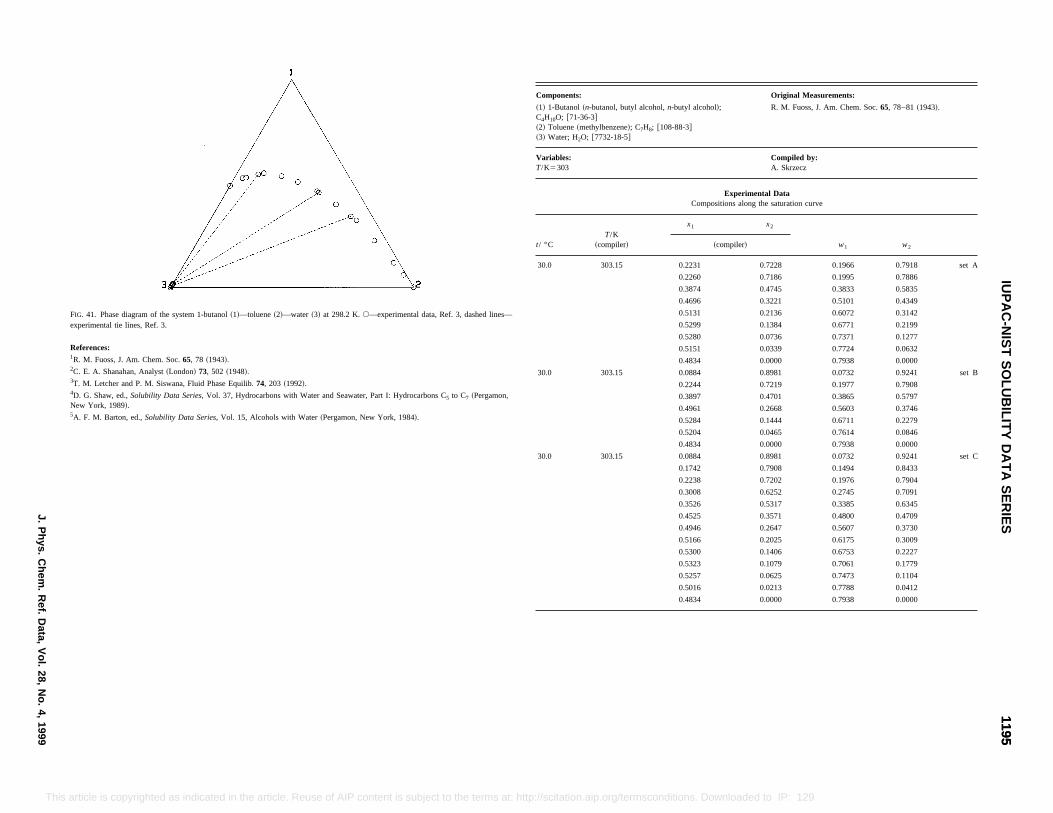
Original Measurements:
tyl alcohol,n-butyl alcohol!;
e; C7H8; @108-88-3##
R. M. Fuoss, J. Am. Chem. Soc.65, 78–81~1943!.
Compiled by:A. Skrzecz
Experimental DataCompositions along the saturation curve
x1 x2
w1 w2~compiler!
0.2231 0.7228 0.1966 0.7918 set A
0.2260 0.7186 0.1995 0.7886
0.3874 0.4745 0.3833 0.5835
0.4696 0.3221 0.5101 0.4349
0.5131 0.2136 0.6072 0.3142
0.5299 0.1384 0.6771 0.2199
0.5280 0.0736 0.7371 0.1277
0.5151 0.0339 0.7724 0.0632
0.4834 0.0000 0.7938 0.0000
0.0884 0.8981 0.0732 0.9241 set B
0.2244 0.7219 0.1977 0.7908
0.3897 0.4701 0.3865 0.5797
0.4961 0.2668 0.5603 0.3746
0.5284 0.1444 0.6711 0.2279
0.5204 0.0465 0.7614 0.0846
0.4834 0.0000 0.7938 0.0000
0.0884 0.8981 0.0732 0.9241 set C
0.1742 0.7908 0.1494 0.8433
0.2238 0.7202 0.1976 0.7904
0.3008 0.6252 0.2745 0.7091
0.3526 0.5317 0.3385 0.6345
0.4525 0.3571 0.4800 0.4709
0.4946 0.2647 0.5607 0.3730
0.5166 0.2025 0.6175 0.3009
0.5300 0.1406 0.6753 0.2227
0.5323 0.1079 0.7061 0.1779
0.5257 0.0625 0.7473 0.1104
0.5016 0.0213 0.7788 0.0412
0.4834 0.0000 0.7938 0.0000
11951195
IUP
AC
-NIS
TS
OLU
BILIT
YD
AT
AS
ER
IESJ.P
hys.C
hem.
Ref.
Data,
Vol.
28,N
o.4,
1999
This to the terms at: http://scitation.aip.org/termsconditions. Downloaded to IP: 129.6.105.191 On: Fri, 05 Sep 2014 17:51:55
article is copyrighted as indicated in the article. Reuse of AIP content is subjectFIG. 41. Phase diagram of the system 1-butanol~1!—toluene~2!—water ~3! at 298.2 K.s—experimental data, Ref. 3, dashed lines—experimental tie lines, Ref. 3.
References:1R. M. Fuoss, J. Am. Chem. Soc.65, 78 ~1943!.2C. E. A. Shanahan, Analyst~London! 73, 502 ~1948!.3T. M. Letcher and P. M. Siswana, Fluid Phase Equilib.74, 203 ~1992!.4D. G. Shaw, ed.,Solubility Data Series,Vol. 37, Hydrocarbons with Water and Seawater, Part I: Hydrocarbons C5 to C7 ~Pergamon,New York, 1989!.5A. F. M. Barton, ed.,Solubility Data Series, Vol. 15, Alcohols with Water~Pergamon, New York, 1984!.
Components:
~1! 1-Butanol~n-butanol, buC4H10O; @71-36-3#~2! Toluene~methylbenzen!~3! Water; H2O; @7732-18-5
Variables:T/K5303
t/ °CT/K
~compiler!
30.0 303.15
30.0 303.15
30.0 303.15
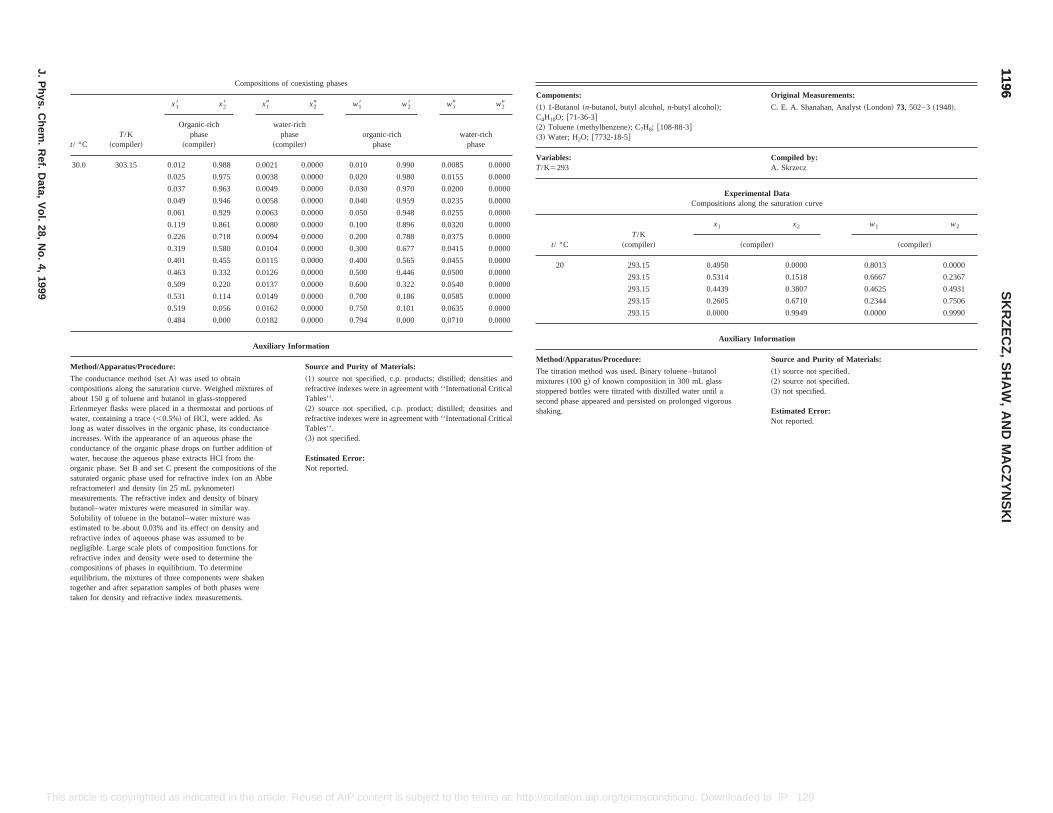
w29
water-richphase
0.0085 0.0000
0.0155 0.0000
0.0200 0.0000
0.0235 0.0000
0.0255 0.0000
0.0320 0.0000
0.0375 0.0000
0.0415 0.0000
0.0455 0.0000
0.0500 0.0000
0.0540 0.0000
0.0585 0.0000
0.0635 0.0000
0.0710 0.0000
istilled; densities and‘International Critical
stilled; densities and‘International Critical
Components: Original Measurements:
~1! 1-Butanol~n-butanol, butyl alcohol,n-butyl alcohol!;C4H10O; @71-36-3#~2! Toluene~methylbenzene!; C7H8; @108-88-3#~3! Water; H2O; @7732-18-5#
C. E. A. Shanahan, Analyst~London! 73, 502–3~1948!.
Variables:T/K5293
Compiled by:A. Skrzecz
Experimental DataCompositions along the saturation curve
t/ °CT/K
~compiler!
x1 x2 w1 w2
~compiler! ~compiler!
20 293.15 0.4950 0.0000 0.8013 0.0000
293.15 0.5314 0.1518 0.6667 0.2367
293.15 0.4439 0.3807 0.4625 0.4931
293.15 0.2605 0.6710 0.2344 0.7506
293.15 0.0000 0.9949 0.0000 0.9990
Auxiliary Information
Method/Apparatus/Procedure: Source and Purity of Materials:
The titration method was used. Binary toluene–butanolmixtures~100 g! of known composition in 300 mL glassstoppered bottles were titrated with distilled water until asecond phase appeared and persisted on prolonged vigorousshaking.
~1! source not specified.~2! source not specified.~3! not specified.
Estimated Error:Not reported.
11961196
SK
RZ
EC
Z,
SH
AW
,A
ND
MA
CZ
YN
SK
I
J.P
hys.C
hem.
Ref.
Data,
Vol.
28,N
o.4,
1999
This g/termsconditions. Downloaded to IP: 129.6.105.191 On: Fri, 05 Sep 2014 17:51:55
refractive index of aqueous phase was assumed to benegligible. Large scale plots of composition functions forrefractive index and density were used to determine thecompositions of phases in equilibrium. To determineequilibrium, the mixtures of three components were shakentogether and after separation samples of both phases weretaken for density and refractive index measurements.
article is copyrighted as indicated in the article. Reuse of AIP content is subject to the terms at: http://scitation.aip.or
Compositions of coexisting phases
t/ °CT/K
~compiler!
x18 x28 x19 x29 w18 w28 w19
Organic-richphase
~compiler!
water-richphase
~compiler!organic-rich
phase
30.0 303.15 0.012 0.988 0.0021 0.0000 0.010 0.990
0.025 0.975 0.0038 0.0000 0.020 0.980
0.037 0.963 0.0049 0.0000 0.030 0.970
0.049 0.946 0.0058 0.0000 0.040 0.959
0.061 0.929 0.0063 0.0000 0.050 0.948
0.119 0.861 0.0080 0.0000 0.100 0.896
0.226 0.718 0.0094 0.0000 0.200 0.788
0.319 0.580 0.0104 0.0000 0.300 0.677
0.401 0.455 0.0115 0.0000 0.400 0.565
0.463 0.332 0.0126 0.0000 0.500 0.446
0.509 0.220 0.0137 0.0000 0.600 0.322
0.531 0.114 0.0149 0.0000 0.700 0.186
0.519 0.056 0.0162 0.0000 0.750 0.101
0.484 0.000 0.0182 0.0000 0.794 0.000
Auxiliary Information
Method/Apparatus/Procedure: Source and Purity of Materials:
The conductance method~set A! was used to obtaincompositions along the saturation curve. Weighed mixtures ofabout 150 g of toluene and butanol in glass-stopperedErlenmeyer flasks were placed in a thermostat and portions ofwater, containing a trace~,0.5%! of HCl, were added. Aslong as water dissolves in the organic phase, its conductanceincreases. With the appearance of an aqueous phase theconductance of the organic phase drops on further addition ofwater, because the aqueous phase extracts HCl from theorganic phase. Set B and set C present the compositions of thesaturated organic phase used for refractive index~on an Abberefractometer! and density~in 25 mL pyknometer!measurements. The refractive index and density of binarybutanol–water mixtures were measured in similar way.Solubility of toluene in the butanol–water mixture wasestimated to be about 0.03% and its effect on density and
~1! source not specified, c.p. products; drefractive indexes were in agreement with ‘Tables’’.~2! source not specified, c.p. product; direfractive indexes were in agreement with ‘Tables’’.~3! not specified.
Estimated Error:Not reported.

Original Measurements:
T. M. Letcher and P. M. Siswana, Fluid Phase Equilib.74, 203–17 ~1992!.
Compiled by:A. Skrzecz
l Datahe saturation curve
x2
w1 w2
~compiler!
0.000 0.000 0.000
0.000 0.074 0.000
0.000 0.797 0.000
0.034 0.778 0.063
0.047 0.765 0.085
0.110 0.714 0.178
0.190 0.638 0.282
0.271 0.564 0.376
0.372 0.479 0.479
0.481 0.388 0.583
0.603 0.295 0.688
0.725 0.198 0.792
0.858 0.099 0.896
0.928 0.049 0.948
0.999 0.000 0.9998
existing phases
x29 w18 w28 w19 w29
horganic-rich
phase~compiler!
water-richphase
~compiler!
Auxiliary Information
Method/Apparatus/Procedure: Source and Purity of Materials:
The points on the binodal curve were determined by theformation of a cloudy mixture on shaking after the addition ofa known mass of one component to a mixture of knownmasses of the other two components. Precision weighingsyringes were used as described in Ref. 1. Tie linecompositions were determined by the refractive index methodreported in Ref. 2 and a complementary method using the KarlFischer titrations as reported in Ref. 3.
~1! Merck, AR grade; distilled, dried by the addition ofanhydrous potassium carbonate, distilled; purity better than 99.6mole % by glc.~2! BDH; used as received; purity better than 99.6 mole % byglc.~3! not specified.
Estimated Error:estimated comp. 0.005 mole fraction on the binodal curve and0.01 mole fraction for tie lines~estimated by the authors!.
References:1T. M. Letcher, S. Wootten, B. Shuttleworth, and C. Heward, J.Chem. Thermodyn.18, 1037~1986!.2S. W. Briggs and E. W. Comings, Ind. Eng. Chem.35, 411~1943!.3T. M. Letcher, P. M. Siswana, P. Van der Watt, and S. Radloff,J. Chem. Thermodyn.21, 1053~1989!.
11971197
IUP
AC
-NIS
TS
OLU
BILIT
YD
AT
AS
ER
IESJ.P
hys.C
hem.
Ref.
Data,
Vol.
28,N
o.4,
1999
Thi rg/termsconditions. Downloaded to IP: 129.6.105.191 On: Fri, 05 Sep 2014 17:51:55
25.0 298.2 0.000 0.999 0.000 0.000 0.000 0.9998 0.000 0.000
0.341 0.570 0.007 0.000 0.318 0.661 0.028 0.000
0.455 0.382 0.012 0.000 0.469 0.490 0.048 0.000
0.542 0.090 0.016 0.000 0.729 0.151 0.063 0.000
0.488 0.000 0.019 0.000 0.797 0.000 0.074 0.000
s article is copyrighted as indicated in the article. Reuse of AIP content is subject to the terms at: http://scitation.aip.o
Components:
~1! 1-Butanol~n-butanol, butyl alcohol,n-butyl alcohol!;C4H10O; @71-36-3#~2! Toluene~methylbenzene!; C7H8; @ 108-88-3#~3! Water; H2O; @7732-18-5#
Variables:T/K5298
ExperimentaCompositions along t
t/ °CT/K
~compiler! x1
25.0 298.2 0.000
0.019
0.488
0.524
0.527
0.548
0.534
0.506
0.462
0.398
0.322
0.225
0.118
0.060
0.000
Compositions of co
t/ °CT/K
~compiler!
x18 x28 x19
organic-richphase
water-ricphase
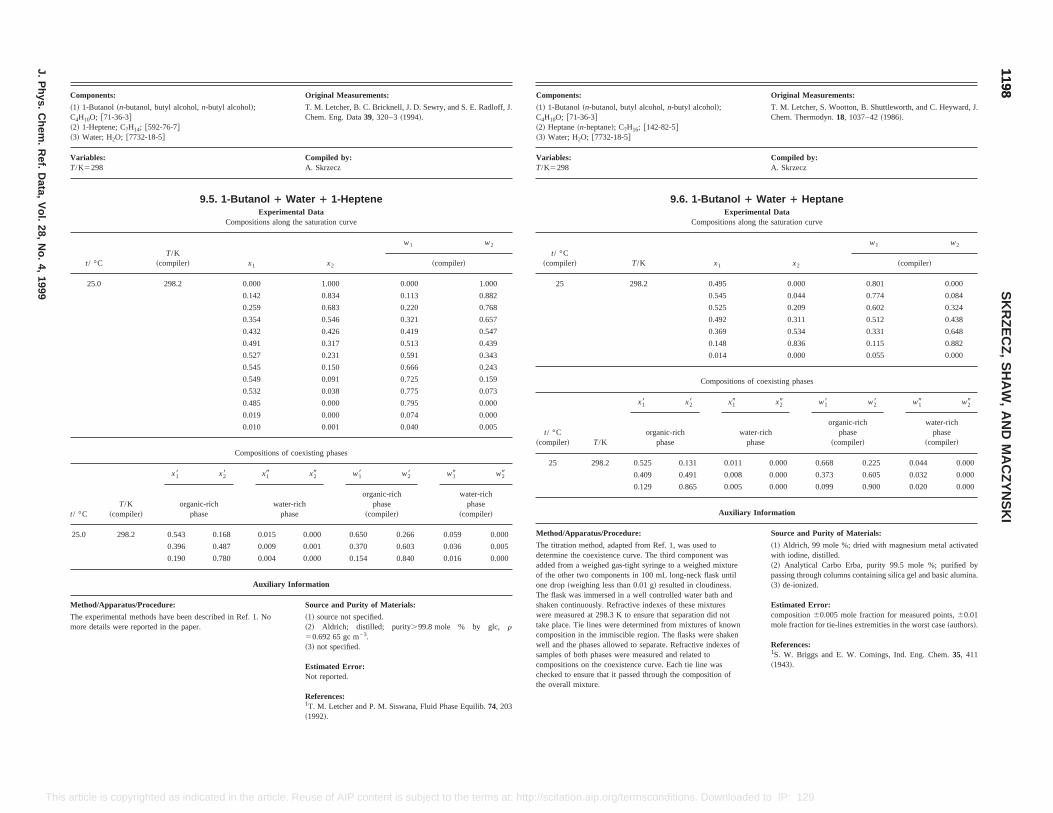
Original Measurements:
ol!; T. M. Letcher, S. Wootton, B. Shuttleworth, and C. Heyward, J.Chem. Thermodyn.18, 1037–42~1986!.
Compiled by:A. Skrzecz
tanol 1 Water 1 HeptaneExperimental Data
ositions along the saturation curve
x1 x2
w1 w2
~compiler!
0.495 0.000 0.801 0.000
.545 0.044 0.774 0.084
.525 0.209 0.602 0.324
.492 0.311 0.512 0.438
.369 0.534 0.331 0.648
.148 0.836 0.115 0.882
.014 0.000 0.055 0.000
mpositions of coexisting phases
x19 x29 w18 w28 w19 w29
water-richphase
organic-richphase
~compiler!
water-richphase
~compiler!
0.011 0.000 0.668 0.225 0.044 0.000
0.008 0.000 0.373 0.605 0.032 0.000
0.005 0.000 0.099 0.900 0.020 0.000
Auxiliary Information
Source and Purity of Materials:
ot wasmixturek untilss.h anduresid notf knownshakendexes of
astion of
~1! Aldrich, 99 mole %; dried with magnesium metal activatedwith iodine, distilled.~2! Analytical Carbo Erba, purity 99.5 mole %; purified bypassing through columns containing silica gel and basic alumina.~3! de-ionized.
Estimated Error:composition60.005 mole fraction for measured points,60.01mole fraction for tie-lines extremities in the worst case~authors!.
References:1S. W. Briggs and E. W. Comings, Ind. Eng. Chem.35, 411~1943!.
11981198
SK
RZ
EC
Z,
SH
AW
,A
ND
MA
CZ
YN
SK
I
J.P
hys.C
hem.
Ref.
Data,
Vol.
28,N
o.4,
1999
This loaded to IP: 129.6.105.191 On: Fri, 05 Sep 2014 17:51:55
25.0 298.2 0.543 0.168 0.015 0.000 0.650 0.266 0.059 0.000
0.396 0.487 0.009 0.001 0.370 0.603 0.036 0.005
0.190 0.780 0.004 0.000 0.154 0.840 0.016 0.000
Auxiliary Information
Method/Apparatus/Procedure: Source and Purity of Materials:
The experimental methods have been described in Ref. 1. Nomore details were reported in the paper.
~1! source not specified.~2! Aldrich; distilled; purity.99.8 mole % by glc, r50.692 65 gc m23.~3! not specified.
Estimated Error:Not reported.
References:1T. M. Letcher and P. M. Siswana, Fluid Phase Equilib.74, 203~1992!.
Method/Apparatus/Procedure:
The titration method, adapted from Ref. 1, was used tdetermine the coexistence curve. The third componenadded from a weighed gas-tight syringe to a weighedof the other two components in 100 mL long-neck flasone drop~weighing less than 0.01 g! resulted in cloudineThe flask was immersed in a well controlled water batshaken continuously. Refractive indexes of these mixtwere measured at 298.3 K to ensure that separation dtake place. Tie lines were determined from mixtures ocomposition in the immiscible region. The flasks werewell and the phases allowed to separate. Refractive insamples of both phases were measured and related tocompositions on the coexistence curve. Each tie line wchecked to ensure that it passed through the composithe overall mixture.
article is copyrighted as indicated in the article. Reuse of AIP content is subject to the terms at: http://scitation.aip.org/termsconditions. Down
Components: Original Measurements:
~1! 1-Butanol~n-butanol, butyl alcohol,n-butyl alcohol!;C4H10O; @71-36-3#~2! 1-Heptene; C7H14; @592-76-7#~3! Water; H2O; @7732-18-5#
T. M. Letcher, B. C. Bricknell, J. D. Sewry, and S. E. Radloff, J.Chem. Eng. Data39, 320–3~1994!.
Variables:T/K5298
Compiled by:A. Skrzecz
9.5. 1-Butanol 1 Water 1 1-HepteneExperimental Data
Compositions along the saturation curve
t/ °CT/K
~compiler! x1 x2
w1 w2
~compiler!
25.0 298.2 0.000 1.000 0.000 1.000
0.142 0.834 0.113 0.882
0.259 0.683 0.220 0.768
0.354 0.546 0.321 0.657
0.432 0.426 0.419 0.547
0.491 0.317 0.513 0.439
0.527 0.231 0.591 0.343
0.545 0.150 0.666 0.243
0.549 0.091 0.725 0.159
0.532 0.038 0.775 0.073
0.485 0.000 0.795 0.000
0.019 0.000 0.074 0.000
0.010 0.001 0.040 0.005
Compositions of coexisting phases
t/ °CT/K
~compiler!
x18 x28 x19 x29 w18 w28 w19 w29
organic-richphase
water-richphase
organic-richphase
~compiler!
water-richphase
~compiler!
Components:
~1! 1-Butanol~n-butanol, butyl alcohol,n-butyl alcohC4H10O; @71-36-3#~2! Heptane~n-heptane!; C7H16; @142-82-5#~3! Water; H2O; @7732-18-5#
Variables:T/K5298
9.6. 1-Bu
Comp
t/ °C~compiler! T/K
25 298.2
0
0
0
0
0
0
Co
t/ °C~compiler! T/K
x18 x28
organic-richphase
25 298.2 0.525 0.131
0.409 0.491
0.129 0.865

Original Measurements:
utyl alcohol,n-butyl alcohol!;
thylbenzene!; C9H12; @108-67-8#5#
T. M. Letcher and P. M. Siswana, Fluid Phase Equilib,74, 203–17 ~1992!.
Compiled by:A. Skrzecz
9.8. 1-Butanol 1 Water 1 MesityleneExperimental Data
Compositions along the saturation curve
T/Kompiler! x1 x2
w1 w2
~compiler!
298.2 0.000 0.000 0.000 0.000
0.019 0.000 0.074 0.000
0.488 0.000 0.797 0.000
0.493 0.002 0.796 0.005
0.530 0.034 0.767 0.080
0.546 0.083 0.708 0.175
0.541 0.143 0.637 0.273
0.496 0.306 0.477 0.477
0.436 0.404 0.386 0.580
0.365 0.525 0.294 0.685
0.269 0.664 0.198 0.791
0.146 0.814 0.099 0.894
0.077 0.902 0.050 0.947
0.000 0.999 0.000 0.9998
Compositions of coexisting phases
x18 x28 x19 x29 w18 w28 w19 w29
organic-richphase
water-richphase
organic-richphase
~compiler!
water-richphase
~compiler!
0.000 0.000 0.9998 0.000 0.000
0.000 0.290 0.689 0.028 0.000
0.000 0.468 0.487 0.040 0.000
0.000 0.725 0.151 0.059 0.000
0.000 0.797 0.000 0.074 0.000
11991199
IUP
AC
-NIS
TS
OLU
BILIT
YD
AT
AS
ER
IESJ.P
hys.C
hem.
Ref.
Data,
Vol.
28,N
o.4,
1999
This to IP: 129.6.105.191 On: Fri, 05 Sep 2014 17:51:55
0.542 0.140 0.015 0.000 0.661 0.245 0.059 0.0000.399 0.463 0.010 0.000 0.364 0.605 0.040 0.0000.170 0.788 0.005 0.000 0.130 0.862 0.020 0.0000.000 0.998 0.000 0.000 0.000 0.9997 0.000 0.000
Auxiliary Information
Method/Apparatus/Procedure: Source and Purity of Materials:
The titration method was used to determine binodal curve. Abinary mixture of known composition was titrated with thethird component until cloudiness was observed. Tie linecompositions were related to the coexistence curve; water wasdetermined by the Karl Fischer titration. The methods weredescribed in Ref. 1.
~1! source not specified; used as received.~2! source not specified; recrystallized three times.~3! not specified.
Estimated Error:comp. ,0.005 mole fraction~estimated authors’ precision onbinodal curve!, ,0.01 mole fraction ~estimated authors’precision of tie lines!.
References:1T. M. Letcher, S. Wootten, B. Shuttleworth, and C. Heyward, J.Chem. Thermodyn.18, 1037~1986!.
25.0 298.2 0.000 0.999 0.000
0.361 0.530 0.007
0.491 0.315 0.010
0.545 0.070 0.015
0.488 0.000 0.019
article is copyrighted as indicated in the article. Reuse of AIP content is subject to the terms at: http://scitation.aip.org/termsconditions. Downloaded
Components: Original Measurements:
~1! 1-Butanol~n-butanol, butyl alcohol,n-butyl alcohol!;C4H10O; @71-36-3#~2! p-Xylene ~1,4-dimethylbenzene, 1,4-xylene!; C8H10;@106-42-3#~3! Water; H2O; @7732-18-5#
T. M. Letcher, P. M. Siswana, P. van der Watt, and S. Radloff,J. Chem. Thermodyn.21, 1053–60~1989!.
Variables:T/K5298
Compiled by:A. Skrzecz
9.7. 1-Butanol 1 Water 1 p-XyleneExperimental Data
Compositions along the saturation curve
t/ °C~compiler! T/K x1 x2
w1 w2
~compiler!
25.0 298.2 0.000 0.998 0.000 0.99970.070 0.915 0.051 0.9470.133 0.837 0.099 0.8950.248 0.691 0.198 0.7900.341 0.557 0.293 0.6860.415 0.434 0.387 0.5790.474 0.330 0.477 0.4750.514 0.239 0.561 0.3740.534 0.093 0.705 0.1760.539 0.070 0.734 0.1370.491 0.003 0.794 0.0070.488 0.000 0.797 0.0000.020 0.000 0.077 0.000
Compositions of coexisting phases
t/ °C~compiler! T/K
x18 x28 x19 x29 w18 w28 w19 w29
organic-richphase
water-richphase
organic-richphase
~compiler!
water-richphase
~compiler!
25.0 298.2 0.488 0.000 0.020 0.000 0.797 0.000 0.077 0.000
Components:
~1! 1-Butanol~n-butanol, bC4H10O; @71-36-3#~2! Mesitylene~1,3,5-trime~3! Water; H2O; @7732-18-
Variables:T/K5298
t/ °C ~c
25.0
t/ °CT/K
~compiler!
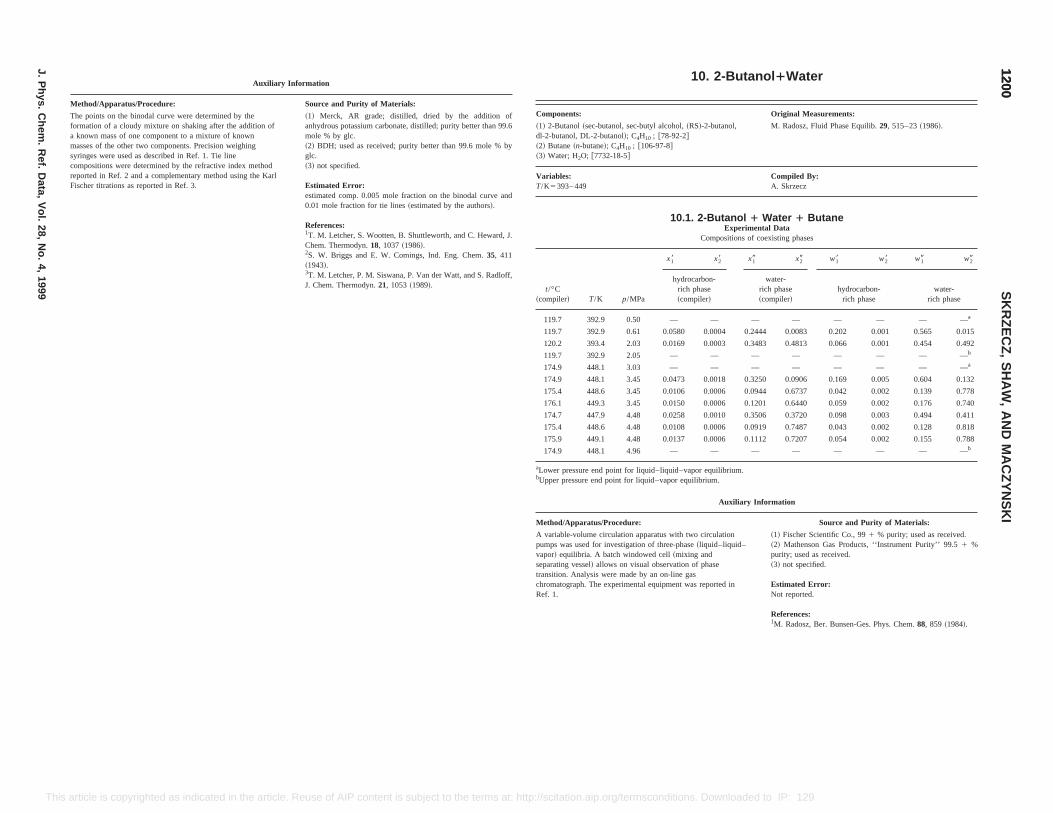
10. 2-Butanol 1Water
Original Measurements:
l alcohol,~RS!-2-butanol,78-92-2#7-8#
M. Radosz, Fluid Phase Equilib.29, 515–23~1986!.
Compiled By:A. Skrzecz
10.1. 2-Butanol 1 Water 1 ButaneExperimental Data
Compositions of coexisting phases
x18 x28 x19 x29 w18 w28 w19 w29
hydrocarbon-rich phase~compiler!
water-rich phase~compiler!
hydrocarbon-rich phase
water-rich phase
— — — — — — — —a
0.0580 0.0004 0.2444 0.0083 0.202 0.001 0.565 0.015
0.0169 0.0003 0.3483 0.4813 0.066 0.001 0.454 0.492
— — — — — — — —b
— — — — — — — —a
0.0473 0.0018 0.3250 0.0906 0.169 0.005 0.604 0.132
0.0106 0.0006 0.0944 0.6737 0.042 0.002 0.139 0.778
0.0150 0.0006 0.1201 0.6440 0.059 0.002 0.176 0.740
0.0258 0.0010 0.3506 0.3720 0.098 0.003 0.494 0.411
0.0108 0.0006 0.0919 0.7487 0.043 0.002 0.128 0.818
0.0137 0.0006 0.1112 0.7207 0.054 0.002 0.155 0.788
— — — — — — — —b
d–liquid–vapor equilibrium.d–vapor equilibrium.
Auxiliary Information
Source and Purity of Materials:
A variable-volume circulation apparatus with two circulationpumps was used for investigation of three-phase~liquid–liquid–vapor! equilibria. A batch windowed cell~mixing andseparating vessel! allows on visual observation of phasetransition. Analysis were made by an on-line gaschromatograph. The experimental equipment was reported inRef. 1.
~1! Fischer Scientific Co., 991 % purity; used as received.~2! Mathenson Gas Products, ‘‘Instrument Purity’’ 99.51 %purity; used as received.~3! not specified.
Estimated Error:Not reported.
References:1M. Radosz, Ber. Bunsen-Ges. Phys. Chem.88, 859 ~1984!.
12001200
SK
RZ
EC
Z,
SH
AW
,A
ND
MA
CZ
YN
SK
I
J.P
hys.C
hem.
Ref.
Data,
Vol.
28,N
o.4,
1999
This e of AIP content is subject to the terms at: http://scitation.aip.org/termsconditions. Downloaded to IP: 129.6.105.191 On: Fri, 05 Sep 2014 17:51:55
article is copyrighted as indicated in the article. ReusAuxiliary Information
Method/Apparatus/Procedure: Source and Purity of Materials:
The points on the binodal curve were determined by theformation of a cloudy mixture on shaking after the addition ofa known mass of one component to a mixture of knownmasses of the other two components. Precision weighingsyringes were used as described in Ref. 1. Tie linecompositions were determined by the refractive index methodreported in Ref. 2 and a complementary method using the KarlFischer titrations as reported in Ref. 3.
~1! Merck, AR grade; distilled, dried by the addition ofanhydrous potassium carbonate, distilled; purity better than 99.6mole % by glc.~2! BDH; used as received; purity better than 99.6 mole % byglc.~3! not specified.
Estimated Error:estimated comp. 0.005 mole fraction on the binodal curve and0.01 mole fraction for tie lines~estimated by the authors!.
References:1T. M. Letcher, S. Wootten, B. Shuttleworth, and C. Heward, J.Chem. Thermodyn.18, 1037~1986!.2S. W. Briggs and E. W. Comings, Ind. Eng. Chem.35, 411~1943!.3T. M. Letcher, P. M. Siswana, P. Van der Watt, and S. Radloff,J. Chem. Thermodyn.21, 1053~1989!.
Components:
~1! 2-Butanol~sec-butanol, sec-butydl-2-butanol, DL-2-butanol!; C4H10 ; @~2! Butane~n-butane!; C4H10 ; @106-9~3! Water; H2O; @7732-18-5#
Variables:T/K5393– 449
t/°C~compiler! T/K p/MPa
119.7 392.9 0.50
119.7 392.9 0.61
120.2 393.4 2.03
119.7 392.9 2.05
174.9 448.1 3.03
174.9 448.1 3.45
175.4 448.6 3.45
176.1 449.3 3.45
174.7 447.9 4.48
175.4 448.6 4.48
175.9 449.1 4.48
174.9 448.1 4.96
aLower pressure end point for liquibUpper pressure end point for liqui
Method/Apparatus/Procedure:
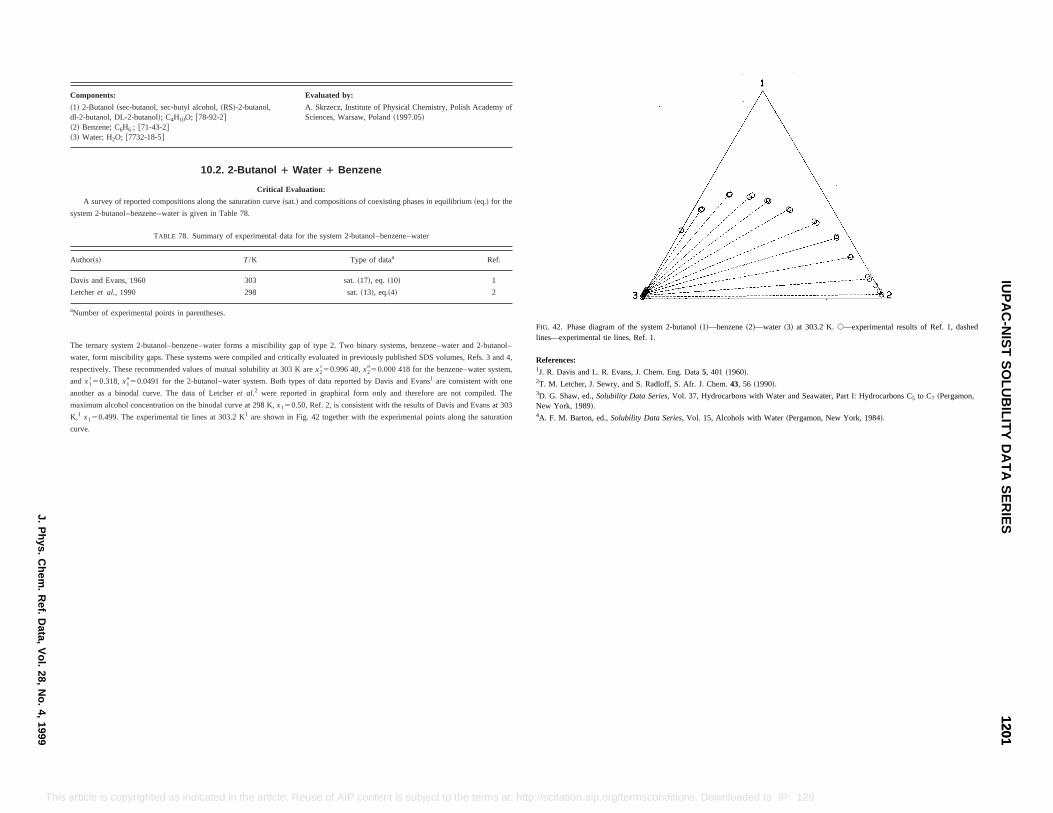
stry, Polish Academy of
equilibrium~eq.! for the
ter
Ref.
1
2
enzene–water and 2-butanol–
SDS volumes, Refs. 3 and 4,
enzene–water system,
anse consistent with one
e are not compiled. The
f Davis and Evans at 303
oints along the saturation
FIG. 42. Phase diagram of the system 2-butanol~1!—benzene~2!—water ~3! at 303.2 K.s—experimental results of Ref. 1, dashedlines—experimental tie lines, Ref. 1.
References:1J. R. Davis and L. R. Evans, J. Chem. Eng. Data5, 401 ~1960!.2T. M. Letcher, J. Sewry, and S. Radloff, S. Afr. J. Chem.43, 56 ~1990!.3D. G. Shaw, ed.,Solubility Data Series, Vol. 37, Hydrocarbons with Water and Seawater, Part I: Hydrocarbons C5 to C7 ~Pergamon,New York, 1989!.4A. F. M. Barton, ed.,Solubility Data Series,Vol. 15, Alcohols with Water~Pergamon, New York, 1984!.
12011201
IUP
AC
-NIS
TS
OLU
BILIT
YD
AT
AS
ER
IESJ.P
hys.C
hem.
Ref.
Data,
Vol.
28,N
o.4,
1999
This e terms at: http://scitation.aip.org/termsconditions. Downloaded to IP: 129.6.105.191 On: Fri, 05 Sep 2014 17:51:55
article is copyrighted as indicated in the article. Reuse of AIP content is subject to thComponents: Evaluated by:
~1! 2-Butanol~sec-butanol, sec-butyl alcohol,~RS!-2-butanol,dl-2-butanol, DL-2-butanol!; C4H10O; @78-92-2#~2! Benzene; C6H6 ; @71-43-2#~3! Water; H2O; @7732-18-5#
A. Skrzecz, Institute of Physical ChemiSciences, Warsaw, Poland~1997.05!
10.2. 2-Butanol 1 Water 1 Benzene
Critical Evaluation:
A survey of reported compositions along the saturation curve~sat.! and compositions of coexisting phases in
system 2-butanol–benzene–water is given in Table 78.
TABLE 78. Summary of experimental data for the system 2-butanol–benzene–wa
Author~s! T/K Type of dataa
Davis and Evans, 1960 303 sat.~17!, eq. ~10!
Letcheret al., 1990 298 sat.~13!, eq.~4!
aNumber of experimental points in parentheses.
The ternary system 2-butanol–benzene–water forms a miscibility gap of type 2. Two binary systems, b
water, form miscibility gaps. These systems were compiled and critically evaluated in previously published
respectively. These recommended values of mutual solubility at 303 K arex2850.996 40,x2950.000 418 for the b
and x1850.318,x1950.0491 for the 2-butanol–water system. Both types of data reported by Davis and Ev1 ar
another as a binodal curve. The data of Letcheret al.2 were reported in graphical form only and therefor
maximum alcohol concentration on the binodal curve at 298 K,x150.50, Ref. 2, is consistent with the results o
K,1 x150.499. The experimental tie lines at 303.2 K1 are shown in Fig. 42 together with the experimental p
curve.
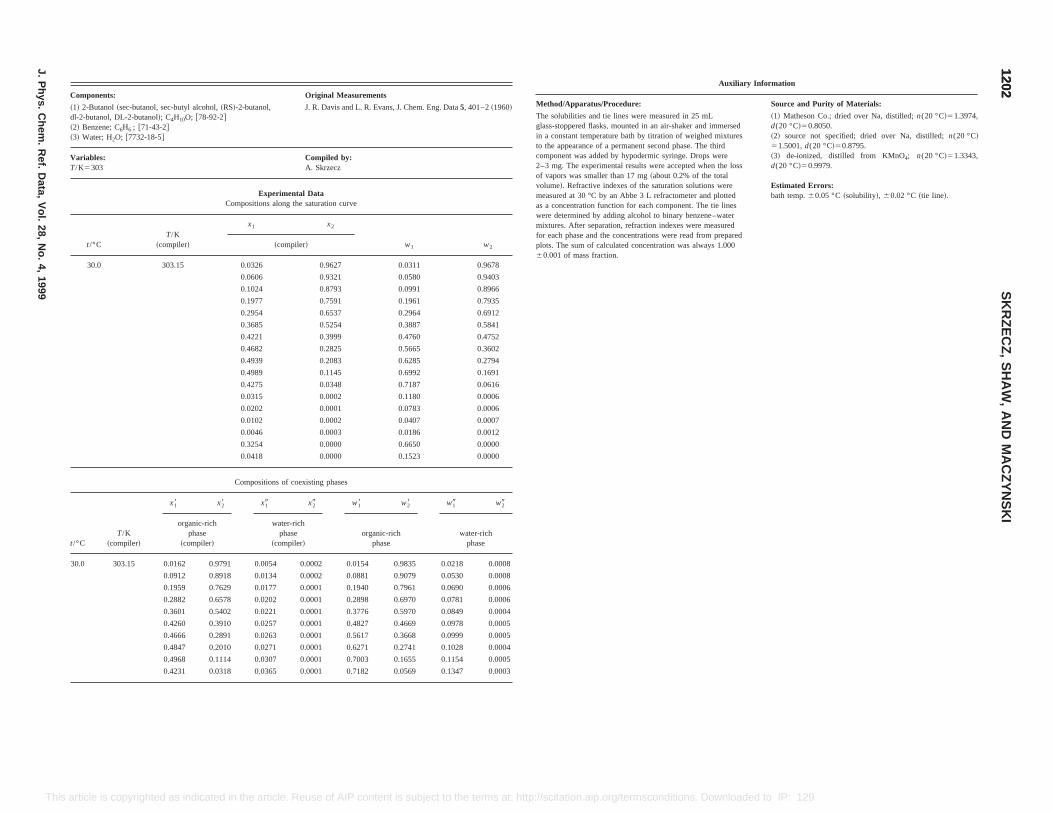
Original Measurements
J. R. Davis and L. R. Evans, J. Chem. Eng. Data5, 401–2~1960!
Compiled by:A. Skrzecz
rimental Dataalong the saturation curve
x2
w1 w2~compiler!
0.9627 0.0311 0.9678
0.9321 0.0580 0.9403
0.8793 0.0991 0.8966
0.7591 0.1961 0.7935
0.6537 0.2964 0.6912
0.5254 0.3887 0.5841
0.3999 0.4760 0.4752
0.2825 0.5665 0.3602
0.2083 0.6285 0.2794
0.1145 0.6992 0.1691
0.0348 0.7187 0.0616
0.0002 0.1180 0.0006
0.0001 0.0783 0.0006
0.0002 0.0407 0.0007
0.0003 0.0186 0.0012
0.0000 0.6650 0.0000
0.0000 0.1523 0.0000
ns of coexisting phases
x29 w18 w28 w19 w29
ater-rich
Auxiliary Information
Method/Apparatus/Procedure: Source and Purity of Materials:
The solubilities and tie lines were measured in 25 mLglass-stoppered flasks, mounted in an air-shaker and immersedin a constant temperature bath by titration of weighed mixturesto the appearance of a permanent second phase. The thirdcomponent was added by hypodermic syringe. Drops were2–3 mg. The experimental results were accepted when the lossof vapors was smaller than 17 mg~about 0.2% of the totalvolume!. Refractive indexes of the saturation solutions weremeasured at 30 °C by an Abbe 3 L refractometer and plottedas a concentration function for each component. The tie lineswere determined by adding alcohol to binary benzene–watermixtures. After separation, refraction indexes were measuredfor each phase and the concentrations were read from preparedplots. The sum of calculated concentration was always 1.00060.001 of mass fraction.
~1! Matheson Co.; dried over Na, distilled;n(20 °C!51.3974,d(20 °C!50.8050.~2! source not specified; dried over Na, distilled;n(20 °C!51.5001,d(20 °C!50.8795.~3! de-ionized, distilled from KMnO4; n(20 °C!51.3343,d(20 °C!50.9979.
Estimated Errors:bath temp.60.05 °C~solubility!, 60.02 °C~tie line!.
12021202
SK
RZ
EC
Z,
SH
AW
,A
ND
MA
CZ
YN
SK
I
J.P
hys.C
hem.
Ref.
Data,
Vol.
28,N
o.4,
1999
This . Downloaded to IP: 129.6.105.191 On: Fri, 05 Sep 2014 17:51:55
t/°CT/K
~compiler!phase
~compiler!phase
~compiler!organic-rich
phasewater-rich
phase
30.0 303.15 0.0162 0.9791 0.0054 0.0002 0.0154 0.9835 0.0218 0.0008
0.0912 0.8918 0.0134 0.0002 0.0881 0.9079 0.0530 0.0008
0.1959 0.7629 0.0177 0.0001 0.1940 0.7961 0.0690 0.0006
0.2882 0.6578 0.0202 0.0001 0.2898 0.6970 0.0781 0.0006
0.3601 0.5402 0.0221 0.0001 0.3776 0.5970 0.0849 0.0004
0.4260 0.3910 0.0257 0.0001 0.4827 0.4669 0.0978 0.0005
0.4666 0.2891 0.0263 0.0001 0.5617 0.3668 0.0999 0.0005
0.4847 0.2010 0.0271 0.0001 0.6271 0.2741 0.1028 0.0004
0.4968 0.1114 0.0307 0.0001 0.7003 0.1655 0.1154 0.0005
0.4231 0.0318 0.0365 0.0001 0.7182 0.0569 0.1347 0.0003
article is copyrighted as indicated in the article. Reuse of AIP content is subject to the terms at: http://scitation.aip.org/termsconditions
Components:
~1! 2-Butanol~sec-butanol, sec-butyl alcohol,~RS!-2-butanol,dl-2-butanol, DL-2-butanol!; C4H10O; @78-92-2#~2! Benzene; C6H6 ; @71-43-2#~3! Water; H2O; @7732-18-5#
Variables:T/K5303
ExpeCompositions
t/°CT/K
~compiler!
x1
30.0 303.15 0.0326
0.0606
0.1024
0.1977
0.2954
0.3685
0.4221
0.4682
0.4939
0.4989
0.4275
0.0315
0.0202
0.0102
0.0046
0.3254
0.0418
Compositio
x18 x28 x19
organic-rich w
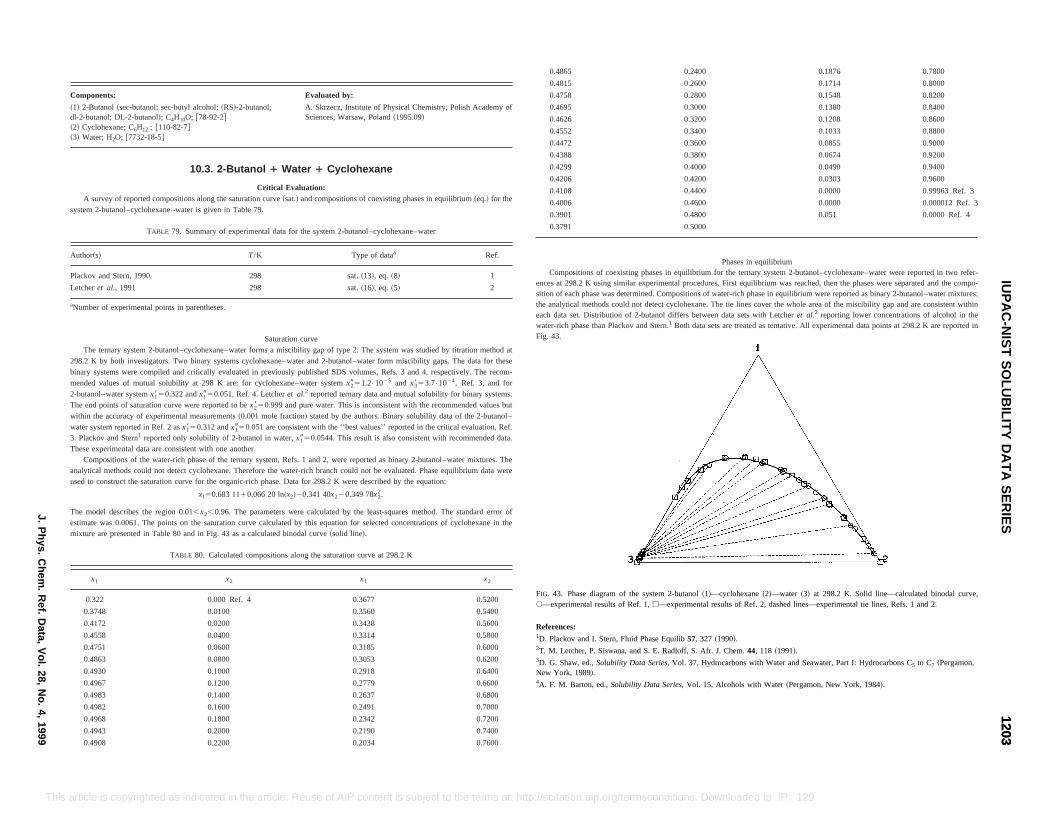
0.1876 0.7800
0.1714 0.8000
0.1548 0.8200
0.1380 0.8400
0.1208 0.8600
0.1033 0.8800
0.0855 0.9000
0.0674 0.9200
0.0490 0.9400
0.0303 0.9600
0.0000 0.99963 Ref. 3
0.0000 0.000012 Ref. 3
0.051 0.0000 Ref. 4
Phases in equilibriumm for the ternary system 2-butanol–cyclohexane–water were reported in two refer-ures. First equilibrium was reached, then the phases were separated and the compo-of water-rich phase in equilibrium were reported as binary 2-butanol–water mixtures;e. The tie lines cover the whole area of the miscibility gap and are consistent withineen data sets with Letcheret al.2 reporting lower concentrations of alcohol in thets are treated as tentative. All experimental data points at 298.2 K are reported in
e~2!—water ~3! at 298.2 K. Solid line—calculated binodal curve,ef. 2, dashed lines—experimental tie lines, Refs. 1 and 2.
.118 ~1991!.
ith Water and Seawater, Part I: Hydrocarbons C5 to C7 ~Pergamon,
th Water~Pergamon, New York, 1984!.
12031203
IUP
AC
-NIS
TS
OLU
BILIT
YD
AT
AS
ER
IESJ.P
hys.C
hem.
Ref.
Data,
Vol.
28,N
o.4,
1999
This to IP: 129.6.105.191 On: Fri, 05 Sep 2014 17:51:55
mixture are presented in Table 80 and in Fig. 43 as a calculated binodal curve~solid line!.
TABLE 80. Calculated compositions along the saturation curve at 298.2 K
x1 x2 x1 x2
0.322 0.000 Ref. 4 0.3677 0.5200
0.3748 0.0100 0.3560 0.5400
0.4172 0.0200 0.3438 0.5600
0.4558 0.0400 0.3314 0.5800
0.4751 0.0600 0.3185 0.6000
0.4863 0.0800 0.3053 0.6200
0.4930 0.1000 0.2918 0.6400
0.4967 0.1200 0.2779 0.6600
0.4983 0.1400 0.2637 0.6800
0.4982 0.1600 0.2491 0.7000
0.4968 0.1800 0.2342 0.7200
0.4943 0.2000 0.2190 0.7400
0.4908 0.2200 0.2034 0.7600
FIG. 43. Phase diagram of the system 2-butanol~1!—cyclohexans—experimental results of Ref. 1,h—experimental results of R
References:1D. Plackov and I. Stern, Fluid Phase Equilib57, 327 ~1990!.2T. M. Letcher, P. Siswana, and S. E. Radloff, S. Afr. J. Chem44,3D. G. Shaw, ed.,Solubility Data Series,Vol. 37, Hydrocarbons wNew York, 1989!.4A. F. M. Barton, ed.,Solubility Data Series, Vol. 15, Alcohols wi
article is copyrighted as indicated in the article. Reuse of AIP content is subject to the terms at: http://scitation.aip.org/termsconditions. Downloaded
Components: Evaluated by:
~1! 2-Butanol~sec-butanol; sec-butyl alcohol;~RS!-2-butanol;dl-2-butanol; DL-2-butanol!; C4H10O; @78-92-2#~2! Cyclohexane; C6H12 ; @110-82-7#~3! Water; H2O; @7732-18-5#
A. Skrzecz, Institute of Physical Chemistry, Polish Academy ofSciences, Warsaw, Poland~1995.09!
10.3. 2-Butanol 1 Water 1 Cyclohexane
Critical Evaluation:A survey of reported compositions along the saturation curve~sat.! and compositions of coexisting phases in equilibrium~eq.! for the
system 2-butanol–cyclohexane–water is given in Table 79.
TABLE 79. Summary of experimental data for the system 2-butanol–cyclohexane–water
Author~s! T/K Type of dataa Ref.
Plackov and Stern, 1990 298 sat.~13!, eq. ~8! 1
Letcheret al., 1991 298 sat.~16!, eq. ~5! 2
aNumber of experimental points in parentheses.
Saturation curveThe ternary system 2-butanol–cyclohexane–water forms a miscibility gap of type 2. The system was studied by titration method at
298.2 K by both investigators. Two binary systems cyclohexane–water and 2-butanol–water form miscibility gaps. The data for thesebinary systems were compiled and critically evaluated in previously published SDS volumes, Refs. 3 and 4, respectively. The recom-mended values of mutual solubility at 298 K are: for cyclohexane–water systemx2951.2•1025 and x3853.7•1024, Ref. 3, and for2-butanol–water systemx1850.322 andx1950.051, Ref. 4. Letcheret al.2 reported ternary data and mutual solubility for binary systems.The end points of saturation curve were reported to bex2850.999 and pure water. This is inconsistent with the recommended values butwithin the accuracy of experimental measurements~0.001 mole fraction! stated by the authors. Binary solubility data of the 2-butanol–water system reported in Ref. 2 asx1850.312 andx1950.051 are consistent with the ‘‘best values’’ reported in the critical evaluation, Ref.3. Plackov and Stern1 reported only solubility of 2-butanol in water,x1950.0544. This result is also consistent with recommended data.These experimental data are consistent with one another.
Compositions of the water-rich phase of the ternary system, Refs. 1 and 2, were reported as binary 2-butanol–water mixtures. Theanalytical methods could not detect cyclohexane. Therefore the water-rich branch could not be evaluated. Phase equilibrium data wereused to construct the saturation curve for the organic-rich phase. Data for 298.2 K were described by the equation:
x150.683 1110.066 20 ln~x2!20.341 40x220.349 78x22.
The model describes the region 0.01,x2,0.96. The parameters were calculated by the least-squares method. The standard error ofestimate was 0.0061. The points on the saturation curve calculated by this equation for selected concentrations of cyclohexane in the
0.4865 0.2400
0.4815 0.2600
0.4758 0.2800
0.4695 0.3000
0.4626 0.3200
0.4552 0.3400
0.4472 0.3600
0.4388 0.3800
0.4299 0.4000
0.4206 0.4200
0.4108 0.4400
0.4006 0.4600
0.3901 0.4800
0.3791 0.5000
Compositions of coexisting phases in equilibriuences at 298.2 K using similar experimental procedsition of each phase was determined. Compositionsthe analytical methods could not detect cyclohexaneach data set. Distribution of 2-butanol differs betwwater-rich phase than Plackov and Stern.1 Both data seFig. 43.
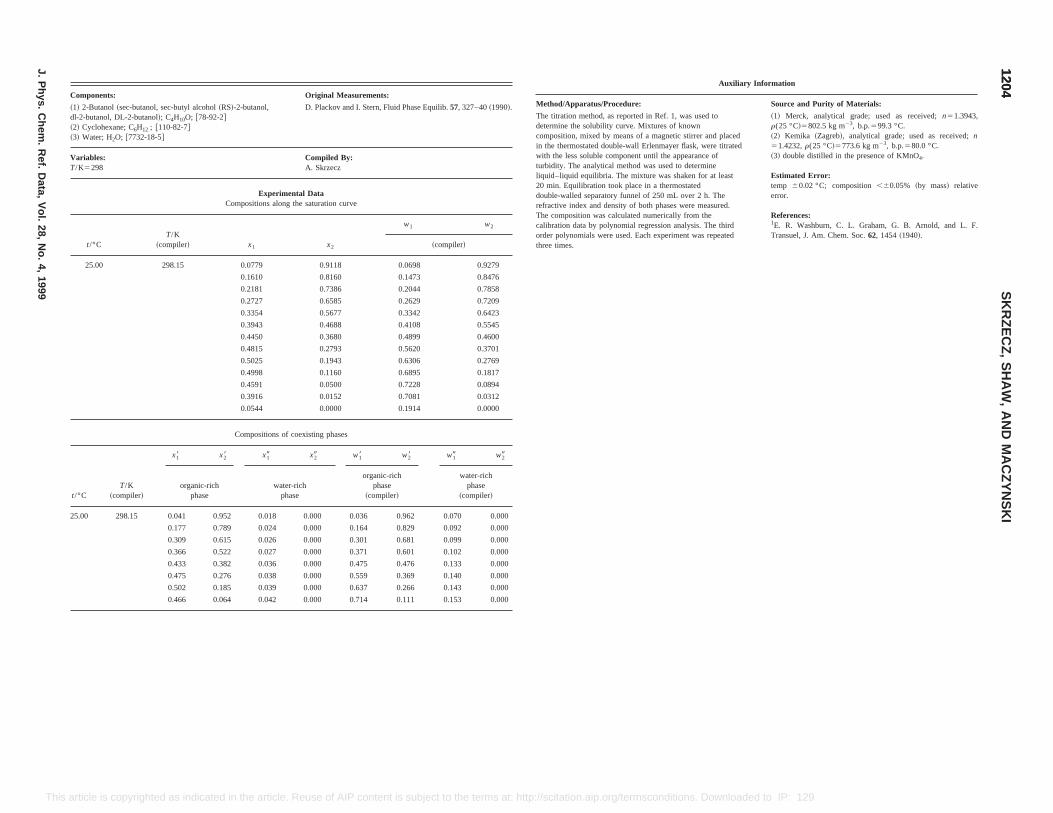
Original Measurements:
ol, D. Plackov and I. Stern, Fluid Phase Equilib.57, 327–40~1990!.
Compiled By:A. Skrzecz
xperimental Datans along the saturation curve
x2
w1 w2
~compiler!
9 0.9118 0.0698 0.9279
0.8160 0.1473 0.8476
0.7386 0.2044 0.7858
0.6585 0.2629 0.7209
0.5677 0.3342 0.6423
0.4688 0.4108 0.5545
0.3680 0.4899 0.4600
0.2793 0.5620 0.3701
0.1943 0.6306 0.2769
0.1160 0.6895 0.1817
0.0500 0.7228 0.0894
0.0152 0.7081 0.0312
0.0000 0.1914 0.0000
itions of coexisting phases
x19 x29 w18 w28 w19 w29
water-richphase
organic-richphase
~compiler!
water-richphase
~compiler!
0.018 0.000 0.036 0.962 0.070 0.000
Auxiliary Information
Method/Apparatus/Procedure: Source and Purity of Materials:
The titration method, as reported in Ref. 1, was used todetermine the solubility curve. Mixtures of knowncomposition, mixed by means of a magnetic stirrer and placedin the thermostated double-wall Erlenmayer flask, were titratedwith the less soluble component until the appearance ofturbidity. The analytical method was used to determineliquid–liquid equilibria. The mixture was shaken for at least20 min. Equilibration took place in a thermostateddouble-walled separatory funnel of 250 mL over 2 h. Therefractive index and density of both phases were measured.The composition was calculated numerically from thecalibration data by polynomial regression analysis. The thirdorder polynomials were used. Each experiment was repeatedthree times.
~1! Merck, analytical grade; used as received;n51.3943,r(25 °C!5802.5 kg m23, b.p.599.3 °C.~2! Kemika ~Zagreb!, analytical grade; used as received;n51.4232,r(25 °C!5773.6 kg m23, b.p.580.0 °C.~3! double distilled in the presence of KMnO4.
Estimated Error:temp 60.02 °C; composition,60.05% ~by mass! relativeerror.
References:1E. R. Washburn, C. L. Graham, G. B. Arnold, and L. F.Transuel, J. Am. Chem. Soc.62, 1454~1940!.
12041204
SK
RZ
EC
Z,
SH
AW
,A
ND
MA
CZ
YN
SK
I
J.P
hys.C
hem.
Ref.
Data,
Vol.
28,N
o.4,
1999
This a rmsconditions. Downloaded to IP: 129.6.105.191 On: Fri, 05 Sep 2014 17:51:55
0.177 0.789 0.024 0.000 0.164 0.829 0.092 0.000
0.309 0.615 0.026 0.000 0.301 0.681 0.099 0.000
0.366 0.522 0.027 0.000 0.371 0.601 0.102 0.000
0.433 0.382 0.036 0.000 0.475 0.476 0.133 0.000
0.475 0.276 0.038 0.000 0.559 0.369 0.140 0.000
0.502 0.185 0.039 0.000 0.637 0.266 0.143 0.000
0.466 0.064 0.042 0.000 0.714 0.111 0.153 0.000
rticle is copyrighted as indicated in the article. Reuse of AIP content is subject to the terms at: http://scitation.aip.org/te
Components:
~1! 2-Butanol~sec-butanol, sec-butyl alcohol~RS!-2-butandl-2-butanol, DL-2-butanol!; C4H10O; @78-92-2#~2! Cyclohexane; C6H12 ; @110-82-7#~3! Water; H2O; @7732-18-5#
Variables:T/K5298
ECompositio
t/°CT/K
~compiler! x1
25.00 298.15 0.077
0.1610
0.2181
0.2727
0.3354
0.3943
0.4450
0.4815
0.5025
0.4998
0.4591
0.3916
0.0544
Compos
t/°CT/K
~compiler!
x18 x28
organic-richphase
25.00 298.15 0.041 0.952

Original Measurements:
T. M. Letcher, P. Siswana, and S. E. Radloff, S. Afr. J. Chem.44, 118–21~1991!.
Compiled by:A. Skrzecz
ntal Datag the saturation curve
x2
w1 w2
~compiler!
0.000 0.000 0.000
0.000 0.181 0.000
0.000 0.651 0.000
0.006 0.691 0.013
0.013 0.710 0.027
0.038 0.725 0.070
0.110 0.695 0.174
0.191 0.634 0.273
0.284 0.560 0.374
0.386 0.477 0.477
0.498 0.388 0.581
0.621 0.294 0.687
0.746 0.198 0.792
0.875 0.100 0.897
0.935 0.049 0.949
0.999 0.0000 0.9998
f coexisting phases
x29 w18 w28 w19 w29
r-richase
organic-richphase
~compiler!
water-richphase
~compiler!
Auxiliary Information
Method/Appratus/Procedure: Source and Purity of Materials
The points on the binodal curve were determined by thetitration method, as described in Ref. 1. The formation of acloudy mixture was observed visually on shaking afteraddition of a known mass of the third component; syringeswere precisely weighed. Tie line compositions weredetermined by the refractive index method, Ref. 2, and acomplementary method using the Karl Fischer titration, Ref. 3.Measurements were made at pressure of 94.7 kPa.
~1! Merck; AR grade; dried by addition of anhydrous K2CO3,distilled; purity .99.9 mole % by glc.~2! BDH; Gold label grade; used as received; purity.99.9 mole% by glc.~3! not specified.
Estimated Error:composition60.005 mole fraction~binodal curve!, 60.01 molefraction ~tie lines!.
References:1T. M. Letcher, S. Wootten, B. Shuttleworth, and C. Heyward, J.Chem. Thermodyn.18, 1037~1986!.2S. W. Briggs, and E. W. Comings, Ind. Eng. Chem.35, 411~1943!.3T. M. Letcher, P. Siswana, P. van der Watt, and S. Radloff, J.Chem. Thermodyn.21, 1053~1989!.
12051205
IUP
AC
-NIS
TS
OLU
BILIT
YD
AT
AS
ER
IESJ.P
hys.C
hem.
Ref.
Data,
Vol.
28,N
o.4,
1999
This /termsconditions. Downloaded to IP: 129.6.105.191 On: Fri, 05 Sep 2014 17:51:55
25.0 298.2 0.312 0.000 0.051 0.000 0.651 0.000 0.181 0.000
0.445 0.040 0.042 0.000 0.723 0.074 0.153 0.000
0.495 0.241 0.030 0.000 0.594 0.329 0.113 0.000
0.416 0.428 0.025 0.000 0.443 0.517 0.095 0.000
0.280 0.650 0.018 0.000 0.271 0.713 0.070 0.000
article is copyrighted as indicated in the article. Reuse of AIP content is subject to the terms at: http://scitation.aip.org
Components:
~1! 2-Butanol~sec-butanol, sec-butyl alcohol,~RS!-2-butanol,dl-2-butanol, DL-2-butanol!; C4H10O; @78-92-2#~2! Cyclohexane; C6H12 ; @110-82-7#~3! Water; H2O; @7732-18-5#
Variables:T/K5298
ExperimeCompositions alon
t/°C~compiler! T/K x1
25.0 298.2 0.000
0.051
0.312
0.360
0.391
0.445
0.500
0.504
0.482
0.438
0.377
0.302
0.212
0.111
0.055
0.000
Compositions o
t/°C~compiler! T/K
x18 x28 x19
organic-richphase
wateph
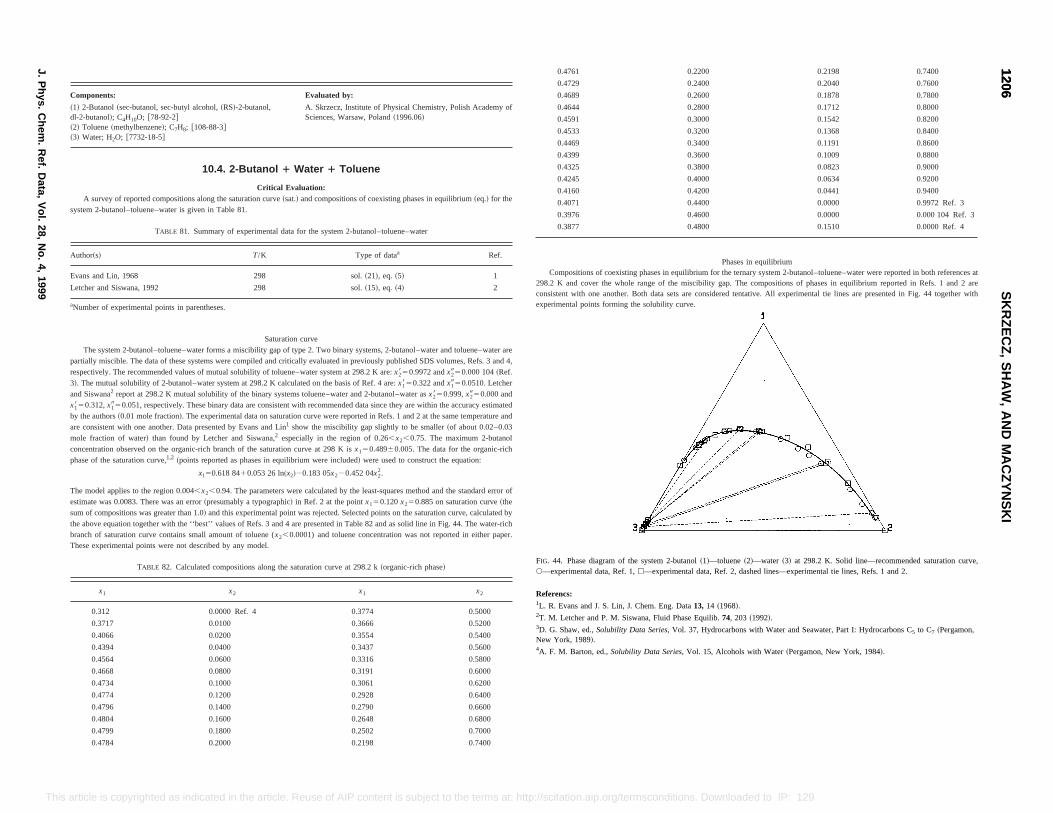
0.2200 0.2198 0.7400
0.2400 0.2040 0.7600
0.2600 0.1878 0.7800
0.2800 0.1712 0.8000
0.3000 0.1542 0.8200
0.3200 0.1368 0.8400
0.3400 0.1191 0.8600
0.3600 0.1009 0.8800
0.3800 0.0823 0.9000
0.4000 0.0634 0.9200
0.4200 0.0441 0.9400
0.4400 0.0000 0.9972 Ref. 3
0.4600 0.0000 0.000 104 Ref. 3
0.4800 0.1510 0.0000 Ref. 4
Phases in equilibriumquilibrium for the ternary system 2-butanol–toluene–water were reported in both references ate miscibility gap. The compositions of phases in equilibrium reported in Refs. 1 and 2 arets are considered tentative. All experimental tie lines are presented in Fig. 44 together with
curve.
water ~3! at 298.2 K. Solid line—recommended saturation curve,shed lines—experimental tie lines, Refs. 1 and 2.
992!.
with Water and Seawater, Part I: Hydrocarbons C5 to C7 ~Pergamon,
ith Water~Pergamon, New York, 1984!.
12061206
SK
RZ
EC
Z,
SH
AW
,A
ND
MA
CZ
YN
SK
I
J.P
hys.C
hem.
Ref.
Data,
Vol.
28,N
o.4,
1999
This to IP: 129.6.105.191 On: Fri, 05 Sep 2014 17:51:55
branch of saturation curve contains small amount of toluene (x2,0.0001) and toluene concentration was not reported in either paper.These experimental points were not described by any model.
TABLE 82. Calculated compositions along the saturation curve at 298.2 k~organic-rich phase!
x1 x2 x1 x2
0.312 0.0000 Ref. 4 0.3774 0.5000
0.3717 0.0100 0.3666 0.5200
0.4066 0.0200 0.3554 0.5400
0.4394 0.0400 0.3437 0.5600
0.4564 0.0600 0.3316 0.5800
0.4668 0.0800 0.3191 0.6000
0.4734 0.1000 0.3061 0.6200
0.4774 0.1200 0.2928 0.6400
0.4796 0.1400 0.2790 0.6600
0.4804 0.1600 0.2648 0.6800
0.4799 0.1800 0.2502 0.7000
0.4784 0.2000 0.2198 0.7400
FIG. 44. Phase diagram of the system 2-butanol~1!—toluene~2!—s—experimental data, Ref. 1,h—experimental data, Ref. 2, da
Referencs:1L. R. Evans and J. S. Lin, J. Chem. Eng. Data13, 14 ~1968!.2T. M. Letcher and P. M. Siswana, Fluid Phase Equilib.74, 203 ~13D. G. Shaw, ed.,Solubility Data Series, Vol. 37, HydrocarbonsNew York, 1989!.4A. F. M. Barton, ed.,Solubility Data Series, Vol. 15, Alcohols w
article is copyrighted as indicated in the article. Reuse of AIP content is subject to the terms at: http://scitation.aip.org/termsconditions. Downloaded
Components: Evaluated by:
~1! 2-Butanol~sec-butanol, sec-butyl alcohol,~RS!-2-butanol,dl-2-butanol!; C4H10O; @78-92-2#~2! Toluene~methylbenzene!; C7H8; @108-88-3#~3! Water; H2O; @7732-18-5#
A. Skrzecz, Institute of Physical Chemistry, Polish Academy ofSciences, Warsaw, Poland~1996.06!
10.4. 2-Butanol 1 Water 1 Toluene
Critical Evaluation:A survey of reported compositions along the saturation curve~sat.! and compositions of coexisting phases in equilibrium~eq.! for the
system 2-butanol–toluene–water is given in Table 81.
TABLE 81. Summary of experimental data for the system 2-butanol–toluene–water
Author~s! T/K Type of dataa Ref.
Evans and Lin, 1968 298 sol.~21!, eq. ~5! 1
Letcher and Siswana, 1992 298 sol.~15!, eq. ~4! 2
aNumber of experimental points in parentheses.
Saturation curveThe system 2-butanol–toluene–water forms a miscibility gap of type 2. Two binary systems, 2-butanol–water and toluene–water are
partially miscible. The data of these systems were compiled and critically evaluated in previously published SDS volumes, Refs. 3 and 4,respectively. The recommended values of mutual solubility of toluene–water system at 298.2 K are:x2850.9972 andx2950.000 104~Ref.3!. The mutual solubility of 2-butanol–water system at 298.2 K calculated on the basis of Ref. 4 are:x1850.322 andx1950.0510. Letcherand Siswana2 report at 298.2 K mutual solubility of the binary systems toluene–water and 2-butanol–water asx2850.999,x2950.000 andx1850.312,x1950.051, respectively. These binary data are consistent with recommended data since they are within the accuracy estimatedby the authors~0.01 mole fraction!. The experimental data on saturation curve were reported in Refs. 1 and 2 at the same temperature andare consistent with one another. Data presented by Evans and Lin1 show the miscibility gap slightly to be smaller~of about 0.02–0.03mole fraction of water! than found by Letcher and Siswana,2 especially in the region of 0.26,x2,0.75. The maximum 2-butanolconcentration observed on the organic-rich branch of the saturation curve at 298 K isx150.48960.005. The data for the organic-richphase of the saturation curve,1,2 ~points reported as phases in equilibrium were included! were used to construct the equation:
x150.618 8410.053 26 ln~x2!20.183 05x220.452 04x22.
The model applies to the region 0.004,x2,0.94. The parameters were calculated by the least-squares method and the standard error ofestimate was 0.0083. There was an error~presumably a typographic! in Ref. 2 at the pointx150.120x250.885 on saturation curve~thesum of compositions was greater than 1.0! and this experimental point was rejected. Selected points on the saturation curve, calculated bythe above equation together with the ‘‘best’’ values of Refs. 3 and 4 are presented in Table 82 and as solid line in Fig. 44. The water-rich
0.4761
0.4729
0.4689
0.4644
0.4591
0.4533
0.4469
0.4399
0.4325
0.4245
0.4160
0.4071
0.3976
0.3877
Compositions of coexisting phases in e298.2 K and cover the whole range of thconsistent with one another. Both data seexperimental points forming the solubility
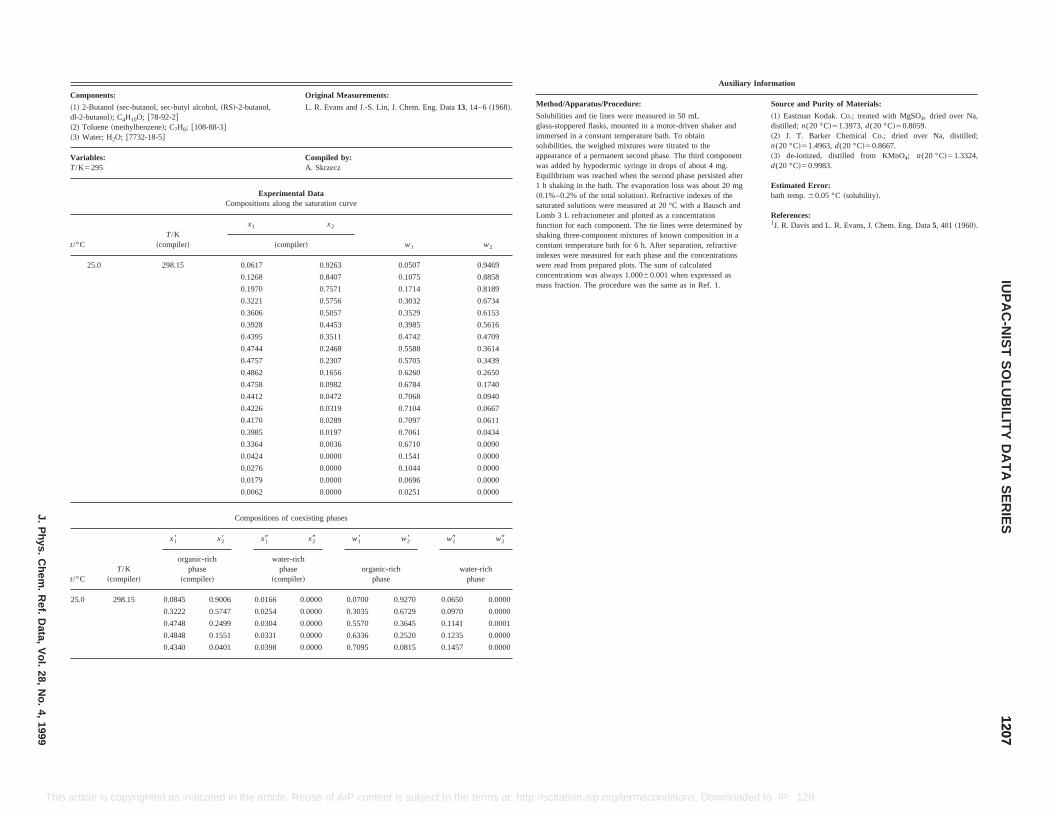
Original Measurements:
L. R. Evans and J.-S. Lin, J. Chem. Eng. Data13, 14–6~1968!.
Compiled by:A. Skrzecz
Datae saturation curve
x2
w1 w2!
0.9263 0.0507 0.9469
0.8407 0.1075 0.8858
0.7571 0.1714 0.8189
0.5756 0.3032 0.6734
0.5057 0.3529 0.6153
0.4453 0.3985 0.5616
0.3511 0.4742 0.4709
0.2468 0.5588 0.3614
0.2307 0.5705 0.3439
0.1656 0.6260 0.2650
0.0982 0.6784 0.1740
0.0472 0.7068 0.0940
0.0319 0.7104 0.0667
0.0289 0.7097 0.0611
0.0197 0.7061 0.0434
0.0036 0.6710 0.0090
0.0000 0.1541 0.0000
0.0000 0.1044 0.0000
0.0000 0.0696 0.0000
0.0000 0.0251 0.0000
xisting phases
Auxiliary Information
Method/Apparatus/Procedure: Source and Purity of Materials:
Solubilities and tie lines were measured in 50 mLglass-stoppered flasks, mounted in a motor-driven shaker andimmersed in a constant temperature bath. To obtainsolubilities, the weighed mixtures were titrated to theappearance of a permanent second phase. The third componentwas added by hypodermic syringe in drops of about 4 mg.Equilibrium was reached when the second phase persisted after1 h shaking in the bath. The evaporation loss was about 20 mg~0.1%–0.2% of the total solution!. Refractive indexes of thesaturated solutions were measured at 20 °C with a Bausch andLomb 3 L refractometer and plotted as a concentrationfunction for each component. The tie lines were determined byshaking three-component mixtures of known composition in aconstant temperature bath for 6 h. After separation, refractiveindexes were measured for each phase and the concentrationswere read from prepared plots. The sum of calculatedconcentrations was always 1.00060.001 when expressed asmass fraction. The procedure was the same as in Ref. 1.
~1! Eastman Kodak. Co.; treated with MgSO4, dried over Na,distilled; n(20 °C!51.3973,d(20 °C!50.8059.~2! J. T. Barker Chemical Co.; dried over Na, distilled;n(20 °C!51.4963,d(20 °C!50.8667.~3! de-ionized, distilled from KMnO4; n(20 °C!51.3324,d(20 °C!50.9983.
Estimated Error:bath temp.60.05 °C~solubility!.
References:1J. R. Davis and L. R. Evans, J. Chem. Eng. Data5, 401~1960!.
12071207
IUP
AC
-NIS
TS
OLU
BILIT
YD
AT
AS
ER
IESJ.P
hys.C
hem.
Ref.
Data,
Vol.
28,N
o.4,
1999
This itions. Downloaded to IP: 129.6.105.191 On: Fri, 05 Sep 2014 17:51:55
t/°CT/K
~compiler!
x18 x28 x19 x29 w18 w28 w19 w29
organic-richphase
~compiler!
water-richphase
~compiler!organic-rich
phasewater-rich
phase
25.0 298.15 0.0845 0.9006 0.0166 0.0000 0.0700 0.9270 0.0650 0.0000
0.3222 0.5747 0.0254 0.0000 0.3035 0.6729 0.0970 0.0000
0.4748 0.2499 0.0304 0.0000 0.5570 0.3645 0.1141 0.0001
0.4848 0.1551 0.0331 0.0000 0.6336 0.2520 0.1235 0.0000
0.4340 0.0401 0.0398 0.0000 0.7095 0.0815 0.1457 0.0000
article is copyrighted as indicated in the article. Reuse of AIP content is subject to the terms at: http://scitation.aip.org/termscond
Components:
~1! 2-Butanol~sec-butanol, sec-butyl alcohol,~RS!-2-butanol,dl-2-butanol!; C4H10O; @78-92-2#~2! Toluene~methylbenzene!; C7H8; @108-88-3#~3! Water; H2O; @7732-18-5#
Variables:T/K5295
ExperimentalCompositions along th
t/°CT/K
~compiler!
x1
~compiler
25.0 298.15 0.0617
0.1268
0.1970
0.3221
0.3606
0.3928
0.4395
0.4744
0.4757
0.4862
0.4758
0.4412
0.4226
0.4170
0.3985
0.3364
0.0424
0.0276
0.0179
0.0062
Compositions of coe
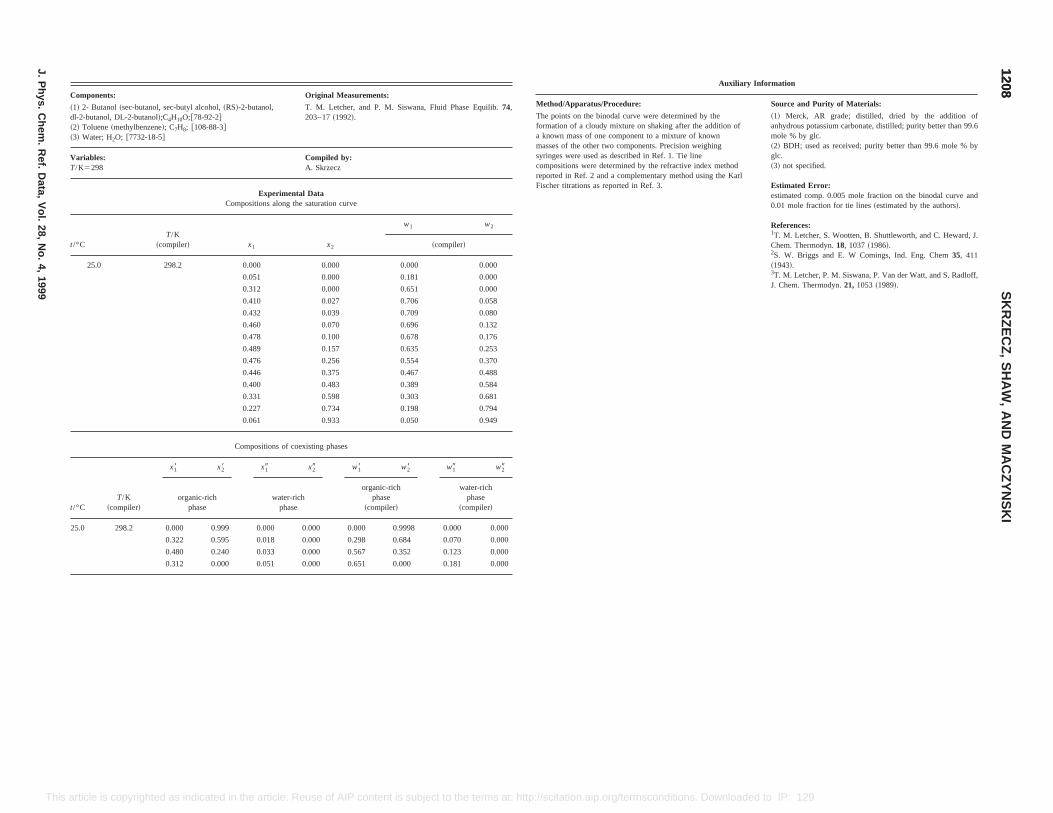
Original Measurements:
T. M. Letcher, and P. M. Siswana, Fluid Phase Equilib.74,203–17~1992!.
Compiled by:A. Skrzecz
Datae saturation curve
x2
w1 w2
~compiler!
0.000 0.000 0.000
0.000 0.181 0.000
0.000 0.651 0.000
0.027 0.706 0.058
0.039 0.709 0.080
0.070 0.696 0.132
0.100 0.678 0.176
0.157 0.635 0.253
0.256 0.554 0.370
0.375 0.467 0.488
0.483 0.389 0.584
0.598 0.303 0.681
0.734 0.198 0.794
0.933 0.050 0.949
existing phases
x29 w18 w28 w19 w29
organic-richphase
~compiler!
water-richphase
~compiler!
0.000 0.000 0.9998 0.000 0.000
Auxiliary Information
Method/Apparatus/Procedure: Source and Purity of Materials:
The points on the binodal curve were determined by theformation of a cloudy mixture on shaking after the addition ofa known mass of one component to a mixture of knownmasses of the other two components. Precision weighingsyringes were used as described in Ref. 1. Tie linecompositions were determined by the refractive index methodreported in Ref. 2 and a complementary method using the KarlFischer titrations as reported in Ref. 3.
~1! Merck, AR grade; distilled, dried by the addition ofanhydrous potassium carbonate, distilled; purity better than 99.6mole % by glc.~2! BDH; used as received; purity better than 99.6 mole % byglc.~3! not specified.
Estimated Error:estimated comp. 0.005 mole fraction on the binodal curve and0.01 mole fraction for tie lines~estimated by the authors!.
References:1T. M. Letcher, S. Wootten, B. Shuttleworth, and C. Heward, J.Chem. Thermodyn.18, 1037~1986!.2S. W. Briggs and E. W Comings, Ind. Eng. Chem35, 411~1943!.3T. M. Letcher, P. M. Siswana, P. Van der Watt, and S. Radloff,J. Chem. Thermodyn.21, 1053 ~1989!.
12081208
SK
RZ
EC
Z,
SH
AW
,A
ND
MA
CZ
YN
SK
I
J.P
hys.C
hem.
Ref.
Data,
Vol.
28,N
o.4,
1999
This .org/termsconditions. Downloaded to IP: 129.6.105.191 On: Fri, 05 Sep 2014 17:51:55
0.322 0.595 0.018 0.000 0.298 0.684 0.070 0.000
0.480 0.240 0.033 0.000 0.567 0.352 0.123 0.000
0.312 0.000 0.051 0.000 0.651 0.000 0.181 0.000
article is copyrighted as indicated in the article. Reuse of AIP content is subject to the terms at: http://scitation.aip
Components:
~1! 2- Butanol~sec-butanol, sec-butyl alcohol,~RS!-2-butanol,dl-2-butanol, DL-2-butanol!;C4H10O;@78-92-2#~2! Toluene~methylbenzene!; C7H8; @108-88-3#~3! Water; H2O; @7732-18-5#
Variables:T/K5298
ExperimentalCompositions along th
t/°CT/K
~compiler! x1
25.0 298.2 0.000
0.051
0.312
0.410
0.432
0.460
0.478
0.489
0.476
0.446
0.400
0.331
0.227
0.061
Compositions of co
t/°CT/K
~compiler!
x18 x28 x19
organic-richphase
water-richphase
25.0 298.2 0.000 0.999 0.000

Original Measurements:
S!-2-butanol, T. M. Letcher, S. Wootton, B. Shuttleworth, and C. Heyward, J.Chem. Thermodyn.18, 1037–42~1986!.
Compiled by:A. Skrzecz
2-Butanol 1 Water 1 HeptaneExperimental Data
ompositions along the saturation curve
x1 x2
w1 w2
~compiler!
0.348 0.000 0.687 0.000
0.443 0.028 0.727 0.062
0.513 0.143 0.649 0.245
0.484 0.305 0.511 0.435
0.367 0.528 0.332 0.645
0.159 0.825 0.124 0.873
0.057 0.000 0.199 0.000
Compositions of coexisting phases
x19 x29 w18 w28 w19 w29
water-richphase
organic-richphase
~compiler!
water-richphase
~compiler!
74 0.030 0.000 0.453 0.505 0.113 0.000
6 0.025 0.000 0.182 0.810 0.095 0.000
2 0.017 0.000 0.098 0.900 0.066 0.000
Auxiliatry Information
Source and Purity of Materials:
rel
tnnof
f
~1! Aldrich, Gold label, 99.5 mole %; dried with anhydrouspotassium carbonate, filtrated, distilled.~2! Analytical Carbo Erba, purity 99.5 mole %; purified bypassing through columns containing silica gel and basic alumina.~3! de-ionized.
Estimated Error:composition60.005 mole fraction for measured points,60.01mole fraction for tie-lines extremities in the worst case~authors!.
References:1S. W. Brigg, and E. W. Comings, Ind. Eng. Chem.35, 441~1993!.
12091209
IUP
AC
-NIS
TS
OLU
BILIT
YD
AT
AS
ER
IESJ.P
hys.C
hem.
Ref.
Data,
Vol.
28,N
o.4,
1999
This ed to IP: 129.6.105.191 On: Fri, 05 Sep 2014 17:51:55
t/°C ~compiler! phase phase ~compiler! ~compiler!
25.0 298.2 0.527 0.183 0.042 0.000 0.627 0.289 0.153 0.000
0.400 0.478 0.027 0.001 0.376 0.596 0.102 0.005
0.170 0.785 0.011 0.000 0.139 0.852 0.044 0.000
Auxiliary Information
Method/Apparatus/Procedure: Source and Purity of Materials:
The experimental methods have been described in Ref. 1. Nomore details were reported in the paper.
~1! source not specified.~2! Aldrich; distilled; purity .99.8 mole % by glc, r50.692 65 g cm23.~3! not specified.
Estimated Error:Not reported.
References:1T. M. Letcher and P. M. Siswana, Fluid Phase Equilib.74, 203~1992!.
Method/Apparatus/Procedure:
The titration method, adapted from Ref. 1, was used todetermine the coexistence curve. The third component wasadded from a weighed gas-tight syringe to a weighed mixtuof the other two components in 100 mL long-neck flask untione drop~weighing less than 0.01 g! resulted in cloudiness.The flask was immersed in a well controlled water bath andshaken continuously. Refractive indexes of these mixtureswere measured at 298.3 K to ensure that separation did notake place. Tie lines were determined from mixtures of knowcomposition in the immiscible region. The flasks were shakewell and the phases allowed to separate. Refractive indexessamples of both phases were measured and related tocompositions on the coexistence curve. Each tie line waschecked to ensure that it passed through the composition othe overall mixture.
article is copyrighted as indicated in the article. Reuse of AIP content is subject to the terms at: http://scitation.aip.org/termsconditions. Download
Components: Original Measurements:
~1! 2-Butanol~sec-butanol, sec-butyl alcohol,~RS!-2-butanol,dl-2-butanol, DL-2 butanol!; C4H10O; @78-92-2#~2! 1-Heptene; C7H14; @592-76-7#~3! Water; H2O; @7732-18-5#
T. M. Letcher, B. C. Bricknell, J. D. Sewry, and S. E. Radloff, J.Chem. Eng. Data39, 320–3~1994!.
Variables:T/K5298
Compiled by:A. Skrzecz
10.5. 2-Butanol 1 Water 1 1-HepteneExperimental Data
Compositions along the saturation curve
t/°CT/K
~compiler! x1 x2
w1 w2
~compiler!
25.0 298.2 0.000 1.000 0.000 1.000
0.142 0.828 0.114 0.880
0.255 0.683 0.217 0.770
0.391 0.489 0.366 0.607
0.430 0.426 0.418 0.548
0.485 0.323 0.505 0.446
0.520 0.231 0.587 0.345
0.521 0.147 0.654 0.245
0.498 0.082 0.703 0.153
0.452 0.037 0.723 0.078
0.322 0.000 0.661 0.000
0.054 0.000 0.190 0.000
0.023 0.001 0.088 0.005
0.000 0.000 0.000 0.000
Compositions of coexisting phases
T/K
x18 x28 x19 x29 w18 w28 w19 w29
organic-rich water-richorganic-rich
phasewater-rich
phase
Components:
~1! 2-Butanol~sec-butanol, sec-butyl alcohol,~Rdl-2-butanol, DL-2-butanol!; C4H10O; @78-92-2#~2! Heptane~n-heptane!; C7H16; @142-82-5#~3! Water; H2O; @7732-18-5#
Variables:T/K5298
10.6.
C
t/°C~compiler! T/K
25 298.2
t/°C~compiler! T/K
x18 x28
organic-richphase
25 298.2 0.453 0.3
0.224 0.73
0.127 0.86
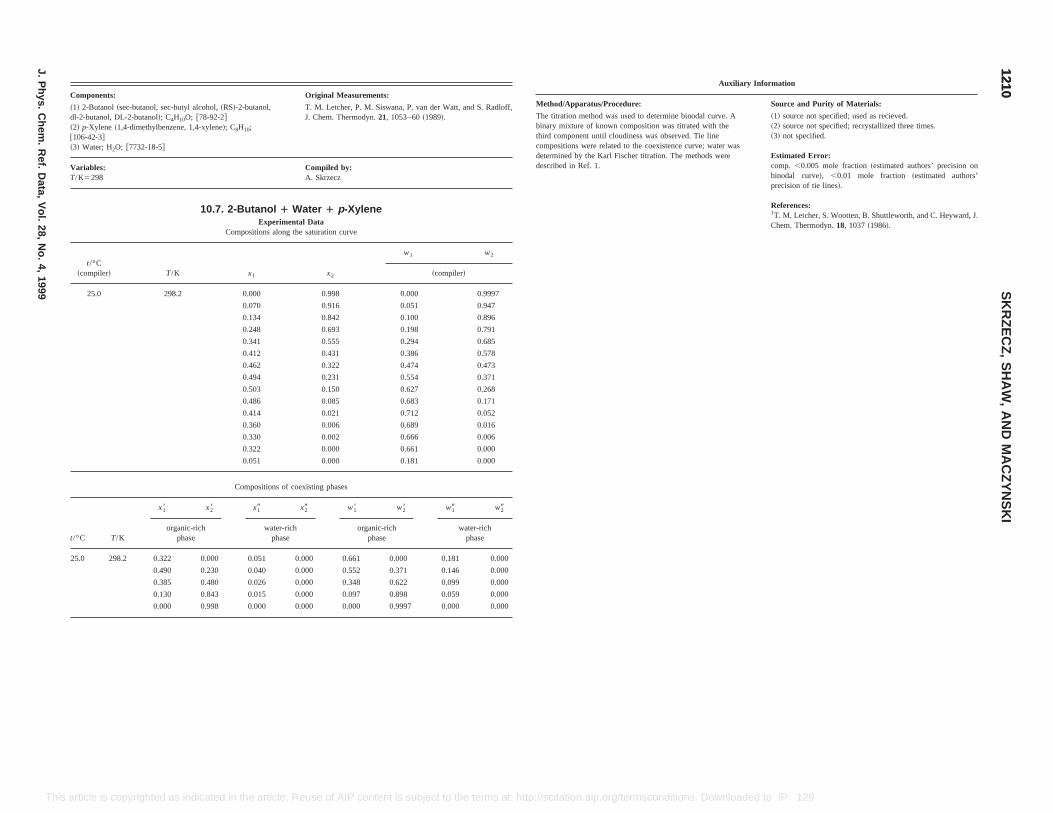
Original Measurements:
butanol,
0;
T. M. Letcher, P. M. Siswana, P. van der Watt, and S. Radloff,J. Chem. Thermodyn.21, 1053–60~1989!.
Compiled by:A. Skrzecz
tanol 1 Water 1 p-XyleneExperimental Data
ositions along the saturation curve
x1 x2
w1 w2
~compiler!
0.000 0.998 0.000 0.9997
.070 0.916 0.051 0.947
.134 0.842 0.100 0.896
.248 0.693 0.198 0.791
.341 0.555 0.294 0.685
.412 0.431 0.386 0.578
.462 0.322 0.474 0.473
.494 0.231 0.554 0.371
.503 0.150 0.627 0.268
.486 0.085 0.683 0.171
.414 0.021 0.712 0.052
.360 0.006 0.689 0.016
.330 0.002 0.666 0.006
.322 0.000 0.661 0.000
.051 0.000 0.181 0.000
mpositions of coexisting phases
x19 x29 w18 w28 w19 w29
water-rich organic-rich water-rich
Auxiliary Information
Method/Apparatus/Procedure: Source and Purity of Materials:
The titration method was used to determine binodal curve. Abinary mixture of known composition was titrated with thethird component until cloudiness was observed. Tie linecompositions were related to the coexistence curve; water wasdetermined by the Karl Fischer titration. The methods weredescribed in Ref. 1.
~1! source not specified; used as recieved.~2! source not specified; recrystallized three times.~3! not specified.
Estimated Error:comp. ,0.005 mole fraction~estimated authors’ precision onbinodal curve!, ,0.01 mole fraction ~estimated authors’precision of tie lines!.
References:1T. M. Letcher, S. Wootten, B. Shuttleworth, and C. Heyward, J.Chem. Thermodyn.18, 1037~1986!.
12101210
SK
RZ
EC
Z,
SH
AW
,A
ND
MA
CZ
YN
SK
I
J.P
hys.C
hem.
Ref.
Data,
Vol.
28,N
o.4,
1999
This ermsconditions. Downloaded to IP: 129.6.105.191 On: Fri, 05 Sep 2014 17:51:55
t/°C T/K phase phase phase phase
25.0 298.2 0.322 0.000 0.051 0.000 0.661 0.000 0.181 0.000
0.490 0.230 0.040 0.000 0.552 0.371 0.146 0.000
0.385 0.480 0.026 0.000 0.348 0.622 0.099 0.000
0.130 0.843 0.015 0.000 0.097 0.898 0.059 0.000
0.000 0.998 0.000 0.000 0.000 0.9997 0.000 0.000
article is copyrighted as indicated in the article. Reuse of AIP content is subject to the terms at: http://scitation.aip.org/t
Components:
~1! 2-Butanol~sec-butanol, sec-butyl alcohol,~RS!-2-dl-2-butanol, DL-2-butanol!; C4H10O; @78-92-2#~2! p-Xylene ~1,4-dimethylbenzene, 1,4-xylene!; C8H1
@106-42-3#~3! Water; H2O; @7732-18-5#
Variables:T/K5298
10.7. 2-Bu
Comp
t/°C~compiler! T/K
25.0 298.2
0
0
0
0
0
0
0
0
0
0
0
0
0
0
Co
x18 x28
organic-rich
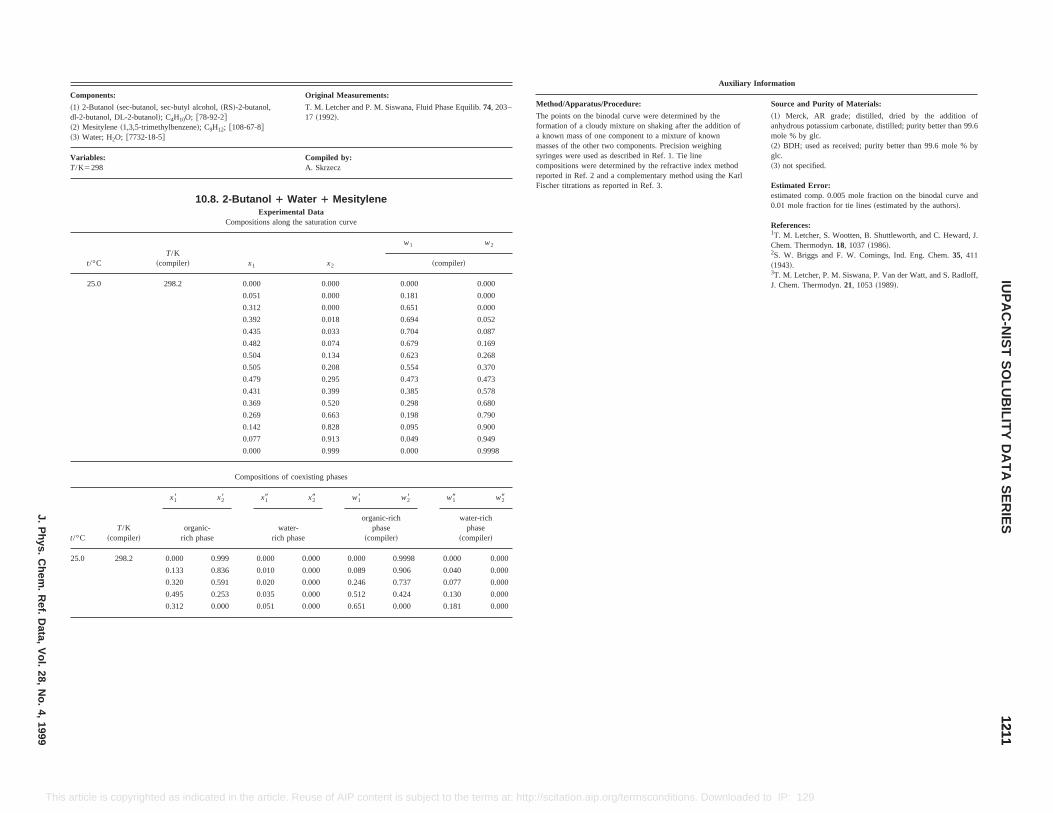
Original Measurements:
T. M. Letcher and P. M. Siswana, Fluid Phase Equilib.74, 203–17 ~1992!.
Compiled by:A. Skrzecz
ter 1 Mesityleneal Datathe saturation curve
x2
w1 w2
~compiler!
0.000 0.000 0.000
0.000 0.181 0.000
0.000 0.651 0.000
0.018 0.694 0.052
0.033 0.704 0.087
0.074 0.679 0.169
0.134 0.623 0.268
0.208 0.554 0.370
0.295 0.473 0.473
0.399 0.385 0.578
0.520 0.298 0.680
0.663 0.198 0.790
0.828 0.095 0.900
0.913 0.049 0.949
0.999 0.000 0.9998
oexisting phases
x29 w18 w28 w19 w29
organic-richphase
water-richphase
Auxiliary Information
Method/Apparatus/Procedure: Source and Purity of Materials:
The points on the binodal curve were determined by theformation of a cloudy mixture on shaking after the addition ofa known mass of one component to a mixture of knownmasses of the other two components. Precision weighingsyringes were used as described in Ref. 1. Tie linecompositions were determined by the refractive index methodreported in Ref. 2 and a complementary method using the KarlFischer titrations as reported in Ref. 3.
~1! Merck, AR grade; distilled, dried by the addition ofanhydrous potassium carbonate, distilled; purity better than 99.6mole % by glc.~2! BDH; used as received; purity better than 99.6 mole % byglc.~3! not specified.
Estimated Error:estimated comp. 0.005 mole fraction on the binodal curve and0.01 mole fraction for tie lines~estimated by the authors!.
References:1T. M. Letcher, S. Wootten, B. Shuttleworth, and C. Heward, J.Chem. Thermodyn.18, 1037~1986!.2S. W. Briggs and F. W. Comings, Ind. Eng. Chem.35, 411~1943!.3T. M. Letcher, P. M. Siswana, P. Van der Watt, and S. Radloff,J. Chem. Thermodyn.21, 1053~1989!.
12111211
IUP
AC
-NIS
TS
OLU
BILIT
YD
AT
AS
ER
IESJ.P
hys.C
hem.
Ref.
Data,
Vol.
28,N
o.4,
1999
This rmsconditions. Downloaded to IP: 129.6.105.191 On: Fri, 05 Sep 2014 17:51:55
t/°C ~compiler! rich phase rich phase ~compiler! ~compiler!
25.0 298.2 0.000 0.999 0.000 0.000 0.000 0.9998 0.000 0.000
0.133 0.836 0.010 0.000 0.089 0.906 0.040 0.000
0.320 0.591 0.020 0.000 0.246 0.737 0.077 0.000
0.495 0.253 0.035 0.000 0.512 0.424 0.130 0.000
0.312 0.000 0.051 0.000 0.651 0.000 0.181 0.000
article is copyrighted as indicated in the article. Reuse of AIP content is subject to the terms at: http://scitation.aip.org/te
Components:
~1! 2-Butanol~sec-butanol, sec-butyl alcohol,~RS!-2-butanol,dl-2-butanol, DL-2-butanol!; C4H10O; @78-92-2#~2! Mesitylene~1,3,5-trimethylbenzene!; C9H12; @108-67-8#~3! Water; H2O; @7732-18-5#
Variables:T/K5298
10.8. 2-Butanol 1 WaExperiment
Compositions along
t/°CT/K
~compiler! x1
25.0 298.2 0.000
0.051
0.312
0.392
0.435
0.482
0.504
0.505
0.479
0.431
0.369
0.269
0.142
0.077
0.000
Compositions of c
T/K
x18 x28 x19
organic- water-
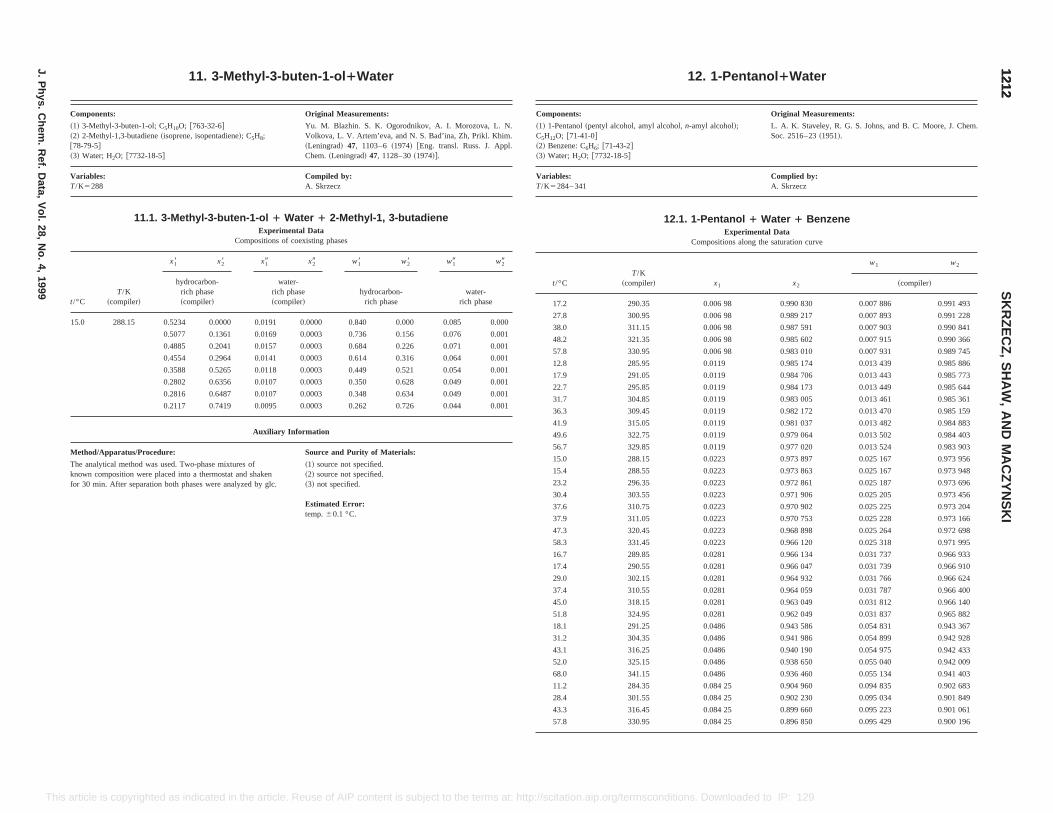
anol 1Water
Original Measurements:
L. A. K. Staveley, R. G. S. Johns, and B. C. Moore, J. Chem.Soc. 2516–23~1951!.
Complied by:A. Skrzecz
Water 1 Benzeneental Datang the saturation curve
x2
w1 w2
~compiler!
0.990 830 0.007 886 0.991 493
0.989 217 0.007 893 0.991 228
0.987 591 0.007 903 0.990 841
0.985 602 0.007 915 0.990 366
0.983 010 0.007 931 0.989 745
0.985 174 0.013 439 0.985 886
0.984 706 0.013 443 0.985 773
0.984 173 0.013 449 0.985 644
0.983 005 0.013 461 0.985 361
0.982 172 0.013 470 0.985 159
0.981 037 0.013 482 0.984 883
0.979 064 0.013 502 0.984 403
0.977 020 0.013 524 0.983 903
0.973 897 0.025 167 0.973 956
0.973 863 0.025 167 0.973 948
0.972 861 0.025 187 0.973 696
0.971 906 0.025 205 0.973 456
0.970 902 0.025 225 0.973 204
0.970 753 0.025 228 0.973 166
0.968 898 0.025 264 0.972 698
58.3 331.45 0.0223 0.966 120 0.025 318 0.971 995
16.7 289.85 0.0281 0.966 134 0.031 737 0.966 933
17.4 290.55 0.0281 0.966 047 0.031 739 0.966 910
29.0 302.15 0.0281 0.964 932 0.031 766 0.966 624
37.4 310.55 0.0281 0.964 059 0.031 787 0.966 400
45.0 318.15 0.0281 0.963 049 0.031 812 0.966 140
51.8 324.95 0.0281 0.962 049 0.031 837 0.965 882
18.1 291.25 0.0486 0.943 586 0.054 831 0.943 367
31.2 304.35 0.0486 0.941 986 0.054 899 0.942 928
43.1 316.25 0.0486 0.940 190 0.054 975 0.942 433
52.0 325.15 0.0486 0.938 650 0.055 040 0.942 009
68.0 341.15 0.0486 0.936 460 0.055 134 0.941 403
11.2 284.35 0.084 25 0.904 960 0.094 835 0.902 683
28.4 301.55 0.084 25 0.902 230 0.095 034 0.901 849
43.3 316.45 0.084 25 0.899 660 0.095 223 0.901 061
57.8 330.95 0.084 25 0.896 850 0.095 429 0.900 196
12121212
SK
RZ
EC
Z,
SH
AW
,A
ND
MA
CZ
YN
SK
I
J.P
hys.C
hem.
Ref.
Data,
Vol.
28,N
o.4,
1999
This p://scitation.aip.org/termsconditions. Downloaded to IP: 129.6.105.191 On: Fri, 05 Sep 2014 17:51:55
article is copyrighted as indicated in the article. Reuse of AIP content is subject to the terms at: htt11. 3-Methyl-3-buten-1-ol 1Water
Components: Original Measurements:
~1! 3-Methyl-3-buten-1-ol; C5H10O; @763-32-6#~2! 2-Methyl-1,3-butadiene~isoprene, isopentadiene!; C5H8;@78-79-5#~3! Water; H2O; @7732-18-5#
Yu. M. Blazhin. S. K. Ogorodnikov, A. I. Morozova, L. N.Volkova, L. V. Artem’eva, and N. S. Bad’ina, Zh, Prikl. Khim.~Leningrad! 47, 1103–6 ~1974! @Eng. transl. Russ. J. Appl.Chem.~Leningrad! 47, 1128–30~1974!#.
Variables:T/K5288
Compiled by:A. Skrzecz
11.1. 3-Methyl-3-buten-1-ol 1 Water 1 2-Methyl-1, 3-butadieneExperimental Data
Compositions of coexisting phases
t/°CT/K
~compiler!
x18 x28 x19 x29 w18 w28 w19 w29
hydrocarbon-rich phase~compiler!
water-rich phase~compiler!
hydrocarbon-rich phase
water-rich phase
15.0 288.15 0.5234 0.0000 0.0191 0.0000 0.840 0.000 0.085 0.000
0.5077 0.1361 0.0169 0.0003 0.736 0.156 0.076 0.001
0.4885 0.2041 0.0157 0.0003 0.684 0.226 0.071 0.001
0.4554 0.2964 0.0141 0.0003 0.614 0.316 0.064 0.001
0.3588 0.5265 0.0118 0.0003 0.449 0.521 0.054 0.001
0.2802 0.6356 0.0107 0.0003 0.350 0.628 0.049 0.001
0.2816 0.6487 0.0107 0.0003 0.348 0.634 0.049 0.001
0.2117 0.7419 0.0095 0.0003 0.262 0.726 0.044 0.001
Auxiliary Information
Method/Apparatus/Procedure: Source and Purity of Materials:
The analytical method was used. Two-phase mixtures ofknown composition were placed into a thermostat and shakenfor 30 min. After separation both phases were analyzed by glc.
~1! source not specified.~2! source not specified.~3! not specified.
Estimated Error:temp.60.1 °C.
12. 1-Pent
Components:
~1! 1-Pentanol~pentyl alcohol, amyl alcohol,n-amyl alcohol!;C5H12O; @71-41-0#~2! Benzene: C6H6; @71-43-2#~3! Water; H2O; @7732-18-5#
Variables:T/K5284– 341
12.1. 1-Pentanol 1Experim
Compositions alo
t/°CT/K
~compiler! x1
17.2 290.35 0.006 98
27.8 300.95 0.006 98
38.0 311.15 0.006 98
48.2 321.35 0.006 98
57.8 330.95 0.006 98
12.8 285.95 0.0119
17.9 291.05 0.0119
22.7 295.85 0.0119
31.7 304.85 0.0119
36.3 309.45 0.0119
41.9 315.05 0.0119
49.6 322.75 0.0119
56.7 329.85 0.0119
15.0 288.15 0.0223
15.4 288.55 0.0223
23.2 296.35 0.0223
30.4 303.55 0.0223
37.6 310.75 0.0223
37.9 311.05 0.0223
47.3 320.45 0.0223
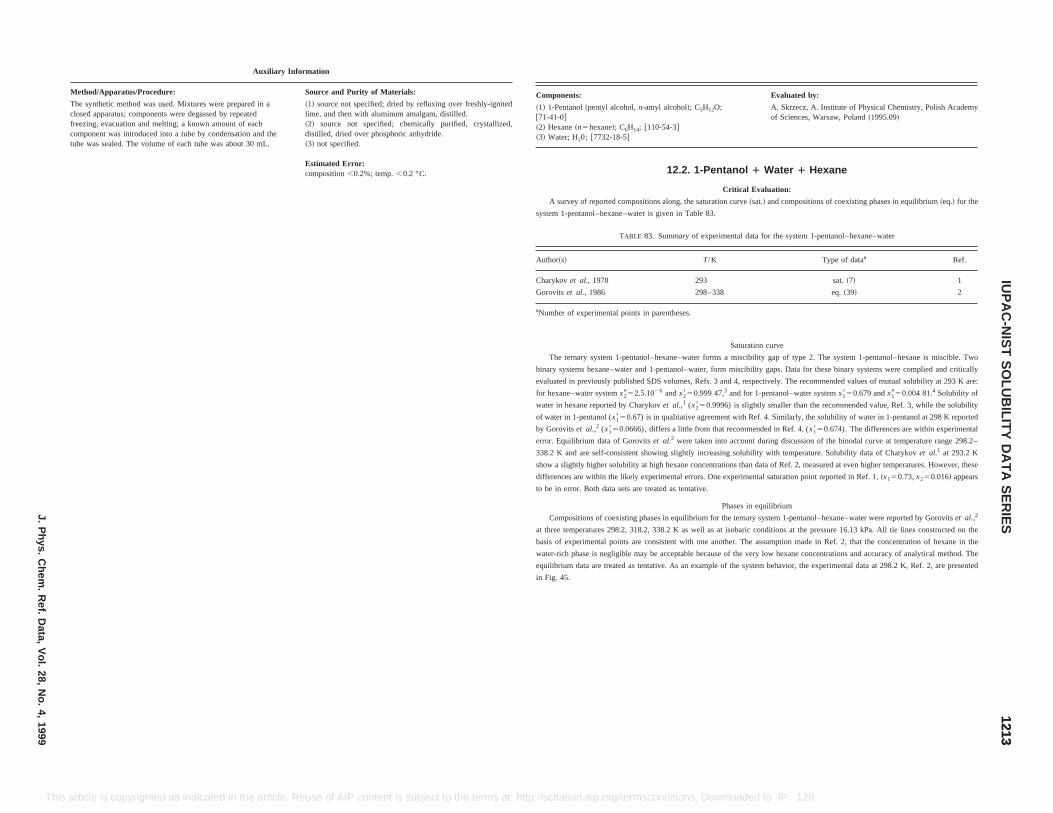
Evaluated by:
ntyl alcohol,n-amyl alcohol!; C5H12O;
exane!; C6H14; @110-54-3#7732-18-5#
A. Skrzecz, A. Institute of Physical Chemistry, Polish Academyof Sciences, Warsaw, Poland~1995.09!
12.2. 1-Pentanol 1 Water 1 Hexane
Critical Evaluation:
eported compositions along, the saturation curve~sat.! and compositions of coexisting phases in equilibrium~eq.! for the
ol–hexane–water is given in Table 83.
TABLE 83. Summary of experimental data for the system 1-pentanol–hexane–water
T/K Type of dataa Ref.
978 293 sat.~7! 1
986 298–338 eq.~39! 2
rimental points in parentheses.
Saturation curve
system 1-pentanol–hexane–water forms a miscibility gap of type 2. The system 1-pentanol–hexane is miscible. Two
exane–water and 1-pentanol–water, form miscibility gaps. Data for these binary systems were complied and critically
iously published SDS volumes, Refs. 3 and 4, respectively. The recommended values of mutual solubility at 293 K are:
r systemx2952.5.1026 andx2850.999 47,3 and for 1-pentanol–water systemx1850.679 andx1950.004 81.4 Solubility of
reported by Charykovet al.,1 (x2850.9996) is slightly smaller than the recommended value, Ref. 3, while the solubility
tanol (x1850.67) is in qualitative agreement with Ref. 4. Similarly, the solubility of water in 1-pentanol at 298 K reported
,2 (x1850.0666), differs a little from that recommended in Ref. 4. (x1850.674). The differences are within experimental
data of Gorovitset al.2 were taken into account during discussion of the binodal curve at temperature range 298.2–
self-consistent showing slightly increasing solubility with temperature. Solubility data of Charykovet al.1 at 293.2 K
igher solubility at high hexane concentrations than data of Ref. 2, measured at even higher temperatures. However, these
ithin the likely experimental errors. One experimental saturation point reported in Ref. 1,~x150.73,x250.016! appears
th data sets are treated as tentative.
Phases in equilibrium
s of coexisting phases in equilibrium for the ternary system 1-pentanol–hexane–water were reported by Gorovitset al.,2
at three temperatures 298.2, 318.2, 338.2 K as well as at isobaric conditions at the pressure 16.13 kPa. All tie lines constructed on the
basis of experimental points are consistent with one another. The assumption made in Ref. 2, that the concentration of hexane in the
water-rich phase is negligible may be acceptable because of the very low hexane concentrations and accuracy of analytical method. The
equilibrium data are treated as tentative. As an example of the system behavior, the experimental data at 298.2 K, Ref. 2, are presented
in Fig. 45.
12131213
IUP
AC
-NIS
TS
OLU
BILIT
YD
AT
AS
ER
IESJ.P
hys.C
hem.
Ref.
Data,
Vol.
28,N
o.4,
1999
This ted in the article. Reuse of AIP content is subject to the terms at: http://scitation.aip.org/termsconditions. Downloaded to IP: 129.6.105.191 On: Fri, 05 Sep 2014 17:51:55
article is copyrighted as indicaAuxiliary Information
Method/Apparatus/Procedure: Source and Purity of Materials:
The synthetic method was used. Mixtures were prepared in aclosed apparatus; components were degassed by repeatedfreezing, evacuation and melting; a known amount of eachcomponent was introduced into a tube by condensation and thetube was sealed. The volume of each tube was about 30 mL.
~1! source not specified; dried by refluxing over freshly-ignitedlime, and then with aluminum amalgam, distilled.~2! source not specified; chemically purified, crystallized,distilled, dried over phosphoric anhydride.~3! not specified.
Estimated Error:composition,0.2%; temp.,0.2 °C.
Components:
~1! 1-Pentanol~pe@71-41-0#~2! Hexane~n5h~3! Water; H20; @
A survey of r
system 1-pentan
Author~s!
Charykovet al., 1
Gorovitset al., 1
aNumber of expe
The ternary
binary systems h
evaluated in prev
for hexane–wate
water in hexane
of water in 1-pen
by Gorovitset al.
error. Equilibrium
338.2 K and are
show a slightly h
differences are w
to be in error. Bo
Composition
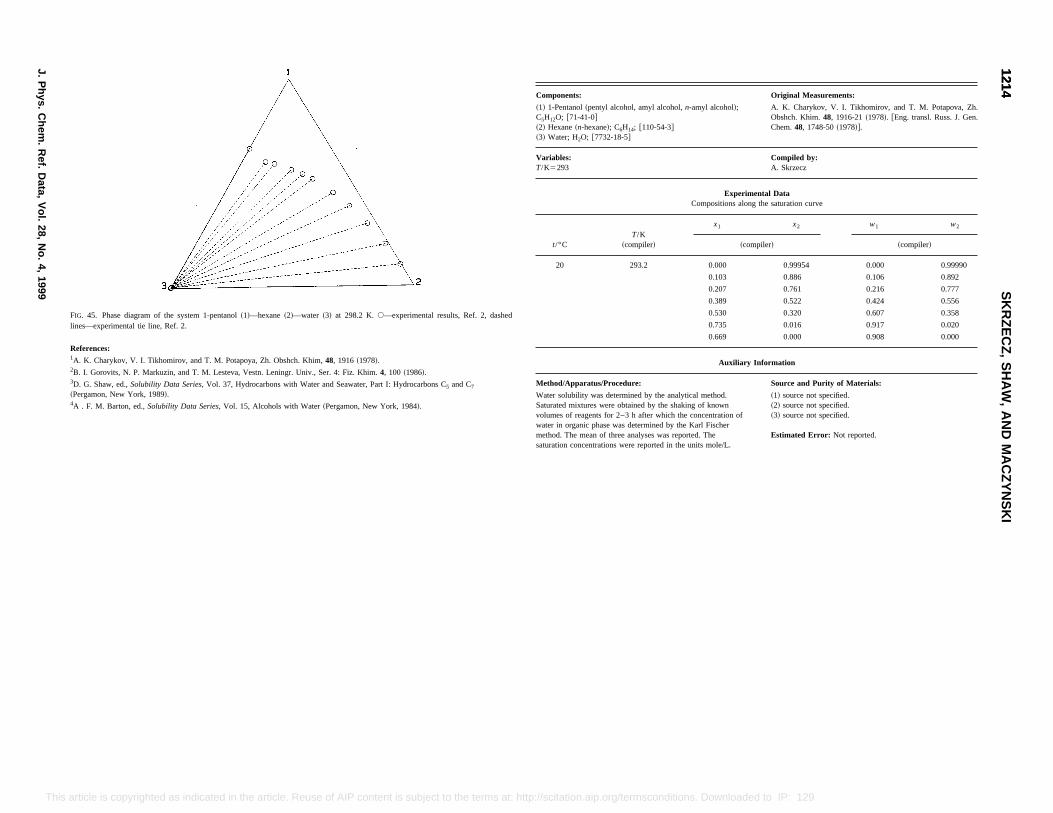
ts, Ref. 2, dashed
Cd C7
Components: Original Measurements:
~1! 1-Pentanol~pentyl alcohol, amyl alcohol,n-amyl alcohol!;C5H12O; @71-41-0#~2! Hexane~n-hexane!; C6H14; @110-54-3#~3! Water; H2O; @7732-18-5#
A. K. Charykov, V. I. Tikhomirov, and T. M. Potapova, Zh.Obshch. Khim.48, 1916-21~1978!. @Eng. transl. Russ. J. Gen.Chem.48, 1748-50~1978!#.
Variables:T/K5293
Compiled by:A. Skrzecz
Experimental DataCompositions along the saturation curve
t/°CT/K
~compiler!
x1 x2 w1 w2
~compiler! ~compiler!
20 293.2 0.000 0.99954 0.000 0.99990
0.103 0.886 0.106 0.892
0.207 0.761 0.216 0.777
0.389 0.522 0.424 0.556
0.530 0.320 0.607 0.358
0.735 0.016 0.917 0.020
0.669 0.000 0.908 0.000
Auxiliary Information
Method/Apparatus/Procedure: Source and Purity of Materials:
Water solubility was determined by the analytical method.Saturated mixtures were obtained by the shaking of knownvolumes of reagents for 2–3 h after which the concentration ofwater in organic phase was determined by the Karl Fischermethod. The mean of three analyses was reported. Thesaturation concentrations were reported in the units mole/L.
~1! source not specified.~2! source not specified.~3! source not specified.
Estimated Error: Not reported.
12141214
SK
RZ
EC
Z,
SH
AW
,A
ND
MA
CZ
YN
SK
I
J.P
hys.C
hem.
Ref.
Data,
Vol.
28,N
o.4,
1999
This t to the terms at: http://scitation.aip.org/termsconditions. Downloaded to IP: 129.6.105.191 On: Fri, 05 Sep 2014 17:51:55
article is copyrighted as indicated in the article. Reuse of AIP content is subjecFIG. 45. Phase diagram of the system 1-pentanol~1!—hexane~2!—water ~3! at 298.2 K.s—experimental resullines—experimental tie line, Ref. 2.
References:1A. K. Charykov, V. I. Tikhomirov, and T. M. Potapoya, Zh. Obshch. Khim,48, 1916~1978!.2B. I. Gorovits, N. P. Markuzin, and T. M. Lesteva, Vestn. Leningr. Univ., Ser. 4: Fiz. Khim.4, 100 ~1986!.3D. G. Shaw, ed.,Solubility Data Series, Vol. 37, Hydrocarbons with Water and Seawater, Part I: Hydrocarbons5 an~Pergamon, New York, 1989!.4A . F. M. Barton, ed.,Solubility Data Series, Vol. 15, Alcohols with Water~Pergamon, New York, 1984!.
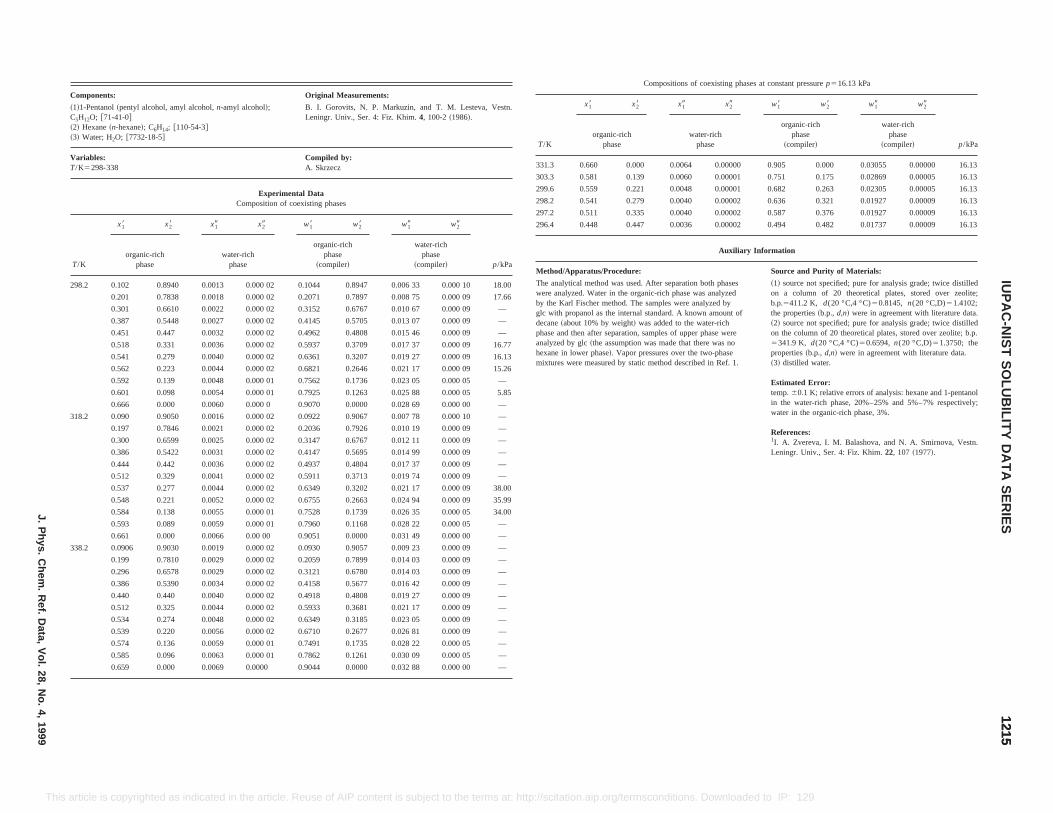
teva, Vestn.
p/kPa
10 18.00
09 17.66
09 —
09 —
09 —
09 16.77
09 16.13
09 15.26
05 —
05 5.85
00 —
10 —
09 —
09 —
09 —
09 —
09 —
09 38.00
09 35.99
05 34.00
05 —
Compositions of coexisting phases at constant pressurep516.13 kPa
T/K
x18 x28 x19 x29 w18 w28 w19 w29
p/kPaorganic-rich
phasewater-rich
phase
organic-richphase
~compiler!
water-richphase
~compiler!
331.3 0.660 0.000 0.0064 0.00000 0.905 0.000 0.03055 0.00000 16.13
303.3 0.581 0.139 0.0060 0.00001 0.751 0.175 0.02869 0.00005 16.13
299.6 0.559 0.221 0.0048 0.00001 0.682 0.263 0.02305 0.00005 16.13
298.2 0.541 0.279 0.0040 0.00002 0.636 0.321 0.01927 0.00009 16.13
297.2 0.511 0.335 0.0040 0.00002 0.587 0.376 0.01927 0.00009 16.13
296.4 0.448 0.447 0.0036 0.00002 0.494 0.482 0.01737 0.00009 16.13
Auxiliary Information
Method/Apparatus/Procedure: Source and Purity of Materials:
The analytical method was used. After separation both phaseswere analyzed. Water in the organic-rich phase was analyzedby the Karl Fischer method. The samples were analyzed byglc with propanol as the internal standard. A known amount ofdecane~about 10% by weight! was added to the water-richphase and then after separation, samples of upper phase wereanalyzed by glc~the assumption was made that there was nohexane in lower phase!. Vapor pressures over the two-phasemixtures were measured by static method described in Ref. 1.
~1! source not specified; pure for analysis grade; twice distilledon a column of 20 theoretical plates, stored over zeolite;b.p.5411.2 K, d(20 °C,4 °C)50.8145, n(20 °C,D)51.4102;the properties~b.p.,d,n! were in agreement with literature data.~2! source not specified; pure for analysis grade; twice distilledon the column of 20 theoretical plates, stored over zeolite; b.p.5341.9 K, d(20 °C,4 °C)50.6594, n(20 °C,D)51.3750; theproperties~b.p.,d,n! were in agreement with literature data.~3! distilled water.
Estimated Error:temp.60.1 K; relative errors of analysis: hexane and 1-pentanolin the water-rich phase, 20%–25% and 5%–7% respectively;water in the organic-rich phase, 3%.
References:1I. A. Zvereva, I. M. Balashova, and N. A. Smirnova, Vestn.Leningr. Univ., Ser. 4: Fiz. Khim.22, 107 ~1977!.
12151215
IUP
AC
-NIS
TS
OLU
BILIT
YD
AT
AS
ER
IESJ.P
hys.C
hem.
Ref.
Data,
Vol.
28,N
o.4,
1999
This s. Downloaded to IP: 129.6.105.191 On: Fri, 05 Sep 2014 17:51:55
0.661 0.000 0.0066 0.00 00 0.9051 0.0000 0.031 49 0.000 00 —
338.2 0.0906 0.9030 0.0019 0.000 02 0.0930 0.9057 0.009 23 0.000 09 —
0.199 0.7810 0.0029 0.000 02 0.2059 0.7899 0.014 03 0.000 09 —
0.296 0.6578 0.0029 0.000 02 0.3121 0.6780 0.014 03 0.000 09 —
0.386 0.5390 0.0034 0.000 02 0.4158 0.5677 0.016 42 0.000 09 —
0.440 0.440 0.0040 0.000 02 0.4918 0.4808 0.019 27 0.000 09 —
0.512 0.325 0.0044 0.000 02 0.5933 0.3681 0.021 17 0.000 09 —
0.534 0.274 0.0048 0.000 02 0.6349 0.3185 0.023 05 0.000 09 —
0.539 0.220 0.0056 0.000 02 0.6710 0.2677 0.026 81 0.000 09 —
0.574 0.136 0.0059 0.000 01 0.7491 0.1735 0.028 22 0.000 05 —
0.585 0.096 0.0063 0.000 01 0.7862 0.1261 0.030 09 0.000 05 —
0.659 0.000 0.0069 0.0000 0.9044 0.0000 0.032 88 0.000 00 —
article is copyrighted as indicated in the article. Reuse of AIP content is subject to the terms at: http://scitation.aip.org/termscondition
Components: Original Measurements:
~1!1-Pentanol~pentyl alcohol, amyl alcohol,n-amyl alcohol!;C5H12O; @71-41-0#~2! Hexane~n-hexane!; C6H14; @110-54-3#~3! Water; H2O; @7732-18-5#
B. I. Gorovits, N. P. Markuzin, and T. M. LesLeningr. Univ., Ser. 4: Fiz. Khim.4, 100-2~1986!.
Variables:T/K5298-338
Compiled by:A. Skrzecz
Experimental DataComposition of coexisting phases
T/K
x18 x28 x19 x29 w18 w28 w19 w29
organic-richphase
water-richphase
organic-richphase
~compiler!
water-richphase
~compiler!
298.2 0.102 0.8940 0.0013 0.000 02 0.1044 0.8947 0.006 33 0.000
0.201 0.7838 0.0018 0.000 02 0.2071 0.7897 0.008 75 0.000
0.301 0.6610 0.0022 0.000 02 0.3152 0.6767 0.010 67 0.000
0.387 0.5448 0.0027 0.000 02 0.4145 0.5705 0.013 07 0.000
0.451 0.447 0.0032 0.000 02 0.4962 0.4808 0.015 46 0.000
0.518 0.331 0.0036 0.000 02 0.5937 0.3709 0.017 37 0.000
0.541 0.279 0.0040 0.000 02 0.6361 0.3207 0.019 27 0.000
0.562 0.223 0.0044 0.000 02 0.6821 0.2646 0.021 17 0.000
0.592 0.139 0.0048 0.000 01 0.7562 0.1736 0.023 05 0.000
0.601 0.098 0.0054 0.000 01 0.7925 0.1263 0.025 88 0.000
0.666 0.000 0.0060 0.000 0 0.9070 0.0000 0.028 69 0.000
318.2 0.090 0.9050 0.0016 0.000 02 0.0922 0.9067 0.007 78 0.000
0.197 0.7846 0.0021 0.000 02 0.2036 0.7926 0.010 19 0.000
0.300 0.6599 0.0025 0.000 02 0.3147 0.6767 0.012 11 0.000
0.386 0.5422 0.0031 0.000 02 0.4147 0.5695 0.014 99 0.000
0.444 0.442 0.0036 0.000 02 0.4937 0.4804 0.017 37 0.000
0.512 0.329 0.0041 0.000 02 0.5911 0.3713 0.019 74 0.000
0.537 0.277 0.0044 0.000 02 0.6349 0.3202 0.021 17 0.000
0.548 0.221 0.0052 0.000 02 0.6755 0.2663 0.024 94 0.000
0.584 0.138 0.0055 0.000 01 0.7528 0.1739 0.026 35 0.000
0.593 0.089 0.0059 0.000 01 0.7960 0.1168 0.028 22 0.000

M
TdaodwcmdmTrmEc
entanol 1Water
Original Measurements:
T. M. Letcher, S. Wootton, B. Shuttleworth, and C. Heyward, J.Chem. Thermodyn.18, 1037–42~1986!.
Compiled by:A. Skrzecz
nol 1 Water 1 HeptaneExperimental Dataions along the saturation curve
x2
w1 w2
~compiler!
1 0.000 0.901 0.000
8 0.175 0.709 0.236
0 0.358 0.534 0.435
2 0.595 0.346 0.646
5 0.853 0.105 0.889
9 0.000 0.043 0.000
sitions of coexisting phase
x19 x29 w18 w28 w19 w29
water-richphase
organic-richphase
~compiler!
water-richphase
~compiler!
0.005 0.000 0.727 0.216 0.024 0.000
0.004 0.000 0.387 0.597 0.019 0.000
0.002 0.000 0.099 0.899 0.010 0.000
uxiliary Information
Source and Purity of Materials:
ot wasmixturek untilss.h anduresid notf knownshakendexes of
astion of
~1! source not specified.~2! Analytical Carbo Erba, purity 99.5 mole %; purified bypassing through columns containing silica gel and basic alumina.~3! de-ionized.
Estimated Error:composition60.005 mole fraction for measured points,60.01mole fraction for tie-lines extremities in the worst case~authors!.
References:1S. W. Briggs and E. W. Comings, Ind. Eng. Chem.35, 411~1943!.
12161216
SK
RZ
EC
Z,
SH
AW
,A
ND
MA
CZ
YN
SK
I
J.P
hys.C
hem.
Ref.
Data,
Vol.
28,N
o.4,
1999
This a loaded to IP: 129.6.105.191 On: Fri, 05 Sep 2014 17:51:55
Auxiliary Information
ethod/Apparatus/Procedure: Source and Purity of Materials:
he titration method, adapted from Ref. 1, was used toetermine the coexistence curve. The third component wasdded from a weighed gas-tight syringe to a weighed mixturef other two components in 100 cm3 long-neck flask until onerop ~weighing less than 0.01 g! results cloudiness. The flaskas immersed in a well controlled water bath and shakenontinuously. Refractive indexes of these mixtures wereeasured at temperature of 298.3 K to ensure that separationid not take place. The tie lines were determined fromixtures of well known composition in the immiscible region.he flasks were well shaken and left for separation. Theefractive indexes of the samples of the both phases wereeasured and related to compositions the coexisting curve.ach tie line was checked to ensure that it passed through theomposition of the overall mixture.
~1! Analytical Carlo Erba, 99 mole %; dried with anhydrouspotassium carbonate, distilled.~2! Analytical Carbo Erba, purity 99.5 mole %; purified bypassing through column containing silica gel and basic alumina.~3! de-ionized.
Estimated Error:composition60.005 mole fraction for measured points,60.01mole fraction for tie-lines extremities in the worst case~authors!.
References:1S. W. Briggs and E. W. Comings, Ind. Eng. Chem.35, 411~1943!.
Method/Apparatus/Procedure:
The titration method, adapted from Ref. 1, was used tdetermine the coexistence curve. The third componenadded from a weighed gas-tight syringe to a weighedof the other two components in 100 mL long-neck flasone drop~weighing less than 0.01 g! resulted in cloudineThe flask was immersed in a well controlled water batshaken continuously. Refractive indexes of these mixtwere measured at 298.3 K to ensure that separation dtake place. Tie lines were determined from mixtures ocomposition in the immiscible region. The flasks werewell and the phases allowed to separate. Refractive insamples of both phases were measured and related tocompositions on the coexistence curve. Each tie line wchecked to ensure that it passed through the composithe overall mixture.
rticle is copyrighted as indicated in the article. Reuse of AIP content is subject to the terms at: http://scitation.aip.org/termsconditions. Down
Components: Original Measurements:
~1! 1-Pentanol~pentyl alcohol, amyl alcohol,n-amyl alcohol!;C5H12O; @71-41-0#~2! Heptane~n-heptane!; C7H16; @142-82-5#~3! Water; H2O; @7732-18-5#
T. M. Letcher, S. Wootton, B. Shuttleworth, and C. Heyward, J.Chem. Thermodyn.18, 1037–42~1986!.
Variables:T/K5298
Compiled by:A. Skrzecz
12.3. 1-Pentanol 1 Water 1 HeptaneExperimental Data
Compositions along the saturation curve
t/°C~compiler! T/K x1 x2
w1 w2
~compiler!
25 298.2 0.699 0.000 0.919 0.000
0.703 0.057 0.861 0.079
0.694 0.130 0.791 0.168
0.640 0.228 0.691 0.280
0.581 0.324 0.600 0.380
0.495 0.450 0.486 0.503
0.318 0.656 0.297 0.698
0.110 0.884 0.099 0.900
0.004 0.000 0.019 0.000
Compositions of coexisting phases
t/°C~compiler! T/K
x18 x28 x19 x29 w18 w28 w19 w29
organic-richphase
water-richphase
organic-richphase
~compiler!
water-richphase
~compiler!
25 298.2 0.640 0.228 0.004 0.000 0.691 0.280 0.019 0.000
0.370 0.595 0.003 0.000 0.351 0.642 0.015 0.000
0.111 0.884 0.002 0.000 0.099 0.900 0.010 0.000
13. 2-P
Components:
~1! 2-Pentanol~dl-2-pentanol,~RS!-2-pentanol!; C5H12O;@6032-29-7#~2! Heptane~n-heptane!; C7H16; @142-82-5#~3! Water; H2O; @7732-18-5#
Variables:T/K5298
13.1. 2-Penta
Composit
t/SDC~compiler! T/K x1
25 298.2 0.65
0.59
0.50
0.36
0.11
0.00
Compo
t/°C~compiler! T/K
x18 x28
organic-richphase
25 298.2 0.609 0.159
0.390 0.530
0.110 0.880
A
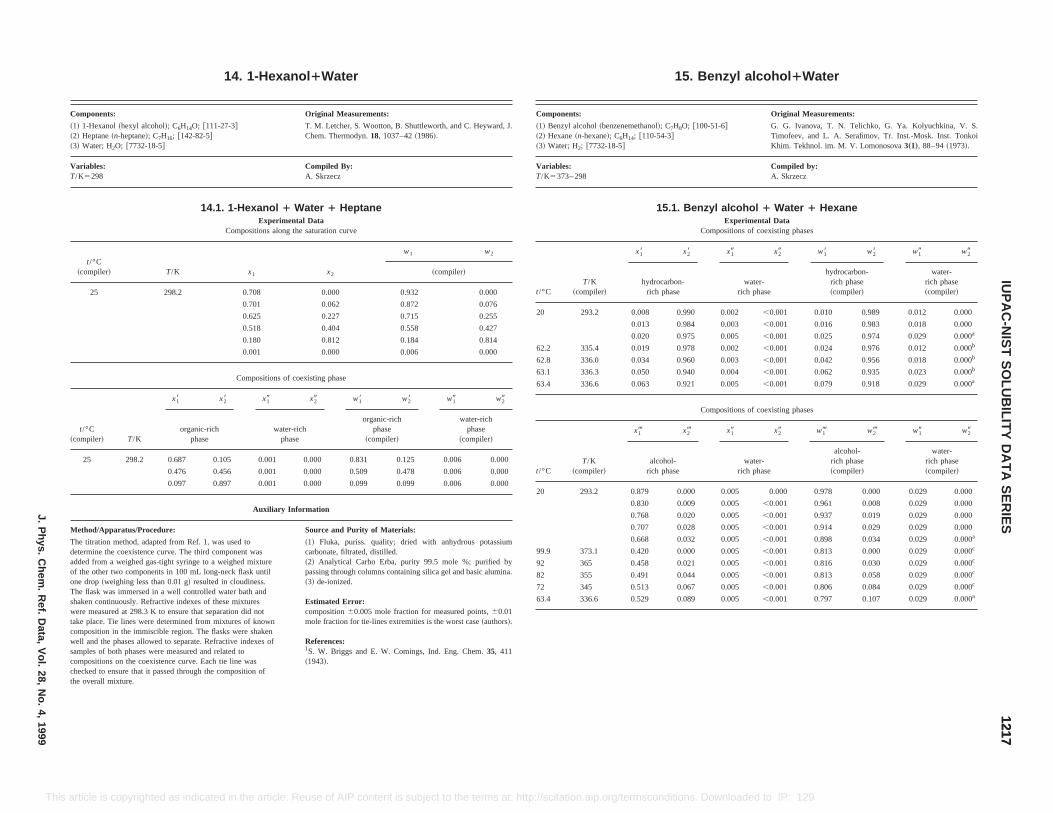
15. Benzyl alcohol 1Water
Original Measurements:
anol!; C7H8O; @100-51-6#0-54-3#
G. G. Ivanova, T. N. Telichko, G. Ya. Kolyuchkina, V. S.Timofeev, and L. A. Serafimov, Tr. Inst.-Mosk. Inst. TonkoiKhim. Tekhnol. im. M. V. Lomonosova3„1…, 88–94~1973!.
Compiled by:A. Skrzecz
15.1. Benzyl alcohol 1 Water 1 HexaneExperimental Data
Compositions of coexisting phases
x28 x19 x29 w18 w28 w19 w29
drocarbon-rich phase
water-rich phase
hydrocarbon-rich phase~compiler!
water-rich phase~compiler!
8 0.990 0.002 ,0.001 0.010 0.989 0.012 0.000
3 0.984 0.003 ,0.001 0.016 0.983 0.018 0.000
0 0.975 0.005 ,0.001 0.025 0.974 0.029 0.000a
9 0.978 0.002 ,0.001 0.024 0.976 0.012 0.000b
4 0.960 0.003 ,0.001 0.042 0.956 0.018 0.000b
0 0.940 0.004 ,0.001 0.062 0.935 0.023 0.000b
3 0.921 0.005 ,0.001 0.079 0.918 0.029 0.000a
Compositions of coexisting phases
x2- x19 x29 w1- w2- w19 w29
alcohol-ich phase
water-rich phase
alcohol-rich phase~compiler!
water-rich phase~compiler!
9 0.000 0.005 0.000 0.978 0.000 0.029 0.000
0.009 0.005 ,0.001 0.961 0.008 0.029 0.000
0.020 0.005 ,0.001 0.937 0.019 0.029 0.000
0.005 ,0.001 0.914 0.029 0.029 0.000
0.005 ,0.001 0.898 0.034 0.029 0.000a
0 0.005 ,0.001 0.813 0.000 0.029 0.000c
0.005 ,0.001 0.816 0.030 0.029 0.000c
0.005 ,0.001 0.813 0.058 0.029 0.000c
0.005 ,0.001 0.806 0.084 0.029 0.000c
9 0.005 ,0.001 0.797 0.107 0.029 0.000a
12171217
IUP
AC
-NIS
TS
OLU
BILIT
YD
AT
AS
ER
IESJ.P
hys.C
hem.
Ref.
Data,
Vol.
28,N
o.4,
1999
This Downloaded to IP: 129.6.105.191 On: Fri, 05 Sep 2014 17:51:55
Method/Apparatus/Procedure: Source and Purity of Materials:
The titration method, adapted from Ref. 1, was used todetermine the coexistence curve. The third component wasadded from a weighed gas-tight syringe to a weighed mixtureof the other two components in 100 mL long-neck flask untilone drop~weighing less than 0.01 g! resulted in cloudiness.The flask was immersed in a well controlled water bath andshaken continuously. Refractive indexes of these mixtureswere measured at 298.3 K to ensure that separation did nottake place. Tie lines were determined from mixtures of knowncomposition in the immiscible region. The flasks were shakenwell and the phases allowed to separate. Refractive indexes ofsamples of both phases were measured and related tocompositions on the coexistence curve. Each tie line waschecked to ensure that it passed through the composition ofthe overall mixture.
~1! Fluka, puriss. quality; dried with anhydrous potassiumcarbonate, filtrated, distilled.~2! Analytical Carbo Erba, purity 99.5 mole %; purified bypassing through columns containing silica gel and basic alumina.~3! de-ionized.
Estimated Error:composition60.005 mole fraction for measured points,60.01mole fraction for tie-lines extremities is the worst case~authors!.
References:1S. W. Briggs and E. W. Comings, Ind. Eng. Chem.35, 411~1943!.
0.707 0.028
0.668 0.032
99.9 373.1 0.420 0.00
92 365 0.458 0.021
82 355 0.491 0.044
72 345 0.513 0.067
63.4 336.6 0.529 0.08
article is copyrighted as indicated in the article. Reuse of AIP content is subject to the terms at: http://scitation.aip.org/termsconditions.
14. 1-Hexanol 1Water
Components: Original Measurements:
~1! 1-Hexanol~hexyl alcohol!; C6H14O; @111-27-3#~2! Heptane~n-heptane!; C7H16; @142-82-5#~3! Water; H2O; @7732-18-5#
T. M. Letcher, S. Wootton, B. Shuttleworth, and C. Heyward, J.Chem. Thermodyn.18, 1037–42~1986!.
Variables:T/K5298
Compiled By:A. Skrzecz
14.1. 1-Hexanol 1 Water 1 HeptaneExperimental Data
Compositions along the saturation curve
t/°C~compiler! T/K x1 x2
w1 w2
~compiler!
25 298.2 0.708 0.000 0.932 0.000
0.701 0.062 0.872 0.076
0.625 0.227 0.715 0.255
0.518 0.404 0.558 0.427
0.180 0.812 0.184 0.814
0.001 0.000 0.006 0.000
Compositions of coexisting phase
t/°C~compiler! T/K
x18 x28 x19 x29 w18 w28 w19 w29
organic-richphase
water-richphase
organic-richphase
~compiler!
water-richphase
~compiler!
25 298.2 0.687 0.105 0.001 0.000 0.831 0.125 0.006 0.000
0.476 0.456 0.001 0.000 0.509 0.478 0.006 0.000
0.097 0.897 0.001 0.000 0.099 0.099 0.006 0.000
Auxiliary Information
Components:
~1! Benzyl alcohol~benzenemeth~2! Hexane~n-hexane!; C6H14; @11~3! Water; H2; @7732-18-5#
Variables:T/K5373– 298
t/°CT/K
~compiler!
x18
hy
20 293.2 0.00
0.01
0.02
62.2 335.4 0.01
62.8 336.0 0.03
63.1 336.3 0.05
63.4 336.6 0.06
t/°CT/K
~compiler!
x1-
r
20 293.2 0.87
0.830
0.768
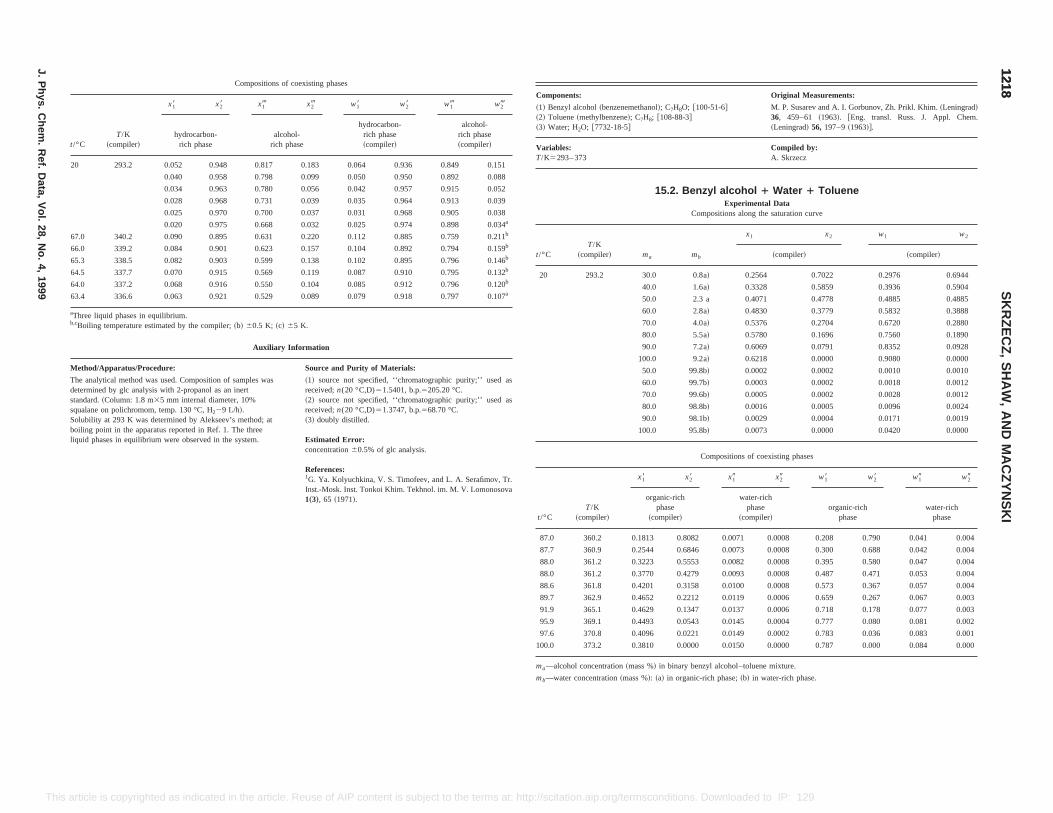
Original Measurements:
@100-51-6# M. P. Susarev and A. I. Gorbunov, Zh. Prikl. Khim.~Leningrad!36, 459–61 ~1963!. @Eng. transl. Russ. J. Appl. Chem.~Leningrad! 56, 197–9~1963!#.
Compiled by:A. Skrzecz
nzyl alcohol 1 Water 1 TolueneExperimental Data
ompositions along the saturation curve
b
x1 x2 w1 w2
~compiler! ~compiler!
0.8a! 0.2564 0.7022 0.2976 0.6944
1.6a! 0.3328 0.5859 0.3936 0.5904
2.3 a 0.4071 0.4778 0.4885 0.4885
2.8a! 0.4830 0.3779 0.5832 0.3888
4.0a! 0.5376 0.2704 0.6720 0.2880
5.5a! 0.5780 0.1696 0.7560 0.1890
7.2a! 0.6069 0.0791 0.8352 0.0928
9.2a! 0.6218 0.0000 0.9080 0.0000
9.8b! 0.0002 0.0002 0.0010 0.0010
9.7b! 0.0003 0.0002 0.0018 0.0012
9.6b! 0.0005 0.0002 0.0028 0.0012
8.8b! 0.0016 0.0005 0.0096 0.0024
8.1b! 0.0029 0.0004 0.0171 0.0019
5.8b! 0.0073 0.0000 0.0420 0.0000
Compositions of coexisting phases
x19 x29 w18 w28 w19 w29
water-richphase
~compiler!organic-rich
phasewater-rich
phase
87.0 360.2 0.1813 0.8082 0.0071 0.0008 0.208 0.790 0.041 0.004
87.7 360.9 0.2544 0.6846 0.0073 0.0008 0.300 0.688 0.042 0.004
88.0 361.2 0.3223 0.5553 0.0082 0.0008 0.395 0.580 0.047 0.004
88.0 361.2 0.3770 0.4279 0.0093 0.0008 0.487 0.471 0.053 0.004
88.6 361.8 0.4201 0.3158 0.0100 0.0008 0.573 0.367 0.057 0.004
89.7 362.9 0.4652 0.2212 0.0119 0.0006 0.659 0.267 0.067 0.003
91.9 365.1 0.4629 0.1347 0.0137 0.0006 0.718 0.178 0.077 0.003
95.9 369.1 0.4493 0.0543 0.0145 0.0004 0.777 0.080 0.081 0.002
97.6 370.8 0.4096 0.0221 0.0149 0.0002 0.783 0.036 0.083 0.001
100.0 373.2 0.3810 0.0000 0.0150 0.0000 0.787 0.000 0.084 0.000
ma—alcohol concentration~mass %! in binary benzyl alcohol–toluene mixture.
mb—water concentration~mass %!: ~a! in organic-rich phase;~b! in water-rich phase.
12181218
SK
RZ
EC
Z,
SH
AW
,A
ND
MA
CZ
YN
SK
I
J.P
hys.C
hem.
Ref.
Data,
Vol.
28,N
o.4,
1999
This http://scitation.aip.org/termsconditions. Downloaded to IP: 129.6.105.191 On: Fri, 05 Sep 2014 17:51:55
article is copyrighted as indicated in the article. Reuse of AIP content is subject to the terms at:Compositions of coexisting phases
t/°CT/K
~compiler!
x18 x28 x1- x2- w18 w28 w1- w2-
hydrocarbon-rich phase
alcohol-rich phase
hydrocarbon-rich phase~compiler!
alcohol-rich phase~compiler!
20 293.2 0.052 0.948 0.817 0.183 0.064 0.936 0.849 0.151
0.040 0.958 0.798 0.099 0.050 0.950 0.892 0.088
0.034 0.963 0.780 0.056 0.042 0.957 0.915 0.052
0.028 0.968 0.731 0.039 0.035 0.964 0.913 0.039
0.025 0.970 0.700 0.037 0.031 0.968 0.905 0.038
0.020 0.975 0.668 0.032 0.025 0.974 0.898 0.034a
67.0 340.2 0.090 0.895 0.631 0.220 0.112 0.885 0.759 0.211b
66.0 339.2 0.084 0.901 0.623 0.157 0.104 0.892 0.794 0.159b
65.3 338.5 0.082 0.903 0.599 0.138 0.102 0.895 0.796 0.146b
64.5 337.7 0.070 0.915 0.569 0.119 0.087 0.910 0.795 0.132b
64.0 337.2 0.068 0.916 0.550 0.104 0.085 0.912 0.796 0.120b
63.4 336.6 0.063 0.921 0.529 0.089 0.079 0.918 0.797 0.107a
aThree liquid phases in equilibrium.b,cBoiling temperature estimated by the compiler;~b! 60.5 K; ~c! 65 K.
Auxiliary Information
Method/Apparatus/Procedure: Source and Purity of Materials:
The analytical method was used. Composition of samples wasdetermined by glc analysis with 2-propanol as an inertstandard.~Column: 1.8 m35 mm internal diameter, 10%squalane on polichromom, temp. 130 °C, H229 L/h!.Solubility at 293 K was determined by Alekseev’s method; atboiling point in the apparatus reported in Ref. 1. The threeliquid phases in equilibrium were observed in the system.
~1! source not specified, ‘‘chromatographic purity;’’ used asreceived;n(20 °C,D)51.5401, b.p.5205.20 °C.~2! source not specified, ‘‘chromatographic purity;’’ used asreceived;n(20 °C,D)51.3747, b.p.568.70 °C.~3! doubly distilled.
Estimated Error:concentration60.5% of glc analysis.
References:1G. Ya. Kolyuchkina, V. S. Timofeev, and L. A. Serafimov, Tr.Inst.-Mosk. Inst. Tonkoi Khim. Tekhnol. im. M. V. Lomonosova1„3…, 65 ~1971!.
Components:
~1! Benzyl alcohol~benzenemethanol!; C7H8O;~2! Toluene~methylbenzene!; C7H8; @108-88-3#~3! Water; H2O; @7732-18-5#
Variables:T/K5293– 373
15.2. Be
C
t/°CT/K
~compiler! ma m
20 293.2 30.0
40.0
50.0
60.0
70.0
80.0
90.0
100.0
50.0 9
60.0 9
70.0 9
80.0 9
90.0 9
100.0 9
t/°CT/K
~compiler!
x18 x28
organic-richphase
~compiler!
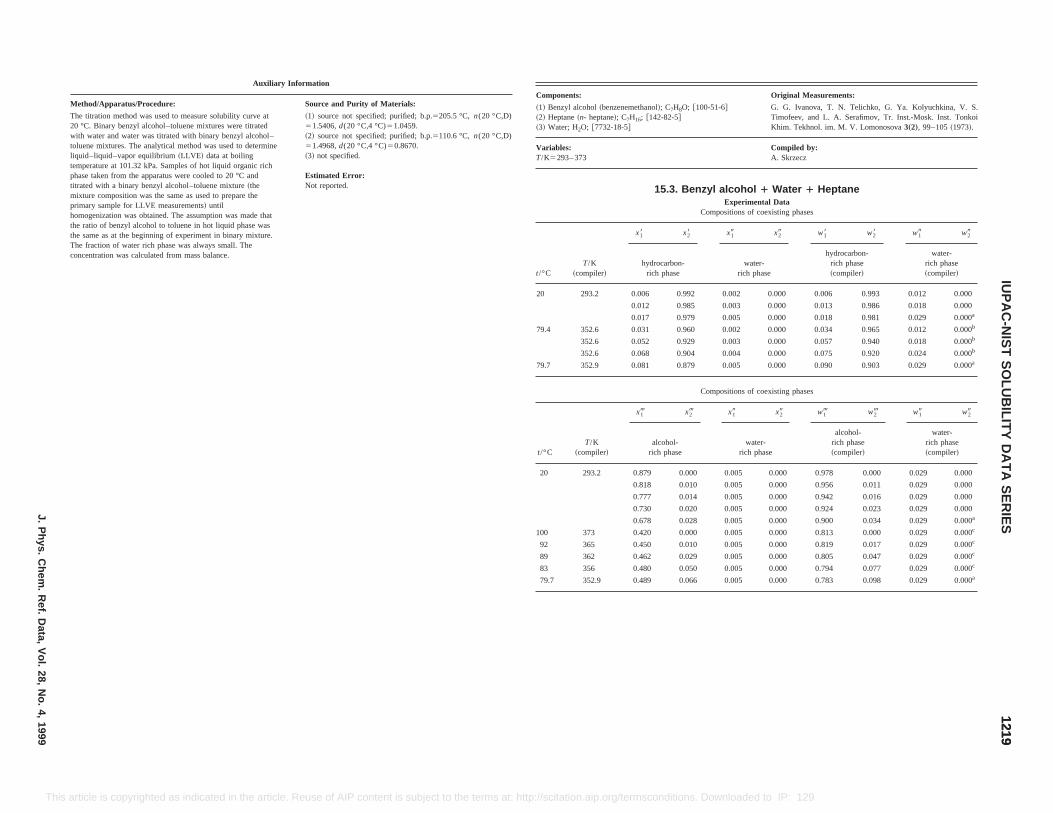
Original Measurements:
zenemethanol!; C7H8O; @100-51-6#e!; C7H16; @142-82-5#18-5#
G. G. Ivanova, T. N. Telichko, G. Ya. Kolyuchkina, V. S.Timofeev, and L. A. Serafimov, Tr. Inst.-Mosk. Inst. TonkoiKhim. Tekhnol. im. M. V. Lomonosova3„2…, 99–105~1973!.
Compiled by:A. Skrzecz
15.3. Benzyl alcohol 1 Water 1 HeptaneExperimental Data
Compositions of coexisting phases
x18 x28 x19 x29 w18 w28 w19 w29
hydrocarbon-rich phase
water-rich phase
hydrocarbon-rich phase~compiler!
water-rich phase~compiler!
0.006 0.992 0.002 0.000 0.006 0.993 0.012 0.000
0.012 0.985 0.003 0.000 0.013 0.986 0.018 0.000
0.017 0.979 0.005 0.000 0.018 0.981 0.029 0.000a
0.031 0.960 0.002 0.000 0.034 0.965 0.012 0.000b
0.052 0.929 0.003 0.000 0.057 0.940 0.018 0.000b
0.068 0.904 0.004 0.000 0.075 0.920 0.024 0.000b
0.081 0.879 0.005 0.000 0.090 0.903 0.029 0.000a
Compositions of coexisting phases
x1- x2- x19 x29 w1- w2- w19 w29
alcohol-rich phase
water-rich phase
alcohol-rich phase~compiler!
water-rich phase~compiler!
0.879 0.000 0.005 0.000 0.978 0.000 0.029 0.000
0.818 0.010 0.005 0.000 0.956 0.011 0.029 0.000
0.777 0.014 0.005 0.000 0.942 0.016 0.029 0.000
0.730 0.020 0.005 0.000 0.924 0.023 0.029 0.000
0.678 0.028 0.005 0.000 0.900 0.034 0.029 0.000a
100 373 0.420 0.000 0.005 0.000 0.813 0.000 0.029 0.000c
92 365 0.450 0.010 0.005 0.000 0.819 0.017 0.029 0.000c
89 362 0.462 0.029 0.005 0.000 0.805 0.047 0.029 0.000c
83 356 0.480 0.050 0.005 0.000 0.794 0.077 0.029 0.000c
79.7 352.9 0.489 0.066 0.005 0.000 0.783 0.098 0.029 0.000a
12191219
IUP
AC
-NIS
TS
OLU
BILIT
YD
AT
AS
ER
IESJ.P
hys.C
hem.
Ref.
Data,
Vol.
28,N
o.4,
1999
This Reuse of AIP content is subject to the terms at: http://scitation.aip.org/termsconditions. Downloaded to IP: 129.6.105.191 On: Fri, 05 Sep 2014 17:51:55
article is copyrighted as indicated in the article.Auxiliary Information
Method/Apparatus/Procedure: Source and Purity of Materials:
The titration method was used to measure solubility curve at20 °C. Binary benzyl alcohol–toluene mixtures were titratedwith water and water was titrated with binary benzyl alcohol–toluene mixtures. The analytical method was used to determineliquid–liquid–vapor equilibrium~LLVE ! data at boilingtemperature at 101.32 kPa. Samples of hot liquid organic richphase taken from the apparatus were cooled to 20 °C andtitrated with a binary benzyl alcohol–toluene mixture~themixture composition was the same as used to prepare theprimary sample for LLVE measurements! untilhomogenization was obtained. The assumption was made thatthe ratio of benzyl alcohol to toluene in hot liquid phase wasthe same as at the beginning of experiment in binary mixture.The fraction of water rich phase was always small. Theconcentration was calculated from mass balance.
~1! source not specified; purified; b.p.5205.5 °C, n(20 °C,D)51.5406,d(20 °C,4 °C)51.0459.~2! source not specified; purified; b.p.5110.6 °C, n(20 °C,D)51.4968,d(20 °C,4 °C)50.8670.~3! not specified.
Estimated Error:Not reported.
Components:
~1! Benzyl alcohol~ben~2! Heptane~n- heptan~3! Water; H2O; @7732-
Variables:T/K5293– 373
t/°CT/K
~compiler!
20 293.2
79.4 352.6
352.6
352.6
79.7 352.9
t/°CT/K
~compiler!
20 293.2
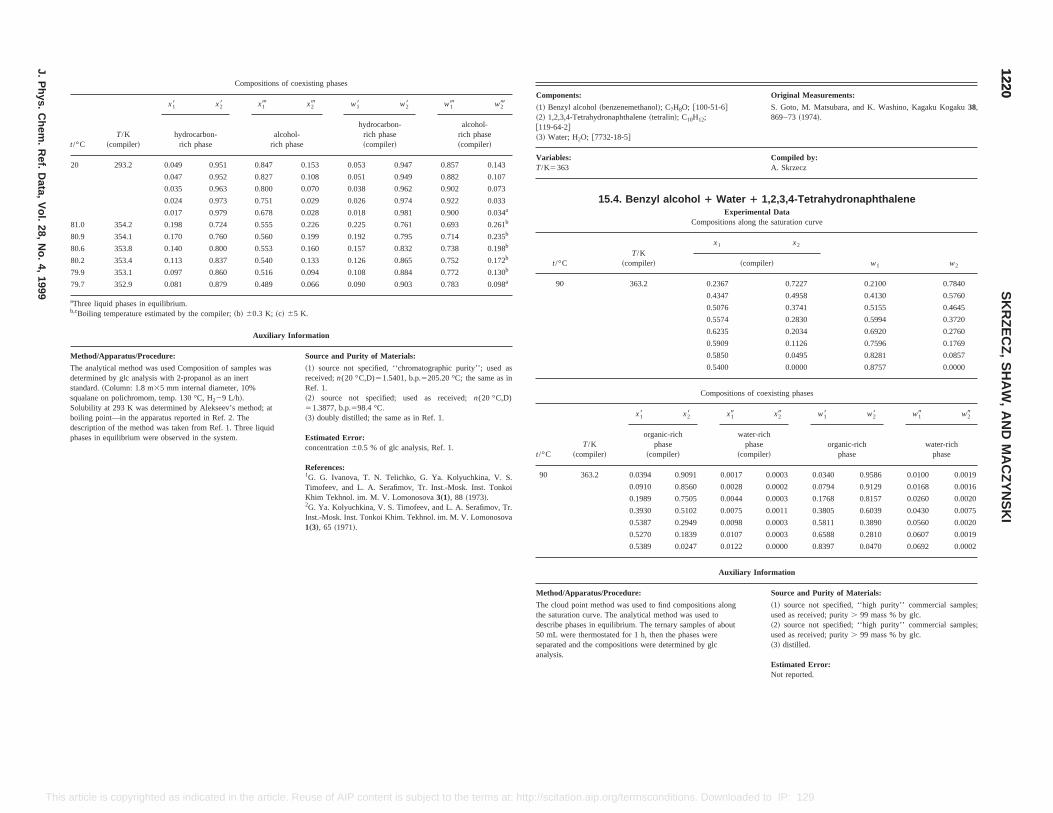
Original Measurements:
@100-51-6#H12;
S. Goto, M. Matsubara, and K. Washino, Kagaku Kogaku38,869–73~1974!.
Compiled by:A. Skrzecz
l 1 Water 1 1,2,3,4-TetrahydronaphthaleneExperimental Data
Compositions along the saturation curve
x1 x2
w1 w2~compiler!
0.2367 0.7227 0.2100 0.7840
0.4347 0.4958 0.4130 0.5760
0.5076 0.3741 0.5155 0.4645
0.5574 0.2830 0.5994 0.3720
0.6235 0.2034 0.6920 0.2760
0.5909 0.1126 0.7596 0.1769
0.5850 0.0495 0.8281 0.0857
0.5400 0.0000 0.8757 0.0000
Compositions of coexisting phases
x19 x29 w18 w28 w19 w29
water-richphase
~compiler!organic-rich
phasewater-rich
phase
091 0.0017 0.0003 0.0340 0.9586 0.0100 0.0019
60 0.0028 0.0002 0.0794 0.9129 0.0168 0.0016
05 0.0044 0.0003 0.1768 0.8157 0.0260 0.0020
02 0.0075 0.0011 0.3805 0.6039 0.0430 0.0075
49 0.0098 0.0003 0.5811 0.3890 0.0560 0.0020
0.5270 0.1839 0.0107 0.0003 0.6588 0.2810 0.0607 0.0019
0.5389 0.0247 0.0122 0.0000 0.8397 0.0470 0.0692 0.0002
Auxiliary Information
ethod/Apparatus/Procedure: Source and Purity of Materials:
he cloud point method was used to find compositions alonge saturation curve. The analytical method was used to
escribe phases in equilibrium. The ternary samples of about0 mL were thermostated for 1 h, then the phases wereeparated and the compositions were determined by glcnalysis.
~1! source not specified, ‘‘high purity’’ commercial samples;used as received; purity. 99 mass % by glc.~2! source not specified; ‘‘high purity’’ commercial samples;used as received; purity. 99 mass % by glc.~3! distilled.
Estimated Error:Not reported.
12201220
SK
RZ
EC
Z,
SH
AW
,A
ND
MA
CZ
YN
SK
I
J.P
hys.C
hem.
Ref.
Data,
Vol.
28,N
o.4,
1999
This /scitation.aip.org/termsconditions. Downloaded to IP: 129.6.105.191 On: Fri, 05 Sep 2014 17:51:55
1„3…, 65 ~1971!.
M
Tthd5sa
article is copyrighted as indicated in the article. Reuse of AIP content is subject to the terms at: http:/
Compositions of coexisting phases
t/°CT/K
~compiler!
x18 x28 x1- x2- w18 w28 w1- w2-
hydrocarbon-rich phase
alcohol-rich phase
hydrocarbon-rich phase~compiler!
alcohol-rich phase~compiler!
20 293.2 0.049 0.951 0.847 0.153 0.053 0.947 0.857 0.143
0.047 0.952 0.827 0.108 0.051 0.949 0.882 0.107
0.035 0.963 0.800 0.070 0.038 0.962 0.902 0.073
0.024 0.973 0.751 0.029 0.026 0.974 0.922 0.033
0.017 0.979 0.678 0.028 0.018 0.981 0.900 0.034a
81.0 354.2 0.198 0.724 0.555 0.226 0.225 0.761 0.693 0.261b
80.9 354.1 0.170 0.760 0.560 0.199 0.192 0.795 0.714 0.235b
80.6 353.8 0.140 0.800 0.553 0.160 0.157 0.832 0.738 0.198b
80.2 353.4 0.113 0.837 0.540 0.133 0.126 0.865 0.752 0.172b
79.9 353.1 0.097 0.860 0.516 0.094 0.108 0.884 0.772 0.130b
79.7 352.9 0.081 0.879 0.489 0.066 0.090 0.903 0.783 0.098a
aThree liquid phases in equilibrium.b,cBoiling temperature estimated by the compiler;~b! 60.3 K; ~c! 65 K.
Auxiliary Information
Method/Apparatus/Procedure: Source and Purity of Materials:
The analytical method was used Composition of samples wasdetermined by glc analysis with 2-propanol as an inertstandard.~Column: 1.8 m35 mm internal diameter, 10%squalane on polichromom, temp. 130 °C, H229 L/h!.Solubility at 293 K was determined by Alekseev’s method; atboiling point—in the apparatus reported in Ref. 2. Thedescription of the method was taken from Ref. 1. Three liquidphases in equilibrium were observed in the system.
~1! source not specified, ‘‘chromatographic purity’’; used asreceived;n(20 °C,D)51.5401, b.p.5205.20 °C; the same as inRef. 1.~2! source not specified; used as received;n(20 °C,D)51.3877, b.p.598.4 °C.~3! doubly distilled; the same as in Ref. 1.
Estimated Error:concentration60.5 % of glc analysis, Ref. 1.
References:1G. G. Ivanova, T. N. Telichko, G. Ya. Kolyuchkina, V. S.Timofeev, and L. A. Serafimov, Tr. Inst.-Mosk. Inst. TonkoiKhim Tekhnol. im. M. V. Lomonosova3„1…, 88 ~1973!.2G. Ya. Kolyuchkina, V. S. Timofeev, and L. A. Serafimov, Tr.Inst.-Mosk. Inst. Tonkoi Khim. Tekhnol. im. M. V. Lomonosova
Components:
~1! Benzyl alcohol~benzenemethanol!; C7H8O;~2! 1,2,3,4-Tetrahydronaphthalene~tetralin!; C10
@119-64-2#~3! Water; H2O; @7732-18-5#
Variables:T/K5363
15.4. Benzyl alcoho
t/°CT/K
~compiler!
90 363.2
t/°CT/K
~compiler!
x18 x28
organic-richphase
~compiler!
90 363.2 0.0394 0.9
0.0910 0.85
0.1989 0.75
0.3930 0.51
0.5387 0.29
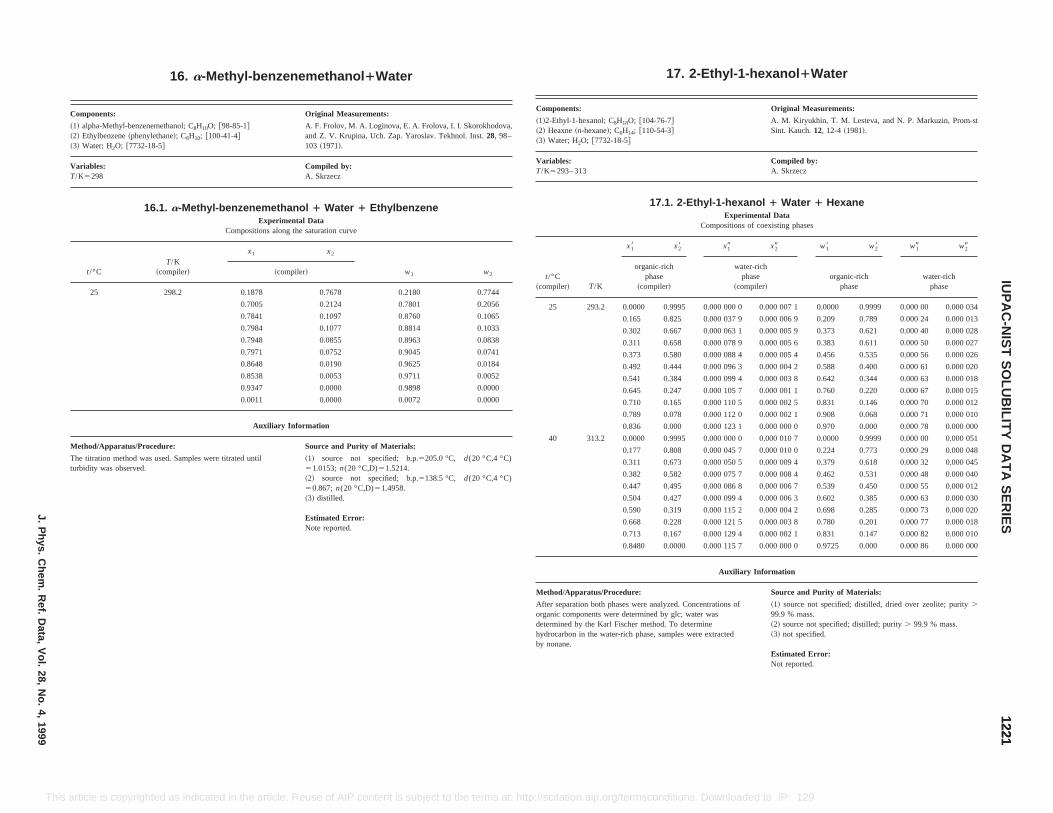
2-Ethyl-1-hexanol 1Water
Original Measurements:
A. M. Kiryukhin, T. M. Lesteva, and N. P. Markuzin, Prom-stSint. Kauch.12, 12-4 ~1981!.
Compiled by:A. Skrzecz
Ethyl-1-hexanol 1 Water 1 HexaneExperimental Data
Compositions of coexisting phases
x19 x29 w18 w28 w19 w29
water-richphase
~compiler!organic-rich
phasewater-rich
phase
95 0.000 000 0 0.000 007 1 0.0000 0.9999 0.000 00 0.000 034
0.000 037 9 0.000 006 9 0.209 0.789 0.000 24 0.000 013
0.000 063 1 0.000 005 9 0.373 0.621 0.000 40 0.000 028
0.000 078 9 0.000 005 6 0.383 0.611 0.000 50 0.000 027
0.000 088 4 0.000 005 4 0.456 0.535 0.000 56 0.000 026
0.000 096 3 0.000 004 2 0.588 0.400 0.000 61 0.000 020
0.000 099 4 0.000 003 8 0.642 0.344 0.000 63 0.000 018
0.000 105 7 0.000 001 1 0.760 0.220 0.000 67 0.000 015
0.000 110 5 0.000 002 5 0.831 0.146 0.000 70 0.000 012
0.000 112 0 0.000 002 1 0.908 0.068 0.000 71 0.000 010
0.000 123 1 0.000 000 0 0.970 0.000 0.000 78 0.000 000
95 0.000 000 0 0.000 010 7 0.0000 0.9999 0.000 00 0.000 051
0.000 045 7 0.000 010 0 0.224 0.773 0.000 29 0.000 048
0.000 050 5 0.000 009 4 0.379 0.618 0.000 32 0.000 045
0.000 075 7 0.000 008 4 0.462 0.531 0.000 48 0.000 040
0.000 086 8 0.000 006 7 0.539 0.450 0.000 55 0.000 012
0.000 099 4 0.000 006 3 0.602 0.385 0.000 63 0.000 030
0.000 115 2 0.000 004 2 0.698 0.285 0.000 73 0.000 020
0.000 121 5 0.000 003 8 0.780 0.201 0.000 77 0.000 018
0.713 0.167 0.000 129 4 0.000 002 1 0.831 0.147 0.000 82 0.000 010
0.8480 0.0000 0.000 115 7 0.000 000 0 0.9725 0.000 0.000 86 0.000 000
Auxiliary Information
thod/Apparatus/Procedure: Source and Purity of Materials:
ter separation both phases were analyzed. Concentrations ofganic components were determined by glc; water wastermined by the Karl Fischer method. To determinedrocarbon in the water-rich phase, samples were extractednonane.
~1! source not specified; distilled, dried over zeolite; purity.
99.9 % mass.~2! source not specified; distilled; purity. 99.9 % mass.~3! not specified.
Estimated Error:Not reported.
12211221
IUP
AC
-NIS
TS
OLU
BILIT
YD
AT
AS
ER
IESJ.P
hys.C
hem.
Ref.
Data,
Vol.
28,N
o.4,
1999
This scitation.aip.org/termsconditions. Downloaded to IP: 129.6.105.191 On: Fri, 05 Sep 2014 17:51:55
Me
Afordehyby
article is copyrighted as indicated in the article. Reuse of AIP content is subject to the terms at: http://
16. a-Methyl-benzenemethanol 1Water
Components: Original Measurements:
~1! alpha-Methyl-benzenemethanol; C8H10O; @98-85-1#~2! Ethylbenzene~phenylethane!; C8H10; @100-41-4#~3! Water; H2O; @7732-18-5#
A. F. Frolov, M. A. Loginova, E. A. Frolova, I. I. Skorokhodova,and Z. V. Krupina, Uch. Zap. Yaroslav. Tekhnol. Inst.28, 98–103 ~1971!.
Variables:T/K5298
Compiled by:A. Skrzecz
16.1. a-Methyl-benzenemethanol 1 Water 1 EthylbenzeneExperimental Data
Compositions along the saturation curve
t/°CT/K
~compiler!
x1 x2
w1 w2~compiler!
25 298.2 0.1878 0.7678 0.2180 0.7744
0.7005 0.2124 0.7801 0.2056
0.7841 0.1097 0.8760 0.1065
0.7984 0.1077 0.8814 0.1033
0.7948 0.0855 0.8963 0.0838
0.7971 0.0752 0.9045 0.0741
0.8648 0.0190 0.9625 0.0184
0.8538 0.0053 0.9711 0.0052
0.9347 0.0000 0.9898 0.0000
0.0011 0.0000 0.0072 0.0000
Auxiliary Information
Method/Apparatus/Procedure: Source and Purity of Materials:
The titration method was used. Samples were titrated untilturbidity was observed.
~1! source not specified; b.p.5205.0 °C, d(20 °C,4 °C)51.0153;n(20 °C,D)51.5214.~2! source not specified; b.p.5138.5 °C, d(20 °C,4 °C)50.867; n(20 °C,D)51.4958.~3! distilled.
Estimated Error:Note reported.
17.
Components:
~1!2-Ethyl-1-hexanol; C8H18O; @104-76-7#~2! Heaxne~n-hexane!; C6H14; @110-54-3#~3! Water; H2O; @7732-18-5#
Variables:T/K5293– 313
17.1. 2-
t/°C~compiler! T/K
x18 x28
organic-richphase
~compiler!
25 293.2 0.0000 0.99
0.165 0.825
0.302 0.667
0.311 0.658
0.373 0.580
0.492 0.444
0.541 0.384
0.645 0.247
0.710 0.165
0.789 0.078
0.836 0.000
40 313.2 0.0000 0.99
0.177 0.808
0.311 0.673
0.382 0.582
0.447 0.495
0.504 0.427
0.590 0.319
0.668 0.228
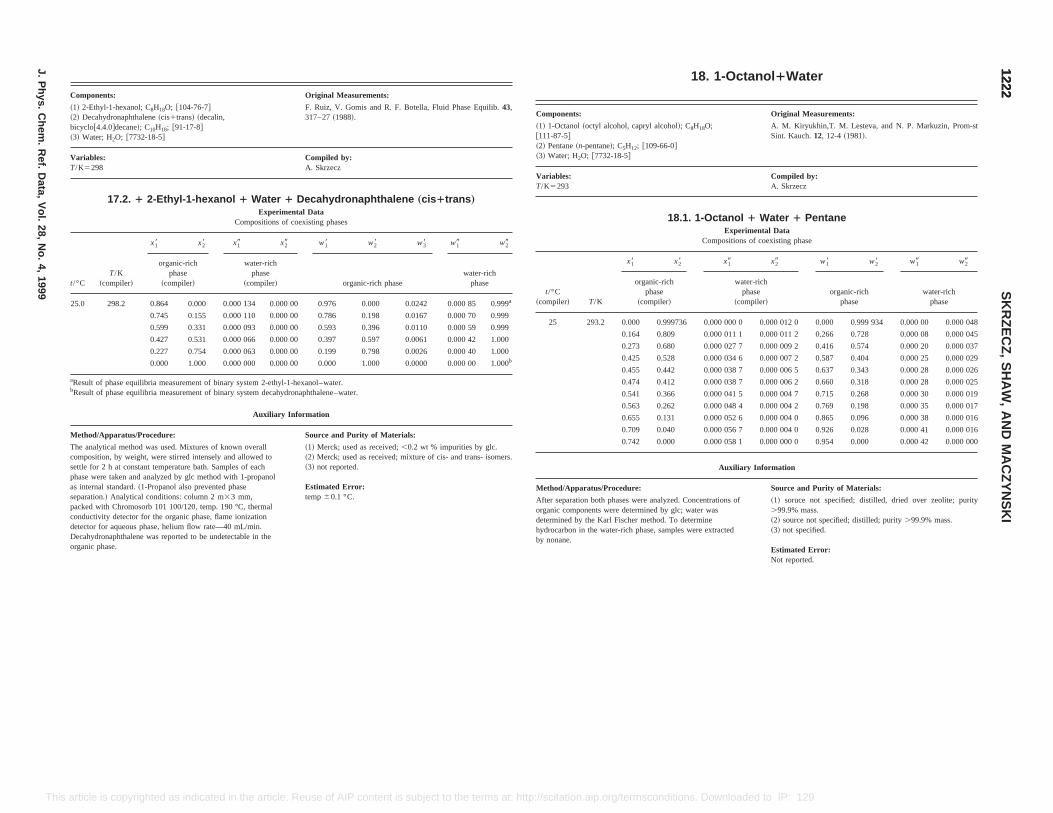
detector for aqueous phase, helium flow rate—40 mL/min.
18. 1-Octanol 1Water
: Original Measurements:
l~octyl alcohol, capryl alcohol!; C8H18O;
n-pentane!; C5H12; @109-66-0#
2O; @7732-18-5#
A. M. Kiryukhin,T. M. Lesteva, and N. P. Markuzin, Prom-stSint. Kauch.12, 12-4 ~1981!.
Compiled by:A. Skrzecz
18.1. 1-Octanol 1 Water 1 PentaneExperimental Data
Compositions of coexisting phase
T/K
x18 x28 x19 x29 w18 w28 w19 w29
organic-richphase
~compiler!
water-richphase
~compiler!organic-rich
phasewater-rich
phase
293.2 0.000 0.999736 0.000 000 0 0.000 012 0 0.000 0.999 934 0.000 00 0.000 048
0.164 0.809 0.000 011 1 0.000 011 2 0.266 0.728 0.000 08 0.000 045
0.273 0.680 0.000 027 7 0.000 009 2 0.416 0.574 0.000 20 0.000 037
0.425 0.528 0.000 034 6 0.000 007 2 0.587 0.404 0.000 25 0.000 029
0.455 0.442 0.000 038 7 0.000 006 5 0.637 0.343 0.000 28 0.000 026
0.474 0.412 0.000 038 7 0.000 006 2 0.660 0.318 0.000 28 0.000 025
0.541 0.366 0.000 041 5 0.000 004 7 0.715 0.268 0.000 30 0.000 019
0.563 0.262 0.000 048 4 0.000 004 2 0.769 0.198 0.000 35 0.000 017
0.655 0.131 0.000 052 6 0.000 004 0 0.865 0.096 0.000 38 0.000 016
0.709 0.040 0.000 056 7 0.000 004 0 0.926 0.028 0.000 41 0.000 016
0.742 0.000 0.000 058 1 0.000 000 0 0.954 0.000 0.000 42 0.000 000
Auxiliary Information
aratus/Procedure: Source and Purity of Materials:
tion both phases were analyzed. Concentrations ofponents were determined by glc; water wasby the Karl Fischer method. To determine
on in the water-rich phase, samples were extracted.
~1! soruce not specified; distilled, dried over zeolite; purity.99.9% mass.~2! source not specified; distilled; purity.99.9% mass.~3! not specified.
Estimated Error:Not reported.
12221222
SK
RZ
EC
Z,
SH
AW
,A
ND
MA
CZ
YN
SK
I
J.P
hys.C
hem.
Ref.
Data,
Vol.
28,N
o.4,
1999
This n.aip.org/termsconditions. Downloaded to IP: 129.6.105.191 On: Fri, 05 Sep 2014 17:51:55
Decahydronaphthalene was reported to be undetectable in theorganic phase.
hydrocarbby nonane
article is copyrighted as indicated in the article. Reuse of AIP content is subject to the terms at: http://scitatio
Components: Original Measurements:
~1! 2-Ethyl-1-hexanol; C8H18O; @104-76-7#~2! Decahydronaphthalene~cis1trans! ~decalin,[email protected]#decane!; C10H18; @91-17-8#~3! Water; H2O; @7732-18-5#
F. Ruiz, V. Gomis and R. F. Botella, Fluid Phase Equilib.43,317–27~1988!.
Variables:T/K5298
Compiled by:A. Skrzecz
17.2. 1 2-Ethyl-1-hexanol 1 Water 1 Decahydronaphthalene „cis 1trans …
Experimental DataCompositions of coexisting phases
t/°CT/K
~compiler!
x18 x28 x19 x29 w18 w28 w38 w19 w29
organic-richphase
~compiler!
water-richphase
~compiler! organic-rich phasewater-rich
phase
25.0 298.2 0.864 0.000 0.000 134 0.000 00 0.976 0.000 0.0242 0.000 85 0.999a
0.745 0.155 0.000 110 0.000 00 0.786 0.198 0.0167 0.000 70 0.999
0.599 0.331 0.000 093 0.000 00 0.593 0.396 0.0110 0.000 59 0.999
0.427 0.531 0.000 066 0.000 00 0.397 0.597 0.0061 0.000 42 1.000
0.227 0.754 0.000 063 0.000 00 0.199 0.798 0.0026 0.000 40 1.000
0.000 1.000 0.000 000 0.000 00 0.000 1.000 0.0000 0.000 00 1.000b
aResult of phase equilibria measurement of binary system 2-ethyl-1-hexanol–water.bResult of phase equilibria measurement of binary system decahydronaphthalene–water.
Auxiliary Information
Method/Apparatus/Procedure: Source and Purity of Materials:
The analytical method was used. Mixtures of known overallcomposition, by weight, were stirred intensely and allowed tosettle for 2 h atconstant temperature bath. Samples of eachphase were taken and analyzed by glc method with 1-propanolas internal standard.~1-Propanol also prevented phaseseparation.! Analytical conditions: column 2 m33 mm,packed with Chromosorb 101 100/120, temp. 190 °C, thermalconductivity detector for the organic phase, flame ionization
~1! Merck; used as received;,0.2 wt % impurities by glc.~2! Merck; used as received; mixture of cis- and trans- isomers.~3! not reported.
Estimated Error:temp60.1 °C.
Components
~1! 1-Octano@111-87-5#~2! Pentane~~3! Water; H
Variables:T/K5293
t/°C~compiler!
25
Method/App
After separaorganic comdetermined
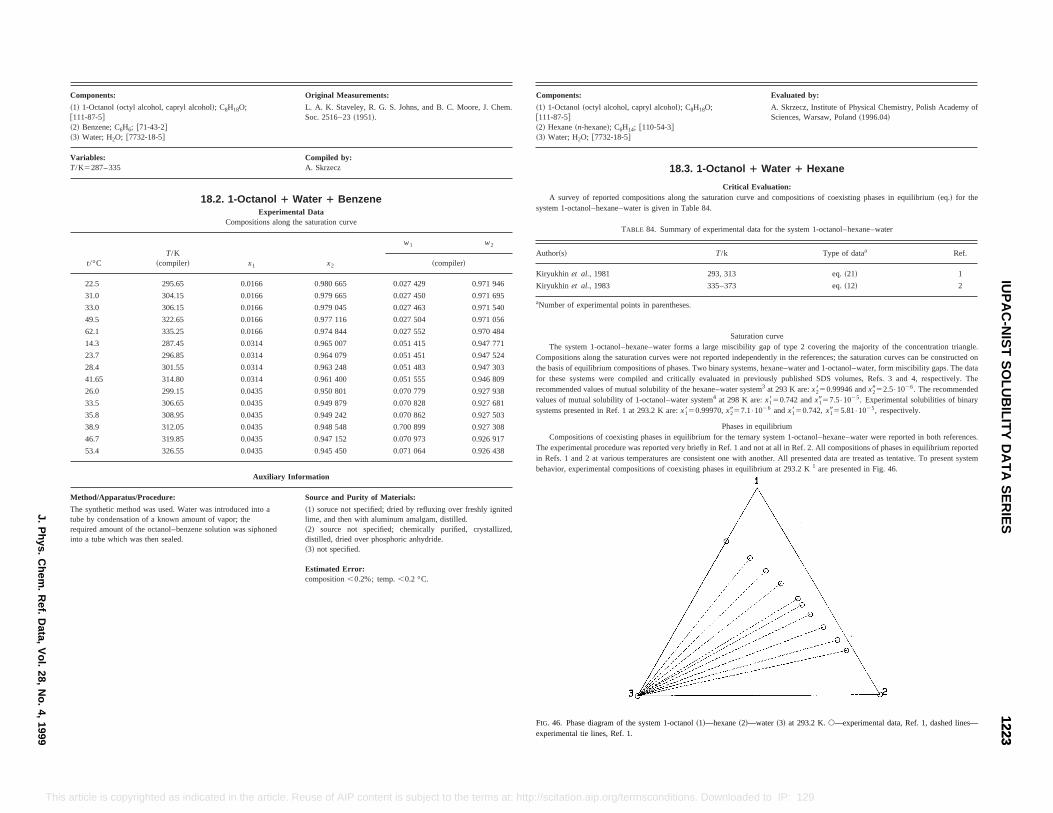
Evaluated by:
A. Skrzecz, Institute of Physical Chemistry, Polish Academy ofSciences, Warsaw, Poland~1996.04!
Water 1 Hexane
valuation:urve and compositions of coexisting phases in equilibrium~eq.! for the
data for the system 1-octanol–hexane–water
Type of dataa Ref.
eq.~21! 1
eq.~12! 2
ion curveibility gap of type 2 covering the majority of the concentration triangle.dependently in the references; the saturation curves can be constructed on
stems, hexane–water and 1-octanol–water, form miscibility gaps. The datapreviously published SDS volumes, Refs. 3 and 4, respectively. The
system3 at 293 K are:x2850.99946 andx2952.5•1026. The recommendedre:x1850.742 andx1957.5•1025. Experimental solubilities of binary1026 andx1850.742,x1955.81•1025, respectively.
equilibriumrnary system 1-octanol–hexane–water were reported in both references.and not at all in Ref. 2. All compositions of phases in equilibrium reportedith another. All presented data are treated as tentative. To present systemquilibrium at 293.2 K1 are presented in Fig. 46.
agram of the system 1-octanol~1!—hexane~2!—water ~3! at 293.2 K.s—experimental data, Ref. 1, dashed lines—nes, Ref. 1.
12231223
IUP
AC
-NIS
TS
OLU
BILIT
YD
AT
AS
ER
IESJ.P
hys.C
hem.
Ref.
Data,
Vol.
28,N
o.4,
1999
This .org/termsconditions. Downloaded to IP: 129.6.105.191 On: Fri, 05 Sep 2014 17:51:55
required amount of the octanol–benzene solution was siphonedinto a tube which was then sealed.
~2! source not specified; chemically purified, crystallized,distilled, dried over phosphoric anhydride.~3! not specified.
Estimated Error:composition,0.2%; temp.,0.2 °C.
FIG. 46. Phase diexperimental tie li
article is copyrighted as indicated in the article. Reuse of AIP content is subject to the terms at: http://scitation.aip
Components: Original Measurements:
~1! 1-Octanol~octyl alcohol, capryl alcohol!; C8H18O;@111-87-5#~2! Benzene; C6H6; @71-43-2#~3! Water; H2O; @7732-18-5#
L. A. K. Staveley, R. G. S. Johns, and B. C. Moore, J. Chem.Soc. 2516–23~1951!.
Variables:T/K5287– 335
Compiled by:A. Skrzecz
18.2. 1-Octanol 1 Water 1 BenzeneExperimental Data
Compositions along the saturation curve
t/°CT/K
~compiler! x1 x2
w1 w2
~compiler!
22.5 295.65 0.0166 0.980 665 0.027 429 0.971 946
31.0 304.15 0.0166 0.979 665 0.027 450 0.971 695
33.0 306.15 0.0166 0.979 045 0.027 463 0.971 540
49.5 322.65 0.0166 0.977 116 0.027 504 0.971 056
62.1 335.25 0.0166 0.974 844 0.027 552 0.970 484
14.3 287.45 0.0314 0.965 007 0.051 415 0.947 771
23.7 296.85 0.0314 0.964 079 0.051 451 0.947 524
28.4 301.55 0.0314 0.963 248 0.051 483 0.947 303
41.65 314.80 0.0314 0.961 400 0.051 555 0.946 809
26.0 299.15 0.0435 0.950 801 0.070 779 0.927 938
33.5 306.65 0.0435 0.949 879 0.070 828 0.927 681
35.8 308.95 0.0435 0.949 242 0.070 862 0.927 503
38.9 312.05 0.0435 0.948 548 0.700 899 0.927 308
46.7 319.85 0.0435 0.947 152 0.070 973 0.926 917
53.4 326.55 0.0435 0.945 450 0.071 064 0.926 438
Auxiliary Information
Method/Apparatus/Procedure: Source and Purity of Materials:
The synthetic method was used. Water was introduced into atube by condensation of a known amount of vapor; the
~1! soruce not specified; dried by refluxing over freshly ignitedlime, and then with aluminum amalgam, distilled.
Components:
~1! 1-Octanol~octyl alcohol, capryl alcohol!; C8H18O;@111-87-5#~2! Hexane~n-hexane!; C6H14; @110-54-3#~3! Water; H2O; @7732-18-5#
18.3. 1-Octanol 1
Critical EA survey of reported compositions along the saturation c
system 1-octanol–hexane–water is given in Table 84.
TABLE 84. Summary of experimental
Author~s! T/k
Kiryukhin et al., 1981 293, 313
Kiryukhin et al., 1983 335–373
aNumber of experimental points in parentheses.
SaturatThe system 1-octanol–hexane–water forms a large misc
Compositions along the saturation curves were not reported inthe basis of equilibrium compositions of phases. Two binary syfor these systems were compiled and critically evaluated inrecommended values of mutual solubility of the hexane–watervalues of mutual solubility of 1-octanol–water system4 at 298 K asystems presented in Ref. 1 at 293.2 K are:x1850.99970,x2957.1•
Phases inCompositions of coexisting phases in equilibrium for the te
The experimental procedure was reported very briefly in Ref. 1in Refs. 1 and 2 at various temperatures are consistent one wbehavior, experimental compositions of coexisting phases in e

Original Measurements:
cohol!; C8H18O;
-3#
A. M. Kiryukhin, T. M. Lesteva, and N. P. Markuzin, Prom-stSint. Kauch.12, 12–4~1981!.
Compiled by:A. Skrzecz
Experimental DataCompositions of coexisting phases
x28 x19 x29 w18 w28 w19 w29
ich
r!
water-richphase
~compiler!organic-rich
phasewater-rich
phase
999 770 0.000 000 0 0.000 007 1 0.000 0.999 952 0.000 00 0.000 034
55 0.000 009 7 0.000 006 7 0.298 0.696 0.000 07 0.000 032
93 0.000 018 0 0.000 006 3 0.363 0.629 0.000 13 0.000 030
04 0.000 022 1 0.000 005 6 0.444 0.543 0.000 16 0.000 027
20 0.000 026 3 0.000 005 0 0.521 0.462 0.000 19 0.000 024
63 0.000 029 1 0.000 004 2 0.575 0.406 0.000 21 0.000 020
31 0.000 031 8 0.000 003 1 0.608 0.373 0.000 23 0.000 015
25 0.000 038 7 0.000 003 6 0.696 0.279 0.000 28 0.000 017
33 0.000 041 5 0.000 002 1 0.771 0.199 0.000 30 0.000 010
37 0.000 048 4 0.000 001 7 0.848 0.116 0.000 35 0.000 008
00 0.000 058 1 0.000 000 0 0.954 0.000 0.000 42 0.000 000
9995 0.000 000 0 0.000 010 7 0.000 0.9999 0.000 00 0.000 051
76 0.000 016 6 0.000 007 7 0.374 0.616 0.000 12 0.000 037
63 0.000 029 1 0.000 005 9 0.482 0.503 0.000 21 0.000 028
19 0.000 030 4 0.000 005 2 0.526 0.458 0.000 22 0.000 025
31 0.000 037 4 0.000 004 2 0.608 0.373 0.000 27 0.000 020
00 0.000 038 7 0.000 003 8 0.624 0.352 0.000 28 0.000 018
20 0.000 041 5 0.000 003 1 0.703 0.273 0.000 30 0.000 015
76 0.000 044 3 0.000 002 1 0.740 0.234 0.000 32 0.000 010
13 0.000 055 4 0.000 000 8 0.866 0.096 0.000 40 0.000 004
00 0.000 066 4 0.000 000 0 0.952 0.000 0.000 48 0.000 000
Auxiliary Information
Method/Apparatus/Procedure: Source and Purity of Materials:
After separation both phases were analyzed. Concentrations oforganic components were determined by glc; water wasdetermined by the Karl Fischer method. To determinehydrocarbon in the water-rich phase, samples were extractedby nonane.
~1! source not specified; distilled, dried over zeolite; purity.99.9% mass.~2! source not specified; distilled; purity.99.9% mass.~3! not specified.
Estimated Error:Not reported.
12241224
SK
RZ
EC
Z,
SH
AW
,A
ND
MA
CZ
YN
SK
I
J.P
hys.C
hem.
Ref.
Data,
Vol.
28,N
o.4,
1999
This ndicated in the article. Reuse of AIP content is subject to the terms at: http://scitation.aip.org/termsconditions. Downloaded to IP: 129.6.105.191 On: Fri, 05 Sep 2014 17:51:55
article is copyrighted as iReferences:1A. M. Kiryukhin, T. M. Lesteva, and N. P. Markuzin, Prom-st Sint. Kauch.12, 12 ~1981!.2A. M. Kiryukhin, T. M. Lesteva, and N. P. Markuzin, Prom-st Sint. Kauch.12, 3 ~1983!.3D. G. Shaw, ed.,Solubility Data Series, Vol. 37. Hydrocarbons with Water and Seawater, Part I: Hydrocarbons C5 to C7 ~Pergamon,New York, 1989!.4A. F. M. Barton, ed.,Solubility Data Series,Vol. 15, Alcohols with Water~Pergamon, New York, 1984!.
Components:
~1! 1-Octanol~octyl alcohol, capryl al@111-87-5#~2! Hexane~n-hexane!; C6H14; @110-54~3! Water; H2O; @7732-18-5#
Variables:T/K5293– 313
t °CT/K
~compiler!
x18
organic-rphase
~complie
25 293.2 0.000 0.
0.214 0.7
0.265 0.6
0.327 0.6
0.388 0.5
0.434 0.4
0.464 0.4
0.536 0.3
0.598 0.2
0.661 0.1
0.742 0.0
40 313.2 0.000 0.
0.272 0.6
0.357 0.5
0.394 0.5
0.464 0.4
0.469 0.4
0.545 0.3
0.577 0.2
0.674 0.1
0.733 0.0
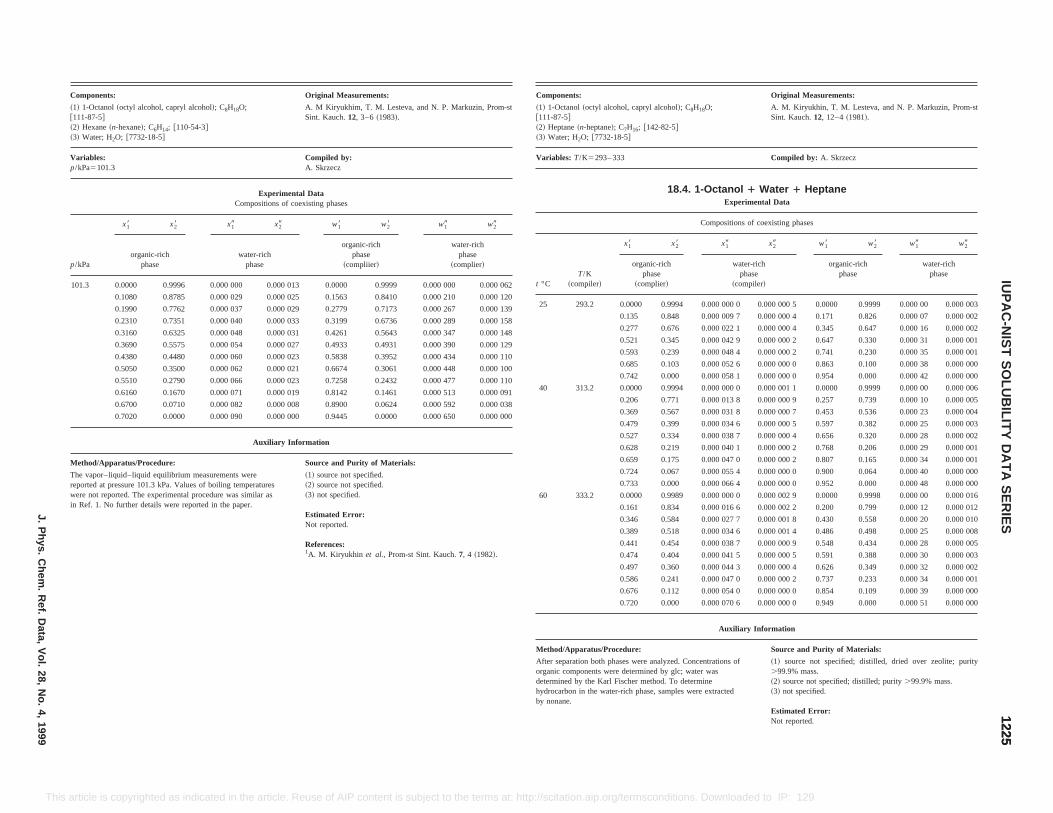
Original Measurements:
A. M. Kiryukhin, T. M. Lesteva, and N. P. Markuzin, Prom-stSint. Kauch.12, 12–4~1981!.
Compiled by: A. Skrzecz
1 Water 1 Heptanerimental Data
ns of coexisting phases
x29 w18 w28 w19 w29
ater-richphaseompiler!
organic-richphase
water-richphase
0 0 0.000 000 5 0.0000 0.9999 0.000 00 0.000 003
7 0.000 000 4 0.171 0.826 0.000 07 0.000 002
1 0.000 000 4 0.345 0.647 0.000 16 0.000 002
9 0.000 000 2 0.647 0.330 0.000 31 0.000 001
4 0.000 000 2 0.741 0.230 0.000 35 0.000 001
6 0.000 000 0 0.863 0.100 0.000 38 0.000 000
1 0.000 000 0 0.954 0.000 0.000 42 0.000 000
0 0 0.000 001 1 0.0000 0.9999 0.000 00 0.000 006
8 0.000 000 9 0.257 0.739 0.000 10 0.000 005
8 0.000 000 7 0.453 0.536 0.000 23 0.000 004
6 0.000 000 5 0.597 0.382 0.000 25 0.000 003
7 0.000 000 4 0.656 0.320 0.000 28 0.000 002
1 0.000 000 2 0.768 0.206 0.000 29 0.000 001
0 0.000 000 2 0.807 0.165 0.000 34 0.000 001
4 0.000 000 0 0.900 0.064 0.000 40 0.000 000
4 0.000 000 0 0.952 0.000 0.000 48 0.000 000
0 0 0.000 002 9 0.0000 0.9998 0.000 00 0.000 016
6 0.000 002 2 0.200 0.799 0.000 12 0.000 012
7 0.000 001 8 0.430 0.558 0.000 20 0.000 010
0.389 0.518 0.000 034 6 0.000 001 4 0.486 0.498 0.000 25 0.000 008
0.441 0.454 0.000 038 7 0.000 000 9 0.548 0.434 0.000 28 0.000 005
0.474 0.404 0.000 041 5 0.000 000 5 0.591 0.388 0.000 30 0.000 003
0.497 0.360 0.000 044 3 0.000 000 4 0.626 0.349 0.000 32 0.000 002
0.586 0.241 0.000 047 0 0.000 000 2 0.737 0.233 0.000 34 0.000 001
0.676 0.112 0.000 054 0 0.000 000 0 0.854 0.109 0.000 39 0.000 000
0.720 0.000 0.000 070 6 0.000 000 0 0.949 0.000 0.000 51 0.000 000
Auxiliary Information
aratus/Procedure: Source and Purity of Materials:
ation both phases were analyzed. Concentrations ofponents were determined by glc; water wasby the Karl Fischer method. To determine
n in the water-rich phase, samples were extracted
~1! source not specified; distilled, dried over zeolite; purity.99.9% mass.~2! source not specified; distilled; purity.99.9% mass.~3! not specified.
Estimated Error:Not reported.
12251225
IUP
AC
-NIS
TS
OLU
BILIT
YD
AT
AS
ER
IESJ.P
hys.C
hem.
Ref.
Data,
Vol.
28,N
o.4,
1999
This n.aip.org/termsconditions. Downloaded to IP: 129.6.105.191 On: Fri, 05 Sep 2014 17:51:55
References:1A. M. Kiryukhin et al., Prom-st Sint. Kauch.7, 4 ~1982!.
Method/App
After separorganic comdeterminedhydrocarboby nonane.
article is copyrighted as indicated in the article. Reuse of AIP content is subject to the terms at: http://scitatio
Components: Original Measurements:
~1! 1-Octanol~octyl alcohol, capryl alcohol!; C8H18O;@111-87-5#~2! Hexane~n-hexane!; C6H14; @110-54-3#~3! Water; H2O; @7732-18-5#
A. M Kiryukhim, T. M. Lesteva, and N. P. Markuzin, Prom-stSint. Kauch.12, 3–6 ~1983!.
Variables:p/kPa5101.3
Compiled by:A. Skrzecz
Experimental DataCompositions of coexisting phases
p/kPa
x18 x28 x19 x29 w18 w28 w19 w29
organic-richphase
water-richphase
organic-richphase
~compliier!
water-richphase
~complier!
101.3 0.0000 0.9996 0.000 000 0.000 013 0.0000 0.9999 0.000 000 0.000 062
0.1080 0.8785 0.000 029 0.000 025 0.1563 0.8410 0.000 210 0.000 120
0.1990 0.7762 0.000 037 0.000 029 0.2779 0.7173 0.000 267 0.000 139
0.2310 0.7351 0.000 040 0.000 033 0.3199 0.6736 0.000 289 0.000 158
0.3160 0.6325 0.000 048 0.000 031 0.4261 0.5643 0.000 347 0.000 148
0.3690 0.5575 0.000 054 0.000 027 0.4933 0.4931 0.000 390 0.000 129
0.4380 0.4480 0.000 060 0.000 023 0.5838 0.3952 0.000 434 0.000 110
0.5050 0.3500 0.000 062 0.000 021 0.6674 0.3061 0.000 448 0.000 100
0.5510 0.2790 0.000 066 0.000 023 0.7258 0.2432 0.000 477 0.000 110
0.6160 0.1670 0.000 071 0.000 019 0.8142 0.1461 0.000 513 0.000 091
0.6700 0.0710 0.000 082 0.000 008 0.8900 0.0624 0.000 592 0.000 038
0.7020 0.0000 0.000 090 0.000 000 0.9445 0.0000 0.000 650 0.000 000
Auxiliary Information
Method/Apparatus/Procedure: Source and Purity of Materials:
The vapor–liquid–liquid equilibrium measurements werereported at pressure 101.3 kPa. Values of boiling temperatureswere not reported. The experimental procedure was similar asin Ref. 1. No further details were reported in the paper.
~1! source not specified.~2! source not specified.~3! not specified.
Estimated Error:Not reported.
Components:
~1! 1-Octanol~octyl alcohol, capryl alcohol!; C8H18O;@111-87-5#~2! Heptane~n-heptane!; C7H16; @142-82-5#~3! Water; H2O; @7732-18-5#
Variables: T/K5293– 333
18.4. 1-OctanolExpe
Compositio
t °CT/K
~compiler!
x18 x28 x19
organic-richphase
~complier!
w
~c
25 293.2 0.0000 0.9994 0.000 00
0.135 0.848 0.000 009
0.277 0.676 0.000 022
0.521 0.345 0.000 042
0.593 0.239 0.000 048
0.685 0.103 0.000 052
0.742 0.000 0.000 058
40 313.2 0.0000 0.9994 0.000 00
0.206 0.771 0.000 013
0.369 0.567 0.000 031
0.479 0.399 0.000 034
0.527 0.334 0.000 038
0.628 0.219 0.000 040
0.659 0.175 0.000 047
0.724 0.067 0.000 055
0.733 0.000 0.000 066
60 333.2 0.0000 0.9989 0.000 00
0.161 0.834 0.000 016
0.346 0.584 0.000 027
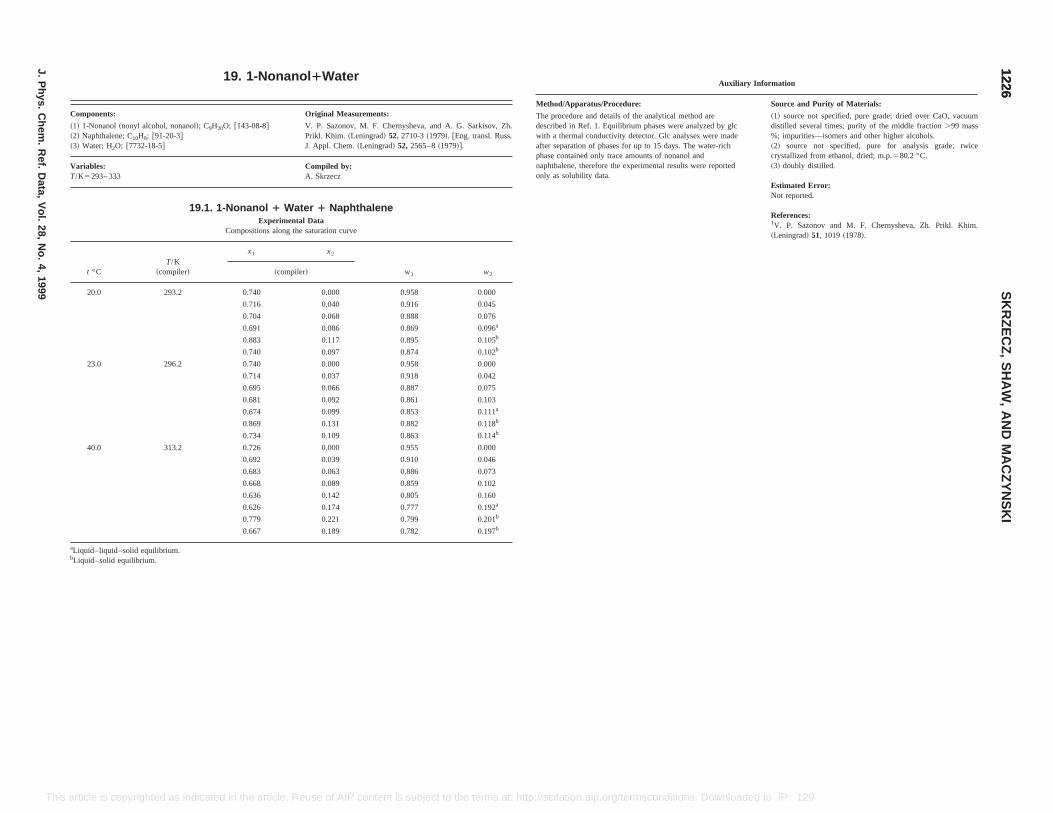
Nonanol 1Water
Original Measurements:
8-8# V. P. Sazonov, M. F. Chernysheva, and A. G. Sarkisov, Zh.Prikl. Khim. ~Leningrad! 52, 2710-3~1979!. @Eng. transl. Russ.J. Appl. Chem.~Leningrad! 52, 2565–8~1979!#.
Compiled by:A. Skrzecz
ol 1 Water 1 NaphthaleneExperimental Data
itions along the saturation curve
x2
w1 w2~compiler!
40 0.000 0.958 0.000
6 0.040 0.916 0.045
4 0.068 0.888 0.076
1 0.086 0.869 0.096a
3 0.117 0.895 0.105b
0 0.097 0.874 0.102b
40 0.000 0.958 0.000
4 0.037 0.918 0.042
5 0.066 0.887 0.075
1 0.092 0.861 0.103
4 0.099 0.853 0.111a
9 0.131 0.882 0.118b
4 0.109 0.863 0.114b
26 0.000 0.955 0.000
2 0.039 0.910 0.046
3 0.063 0.886 0.073
8 0.089 0.859 0.102
6 0.142 0.805 0.160
6 0.174 0.777 0.192a
9 0.221 0.799 0.201b
Auxiliary Information
Method/Apparatus/Procedure: Source and Purity of Materials:
The procedure and details of the analytical method aredescribed in Ref. 1. Equilibrium phases were analyzed by glcwith a thermal conductivity detector. Glc analyses were madeafter separation of phases for up to 15 days. The water-richphase contained only trace amounts of nonanol andnaphthalene, therefore the experimental results were reportedonly as solubility data.
~1! source not specified, pure grade; dried over CaO, vacuumdistilled several times; purity of the middle fraction.99 mass%; impurities—isomers and other higher alcohols.~2! source not specified, pure for analysis grade; twicecrystallized from ethanol, dried; m.p.580.2 °C.~3! doubly distilled.
Estimated Error:Not reported.
References:1V. P. Sazonov and M. F. Chernysheva, Zh. Prikl. Khim.~Leningrad! 51, 1019~1978!.
12261226
SK
RZ
EC
Z,
SH
AW
,A
ND
MA
CZ
YN
SK
I
J.P
hys.C
hem.
Ref.
Data,
Vol.
28,N
o.4,
1999
This .aip.org/termsconditions. Downloaded to IP: 129.6.105.191 On: Fri, 05 Sep 2014 17:51:55
0.667 0.189 0.782 0.197b
aLiquid–liquid–solid equilibrium.bLiquid–solid equilibrium.
article is copyrighted as indicated in the article. Reuse of AIP content is subject to the terms at: http://scitation
19. 1-
Components:
~1! 1-Nonanol~nonyl alcohol, nonanol!; C9H20O; @143-0~2! Naphthalene; C10H8; @91-20-3#~3! Water; H2O; @7732-18-5#
Variables:T/K5293– 333
19.1. 1-Nonan
Compos
t °CT/K
~compiler!
x1
20.0 293.2 0.7
0.71
0.70
0.69
0.88
0.74
23.0 296.2 0.7
0.71
0.69
0.68
0.67
0.86
0.73
40.0 313.2 0.7
0.69
0.68
0.66
0.63
0.62
0.77

12271227IUPAC-NIST SOLUBILITY DATA SERIES
This
20. System Index
Note: a letter E indicates presence of a Critical EvaluationBenzene1Water
1 1-Butanol 1186–1188E1 2-Butanol 1201–1202E1 Ethanol 1027–1042E1 Methanol 995–1002E1 2-Methyl-1-propanol 1165–1166E1 2-Methyl-2-propanol 1174–1175E1 1-Octanol 12231 1-Pentanol 1212–12131 1-Propanol 1095–1100E1 2-Propanol 1130–1137E
Benzyl alcohol1Water1 Heptane 1219–12201 Hexane 1217–12181 1, 2, 3, 4-Tetrahydronaphthalene 12201 Toluene 1218–1219
Butane1Water1 2-Butanol 12001 Methanol 993
1-Butanol1Water1 Benzene 1186–1188E1 Cyclohexane 1189–1191E1 Heptane 11981 1-Heptene 11981 Hexane 1191–1194E1 Mesitylene 1199–12001 Toluene 1194–1197E1 p-Xylene 1199
2-Butanol1Water1 Benzene 1201–1202E1 Butane 12001 Cyclohexane 1203–1205E1 Heptane 12091 1-Heptene 12091 Mesitylene 12111 Toluene 1206–1208E1 p-Xylene 1210
1-Butene1Water1 2-Methyl-2-propanol 1173
Cyclohexane1Water1 1-Butanol 1189–1191E1 2-Butanol 1203–1205E1 Ethanol 1045–1052E1 Methanol 1004–1007E1 2-Methyl-1-propanol 1167–1169E1 2-Methyl-2-propanol 1176–1178E1 1-Propanol 1100–1103E1 2-Propanol 1139–1145E
Cyclohexene1Water1 Ethanol 1043–1044E1 Methanol 1002–1004E1 2-Propanol 1138
Decahydronaphthalene~cis1trans!1Water1 Ethanol 1093–10941 2-Ethyl-1-hexanol 1222
Decane1Water1 Ethanol 10941 1-Propanol 1126–1129E
2,2-Dimethylbutane1Water1 Ethanol 1052
Ethanol1Water1 Benzene 1027–1042E1 Cyclohexane 1045–1052E1 Cyclohexene 1043–1044E1 Decahydronaphthalene (cis1trans) 1093–1094
J. Phys. Chem. Ref. Data, Vol. 28, No. 4, 1999 article is copyrighted as indicated in the article. Reuse of AIP content is subject to the terms at: http://scitation.aip.org/termsconditions. Downloaded to IP:
129.6.105.191 On: Fri, 05 Sep 2014 17:51:55
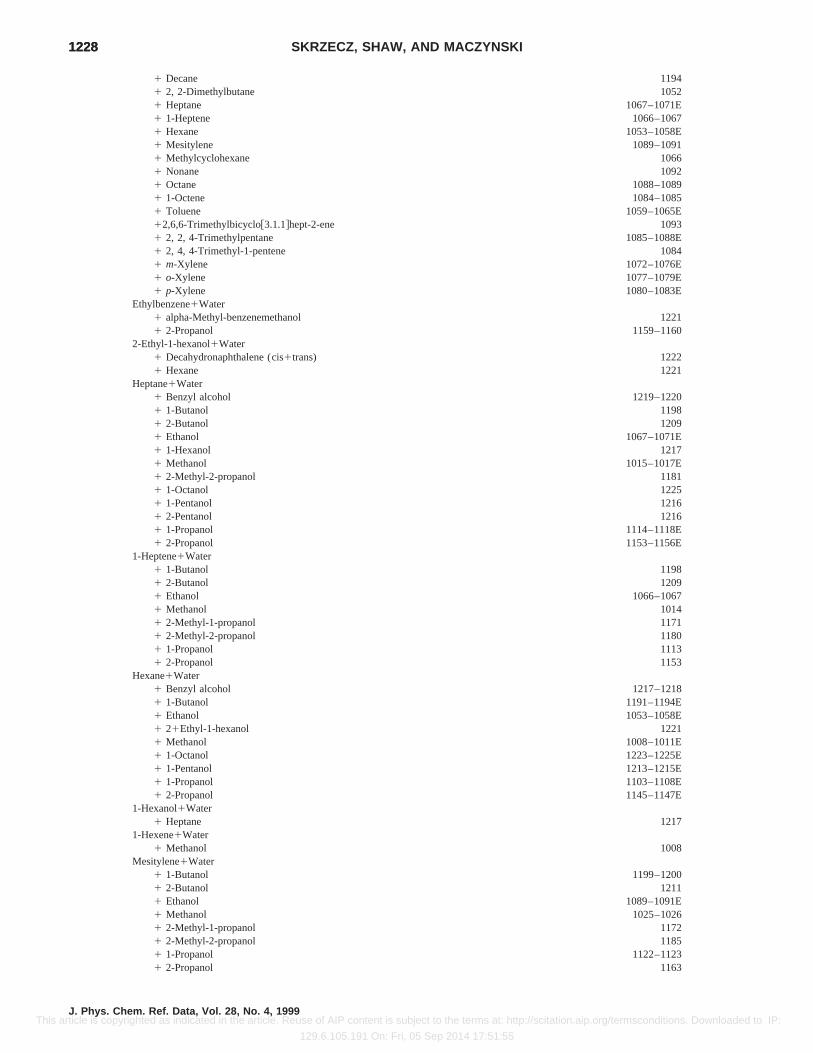
12281228 SKRZECZ, SHAW, AND MACZYNSKI
This a
1 Decane 11941 2, 2-Dimethylbutane 10521 Heptane 1067–1071E1 1-Heptene 1066–10671 Hexane 1053–1058E1 Mesitylene 1089–10911 Methylcyclohexane 10661 Nonane 10921 Octane 1088–10891 1-Octene 1084–10851 Toluene 1059–1065E12,6,[email protected]#hept-2-ene 10931 2, 2, 4-Trimethylpentane 1085–1088E1 2, 4, 4-Trimethyl-1-pentene 10841 m-Xylene 1072–1076E1 o-Xylene 1077–1079E1 p-Xylene 1080–1083E
Ethylbenzene1Water1 alpha-Methyl-benzenemethanol 12211 2-Propanol 1159–1160
2-Ethyl-1-hexanol1Water1 Decahydronaphthalene (cis1trans) 12221 Hexane 1221
Heptane1Water1 Benzyl alcohol 1219–12201 1-Butanol 11981 2-Butanol 12091 Ethanol 1067–1071E1 1-Hexanol 12171 Methanol 1015–1017E1 2-Methyl-2-propanol 11811 1-Octanol 12251 1-Pentanol 12161 2-Pentanol 12161 1-Propanol 1114–1118E1 2-Propanol 1153–1156E
1-Heptene1Water1 1-Butanol 11981 2-Butanol 12091 Ethanol 1066–10671 Methanol 10141 2-Methyl-1-propanol 11711 2-Methyl-2-propanol 11801 1-Propanol 11131 2-Propanol 1153
Hexane1Water1 Benzyl alcohol 1217–12181 1-Butanol 1191–1194E1 Ethanol 1053–1058E1 21Ethyl-1-hexanol 12211 Methanol 1008–1011E1 1-Octanol 1223–1225E1 1-Pentanol 1213–1215E1 1-Propanol 1103–1108E1 2-Propanol 1145–1147E
1-Hexanol1Water1 Heptane 1217
1-Hexene1Water1 Methanol 1008
Mesitylene1Water1 1-Butanol 1199–12001 2-Butanol 12111 Ethanol 1089–1091E1 Methanol 1025–10261 2-Methyl-1-propanol 11721 2-Methyl-2-propanol 11851 1-Propanol 1122–11231 2-Propanol 1163
J. Phys. Chem. Ref. Data, Vol. 28, No. 4, 1999rticle is copyrighted as indicated in the article. Reuse of AIP content is subject to the terms at: http://scitation.aip.org/termsconditions. Downloaded to IP:
129.6.105.191 On: Fri, 05 Sep 2014 17:51:55
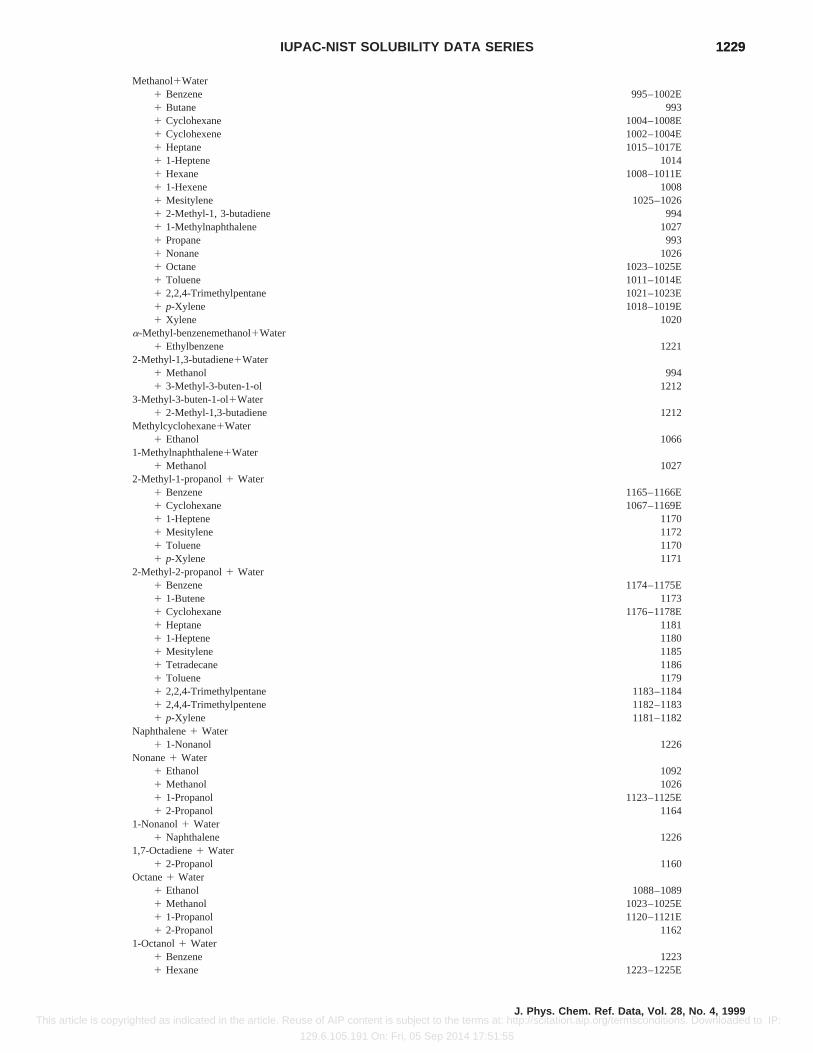
12291229IUPAC-NIST SOLUBILITY DATA SERIES
This a
Methanol1Water1 Benzene 995–1002E1 Butane 9931 Cyclohexane 1004–1008E1 Cyclohexene 1002–1004E1 Heptane 1015–1017E1 1-Heptene 10141 Hexane 1008–1011E1 1-Hexene 10081 Mesitylene 1025–10261 2-Methyl-1, 3-butadiene 9941 1-Methylnaphthalene 10271 Propane 9931 Nonane 10261 Octane 1023–1025E1 Toluene 1011–1014E1 2,2,4-Trimethylpentane 1021–1023E1 p-Xylene 1018–1019E1 Xylene 1020
a-Methyl-benzenemethanol1Water1 Ethylbenzene 1221
2-Methyl-1,3-butadiene1Water1 Methanol 9941 3-Methyl-3-buten-1-ol 1212
3-Methyl-3-buten-1-ol1Water1 2-Methyl-1,3-butadiene 1212
Methylcyclohexane1Water1 Ethanol 1066
1-Methylnaphthalene1Water1 Methanol 1027
2-Methyl-1-propanol1 Water1 Benzene 1165–1166E1 Cyclohexane 1067–1169E1 1-Heptene 11701 Mesitylene 11721 Toluene 11701 p-Xylene 1171
2-Methyl-2-propanol1 Water1 Benzene 1174–1175E1 1-Butene 11731 Cyclohexane 1176–1178E1 Heptane 11811 1-Heptene 11801 Mesitylene 11851 Tetradecane 11861 Toluene 11791 2,2,4-Trimethylpentane 1183–11841 2,4,4-Trimethylpentene 1182–11831 p-Xylene 1181–1182
Naphthalene1 Water1 1-Nonanol 1226
Nonane1 Water1 Ethanol 10921 Methanol 10261 1-Propanol 1123–1125E1 2-Propanol 1164
1-Nonanol1 Water1 Naphthalene 1226
1,7-Octadiene1 Water1 2-Propanol 1160
Octane1 Water1 Ethanol 1088–10891 Methanol 1023–1025E1 1-Propanol 1120–1121E1 2-Propanol 1162
1-Octanol1 Water1 Benzene 12231 Hexane 1223–1225E
J. Phys. Chem. Ref. Data, Vol. 28, No. 4, 1999rticle is copyrighted as indicated in the article. Reuse of AIP content is subject to the terms at: http://scitation.aip.org/termsconditions. Downloaded to IP:
129.6.105.191 On: Fri, 05 Sep 2014 17:51:55
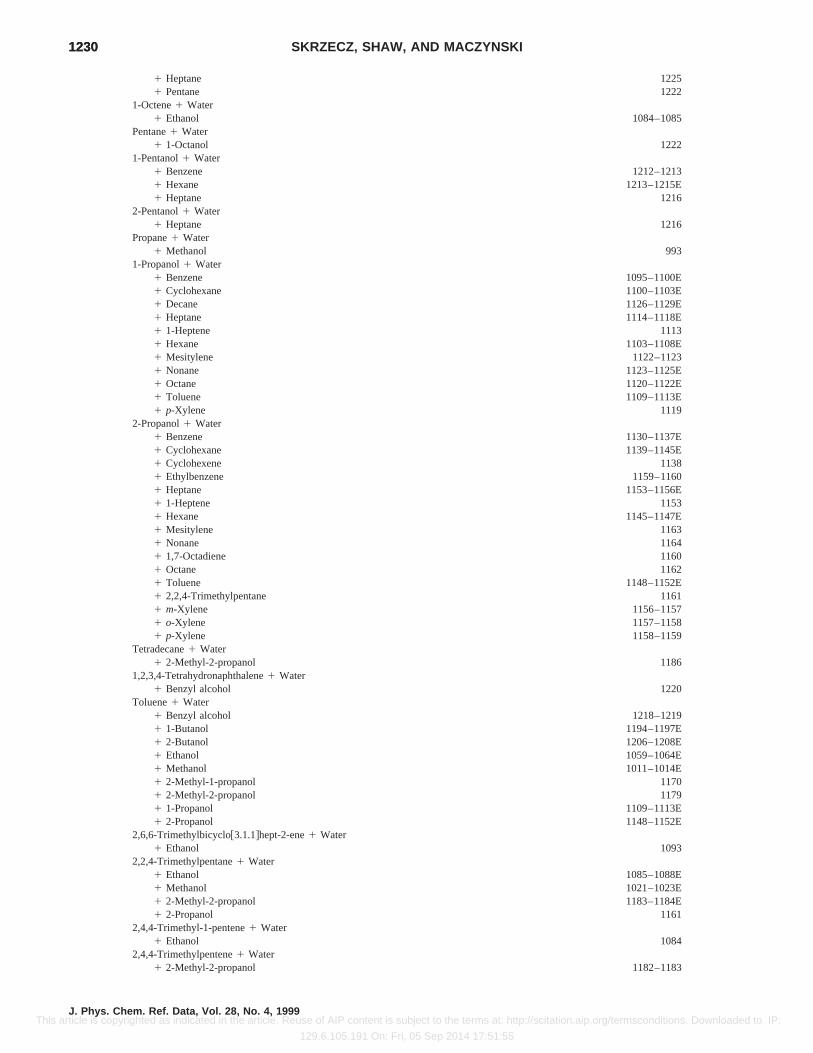
12301230 SKRZECZ, SHAW, AND MACZYNSKI
This a
1 Heptane 12251 Pentane 1222
1-Octene1 Water1 Ethanol 1084–1085
Pentane1 Water1 1-Octanol 1222
1-Pentanol1 Water1 Benzene 1212–12131 Hexane 1213–1215E1 Heptane 1216
2-Pentanol1 Water1 Heptane 1216
Propane1 Water1 Methanol 993
1-Propanol1 Water1 Benzene 1095–1100E1 Cyclohexane 1100–1103E1 Decane 1126–1129E1 Heptane 1114–1118E1 1-Heptene 11131 Hexane 1103–1108E1 Mesitylene 1122–11231 Nonane 1123–1125E1 Octane 1120–1122E1 Toluene 1109–1113E1 p-Xylene 1119
2-Propanol1 Water1 Benzene 1130–1137E1 Cyclohexane 1139–1145E1 Cyclohexene 11381 Ethylbenzene 1159–11601 Heptane 1153–1156E1 1-Heptene 11531 Hexane 1145–1147E1 Mesitylene 11631 Nonane 11641 1,7-Octadiene 11601 Octane 11621 Toluene 1148–1152E1 2,2,4-Trimethylpentane 11611 m-Xylene 1156–11571 o-Xylene 1157–11581 p-Xylene 1158–1159
Tetradecane1 Water1 2-Methyl-2-propanol 1186
1,2,3,4-Tetrahydronaphthalene1 Water1 Benzyl alcohol 1220
Toluene1 Water1 Benzyl alcohol 1218–12191 1-Butanol 1194–1197E1 2-Butanol 1206–1208E1 Ethanol 1059–1064E1 Methanol 1011–1014E1 2-Methyl-1-propanol 11701 2-Methyl-2-propanol 11791 1-Propanol 1109–1113E1 2-Propanol 1148–1152E
2,6,[email protected]#hept-2-ene1 Water1 Ethanol 1093
2,2,4-Trimethylpentane1 Water1 Ethanol 1085–1088E1 Methanol 1021–1023E1 2-Methyl-2-propanol 1183–1184E1 2-Propanol 1161
2,4,4-Trimethyl-1-pentene1 Water1 Ethanol 1084
2,4,4-Trimethylpentene1 Water1 2-Methyl-2-propanol 1182–1183
J. Phys. Chem. Ref. Data, Vol. 28, No. 4, 1999rticle is copyrighted as indicated in the article. Reuse of AIP content is subject to the terms at: http://scitation.aip.org/termsconditions. Downloaded to IP:
129.6.105.191 On: Fri, 05 Sep 2014 17:51:55
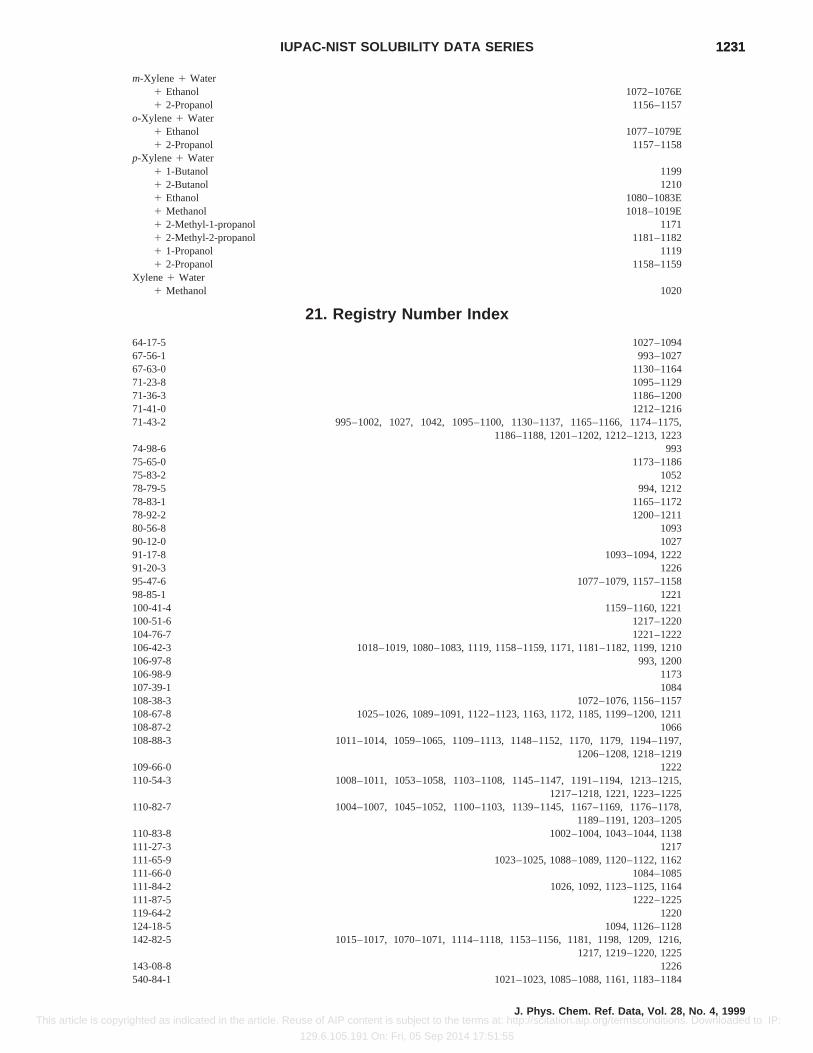
12311231IUPAC-NIST SOLUBILITY DATA SERIES
This ar
m-Xylene 1 Water1 Ethanol 1072–1076E1 2-Propanol 1156–1157
o-Xylene 1 Water1 Ethanol 1077–1079E1 2-Propanol 1157–1158
p-Xylene 1 Water1 1-Butanol 11991 2-Butanol 12101 Ethanol 1080–1083E1 Methanol 1018–1019E1 2-Methyl-1-propanol 11711 2-Methyl-2-propanol 1181–11821 1-Propanol 11191 2-Propanol 1158–1159
Xylene 1 Water1 Methanol 1020
21. Registry Number Index
64-17-5 1027–109467-56-1 993–102767-63-0 1130–116471-23-8 1095–112971-36-3 1186–120071-41-0 1212–121671-43-2 995–1002, 1027, 1042, 1095–1100, 1130–1137, 1165–1166, 1174–1175,
1186–1188, 1201–1202, 1212–1213, 122374-98-6 99375-65-0 1173–118675-83-2 105278-79-5 994, 121278-83-1 1165–117278-92-2 1200–121180-56-8 109390-12-0 102791-17-8 1093–1094, 122291-20-3 122695-47-6 1077–1079, 1157–115898-85-1 1221100-41-4 1159–1160, 1221100-51-6 1217–1220104-76-7 1221–1222106-42-3 1018–1019, 1080–1083, 1119, 1158–1159, 1171, 1181–1182, 1199, 1210106-97-8 993, 1200106-98-9 1173107-39-1 1084108-38-3 1072–1076, 1156–1157108-67-8 1025–1026, 1089–1091, 1122–1123, 1163, 1172, 1185, 1199–1200, 1211108-87-2 1066108-88-3 1011–1014, 1059–1065, 1109–1113, 1148–1152, 1170, 1179, 1194–1197,
1206–1208, 1218–1219109-66-0 1222110-54-3 1008–1011, 1053–1058, 1103–1108, 1145–1147, 1191–1194, 1213–1215,
1217–1218, 1221, 1223–1225110-82-7 1004–1007, 1045–1052, 1100–1103, 1139–1145, 1167–1169, 1176–1178,
1189–1191, 1203–1205110-83-8 1002–1004, 1043–1044, 1138111-27-3 1217111-65-9 1023–1025, 1088–1089, 1120–1122, 1162111-66-0 1084–1085111-84-2 1026, 1092, 1123–1125, 1164111-87-5 1222–1225119-64-2 1220124-18-5 1094, 1126–1128142-82-5 1015–1017, 1070–1071, 1114–1118, 1153–1156, 1181, 1198, 1209, 1216,
1217, 1219–1220, 1225143-08-8 1226540-84-1 1021–1023, 1085–1088, 1161, 1183–1184
J. Phys. Chem. Ref. Data, Vol. 28, No. 4, 1999ticle is copyrighted as indicated in the article. Reuse of AIP content is subject to the terms at: http://scitation.aip.org/termsconditions. Downloaded to IP:
129.6.105.191 On: Fri, 05 Sep 2014 17:51:55
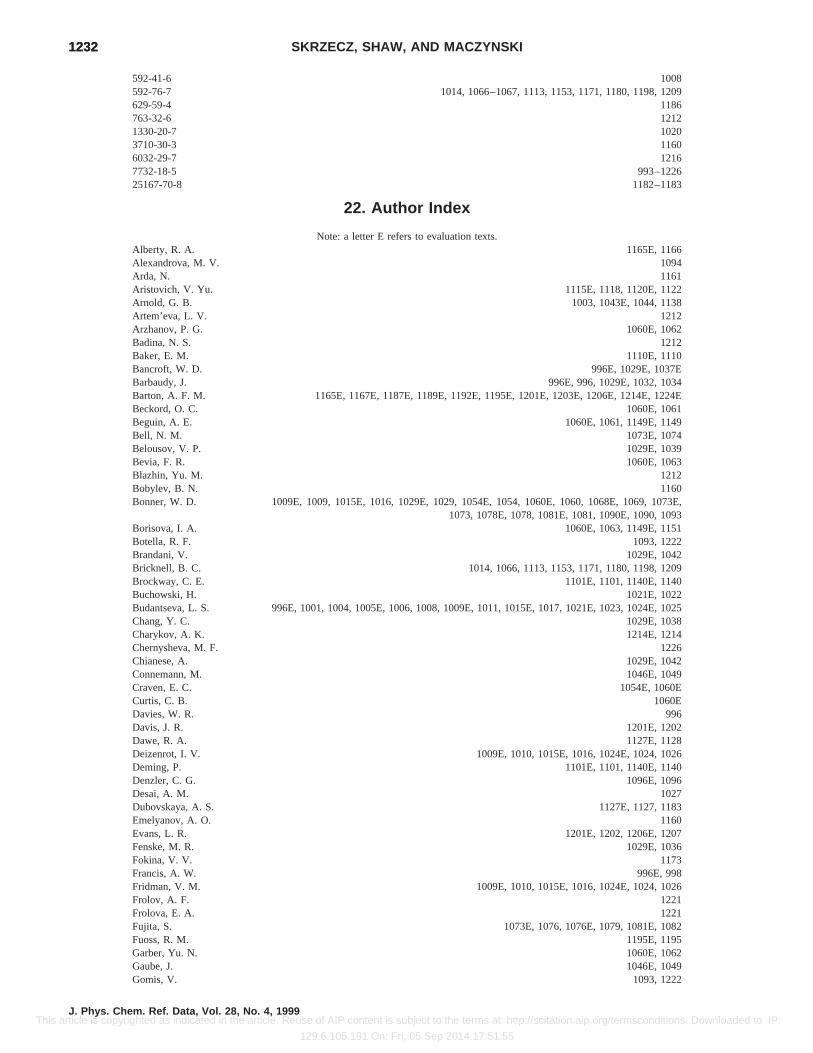
12321232 SKRZECZ, SHAW, AND MACZYNSKI
This
592-41-6 1008592-76-7 1014, 1066–1067, 1113, 1153, 1171, 1180, 1198, 1209629-59-4 1186763-32-6 12121330-20-7 10203710-30-3 11606032-29-7 12167732-18-5 993–122625167-70-8 1182–1183
22. Author Index
Note: a letter E refers to evaluation texts.Alberty, R. A. 1165E, 1166Alexandrova, M. V. 1094Arda, N. 1161Aristovich, V. Yu. 1115E, 1118, 1120E, 1122Arnold, G. B. 1003, 1043E, 1044, 1138Artem’eva, L. V. 1212Arzhanov, P. G. 1060E, 1062Badina, N. S. 1212Baker, E. M. 1110E, 1110Bancroft, W. D. 996E, 1029E, 1037EBarbaudy, J. 996E, 996, 1029E, 1032, 1034Barton, A. F. M. 1165E, 1167E, 1187E, 1189E, 1192E, 1195E, 1201E, 1203E, 1206E, 1214E, 1224EBeckord, O. C. 1060E, 1061Beguin, A. E. 1060E, 1061, 1149E, 1149Bell, N. M. 1073E, 1074Belousov, V. P. 1029E, 1039Bevia, F. R. 1060E, 1063Blazhin, Yu. M. 1212Bobylev, B. N. 1160Bonner, W. D. 1009E, 1009, 1015E, 1016, 1029E, 1029, 1054E, 1054, 1060E, 1060, 1068E, 1069, 1073E,
1073, 1078E, 1078, 1081E, 1081, 1090E, 1090, 1093Borisova, I. A. 1060E, 1063, 1149E, 1151Botella, R. F. 1093, 1222Brandani, V. 1029E, 1042Bricknell, B. C. 1014, 1066, 1113, 1153, 1171, 1180, 1198, 1209Brockway, C. E. 1101E, 1101, 1140E, 1140Buchowski, H. 1021E, 1022Budantseva, L. S. 996E, 1001, 1004, 1005E, 1006, 1008, 1009E, 1011, 1015E, 1017, 1021E, 1023, 1024E, 1025Chang, Y. C. 1029E, 1038Charykov, A. K. 1214E, 1214Chernysheva, M. F. 1226Chianese, A. 1029E, 1042Connemann, M. 1046E, 1049Craven, E. C. 1054E, 1060ECurtis, C. B. 1060EDavies, W. R. 996Davis, J. R. 1201E, 1202Dawe, R. A. 1127E, 1128Deizenrot, I. V. 1009E, 1010, 1015E, 1016, 1024E, 1024, 1026Deming, P. 1101E, 1101, 1140E, 1140Denzler, C. G. 1096E, 1096Desai, A. M. 1027Dubovskaya, A. S. 1127E, 1127, 1183Emelyanov, A. O. 1160Evans, L. R. 1201E, 1202, 1206E, 1207Fenske, M. R. 1029E, 1036Fokina, V. V. 1173Francis, A. W. 996E, 998Fridman, V. M. 1009E, 1010, 1015E, 1016, 1024E, 1024, 1026Frolov, A. F. 1221Frolova, E. A. 1221Fujita, S. 1073E, 1076, 1076E, 1079, 1081E, 1082Fuoss, R. M. 1195E, 1195Garber, Yu. N. 1060E, 1062Gaube, J. 1046E, 1049Gomis, V. 1093, 1222
J. Phys. Chem. Ref. Data, Vol. 28, No. 4, 1999 article is copyrighted as indicated in the article. Reuse of AIP content is subject to the terms at: http://scitation.aip.org/termsconditions. Downloaded to IP:
129.6.105.191 On: Fri, 05 Sep 2014 17:51:55
12331233IUPAC-NIST SOLUBILITY DATA SERIES
This a
Gorbunov, A. I. 1060E, 1063, 1149E, 1151, 1218Gorovits, B. I. 1214E, 1220Goto, S. 1220Graham, C. L. 1003, 1043E, 1044, 1101E, 1119, 1138, 1140E, 1140Hand, D. B. 996EHartley, J. 1020Hayakawa, T. 1073, 1076, 1078E, 1079, 1081E, 1082Heyward, C. 1015E, 1017, 1068E, 1071, 1115E, 1118, 1154E, 1156, 1181, 1198, 1209, 1216, 1217Hlavaty, K. 1096E, 1149EHnizda, V. 1029E, 1034Holmes, J. 996E, 1029E, 1096EHolt, A. 1073E, 1074Hong, W.-H. 1182Hopson, W. H. 1096E, 1097, 1105E, 1105, 1115E, 1115Hubard, S. S. 1029E, 1037Huber, J. F. K. 1086E, 1088Hulsman, J. A. R. J. 1086E, 1088Ilin, K. K. 1110E, 1101Ilyaskin, V. I. 1146E, 1147, 1192E, 1194Ishida, K. 993, 994Ivanova, G. G. 1217, 1219Johns, R. G. S. 996E, 997, 1029E, 1037, 1187E, 1188, 1212, 1223Jones, J. H. 1096E, 1097, 1105E, 1105, 1115E, 1115Kafarov, V. V. 996E, 1012E, 1018E, 1054E, 1060E, 1073E, 1096E, 1110E, 1131E, 1149EKamaevskaya, L. A. 1029E, 1040Karapetyants, M. Kh. 1054E, 1056, 1068E, 1070, 1088, 1092, 1105E, 1106, 1115E, 1116, 1120E, 1121, 1124E, 1124,
1127E, 1127, 1146E, 1146, 1154E, 1155, 1162, 1164, 1183Karrer, L. 1046E, 1047Katayama, T. 1105E, 1108, 1192E, 1193Khrabrova, N. G. 1173Kimura, O. 1029E, 1035Kiryukhin, A. M. 1221, 1222, 1224E, 1224, 1225Knypl, E. T. 1159Kogan, V. B. 1009E, 1010, 1015E, 1016, 1024E, 1024, 1026Kolyuchkina, G. Ya. 1217, 1219Komarova, L. F. 1060E, 1062Koshelkov, V. A. 1105E, 1107, 1124E, 1125Koshel’kov, V. A. 1115E, 1118, 1120E, 1122Kretschmer, C. B. 1043E, 1044, 1046, 1048, 1052, 1066, 1084, 1086E, 1086, 1087Krupina, Z. V. 1221Kubicek V. 1060E, 1064Kulbyaeva, T. A. 1009E, 1010, 1015E, 1016, 1024E, 1024, 1026Lee, H. 1182Lee, Y.-W. 1182Lee, Y. Y. 1182Legochkina, L. A. 1131E, 1134Leikola, E. 996E, 1012E, 1018E, 1060E, 1073E, 1096E, 1110E, 1131E, 1149ELesteva, T. M. 994, 996E, 1001, 1004, 1005E, 1006, 1008, 1009E, 1011, 1015E, 1017, 1021E, 1023, 1024E,
1025, 1214E, 1215, 1221Letcher, T. M. 996E, 1005E, 1007, 1012E, 1013, 1014, 1015E, 1017, 1018E, 1019, 1025, 1029E, 1046E, 1050,
1060E, 1065, 1066, 1068E, 1071, 1081E, 1083, 1090E, 1091, 1096E, 1101E, 1102, 1110E,1112, 1113, 1115E, 1118, 1119, 1122, 1131E, 1140E, 1143, 1149E, 1152, 1153, 1154E, 1156,1157, 1158, 1163, 1165E, 1167E, 1169, 1170, 1171, 1172, 1174E, 1176E, 1178, 1179, 1180,1181, 1185, 1187E, 1189E, 1190, 1195E, 1197, 1198, 1199, 1201E, 1203E, 1205, 1206E, 1208,
1209, 1210, 1211, 1216, 1217Lin, J.-S. 1206E, 1207Lincoln, A. T. 1029ELinke, W. F. 1073ELoginova, M. A. 1221Lorah, J. R. 1068E, 1069Lorimer, J. W. 1005E, 1009E, 1015E, 1021E, 1024EMaczynski, A. 1005E, 1009E, 1015E, 1021E, 1024EMahers, E. G. 1127E, 1128Markuzin, N. P. 1214E, 1215, 1221, 1222, 1224E, 1224, 1225Mason, L. S. 1012E, 1013Matous, J. 1060E, 1064Matsubara, M. 1220Matsuura, H. 1054E, 1058
J. Phys. Chem. Ref. Data, Vol. 28, No. 4, 1999rticle is copyrighted as indicated in the article. Reuse of AIP content is subject to the terms at: http://scitation.aip.org/termsconditions. Downloaded to IP:
129.6.105.191 On: Fri, 05 Sep 2014 17:51:55
12341234 SKRZECZ, SHAW, AND MACZYNSKI
This a
Mazanko, T. F. 996E, 999, 1096E, 1098, 1131E, 1132, 1135, 1136McCants, J. F. 1096E, 1097, 1105E, 1105, 1115E, 1115Meijers, C. A. M. 1086E, 1088Melnik, L. V. 1160Mertslin, R. V. 1029E, 1040, 1054E, 1056Michnick, M. J. 1186Mochalov, K. I. 1073EMondain-Monval, P. 1060E, 1062, 1073E, 1075Moore, B. C. 996E, 997, 1029E, 1037, 1131E, 1134, 1187E, 1188, 1212, 1223Morachevskii, A. G. 1029E, 1039Moriyoshi, T. 1046E, 1049, 1054E, 1058Morozov, A. V. 1146E, 1147, 1192E, 1194Morozova, A. I. 1212Morozova, V. I. 994Moulton, R. W. 1029E, 1038Nagatsuka, K. 993, 994Nam, S. 1073E, 1076, 1078E, 1079, 1081, 1082Naymova, A. A. 1173Nemtsov, M. S. 996E, 1001, 1004, 1005E, 1006, 1008, 1009E, 1011, 1015E, 1017, 1021E, 1023E, 1024E, 1025Nikurashina, N. I. 1029E, 1040, 1054E, 1056, 1110E, 1111, 1131E, 1135, 1140E, 1142Nishimoto, W. 1054E, 1058Niwase, Y. 996E, 997Noda, K. 993, 994Novak, J. P. 1060E, 1064Nowakowska, J. 1084, 1086E, 1087Ogorodnikov, S. K. 994, 1212Olsen, A. L. 1131E, 1131Ormandy, W. R. 996E, 1054E, 1060EPatterson, R. E. 1029E, 1041, 1054E, 1057Paulsen, I. A. 1029E, 1046E, 1047, 1048, 1054E, 1055Pavlenko, T. G. 1105E, 1107, 1115E, 1118, 1120E, 1122, 1124E, 1125Perrakis, N. 996E, 1029E, 1131E, 1187EPetrov, V. A. 1054E, 1056Pfennig, A. 1046E, 1049Pick, J. 1149E, 1150Plackov, D. 1005E, 1046E, 1051, 1101E, 1103, 1140E, 1144, 1167E, 1168, 1176E, 1177, 1189E, 1190,
1203E, 1204Plyngeu, V. Ya. 1131E, 1136Polozhentseva, E. N. 1029E, 1060EPolyakov, A. A. 1173Pond, T. W. M. 996Potapova, T. M. 1214E, 1212Prutton, C. F. 1027Pugachevich, P. P. 1115E, 1117Quiquerez, J. 1060E, 1062, 1073E, 1075Rabinovich, I. I. 1115E, 1117Radloff, S. E. 996E, 1005E, 1007, 1014, 1018E, 1019, 1029E, 1046E, 1050, 1066, 1081E, 1083, 1096E,
1101E, 1102, 1113, 1115E, 1119, 1131E, 1140E, 1143, 1149E, 1153, 1158, 1165E, 1167E,1169, 1171, 1174E, 1176E, 1178, 1180, 1181, 1187E, 1189E, 1190, 1198, 1199, 1201E, 1203E,
1205, 1209, 1210Radosz, M. 1200Ravindran, S. 1096E, 1101E, 1115E, 1149E, 1176ERajendran, M. 1131E, 1137Renganarayanan, S. 1131E, 1137Reuter, U. 1046E, 1049Ricna, K. 1060E, 1064Rico, D. P. 1060E, 1063Ross, S. 1029E, 1041, 1054E, 1057Rossi, M. 1029E, 1042Ruiz, F. 1093, 1222Sabylin, I. I. 1115E, 1118, 1120E, 1122Sadovnikova, L. V. 1094Sarkisov, A. G. 1146E, 1147, 1192E, 1194, 1226Sata, N. 996E, 997, 1029E, 1035Sato, K. 993, 994Sayar, A. A. 1161Sazonov, V. P. 1226Schweppe, J. L. 1068E, 1069
J. Phys. Chem. Ref. Data, Vol. 28, No. 4, 1999rticle is copyrighted as indicated in the article. Reuse of AIP content is subject to the terms at: http://scitation.aip.org/termsconditions. Downloaded to IP:
129.6.105.191 On: Fri, 05 Sep 2014 17:51:55
12351235IUPAC-NIST SOLUBILITY DATA SERIES
This a
Serafimov, L. A. 1105E, 1107, 1115E, 1118, 1120E, 1122, 1124E, 1125, 1217, 1219Sewry, J. D. 996E, 1014, 1029E, 1066, 1113, 1131E, 1153, 1165E, 1171, 1174E, 1180, 1187E, 1198, 1201E,
1209Shanahan, C. E. A. 1195E, 1196Shaw, D. G. 996E, 1005E, 1009E, 1012E, 1015E, 1018E, 1021E, 1024E, 1029E, 1043E, 1046E, 1054E,
1060E, 1068E, 1073E, 1078E, 1081E, 1086E, 1090E, 1096E, 1101E, 1105E, 1110E, 1115E,1120E, 1124E, 1127E, 1131E, 1140E, 1146E, 1149E, 1154E, 1165E, 1167E, 1174E, 1176E,
1187E, 1189E, 1192E, 1195E, 1201E, 1203E, 1206E, 1214E, 1224EShuttleworth, B. 1015E, 1017, 1068E, 1071, 1115E, 1118, 1154E, 1156, 1181, 1198, 1209, 1216, 1217Sidgwick, N. V. 1029ESilva, M. K. 1186Simonsen, D. R. 1174E, 1175Sinegubova, S. I. 1131E, 1135, 1140E, 1142Siswana, P. M. 1005E, 1007, 1012E, 1013, 1018E, 1019, 1025, 1046E, 1050, 1060E, 1065, 1081E, 1083,
1090E, 1091, 1096E, 1101E, 1102, 1110E, 1112, 1119, 1122, 1140E, 1143, 1149E, 1152, 1156,1157, 1158, 1163, 1167E, 1169, 1170, 1171, 1172, 1174E, 1176E, 1178, 1179, 1181, 1185,
1189E, 1190, 1195E, 1197, 1199, 1203E, 1205, 1206E, 1208, 1210, 1211Skorokhodova, I. I. 1221Skrzecz, A. 1005E, 1009E, 1015E, 1021E, 1024ESokolov, N. M. 1060E, 1063, 1149E, 1151Spencer, H. C. 1005ESpurrell, W. J. 1029ESrinivasan, D. 1131E, 1137Stankova, L. 1149E, 1150Staveley, L. A. K. 996E, 997, 1029E, 1037, 1187E, 1188, 1212, 1223Stern, I. 1005E, 1046E, 1051, 1101E, 1103, 1140E, 1144, 1167E, 1168, 1176E, 1177, 1189E, 1190,
1203E, 1204Strandskov, C. V. 1187E, 1187Sugi, H. 1105E, 1108, 1192E, 1193Suhrmann, R. 1009E, 1010Susarev, M. P. 1218Takahashi, K. 1046E, 1047Tarasenkov, D. N. 1029E, 1046E, 1047, 1048, 1054E, 1055, 1060ETaylor, S. F. 1029ETelichko, T. N. 1217, 1219Teperek, J. 1021E, 1022Tikhomirov, V. I. 1214E, 1214Timofeev, V. S. 1005E, 1107, 1115E, 1118, 1120E, 1124E, 1125, 1217, 1219Titova, V. N. 1105E, 1107, 1124E, 1125Transue, L. F. 1003, 1043E, 1044, 1138Triday, J. O. 996ETurovskii, V. B. 1146E, 1147, 1192E, 1194Tyvina, T. N. 1173Udovenko, V. V. 996E, 999, 1096E, 1098, 1131E, 1132, 1135, 1136Uosaki, Y. 1046E, 1049, 1054E, 1058van der Watt, P. 1018E, 1019, 1081E, 1083, 1119, 1158, 1171, 1181, 1199, 1210Varteressian, K. A. 1029E, 1036Vasileva, I. I. 1173Vatskova, V. G. 1060E, 1063, 1149E, 1151Verhoeye, L. A. J. 1140E, 1141Vesely, F. 1149E, 1150Vold, R. 1029E, 1034, 1046E, 1046Volkova, L. N. 1212Vorobeva, A. I. 1054E, 1056, 1068E, 1070, 1088, 1092, 1105E, 1106, 1115E, 1116, 1120E, 1121, 1124E, 1124,
1127E, 1146E, 1146, 1154E, 1155, 1162, 1164Walsh, T. J. 1027Walter, R. 1009E, 1010Washburn, E. R. 1003E, 1005E, 1012E, 1013, 1029E, 1034, 1043E, 1044, 1046E, 1046, 1060E, 1061, 1101E,
1101, 1131E, 1131, 1138, 1140E, 1140, 1149E, 1149, 1165E, 1166, 1174, 1175, 1187E, 1187Washino, K. 1220Wehrmann, F. 1029E, 1031Wiebe, R. 1043E, 1044, 1046E, 1048, 1052, 1066, 1084, 1086E, 1086, 1087Willhite, G. P. 1186Wojdylo, S. Z. 1159Wootton, S. 1015E, 1017, 1068E, 1071, 1115E, 1118, 1154E, 1156, 1181, 1198, 1209, 1216, 1217Wright, R. 1029E, 1033Yagues, V. G. 1060E, 1063Yamakawa, T. 1046E, 1047
J. Phys. Chem. Ref. Data, Vol. 28, No. 4, 1999rticle is copyrighted as indicated in the article. Reuse of AIP content is subject to the terms at: http://scitation.aip.org/termsconditions. Downloaded to IP:
129.6.105.191 On: Fri, 05 Sep 2014 17:51:55