iv. caries in specific surfaces of the permanent teeth …
TRANSCRIPT

THE IN F L U E N C E OF W A R A N D P O S T W A R CONDITIONS ON T H E T E E T H OF N O R W E G IA N
SCHOOL C H IL D R E N 1
IV. CARIES IN SPECIFIC SURFACES OF TH E P E R M A N E N T TEETH
G u t t o r m T o v e r u d , 2 L o u i s R u b a l 3 a n d D o r o t h y G . W i e h l 3
CHANGES in the condition of the teeth of Norwegian school children during and after World War II have been described in earlier publications (Toverud, 1956,
1957, II and III) which reported the findings from nationwide examinations on 5,000 to 7,000 children each school year from 1940-1941 to 1948-1949 and in 1951-1952 and 1952-1953. Main points discussed in these reports are as follows:
(1) Eruption time of the permanent teeth, particularly of teeth replacing deciduous molars, was “ delayed” during the War and changed later toward prewar eruption patterns. This was ascribed chiefly to longer retention of deciduous teeth as a result of less carious destruction, and partly to a nutritional factor.
(2) Caries rates in deciduous and permanent teeth showed a sharp reduction during the War years and began to increase in 1946 or later. Rationing of foods, particularly the great reduction in sugar and products of sugar and white flour leading to infrequent eating of these substances, together with increased consumption of coarse bread, potatoes and vegetables were con-1 From the Pedodontic Department, Dental Faculty, University in Oslo, former
Norwegian State Dental School, and the Milbank Memorial Fund.2 Dr. Philos., Oslo; F.D.S.R.C.S., England and Edinburgh; Professor of Pedo-
dontia.3 Milbank Memorial Fund, research staff.
A cknowledgment
These studies were made possible through the generous cooperation of schooldentists in the following school dental clinics: Aker, Blaker, Brunlanes, Baerum,Egersund, Eidsvoll, Fet, Fredrikstad, Gausdal, Gjerpen, Grue, Hedrum, Larvik,Meldal, Moss, Odda, Oppegaard, Porsgrunn, Ski, Skudeneshavn, Stord, Strinda,Troms0, Trondheim, T0nsberg, and Tune.
Economic support of the studies from Norske Melke-produsenters Landsforbund,A /S Norsk Dental Depot, A /S Si-Ko’s Fond, Ole Smith Houskens Fond, and NorgesAlmenvitenskapelige Forskningsrad also is acknowledged with gratitude.
The statistical treatment of the primary data has been carried out at the MilbankMemorial Fund, New York.

sidered the main causes of the reduced caries rates. Changes in diet and eating habits reduced the factors conducive to tooth destruction and increased the possibilities for early post-eruptive maturation of enamel.
(3 ) It was shown (Toverud, 1957, II) that a definite reduction had taken place in total surface caries rates for permanentfirst molars in 12-13-year-old children during the War in spite of the fact that the DMF tooth rate did not show any reduction until 1948. This points to the value of studying changes in caries in the tooth surfaces in studies of the effect of caries preventive or caries promoting factors.
In the present report, trends of the specific surface caries rates during the War and postwar years will be examined for the different permanent teeth. First, changes in surface caries rates in children of a specific age examined in each of the nine school years from 1940-1941 to 1948-1949 will be described; and second, the accumulation of caries between age 8 and 12 years will be studied for quasi-cohorts of children reaching age 12 years at the end of the war period and in later years.
D a t a a n d M e t h o d
The data collected and methods of analysis for the Nor-
490 The Milbank Memorial Fund Quarterly
Table 1. Number of children1 aged 7, 8, 12 and 13 years examined in villages in Norway 1940-1941 to 1948-1949, and in 1951-1952 and 1952-1953.
SchoolY ear
Age 7 Age 8 Age 12 Age 13
Total Boys Girls Total Boys Girls Total Boys Girls Total Boys Girls
1940-41 435 220 215 294 151 143 248 131 117 310 165 1451941-42 388 184 204 368 180 188 224 121 103 282 145 137
1942-43 456 236 220 376 192 184 222 110 112 320 165 1551943-44 333 182 151 400 212 188 262 140 122 371 193 178
1944-45 278 125 153 269 138 131 301 170 131 357 190 167
1945-46 354 187 167 410 201 209 363 172 191 416 228 188
1946-47 259 135 124 249 121 128 238 120 118 232 129 103
1947-48 339 162 177 300 158 142 283 146 137 293 150 143
1948-49 293 156 137 332 155 177 268 144 124 295 155 140
1951- 52* 174 92 82 167 86 811952- 53* 238 120 118 176 82 94
1 Number with one or more permanent teeth erupted.* Three villages only in 1951-1952 and 1952-1953. See footnote 4.

wegian dental study have been described in detail (Toverud, 1956). Only those aspects of the study which are of special relevance to this report are discussed here.
Examinations of the school children were made by school dentists, using a mirror and explorer. On a special form with a numbered square for each tooth, the dentist recorded whether the permanent tooth was erupted, present or extracted and indicated the surface location for any untreated caries and for any fillings. The examination was limited to the right side of the mouth.
Annual examinations in a randomized sample of Norwegian communities had been planned, but for a variety of reasons, particularly during the German occupation, not all communities in the sample were represented in every year. In this analysis of surface caries, combined data for ten villages with dental examinations in most years from 1941 to 1949 are used.4 In most of the villages, only children in the first, second, sixth and seventh grades were examined with the result that only ages 7, 8, 12 and 13 years are well represented. The numbers of children at these ages examined each year are shown in Table 1.
The considerable annual variation in the numbers of examinations at each age is due not only to omission of data from one or more villages in some years but also to failure of some dentists to examine all the children in the specified grades every year. Consequently, at any specific age, examinations from the different villages were varying proportions of the total from year to year; and also in any year, examinations from a specific village were varying proportions of the total examinations at the different ages. The shifting composition of the
4 Villages with data for 1941 to 1949 and for 1951-1952 and 1952-1953 are Baerum, Oppegaard and Stord. Other villages included for the first period are: Aker,Eidsvoll, Hedrum, Odda, Ski, Strinda and Tune. The numbers of children of different ages examined in each village in the different years has been shown in Part I(Toverud, 1956). Villages with no examinations in certain years are: Stord, in 1945;Ski and Hedrum in 1947; Aker and Strinda, in 1947, 1948 and 1949. In addition, in Stord, examinations for 12 and 13 year-old children were not available for the years 1941 to 1945, inclusive.
Teeth of Norwegian School Children: IV 491

population probably contributed to the irregular fluctuations in annual rates of caries prevalence at specific ages, but a careful check of the data from individual villages gave no indication that the overall pattern of changes in prevalence was significantly affected.
The longitudinal study of incidence of caries between two ages could not be limited to a definite cohort (specific population) because of the varying composition of the population by age and school year. However, a large majority of children examined at age 12 years in 1944-1945 and later were included in the population examined four years earlier at age 8. The increment in caries in specific surfaces of the first permanent molars and the incisors between these ages is studied for the War years and later.
For this report on trends in caries in specific surfaces and on increment in surface caries for cohorts of children, recorded annual rates for the population examined in the period 1941 to 1949 have been smoothed to eliminate irregular fluctuations. The procedure for obtaining smoothed rates was as follows: 1
1. A three-year moving average was used from the earliestyear, 1941, to the year with the lowest recorded rate.
2. The rate for 1941 was obtained by extending the movingaverage trend (difference between 1942 and 1943) backward one year unless this estimate seemed to exaggerate the intial value. In these instances, either the observed rate was used for first year, or, if the 1942 rate was higher than the 1941 rate, the average for these two years was used for both years.
3. The year for the minimum rate in the smoothed values is that in which the recorded rate was a minimum. The “ smoothed” minimum rate was obtained by extrapolating the moving average trend or using the observed minimum, whichever was higher.
4. Smoothed rates for years following the minimum rateare usually values obtained from a three-year moving average or estimated from a straight line based on the averages for two
492 The Milbank Memorial Fund Quarterly

successive two-year periods. When the minimum was in 1948,the recorded rate for 1949 was usually used.The smoothed rates obtained by the above procedures give
a conservative estimate of the decrease in caries between 1941 and the year with the lowest rate, and the latter is always the year in which the recorded rate was a minimum. Any increase in caries shown for years after the minimum rate also is a conservative estimate.
Rates used in this study are for boys and girls combined. The numbers of each sex at specific ages are shown in Table 1. The small difference in proportions by sex from year to year would have very little effect on the rates, and the effect is further reduced in the smoothed rates.
T r e n d s i n S p e c i f i c - S u r f a c e C a r i e s R a t e s
1940-1941 t o 1948-1949Since, generally, caries involvement in the permanent denti
tion of younger school-age children is confined mainly to the first molars, patterns of change in the specific-surface caries rates for these teeth in the 7-year-olds will be examined first. Later, caries rates will be presented for the surfaces of the permanent incisors in 8-year old children and for surfaces of all the permanent teeth of the 13-year old children.
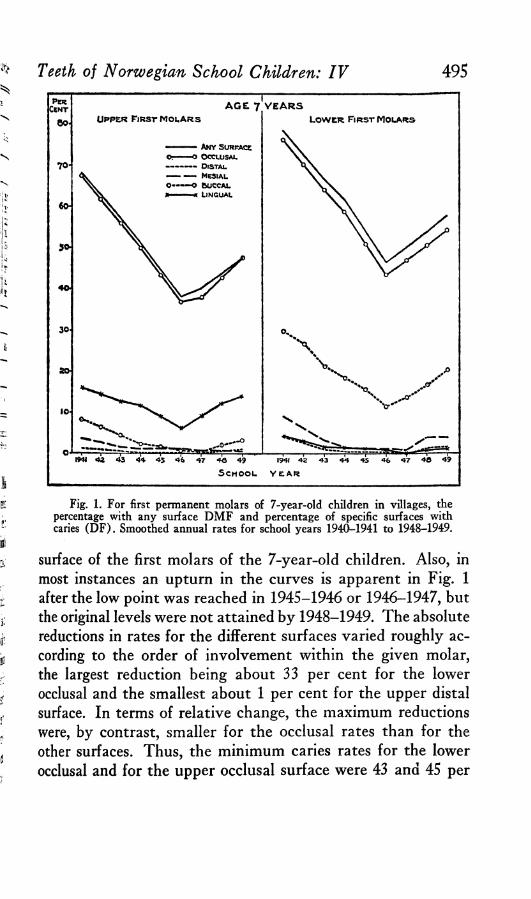
First Molars of 7-Year Old Children. The smoothed annualrates for the permanent first molars of the 7-year old children are shown in Table 2 and Fig. 1, the latter illustrating graphically the relative order of caries involvement in the different surfaces, as well as the trends.
As Fig. 1 clearly indicates, the surface with maximum caries involvement in both upper and lower first molars at this age is the occlusal. The rate for “ any surface,” i.e., the DMF tooth rate as conventionally used, is seldom more than one to three percentage points above the occlusal rate in the same year, so that the trend for first molar tooth DMF rates is essentially the same as the trend for the occlusal values. Minimum rates are shown for the distal surfaces of the upper molars
Teeth of Norwegian School Children: IV 493

494 The Milbank Memorial Fund Quarterly
S c h o o l
Y ear
U p p e r T eeth Lower T eeth
AnySurface Occlusal Mesial Distal Buccal Lingual Any
Surface Occlusal Mesial Distal Buccal Lingui
P E R C E N T O F !SU R FA C E S CARIOUS IN FIR S T MOLARS
1940-41 6 8 .2 6 7 .5 3 .7 1 .3 8 .2 1 5 .9 7 8 .4 7 6 .2 9 .1 3 .9 29.7 4.01941-42 6 2 .6 6 1 .7 2 .6 0 .9 6 .3 1 4 .2 7 2 .5 7 0 .1 6 .1 2 .5 26.7 2 .81942-43 5 7 .0 5 5 .9 1 .5 0 .5 4 .4 12.5 6 6 .6 6 4 .0 3 .1 1.1 21.2 1.61943-44 5 1 .2 5 0 .0 1 .1 0 .2 2 .3 11.5 6 1 .6 5 8 .6 1 .5 0 .6 18.3 1.51944-45 4 4 .6 4 3 .4 1 .1 0 .2 1 .5 8 .8 5 4 .1 5 1 .0 1 .2 0 .5 15.4 1.41945-46 3 8 .0 3 6 .8 1 .1 0 .1 0 .7 6 .1 4 6 .6 4 3 .4 1 .2 0 .3 11.4 1.11946-47 4 0 .0 3 8 .0 0 .8 0 0 .4 9 .0 5 0 .2 4 7 .0 0 .8 0 13.7 01947-48 4 3 .8 4 2 .8 0 .7 0 .6 2 .1 12.1 5 3 .9 5 0 .6 3 .8 1.3 16.6 0.91948-49 4 7 .6 4 7 .6 0 .7 1 .1 3 .3 1 3 .9 5 7 .6 5 4 .2 3 .8 1 .4 20.2 0.9
M AXIM UM P E R C E N T A G E RED U CTIO N IN S U R FA C E RA TES
4 4 .3 4 5 .4 81.1 100.0 95 .1 6 1 .6 4 0 .6 4 3 .0 9 1 .2 100 .0 61.6 100.0
M AXIM UM A B S O L U T E RED UCTIO N IN SU R FA C E R A TES
3 0 .2 3 0 .7 3.0 1 .3 7 .8 9 .8 3 1 .8 32 .8 8 .3 3 .9 18.3 4.0
Table 2. Per cent of specific surfaces with caries (DF) for permanent first molars of 7-year-old children. Smoothed annual rates, 1940-1941 to 1948-1949,for combined villages.
and for the distal or lingual surfaces of the lowers. Mesial values are consistently higher than the distal for both molars.
Rates for corresponding surfaces usually are higher in the lower first molars than in the upper, the notable exception being the lingual with much higher values in the upper molars. Buccal involvement in the lower first molars and lingual in the upper is greater than all other surfaces except the occlusal. The interchange in the order of buccal and lingual rates in the upper and lower first molars is a characteristic feature of the caries pattern for these teeth. The smallest differences in annual rates for corresponding surfaces in upper and lower first molars are for the distal and mesial surfaces and the largest for the buccal surface. The average annual difference between the buccal rates in upper and lower molars is about 16 per cent; for lingual rates, it is 10 per cent and for occlusal about 8 per cent.
Some decrease from the 1941 rates occurred for every type of
Teeth of Norwegian School Children: IV 495
Fig. 1. For first permanent molars of 7-year-old children in villages, thepercentage with any surface D M F and percentage of specific surfaces withcaries (D F ). Smoothed annual rates for school years 1940-1941 to 1948-1949.
surface of the first molars of the 7-year-old children. Also, in most instances an upturn in the curves is apparent in Fig. 1 after the low point was reached in 1945-1946 or 1946-1947, but the original levels were not attained by 1948-1949. The absolute reductions in rates for the different surfaces varied roughly according to the order of involvement within the given molar, the largest reduction being about 33 per cent for the lower occlusal and the smallest about 1 per cent for the upper distal surface. In terms of relative change, the maximum reductions were, by contrast, smaller for the occlusal rates than for the other surfaces. Thus, the minimum caries rates for the lower occlusal and for the upper occlusal surface were 43 and 45 per
cent less, respectively, than the 1941 rates; whereas for other surfaces relative decreases ranged from 62 to 100 per cent. For
496 The Milbank Memorial Fund Quarterly
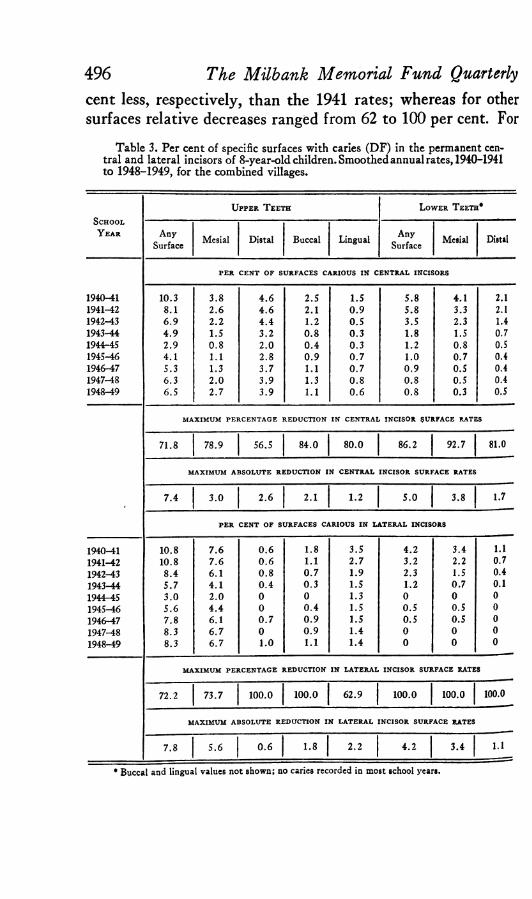
Table 3. Per cent of specific surfaces with caries (DF) in the permanent central and lateral incisors of 8-year-old children. Smoothed annual rates, 1940-1941to 1948-1949, for the combined villages.
SchoolY ear
Upper T eeth Lower T eeth*
AnySurface Mesial Distal Buccal Lingual Any
Surface Mesial Distal
PER CENT OF SURFACES CARIOUS IN CENTRAL INCISORS
1 9 4 0 -4 1 1 0 .3 3 . 8 4 . 6 2 .5 1 .5 5 . 8 4 .1 2 .11 9 4 1 -4 2 8 .1 2 . 6 4 . 6 2 .1 0 . 9 5 . 8 3 .3 2.11 9 4 2 -4 3 6 . 9 2 . 2 4 . 4 1 .2 0 . 5 3 .5 2 .3 1 .41 9 4 3 -4 4 4 . 9 1 .5 3 . 2 0 . 8 0 . 3 1 .8 1 .5 0 .71 9 4 4 -4 5 2 . 9 0 . 8 2 . 0 0 . 4 0 .3 1 .2 0 .8 0 .51 9 4 5 -4 6 4 .1 1 .1 2 .8 0 . 9 0 . 7 1.0 0 .7 0 .41 9 4 6 -4 7 5 .3 1 .3 3 . 7 1 .1 0 . 7 0 . 9 0 .5 0 .41 9 4 7 -4 8 6 .3 2 . 0 3 . 9 1 .3 0 . 8 0 . 8 0 .5 0 .41 9 4 8 -4 9 6 .5 2 . 7 3 . 9 1 .1 0 . 6 0 . 8 0 .3 0 .5
MAXIMUM PERCENTAGE REDUCTION IN CENTRAL INCISOR SURFACE RATES
7 1 .8 7 8 .9 5 6 .5 8 4 .0 8 0 .0 8 6 .2 9 2 .7 8 1 .0
MAXIMUM ABSOLUTE REDUCTION IN CENTRAL INCISOR SURFACE RATES
7 . 4 3 . 0 2 . 6 2 .1 1 .2 5 . 0 3 .8 1 .7
PER CENT OF SURFACES CARIOUS IN LATERAL INCISORS
1 9 4 0 -4 1 1 0 .8 7 . 6 0 . 6 1 .8 3 .5 4 . 2 3 .4 1.1
1 9 4 1 -4 2 1 0 .8 7 . 6 0 . 6 1 .1 2 . 7 3 .2 2 .2 0 .7
1 9 4 2 -4 3 8 . 4 6 .1 0 . 8 0 . 7 1 .9 2 .3 1 .5 0 .4
1 9 4 3 -4 4 5 . 7 4 . 1 0 . 4 0 . 3 1 .5 1 .2 0 .7 0.11 9 4 4 -4 5 3 . 0 2 . 0 0 0 1 .3 0 0 01 9 4 5 -4 6 5 . 6 4 . 4 0 0 . 4 1 .5 0 . 5 0 .5 0
1 9 4 6 -4 7 7 . 8 6 .1 0 . 7 0 . 9 1 .5 0 .5 0 .5 0
1 9 4 7 -4 8 8 .3 6 . 7 0 0 . 9 1 .4 0 0 01 9 4 8 -4 9 8 .3 6 . 7 1.0 1 .1 1 .4 0 0 0
—
MAXIMUM PERCENTAGE REDUCTION IN LATERAL INCISOR SURFACE RATES
7 2 .2 7 3 .7 1 0 0 .0 1 0 0 .0 6 2 .9 1 0 0 .0 1 0 0 .0 100 .0
MAXIMUM ABSOLUTE REDUCTION IN LATERAL INCISOR SURFACE RATES
7 .8 5 . 6 0 . 6 1 .8 2 . 2 4 . 2 3 .4 1.1
* Buccal and lingual values not shown; no caries recorded in most school years.

Teeth of Norwegian School Children: IV 497PERCe n t
AGE ©YEARSU p p e r Ce n t r a l In c is o r s
■ ■— An v Surface
l o w e r Ce n t r a l I n c is o r s
2 * -------------D is ta l
— — M e s ia l o — — o Bu cc al • ■■■■■■« Lin g u a l
•O-
0-
U p p e r l a t e r a l In c is o r s L o w e r L a t e r a l In c is o r s
20*
10-
O- — i— ■nr 1 ~ 1 —1941 42 AS 44 45 4 * 47 46 49 1941 42 43 44 43 4fr 47 4& 49
SC HO O L Y e a r
Fig. 2. For permanent incisors of 8-year-old children in villages, the percentage with any D F surface and percentage of specific surfaces with caries. Smoothed annual rates for school years 1940-1941 to 1948-1949.
the distal surface of upper molars and for both distal and lingual surfaces of lower molars, no caries were recorded for the children examined in 1946-1947, a reduction of 100 per cent. These zero rates should be viewed in the light of the very low rates of only 1 to 4 per cent in 1941. In general, the reductions percentagewise usually were greatest for the surfaces least involved, while the absolute reductions tend to be larger for the more susceptible surfaces.
Permanent Incisors of 8-Year-Old Children. The incisors arenext to the first molars in order of emergence in the permanent dentition. The specific-surface caries rates in the incisors of the 8-year children given in Table 3 and Fig. 2 describe the caries pattern at an early stage of mouth exposure, and the changes in rates from 1940-1941 to 1948-1949. Caries rates for incisors generally are still rather low at this age but certain intradental patterns and trends appear to take fairly clear form.
It is evident from Fig. 2 that, intradentally, the 'mesial sur-

face had the highest caries rate in the upper lateral incisors and in both lower incisors; but, in the upper central incisors, the distal surface had the highest rate.
Trends in the caries rates for the contacting surfaces of the upper incisors (distal central and mesial lateral) were quite similar; for both surfaces, there is a sharp reduction in caries during the War years followed by a very definite increase. Caries rates in these contacting surfaces are discussed in detail for the children aged 13 years.
In the lingual surface of upper lateral incisors, the caries rates were higher than either distal or buccal rates for these teeth and also showed less reduction percentagewise than any surface of the lateral incisors, and less than any surface of the other incisors with the exception of the distal surface of upper central incisors. This pattern for caries in the lingual surface of upper lateral incisors is ascribed to the lingual pit.
With maximum rates for the incisors no more than 11 per cent at the beginning of the period, it is obvious that absolute reductions from the initial rates are small, but percentage reductions are large. The percentage reductions in any surface rates (tooth DF) varied from 100 per cent for the lower lateral incisors to 72 per cent for both upper incisors. Since the caries rates are so low for these teeth, significance of differences among rates for the specific surfaces and for the teeth derives largely from consistency in the patterns. In general, caries rates for the specific surfaces of upper incisors show a definite decrease to 1944-1945 and an increase thereafter; rates for the lower incisors were low initially and became negligible in later years.
SPECIFIC-SURFACE CARIES RATES FOR THE DIFFERENT PERMANENTTEETH OF 13-YEAR-OLD CHILDREN, 1940-1941 TO 1948-1949The smoothed annual caries rates for specific surfaces of the
different permanent teeth of 13-year-old children examined in the villages in 1940-1941 to 1948-1949 are presented in Table 4a, Table 4b and Fig. 3. For each type of tooth, the chart
498 The Milbank Memorial Fund Quarterly

shows the relative order of caries involvement for the different surfaces in any specified school year and also the changes over the nine-year period. The pattern of involvement and trends for each tooth may be compared with those of the adjacent or more remote members of the permanent dentition, but differ-
Teeth of Norwegian School Children: IV 499
Table 4a. Per cent of specific surfaces with caries (DF) for the incisors andcuspids of 13-year-old children. Smoothed annual rates, 1940-1941 to 1948-1949,for the combined villages.
S c h o o l y e a r
U p p e r T e e t h L o w e r T e e t h 1
AnySurf. Mes. Dist. Buc. Ling. Any
Surf. Mes. Dist. Buc.
C E N T R A L IN CISO RS
1940-41 65.0 42.8 51.0 5.0 6.5 21.5 16.9 16.0 0.91941-42 65.0 42.8 51.0 5.0 6.4 21.5 16.9 15.1 0.91942-43 62.4 40.0 48.3 4.7 6.0 21.6 17.3 14.2 0.61943-44 57.1 35.3 43.7 3.3 5.3 21.3 16.4 14.0 0.51944-45 51.0 29.7 39.6 3.0 4.4 19.3 14.9 12.7 0.51945-46 46.9 24.9 36.5 2.8 3.6 16.1 11.8 10.2 0.61946-47 44.7 21.6 34.7 2.6 3.5 11.3 7.8 6.7 0.71947-48 42.7 22.6 32.9 2.0 2.8 7.8 5.1 4.1 0.91948-49 44.4 23.2 35.9 1.5 2.7 5.6 3.7 2.9 0.9
L A T E R A L IN CISO RS
1940-41 60.4 51.2 22.1 3.8 17.2 16.3 14.2 7.3 1.01941-42 60.2 50.3 20.3 3.8 17.2 16.3 14.2 7.2 1.01942-43 59.0 48.7 18.5 3.8 17.2 15.4 13.8 5.7 1.01943-44 54.9 44.5 15.3 3.3 16.3 14.1 12.9 4.2 0.61944-45 50.1 40.1 11.6 2.8 16.3 12.8 11.8 3.3 0.21945-46 46.5 36.4 8.6 2.3 16.1 9.4 8.5 2.7 0.41946-47 43.9 33.9 7.4 1.7 15.3 6.8 5.4 2.2 0.91947-48 41.3 31.4 6.6 1.1 12.1 4.7 3.5 1.8 1.11948-49 44.0 32.4 9.9 2.4 13.3 4.4 3.1 1.7 1.2
CUSPID S
1940-41 16.8 12.2 5.9 * * 6.2 3.8 0.9 •1941-42 16.8 12.2 4.1 * * 6.2 3.8 0.9 *1942-43 11.6 8.3 2.3 * * 4.3 2.6 0.6 *1943-44 7.2 5.0 1.8 • • 2.0 1.3 0.3 •1944-45 4.5 3.2 1.0 * * 1.7 1.2 0.3 •1945-46 2.5 1.6 0.3 * * 1.3 0.8 0.3 *1946-47 4.3 2.9 . 0.7 * * 1.3 0.8 0.2 •1947-48 6.5 4.8 1.6 * • 1.0 0.6 0 *1948-49 8.7 6.7 2.5 * * 1.4 1.0 0 *
1 Lingual rates omitted; less than 1.0 per cent and zero in many years. * Rates negligible.

500 The Milbank Memorial Fund Quarterly
Fig.
3.
For
each
per
man
ent
toot
h of
13-
year
-old
chi
ldre
n in
vill
ages
, th
e pe
rcen
tage
with
any
DF
sur
face
and
the
per
ce
ntag
e of
spe
cific
surfa
ces
with
carie
s. S
moo
thed
ann
ual
rate
sfo
rsc
hool
yea
rs 1
940-
1941
to19
48—1
949.

Table 4b. Per cent of specific surfaces with caries (D F)1 for the permanentbicuspids and molars of 13-year-old children. Smoothed annual rates, 1940-1941to 1948-1949 for the combined villages.
i Upper T eeth Lower T eeth
y Schooli, Y e a r
HH
AnySurf. Occl. Mes. Dist. Buc.2 Ling.2 Any
Surf. Occl. Mes. Dist. Buc.2 Ling.1
liF IR S T BIC U SPID S
* 1940-41 39 .7 2 9 .6 8 .4 2 3 .8 1 5 .9 1 0 .4 2 .7 8 .4| 1941-42 39 .7 2 9 .6 6 .8 2 3 .8 1 5 .9 1 0 .4 1 .9 8 .4J 1942-43 3 1 .8 25 .1 5 .2 16 .3 1 1 .9 8 .6 1 .1 4 .91 1943-44 2 5 .4 21.3 3 .3 1 0 .4 8 .0 6 .0 0 .9 2 .2} 1944-45 21.1 1 7 .4 2 .5 7 .7 5 .6 4 .4 0 .8 0 .9< 1945-46 18.2 1 6 .7 1 .8 5 .3 4 .3 3 .3 0 .9 0 .3
1946-47 1 8 .9 14.8 1 .4 7 .6 5 .5 4 .4 0 .5 0 .9• 1947-48 2 0 .3 1 3 .8 1 .0 10 .1 6 .6 5 .2 0 1 .7\ 1948-49 21 .7 15.5 3 .5 1 2 .6 7 .6 5 .8 0 2 .5
j SECOND B IC U SPID S
1940-41 4 1 .8 3 2 .4 2 4 .9 1 9 .7 3 7 .1 2 9 .9 1 0 .6 16.3j 1941-42 3 8 .2 3 2 .4 2 4 .9 1 7 .6 3 1 .6 2 6 .4 7 .7 1 3 .9! 1942-43 34.5 2 7 .1 1 7 .9 1 5 .6 2 5 .1 2 1 .4 4 .9 1 0 .5
1943-44 2 8 .7 2 1 .9 1 1 .8 11 .5 1 9 .8 1 7 .0 2 .5 7 .7! 1944-45 24.5 1 8 .6 8 .6 8 .8 1 4 .7 12.1 1 .7 5 .0'i 1945-46 18.8 1 3 .7 5 .4 5 .7 9 .6 7 .2 0 .9 3 .2I 1946-47 1 4 .7 8 .8 6 .5 4 .9 1 3 .5 10 .3 1 .5 5 .2i‘ 1947-48 22.1 14.1 9 .1 1 0 .9 1 7 .6 1 3 .1 2 .2 7 .7i 1948-49 2 7 .7 1 8 .8 1 1 .7 1 6 .9 2 1 .3 1 5 .4 2 .9 1 0 .2
- F IR S T MOLARS
1940-41 9 6 .8 9 5 .2 6 0 .4 1 3 .3 1 8 .7 4 4 .4 9 8 .1 9 6 .5 5 7 .3 3 5 .6 6 1 .3 1 1 .61941-42 9 6 .8 9 5 .2 6 0 .4 1 3 .3 1 8 .7 4 4 .4 9 7 .8 9 6 .6 5 6 .1 3 4 .6 6 1 .3 1 1 .61942-43 97 .1 9 6 .1 6 0 .4 1 3 .4 1 8 .7 4 4 .4 9 7 .6 9 6 .6 5 4 .9 3 3 .1 6 0 .9 1 1 .61943-44 9 7 .2 9 6 .3 6 0 .4 1 1 .4 1 8 .7 4 4 .4 9 7 .8 9 6 .9 5 0 .7 3 0 .6 6 0 .4 1 1 .61944-45 9 7 .3 9 6 .3 5 5 .5 9 .4 1 8 .7 4 4 .4 9 8 .0 9 6 .9 4 7 .7 2 5 .5 5 9 .0 1 1 .61945-46 9 6 .9 9 5 .9 4 7 .8 7 .7 1 7 .0 4 3 .1 9 8 .0 9 6 .9 4 5 .6 2 1 .8 5 5 .7 9 .51946-47 95.3 9 4 .5 4 0 .3 6 .4 1 5 .0 3 9 .0 9 7 .2 9 6 .0 4 1 .8 1 7 .8 5 2 .4 7 .61947-48 9 2 .9 9 2 .0 3 3 .2 5 .4 1 3 .2 3 4 .8 9 5 .2 9 3 .6 3 5 .5 16.3 4 8 .2 7 .41948-49 9 0 .5 89 .5 2 8 .6 5 .1 1 1 .4 3 0 .6 9 3 .0 9 1 .2 2 9 .2 1 4 .8 4 4 .0 6 .8
SECOND M OLARS
1940-41 67 .3 6 6 .5 3 .5 1 .0 3 .8 9 .5 7 9 .2 7 7 .2 9 .5 2 .9 2 0 .7 2 .21941-42 6 4 .0 6 3 .3 2 .3 0 .8 3 .0 9 .5 7 9 .2 7 7 .2 7 .0 2 .2 1 8 .0 1 .51942-43 6 0 .7 6 0 .1 1 .1 0 .6 2 .2 8 .5 7 4 .7 7 3 .2 4 .5 1 .5 15.3 0 .51943-44 5 8 .6 5 7 .9 1 .3 0 .5 1 .8 6 .6 7 1 .1 6 9 .8 3 .0 0 .7 13.3 0 .71944-45 5 4 .7 5 3 .8 0 .8 0 .3 1 .3 4 .2 6 6 .7 6 5 .7 1 .5 0 .6 1 0 .0 0 .31945-46 5 0 .8 4 9 .7 0 .3 0 0 .8 2 .1 6 2 .3 6 1 .6 0 0 .5 6 .7 01946-47 53 .3 5 2 .8 0 .9 0 2 .3 3 .6 6 6 .4 6 6 .0 1 .9 1 .1 11 .8 01947-48 5 3 .4 5 2 .9 1 .3 1 .3 3 .1 5 .0 6 7 .0 6 6 .5 2 .8 1 .4 1 4 .7 0 .21948-49 5 3 .4 5 2 .9 1 .4 2 .0 2 .7 6 .4 6 8 .0 6 7 .7 3 .0 1 .6 1 4 .9 0 .2
1 Rates are percentages DF (decayed or filled) except for first molars. For the latter teeth the rates include extractions, see footnote 5.
* Buccal and lingual rates are omitted for bicuspids because they were negligible in all years.

502ences in post-eruptive age, as well as in morphology, should be considered in such comparisons.
For the first molars, the percentages of carious surfaces are based on the total numbers of teeth including extractions and each specific-surface rate includes an estimated percentage of the extracted teeth.5 For the other teeth, rates are percentages DF ( decayed or filled ); the numbers of extractions omitted were too small to affect the rates appreciably.
Specific-Surface Caries Rates for First M olars. The occlusal surfaces far outrank all others in the level of caries accumulation in both upper and lower first molars and, at age 13 years, the rates were near saturation for most of the period.However, for the other surfaces of each molar there is a wide variation in rates. Mesial rates tend to be relatively high, especially in the upper molar at the beginning of the study, when 60 per cent of the mesial surfaces were affected. In
5 It was assumed that the occlusal surface was carious in all extracted first molars and that other surfaces were carious in the same proportions as in non-extracted teeth having both occlusal and other surface caries at the beginning of the study.
The Milbank Memorial Fund Quarterly
Fig. 4. Caries rates for specific surfaces of upper and lower first permanent molars of 13-year-old village children, 1941 to 1949.

503the lower tooth, buccal rates were even higher than mesial. The lowest values are provided by the distal surfaces of the upper teeth and by the lingual surfaces of the lower. The same interchange in order of lingual and buccal caries in the upper and lower first molars noted for the 7-year-old children is apparent also for children aged 13, with the lingual rate higher than the buccal in the upper molars and the buccal rate much higher than the lingual in the lower molars.
Caries rates for corresponding specific surfaces of the upper and lower first molars in 13-year-old children are compared in Fig. 4. It is apparent that the any surface rates as well as the occlusal rates were nearly the same in the upper and lower molars, rates for the lower being slightly higher. This is true during the total period 1941-1949. At age 7, the differences were substantially greater, indicating that, with increasing age and with values near 100 per cent, upper and lower occlusal rates tend to become indistinguishable. Mesial rates were higher in the upper molar from 1941 to 1946 and thereafter the rates for upper and lower molars were about the same. Distal rates were two and one-half times higher in the lower than in the upper molar in the early period but the differences decreased somewhat during the years after 1944. Rates for the buccal surface were nearly four times higher for the lower than for the upper molar during the whole period; and rates for lingual surfaces show differences of the same magnitude, but are higher for the upper tooth.
During this nine-year period, trends in the caries rates for different surfaces of the first molars obviously were quite dissimilar. Occlusal rates for both the upper and lower molars remained relatively unchanged at 95 per cent or higher until 1947 and the minimum rates in 1949 were only 5 or 6 per cent lower. These occlusal rates are closely equivalent to the any surface rates, that is, the tooth DMF rates which must be at least as high as the highest rate for any one of the specific surfaces. Thus, for these 13-year-old children, the DMF tooth rates represent occlusal values almost entirely and fail to reveal
Teeth of Norwegian School Children: IV

large changes in rates for other surfaces. The changes in other specific-surface caries rates for the first molars fall roughly into the following pattern: Mesial and distal curves show the earliest and sharpest declines from the 1941 levels; buccal and lingual reductions are more delayed and less pronounced. The largest actual reductions are shown by the mesial rates which decreased by 32 per cent for the upper and 28 per cent for the lower molars. The maximum percentage reductions are found for the distal rates—62 per cent for the upper, 58 per cent for the lower. Reductions in the mesial rates were on the order of 50 per cent relatively; and those in the buccal and lingual rates were much smaller.
Although reductions in specific-surface rates for first molars relative to the 1940-1941 values occurred both at ages 7 and 13 years, the general pattern of change during the nine-year period is quite different. The curves at age 7 (Fig. 1) tend to be more or less saddle-shaped, pointing to an increase in caries near the end of the period. At age 13, no upturns are noted, and the reductions generally begin later.
Specific-Surface Caries Rates for Second Molars. The permanent second molars of 13-year-old children are generally at a relatively early mouth-exposure stage and one might expect a rather light caries accumulation. As can be seen readily in Fig. 3, the any surface rates for the second molars of the 13- year-old village children are usually as great as or greater than corresponding rates for all other permanent teeth except the first molars. However, this high level of DF rates for second molars is largely a reflection of the high occlusal involment, other surfaces being much less affected.
The intradental pattern of surface caries in both the upper and lower second molars of the 13-year-olds may be compared with that shown earlier for the first molars of the 7-year-olds. Although the populations are different and the post-eruptive ages not quite the same, the strong morphological similarities in the two types of molars appear to be reflected in the relative order of surface caries within each tooth. Thus, in the upper
504 The Milbank Memorial Fund Quarterly
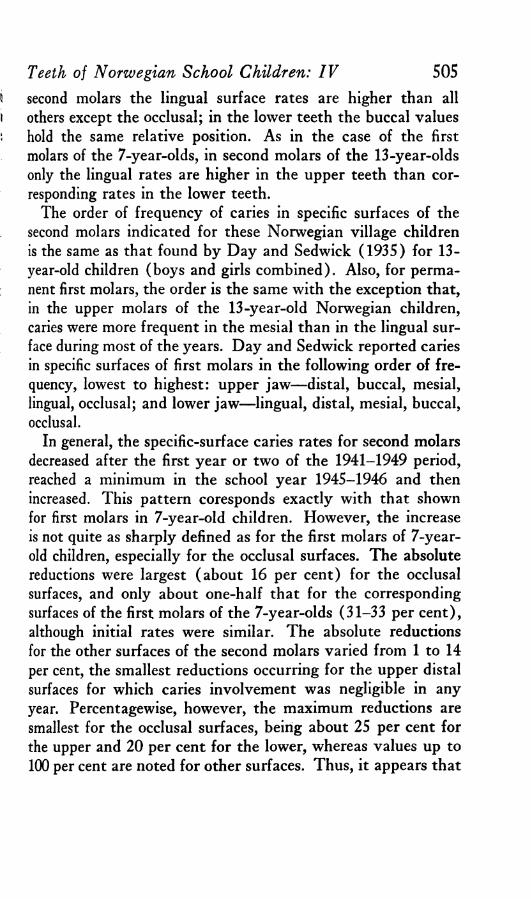
second molars the lingual surface rates are higher than all others except the occlusal; in the lower teeth the buccal values hold the same relative position. As in the case of the first molars of the 7-year-olds, in second molars of the 13-year-olds only the lingual rates are higher in the upper teeth than corresponding rates in the lower teeth.
The order of frequency of caries in specific surfaces of the second molars indicated for these Norwegian village children is the same as that found by Day and Sedwick (1935) for 13- year-old children (boys and girls combined). Also, for permanent first molars, the order is the same with the exception that, in the upper molars of the 13-year-old Norwegian children, caries were more frequent in the mesial than in the lingual surface during most of the years. Day and Sedwick reported caries in specific surfaces of first molars in the following order of frequency, lowest to highest: upper jaw—distal, buccal, mesial, lingual, occlusal; and lower jaw—lingual, distal, mesial, buccal, occlusal.
In general, the specific-surface caries rates for second molars decreased after the first year or two of the 1941-1949 period, reached a minimum in the school year 1945-1946 and then increased. This pattern coresponds exactly with that shown for first molars in 7-year-old children. However, the increase is not quite as sharply defined as for the first molars of 7-year- old children, especially for the occlusal surfaces. The absolute reductions were largest (about 16 per cent) for the occlusal surfaces, and only about one-half that for the corresponding surfaces of the first molars of the 7-year-olds (31-33 per cent), although initial rates were similar. The absolute reductions for the other surfaces of the second molars varied from 1 to 14 per cent, the smallest reductions occurring for the upper distal surfaces for which caries involvement was negligible in any year. Percentagewise, however, the maximum reductions are smallest for the occlusal surfaces, being about 25 per cent for the upper and 20 per cent for the lower, whereas values up to 100 per cent are noted for other surfaces. Thus, it appears that
Teeth of Norwegian School Children: IV 505

for both the first molars of the 7-year-olds and the second molars of the 13-year-olds the absolute decreases varied roughly according to the order of the specific-surface rates within the given tooth while maximum decreases percentagewise were smaller for the high-caries surfaces than for the low-caries surfaces.
Specific-Surface Caries Rates for the Permanent Incisors. There are large differences in the caries rates of upper and lower incisors, the latter pair having much less caries. However, while the tooth DF rates for adjacent incisors in the same jaw were at about the same levels and show similar trends over the period studied, the caries accumulation in the various surfaces appears to be different within each tooth, as may be seen in Fig. 3.
Of special interest are the patterns of caries in the different surfaces of the upper incisors. In the upper central incisor, distal surface rates are consistently higher than the mesial, the lower frequency in the latter surface being accounted for most probably by the diastema in the middle line of the upper jaw. The caries preventive effect of diastema on proximal surfaces has been clearly shown by Welander (1955) and Engh (1956). In the adjacent lateral incisors, mesial rates are far higher than distal, the low level of the latter being mainly attributable to the low caries rate of both the deciduous and the permanent cuspids. A comparison of the rates for the contacting surfaces of the upper incisors— distal central with mesial lateral—shows that they are almost identical in each year. The similarity of these rates at age 13 and also at age 8 years indicates that these surfaces acquire clinical caries at about the same time.
A decrease in caries rates for most surfaces of the upper incisors of the 13-year-old children began in the third year of the study, 1942-1943, and continued into 1947-1948, but in 1948— 1949 the rates level off or rise slightly.6 In general, surfaces
6 For these smoothed annual rates, described in the section on method, the year in which the lowest rate was recorded has been acceptd as the low point of the nine years. Considerable variation in rates can be attributed to population sampling and
(Continued on page 507)
506 The Milbank Memorial Fund Quarterly

with the highest caries rates show the smallest percentage reductions, as noted for other teeth. One notable exception to this relationship between caries level and percentage reduction, is the small decline in caries rates for the lingual surface of upper lateral incisors. For this surface, only a 30 per cent decrease is shown, compared with a 70 per cent decrease in the distal surface rates, although in 1941 the rates were 17 and 22, respectively, for the lingual and distal surfaces.
The intradental patterns of caries accumulation are somewhat different for the lower and upper incisors. In the lower central incisors, mesial and distal rates were almost equal, with the distal tending to be very slightly lower. (A diastema in the middle line in the lower jaw is very rare.) However, in the adjacent lower lateral incisors, caries rates for the mesial surface were highest and nearly the same as the distal rates in central incisors; and rates for the distal surface were much lower. A similar pattern was noted for the upper lateral incisors. The decrease in the mesial and distal rates for both lower incisors approximated 80 per cent and, at the end of the period, the rates were only 2 or 4 per cent. Buccal and lingual surfaces of the lower incisors had negligible rates, 1 per cent or less throughout the nine years.
The big differences between upper and lower incisors in the caries rates for corresponding surfaces are portrayed clearly in Fig. 5. For every surface, rates are much higher in the upper tooth than in the corresponding lower tooth surface during the entire period except rates for the buccal surfaces which at the end of the period had declined to the same very low level that was characteristic of buccal surfaces in the lower incisors throughout the period. In general, the high rates for the upper teeth began to decrease in 1942 or 1943 and a downward trend continued to 1947 or 1948, whereas for surfaces of the lower teeth, rates declined very little until after 1945 when there was
other sources of error variation, and consequently the minimum used may not havediffered significantly from a previous or later year. Furthermore, when only one year, or even two years, followed the minimum, small increases in the rate do notfirmly establish a reversal of trend.
Teeth of Norwegian School Children: IV 507

508 The Milbank Memorial Fund Quarterly
Fig. 5. Caries rates, per cent D F, for specific surfaces of upper and lower incisors of 13-year-old village children, 1941 to 1949.
a sharp reduction into 1949. Percentagewise, decreases in caries rates were greater for the lower than for the upper incisors. (See Table 5.) However, relative changes in rates for distal surfaces of the lateral incisors were fairly similar during the nine-year period, and the maximum decrease was 70 per cent

for the upper and 77 per cent for the lower lateral incisor.Specific-Surface Caries Rates for Cuspids. The cuspids,
among the least caries susceptible in the permanent dentition, have appreciable involvement only in the mesial and distal surfaces. Rates for mesial surfaces were consistently higher than for the distal, a difference corresponding to the higher distal surface caries rate of the adjacent lateral incisor than the mesial surface caries rate of the adjacent first bicuspid. Trends for the specific-surface caries rates were very similar during
Teeth of Norwegian School Children: IV 509
Table 5. For 13-year-old children maximum reductions in caries rates forspecific surfaces of the permanent teeth, 1940-1941 to 1948-1949. Estimatedfrom smoothed annual rates; 1940-1941 rates the base year.
Tooth
Upper Jaw Lower Jaw
AnySurf. Occl. Mes. Dist. Buc. Ling. Any
Surf. Occl. Mes. Dist. Buc. Ling.
M AXIM UM ;P E R C E N T A G E R E D U C TIO N IN C A R IE S R A T E
Central Incisor 34 50 35 70 59 74 78 82 * •
Lateral Incisor 32 39 70 71 30 73 78 77 * *
Cuspid 85 87 95 * * 84 84 100 * •
First Bicuspid 54 53 88 78 • * 73 68 100 96 * *
Second Bicuspid 65 73 78 75 * * 74 76 92 80 * *
First Molar 7 6 53 62 39 31 5 5 49 58 28 41Second Molar 25 25 91 100 79 78 21 20 100 83 68 100
M AXIM UM A B S O L U T E R ED U C TIO N FRO M R A T E i n 1940-1941
Central Incisor 2 2 .3 2 1 .2 18.1 3 .5 3 .8 1 5 .9 1 3 .2 13.1 * *
Lateral Incisor 19.1 1 9 .8 1 5 .5 2 .7 5 .1 1 1 .9 11.1 5 .6 * *
Cuspid 14.3 1 0 .6 5 .6 * * 5 .2 3 .2 0 .9 * •
First Bicuspid 2 1 .5 1 5 .8 7 .4 1 8 .5 * * 1 1 .6 7 .1 2 .7 8 .1 * *
Second Bicuspid 2 7 .1 2 3 .6 19 .5 1 4 .8 * * 2 7 .5 2 2 .7 9 .7 13.1 • *
First Molar 6 .3 5 .7 3 1 .8 8 .2 7 .3 1 3 .8 5 .1 5 .3 2 8 .1 2 0 .8 17.3 4 .8Second Molar 16.5 1 6 .8 3 .2 1.0 3 .0 7 .4 1 6 .9 1 5 .6 9 .5 2 .4 1 4 .0 2 .2
C A R IE S R A T E (P E R C E N T ) IN 1940- 1941
Central Incisor 6 5 .0 4 2 .8 5 1 .0 5 .0 6 .5 2 1 .5 1 6 .9 1 6 .0 * *
Lateral Incisor 6 0 .4 5 1 .2 2 2 .1 3 .8 1 7 .2 1 6 .3 1 4 .2 7 .3 * *
Cuspid 1 6 .8 1 2 .2 5 .9 * * 6 .2 3 .8 0 .9 * *
First Bicuspid 3 9 .7 2 9 .6 8 .4 2 3 .8 * * 1 5 .9 1 0 .4 2 .7 8 .4 * *
Second Bicuspid 4 1 .8 3 2 .4 2 4 .9 1 9 .7 * * 3 7 .1 2 9 .9 1 0 .6 16 .3 * •
First Molar 9 6 .8 9 5 .2 6 0 .4 1 3 .3 1 8 .7 4 4 .4 9 8 .1 9 6 .5 5 7 .3 3 5 .6 6 1 .3 1 1 .6Second Molar 6 7 .3 6 6 .5 3 .5 1.0 3 .8 9 .5 7 9 .2 7 7 .2 9 .5 2 .9 2 0 .7 2 .2
* Omitted; rates too low to evaluate changes.

the nine-year period; and the percentage reductions were 84 per cent or more. In the upper cuspids, there is a tendency for rates to increase after 1946; in the lower cuspids, values become negligible near the end of the period.
Specific-Surface Caries Rates for Bicuspids. For the differentbicuspids it is evident in Fig. 3 and Table 4b that the trends for the tooth DF rates (any surface rates) roughly parallel the trends for caries rates for the principal surfaces affected— the occlusal, the mesial and the distal. Buccal and lingual caries rates were almost negligible and are not considered here. As in the case of the molars, the occlusal surface was the most highly affected in each type of bicuspids. However, for the bicuspids, differences between tooth DF rates and corresponding occlusal rates are considerable in contrast to very small differences for first and second molars, indicating that a considerable proportion of the carious bicuspids did not have occlusal involvement. Because of a difference in the fissure- system of bicuspids and molars, the occlusal surface of the bicuspids is less prone to caries.
Although the general level of any surface rates for the upper first and second bicuspids is about the same, the intradental mesial-distal patterns for the two types of teeth are different. For the upper first bicuspids, mesial rates are much lower than the distal, whereas for the upper second bicuspids, mesial and distal rates are fairly equal. The low caries rate in the mesial surface of first bicuspids corresponds with the low distal caries rate of adjacent cuspids already mentioned. In addition, the contact with its adjacent surface is different for the mesial and distal surfaces of first bicuspids and is less caries-disposing for the mesial surface. The contacting surfaces of the two upper bicuspids— distal surface of the first with mesial of the second bicuspid—have almost identical rates, indicating a probable similarity in individual rates of attack in the two surfaces as was noted for the correponding situation in the upper incisors.
The well-known difference in susceptibility of the pair of lower bicuspids appears to carry over into the rates for the
510 The Milbank Memorial Fund Quarterly

specific surfaces. The order of involvement is, however, about the same in each tooth, the occlusal being higher than the distal and the latter higher than the mesial. The lower caries rate of the mesial surface than of the distal for first bicuspids and the similarity of rates for the contacting surfaces of the two bicuspids may be explained in the same way as for the maxillary bicuspids. The differences in occlusal rates are attributed to the differences in occlusal grooves in these two teeth.
For all surfaces of the bicuspids, reductions in caries rates had occurred by 1942-1943 or before, and a marked downward trend continued to 1946 or 1947. Thereafter, the rates for most surfaces increased. The largest absolute reductions in rates were 24 and 23 per cent for the occlusal surfaces of the upper and lower second bicuspids, respectively; and about 19 per cent for the adjacent distal and mesial surfaces of the two upper bicuspids. The smallest reductions were for the surfaces of the lower first bicuspids, being only about 3 per cent for mesial surfaces.
Percentage reductions tended to follow the usual pattern and were somewhat larger for surfaces with low caries involvement than for those with rates at higher levels for the same tooth. However, variations in percentage reduction were not very large for surfaces of the second bicuspids, 73 to 78 per cent among upper and 76 to 92 per cent among lower surfaces (see Table 5). Furthermore, the percentage reductions for occlusal surfaces of the four bicuspids did not vary in relation to initial caries rates. Thus, for upper first bicuspids, the maximum percentage reduction was 53 per cent compared with 73 and 76 per cent for occlusal surfaces of the second bicuspids, although all had approximately the same initial caries rate, and the maximum reduction was 68 per cent for the occlusal surface of lower first bicuspids which had much less caries involvement.
The differences in specific-surface caries rates between the upper and the lower bicuspids are demonstrated more clearly in Fig. 6. In the first bicuspids the rates for the upper tooth are more than twice as high as those for the lower one. Rates
Teeth of Norwegian School Children: IV 511

for the mesial surface of the upper second bicuspid are also more than double those for the lower one, whereas the rates for the other surfaces of this tooth do not show the same big differences. The cause of the bigger difference between caries rates for mesial surfaces than for other surfaces of upper and lower second bicuspids may be found in the anatomy of the contacting distal surfaces of the first bicuspids. The distal surface of the lower first bicuspid has a typical convex form whereas the corresponding surface of the upper first bicuspid is flatter and thus gives a condition more conducive to plaque formation.Throughout the nine- year period, the trends for specific-surface caries rates for upper and lower first bicuspid were very similar. A corresponding parallelism is found for second bicuspids except that rates for occlusal and distal surfaces of the lower teeth were a minimum in 1945-1946 and corresponding rates for the upper teeth continued to decrease until 1946-1947.
512 The Milbank Memorial Fund Quarterly
Summary D iscussion of Specific-Surface Caries Rates, 1940-1941 to 1948-1949
The foregoing analysis of caries rates for specific surfaces of the different permanent teeth of younger and older school children indicates several quite consistent patterns that support some general conclusions concerning intradental differences in surface involvement and concerning the effect of war conditions on the different permanent teeth.
First, it may be noted that the general differential involvement of specific surfaces of each tooth for children of a given age persisted with very few exceptions throughout the period. In other words, for most of the teeth there was no significant shift in order of rates, although the amount of difference among surfaces of a specific tooth did change and in some teeth, caries rates for some surfaces became zero or too low to indicate any significant surface difference. The outstanding shifts in the order of surface involvement occurred in the upper teeth of 13-year-old children as follows: (1 ) in the lateral incisors, caries rates for the lingual surface were lower initially than for distal surfaces but were higher after 1944 because there was almost no decrease in lingual caries; (2 ) in first molars, lingual rates were considerably lower than mesial rates until 1945, and thereafter were nearly equal; and (3) in the second bicuspids, distal rates were somewhat lower than mesial rates initially, but were equal in 1944 and later years. The shift in rank of the lingual surface of upper first molars and of the distal surface of second bicuspids is the result of relatively greater changes in caries in the mesial surface of these teeth. The pit in the lingual surface of upper lateral incisors already has been mentioned as a factor contributing to the small decrease in caries.
The comparative level of caries in the different surfaces of each tooth need not be described again. It is shown clearly in Figures 1, 2 and 3. For every tooth with an occlusal surface, this surface had the maximum caries rate. In the molars, rates for the occlusal surface were approximately equal to the tooth
Teeth of Norwegian School Children: IV 513

DF rate (any surface DF) since it was rare for any other surface to be carious without occlusal involvement. In the case of the cuspids and both incisors, except upper central incisors, the mesial surface had the highest caries rate, and the distal rate ranked second (see previous paragraph for shift in order in upper lateral incisor). In upper central incisors, the distal surface rates were higher than mesial rates. Buccal and lingual surfaces had quite low caries rates in all the teeth with the exception of the molars and of the lingual surface in upper lateral incisors. In the upper molars, the caries rate in the lingual surface was second only to the occlusal rate for first molars at age 7 and second molars at age 13; and ranked third for first molars at age 13 except at the end of the period when it was second and slightly higher than the mesial surface. In the lower molars, caries occurred in the buccal surface more frequently than in any surface except the occlusal.
The amount of decrease in caries and the percentage reduction from the earliest available rate (1940-1941) varied widely for different surfaces in the same tooth and for the same surfaces of different teeth, although some decrease in caries was recorded within the nine-year period in every surface of each tooth. There were also differences in the year in which a downward trend became evident and the speed with which it progressed. These differences in trends are associated with two factors; first, the duration of mouth exposure of the tooth at time of examination, and second, the degree of susceptibility of the specific surface.
The general pattern of the trend was very similar for teeth which had had a fairly comparable period of mouth exposure. The teeth reported on here may be classified in two groups: Group I, teeth with short exposure at examination, includingfirst molars at age 7, incisors at age 8, second molars, cuspids and bicuspids at age 13 years; and Group II, teeth with longexposure, including first molars and incisors at age 13 years.
For teeth in Group I, the annual caries rates usually show some decrease beginning in 1942 and reach a low level in 1945
514 The MUbank Memorial Fund Quarterly

(incisors) or 1946 (all others except upper second bicuspids which were at a minimum in 1947). In the following years, an increase occurred. The slope of the curves for specific surfaces usually is greatest for the surface having the highest rate; that is, for the surface most susceptible to caries. However, the larger absolute reduction in the caries rate for the most susceptible surface of a tooth represents, as a rule, a smaller proportional reduction than that occurring in the other surfaces. For surfaces with very low susceptibility, the caries rates became negligible and generally increased little or not at all at the end of the period.
The overall effect on the permanent teeth in Group I of changes in caries in the specific surfaces is described in Table 6 by the average number of carious surfaces per tooth with any caries.7 An improvement in the carious condition of the dentition may be measured by a reduction in the frequency of multiple carious surfaces as well as by a reduction in the tooth DF rates. For the molars, the very susceptible occlusal surface largely determines the tooth DF rates, but less frequent involvement of the other surfaces of the molars is of great importance in preserving the tooth. For 7-year-old children, the average number of DF surfaces for lower first molars having any caries was 1.57 in 1941 and had decreased to 1.23 in 1946 as a result of a greater percentage decrease in all other surfaces (70 per cent) than in occlusal surfaces (43 per cent). A similar reduction in the number of carious surfaces per DF tooth is shown in Table 6 for the upper first molars, and also for second molars and bicuspids of 13-year-old children. For all these teeth, there is a striking similarity in the percentage reduction of caries rates for all surfaces exclusive of the occlusal; for the upper teeth, the reduction ranged from 73 to 82 per cent, and for the lower teeth from 70 to 87 per cent. The reduction was more variable for occlusal surfaces, being as low as 25 and 20 per cent in upper and lower second molars and as high as 73
7 Since the cuspids had a low tooth D F rate and multiple carious surfaces were infrequent even in 1941, the number of carious surfaces per tooth are not shown in Table 6.
Teeth of Norwegian School Children: IV 515

and 76 per cent in second bicuspids of 13-year-old children. The second bicuspids, which had the highest average number of DF surfaces per DF tooth, had the greatest decrease in the averages; for the upper tooth, the average decreased from 1.89
Table 6. Average number of carious surfaces per D F tooth; total carious surfaces for incisors, caries rates for occlusal surfaces and cumulated rates for other surfaces of permanent molars and bicuspids in 1940-1941, in year with lowest tooth DF rate, and in 1948-1949 and percentage change in rates from first year.
516 The Milbank Memorial Fund Quarterly
Specific Toots, Ace asd Y ear1
47rra& |aw Lowes JaW
DF Surfaces per 100 Teeth
Per Cent Decrease from 1941 Av. No., of
DF Surf, per DF Tooth
DF Surfaces per 100 Teeth
Per Cent Decrease from 1911 Av.N<
DF Si PertToolOrel. All Surf.
Esc. Occl. Occl. All Surf. Exc. Occl. Occl. All Surf,
Exc. Occl. Occl. Alt Surf Exc.Ocd»
Croup I — Short ExposureA ge 7: F irst M otors
1941 67.5 29.1 1.42 76.2 46.7 is:1946 36.8 8.0 45 73 1.18 43.4 14.0 43 70 1.21949 47.6 19.0 30 35 1.40 54.2 26.3 29 44. 1.4
A g e 8: Central In cisors1941 12.4 1.20 7.2 U1945 3.5 72 1.21 1.5 79 1.11949 8.3 33 1.28 0.8 89 1.8
Lateral Incisors1941 13.5 1.25 5.1 1.21945 3.3 76 1.10 0 1001949 K).2 24 1.23 0 100
A i t 13 ; Second M otors1941 66.5 17.8 1.25 77.2 35.3 1.41946 49.7 3.2 25 82 1.04 61.6 7.2 20 80 It1949 52.9 12.5 20 30 1.22 67.7 19.7 12 44 M
Second Bicuspids1941 32.4 46.5 1.89 29.9 29.8 1.61947,1946 8.8 11.5 73 75 1.38 7.2 4.5 76 85 1.21949 18.8 28.8 42 38 1.72 15.4 13.4 48 55 1.1
First Bicuspids1941 29.6 33.5 1.59 10.4 13.0 1.41946 16.7 8.1 44 76 1.36 3.3 1.7 68 87 M1949 15.5 16.9 48 50 1.49 5.8 3.0 44 77 1.1
Croup I I — Long ExposureA ge rj? First M olars*
1941 95.2 136.8 2.40 96.5 165.8 u1946 95.9 115.6 • 1$ 2.1i 96.9 132.6 • 20 2J1949* 89.5 75.7 6 45 1.83 91.1 94.# 5 43 2.C
Central Incisors1941 105.3 1.62 34.0 1.!1946 67.8 36 1.45 22.6 34 M1948,1949* 60.3 43 1.41 8.0 76 1.1
Lateral Incisors1941 94.3 1.56 22.8 1.11946 63.4 33 1.36 11.6 49 1.11948. 1949* 51.2 46 1.24 6.7 71 1.3
1 When two years are listed, the first is the year for the minimum rate in the upper jaw and the second year applies to the lower j aw.
2 Rates for first molars at age 13 are DMF rates; adjustment for extractions is explained on p. 502.3 Year for lowest tooth DF rate (any surface carious), 1946 shown for comparison with teeth in Group I.* Change less than 1 per cent.

to 1.38 and for the lower, it decreased from 1.61 to 1.22. In the second molars, especially the upper teeth, multiple surfaces were carious less frequently than for any other tooth in Group I except the incisors, both at the beginning of the period and in the year with the minimum DF tooth rates. In the latter year, surfaces other than the occlusal in second molars were rarely affected with caries although the DF rates for occlusal surfaces had decreased relatively little. At age 13 years, the second molars are at an early stage of eruption and a large percentage of these teeth has only the occlusal surface exposed whereas the second bicuspids usually have the “ normal” clinical crown exposed.
It is of interest that when caries rates increased after the War, the increase was as great or greater for other surfaces than for occlusal surfaces in the first and second molars and in second bicuspids, and the number of carious surfaces per DF tooth became nearly equal to the average number in 1941 for some of the teeth. Thus, the factors conducive to caries in the post-war years were causing a spread of caries to other surfaces of affected teeth as much or more than they were increasing the incidence of caries in the occlusal surfaces, or in any single susceptible surface.
The small increase at the end of the period in caries rates for occlusal surfaces of second molars of 13-year-old children has been noted previously. For these teeth, there was a much greater increase in other carious surfaces, and a considerable rise in the number of DF surfaces per carious tooth. Mouth exposure time for many of the second molars, especially the upper molars, has been only a few months at age 13 years (about 50 per cent of upper molars were erupted at age 12 and 75 to 80 per cent at age 13). The less favorable oral environment of the post-war years apparently had not speeded up the rate of developing caries in the susceptible occlusal surface but had affected the accumulation of caries in “ other” surfaces, presumably in molars having relatively long mouth exposure.
In the incisors, there is a slow accumulation of caries, and
Teeth of Norwegian School Children: IV 517

at age 8, caries rates for the specific surfaces are so low that small changes in the number of surfaces with caries are not significant. In the early years, the average number of DF surfaces per DF tooth varied from 1.20 to 1.25 for the four incisors. A sharp decrease in the tooth DF rates during the War and an increase in the post-war years for upper incisors was not accompanied by significant changes in these ratios of surfaces per tooth.
Teeth in Group II, first molars and incisors of children aged 13 years, differed from those in Group I in the trends for caries rates during the nine-year period. A real decrease in rates began only in the third year or later, as late as 1946-1947 in the case of first molars. For most surfaces of these teeth, the downward trend continued into 1948-1949; for a few, there is a tendency for the rate to increase slightly in the last year.
What is the explanation for this principal difference in the two groups? One factor of importance is the oral environment at the time the tooth erupted. A second factor is the level of caries already present at the beginning of the period.
In an earlier report on this study (Toverud, 1957 III) it was pointed out that the oral environment during the first post- eruptive period is a decisive factor affecting the susceptibility of the tooth to caries.
The teeth in Group I are young teeth having been in contact with the oral environment for one to three years, whereas those in Group II have had a mouth exposure time of five to seven years. Most of the teeth in Group I examined in 1942 erupted after the rationing of food—particularly of the refined carbohydrates—had started, and thus erupted into an environment less harmful to the teeth than did the teeth examined in 1941. The environment continued to improve as a result of the restricted diet as long as the war lasted. The environment of the teeth not only comprises the destructive factors, carbohydrates and bacteria, but also protective forces through saliva. The latter had better opportunity for action during the period of restricted intake of refined carbohydrates. The condition in
518 The Milbank Memorial Fund Quarterly

the mouth was more favorable for the very important maturation of the enamel soon after eruption. This factor is no doubt the cause of the lapse of one to three years from the war’s end to the rise in the caries rates. But the teeth examined in 1947- 1949 which had erupted after the war, did not have the same post-eruptive maturation condition. These young teeth, therefore, responded quickly to an increasingly unfavorable environment.
Teeth of the second group with a mouth exposure time of five to seven years, of course, had accumulated different amounts of caries at the time of examination. At nine years of age children examined in 1940-1941 had caries in more than 90 per cent of occlusal surfaces of first molars. Consequently, nearly all first molars in 13-year-old children examined from 1941 to 1945 or 1946 had occlusal surface caries when the rationing started, and no decline in occlusal rates could be expected during these years. Also, since occlusal surface rates are nearly equal to the any surface rates, i.e. DMF tooth rates, the latter could not decline. However, these rates show a downward trend for 1947 and the two following years. In lingual and buccal surfaces, caries rates continued at a constant level until 1945 and then decreased rather sharply, as shown in Fig. 3. An earlier reduction in caries is shown for mesial and distalsurfaces.
As shown in Table 6, the accumulation of caries in surfaces other than occlusal had decreased by 1946 and a reduction of 15 per cent is shown for upper first molars and 20 per cent for lower first molars, although no change in occlusal caries had occurred. With a reduction in the number of carious surfaces, there was less destruction of first molars at the end of the war period, and this type of improvement increased up to 1949.
For incisors of 13-year-old children, the sharp downward trend in caries rates for the different surfaces began in 1943 or 1944, except for lingual surfaces of upper lateral incisors. Prevalence of caries in these teeth increases gradually with increas-
Teeth of Norwegian School Children: IV 519

ing post-eruptive age and the beneficial oral environment during the war years slowed the rate of accumulation of caries in teeth that had erupted before rationing. However, from 1941 to 1946 the reduction in carious surfaces was 36 and 33 per cent for upper central and upper lateral incisors, respectively, and was much less than for the younger teeth in Group I, the reduction for the same teeth being 72 and 76 per cent at age 8 years.
The continuous post-war decrease or leveling off of DF rates for first molars and incisors of 13-year-old children does not indicate that an increase in the rate of acquiring caries had not occurred in that part of the post-eruptive period that followed the war years. The teeth examined in 1948 and 1949 had erupted during the war years when, as has been pointed out, very little caries was accumulated in the first two or three post- eruptive years. Even a fairly large increment in later years could occur without increasing the caries prevalence at age 13 years above that for the preceding school year. Changes in the increments in caries in specific surfaces between two ages within different time periods are described in the next section.
T r e n d s i n I n c r e m e n t s o f C a r i e s i n S p e c i f i c S u r f a c e s of
P e r m a n e n t F i r s t M o l a r s a n d I n c i s o r s
The increment of caries within a specific age interval affords a measure of caries activity which relates to a fairly constant post-eruptive age of a specific tooth and to a definite time period, that is, to the specific years in which the age interval occurred. Prevalence rates, on the other hand, are a measure of the accumulated incidence of caries during the total post- eruptive exposure of a tooth, and, if this exposure has been a number of years, the rates may not reveal changes in the age pattern of incidence of caries during the post-eruption period. Ideally, the increment should be obtained from repeated examinations of the same children (cohort) at successive ages, and a series of cohorts should be followed through different time periods in order to study time changes in increments of caries. Observed variations in increments among different cohorts then
520 The Milbank Memorial Fund Quarterly

can be identified with definite time periods and be related to any changes in conditions that might have affected caries activity.
For the 12-year-old children in the combined village group, a study was made of the time trends in increments of caries during the age interval 8 to 12 years for specific surfaces of permanent first molars and incisors. These four-year increments are not obtained from true cohorts of children, since, as previously explained, not all the 8-year-old children were examined in later years and not all the 12-year-old children examined in 1944-1945 or later had been examined earlier at age 8 years. However, the caries rates for the two ages are believed to be representative of the village group in the year of examination. Increments for a shorter interval than four years would be desirable in order to associate changes with specific years during the war and early post-war years when conditions affecting oral environment underwent rapid change; but data were available for few children aged 9 to 11 years. As a result of the changing trends in caries rates at specific ages, the age patterns of accumulating caries from 8 to 12 years no doubt differed markedly for the various cohorts, and within a four-year interval both low and high age specific incidence rates may have occurred.
In order to present some data on increments of caries in teeth which erupted in the post-war period, examinations made in three of the villages in 1951-1952 and 1952-1953 have been utilized for this study,8 in addition to the examinations from the larger village group for the earlier period from 1941 to 1949. Data for the three villages, though not strictly comparable with that for earlier years, probably are fairly representative of the larger group. However, the caries rates for this smaller population are subject to much random variation.
Increments of Caries for First Molars. The annual rates for8 The three villages with examinations in 19S1-1952 and 1952-1953 contributed
one-half or more to the population of the total group in the earlier period 1941 to1949. The actual computed rates are used for 1952 and 1953, but smoothed annual rates are used for the earlier period.
Teeth of Norwegian School Children: IV 521
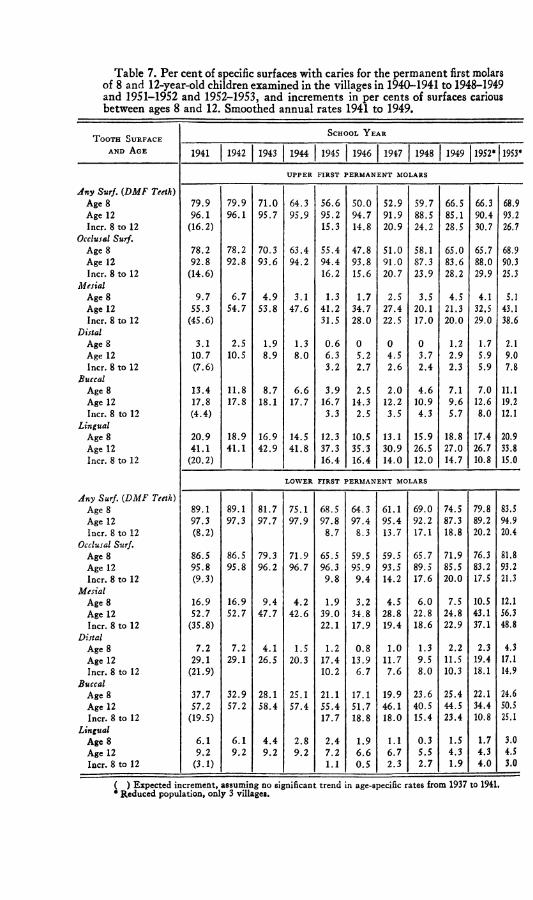
Table 7. Per cent of specific surfaces with caries for the permanent first molars of 8 and 12-year-old children examined in the villages in 1940-1941 to 1948-1949and 1951-1952 and 1952-1953, and increments in per cents of surfaces carious between ages 8 and 12. Smoothed annual rates 1941 to 1949.
T o o t h S u r f a c e
a n d A g e
S c h o o l Y e a r
1941 1942 1943 1944 1945 1946 | 1947 1948 1949 1952* 1953*
U P P E R FIR S T P ER M A N EN T MOLARS
Any Surf. (DMF Teeth)Age 8 79.9 79.9 71.0 64.3 56.6 50.0 52.9 59.7 66.5 66.3 68.9Age 12 96.1 96.1 95.7 95.9 95.2 94.7 91.9 88.5 85.1 90.4 93.2Incr. 8 to 12 (16.2) 15.3 14.8 20.9 24.2 28.5 30.7 26.7
Occlusal Surf.Age 8 78.2 78.2 70.3 63.4 55.4 47.8 51.0 58.1 65.0 65.7 68.9Age 12 92.8 92.8 93.6 94.2 94.4 93.8 91.0 87.3 83.6 88.0 90.3Incr. 8 to 12 (14.6) 16.2 15.6 20.7 23.9 28.2 29.9 25.3
MesialAge 8 9.7 6.7 4.9 3.1 1.3 1.7 2.5 3.5 4.5 4.1 5.1Age 12 55.3 54.7 53.8 47.6 41.2 34.7 27.4 20.1 21.3 32,5 43.1Incr. 8 to 12 (45.6) 31.5 28.0 22.5 17.0 20.0 29.0 38.6
DistalAge 8 3.1 2.5 1.9 1.3 0.6 0 0 0 1.2 1.7 2.1Age 12 10.7 10.5 8.9 8.0 6.3 5.2 4.5 3.7 2.9 5.9 9.0Incr. 8 to 12 (7.6) 3.2 2.7 2.6 2.4 2.3 5.9 7.8
BuccalAge 8 13.4 11.8 8.7 6.6 3.9 2.5 2.0 4.6 7.1 7.0 11.1Age 12 17.8 17.8 18.1 17.7 16.7 14.3 12.2 10.9 9.6 12.6 19.2Incr. 8 to 12 (4.4) 3.3 2.5 3.5 4.3 5.7 8.0 12.1
LingualAge 8 20.9 18.9 16.9 14.5 12.3 10.5 13.1 15.9 18.8 17.4 20.9Age 12 41.1 41.1 42.9 41.8 37.3 35.3 30.9 26.5 27.0 26.7 33.8Incr. 8 to 12 (20.2) 16.4 16.4 14.0 12.0 14.7 10.8 15.0
L O W E R F IR S T PER M A N EN T MOLARS
Any Surf. (DMF Teeth)Age 8 89.1 89.1 81.7 75.1 68.5 64.3 61.1 69.0 74.5 79.8 83.5Age 12 97.3 97.3 97.7 97.9 97.8 97.4 95.4 92.2 87.3 89.2 94.9Incr. 8 to 12 (8.2) 8.7 8.3 13.7 17.1 18.8 20.2 20.4
Occlusal Surf.Age 8 86.5 86.5 79.3 71.9 65.5 59.5 59.5 65.7 71.9 76.3 81.8Age 12 95.8 95.8 96.2 96.7 96.3 95.9 93.5 89.5 85.5 83.2 93.2Incr. 8 to 12 (9.3) 9.8 9.4 14.2 17.6 20.0 17.5 21.3
MesialAge 8 16.9 16.9 9.4 4.2 1.9 3.2 4.5 6.0 7.5 10.5 12.1Age 12 52.7 52.7 47.7 42.6 39.0 34.8 28.8 22.8 24.8 43.1 56.3Incr. 8 to 12 (35.8) 22.1 17.9 19.4 18.6 22.9 37.1 48.8
DistalAge 8 7.2 7.2 4.1 1.5 1.2 0.8 1.0 1.3 2.2 2.3 4.3Age 12 29.1 29.1 26.5 20.3 17.4 13.9 11.7 9.5 11.5 19.4 17.1Incr. 8 to 12 (21.9) 10.2 6.7 7.6 8.0 10.3 18.1 14.9
BuccalAge 8 37.7 32.9 28.1 25.1 21.1 17.1 19.9 23.6 25.4 22.1 24.6Age 12 57.2 57.2 58.4 57.4 55.4 51.7 46.1 40.5 44.5 34.4 50.5Incr. 8 to 12 (19.5) 17.7 18.8 18.0 15.4 23.4 10.8 25.1
LingualAge 8 6.1 6.1 4.4 2.8 2.4 1.9 1.1 0.3 1.5 1.7 3.0Age 12 9.2 9.2 9.2 9.2 7.2 6.6 6.7 5.5 4.3 4.3 4.5Incr. 8 to 12 (3.1) 1.1 0.5 2.3 2.7 1.9 4.0 3.0
( ) Expected increment, assuming no significant trend in age-specific rates from 1937 to 1941. * Reduced population, only 3 villages.
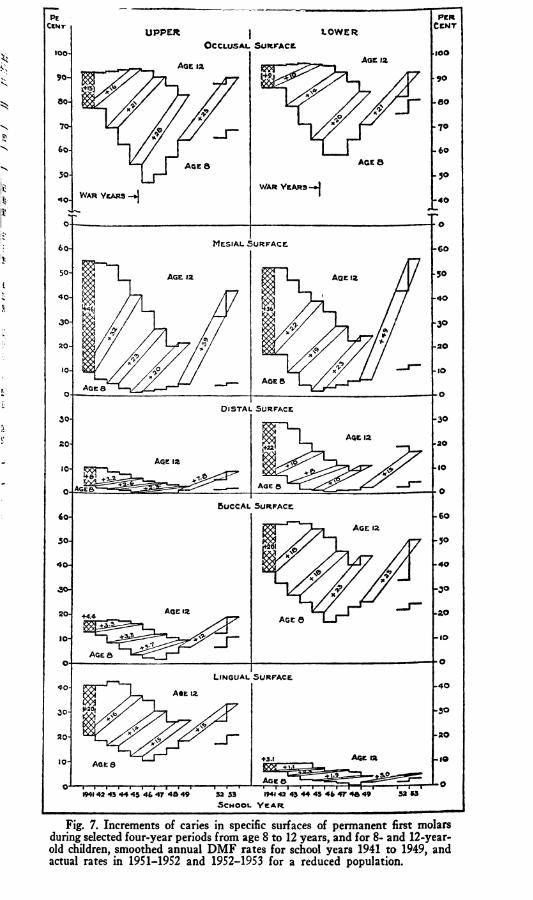
old children, smoothed annual D M F rates for school years 1941 to 1949, and actual rates in 1951-1952 and 1952-1953 for a reduced population.

caries in each surface of permanent first molars for 8-year-old and 12-year-old children are shown in Table 7 and Fig. 7. For each 8-year-old cohort, the increment of caries during the next four years, as estimated from the rate at age 12 in the school year four years later, is also given in Table 7. Increments for selected cohorts are indicated in Fig. 7 by lines connecting the rates for corresponding 8- and 12-year-old children. For comparison with the longitudinal increments, the difference between rates in 1941 for 8-year-old and 12-year-old children is shown for each tooth surface. This difference may be taken as the usual or “ expected” increment assuming no trend in age specific rates in the four years preceding 1940-1941. Data from school dental clinics do not indicate any appreciable changes in caries prevalence before the War. As noted in an earlier publication (Toverud, 1957, II), the number of DMF surfaces per 7-year-old child in Oslo was 6.7, 6.6, and 6.7 for the years 1938, 1939, and 1940.
Trends in the annual specific surface caries rates for children aged 8 and 12 years during the nine years from 1941 to 1949 are very nearly the same as the trends described for children aged 7 and 13. For the 8-year-old children, there was a sharp reduction in caries until 1945 or 1946, after which there was an increase. For 12-year-old children, the decrease in caries rates began later and continued until 1948 or 1949. The caries level at age 12 in any year is clearly the result of rapidly changing rates at age 8 and of changing increments between 8 and 12 years of age.
In the occlusal surfaces of both upper and lower molars, the increment for the 1941 and 1942 8-year-old cohorts was equal to or slightly greater than the expected increment and consequently the caries rate at age 12 showed no decrease in 1945 and 1946. For later cohorts, the increment is increasing but the increase is less than the decrease at 8 years of age and the occlusal caries rate at age 12 decreased in the post-war years. By 1953, the occlusal caries rate at age 12 had increased almost to the 1941 rate in part as a result of the increased rate for
524 The Milbank Memorial Fund Quarterly

8-year-old children examined in 1949 and in part as a result of a large four-year increment.
For mesial and distal surfaces of the first molars, the four- year increment of caries for the 1941 cohort was very much less than the expected increment and consequently the surface caries rates at age 12 were much lower in 1945 than in 1941. For successive cohorts of 8-year-old children including those examined in the school year 1944-1945 the increment to age 12 either continued to decrease or changed only slightly, and these increments combined with the low caries rates at age 8 produced a continued decrease in the rates for 12-year-old children up to 1948 or 1949. For the 1949 cohort, a sharp increase is shown for the increments of caries in these surfaces and a very high caries rate at age 12 in 1953 is indicated, as was noted for occlusal surfaces.
For buccal and lingual surfaces of upper and lower first molars, the increment of caries for the 1941 cohort was slightly less than the expected increment from age 8 to 12 years. Changes in increments of caries between age 8 and 12 years were generally small and the continued decrease in caries rates for these surfaces in first molars of 12-year-old children during the years from 1945 to 1949 was largely the result of the greatly reduced rates at age 8 during the war years. In 1949, caries rates in the buccal surfaces had increased considerably for 8- year-old children, and the increments in the next four years also increased, so that for 12-year-old children in 1953, the rate for the buccal surface was as high in upper molars and nearly as high in lower molars as in 1941. In the lingual surface of upper molars, caries rates increased for 8-year-old children in the post-war years, but the four-year increment remained constant. In the lower molars, lingual surface rates, which are very low even at age 12, became negligible for the 8-year-old children and remained so until 1949. The four-year increment of caries was 3 per cent for the 1949 cohort, the same as the increase from 8 to 12 years of age indicated by the 1941 examinations.
Changes in the increments of caries in the different surfaces
Teeth of Norwegian School Children: IV 525

during the war and post-war years followed several patterns which are clearly associated with levels of susceptibility of the surface as indicated by the caries rates at age 8 years and the accumulation of caries by age 12 in 1940-1941. For occlusal surfaces, rates were already about 80 per cent or higher for 8-year-old children in 1940-1941 and the few surfaces not affected became carious in the next four years at the prewar or expected rate. A rapid decrease in occlusal caries rates during the war years for 8-year-old children was not accompanied by any decrease in the increments; in fact there was some increase beginning with the cohort that was 12 years old in 1946-1947. A similar pattern is found for buccal surfaces in lower molars for which the caries rate at age 8 also was relatively high initially and decreased sharply during the war years. The continuous large decrease in caries rates among 8-year-old children for these highly susceptible surfaces left increasing percentages of caries-free surfaces to be exposed to the post-war environment during the age interval 8 to 12 years and consequently the caries incidence increased in this age period. A different trend is found for surfaces with a low caries rate at age 8 and a large expected increment in the four years to age 12, notably the mesial surfaces and lower distal surface. For these surfaces, a sharp reduction from the expected increment began during the war years and persisted for the immediate postwar period, 1945 to 1949. Only in the later period after 1949 was there an increased increment for the ages 8 to 12 years. Although caries rates in the distal surface of upper molars were much lower at age 8 and 12 years the pattern for increment changes is similar to that noted for the lower distal surface. Changes in increments were small for upper and lower lingual surfaces and for the upper buccal surface except that in the latter surface caries increased sharply in the 1949 to 1953 period.
In an earlier report (Toverud, 1957 III) it was noted that the increments of caries for the total surfaces of permanent first molars between ages 8 and 12 years, and also the incidence
526 The Milbank Memorial Fund Quarterly
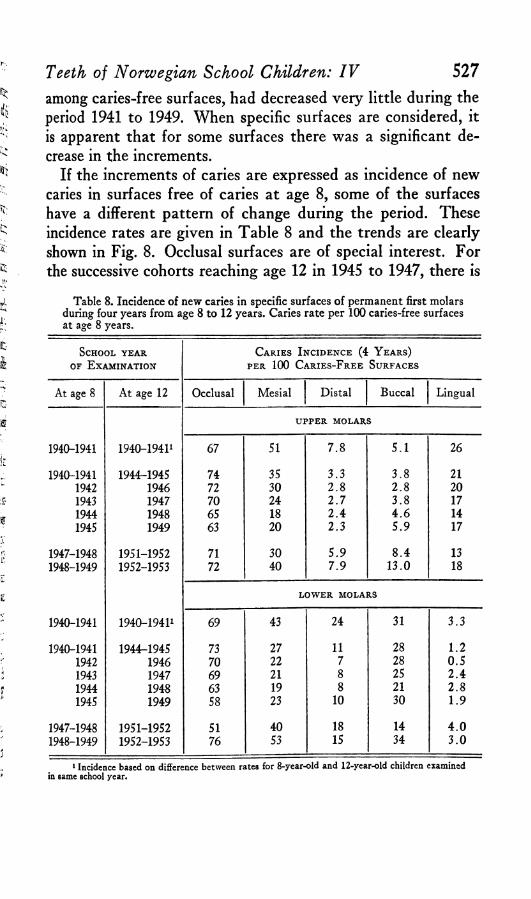
among caries-free surfaces, had decreased very little during the period 1941 to 1949. When specific surfaces are considered, it is apparent that for some surfaces there was a significant decrease in the increments.
If the increments of caries are expressed as incidence of new caries in surfaces free of caries at age 8, some of the surfaces have a different pattern of change during the period. These incidence rates are given in Table 8 and the trends are clearly shown in Fig. 8. Occlusal surfaces are of special interest. For the successive cohorts reaching age 12 in 1945 to 1947, there is
Teeth of Norwegian School Children: IV 527
Table 8. Incidence of new caries in specific surfaces of permanent first molars during four years from age 8 to 12 years. Caries rate per 100 caries-free surfaces at age 8 years.
School ye a r of E xam ination
C aries I ncidence (4 Y ears)per 100 C aries-F ree Surfaces
At age 8 At age 12 Occlusal Mesial Distal Buccal Lingual
UPPER MOLARS
1940-1941 1940—19411 67 51 7 .8 5 .1 26
1940-1941 1944-1945 74 35 3 .3 3 .8 211942 1946 72 30 2 .8 2 .8 201943 1947 70 24 2 .7 3 .8 171944 1948 65 18 2 .4 4 .6 141945 1949 63 20 2 .3 5 .9 17
1947-1948 1951-1952 71 30 5 .9 8 .4 131948-1949 1952-1953 72 40 7 .9 13 .0 18
LOWER MOLARS
1940-1941 1940—19411 69 43 24 31 3 .3
1940-1941 1944r-1945 73 27 11 28 1 .21942 1946 70 22 7 28 0 .51943 1947 69 21 8 25 2 .41944 1948 63 19 8 21 2 .81945 1949 58 23 10 30 1 .9
1947-1948 1951-1952 51 40 18 14 4 .01948-1949 1952-1953 76 53 15 34 3 .0
1 Incidence based on difference between rates for 8-year-old and 12-year-old children examined in same school year.

PerCent
70
60*
50
a slight decrease in incidence of caries for both upper and lower molars, and for those becoming age 12 in 1948 or 1949 the decrease is accelerated, especially for lower molars. Although the incidence in these latter years occurred during the post-war period, the rate remained relatively low for these teeth which erupted during the last years of the war. For children 8 years old in 1949, incidence of caries in occlusal surfaces increased to the prewar level or higher during the four years ending in 1953.
For surfaces other than occlusal, the four- year incidence of caries in caries-free surfaces does not differ very greatly from the absolute increment, since the accumulated prevalence at age 8 is not large. Incidence rates for the mesial and lingual surfaces of upper molars and for the mesial and buccal sur-
528 The Milbank Memorial Fund Quarterly
50
UPPER PIRST MOLARS
0 c ’0C --
M.
\
///
O.B. ^ 9
LOWER FIRST MOLARS
o e .
jn . t/
B./ to '/
L.
6
\ ---------J * ------------L. . i
1945 1944 1947 1940 1949 J9K 1950
S chool V ea r Ending th e In ter val b to 12 Y ear s
Fig. 8. For caries-free surfaces in permanent first molars of 8-year-old children, the incidence of caries in each surface in the four-year period to age 12 years. Expected incidence is estimated from rates in 1940-1941 for 8- and 12-year-old children.
faces of lower molars were at the lowest level for the four-year period 1944 to 1948; and in the next four-year period, these rates show an increase.
Increments of Caries for Incisors. Annual caries rates for

Table 9. Per cent of specific surfaces with caries for the permanent central incisors of 8- and 12-year-old children examined in the villages in 1940-1941 to1948-1949 and in 19S1-1952 and 1952-1953, and the increments in per cents ofsurfaces carious between ages 8 and 12. Smoothed annual rates, 1941 to 1949.
Teeth of Norwegian School Children: IV 529
Tooth Surface and Age
School Y ear
1941 1942 1943 1944 1945 1946 1947 1948 1949 1952* 1953*
U P P E R C E N T R A L IN CISO RS
Any Surf. (DF)Age 8 10.3 8.1 6.9 4.9 2.9 4.1 5.3 6.3 6.5 6.3 9.2Age 12 57.4 55.6 50.5 46.2 40.8 37.7 34.6 38.3 42.0 35.9 36.9Incr. 8 to 12 (47.1) 30.5 29.6 27.7 33.4 39.1 29.6 30.4
MesialAge 8 3.8 2.6 2.2 1.5 0.8 1.1 1.3 2.0 2.7 2.5 2.6Age 12 34.4 33.4 29.1 26.0 20.7 16.5 16.9 18.1 19.3 20.4 15.9Incr. 8 to 12 (30.6) 16.9 13.9 14.7 16.6 18.5 18.4 13.2
DistalAge 8 4.6 4.6 4.4 3.2 2.0 2.8 3.7 3.9 3.9 4.4 7.0Age 12 44.4 42.7 39.5 36.0 31.4 27.9 24.4 29.7 35.1 23.4 29.0Incr. 8 to 12 (39.8) 26.8 23.3 20.0 26.5 33.1 19.5 25.1
BuccalAge 8 2.5 2.1 1.2 0.8 0.4 0.9 1.1 1.3 1.1 0.6 1.3Age 12 4.4 4.0 3.0 2.7 2.5 2.3 1.8 1.3 0.8 2.4 0.6Incr. 8 to 12 (1.9) 0 0.2 0 .6 0.5 0.4 1.1 - 0 .5
LingualAge 8 1.5 0.9 0.5 0.3 0.3 0.7 0.7 0.8 0 .6 0 0.4Age 12 4.7 4.7 4.6 4.0 3.5 3.2 2.4 2.0 2.0 2.4 2.3Incr. 8 to 12 (3.2) 2.0 2.3 1.9 1.7 1.7 1.6 1.7
L O W E R C E N T R A L IN CISO RS1
Any Surf. (DF)Age 8 5.8 5.8 3.5 1.8 1.2 1.0 0.9 0.8 0.9 0 0.8Age 12 19.8 19.2 16.9 15.2 11.6 8.7 5.8 3.7 3.0 0.6 2.8Incr. 8 to 12 (14.0) 5.8 2.9 2.3 1.9 1.8 - 0 .2 1.9
MesialAge 8 4.1 3.3 2.3 1.5 0.8 0.7 0.5 0.5 0.3 0 0.8Age 12 15.5 15.5 12.7 11.6 8.1 6.1 3.8 2.3 0.8 0.6 0.6Incr. 8 to 12 (11.4) 4.0 2.8 1.5 0.8 0 0.1 0.3
DistalAge 8 2.1 2.1 1.4 0.7 0.5 0 .4 0 .4 0.4 0.5 0 0.4Age 12 13.8 12.8 11.4 10.0 7.7 5.5 3.6 2.3 1.0 0 2.3Incr. 8 to 12 (11.7) 5.6 3.4 2.2 1.6 0.5 - 0 .4 1.8
1 Buccal and lingual rates omitted.(, ) Expected increments, assuming no significant trend in age-specific rates from 1937 to 1911, * Reduced population, only 3 villages.

530Table 10. Per cent of specific surfaces with caries for the permanent lateral
incisors of 8- and 12-year-old children examined in the villages in 1940-1941 to 1948-1949 and in 1951-1952 and 1952-1953, and increments in per cents of surfaces carious between ages 8 and 12. Smoothed annual rates, 1941 to 1949.
The Milbank Memorial Fund Quarterly
T ooth SurfaceSchool Y ear
and Age1941 1942 1943 1944 1945 1946 1947 1948 1949 1952* 1953*
U P P E R L A T E R A L INCISOR
Any Surf. (DF)Age 8 10.8 10.8 8.4 5.7 3.0 5.6 7.8 8.3 8.3 8.7 13.8Age 12 55.9 51.7 48.8 45.5 43.1 37.7 32.3 38.0 43.8 30.5 39.9Incr. 8 to 12 (45.1) 32.3 26.9 23.9 32.3 40.8 22.2 31.6
MesialAge 8 7.6 7.6 6.1 4.1 2.0 4.4 6.1 6.7 6.7 6.7 10.1Age 12 42.8 41.0 37.8 34.7 31.6 28.4 25.2 30.3 35.4 22.6 29.5Incr. 8 to 12 (35.2) 24.0 20.8 19.1 26.2 33.4 15.9 22.8
DistalAge 8 0.6 0.6 0.8 0 .4 0 0 0.7 0 1.0 0 0.6Age 12 15.6 14.0 10.6 8.4 5.4 3.9 2.4 4.9 6.3 2.4 7.5Incr. 8 to 12 (15.0) 4.8 3.3 1.6 4.5 6.3 2.4 6.5
BuccalAge 8 1.8 1.1 0.7 0.3 0 0.4 0.9 0.9 1.1 1.0 0Age 12 3.4 3.4 3.0 2.4 1.9 1.4 0.9 1.9 2.4 1.8 1.2Incr. 8 to 12 (1.6) 0.1 0.3 0.2 1.6 2.4 0.9 0.1
LingualAge 8 3.5 2.7 1.9 1.5 1.1 1.5 1.5 1.4 1.4 1.9 3.8Age 12 16.8 16.8 15.3 15.2 15.5 13.5 10.1 11.3 11.3 7.9 12.7Incr. 8 to 12 (13.3) 12.0 10.8 8.2 9.8 10.2 6.5 11.3
L O W E R L A T E R A L INCISOR1
Any Surf. (DF)Age 8 4.2 3.2 2.3 1.2 0 0.5 0.5 0 0 0.7 0.5Age 12 14.4 14.4 12.6 10.9 7.6 6.1 4.5 3.1 1.7 0.6 2.3Incr. 8 to 12 (10.2) 3.4 2.9 2.2 1.9 1.7 0.6 2.3
MesialAge 8 3.4 2.2 1.5 0.7 0 0.5 0.5 0 0 0.7 0.5Age 12 12.9 12.8 11.4 9.7 6.9 5.1 3.4 2.3 1.2 0.6 1.7Incr. 8 to 12 (9.5) 3.5 2.9 1.9 1.6 1.2 0.6 1.7
DistalAge 8 1.1 0.7 0.4 0.1 0 0 0 0 0 0 0Age 12 6.0 4.7 3.5 2.5 1.3 1.1 1.1 0.7 0.3 0 1.1Incr. 8 to 12 (4.9) 0.2 0.4 0.7 0.6 0.3 0 1.1
1 Buccal and lingual rates omitted.( ) Expected increments, assuming no significant trend in age-specific rates from 1937 to 1941. • Reduced population, only 3 villages.

specific surfaces of the permanent incisors of the 8- and 12-year- old children and increments of caries for successive quasicohorts are shown in Tables 9 and 10 for central and lateral
Teeth o f N orw egian S chool C hildren : I V 531
Fig. 9. Increments of caries in specific surfaces of incisors during selected four-year periods from age 8 to 12 years, and for 8- and 12-year-old children, smoothed annual D F rates for school years 1940-1941 to 1948-1949, and actual rates in 1951-1952 and 1952-1953 for a reduced population.

incisors, respectively. Trends in the annual rates at the two ages and increments from age 8 to 12 years for selected cohorts are shown in Fig. 9 only for mesial and distal surfaces.
Most of the caries in incisors occur in the mesial and distal surfaces with the exception of upper lateral incisors in which the lingual surface is carious more often than the distal. At age 8, these teeth are relatively free of caries, and in 1941 specific surface rates were less than 5 per cent except for the mesial surface of upper lateral incisors (7.6 per cent). Consequently the caries rates at age 12 were largely determined by the accumulation of caries during the age period 8 to 12 years and trends in rates for children aged 12 years are very nearly the same as trends in increments for the war and post-war years. The patterns of change in the specific-surface rates at age 12 are similar to those previously discussed for the 13-year-old group, and, therefore, only the principal indications concerning changes in increments are mentioned here.
In the mesial and distal surfaces of both central and lateral incisors, the caries accumulated by age 12 had begun to decrease in the early war years and rates were somewhat lower in 1941-1942 or 1942-1943 than in 1940-1941. For the cohort of children 8 years old in 1941, the increments of caries in the four years to 1945 were very much less than the expected or estimated prewar increment for each surface. However, in the lingual surface of upper lateral incisors, the prevalence of caries at age 12 remained fairly constant through 1945, and decreased relatively little in the next two years.
During the early post-war years, the trends in the specific- surface caries rates, and increments, were different for the upper and lower incisors. For the upper teeth, which are much more susceptible to caries than the lower, caries rates at age 12 decreased until 1947 and then increased in 1948 and 1949; but rates for the lower incisors show a continuous decrease to 1949 when only 3 per cent of the teeth were carious. In 1947, caries rates at age 12 for distal surfaces of upper central incisors and for adjacent mesial surfaces of lateral incisors
532 T he M ilban k M em oria l F u n d Quarterly

indicate four-year increments of 20 and 19 per cent respectively, as against expected increments of 40 and 35 per cent. A similar reduction is shown for caries in the mesial surface of upper central incisors, and the increment to 1947 was 15 per cent compared to an expected 31 per cent. Increases in increments for children 12 years of age in 1948 and 1949 occurred in mesial and distal surfaces of both upper incisors. In the adjacent surfaces of upper lateral and central incisors, the caries increments had risen to 33 per cent in 1949; but for the mesial surface of central incisors and distal surface of lateral incisors, only small increases in the increments are shown. The increase for the lingual surface of upper lateral incisors also was very small.
In the two school years, 1951-1952 and 1952-1953, caries rates for the incisors show wide annual fluctuations, although examinations were made in the same three villages. However, the number of children examined each year was small and none of the differences between rates for the two years is statistically significant; that is, all observed differences had more than a five per cent chance of occurring on the basis of sampling alone. Therefore, an average rate for the two years may be considered representative of the prevalence of caries in this period. For both lower incisors, caries rates remained negligible at age 12. For upper incisors, at 8 years of age the DF tooth rates were somewhat higher than in 1948 and 1949. In the central incisors, a small increase is indicated only for the distal surface; but in the upper lateral incisors, rates for both the mesial and lingual surfaces were higher. For the three surfaces which show an increase at age 8, the caries prevalence in the later period was similar to that recorded in 1940 and 1941. For the children 12 years of age in 1952 and 1953, there is no indication that the prevalence of caries in any of the incisors had increased to levels above those noted for 1949 and both the rates and four-year increments continued to be less than those shown for 1940-1941.
The pattern of time changes in caries prevalence shown for
Teeth o f N orw egian S chool C hildren : I V 533

upper incisors of the 12-year-old children after the war differs from that previously described for the first molars. Whereas the DF rates for mesial and distal surfaces of upper incisors, and also the DF tooth rates, were at their lowest levels in the school year 1946-1947, increased in the next two years, and apparently leveled off in the later period, the corresponding rates for upper and lower first molars continued to decrease in 1948, remained near the same level in 1949, and then in the later period increased sharply. The total accumulation of caries in the occlusal surfaces of the molars at age 12 also decreased until the year 1949, and the incidence of caries-free surfaces between age 8 and 12 years was less for the period 1945 to 1949 than in any previous four-year period. This delay in the increase in caries in first molars as compared with the upper incisors most probably is the result of differences in mouth-exposure time during the war. The average age at eruption for first molars is 6 years, for upper central incisors 7 years and for upper lateral incisors 8 years. Thus, in 12-year- old children examined in 1948, first molars erupted in 1942, central incisors erupted in 1943, and lateral incisors erupted in 1944. In a previous report (Toverud, 1956) evidence of delayed eruption of most of the permanent teeth was found for the years after the three-year period 1941-1943. The upper incisors showed great delay in eruption in the period 1944̂ -1946; and for these teeth, about one-half year may be added to the eruption time. Consequently, the permanent first molars of children aged 12 in 1948 or 1949 had a much longer mouth- exposure time than the incisors during the war years when the intake of easily fermentable carbohydrates was low and oral conditions were favorable for maturation.
G e n e r a l D i s c u s s i o n
This report on caries in specific surfaces of permanent teeth of village school children in Norway has been concerned with three general questions: (1 ) occurrence of caries in specific surfaces of each tooth at an early post-eruptive time and, for
534 T h e M ilhank M em oria l F u nd Quarterly

first molars and incisors, after longer mouth exposure; (2 ) trends in specific surface rates for children at selected ages during the war and post-war years; and (3) changes in increments of caries in first molars and incisors between age 8 and 12 years for successive groups as a method of evaluating the effect of war and post-war conditions on caries prevalence.
In his studies on “The Occurrence of Dental Caries in the Permanent Dentition” Welander (1955) concludes: “ Proximal surfaces on the same tooth tend to have the same caries status,” and “The abutting teeth tend to have the same caries status.” The population studied by Welander consisted of conscripts. It would seem natural that these conditions change with age and the caries experience of these 13-year-old children shows many expections. From Fig. 3 it is clearly seen that the caries rates for the two proximal surfaces of a tooth may differ very much; note differences in the first molar, upper lateral incisor, upper first bicuspid and upper central incisor. Fig. 3 also illustrates the great tendency for contacting surfaces to have corresponding caries rates. Thus, in the upper jaw, rates are similar for: distal surface of central incisor and mesial surface of lateral incisor; distal surface of lateral incisor and mesial surface of cuspid; distal surface of cuspid and mesial surface of first bicuspid. Differences in the caries status of abutting teeth in this age group are shown for the cuspids which differ very much from their neighbors, the second bicuspids which differ from the first molars, and the lower second bicuspid which differs from the lower first bicuspid.
The rank of the specific teeth according to their DMF tooth rates also will differ with age during childhood and adolescence. Thus, the rank of the DMF tooth rates for these 13-year-old children does not conform with that of adults.
In an earlier report (Toverud, 1957 II and III) dealing with the changes in DMF tooth rates and DMF total surface rates for the permanent first molars it was shown that the younger teeth reacted earlier than the older teeth both as to decrease and to increase. This difference is demonstrated by trends
Teeth o f N orw egian S chool C hildren : I V 535

shown in Figs. 1 and 3. When specific surface rates are examined, it is found that changes in caries rates differed not only from tooth to tooth, but also for surfaces in the same tooth. In young teeth, some change in caries rates usually became evident in all the surfaces soon after conditions affecting dentition occurred, and the differences among surfaces of the same tooth were largely those of degree. The most susceptible surfaces in which the caries prevalence in 1940-1941 was at a high level at an early tooth age had the largest absolute reduction in caries during the war years and usually had an increase early in the post-war period. Surfaces in which the caries rate was low in the earliest post-eruptive years had smaller absolute reductions in caries and tended to have a more delayed increase in the post-war period. The larger absolute reductions in the high surface caries rates represent smaller percentage changes than the percentage changes in the lower surface caries rates, but the high absolute changes have more practical significance.
Trends in rates for specific surfaces of the first molars of 7-year-old children shown in Fig. 1 illustrate the differences. Both in the upper and lower molars, the caries rate of the fissure-pit surfaces, especially the occlusal surfaces, not only decreased rapidly during the war years but also increased very soon after the war. For the smooth surfaces, including mesial and distal surfaces of upper and lower molars, buccal in the upper and lingual in the lower molar, caries rates decreased in each of the war years but increased less quickly after the war. In the second molars and in the bicuspids of 13-year-old children (young teeth), the fissure-pit and the smooth surfaces tend to exhibit changes in caries rates similar to those noted for first molars of the 7-year-old children.
For the first permanent molars of 12- and 13-year-old children, there were very large differences among trends of specific surface caries rates, and for most surfaces the trends differed sharply from the DMF tooth trends. For these teeth with a post-eruptive age of about 7 years in 13-year-old children, the
536 T he M ilban k M em oria l F u n d Quarterly

DMF tooth rates and also the occlusal surface rates shown in Fig. 3 were about 95 per cent or more until 1948 and 1949 when a small decrease occurred for the teeth which had erupted after the beginning of the war. For some other surfaces, however, the decreases in caries rates were much greater and began early in the period. For the mesial and distal surfaces, caries rates initially were so high that the reduction demonstrated is of great significance to the preservation of this tooth.
In his interesting publication “ Epidemiological Trend Patterns of Dental Caries Prevalence Data,” Knutson (1958) has demonstrated on large groups of children from different places in the USA a high correlation between the percentage of children with one or more DMF teeth,9 rates for DMF teeth and DMF surfaces. Baume (1959) in his publication “ Evaluation of Caries Preventive Procedures” states: “ The DMF tooth rate per person is the appropriate index for estimating past and present caries experience (prevalence) of a population of some magnitude. Prevalence within smaller samples may be expressed by the DMF surface rate per person.”
This analysis of trends in caries rates has shown that DF surface rates are a more sensitive measure of change than the DF tooth rates. When caries in a single susceptible surface, such as the occlusal surface, dominates the tooth rate, only changes in this surface are measured by the DF tooth rate; and, when the caries rate for one surface is high at the time conditions change, benefits resulting from less caries activity in other surfaces are not revealed by the tooth rate. Thus, a record of surface caries is important for evaluating effects of prospective caries preventive methods.
9 The presence or absence of caries in the first permanent molars will almostalways determine the percentage of children with one or more D M F teeth, since these teeth are the first to erupt and are very susceptible to caries. Variations in this percentage for a specific age group will reflect the caries producing conditions affecting the group if conditions have been constant. However, a change in conditions can modify this percentage only to the extent that it can affect the incidence in caries-free children; and, consequently, if first molars have a high prevalence of caries soon after eruption, as in the Norwegian children before the War, only the percentage for younger children will be modified by new factors affecting caries, that is, the percentage for children with newly erupted first molars.
Teeth o f N orw eg ian S ch ool C hildren : IV 537

During years of changing oral conditions, increments of caries acquired within definite periods of time can measure more directly the effects of new conditions on caries activity in older teeth than the rates for all accumulated caries which are affected in varying degree by mouth exposure under different conditions at different post-eruptive periods. In this study of increments of caries in the incisors during the age period 8 to 12 years, the increments followed closely the total DF rates at age 12, since the caries prevalence accumulated to age 8 is very little. However, for the first molars, especially the occlusal surface, the four-year increments for the children 12 years of age in 1947 to 1949 were increasing, but the DF prevalence rates continued to decrease or remained constant because at age 8 these children had many fewer caries attacks in the first molars than those examined in earlier years. Thus, the changes in increments of caries in first molars of the older school children describe more accurately the patterns of change in caries activity than do the annual DF rates. The timing of the effects of rapid changes in war and post-war conditions on the dentition would have been more clearly defined if increments for shorter periods than four years had been available.
It would be of interest to compare the differences in reduction of caries in specific teeth and specific surfaces found in this study with corresponding reductions after use of fluorides as a caries prophylactic measure. Unfortunately, the data are not directly comparable with that reported from any studies on the effects of fluorine.
R e f e r e n c e s
Baume, L. J.: Evaluation of Caries Preventive Procedures. Le Journal Dentaire Beige, 1959, 50, p. 153.
Day, C. D. M . and Sedwick, H. J.: Studies on the Incidence of Dental Caries. Dental Cosmos, 1935, 77, p. 442.
Engh, O .: Sammenhengen mellom Tannstillingen og tannkaries. Munnpleien, 1956, 39, No. 4-5 .
Knutson, J. W .: Epidemiological Trend Patterns of Dental Caries Prevalence Data. Journal of the American Dental Association, 1958, 57, p. 821.
538 T h e M ilban k M em oria l F u n d Quarterly

Toverud, G .: The Influence of War and Post-War Conditions on the Teeth ofNorwegian School Children.
I. Eruption of Permanent Teeth and Status of Deciduous Dentition. TheMilbank Memorial Fund Quarterly, 1956, 34, No. 4.
II. Caries in the Permanent Teeth of Children Aged 7-8 and 12-13. TheMilbank Memorial Fund Quarterly, 1957, 35, No. 2.
III. Discussion of Food Supply and Dental Condition in Norway and OtherEuropean Countries. The Milbank Memorial Fund Quarterly, 1957, 35, No. 4.
Welander, E .: The Occurrence of Dental Caries in the Permanent Dentition.Uppsala, Almqvist and Wiksell, 1955.
Teeth o f N orw egian S ch ool C hildren : I V 539