j. christopher lytle port of oakland alan s. yee … atienza . port auditor . ... 530 water street,...
TRANSCRIPT
J. CHRISTOPHER LYTLE Executive Director DANNY WAN Port Attorney ARNEL ATIENZA Port Auditor JOHN T. BETTERTON Secretary of the Board
PORT OF OAKLAND BOARD OF PORT COMMISSIONERS 530 Water Street Oakland, California 94607 (510) 627-1696(w)(510) 839-5104(f)TDD/TTY 711
E-Mail: [email protected] Website: www.portofoakland.com
AGENDA
ALAN S. YEE President
CESTRA BUTNER First Vice-President
EARL HAMLIN Second Vice-President
MICHAEL COLBRUNO Commissioner
JAMES W. HEAD Commissioner
BRYAN R. PARKER Commissioner
VICTOR UNO Commissioner
Special Meeting of the Audit Committee
January 22, 2014 – 9:00 a.m. Board Room – 2nd Floor
ROLL CALL Commissioner Hamlin (Chair), Commissioner Parker and Commissioner Uno 1. CLOSED SESSION
Closed Session discussions and materials may not be disclosed to a person not entitled
to receive it, unless the Audit Committee authorizes disclosure of that confidential information.
ROLL CALL/OPEN SESSION (Approximately 9:00 a.m.) Commissioner Hamlin (Chair), Commissioner Parker and Commissioner Uno CLOSED SESSION REPORT The Port Attorney or Board Secretary will report on any final actions taken in Closed
Session. 2. FINANCIAL REPORTING This section of the meeting is reserved for action or discussion related to financial
reporting matters and may include independent auditors.
2.1 Comprehensive Annual Financial Report for Year Ended June 30, 2014 (External Auditor – Macias, Gini & O’Connell)
• Discussion Only
2.2 Management Letter for Year Ended June 30, 2014 (External Auditor – Macias, Gini &
O’Connell) • Discussion Only
2.3 CalPERS Pension Actuarial Report dated October 2014 (Finance – S. Lee)
• Discussion Only
3. INTERNAL CONTROLS
This section of the meeting is reserved for action or discussion related to internal control matters. Internal controls consist mainly of systematic measures instituted by an organization to safeguard its assets and to provide reasonable assurance on the reliability and accuracy of financial information, proper compliance with laws and regulations, and effective and efficient operations.
3.1 Administrative Policies and Procedures Report (Finance – S. Lee)
• Discussion Only
3.2 Whistle Blower Program Report (Internal Audit – A. Atienza) • Discussion Only
4. ADMINISTRATION This section of the meeting is reserved for action or discussion related to administrative
matters, including scheduling items for future Agendas and/or scheduling Special Meetings, and for reporting noteworthy events occurring since the last Audit Committee meeting.
OPEN FORUM The Audit Committee will receive public comment on non-agenda items during this time.
Please fill out a speaker card and present it to the Secretary of the Committee. ADJOURNMENT The next Regular Meeting of the Audit Committee will be held on April 16, 2015.
2
PUBLIC PARTICIPATION
To Speak on an Agenda Item You may speak on any item appearing on the Agenda. Please fill out a Speaker’s Card and give it to the Board Secretary before the start of the meeting or immediately after conclusion of Closed Session. Cards received after the start of the meeting will be treated as a single request to speak in Open Forum. All speakers will be allotted a minimum of one minute. To Receive Agendas & Related Materials Should you have questions or concerns regarding this Agenda, or wish to review any of the Agenda Related Materials, please contact the Board Secretary, John Betterton, at: (510) 627-1696, or visit our web page at: www.portofoakland.com To receive Port Agendas and Agenda Related Materials by email, please email your request to: [email protected] Disability Related Modifications Any person who requires a disability-related modification or accommodation, including auxiliary aids or services, in order to participate in the meeting, may submit a written request, electronic request, or telephone request [via the California Relay Service (telephone) for the hearing impaired at (800) 735-2922], to the Secretary of the Board no later than five working days prior to the scheduled meeting date.
John Betterton, Secretary of the Board 530 Water Street, Oakland, CA 94607
[email protected] (510) 627-1696
Language & Interpretive Services As a grantee of federal aid grant funds from the US Department of Transportation, the Port is responsible for ensuring equal access to its programs, services, and benefits. To request bilingual interpreters or materials in alternate formats, please contact the Assistant Secretary of the Board no later than five working days prior to the scheduled meeting date.
Daria Edgerly, Assistant Secretary of the Board 530 Water Street, Oakland, CA 94607 [email protected] (510) 627-1337
Scented Products Please refrain from wearing scented products to this meeting so attendees who experience chemical sensitivities may attend.
3

Commissioner’s Statement of Intention
We are a governing Board whose authority lies with the entirety of the Board. We govern in accordance with our fiduciary duty to the Port of Oakland. We conduct ourselves with clarity and transparency, grounded in the principles of integrity, trust and respect. We reach our decisions through candid, open and deliberative debate and hold both staff and ourselves accountable for implementing them.
4

Financial Report Items
This section of the meeting is reserved for action or discussion related to financial reporting matters and may include independent auditors.

BUDGET SUMMARYOne-Year Operating and Capital Budget
Fiscal Year Ended June 30, 2015
Five-Year Operating Forecast and Capital Needs AssessmentFiscal Years ending June 30, 2015 through 2019
��
Oakland, California(A Component Unit of the City of Oakland)
For the Years Ended June 30, 2014 and 2013
Comprehensive Annual Financial Report

Port of Oakland Oakland, California
(A Component Unit of the City of Oakland)
Comprehensive Annual Financial Report For the Years Ended June 30, 2014 and 2013
Prepared by the Financial Services Division

This page left intentionally blank.
PORT OF OAKLAND (A Component Unit of the City of Oakland)
COMPREHENSIVE ANNUAL FINANCIAL REPORT
Fiscal Years Ended June 30, 2014 and 2013
Table of Contents
Pages INTRODUCTORY SECTION
Letter of Transmittal ................................................................................................................ i GFOA Certificate of Achievement for Excellence in Financial Reporting ........................... vii Organization Chart ............................................................................................................... viii Appointed Officials, Executive and Contributing Staff ......................................................... ix
FINANCIAL SECTION Independent Auditors’ Report ................................................................................................... 1-2 Management’s Discussion and Analysis (Unaudited) ............................................................ 3-16 Financial Statements:
Statements of Net Position ................................................................................................ 18-19 Statements of Revenues, Expenses and Changes in Net Position ..................................... 20-21 Statements of Cash Flows ................................................................................................. 22-23 Notes to Financial Statements ........................................................................................... 25-58
Required Supplementary Information (Unaudited): Schedule of Funding Progress - Other Postemployment Benefits ......................................... 59 STATISTICAL SECTION (Unaudited)
Index to Statistical Section .................................................................................................... 61 Net Position by Components ................................................................................................. 62 Statements of Revenues, Expenses and Changes in Net Position .......................................... 63 Principal Revenue Sources and Airline Revenue per Enplaned Passenger ........................... 64 Aviation Statistics – South Airport ........................................................................................ 65 Top Ten Individual Sources of Aviation Revenue ................................................................ 66 Schedule of Airline Rates and Changes ................................................................................. 67 Principal Revenue Sources and Maritime Revenue per TEU ................................................ 68 Maritime Division – Container Trends .................................................................................. 69 Top Ten Individual Sources of Maritime Revenue by Alphabetical Order ........................... 70 Net Pledged Revenues and Debt Service Coverage Calculation ........................................... 71 Ratios of Debt Service ........................................................................................................... 72 Outstanding Debt by Debt Type ............................................................................................ 73 Demographic and Economic Statistics for the City of Oakland ............................................ 74 Principal Employers in the City of Oakland - FY 2013 vs. FY 2006 .................................... 75 Actual Employee Count by Division ..................................................................................... 76 Capital Assets Information .................................................................................................... 77

This page left intentionally blank.
INTRODUCTORY SECTION
Letter of Transmittal GFOA Certificate of Achievement for
Excellence in Financial Reporting Organization Chart
Appointed Officials, Executive Staff and
Contributing Staff

This page left intentionally blank.
vii
viii
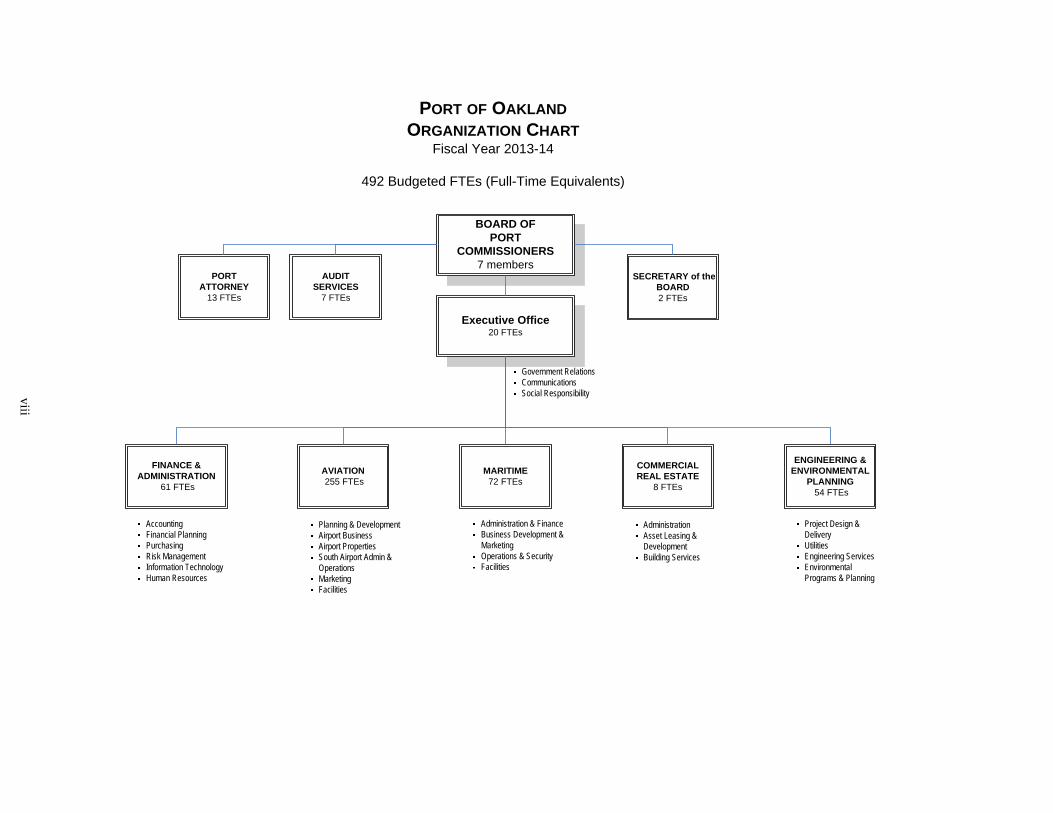
Executive Office20 FTEs
MARITIME72 FTEs
COMMERCIAL REAL ESTATE
8 FTEs
AVIATION 255 FTEs
FINANCE & ADMINISTRATION
61 FTEs
ENGINEERING & ENVIRONMENTAL
PLANNING54 FTEs
BOARD OF PORT
COMMISSIONERS7 members
AUDIT SERVICES
7 FTEs
PORT ATTORNEY
13 FTEs
SECRETARY of the BOARD2 FTEs
PORT OF OAKLANDORGANIZATION CHART
Fiscal Year 2013-14
492 Budgeted FTEs (Full-Time Equivalents)
Project Design & DeliveryUtilitiesEngineering ServicesEnvironmental Programs & Planning
AdministrationAsset Leasing & DevelopmentBuilding Services
Administration & FinanceBusiness Development & MarketingOperations & SecurityFacilities
Planning & Development Airport BusinessAirport PropertiesSouth Airport Admin & OperationsMarketingFacilities
AccountingFinancial PlanningPurchasingRisk ManagementInformation TechnologyHuman Resources
Government RelationsCommunicationsSocial Responsibility
ix
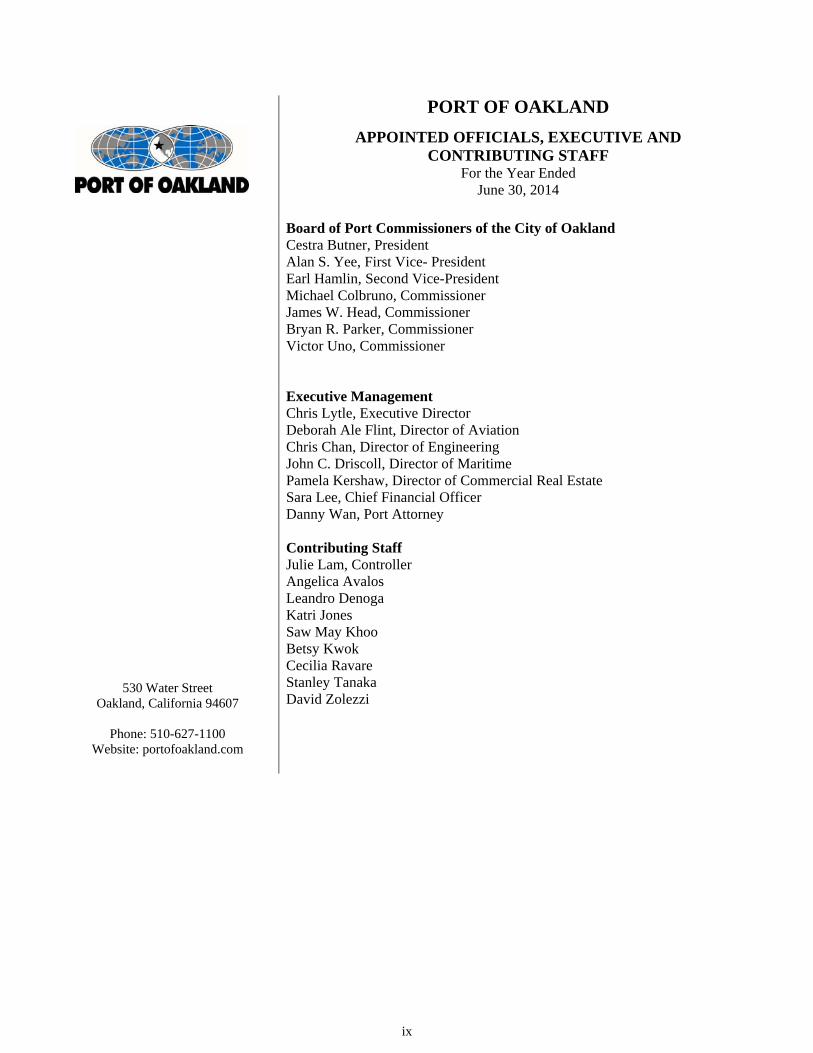
PORT OF OAKLAND
APPOINTED OFFICIALS, EXECUTIVE AND CONTRIBUTING STAFF
For the Year Ended June 30, 2014
Board of Port Commissioners of the City of Oakland
Cestra Butner, President Alan S. Yee, First Vice- President Earl Hamlin, Second Vice-President Michael Colbruno, Commissioner James W. Head, Commissioner Bryan R. Parker, Commissioner Victor Uno, Commissioner
Executive Management Chris Lytle, Executive Director Deborah Ale Flint, Director of Aviation Chris Chan, Director of Engineering John C. Driscoll, Director of Maritime Pamela Kershaw, Director of Commercial Real Estate Sara Lee, Chief Financial Officer Danny Wan, Port Attorney
530 Water Street Oakland, California 94607
Phone: 510-627-1100
Website: portofoakland.com
Contributing Staff Julie Lam, Controller Angelica Avalos Leandro Denoga Katri Jones Saw May Khoo Betsy Kwok Cecilia Ravare Stanley Tanaka David Zolezzi

x
This page left intentionally blank.
FINANCIAL SECTION
Independent Auditors’ Report Management’s Discussion and Analysis
(unaudited)
Financial Statements Required Supplementary Information
(unaudited)

This page left intentionally blank.
1
Independent Auditors’ Report Board of Port Commissioners of the City of Oakland, Oakland, California Report on the Financial Statements
We have audited the accompanying financial statements of the Port of Oakland (Port), a component unit of the City of Oakland, California as of and for the years ended June 30, 2014 and 2013, and the related notes to the financial statements, as listed in the table of contents.
Management’s Responsibility for the Financial Statements
Management is responsible for the preparation and fair presentation of these financial statements in accordance with accounting principles generally accepted in the United States of America; this includes the design, implementation, and maintenance of internal control relevant to the preparation and fair presentation of financial statements that are free from material misstatement, whether due to fraud or error.
Auditors’ Responsibility
Our responsibility is to express an opinion on these financial statements based on our audits. We conducted our audits in accordance with auditing standards generally accepted in the United States of America and the standards applicable to financial audits contained in Government Auditing Standards, issued by the Comptroller General of the United States. Those standards require that we plan and perform the audit to obtain reasonable assurance about whether the financial statements are free from material misstatement. An audit involves performing procedures to obtain audit evidence about the amounts and disclosures in the financial statements. The procedures selected depend on the auditors’ judgment, including the assessment of the risks of material misstatement of the financial statements, whether due to fraud or error. In making those risk assessments, the auditors considers internal control relevant to the entity’s preparation and fair presentation of the financial statements in order to design audit procedures that are appropriate in the circumstances, but not for the purpose of expressing an opinion on the effectiveness of the entity’s internal control. Accordingly, we express no such opinion. An audit also includes evaluating the appropriateness of accounting policies used and the reasonableness of significant accounting estimates made by management, as well as evaluating the overall presentation of the financial statements. We believe that the audit evidence we have obtained is sufficient and appropriate to provide a basis for our audit opinion. Opinion In our opinion, the financial statements referred to above present fairly, in all material respects, the financial position of the Port as of June 30, 2014 and 2013, and the changes in its financial position and its cash flows for the years then ended in accordance with accounting principles generally accepted in the United States of America.
2
Other Matters
Required Supplementary Information
Accounting principles generally accepted in the United States of America require that the management’s discussion and analysis and the schedule of funding progress – other postemployment benefits identified in the accompanying table of contents be presented to supplement the financial statements. Such information, although not a part of the financial statements, is required by the Governmental Accounting Standards Board who considers it to be an essential part of financial reporting for placing the financial statements in an appropriate operational, economic, or historical context. We have applied certain limited procedures to the required supplementary information in accordance with auditing standards generally accepted in the United States of America, which consisted of inquiries of management about the methods of preparing the information and comparing the information for consistency with management’s responses to our inquiries, the financial statements, and other knowledge we obtained during our audits of the financial statements. We do not express an opinion or provide any assurance on the information because the limited procedures do not provide us with sufficient evidence to express an opinion or provide any assurance. Other Information
Our audits were conducted for the purpose of forming an opinion on the financial statements that collectively comprise the Port’s financial statements. The introductory and statistical sections are presented for purposes of additional analysis and are not a required part of the financial statements. The introductory and statistical sections have not been subjected to the auditing procedures applied in the audit of the financial statements, and accordingly, we do not express an opinion or provide any assurance on them. Other Reporting Required by Government Auditing Standards
In accordance with Government Auditing Standards, we have also issued our report dated December 3, 2014, on our consideration of the Port’s internal control over financial reporting and on our tests of its compliance with certain provisions of laws, regulations, contracts, and grant agreements and other matters. The purpose of that report is to describe the scope of our testing of internal control over financial reporting and compliance and the results of that testing, and not to provide an opinion on internal control over financial reporting or on compliance. That report is an integral part of an audit performed in accordance with Government Auditing Standards in considering the Port’s internal control over financial reporting and compliance.
Oakland, California December 4, 2014
Port of Oakland (A Component Unit of the City of Oakland)
Management’s Discussion and Analysis (unaudited) June 30, 2014 and 2013
3
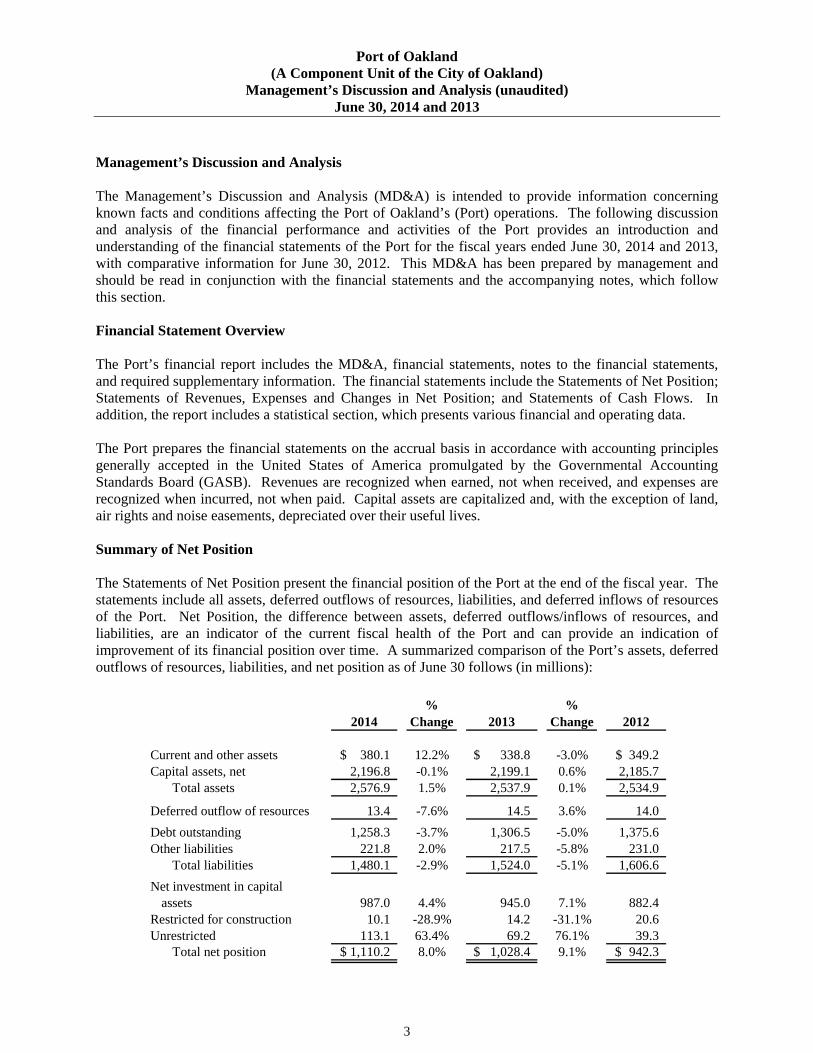
Management’s Discussion and Analysis The Management’s Discussion and Analysis (MD&A) is intended to provide information concerning known facts and conditions affecting the Port of Oakland’s (Port) operations. The following discussion and analysis of the financial performance and activities of the Port provides an introduction and understanding of the financial statements of the Port for the fiscal years ended June 30, 2014 and 2013, with comparative information for June 30, 2012. This MD&A has been prepared by management and should be read in conjunction with the financial statements and the accompanying notes, which follow this section. Financial Statement Overview The Port’s financial report includes the MD&A, financial statements, notes to the financial statements, and required supplementary information. The financial statements include the Statements of Net Position; Statements of Revenues, Expenses and Changes in Net Position; and Statements of Cash Flows. In addition, the report includes a statistical section, which presents various financial and operating data. The Port prepares the financial statements on the accrual basis in accordance with accounting principles generally accepted in the United States of America promulgated by the Governmental Accounting Standards Board (GASB). Revenues are recognized when earned, not when received, and expenses are recognized when incurred, not when paid. Capital assets are capitalized and, with the exception of land, air rights and noise easements, depreciated over their useful lives. Summary of Net Position The Statements of Net Position present the financial position of the Port at the end of the fiscal year. The statements include all assets, deferred outflows of resources, liabilities, and deferred inflows of resources of the Port. Net Position, the difference between assets, deferred outflows/inflows of resources, and liabilities, are an indicator of the current fiscal health of the Port and can provide an indication of improvement of its financial position over time. A summarized comparison of the Port’s assets, deferred outflows of resources, liabilities, and net position as of June 30 follows (in millions):
2014%
Change 2013%
Change 2012
Current and other assets 380.1$ 12.2% 338.8$ -3.0% 349.2$ Capital assets, net 2,196.8 -0.1% 2,199.1 0.6% 2,185.7
Total assets 2,576.9 1.5% 2,537.9 0.1% 2,534.9
Deferred outflow of resources 13.4 -7.6% 14.5 3.6% 14.0 Debt outstanding 1,258.3 -3.7% 1,306.5 -5.0% 1,375.6 Other liabilities 221.8 2.0% 217.5 -5.8% 231.0
Total liabilities 1,480.1 -2.9% 1,524.0 -5.1% 1,606.6 Net investment in capital
assets 987.0 4.4% 945.0 7.1% 882.4 Restricted for construction 10.1 -28.9% 14.2 -31.1% 20.6 Unrestricted 113.1 63.4% 69.2 76.1% 39.3
Total net position 1,110.2$ 8.0% 1,028.4$ 9.1% 942.3$
Port of Oakland (A Component Unit of the City of Oakland)
Management’s Discussion and Analysis (unaudited) June 30, 2014 and 2013
4
Summary of Net Position (continued)
Total net position at June 30, 2014, increased approximately $81.8 million or 8.0% from $1,028.4 million on June 30, 2013 to $1,110.2 million on June 30, 2014. Net investment in capital assets, net of related debt, increased $42.0 million due to a decrease in outstanding debt of $48.2 million offset by a decrease in the book value of capital assets of approximately $2.3 million and an increase in accounts payable on construction contracts of $4.9 million. Restricted for construction decreased $4.1 million due to continued spending of passenger facility charges (PFC) proceeds on construction projects. Unrestricted net position increased approximately $43.9 million due to an increase in the Port’s unrestricted cash balance of $23.1 million, an increase in accounts receivable of $10.6 million primarily due to federal grants, an increase in other assets of $5.4 million for tenant performance deposits and a decrease in unearned revenue of $4.9 million.
Total net position at June 30, 2013, increased approximately $86.1 million or 9.1% from $942.3 million on June 30, 2012 to $1,028.4 million on June 30, 2013. Net investment in capital assets, net of related debt, increased by approximately $62.6 million due to decrease in outstanding debt of $69 million and an increase in capital assets, net of depreciation of $13 million, offset by an increase in accounts payables on construction contracts of $4 million and decreases in bond reserves of $12.5 million and noise abatement reserves of $2.4 million. Restricted for construction decreased $6.4 million due to an increase in spending of PFC proceeds on construction projects. Unrestricted net position increased approximately $29.9 million primarily as a result of an increase in other receivables of $17 million and a decrease in unearned revenue and environmental and other liabilities of $14 million. The increase in other receivables was primarily due to a $13.5 million promissory note from the combined sale and lease of the Oak-to-Ninth property. The decrease in environmental and other liabilities was primarily due to the completion and progress on environmental projects. Deferred outflows of resources is the amount of the unamortized deferred loss on refunding that was formerly included in the long term debt total. This change was made because of the adoption of GASB 65 as discussed in Note 2 to the financial statements that classifies certain transactions in a new category called deferred outflows of resources.
Port of Oakland (A Component Unit of the City of Oakland)
Management’s Discussion and Analysis (unaudited) June 30, 2014 and 2013
5
Summary of Revenues, Expenses and Changes in Net Position The Statements of Revenues, Expenses and Changes in Net Position reflect how the Port’s net position changed during the most recent fiscal year compared to the prior year. These changes are reported as soon as the underlying event giving rise to the change occurs, regardless of the timing of related cash flows. A summary of the Statements of Revenues, Expenses and Changes in Net Position as of June 30 follows (in millions):
2014%
Change 2013%
Change 2012
Operating revenues 323.0$ 2.4% 315.5$ 3.1% 306.1$ Passenger facility charge revenue 19.7 -1.0% 19.9 0.5% 19.8 Customer facility charge revenue 5.6 3.7% 5.4 3.8% 5.2 Interest income 1.4 27.3% 1.1 -35.3% 1.7 Other income - -100.0% 19.1 100.0% -
Total revenues 349.7 -3.1% 361.0 8.5% 332.8
Operating expenses before depreciation 168.5 11.1% 151.6 0.5% 150.8 Depreciation 99.2 1.0% 98.2 0.2% 98.0 Interest expense 54.0 -9.4% 59.6 -10.8% 66.8 Other expense 6.5 91.2% 3.4 -17.1% 4.1
Total expenses 328.2 4.9% 312.8 -2.2% 319.7 Change in net assets before capital
contributions 21.5 -55.4% 48.2 267.9% 13.1 Capital contributions -
Grants from government agencies 60.3 59.1% 37.9 63.4% 23.2 Increase in net position 81.8 -5.0% 86.1 137.2% 36.3
Net position, beginning of the year 1,028.4 9.1% 942.3 4.0% 906.0 Net position, end of the year 1,110.2$ 8.0% 1,028.4$ 9.1% 942.3$
Twelve Months Ended
Port of Oakland (A Component Unit of the City of Oakland)
Management’s Discussion and Analysis (unaudited) June 30, 2014 and 2013
6
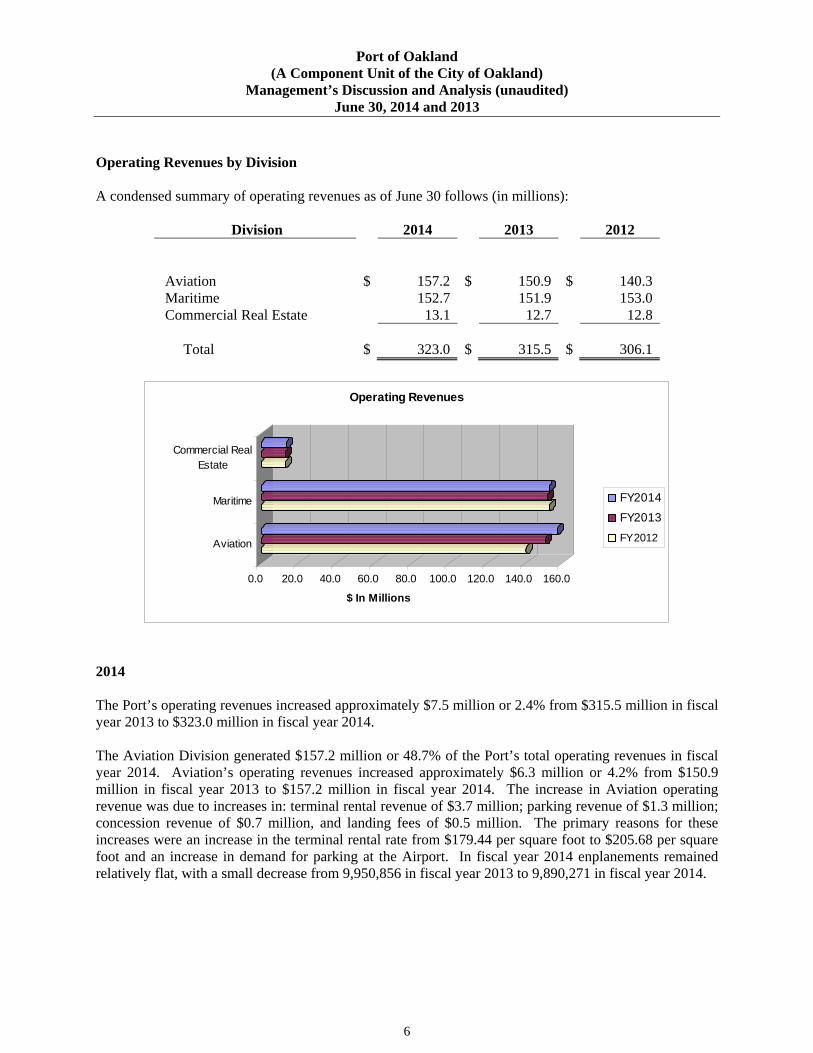
Operating Revenues by Division A condensed summary of operating revenues as of June 30 follows (in millions):
Division 2014 2013 2012
Aviation
$ 157.2 $ 150.9 $ 140.3 Maritime 152.7 151.9 153.0 Commercial Real Estate 13.1 12.7 12.8
Total
$ 323.0 $ 315.5 $ 306.1
0.0 20.0 40.0 60.0 80.0 100.0 120.0 140.0 160.0
$ In Millions
Aviation
Maritime
Commercial RealEstate
Operating Revenues
FY2014
FY2013
FY2012
2014 The Port’s operating revenues increased approximately $7.5 million or 2.4% from $315.5 million in fiscal year 2013 to $323.0 million in fiscal year 2014. The Aviation Division generated $157.2 million or 48.7% of the Port’s total operating revenues in fiscal year 2014. Aviation’s operating revenues increased approximately $6.3 million or 4.2% from $150.9 million in fiscal year 2013 to $157.2 million in fiscal year 2014. The increase in Aviation operating revenue was due to increases in: terminal rental revenue of $3.7 million; parking revenue of $1.3 million; concession revenue of $0.7 million, and landing fees of $0.5 million. The primary reasons for these increases were an increase in the terminal rental rate from $179.44 per square foot to $205.68 per square foot and an increase in demand for parking at the Airport. In fiscal year 2014 enplanements remained relatively flat, with a small decrease from 9,950,856 in fiscal year 2013 to 9,890,271 in fiscal year 2014.
Port of Oakland (A Component Unit of the City of Oakland)
Management’s Discussion and Analysis (unaudited) June 30, 2014 and 2013
7
Operating Revenues by Division (continued) The Maritime Division generated $152.7 million or 47.3% of the Port’s total operating revenues in fiscal year 2014. Maritime’s operating revenues increased approximately $0.8 million or 0.5% from $151.9 million in fiscal year 2013 to $152.7 million in fiscal year 2014. The increase in Maritime operating revenue was primarly due to increased short–term rentals. Loaded Twenty Equivalent Units (TEUs) increased 2.2% from 1,793,749 in fiscal year 2013 to 1,832,559 in fiscal year 2014. The Commercial Real Estate Division generated $13.1 million or 4.1% of the Port’s total operating revenues in fiscal year 2014. Commercial Real Estate’s operating revenues in fiscal year 2014 were essentially unchanged from fiscal year 2013. 2013 The Port’s operating revenues increased approximately $9.4 million or 3.1% from $306.1 million in fiscal year 2012 to $315.5 million in fiscal year 2013. The Aviation Division generated $150.9 million or 47.8% of the Port’s total operating revenues in fiscal year 2013. Aviation’s operating revenues increased approximately $10.6 million or 7.6% from $140.3 million in fiscal year 2012 to $150.9 million in fiscal year 2013. The increase in Aviation revenue was due to increases in: terminal rental revenue of $4.0 million; cargo building rental revenue of $2.3 million; parking revenue of $1.2 million; utility revenue of $1.5 million; and concession revenue of $0.7 million. The primary reasons for these increases were an increase in the terminal rental rate from $145.88 per square foot to $179.44 per square foot and an overall increase in demand at the airport. Passenger traffic increased 3.2% in fiscal year 2013, from 9,643,555 in fiscal year 2012 to 9,950,856 in fiscal year 2013. The Maritime Division generated $151.9 million or 48.1% of the Port’s total operating revenues in fiscal year 2013. Maritime’s operating revenues decreased approximately $1.1 million or 0.7% from $153 million in fiscal year 2012 to $151.9 million in fiscal year 2013. The decrease in Maritime revenue is primarily due to a shift in cargo activity among the terminals. TEUs decreased 0.1% from 1,796,671 in fiscal year 2012 to 1,794,187 in fiscal year 2013. The Commercial Real Estate Division generated $12.7 million or 4.0% of the Port’s total operating revenues in fiscal year 2013. Commercial Real Estate’s operating revenues in fiscal year 2013 were essentially unchanged from fiscal year 2012.
Port of Oakland (A Component Unit of the City of Oakland)
Management’s Discussion and Analysis (unaudited) June 30, 2014 and 2013
8
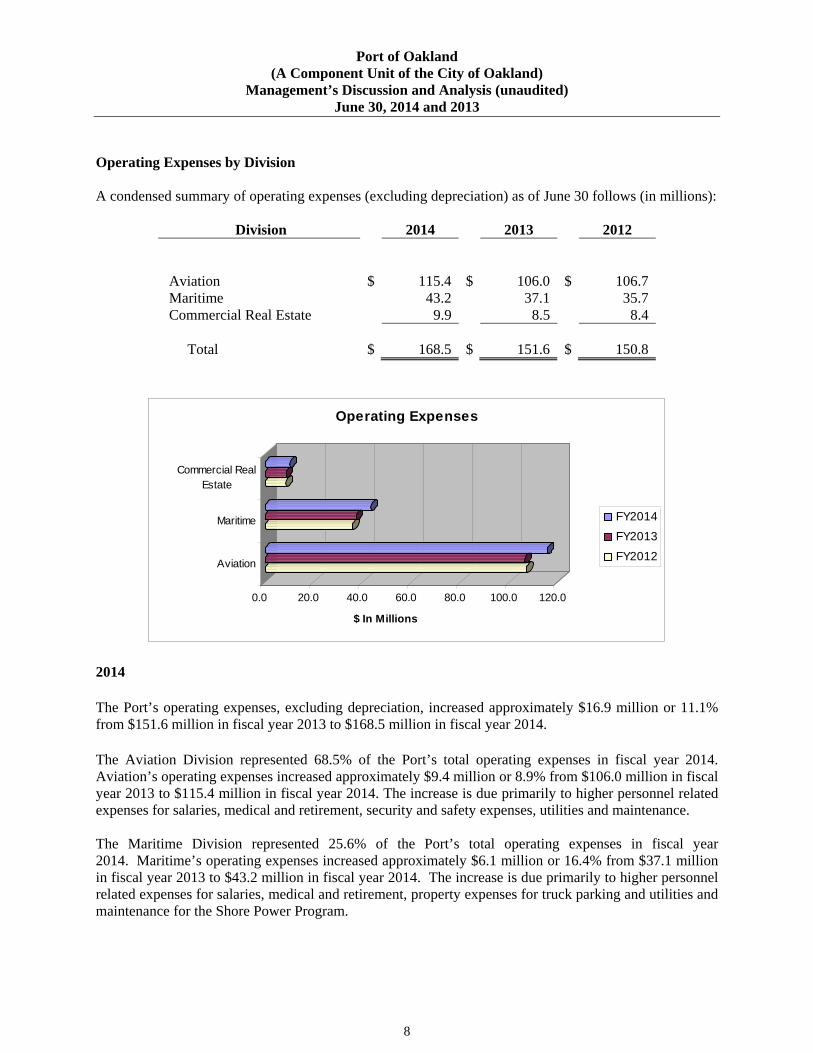
Operating Expenses by Division A condensed summary of operating expenses (excluding depreciation) as of June 30 follows (in millions):
Division 2014 2013 2012
Aviation
$ 115.4 $ 106.0
$ 106.7
Maritime 43.2 37.1 35.7 Commercial Real Estate 9.9 8.5 8.4
Total
$ 168.5 $ 151.6
$ 150.8
0.0 20.0 40.0 60.0 80.0 100.0 120.0
$ In Millions
Aviation
Maritime
Commercial RealEstate
Operating Expenses
FY2014
FY2013
FY2012
2014
The Port’s operating expenses, excluding depreciation, increased approximately $16.9 million or 11.1% from $151.6 million in fiscal year 2013 to $168.5 million in fiscal year 2014.
The Aviation Division represented 68.5% of the Port’s total operating expenses in fiscal year 2014. Aviation’s operating expenses increased approximately $9.4 million or 8.9% from $106.0 million in fiscal year 2013 to $115.4 million in fiscal year 2014. The increase is due primarily to higher personnel related expenses for salaries, medical and retirement, security and safety expenses, utilities and maintenance. The Maritime Division represented 25.6% of the Port’s total operating expenses in fiscal year 2014. Maritime’s operating expenses increased approximately $6.1 million or 16.4% from $37.1 million in fiscal year 2013 to $43.2 million in fiscal year 2014. The increase is due primarily to higher personnel related expenses for salaries, medical and retirement, property expenses for truck parking and utilities and maintenance for the Shore Power Program.
Port of Oakland (A Component Unit of the City of Oakland)
Management’s Discussion and Analysis (unaudited) June 30, 2014 and 2013
9
Operating Expenses by Division (continued) The Commercial Real Estate Division represented 5.9% of the Port’s total operating expenses in fiscal year 2014. Commercial Real Estate’s operating expenses increased approximately $1.4 million or 16.5% from $8.5 million in fiscal year 2013 to $9.9 million in fiscal year 2014. The increase is due primarily to higher personnel related expenses for salaries, medical and retirement, pollution remediation site monitoring costs and utilities. 2013 The Port’s operating expenses, excluding depreciation, increased approximately $0.8 million or 0.5% from $150.8 million in fiscal year 2012 to $151.6 million in fiscal year 2013. The Aviation Division represented 69.9% of the Port’s total operating expenses in fiscal year 2013. Aviation’s operating expenses decreased approximately $0.7 million or 0.7% from $106.7 million in fiscal year 2012 to $106.0 million in fiscal year 2013. The decrease was primarily due to lower Aircraft Rescue and Fire Fighting (ARFF) expenses resulting from a fiscal year 2012 and fiscal year 2013 true-up with the City of Oakland.
The Maritime Division represented 24.5% of the Port’s total operating expenses in fiscal year 2013. Maritime’s operating expenses increased approximately $1.4 million or 3.9% from $35.7 million in fiscal year 2012 to $37.1 million in fiscal year 2013. The increase was due to higher personnel related expenses, security projects and supplies for a variety of maintenance and repair projects. The Commercial Real Estate Division represented 5.6% of the Port’s total operating expenses in fiscal year 2013. Commercial Real Estate’s operating expenses in fiscal year 2013 were essentially unchanged from fiscal year 2012.
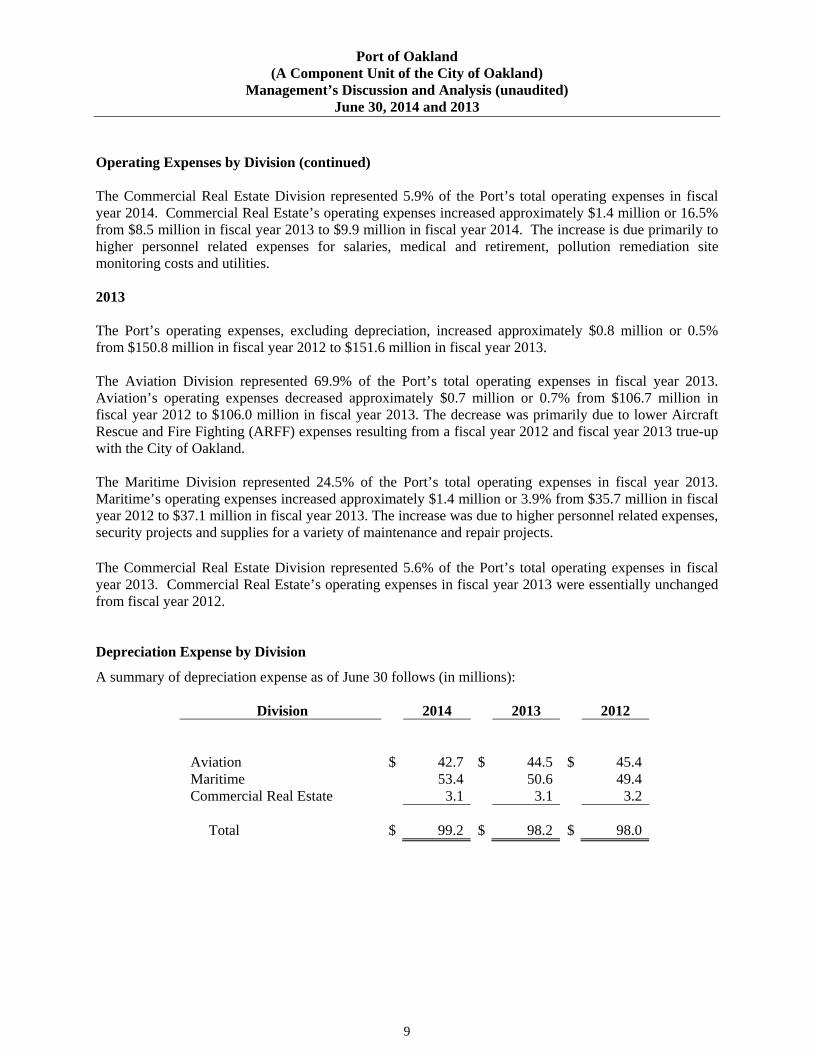
Depreciation Expense by Division A summary of depreciation expense as of June 30 follows (in millions):
Division 2014 2013 2012
Aviation
$ 42.7 $ 44.5
$ 45.4
Maritime 53.4 50.6 49.4 Commercial Real Estate 3.1 3.1 3.2
Total
$ 99.2 $ 98.2
$ 98.0
Port of Oakland (A Component Unit of the City of Oakland)
Management’s Discussion and Analysis (unaudited) June 30, 2014 and 2013
10
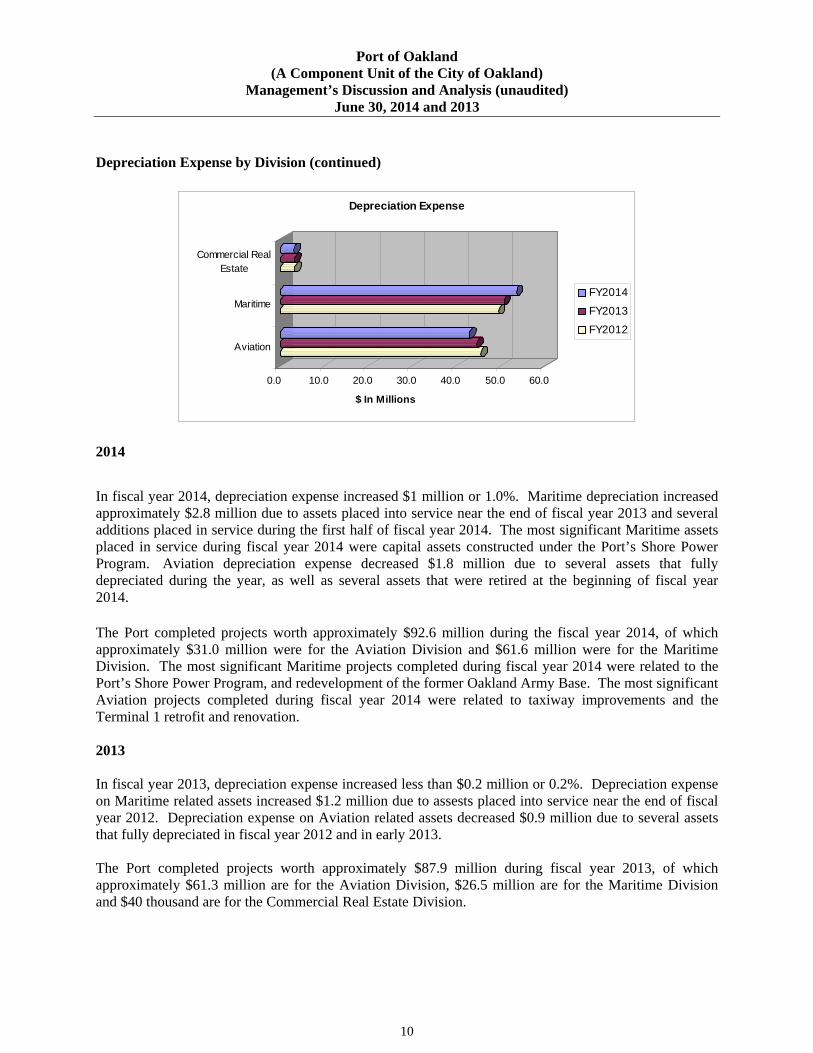
Depreciation Expense by Division (continued)
0.0 10.0 20.0 30.0 40.0 50.0 60.0
$ In Millions
Aviation
Maritime
Commercial RealEstate
Depreciation Expense
FY2014
FY2013
FY2012
2014
In fiscal year 2014, depreciation expense increased $1 million or 1.0%. Maritime depreciation increased approximately $2.8 million due to assets placed into service near the end of fiscal year 2013 and several additions placed in service during the first half of fiscal year 2014. The most significant Maritime assets placed in service during fiscal year 2014 were capital assets constructed under the Port’s Shore Power Program. Aviation depreciation expense decreased $1.8 million due to several assets that fully depreciated during the year, as well as several assets that were retired at the beginning of fiscal year 2014.
The Port completed projects worth approximately $92.6 million during the fiscal year 2014, of which approximately $31.0 million were for the Aviation Division and $61.6 million were for the Maritime Division. The most significant Maritime projects completed during fiscal year 2014 were related to the Port’s Shore Power Program, and redevelopment of the former Oakland Army Base. The most significant Aviation projects completed during fiscal year 2014 were related to taxiway improvements and the Terminal 1 retrofit and renovation. 2013 In fiscal year 2013, depreciation expense increased less than $0.2 million or 0.2%. Depreciation expense on Maritime related assets increased $1.2 million due to assests placed into service near the end of fiscal year 2012. Depreciation expense on Aviation related assets decreased $0.9 million due to several assets that fully depreciated in fiscal year 2012 and in early 2013. The Port completed projects worth approximately $87.9 million during fiscal year 2013, of which approximately $61.3 million are for the Aviation Division, $26.5 million are for the Maritime Division and $40 thousand are for the Commercial Real Estate Division.
Port of Oakland (A Component Unit of the City of Oakland)
Management’s Discussion and Analysis (unaudited) June 30, 2014 and 2013
11
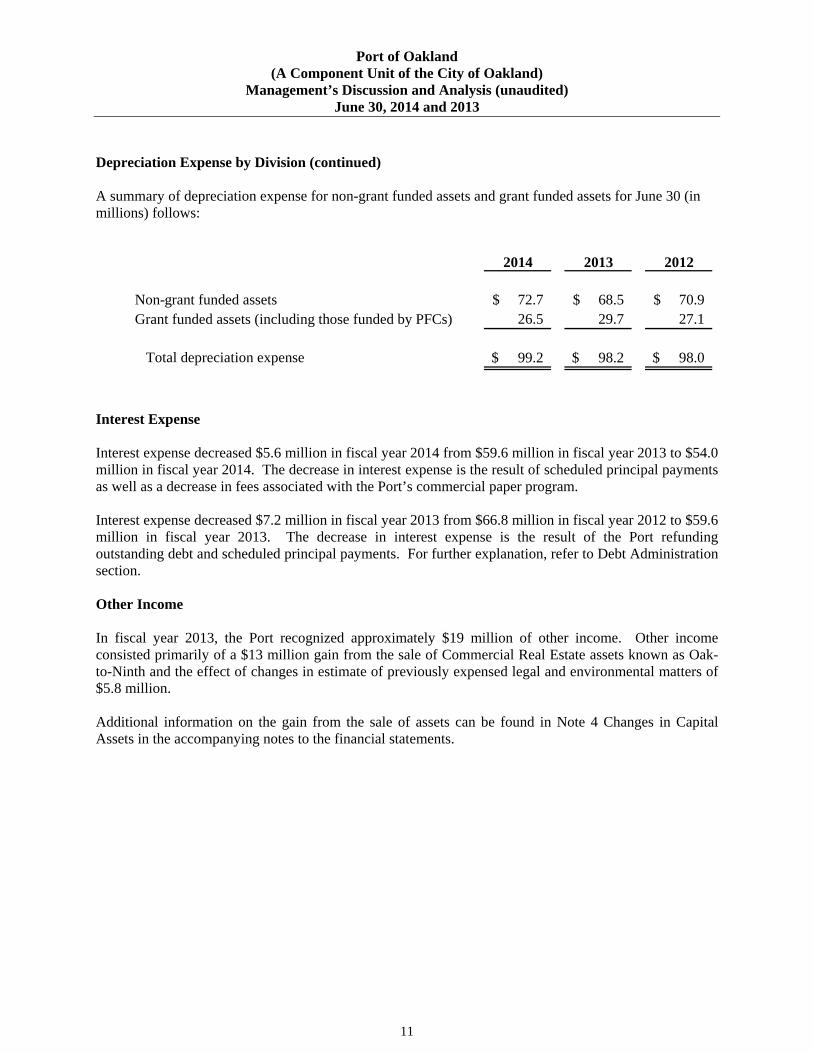
Depreciation Expense by Division (continued) A summary of depreciation expense for non-grant funded assets and grant funded assets for June 30 (in millions) follows:
2014 2013 2012
Non-grant funded assets 72.7$ 68.5$ 70.9$ Grant funded assets (including those funded by PFCs) 26.5 29.7 27.1
Total depreciation expense 99.2$ 98.2$ 98.0$
Interest Expense Interest expense decreased $5.6 million in fiscal year 2014 from $59.6 million in fiscal year 2013 to $54.0 million in fiscal year 2014. The decrease in interest expense is the result of scheduled principal payments as well as a decrease in fees associated with the Port’s commercial paper program. Interest expense decreased $7.2 million in fiscal year 2013 from $66.8 million in fiscal year 2012 to $59.6 million in fiscal year 2013. The decrease in interest expense is the result of the Port refunding outstanding debt and scheduled principal payments. For further explanation, refer to Debt Administration section. Other Income In fiscal year 2013, the Port recognized approximately $19 million of other income. Other income consisted primarily of a $13 million gain from the sale of Commercial Real Estate assets known as Oak-to-Ninth and the effect of changes in estimate of previously expensed legal and environmental matters of $5.8 million. Additional information on the gain from the sale of assets can be found in Note 4 Changes in Capital Assets in the accompanying notes to the financial statements.
Port of Oakland (A Component Unit of the City of Oakland)
Management’s Discussion and Analysis (unaudited) June 30, 2014 and 2013
12
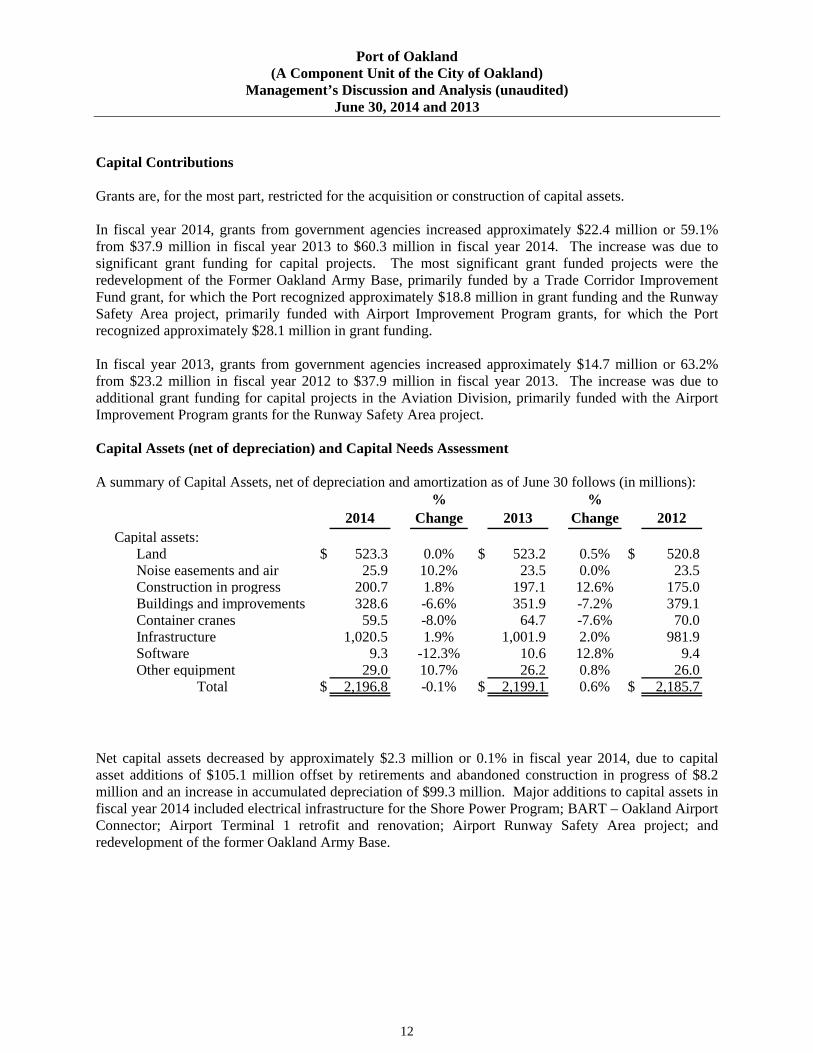
Capital Contributions Grants are, for the most part, restricted for the acquisition or construction of capital assets. In fiscal year 2014, grants from government agencies increased approximately $22.4 million or 59.1% from $37.9 million in fiscal year 2013 to $60.3 million in fiscal year 2014. The increase was due to significant grant funding for capital projects. The most significant grant funded projects were the redevelopment of the Former Oakland Army Base, primarily funded by a Trade Corridor Improvement Fund grant, for which the Port recognized approximately $18.8 million in grant funding and the Runway Safety Area project, primarily funded with Airport Improvement Program grants, for which the Port recognized approximately $28.1 million in grant funding. In fiscal year 2013, grants from government agencies increased approximately $14.7 million or 63.2% from $23.2 million in fiscal year 2012 to $37.9 million in fiscal year 2013. The increase was due to additional grant funding for capital projects in the Aviation Division, primarily funded with the Airport Improvement Program grants for the Runway Safety Area project. Capital Assets (net of depreciation) and Capital Needs Assessment A summary of Capital Assets, net of depreciation and amortization as of June 30 follows (in millions):
2014%
Change 2013%
Change 2012Capital assets:
Land $ 523.3 0.0% $ 523.2 0.5% $ 520.8Noise easements and air 25.9 10.2% 23.5 0.0% 23.5Construction in progress 200.7 1.8% 197.1 12.6% 175.0Buildings and improvements 328.6 -6.6% 351.9 -7.2% 379.1Container cranes 59.5 -8.0% 64.7 -7.6% 70.0Infrastructure 1,020.5 1.9% 1,001.9 2.0% 981.9Software 9.3 -12.3% 10.6 12.8% 9.4Other equipment 29.0 10.7% 26.2 0.8% 26.0
Total $ 2,196.8 -0.1% $ 2,199.1 0.6% $ 2,185.7
Net capital assets decreased by approximately $2.3 million or 0.1% in fiscal year 2014, due to capital asset additions of $105.1 million offset by retirements and abandoned construction in progress of $8.2 million and an increase in accumulated depreciation of $99.3 million. Major additions to capital assets in fiscal year 2014 included electrical infrastructure for the Shore Power Program; BART – Oakland Airport Connector; Airport Terminal 1 retrofit and renovation; Airport Runway Safety Area project; and redevelopment of the former Oakland Army Base.
Port of Oakland (A Component Unit of the City of Oakland)
Management’s Discussion and Analysis (unaudited) June 30, 2014 and 2013
13
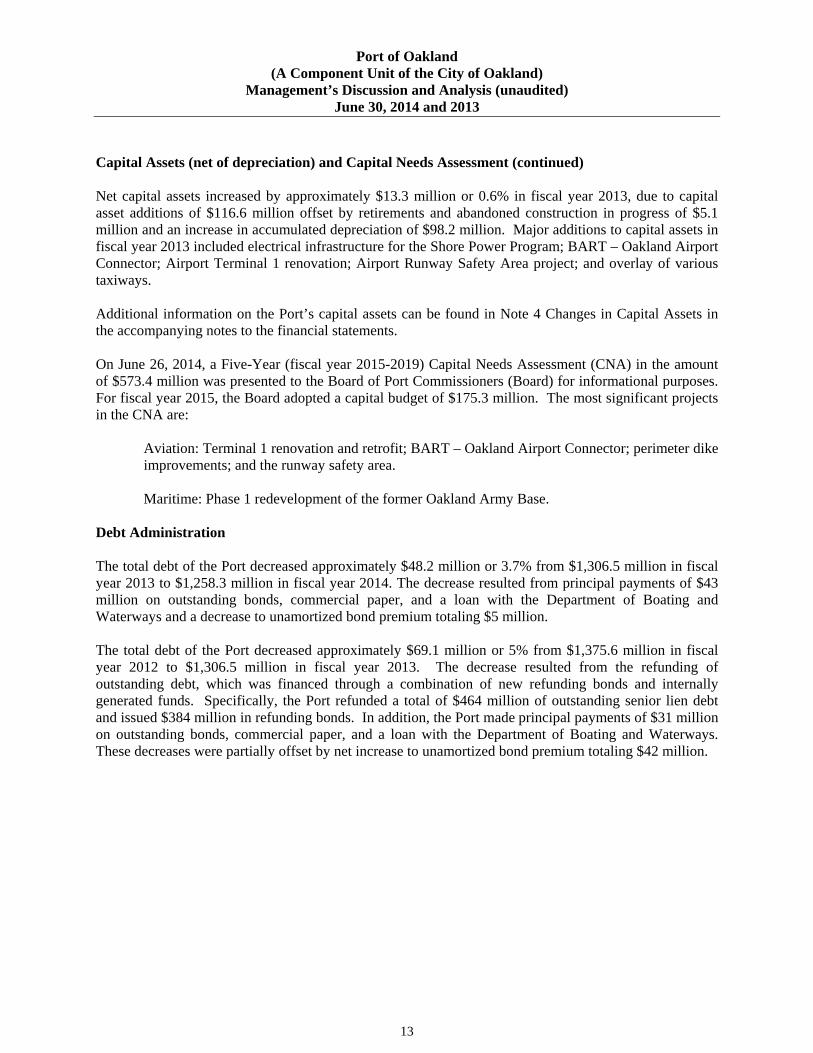
Capital Assets (net of depreciation) and Capital Needs Assessment (continued) Net capital assets increased by approximately $13.3 million or 0.6% in fiscal year 2013, due to capital asset additions of $116.6 million offset by retirements and abandoned construction in progress of $5.1 million and an increase in accumulated depreciation of $98.2 million. Major additions to capital assets in fiscal year 2013 included electrical infrastructure for the Shore Power Program; BART – Oakland Airport Connector; Airport Terminal 1 renovation; Airport Runway Safety Area project; and overlay of various taxiways. Additional information on the Port’s capital assets can be found in Note 4 Changes in Capital Assets in the accompanying notes to the financial statements. On June 26, 2014, a Five-Year (fiscal year 2015-2019) Capital Needs Assessment (CNA) in the amount of $573.4 million was presented to the Board of Port Commissioners (Board) for informational purposes. For fiscal year 2015, the Board adopted a capital budget of $175.3 million. The most significant projects in the CNA are:
Aviation: Terminal 1 renovation and retrofit; BART – Oakland Airport Connector; perimeter dike improvements; and the runway safety area. Maritime: Phase 1 redevelopment of the former Oakland Army Base.
Debt Administration The total debt of the Port decreased approximately $48.2 million or 3.7% from $1,306.5 million in fiscal year 2013 to $1,258.3 million in fiscal year 2014. The decrease resulted from principal payments of $43 million on outstanding bonds, commercial paper, and a loan with the Department of Boating and Waterways and a decrease to unamortized bond premium totaling $5 million. The total debt of the Port decreased approximately $69.1 million or 5% from $1,375.6 million in fiscal year 2012 to $1,306.5 million in fiscal year 2013. The decrease resulted from the refunding of outstanding debt, which was financed through a combination of new refunding bonds and internally generated funds. Specifically, the Port refunded a total of $464 million of outstanding senior lien debt and issued $384 million in refunding bonds. In addition, the Port made principal payments of $31 million on outstanding bonds, commercial paper, and a loan with the Department of Boating and Waterways. These decreases were partially offset by net increase to unamortized bond premium totaling $42 million.
Port of Oakland (A Component Unit of the City of Oakland)
Management’s Discussion and Analysis (unaudited) June 30, 2014 and 2013
14
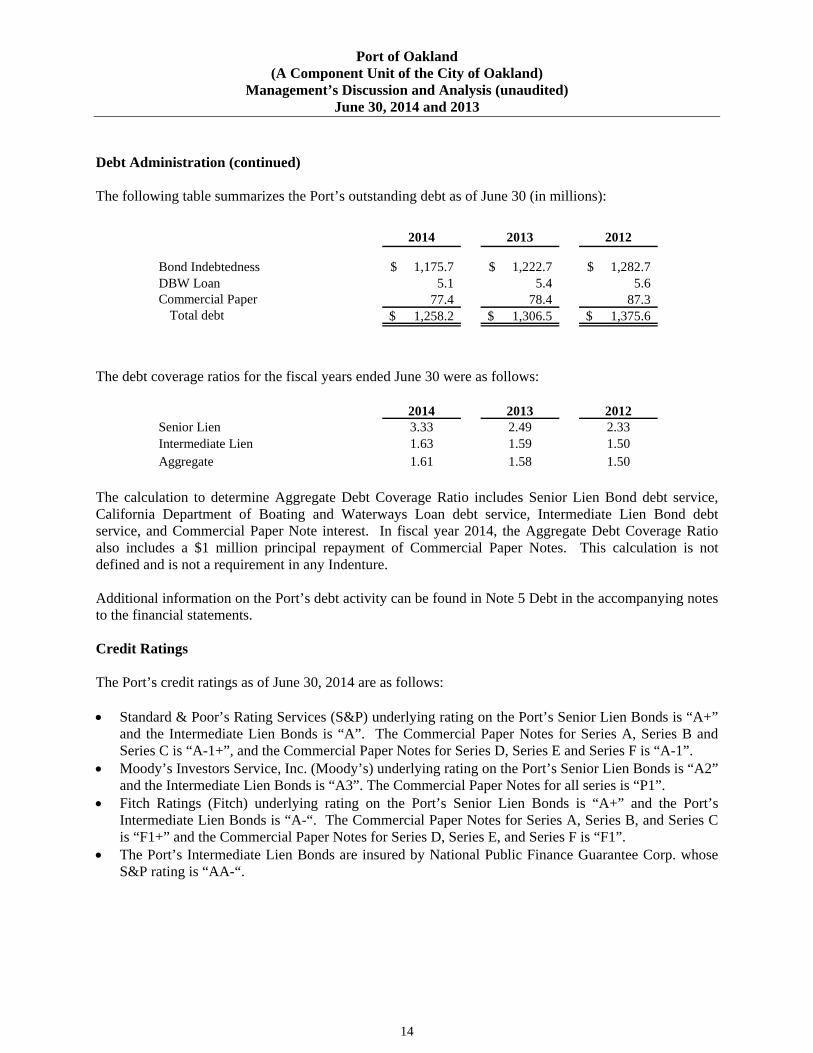
Debt Administration (continued) The following table summarizes the Port’s outstanding debt as of June 30 (in millions):
2014 2013 2012
Bond Indebtedness 1,175.7$ 1,222.7$ 1,282.7$ DBW Loan 5.1 5.4 5.6 Commercial Paper 77.4 78.4 87.3
Total debt 1,258.2$ 1,306.5$ 1,375.6$
The debt coverage ratios for the fiscal years ended June 30 were as follows:
2014 2013 2012Senior Lien 3.33 2.49 2.33Intermediate Lien 1.63 1.59 1.50Aggregate 1.61 1.58 1.50
The calculation to determine Aggregate Debt Coverage Ratio includes Senior Lien Bond debt service, California Department of Boating and Waterways Loan debt service, Intermediate Lien Bond debt service, and Commercial Paper Note interest. In fiscal year 2014, the Aggregate Debt Coverage Ratio also includes a $1 million principal repayment of Commercial Paper Notes. This calculation is not defined and is not a requirement in any Indenture. Additional information on the Port’s debt activity can be found in Note 5 Debt in the accompanying notes to the financial statements. Credit Ratings The Port’s credit ratings as of June 30, 2014 are as follows: Standard & Poor’s Rating Services (S&P) underlying rating on the Port’s Senior Lien Bonds is “A+”
and the Intermediate Lien Bonds is “A”. The Commercial Paper Notes for Series A, Series B and Series C is “A-1+”, and the Commercial Paper Notes for Series D, Series E and Series F is “A-1”.
Moody’s Investors Service, Inc. (Moody’s) underlying rating on the Port’s Senior Lien Bonds is “A2” and the Intermediate Lien Bonds is “A3”. The Commercial Paper Notes for all series is “P1”.
Fitch Ratings (Fitch) underlying rating on the Port’s Senior Lien Bonds is “A+” and the Port’s Intermediate Lien Bonds is “A-“. The Commercial Paper Notes for Series A, Series B, and Series C is “F1+” and the Commercial Paper Notes for Series D, Series E, and Series F is “F1”.
The Port’s Intermediate Lien Bonds are insured by National Public Finance Guarantee Corp. whose S&P rating is “AA-“.
Port of Oakland (A Component Unit of the City of Oakland)
Management’s Discussion and Analysis (unaudited) June 30, 2014 and 2013
15
Notes to the Financial Statements The notes to the Port’s financial statements can be found on pages 23-58 of this report. These notes provide additional information that is essential to a full understanding of the financial statements. Facts and Conditions Affecting the Port’s Operation Aviation The Airport is one of three commercial airports serving the San Francisco Bay Area; the Airport, San Francisco International (SFO), and Norman Mineta San Jose International (SJC). The Bay Area airports, especially the Airport and SFO, serve overlapping markets and compete for passengers who frequently consider more than one Bay Area airport when purchasing air travel. Additionally, airlines may shift their operations among the Bay Area airports based upon local competition and each airline's market share goals. Air carriers also consider airport operating costs, the availability of airport facilities and, in some cases, the location of existing alliance partner flight activity as contributing factors in their flight schedule decision-making process. In addition to the aforementioned factors, the activity levels at the Airport are also sensitive to general economic conditions, acts of terrorism or disease epidemic/pandemic which could significantly impact demand for air travel. The Airport is unable to predict how market competition or future economic conditions will affect the Airport’s operations. Maritime The Seaport competes for market share with respect to discretionary intermodal rail cargo with other U.S. West Coast ports, as well as with ports in other parts of the U.S. and in Canada and Mexico. Future developments, including but not limited to the widening of the Panama Canal, could result in greater diversion of this type of cargo from West Coast ports to East Coast and Gulf ports. Expansion of other ports could also cause a decrease in the Port’s market share of discretionary intermodal rail cargo. As the Seaport continues to work towards expanding its market share of such cargo, these types of developments may adversely affect the Seaport. However, the Seaport cannot predict the scope of potential impacts at this time. The Seaport’s competitive position on the West Coast and in the U.S. is also affected by the availability and productivity of labor on the marine terminals. The bargaining agreement between the International Longshore and Warehouse Union and the Pacific Maritime Association, expired on July 1, 2014. Negotiations are ongoing but concerns of labor instability and work stoppages may lead to the diversion of cargo from or between U.S. West Coast ports, including the Seaport. Potential disruptions at the various U.S. West Coast ports may not be equal, and therefore, could lead to an increase or a decrease of cargo activity, as cargo is diverted either from or to the other U.S. West Coast ports. The impacts, if any, of the on-going negotiations cannot be estimated at this time. Historically, the Port has managed a balance of import and export trade, leading with a strong export base of California’s premium agricultural products and other U.S. goods bound for foreign markets. The State of California is currently experiencing one of its worst droughts on record, with significant impacts to the State’s agricultural industry. The overall economic impact of the drought depends on a number of complex and inter-related factors, and it is therefore difficult to quantify and predict how the drought may impact the Port’s cargo activity or how long those impacts, if any, may last.
Port of Oakland (A Component Unit of the City of Oakland)
Management’s Discussion and Analysis (unaudited) June 30, 2014 and 2013
16
Commercial Real Estate Over the last decade, the Commercial Real Estate Division has leased most of its properties to developers or tenants under long-term ground leases, under which the developer or tenant is responsible for the development, subleasing, operation and maintenance of the improvements on the properties. The Port continues to work with the developers to ensure the properties are developed and managed in ways that are compliant with California Tidelands Trust regulations, however most of the development cost and financial risk is held by the developers. Contacting the Port’s Financial Management Requests for additional information about this report, should be addressed to the Financial Services Division, Port of Oakland, 530 Water Street, Oakland, California 94607 or visit the website at www.portofoakland.com.

17
This page left intentionally blank.
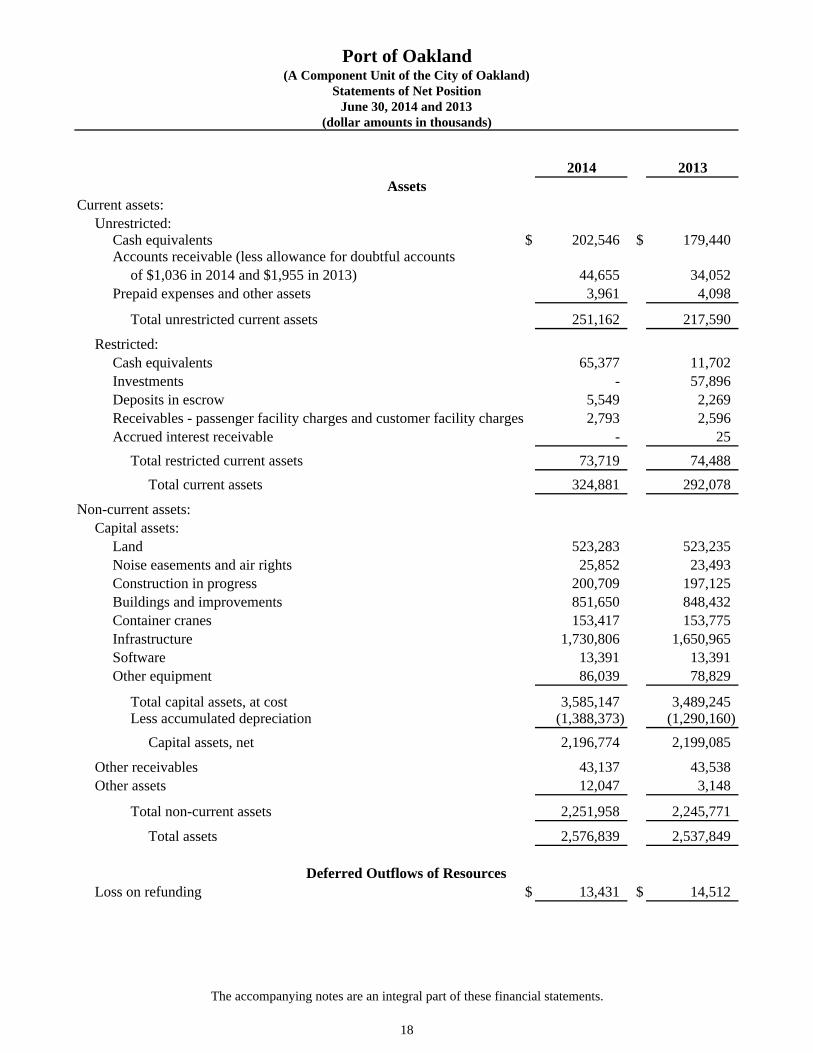
2014 2013
Current assets:Unrestricted:
Cash equivalents $ 202,546 $ 179,440Accounts receivable (less allowance for doubtful accounts
of $1,036 in 2014 and $1,955 in 2013) 44,655 34,052Prepaid expenses and other assets 3,961 4,098
Total unrestricted current assets 251,162 217,590
Restricted:Cash equivalents 65,377 11,702Investments - 57,896 Deposits in escrow 5,549 2,269Receivables - passenger facility charges and customer facility charges 2,793 2,596Accrued interest receivable - 25
Total restricted current assets 73,719 74,488Total current assets 324,881 292,078
Non-current assets:Capital assets:
Land 523,283 523,235Noise easements and air rights 25,852 23,493Construction in progress 200,709 197,125Buildings and improvements 851,650 848,432Container cranes 153,417 153,775Infrastructure 1,730,806 1,650,965Software 13,391 13,391Other equipment 86,039 78,829
Total capital assets, at cost 3,585,147 3,489,245Less accumulated depreciation (1,388,373) (1,290,160)
Capital assets, net 2,196,774 2,199,085
Other receivables 43,137 43,538Other assets 12,047 3,148
Total non-current assets 2,251,958 2,245,771
Total assets 2,576,839 2,537,849
Loss on refunding $ 13,431 $ 14,512
Assets
Deferred Outflows of Resources
Port of Oakland(A Component Unit of the City of Oakland)
Statements of Net PositionJune 30, 2014 and 2013
(dollar amounts in thousands)
The accompanying notes are an integral part of these financial statements.
18
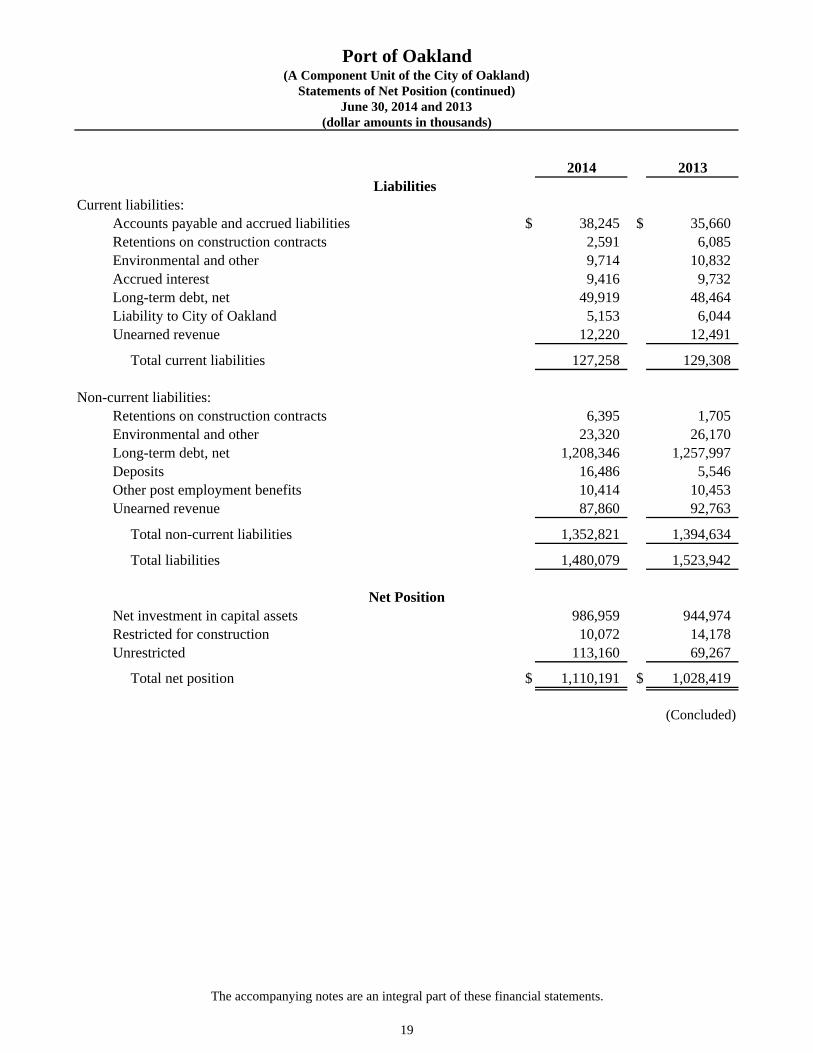
2014 2013
Current liabilities:Accounts payable and accrued liabilities $ 38,245 $ 35,660Retentions on construction contracts 2,591 6,085Environmental and other 9,714 10,832Accrued interest 9,416 9,732Long-term debt, net 49,919 48,464Liability to City of Oakland 5,153 6,044Unearned revenue 12,220 12,491
Total current liabilities 127,258 129,308
Non-current liabilities:Retentions on construction contracts 6,395 1,705Environmental and other 23,320 26,170Long-term debt, net 1,208,346 1,257,997Deposits 16,486 5,546Other post employment benefits 10,414 10,453Unearned revenue 87,860 92,763
Total non-current liabilities 1,352,821 1,394,634
Total liabilities 1,480,079 1,523,942
Net investment in capital assets 986,959 944,974Restricted for construction 10,072 14,178Unrestricted 113,160 69,267
Total net position $ 1,110,191 $ 1,028,419
(Concluded)
Net Position
Liabilities
Port of Oakland(A Component Unit of the City of Oakland)
Statements of Net Position (continued)June 30, 2014 and 2013
(dollar amounts in thousands)
The accompanying notes are an integral part of these financial statements.
19
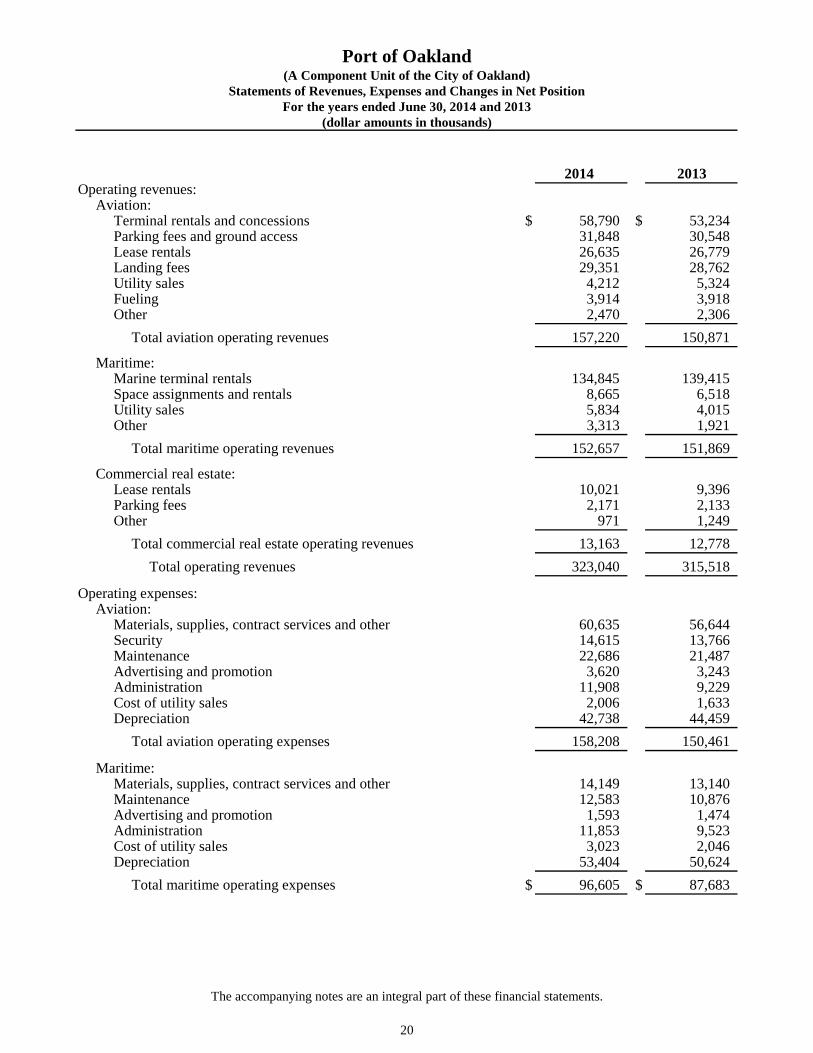
2014 2013Operating revenues:
Aviation:Terminal rentals and concessions $ 58,790 $ 53,234Parking fees and ground access 31,848 30,548Lease rentals 26,635 26,779Landing fees 29,351 28,762Utility sales 4,212 5,324Fueling 3,914 3,918Other 2,470 2,306
Total aviation operating revenues 157,220 150,871
Maritime: Marine terminal rentals 134,845 139,415
Space assignments and rentals 8,665 6,518Utility sales 5,834 4,015Other 3,313 1,921
Total maritime operating revenues 152,657 151,869
Commercial real estate:Lease rentals 10,021 9,396Parking fees 2,171 2,133Other 971 1,249
Total commercial real estate operating revenues 13,163 12,778Total operating revenues 323,040 315,518
Operating expenses:Aviation:
Materials, supplies, contract services and other 60,635 56,644Security 14,615 13,766Maintenance 22,686 21,487Advertising and promotion 3,620 3,243Administration 11,908 9,229Cost of utility sales 2,006 1,633Depreciation 42,738 44,459
Total aviation operating expenses 158,208 150,461
Maritime:Materials, supplies, contract services and other 14,149 13,140Maintenance 12,583 10,876Advertising and promotion 1,593 1,474Administration 11,853 9,523Cost of utility sales 3,023 2,046Depreciation 53,404 50,624
Total maritime operating expenses $ 96,605 $ 87,683
(A Component Unit of the City of Oakland)Port of Oakland
(dollar amounts in thousands)For the years ended June 30, 2014 and 2013
Statements of Revenues, Expenses and Changes in Net Position
The accompanying notes are an integral part of these financial statements.
20
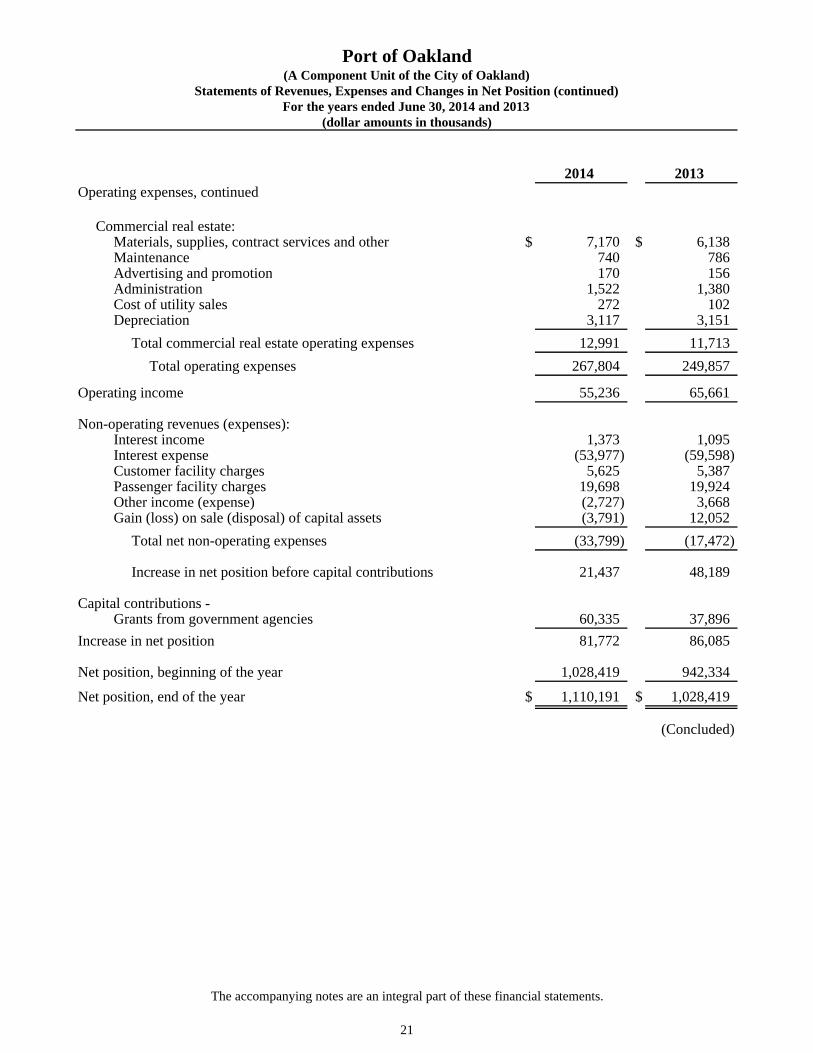
2014 2013Operating expenses, continued
Commercial real estate: Materials, supplies, contract services and other $ 7,170 $ 6,138Maintenance 740 786Advertising and promotion 170 156Administration 1,522 1,380Cost of utility sales 272 102Depreciation 3,117 3,151
Total commercial real estate operating expenses 12,991 11,713Total operating expenses 267,804 249,857
Operating income 55,236 65,661
Non-operating revenues (expenses):Interest income 1,373 1,095Interest expense (53,977) (59,598)Customer facility charges 5,625 5,387Passenger facility charges 19,698 19,924Other income (expense) (2,727) 3,668Gain (loss) on sale (disposal) of capital assets (3,791) 12,052
Total net non-operating expenses (33,799) (17,472)
Increase in net position before capital contributions 21,437 48,189
Capital contributions - Grants from government agencies 60,335 37,896
Increase in net position 81,772 86,085
Net position, beginning of the year 1,028,419 942,334
Net position, end of the year $ 1,110,191 $ 1,028,419
(Concluded)
Port of Oakland
(dollar amounts in thousands)For the years ended June 30, 2014 and 2013
Statements of Revenues, Expenses and Changes in Net Position (continued)(A Component Unit of the City of Oakland)
The accompanying notes are an integral part of these financial statements.
21
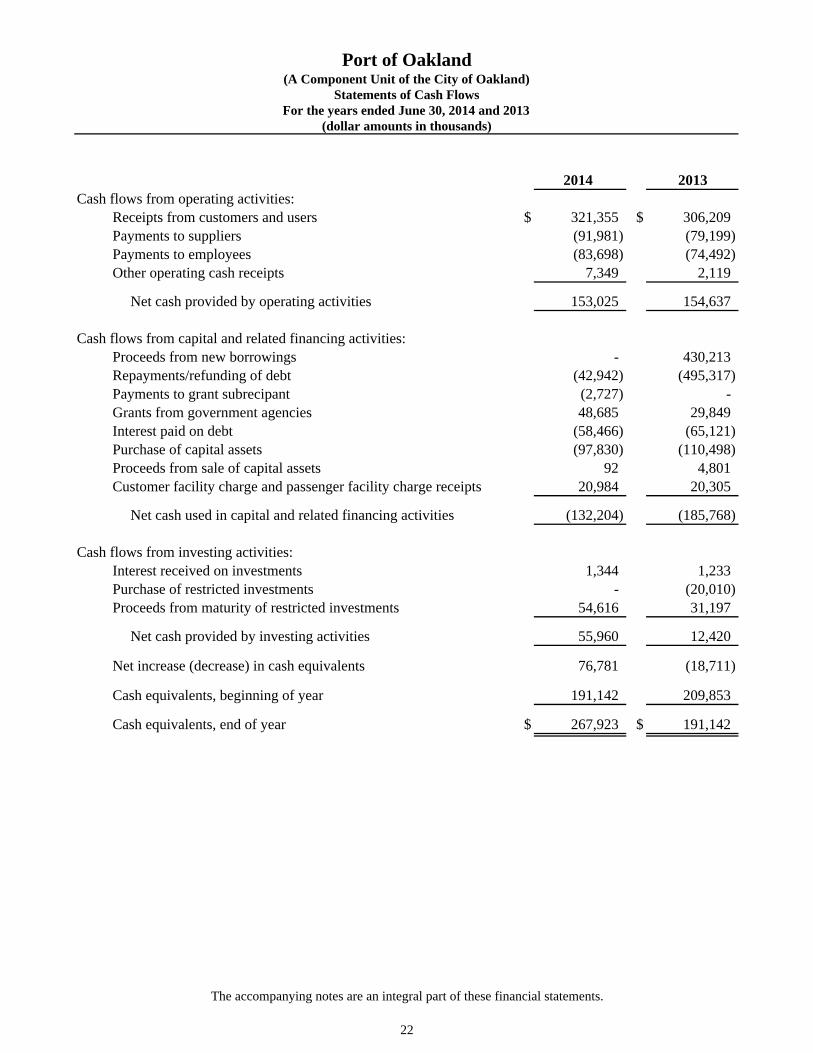
2014 2013Cash flows from operating activities:
Receipts from customers and users $ 321,355 $ 306,209Payments to suppliers (91,981) (79,199)Payments to employees (83,698) (74,492)Other operating cash receipts 7,349 2,119
Net cash provided by operating activities 153,025 154,637
Cash flows from capital and related financing activities:Proceeds from new borrowings - 430,213Repayments/refunding of debt (42,942) (495,317)Payments to grant subrecipant (2,727) - Grants from government agencies 48,685 29,849Interest paid on debt (58,466) (65,121)Purchase of capital assets (97,830) (110,498)Proceeds from sale of capital assets 92 4,801 Customer facility charge and passenger facility charge receipts 20,984 20,305
Net cash used in capital and related financing activities (132,204) (185,768)
Cash flows from investing activities:Interest received on investments 1,344 1,233Purchase of restricted investments - (20,010)Proceeds from maturity of restricted investments 54,616 31,197
Net cash provided by investing activities 55,960 12,420
Net increase (decrease) in cash equivalents 76,781 (18,711)
Cash equivalents, beginning of year 191,142 209,853
Cash equivalents, end of year $ 267,923 $ 191,142
Port of Oakland
(dollar amounts in thousands)For the years ended June 30, 2014 and 2013
Statements of Cash Flows(A Component Unit of the City of Oakland)
The accompanying notes are an integral part of these financial statements.
22
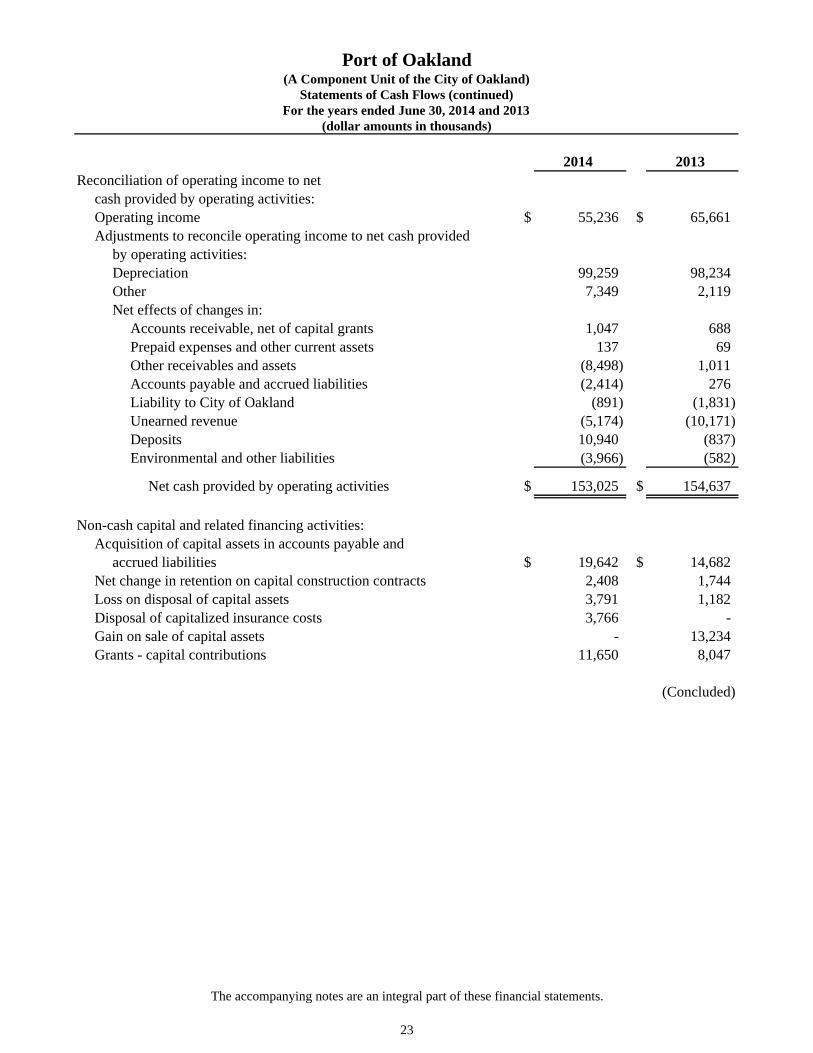
2014 2013Reconciliation of operating income to net
cash provided by operating activities:Operating income $ 55,236 $ 65,661Adjustments to reconcile operating income to net cash provided
by operating activities:Depreciation 99,259 98,234Other 7,349 2,119Net effects of changes in:
Accounts receivable, net of capital grants 1,047 688Prepaid expenses and other current assets 137 69Other receivables and assets (8,498) 1,011Accounts payable and accrued liabilities (2,414) 276Liability to City of Oakland (891) (1,831)Unearned revenue (5,174) (10,171)Deposits 10,940 (837)Environmental and other liabilities (3,966) (582)
Net cash provided by operating activities $ 153,025 $ 154,637
Non-cash capital and related financing activities:Acquisition of capital assets in accounts payable and
accrued liabilities $ 19,642 $ 14,682Net change in retention on capital construction contracts 2,408 1,744Loss on disposal of capital assets 3,791 1,182Disposal of capitalized insurance costs 3,766 - Gain on sale of capital assets - 13,234Grants - capital contributions 11,650 8,047
(Concluded)
Port of Oakland
(dollar amounts in thousands)For the years ended June 30, 2014 and 2013
Statements of Cash Flows (continued)(A Component Unit of the City of Oakland)
The accompanying notes are an integral part of these financial statements.
23

24
This page left intentionally blank.
Port of Oakland (A Component Unit of the City of Oakland)
Notes to Financial Statements For the years ended June 30, 2014 and 2013
25
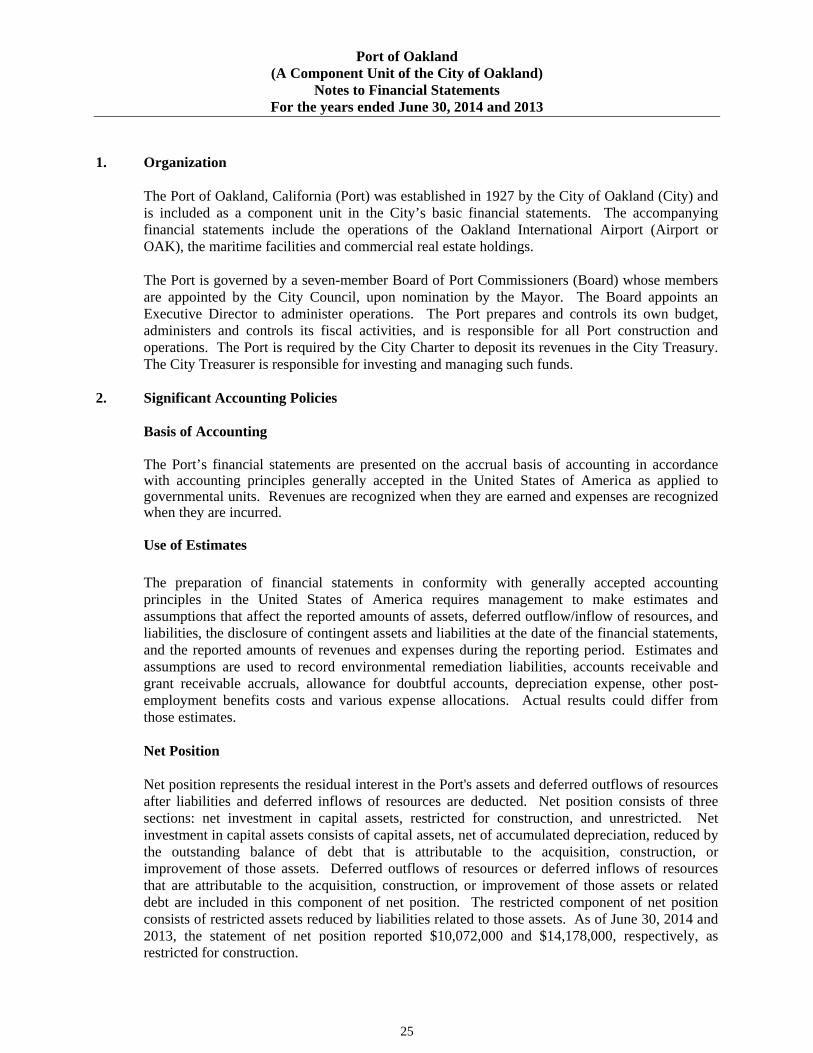
1. Organization
The Port of Oakland, California (Port) was established in 1927 by the City of Oakland (City) and is included as a component unit in the City’s basic financial statements. The accompanying financial statements include the operations of the Oakland International Airport (Airport or OAK), the maritime facilities and commercial real estate holdings.
The Port is governed by a seven-member Board of Port Commissioners (Board) whose members are appointed by the City Council, upon nomination by the Mayor. The Board appoints an Executive Director to administer operations. The Port prepares and controls its own budget, administers and controls its fiscal activities, and is responsible for all Port construction and operations. The Port is required by the City Charter to deposit its revenues in the City Treasury. The City Treasurer is responsible for investing and managing such funds.
2. Significant Accounting Policies
Basis of Accounting
The Port’s financial statements are presented on the accrual basis of accounting in accordance with accounting principles generally accepted in the United States of America as applied to governmental units. Revenues are recognized when they are earned and expenses are recognized when they are incurred.
Use of Estimates
The preparation of financial statements in conformity with generally accepted accounting principles in the United States of America requires management to make estimates and assumptions that affect the reported amounts of assets, deferred outflow/inflow of resources, and liabilities, the disclosure of contingent assets and liabilities at the date of the financial statements, and the reported amounts of revenues and expenses during the reporting period. Estimates and assumptions are used to record environmental remediation liabilities, accounts receivable and grant receivable accruals, allowance for doubtful accounts, depreciation expense, other post-employment benefits costs and various expense allocations. Actual results could differ from those estimates. Net Position
Net position represents the residual interest in the Port's assets and deferred outflows of resources after liabilities and deferred inflows of resources are deducted. Net position consists of three sections: net investment in capital assets, restricted for construction, and unrestricted. Net investment in capital assets consists of capital assets, net of accumulated depreciation, reduced by the outstanding balance of debt that is attributable to the acquisition, construction, or improvement of those assets. Deferred outflows of resources or deferred inflows of resources that are attributable to the acquisition, construction, or improvement of those assets or related debt are included in this component of net position. The restricted component of net position consists of restricted assets reduced by liabilities related to those assets. As of June 30, 2014 and 2013, the statement of net position reported $10,072,000 and $14,178,000, respectively, as restricted for construction.
Port of Oakland (A Component Unit of the City of Oakland)
Notes to Financial Statements For the years ended June 30, 2014 and 2013
26
Cash Equivalents The Port considers highly liquid investments with a maturity of three months or less when purchased to be cash equivalents. The Port's cash and investments in the City Treasury are, in substance, demand deposits and are considered cash equivalents. Investments
The Port reports its investments at fair value in the accompanying financial statements and the corresponding change in fair value of investments is reported in the year in which the change occurs. Fair value is based upon quoted market prices. Accounts Receivable and Allowance for Doubtful Accounts Accounts receivable are recorded for invoices issued to customers and granting agencies in accordance with contractual arrangements. The allowance for doubtful accounts is based on a tiered percentage of significantly aged receivables. Accounts receivable are written-off against the allowance when deemed uncollectible. Recoveries of receivables previously written-off are recorded when received. Restricted Assets
Assets whose use is restricted to specific purposes by bond indenture or regulation are segregated on the statements of net position. Capital Assets
Capital assets are stated at cost and it is the policy of the Port to capitalize all expenses related to capital assets greater than $5,000. Interest costs applicable to qualifying assets are capitalized as part of the cost of the assets. Interest earned on temporary investment of the proceeds from qualifying tax-exempt debt is offset against interest costs capitalized. Depreciation expense is calculated using the straight-line method over the following estimated useful lives of the assets:
Buildings and improvements 5 to 50 years Container cranes 25 years Infrastructure 10 to 50 years Other equipment 5 to 10 years Intangible assets 20 years
Tenant improvements paid for by the tenants and owned by the Port are recorded as capital assets with an offsetting credit to unearned revenue. The asset is amortized over the shorter of the life of the lease or the life of the asset and the unearned revenue is amortized over the same terms. Intangible assets which are identifiable are recorded as capital assets. The Port has identified noise easements, air rights and computer software development costs as intangible assets. Intangible assets not having indefinite useful lives are amortized over the estimated useful life of the asset.
Port of Oakland (A Component Unit of the City of Oakland)
Notes to Financial Statements For the years ended June 30, 2014 and 2013
27
Other Receivables
Other receivables include future lease receipts from a fifty-year finance lease agreement associated with the sale and lease of the Marina as discussed in Note 7, and a note receivable associated with the sale and lease of the Oak-to-Ninth property as discussed in Note 4. Loss on Refunding The loss on refunding at the time of a refunding is reported as deferred outflow of resources and is amortized as interest expense over the shorter of the remaining life of the refunded bonds or life of the new bonds. Unearned Revenue Unearned interest revenue and prepaid rent related to tenant leases are deferred and amortized principally on the straight-line method over the life of the remaining lease term. Compensated Absences
The Port accrues employee benefits, including accumulated vacation and sick leave, as liabilities in the period the benefits are earned.
Operating Revenues and Expenses
Operating revenues and expenses consist of those revenues and expenses that result from the ongoing principal operations of the Port. Operating revenues consist primarily of charges for services. Non-operating revenues and expenses consist of those revenues and expenses that are related to financing and investing activities. When an expense is incurred for purposes for which there are both restricted and unrestricted assets available, it is the Port’s policy to first utilize available restricted assets and then to utilize unrestricted assets.
Allocation of Expenses to the Port Businesses
The Port records to each of its revenue divisions (Aviation, Maritime, and Commercial Real Estate) expenses directly related to those operations. In addition, the Port annually allocates indirect expenses to these divisions based on an expense allocation methodology. Allocated expenses include general operating expenses, maintenance, advertising and promotion, and administrative expenses. Grants from Government Agencies
Grants are, for the most part, restricted for the acquisition or construction of capital assets. Such grants are recorded as revenue when all eligibility requirements imposed by the provider have been met.
Port of Oakland (A Component Unit of the City of Oakland)
Notes to Financial Statements For the years ended June 30, 2014 and 2013
28
Passenger Facility Charges
The Port, as authorized by the Federal Aviation Administration (FAA) pursuant to the Aviation Safety and Capacity Expansion Act of 1990 (the Act), as amended, currently imposes a Passenger Facility Charge (PFC) of $4.50 for each enplaning passenger at the Airport. Under the Act, air carriers are responsible for the collection of PFC charges and are required to remit PFC revenues to the Port in the following month after they are recorded by the air carrier. The Port has three approved and active applications with the FAA to collect and use PFC funds for specific purposes. The current authority to impose PFCs is estimated to end March 1, 2032. PFC revenues, including any interest earned thereon, are restricted solely to finance allowable costs of new airport planning and development projects as defined and authorized by the FAA. PFC revenues may be used to pay debt service and related expenditures associated with FAA approved projects and the Port has received FAA approval to pay certain debt service if debt proceeds are used for qualifying projects. PFC revenues are recorded as non-operating revenue and any unspent PFC revenues are recorded as restricted cash. Customer Facility Charges
Under Section 1936 of the California Civil Code, and pursuant to a Port ordinance effective January 2009, the rental car companies operating at the Airport are required to collect from the rental customers and remit to the Port a $10-per-transaction Customer Facility Charge (CFC). The revenues from CFCs collected by the Port are funding the common use shuttle bus operations between the terminal and rental car facility and are eligible to fund common use capital improvements. CFC revenues are recorded as non-operating revenue and any unspent CFC revenues are recorded as restricted cash. New Accounting Pronouncements Not Yet Adopted In June 2012, GASB issued Statement No. 68, Accounting and Financial Reporting for Pensions. The significant changes in this statement address (1) the measurement of pension obligations that derive liabilities (or assets); and (2) the calculations behind pension expense. GASB 68 also covers:
Deferred outflows and deferred inflows of resources; Methods and assumptions of pension calculations, including how to calculate the
discount rate to be used and how to attribute the pension liability to various periods; Note disclosure and required supplementary information; and Defined contribution pension plan reporting.
Application of this statement is effective for the Port’s fiscal year ending June 30, 2015.
Port of Oakland (A Component Unit of the City of Oakland)
Notes to Financial Statements For the years ended June 30, 2014 and 2013
29
New Accounting Pronouncements Not Yet Adopted (continued) In November 2013, GASB issued Statement No. 71, Pensions Transition for Contributions Made Subsequent to the Measurement Date-an amendment of GASB Statement No. 68. This Statement addresses an issue regarding application of the transition provisions of the GASB Statement No. 68, Accounting and Financial Reporting for Pensions. The issue relates to amounts associated with contributions, if any, made by the state or local government employer or nonemployer contributing entity to a defined benefit pension plan after the measurement date of the government’s beginning net pension liability. Application of this statement is effective for the Port’s fiscal year ending June 30, 2015.
3. Cash, Cash Equivalents, Investments, and Deposits
The Port's cash, cash equivalents, investments and deposits in escrow consisted of the following at June 30 (in thousands):
2014 2013
U.S. Treasury Notes $ - $ 57,896 Government Securities Money Market Mutual Funds 58,098 120 City Investment Pool 209,200 190,396 Deposits in Escrow 5,549 2,269 Bank Deposits and Cash on Hand 625 626
$ 273,472 $ 251,307
Deposits in Escrow Deposits in escrow consist of amounts received from construction contractors that are deposited into an escrow account in-lieu of retention withheld from construction progress billings. Interest on these deposits accrues to the contractor. Investments Under the City Charter, all cash receipts from the operations of the Port are deposited in the City Investment Pool. These funds are invested by the City, pursuant to an Investment Policy, which it administers and reviews annually. For this reason, the Port does not maintain a policy of its own, and relies on the City Investment Policy to mitigate the risks described below. Senior Lien Bonds reserves are on deposit with the Senior Lien Bonds trustee. The investment of funds held by the Senior Lien Bonds trustee is governed by the Senior Trust Indenture and is currently invested in either 1) U.S. Treasury Notes or 2) Government Securities Money Market Mutual Funds. There were no investments pertaining to the Intermediate Lien Debt.
Port of Oakland (A Component Unit of the City of Oakland)
Notes to Financial Statements For the years ended June 30, 2014 and 2013
30
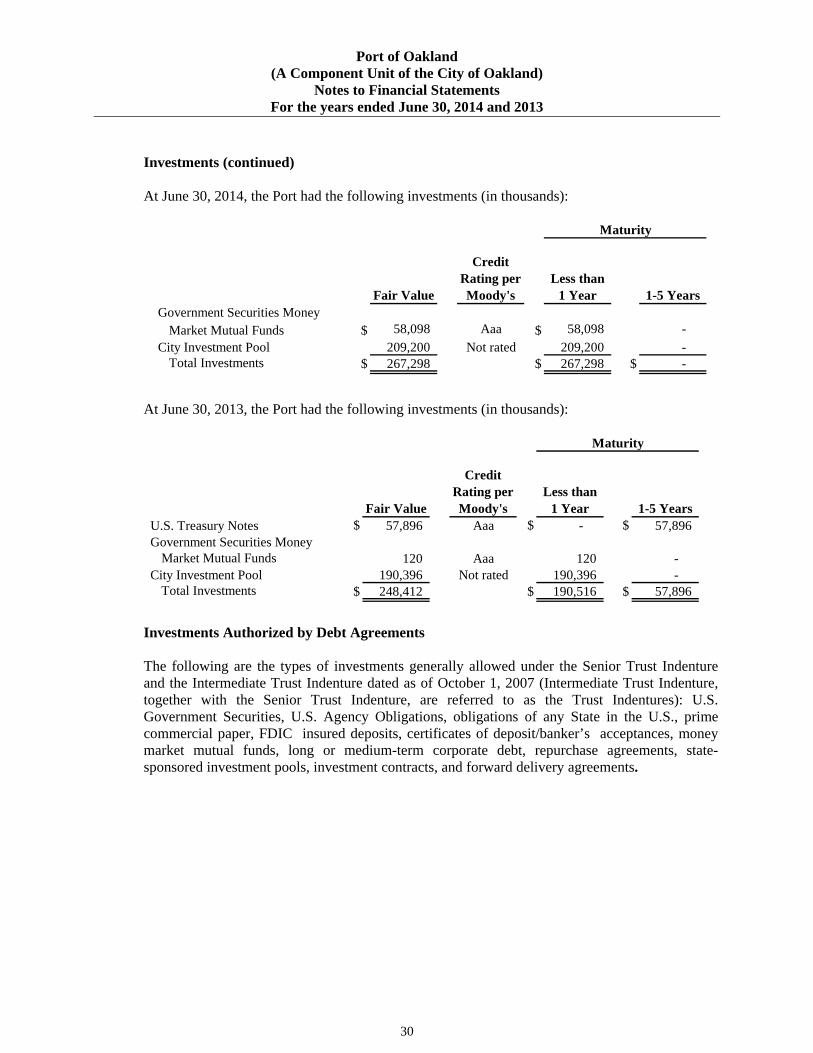
Investments (continued) At June 30, 2014, the Port had the following investments (in thousands):
Fair Value
Credit Rating per Moody's
Less than 1 Year 1-5 Years
Government Securities Money Market Mutual Funds $ 58,098 Aaa $ 58,098 -
City Investment Pool 209,200 Not rated 209,200 - Total Investments $ 267,298 $ 267,298 $ -
Maturity
At June 30, 2013, the Port had the following investments (in thousands):
Fair Value
Credit Rating per Moody's
Less than 1 Year 1-5 Years
U.S. Treasury Notes $ 57,896 Aaa $ - $ 57,896 Government Securities Money
Market Mutual Funds 120 Aaa 120 - City Investment Pool 190,396 Not rated 190,396 -
Total Investments $ 248,412 $ 190,516 $ 57,896
Maturity
Investments Authorized by Debt Agreements The following are the types of investments generally allowed under the Senior Trust Indenture and the Intermediate Trust Indenture dated as of October 1, 2007 (Intermediate Trust Indenture, together with the Senior Trust Indenture, are referred to as the Trust Indentures): U.S. Government Securities, U.S. Agency Obligations, obligations of any State in the U.S., prime commercial paper, FDIC insured deposits, certificates of deposit/banker’s acceptances, money market mutual funds, long or medium-term corporate debt, repurchase agreements, state-sponsored investment pools, investment contracts, and forward delivery agreements.
Port of Oakland (A Component Unit of the City of Oakland)
Notes to Financial Statements For the years ended June 30, 2014 and 2013
31
Interest Rate Risk This risk represents the possibility that an interest rate change could adversely affect an investment’s fair value. In order to manage interest rate risk:
Proceeds from bonds are invested in permitted investments, as stated in the Trust Indentures, with short term maturities.
The deposits with the City Treasury pursuant to the City’s Investment Policy and Section 53601 of the State of California Government Code, limits certain investments to short-term maturities of 360 days and 270 days, respectively. Also, Section 53601 limits the maximum maturity of any investment to be no longer than 5 years unless authority for such investment is expressly granted in advance by the City Council or authorized by bond covenants.
Credit Risk This risk represents the possibility that the issuer/counterparty to an investment will be unable to fulfill its obligation.
In order to manage credit risk:
Provisions of the Trust Indentures prescribe restrictions on the types of permitted
investments of the monies held by the trustee in the funds and accounts created under the Trust Indentures, including agreements or financial institutions that must meet certain ratings, such as certain investments that must be rated in either of the two highest ratings by S&P and Moody’s.
The deposits with the City Treasury are invested in short-term debt that is rated at least A-1 by S&P, P-1 by Moody’s or F-1 by Fitch Ratings. Long-term debt shall be rated at least A- by S&P, A3 by Moody’s, and A- by Fitch Ratings.
Port of Oakland (A Component Unit of the City of Oakland)
Notes to Financial Statements For the years ended June 30, 2014 and 2013
32
Concentration of Credit Risk
The Trust Indentures place no limit on the amount the Port may invest in any one issuer. Port revenues are deposited in the City Treasury. These and all City funds are pooled and invested in the City Investment Pool. The City has adopted an investment policy that provides for the following:
The maximum maturity for any one investment may not exceed 5 years. No more than 5 percent of the total assets of the investments held by the City may be
invested in the securities of any one issuer except the obligations of the United States government or government-sponsored enterprises.
Permitted investments include U.S. treasury securities, federal agency and instrumentalities, banker’s acceptances, commercial paper, asset-backed commercial paper, local government investment pools, medium-term notes, negotiable certificates of deposit, repurchase agreements, reverse repurchase agreements, secured obligations and agreements, certificates of deposit, money market mutual funds, state investment pool (Local Agency Investment Fund), local City/agency bonds and State of California obligations, and other local agency bonds.
All investments are to be secured through third party custody and safekeeping procedures. All securities purchased from dealers and brokers are held in safekeeping by the City’s custodial bank, which establishes ownership by the City.
Additional information regarding deposit custodial credit, interest and credit risks, and securities lending transactions of the City Investment Pool is presented in the notes of the City’s basic financial statements. Requests for financial information should be addressed to the Finance and Management Agency, Accounting Division, City of Oakland, 150 Frank H. Ogawa Plaza, Suite 6353, Oakland, California 94612-2093.
Custodial Credit Risk Custodial credit risks is the risk that, in the event of the failure of a depository financial institution or counterparty to a transaction, the Port will not be able to recover the value of its investment or collateral securities that are in possession of another party. To protect against custodial credit risk:
All securities owned by the Port under the terms of the Trust Indentures are held in the name of the Port for safekeeping by a third party bank trust department, acting as an agent for the Port. The Port had investments held by a third party bank trust department in the amount of $58,098,000 and $58,016,000 at June 30, 2014 and 2013, respectively.
All securities owned by the Port and invested by the City are held in the name of the City for safekeeping by a third party bank trust department, acting as an agent for the City under the terms of the Custody Agreements. The Port had $209,200,000 and $190,396,000 invested in the City Investment Pool at June 30, 2014 and 2013, respectively.
Port of Oakland (A Component Unit of the City of Oakland)
Notes to Financial Statements For the years ended June 30, 2014 and 2013
33
Custodial Credit Risk (continued) The carrying amount of the Port’s deposits in escrow was $5,549,000 at June 30, 2014 and $2,269,000 at June 30, 2013. Of this amount, bank balances and escrow deposits of $250,000 on June 30, 2014 and on June 30, 2013, are insured or collateralized with securities held by the pledging financial institution’s trust department in the Port’s name and the remaining balance of $5,218,000 as of June 30, 2014 and $1,839,000 as of June 30, 2013, was exposed to custodial credit risk by not being insured or collateralized.
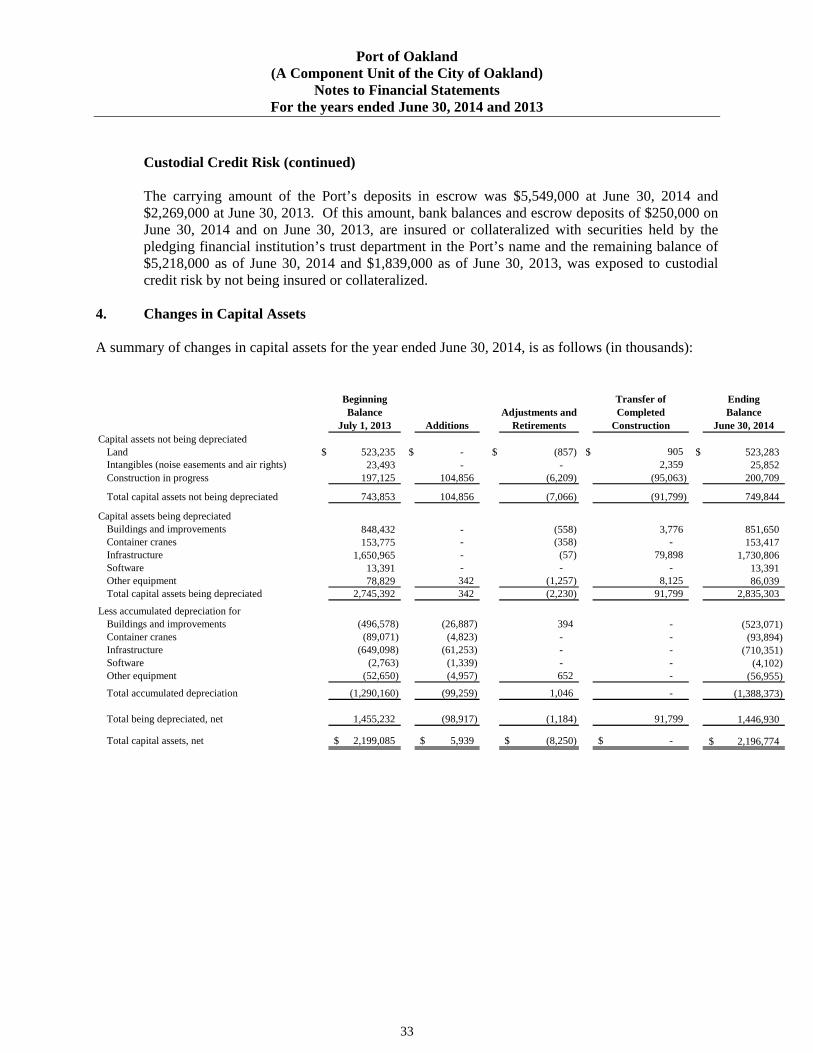
4. Changes in Capital Assets A summary of changes in capital assets for the year ended June 30, 2014, is as follows (in thousands):
Beginning Balance
July 1, 2013 AdditionsAdjustments and
Retirements
Transfer of Completed
Construction
Ending Balance
June 30, 2014Capital assets not being depreciated
Land $ 523,235 $ - $ (857) $ 905 $ 523,283 Intangibles (noise easements and air rights) 23,493 - - 2,359 25,852 Construction in progress 197,125 104,856 (6,209) (95,063) 200,709
Total capital assets not being depreciated 743,853 104,856 (7,066) (91,799) 749,844
Capital assets being depreciatedBuildings and improvements 848,432 - (558) 3,776 851,650 Container cranes 153,775 - (358) - 153,417 Infrastructure 1,650,965 - (57) 79,898 1,730,806 Software 13,391 - - - 13,391 Other equipment 78,829 342 (1,257) 8,125 86,039 Total capital assets being depreciated 2,745,392 342 (2,230) 91,799 2,835,303
Less accumulated depreciation forBuildings and improvements (496,578) (26,887) 394 - (523,071) Container cranes (89,071) (4,823) - - (93,894) Infrastructure (649,098) (61,253) - - (710,351) Software (2,763) (1,339) - - (4,102) Other equipment (52,650) (4,957) 652 - (56,955) Total accumulated depreciation (1,290,160) (99,259) 1,046 - (1,388,373)
Total being depreciated, net 1,455,232 (98,917) (1,184) 91,799 1,446,930
Total capital assets, net 2,199,085$ 5,939$ (8,250)$ -$ 2,196,774$
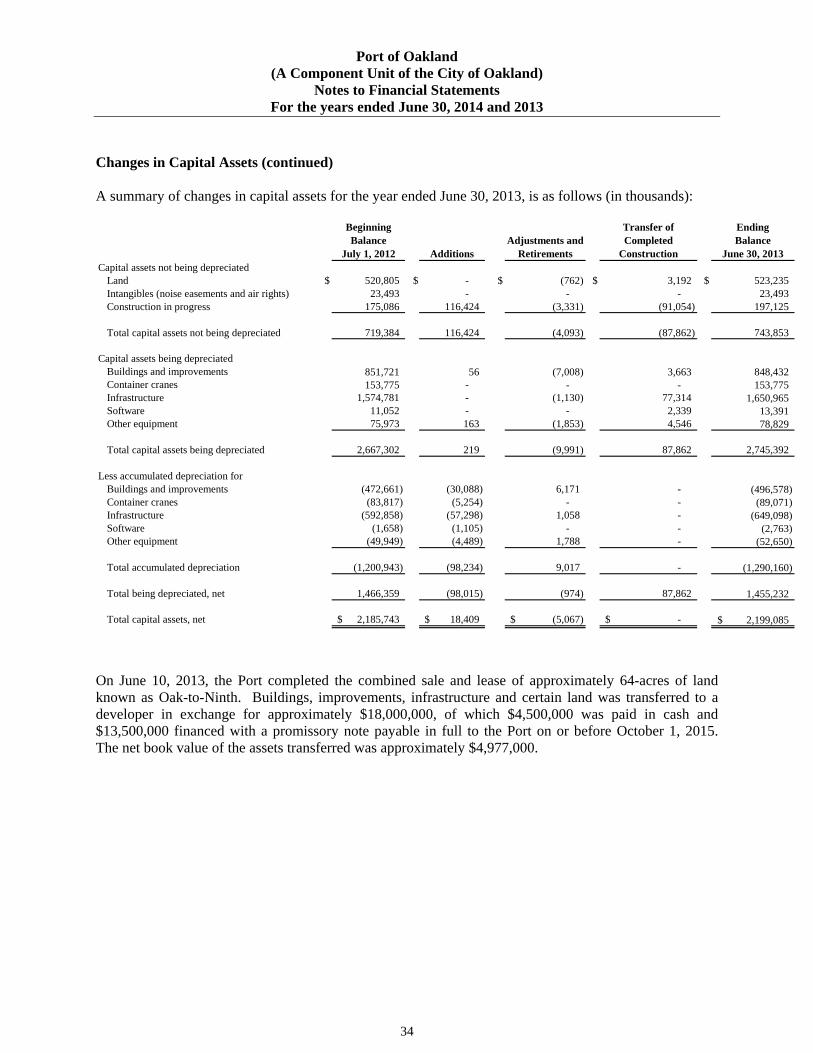
Port of Oakland (A Component Unit of the City of Oakland)
Notes to Financial Statements For the years ended June 30, 2014 and 2013
34
Changes in Capital Assets (continued)
A summary of changes in capital assets for the year ended June 30, 2013, is as follows (in thousands):
Beginning Balance
July 1, 2012 AdditionsAdjustments and
Retirements
Transfer of Completed
Construction
Ending Balance
June 30, 2013Capital assets not being depreciated
Land $ 520,805 $ - $ (762) $ 3,192 $ 523,235 Intangibles (noise easements and air rights) 23,493 - - - 23,493 Construction in progress 175,086 116,424 (3,331) (91,054) 197,125
Total capital assets not being depreciated 719,384 116,424 (4,093) (87,862) 743,853
Capital assets being depreciatedBuildings and improvements 851,721 56 (7,008) 3,663 848,432 Container cranes 153,775 - - - 153,775 Infrastructure 1,574,781 - (1,130) 77,314 1,650,965 Software 11,052 - - 2,339 13,391 Other equipment 75,973 163 (1,853) 4,546 78,829
Total capital assets being depreciated 2,667,302 219 (9,991) 87,862 2,745,392
Less accumulated depreciation forBuildings and improvements (472,661) (30,088) 6,171 - (496,578) Container cranes (83,817) (5,254) - - (89,071) Infrastructure (592,858) (57,298) 1,058 - (649,098) Software (1,658) (1,105) - - (2,763) Other equipment (49,949) (4,489) 1,788 - (52,650)
Total accumulated depreciation (1,200,943) (98,234) 9,017 - (1,290,160)
Total being depreciated, net 1,466,359 (98,015) (974) 87,862 1,455,232
Total capital assets, net 2,185,743$ 18,409$ (5,067)$ -$ 2,199,085$
On June 10, 2013, the Port completed the combined sale and lease of approximately 64-acres of land known as Oak-to-Ninth. Buildings, improvements, infrastructure and certain land was transferred to a developer in exchange for approximately $18,000,000, of which $4,500,000 was paid in cash and $13,500,000 financed with a promissory note payable in full to the Port on or before October 1, 2015. The net book value of the assets transferred was approximately $4,977,000.
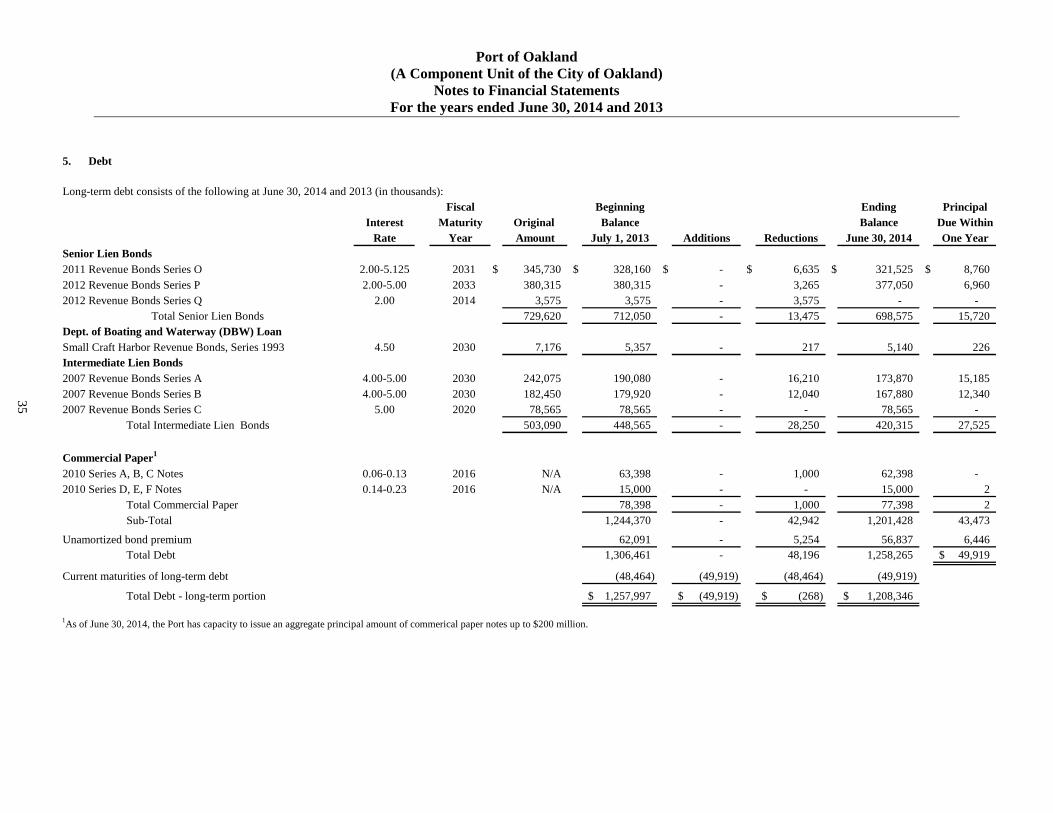
Port of Oakland (A Component Unit of the City of Oakland)
Notes to Financial Statements For the years ended June 30, 2014 and 2013
35
5. Debt
Long-term debt consists of the following at June 30, 2014 and 2013 (in thousands):Fiscal Beginning Ending Principal
Interest Maturity Original Balance Balance Due WithinRate Year Amount July 1, 2013 Additions Reductions June 30, 2014 One Year
2011 Revenue Bonds Series O 2.00-5.125 2031 $ 345,730 $ 328,160 $ - $ 6,635 $ 321,525 $ 8,7602012 Revenue Bonds Series P 2.00-5.00 2033 380,315 380,315 - 3,265 377,050 6,9602012 Revenue Bonds Series Q 2.00 2014 3,575 3,575 - 3,575 - -
729,620 712,050 - 13,475 698,575 15,720
4.50 2030 7,176 5,357 - 217 5,140 226
4.00-5.00 2030 242,075 190,080 - 16,210 173,870 15,1854.00-5.00 2030 182,450 179,920 - 12,040 167,880 12,340
5.00 2020 78,565 78,565 - - 78,565 - 503,090 448,565 - 28,250 420,315 27,525
0.06-0.13 2016 N/A 63,398 - 1,000 62,398 - 0.14-0.23 2016 N/A 15,000 - - 15,000 2
78,398 - 1,000 77,398 2 Sub-Total 1,244,370 - 42,942 1,201,428 43,473
62,091 - 5,254 56,837 6,446 Total Debt 1,306,461 - 48,196 1,258,265 49,919$
(48,464) (49,919) (48,464) (49,919)
1,257,997$ (49,919)$ (268)$ 1,208,346$
Intermediate Lien Bonds
Senior Lien Bonds
Small Craft Harbor Revenue Bonds, Series 1993
Total Senior Lien BondsDept. of Boating and Waterway (DBW) Loan
Total Debt - long-term portion
Commercial Paper1
2010 Series A, B, C Notes2010 Series D, E, F Notes
Unamortized bond premium
Total Commercial Paper
2007 Revenue Bonds Series A
Total Intermediate Lien Bonds
1As of June 30, 2014, the Port has capacity to issue an aggregate principal amount of commerical paper notes up to $200 million.
2007 Revenue Bonds Series B2007 Revenue Bonds Series C
Current maturities of long-term debt
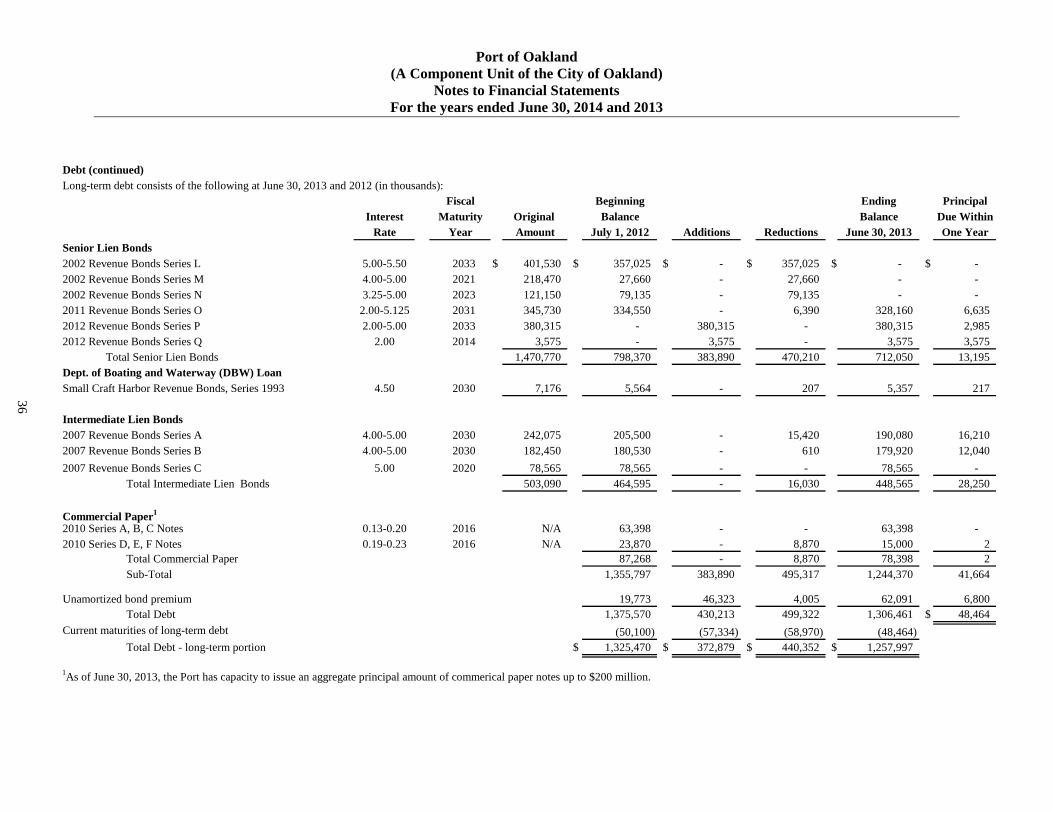
Port of Oakland (A Component Unit of the City of Oakland)
Notes to Financial Statements For the years ended June 30, 2014 and 2013
36
Debt (continued)Long-term debt consists of the following at June 30, 2013 and 2012 (in thousands):
Fiscal Beginning Ending PrincipalInterest Maturity Original Balance Balance Due Within
Rate Year Amount July 1, 2012 Additions Reductions June 30, 2013 One YearSenior Lien Bonds2002 Revenue Bonds Series L 5.00-5.50 2033 $ 401,530 $ 357,025 $ - $ 357,025 $ - $ - 2002 Revenue Bonds Series M 4.00-5.00 2021 218,470 27,660 - 27,660 - - 2002 Revenue Bonds Series N 3.25-5.00 2023 121,150 79,135 - 79,135 - - 2011 Revenue Bonds Series O 2.00-5.125 2031 345,730 334,550 - 6,390 328,160 6,6352012 Revenue Bonds Series P 2.00-5.00 2033 380,315 - 380,315 - 380,315 2,9852012 Revenue Bonds Series Q 2.00 2014 3,575 - 3,575 - 3,575 3,575 Total Senior Lien Bonds 1,470,770 798,370 383,890 470,210 712,050 13,195 Dept. of Boating and Waterway (DBW) LoanSmall Craft Harbor Revenue Bonds, Series 1993 4.50 2030 7,176 5,564 - 207 5,357 217
Intermediate Lien Bonds2007 Revenue Bonds Series A 4.00-5.00 2030 242,075 205,500 - 15,420 190,080 16,2102007 Revenue Bonds Series B 4.00-5.00 2030 182,450 180,530 - 610 179,920 12,0402007 Revenue Bonds Series C 5.00 2020 78,565 78,565 - - 78,565 -
Total Intermediate Lien Bonds 503,090 464,595 - 16,030 448,565 28,250
2010 Series A, B, C Notes 0.13-0.20 2016 N/A 63,398 - - 63,398 - 2010 Series D, E, F Notes 0.19-0.23 2016 N/A 23,870 - 8,870 15,000 2
Total Commercial Paper 87,268 - 8,870 78,398 2 Sub-Total 1,355,797 383,890 495,317 1,244,370 41,664
Unamortized bond premium 19,773 46,323 4,005 62,091 6,800 Total Debt 1,375,570 430,213 499,322 1,306,461 $ 48,464
Current maturities of long-term debt (50,100) (57,334) (58,970) (48,464) $ 1,325,470 $ 372,879 $ 440,352 $ 1,257,997
Commercial Paper1
1As of June 30, 2013, the Port has capacity to issue an aggregate principal amount of commerical paper notes up to $200 million.
Total Debt - long-term portion
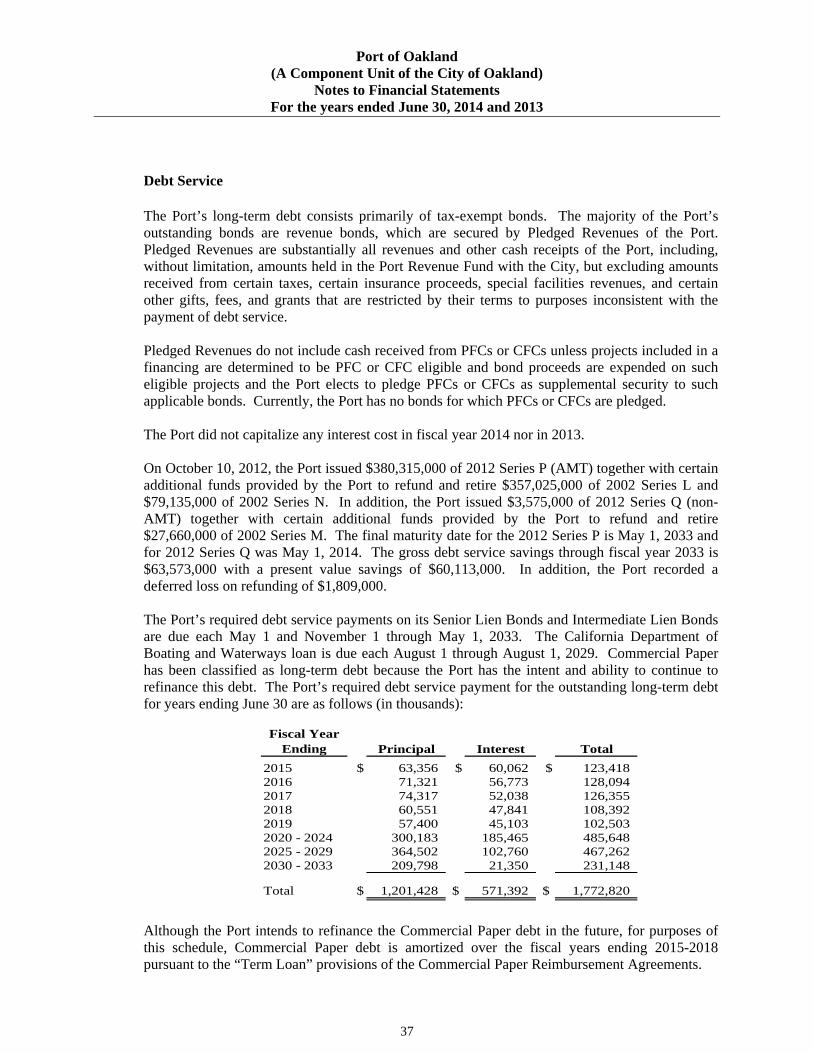
Port of Oakland (A Component Unit of the City of Oakland)
Notes to Financial Statements For the years ended June 30, 2014 and 2013
37
Debt Service The Port’s long-term debt consists primarily of tax-exempt bonds. The majority of the Port’s outstanding bonds are revenue bonds, which are secured by Pledged Revenues of the Port. Pledged Revenues are substantially all revenues and other cash receipts of the Port, including, without limitation, amounts held in the Port Revenue Fund with the City, but excluding amounts received from certain taxes, certain insurance proceeds, special facilities revenues, and certain other gifts, fees, and grants that are restricted by their terms to purposes inconsistent with the payment of debt service. Pledged Revenues do not include cash received from PFCs or CFCs unless projects included in a financing are determined to be PFC or CFC eligible and bond proceeds are expended on such eligible projects and the Port elects to pledge PFCs or CFCs as supplemental security to such applicable bonds. Currently, the Port has no bonds for which PFCs or CFCs are pledged. The Port did not capitalize any interest cost in fiscal year 2014 nor in 2013. On October 10, 2012, the Port issued $380,315,000 of 2012 Series P (AMT) together with certain additional funds provided by the Port to refund and retire $357,025,000 of 2002 Series L and $79,135,000 of 2002 Series N. In addition, the Port issued $3,575,000 of 2012 Series Q (non-AMT) together with certain additional funds provided by the Port to refund and retire $27,660,000 of 2002 Series M. The final maturity date for the 2012 Series P is May 1, 2033 and for 2012 Series Q was May 1, 2014. The gross debt service savings through fiscal year 2033 is $63,573,000 with a present value savings of $60,113,000. In addition, the Port recorded a deferred loss on refunding of $1,809,000. The Port’s required debt service payments on its Senior Lien Bonds and Intermediate Lien Bonds are due each May 1 and November 1 through May 1, 2033. The California Department of Boating and Waterways loan is due each August 1 through August 1, 2029. Commercial Paper has been classified as long-term debt because the Port has the intent and ability to continue to refinance this debt. The Port’s required debt service payment for the outstanding long-term debt for years ending June 30 are as follows (in thousands):
Fiscal Year Ending Principal Interest Total
2015 $ 63,356 $ 60,062 $ 123,418 2016 71,321 56,773 128,094 2017 74,317 52,038 126,355 2018 60,551 47,841 108,392 2019 57,400 45,103 102,503 2020 - 2024 300,183 185,465 485,648 2025 - 2029 364,502 102,760 467,262 2030 - 2033 209,798 21,350 231,148
Total $ 1,201,428 $ 571,392 $ 1,772,820
Although the Port intends to refinance the Commercial Paper debt in the future, for purposes of this schedule, Commercial Paper debt is amortized over the fiscal years ending 2015-2018 pursuant to the “Term Loan” provisions of the Commercial Paper Reimbursement Agreements.
Port of Oakland (A Component Unit of the City of Oakland)
Notes to Financial Statements For the years ended June 30, 2014 and 2013
38
Types of Debt and Priority of Payment Senior Lien Bonds On October 10, 2012, the 2002 Series L, 2002 Series M, and 2002 Series N were refunded with 2012 Series P and 2012 Series Q. 2011 Series O, 2012 Series P, and 2012 Series Q (collectively, the Senior Lien Bonds) are issued under the Senior Trust Indenture and are paid from Pledged Revenues first.
As long as any Senior Lien Bonds remain outstanding, the Port has covenanted to collect rates, tolls, fees, rentals and charges so that Pledged Revenues in each fiscal year will be sufficient to pay all of the following amounts: (i) the sum of principal and interest on the outstanding Senior Lien Bonds; (ii) all other payments required for compliance with terms of the Senior Trust Indenture including, but not limited to, required deposits to any Reserve Fund; (iii) all other payments necessary to meet ongoing legal obligations to be paid from Pledged Revenues; and (iv) operation and maintenance expenses of the Port. In addition, payment of principal and interest on the Senior Lien Bonds when due is secured by a reserve fund held by the trustee and invested in U.S. Treasury Notes. The Port has also covenanted in the Senior Trust Indenture that Net Pledged Revenue (Revenues less the Operation and Maintenance Expenses) will be equal to at least 125% of actual debt service for the Senior Lien Bonds (Senior Lien Debt Coverage Ratio). California Department of Boating and Waterways (DBW) Loan
The DBW Loan is subordinate to the Senior Lien Bonds but superior to the Intermediate Lien Bonds and the Port’s Commercial Paper Notes with respect to the Pledged Revenues. The Port turned over the operation of its marina, financed, in part, with DBW Loans, to a private company through a fifty-year capital lease in May 2004. The only DBW Loan outstanding as of June 30, 2014, was Series 1993 with a balance of $5,140,000.
Intermediate Lien Bonds The 2007 Series A, Series B and Series C Bonds (collectively, the Intermediate Lien Bonds) issued under the Intermediate Trust Indenture are next in payment priority. The Intermediate Lien Bonds are paid from the Intermediate Lien Pledged Revenues. The Intermediate Lien Pledged Revenues are the Pledged Revenues after payment first, of all amounts payable for any Senior Lien Bonds and second, any debt service requirements payable on the DBW Loan. Payment of principal and interest on the Intermediate Lien Bonds when due is secured by a debt service reserve surety policy, as well as being insured by municipal bond insurance policies.
The Port covenanted in the Intermediate Trust Indenture that Net Pledged Revenues will be equal to at least 110% of the actual debt service becoming due and payable on the combined Intermediate Lien Bonds, Senior Lien Bonds, and DBW Loan (Intermediate Lien Debt Coverage Ratio).
Port of Oakland (A Component Unit of the City of Oakland)
Notes to Financial Statements For the years ended June 30, 2014 and 2013
39
Commercial Paper Notes Commercial Paper Notes (CP Notes) have the lowest payment priority. The Board authorized a $150,000,000 Commercial Paper program in 1998 and a further $150,000,000 was authorized in 1999. The maximum maturity of the CP Notes is 270 days and the maximum interest rate is 12%. The Port has classified the CP Notes as long term debt as the Port intends and has the ability to reissue CP Notes until the expiration of the two irrevocable Letters of Credit (LOC), discussed below. Interest income paid to the holders of the CP Notes may fall under one of three tax treatments: tax-exempt Alternative Minimum Tax (AMT), tax-exempt non-AMT and taxable.
As of June 30, 2013, the CP Notes, backed by one of two separate irrevocable LOC which were originally issued on August 2, 2010, were as follows:
Wells Fargo Bank, National Association (Wells) with a maximum stated amount of $163,315,000 (principal of $150,000,000 and interest of $13,315,000) and a termination date of August 2, 2013. The outstanding balance on the CP Notes issued under this LOC was $63,398,000 on June 30, 2013.
JPMorgan Chase Bank, National Association (JPMorgan) with a maximum stated amount
of $54,438,000 (principal of $50,000,000 and interest of $4,438,000) and an original termination date of August 2, 2012, that was extended to August 1, 2014. The outstanding balance on the CP Notes issued under this LOC was $15,000,000 on June 30, 2013.
Commercial Paper Notes (continued) On July 1, 2013, the Port renewed its LOC’s with both Wells and JPMorgan. Each LOC now has a maximum stated amount of $108,876,713 (principal of $100,000,000 and interest of $8,876,713) and a termination date of June 30, 2016. As of June 30, 2014, the outstanding balance on the CP notes issued under the Wells LOC was $62,398,000, while the CP notes issued under JP Morgan LOC was $15,000,000. The Port covenants in the Letter of Credit and Reimbursement Agreements with Wells and JPMorgan that the Intermediate Lien Debt Coverage Ratio will equal to at least 110%.
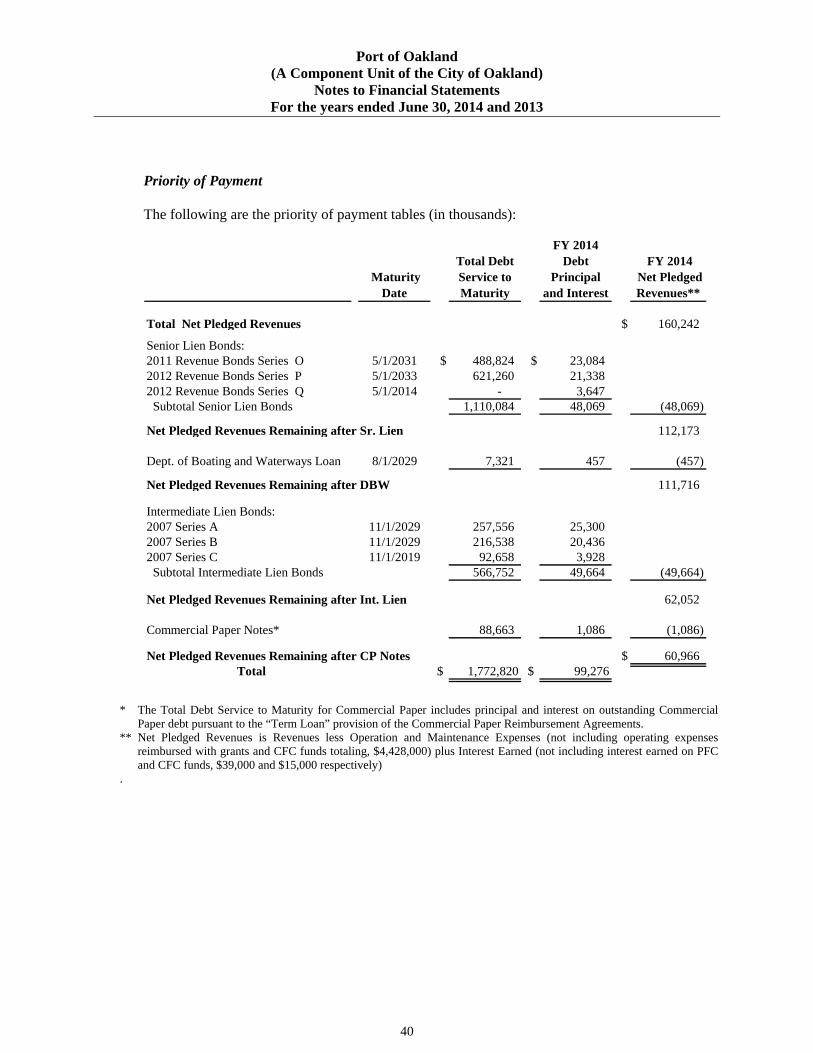
Port of Oakland (A Component Unit of the City of Oakland)
Notes to Financial Statements For the years ended June 30, 2014 and 2013
40
Priority of Payment
The following are the priority of payment tables (in thousands):
Maturity Date
Total Debt Service to Maturity
FY 2014 Debt
Principal and Interest
FY 2014 Net Pledged Revenues**
Total Net Pledged Revenues $ 160,242
Senior Lien Bonds:2011 Revenue Bonds Series O 5/1/2031 $ 488,824 $ 23,084 2012 Revenue Bonds Series P 5/1/2033 621,260 21,338 2012 Revenue Bonds Series Q 5/1/2014 - 3,647 Subtotal Senior Lien Bonds 1,110,084 48,069 (48,069)
Net Pledged Revenues Remaining after Sr. Lien 112,173
8/1/2029 7,321 457 (457)
Net Pledged Revenues Remaining after DBW 111,716
Intermediate Lien Bonds:2007 Series A 11/1/2029 257,556 25,300 2007 Series B 11/1/2029 216,538 20,436 2007 Series C 11/1/2019 92,658 3,928
566,752 49,664 (49,664)
62,052
Commercial Paper Notes* 88,663 1,086 (1,086)
$ 60,966 Total $ 1,772,820 $ 99,276
Net Pledged Revenues Remaining after CP Notes
Subtotal Intermediate Lien Bonds
Net Pledged Revenues Remaining after Int. Lien
Dept. of Boating and Waterways Loan
* The Total Debt Service to Maturity for Commercial Paper includes principal and interest on outstanding Commercial
Paper debt pursuant to the “Term Loan” provision of the Commercial Paper Reimbursement Agreements. ** Net Pledged Revenues is Revenues less Operation and Maintenance Expenses (not including operating expenses
reimbursed with grants and CFC funds totaling, $4,428,000) plus Interest Earned (not including interest earned on PFC and CFC funds, $39,000 and $15,000 respectively)
.
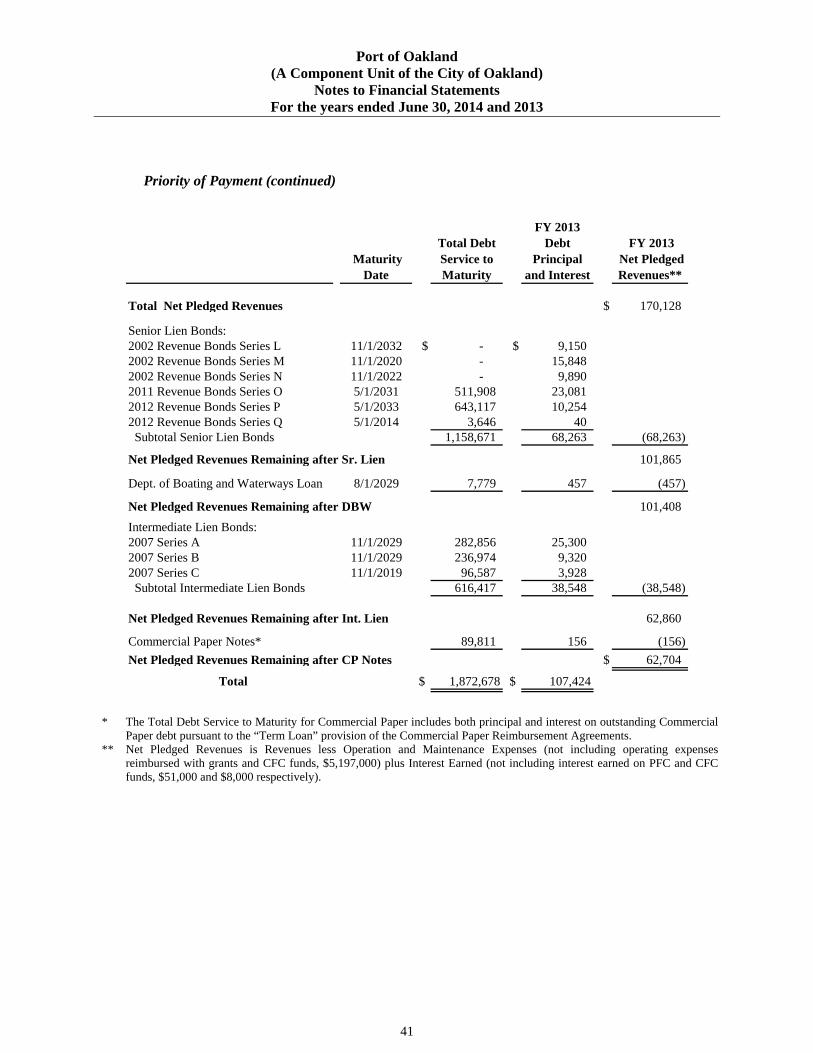
Port of Oakland (A Component Unit of the City of Oakland)
Notes to Financial Statements For the years ended June 30, 2014 and 2013
41
Priority of Payment (continued)
Maturity Date
Total Debt Service to Maturity
FY 2013 Debt
Principal and Interest
FY 2013 Net Pledged Revenues**
Total Net Pledged Revenues $ 170,128
Senior Lien Bonds:2002 Revenue Bonds Series L 11/1/2032 $ - $ 9,150 2002 Revenue Bonds Series M 11/1/2020 - 15,848 2002 Revenue Bonds Series N 11/1/2022 - 9,890 2011 Revenue Bonds Series O 5/1/2031 511,908 23,081 2012 Revenue Bonds Series P 5/1/2033 643,117 10,254 2012 Revenue Bonds Series Q 5/1/2014 3,646 40 Subtotal Senior Lien Bonds 1,158,671 68,263 (68,263)
Net Pledged Revenues Remaining after Sr. Lien 101,865
8/1/2029 7,779 457 (457)
Net Pledged Revenues Remaining after DBW 101,408 Intermediate Lien Bonds:2007 Series A 11/1/2029 282,856 25,300 2007 Series B 11/1/2029 236,974 9,320 2007 Series C 11/1/2019 96,587 3,928
616,417 38,548 (38,548)
62,860
Commercial Paper Notes* 89,811 156 (156) $ 62,704
Total $ 1,872,678 $ 107,424
Dept. of Boating and Waterways Loan
Subtotal Intermediate Lien Bonds
Net Pledged Revenues Remaining after Int. Lien
Net Pledged Revenues Remaining after CP Notes
* The Total Debt Service to Maturity for Commercial Paper includes both principal and interest on outstanding Commercial
Paper debt pursuant to the “Term Loan” provision of the Commercial Paper Reimbursement Agreements. ** Net Pledged Revenues is Revenues less Operation and Maintenance Expenses (not including operating expenses
reimbursed with grants and CFC funds, $5,197,000) plus Interest Earned (not including interest earned on PFC and CFC funds, $51,000 and $8,000 respectively).
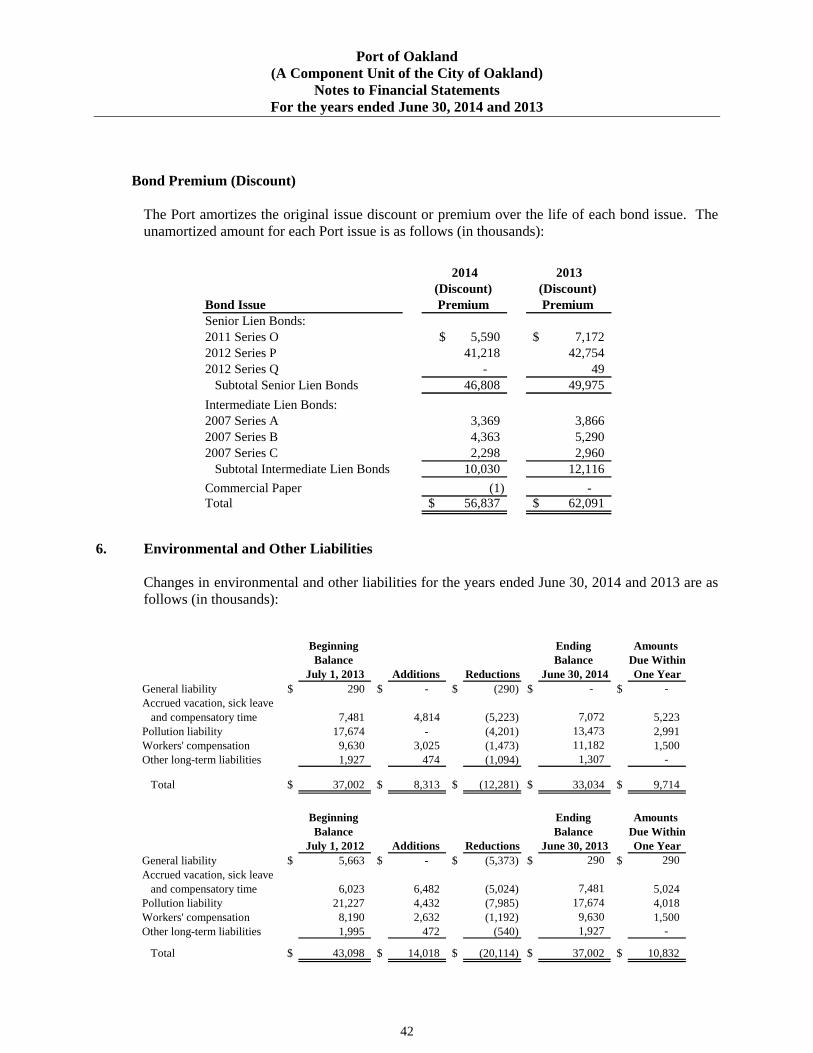
Port of Oakland (A Component Unit of the City of Oakland)
Notes to Financial Statements For the years ended June 30, 2014 and 2013
42
Bond Premium (Discount)
The Port amortizes the original issue discount or premium over the life of each bond issue. The unamortized amount for each Port issue is as follows (in thousands):
2014 2013
(Discount) (Discount) Bond Issue Premium Premium Senior Lien Bonds:2011 Series O 5,590$ 7,172$ 2012 Series P 41,218 42,754 2012 Series Q - 49 Subtotal Senior Lien Bonds 46,808 49,975 Intermediate Lien Bonds:2007 Series A 3,369 3,866 2007 Series B 4,363 5,290 2007 Series C 2,298 2,960 Subtotal Intermediate Lien Bonds 10,030 12,116 Commercial Paper (1) - Total 56,837$ 62,091$
6. Environmental and Other Liabilities
Changes in environmental and other liabilities for the years ended June 30, 2014 and 2013 are as follows (in thousands):
Beginning Ending Amounts Balance Balance Due Within
July 1, 2013 Additions Reductions June 30, 2014 One YearGeneral liability $ 290 $ - $ (290) $ - $ - Accrued vacation, sick leave and compensatory time 7,481 4,814 (5,223) 7,072 5,223 Pollution liability 17,674 - (4,201) 13,473 2,991 Workers' compensation 9,630 3,025 (1,473) 11,182 1,500 Other long-term liabilities 1,927 474 (1,094) 1,307 -
Total $ 37,002 $ 8,313 $ (12,281) $ 33,034 $ 9,714
Beginning Ending Amounts Balance Balance Due Within
July 1, 2012 Additions Reductions June 30, 2013 One YearGeneral liability $ 5,663 $ - $ (5,373) $ 290 $ 290 Accrued vacation, sick leave and compensatory time 6,023 6,482 (5,024) 7,481 5,024 Pollution liability 21,227 4,432 (7,985) 17,674 4,018 Workers' compensation 8,190 2,632 (1,192) 9,630 1,500 Other long-term liabilities 1,995 472 (540) 1,927 -
Total $ 43,098 $ 14,018 $ (20,114) $ 37,002 $ 10,832
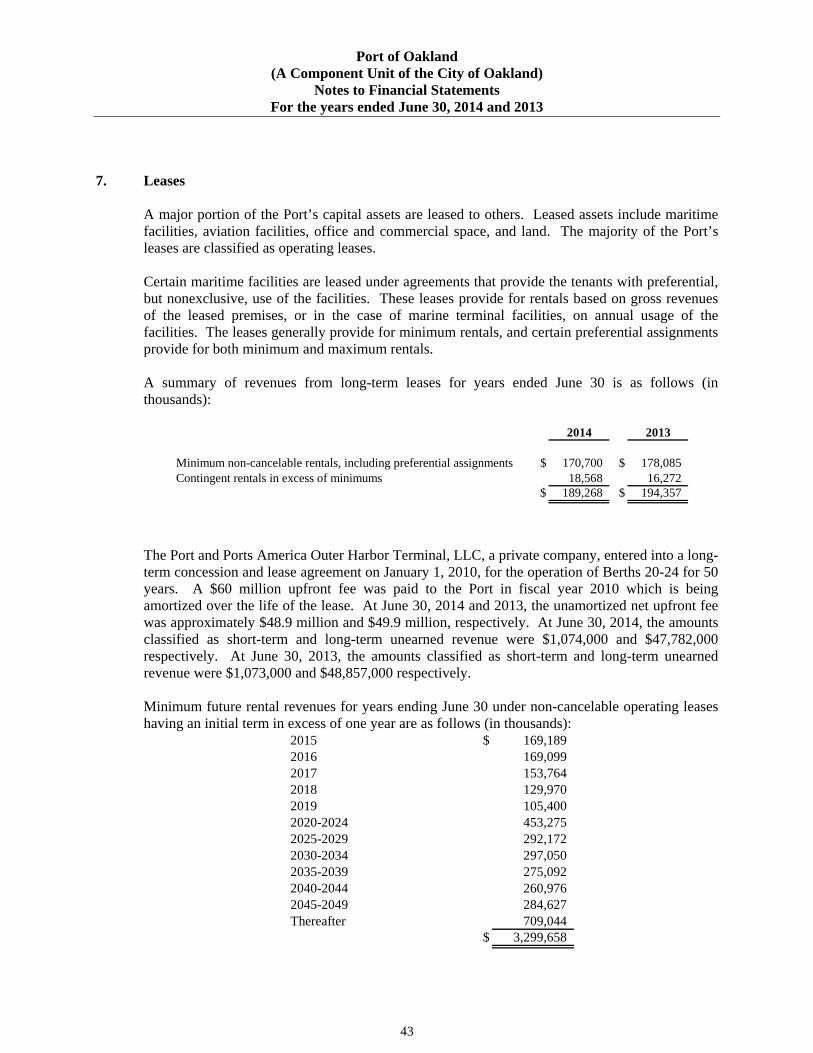
Port of Oakland (A Component Unit of the City of Oakland)
Notes to Financial Statements For the years ended June 30, 2014 and 2013
43
7. Leases A major portion of the Port’s capital assets are leased to others. Leased assets include maritime facilities, aviation facilities, office and commercial space, and land. The majority of the Port’s leases are classified as operating leases. Certain maritime facilities are leased under agreements that provide the tenants with preferential, but nonexclusive, use of the facilities. These leases provide for rentals based on gross revenues of the leased premises, or in the case of marine terminal facilities, on annual usage of the facilities. The leases generally provide for minimum rentals, and certain preferential assignments provide for both minimum and maximum rentals. A summary of revenues from long-term leases for years ended June 30 is as follows (in thousands):
2014 2013
Minimum non-cancelable rentals, including preferential assignments $ 170,700 $ 178,085 Contingent rentals in excess of minimums 18,568 16,272
$ 189,268 $ 194,357
The Port and Ports America Outer Harbor Terminal, LLC, a private company, entered into a long-term concession and lease agreement on January 1, 2010, for the operation of Berths 20-24 for 50 years. A $60 million upfront fee was paid to the Port in fiscal year 2010 which is being amortized over the life of the lease. At June 30, 2014 and 2013, the unamortized net upfront fee was approximately $48.9 million and $49.9 million, respectively. At June 30, 2014, the amounts classified as short-term and long-term unearned revenue were $1,074,000 and $47,782,000 respectively. At June 30, 2013, the amounts classified as short-term and long-term unearned revenue were $1,073,000 and $48,857,000 respectively. Minimum future rental revenues for years ending June 30 under non-cancelable operating leases having an initial term in excess of one year are as follows (in thousands):
2015 $ 169,189 2016 169,099 2017 153,764 2018 129,970 2019 105,400 2020-2024 453,275 2025-2029 292,172 2030-2034 297,050 2035-2039 275,092 2040-2044 260,976 2045-2049 284,627 Thereafter 709,044
$ 3,299,658
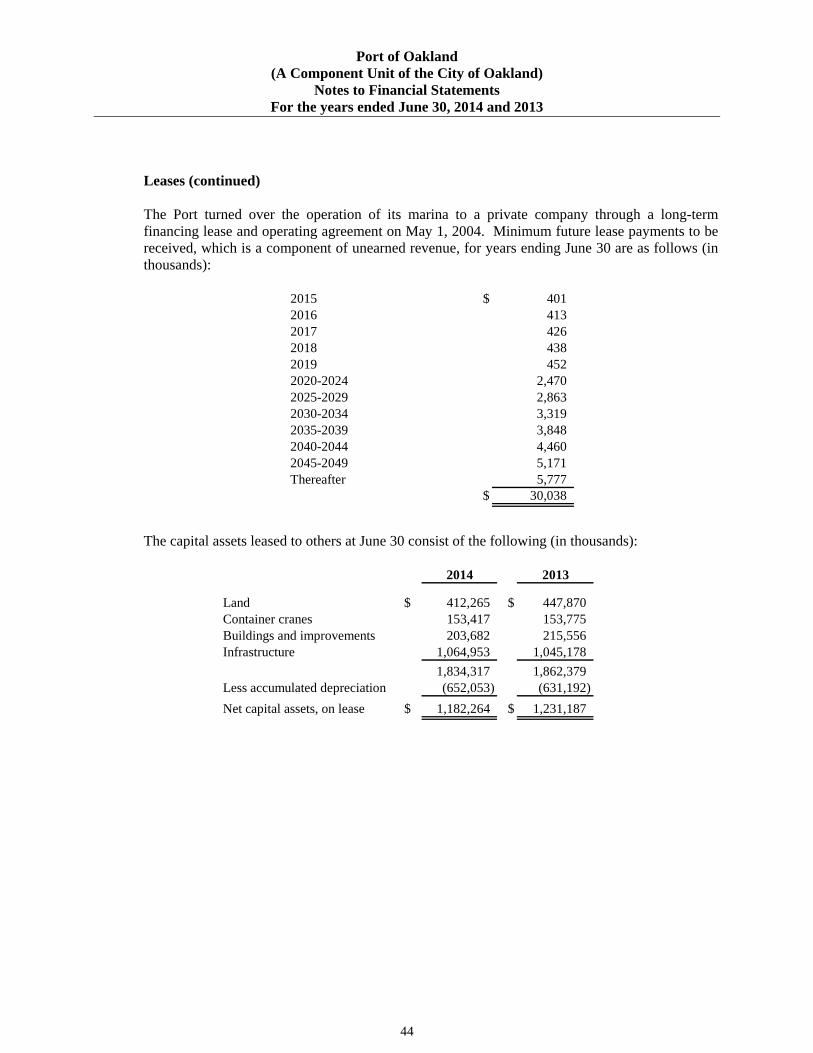
Port of Oakland (A Component Unit of the City of Oakland)
Notes to Financial Statements For the years ended June 30, 2014 and 2013
44
Leases (continued) The Port turned over the operation of its marina to a private company through a long-term financing lease and operating agreement on May 1, 2004. Minimum future lease payments to be received, which is a component of unearned revenue, for years ending June 30 are as follows (in thousands):
2015 $ 401 2016 413 2017 426 2018 438 2019 452 2020-2024 2,470 2025-2029 2,863 2030-2034 3,319 2035-2039 3,848 2040-2044 4,460 2045-2049 5,171 Thereafter 5,777
$ 30,038
The capital assets leased to others at June 30 consist of the following (in thousands):
2014 2013
Land $ 412,265 $ 447,870 Container cranes 153,417 153,775 Buildings and improvements 203,682 215,556 Infrastructure 1,064,953 1,045,178
1,834,317 1,862,379 Less accumulated depreciation (652,053) (631,192) Net capital assets, on lease $ 1,182,264 $ 1,231,187
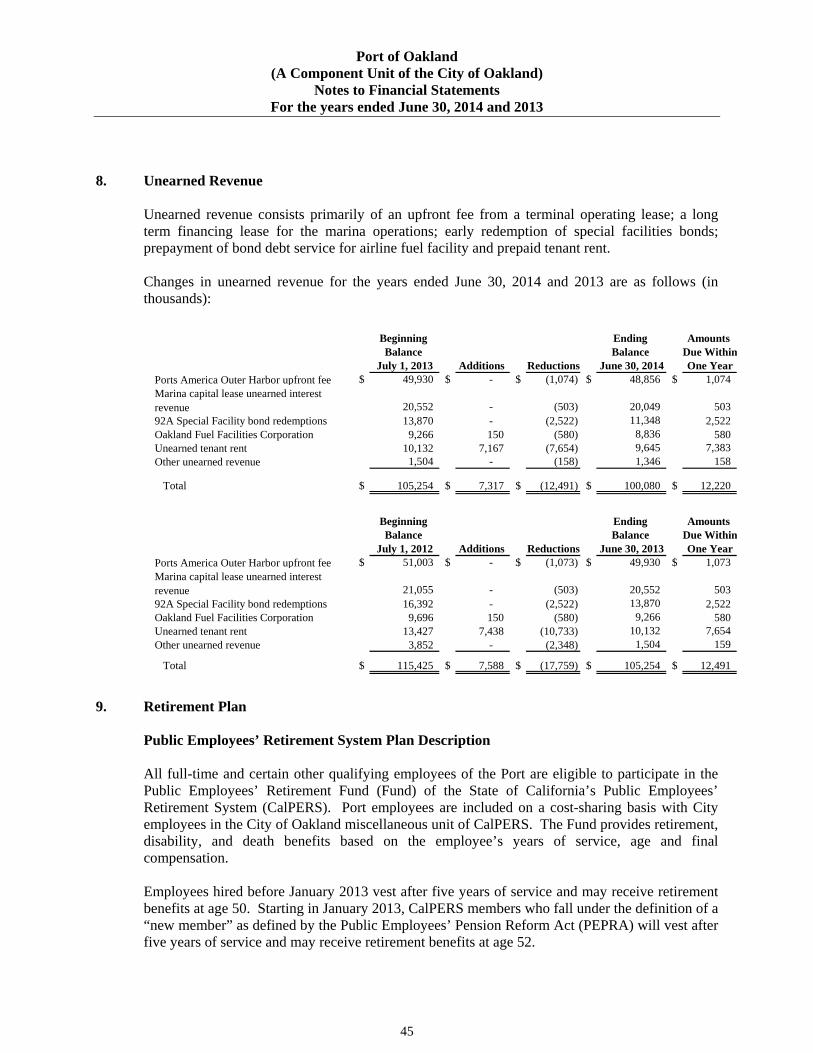
Port of Oakland (A Component Unit of the City of Oakland)
Notes to Financial Statements For the years ended June 30, 2014 and 2013
45
8. Unearned Revenue
Unearned revenue consists primarily of an upfront fee from a terminal operating lease; a long term financing lease for the marina operations; early redemption of special facilities bonds; prepayment of bond debt service for airline fuel facility and prepaid tenant rent. Changes in unearned revenue for the years ended June 30, 2014 and 2013 are as follows (in thousands):
Beginning Ending Amounts Balance Balance Due Within
July 1, 2013 Additions Reductions June 30, 2014 One YearPorts America Outer Harbor upfront fee $ 49,930 $ - $ (1,074) $ 48,856 $ 1,074 Marina capital lease unearned interest revenue 20,552 - (503) 20,049 503 92A Special Facility bond redemptions 13,870 - (2,522) 11,348 2,522 Oakland Fuel Facilities Corporation 9,266 150 (580) 8,836 580 Unearned tenant rent 10,132 7,167 (7,654) 9,645 7,383 Other unearned revenue 1,504 - (158) 1,346 158
Total $ 105,254 $ 7,317 $ (12,491) $ 100,080 $ 12,220
Beginning Ending Amounts Balance Balance Due Within
July 1, 2012 Additions Reductions June 30, 2013 One YearPorts America Outer Harbor upfront fee $ 51,003 $ - $ (1,073) $ 49,930 $ 1,073 Marina capital lease unearned interest revenue 21,055 - (503) 20,552 503 92A Special Facility bond redemptions 16,392 - (2,522) 13,870 2,522 Oakland Fuel Facilities Corporation 9,696 150 (580) 9,266 580 Unearned tenant rent 13,427 7,438 (10,733) 10,132 7,654 Other unearned revenue 3,852 - (2,348) 1,504 159
Total $ 115,425 $ 7,588 $ (17,759) $ 105,254 $ 12,491
9. Retirement Plan
Public Employees’ Retirement System Plan Description All full-time and certain other qualifying employees of the Port are eligible to participate in the Public Employees’ Retirement Fund (Fund) of the State of California’s Public Employees’ Retirement System (CalPERS). Port employees are included on a cost-sharing basis with City employees in the City of Oakland miscellaneous unit of CalPERS. The Fund provides retirement, disability, and death benefits based on the employee’s years of service, age and final compensation. Employees hired before January 2013 vest after five years of service and may receive retirement benefits at age 50. Starting in January 2013, CalPERS members who fall under the definition of a “new member” as defined by the Public Employees’ Pension Reform Act (PEPRA) will vest after five years of service and may receive retirement benefits at age 52.
Port of Oakland (A Component Unit of the City of Oakland)
Notes to Financial Statements For the years ended June 30, 2014 and 2013
46
Public Employees’ Retirement System Plan Description (continued) These benefit provisions and all other requirements are established by State statute and City ordinance. CalPERS issues a separate comprehensive annual financial report. Copies of the annual financial report may be obtained from the CalPERS Executive Office, 400 Q Street, Sacramento, California 95811 or at www.CalPERS.ca.gov. A separate report for the City’s plan within CalPERS is not available. CalPERS does not calculate a separate pension obligation for the Port; therefore, no separate Port obligation can be presented herein. CalPERS’ most recent actuarial valuation for the Miscellaneous Plan of the City of Oakland as of June 30, 2013 valued the combined Port and City actuarial accrued liability at $2,153,339,419 and the combined Port and City unfunded actuarial accrued liability was $656,748,512. Under the requirements of GASB 68, the Port will have to recognize a liability for its proportionate share of the net pension liability and GASB 68 has recommended the use of the Port’s projected long-term contribution effort as compared to the total projected long-term contribution effort of the combined Port and City as a basis for determining the Port’s share. The Port is evaluating the effects of this methodology in anticipation of implementing GASB 68 for the fiscal year ending June 30, 2015. The Port is required to contribute the remaining amounts necessary to fund retirement benefits for its employees using the actuarial basis determined by CalPERS. The Port’s employer contribution to the Fund was 27.295% (fiscal year 2014), 25.115% (July 2012 to Feb 2013), 24.248% (March 2013 to June 2013), and 23.604% (fiscal year 2012) of covered payroll. For the fiscal years ended June 30, 2014, 2013, and 2012, the Port’s annual pension costs for the employer contribution to CalPERS was $13,105,000, $11,490,000, and $11,039,000 respectively. The Port contributed 100% of the actuarial required contribution for each of the three years. The employer contribution rate for the year ended June 30, 2014 was based upon an actuarial valuation study performed by CalPERS Actuarial & Employer Services Division as of June 30, 2011. The Port’s payroll reported to CalPERS for employees participating in the Fund was $48,524,000, $45,796,000, and $46,768,000 for the years ended June 30, 2014, 2013 and 2012, respectively. The Port’s payroll for all employees was $48,727,000, $44,721,000, and $43,214,000 in fiscal years 2014, 2013 and 2012 respectively. PERS Employee Member Contributions For fiscal year 2013, the Port elected to pay the 8% Employer Paid Member Contributions (EPMC) to CalPERS on behalf of most of its employees and has exercised its options to include the 8% EPMC as compensation for the purpose of calculating the CalPERS contribution. Effective the first day of the pay period containing July 1, 2013, the Port discontinued the payment of the 8% EPMC. Port employees who are members of CalPERS including unrepresented employees are required to contribute 8% of their base salary as employee paid member contributions to CalPERS The Port has contributed $5,500, $3,122,000, and $3,552,000 for the fiscal years ended June 30, 2014, 2013, and 2012 respectively.
Port of Oakland (A Component Unit of the City of Oakland)
Notes to Financial Statements For the years ended June 30, 2014 and 2013
47
Public Employees’ Pension Reform Act of 2013 Starting in January 2013, CalPERS members who fall under the definition of a “new member” as defined by PEPRA are subject to the provisions of PEPRA. Highlights of PEPRA are below. For more information contact CalPERS at (888) 225-7377.
Benefit formula for new Miscellaneous members is 2% at age 62 Caps annual salary that can be used to calculate final pension benefit Imposes member contribution requirements Change in CalPERS Assumptions On March 14, 2012, the CalPERS Board of Administration approved a recommendation to lower the CalPERS discount rate assumption, or the rate of investment return the Fund assumes, from 7.75 to 7.50 percent. The new discount rate was used to set the plan’s 2014-15 contributions rates. On April 17, 2013, the CalPERS Board of Administration approved a recommendation to change the CalPERS amortization and rate smoothing policies. Beginning with the June 30, 2013 valuations that set the plan’s 2015-16 contribution rates, CalPERS will no longer use the actuarial value of assets and will employ an amortization and smoothing policy that will pay for all gains and losses over a fixed 30-year period with increases or decreases in the rate spread directly over a 5-year period. On February 19, 2014, the CalPERS Board of Administration adopted relatively modest changes to the current asset allocation that will reduce the expected volatility of returns. The new asset allocation is expected to have a long-term blended return that continues to support a discount rate of 7.5 percent. The CalPERS Board of Administration also adopted several changes to the demographic assumptions that more closely align with actual experience. The new actuarial assumptions will be used to set the plan’s 2016-17 contribution rates. Agreement Between the City and the Port Regarding CalPERS Payments
During the period from July 1, 1976, through January 17, 1998, the Port appointed certain employees to positions in the classifications of Airport Servicemen and Airport Operations Supervisors. The Port was and has always been the employer that directly appointed, retained, employed and compensated the personnel in these positions.
As result of a decision by CalPERS’ Board of Administration on April 15, 1998, employees appointed to positions in the classifications of Airport Servicemen and Airport Operations Supervisors were reclassified from miscellaneous member status in CalPERS to safety member status, effective retroactively to the later of either the date of their respective employment in such classifications or July 1, 1976.
Port of Oakland (A Component Unit of the City of Oakland)
Notes to Financial Statements For the years ended June 30, 2014 and 2013
48
Agreement Between the City and the Port Regarding CalPERS Payments (continued)
The decision to reclassify employees to safety member status resulted in an additional net cost to provide retirement benefits. CalPERS’ actuary estimated that the present value of this net cost (including subsequent actual experience through June 30, 2000, and projected experience through June 30, 2002) was $5,915,000. The Port entered into an agreement with the City for the payment of this net cost by the Port directly to CalPERS. The agreement provides for the Port to make payments over 20 years in annual installments, adjusted for cost of living at a rate of 3.75%, until fully paid. No pre-payment penalty applies. The Port has made the scheduled payments of $697,397 and $672,190 for the fiscal years ended June 30, 2014 and 2013, respectively. The remaining unfunded liability at June 30, 2014 and 2013 was $4,631,000 and $4,922,000 respectively.
10. Other Postemployment Benefits Plan Description The Port contributes to the California Employer’s Retiree Benefit Trust (CERBT), an agent multiple-employer defined benefit postemployment healthcare plan administered by CalPERS. The CERBT is an Internal Revenue Code Section 115 trust and an investment vehicle that can be used by all California public employers to prefund future retiree health and Other Postemployment Benefits (OPEB) costs. The Port’s Retiree Health Plan allows eligible retirees and their dependents to receive employer paid medical insurance benefits through CalPERS, subject to certain limitations described below. Additionally, through the Port’s Retiree Health Plan, employees hired before October 1, 2009 [before January 1, 2013 for members of the Services Employees International Union (SEIU) and International Brotherhood of Electrical Workers (IBEW)] are eligible to receive dental and vision benefits. Prior to 2011, eligible retirees must have attained the age of fifty or over at the time of retirement, have five or more years of CalPERS service, and must be eligible to receive PERS retirement benefits. On July 21, 2011, the Port adopted resolutions that established a Health Benefit Vesting Requirement for employees hired on or after September 1, 2011 (on or after April 1, 2013 for members of SEIU and IBEW). The vesting schedule does not apply to employees that are granted a disability retirement.
Port of Oakland (A Component Unit of the City of Oakland)
Notes to Financial Statements For the years ended June 30, 2014 and 2013
49
Plan Description (continued) Under the adopted vesting schedule, the Port shall pay a percentage of retiree medical coverage for a retiree and his or her eligible dependents based on the provisions of Section 22893 of the California Government Code. Under these rules, a retiree must have at least 10 years of credited service with a CalPERS agency, at least five of which are with the City/Port. The Port will pay a percentage of employer contributions for the Retiree based upon the following:
Years of Credited Service
(at least 5 of which are with the City/Port) %
of Employer Contributions 10 50 11 55 12 60 13 65 14 70 15 75 16 80 17 85 18 90 19 95 20 100
Funding Policy Benefit provisions are established and are amended through negotiations between the Port and the various bargaining units during each bargaining period. The Port pays a portion of retiree benefit expenses on a pay-as–you-go basis to third parties, outside of the CERBT fund, and funds the remaining annual required contribution (ARC) to the CERBT fund. As of June 30, 2014, there were approximately 535 employees who had retired from the Port and were participating in the Port’s Retiree Health Plan. During fiscal year ended June 30, 2014, the Port contributed $5,800,000 to the CERBT and made payments of $7,028,398 on behalf of eligible retirees to third parties outside of the CERBT fund. As of June 30, 2013, there were approximately 526 employees who had retired from the Port and were participating in the Port’s Retiree Health Plan. During fiscal year ended June 30, 2013, the Port contributed $4,200,000 to the CERBT and made payments of $6,840,944 on behalf of eligible retirees to third parties outside of the CERBT fund. Annual OPEB Cost and Net OPEB Obligation The Port’s annual OPEB cost is equal to (a) ARC, an amount actuarially determined in accordance with the parameters of GASB Statement 45, plus (b) one year’s interest on the beginning balance of the net OPEB obligation, and minus (c) an adjustment to the ARC. The ARC represents a level of funding that, if paid on an ongoing basis, is projected to cover the normal cost of each year and any unfunded actuarial liabilities (or funding excess) amortized over a “closed” period of thirty years.
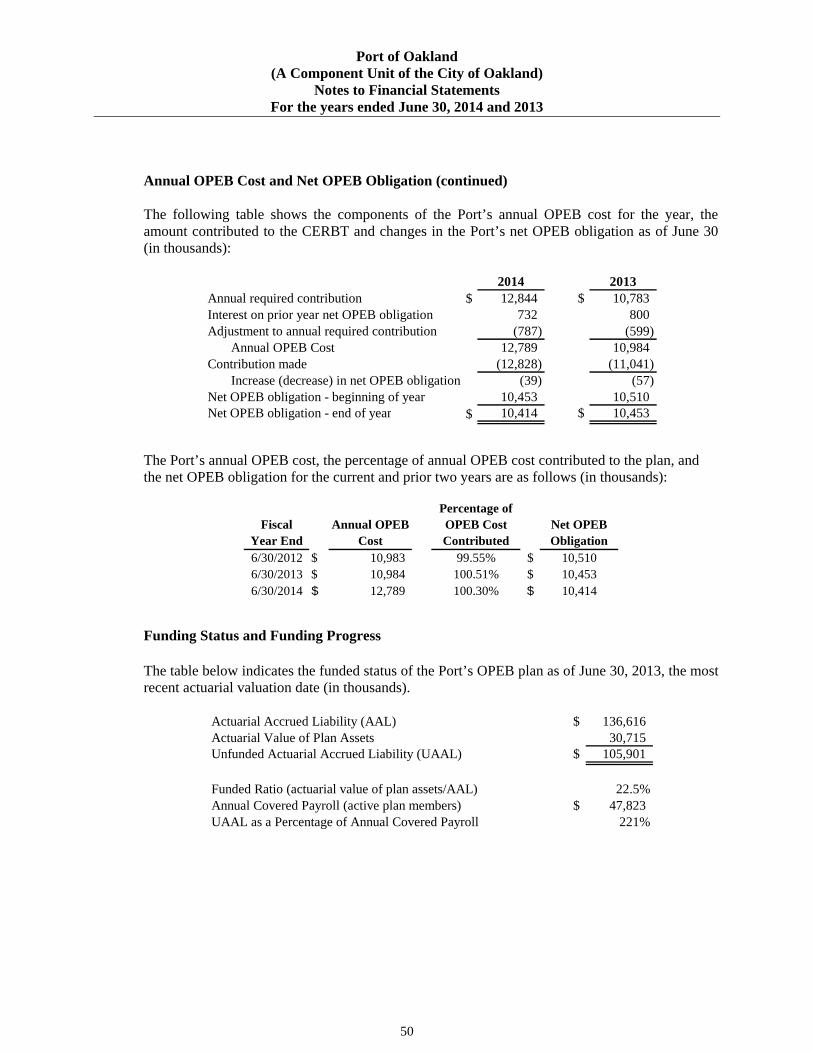
Port of Oakland (A Component Unit of the City of Oakland)
Notes to Financial Statements For the years ended June 30, 2014 and 2013
50
Annual OPEB Cost and Net OPEB Obligation (continued) The following table shows the components of the Port’s annual OPEB cost for the year, the amount contributed to the CERBT and changes in the Port’s net OPEB obligation as of June 30 (in thousands):
2014 2013Annual required contribution $ 12,844 $ 10,783 Interest on prior year net OPEB obligation 732 800 Adjustment to annual required contribution (787) (599) Annual OPEB Cost 12,789 10,984 Contribution made (12,828) (11,041) Increase (decrease) in net OPEB obligation (39) (57) Net OPEB obligation - beginning of year 10,453 10,510 Net OPEB obligation - end of year $ 10,414 $ 10,453
The Port’s annual OPEB cost, the percentage of annual OPEB cost contributed to the plan, and the net OPEB obligation for the current and prior two years are as follows (in thousands):
Fiscal Year End
Annual OPEB Cost
Percentage of OPEB Cost Contributed
Net OPEB Obligation
6/30/2012 $ 10,983 99.55% $ 10,5106/30/2013 $ 10,984 100.51% $ 10,4536/30/2014 $ 12,789 100.30% $ 10,414
Funding Status and Funding Progress The table below indicates the funded status of the Port’s OPEB plan as of June 30, 2013, the most recent actuarial valuation date (in thousands).
Actuarial Accrued Liability (AAL) $ 136,616 Actuarial Value of Plan Assets 30,715 Unfunded Actuarial Accrued Liability (UAAL) $ 105,901
Funded Ratio (actuarial value of plan assets/AAL) 22.5%Annual Covered Payroll (active plan members) $ 47,823 UAAL as a Percentage of Annual Covered Payroll 221%
Port of Oakland (A Component Unit of the City of Oakland)
Notes to Financial Statements For the years ended June 30, 2014 and 2013
51
Actuarial Methods and Assumptions
Projections of benefits for financial reporting purposes are based on the substantive plan in effect and include the types of benefits provided at the time of each valuation and the historical pattern of sharing of benefit costs between the employer and plan members to that point. The actuarial methods and assumptions used include techniques that are designed to reduce the effects of short-term volatility in actuarial accrued liabilities and the actuarial value of assets, consistent with the long-term perspective of the calculations. Actuarial valuations of an ongoing plan involve estimates of the value of reported amounts and assumptions about the probability of occurrence of events far into the future. Examples include assumptions about future employment, mortality, and the healthcare cost trend. Actuarially determined amounts are subject to continual revision as actual results are compared with past expectations and new estimates are made about the future. The actuarial cost method used for determining the benefit obligations of the Port is the Projected Unit Credit Cost Method. Under the principles of this method, the actuarial present value of the projected benefits is the value of benefits expected to be paid for active and retired employees. The AAL is the present value of benefits attributed to employee service rendered prior to the valuation date. The AAL equals the present value of benefits multiplied by a fraction equal to service date over service at expected retirement. The ARC for fiscal year 2013 was based on an actuarial valuation of the Port’s plan as of June 30, 2011, which amortized the UAAL as a level dollar amount over an “open” period of 30 years. The ARC for fiscal year 2014 was based on an acturial valuation of the Port’s plan as of June 30, 2013, which amortized the Port’s UAAL over a “closed” period of 30 years. Actuarial assumptions used for the valuation of the Port’s plan include a discount rate, which is based on the CERBT expected rate of return for the plan assets, and annual healthcare cost trends, which is based on the “Getzen” model published by the Society of Actuaries. The demographic assumptions regarding turnover and retirement are based on statistics from reports for CalPERS under a “2.7% @ 55” benefits schedule. The June 30, 2011 valuation used a discount rate of 7.61% and annual healthcare costs were assumed to increase at rates ranging from 4.00% to 8.75%. The June 30, 2013 valuation used a discount rate of 7.00% and annual healthcare costs were assumed to increase at rates ranging from 2.75% to 7.25%. The schedules presented as required supplementary information following the notes to the financial statements, present multiyear trend information. The Schedule of Funding Progress - Other Postemployment Benefits presents information about whether the actuarial values of plan assets are increasing or decreasing over time relative to the actuarial accrued liabilities for benefits.
Port of Oakland (A Component Unit of the City of Oakland)
Notes to Financial Statements For the years ended June 30, 2014 and 2013
52
11. Agreements with City of Oakland
The Port has entered into agreements with the City for provisions of various services such as aircraft rescue and firefighting (ARFF), Special Services, General Services, and Lake Merritt Trust Services. The City provides these services to the Port. Special Services include designated police services, personnel, city clerk, legislative programming, and treasury services. General Services include fire, rescue, police, street maintenance, and similar services. Lake Merritt Trust Services include items such as recreation services, grounds maintenance, security, and lighting. Port payments to the City for these services are made upon execution of appropriate agreements and/or periodic findings and authorizations from the Board. Special Services and ARFF Payments for Special Services and ARFF are treated as a cost of Port operations pursuant to City Charter Section 717(3) Clause Third and have priority over certain other expenditures of Port revenues. Special Services and ARFF from the City totaled $ 5,475,000 and $3,221,000 in fiscal years 2014 and 2013, respectively, and are included in Operating Expenses. At June 30, 2014 and 2013, $2,954,000 and $3,899,000, respectively, were accrued as current liabilities for these payments. General Services and Lake Merritt Trust Services Payments for General Services provided by the City are payable only to the extent the Port determines annually that surplus monies are available under the Charter for such purposes. As of June 30, 2014 and 2013, the Port accrued approximately $773,000 and $1,012,000, respectively, of payments for General Services. Additionally, the Port accrued approximately $1,425,000 and $1,133,000 to reimburse the City for Lake Merritt Trust Services in fiscal years 2014 and 2013, respectively. Subject to availability of surplus monies, the Port expects that it will continue to reimburse the City annually for General Services and Lake Merritt Trust Services.
Port of Oakland (A Component Unit of the City of Oakland)
Notes to Financial Statements For the years ended June 30, 2014 and 2013
53
Golf Course Lease The Port has leased property to the City under a 66-year lease, which is expressed in terms of the Amended and Restated Lease between the Port and the City for the development and operation of a public golf course by the City. The lease commenced in 2003 when the Port delivered a completed 164.9 acre golf course to the City to replace the City’s golf course that was destroyed when the Port used the site as a dredge disposal site. The golf course is leased to a third party and the minimum annual rental of $270,000 is payable in twelve installments of $22,500 per month, which is then split 50/50 between the Port and the City. Unearned Rent In November 1994, the City entered into an agreement with the Port to partially fund the development of a project related to a lease at the Port. The lease required $5,145,000 in tenant improvements partially financed by $2,000,000 in deferred rent from the City’s former Redevelopment Agency. The unearned rent is classified as unearned revenue. At June 30, 2014 and 2013, unearned rent was approximately $802,000 and $872,000, respectively. The amount classified as short term unearned revenue at June 30, 2014 and 2013 was $70,000.
12. Commitments
Capital Program
As of June 30, 2014, the Port had construction commitments for the acquisition and construction of assets as follows (in thousands):
Aviation $ 94,251 Maritime 51,787 Other 64 Total $ 146,102
.
The most significant projects for which the Port has contractual commitments for construction are: Runway Safety Area of $6,601,000, Airport Terminal Renovation projects of $84,606,000, and Phase 1 of the new rail terminal project on Port-owned OAB property of $48,347,000.
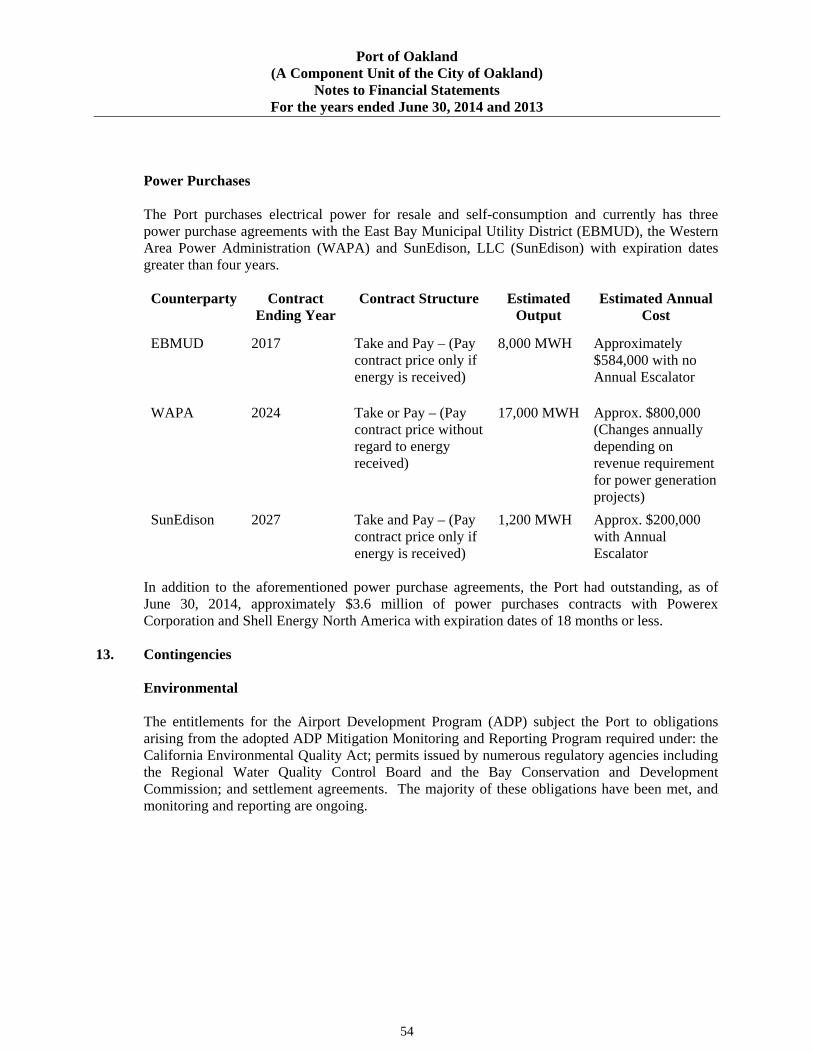
Port of Oakland (A Component Unit of the City of Oakland)
Notes to Financial Statements For the years ended June 30, 2014 and 2013
54
Power Purchases The Port purchases electrical power for resale and self-consumption and currently has three power purchase agreements with the East Bay Municipal Utility District (EBMUD), the Western Area Power Administration (WAPA) and SunEdison, LLC (SunEdison) with expiration dates greater than four years. Counterparty Contract
Ending Year Contract Structure Estimated
Output Estimated Annual
Cost
EBMUD 2017 Take and Pay – (Pay contract price only if energy is received)
8,000 MWH Approximately $584,000 with no Annual Escalator
WAPA 2024 Take or Pay – (Pay contract price without regard to energy received)
17,000 MWH Approx. $800,000 (Changes annually depending on revenue requirement for power generation projects)
SunEdison 2027 Take and Pay – (Pay contract price only if energy is received)
1,200 MWH Approx. $200,000 with Annual Escalator
In addition to the aforementioned power purchase agreements, the Port had outstanding, as of June 30, 2014, approximately $3.6 million of power purchases contracts with Powerex Corporation and Shell Energy North America with expiration dates of 18 months or less.
13. Contingencies
Environmental
The entitlements for the Airport Development Program (ADP) subject the Port to obligations arising from the adopted ADP Mitigation Monitoring and Reporting Program required under: the California Environmental Quality Act; permits issued by numerous regulatory agencies including the Regional Water Quality Control Board and the Bay Conservation and Development Commission; and settlement agreements. The majority of these obligations have been met, and monitoring and reporting are ongoing.
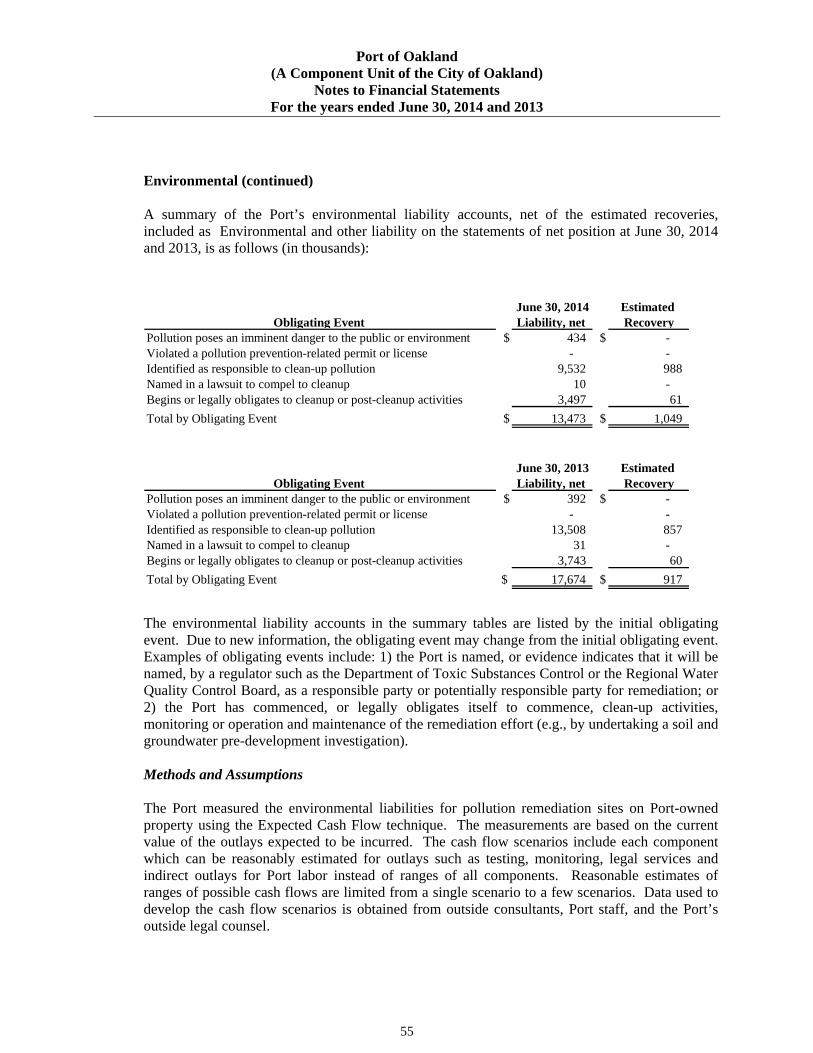
Port of Oakland (A Component Unit of the City of Oakland)
Notes to Financial Statements For the years ended June 30, 2014 and 2013
55
Environmental (continued) A summary of the Port’s environmental liability accounts, net of the estimated recoveries, included as Environmental and other liability on the statements of net position at June 30, 2014 and 2013, is as follows (in thousands):
June 30, 2014 Estimated Obligating Event Liability, net Recovery
Pollution poses an imminent danger to the public or environment $ 434 $ - Violated a pollution prevention-related permit or license - - Identified as responsible to clean-up pollution 9,532 988 Named in a lawsuit to compel to cleanup 10 - Begins or legally obligates to cleanup or post-cleanup activities 3,497 61 Total by Obligating Event $ 13,473 $ 1,049
June 30, 2013 Estimated Obligating Event Liability, net Recovery
Pollution poses an imminent danger to the public or environment $ 392 $ - Violated a pollution prevention-related permit or license - - Identified as responsible to clean-up pollution 13,508 857 Named in a lawsuit to compel to cleanup 31 - Begins or legally obligates to cleanup or post-cleanup activities 3,743 60 Total by Obligating Event $ 17,674 $ 917
The environmental liability accounts in the summary tables are listed by the initial obligating event. Due to new information, the obligating event may change from the initial obligating event. Examples of obligating events include: 1) the Port is named, or evidence indicates that it will be named, by a regulator such as the Department of Toxic Substances Control or the Regional Water Quality Control Board, as a responsible party or potentially responsible party for remediation; or 2) the Port has commenced, or legally obligates itself to commence, clean-up activities, monitoring or operation and maintenance of the remediation effort (e.g., by undertaking a soil and groundwater pre-development investigation). Methods and Assumptions The Port measured the environmental liabilities for pollution remediation sites on Port-owned property using the Expected Cash Flow technique. The measurements are based on the current value of the outlays expected to be incurred. The cash flow scenarios include each component which can be reasonably estimated for outlays such as testing, monitoring, legal services and indirect outlays for Port labor instead of ranges of all components. Reasonable estimates of ranges of possible cash flows are limited from a single scenario to a few scenarios. Data used to develop the cash flow scenarios is obtained from outside consultants, Port staff, and the Port’s outside legal counsel.
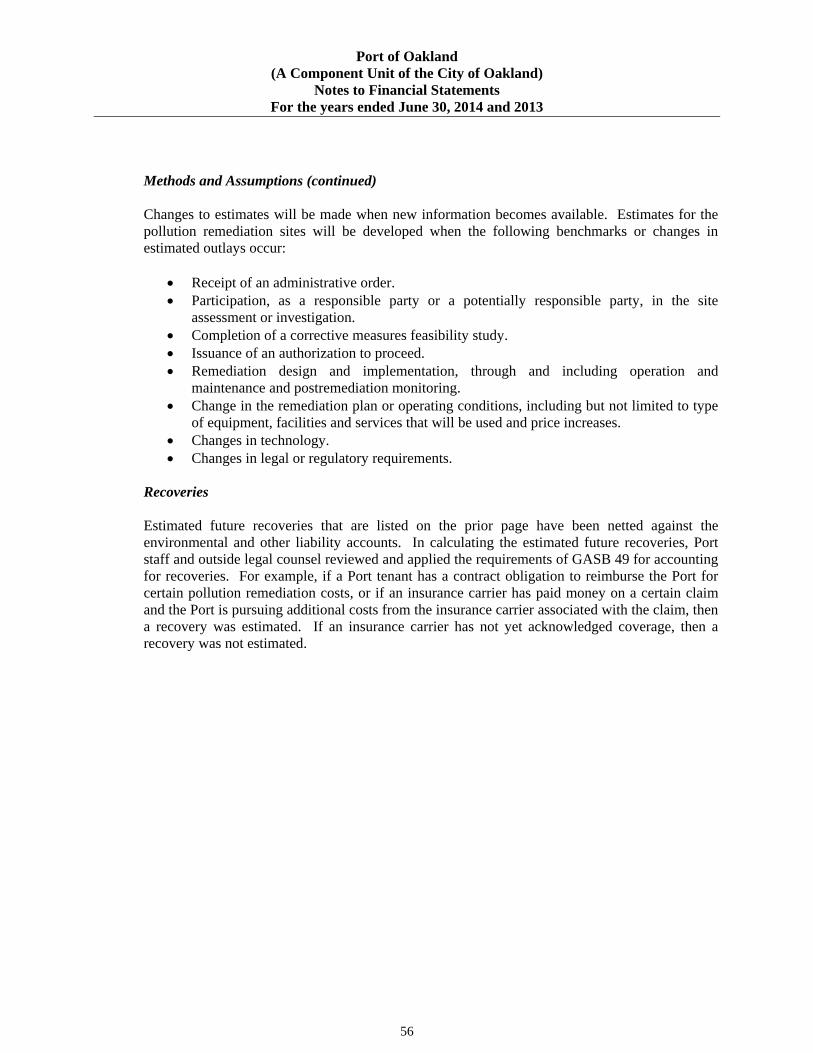
Port of Oakland (A Component Unit of the City of Oakland)
Notes to Financial Statements For the years ended June 30, 2014 and 2013
56
Methods and Assumptions (continued) Changes to estimates will be made when new information becomes available. Estimates for the pollution remediation sites will be developed when the following benchmarks or changes in estimated outlays occur:
Receipt of an administrative order. Participation, as a responsible party or a potentially responsible party, in the site
assessment or investigation. Completion of a corrective measures feasibility study. Issuance of an authorization to proceed. Remediation design and implementation, through and including operation and
maintenance and postremediation monitoring. Change in the remediation plan or operating conditions, including but not limited to type
of equipment, facilities and services that will be used and price increases. Changes in technology. Changes in legal or regulatory requirements.
Recoveries Estimated future recoveries that are listed on the prior page have been netted against the environmental and other liability accounts. In calculating the estimated future recoveries, Port staff and outside legal counsel reviewed and applied the requirements of GASB 49 for accounting for recoveries. For example, if a Port tenant has a contract obligation to reimburse the Port for certain pollution remediation costs, or if an insurance carrier has paid money on a certain claim and the Port is pursuing additional costs from the insurance carrier associated with the claim, then a recovery was estimated. If an insurance carrier has not yet acknowledged coverage, then a recovery was not estimated.
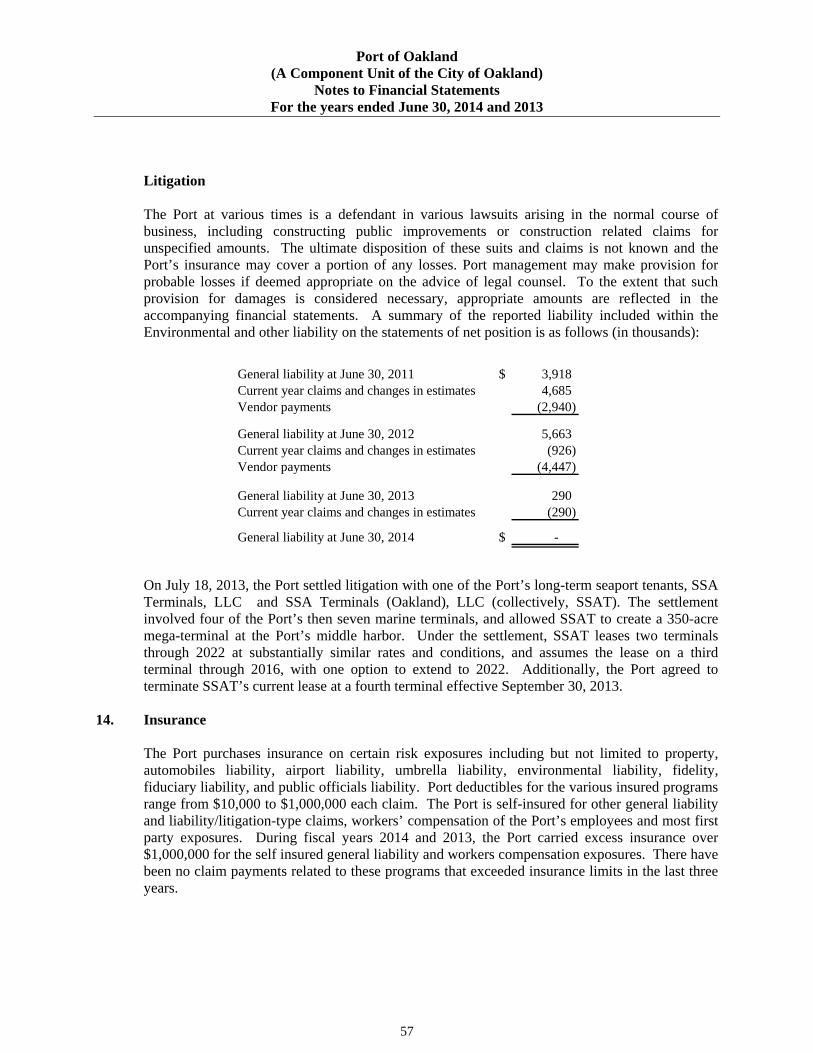
Port of Oakland (A Component Unit of the City of Oakland)
Notes to Financial Statements For the years ended June 30, 2014 and 2013
57
Litigation
The Port at various times is a defendant in various lawsuits arising in the normal course of business, including constructing public improvements or construction related claims for unspecified amounts. The ultimate disposition of these suits and claims is not known and the Port’s insurance may cover a portion of any losses. Port management may make provision for probable losses if deemed appropriate on the advice of legal counsel. To the extent that such provision for damages is considered necessary, appropriate amounts are reflected in the accompanying financial statements. A summary of the reported liability included within the Environmental and other liability on the statements of net position is as follows (in thousands):
General liability at June 30, 2011 $ 3,918 Current year claims and changes in estimates 4,685 Vendor payments (2,940)
General liability at June 30, 2012 5,663 Current year claims and changes in estimates (926) Vendor payments (4,447)
General liability at June 30, 2013 290 Current year claims and changes in estimates (290)
General liability at June 30, 2014 $ -
On July 18, 2013, the Port settled litigation with one of the Port’s long-term seaport tenants, SSA Terminals, LLC and SSA Terminals (Oakland), LLC (collectively, SSAT). The settlement involved four of the Port’s then seven marine terminals, and allowed SSAT to create a 350-acre mega-terminal at the Port’s middle harbor. Under the settlement, SSAT leases two terminals through 2022 at substantially similar rates and conditions, and assumes the lease on a third terminal through 2016, with one option to extend to 2022. Additionally, the Port agreed to terminate SSAT’s current lease at a fourth terminal effective September 30, 2013.
14. Insurance
The Port purchases insurance on certain risk exposures including but not limited to property, automobiles liability, airport liability, umbrella liability, environmental liability, fidelity, fiduciary liability, and public officials liability. Port deductibles for the various insured programs range from $10,000 to $1,000,000 each claim. The Port is self-insured for other general liability and liability/litigation-type claims, workers’ compensation of the Port’s employees and most first party exposures. During fiscal years 2014 and 2013, the Port carried excess insurance over $1,000,000 for the self insured general liability and workers compensation exposures. There have been no claim payments related to these programs that exceeded insurance limits in the last three years.
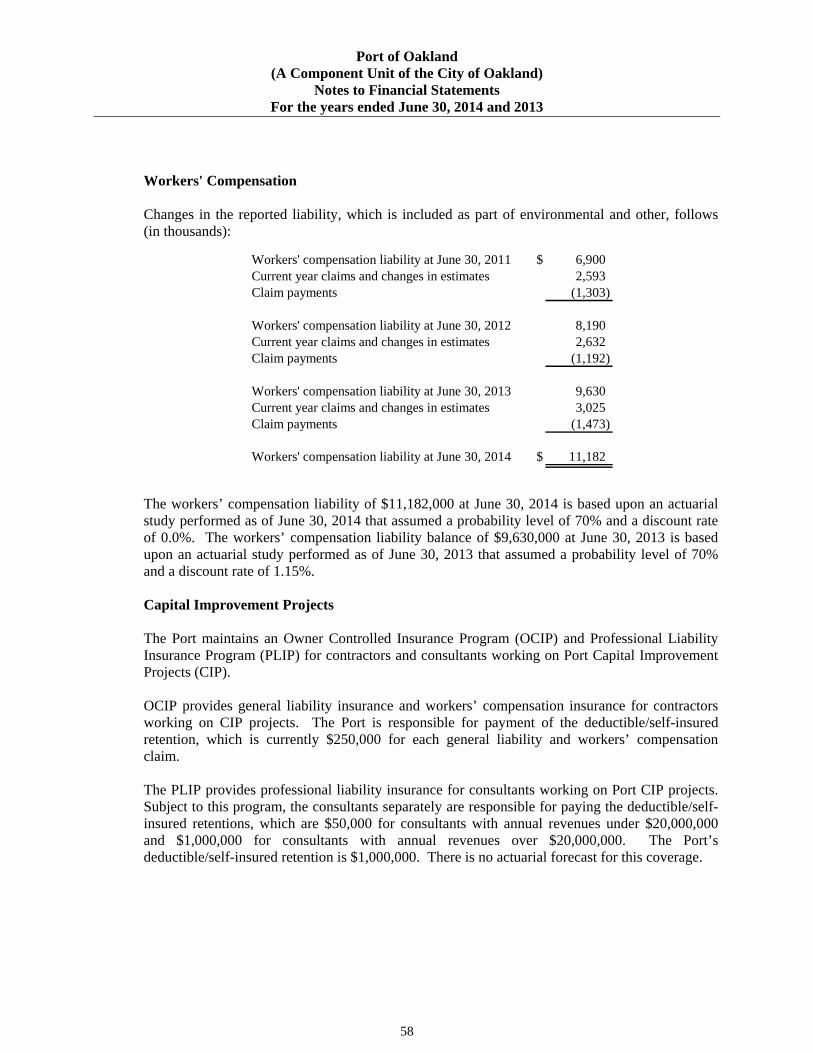
Port of Oakland (A Component Unit of the City of Oakland)
Notes to Financial Statements For the years ended June 30, 2014 and 2013
58
Workers' Compensation Changes in the reported liability, which is included as part of environmental and other, follows (in thousands):
Workers' compensation liability at June 30, 2011 $ 6,900 Current year claims and changes in estimates 2,593 Claim payments (1,303)
Workers' compensation liability at June 30, 2012 8,190 Current year claims and changes in estimates 2,632 Claim payments (1,192)
Workers' compensation liability at June 30, 2013 9,630 Current year claims and changes in estimates 3,025 Claim payments (1,473)
Workers' compensation liability at June 30, 2014 $ 11,182
The workers’ compensation liability of $11,182,000 at June 30, 2014 is based upon an actuarial study performed as of June 30, 2014 that assumed a probability level of 70% and a discount rate of 0.0%. The workers’ compensation liability balance of $9,630,000 at June 30, 2013 is based upon an actuarial study performed as of June 30, 2013 that assumed a probability level of 70% and a discount rate of 1.15%. Capital Improvement Projects The Port maintains an Owner Controlled Insurance Program (OCIP) and Professional Liability Insurance Program (PLIP) for contractors and consultants working on Port Capital Improvement Projects (CIP). OCIP provides general liability insurance and workers’ compensation insurance for contractors working on CIP projects. The Port is responsible for payment of the deductible/self-insured retention, which is currently $250,000 for each general liability and workers’ compensation claim.
The PLIP provides professional liability insurance for consultants working on Port CIP projects. Subject to this program, the consultants separately are responsible for paying the deductible/self-insured retentions, which are $50,000 for consultants with annual revenues under $20,000,000 and $1,000,000 for consultants with annual revenues over $20,000,000. The Port’s deductible/self-insured retention is $1,000,000. There is no actuarial forecast for this coverage.
REQUIRED SUPPLEMENTARY INFORMATION

This page left intentionally blank.
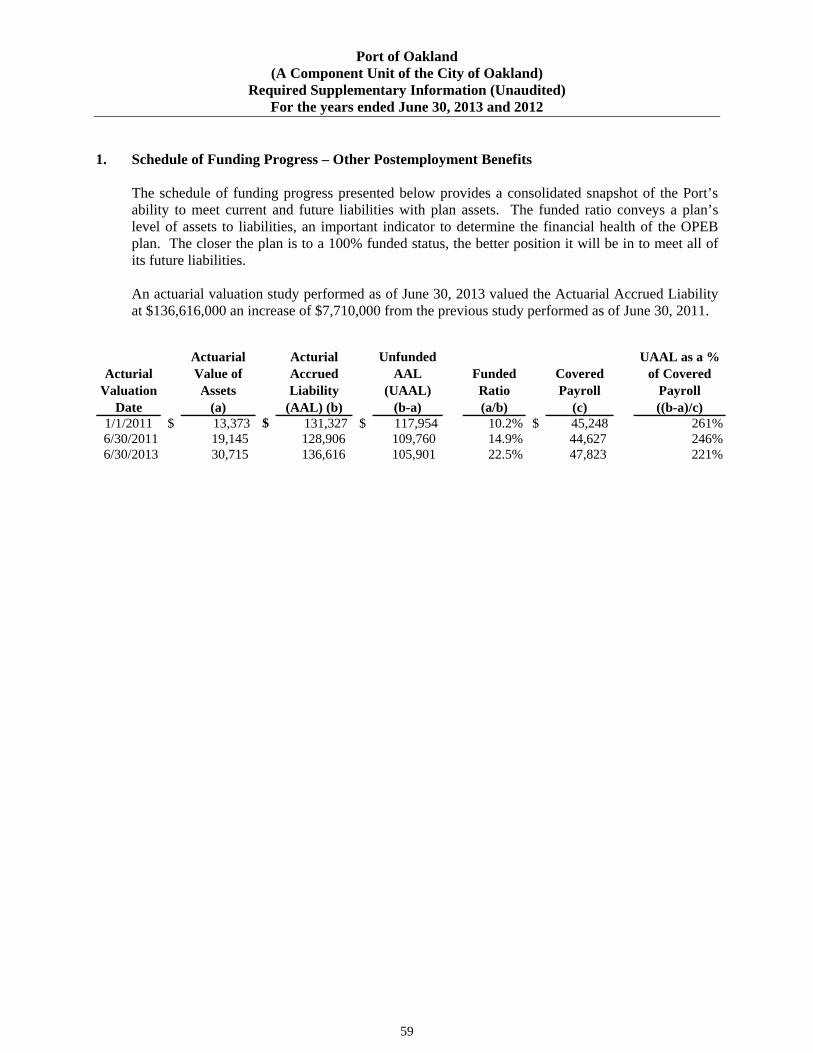
Port of Oakland (A Component Unit of the City of Oakland)
Required Supplementary Information (Unaudited) For the years ended June 30, 2013 and 2012
59
1. Schedule of Funding Progress – Other Postemployment Benefits
The schedule of funding progress presented below provides a consolidated snapshot of the Port’s ability to meet current and future liabilities with plan assets. The funded ratio conveys a plan’s level of assets to liabilities, an important indicator to determine the financial health of the OPEB plan. The closer the plan is to a 100% funded status, the better position it will be in to meet all of its future liabilities. An actuarial valuation study performed as of June 30, 2013 valued the Actuarial Accrued Liability at $136,616,000 an increase of $7,710,000 from the previous study performed as of June 30, 2011.
Acturial Valuation
Date
Actuarial Value of Assets
(a)
Acturial Accrued Liability
(AAL) (b)
Unfunded AAL
(UAAL) (b-a)
Funded Ratio (a/b)
Covered Payroll
(c)
UAAL as a % of Covered
Payroll ((b-a)/c)
1/1/2011 $ 13,373 $ 131,327 $ 117,954 10.2% $ 45,248 261%6/30/2011 19,145 128,906 109,760 14.9% 44,627 246%6/30/2013 30,715 136,616 105,901 22.5% 47,823 221%

60
This page left intentionally blank.
Statistical Section (Unaudited)

This page left intentionally blank.
61
PORT OF OAKLAND (A Component Unit of the City of Oakland)
Statistical Section
This part of the comprehensive annual financial report for the Port of Oakland presents detailed information as a context for understanding the financial statements, note disclosures, and required supplementary information. Contents Schedule Financial Trends Net Position by Components .................................................................................................. 1 Statements of Revenues, Expenses and Changes in Net Position .......................................... 2 Revenue Capacity Aviation Division: Principal Revenue Sources and Airline Revenue per Enplaned Passenger ............................ 3 Aviation Statistics – South Airport ........................................................................................ 4 Top Ten Individual Sources of Aviation Revenue ................................................................. 5
Schedule of Airline Rates and Charges .................................................................................. 6 Maritime Division: Principal Revenue Sources and Maritime Revenue per TEU ................................................ 7 Maritime Division - Container Trends ................................................................................... 8 Top Ten Individual Sources of Maritime Revenue by Alphabetical Order ........................... 9 Debt Capacity Net Pledged Revenues and Debt Service Coverage Calculation ......................................... 10
Ratios of Debt Service ......................................................................................................... 11 Outstanding Debt by Debt Type .......................................................................................... 12
Demographic and Economic Information Demographic and Economic Statistics for the City of Oakland .......................................... 13 Principal Employers in the City of Oakland – FY 2013 vs. FY 2006 .................................. 14 Operating Information Actual Employee Count by Division ................................................................................... 15 Capital Assets Information ................................................................................................... 16
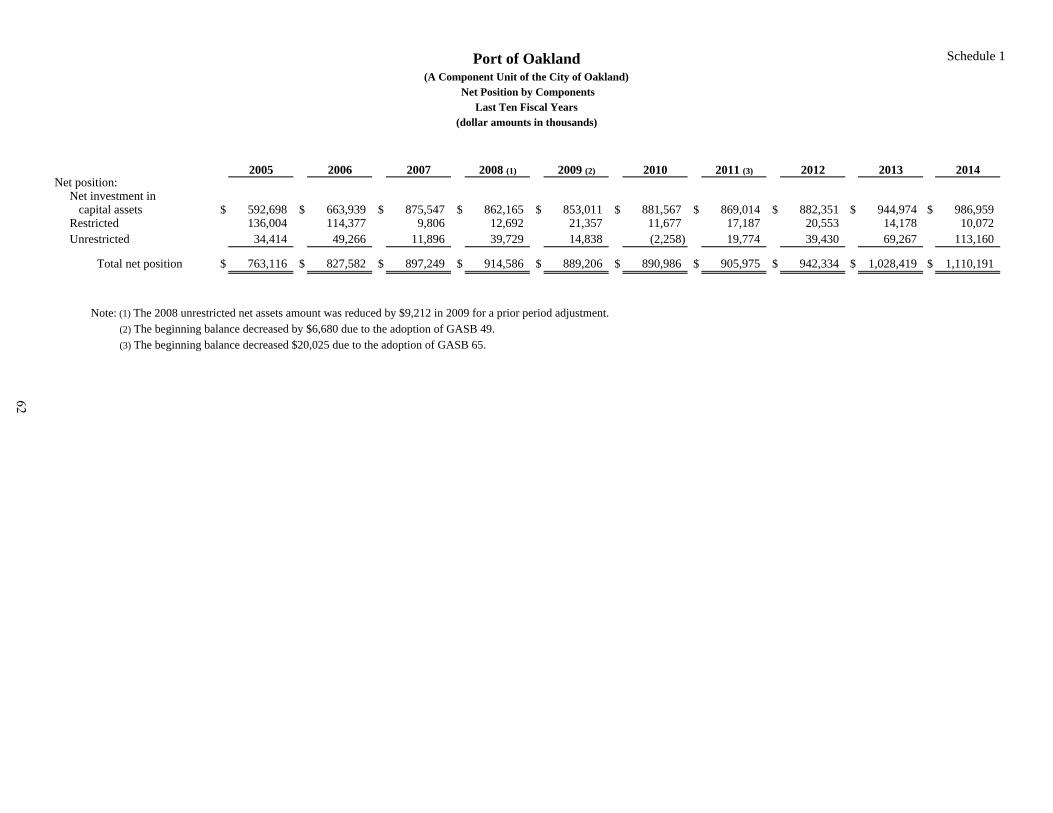
Schedule 1
2005 2006 2007 2008 (1) 2009 (2) 2010 2011 (3) 2012 2013 2014Net position: Net investment in
capital assets $ 592,698 $ 663,939 $ 875,547 $ 862,165 $ 853,011 $ 881,567 $ 869,014 $ 882,351 $ 944,974 $ 986,959 Restricted 136,004 114,377 9,806 12,692 21,357 11,677 17,187 20,553 14,178 10,072 Unrestricted 34,414 49,266 11,896 39,729 14,838 (2,258) 19,774 39,430 69,267 113,160
Total net position $ 763,116 $ 827,582 $ 897,249 $ 914,586 $ 889,206 $ 890,986 $ 905,975 $ 942,334 $ 1,028,419 $ 1,110,191
Note: (1) The 2008 unrestricted net assets amount was reduced by $9,212 in 2009 for a prior period adjustment. (2) The beginning balance decreased by $6,680 due to the adoption of GASB 49. (3) The beginning balance decreased $20,025 due to the adoption of GASB 65.
(dollar amounts in thousands)
Port of Oakland(A Component Unit of the City of Oakland)
Net Position by ComponentsLast Ten Fiscal Years
62
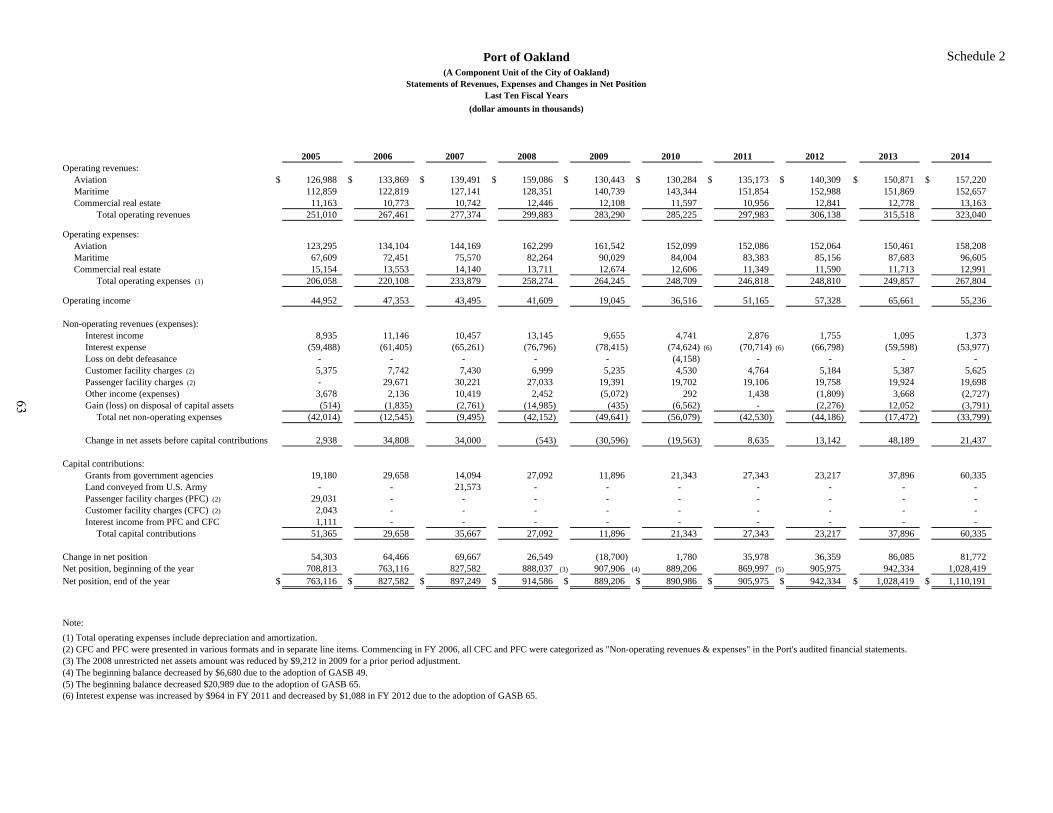
Schedule 2
2005 2006 2007 2008 2009 2010 2011 2012 2013 2014Operating revenues:
Aviation $ 126,988 $ 133,869 $ 139,491 $ 159,086 $ 130,443 $ 130,284 $ 135,173 $ 140,309 $ 150,871 $ 157,220Maritime 112,859 122,819 127,141 128,351 140,739 143,344 151,854 152,988 151,869 152,657Commercial real estate 11,163 10,773 10,742 12,446 12,108 11,597 10,956 12,841 12,778 13,163
Total operating revenues 251,010 267,461 277,374 299,883 283,290 285,225 297,983 306,138 315,518 323,040
Operating expenses:Aviation 123,295 134,104 144,169 162,299 161,542 152,099 152,086 152,064 150,461 158,208Maritime 67,609 72,451 75,570 82,264 90,029 84,004 83,383 85,156 87,683 96,605Commercial real estate 15,154 13,553 14,140 13,711 12,674 12,606 11,349 11,590 11,713 12,991
Total operating expenses (1) 206,058 220,108 233,879 258,274 264,245 248,709 246,818 248,810 249,857 267,804
Operating income 44,952 47,353 43,495 41,609 19,045 36,516 51,165 57,328 65,661 55,236
Non-operating revenues (expenses):Interest income 8,935 11,146 10,457 13,145 9,655 4,741 2,876 1,755 1,095 1,373Interest expense (59,488) (61,405) (65,261) (76,796) (78,415) (74,624) (6) (70,714) (6) (66,798) (59,598) (53,977)Loss on debt defeasance - - - - - (4,158) - - - - Customer facility charges (2) 5,375 7,742 7,430 6,999 5,235 4,530 4,764 5,184 5,387 5,625Passenger facility charges (2) - 29,671 30,221 27,033 19,391 19,702 19,106 19,758 19,924 19,698Other income (expenses) 3,678 2,136 10,419 2,452 (5,072) 292 1,438 (1,809) 3,668 (2,727)Gain (loss) on disposal of capital assets (514) (1,835) (2,761) (14,985) (435) (6,562) - (2,276) 12,052 (3,791)
Total net non-operating expenses (42,014) (12,545) (9,495) (42,152) (49,641) (56,079) (42,530) (44,186) (17,472) (33,799)
Change in net assets before capital contributions 2,938 34,808 34,000 (543) (30,596) (19,563) 8,635 13,142 48,189 21,437
Capital contributions: Grants from government agencies 19,180 29,658 14,094 27,092 11,896 21,343 27,343 23,217 37,896 60,335Land conveyed from U.S. Army - - 21,573 - - - - - - - Passenger facility charges (PFC) (2) 29,031 - - - - - - - - - Customer facility charges (CFC) (2) 2,043 - - - - - - - - - Interest income from PFC and CFC 1,111 - - - - - - - - -
Total capital contributions 51,365 29,658 35,667 27,092 11,896 21,343 27,343 23,217 37,896 60,335
Change in net position 54,303 64,466 69,667 26,549 (18,700) 1,780 35,978 36,359 86,085 81,772Net position, beginning of the year 708,813 763,116 827,582 888,037 (3) 907,906 (4) 889,206 869,997 (5) 905,975 942,334 1,028,419Net position, end of the year $ 763,116 $ 827,582 $ 897,249 $ 914,586 $ 889,206 $ 890,986 $ 905,975 $ 942,334 $ 1,028,419 $ 1,110,191
Note: (1) Total operating expenses include depreciation and amortization.(2) CFC and PFC were presented in various formats and in separate line items. Commencing in FY 2006, all CFC and PFC were categorized as "Non-operating revenues & expenses" in the Port's audited financial statements.(3) The 2008 unrestricted net assets amount was reduced by $9,212 in 2009 for a prior period adjustment.(4) The beginning balance decreased by $6,680 due to the adoption of GASB 49.(5) The beginning balance decreased $20,989 due to the adoption of GASB 65.(6) Interest expense was increased by $964 in FY 2011 and decreased by $1,088 in FY 2012 due to the adoption of GASB 65.
(dollar amounts in thousands)
Port of Oakland(A Component Unit of the City of Oakland)
Statements of Revenues, Expenses and Changes in Net PositionLast Ten Fiscal Years
63
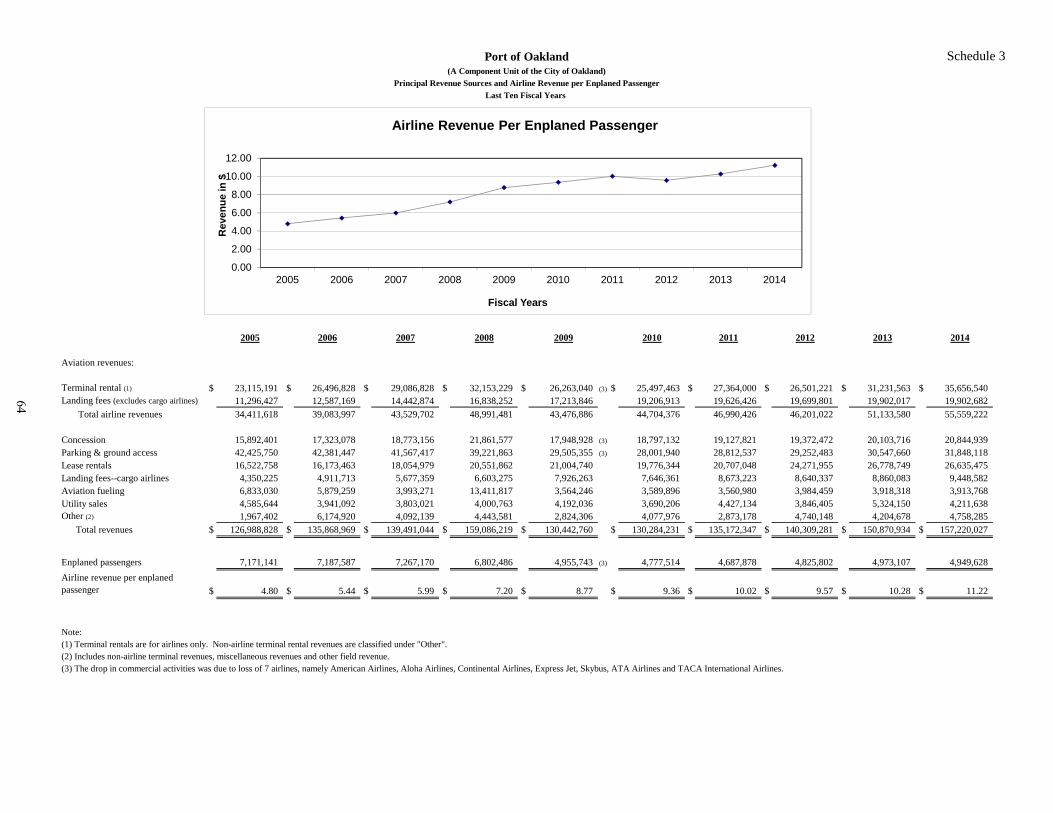
Schedule 3
2009 (2)
2005 2006 2007 2008 2009 2010 2011 2012 2013 2014
Aviation revenues:
Terminal rental (1) $ 23,115,191 $ 26,496,828 $ 29,086,828 $ 32,153,229 $ 26,263,040 (3) $ 25,497,463 $ 27,364,000 $ 26,501,221 $ 31,231,563 $ 35,656,540 Landing fees (excludes cargo airlines) 11,296,427 12,587,169 14,442,874 16,838,252 17,213,846 19,206,913 19,626,426 19,699,801 19,902,017 19,902,682 Total airline revenues 34,411,618 39,083,997 43,529,702 48,991,481 43,476,886 44,704,376 46,990,426 46,201,022 51,133,580 55,559,222
Concession 15,892,401 17,323,078 18,773,156 21,861,577 17,948,928 (3) 18,797,132 19,127,821 19,372,472 20,103,716 20,844,939 Parking & ground access 42,425,750 42,381,447 41,567,417 39,221,863 29,505,355 (3) 28,001,940 28,812,537 29,252,483 30,547,660 31,848,118 Lease rentals 16,522,758 16,173,463 18,054,979 20,551,862 21,004,740 19,776,344 20,707,048 24,271,955 26,778,749 26,635,475 Landing fees--cargo airlines 4,350,225 4,911,713 5,677,359 6,603,275 7,926,263 7,646,361 8,673,223 8,640,337 8,860,083 9,448,582 Aviation fueling 6,833,030 5,879,259 3,993,271 13,411,817 3,564,246 3,589,896 3,560,980 3,984,459 3,918,318 3,913,768 Utility sales 4,585,644 3,941,092 3,803,021 4,000,763 4,192,036 3,690,206 4,427,134 3,846,405 5,324,150 4,211,638 Other (2) 1,967,402 6,174,920 4,092,139 4,443,581 2,824,306 4,077,976 2,873,178 4,740,148 4,204,678 4,758,285 Total revenues $ 126,988,828 $ 135,868,969 $ 139,491,044 $ 159,086,219 $ 130,442,760 $ 130,284,231 $ 135,172,347 $ 140,309,281 $ 150,870,934 $ 157,220,027
Enplaned passengers 7,171,141 7,187,587 7,267,170 6,802,486 4,955,743 (3) 4,777,514 4,687,878 4,825,802 4,973,107 4,949,628 Airline revenue per enplaned passenger $ 4.80 $ 5.44 $ 5.99 $ 7.20 $ 8.77 $ 9.36 $ 10.02 $ 9.57 $ 10.28 $ 11.22
Note:(1) Terminal rentals are for airlines only. Non-airline terminal rental revenues are classified under "Other".(2) Includes non-airline terminal revenues, miscellaneous revenues and other field revenue.(3) The drop in commercial activities was due to loss of 7 airlines, namely American Airlines, Aloha Airlines, Continental Airlines, Express Jet, Skybus, ATA Airlines and TACA International Airlines.
Port of Oakland(A Component Unit of the City of Oakland)
Principal Revenue Sources and Airline Revenue per Enplaned Passenger
Last Ten Fiscal Years
0.00
2.00
4.00
6.00
8.00
10.00
12.00
2005 2006 2007 2008 2009 2010 2011 2012 2013 2014
Rev
enue
in $
Fiscal Years
Airline Revenue Per Enplaned Passenger
64
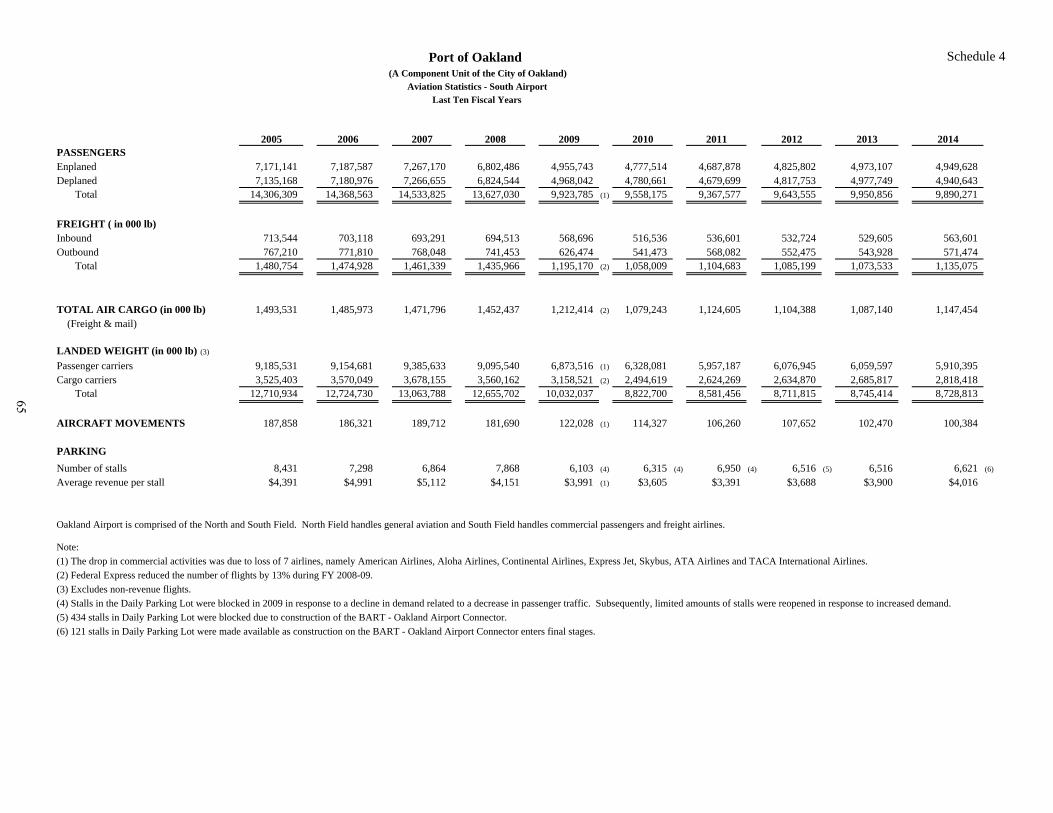
Schedule 4
2005 2006 2007 2008 2009 2010 2011 2012 2013 2014PASSENGERSEnplaned 7,171,141 7,187,587 7,267,170 6,802,486 4,955,743 4,777,514 4,687,878 4,825,802 4,973,107 4,949,628Deplaned 7,135,168 7,180,976 7,266,655 6,824,544 4,968,042 4,780,661 4,679,699 4,817,753 4,977,749 4,940,643 Total 14,306,309 14,368,563 14,533,825 13,627,030 9,923,785 (1) 9,558,175 9,367,577 9,643,555 9,950,856 9,890,271
FREIGHT ( in 000 lb)Inbound 713,544 703,118 693,291 694,513 568,696 516,536 536,601 532,724 529,605 563,601Outbound 767,210 771,810 768,048 741,453 626,474 541,473 568,082 552,475 543,928 571,474 Total 1,480,754 1,474,928 1,461,339 1,435,966 1,195,170 (2) 1,058,009 1,104,683 1,085,199 1,073,533 1,135,075
TOTAL AIR CARGO (in 000 lb) 1,493,531 1,485,973 1,471,796 1,452,437 1,212,414 (2) 1,079,243 1,124,605 1,104,388 1,087,140 1,147,454 (Freight & mail)
LANDED WEIGHT (in 000 lb) (3)
Passenger carriers 9,185,531 9,154,681 9,385,633 9,095,540 6,873,516 (1) 6,328,081 5,957,187 6,076,945 6,059,597 5,910,395Cargo carriers 3,525,403 3,570,049 3,678,155 3,560,162 3,158,521 (2) 2,494,619 2,624,269 2,634,870 2,685,817 2,818,418 Total 12,710,934 12,724,730 13,063,788 12,655,702 10,032,037 8,822,700 8,581,456 8,711,815 8,745,414 8,728,813
AIRCRAFT MOVEMENTS 187,858 186,321 189,712 181,690 122,028 (1) 114,327 106,260 107,652 102,470 100,384
PARKING
Number of stalls 8,431 7,298 6,864 7,868 6,103 (4) 6,315 (4) 6,950 (4) 6,516 (5) 6,516 6,621 (6)
Average revenue per stall $4,391 $4,991 $5,112 $4,151 $3,991 (1) $3,605 $3,391 $3,688 $3,900 $4,016
Oakland Airport is comprised of the North and South Field. North Field handles general aviation and South Field handles commercial passengers and freight airlines.
Note: (1) The drop in commercial activities was due to loss of 7 airlines, namely American Airlines, Aloha Airlines, Continental Airlines, Express Jet, Skybus, ATA Airlines and TACA International Airlines.(2) Federal Express reduced the number of flights by 13% during FY 2008-09.(3) Excludes non-revenue flights.(4) Stalls in the Daily Parking Lot were blocked in 2009 in response to a decline in demand related to a decrease in passenger traffic. Subsequently, limited amounts of stalls were reopened in response to increased demand.(5) 434 stalls in Daily Parking Lot were blocked due to construction of the BART - Oakland Airport Connector.(6) 121 stalls in Daily Parking Lot were made available as construction on the BART - Oakland Airport Connector enters final stages.
Port of Oakland (A Component Unit of the City of Oakland)
Aviation Statistics - South AirportLast Ten Fiscal Years
65
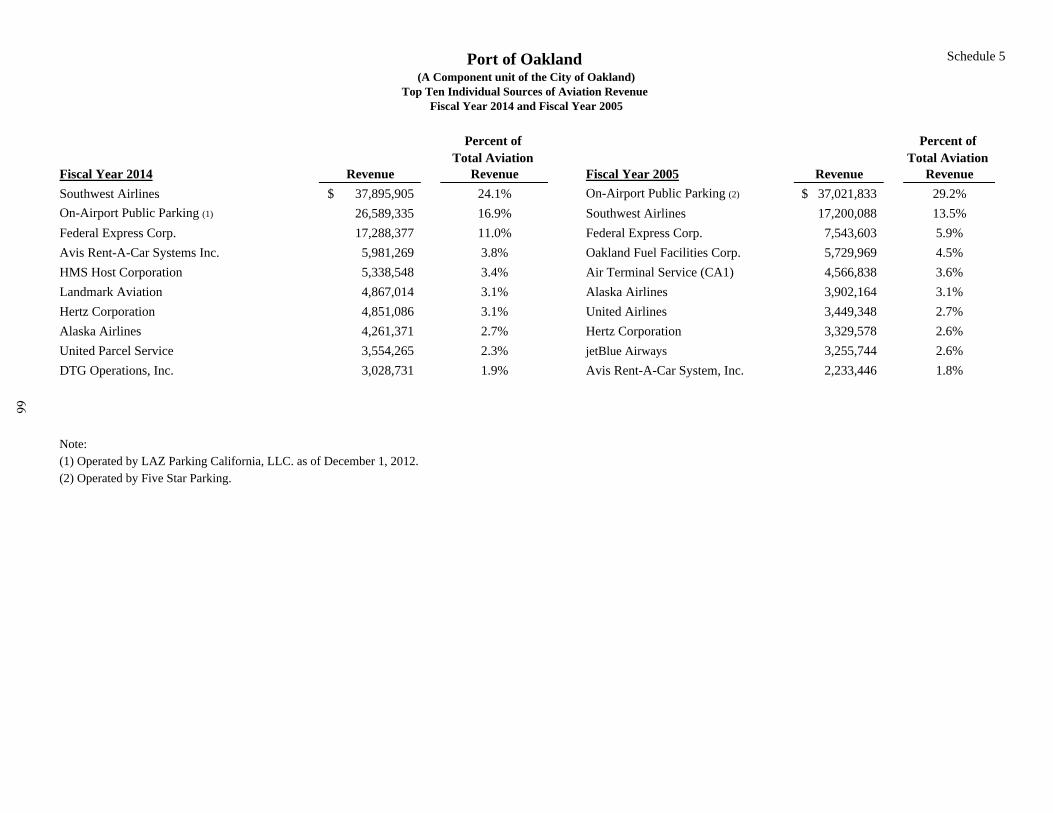
Schedule 5
Percent of Percent of Total Aviation Total Aviation
Fiscal Year 2014 Revenue Revenue Fiscal Year 2005 Revenue Revenue
Southwest Airlines 37,895,905$ 24.1% On-Airport Public Parking (2) 37,021,833$ 29.2%On-Airport Public Parking (1) 26,589,335 16.9% Southwest Airlines 17,200,088 13.5%Federal Express Corp. 17,288,377 11.0% Federal Express Corp. 7,543,603 5.9%Avis Rent-A-Car Systems Inc. 5,981,269 3.8% Oakland Fuel Facilities Corp. 5,729,969 4.5%HMS Host Corporation 5,338,548 3.4% Air Terminal Service (CA1) 4,566,838 3.6%
4,867,014 3.1% Alaska Airlines 3,902,164 3.1%Hertz Corporation 4,851,086 3.1% United Airlines 3,449,348 2.7%Alaska Airlines 4,261,371 2.7% Hertz Corporation 3,329,578 2.6%United Parcel Service 3,554,265 2.3% jetBlue Airways 3,255,744 2.6%DTG Operations, Inc. 3,028,731 1.9% Avis Rent-A-Car System, Inc. 2,233,446 1.8%
Note:(1) Operated by LAZ Parking California, LLC. as of December 1, 2012.(2) Operated by Five Star Parking.
Landmark Aviation
Port of Oakland (A Component unit of the City of Oakland)
Top Ten Individual Sources of Aviation Revenue Fiscal Year 2014 and Fiscal Year 2005
66
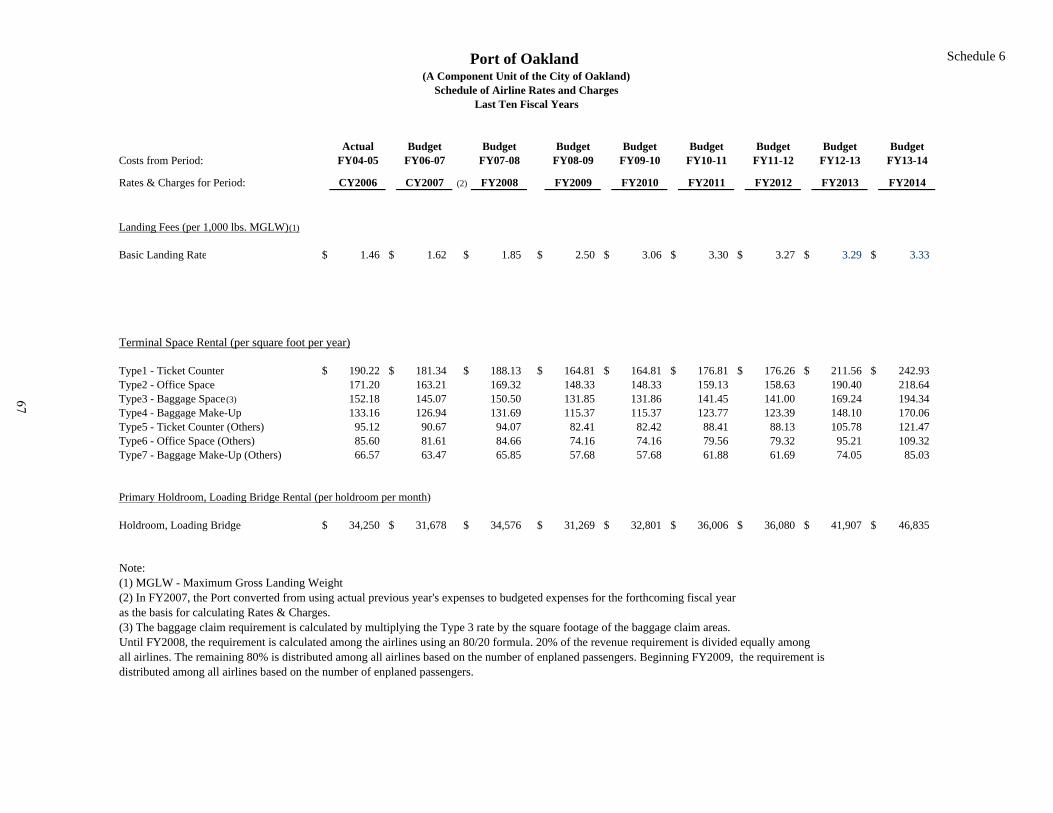
Schedule 6
Actual Budget Budget Budget Budget Budget Budget Budget BudgetCosts from Period: FY04-05 FY06-07 FY07-08 FY08-09 FY09-10 FY10-11 FY11-12 FY12-13 FY13-14
Rates & Charges for Period: CY2006 CY2007 (2) FY2008 FY2009 FY2010 FY2011 FY2012 FY2013 FY2014
Landing Fees (per 1,000 lbs. MGLW) (1)
Basic Landing Rate $ 1.46 $ 1.62 $ 1.85 $ 2.50 $ 3.06 $ 3.30 $ 3.27 $ 3.29 $ 3.33
Terminal Space Rental (per square foot per year)
Type1 - Ticket Counter $ 190.22 $ 181.34 $ 188.13 $ 164.81 $ 164.81 $ 176.81 $ 176.26 $ 211.56 $ 242.93Type2 - Office Space 171.20 163.21 169.32 148.33 148.33 159.13 158.63 190.40 218.64Type3 - Baggage Space (3) 152.18 145.07 150.50 131.85 131.86 141.45 141.00 169.24 194.34Type4 - Baggage Make-Up 133.16 126.94 131.69 115.37 115.37 123.77 123.39 148.10 170.06Type5 - Ticket Counter (Others) 95.12 90.67 94.07 82.41 82.42 88.41 88.13 105.78 121.47Type6 - Office Space (Others) 85.60 81.61 84.66 74.16 74.16 79.56 79.32 95.21 109.32Type7 - Baggage Make-Up (Others) 66.57 63.47 65.85 57.68 57.68 61.88 61.69 74.05 85.03
Primary Holdroom, Loading Bridge Rental (per holdroom per month)
Holdroom, Loading Bridge $ 34,250 $ 31,678 $ 34,576 $ 31,269 $ 32,801 $ 36,006 $ 36,080 $ 41,907 $ 46,835
Note: (1) MGLW - Maximum Gross Landing Weight(2) In FY2007, the Port converted from using actual previous year's expenses to budgeted expenses for the forthcoming fiscal yearas the basis for calculating Rates & Charges.(3) The baggage claim requirement is calculated by multiplying the Type 3 rate by the square footage of the baggage claim areas.Until FY2008, the requirement is calculated among the airlines using an 80/20 formula. 20% of the revenue requirement is divided equally amongall airlines. The remaining 80% is distributed among all airlines based on the number of enplaned passengers. Beginning FY2009, the requirement is distributed among all airlines based on the number of enplaned passengers.
Port of Oakland (A Component Unit of the City of Oakland)
Schedule of Airline Rates and ChargesLast Ten Fiscal Years
67
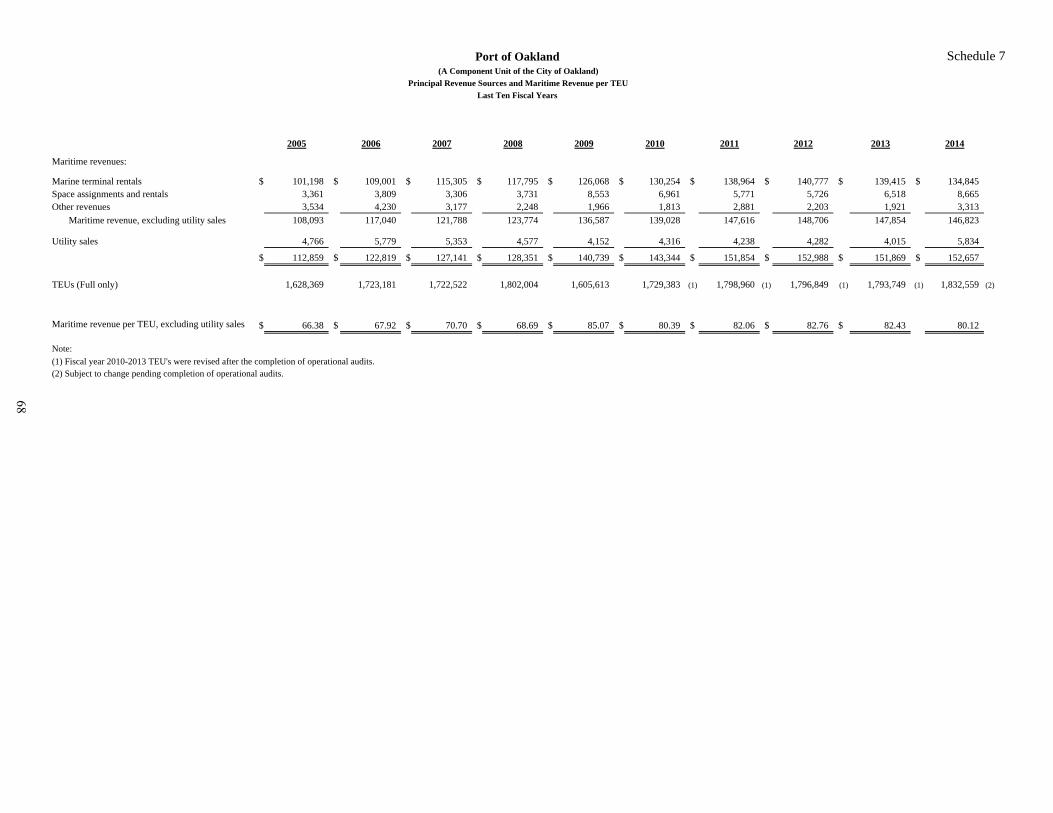
Schedule 7
2005 2006 2007 2008 2009 2010 2011 2012 2013 2014
Maritime revenues:
Marine terminal rentals $ 101,198 $ 109,001 $ 115,305 $ 117,795 $ 126,068 $ 130,254 $ 138,964 $ 140,777 $ 139,415 $ 134,845 Space assignments and rentals 3,361 3,809 3,306 3,731 8,553 6,961 5,771 5,726 6,518 8,665 Other revenues 3,534 4,230 3,177 2,248 1,966 1,813 2,881 2,203 1,921 3,313 Maritime revenue, excluding utility sales 108,093 117,040 121,788 123,774 136,587 139,028 147,616 148,706 147,854 146,823
Utility sales 4,766 5,779 5,353 4,577 4,152 4,316 4,238 4,282 4,015 5,834
$ 112,859 $ 122,819 $ 127,141 $ 128,351 $ 140,739 $ 143,344 $ 151,854 $ 152,988 $ 151,869 $ 152,657
TEUs (Full only) 1,628,369 1,723,181 1,722,522 1,802,004 1,605,613 1,729,383 (1) 1,798,960 (1) 1,796,849 (1) 1,793,749 (1) 1,832,559 (2)
Maritime revenue per TEU, excluding utility sales $ 66.38 $ 67.92 $ 70.70 $ 68.69 $ 85.07 $ 80.39 $ 82.06 $ 82.76 $ 82.43 80.12
Note:(1) Fiscal year 2010-2013 TEU's were revised after the completion of operational audits.(2) Subject to change pending completion of operational audits.
Port of Oakland
Principal Revenue Sources and Maritime Revenue per TEU
(A Component Unit of the City of Oakland)
Last Ten Fiscal Years
68
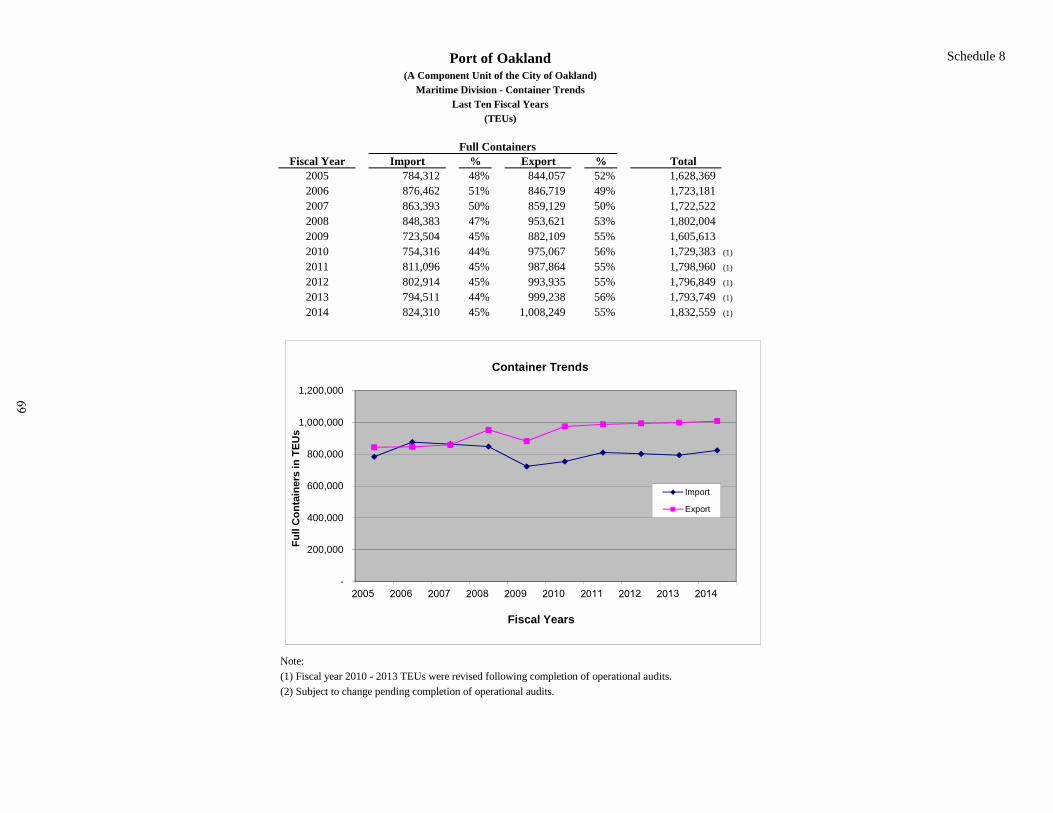
Schedule 8
Fiscal Year Import % Export % Total2005 784,312 48% 844,057 52% 1,628,369 2006 876,462 51% 846,719 49% 1,723,181 2007 863,393 50% 859,129 50% 1,722,522 2008 848,383 47% 953,621 53% 1,802,004 2009 723,504 45% 882,109 55% 1,605,613 2010 754,316 44% 975,067 56% 1,729,383 (1)
2011 811,096 45% 987,864 55% 1,798,960 (1)
2012 802,914 45% 993,935 55% 1,796,849 (1)
2013 794,511 44% 999,238 56% 1,793,749 (1)
2014 824,310 45% 1,008,249 55% 1,832,559 (1)
Note:(1) Fiscal year 2010 - 2013 TEUs were revised following completion of operational audits.(2) Subject to change pending completion of operational audits.
(TEUs)
Full Containers
Port of Oakland(A Component Unit of the City of Oakland)
Maritime Division - Container Trends
Last Ten Fiscal Years
-
200,000
400,000
600,000
800,000
1,000,000
1,200,000
Full
Con
tain
ers
in T
EUs
Fiscal Years
Container Trends
Import
Export
69
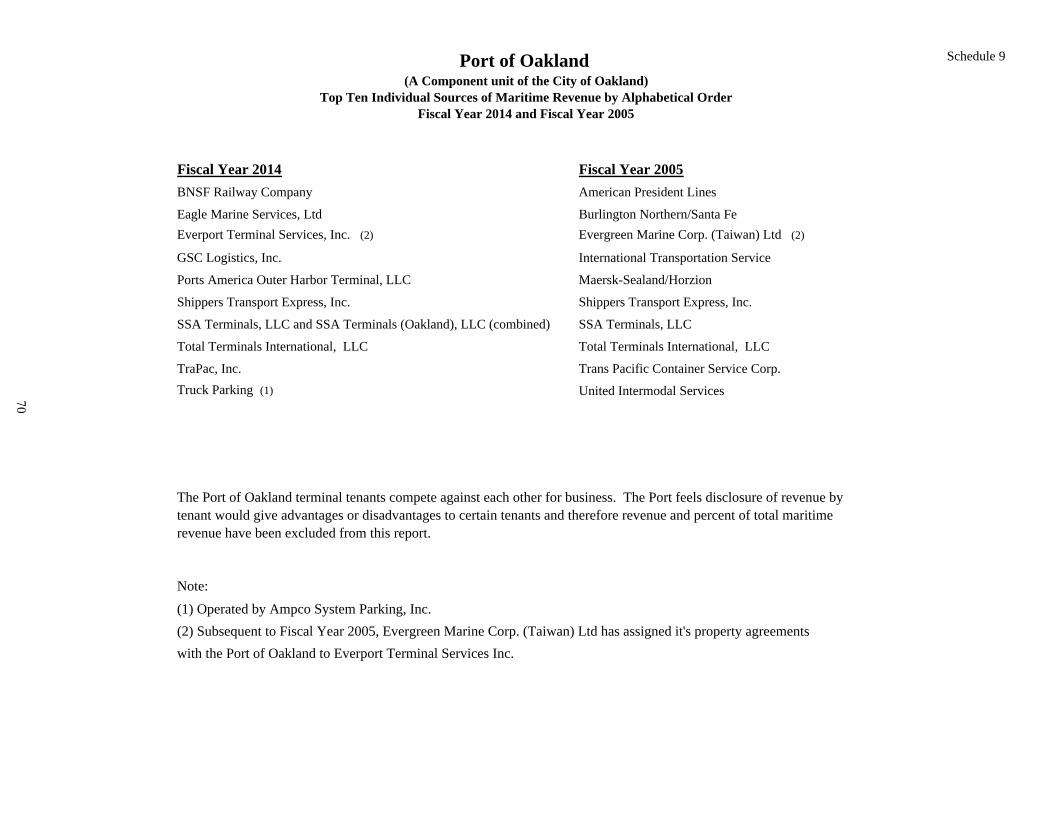
Schedule 9
Fiscal Year 2014 Fiscal Year 2005
BNSF Railway Company American President Lines
Eagle Marine Services, Ltd Burlington Northern/Santa Fe Everport Terminal Services, Inc. (2) Evergreen Marine Corp. (Taiwan) Ltd (2)
GSC Logistics, Inc. International Transportation Service
Ports America Outer Harbor Terminal, LLC Maersk-Sealand/Horzion
Shippers Transport Express, Inc. Shippers Transport Express, Inc.
SSA Terminals, LLC and SSA Terminals (Oakland), LLC (combined) SSA Terminals, LLC
Total Terminals International, LLC Total Terminals International, LLC
TraPac, Inc. Trans Pacific Container Service Corp.Truck Parking (1) United Intermodal Services
Note: (1) Operated by Ampco System Parking, Inc.(2) Subsequent to Fiscal Year 2005, Evergreen Marine Corp. (Taiwan) Ltd has assigned it's property agreements with the Port of Oakland to Everport Terminal Services Inc.
The Port of Oakland terminal tenants compete against each other for business. The Port feels disclosure of revenue by tenant would give advantages or disadvantages to certain tenants and therefore revenue and percent of total maritime revenue have been excluded from this report.
Port of Oakland (A Component unit of the City of Oakland)
Top Ten Individual Sources of Maritime Revenue by Alphabetical OrderFiscal Year 2014 and Fiscal Year 2005
70
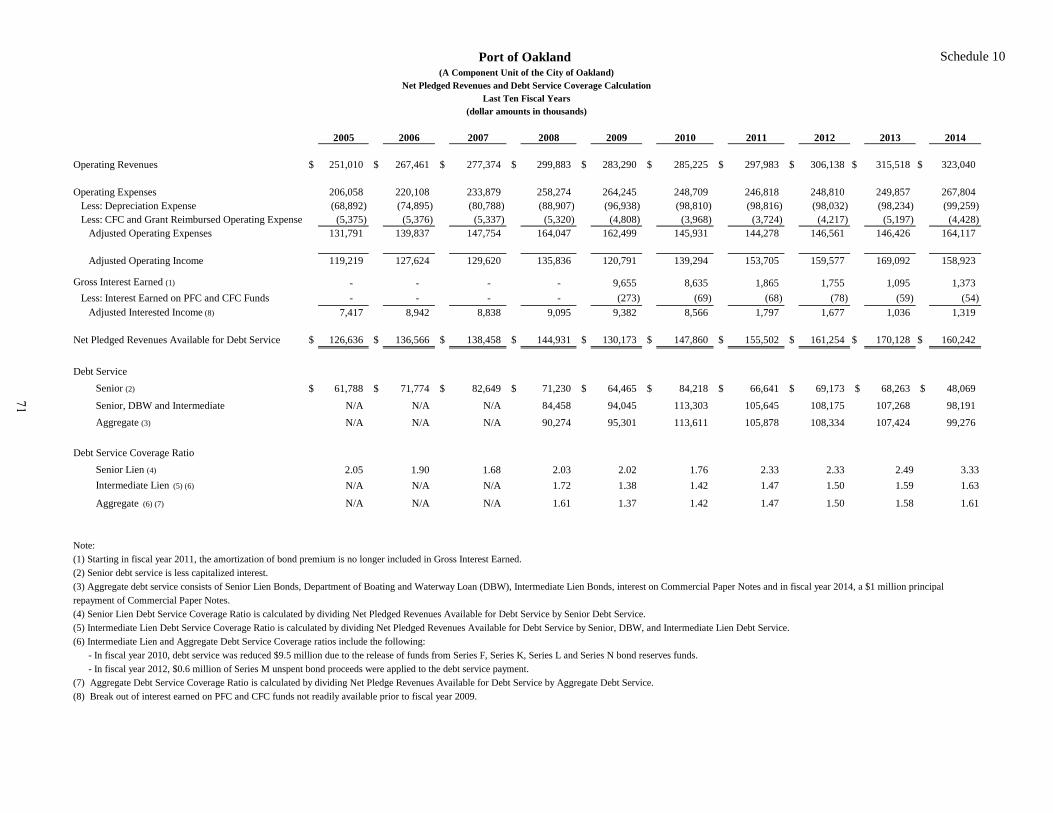
Schedule 10
2005 2006 2007 2008 2009 2010 2011 2012 2013 2014
Operating Revenues $ 251,010 $ 267,461 $ 277,374 $ 299,883 $ 283,290 $ 285,225 $ 297,983 $ 306,138 $ 315,518 $ 323,040
Operating Expenses 206,058 220,108 233,879 258,274 264,245 248,709 246,818 248,810 249,857 267,804 Less: Depreciation Expense (68,892) (74,895) (80,788) (88,907) (96,938) (98,810) (98,816) (98,032) (98,234) (99,259) Less: CFC and Grant Reimbursed Operating Expense (5,375) (5,376) (5,337) (5,320) (4,808) (3,968) (3,724) (4,217) (5,197) (4,428)
Adjusted Operating Expenses 131,791 139,837 147,754 164,047 162,499 145,931 144,278 146,561 146,426 164,117
Adjusted Operating Income 119,219 127,624 129,620 135,836 120,791 139,294 153,705 159,577 169,092 158,923
Gross Interest Earned (1) - - - - 9,655 8,635 1,865 1,755 1,095 1,373 Less: Interest Earned on PFC and CFC Funds - - - - (273) (69) (68) (78) (59) (54)
Adjusted Interested Income (8) 7,417 8,942 8,838 9,095 9,382 8,566 1,797 1,677 1,036 1,319
Net Pledged Revenues Available for Debt Service $ 126,636 $ 136,566 $ 138,458 $ 144,931 $ 130,173 $ 147,860 $ 155,502 $ 161,254 $ 170,128 $ 160,242
Debt ServiceSenior (2) $ 61,788 $ 71,774 $ 82,649 $ 71,230 $ 64,465 $ 84,218 $ 66,641 $ 69,173 $ 68,263 $ 48,069
Senior, DBW and Intermediate N/A N/A N/A 84,458 94,045 113,303 105,645 108,175 107,268 98,191 Aggregate (3) N/A N/A N/A 90,274 95,301 113,611 105,878 108,334 107,424 99,276
Debt Service Coverage RatioSenior Lien (4) 2.05 1.90 1.68 2.03 2.02 1.76 2.33 2.33 2.49 3.33Intermediate Lien (5) (6) N/A N/A N/A 1.72 1.38 1.42 1.47 1.50 1.59 1.63
Aggregate (6) (7) N/A N/A N/A 1.61 1.37 1.42 1.47 1.50 1.58 1.61
Note:(1) Starting in fiscal year 2011, the amortization of bond premium is no longer included in Gross Interest Earned.(2) Senior debt service is less capitalized interest.(3) Aggregate debt service consists of Senior Lien Bonds, Department of Boating and Waterway Loan (DBW), Intermediate Lien Bonds, interest on Commercial Paper Notes and in fiscal year 2014, a $1 million principal repayment of Commercial Paper Notes.(4) Senior Lien Debt Service Coverage Ratio is calculated by dividing Net Pledged Revenues Available for Debt Service by Senior Debt Service.(5) Intermediate Lien Debt Service Coverage Ratio is calculated by dividing Net Pledged Revenues Available for Debt Service by Senior, DBW, and Intermediate Lien Debt Service.(6) Intermediate Lien and Aggregate Debt Service Coverage ratios include the following:
- In fiscal year 2010, debt service was reduced $9.5 million due to the release of funds from Series F, Series K, Series L and Series N bond reserves funds.- In fiscal year 2012, $0.6 million of Series M unspent bond proceeds were applied to the debt service payment.
(7) Aggregate Debt Service Coverage Ratio is calculated by dividing Net Pledge Revenues Available for Debt Service by Aggregate Debt Service.(8) Break out of interest earned on PFC and CFC funds not readily available prior to fiscal year 2009.
(dollar amounts in thousands)
Port of Oakland (A Component Unit of the City of Oakland)
Net Pledged Revenues and Debt Service Coverage CalculationLast Ten Fiscal Years
71
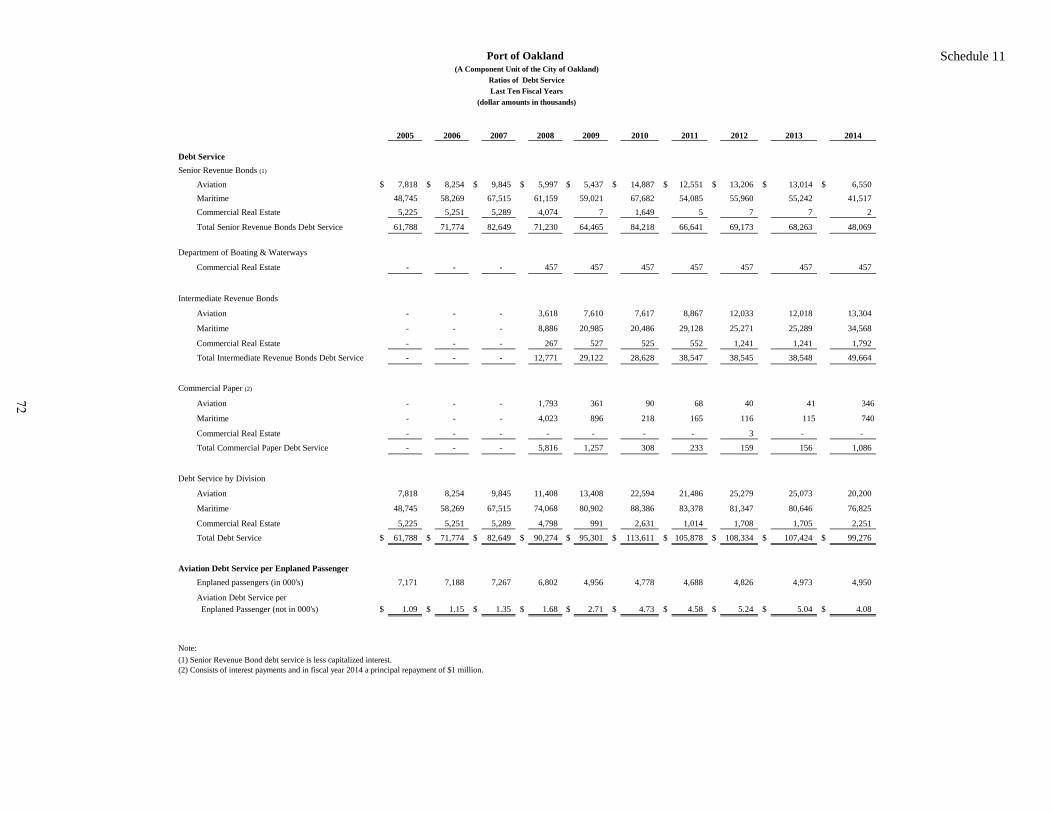
Schedule 11
2005 2006 2007 2008 2009 2010 2011 2012 2013 2014
Debt Service
Senior Revenue Bonds (1)
Aviation $ 7,818 $ 8,254 $ 9,845 $ 5,997 $ 5,437 $ 14,887 $ 12,551 $ 13,206 $ 13,014 $ 6,550 Maritime 48,745 58,269 67,515 61,159 59,021 67,682 54,085 55,960 55,242 41,517 Commercial Real Estate 5,225 5,251 5,289 4,074 7 1,649 5 7 7 2
Total Senior Revenue Bonds Debt Service 61,788 71,774 82,649 71,230 64,465 84,218 66,641 69,173 68,263 48,069
Department of Boating & Waterways
Commercial Real Estate - - - 457 457 457 457 457 457 457
Intermediate Revenue Bonds
Aviation - - - 3,618 7,610 7,617 8,867 12,033 12,018 13,304
Maritime - - - 8,886 20,985 20,486 29,128 25,271 25,289 34,568
Commercial Real Estate - - - 267 527 525 552 1,241 1,241 1,792
Total Intermediate Revenue Bonds Debt Service - - - 12,771 29,122 28,628 38,547 38,545 38,548 49,664
Commercial Paper (2)
Aviation - - - 1,793 361 90 68 40 41 346
Maritime - - - 4,023 896 218 165 116 115 740
Commercial Real Estate - - - - - - - 3 - -
Total Commercial Paper Debt Service - - - 5,816 1,257 308 233 159 156 1,086
Debt Service by Division
Aviation 7,818 8,254 9,845 11,408 13,408 22,594 21,486 25,279 25,073 20,200
Maritime 48,745 58,269 67,515 74,068 80,902 88,386 83,378 81,347 80,646 76,825
Commercial Real Estate 5,225 5,251 5,289 4,798 991 2,631 1,014 1,708 1,705 2,251
Total Debt Service $ 61,788 $ 71,774 $ 82,649 $ 90,274 $ 95,301 $ 113,611 $ 105,878 $ 108,334 $ 107,424 $ 99,276
Aviation Debt Service per Enplaned Passenger
Enplaned passengers (in 000's) 7,171 7,188 7,267 6,802 4,956 4,778 4,688 4,826 4,973 4,950
Aviation Debt Service per Enplaned Passenger (not in 000's) $ 1.09 $ 1.15 $ 1.35 $ 1.68 $ 2.71 $ 4.73 $ 4.58 $ 5.24 $ 5.04 $ 4.08
Note:(1) Senior Revenue Bond debt service is less capitalized interest.(2) Consists of interest payments and in fiscal year 2014 a principal repayment of $1 million.
(dollar amounts in thousands)
Port of Oakland (A Component Unit of the City of Oakland)
Ratios of Debt Service
Last Ten Fiscal Years
72
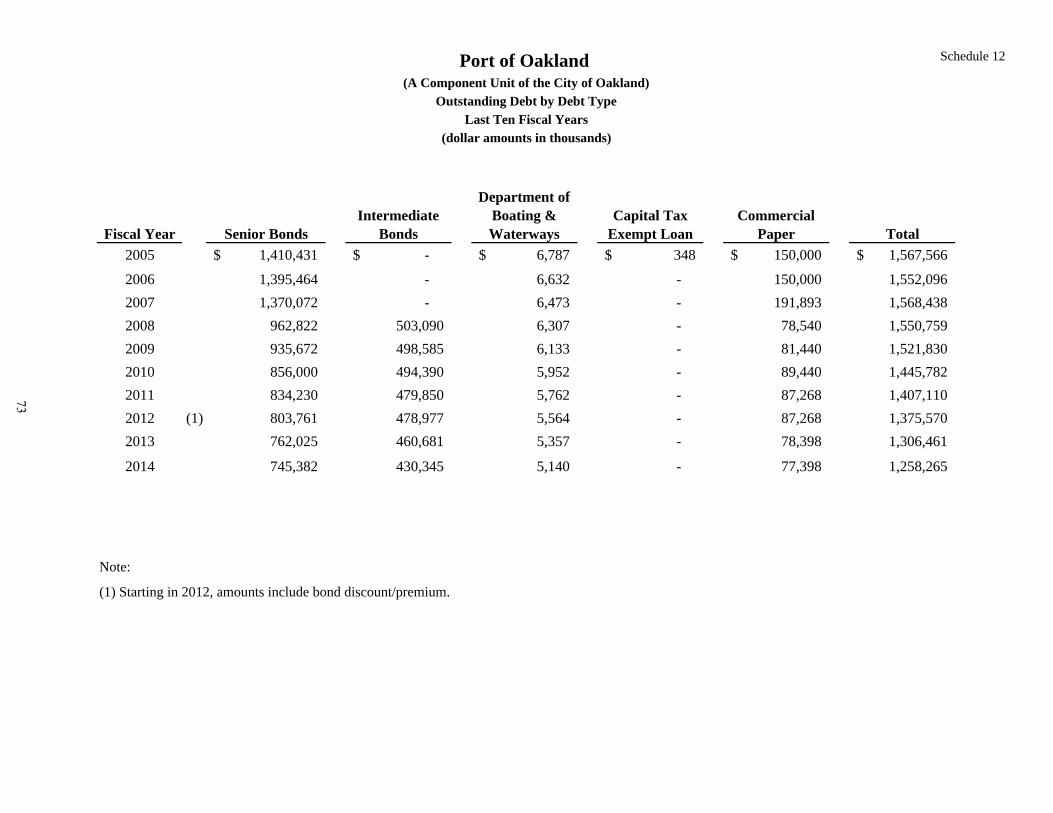
Schedule 12
Fiscal Year Senior BondsIntermediate
Bonds
Department of Boating & Waterways
Capital Tax Exempt Loan
Commercial Paper Total
2005 1,410,431$ -$ 6,787$ 348$ 150,000$ 1,567,566$
2006 1,395,464 - 6,632 - 150,000 1,552,096 2007 1,370,072 - 6,473 - 191,893 1,568,438 2008 962,822 503,090 6,307 - 78,540 1,550,759 2009 935,672 498,585 6,133 - 81,440 1,521,830 2010 856,000 494,390 5,952 - 89,440 1,445,782 2011 834,230 479,850 5,762 - 87,268 1,407,110 2012 (1) 803,761 478,977 5,564 - 87,268 1,375,570 2013 762,025 460,681 5,357 - 78,398 1,306,461
2014 745,382 430,345 5,140 - 77,398 1,258,265
Note:
(1) Starting in 2012, amounts include bond discount/premium.
Port of Oakland (A Component Unit of the City of Oakland)
Outstanding Debt by Debt Type
Last Ten Fiscal Years
(dollar amounts in thousands)
73
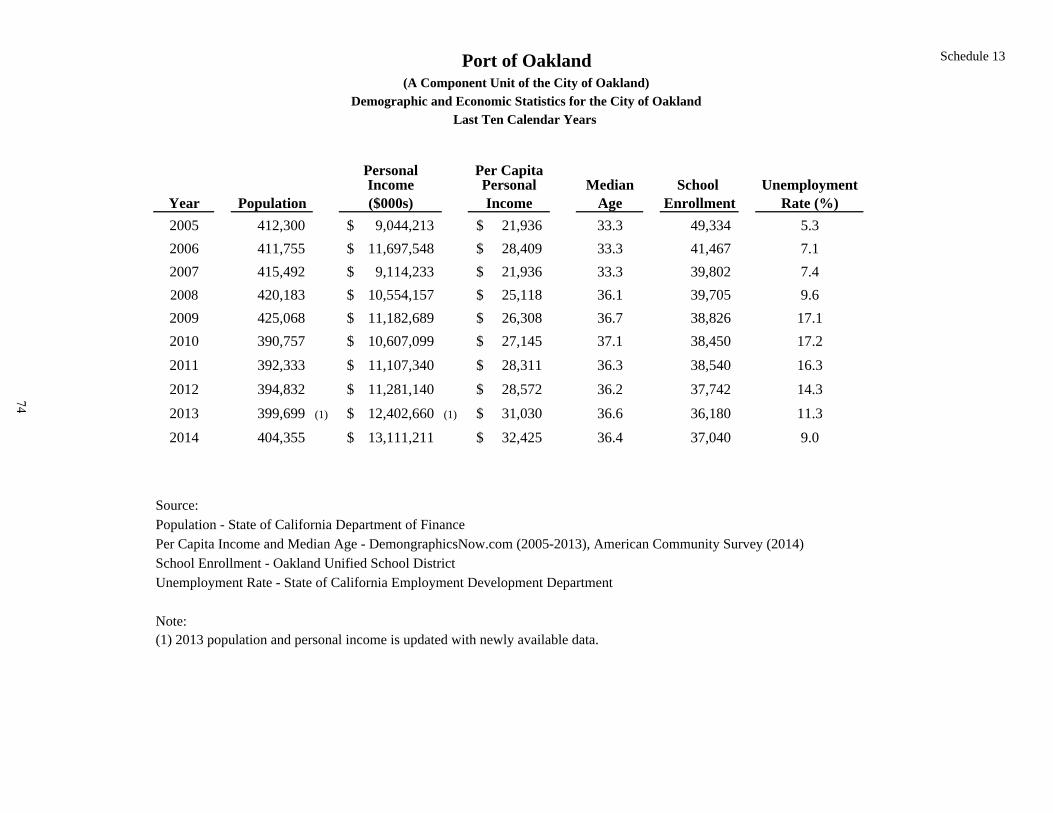
Schedule 13
Personal Per CapitaIncome Personal Median School Unemployment
Year Population ($000s) Income Age Enrollment Rate (%)
2005 412,300 9,044,213$ 21,936$ 33.3 49,334 5.32006 411,755 11,697,548$ 28,409$ 33.3 41,467 7.12007 415,492 9,114,233$ 21,936$ 33.3 39,802 7.42008 420,183 10,554,157$ 25,118$ 36.1 39,705 9.62009 425,068 11,182,689$ 26,308$ 36.7 38,826 17.12010 390,757 10,607,099$ 27,145$ 37.1 38,450 17.22011 392,333 11,107,340$ 28,311$ 36.3 38,540 16.32012 394,832 11,281,140$ 28,572$ 36.2 37,742 14.32013 399,699 (1) 12,402,660$ (1) 31,030$ 36.6 36,180 11.32014 404,355 13,111,211$ 32,425$ 36.4 37,040 9.0
Source: Population - State of California Department of FinancePer Capita Income and Median Age - DemongraphicsNow.com (2005-2013), American Community Survey (2014)School Enrollment - Oakland Unified School District Unemployment Rate - State of California Employment Development Department
Note: (1) 2013 population and personal income is updated with newly available data.
Port of Oakland(A Component Unit of the City of Oakland)
Demographic and Economic Statistics for the City of Oakland
Last Ten Calendar Years
74
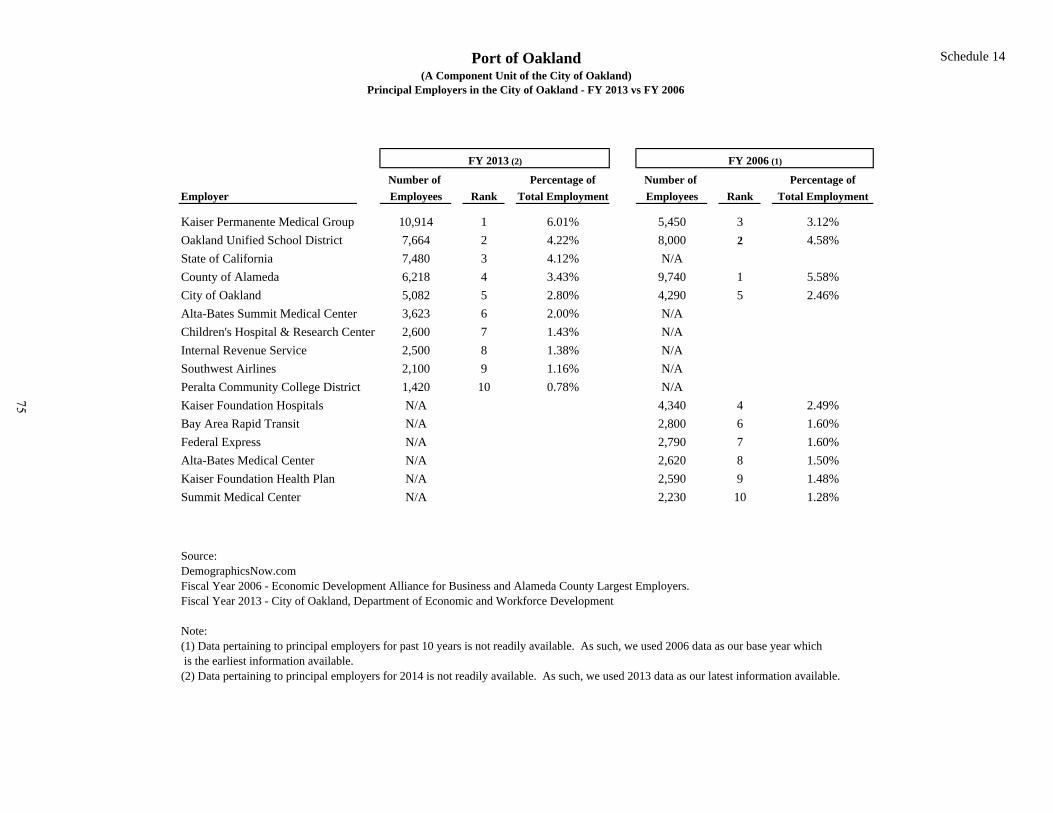
Schedule 14
Number of Percentage of Number of Percentage of
Employer Employees Rank Total Employment Employees Rank Total Employment
Kaiser Permanente Medical Group 10,914 1 6.01% 5,450 3 3.12%Oakland Unified School District 7,664 2 4.22% 8,000 2 4.58%State of California 7,480 3 4.12% N/ACounty of Alameda 6,218 4 3.43% 9,740 1 5.58%City of Oakland 5,082 5 2.80% 4,290 5 2.46%Alta-Bates Summit Medical Center 3,623 6 2.00% N/AChildren's Hospital & Research Center 2,600 7 1.43% N/AInternal Revenue Service 2,500 8 1.38% N/ASouthwest Airlines 2,100 9 1.16% N/APeralta Community College District 1,420 10 0.78% N/AKaiser Foundation Hospitals N/A 4,340 4 2.49%Bay Area Rapid Transit N/A 2,800 6 1.60%Federal Express N/A 2,790 7 1.60%Alta-Bates Medical Center N/A 2,620 8 1.50%Kaiser Foundation Health Plan N/A 2,590 9 1.48%Summit Medical Center N/A 2,230 10 1.28%
Source: DemographicsNow.comFiscal Year 2006 - Economic Development Alliance for Business and Alameda County Largest Employers.Fiscal Year 2013 - City of Oakland, Department of Economic and Workforce Development
Note:(1) Data pertaining to principal employers for past 10 years is not readily available. As such, we used 2006 data as our base year which is the earliest information available.(2) Data pertaining to principal employers for 2014 is not readily available. As such, we used 2013 data as our latest information available.
FY 2006 (1)FY 2013 (2)
Port of Oakland(A Component Unit of the City of Oakland)
Principal Employers in the City of Oakland - FY 2013 vs FY 2006
75
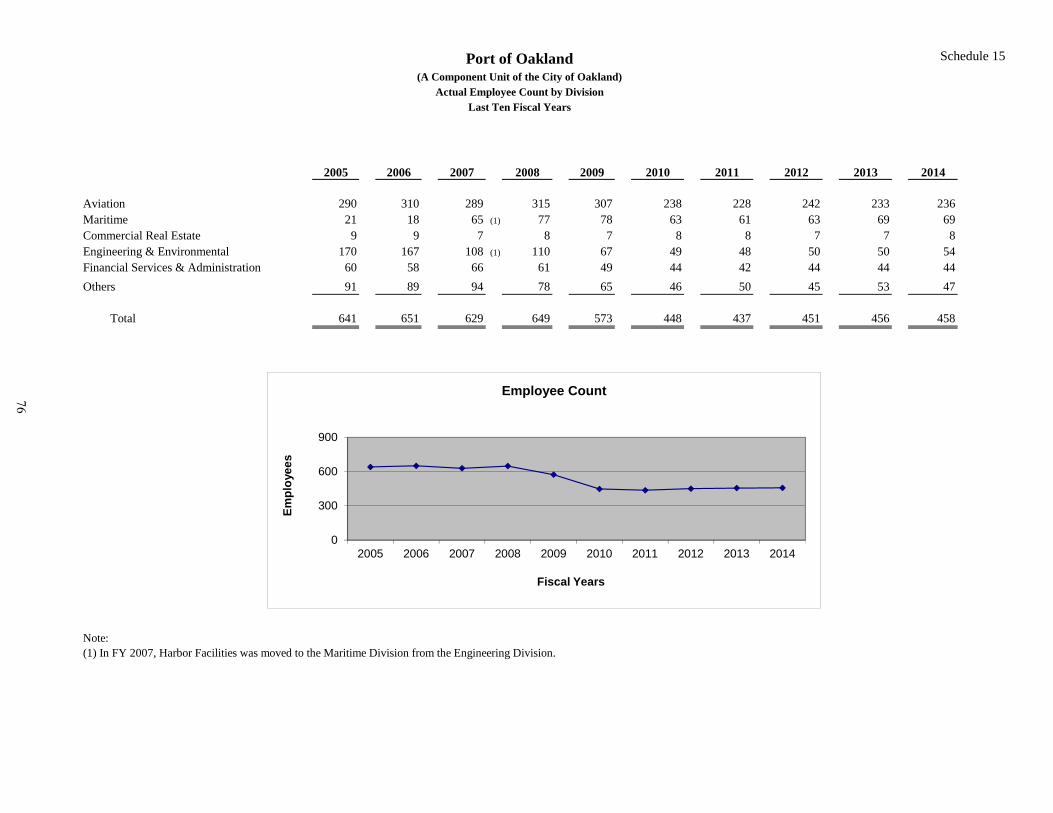
Schedule 15
2005 2006 2007 2008 2009 2010 2011 2012 2013 2014
Aviation 290 310 289 315 307 238 228 242 233 236Maritime 21 18 65 (1) 77 78 63 61 63 69 69Commercial Real Estate 9 9 7 8 7 8 8 7 7 8Engineering & Environmental 170 167 108 (1) 110 67 49 48 50 50 54Financial Services & Administration 60 58 66 61 49 44 42 44 44 44Others 91 89 94 78 65 46 50 45 53 47
Total 641 651 629 649 573 448 437 451 456 458
Note:(1) In FY 2007, Harbor Facilities was moved to the Maritime Division from the Engineering Division.
Port of Oakland(A Component Unit of the City of Oakland)
Actual Employee Count by DivisionLast Ten Fiscal Years
0
300
600
900
2005 2006 2007 2008 2009 2010 2011 2012 2013 2014
Empl
oyee
s
Fiscal Years
Employee Count76
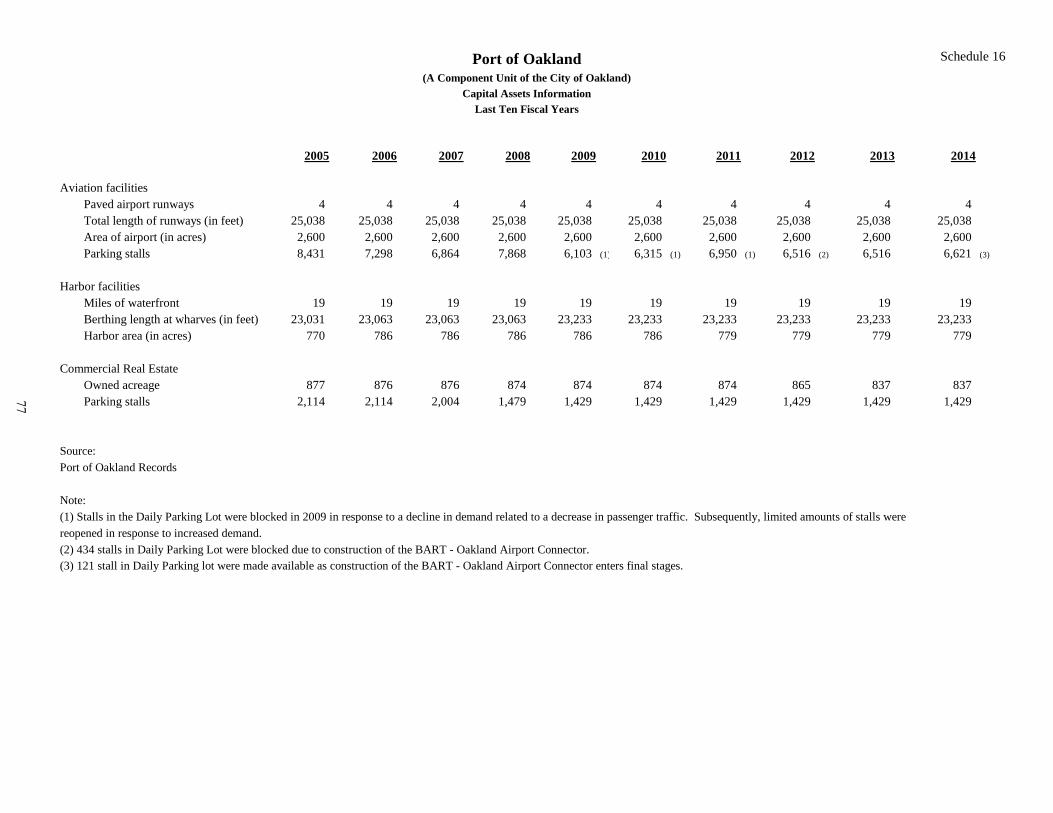
Schedule 16
2005 2006 2007 2008 2009 2010 2011 2012 2013 2014
Aviation facilitiesPaved airport runways 4 4 4 4 4 4 4 4 4 4 Total length of runways (in feet) 25,038 25,038 25,038 25,038 25,038 25,038 25,038 25,038 25,038 25,038 Area of airport (in acres) 2,600 2,600 2,600 2,600 2,600 2,600 2,600 2,600 2,600 2,600 Parking stalls 8,431 7,298 6,864 7,868 6,103 (1) 6,315 (1) 6,950 (1) 6,516 (2) 6,516 6,621 (3)
Harbor facilitiesMiles of waterfront 19 19 19 19 19 19 19 19 19 19 Berthing length at wharves (in feet) 23,031 23,063 23,063 23,063 23,233 23,233 23,233 23,233 23,233 23,233 Harbor area (in acres) 770 786 786 786 786 786 779 779 779 779
Commercial Real EstateOwned acreage 877 876 876 874 874 874 874 865 837 837 Parking stalls 2,114 2,114 2,004 1,479 1,429 1,429 1,429 1,429 1,429 1,429
Source: Port of Oakland Records
Note: (1) Stalls in the Daily Parking Lot were blocked in 2009 in response to a decline in demand related to a decrease in passenger traffic. Subsequently, limited amounts of stalls were reopened in response to increased demand.(2) 434 stalls in Daily Parking Lot were blocked due to construction of the BART - Oakland Airport Connector.(3) 121 stall in Daily Parking lot were made available as construction of the BART - Oakland Airport Connector enters final stages.
Port of Oakland(A Component Unit of the City of Oakland)
Capital Assets Information
Last Ten Fiscal Years
77

78
This page left intentionally blank.

PORT OF OAKLAND
Report to Board of Port Commissioners Year Ended June 30, 2014
PORT OF OAKLAND Report to Board of Port Commissioners
Year Ended June 30, 2014
Table of Contents Page Transmittal Letter .......................................................................................................................................... 1 Required Communications ............................................................................................................................ 2 Current Year Comments and Responses ...................................................................................................... 5 Status of Prior Year Comments .................................................................................................................... 5
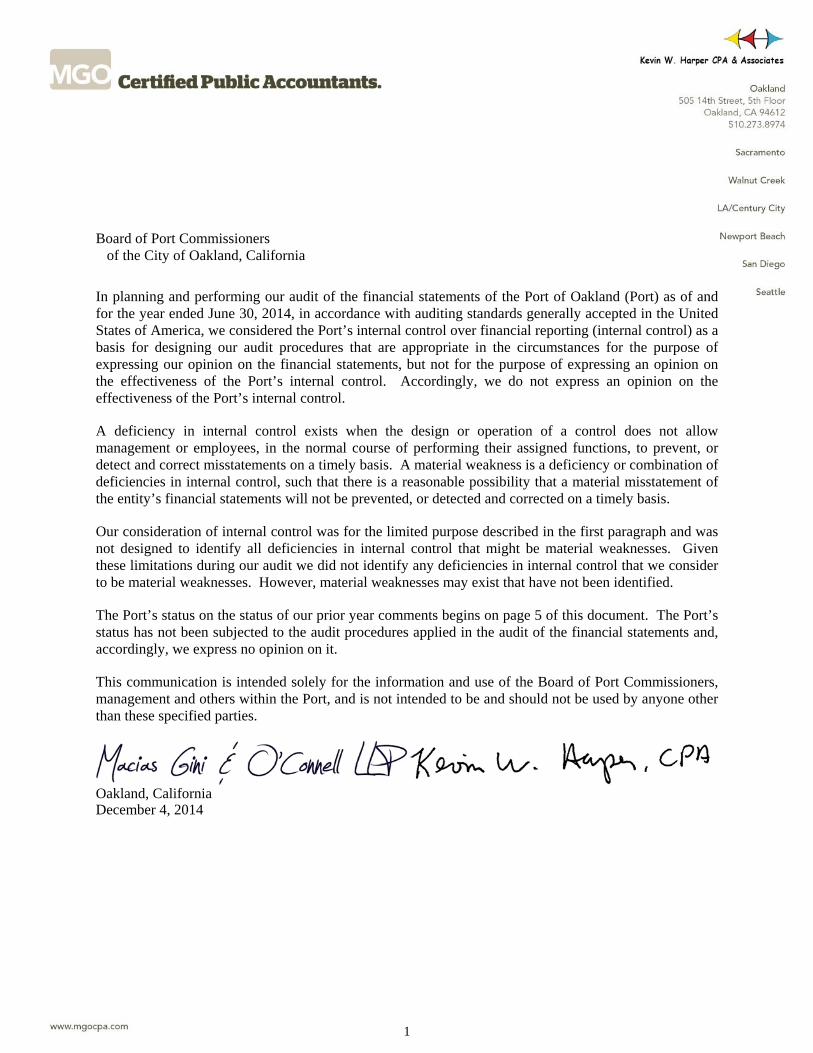
1
Board of Port Commissioners of the City of Oakland, California
In planning and performing our audit of the financial statements of the Port of Oakland (Port) as of and for the year ended June 30, 2014, in accordance with auditing standards generally accepted in the United States of America, we considered the Port’s internal control over financial reporting (internal control) as a basis for designing our audit procedures that are appropriate in the circumstances for the purpose of expressing our opinion on the financial statements, but not for the purpose of expressing an opinion on the effectiveness of the Port’s internal control. Accordingly, we do not express an opinion on the effectiveness of the Port’s internal control.
A deficiency in internal control exists when the design or operation of a control does not allow management or employees, in the normal course of performing their assigned functions, to prevent, or detect and correct misstatements on a timely basis. A material weakness is a deficiency or combination of deficiencies in internal control, such that there is a reasonable possibility that a material misstatement of the entity’s financial statements will not be prevented, or detected and corrected on a timely basis.
Our consideration of internal control was for the limited purpose described in the first paragraph and was not designed to identify all deficiencies in internal control that might be material weaknesses. Given these limitations during our audit we did not identify any deficiencies in internal control that we consider to be material weaknesses. However, material weaknesses may exist that have not been identified.
The Port’s status on the status of our prior year comments begins on page 5 of this document. The Port’s status has not been subjected to the audit procedures applied in the audit of the financial statements and, accordingly, we express no opinion on it.
This communication is intended solely for the information and use of the Board of Port Commissioners, management and others within the Port, and is not intended to be and should not be used by anyone other than these specified parties.
Oakland, California December 4, 2014
PORT OF OAKLAND Report to Board of Port Commissioners
Year Ended June 30, 2014
2
REQUIRED COMMUNICATIONS We have audited the financial statements of the Port of Oakland (Port), as of and for the year ended June 30, 2014. Professional auditing standards require that we provide you with information about our responsibilities under generally accepted auditing standards, Government Auditing Standards and U.S. Office of Management and Budget (OMB) Circular A-133, as well as certain information related to the planned scope and timing of our audit. We have communicated such information in our engagement letter dated May 5, 2014. Professional standards also require that we communicate to you the following information related to our audit.
Qualitative Aspects of Accounting Practices Management is responsible for the selection and use of appropriate accounting policies. The significant accounting policies used by the Port are described in Note 2 to the Port’s financial statements. No new accounting policies were adopted and the application of existing policies was not changed during the fiscal year ended June 30, 2014. We noted no transactions entered into by the Port during the year for which there is a lack of authoritative guidance or consensus. All significant transactions have been recognized in the financial statements in the proper period. Accounting estimates are an integral part of the financial statements prepared by management and are based on management’s knowledge and experience about past and current events and assumptions about future events. Certain accounting estimates are particularly sensitive because of their significance to the financial statements and because of the possibility that future events affecting them may differ significantly from those expected. The most sensitive estimates affecting the financial statements were:
Claims liabilities; Pollution remediation costs; Allowance for losses on customer accounts receivable; Workers’ compensation liability; Pension contributions and Postemployment benefits other than pensions (OPEB) liability; Depreciation for capital assets; Allocation of costs to construction projects.
Management’s estimates were based on the following:
Estimated claims liabilities and pollution remediation costs are based on independent consultant valuations as well as internal valuations;
Allowance for losses on customer accounts receivable is based on historical collection activity; Workers’ compensation liability is based on an actuarial valuation; Estimated pension contributions and OPEB liability are based on actuarial valuations; Depreciation estimates for capital assets are based on estimated useful lives of assets; and Allocation of costs to construction projects is based on a methodology in accordance with OMB
Circular A-87 cost principles.
PORT OF OAKLAND Report to Board of Port Commissioners
Year Ended June 30, 2014
3
REQUIRED COMMUNICATIONS (Continued) Qualitative Aspects of Accounting Practices (Continued) We evaluated the key factors and assumptions used to develop these accounting estimates in determining that they are reasonable in relation to the Port’s financial statements. Certain financial statement disclosures are particularly sensitive because of their significance to financial statement users. The most sensitive disclosures affecting the financial statements have been noted above. The financial statement disclosures are neutral, consistent and clear. Difficulties Encountered in Performing the Audit We encountered no significant difficulties in dealing with management in performing and completing our audit. Corrected and Uncorrected Misstatements Professional standards require us to accumulate all known and likely misstatements identified during the audit, other than those that are trivial, and communicate them to the appropriate level of management. Management has corrected all such misstatements. In addition, none of the misstatements detected as a result of audit procedures and corrected by management were material, either individually or in the aggregate to the financial statements taken as a whole. Disagreements with Management For purposes of this letter, a disagreement with management is a financial accounting, reporting, or auditing matter, whether or not resolved to our satisfaction, that could be significant to the financial statements or the auditors’ report. We are pleased to report that no such disagreements arose during the course of our audit. Management Representations We have requested certain representations from management that are included in the management representation letter dated December 4, 2014. Management Consultations with Other Independent Accountants In some cases, management may decide to consult with other accountants about auditing and accounting matters, similar to obtaining a “second opinion” on certain situations. If a consultation involves application of an accounting principle to the Port’s financial statements or a determination of the type of auditor’s opinion that may be expressed on those financial statements, our professional standards require the consulting accountant to check with us to determine that the consultant has all relevant facts. To our knowledge, there were no such consultations with other accountants.
PORT OF OAKLAND Report to Board of Port Commissioners
Year Ended June 30, 2014
4
REQUIRED COMMUNICATIONS (Continued) Other Audit Findings or Issues We generally discuss a variety of matters, including the application of accounting principles and auditing standards, with management each year prior to retention as the Port’s auditors. However, these discussions occurred in the normal course of our professional relationship and our responses were not a condition to our retention.
Other Information in Documents Containing Audited Financial Statements Our responsibility for other information in documents containing the financial statements and our report does not extend beyond the financial information identified in our audit report. We do not have an obligation to perform any procedures to corroborate other information contained in these documents. The Port includes its financial statements and our report in its Comprehensive Annual Financial Report (CAFR). However, we have read the other information in the Port’s CAFR and considered whether such information, or its manner of presentation, were consistent with information appearing in the financial statements. Nothing came to our attention that caused us to believe that such information, or manner of its presentation, is materially inconsistent with the information, or manner of its presentation, appearing in the financial statements.
PORT OF OAKLAND Report to Board of Port Commissioners
Year Ended June 30, 2014
5
CURRENT YEAR COMMENTS AND RESPONSES None reported. STATUS OF PRIOR YEAR COMMENTS 2012-#4. Financial Policies (General Comment) – In progress The Port should review the listing of GFOA best practice policies against an inventory of its current policies to determine if there are additional policies that should be put in place or updated. Status per Port Management During fiscal year ended June 30, 2013, Port management conducted a review of the Port’s financial policies to determine if and where updates were needed, and to identify if new policies were necessary to fill in gaps. It was determined that several of the policies required only minor updating, while certain policies required more significant rewrites, and one new policy, focusing on Accounts Payable, was needed. During fiscal year ended June 30, 2014, the Port completed and published a new Accounts Payable policy that establishes roles and responsibilities for Port employees involved in the request, processing and approval of the disbursement of Port funds. The new Accounts Payable policy is supported by five standard operating procedure documents that detail the processing of: Purchase Order Invoices, Manual Payment Requests, PCard Statements, Payment Processing, and Outstanding Check Maintenance. In the next three months the Port will be focused on significantly updating the current capitalization policy and documenting the standard operating procedures for the processes the Port uses to identify, record, track, and retire capitalized costs. Following the completion of the Capitalization policy, the Port will focus on updating the Grants Management policy and document standard operating procedures for the Port to track reimbursable costs, the preparation and approval of grant reimbursement requests, and monitoring other compliance requirements. While updating these policies the Port will also be looking for ways to improve efficiency, strengthen internal control, and utilize Oracle to its fullest extent. 2012-#5. Grants Management (General Comment) – In progress 1. The Finance Division should prepare a grants summary report at least quarterly. Finance
management should use this report to assure that all grants are being administered properly, including expenses agree with amounts recorded in the general ledger, amounts expended are claimed for reimbursement in a timely manner, billed amounts are collected in a timely manner, expenditures are on track for being spent within the grant period, and receivables recorded in the general ledger agree with grant administrator records.
2. The Finance Department should develop a written policy for managing grants that describes the major
steps from grant application to close out. The Port should update its grant procedures to contemplate the new grants policy as well as changes resulting from implementation of Oracle.
PORT OF OAKLAND Report to Board of Port Commissioners
Year Ended June 30, 2014
6
Status per Port Management During the last six months Port management reorganized the grant management team so that it is overseen by the Port Controller with duties performed by accountants who have knowledge and experience in grants management. Port management feels this strategic change more closely aligns the skills sets needed to design and implement procedures that thoroughly document and reconcile grant reimbursement requests as well as track the status and compliance of grants appropriately. Port staff has already created a tracking worksheet to track the status and funding of grants and will continue to improve upon this worksheet and develop additional procedures as part of the policy and procedure update described in finding 2012-#4 Financial Policies.
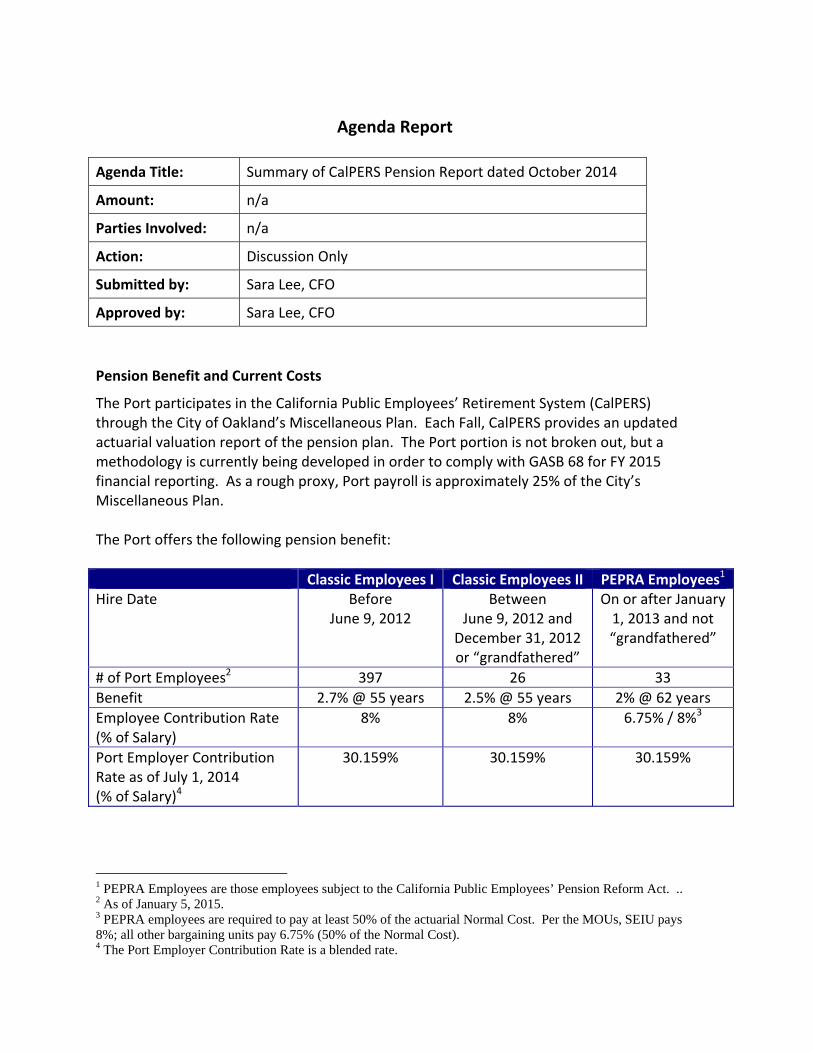
Agenda Report
Agenda Title: Summary of CalPERS Pension Report dated October 2014
Amount: n/a
Parties Involved: n/a
Action: Discussion Only
Submitted by: Sara Lee, CFO
Approved by: Sara Lee, CFO
Pension Benefit and Current Costs
The Port participates in the California Public Employees’ Retirement System (CalPERS) through the City of Oakland’s Miscellaneous Plan. Each Fall, CalPERS provides an updated actuarial valuation report of the pension plan. The Port portion is not broken out, but a methodology is currently being developed in order to comply with GASB 68 for FY 2015 financial reporting. As a rough proxy, Port payroll is approximately 25% of the City’s Miscellaneous Plan. The Port offers the following pension benefit:
Classic Employees I Classic Employees II PEPRA Employees1
Hire Date Before June 9, 2012
Between June 9, 2012 and
December 31, 2012 or “grandfathered”
On or after January 1, 2013 and not “grandfathered”
# of Port Employees2 397 26 33
Benefit 2.7% @ 55 years 2.5% @ 55 years 2% @ 62 years
Employee Contribution Rate (% of Salary)
8% 8% 6.75% / 8%3
Port Employer Contribution Rate as of July 1, 2014 (% of Salary)4
30.159% 30.159% 30.159%
1 PEPRA Employees are those employees subject to the California Public Employees’ Pension Reform Act. .. 2 As of January 5, 2015. 3 PEPRA employees are required to pay at least 50% of the actuarial Normal Cost. Per the MOUs, SEIU pays 8%; all other bargaining units pay 6.75% (50% of the Normal Cost). 4 The Port Employer Contribution Rate is a blended rate.
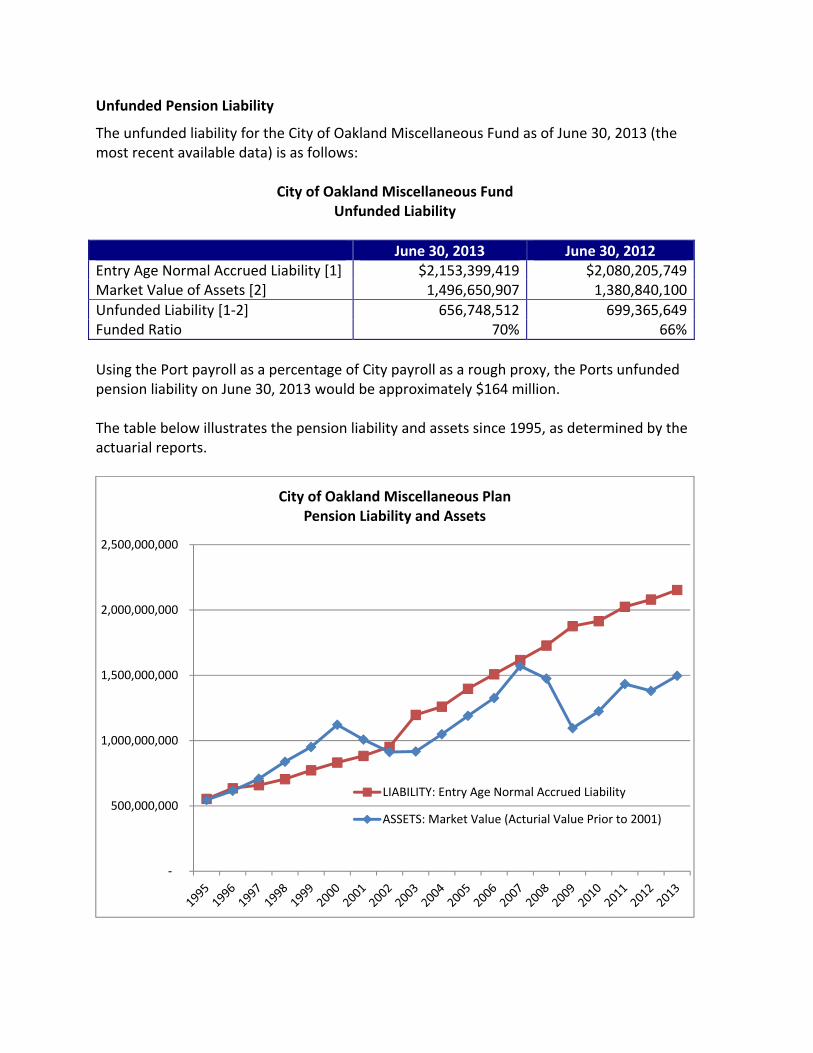
Unfunded Pension Liability
The unfunded liability for the City of Oakland Miscellaneous Fund as of June 30, 2013 (the most recent available data) is as follows:
City of Oakland Miscellaneous Fund Unfunded Liability
June 30, 2013 June 30, 2012 Entry Age Normal Accrued Liability [1] $2,153,399,419 $2,080,205,749Market Value of Assets [2] 1,496,650,907 1,380,840,100
Unfunded Liability [1‐2] 656,748,512 699,365,649Funded Ratio 70% 66%
Using the Port payroll as a percentage of City payroll as a rough proxy, the Ports unfunded pension liability on June 30, 2013 would be approximately $164 million. The table below illustrates the pension liability and assets since 1995, as determined by the actuarial reports.
‐
500,000,000
1,000,000,000
1,500,000,000
2,000,000,000
2,500,000,000
City of Oakland Miscellaneous PlanPension Liability and Assets
LIABILITY: Entry Age Normal Accrued Liability
ASSETS: Market Value (Acturial Value Prior to 2001)
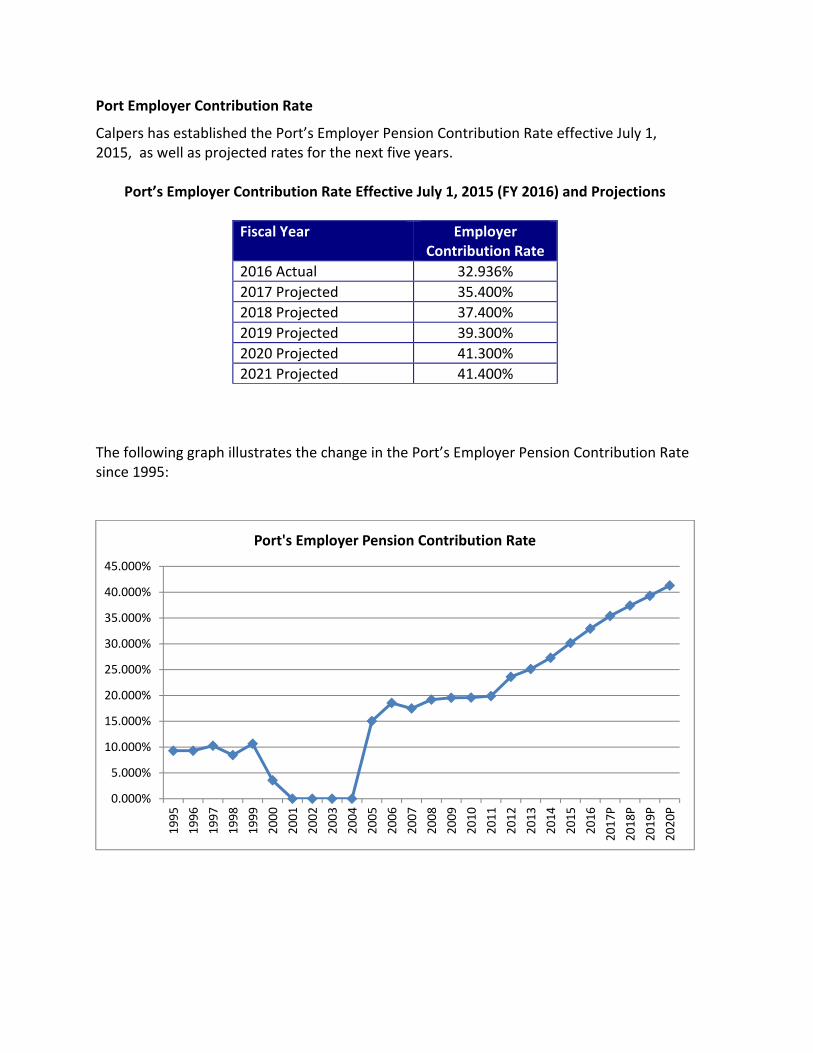
Port Employer Contribution Rate
Calpers has established the Port’s Employer Pension Contribution Rate effective July 1, 2015, as well as projected rates for the next five years.
Port’s Employer Contribution Rate Effective July 1, 2015 (FY 2016) and Projections
Fiscal Year Employer Contribution Rate
2016 Actual 32.936%
2017 Projected 35.400%
2018 Projected 37.400%
2019 Projected 39.300%
2020 Projected 41.300%
2021 Projected 41.400%
The following graph illustrates the change in the Port’s Employer Pension Contribution Rate since 1995:
0.000%
5.000%
10.000%
15.000%
20.000%
25.000%
30.000%
35.000%
40.000%
45.000%
1995
1996
1997
1998
1999
2000
2001
2002
2003
2004
2005
2006
2007
2008
2009
2010
2011
2012
2013
2014
2015
2016
2017P
2018P
2019P
2020P
Port's Employer Pension Contribution Rate
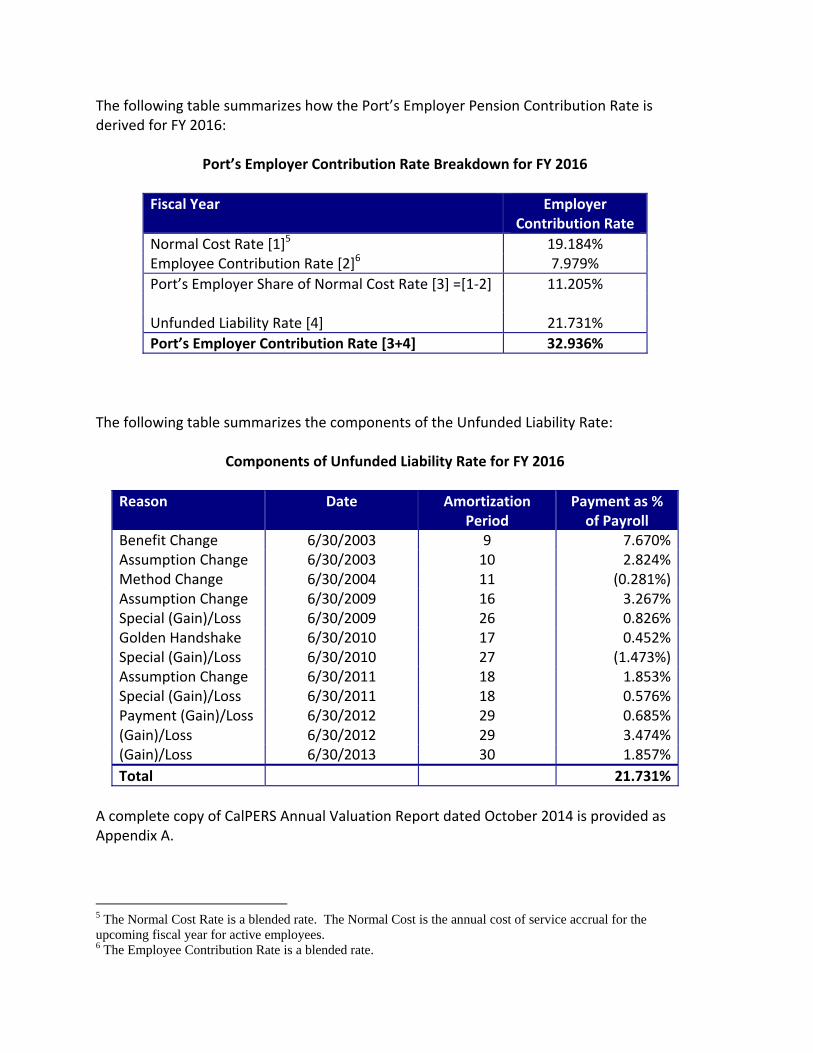
The following table summarizes how the Port’s Employer Pension Contribution Rate is derived for FY 2016:
Port’s Employer Contribution Rate Breakdown for FY 2016
Fiscal Year Employer Contribution Rate
Normal Cost Rate [1]5 19.184% Employee Contribution Rate [2]6 7.979%
Port’s Employer Share of Normal Cost Rate [3] =[1‐2] 11.205% Unfunded Liability Rate [4] 21.731%
Port’s Employer Contribution Rate [3+4] 32.936%
The following table summarizes the components of the Unfunded Liability Rate:
Components of Unfunded Liability Rate for FY 2016
Reason Date Amortization Period
Payment as % of Payroll
Benefit Change 6/30/2003 9 7.670%Assumption Change 6/30/2003 10 2.824%Method Change 6/30/2004 11 (0.281%)Assumption Change 6/30/2009 16 3.267%Special (Gain)/Loss 6/30/2009 26 0.826%Golden Handshake 6/30/2010 17 0.452%Special (Gain)/Loss 6/30/2010 27 (1.473%)Assumption Change 6/30/2011 18 1.853%Special (Gain)/Loss 6/30/2011 18 0.576%Payment (Gain)/Loss 6/30/2012 29 0.685%(Gain)/Loss 6/30/2012 29 3.474%(Gain)/Loss 6/30/2013 30 1.857%
Total 21.731%
A complete copy of CalPERS Annual Valuation Report dated October 2014 is provided as Appendix A.
5 The Normal Cost Rate is a blended rate. The Normal Cost is the annual cost of service accrual for the upcoming fiscal year for active employees. 6 The Employee Contribution Rate is a blended rate.
California Public Employees’ Retirement System Actuarial Office
P.O. Box 942701 Sacramento, CA 94229-2701 TTY: (916) 795-3240 (888) 225-7377 phone • (916) 795-2744 fax www.calpers.ca.gov
October 2014
MISCELLANEOUS PLAN OF THE CITY OF OAKLAND (CalPERS ID: 4015143822) Annual Valuation Report as of June 30, 2013
Dear Employer,
As an attachment to this letter, you will find a copy of the June 30, 2013 actuarial valuation report of your pension plan. Your 2013 actuarial valuation report contains important actuarial information about your pension plan at CalPERS. Your CalPERS staff actuary, whose signature appears in the Actuarial Certification Section on page 1, is available to discuss the report with you after October 31, 2014.
Future Contribution Rates
The exhibit below displays the Minimum Employer Contribution Rate for fiscal year 2015-16 and a projected contribution rate for 2016-17, before any cost sharing. The projected rate for 2016-17 is based on the most recent information available, including an estimate of the investment return for fiscal year 2013-14, namely 18 percent, and the impact of the actuarial assumptions adopted by the CalPERS Board in February 2014 that will impact employer rates for the first time in fiscal year 2016-17. For a projection of employer rates beyond 2016-17, please refer to the “Projected Rates” in the “Risk Analysis” section, which includes rate projections through 2020-21 under a variety of investment return scenarios. Please disregard any projections that we may have provided you in the past.
Fiscal Year Employer Contribution Rate
2015-16 32.936% 2016-17 35.4% (projected)
Member contributions other than cost sharing (whether paid by the employer or the employee) are in addition to the above rates. The employer contribution rates in this report do not reflect any cost sharing arrangement you may have with your employees.
The estimate for 2016-17 also assumes that there are no future contract amendments and no liability gains or losses (such as larger than expected pay increases, more retirements than expected, etc.). This is a very important assumption because these gains and losses do occur and can have a significant impact on your contribution rate. Even for the largest plans, such gains and losses often cause a change in the employer’s contribution rate of one or two percent of payroll and may be even larger in some less common instances. These gains and losses cannot be predicted in advance so the projected employer contribution rates are just estimates. Your actual rate for 2016-17 will be provided in next year’s report.
Appendix A
MISCELLANEOUS PLAN OF THE CITY OF OAKLAND (CalPERS ID: 4015143822) Annual Valuation Report as of June 30, 2013
Page 2
Changes since the Prior Year’s Valuation
On January 1, 2013, the Public Employees’ Pension Reform Act of 2013 (PEPRA) took effect. The impact of the PEPRA changes are included in the rates and the benefit provision listings of the June 30, 2013 valuation for the 2015-16 rates. For more information on PEPRA, please refer to the CalPERS website.
On April 17, 2013, the CalPERS Board of Administration approved a recommendation to change the CalPERS amortization and rate smoothing policies. Beginning with the June 30, 2013 valuations that set the 2015-16 rates, CalPERS will no longer use an actuarial value of assets and will employ an amortization and smoothing policy that will pay for all gains and losses over a fixed 30-year period with the increases or decreases in the rate spread directly over a 5-year period.
In 2014 CalPERS completed a 2-year asset liability management study incorporating actuarial assumptions and strategic asset allocation. On February 19, 2014 the CalPERS Board of Administration adopted relatively modest changes to the current asset allocation that will reduce the expected volatility of returns. The adopted asset allocation is expected to have a long- term blended return that continues to support a discount rate assumption of 7.5 percent. The Board also approved several changes to the demographic assumptions that more closely align with actual experience. The most significant of these is mortality improvement to acknowledge the greater life expectancies we are seeing in our membership and expected continued improvements. The new actuarial assumptions will be used to set the FY 2016-17 contribution rates for public agency employers. The increase in liability due to new actuarial assumptions will be calculated in the 2014 actuarial valuation and will be amortized over a 20-year period with a 5-year ramp-up/ramp-down in accordance with Board policy.
Besides the above noted changes, there may also be changes specific to your plan such as contract amendments and funding changes.
Further descriptions of general changes are included in the “Highlights and Executive Summary” section and in Appendix A, “Actuarial Methods and Assumptions.” The effect of the changes on your rate is included in the “Reconciliation of Required Employer Contributions.”
We understand that you might have a number of questions about these results. While we are very interested in discussing these results with your agency, in the interest of allowing us to give every public agency their results, we ask that you wait until after October 31 to contact us with actuarial questions. If you have other questions, you may call the Customer Contact Center at (888)-CalPERS or (888-225-7377).
Sincerely,
ALAN MILLIGAN Chief Actuary
ACTUARIAL VALUATION as of June 30, 2013
for the MISCELLANEOUS PLAN
of the CITY OF OAKLAND
(CalPERS ID: 4015143822)
REQUIRED CONTRIBUTIONS
FOR FISCAL YEAR July 1, 2015 – June 30, 2016

THIS PAGE
INTENTIONALLY
LEFT BLANK
TABLE OF CONTENTS
ACTUARIAL CERTIFICATION 1
HIGHLIGHTS AND EXECUTIVE SUMMARY
Introduction 5
Purpose of the Report 5 Required Employer Contribution 6 Plan’s Funded Status 6 Cost 7 Changes Since the Prior Year’s Valuation 8 Subsequent Events 8
ASSETS
Reconciliation of the Market Value of Assets 11 Asset Allocation 12
CalPERS History of Investment Returns 13
LIABILITIES AND RATES
Development of Accrued and Unfunded Liabilities 17 (Gain) / Loss Analysis 06/30/12 - 06/30/13 18 Schedule of Amortization Bases 19 Alternate Amortization Schedules 20 Reconciliation of Required Employer Contributions 21 Employer Contribution Rate History 22 Funding History 22
RISK ANALYSIS
Volatility Ratios 25 Projected Rates 26 Analysis of Future Investment Return Scenarios 26 Analysis of Discount Rate Sensitivity 27 Hypothetical Termination Liability 28
GASB STATEMENT NO. 27
Information for Compliance with GASB Statement No. 27 31
PLAN’S MAJOR BENEFIT PROVISIONS
Plan’s Major Benefit Options 35
APPENDIX A – ACTUARIAL METHODS AND ASSUMPTIONS
Actuarial Data A1 Actuarial Methods A1 – A2
Actuarial Assumptions A3 – A20 Miscellaneous A20 – A21
APPENDIX B – PRINCIPAL PLAN PROVISIONS B1 – B9 APPENDIX C – PARTICIPANT DATA
Summary of Valuation Data C1 Active Members C2 Transferred and Terminated Members C3 Retired Members and Beneficiaries C4 – C5
APPENDIX D – DEVELOPMENT OF PEPRA MEMBER CONTRIBUTION RATE D1 APPENDIX E – GLOSSARY OF ACTUARIAL TERMS E1 – E3
(CY) FIN PROCESS CONTROL ID: 431678 (PY) FIN PROCESS CONTROL ID: 420248 REPORT ID: 81034

THIS PAGE
INTENTIONALLY
LEFT BLANK
CALPERS ACTUARIAL VALUATION - June 30, 2013 MISCELLANEOUS PLAN OF THE CITY OF OAKLAND CalPERS ID: 4015143822
Page 1
ACTUARIAL CERTIFICATION
To the best of our knowledge, this report is complete and accurate and contains sufficient information to disclose, fully and fairly, the funded condition of the MISCELLANEOUS PLAN OF THE CITY OF OAKLAND. This valuation is based on the member and financial data as of June 30, 2013 provided by the various CalPERS databases and the benefits under this plan with CalPERS as of the date this report was produced. It is our opinion that the valuation has been performed in accordance with generally accepted actuarial principles, in accordance with standards of practice prescribed by the Actuarial Standards Board, and that the assumptions and methods are internally consistent and reasonable for this plan, as prescribed by the CalPERS Board of Administration according to provisions set forth in the California Public Employees’ Retirement Law. The undersigned is an actuary for CalPERS, who is a member of the American Academy of Actuaries and the Society of Actuaries and meets the Qualification Standards of the American Academy of Actuaries to render the actuarial opinion contained herein.
FRITZIE ARCHULETA, ASA, MAAA Senior Pension Actuary, CalPERS

THIS PAGE
INTENTIONALLY
LEFT BLANK
HIGHLIGHTS AND EXECUTIVE SUMMARY
INTRODUCTION
PURPOSE OF THE REPORT
REQUIRED EMPLOYER CONTRIBUTION
PLAN’S FUNDED STATUS
COST
CHANGES SINCE THE PRIOR YEAR’S VALUATION
SUBSEQUENT EVENTS

THIS PAGE
INTENTIONALLY
LEFT BLANK
CALPERS ACTUARIAL VALUATION - June 30, 2013 MISCELLANEOUS PLAN OF THE CITY OF OAKLAND CalPERS ID: 4015143822
Page 5
Introduction
This report presents the results of the June 30, 2013 actuarial valuation of the MISCELLANEOUS PLAN OF THE CITY OF OAKLAND of the California Public Employees’ Retirement System (CalPERS). This actuarial valuation sets the fiscal year 2015-16 required employer contribution rates. On January 1, 2013, the Public Employees’ Pension Reform Act of 2013 (PEPRA) took effect. The impact of most of the PEPRA changes are included in the rates and the benefit provision listings of the June 30, 2013 valuation, which sets the 2015-16 contribution rates. For more information on PEPRA, please refer to the CalPERS website. On April 17, 2013, the CalPERS Board of Administration approved a recommendation to change the CalPERS amortization and smoothing policies. Prior to this change, CalPERS employed an amortization and smoothing policy, which spread investment returns over a 15-year period while experience gains and losses were amortized over a rolling 30-year period. Effective with the June 30, 2013 valuations, CalPERS will no longer
use an actuarial value of assets and will employ an amortization and smoothing policy that will spread rate increases or decreases over a 5-year period, and will amortize all experience gains and losses over a fixed 30-year period. The new amortization and smoothing policy is used in this valuation. In 2014 CalPERS completed a 2-year asset liability management study incorporating actuarial assumptions and strategic asset allocation. On February 19, 2014 the CalPERS Board of Administration adopted relatively modest changes to the current asset allocation that will reduce the expected volatility of returns. The adopted asset allocation is expected to have a long-term blended return that continues to support a discount rate assumption of 7.5 percent. The Board also approved several changes to the demographic assumptions that more closely align with actual experience. The most significant of these is mortality improvement to acknowledge the greater life expectancies we are seeing in our membership and expected continued improvements. The new actuarial assumptions will be used to set the FY 2016-17 contribution rates for public agency employers. The increase in liability due to new actuarial assumptions will be calculated in the 2014 actuarial valuation and will be amortized over a 20-year period with a 5-year ramp-up/ramp-down in accordance with Board policy.
Purpose of the Report
The actuarial valuation was prepared by the CalPERS Actuarial Office using data as of June 30, 2013. The purpose of the report is to: Set forth the assets and accrued liabilities of this plan as of June 30, 2013; Determine the required employer contribution rate for the fiscal year July 1, 2015 through June 30,
2016; Provide actuarial information as of June 30, 2013 to the CalPERS Board of Administration and other
interested parties; and to Provide pension information as of June 30, 2013 to be used in financial reports subject to Governmental
Accounting Standards Board (GASB) Statement Number 27 for a Single Employer Defined Benefit Pension Plan.
California Actuarial Advisory Panel Recommendations This report includes all the basic disclosure elements as described in the Model Disclosure Elements for Actuarial Valuation Reports recommended in 2011 by the California Actuarial Advisory Panel (CAAP), with the exception of including the original base amounts of the various components of the unfunded liability in the Schedule of Amortization Bases shown on page 19. Additionally, this report includes the following “Enhanced Risk Disclosures” also recommended by the CAAP in the Model Disclosure Elements document:
A “Deterministic Stress Test,” projecting future results under different investment income scenarios
A “Sensitivity Analysis,” showing the impact on current valuation results using a 1 percent plus or minus change in the discount rate.
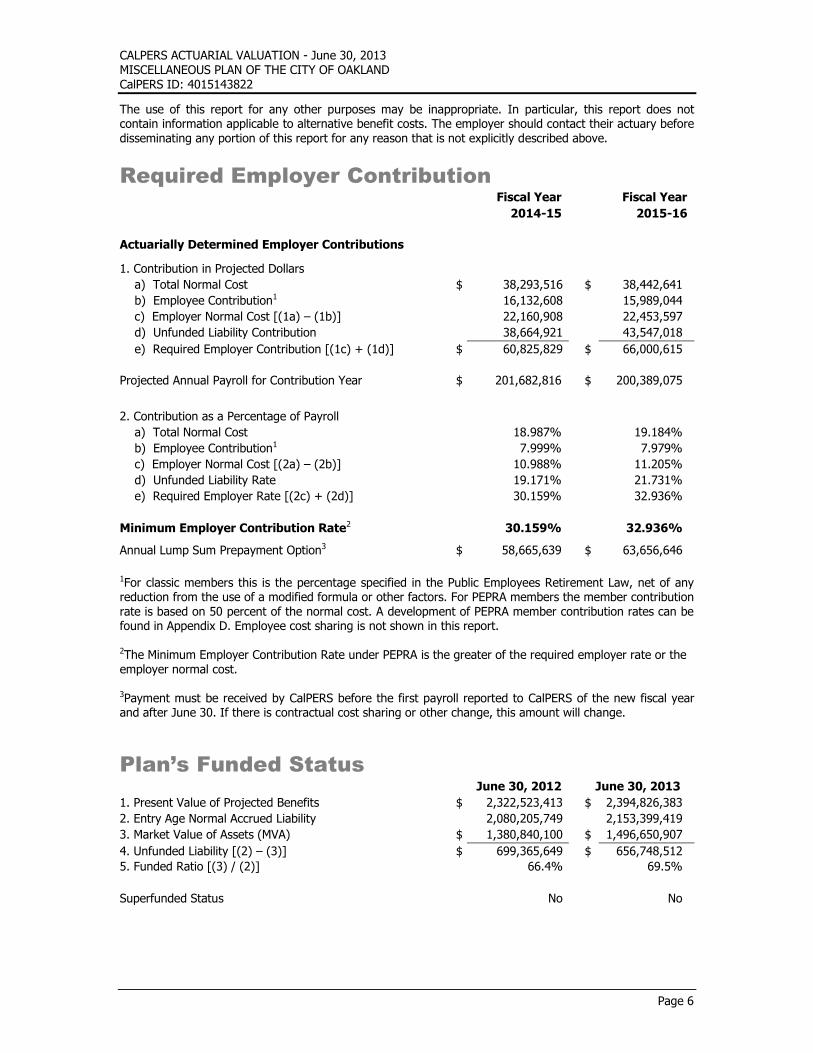
CALPERS ACTUARIAL VALUATION - June 30, 2013 MISCELLANEOUS PLAN OF THE CITY OF OAKLAND CalPERS ID: 4015143822
Page 6
The use of this report for any other purposes may be inappropriate. In particular, this report does not contain information applicable to alternative benefit costs. The employer should contact their actuary before disseminating any portion of this report for any reason that is not explicitly described above.
Required Employer Contribution
Fiscal Year Fiscal Year
2014-15 2015-16
Actuarially Determined Employer Contributions
1. Contribution in Projected Dollars
a) Total Normal Cost $ 38,293,516 $ 38,442,641
b) Employee Contribution1 16,132,608 15,989,044
c) Employer Normal Cost [(1a) – (1b)] 22,160,908 22,453,597
d) Unfunded Liability Contribution 38,664,921 43,547,018
e) Required Employer Contribution [(1c) + (1d)] $ 60,825,829 $ 66,000,615
Projected Annual Payroll for Contribution Year $ 201,682,816 $ 200,389,075
2. Contribution as a Percentage of Payroll
a) Total Normal Cost 18.987% 19.184%
b) Employee Contribution1 7.999% 7.979%
c) Employer Normal Cost [(2a) – (2b)] 10.988% 11.205%
d) Unfunded Liability Rate 19.171% 21.731%
e) Required Employer Rate [(2c) + (2d)] 30.159% 32.936%
Minimum Employer Contribution Rate2 30.159% 32.936%
Annual Lump Sum Prepayment Option3 $ 58,665,639 $ 63,656,646
1For classic members this is the percentage specified in the Public Employees Retirement Law, net of any reduction from the use of a modified formula or other factors. For PEPRA members the member contribution rate is based on 50 percent of the normal cost. A development of PEPRA member contribution rates can be found in Appendix D. Employee cost sharing is not shown in this report. 2The Minimum Employer Contribution Rate under PEPRA is the greater of the required employer rate or the employer normal cost. 3Payment must be received by CalPERS before the first payroll reported to CalPERS of the new fiscal year and after June 30. If there is contractual cost sharing or other change, this amount will change.
Plan’s Funded Status
June 30, 2012 June 30, 2013
1. Present Value of Projected Benefits $ 2,322,523,413 $ 2,394,826,383
2. Entry Age Normal Accrued Liability 2,080,205,749 2,153,399,419
3. Market Value of Assets (MVA) $ 1,380,840,100 $ 1,496,650,907
4. Unfunded Liability [(2) – (3)] $ 699,365,649 $ 656,748,512
5. Funded Ratio [(3) / (2)] 66.4% 69.5%
Superfunded Status No No
CALPERS ACTUARIAL VALUATION - June 30, 2013 MISCELLANEOUS PLAN OF THE CITY OF OAKLAND CalPERS ID: 4015143822
Page 7
Cost
Actuarial Cost Estimates in General What will this pension plan cost? Unfortunately, there is no simple answer. There are two major reasons for the complexity of the answer. First, actuarial calculations, including the ones in this report, are based on a number of assumptions about the future. These assumptions can be divided into two categories.
Demographic assumptions include the percentage of employees that will terminate, die, become disabled, and retire in each future year.
Economic assumptions include future salary increases for each active employee, and the assumption with the greatest impact, future asset returns at CalPERS for each year into the future until the last dollar is paid to current members of your plan.
While CalPERS has set these assumptions to reflect our best estimate of the real future of your plan, it must be understood that these assumptions are very long-term predictors and will surely not be realized in any
one year. For example, while the asset earnings at CalPERS have averaged more than the assumed return of 7.5 percent for the past twenty year period ending June 30, 2013, returns for each fiscal year ranged from negative -24 percent to +21.7 percent. Second, the very nature of actuarial funding produces the answer to the question of plan cost as the sum of two separate pieces.
The Normal Cost (i.e., the annual cost associated with one year of service accrual) expressed as a percentage of total active payroll.
The Past Service Cost or Accrued Liability (i.e., the current value of the benefit for all credited past service of current members) which is expressed as a lump sum dollar amount.
The cost is the sum of a percent of future pay and a lump sum dollar amount (the sum of an apple and an orange if you will). To communicate the total cost, either the Normal Cost (i.e., future percent of payroll) must be converted to a lump sum dollar amount (in which case the total cost is the present value of benefits), or the Past Service Cost (i.e., the lump sum) must be converted to a percent of payroll (in which case the total cost is expressed as the employer’s rate, part of which is permanent and part temporary). Converting the Past Service Cost lump sum to a percent of payroll requires a specific amortization period, and the employer rate will vary depending on the amortization period chosen.
CALPERS ACTUARIAL VALUATION - June 30, 2013 MISCELLANEOUS PLAN OF THE CITY OF OAKLAND CalPERS ID: 4015143822
Page 8
Changes since the Prior Year’s Valuation
Benefits The standard actuarial practice at CalPERS is to recognize mandated legislative benefit changes in the first annual valuation following the effective date of the legislation. Voluntary benefit changes by plan amendment are generally included in the first valuation that is prepared after the amendment becomes effective even if the valuation date is prior to the effective date of the amendment. This valuation generally reflects plan changes by amendments effective before the date of the report. Please refer to the “Plan’s Major Benefit Options” and Appendix B for a summary of the plan provisions used in this valuation. The effect of any mandated benefit changes or plan amendments on the unfunded liability is shown in the “(Gain)/Loss Analysis” and the effect on your employer contribution rate is shown in the “Reconciliation of Required Employer Contributions.” It should be noted that no change in liability or rate is shown for any plan changes, which were already included in the prior year’s valuation.
Actuarial Methods and Assumptions On April 17, 2013, the CalPERS Board of Administration approved a recommendation to change the CalPERS amortization and smoothing policies. Beginning with the June 30, 2013 valuations that set the 2015-16 rates, CalPERS will no longer use an actuarial value of assets and will employ an amortization and rate smoothing policy that will pay for all gains and losses over a fixed 30-year period with the increases or decreases in the rate phased in over a 5-year period. A change in the calculation of termination with vested benefits liability for active members was made this year to better reflect the retirement experience. After termination with vested benefits, a miscellaneous member is assumed to retire at age 59 and a safety member at age 54 rather than at earliest retirement age. The higher benefit factors at these ages results in a slightly higher liability and a modest increase in normal cost.
Public Employees’ Pension Reform Act of 2013 (PEPRA) On January 1, 2013, the Public Employees’ Pension Reform Act of 2013 (PEPRA) took effect, requiring that a public employer’s contribution to a defined benefit plan, in combination with employee contributions to that defined benefit plan, shall not be less than the normal cost rate. Beginning July 1, 2013, this means that some plans with surplus will be paying more than they otherwise would. For more information on PEPRA, please refer to the CalPERS website.
Subsequent Events
Actuarial Methods and Assumptions In 2014 CalPERS completed a 2-year asset liability management study incorporating actuarial assumptions and strategic asset allocation. On February 19, 2014 the CalPERS Board of Administration adopted relatively modest changes to the current asset allocation that will reduce the expected volatility of returns (see Risk Analysis section of report). The adopted asset allocation is expected to have a long- term blended return that continues to support a discount rate assumption of 7.5 percent. The Board also approved several changes to the demographic assumptions that more closely align with actual experience. The most significant of these is mortality improvement to acknowledge the greater life expectancies we are seeing in our membership and expected continued improvements. The new actuarial assumptions will be used to set the FY 2016-17 contribution rates for public agency employers. The increase in liability due to new actuarial assumptions will be calculated in the 2014 actuarial valuation and will be amortized over a 20-year period with a 5-year ramp-up/ramp-down in accordance with Board policy. The impact of assumption changes are included in the “Expected Rate Increases” subsection of the “Risk
Analysis” section.

ASSETS
RECONCILIATION OF THE MARKET VALUE OF ASSETS
ASSET ALLOCATION
CALPERS HISTORY OF INVESTMENT RETURNS

THIS PAGE
INTENTIONALLY
LEFT BLANK
CALPERS ACTUARIAL VALUATION - June 30, 2013 MISCELLANEOUS PLAN OF THE CITY OF OAKLAND CalPERS ID: 4015143822
Page 11
Reconciliation of the Market Value of Assets
1. Market Value of Assets as of 6/30/12 Including Receivables $ 1,380,840,100
2. Receivables for Service Buybacks as of 6/30/12 5,055,594
3. Market Value of Assets as of 6/30/12 1,375,784,506
4. Employer Contributions 39,950,245
5. Employee Contributions 18,782,688
6. Benefit Payments to Retirees and Beneficiaries (115,583,266)
7. Refunds (1,485,022)
8. Lump Sum Payments 0
9. Transfers and Miscellaneous Adjustments (23,681)
10. Investment Return 172,963,612
11. Market Value of Assets as of 6/30/13 $ 1,490,389,082
12. Receivables for Service Buybacks as of 6/30/13 6,261,825
13. Market Value of Assets as of 6/30/13 Including Receivables $ 1,496,650,907
CALPERS ACTUARIAL VALUATION - June 30, 2013 MISCELLANEOUS PLAN OF THE CITY OF OAKLAND CalPERS ID: 4015143822
Page 12
Asset Allocation
CalPERS adheres to an Asset Allocation Strategy which establishes asset class allocation policy targets and ranges, and manages those asset class allocations within their policy ranges. CalPERS recognizes that over 90 percent of the variation in investment returns of a well-diversified pool of assets can typically be attributed to asset allocation decisions. On February 19, 2014 the CalPERS Board of Administration adopted changes to the current asset allocation as shown in the Policy Target Allocation below expressed as percentage of total assets. The asset allocation is has an expected long term blended rate of return of 7.5 percent. The asset allocation and market value of assets shown below reflect the values of the Public Employees Retirement Fund (PERF) in its entirety as of June 30, 2013. The assets for CITY OF OAKLAND MISCELLANEOUS PLAN are part of the Public Employees Retirement Fund (PERF) and are invested accordingly.
(A) Asset Class
(B) Market Value
($ Billion)
(C) Policy Target
Allocation
1) Global Equity 133.4 47.0%
2) Private Equity 31.4 12.0%
3) Global Fixed Income 43.9 19.0%
4) Liquidity 10.5 2.0%
5) Real Assets 25.2 14.0%
6) Inflation Sensitive Assets 9.4 6.0%
7) Absolute Return Strategy (ARS) 7.2 0.0%
Total Fund $261.0 100.0%
Public Equity 51.1%
Private Equity 12.0%
Income 16.8%
Liquidity 4.0%
Real Assets 9.6%
Inflation 3.6%
ARS 2.8%
Asset Allocation at 6/30/2013
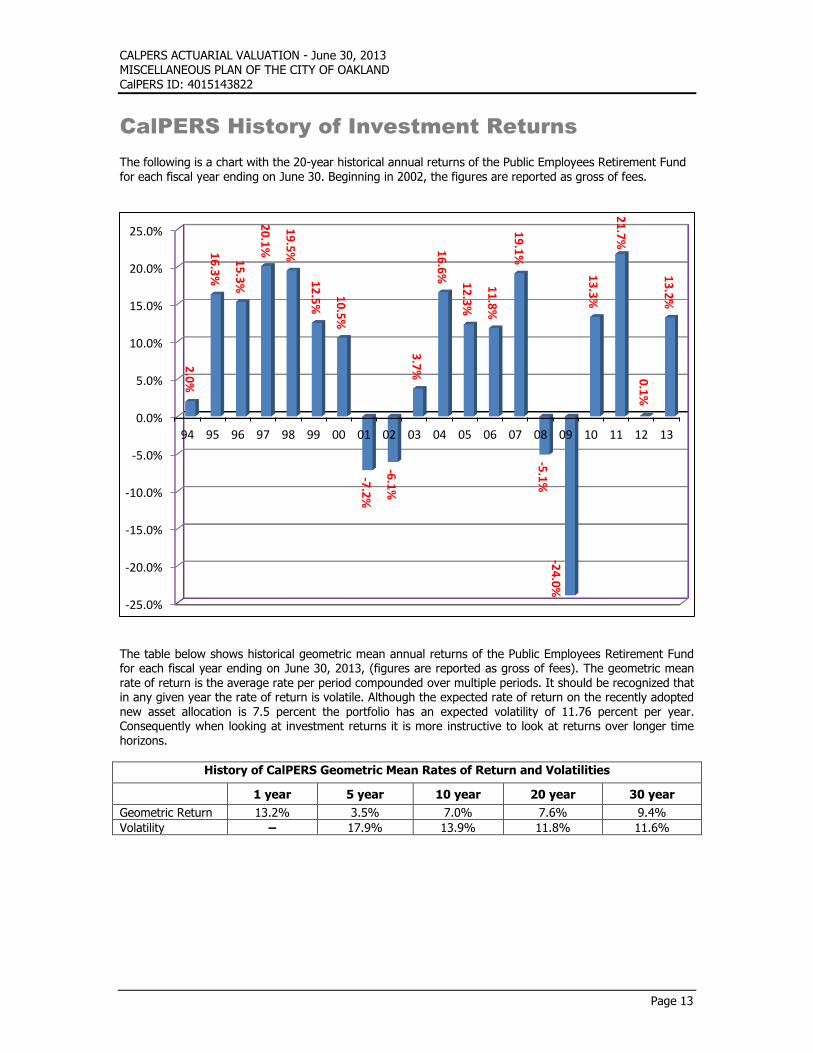
CALPERS ACTUARIAL VALUATION - June 30, 2013 MISCELLANEOUS PLAN OF THE CITY OF OAKLAND CalPERS ID: 4015143822
Page 13
CalPERS History of Investment Returns
The following is a chart with the 20-year historical annual returns of the Public Employees Retirement Fund for each fiscal year ending on June 30. Beginning in 2002, the figures are reported as gross of fees.
The table below shows historical geometric mean annual returns of the Public Employees Retirement Fund for each fiscal year ending on June 30, 2013, (figures are reported as gross of fees). The geometric mean rate of return is the average rate per period compounded over multiple periods. It should be recognized that in any given year the rate of return is volatile. Although the expected rate of return on the recently adopted new asset allocation is 7.5 percent the portfolio has an expected volatility of 11.76 percent per year. Consequently when looking at investment returns it is more instructive to look at returns over longer time horizons.
History of CalPERS Geometric Mean Rates of Return and Volatilities
1 year 5 year 10 year 20 year 30 year
Geometric Return 13.2% 3.5% 7.0% 7.6% 9.4%
Volatility – 17.9% 13.9% 11.8% 11.6%
-25.0%
-20.0%
-15.0%
-10.0%
-5.0%
0.0%
5.0%
10.0%
15.0%
20.0%
25.0%
94 95 96 97 98 99 00 01 02 03 04 05 06 07 08 09 10 11 12 13
2.0
%
16
.3%
15
.3%
20
.1%
19
.5%
12
.5%
10
.5%
-7.2
%
-6.1
%
3.7
%
16
.6%
12
.3%
11
.8%
19
.1%
-5.1
%
-24
.0%
13
.3%
21
.7%
0.1
%
13
.2%

THIS PAGE
INTENTIONALLY
LEFT BLANK
LIABILITIES AND RATES
DEVELOPMENT OF ACCRUED AND UNFUNDED LIABILITIES
(GAIN) / LOSS ANALYSIS 06/30/12 - 06/30/13
SCHEDULE OF AMORTIZATION BASES
ALTERNATE AMORTIZATION SCHEDULES
RECONCILIATION OF REQUIRED EMPLOYER CONTRIBUTIONS
EMPLOYER CONTRIBUTION RATE HISTORY
FUNDING HISTORY

THIS PAGE
INTENTIONALLY
LEFT BLANK
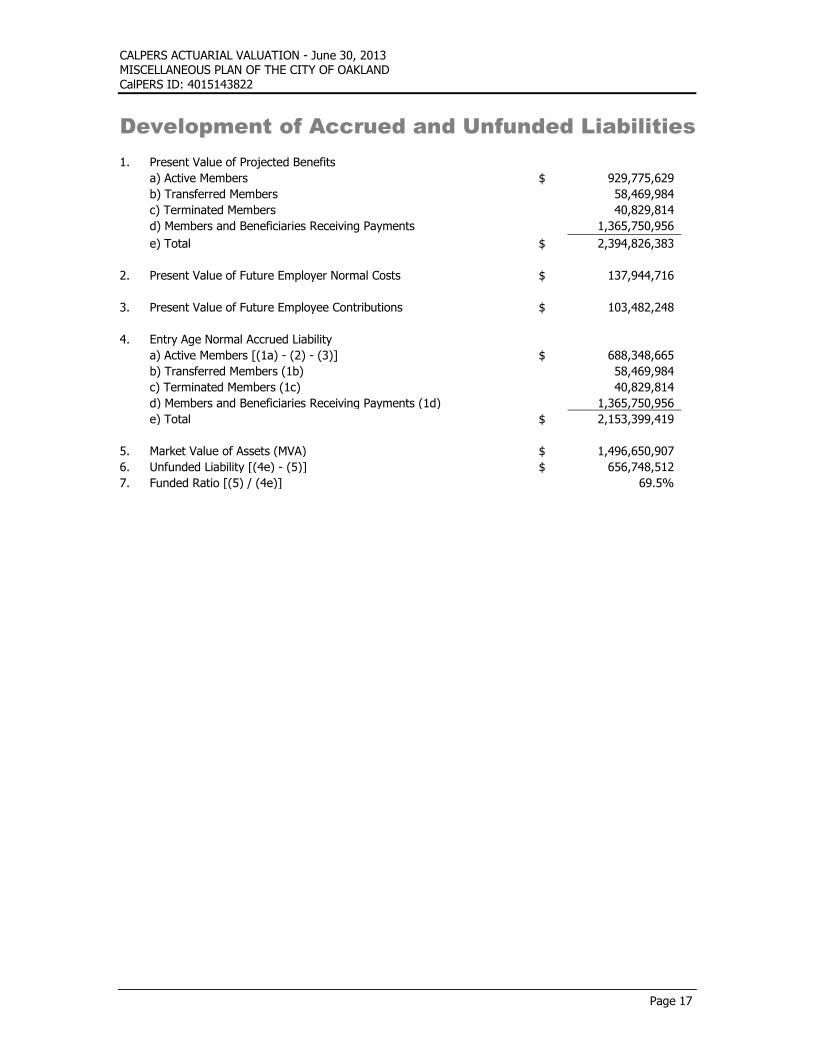
CALPERS ACTUARIAL VALUATION - June 30, 2013 MISCELLANEOUS PLAN OF THE CITY OF OAKLAND CalPERS ID: 4015143822
Page 17
Development of Accrued and Unfunded Liabilities
1. Present Value of Projected Benefits
a) Active Members $ 929,775,629
b) Transferred Members 58,469,984
c) Terminated Members 40,829,814
d) Members and Beneficiaries Receiving Payments 1,365,750,956
e) Total $ 2,394,826,383
2. Present Value of Future Employer Normal Costs $ 137,944,716
3. Present Value of Future Employee Contributions $ 103,482,248
4. Entry Age Normal Accrued Liability
a) Active Members [(1a) - (2) - (3)] $ 688,348,665
b) Transferred Members (1b) 58,469,984
c) Terminated Members (1c) 40,829,814
d) Members and Beneficiaries Receiving Payments (1d) 1,365,750,956
e) Total $ 2,153,399,419
5. Market Value of Assets (MVA) $ 1,496,650,907
6. Unfunded Liability [(4e) - (5)] $ 656,748,512
7. Funded Ratio [(5) / (4e)] 69.5%
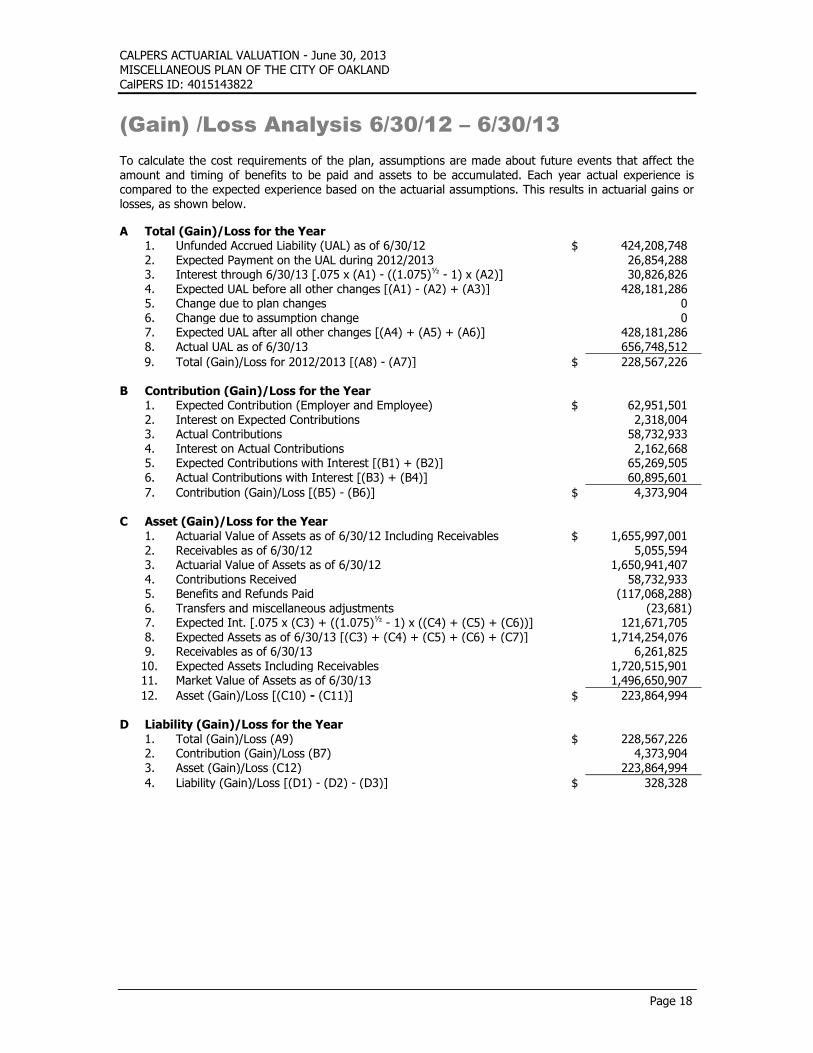
CALPERS ACTUARIAL VALUATION - June 30, 2013 MISCELLANEOUS PLAN OF THE CITY OF OAKLAND CalPERS ID: 4015143822
Page 18
(Gain) /Loss Analysis 6/30/12 – 6/30/13
To calculate the cost requirements of the plan, assumptions are made about future events that affect the amount and timing of benefits to be paid and assets to be accumulated. Each year actual experience is compared to the expected experience based on the actuarial assumptions. This results in actuarial gains or losses, as shown below.
A Total (Gain)/Loss for the Year 1. Unfunded Accrued Liability (UAL) as of 6/30/12 $ 424,208,748 2. Expected Payment on the UAL during 2012/2013 26,854,288 3. Interest through 6/30/13 [.075 x (A1) - ((1.075)½ - 1) x (A2)] 30,826,826 4. Expected UAL before all other changes [(A1) - (A2) + (A3)] 428,181,286 5. Change due to plan changes 0 6. Change due to assumption change 0 7. Expected UAL after all other changes [(A4) + (A5) + (A6)] 428,181,286 8. Actual UAL as of 6/30/13 656,748,512
9. Total (Gain)/Loss for 2012/2013 [(A8) - (A7)] $ 228,567,226 B Contribution (Gain)/Loss for the Year 1. Expected Contribution (Employer and Employee) $ 62,951,501 2. Interest on Expected Contributions 2,318,004 3. Actual Contributions 58,732,933 4. Interest on Actual Contributions 2,162,668 5. Expected Contributions with Interest [(B1) + (B2)] 65,269,505 6. Actual Contributions with Interest [(B3) + (B4)] 60,895,601
7. Contribution (Gain)/Loss [(B5) - (B6)] $ 4,373,904 C Asset (Gain)/Loss for the Year 1. Actuarial Value of Assets as of 6/30/12 Including Receivables $ 1,655,997,001 2. Receivables as of 6/30/12 5,055,594 3. Actuarial Value of Assets as of 6/30/12 1,650,941,407 4. Contributions Received 58,732,933 5. Benefits and Refunds Paid (117,068,288) 6. Transfers and miscellaneous adjustments (23,681) 7. Expected Int. [.075 x (C3) + ((1.075)½ - 1) x ((C4) + (C5) + (C6))] 121,671,705 8. Expected Assets as of 6/30/13 [(C3) + (C4) + (C5) + (C6) + (C7)] 1,714,254,076 9. Receivables as of 6/30/13 6,261,825 10. Expected Assets Including Receivables 1,720,515,901 11. Market Value of Assets as of 6/30/13 1,496,650,907
12. Asset (Gain)/Loss [(C10) - (C11)] $ 223,864,994 D Liability (Gain)/Loss for the Year 1. Total (Gain)/Loss (A9) $ 228,567,226 2. Contribution (Gain)/Loss (B7) 4,373,904 3. Asset (Gain)/Loss (C12) 223,864,994
4. Liability (Gain)/Loss [(D1) - (D2) - (D3)] $ 328,328
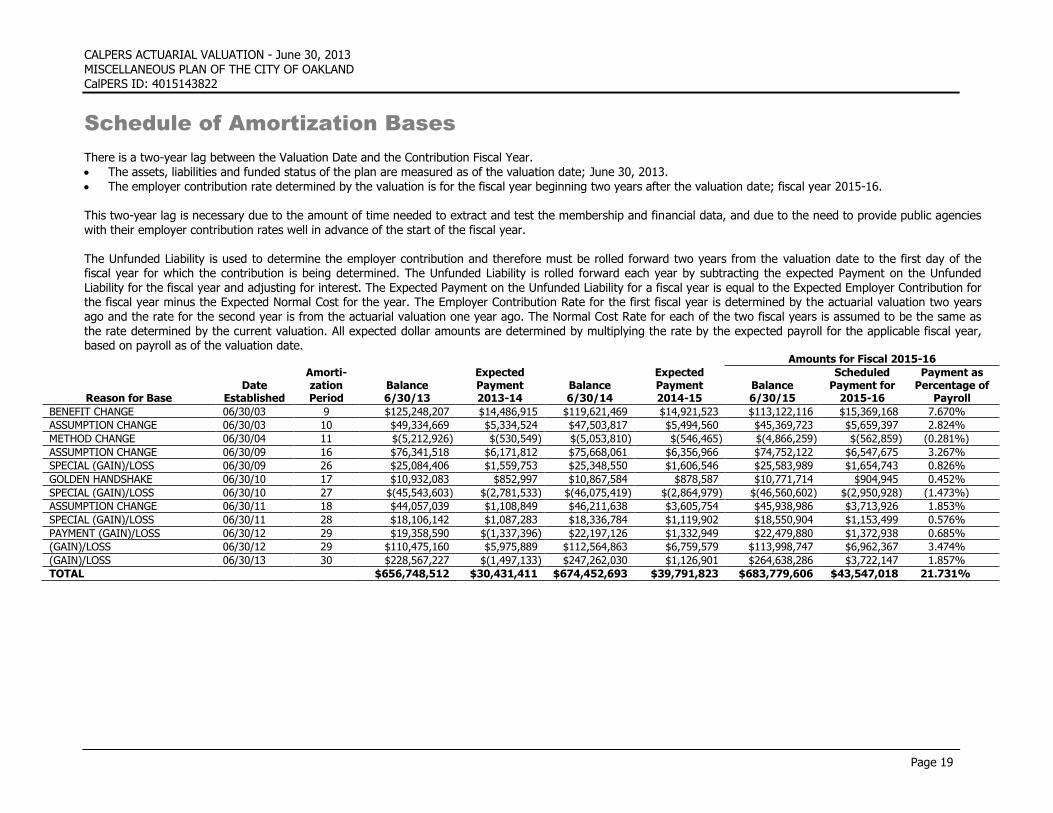
CALPERS ACTUARIAL VALUATION - June 30, 2013
MISCELLANEOUS PLAN OF THE CITY OF OAKLAND CalPERS ID: 4015143822
Page 19
Schedule of Amortization Bases
There is a two-year lag between the Valuation Date and the Contribution Fiscal Year. The assets, liabilities and funded status of the plan are measured as of the valuation date; June 30, 2013. The employer contribution rate determined by the valuation is for the fiscal year beginning two years after the valuation date; fiscal year 2015-16. This two-year lag is necessary due to the amount of time needed to extract and test the membership and financial data, and due to the need to provide public agencies
with their employer contribution rates well in advance of the start of the fiscal year. The Unfunded Liability is used to determine the employer contribution and therefore must be rolled forward two years from the valuation date to the first day of the fiscal year for which the contribution is being determined. The Unfunded Liability is rolled forward each year by subtracting the expected Payment on the Unfunded Liability for the fiscal year and adjusting for interest. The Expected Payment on the Unfunded Liability for a fiscal year is equal to the Expected Employer Contribution for the fiscal year minus the Expected Normal Cost for the year. The Employer Contribution Rate for the first fiscal year is determined by the actuarial valuation two years ago and the rate for the second year is from the actuarial valuation one year ago. The Normal Cost Rate for each of the two fiscal years is assumed to be the same as the rate determined by the current valuation. All expected dollar amounts are determined by multiplying the rate by the expected payroll for the applicable fiscal year, based on payroll as of the valuation date.
Amounts for Fiscal 2015-16
Reason for Base Date
Established
Amorti-zation Period
Balance 6/30/13
Expected Payment 2013-14
Balance 6/30/14
Expected Payment 2014-15
Balance 6/30/15
Scheduled Payment for
2015-16
Payment as Percentage of
Payroll
BENEFIT CHANGE 06/30/03 9 $125,248,207 $14,486,915 $119,621,469 $14,921,523 $113,122,116 $15,369,168 7.670%
ASSUMPTION CHANGE 06/30/03 10 $49,334,669 $5,334,524 $47,503,817 $5,494,560 $45,369,723 $5,659,397 2.824%
METHOD CHANGE 06/30/04 11 $(5,212,926) $(530,549) $(5,053,810) $(546,465) $(4,866,259) $(562,859) (0.281%)
ASSUMPTION CHANGE 06/30/09 16 $76,341,518 $6,171,812 $75,668,061 $6,356,966 $74,752,122 $6,547,675 3.267%
SPECIAL (GAIN)/LOSS 06/30/09 26 $25,084,406 $1,559,753 $25,348,550 $1,606,546 $25,583,989 $1,654,743 0.826%
GOLDEN HANDSHAKE 06/30/10 17 $10,932,083 $852,997 $10,867,584 $878,587 $10,771,714 $904,945 0.452%
SPECIAL (GAIN)/LOSS 06/30/10 27 $(45,543,603) $(2,781,533) $(46,075,419) $(2,864,979) $(46,560,602) $(2,950,928) (1.473%)
ASSUMPTION CHANGE 06/30/11 18 $44,057,039 $1,108,849 $46,211,638 $3,605,754 $45,938,986 $3,713,926 1.853%
SPECIAL (GAIN)/LOSS 06/30/11 28 $18,106,142 $1,087,283 $18,336,784 $1,119,902 $18,550,904 $1,153,499 0.576%
PAYMENT (GAIN)/LOSS 06/30/12 29 $19,358,590 $(1,337,396) $22,197,126 $1,332,949 $22,479,880 $1,372,938 0.685%
(GAIN)/LOSS 06/30/12 29 $110,475,160 $5,975,889 $112,564,863 $6,759,579 $113,998,747 $6,962,367 3.474%
(GAIN)/LOSS 06/30/13 30 $228,567,227 $(1,497,133) $247,262,030 $1,126,901 $264,638,286 $3,722,147 1.857%
TOTAL $656,748,512 $30,431,411 $674,452,693 $39,791,823 $683,779,606 $43,547,018 21.731%
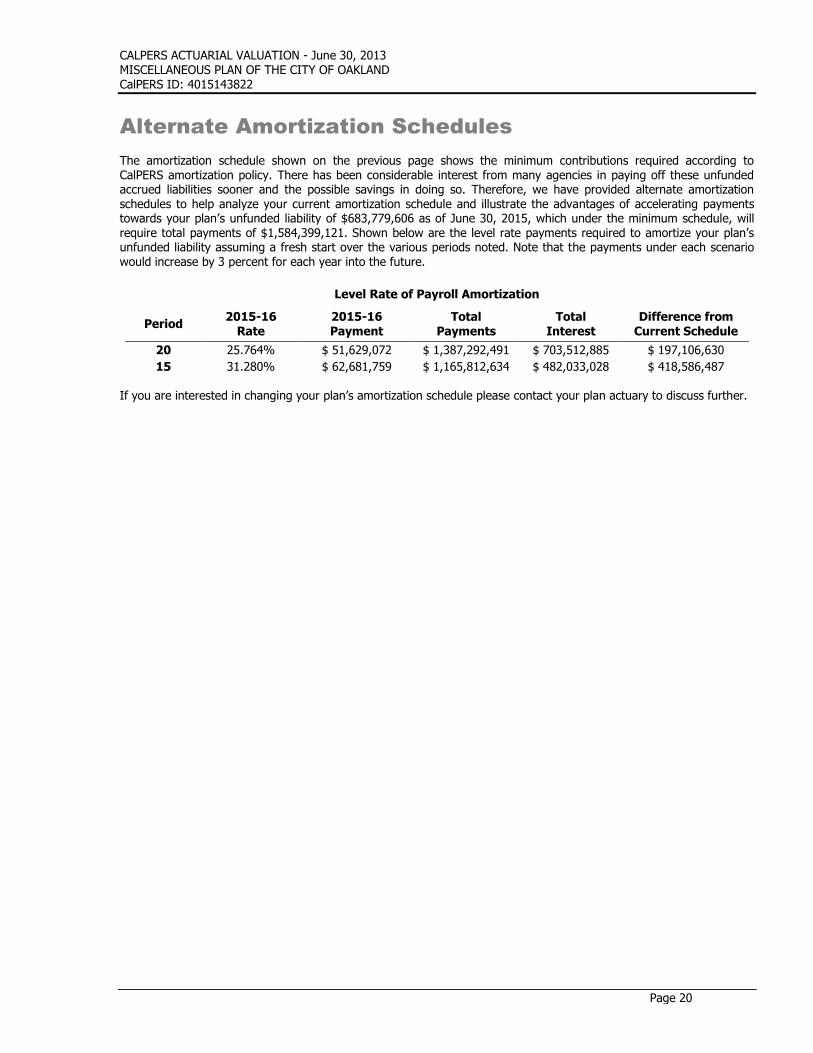
CALPERS ACTUARIAL VALUATION - June 30, 2013 MISCELLANEOUS PLAN OF THE CITY OF OAKLAND CalPERS ID: 4015143822
Page 20 Page 20
Alternate Amortization Schedules
The amortization schedule shown on the previous page shows the minimum contributions required according to CalPERS amortization policy. There has been considerable interest from many agencies in paying off these unfunded accrued liabilities sooner and the possible savings in doing so. Therefore, we have provided alternate amortization schedules to help analyze your current amortization schedule and illustrate the advantages of accelerating payments towards your plan’s unfunded liability of $683,779,606 as of June 30, 2015, which under the minimum schedule, will require total payments of $1,584,399,121. Shown below are the level rate payments required to amortize your plan’s unfunded liability assuming a fresh start over the various periods noted. Note that the payments under each scenario would increase by 3 percent for each year into the future.
If you are interested in changing your plan’s amortization schedule please contact your plan actuary to discuss further.
Level Rate of Payroll Amortization
Period 2015-16
Rate
2015-16
Payment
Total
Payments
Total
Interest
Difference from
Current Schedule
20 25.764% $ 51,629,072 $ 1,387,292,491 $ 703,512,885 $ 197,106,630
15 31.280% $ 62,681,759 $ 1,165,812,634 $ 482,033,028 $ 418,586,487
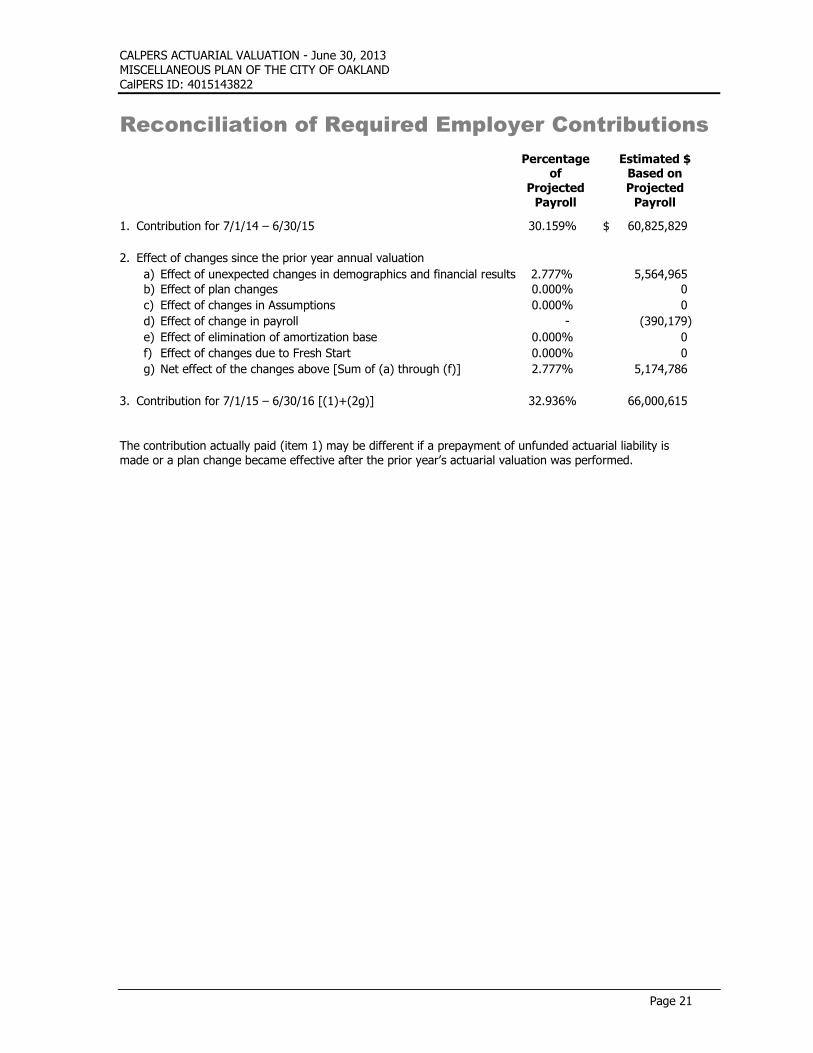
CALPERS ACTUARIAL VALUATION - June 30, 2013 MISCELLANEOUS PLAN OF THE CITY OF OAKLAND CalPERS ID: 4015143822
Page 21
Reconciliation of Required Employer Contributions
Percentage
of Projected
Payroll
Estimated $ Based on Projected
Payroll
1. Contribution for 7/1/14 – 6/30/15 30.159% $ 60,825,829
2. Effect of changes since the prior year annual valuation
a) Effect of unexpected changes in demographics and financial results 2.777% 5,564,965
b) Effect of plan changes 0.000% 0
c) Effect of changes in Assumptions 0.000% 0
d) Effect of change in payroll - (390,179)
e) Effect of elimination of amortization base 0.000% 0
f) Effect of changes due to Fresh Start 0.000% 0
g) Net effect of the changes above [Sum of (a) through (f)] 2.777% 5,174,786
3. Contribution for 7/1/15 – 6/30/16 [(1)+(2g)] 32.936% 66,000,615
The contribution actually paid (item 1) may be different if a prepayment of unfunded actuarial liability is made or a plan change became effective after the prior year’s actuarial valuation was performed.
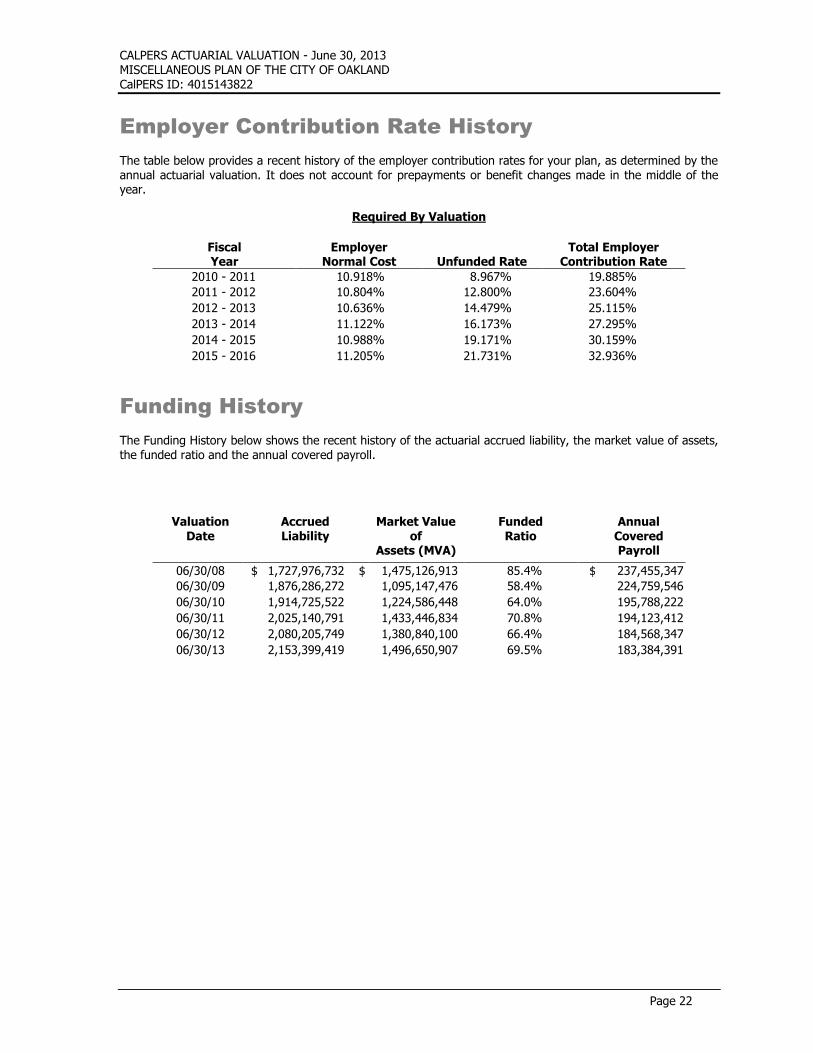
CALPERS ACTUARIAL VALUATION - June 30, 2013 MISCELLANEOUS PLAN OF THE CITY OF OAKLAND CalPERS ID: 4015143822
Page 22
Employer Contribution Rate History
The table below provides a recent history of the employer contribution rates for your plan, as determined by the annual actuarial valuation. It does not account for prepayments or benefit changes made in the middle of the year.
Required By Valuation
Fiscal Year
Employer Normal Cost Unfunded Rate
Total Employer Contribution Rate
2010 - 2011 10.918% 8.967% 19.885%
2011 - 2012 10.804% 12.800% 23.604%
2012 - 2013 10.636% 14.479% 25.115%
2013 - 2014 11.122% 16.173% 27.295%
2014 - 2015 10.988% 19.171% 30.159%
2015 - 2016 11.205% 21.731% 32.936%
Funding History
The Funding History below shows the recent history of the actuarial accrued liability, the market value of assets, the funded ratio and the annual covered payroll.
Valuation Date
Accrued Liability
Market Value of
Assets (MVA)
Funded Ratio
Annual Covered Payroll
06/30/08 $ 1,727,976,732 $ 1,475,126,913 85.4% $ 237,455,347
06/30/09 1,876,286,272 1,095,147,476 58.4% 224,759,546
06/30/10 1,914,725,522 1,224,586,448 64.0% 195,788,222
06/30/11 2,025,140,791 1,433,446,834 70.8% 194,123,412
06/30/12 2,080,205,749 1,380,840,100 66.4% 184,568,347
06/30/13 2,153,399,419 1,496,650,907 69.5% 183,384,391
RISK ANALYSIS
VOLATILITY RATIOS
PROJECTED RATES
ANALYSIS OF FUTURE INVESTMENT RETURN SCENARIOS
ANALYSIS OF DISCOUNT RATE SENSITIVITY
HYPOTHETICAL TERMINATION LIABILITY

THIS PAGE
INTENTIONALLY
LEFT BLANK
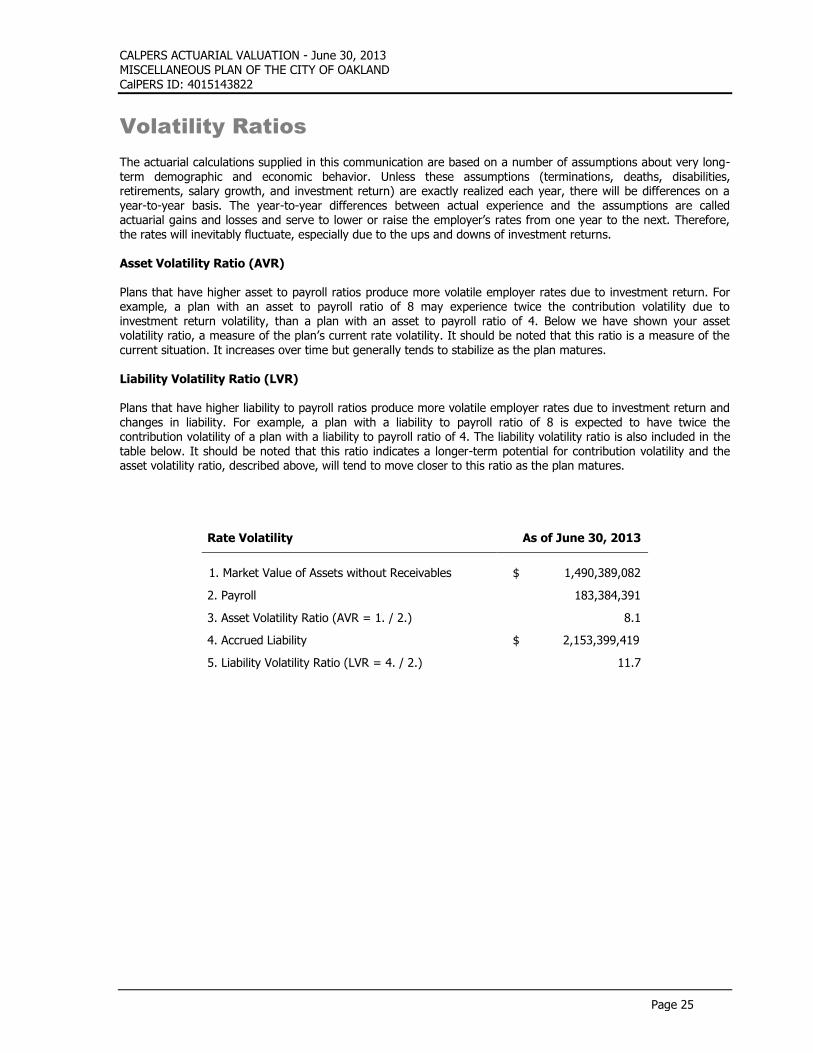
CALPERS ACTUARIAL VALUATION - June 30, 2013 MISCELLANEOUS PLAN OF THE CITY OF OAKLAND CalPERS ID: 4015143822
Page 25
Volatility Ratios
The actuarial calculations supplied in this communication are based on a number of assumptions about very long-term demographic and economic behavior. Unless these assumptions (terminations, deaths, disabilities, retirements, salary growth, and investment return) are exactly realized each year, there will be differences on a year-to-year basis. The year-to-year differences between actual experience and the assumptions are called actuarial gains and losses and serve to lower or raise the employer’s rates from one year to the next. Therefore, the rates will inevitably fluctuate, especially due to the ups and downs of investment returns. Asset Volatility Ratio (AVR) Plans that have higher asset to payroll ratios produce more volatile employer rates due to investment return. For example, a plan with an asset to payroll ratio of 8 may experience twice the contribution volatility due to investment return volatility, than a plan with an asset to payroll ratio of 4. Below we have shown your asset volatility ratio, a measure of the plan’s current rate volatility. It should be noted that this ratio is a measure of the current situation. It increases over time but generally tends to stabilize as the plan matures. Liability Volatility Ratio (LVR) Plans that have higher liability to payroll ratios produce more volatile employer rates due to investment return and changes in liability. For example, a plan with a liability to payroll ratio of 8 is expected to have twice the contribution volatility of a plan with a liability to payroll ratio of 4. The liability volatility ratio is also included in the table below. It should be noted that this ratio indicates a longer-term potential for contribution volatility and the asset volatility ratio, described above, will tend to move closer to this ratio as the plan matures.
Rate Volatility As of June 30, 2013
1. Market Value of Assets without Receivables $ 1,490,389,082
2. Payroll 183,384,391
3. Asset Volatility Ratio (AVR = 1. / 2.) 8.1
4. Accrued Liability $ 2,153,399,419
5. Liability Volatility Ratio (LVR = 4. / 2.) 11.7
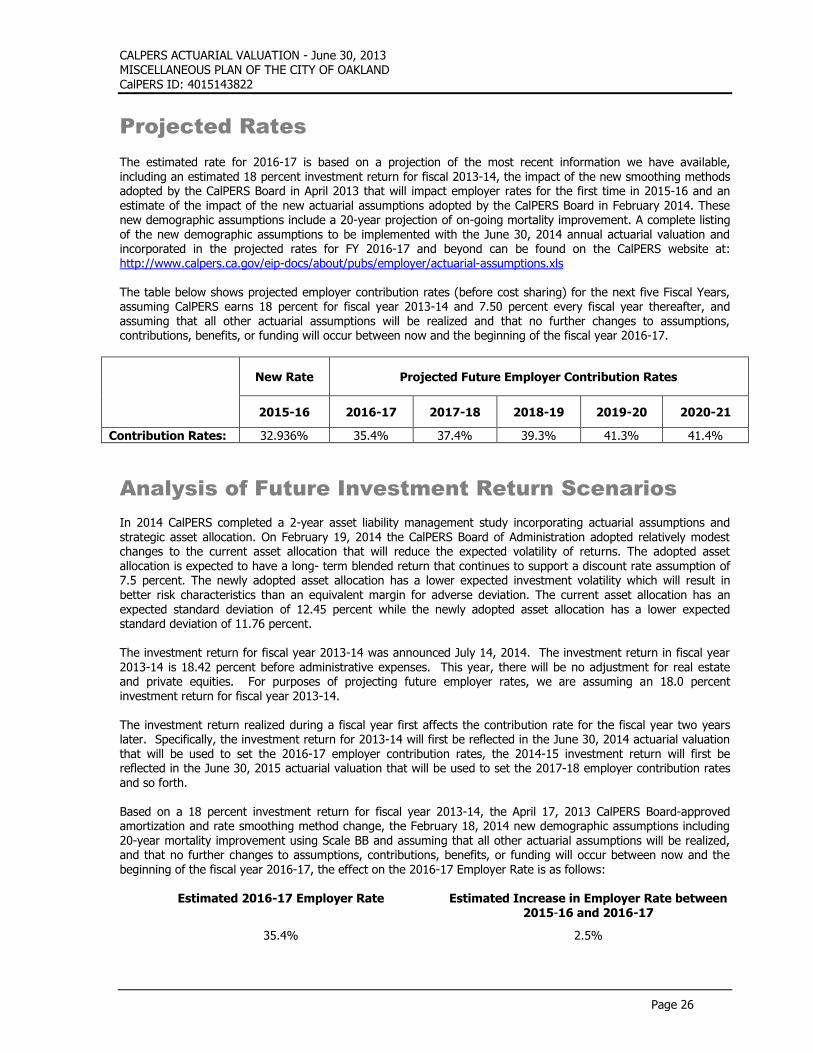
CALPERS ACTUARIAL VALUATION - June 30, 2013 MISCELLANEOUS PLAN OF THE CITY OF OAKLAND CalPERS ID: 4015143822
Page 26
Projected Rates
The estimated rate for 2016-17 is based on a projection of the most recent information we have available, including an estimated 18 percent investment return for fiscal 2013-14, the impact of the new smoothing methods adopted by the CalPERS Board in April 2013 that will impact employer rates for the first time in 2015-16 and an estimate of the impact of the new actuarial assumptions adopted by the CalPERS Board in February 2014. These new demographic assumptions include a 20-year projection of on-going mortality improvement. A complete listing of the new demographic assumptions to be implemented with the June 30, 2014 annual actuarial valuation and incorporated in the projected rates for FY 2016-17 and beyond can be found on the CalPERS website at: http://www.calpers.ca.gov/eip-docs/about/pubs/employer/actuarial-assumptions.xls The table below shows projected employer contribution rates (before cost sharing) for the next five Fiscal Years, assuming CalPERS earns 18 percent for fiscal year 2013-14 and 7.50 percent every fiscal year thereafter, and assuming that all other actuarial assumptions will be realized and that no further changes to assumptions, contributions, benefits, or funding will occur between now and the beginning of the fiscal year 2016-17.
New Rate Projected Future Employer Contribution Rates
2015-16 2016-17 2017-18 2018-19 2019-20 2020-21
Contribution Rates: 32.936% 35.4% 37.4% 39.3% 41.3% 41.4%
Analysis of Future Investment Return Scenarios
In 2014 CalPERS completed a 2-year asset liability management study incorporating actuarial assumptions and strategic asset allocation. On February 19, 2014 the CalPERS Board of Administration adopted relatively modest changes to the current asset allocation that will reduce the expected volatility of returns. The adopted asset
allocation is expected to have a long- term blended return that continues to support a discount rate assumption of 7.5 percent. The newly adopted asset allocation has a lower expected investment volatility which will result in better risk characteristics than an equivalent margin for adverse deviation. The current asset allocation has an expected standard deviation of 12.45 percent while the newly adopted asset allocation has a lower expected standard deviation of 11.76 percent. The investment return for fiscal year 2013-14 was announced July 14, 2014. The investment return in fiscal year 2013-14 is 18.42 percent before administrative expenses. This year, there will be no adjustment for real estate and private equities. For purposes of projecting future employer rates, we are assuming an 18.0 percent investment return for fiscal year 2013-14. The investment return realized during a fiscal year first affects the contribution rate for the fiscal year two years later. Specifically, the investment return for 2013-14 will first be reflected in the June 30, 2014 actuarial valuation that will be used to set the 2016-17 employer contribution rates, the 2014-15 investment return will first be reflected in the June 30, 2015 actuarial valuation that will be used to set the 2017-18 employer contribution rates
and so forth. Based on a 18 percent investment return for fiscal year 2013-14, the April 17, 2013 CalPERS Board-approved amortization and rate smoothing method change, the February 18, 2014 new demographic assumptions including 20-year mortality improvement using Scale BB and assuming that all other actuarial assumptions will be realized, and that no further changes to assumptions, contributions, benefits, or funding will occur between now and the beginning of the fiscal year 2016-17, the effect on the 2016-17 Employer Rate is as follows:
Estimated 2016-17 Employer Rate Estimated Increase in Employer Rate between 2015-16 and 2016-17
35.4% 2.5%
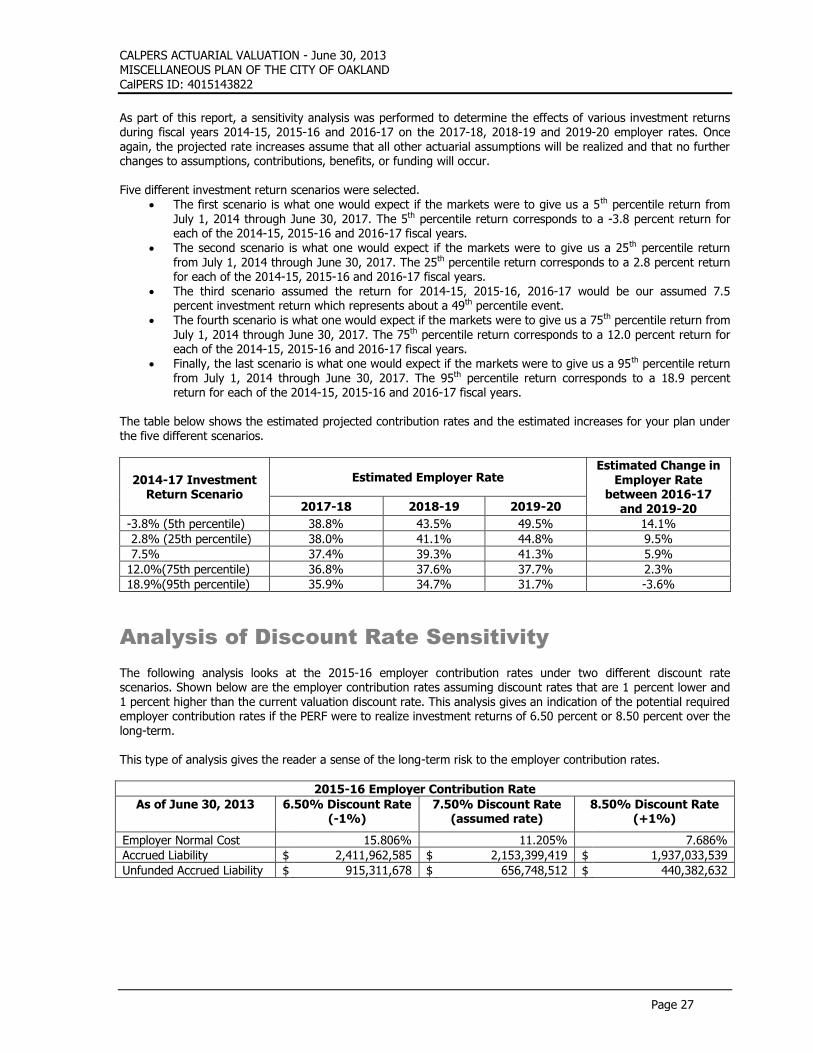
CALPERS ACTUARIAL VALUATION - June 30, 2013 MISCELLANEOUS PLAN OF THE CITY OF OAKLAND CalPERS ID: 4015143822
Page 27
As part of this report, a sensitivity analysis was performed to determine the effects of various investment returns during fiscal years 2014-15, 2015-16 and 2016-17 on the 2017-18, 2018-19 and 2019-20 employer rates. Once again, the projected rate increases assume that all other actuarial assumptions will be realized and that no further changes to assumptions, contributions, benefits, or funding will occur. Five different investment return scenarios were selected.
The first scenario is what one would expect if the markets were to give us a 5th percentile return from July 1, 2014 through June 30, 2017. The 5th percentile return corresponds to a -3.8 percent return for each of the 2014-15, 2015-16 and 2016-17 fiscal years.
The second scenario is what one would expect if the markets were to give us a 25th percentile return from July 1, 2014 through June 30, 2017. The 25th percentile return corresponds to a 2.8 percent return for each of the 2014-15, 2015-16 and 2016-17 fiscal years.
The third scenario assumed the return for 2014-15, 2015-16, 2016-17 would be our assumed 7.5 percent investment return which represents about a 49th percentile event.
The fourth scenario is what one would expect if the markets were to give us a 75th percentile return from
July 1, 2014 through June 30, 2017. The 75th percentile return corresponds to a 12.0 percent return for each of the 2014-15, 2015-16 and 2016-17 fiscal years.
Finally, the last scenario is what one would expect if the markets were to give us a 95th percentile return from July 1, 2014 through June 30, 2017. The 95th percentile return corresponds to a 18.9 percent return for each of the 2014-15, 2015-16 and 2016-17 fiscal years.
The table below shows the estimated projected contribution rates and the estimated increases for your plan under the five different scenarios.
2014-17 Investment Return Scenario
Estimated Employer Rate Estimated Change in
Employer Rate between 2016-17
and 2019-20 2017-18 2018-19 2019-20
-3.8% (5th percentile) 38.8% 43.5% 49.5% 14.1%
2.8% (25th percentile) 38.0% 41.1% 44.8% 9.5%
7.5% 37.4% 39.3% 41.3% 5.9%
12.0%(75th percentile) 36.8% 37.6% 37.7% 2.3%
18.9%(95th percentile) 35.9% 34.7% 31.7% -3.6%
Analysis of Discount Rate Sensitivity
The following analysis looks at the 2015-16 employer contribution rates under two different discount rate scenarios. Shown below are the employer contribution rates assuming discount rates that are 1 percent lower and 1 percent higher than the current valuation discount rate. This analysis gives an indication of the potential required employer contribution rates if the PERF were to realize investment returns of 6.50 percent or 8.50 percent over the long-term. This type of analysis gives the reader a sense of the long-term risk to the employer contribution rates.
2015-16 Employer Contribution Rate
As of June 30, 2013 6.50% Discount Rate (-1%)
7.50% Discount Rate (assumed rate)
8.50% Discount Rate (+1%)
Employer Normal Cost 15.806% 11.205% 7.686%
Accrued Liability $ 2,411,962,585 $ 2,153,399,419 $ 1,937,033,539
Unfunded Accrued Liability $ 915,311,678 $ 656,748,512 $ 440,382,632
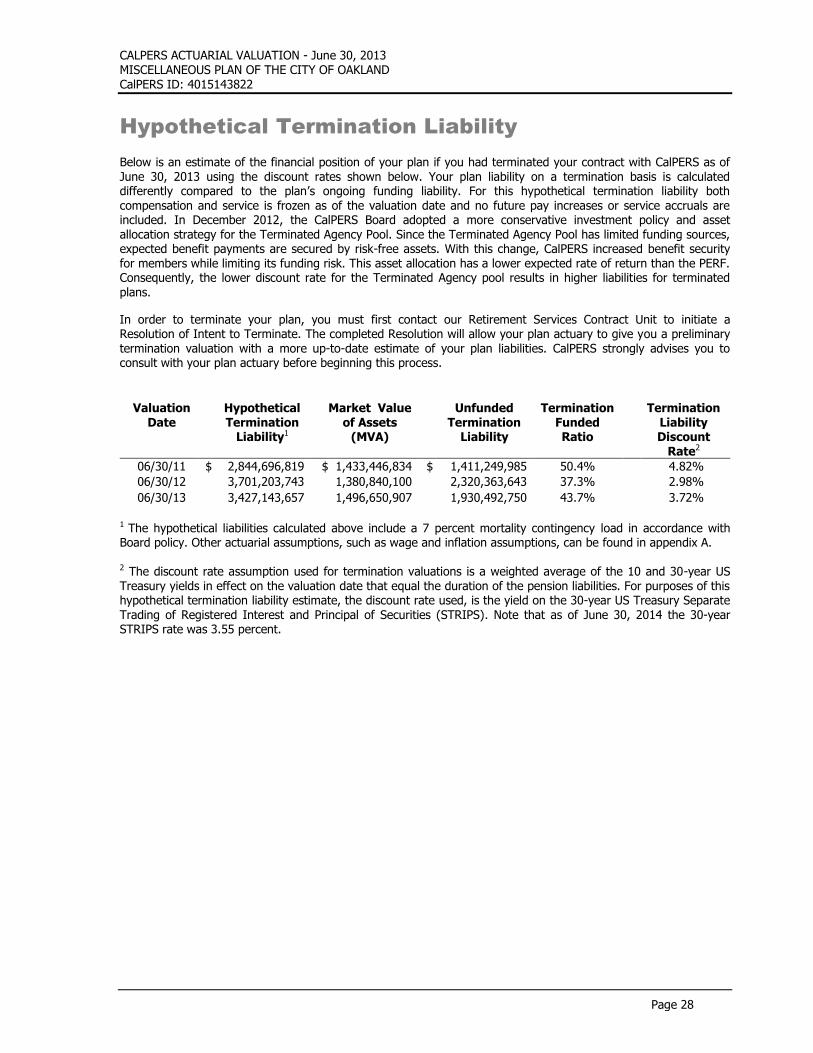
CALPERS ACTUARIAL VALUATION - June 30, 2013 MISCELLANEOUS PLAN OF THE CITY OF OAKLAND CalPERS ID: 4015143822
Page 28
Hypothetical Termination Liability
Below is an estimate of the financial position of your plan if you had terminated your contract with CalPERS as of June 30, 2013 using the discount rates shown below. Your plan liability on a termination basis is calculated differently compared to the plan’s ongoing funding liability. For this hypothetical termination liability both compensation and service is frozen as of the valuation date and no future pay increases or service accruals are included. In December 2012, the CalPERS Board adopted a more conservative investment policy and asset allocation strategy for the Terminated Agency Pool. Since the Terminated Agency Pool has limited funding sources, expected benefit payments are secured by risk-free assets. With this change, CalPERS increased benefit security for members while limiting its funding risk. This asset allocation has a lower expected rate of return than the PERF. Consequently, the lower discount rate for the Terminated Agency pool results in higher liabilities for terminated plans.
In order to terminate your plan, you must first contact our Retirement Services Contract Unit to initiate a Resolution of Intent to Terminate. The completed Resolution will allow your plan actuary to give you a preliminary termination valuation with a more up-to-date estimate of your plan liabilities. CalPERS strongly advises you to consult with your plan actuary before beginning this process.
Valuation
Date
Hypothetical Termination
Liability1
Market Value of Assets
(MVA)
Unfunded Termination
Liability
Termination Funded Ratio
Termination Liability Discount
Rate2
06/30/11 $ 2,844,696,819 $ 1,433,446,834 $ 1,411,249,985 50.4% 4.82%
06/30/12 3,701,203,743 1,380,840,100 2,320,363,643 37.3% 2.98%
06/30/13 3,427,143,657 1,496,650,907 1,930,492,750 43.7% 3.72%
1 The hypothetical liabilities calculated above include a 7 percent mortality contingency load in accordance with Board policy. Other actuarial assumptions, such as wage and inflation assumptions, can be found in appendix A.
2 The discount rate assumption used for termination valuations is a weighted average of the 10 and 30-year US Treasury yields in effect on the valuation date that equal the duration of the pension liabilities. For purposes of this hypothetical termination liability estimate, the discount rate used, is the yield on the 30-year US Treasury Separate Trading of Registered Interest and Principal of Securities (STRIPS). Note that as of June 30, 2014 the 30-year STRIPS rate was 3.55 percent.

GASB STATEMENT NO. 27

THIS PAGE
INTENTIONALLY
LEFT BLANK
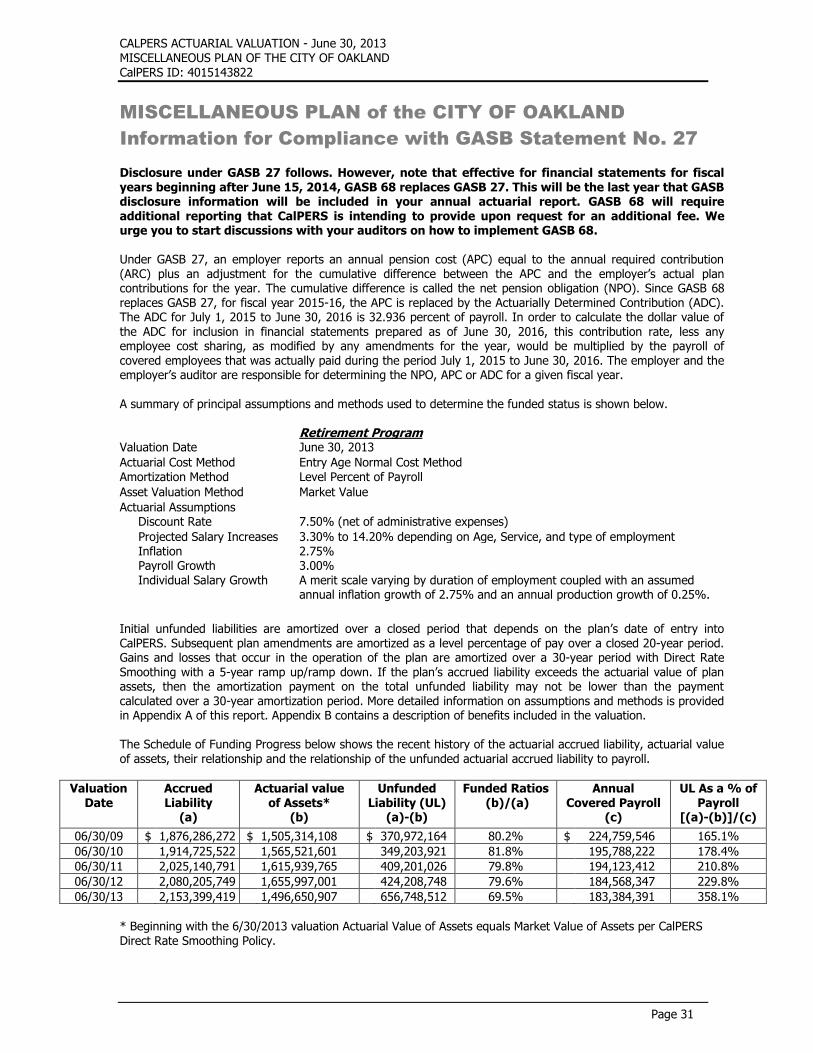
CALPERS ACTUARIAL VALUATION - June 30, 2013 MISCELLANEOUS PLAN OF THE CITY OF OAKLAND CalPERS ID: 4015143822
Page 31
MISCELLANEOUS PLAN of the CITY OF OAKLAND
Information for Compliance with GASB Statement No. 27
Disclosure under GASB 27 follows. However, note that effective for financial statements for fiscal years beginning after June 15, 2014, GASB 68 replaces GASB 27. This will be the last year that GASB disclosure information will be included in your annual actuarial report. GASB 68 will require additional reporting that CalPERS is intending to provide upon request for an additional fee. We urge you to start discussions with your auditors on how to implement GASB 68. Under GASB 27, an employer reports an annual pension cost (APC) equal to the annual required contribution (ARC) plus an adjustment for the cumulative difference between the APC and the employer’s actual plan contributions for the year. The cumulative difference is called the net pension obligation (NPO). Since GASB 68 replaces GASB 27, for fiscal year 2015-16, the APC is replaced by the Actuarially Determined Contribution (ADC). The ADC for July 1, 2015 to June 30, 2016 is 32.936 percent of payroll. In order to calculate the dollar value of
the ADC for inclusion in financial statements prepared as of June 30, 2016, this contribution rate, less any employee cost sharing, as modified by any amendments for the year, would be multiplied by the payroll of covered employees that was actually paid during the period July 1, 2015 to June 30, 2016. The employer and the employer’s auditor are responsible for determining the NPO, APC or ADC for a given fiscal year. A summary of principal assumptions and methods used to determine the funded status is shown below. Retirement Program Valuation Date June 30, 2013
Actuarial Cost Method Entry Age Normal Cost Method Amortization Method Level Percent of Payroll
Asset Valuation Method Market Value
Actuarial Assumptions Discount Rate 7.50% (net of administrative expenses)
Projected Salary Increases 3.30% to 14.20% depending on Age, Service, and type of employment Inflation 2.75% Payroll Growth 3.00% Individual Salary Growth A merit scale varying by duration of employment coupled with an assumed
annual inflation growth of 2.75% and an annual production growth of 0.25%.
Initial unfunded liabilities are amortized over a closed period that depends on the plan’s date of entry into CalPERS. Subsequent plan amendments are amortized as a level percentage of pay over a closed 20-year period. Gains and losses that occur in the operation of the plan are amortized over a 30-year period with Direct Rate Smoothing with a 5-year ramp up/ramp down. If the plan’s accrued liability exceeds the actuarial value of plan assets, then the amortization payment on the total unfunded liability may not be lower than the payment calculated over a 30-year amortization period. More detailed information on assumptions and methods is provided in Appendix A of this report. Appendix B contains a description of benefits included in the valuation. The Schedule of Funding Progress below shows the recent history of the actuarial accrued liability, actuarial value of assets, their relationship and the relationship of the unfunded actuarial accrued liability to payroll.
Valuation Date
Accrued Liability
(a)
Actuarial value of Assets*
(b)
Unfunded Liability (UL)
(a)-(b)
Funded Ratios (b)/(a)
Annual Covered Payroll
(c)
UL As a % of Payroll
[(a)-(b)]/(c)
06/30/09 $ 1,876,286,272 $ 1,505,314,108 $ 370,972,164 80.2% $ 224,759,546 165.1%
06/30/10 1,914,725,522 1,565,521,601 349,203,921 81.8% 195,788,222 178.4%
06/30/11 2,025,140,791 1,615,939,765 409,201,026 79.8% 194,123,412 210.8%
06/30/12 2,080,205,749 1,655,997,001 424,208,748 79.6% 184,568,347 229.8%
06/30/13 2,153,399,419 1,496,650,907 656,748,512 69.5% 183,384,391 358.1%
* Beginning with the 6/30/2013 valuation Actuarial Value of Assets equals Market Value of Assets per CalPERS Direct Rate Smoothing Policy.

THIS PAGE
INTENTIONALLY
LEFT BLANK

PLAN’S MAJOR BENEFIT PROVISIONS

THIS PAGE
INTENTIONALLY
LEFT BLANK
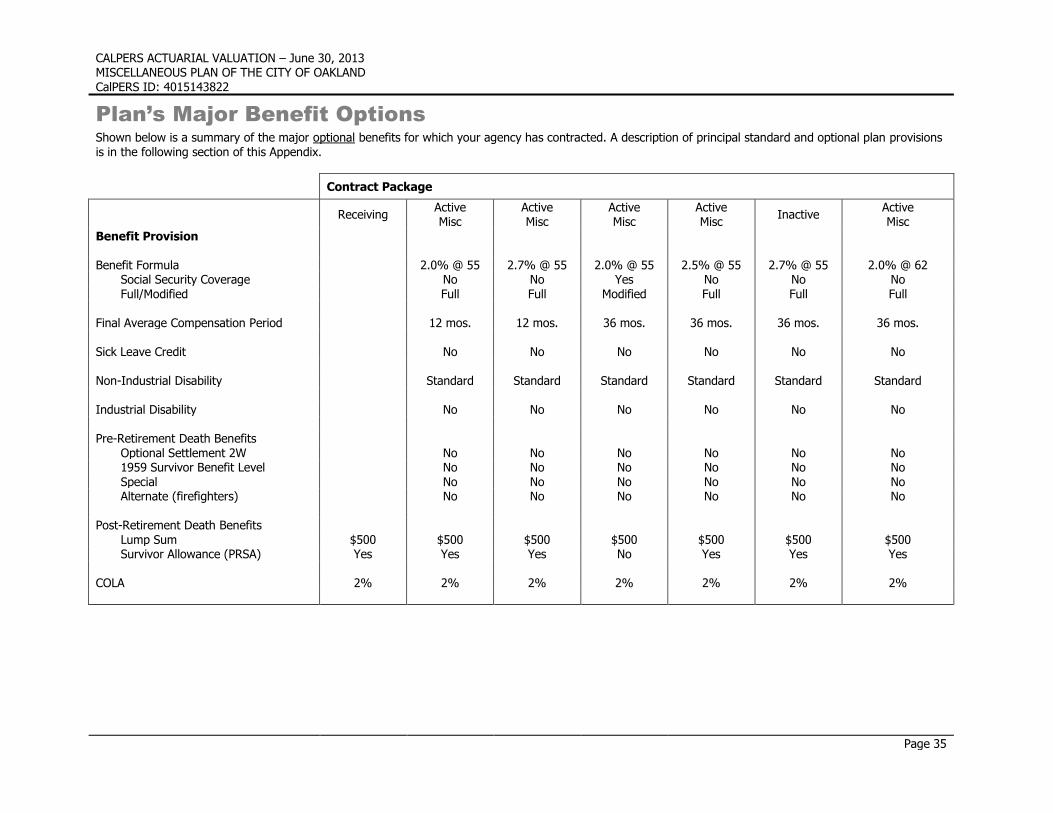
CALPERS ACTUARIAL VALUATION – June 30, 2013 MISCELLANEOUS PLAN OF THE CITY OF OAKLAND CalPERS ID: 4015143822
Plan’s Major Benefit Options
Shown below is a summary of the major optional benefits for which your agency has contracted. A description of principal standard and optional plan provisions is in the following section of this Appendix.
Contract Package
Receiving Active Misc
Active Misc
Active Misc
Active Misc
Inactive Active Misc
Benefit Provision Benefit Formula 2.0% @ 55 2.7% @ 55 2.0% @ 55 2.5% @ 55 2.7% @ 55 2.0% @ 62
Social Security Coverage No No Yes No No No Full/Modified Full Full Modified Full Full Full
Final Average Compensation Period 12 mos. 12 mos. 36 mos. 36 mos. 36 mos. 36 mos. Sick Leave Credit No No No No No No Non-Industrial Disability Standard Standard Standard Standard Standard Standard Industrial Disability No No No No No No Pre-Retirement Death Benefits
Optional Settlement 2W No No No No No No 1959 Survivor Benefit Level No No No No No No Special No No No No No No Alternate (firefighters) No No No No No No
Post-Retirement Death Benefits
Lump Sum $500 $500 $500 $500 $500 $500 $500 Survivor Allowance (PRSA) Yes Yes Yes No Yes Yes Yes
COLA 2% 2% 2% 2% 2% 2% 2%
Contractual Employee Cost Sharing
Page 35
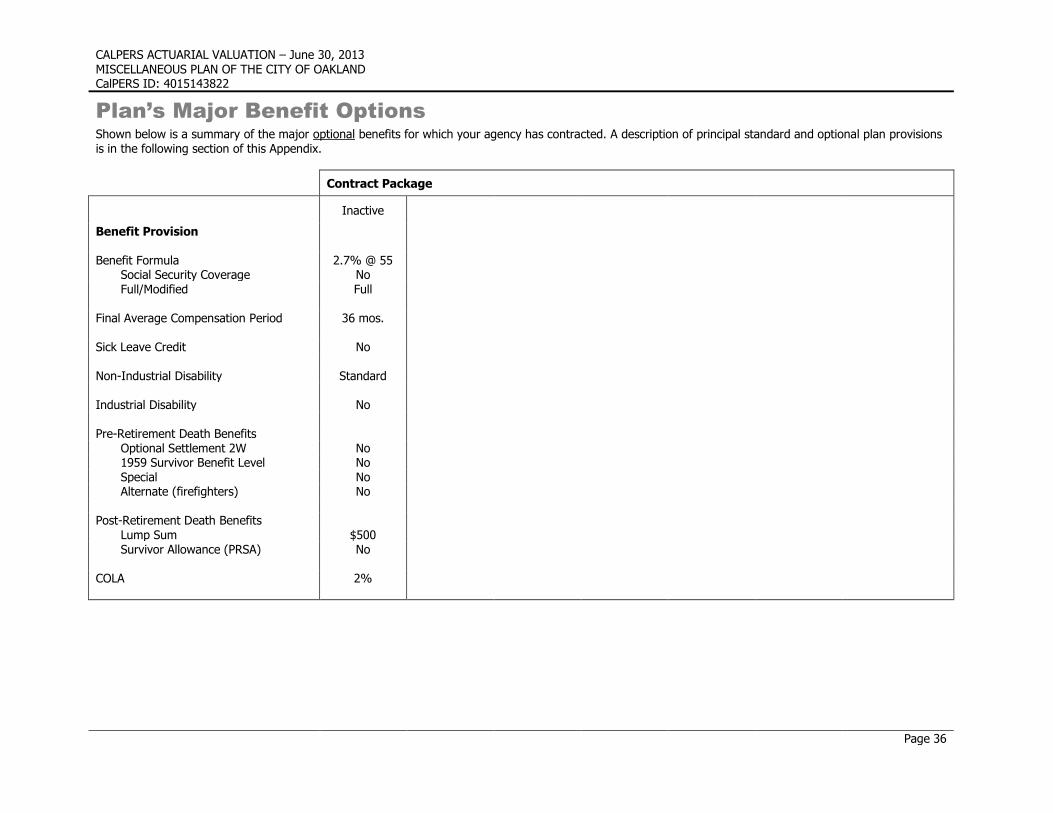
CALPERS ACTUARIAL VALUATION – June 30, 2013
MISCELLANEOUS PLAN OF THE CITY OF OAKLAND CalPERS ID: 4015143822
Plan’s Major Benefit Options
Shown below is a summary of the major optional benefits for which your agency has contracted. A description of principal standard and optional plan provisions is in the following section of this Appendix.
Contract Package
Inactive
Benefit Provision Benefit Formula 2.7% @ 55
Social Security Coverage No Full/Modified Full
Final Average Compensation Period 36 mos. Sick Leave Credit No Non-Industrial Disability Standard Industrial Disability No Pre-Retirement Death Benefits
Optional Settlement 2W No 1959 Survivor Benefit Level No Special No Alternate (firefighters) No
Post-Retirement Death Benefits
Lump Sum $500 Survivor Allowance (PRSA) No
COLA 2%
Page 36
APPENDICES
APPENDIX A – ACTUARIAL METHODS AND ASSUMPTIONS
APPENDIX B – PRINCIPAL PLAN PROVISIONS
APPENDIX C – PARTICIPANT DATA
APPENDIX D – DEVELOPMENT OF PPERA MEMBER CONTRIBUTION RATES
APPENDIX E – GLOSSARY OF ACTUARIAL TERMS

THIS PAGE
INTENTIONALLY
LEFT BLANK
APPENDIX A
ACTUARIAL METHODS AND ASSUMPTIONS
ACTUARIAL DATA
ACTUARIAL METHODS
ACTUARIAL ASSUMPTIONS
MISCELLANEOUS

THIS PAGE
INTENTIONALLY
LEFT BLANK
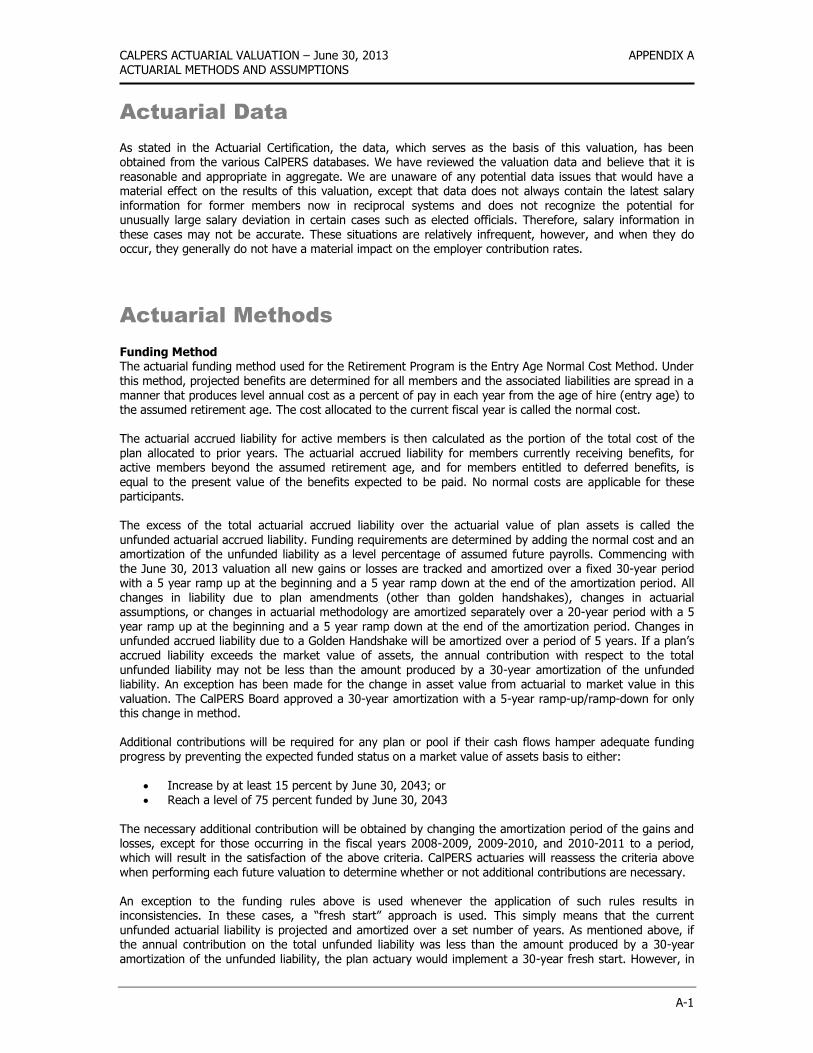
CALPERS ACTUARIAL VALUATION – June 30, 2013 APPENDIX A ACTUARIAL METHODS AND ASSUMPTIONS
A-1
Actuarial Data
As stated in the Actuarial Certification, the data, which serves as the basis of this valuation, has been obtained from the various CalPERS databases. We have reviewed the valuation data and believe that it is reasonable and appropriate in aggregate. We are unaware of any potential data issues that would have a material effect on the results of this valuation, except that data does not always contain the latest salary information for former members now in reciprocal systems and does not recognize the potential for unusually large salary deviation in certain cases such as elected officials. Therefore, salary information in these cases may not be accurate. These situations are relatively infrequent, however, and when they do occur, they generally do not have a material impact on the employer contribution rates.
Actuarial Methods
Funding Method The actuarial funding method used for the Retirement Program is the Entry Age Normal Cost Method. Under this method, projected benefits are determined for all members and the associated liabilities are spread in a manner that produces level annual cost as a percent of pay in each year from the age of hire (entry age) to the assumed retirement age. The cost allocated to the current fiscal year is called the normal cost. The actuarial accrued liability for active members is then calculated as the portion of the total cost of the plan allocated to prior years. The actuarial accrued liability for members currently receiving benefits, for active members beyond the assumed retirement age, and for members entitled to deferred benefits, is equal to the present value of the benefits expected to be paid. No normal costs are applicable for these participants. The excess of the total actuarial accrued liability over the actuarial value of plan assets is called the unfunded actuarial accrued liability. Funding requirements are determined by adding the normal cost and an amortization of the unfunded liability as a level percentage of assumed future payrolls. Commencing with
the June 30, 2013 valuation all new gains or losses are tracked and amortized over a fixed 30-year period with a 5 year ramp up at the beginning and a 5 year ramp down at the end of the amortization period. All changes in liability due to plan amendments (other than golden handshakes), changes in actuarial assumptions, or changes in actuarial methodology are amortized separately over a 20-year period with a 5 year ramp up at the beginning and a 5 year ramp down at the end of the amortization period. Changes in unfunded accrued liability due to a Golden Handshake will be amortized over a period of 5 years. If a plan’s accrued liability exceeds the market value of assets, the annual contribution with respect to the total unfunded liability may not be less than the amount produced by a 30-year amortization of the unfunded liability. An exception has been made for the change in asset value from actuarial to market value in this valuation. The CalPERS Board approved a 30-year amortization with a 5-year ramp-up/ramp-down for only this change in method. Additional contributions will be required for any plan or pool if their cash flows hamper adequate funding progress by preventing the expected funded status on a market value of assets basis to either:
Increase by at least 15 percent by June 30, 2043; or Reach a level of 75 percent funded by June 30, 2043
The necessary additional contribution will be obtained by changing the amortization period of the gains and losses, except for those occurring in the fiscal years 2008-2009, 2009-2010, and 2010-2011 to a period, which will result in the satisfaction of the above criteria. CalPERS actuaries will reassess the criteria above when performing each future valuation to determine whether or not additional contributions are necessary. An exception to the funding rules above is used whenever the application of such rules results in inconsistencies. In these cases, a “fresh start” approach is used. This simply means that the current unfunded actuarial liability is projected and amortized over a set number of years. As mentioned above, if the annual contribution on the total unfunded liability was less than the amount produced by a 30-year amortization of the unfunded liability, the plan actuary would implement a 30-year fresh start. However, in
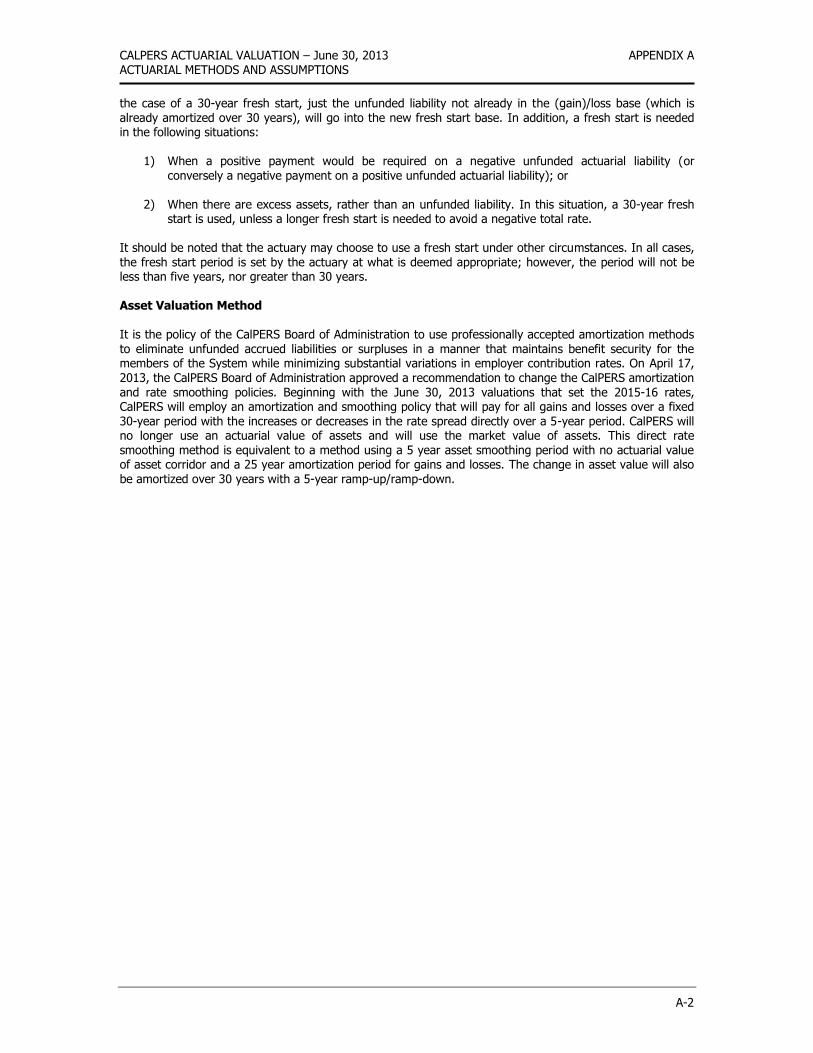
CALPERS ACTUARIAL VALUATION – June 30, 2013 APPENDIX A ACTUARIAL METHODS AND ASSUMPTIONS
A-2
the case of a 30-year fresh start, just the unfunded liability not already in the (gain)/loss base (which is
already amortized over 30 years), will go into the new fresh start base. In addition, a fresh start is needed in the following situations:
1) When a positive payment would be required on a negative unfunded actuarial liability (or conversely a negative payment on a positive unfunded actuarial liability); or
2) When there are excess assets, rather than an unfunded liability. In this situation, a 30-year fresh
start is used, unless a longer fresh start is needed to avoid a negative total rate. It should be noted that the actuary may choose to use a fresh start under other circumstances. In all cases, the fresh start period is set by the actuary at what is deemed appropriate; however, the period will not be less than five years, nor greater than 30 years. Asset Valuation Method It is the policy of the CalPERS Board of Administration to use professionally accepted amortization methods to eliminate unfunded accrued liabilities or surpluses in a manner that maintains benefit security for the members of the System while minimizing substantial variations in employer contribution rates. On April 17, 2013, the CalPERS Board of Administration approved a recommendation to change the CalPERS amortization and rate smoothing policies. Beginning with the June 30, 2013 valuations that set the 2015-16 rates, CalPERS will employ an amortization and smoothing policy that will pay for all gains and losses over a fixed 30-year period with the increases or decreases in the rate spread directly over a 5-year period. CalPERS will no longer use an actuarial value of assets and will use the market value of assets. This direct rate smoothing method is equivalent to a method using a 5 year asset smoothing period with no actuarial value of asset corridor and a 25 year amortization period for gains and losses. The change in asset value will also be amortized over 30 years with a 5-year ramp-up/ramp-down.
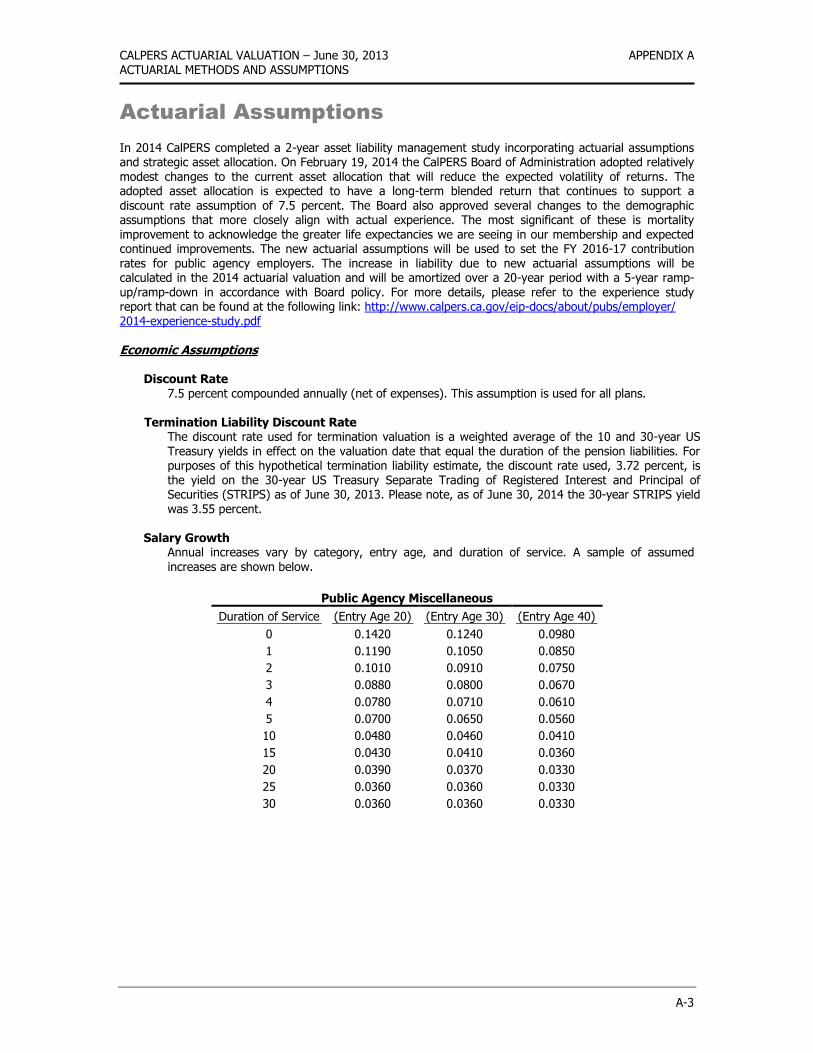
CALPERS ACTUARIAL VALUATION – June 30, 2013 APPENDIX A ACTUARIAL METHODS AND ASSUMPTIONS
A-3
Actuarial Assumptions
In 2014 CalPERS completed a 2-year asset liability management study incorporating actuarial assumptions and strategic asset allocation. On February 19, 2014 the CalPERS Board of Administration adopted relatively modest changes to the current asset allocation that will reduce the expected volatility of returns. The adopted asset allocation is expected to have a long-term blended return that continues to support a discount rate assumption of 7.5 percent. The Board also approved several changes to the demographic assumptions that more closely align with actual experience. The most significant of these is mortality improvement to acknowledge the greater life expectancies we are seeing in our membership and expected continued improvements. The new actuarial assumptions will be used to set the FY 2016-17 contribution rates for public agency employers. The increase in liability due to new actuarial assumptions will be calculated in the 2014 actuarial valuation and will be amortized over a 20-year period with a 5-year ramp-up/ramp-down in accordance with Board policy. For more details, please refer to the experience study report that can be found at the following link: http://www.calpers.ca.gov/eip-docs/about/pubs/employer/ 2014-experience-study.pdf Economic Assumptions
Discount Rate 7.5 percent compounded annually (net of expenses). This assumption is used for all plans.
Termination Liability Discount Rate The discount rate used for termination valuation is a weighted average of the 10 and 30-year US Treasury yields in effect on the valuation date that equal the duration of the pension liabilities. For purposes of this hypothetical termination liability estimate, the discount rate used, 3.72 percent, is the yield on the 30-year US Treasury Separate Trading of Registered Interest and Principal of Securities (STRIPS) as of June 30, 2013. Please note, as of June 30, 2014 the 30-year STRIPS yield was 3.55 percent.
Salary Growth
Annual increases vary by category, entry age, and duration of service. A sample of assumed
increases are shown below.
Public Agency Miscellaneous
Duration of Service (Entry Age 20) (Entry Age 30) (Entry Age 40)
0 0.1420 0.1240 0.0980
1 0.1190 0.1050 0.0850
2 0.1010 0.0910 0.0750
3 0.0880 0.0800 0.0670
4 0.0780 0.0710 0.0610
5 0.0700 0.0650 0.0560
10 0.0480 0.0460 0.0410
15 0.0430 0.0410 0.0360
20 0.0390 0.0370 0.0330
25 0.0360 0.0360 0.0330
30 0.0360 0.0360 0.0330
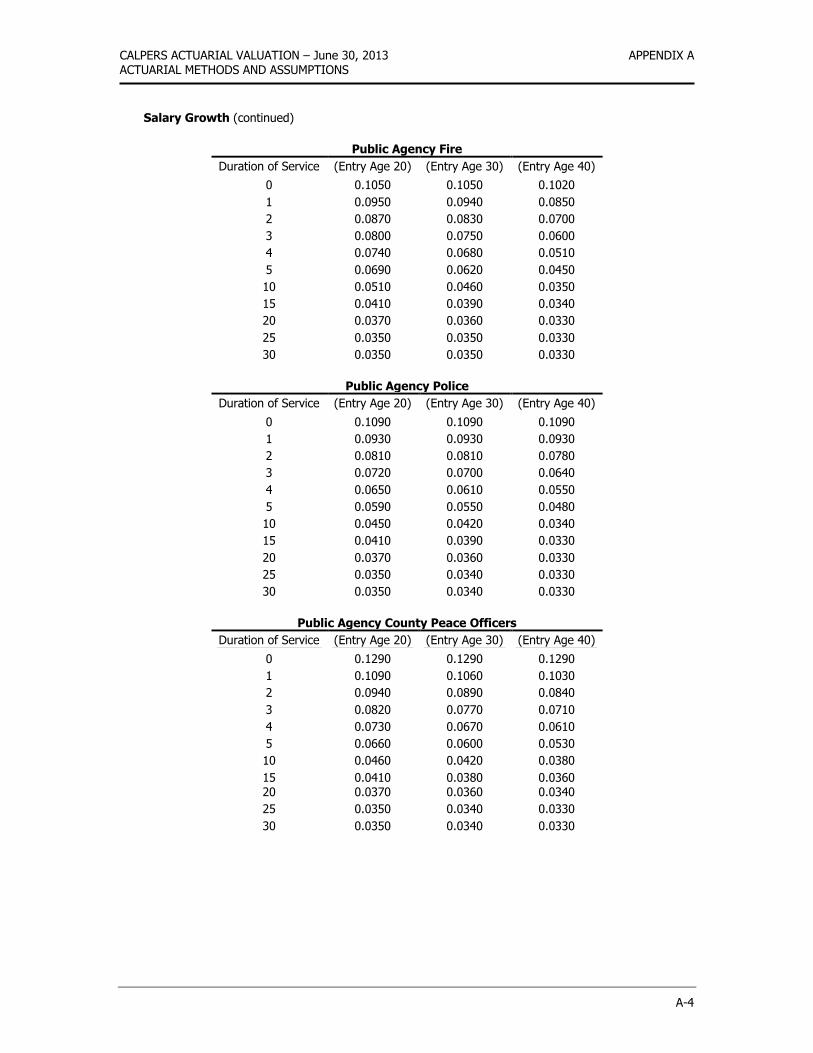
CALPERS ACTUARIAL VALUATION – June 30, 2013 APPENDIX A ACTUARIAL METHODS AND ASSUMPTIONS
A-4
Salary Growth (continued)
Public Agency Fire
Duration of Service (Entry Age 20) (Entry Age 30) (Entry Age 40)
0 0.1050 0.1050 0.1020
1 0.0950 0.0940 0.0850
2 0.0870 0.0830 0.0700
3 0.0800 0.0750 0.0600
4 0.0740 0.0680 0.0510
5 0.0690 0.0620 0.0450
10 0.0510 0.0460 0.0350
15 0.0410 0.0390 0.0340
20 0.0370 0.0360 0.0330
25 0.0350 0.0350 0.0330
30 0.0350 0.0350 0.0330
Public Agency Police
Duration of Service (Entry Age 20) (Entry Age 30) (Entry Age 40)
0 0.1090 0.1090 0.1090
1 0.0930 0.0930 0.0930
2 0.0810 0.0810 0.0780
3 0.0720 0.0700 0.0640
4 0.0650 0.0610 0.0550
5 0.0590 0.0550 0.0480
10 0.0450 0.0420 0.0340
15 0.0410 0.0390 0.0330
20 0.0370 0.0360 0.0330
25 0.0350 0.0340 0.0330
30 0.0350 0.0340 0.0330
Public Agency County Peace Officers
Duration of Service (Entry Age 20) (Entry Age 30) (Entry Age 40)
0 0.1290 0.1290 0.1290
1 0.1090 0.1060 0.1030
2 0.0940 0.0890 0.0840
3 0.0820 0.0770 0.0710
4 0.0730 0.0670 0.0610
5 0.0660 0.0600 0.0530
10 0.0460 0.0420 0.0380
15 0.0410 0.0380 0.0360 20 0.0370 0.0360 0.0340
25 0.0350 0.0340 0.0330
30 0.0350 0.0340 0.0330
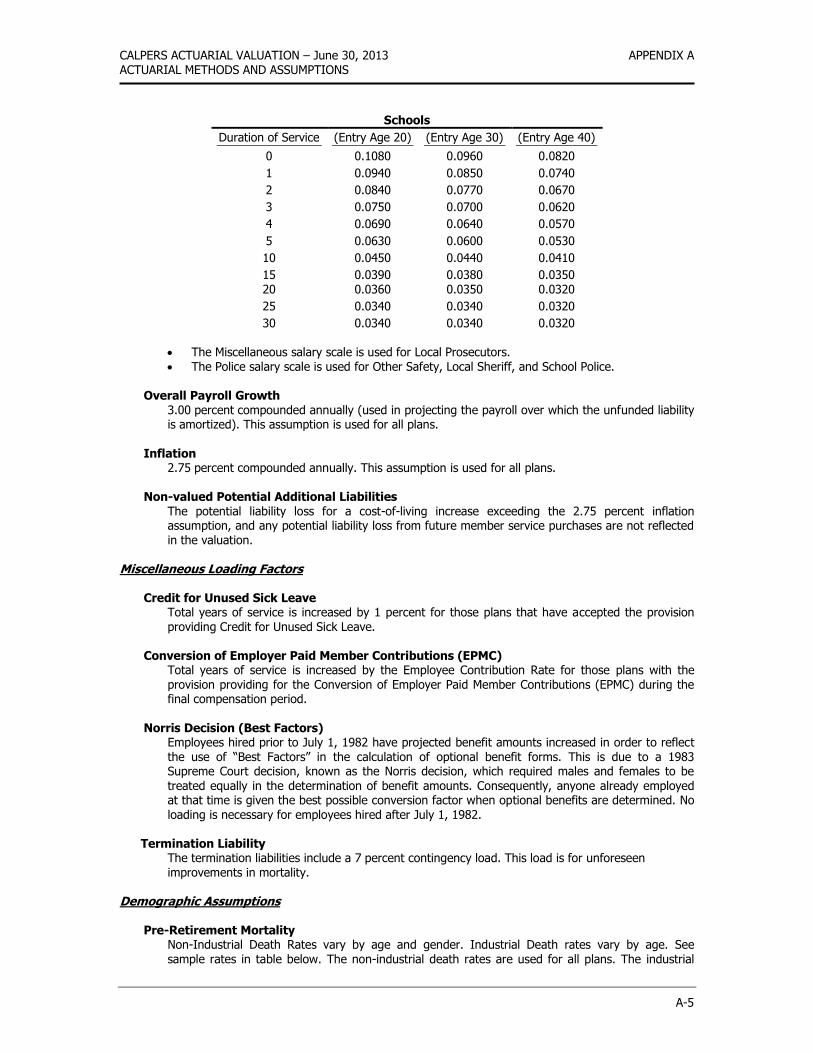
CALPERS ACTUARIAL VALUATION – June 30, 2013 APPENDIX A ACTUARIAL METHODS AND ASSUMPTIONS
A-5
Schools
Duration of Service (Entry Age 20) (Entry Age 30) (Entry Age 40)
0 0.1080 0.0960 0.0820
1 0.0940 0.0850 0.0740
2 0.0840 0.0770 0.0670
3 0.0750 0.0700 0.0620
4 0.0690 0.0640 0.0570
5 0.0630 0.0600 0.0530
10 0.0450 0.0440 0.0410
15 0.0390 0.0380 0.0350 20 0.0360 0.0350 0.0320
25 0.0340 0.0340 0.0320
30 0.0340 0.0340 0.0320
The Miscellaneous salary scale is used for Local Prosecutors. The Police salary scale is used for Other Safety, Local Sheriff, and School Police.
Overall Payroll Growth
3.00 percent compounded annually (used in projecting the payroll over which the unfunded liability is amortized). This assumption is used for all plans.
Inflation 2.75 percent compounded annually. This assumption is used for all plans.
Non-valued Potential Additional Liabilities The potential liability loss for a cost-of-living increase exceeding the 2.75 percent inflation assumption, and any potential liability loss from future member service purchases are not reflected in the valuation.
Miscellaneous Loading Factors
Credit for Unused Sick Leave Total years of service is increased by 1 percent for those plans that have accepted the provision providing Credit for Unused Sick Leave.
Conversion of Employer Paid Member Contributions (EPMC) Total years of service is increased by the Employee Contribution Rate for those plans with the provision providing for the Conversion of Employer Paid Member Contributions (EPMC) during the final compensation period.
Norris Decision (Best Factors) Employees hired prior to July 1, 1982 have projected benefit amounts increased in order to reflect the use of “Best Factors” in the calculation of optional benefit forms. This is due to a 1983 Supreme Court decision, known as the Norris decision, which required males and females to be
treated equally in the determination of benefit amounts. Consequently, anyone already employed at that time is given the best possible conversion factor when optional benefits are determined. No loading is necessary for employees hired after July 1, 1982.
Termination Liability The termination liabilities include a 7 percent contingency load. This load is for unforeseen improvements in mortality.
Demographic Assumptions
Pre-Retirement Mortality Non-Industrial Death Rates vary by age and gender. Industrial Death rates vary by age. See sample rates in table below. The non-industrial death rates are used for all plans. The industrial
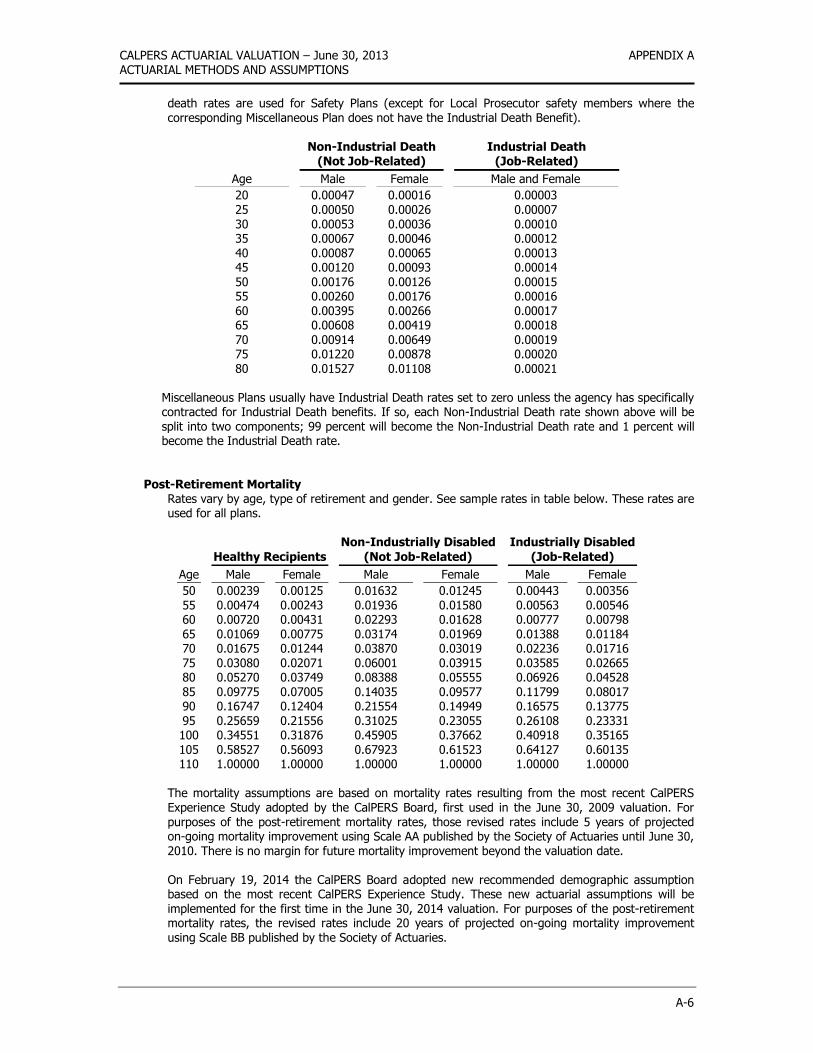
CALPERS ACTUARIAL VALUATION – June 30, 2013 APPENDIX A ACTUARIAL METHODS AND ASSUMPTIONS
A-6
death rates are used for Safety Plans (except for Local Prosecutor safety members where the
corresponding Miscellaneous Plan does not have the Industrial Death Benefit).
Non-Industrial Death Industrial Death (Not Job-Related) (Job-Related)
Age Male Female Male and Female
20 0.00047 0.00016 0.00003 25 0.00050 0.00026 0.00007 30 0.00053 0.00036 0.00010 35 0.00067 0.00046 0.00012 40 0.00087 0.00065 0.00013 45 0.00120 0.00093 0.00014 50 0.00176 0.00126 0.00015 55 0.00260 0.00176 0.00016 60 0.00395 0.00266 0.00017 65 0.00608 0.00419 0.00018
70 0.00914 0.00649 0.00019 75 0.01220 0.00878 0.00020 80 0.01527 0.01108 0.00021
Miscellaneous Plans usually have Industrial Death rates set to zero unless the agency has specifically contracted for Industrial Death benefits. If so, each Non-Industrial Death rate shown above will be split into two components; 99 percent will become the Non-Industrial Death rate and 1 percent will become the Industrial Death rate.
Post-Retirement Mortality Rates vary by age, type of retirement and gender. See sample rates in table below. These rates are used for all plans.
Healthy Recipients
Non-Industrially Disabled Industrially Disabled
(Not Job-Related) (Job-Related)
Age Male Female Male Female Male Female
50 0.00239 0.00125 0.01632 0.01245 0.00443 0.00356 55 0.00474 0.00243 0.01936 0.01580 0.00563 0.00546 60 0.00720 0.00431 0.02293 0.01628 0.00777 0.00798 65 0.01069 0.00775 0.03174 0.01969 0.01388 0.01184 70 0.01675 0.01244 0.03870 0.03019 0.02236 0.01716 75 0.03080 0.02071 0.06001 0.03915 0.03585 0.02665 80 0.05270 0.03749 0.08388 0.05555 0.06926 0.04528 85 0.09775 0.07005 0.14035 0.09577 0.11799 0.08017 90 0.16747 0.12404 0.21554 0.14949 0.16575 0.13775 95 0.25659 0.21556 0.31025 0.23055 0.26108 0.23331 100 0.34551 0.31876 0.45905 0.37662 0.40918 0.35165 105 0.58527 0.56093 0.67923 0.61523 0.64127 0.60135 110 1.00000 1.00000 1.00000 1.00000 1.00000 1.00000
The mortality assumptions are based on mortality rates resulting from the most recent CalPERS Experience Study adopted by the CalPERS Board, first used in the June 30, 2009 valuation. For purposes of the post-retirement mortality rates, those revised rates include 5 years of projected on-going mortality improvement using Scale AA published by the Society of Actuaries until June 30, 2010. There is no margin for future mortality improvement beyond the valuation date.
On February 19, 2014 the CalPERS Board adopted new recommended demographic assumption based on the most recent CalPERS Experience Study. These new actuarial assumptions will be implemented for the first time in the June 30, 2014 valuation. For purposes of the post-retirement mortality rates, the revised rates include 20 years of projected on-going mortality improvement using Scale BB published by the Society of Actuaries.
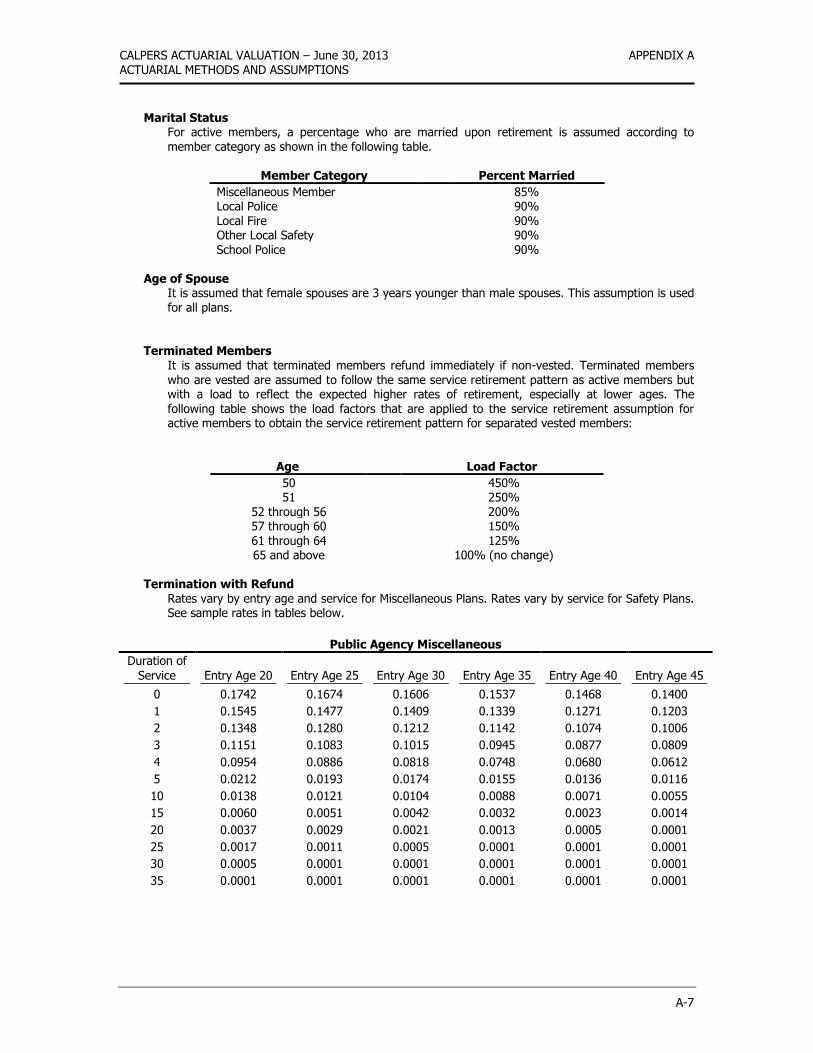
CALPERS ACTUARIAL VALUATION – June 30, 2013 APPENDIX A ACTUARIAL METHODS AND ASSUMPTIONS
A-7
Marital Status For active members, a percentage who are married upon retirement is assumed according to member category as shown in the following table.
Member Category Percent Married
Miscellaneous Member 85% Local Police 90% Local Fire 90% Other Local Safety 90% School Police 90%
Age of Spouse
It is assumed that female spouses are 3 years younger than male spouses. This assumption is used for all plans.
Terminated Members
It is assumed that terminated members refund immediately if non-vested. Terminated members who are vested are assumed to follow the same service retirement pattern as active members but with a load to reflect the expected higher rates of retirement, especially at lower ages. The following table shows the load factors that are applied to the service retirement assumption for active members to obtain the service retirement pattern for separated vested members:
Age Load Factor
50 450% 51 250%
52 through 56 200% 57 through 60 150% 61 through 64 125% 65 and above 100% (no change)
Termination with Refund
Rates vary by entry age and service for Miscellaneous Plans. Rates vary by service for Safety Plans. See sample rates in tables below.
Public Agency Miscellaneous
Duration of
Service Entry Age 20 Entry Age 25 Entry Age 30 Entry Age 35 Entry Age 40 Entry Age 45
0 0.1742 0.1674 0.1606 0.1537 0.1468 0.1400
1 0.1545 0.1477 0.1409 0.1339 0.1271 0.1203
2 0.1348 0.1280 0.1212 0.1142 0.1074 0.1006
3 0.1151 0.1083 0.1015 0.0945 0.0877 0.0809
4 0.0954 0.0886 0.0818 0.0748 0.0680 0.0612
5 0.0212 0.0193 0.0174 0.0155 0.0136 0.0116
10 0.0138 0.0121 0.0104 0.0088 0.0071 0.0055
15 0.0060 0.0051 0.0042 0.0032 0.0023 0.0014
20 0.0037 0.0029 0.0021 0.0013 0.0005 0.0001
25 0.0017 0.0011 0.0005 0.0001 0.0001 0.0001
30 0.0005 0.0001 0.0001 0.0001 0.0001 0.0001
35 0.0001 0.0001 0.0001 0.0001 0.0001 0.0001
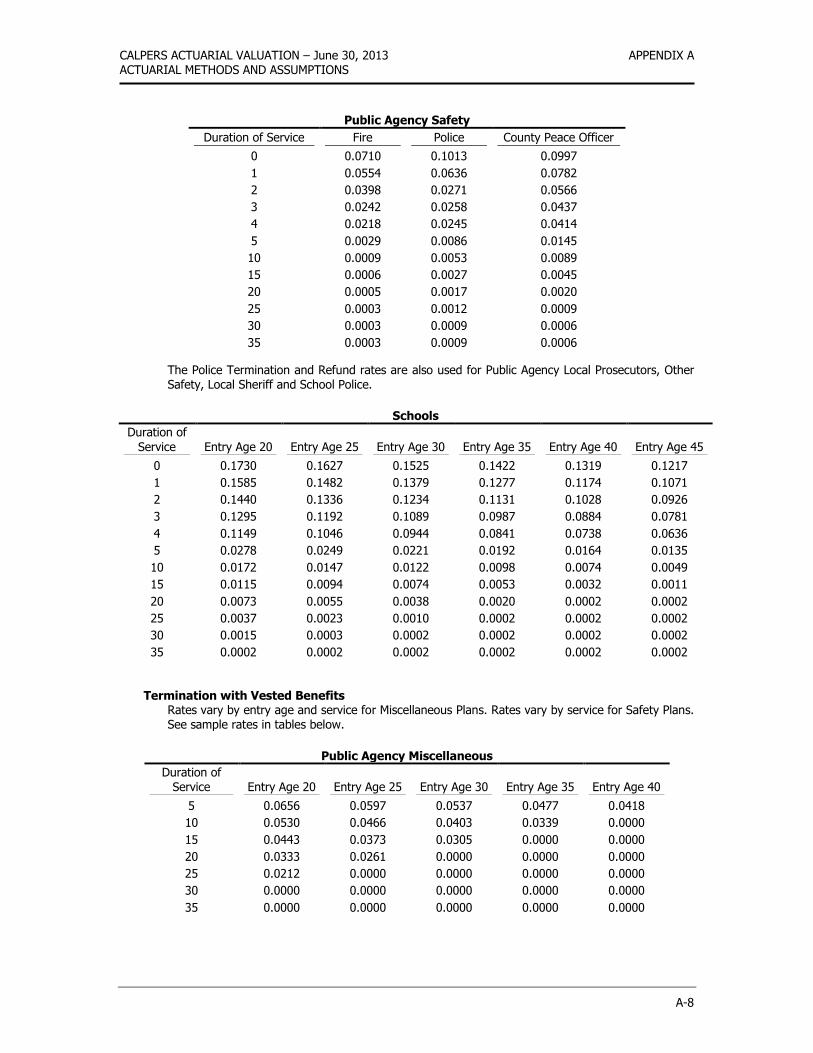
CALPERS ACTUARIAL VALUATION – June 30, 2013 APPENDIX A ACTUARIAL METHODS AND ASSUMPTIONS
A-8
Public Agency Safety
Duration of Service Fire Police County Peace Officer
0 0.0710 0.1013 0.0997
1 0.0554 0.0636 0.0782
2 0.0398 0.0271 0.0566
3 0.0242 0.0258 0.0437
4 0.0218 0.0245 0.0414
5 0.0029 0.0086 0.0145
10 0.0009 0.0053 0.0089
15 0.0006 0.0027 0.0045
20 0.0005 0.0017 0.0020
25 0.0003 0.0012 0.0009
30 0.0003 0.0009 0.0006
35 0.0003 0.0009 0.0006
The Police Termination and Refund rates are also used for Public Agency Local Prosecutors, Other Safety, Local Sheriff and School Police.
Schools
Duration of
Service Entry Age 20 Entry Age 25 Entry Age 30 Entry Age 35 Entry Age 40 Entry Age 45
0 0.1730 0.1627 0.1525 0.1422 0.1319 0.1217
1 0.1585 0.1482 0.1379 0.1277 0.1174 0.1071
2 0.1440 0.1336 0.1234 0.1131 0.1028 0.0926
3 0.1295 0.1192 0.1089 0.0987 0.0884 0.0781
4 0.1149 0.1046 0.0944 0.0841 0.0738 0.0636
5 0.0278 0.0249 0.0221 0.0192 0.0164 0.0135
10 0.0172 0.0147 0.0122 0.0098 0.0074 0.0049
15 0.0115 0.0094 0.0074 0.0053 0.0032 0.0011
20 0.0073 0.0055 0.0038 0.0020 0.0002 0.0002
25 0.0037 0.0023 0.0010 0.0002 0.0002 0.0002
30 0.0015 0.0003 0.0002 0.0002 0.0002 0.0002
35 0.0002 0.0002 0.0002 0.0002 0.0002 0.0002
Termination with Vested Benefits Rates vary by entry age and service for Miscellaneous Plans. Rates vary by service for Safety Plans. See sample rates in tables below.
Public Agency Miscellaneous
Duration of
Service Entry Age 20 Entry Age 25 Entry Age 30 Entry Age 35 Entry Age 40
5 0.0656 0.0597 0.0537 0.0477 0.0418
10 0.0530 0.0466 0.0403 0.0339 0.0000
15 0.0443 0.0373 0.0305 0.0000 0.0000
20 0.0333 0.0261 0.0000 0.0000 0.0000
25 0.0212 0.0000 0.0000 0.0000 0.0000
30 0.0000 0.0000 0.0000 0.0000 0.0000
35 0.0000 0.0000 0.0000 0.0000 0.0000
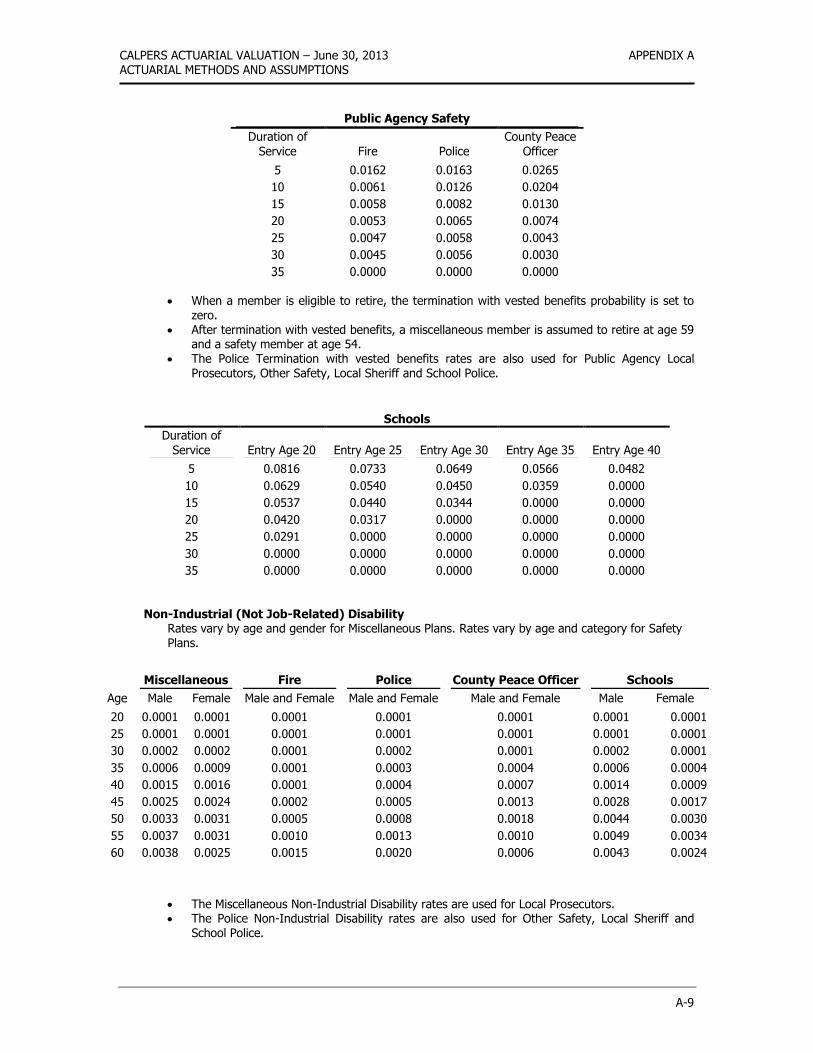
CALPERS ACTUARIAL VALUATION – June 30, 2013 APPENDIX A ACTUARIAL METHODS AND ASSUMPTIONS
A-9
Public Agency Safety
Duration of
Service Fire Police
County Peace
Officer
5 0.0162 0.0163 0.0265
10 0.0061 0.0126 0.0204
15 0.0058 0.0082 0.0130
20 0.0053 0.0065 0.0074
25 0.0047 0.0058 0.0043
30 0.0045 0.0056 0.0030
35 0.0000 0.0000 0.0000
When a member is eligible to retire, the termination with vested benefits probability is set to zero.
After termination with vested benefits, a miscellaneous member is assumed to retire at age 59 and a safety member at age 54.
The Police Termination with vested benefits rates are also used for Public Agency Local Prosecutors, Other Safety, Local Sheriff and School Police.
Schools
Duration of
Service Entry Age 20 Entry Age 25 Entry Age 30 Entry Age 35 Entry Age 40
5 0.0816 0.0733 0.0649 0.0566 0.0482
10 0.0629 0.0540 0.0450 0.0359 0.0000
15 0.0537 0.0440 0.0344 0.0000 0.0000
20 0.0420 0.0317 0.0000 0.0000 0.0000
25 0.0291 0.0000 0.0000 0.0000 0.0000
30 0.0000 0.0000 0.0000 0.0000 0.0000
35 0.0000 0.0000 0.0000 0.0000 0.0000
Non-Industrial (Not Job-Related) Disability
Rates vary by age and gender for Miscellaneous Plans. Rates vary by age and category for Safety Plans.
Miscellaneous Fire Police County Peace Officer Schools
Age Male Female Male and Female Male and Female Male and Female Male Female
20 0.0001 0.0001 0.0001 0.0001 0.0001 0.0001 0.0001
25 0.0001 0.0001 0.0001 0.0001 0.0001 0.0001 0.0001
30 0.0002 0.0002 0.0001 0.0002 0.0001 0.0002 0.0001
35 0.0006 0.0009 0.0001 0.0003 0.0004 0.0006 0.0004
40 0.0015 0.0016 0.0001 0.0004 0.0007 0.0014 0.0009
45 0.0025 0.0024 0.0002 0.0005 0.0013 0.0028 0.0017
50 0.0033 0.0031 0.0005 0.0008 0.0018 0.0044 0.0030
55 0.0037 0.0031 0.0010 0.0013 0.0010 0.0049 0.0034
60 0.0038 0.0025 0.0015 0.0020 0.0006 0.0043 0.0024
The Miscellaneous Non-Industrial Disability rates are used for Local Prosecutors. The Police Non-Industrial Disability rates are also used for Other Safety, Local Sheriff and
School Police.

CALPERS ACTUARIAL VALUATION – June 30, 2013 APPENDIX A ACTUARIAL METHODS AND ASSUMPTIONS
A-10
Industrial (Job-Related) Disability Rates vary by age and category.
Age Fire Police County Peace Officer
20 0.0002 0.0007 0.0003
25 0.0012 0.0032 0.0015
30 0.0025 0.0064 0.0031
35 0.0037 0.0097 0.0046
40 0.0049 0.0129 0.0063
45 0.0061 0.0161 0.0078
50 0.0074 0.0192 0.0101
55 0.0721 0.0668 0.0173
60 0.0721 0.0668 0.0173
The Police Industrial Disability rates are also used for Local Sheriff and Other Safety. Fifty Percent of the Police Industrial Disability rates are used for School Police. One Percent of the Police Industrial Disability rates are used for Local Prosecutors. Normally, rates are zero for Miscellaneous Plans unless the agency has specifically contracted
for Industrial Disability benefits. If so, each miscellaneous non-industrial disability rate will be split into two components: 50 percent will become the Non-Industrial Disability rate and 50 percent will become the Industrial Disability rate.
Service Retirement
Retirement rates vary by age, service, and formula, except for the safety ½ @ 55 and 2% @ 55 formulas, where retirement rates vary by age only.
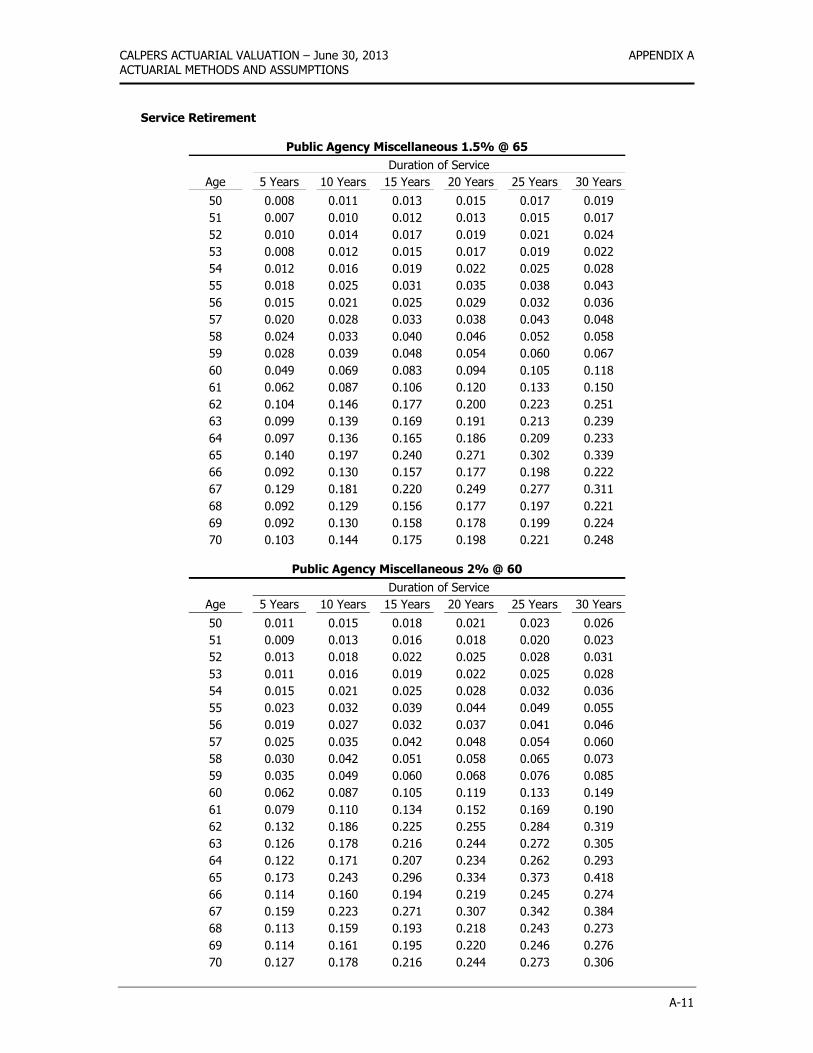
CALPERS ACTUARIAL VALUATION – June 30, 2013 APPENDIX A ACTUARIAL METHODS AND ASSUMPTIONS
A-11
Service Retirement
Public Agency Miscellaneous 1.5% @ 65
Duration of Service
Age 5 Years 10 Years 15 Years 20 Years 25 Years 30 Years
50 0.008 0.011 0.013 0.015 0.017 0.019
51 0.007 0.010 0.012 0.013 0.015 0.017
52 0.010 0.014 0.017 0.019 0.021 0.024
53 0.008 0.012 0.015 0.017 0.019 0.022
54 0.012 0.016 0.019 0.022 0.025 0.028
55 0.018 0.025 0.031 0.035 0.038 0.043
56 0.015 0.021 0.025 0.029 0.032 0.036
57 0.020 0.028 0.033 0.038 0.043 0.048
58 0.024 0.033 0.040 0.046 0.052 0.058
59 0.028 0.039 0.048 0.054 0.060 0.067
60 0.049 0.069 0.083 0.094 0.105 0.118
61 0.062 0.087 0.106 0.120 0.133 0.150
62 0.104 0.146 0.177 0.200 0.223 0.251
63 0.099 0.139 0.169 0.191 0.213 0.239
64 0.097 0.136 0.165 0.186 0.209 0.233
65 0.140 0.197 0.240 0.271 0.302 0.339
66 0.092 0.130 0.157 0.177 0.198 0.222
67 0.129 0.181 0.220 0.249 0.277 0.311
68 0.092 0.129 0.156 0.177 0.197 0.221
69 0.092 0.130 0.158 0.178 0.199 0.224
70 0.103 0.144 0.175 0.198 0.221 0.248
Public Agency Miscellaneous 2% @ 60
Duration of Service
Age 5 Years 10 Years 15 Years 20 Years 25 Years 30 Years
50 0.011 0.015 0.018 0.021 0.023 0.026
51 0.009 0.013 0.016 0.018 0.020 0.023
52 0.013 0.018 0.022 0.025 0.028 0.031
53 0.011 0.016 0.019 0.022 0.025 0.028
54 0.015 0.021 0.025 0.028 0.032 0.036
55 0.023 0.032 0.039 0.044 0.049 0.055
56 0.019 0.027 0.032 0.037 0.041 0.046
57 0.025 0.035 0.042 0.048 0.054 0.060
58 0.030 0.042 0.051 0.058 0.065 0.073
59 0.035 0.049 0.060 0.068 0.076 0.085
60 0.062 0.087 0.105 0.119 0.133 0.149
61 0.079 0.110 0.134 0.152 0.169 0.190
62 0.132 0.186 0.225 0.255 0.284 0.319
63 0.126 0.178 0.216 0.244 0.272 0.305
64 0.122 0.171 0.207 0.234 0.262 0.293
65 0.173 0.243 0.296 0.334 0.373 0.418
66 0.114 0.160 0.194 0.219 0.245 0.274
67 0.159 0.223 0.271 0.307 0.342 0.384
68 0.113 0.159 0.193 0.218 0.243 0.273
69 0.114 0.161 0.195 0.220 0.246 0.276
70 0.127 0.178 0.216 0.244 0.273 0.306
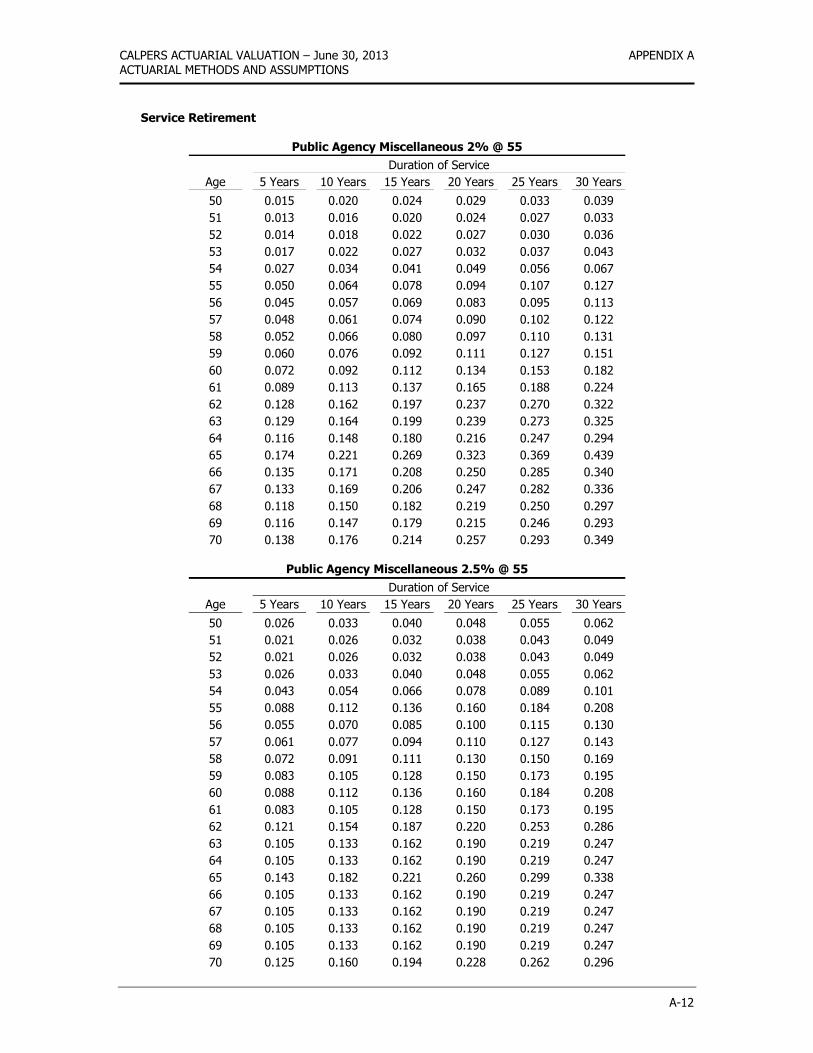
CALPERS ACTUARIAL VALUATION – June 30, 2013 APPENDIX A ACTUARIAL METHODS AND ASSUMPTIONS
A-12
Service Retirement
Public Agency Miscellaneous 2% @ 55
Duration of Service
Age 5 Years 10 Years 15 Years 20 Years 25 Years 30 Years
50 0.015 0.020 0.024 0.029 0.033 0.039
51 0.013 0.016 0.020 0.024 0.027 0.033
52 0.014 0.018 0.022 0.027 0.030 0.036
53 0.017 0.022 0.027 0.032 0.037 0.043
54 0.027 0.034 0.041 0.049 0.056 0.067
55 0.050 0.064 0.078 0.094 0.107 0.127
56 0.045 0.057 0.069 0.083 0.095 0.113
57 0.048 0.061 0.074 0.090 0.102 0.122
58 0.052 0.066 0.080 0.097 0.110 0.131
59 0.060 0.076 0.092 0.111 0.127 0.151
60 0.072 0.092 0.112 0.134 0.153 0.182
61 0.089 0.113 0.137 0.165 0.188 0.224
62 0.128 0.162 0.197 0.237 0.270 0.322
63 0.129 0.164 0.199 0.239 0.273 0.325
64 0.116 0.148 0.180 0.216 0.247 0.294
65 0.174 0.221 0.269 0.323 0.369 0.439
66 0.135 0.171 0.208 0.250 0.285 0.340
67 0.133 0.169 0.206 0.247 0.282 0.336
68 0.118 0.150 0.182 0.219 0.250 0.297
69 0.116 0.147 0.179 0.215 0.246 0.293
70 0.138 0.176 0.214 0.257 0.293 0.349
Public Agency Miscellaneous 2.5% @ 55
Duration of Service
Age 5 Years 10 Years 15 Years 20 Years 25 Years 30 Years
50 0.026 0.033 0.040 0.048 0.055 0.062
51 0.021 0.026 0.032 0.038 0.043 0.049
52 0.021 0.026 0.032 0.038 0.043 0.049
53 0.026 0.033 0.040 0.048 0.055 0.062
54 0.043 0.054 0.066 0.078 0.089 0.101
55 0.088 0.112 0.136 0.160 0.184 0.208
56 0.055 0.070 0.085 0.100 0.115 0.130
57 0.061 0.077 0.094 0.110 0.127 0.143
58 0.072 0.091 0.111 0.130 0.150 0.169
59 0.083 0.105 0.128 0.150 0.173 0.195
60 0.088 0.112 0.136 0.160 0.184 0.208
61 0.083 0.105 0.128 0.150 0.173 0.195
62 0.121 0.154 0.187 0.220 0.253 0.286
63 0.105 0.133 0.162 0.190 0.219 0.247
64 0.105 0.133 0.162 0.190 0.219 0.247
65 0.143 0.182 0.221 0.260 0.299 0.338
66 0.105 0.133 0.162 0.190 0.219 0.247
67 0.105 0.133 0.162 0.190 0.219 0.247
68 0.105 0.133 0.162 0.190 0.219 0.247
69 0.105 0.133 0.162 0.190 0.219 0.247
70 0.125 0.160 0.194 0.228 0.262 0.296
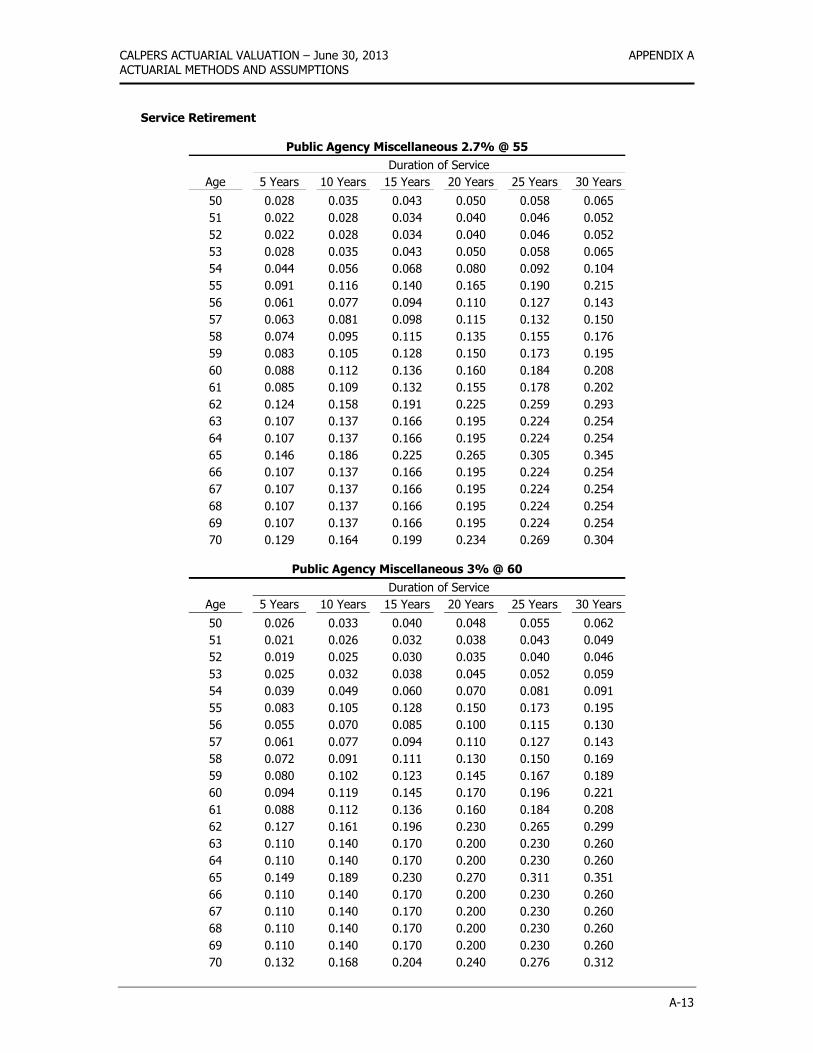
CALPERS ACTUARIAL VALUATION – June 30, 2013 APPENDIX A ACTUARIAL METHODS AND ASSUMPTIONS
A-13
Service Retirement
Public Agency Miscellaneous 2.7% @ 55
Duration of Service
Age 5 Years 10 Years 15 Years 20 Years 25 Years 30 Years
50 0.028 0.035 0.043 0.050 0.058 0.065
51 0.022 0.028 0.034 0.040 0.046 0.052
52 0.022 0.028 0.034 0.040 0.046 0.052
53 0.028 0.035 0.043 0.050 0.058 0.065
54 0.044 0.056 0.068 0.080 0.092 0.104
55 0.091 0.116 0.140 0.165 0.190 0.215
56 0.061 0.077 0.094 0.110 0.127 0.143
57 0.063 0.081 0.098 0.115 0.132 0.150
58 0.074 0.095 0.115 0.135 0.155 0.176
59 0.083 0.105 0.128 0.150 0.173 0.195
60 0.088 0.112 0.136 0.160 0.184 0.208
61 0.085 0.109 0.132 0.155 0.178 0.202
62 0.124 0.158 0.191 0.225 0.259 0.293
63 0.107 0.137 0.166 0.195 0.224 0.254
64 0.107 0.137 0.166 0.195 0.224 0.254
65 0.146 0.186 0.225 0.265 0.305 0.345
66 0.107 0.137 0.166 0.195 0.224 0.254
67 0.107 0.137 0.166 0.195 0.224 0.254
68 0.107 0.137 0.166 0.195 0.224 0.254
69 0.107 0.137 0.166 0.195 0.224 0.254
70 0.129 0.164 0.199 0.234 0.269 0.304
Public Agency Miscellaneous 3% @ 60
Duration of Service
Age 5 Years 10 Years 15 Years 20 Years 25 Years 30 Years
50 0.026 0.033 0.040 0.048 0.055 0.062
51 0.021 0.026 0.032 0.038 0.043 0.049
52 0.019 0.025 0.030 0.035 0.040 0.046
53 0.025 0.032 0.038 0.045 0.052 0.059
54 0.039 0.049 0.060 0.070 0.081 0.091
55 0.083 0.105 0.128 0.150 0.173 0.195
56 0.055 0.070 0.085 0.100 0.115 0.130
57 0.061 0.077 0.094 0.110 0.127 0.143
58 0.072 0.091 0.111 0.130 0.150 0.169
59 0.080 0.102 0.123 0.145 0.167 0.189
60 0.094 0.119 0.145 0.170 0.196 0.221
61 0.088 0.112 0.136 0.160 0.184 0.208
62 0.127 0.161 0.196 0.230 0.265 0.299
63 0.110 0.140 0.170 0.200 0.230 0.260
64 0.110 0.140 0.170 0.200 0.230 0.260
65 0.149 0.189 0.230 0.270 0.311 0.351
66 0.110 0.140 0.170 0.200 0.230 0.260
67 0.110 0.140 0.170 0.200 0.230 0.260
68 0.110 0.140 0.170 0.200 0.230 0.260
69 0.110 0.140 0.170 0.200 0.230 0.260
70 0.132 0.168 0.204 0.240 0.276 0.312
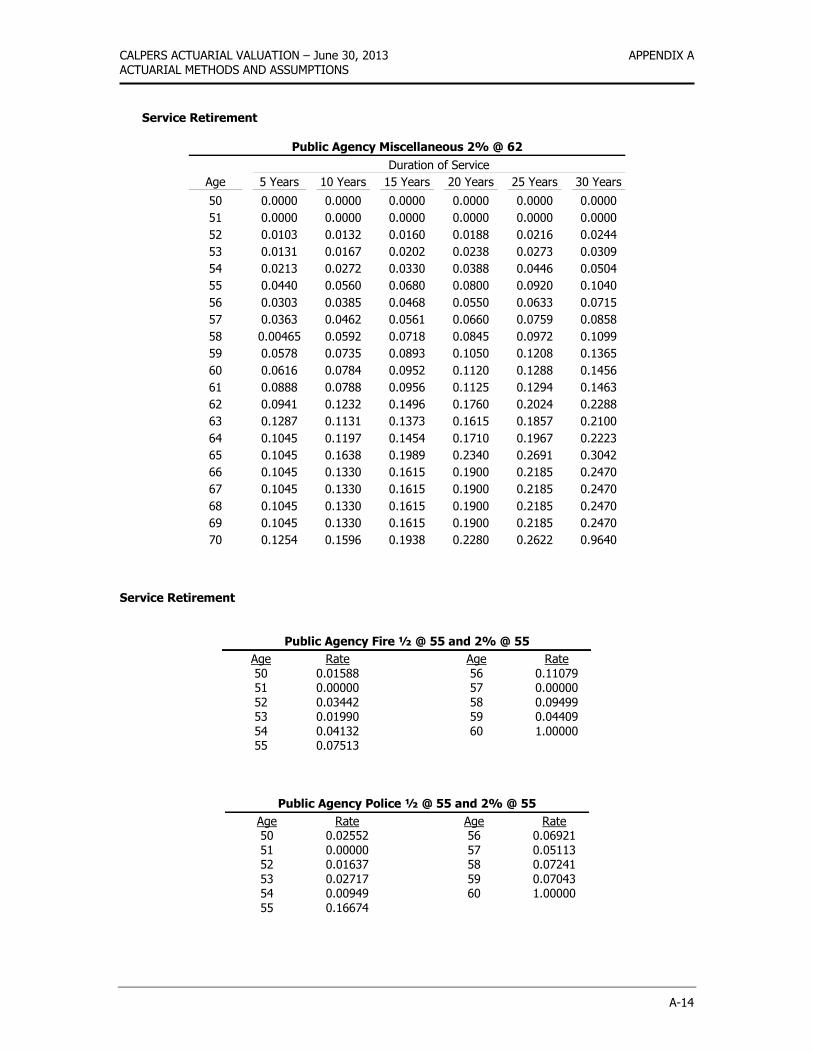
CALPERS ACTUARIAL VALUATION – June 30, 2013 APPENDIX A ACTUARIAL METHODS AND ASSUMPTIONS
A-14
Service Retirement
Public Agency Miscellaneous 2% @ 62
Duration of Service
Age 5 Years 10 Years 15 Years 20 Years 25 Years 30 Years
50 0.0000 0.0000 0.0000 0.0000 0.0000 0.0000
51 0.0000 0.0000 0.0000 0.0000 0.0000 0.0000
52 0.0103 0.0132 0.0160 0.0188 0.0216 0.0244
53 0.0131 0.0167 0.0202 0.0238 0.0273 0.0309
54 0.0213 0.0272 0.0330 0.0388 0.0446 0.0504
55 0.0440 0.0560 0.0680 0.0800 0.0920 0.1040
56 0.0303 0.0385 0.0468 0.0550 0.0633 0.0715
57 0.0363 0.0462 0.0561 0.0660 0.0759 0.0858
58 0.00465 0.0592 0.0718 0.0845 0.0972 0.1099
59 0.0578 0.0735 0.0893 0.1050 0.1208 0.1365
60 0.0616 0.0784 0.0952 0.1120 0.1288 0.1456
61 0.0888 0.0788 0.0956 0.1125 0.1294 0.1463
62 0.0941 0.1232 0.1496 0.1760 0.2024 0.2288
63 0.1287 0.1131 0.1373 0.1615 0.1857 0.2100
64 0.1045 0.1197 0.1454 0.1710 0.1967 0.2223
65 0.1045 0.1638 0.1989 0.2340 0.2691 0.3042
66 0.1045 0.1330 0.1615 0.1900 0.2185 0.2470
67 0.1045 0.1330 0.1615 0.1900 0.2185 0.2470
68 0.1045 0.1330 0.1615 0.1900 0.2185 0.2470
69 0.1045 0.1330 0.1615 0.1900 0.2185 0.2470
70 0.1254 0.1596 0.1938 0.2280 0.2622 0.9640
Service Retirement
Public Agency Fire ½ @ 55 and 2% @ 55
Age 50 51 52 53 54 55
Rate 0.01588 0.00000 0.03442 0.01990 0.04132 0.07513
Age 56 57 58 59 60
Rate 0.11079 0.00000 0.09499 0.04409 1.00000
Public Agency Police ½ @ 55 and 2% @ 55
Age 50 51 52 53 54 55
Rate 0.02552 0.00000 0.01637 0.02717 0.00949 0.16674
Age 56 57 58 59 60
Rate 0.06921 0.05113 0.07241 0.07043 1.00000
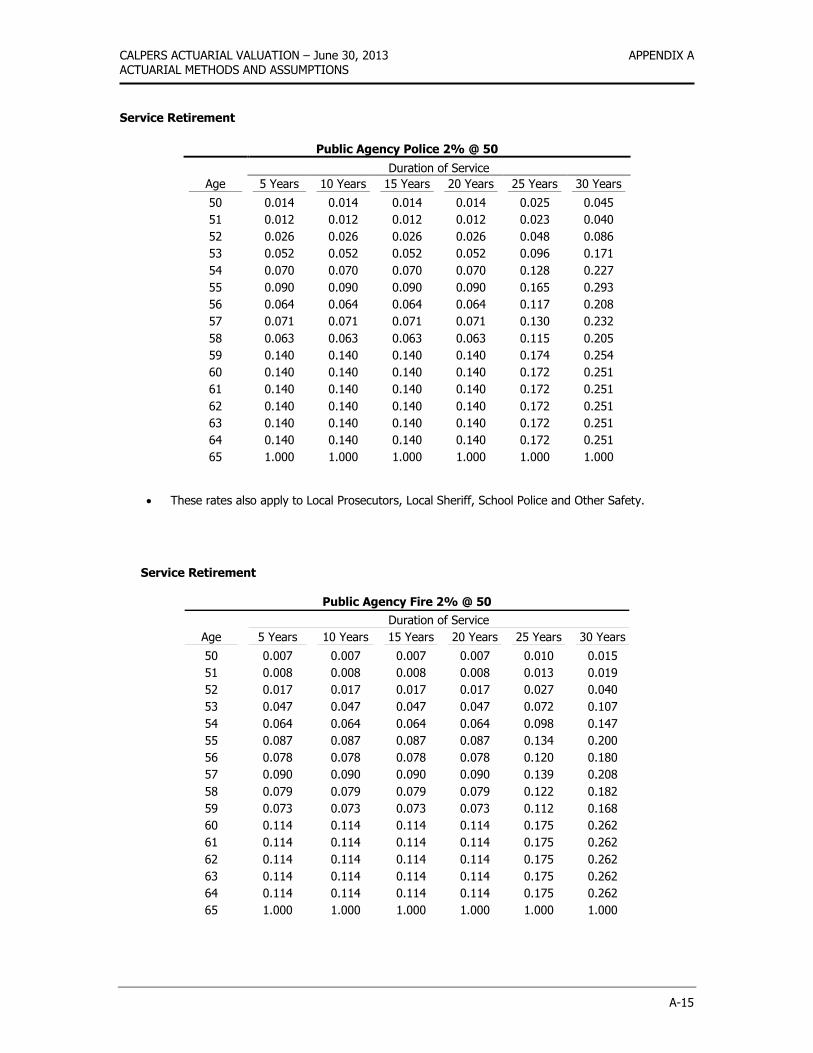
CALPERS ACTUARIAL VALUATION – June 30, 2013 APPENDIX A ACTUARIAL METHODS AND ASSUMPTIONS
A-15
Service Retirement
Public Agency Police 2% @ 50
Duration of Service
Age 5 Years 10 Years 15 Years 20 Years 25 Years 30 Years
50 0.014 0.014 0.014 0.014 0.025 0.045
51 0.012 0.012 0.012 0.012 0.023 0.040
52 0.026 0.026 0.026 0.026 0.048 0.086
53 0.052 0.052 0.052 0.052 0.096 0.171
54 0.070 0.070 0.070 0.070 0.128 0.227
55 0.090 0.090 0.090 0.090 0.165 0.293
56 0.064 0.064 0.064 0.064 0.117 0.208
57 0.071 0.071 0.071 0.071 0.130 0.232
58 0.063 0.063 0.063 0.063 0.115 0.205
59 0.140 0.140 0.140 0.140 0.174 0.254
60 0.140 0.140 0.140 0.140 0.172 0.251
61 0.140 0.140 0.140 0.140 0.172 0.251
62 0.140 0.140 0.140 0.140 0.172 0.251
63 0.140 0.140 0.140 0.140 0.172 0.251
64 0.140 0.140 0.140 0.140 0.172 0.251
65 1.000 1.000 1.000 1.000 1.000 1.000
These rates also apply to Local Prosecutors, Local Sheriff, School Police and Other Safety.
Service Retirement
Public Agency Fire 2% @ 50
Duration of Service
Age 5 Years 10 Years 15 Years 20 Years 25 Years 30 Years
50 0.007 0.007 0.007 0.007 0.010 0.015
51 0.008 0.008 0.008 0.008 0.013 0.019
52 0.017 0.017 0.017 0.017 0.027 0.040
53 0.047 0.047 0.047 0.047 0.072 0.107
54 0.064 0.064 0.064 0.064 0.098 0.147
55 0.087 0.087 0.087 0.087 0.134 0.200
56 0.078 0.078 0.078 0.078 0.120 0.180
57 0.090 0.090 0.090 0.090 0.139 0.208
58 0.079 0.079 0.079 0.079 0.122 0.182
59 0.073 0.073 0.073 0.073 0.112 0.168
60 0.114 0.114 0.114 0.114 0.175 0.262
61 0.114 0.114 0.114 0.114 0.175 0.262
62 0.114 0.114 0.114 0.114 0.175 0.262
63 0.114 0.114 0.114 0.114 0.175 0.262
64 0.114 0.114 0.114 0.114 0.175 0.262
65 1.000 1.000 1.000 1.000 1.000 1.000
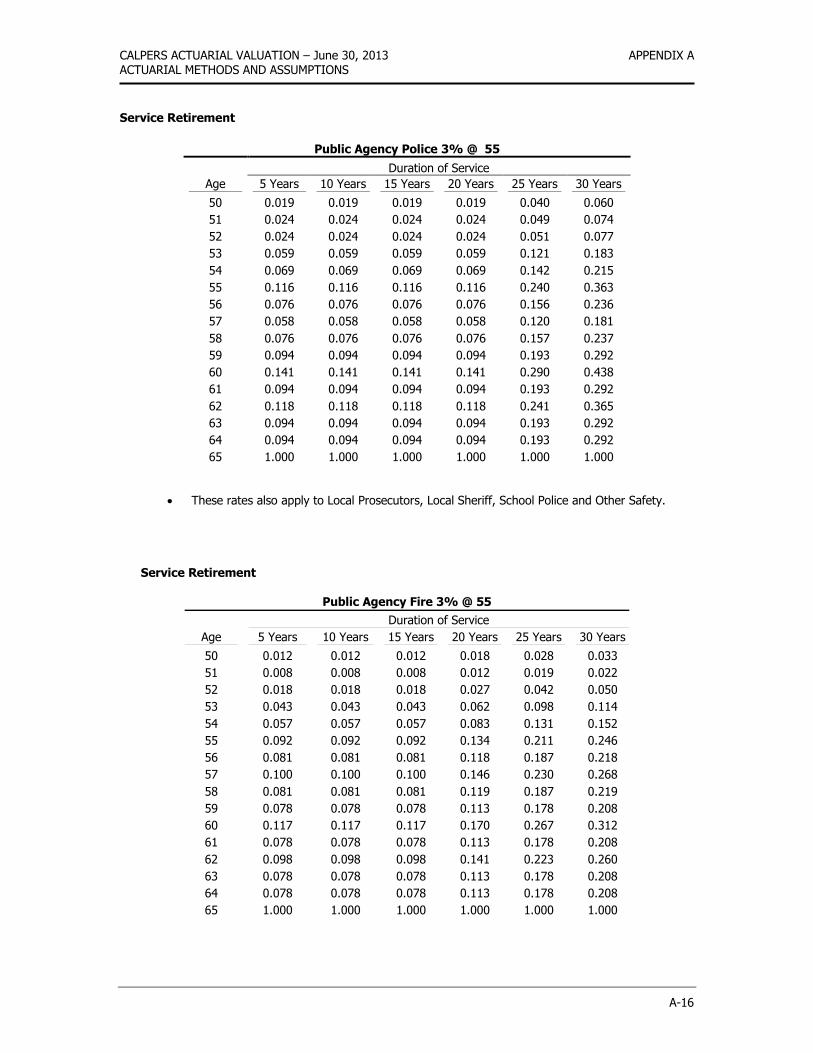
CALPERS ACTUARIAL VALUATION – June 30, 2013 APPENDIX A ACTUARIAL METHODS AND ASSUMPTIONS
A-16
Service Retirement
Public Agency Police 3% @ 55
Duration of Service
Age 5 Years 10 Years 15 Years 20 Years 25 Years 30 Years
50 0.019 0.019 0.019 0.019 0.040 0.060
51 0.024 0.024 0.024 0.024 0.049 0.074
52 0.024 0.024 0.024 0.024 0.051 0.077
53 0.059 0.059 0.059 0.059 0.121 0.183
54 0.069 0.069 0.069 0.069 0.142 0.215
55 0.116 0.116 0.116 0.116 0.240 0.363
56 0.076 0.076 0.076 0.076 0.156 0.236
57 0.058 0.058 0.058 0.058 0.120 0.181
58 0.076 0.076 0.076 0.076 0.157 0.237
59 0.094 0.094 0.094 0.094 0.193 0.292
60 0.141 0.141 0.141 0.141 0.290 0.438
61 0.094 0.094 0.094 0.094 0.193 0.292
62 0.118 0.118 0.118 0.118 0.241 0.365
63 0.094 0.094 0.094 0.094 0.193 0.292
64 0.094 0.094 0.094 0.094 0.193 0.292
65 1.000 1.000 1.000 1.000 1.000 1.000
These rates also apply to Local Prosecutors, Local Sheriff, School Police and Other Safety.
Service Retirement
Public Agency Fire 3% @ 55
Duration of Service
Age 5 Years 10 Years 15 Years 20 Years 25 Years 30 Years
50 0.012 0.012 0.012 0.018 0.028 0.033
51 0.008 0.008 0.008 0.012 0.019 0.022
52 0.018 0.018 0.018 0.027 0.042 0.050
53 0.043 0.043 0.043 0.062 0.098 0.114
54 0.057 0.057 0.057 0.083 0.131 0.152
55 0.092 0.092 0.092 0.134 0.211 0.246
56 0.081 0.081 0.081 0.118 0.187 0.218
57 0.100 0.100 0.100 0.146 0.230 0.268
58 0.081 0.081 0.081 0.119 0.187 0.219
59 0.078 0.078 0.078 0.113 0.178 0.208
60 0.117 0.117 0.117 0.170 0.267 0.312
61 0.078 0.078 0.078 0.113 0.178 0.208
62 0.098 0.098 0.098 0.141 0.223 0.260
63 0.078 0.078 0.078 0.113 0.178 0.208
64 0.078 0.078 0.078 0.113 0.178 0.208
65 1.000 1.000 1.000 1.000 1.000 1.000
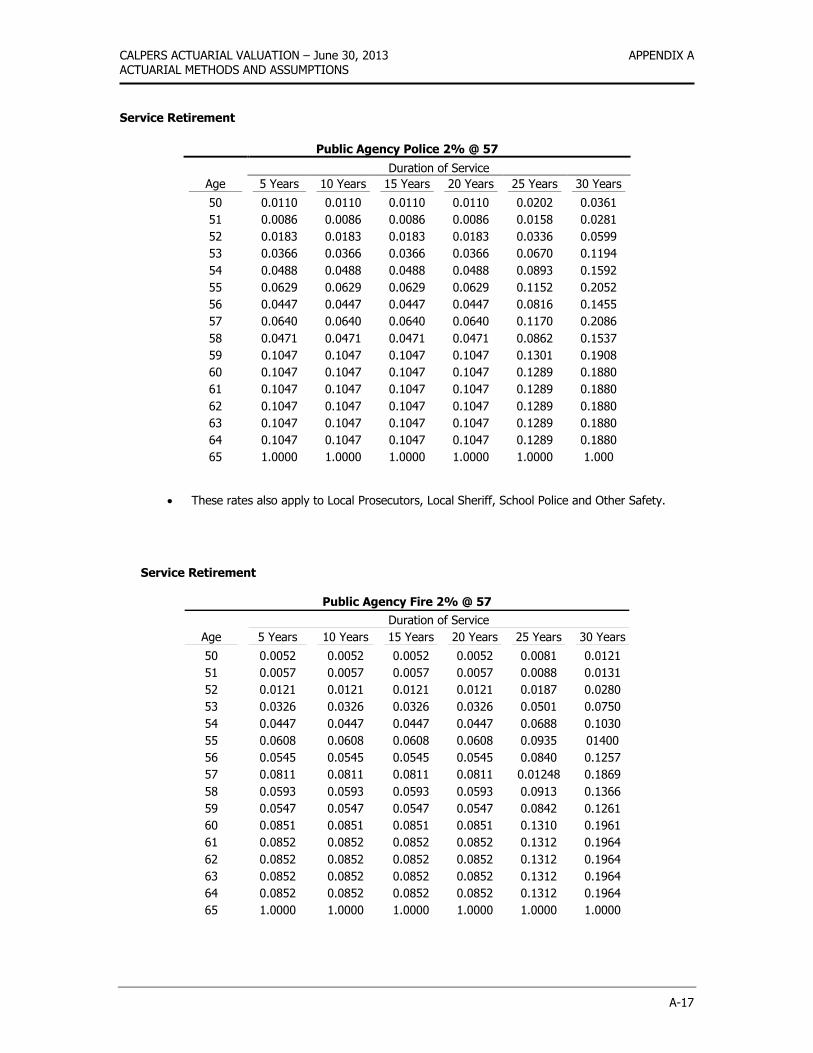
CALPERS ACTUARIAL VALUATION – June 30, 2013 APPENDIX A ACTUARIAL METHODS AND ASSUMPTIONS
A-17
Service Retirement
Public Agency Police 2% @ 57
Duration of Service
Age 5 Years 10 Years 15 Years 20 Years 25 Years 30 Years
50 0.0110 0.0110 0.0110 0.0110 0.0202 0.0361
51 0.0086 0.0086 0.0086 0.0086 0.0158 0.0281
52 0.0183 0.0183 0.0183 0.0183 0.0336 0.0599
53 0.0366 0.0366 0.0366 0.0366 0.0670 0.1194
54 0.0488 0.0488 0.0488 0.0488 0.0893 0.1592
55 0.0629 0.0629 0.0629 0.0629 0.1152 0.2052
56 0.0447 0.0447 0.0447 0.0447 0.0816 0.1455
57 0.0640 0.0640 0.0640 0.0640 0.1170 0.2086
58 0.0471 0.0471 0.0471 0.0471 0.0862 0.1537
59 0.1047 0.1047 0.1047 0.1047 0.1301 0.1908
60 0.1047 0.1047 0.1047 0.1047 0.1289 0.1880
61 0.1047 0.1047 0.1047 0.1047 0.1289 0.1880
62 0.1047 0.1047 0.1047 0.1047 0.1289 0.1880
63 0.1047 0.1047 0.1047 0.1047 0.1289 0.1880
64 0.1047 0.1047 0.1047 0.1047 0.1289 0.1880
65 1.0000 1.0000 1.0000 1.0000 1.0000 1.000
These rates also apply to Local Prosecutors, Local Sheriff, School Police and Other Safety.
Service Retirement
Public Agency Fire 2% @ 57
Duration of Service
Age 5 Years 10 Years 15 Years 20 Years 25 Years 30 Years
50 0.0052 0.0052 0.0052 0.0052 0.0081 0.0121
51 0.0057 0.0057 0.0057 0.0057 0.0088 0.0131
52 0.0121 0.0121 0.0121 0.0121 0.0187 0.0280
53 0.0326 0.0326 0.0326 0.0326 0.0501 0.0750
54 0.0447 0.0447 0.0447 0.0447 0.0688 0.1030
55 0.0608 0.0608 0.0608 0.0608 0.0935 01400
56 0.0545 0.0545 0.0545 0.0545 0.0840 0.1257
57 0.0811 0.0811 0.0811 0.0811 0.01248 0.1869
58 0.0593 0.0593 0.0593 0.0593 0.0913 0.1366
59 0.0547 0.0547 0.0547 0.0547 0.0842 0.1261
60 0.0851 0.0851 0.0851 0.0851 0.1310 0.1961
61 0.0852 0.0852 0.0852 0.0852 0.1312 0.1964
62 0.0852 0.0852 0.0852 0.0852 0.1312 0.1964
63 0.0852 0.0852 0.0852 0.0852 0.1312 0.1964
64 0.0852 0.0852 0.0852 0.0852 0.1312 0.1964
65 1.0000 1.0000 1.0000 1.0000 1.0000 1.0000
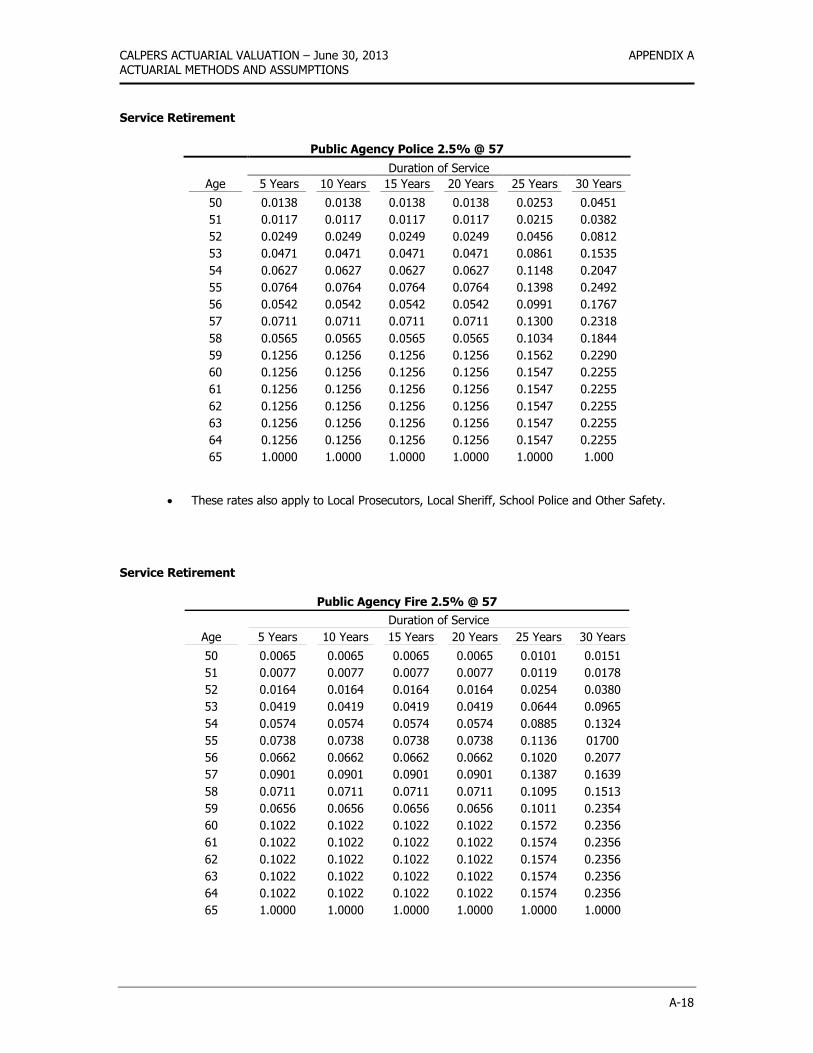
CALPERS ACTUARIAL VALUATION – June 30, 2013 APPENDIX A ACTUARIAL METHODS AND ASSUMPTIONS
A-18
Service Retirement
Public Agency Police 2.5% @ 57
Duration of Service
Age 5 Years 10 Years 15 Years 20 Years 25 Years 30 Years
50 0.0138 0.0138 0.0138 0.0138 0.0253 0.0451
51 0.0117 0.0117 0.0117 0.0117 0.0215 0.0382
52 0.0249 0.0249 0.0249 0.0249 0.0456 0.0812
53 0.0471 0.0471 0.0471 0.0471 0.0861 0.1535
54 0.0627 0.0627 0.0627 0.0627 0.1148 0.2047
55 0.0764 0.0764 0.0764 0.0764 0.1398 0.2492
56 0.0542 0.0542 0.0542 0.0542 0.0991 0.1767
57 0.0711 0.0711 0.0711 0.0711 0.1300 0.2318
58 0.0565 0.0565 0.0565 0.0565 0.1034 0.1844
59 0.1256 0.1256 0.1256 0.1256 0.1562 0.2290
60 0.1256 0.1256 0.1256 0.1256 0.1547 0.2255
61 0.1256 0.1256 0.1256 0.1256 0.1547 0.2255
62 0.1256 0.1256 0.1256 0.1256 0.1547 0.2255
63 0.1256 0.1256 0.1256 0.1256 0.1547 0.2255
64 0.1256 0.1256 0.1256 0.1256 0.1547 0.2255
65 1.0000 1.0000 1.0000 1.0000 1.0000 1.000
These rates also apply to Local Prosecutors, Local Sheriff, School Police and Other Safety.
Service Retirement
Public Agency Fire 2.5% @ 57
Duration of Service
Age 5 Years 10 Years 15 Years 20 Years 25 Years 30 Years
50 0.0065 0.0065 0.0065 0.0065 0.0101 0.0151
51 0.0077 0.0077 0.0077 0.0077 0.0119 0.0178
52 0.0164 0.0164 0.0164 0.0164 0.0254 0.0380
53 0.0419 0.0419 0.0419 0.0419 0.0644 0.0965
54 0.0574 0.0574 0.0574 0.0574 0.0885 0.1324
55 0.0738 0.0738 0.0738 0.0738 0.1136 01700
56 0.0662 0.0662 0.0662 0.0662 0.1020 0.2077
57 0.0901 0.0901 0.0901 0.0901 0.1387 0.1639
58 0.0711 0.0711 0.0711 0.0711 0.1095 0.1513
59 0.0656 0.0656 0.0656 0.0656 0.1011 0.2354
60 0.1022 0.1022 0.1022 0.1022 0.1572 0.2356
61 0.1022 0.1022 0.1022 0.1022 0.1574 0.2356
62 0.1022 0.1022 0.1022 0.1022 0.1574 0.2356
63 0.1022 0.1022 0.1022 0.1022 0.1574 0.2356
64 0.1022 0.1022 0.1022 0.1022 0.1574 0.2356
65 1.0000 1.0000 1.0000 1.0000 1.0000 1.0000
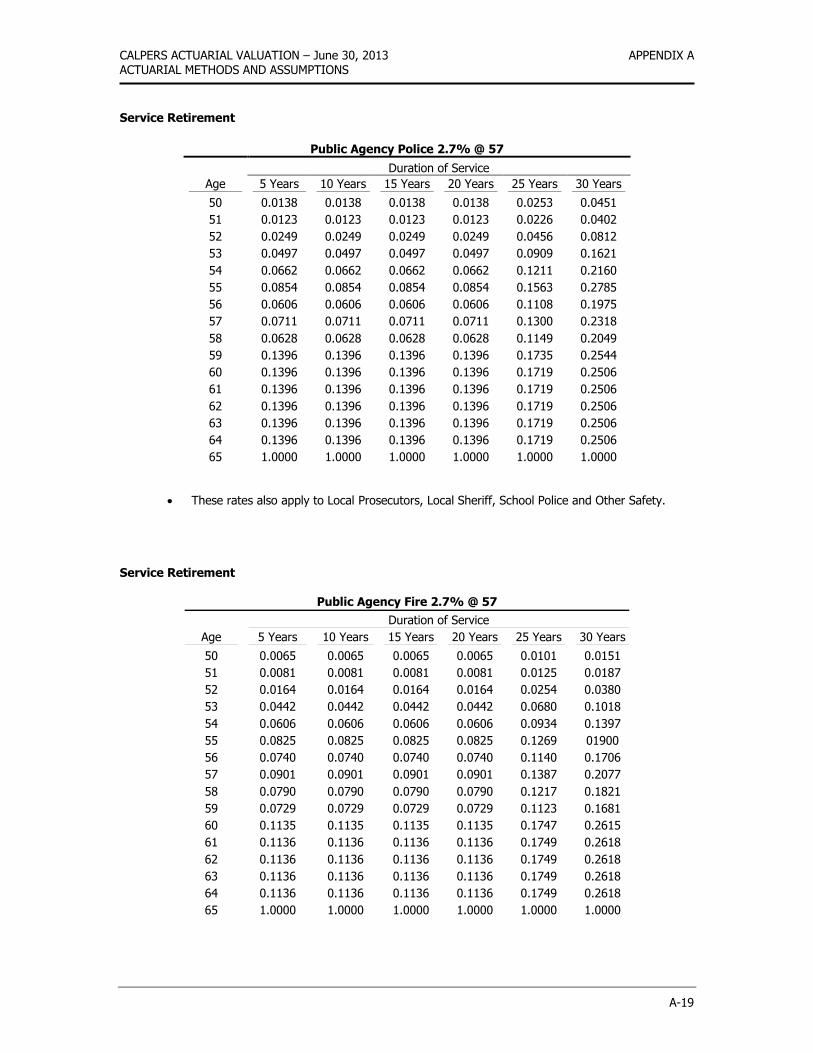
CALPERS ACTUARIAL VALUATION – June 30, 2013 APPENDIX A ACTUARIAL METHODS AND ASSUMPTIONS
A-19
Service Retirement
Public Agency Police 2.7% @ 57
Duration of Service
Age 5 Years 10 Years 15 Years 20 Years 25 Years 30 Years
50 0.0138 0.0138 0.0138 0.0138 0.0253 0.0451
51 0.0123 0.0123 0.0123 0.0123 0.0226 0.0402
52 0.0249 0.0249 0.0249 0.0249 0.0456 0.0812
53 0.0497 0.0497 0.0497 0.0497 0.0909 0.1621
54 0.0662 0.0662 0.0662 0.0662 0.1211 0.2160
55 0.0854 0.0854 0.0854 0.0854 0.1563 0.2785
56 0.0606 0.0606 0.0606 0.0606 0.1108 0.1975
57 0.0711 0.0711 0.0711 0.0711 0.1300 0.2318
58 0.0628 0.0628 0.0628 0.0628 0.1149 0.2049
59 0.1396 0.1396 0.1396 0.1396 0.1735 0.2544
60 0.1396 0.1396 0.1396 0.1396 0.1719 0.2506
61 0.1396 0.1396 0.1396 0.1396 0.1719 0.2506
62 0.1396 0.1396 0.1396 0.1396 0.1719 0.2506
63 0.1396 0.1396 0.1396 0.1396 0.1719 0.2506
64 0.1396 0.1396 0.1396 0.1396 0.1719 0.2506
65 1.0000 1.0000 1.0000 1.0000 1.0000 1.0000
These rates also apply to Local Prosecutors, Local Sheriff, School Police and Other Safety.
Service Retirement
Public Agency Fire 2.7% @ 57
Duration of Service
Age 5 Years 10 Years 15 Years 20 Years 25 Years 30 Years
50 0.0065 0.0065 0.0065 0.0065 0.0101 0.0151
51 0.0081 0.0081 0.0081 0.0081 0.0125 0.0187
52 0.0164 0.0164 0.0164 0.0164 0.0254 0.0380
53 0.0442 0.0442 0.0442 0.0442 0.0680 0.1018
54 0.0606 0.0606 0.0606 0.0606 0.0934 0.1397
55 0.0825 0.0825 0.0825 0.0825 0.1269 01900
56 0.0740 0.0740 0.0740 0.0740 0.1140 0.1706
57 0.0901 0.0901 0.0901 0.0901 0.1387 0.2077
58 0.0790 0.0790 0.0790 0.0790 0.1217 0.1821
59 0.0729 0.0729 0.0729 0.0729 0.1123 0.1681
60 0.1135 0.1135 0.1135 0.1135 0.1747 0.2615
61 0.1136 0.1136 0.1136 0.1136 0.1749 0.2618
62 0.1136 0.1136 0.1136 0.1136 0.1749 0.2618
63 0.1136 0.1136 0.1136 0.1136 0.1749 0.2618
64 0.1136 0.1136 0.1136 0.1136 0.1749 0.2618
65 1.0000 1.0000 1.0000 1.0000 1.0000 1.0000
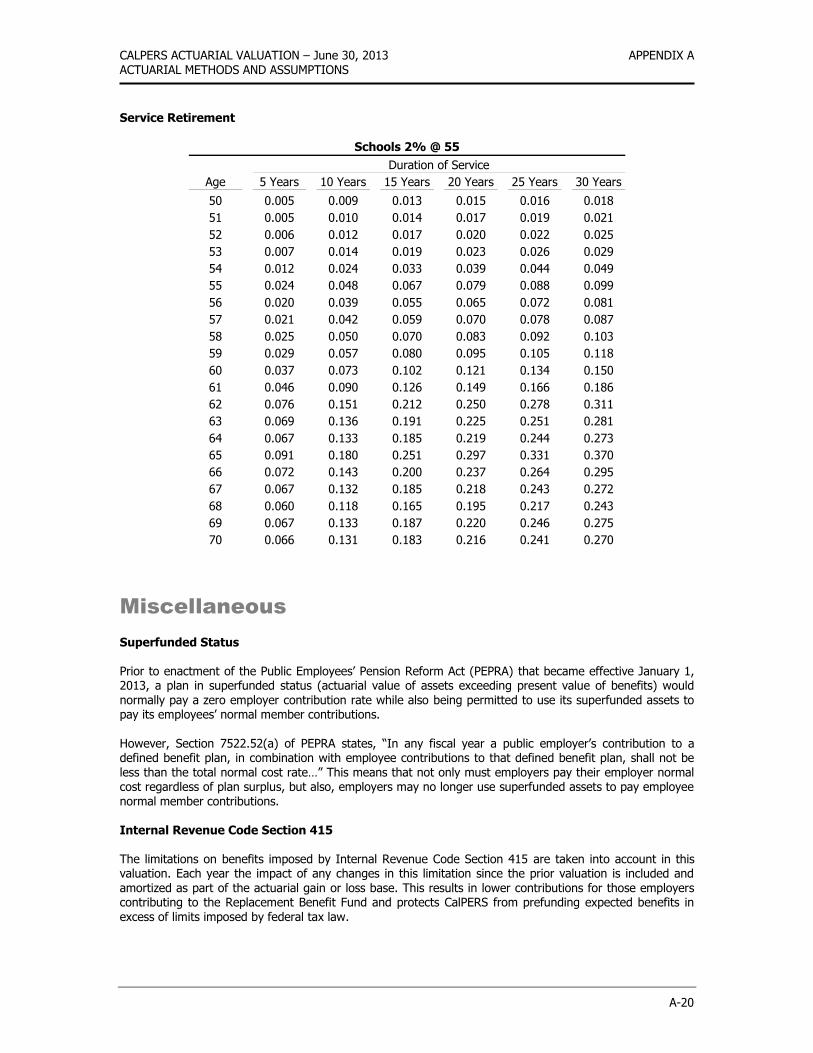
CALPERS ACTUARIAL VALUATION – June 30, 2013 APPENDIX A ACTUARIAL METHODS AND ASSUMPTIONS
A-20
Service Retirement
Schools 2% @ 55
Duration of Service
Age 5 Years 10 Years 15 Years 20 Years 25 Years 30 Years
50 0.005 0.009 0.013 0.015 0.016 0.018
51 0.005 0.010 0.014 0.017 0.019 0.021
52 0.006 0.012 0.017 0.020 0.022 0.025
53 0.007 0.014 0.019 0.023 0.026 0.029
54 0.012 0.024 0.033 0.039 0.044 0.049
55 0.024 0.048 0.067 0.079 0.088 0.099
56 0.020 0.039 0.055 0.065 0.072 0.081
57 0.021 0.042 0.059 0.070 0.078 0.087
58 0.025 0.050 0.070 0.083 0.092 0.103
59 0.029 0.057 0.080 0.095 0.105 0.118
60 0.037 0.073 0.102 0.121 0.134 0.150
61 0.046 0.090 0.126 0.149 0.166 0.186
62 0.076 0.151 0.212 0.250 0.278 0.311
63 0.069 0.136 0.191 0.225 0.251 0.281
64 0.067 0.133 0.185 0.219 0.244 0.273
65 0.091 0.180 0.251 0.297 0.331 0.370
66 0.072 0.143 0.200 0.237 0.264 0.295
67 0.067 0.132 0.185 0.218 0.243 0.272
68 0.060 0.118 0.165 0.195 0.217 0.243
69 0.067 0.133 0.187 0.220 0.246 0.275
70 0.066 0.131 0.183 0.216 0.241 0.270
Miscellaneous
Superfunded Status Prior to enactment of the Public Employees’ Pension Reform Act (PEPRA) that became effective January 1, 2013, a plan in superfunded status (actuarial value of assets exceeding present value of benefits) would normally pay a zero employer contribution rate while also being permitted to use its superfunded assets to pay its employees’ normal member contributions. However, Section 7522.52(a) of PEPRA states, “In any fiscal year a public employer’s contribution to a defined benefit plan, in combination with employee contributions to that defined benefit plan, shall not be less than the total normal cost rate…” This means that not only must employers pay their employer normal cost regardless of plan surplus, but also, employers may no longer use superfunded assets to pay employee normal member contributions. Internal Revenue Code Section 415 The limitations on benefits imposed by Internal Revenue Code Section 415 are taken into account in this valuation. Each year the impact of any changes in this limitation since the prior valuation is included and amortized as part of the actuarial gain or loss base. This results in lower contributions for those employers contributing to the Replacement Benefit Fund and protects CalPERS from prefunding expected benefits in excess of limits imposed by federal tax law.
CALPERS ACTUARIAL VALUATION – June 30, 2013 APPENDIX A ACTUARIAL METHODS AND ASSUMPTIONS
A-21
Internal Revenue Code Section 401(a)(17) The limitations on compensation imposed by Internal Revenue Code Section 401(a)(17) are taken into account in this valuation. Each year, the impact of any changes in the compensation limitation since the prior valuation is included and amortized as part of the actuarial gain or loss base. PEPRA Assumptions The Public Employees’ Pension Reform Act of 2013 (PEPRA) mandated new benefit formulas and new member contributions for new members (as defined by PEPRA) hired after January 1, 2013. For non-pooled plans, these new members will first be reflected in the June 30, 2013 non-pooled plan valuations. New members in pooled plans will first be reflected in the new Miscellaneous and Safety risk pools created by the CalPERS Board in November 2012 in response to the passage of PEPRA, also beginning with the June 30, 2013 valuation. Different assumptions for these new PEPRA members are disclosed above.

THIS PAGE
INTENTIONALLY
LEFT BLANK

APPENDIX B
PRINCIPAL PLAN PROVISIONS

THIS PAGE
INTENTIONALLY
LEFT BLANK
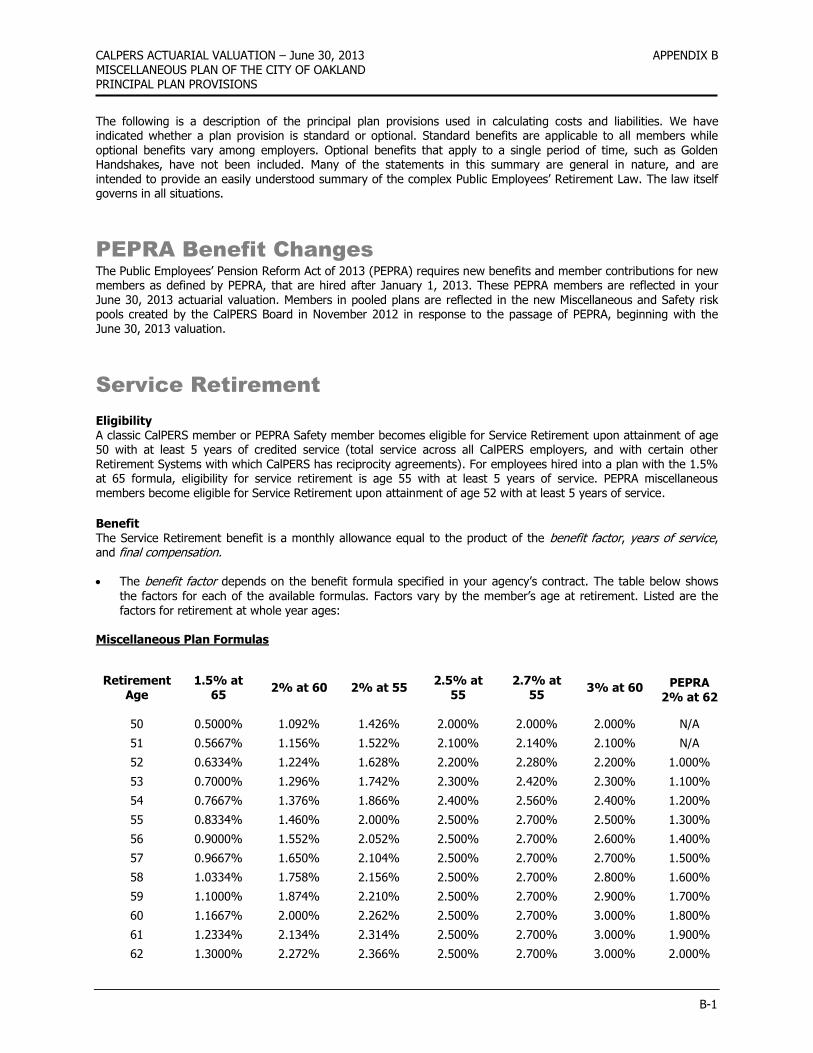
CALPERS ACTUARIAL VALUATION – June 30, 2013 APPENDIX B MISCELLANEOUS PLAN OF THE CITY OF OAKLAND PRINCIPAL PLAN PROVISIONS
B-1
The following is a description of the principal plan provisions used in calculating costs and liabilities. We have indicated whether a plan provision is standard or optional. Standard benefits are applicable to all members while optional benefits vary among employers. Optional benefits that apply to a single period of time, such as Golden Handshakes, have not been included. Many of the statements in this summary are general in nature, and are intended to provide an easily understood summary of the complex Public Employees’ Retirement Law. The law itself governs in all situations.
PEPRA Benefit Changes
The Public Employees’ Pension Reform Act of 2013 (PEPRA) requires new benefits and member contributions for new members as defined by PEPRA, that are hired after January 1, 2013. These PEPRA members are reflected in your June 30, 2013 actuarial valuation. Members in pooled plans are reflected in the new Miscellaneous and Safety risk pools created by the CalPERS Board in November 2012 in response to the passage of PEPRA, beginning with the June 30, 2013 valuation.
Service Retirement
Eligibility A classic CalPERS member or PEPRA Safety member becomes eligible for Service Retirement upon attainment of age 50 with at least 5 years of credited service (total service across all CalPERS employers, and with certain other Retirement Systems with which CalPERS has reciprocity agreements). For employees hired into a plan with the 1.5% at 65 formula, eligibility for service retirement is age 55 with at least 5 years of service. PEPRA miscellaneous members become eligible for Service Retirement upon attainment of age 52 with at least 5 years of service.
Benefit The Service Retirement benefit is a monthly allowance equal to the product of the benefit factor, years of service, and final compensation. The benefit factor depends on the benefit formula specified in your agency’s contract. The table below shows
the factors for each of the available formulas. Factors vary by the member’s age at retirement. Listed are the factors for retirement at whole year ages:
Miscellaneous Plan Formulas
Retirement Age
1.5% at 65
2% at 60 2% at 55 2.5% at
55 2.7% at
55 3% at 60
PEPRA
2% at 62
50 0.5000% 1.092% 1.426% 2.000% 2.000% 2.000% N/A
51 0.5667% 1.156% 1.522% 2.100% 2.140% 2.100% N/A
52 0.6334% 1.224% 1.628% 2.200% 2.280% 2.200% 1.000%
53 0.7000% 1.296% 1.742% 2.300% 2.420% 2.300% 1.100%
54 0.7667% 1.376% 1.866% 2.400% 2.560% 2.400% 1.200%
55 0.8334% 1.460% 2.000% 2.500% 2.700% 2.500% 1.300%
56 0.9000% 1.552% 2.052% 2.500% 2.700% 2.600% 1.400%
57 0.9667% 1.650% 2.104% 2.500% 2.700% 2.700% 1.500%
58 1.0334% 1.758% 2.156% 2.500% 2.700% 2.800% 1.600%
59 1.1000% 1.874% 2.210% 2.500% 2.700% 2.900% 1.700%
60 1.1667% 2.000% 2.262% 2.500% 2.700% 3.000% 1.800%
61 1.2334% 2.134% 2.314% 2.500% 2.700% 3.000% 1.900%
62 1.3000% 2.272% 2.366% 2.500% 2.700% 3.000% 2.000%
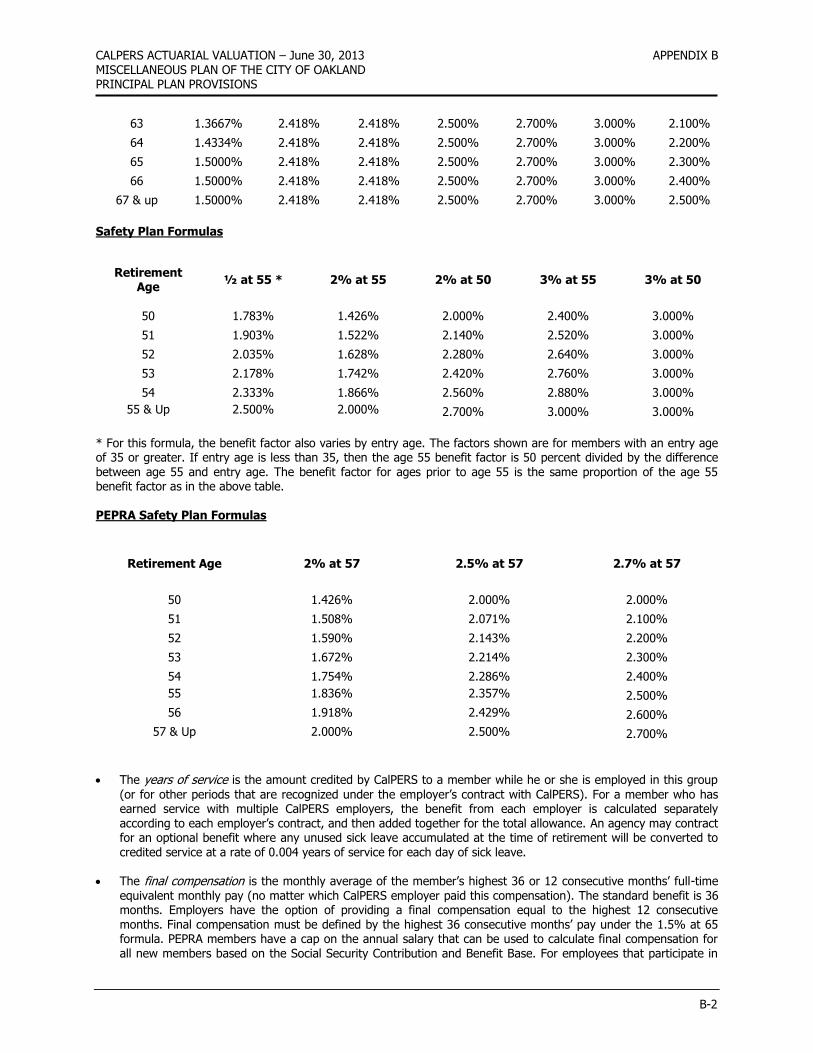
CALPERS ACTUARIAL VALUATION – June 30, 2013 APPENDIX B MISCELLANEOUS PLAN OF THE CITY OF OAKLAND PRINCIPAL PLAN PROVISIONS
B-2
63 1.3667% 2.418% 2.418% 2.500% 2.700% 3.000% 2.100%
64 1.4334% 2.418% 2.418% 2.500% 2.700% 3.000% 2.200%
65 1.5000% 2.418% 2.418% 2.500% 2.700% 3.000% 2.300%
66 1.5000% 2.418% 2.418% 2.500% 2.700% 3.000% 2.400%
67 & up 1.5000% 2.418% 2.418% 2.500% 2.700% 3.000% 2.500%
Safety Plan Formulas
Retirement Age
½ at 55 * 2% at 55 2% at 50 3% at 55 3% at 50
50 1.783% 1.426% 2.000% 2.400% 3.000%
51 1.903% 1.522% 2.140% 2.520% 3.000%
52 2.035% 1.628% 2.280% 2.640% 3.000%
53 2.178% 1.742% 2.420% 2.760% 3.000%
54 2.333% 1.866% 2.560% 2.880% 3.000%
55 & Up 2.500% 2.000% 2.700% 3.000% 3.000%
* For this formula, the benefit factor also varies by entry age. The factors shown are for members with an entry age of 35 or greater. If entry age is less than 35, then the age 55 benefit factor is 50 percent divided by the difference between age 55 and entry age. The benefit factor for ages prior to age 55 is the same proportion of the age 55 benefit factor as in the above table. PEPRA Safety Plan Formulas
Retirement Age 2% at 57 2.5% at 57 2.7% at 57
50 1.426% 2.000% 2.000%
51 1.508% 2.071% 2.100%
52 1.590% 2.143% 2.200%
53 1.672% 2.214% 2.300%
54 1.754% 2.286% 2.400%
55 1.836% 2.357% 2.500%
56 1.918% 2.429% 2.600%
57 & Up 2.000% 2.500% 2.700%
The years of service is the amount credited by CalPERS to a member while he or she is employed in this group
(or for other periods that are recognized under the employer’s contract with CalPERS). For a member who has earned service with multiple CalPERS employers, the benefit from each employer is calculated separately according to each employer’s contract, and then added together for the total allowance. An agency may contract for an optional benefit where any unused sick leave accumulated at the time of retirement will be converted to credited service at a rate of 0.004 years of service for each day of sick leave.
The final compensation is the monthly average of the member’s highest 36 or 12 consecutive months’ full-time
equivalent monthly pay (no matter which CalPERS employer paid this compensation). The standard benefit is 36 months. Employers have the option of providing a final compensation equal to the highest 12 consecutive months. Final compensation must be defined by the highest 36 consecutive months’ pay under the 1.5% at 65 formula. PEPRA members have a cap on the annual salary that can be used to calculate final compensation for all new members based on the Social Security Contribution and Benefit Base. For employees that participate in
CALPERS ACTUARIAL VALUATION – June 30, 2013 APPENDIX B MISCELLANEOUS PLAN OF THE CITY OF OAKLAND PRINCIPAL PLAN PROVISIONS
B-3
Social Security this cap is $113,700 for 2013 and for those employees that do not participate in social security the cap for 2013 is $136,440, the equivalent of 120 percent of the 2013 Contribution and Benefit Base. Adjustments to the caps are permitted annually based on changes to the CPI for All Urban Consumers.
Employees must be covered by Social Security with the 1.5% at 65 formula. Social Security is optional for all
other benefit formulas. For employees covered by Social Security, the Modified formula is the standard benefit. Under this type of formula, the final compensation is offset by $133.33 (or by one third if the final compensation is less than $400). Employers may contract for the Full benefit with Social Security that will eliminate the offset applicable to the final compensation. For employees not covered by Social Security, the Full benefit is paid with no offsets. Auxiliary organizations of the CSUC system may elect reduced contribution rates, in which case the offset is $317 if members are not covered by Social Security or $513 if members are covered by Social Security.
The Miscellaneous Service Retirement benefit is not capped. The Safety Service Retirement benefit is capped at
90 percent of final compensation.
Vested Deferred Retirement
Eligibility for Deferred Status A CalPERS member becomes eligible for a deferred vested retirement benefit when he or she leaves employment, keeps his or her contribution account balance on deposit with CalPERS, and has earned at least 5 years of credited service (total service across all CalPERS employers, and with certain other Retirement Systems with which CalPERS has reciprocity agreements). Eligibility to Start Receiving Benefits The CalPERS classic members and Safety PEPRA members become eligible to receive the deferred retirement benefit upon satisfying the eligibility requirements for Deferred Status and upon attainment of age 50 (55 for employees hired into a 1.5% @ 65 plan). PEPRA Miscellaneous members become eligible to receive the deferred retirement benefit upon satisfying the eligibility requirements for Deferred Status and upon attainment of age 52. Benefit The vested deferred retirement benefit is the same as the Service Retirement benefit, where the benefit factor is based on the member’s age at allowance commencement. For members who have earned service with multiple CalPERS employers, the benefit from each employer is calculated separately according to each employer’s contract, and then added together for the total allowance.
Non-Industrial (Non-Job Related) Disability Retirement
Eligibility A CalPERS member is eligible for Non-Industrial Disability Retirement if he or she becomes disabled and has at least 5 years of credited service (total service across all CalPERS employers, and with certain other Retirement Systems with which CalPERS has reciprocity agreements). There is no special age requirement. Disabled means the member is unable to perform his or her job because of an illness or injury, which is expected to be permanent or to last
indefinitely. The illness or injury does not have to be job related. A CalPERS member must be actively employed by any CalPERS employer at the time of disability in order to be eligible for this benefit. Standard Benefit The standard Non-Industrial Disability Retirement benefit is a monthly allowance equal to 1.8 percent of final compensation, multiplied by service, which is determined as follows: Service is CalPERS credited service, for members with less than 10 years of service or greater than 18.518 years
of service; or Service is CalPERS credited service plus the additional number of years that the member would have worked
until age 60, for members with at least 10 years but not more than 18.518 years of service. The maximum benefit in this case is 33 1/3 percent of Final Compensation.
CALPERS ACTUARIAL VALUATION – June 30, 2013 APPENDIX B MISCELLANEOUS PLAN OF THE CITY OF OAKLAND PRINCIPAL PLAN PROVISIONS
B-4
Improved Benefit Employers have the option of providing the improved Non-Industrial Disability Retirement benefit. This benefit provides a monthly allowance equal to 30 percent of final compensation for the first 5 years of service, plus 1 percent for each additional year of service to a maximum of 50 percent of final compensation. Members who are eligible for a larger service retirement benefit may choose to receive that benefit in lieu of a disability benefit. Members eligible to retire, and who have attained the normal retirement age determined by their service retirement benefit formula, will receive the same dollar amount for disability retirement as that payable for service retirement. For members who have earned service with multiple CalPERS employers, the benefit attributed to each employer is the total disability allowance multiplied by the ratio of service with a particular employer to the total CalPERS service.
Industrial (Job Related) Disability Retirement
All safety members have this benefit. For miscellaneous members, employers have the option of providing this benefit. An employer may choose to provide the Increased benefit option or the Improved benefit option. Eligibility An employee is eligible for Industrial Disability Retirement if he or she becomes disabled while working, where disabled means the member is unable to perform the duties of the job because of a work-related illness or injury, which is, expected to be permanent or to last indefinitely. A CalPERS member who has left active employment within this group is not eligible for this benefit, except to the extent described below. Standard Benefit The standard Industrial Disability Retirement benefit is a monthly allowance equal to 50 percent of final compensation. Increased Benefit (75 percent of Final Compensation)
The increased Industrial Disability Retirement benefit is a monthly allowance equal to 75 percent final compensation for total disability. Improved Benefit (50 percent to 90 percent of Final Compensation) The improved Industrial Disability Retirement benefit is a monthly allowance equal to the Workman’s Compensation Appeals Board permanent disability rate percentage (if 50 percent or greater, with a maximum of 90 percent) times the final compensation. For a CalPERS member not actively employed in this group who became disabled while employed by some other CalPERS employer, the benefit is a return of accumulated member contributions with respect to employment in this group. With the standard or increased benefit, a member may also choose to receive the annuitization of the accumulated member contributions. If a member is eligible for Service Retirement and if the Service Retirement benefit is more than the Industrial Disability Retirement benefit, the member may choose to receive the larger benefit.
Post-Retirement Death Benefit
Standard Lump Sum Payment Upon the death of a retiree, a one-time lump sum payment of $500 will be made to the retiree’s designated survivor(s), or to the retiree’s estate.
Improved Lump Sum Payment Employers have the option of providing an improved lump sum death benefit of $600, $2,000, $3,000, $4,000 or $5,000.
CALPERS ACTUARIAL VALUATION – June 30, 2013 APPENDIX B MISCELLANEOUS PLAN OF THE CITY OF OAKLAND PRINCIPAL PLAN PROVISIONS
B-5
Form of Payment for Retirement Allowance
Standard Form of Payment Generally, the retirement allowance is paid to the retiree in the form of an annuity for as long as he or she is alive. The retiree may choose to provide for a portion of his or her allowance to be paid to any designated beneficiary after the retiree’s death. CalPERS provides for a variety of such benefit options, which the retiree pays for by taking a reduction in his or her retirement allowance. Such reduction takes into account the amount to be provided to the beneficiary and the probable duration of payments (based on the ages of the member and beneficiary) made subsequent to the member’s death.
Improved Form of Payment (Post Retirement Survivor Allowance) Employers have the option to contract for the post retirement survivor allowance.
For retirement allowances with respect to service subject to the modified formula, 25 percent of the retirement allowance will automatically be continued to certain statutory beneficiaries upon the death of the retiree, without a reduction in the retiree’s allowance. For retirement allowances with respect to service subject to the full or supplemental formula, 50 percent of the retirement allowance will automatically be continued to certain statutory beneficiaries upon the death of the retiree, without a reduction in the retiree’s allowance. This additional benefit is often referred to as post retirement survivor allowance (PRSA) or simply as survivor continuance.
In other words, 25 percent or 50 percent of the allowance, the continuance portion, is paid to the retiree for as long as he or she is alive, and that same amount is continued to the retiree’s spouse (or if no eligible spouse, to unmarried children until they attain age 18; or, if no eligible children, to a qualifying dependent parent) for the rest of his or her lifetime. This benefit will not be discontinued in the event the spouse remarries. The remaining 75 percent or 50 percent of the retirement allowance, which may be referred to as the option portion of the benefit, is paid to the retiree as an annuity for as long as he or she is alive. Or, the retiree may choose to provide for some of this option portion to be paid to any designated beneficiary after the retiree’s death. Benefit options applicable to the option portion are the same as those offered with the standard form. The reduction is calculated in the same manner but is applied only to the option portion.
Pre-Retirement Death Benefits
Basic Death Benefit
This is a standard benefit. Eligibility An employee’s beneficiary (or estate) may receive the Basic Death benefit if the member dies while actively employed. A CalPERS member must be actively employed with the CalPERS employer providing this benefit to be eligible for this benefit. A member’s survivor who is eligible for any other pre-retirement death benefit may choose to receive that death benefit instead of this Basic Death benefit.
Benefit The Basic Death Benefit is a lump sum in the amount of the member’s accumulated contributions, where interest is currently credited at 7.5 percent per year, plus a lump sum in the amount of one month's salary for each completed year of current service, up to a maximum of six months' salary. For purposes of this benefit, one month's salary is defined as the member's average monthly full-time rate of compensation during the 12 months preceding death.
1957 Survivor Benefit
This is a standard benefit.
CALPERS ACTUARIAL VALUATION – June 30, 2013 APPENDIX B MISCELLANEOUS PLAN OF THE CITY OF OAKLAND PRINCIPAL PLAN PROVISIONS
B-6
Eligibility An employee’s eligible survivor(s) may receive the 1957 Survivor benefit if the member dies while actively employed, has attained at least age 50 for Classic and Safety PEPRA members and age 52 for Miscellaneous PEPRA members, and has at least 5 years of credited service (total service across all CalPERS employers and with certain other Retirement Systems with which CalPERS has reciprocity agreements). A CalPERS member must be actively employed with the CalPERS employer providing this benefit to be eligible for this benefit. An eligible survivor means the surviving spouse to whom the member was married at least one year before death or, if there is no eligible spouse, to the member's unmarried children under age 18. A member’s survivor who is eligible for any other pre-retirement death benefit may choose to receive that death benefit instead of this 1957 Survivor benefit. Benefit The 1957 Survivor benefit is a monthly allowance equal to one-half of the unmodified Service Retirement benefit that the member would have been entitled to receive if the member had retired on the date of his or her death. If the benefit is payable to the spouse, the benefit is discontinued upon the death of the spouse. If the benefit is payable to a dependent child, the benefit will be discontinued upon death or attainment of age 18, unless the child is disabled. The total amount paid will be at least equal to the Basic Death benefit.
Optional Settlement 2W Death Benefit
This is an optional benefit. Eligibility An employee’s eligible survivor may receive the Optional Settlement 2W Death benefit if the member dies while actively employed, has attained at least age 50 for Classic and Safety PEPRA members and age 52 for Miscellaneous PEPRA members, and has at least 5 years of credited service (total service across all CalPERS employers and with certain other Retirement Systems with which CalPERS has reciprocity agreements). A CalPERS member who is no longer actively employed with any CalPERS employer is not eligible for this benefit. An eligible survivor means the surviving spouse to whom the member was married at least one year before death. A member’s survivor who is
eligible for any other pre-retirement death benefit may choose to receive that death benefit instead of this Optional Settlement 2W Death benefit.
Benefit The Optional Settlement 2W Death benefit is a monthly allowance equal to the Service Retirement benefit that the member would have received had the member retired on the date of his or her death and elected Optional Settlement 2W. (A retiree who elects Optional Settlement 2W receives an allowance that has been reduced so that it will continue to be paid after his or her death to a surviving beneficiary.) The allowance is payable as long as the surviving spouse lives, at which time it is continued to any unmarried children under age 18, if applicable. The total amount paid will be at least equal to the Basic Death Benefit.
Special Death Benefit
This is a standard benefit for safety members. An employer may elect to provide this benefit for miscellaneous
members. Eligibility An employee’s eligible survivor(s) may receive the Special Death benefit if the member dies while actively employed and the death is job-related. A CalPERS member who is no longer actively employed with any CalPERS employer is not eligible for this benefit. An eligible survivor means the surviving spouse to whom the member was married prior to the onset of the injury or illness that resulted in death. If there is no eligible spouse, an eligible survivor means the member's unmarried children under age 22. An eligible survivor who chooses to receive this benefit will not receive any other death benefit.
Benefit The Special Death benefit is a monthly allowance equal to 50 percent of final compensation, and will be increased whenever the compensation paid to active employees is increased but ceasing to increase when the member would
CALPERS ACTUARIAL VALUATION – June 30, 2013 APPENDIX B MISCELLANEOUS PLAN OF THE CITY OF OAKLAND PRINCIPAL PLAN PROVISIONS
B-7
have attained age 50. The allowance is payable to the surviving spouse until death at which time the allowance is continued to any unmarried children under age 22. There is a guarantee that the total amount paid will at least equal the Basic Death Benefit.
If the member’s death is the result of an accident or injury caused by external violence or physical force incurred in the performance of the member’s duty, and there are eligible surviving children (eligible means unmarried children under age 22) in addition to an eligible spouse, then an additional monthly allowance is paid equal to the following:
if 1 eligible child: 12.5 percent of final compensation if 2 eligible children: 20.0 percent of final compensation if 3 or more eligible children: 25.0 percent of final compensation
Alternate Death Benefit for Local Fire Members
This is an optional benefit available only to local fire members. Eligibility An employee’s eligible survivor(s) may receive the Alternate Death benefit in lieu of the Basic Death Benefit or the 1957 Survivor Benefit if the member dies while actively employed and has at least 20 years of total CalPERS service. A CalPERS member who is no longer actively employed with any CalPERS employer is not eligible for this benefit. An eligible survivor means the surviving spouse to whom the member was married prior to the onset of the injury or illness that resulted in death. If there is no eligible spouse, an eligible survivor means the member's unmarried children under age 18. Benefit The Alternate Death benefit is a monthly allowance equal to the Service Retirement benefit that the member would have received had the member retired on the date of his or her death and elected Optional Settlement 2W. (A retiree
who elects Optional Settlement 2W receives an allowance that has been reduced so that it will continue to be paid after his or her death to a surviving beneficiary.) If the member has not yet attained age 50, the benefit is equal to that which would be payable if the member had retired at age 50, based on service credited at the time of death. The allowance is payable as long as the surviving spouse lives, at which time it is continued to any unmarried children under age 18, if applicable. The total amount paid will be at least equal to the Basic Death Benefit.
Cost-of-Living Adjustments (COLA)
Standard Benefit Beginning the second calendar year after the year of retirement, retirement and survivor allowances will be annually adjusted on a compound basis by 2 percent. Improved Benefit Employers have the option of providing any of these improved cost-of-living adjustments by contracting for any one of these Class 1 optional benefits. An improved COLA is not available in conjunction with the 1.5% at 65 formula.
Beginning the second calendar year after the year of retirement, retirement and survivor allowances will be annually adjusted on a compound basis by either 3 percent, 4 percent or 5 percent. However, the cumulative adjustment may not be greater than the cumulative change in the Consumer Price Index since the date of retirement.
Purchasing Power Protection Allowance (PPPA)
Retirement and survivor allowances are protected against inflation by PPPA. PPPA benefits are cost-of-living adjustments that are intended to maintain an individual’s allowance at 80 percent of the initial allowance at
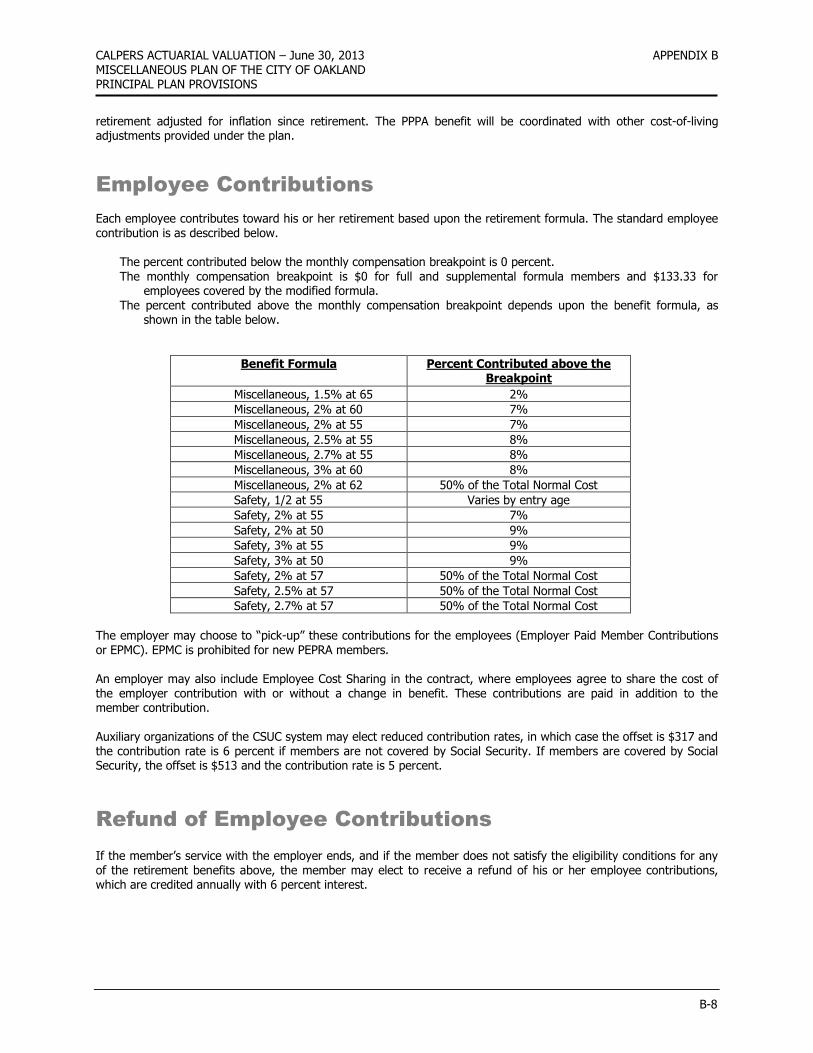
CALPERS ACTUARIAL VALUATION – June 30, 2013 APPENDIX B MISCELLANEOUS PLAN OF THE CITY OF OAKLAND PRINCIPAL PLAN PROVISIONS
B-8
retirement adjusted for inflation since retirement. The PPPA benefit will be coordinated with other cost-of-living adjustments provided under the plan.
Employee Contributions
Each employee contributes toward his or her retirement based upon the retirement formula. The standard employee contribution is as described below.
The percent contributed below the monthly compensation breakpoint is 0 percent. The monthly compensation breakpoint is $0 for full and supplemental formula members and $133.33 for
employees covered by the modified formula. The percent contributed above the monthly compensation breakpoint depends upon the benefit formula, as
shown in the table below.
Benefit Formula Percent Contributed above the Breakpoint
Miscellaneous, 1.5% at 65 2%
Miscellaneous, 2% at 60 7%
Miscellaneous, 2% at 55 7%
Miscellaneous, 2.5% at 55 8%
Miscellaneous, 2.7% at 55 8%
Miscellaneous, 3% at 60 8%
Miscellaneous, 2% at 62 50% of the Total Normal Cost
Safety, 1/2 at 55 Varies by entry age
Safety, 2% at 55 7%
Safety, 2% at 50 9%
Safety, 3% at 55 9%
Safety, 3% at 50 9%
Safety, 2% at 57 50% of the Total Normal Cost
Safety, 2.5% at 57 50% of the Total Normal Cost
Safety, 2.7% at 57 50% of the Total Normal Cost
The employer may choose to “pick-up” these contributions for the employees (Employer Paid Member Contributions or EPMC). EPMC is prohibited for new PEPRA members. An employer may also include Employee Cost Sharing in the contract, where employees agree to share the cost of the employer contribution with or without a change in benefit. These contributions are paid in addition to the member contribution. Auxiliary organizations of the CSUC system may elect reduced contribution rates, in which case the offset is $317 and the contribution rate is 6 percent if members are not covered by Social Security. If members are covered by Social Security, the offset is $513 and the contribution rate is 5 percent.
Refund of Employee Contributions
If the member’s service with the employer ends, and if the member does not satisfy the eligibility conditions for any of the retirement benefits above, the member may elect to receive a refund of his or her employee contributions, which are credited annually with 6 percent interest.
CALPERS ACTUARIAL VALUATION – June 30, 2013 APPENDIX B MISCELLANEOUS PLAN OF THE CITY OF OAKLAND PRINCIPAL PLAN PROVISIONS
B-9
1959 Survivor Benefit
This is a pre-retirement death benefit available only to members not covered by Social Security. Any agency joining CalPERS subsequent to 1993 was required to provide this benefit if the members were not covered by Social Security. The benefit is optional for agencies joining CalPERS prior to 1994. Levels 1, 2 and 3 are now closed. Any new agency or any agency wishing to add this benefit or increase the current level must choose the 4th or Indexed Level. This benefit is not included in the results presented in this valuation. More information on this benefit is available on the CalPERS website at www.calpers.ca.gov.

THIS PAGE
INTENTIONALLY
LEFT BLANK
APPENDIX C
PARTICIPANT DATA
SUMMARY OF VALUATION DATA
ACTIVE MEMBERS
TRANSFERRED AND TERMINATED MEMBERS
RETIRED MEMBERS AND BENEFICIARIES

THIS PAGE
INTENTIONALLY
LEFT BLANK
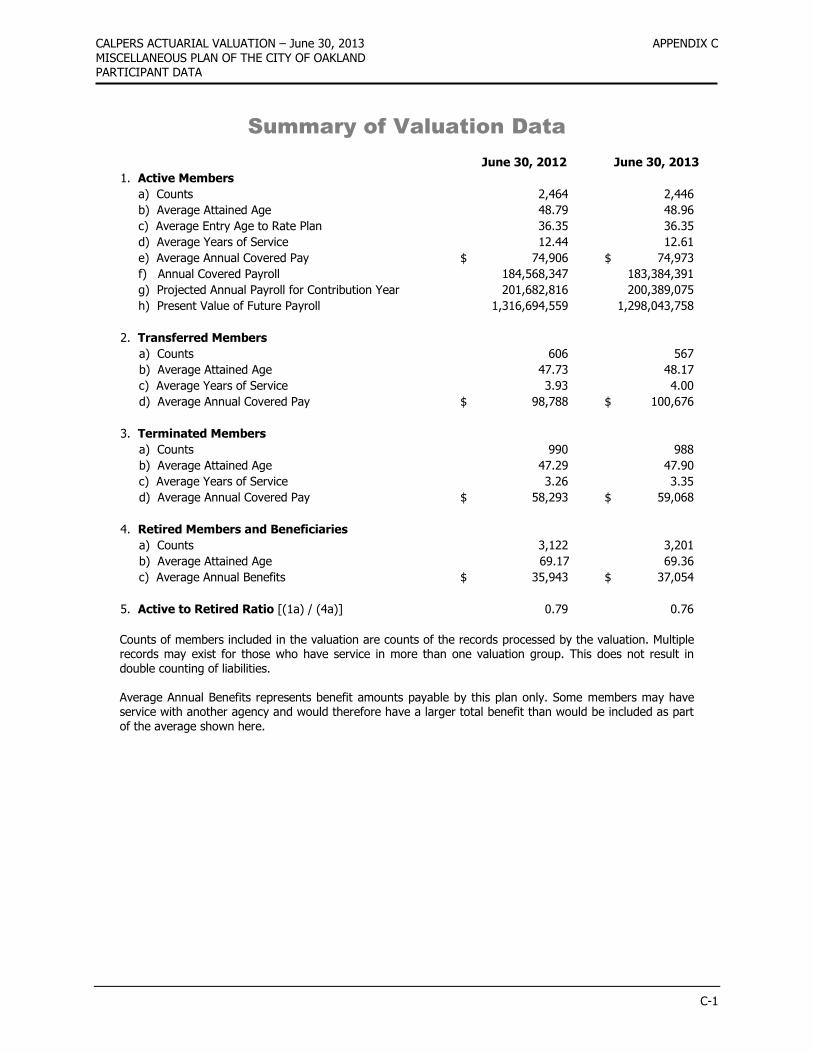
CALPERS ACTUARIAL VALUATION – June 30, 2013 APPENDIX C MISCELLANEOUS PLAN OF THE CITY OF OAKLAND PARTICIPANT DATA
C-1
Summary of Valuation Data
June 30, 2012 June 30, 2013
1. Active Members
a) Counts 2,464 2,446
b) Average Attained Age
48.79 48.96
c) Average Entry Age to Rate Plan 36.35 36.35
d) Average Years of Service 12.44 12.61
e) Average Annual Covered Pay $ 74,906 $ 74,973
f) Annual Covered Payroll 184,568,347 183,384,391
g) Projected Annual Payroll for Contribution Year 201,682,816 200,389,075
h) Present Value of Future Payroll 1,316,694,559 1,298,043,758
2. Transferred Members
a) Counts 606 567
b) Average Attained Age 47.73 48.17
c) Average Years of Service 3.93 4.00
d) Average Annual Covered Pay $ 98,788 $ 100,676
3. Terminated Members
a) Counts 990 988
b) Average Attained Age 47.29 47.90
c) Average Years of Service 3.26 3.35
d) Average Annual Covered Pay $ 58,293 $ 59,068
4. Retired Members and Beneficiaries
a) Counts 3,122 3,201
b) Average Attained Age 69.17 69.36
c) Average Annual Benefits $ 35,943 $ 37,054
5. Active to Retired Ratio [(1a) / (4a)] 0.79 0.76
Counts of members included in the valuation are counts of the records processed by the valuation. Multiple records may exist for those who have service in more than one valuation group. This does not result in double counting of liabilities. Average Annual Benefits represents benefit amounts payable by this plan only. Some members may have service with another agency and would therefore have a larger total benefit than would be included as part of the average shown here.
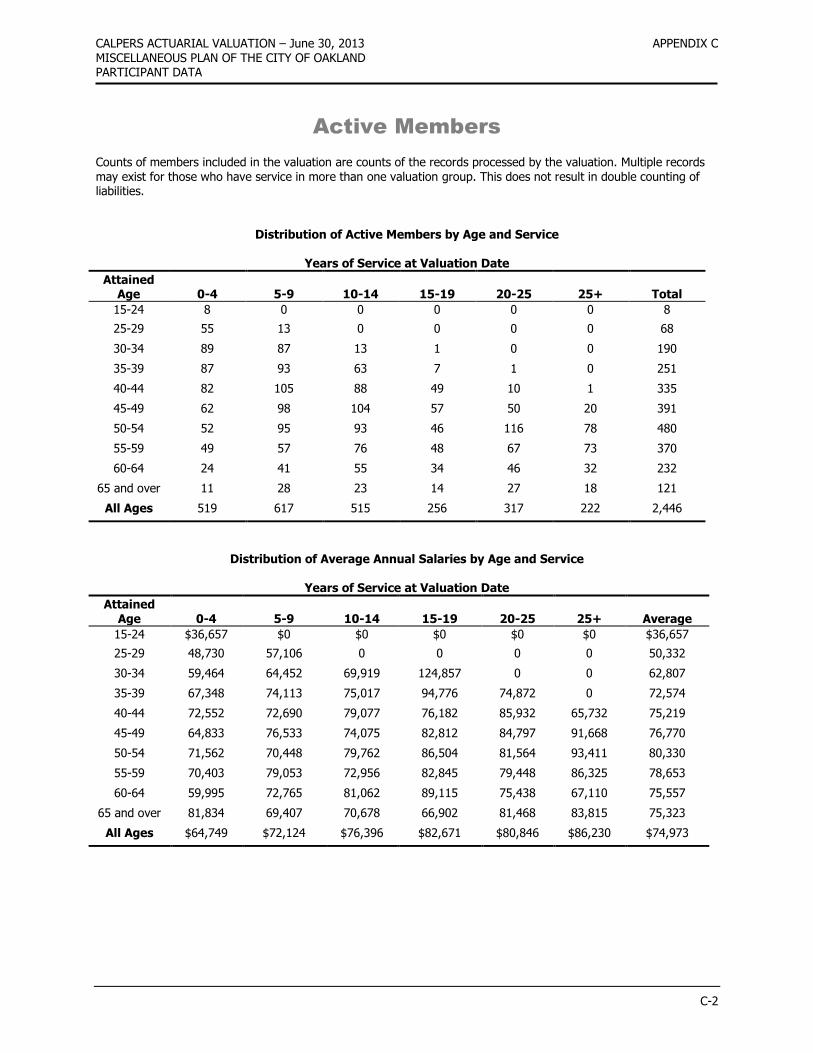
CALPERS ACTUARIAL VALUATION – June 30, 2013 APPENDIX C MISCELLANEOUS PLAN OF THE CITY OF OAKLAND PARTICIPANT DATA
C-2
Active Members
Counts of members included in the valuation are counts of the records processed by the valuation. Multiple records may exist for those who have service in more than one valuation group. This does not result in double counting of liabilities.
Distribution of Active Members by Age and Service
Years of Service at Valuation Date
Attained Age 0-4 5-9 10-14 15-19 20-25 25+ Total
15-24 8 0 0 0 0 0 8
25-29 55 13 0 0 0 0 68
30-34 89 87 13 1 0 0 190
35-39 87 93 63 7 1 0 251
40-44 82 105 88 49 10 1 335
45-49 62 98 104 57 50 20 391
50-54 52 95 93 46 116 78 480
55-59 49 57 76 48 67 73 370
60-64 24 41 55 34 46 32 232
65 and over 11 28 23 14 27 18 121
All Ages 519 617 515 256 317 222 2,446
Distribution of Average Annual Salaries by Age and Service
Years of Service at Valuation Date
Attained Age 0-4 5-9 10-14 15-19 20-25 25+ Average
15-24 $36,657 $0 $0 $0 $0 $0 $36,657
25-29 48,730 57,106 0 0 0 0 50,332
30-34 59,464 64,452 69,919 124,857 0 0 62,807
35-39 67,348 74,113 75,017 94,776 74,872 0 72,574
40-44 72,552 72,690 79,077 76,182 85,932 65,732 75,219
45-49 64,833 76,533 74,075 82,812 84,797 91,668 76,770
50-54 71,562 70,448 79,762 86,504 81,564 93,411 80,330
55-59 70,403 79,053 72,956 82,845 79,448 86,325 78,653
60-64 59,995 72,765 81,062 89,115 75,438 67,110 75,557
65 and over 81,834 69,407 70,678 66,902 81,468 83,815 75,323
All Ages $64,749 $72,124 $76,396 $82,671 $80,846 $86,230 $74,973
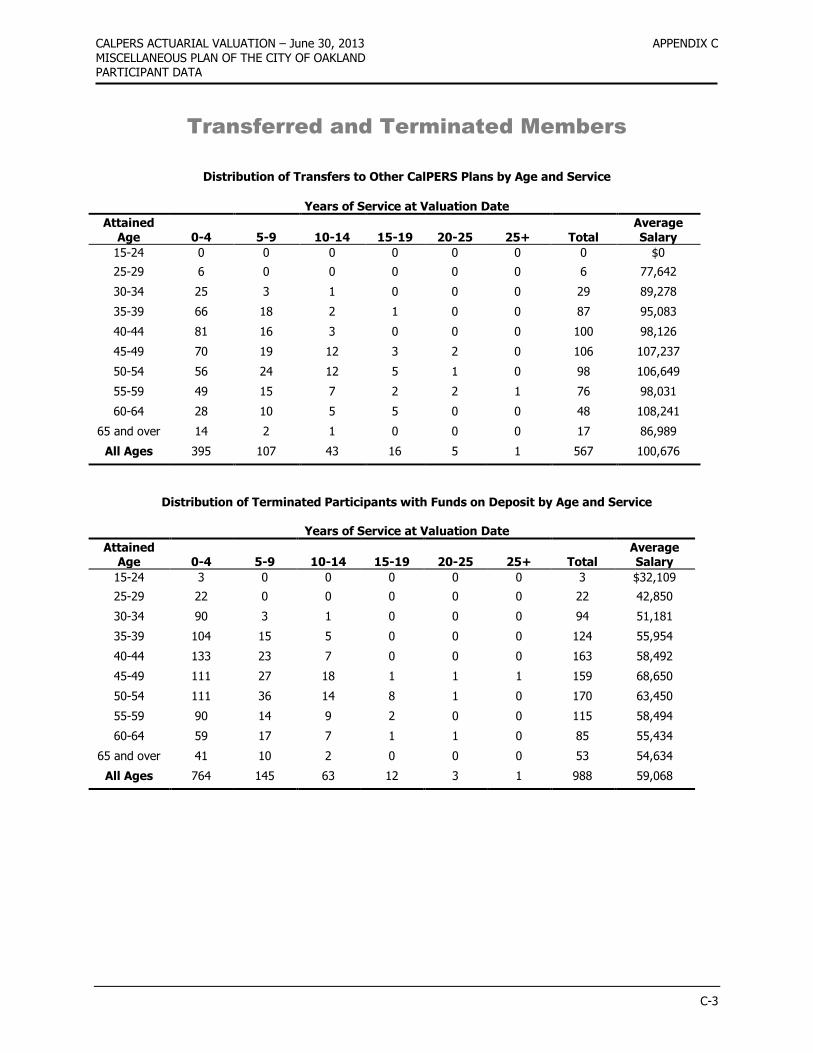
CALPERS ACTUARIAL VALUATION – June 30, 2013 APPENDIX C MISCELLANEOUS PLAN OF THE CITY OF OAKLAND PARTICIPANT DATA
C-3
Transferred and Terminated Members
Distribution of Transfers to Other CalPERS Plans by Age and Service
Years of Service at Valuation Date
Attained Age 0-4 5-9 10-14 15-19 20-25 25+ Total
Average Salary
15-24 0 0 0 0 0 0 0 $0
25-29 6 0 0 0 0 0 6 77,642
30-34 25 3 1 0 0 0 29 89,278
35-39 66 18 2 1 0 0 87 95,083
40-44 81 16 3 0 0 0 100 98,126
45-49 70 19 12 3 2 0 106 107,237
50-54 56 24 12 5 1 0 98 106,649
55-59 49 15 7 2 2 1 76 98,031
60-64 28 10 5 5 0 0 48 108,241
65 and over 14 2 1 0 0 0 17 86,989
All Ages 395 107 43 16 5 1 567 100,676
Distribution of Terminated Participants with Funds on Deposit by Age and Service
Years of Service at Valuation Date
Attained Age 0-4 5-9 10-14 15-19 20-25 25+ Total
Average Salary
15-24 3 0 0 0 0 0 3 $32,109
25-29 22 0 0 0 0 0 22 42,850
30-34 90 3 1 0 0 0 94 51,181
35-39 104 15 5 0 0 0 124 55,954
40-44 133 23 7 0 0 0 163 58,492
45-49 111 27 18 1 1 1 159 68,650
50-54 111 36 14 8 1 0 170 63,450
55-59 90 14 9 2 0 0 115 58,494
60-64 59 17 7 1 1 0 85 55,434
65 and over 41 10 2 0 0 0 53 54,634
All Ages 764 145 63 12 3 1 988 59,068
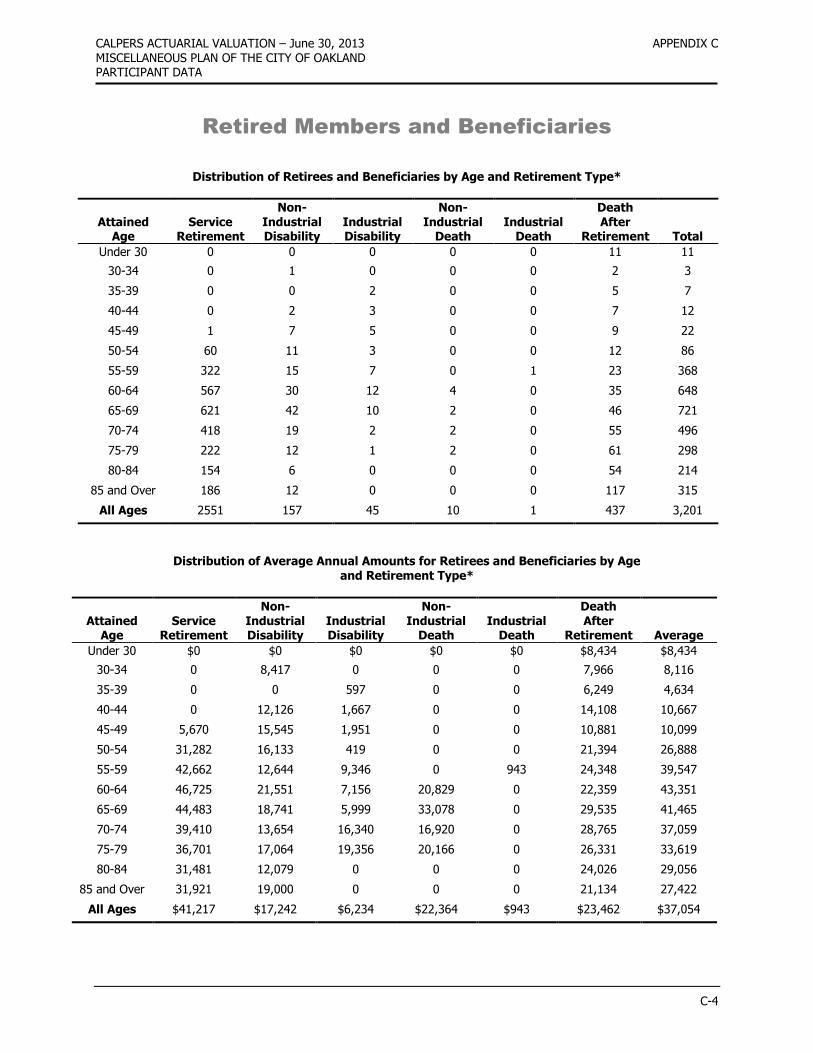
CALPERS ACTUARIAL VALUATION – June 30, 2013 APPENDIX C MISCELLANEOUS PLAN OF THE CITY OF OAKLAND PARTICIPANT DATA
C-4
Retired Members and Beneficiaries
Distribution of Retirees and Beneficiaries by Age and Retirement Type*
Attained Age
Service Retirement
Non-Industrial Disability
Industrial Disability
Non-Industrial
Death Industrial
Death
Death After
Retirement Total
Under 30 0 0 0 0 0 11 11
30-34 0 1 0 0 0 2 3
35-39 0 0 2 0 0 5 7
40-44 0 2 3 0 0 7 12
45-49 1 7 5 0 0 9 22
50-54 60 11 3 0 0 12 86
55-59 322 15 7 0 1 23 368
60-64 567 30 12 4 0 35 648
65-69 621 42 10 2 0 46 721
70-74 418 19 2 2 0 55 496
75-79 222 12 1 2 0 61 298
80-84 154 6 0 0 0 54 214
85 and Over 186 12 0 0 0 117 315
All Ages 2551 157 45 10 1 437 3,201
Distribution of Average Annual Amounts for Retirees and Beneficiaries by Age and Retirement Type*
Attained Age
Service Retirement
Non-Industrial Disability
Industrial Disability
Non-Industrial
Death Industrial
Death
Death After
Retirement Average
Under 30 $0 $0 $0 $0 $0 $8,434 $8,434
30-34 0 8,417 0 0 0 7,966 8,116
35-39 0 0 597 0 0 6,249 4,634
40-44 0 12,126 1,667 0 0 14,108 10,667
45-49 5,670 15,545 1,951 0 0 10,881 10,099
50-54 31,282 16,133 419 0 0 21,394 26,888
55-59 42,662 12,644 9,346 0 943 24,348 39,547
60-64 46,725 21,551 7,156 20,829 0 22,359 43,351
65-69 44,483 18,741 5,999 33,078 0 29,535 41,465
70-74 39,410 13,654 16,340 16,920 0 28,765 37,059
75-79 36,701 17,064 19,356 20,166 0 26,331 33,619
80-84 31,481 12,079 0 0 0 24,026 29,056
85 and Over 31,921 19,000 0 0 0 21,134 27,422
All Ages $41,217 $17,242 $6,234 $22,364 $943 $23,462 $37,054
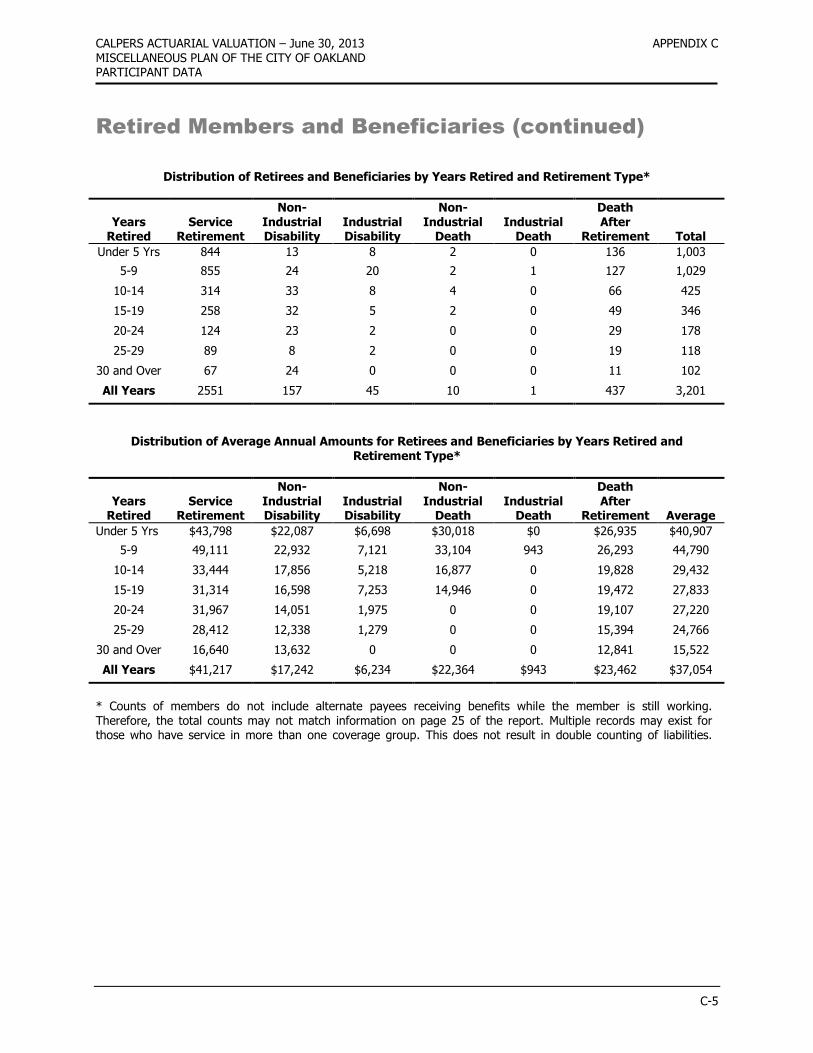
CALPERS ACTUARIAL VALUATION – June 30, 2013 APPENDIX C MISCELLANEOUS PLAN OF THE CITY OF OAKLAND PARTICIPANT DATA
C-5
Retired Members and Beneficiaries (continued)
Distribution of Retirees and Beneficiaries by Years Retired and Retirement Type*
Years Retired
Service Retirement
Non-Industrial Disability
Industrial Disability
Non-Industrial
Death Industrial
Death
Death After
Retirement Total
Under 5 Yrs 844 13 8 2 0 136 1,003
5-9 855 24 20 2 1 127 1,029
10-14 314 33 8 4 0 66 425
15-19 258 32 5 2 0 49 346
20-24 124 23 2 0 0 29 178
25-29 89 8 2 0 0 19 118
30 and Over 67 24 0 0 0 11 102
All Years 2551 157 45 10 1 437 3,201
Distribution of Average Annual Amounts for Retirees and Beneficiaries by Years Retired and Retirement Type*
Years Retired
Service Retirement
Non-Industrial Disability
Industrial Disability
Non-Industrial
Death Industrial
Death
Death After
Retirement Average
Under 5 Yrs $43,798 $22,087 $6,698 $30,018 $0 $26,935 $40,907
5-9 49,111 22,932 7,121 33,104 943 26,293 44,790
10-14 33,444 17,856 5,218 16,877 0 19,828 29,432
15-19 31,314 16,598 7,253 14,946 0 19,472 27,833
20-24 31,967 14,051 1,975 0 0 19,107 27,220
25-29 28,412 12,338 1,279 0 0 15,394 24,766
30 and Over 16,640 13,632 0 0 0 12,841 15,522
All Years $41,217 $17,242 $6,234 $22,364 $943 $23,462 $37,054
* Counts of members do not include alternate payees receiving benefits while the member is still working. Therefore, the total counts may not match information on page 25 of the report. Multiple records may exist for those who have service in more than one coverage group. This does not result in double counting of liabilities.

THIS PAGE
INTENTIONALLY
LEFT BLANK

APPENDIX D
DEVELOPMENT OF PEPRA MEMBER CONTRIBUTION RATE

THIS PAGE
INTENTIONALLY
LEFT BLANK
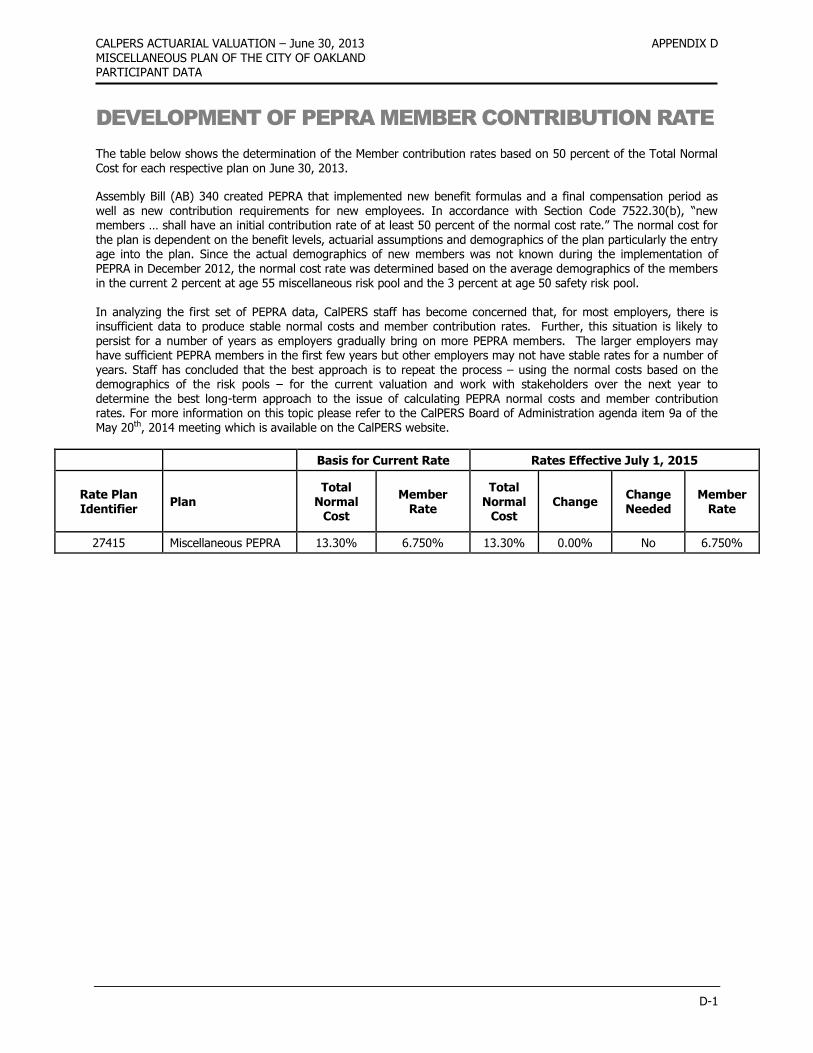
CALPERS ACTUARIAL VALUATION – June 30, 2013 APPENDIX D MISCELLANEOUS PLAN OF THE CITY OF OAKLAND PARTICIPANT DATA
D-1
DEVELOPMENT OF PEPRA MEMBER CONTRIBUTION RATE
The table below shows the determination of the Member contribution rates based on 50 percent of the Total Normal Cost for each respective plan on June 30, 2013.
Assembly Bill (AB) 340 created PEPRA that implemented new benefit formulas and a final compensation period as well as new contribution requirements for new employees. In accordance with Section Code 7522.30(b), “new members … shall have an initial contribution rate of at least 50 percent of the normal cost rate.” The normal cost for the plan is dependent on the benefit levels, actuarial assumptions and demographics of the plan particularly the entry age into the plan. Since the actual demographics of new members was not known during the implementation of PEPRA in December 2012, the normal cost rate was determined based on the average demographics of the members in the current 2 percent at age 55 miscellaneous risk pool and the 3 percent at age 50 safety risk pool. In analyzing the first set of PEPRA data, CalPERS staff has become concerned that, for most employers, there is insufficient data to produce stable normal costs and member contribution rates. Further, this situation is likely to
persist for a number of years as employers gradually bring on more PEPRA members. The larger employers may have sufficient PEPRA members in the first few years but other employers may not have stable rates for a number of years. Staff has concluded that the best approach is to repeat the process – using the normal costs based on the demographics of the risk pools – for the current valuation and work with stakeholders over the next year to determine the best long-term approach to the issue of calculating PEPRA normal costs and member contribution rates. For more information on this topic please refer to the CalPERS Board of Administration agenda item 9a of the May 20th, 2014 meeting which is available on the CalPERS website.
Basis for Current Rate Rates Effective July 1, 2015
Rate Plan Identifier
Plan Total
Normal Cost
Member Rate
Total Normal
Cost Change
Change Needed
Member Rate
27415 Miscellaneous PEPRA 13.30% 6.750% 13.30% 0.00% No 6.750%

THIS PAGE
INTENTIONALLY
LEFT BLANK

APPENDIX E
GLOSSARY OF ACTUARIAL TERMS
CALPERS ACTUARIAL VALUATION – June 30, 2013 APPENDIX E MISCELLANEOUS PLAN OF THE CITY OF OAKLAND GLOSSARY OF ACTUARIAL TERMS
E-1
Glossary of Actuarial Terms
Accrued Liability (also called Actuarial Accrued Liability or Entry Age Normal Accrued Liability)
The total dollars needed as of the valuation date to fund all benefits earned in the past for current members. Actuarial Assumptions
Assumptions made about certain events that will affect pension costs. Assumptions generally can be broken down into two categories: demographic and economic. Demographic assumptions include such things as mortality, disability and retirement rates. Economic assumptions include discount rate, salary growth and inflation.
Actuarial Methods
Procedures employed by actuaries to achieve certain funding goals of a pension plan. Actuarial methods include funding method, setting the length of time to fund the Accrued Liability and determining the Actuarial Value of Assets.
Actuarial Valuation
The determination, as of a valuation date, of the Normal Cost, Accrued liability, Actuarial Value of Assets and related actuarial present values for a pension plan. These valuations are performed annually or when an employer is contemplating a change to their plan provisions.
Actuarial Value of Assets
The Actuarial Value of Assets used for funding purposes is obtained through an asset smoothing technique where investment gains and losses are partially recognized in the year they are incurred, with the remainder recognized in subsequent years.
This method helps to dampen large fluctuations in the employer contribution rate.
Amortization Bases
Separate payment schedules for different portions of the Unfunded Liability. The total Unfunded Liability of a Risk Pool or non-pooled plan can be segregated by "cause,” creating “bases” and each such base will be separately amortized and paid for over a specific period of time. However, all bases are amortized using investment and payroll assumptions from the current valuation. This can be likened to a home having a first mortgage of 24 years remaining payments and a second mortgage that has 10 years remaining payments. Each base or each mortgage note has its own terms (payment period, principal, etc.)
Generally, in an actuarial valuation, the separate bases consist of changes in unfunded liability due to contract amendments, actuarial assumption changes, actuarial methodology changes, and or gains and losses. Payment periods are determined by Board policy and vary based on the cause of the change.
Amortization Period
The number of years required to pay off an Amortization Base. Annual Required Contributions (ARC)
The employer's periodic required annual contributions to a defined benefit pension plan as set forth in GASB Statement No. 27, calculated in accordance with the plan assumptions. The ARC is determined by multiplying the employer contribution rate by the payroll reported to CalPERS for the applicable fiscal year. However, if this contribution is fully prepaid in a lump sum, then the dollar value of the ARC is equal to the Lump Sum Prepayment.
Classic Member (under PEPRA) A classic member is a member who joined CalPERS prior to January, 1, 2013 and who is not defined as a new member under PEPRA. (See definition of new member below)
Discount Rate Assumption
The actuarial assumption that was called “investment return” in earlier CalPERS reports or “actuarial interest rate” in Section 20014 of the California Public Employees’ Retirement Law (PERL).
CALPERS ACTUARIAL VALUATION – June 30, 2013 APPENDIX E MISCELLANEOUS PLAN OF THE CITY OF OAKLAND GLOSSARY OF ACTUARIAL TERMS
E-2
Entry Age
The earliest age at which a plan member begins to accrue benefits under a defined benefit pension plan. In most cases, this is the age of the member on their date of hire.
Entry Age Normal Cost Method
An actuarial cost method designed to fund a member's total plan benefit over the course of his or her career. This method is designed to yield a rate expressed as a level percentage of payroll. (The assumed retirement age less the entry age is the amount of time required to fund a member’s total benefit. Generally, the older a member on the date of hire, the greater the entry age normal cost. This is mainly because there is less time to earn investment income to fund the future benefits.)
Fresh Start
A Fresh Start is when multiple amortization bases are collapsed to one base and amortized together over a new funding period.
Funded Status A measure of how well funded, or how "on track" a plan or risk pool is with respect to assets verses accrued liabilities. A ratio greater than 100% means the plan or risk pool has more assets than liabilities and a ratio less than 100% means liabilities are greater than assets. A funded ratio based on the Actuarial Value of Assets indicates the progress toward fully funding the plan using the actuarial cost methods and assumptions. A funded ratio based on the Market Value of Assets indicates the short-term solvency of the plan.
GASB 27
Statement No. 27 of the Governmental Accounting Standards Board. The accounting standard governing a state or local governmental employer’s accounting for pensions.
GASB 68
Statement No. 68 of the Governmental Accounting Standards Board. The accounting standard governing a state or local governmental employer’s accounting and financial reporting for pensions. GASB 68 replaces GASB 27 effective the first fiscal year beginning after June 15, 2014.
New Member (under PEPRA)
A new member includes an individual who becomes a member of a public retirement system for the first time on or after January 1, 2013, and who was not a member of another public retirement system prior to that date, and who is not subject to reciprocity with another public retirement system.
Normal Cost
The annual cost of service accrual for the upcoming fiscal year for active employees. The normal cost should be viewed as the long term contribution rate.
Pension Actuary
A business professional that is authorized by the Society of Actuaries, and the American Academy of Actuaries to perform the calculations necessary to properly fund a pension plan.
PEPRA
The California Public Employees’ Pension Reform Act of 2013 Prepayment Contribution
A payment made by the employer to reduce or eliminate the year’s required employer contribution. Present Value of Benefits (PVB)
The total dollars needed as of the valuation date to fund all benefits earned in the past or expected to be earned in the future for current members.
Rolling Amortization Period
An amortization period that remains the same each year, rather than declining.
CALPERS ACTUARIAL VALUATION – June 30, 2013 APPENDIX E MISCELLANEOUS PLAN OF THE CITY OF OAKLAND GLOSSARY OF ACTUARIAL TERMS
E-3
Superfunded
A condition existing when a plan’s Actuarial Value of Assets exceeds its Present Value of Benefits. Prior to the passage of PEPRA, when this condition existed on a given valuation date for a given plan, employee contributions for the rate year covered by that valuation could be waived.
Unfunded Liability
When a plan or pool’s Actuarial Value of Assets is less than its Accrued Liability, the difference is the plan or pool’s Unfunded Liability. If the Unfunded Liability is positive, the plan or pool will have to pay contributions exceeding the Normal Cost.
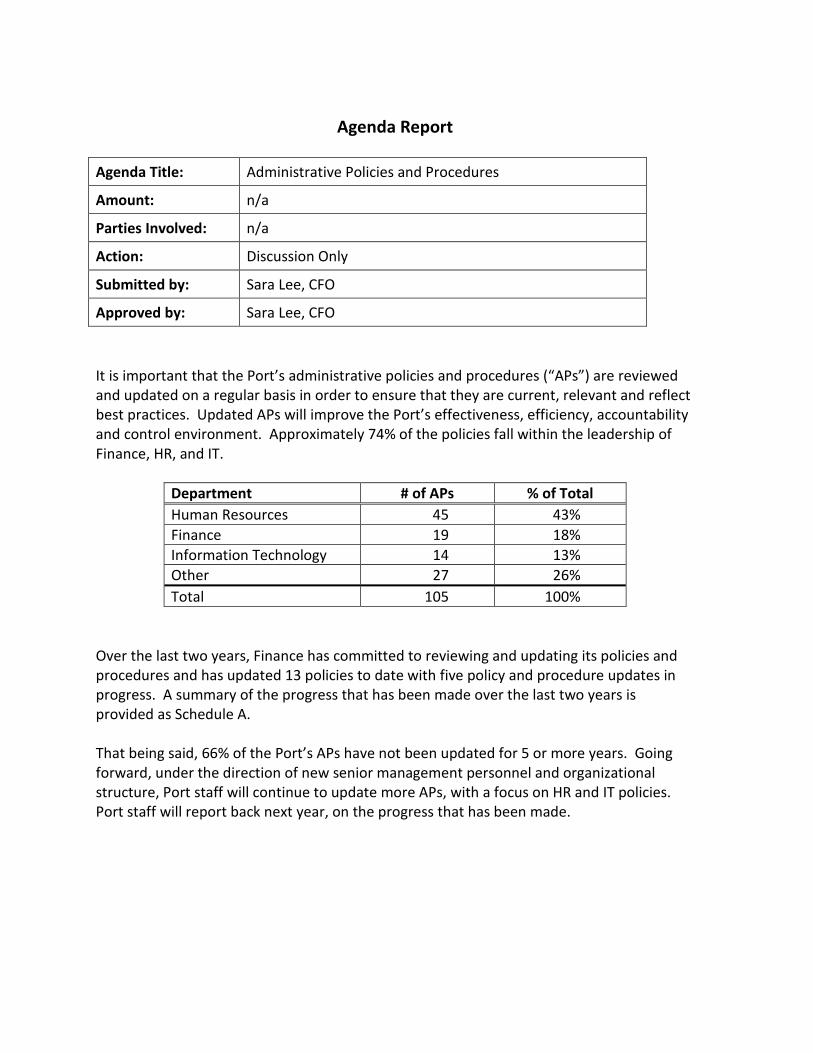
Agenda Report
Agenda Title: Administrative Policies and Procedures
Amount: n/a
Parties Involved: n/a
Action: Discussion Only
Submitted by: Sara Lee, CFO
Approved by: Sara Lee, CFO It is important that the Port’s administrative policies and procedures (“APs”) are reviewed and updated on a regular basis in order to ensure that they are current, relevant and reflect best practices. Updated APs will improve the Port’s effectiveness, efficiency, accountability and control environment. Approximately 74% of the policies fall within the leadership of Finance, HR, and IT.
Department # of APs % of Total Human Resources 45 43% Finance 19 18% Information Technology 14 13% Other 27 26% Total 105 100%
Over the last two years, Finance has committed to reviewing and updating its policies and procedures and has updated 13 policies to date with five policy and procedure updates in progress. A summary of the progress that has been made over the last two years is provided as Schedule A. That being said, 66% of the Port’s APs have not been updated for 5 or more years. Going forward, under the direction of new senior management personnel and organizational structure, Port staff will continue to update more APs, with a focus on HR and IT policies. Port staff will report back next year, on the progress that has been made.
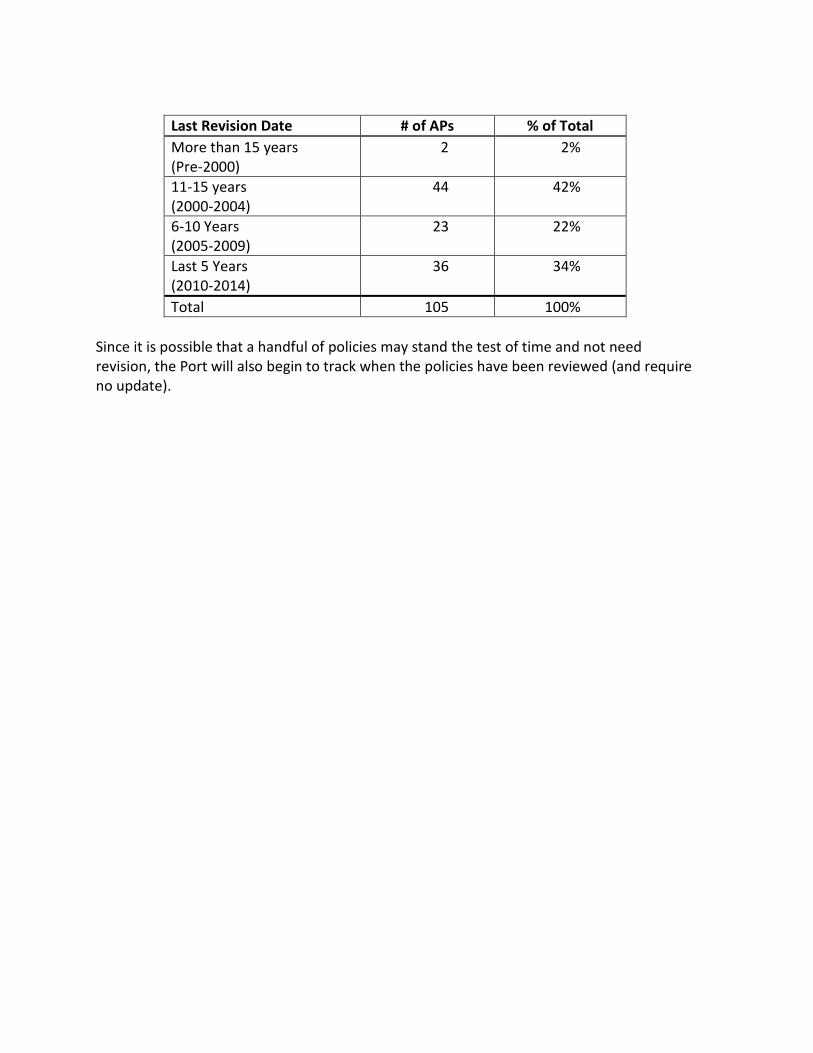
Last Revision Date # of APs % of Total More than 15 years (Pre-2000)
2 2%
11-15 years (2000-2004)
44 42%
6-10 Years (2005-2009)
23 22%
Last 5 Years (2010-2014)
36 34%
Total 105 100% Since it is possible that a handful of policies may stand the test of time and not need revision, the Port will also begin to track when the policies have been reviewed (and require no update).
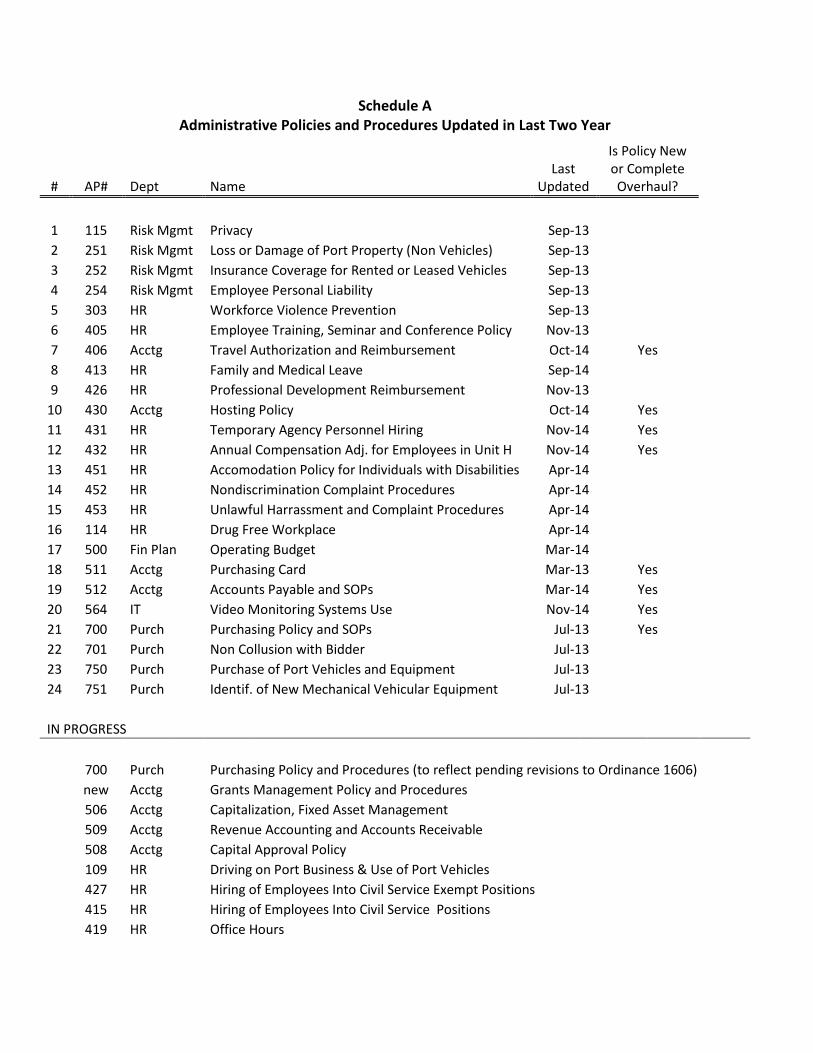
Schedule A Administrative Policies and Procedures Updated in Last Two Year
# AP# Dept Name Last
Updated
Is Policy New or Complete Overhaul?
1 115 Risk Mgmt Privacy Sep-13 2 251 Risk Mgmt Loss or Damage of Port Property (Non Vehicles) Sep-13 3 252 Risk Mgmt Insurance Coverage for Rented or Leased Vehicles Sep-13 4 254 Risk Mgmt Employee Personal Liability Sep-13 5 303 HR Workforce Violence Prevention Sep-13 6 405 HR Employee Training, Seminar and Conference Policy Nov-13 7 406 Acctg Travel Authorization and Reimbursement Oct-14 Yes
8 413 HR Family and Medical Leave Sep-14 9 426 HR Professional Development Reimbursement Nov-13 10 430 Acctg Hosting Policy Oct-14 Yes
11 431 HR Temporary Agency Personnel Hiring Nov-14 Yes 12 432 HR Annual Compensation Adj. for Employees in Unit H Nov-14 Yes 13 451 HR Accomodation Policy for Individuals with Disabilities Apr-14
14 452 HR Nondiscrimination Complaint Procedures Apr-14 15 453 HR Unlawful Harrassment and Complaint Procedures Apr-14 16 114 HR Drug Free Workplace Apr-14 17 500 Fin Plan Operating Budget Mar-14 18 511 Acctg Purchasing Card Mar-13 Yes
19 512 Acctg Accounts Payable and SOPs Mar-14 Yes 20 564 IT Video Monitoring Systems Use Nov-14 Yes 21 700 Purch Purchasing Policy and SOPs Jul-13 Yes 22 701 Purch Non Collusion with Bidder Jul-13
23 750 Purch Purchase of Port Vehicles and Equipment Jul-13 24 751 Purch Identif. of New Mechanical Vehicular Equipment Jul-13
IN PROGRESS
700 Purch Purchasing Policy and Procedures (to reflect pending revisions to Ordinance 1606)
new Acctg Grants Management Policy and Procedures
506 Acctg Capitalization, Fixed Asset Management
509 Acctg Revenue Accounting and Accounts Receivable
508 Acctg Capital Approval Policy
109 HR Driving on Port Business & Use of Port Vehicles
427 HR Hiring of Employees Into Civil Service Exempt Positions
415 HR Hiring of Employees Into Civil Service Positions
419 HR Office Hours


Internal Controls Items
This section of the meeting is reserved for action or discussion related to internal control matters. Internal controls consist mainly of systematic measures instituted by an organization to safeguard its assets and to provide reasonable assurance on the reliability and accuracy of financial information, proper compliance with laws and regulations, and effective and efficient operations.

Whistleblower Hotline Program
Presented by
Office of Audit Services
January 22, 2015
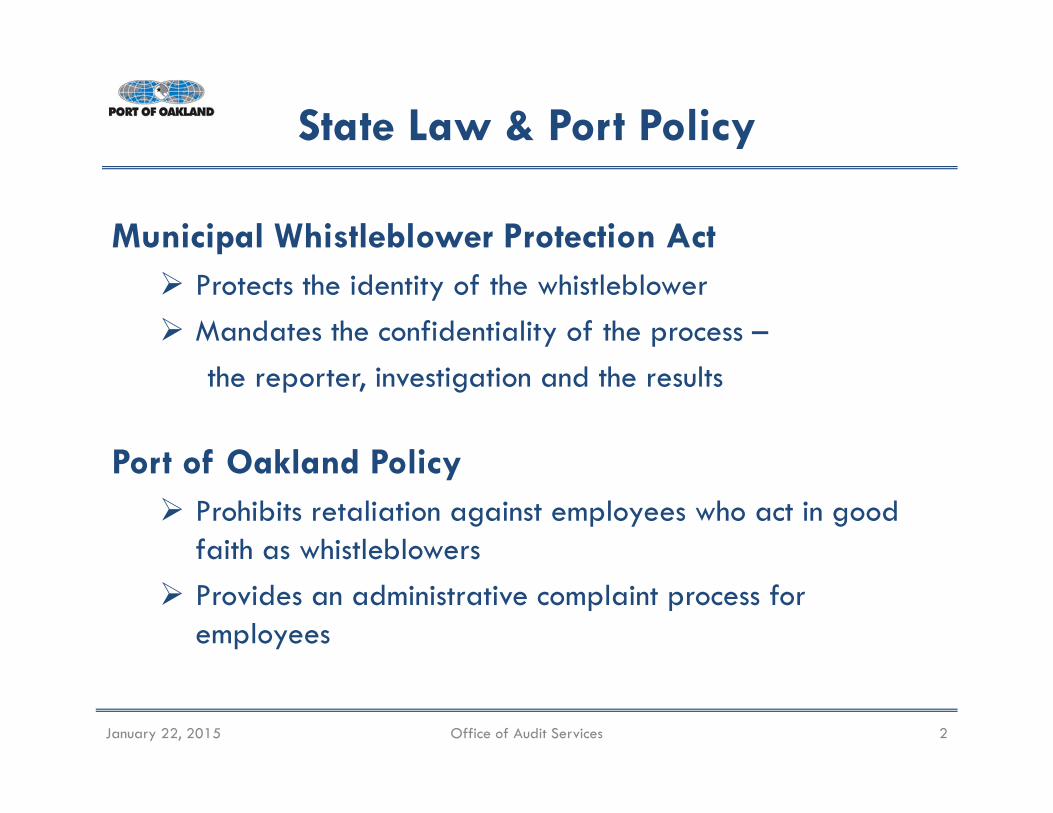
State Law & Port Policy
Municipal Whistleblower Protection Act Protects the identity of the whistleblower Mandates the confidentiality of the process –
the reporter, investigation and the results
Port of Oakland Policy Prohibits retaliation against employees who act in good
faith as whistleblowers Provides an administrative complaint process for
employees
January 22, 2015 Office of Audit Services 2
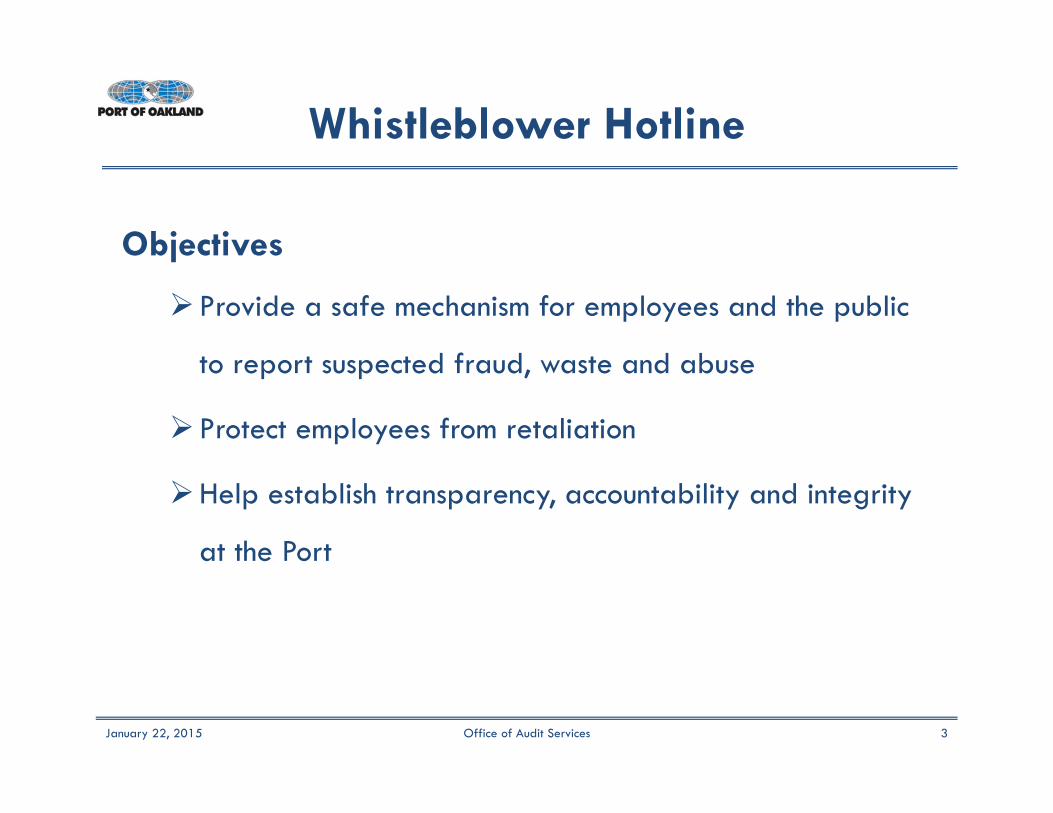
Whistleblower Hotline
Objectives
Provide a safe mechanism for employees and the public
to report suspected fraud, waste and abuse
Protect employees from retaliation
Help establish transparency, accountability and integrity
at the Port
January 22, 2015 Office of Audit Services 3
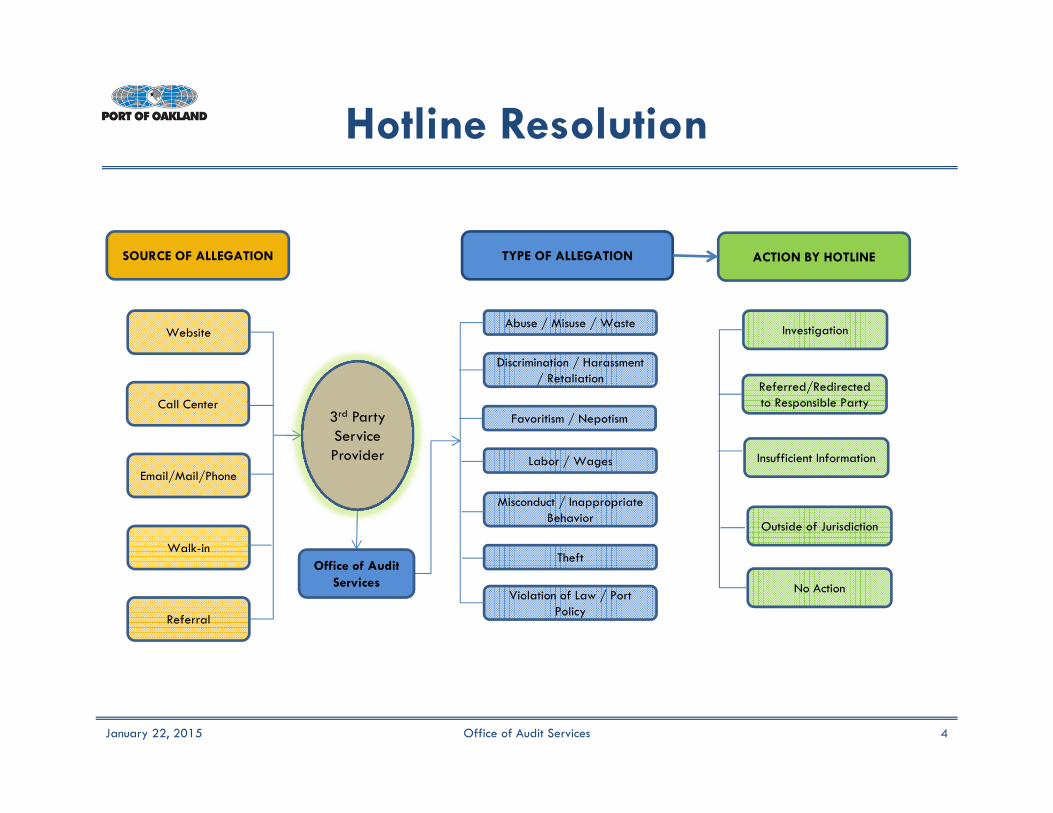
Hotline Resolution
Website
Call Center
SOURCE OF ALLEGATION
Email/Mail/Phone
Referral
TYPE OF ALLEGATION
Abuse / Misuse / Waste
Discrimination / Harassment / Retaliation
Favoritism / Nepotism
Violation of Law / Port Policy
Misconduct / Inappropriate Behavior
Labor / Wages
ACTION BY HOTLINE
Investigation
Referred/Redirected to Responsible Party
Insufficient Information
Outside of Jurisdiction
No Action
3rd Party Service Provider
Office of Audit Services
Theft
January 22, 2015 Office of Audit Services 4
Walk-in
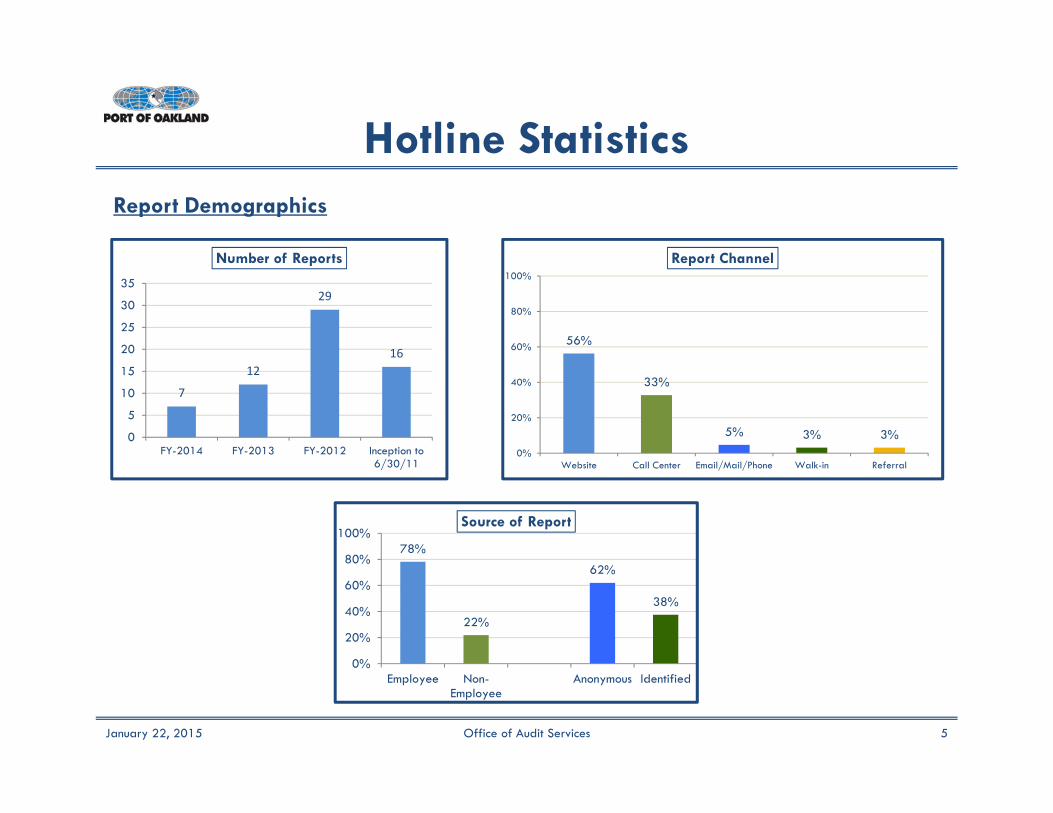
Hotline Statistics
January 22, 2015 Office of Audit Services 5
Report Demographics
78%
22%
62%
38%
0%
20%
40%
60%
80%
100%
Employee Non-Employee
Anonymous Identified
Source of Report
56%
33%
5% 3% 3%0%
20%
40%
60%
80%
100%
Website Call Center Email/Mail/Phone Walk-in Referral
Report Channel
7
12
29
16
0
5
10
15
20
25
30
35
FY-2014 FY-2013 FY-2012 Inception to6/30/11
Number of Reports
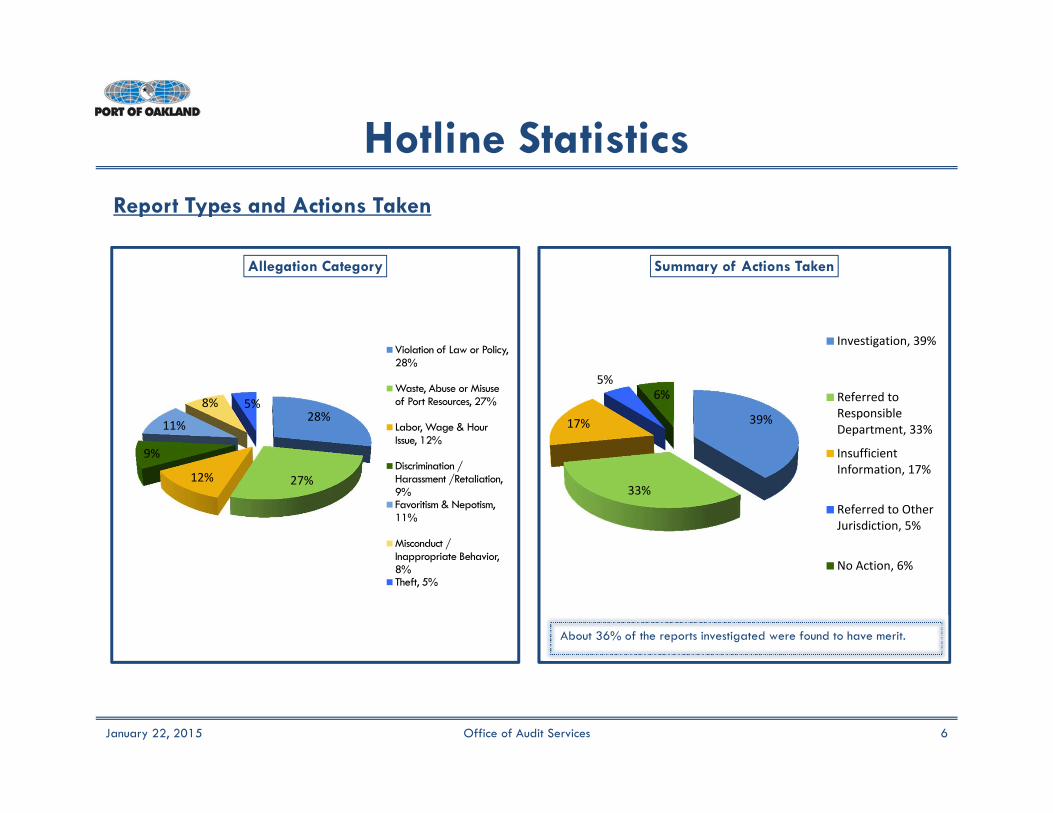
39%
33%
17%
5%6%
Summary of Actions Taken
Investigation, 39%
Referred toResponsibleDepartment, 33%
InsufficientInformation, 17%
Referred to OtherJurisdiction, 5%
No Action, 6%
Hotline Statistics
January 22, 2015 Office of Audit Services 6
Report Types and Actions Taken
About 36% of the reports investigated were found to have merit.
28%
27%12%
9%
11%
8% 5%
Allegation Category
Violation of Law or Policy, 28%
Waste, Abuse or Misuse of Port Resources, 27%
Labor, Wage & Hour Issue, 12%
Discrimination / Harassment /Retaliation, 9%Favoritism & Nepotism, 11%
Misconduct / Inappropriate Behavior, 8%Theft, 5%
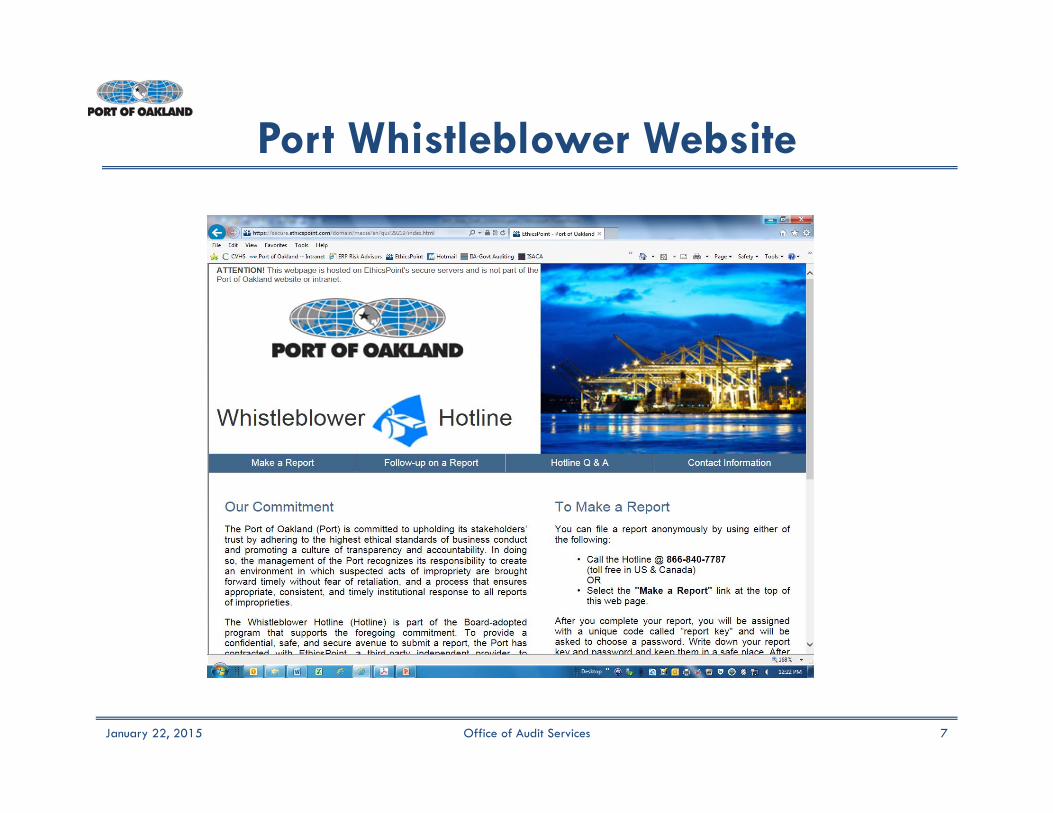
Port Whistleblower Website
January 22, 2015 Office of Audit Services 7

Administration Items
This section of the meeting is reserved for action or discussion related to administrative matters, including scheduling items for future Agendas and/or scheduling Special Meetings, and for reporting noteworthy events occurring since the last Audit Committee meeting.