j measurement, metering, benchmarking & metrics
TRANSCRIPT

Measurement, Metering, Benchmarking & Metrics
International Emerging Technology Symposium – 2016Chicago, Illinois
Presented by
H.W. (Bill) Hoffman, P.E.
H.W. (Bill) Hoffman & Associates, LLC
Austin, Texas

The purpose of this presentation is to aquatint you with the many changes that are occurring in how we measure, monitor, meter, benchmark and examine water use in America
in the 21st Century.

Measurement, Metering, Benchmarking & Metrics
Will Change Many Things.
•How we meter and sub-meter buildings•How we estimate flow and thus meter size•How we detect leaks•How government looks at things•How facility managers manage buildings•How utilities look at their own use

At the Facility Level

If you don’t measure it, you
CAN NOTmanage it!


A Large Chinese Buffet Restaurant
150
200
250
300
350
400
450
500
550
Sep-
03O
ct-0
3N
ov-0
3D
ec-0
3Ja
n-04
Feb-
04M
ar-0
4A
pr-0
4M
ay-0
4Ju
n-04
Jul-0
4A
ug-0
4Se
p-04
Oct
-04
Nov
-04
Dec
-04
Jan-
05Fe
b-05
Mar
-05
Apr
-05
May
-05
Jun-
05Ju
l-05
Aug
-05
Sep-
05
1,00
0's
of G
al. /
Mon
th

Data Management & Process Control

What is Driving This?
The Cost of Water!

Circle of BlueApril, 2015
http://www.circleofblue.org/waternews/2015/world/price-of-water-2015-up-6-percent-in-30-major-u-s-cities-41-percent-rise-since-2010/
Price of Water 2015: Up 6 % in 30 Major U.S. Cities;
41 % Since 2010!


Cost to Flush a Toilet at Current Inflation Rate of 5.85%
Gallons per Flush
Cents per Flush in 2015
Cents per Flush in 2035
5 4.9 15.43.5 3.4 10.81.6 1.6 4.9
1.28 1.2 4.0

$0$5
,000
$10,
000
$15,
000
$20,
000
$25,
000
$30,
000
$35,
000
$40,
000
$45,
000
$50,
000
$55,
000
$60,
000
$65,
000
$70,
000
$75,
000
$80,
000
Best Available
Old WastefulType
Annual Water and Wastewater Cost
Blue – 2015 Red ‐ 2035
What 20 Years Means for Total Cost of Water and Sewer for an Office Building with 500 People

The cost of leaks!
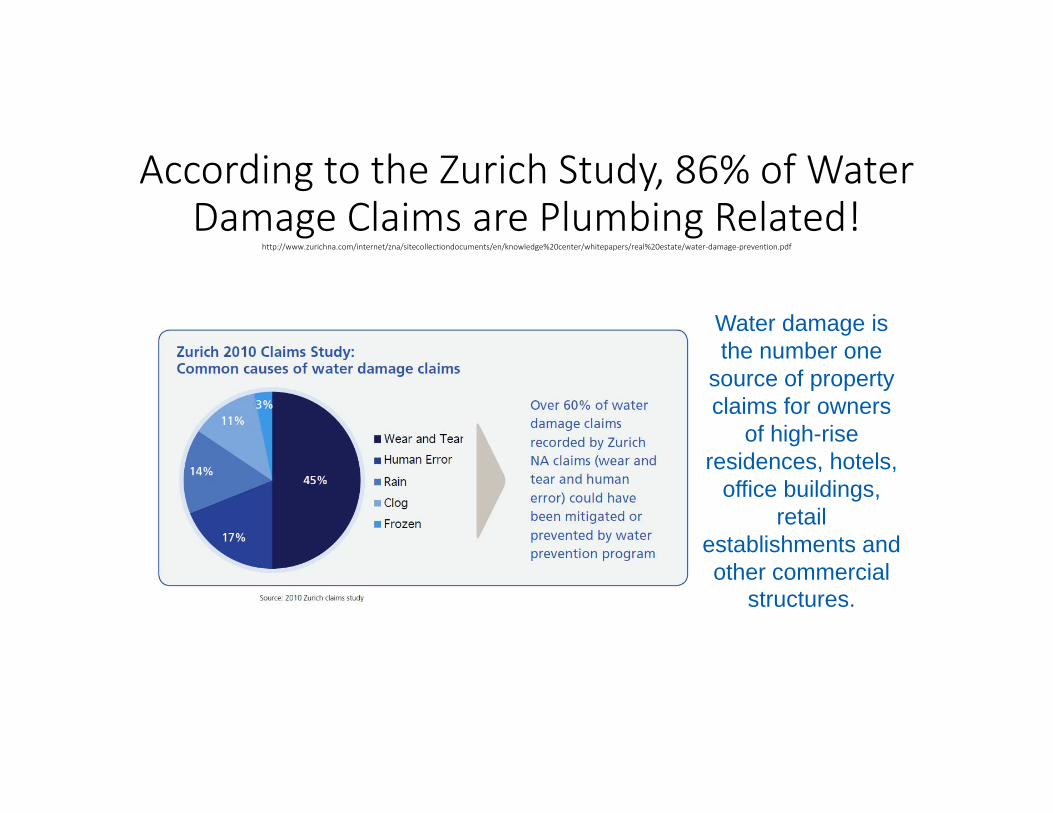
According to the Zurich Study, 86% of Water Damage Claims are Plumbing Related!
http://www.zurichna.com/internet/zna/sitecollectiondocuments/en/knowledge%20center/whitepapers/real%20estate/water‐damage‐prevention.pdf
Water damage is the number one
source of property claims for owners
of high-rise residences, hotels,
office buildings, retail
establishments and other commercial
structures.


AWWA Estimates that 15% of Water Lost Through Leaks in Distribution

States and Cities are Looking at How Water is Used and by Whom

79
90
85
74
69
88
76
62
73
82
159
170
159
175
0 20 40 60 80 100 120 140 160 180 200 220 240 260
Medium Utilities (237)
Medium-Large Utilities3 (31)
Large Utilities (30)
Medium Significant ICI1 Utilities (27)
Metropolitan Utilities
Medium-Large Significant ICI Utilities (5)
Large Significant ICI Utilities (5)
Gallons per Person per Day
Water Use of Texas UtilitiesTWDB 2015 ‐ SB 181 Report
Residential GPCD ICI & Other GPCD

0.0 0.5 1.0 1.5 2.0 2.5 3.0 3.5 4.0 4.5 5.0
ReligiousIndustrial Warehouse
Other Educational BldgService Station‐Repair Garage
Correctional FacilityAmusment‐Recreation‐Athletic
Other Group ShelterSancturay
Commercial WarehouseFood Stores
CollegesSchools
Service Est.Resturant/ Bar
HealthcareHotel
All OtherRetail
Offices
Millions of Gallons per Day (MGD)
Water Use by Commercial/Institutional UsersAustin, Texas Study
Red = Food Svc.

0
10
20
30
40
50
60
70
80
Residential indoor gpcd Residential Outdoor gpcd Leak loss gpcd Com./Inst. gpcd
Gal
lons
per
Per
son
per D
ay
Breakdown of Non-Industrial Municipal Use in 87 Texas Cities
2009 2010 2011 2012 2013

Energy Star Portfolio Manager• It now contains water data.
•Many local governments are requiring it for government properties.
•Some are now requiring all commercial property of any size to use it and report it.

Entities Using EPA Portfolio ManagerStars = Water Benchmarking Required

Examples of Energy Star Portfolio Manager Data for Office
Buildings in 2014Gallons per Square Foot per Year
City New York Washington DC Boston Minneapolis
No. of Buildings (398) (342) (218) (80)
Low (Meter stuck??) 0.01 0.2 0.09 0.01Median 16.7 16.1 11.6 10.8
Average 45.6 163.7 40.7 12.1
High (Get the meter checked!!!!) 4,821.5 33,917.8 1,552.3 43.6

Same Cities Without High and Low Data
05
10152025303540455055606570
5% 10%
15%
20%
25%
30%
35%
40%
45%
50%
55%
60%
65%
70%
75%
80%
85%
90%
95%
Gal
lons
per
Squ
are
Foot
per
Yea
r
Office Building Water UseEPA Portfolio Manager
New York Washington DC Boston Mineapolis

Studies Across the Nation

1 16 31 46 61 76 91 106
121
136
151
166
181
196
211
226
241Gallons per Bed
Hospitals2002 ASHE Study
Do You see the same Pattern Here?
0
20
40
60
80
1 6 11 16 21 26 31 36 41 46 51 56 61 66 71 76
GPC
D
Elementary Schools in a District in Texas

EPA Portfolio Manager Information on Water

59%64%
67% 68% 67%
59%
52%56% 58% 58%
0%
10%
20%
30%
40%
50%
60%
70%
0
20
40
60
80
100
120
140
160
2003 2004 2005 2006 2007 2008 2009 2010 2011 2012
Perc
ent O
ccup
ancy
Gal
lons
per
Squ
are
Foot
per
Yea
r
Hotel and Motel Water Use Factors for Phoenix - 2003 to 2012
Percent Occupancy Motel Adjusted for Occupancy
Motel Unadjusted for Occupancy Hotel Adjusted for Occupancy
Hotel Unadjusted for Occupancy
Commercial & Institutional Savings Too

Summary of Restaurant Water Use Coefficients from Various StudiesSource: H.W. (Bill) Hoffman & Associates, LLC
Source of Information Best Gal./Meal
Avg. Gal./ Meal
Gal./ sq. ft./ Year
Best Gal./ Seat/ Day
Avg. Gal./ Seat/ Day
Florida (Univ. of Fl.) Restaurant 270Florida (Univ. of Fl.) Fast Food 240
Colorado Study (Brendle Group) 9 to 12 192 29 53
USA (2000 AWWARF CI End Use Study) 130 to 331 20 to 30 Boulder Colorado 8 to 9 125 49Danamark (Canada)
U of Kansas (M. Vanschenkhof) 12.8 266
South Australia study and Sydney Water 9 to 12
North Carolina ICI BMP 20 to 40 Austin Study (Full Svc.) 2013 173 31Austin Study (Fast Food) 2013 257 39

Summary of Hospital Water Use Coefficients from Various StudiesSource: H.W. (Bill) Hoffman & Associates, LLC
Study Gal./Bed/DayGal./Sq. Ft/Yr.
Average Best
Federal Facilities Average 125Univ. of Florida Study 31United Kingdom -Large Teaching 41 34UK Small Acute or Long Stay 29 22
UK Small Acute or Long Stay With Laundry 39 31North Carolina Rule of Thumb 300ASHE 2002 Study 471Energy Star Portfolio Mgr. 315Victoria Public Health Service - Australia 39 17Health Estate Journal - United Kingdom 87US Energy Information Adm. 2007 study 395 68City of Austin (9 largest medical Facilities) 335 58 18

Summary of Six United States Studies Reporting Water Use by Gallons per Square Foot of Heated Space per Year
Type of Facility
EPA Portfolio Manager 20121
University of Florida2
Santa Fe, New Mexico3
Colorado Water Wise - Brendle
Group.4
AWWA End Use
Study 2000 5
Austin 20136
Gallons per Square Foot of Heated Space per YearRestaurants 221 173 to 211 130 to 330 215
Senior Care Facilities 61 106 62 to 101
Hotels 54 85 79 to 165 60 to115 72
Hospitals 52 31 58
Grocery/Supermarkets 24 95 36 52to 64
Medical Offices 19 34 49
Offices 13 20 26 9 to 15 19
Banking/Financial 12 89
Court House 11
K-12 Schools 10 20 12 to 19 8 to 16
Houses of Worship 7 15
Retail/Shopping Centers 5 32 20
Unrefrigerated Warehouses 3 8

Big Data is ComingSoon to your city!

In the Next 20 Years, All Water Utilities Will Be Using AMI
Advanced Metering Infrastructure

Utility Organizations are in on the act

American Water Works AssociationWater Research Foundation
•2015 Residential End Use Study
•2016 Commercial – Institutional Methodology Study
•2018 Commercial Institutional Data Base

The Federal GovernmentActivity
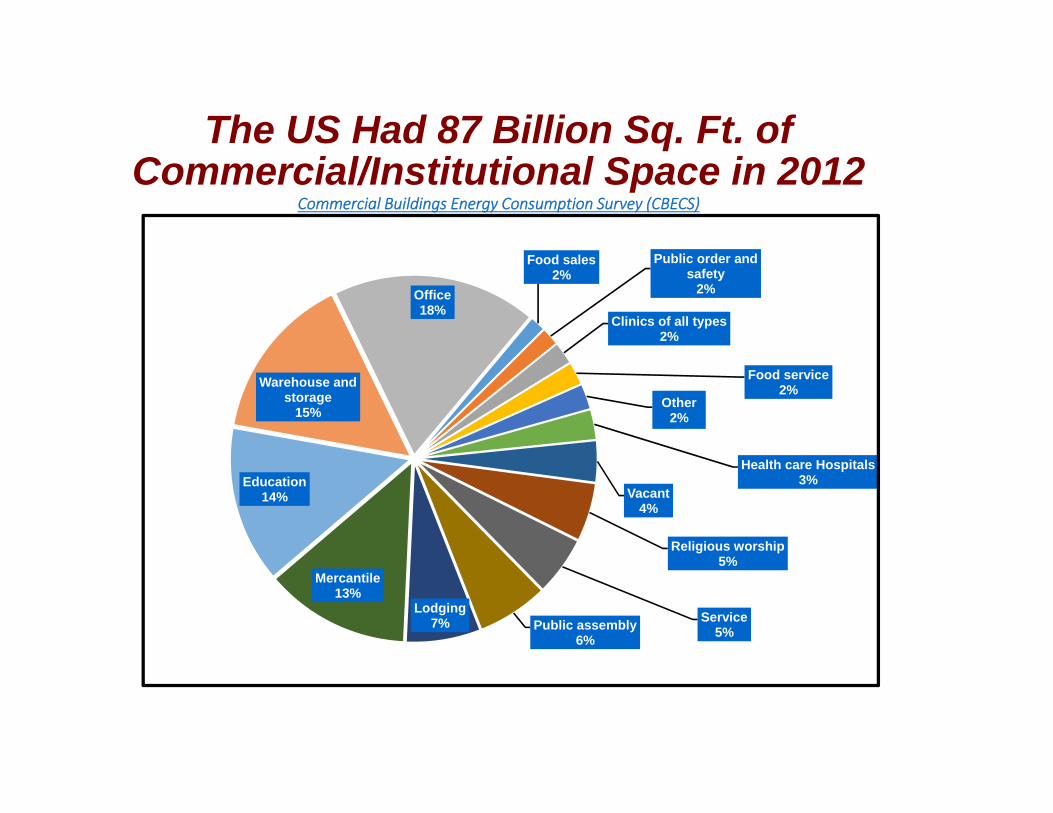
Food sales 2%
Public order and safety
2%
Clinics of all types2%
Food service 2%
Other 2%
Health care Hospitals3%
Vacant 4%
Religious worship 5%
Service 5%Public assembly
6%
Lodging 7%
Mercantile 13%
Education14%
Warehouse and storage
15%
Office 18%
The US Had 87 Billion Sq. Ft. of Commercial/Institutional Space in 2012
Commercial Buildings Energy Consumption Survey (CBECS)

315
365
418
453
300
320
340
360
380
400
420
440
460
480
North East West Mid West South
Gal
./Bed
/Day
CBECS 2007 Hospital UseGallons per Bed per Day
COMMERCIAL BUILDINGS ENERGY CONSUMPTION SURVEY)

Census Regions Used by CBECS


Cooling Tower53%
All Other Uses47%
Eleven Office Buildings in Austin, Texas
Cooling Towers
49%
Domestic41% Food Service
4%
Medical Equip.
1%
Irrigation5%
A Large Hospital in Arizona
Grocery Store Water Use in California
Pacific Institute
Cooling Tower49%
Other22%
Irrigation3%
Kitchen9%
Domestic17% Cooling
Towers43%
Toilets20%
Other Plumbing
8%
Food Service8%
Medical Equip.
9%
Leaks & Other
8%Boilers
4%
A Large Hospital in Florida

So is it working?

Texas Water Development Board Water Use Projection Tables
Year of Implementation in TexasAction 1993 2007 2010 2013 3014 2015 2018
Energy Policy Act
1.28 gpf toilets
Dishwashers
Front Load Washers
Top Load Washers

0 2 4 6 8 10 12 14 16 18 20 22 24 26 28 30
Pre-Rinse Spray Valve using 1.28 gpm or lessCommercial Ice Maker
Home DishwasherNon-Mechanical Food scrap collector (strainers)
Garbage Disposal 0.75 HP to 10.0 HPFood Waste Pulpers
Steam CookerCombination Oven
Residential Clothes WasherCoin Laundry EquipmentCommercial Dishwasher
Mechanical Strainers with Recirculation SystemsOn Premise Laundry Equipment
ToiletsUrinals
Tunnel Clothes Washers
Years
Average Life of Appliances

0% 10%
20%
30%
40%
50%
60%
70%
80%
90%
100%
Shower
Commercial Toiltes
Residential Clothes…
Pre-Rinse Spray Valves
Residential Toilets
Residential Dish…
Commercial Dish…
Urinals
Percent Reduction in Use From Best in Class
All of this has had a real impact on water use across the Nation

US GDP vs. Water Withdrawals

All Water Use in USA – USGSAfter Peter Glick Water Use Trends in the United States ‐ Pacific Institute

0
1
2
3
4
5
0
5
10
15
20
25
30
35
40
45
50
1950 1960 1970 1980 1990 2000 2010
Dim
ensi
onle
ss In
dex
Bill
ions
of G
allo
ns p
er D
ay
Year
US Industrial Water Use vs. Output IndexSource. Bureau if Economic Analysis
Industry way down

10
15
20
25
30
35
40
45
50
100
110
120
130
140
150
160
170
180
1950 1955 1960 1965 1970 1975 1980 1985 1990 1995 2000 2005 2010
Bill
ions
of G
al./D
ay
Gal
./Per
son/
Day
US Per Capita Use (gpcd) Total Municipal/Domestic Use
And it is showing up in real municipal water use data
US Geological Survey Report – 2014http://water.usgs.gov/watuse/

Residential End Use Study ‐ AWWA
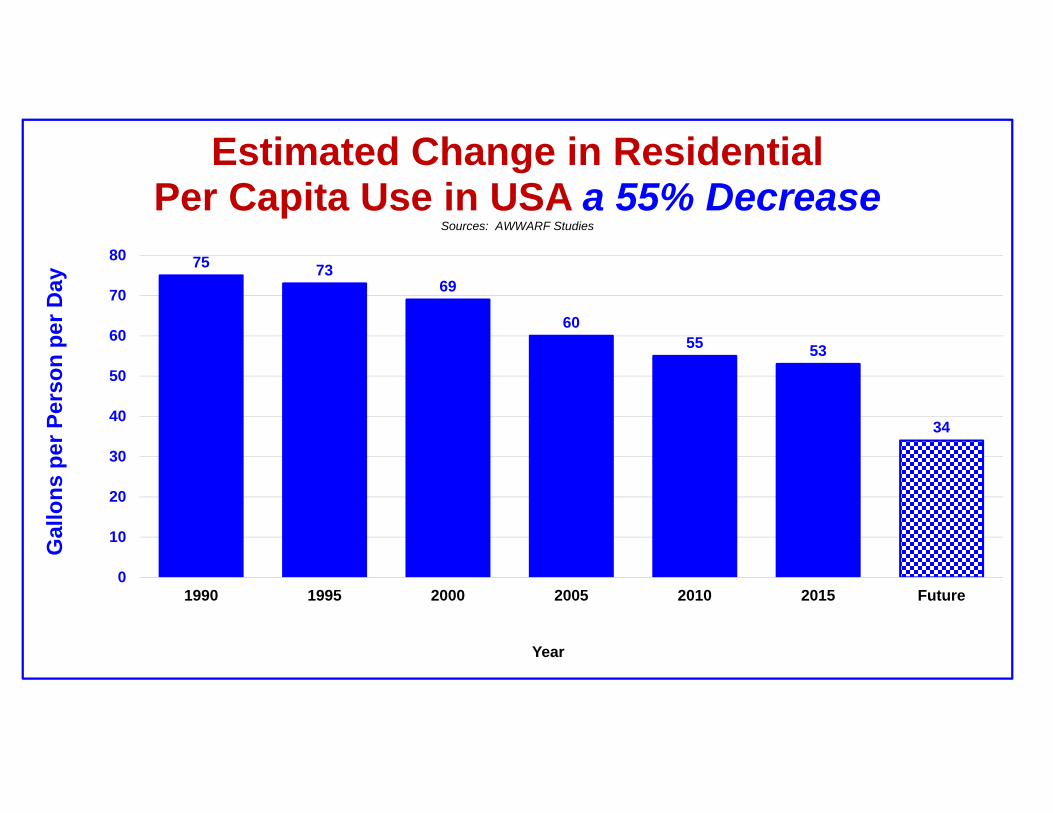
75 7369
6055 53
34
0
10
20
30
40
50
60
70
80
1990 1995 2000 2005 2010 2015 Future
Gal
lons
per
Per
son
per D
ay
Year
Estimated Change in Residential Per Capita Use in USA a 55% Decrease
Sources: AWWARF Studies

Black Water35%
Gray water53%
Leaks12%
Average American Household Indoor UseEPA estimates tha about 1/3 of residential use is outdoor

New York City

Seattle Washington


If you don’t measure it, you
CAN NOTmanage it!

Conclusions• We have entered the age of Big Data!
• The price of water and wastewater will ensure that enhanced metering, measurement and monitoring are here to stay!
• Codes, Standards, Design and our Thinking will need to change!
• We are just at the beginning!

We covered a lot!
Questions?

Measurement, Metering, Benchmarking & Metrics
International Emerging Technology Symposium – 2016Chicago, Illinois
H.W. (Bill) Hoffman, P.E.H.W. (Bill) Hoffman & Associates, LLC
9013 Texas Sun DriveAustin, TX 787489
512-294-7193

TheThe
EndEnd