j. - nopr: homenopr.niscair.res.in/bitstream/123456789/49847/1/ijca 21a... · 2019. 8. 14. ·...
TRANSCRIPT

References1. ZUMAN, 'P., Topics in organic polarography (plenum,
London), 1970, 91.2. liAMMET, L. P., J. Arn. chem. Soc., 59 (1937), 96.3. RAVINDRANATH,L. K. & BRAHMA1IRAo, S., J. electroanal.
Chem., 105 (1979), 217.4. SUBRAHMANAYA,R. S. & VIJAYALAKSHMMA,S. K., Indian
J. Chem., 9 (1971), 1265. .S. SUBRAHMANAYA,R. S. & VUAYALAKSHMMA,S. K., Indian
J. Chem., 14A (1976), 24.6. KRISHNA RAo, K. V., Ph. D. Thesis, Sri Venkateswara
University, Tirupati (1976). .7. ZUMAN, P., MEITES, L. & KOLTHOFF, I. M., Progress In
polarography. Vol. m, (Wiley-Interscience, New York),1972, 261.
Polarographic Behaviour of Nitroprusside Ion
R. S. KASHYAP, P. N. SHARMA & ARVIND KUMAR·Chemistry Department, Agra College, Agra
Received 29 August 1981; revised and accepted 11 December1981
Polarographic behaviour or nitroprusside ion bas been studiedat different pH values. In a strongly acidic medium, only onewave is obtained; two waves appear upto pH 6; at pH > 6, allthe three waves are observed. In fairly alkaline medium thefirst wave is completely eliminated. The analysis of the wavesiDdicates that the first and second reduction steps are reversibleand the third step is irreversible at dilIerentpH values. The valuesof rate constant and heterogeneous rate constant (kh) alsosupport the above views. The values of temperature coefficientor the baIf-wave potential or first and second waves are verynominal as expected ror reversible reductions. The comtancy iobalf-wave potential ror the third wave with increase in tempe-rature confirms the irreversible nature of the third step.
KOLTHOFF and TorenI studied the polarographicbehaviour of nitroprusside ion and reported that
it gives three reduction waves at the d.m.e. The firsttwo reduction steps involved one electron each andwere independent of the hydrogen ion concentrationin the pH range 6.0-10.0. These reduction steps werefound to be reversible; however, the third one corres-ponded to an irreversible process. The effect of thenature and concentration of the supporting electroly-tes on the polarographic behaviour of nitroprussideion and a tentative mechanism for the reductionprocess have already been reported in our earliercommunications,
The present note deals with the effect of pH andtemperature on the polarographic behaviour of nitro-prusside ion, specially on the third reduction step.Kinetic and thermodynamic parameters have beencalculated.
Recrystallized sodium nitroprusside dihydrate(BDH) was used for the experiments. The nitro-prusside solution is light-sensitive and slowly turnsgreen on exposure to light. Therefore, fresh solutionswere prepared every alternate day and kept in darkand were exposed to diffuse light only while takingthe polarograms. All other chemicals were AR
NOTES
reagents (BDH). The solutions were deaerated bybubbling pure nitrogen gas. The temperature wasmaintained at 30 ± 0.1°C.
Polarograms were recorded on a Toshniwal Manualpolarograph in conjunction with a sensitive polyflexgalvanometer.
Half-wave potentials and slope values were evalua-ted from -Ed.e. vs log ilt«t curves. The value oftransfer coefficient IX has also been determined fromthe plot of log (i-i,) VS -Ed.e. in the case of thirdreduction step.
It is interesting to note that the polarographicbehaviour of nitroprusside ion varies with the pH.Upto pH 4.2, only one reduction wave is observed;at pH 5.8 the second wave appears; from pH 6.4 to10.3 three well-defined waves are obtained. From theabove observations it seems that the reduction ofnitroprusside ion beyond first and second stages isnot feasible in presence of high concentration ofhydrogen ions and the elimination of the first reduc-tion wave in highly alkaline medium may be due tothe interaction of nitroprusside ion with hydroxyl ionswhich has been reported by Cambi and Szego"also.
In the pH range 6.4-10.3, the half-wave potentialof the first wave is almost constant, while itvaries irregularly for the second wave. The half-wave potential of the third wave shows a continuouspositive shift, a characteristic of a irreversible process.The irregularity in the shift of half-wave potentialof the second wave with pH may be due to the semi-kinetic character of the wave caused by the changein the ionic strength of the medium.
The third wave has a 2-electron height at low pHof about 6.4. With increasing pH, the sum of theheights of the three waves first increases and thendecreases. However, the sum of the heights of firstand second waves becomes lesser than the height ofthird wave with the increase in pH from 6.4 to 10.3.Hence, it follows that the electrode process in thethird wave in the alkaline pH range cannot be a furtherreduction of the product of the electrode reactionoccurring in the second wave.
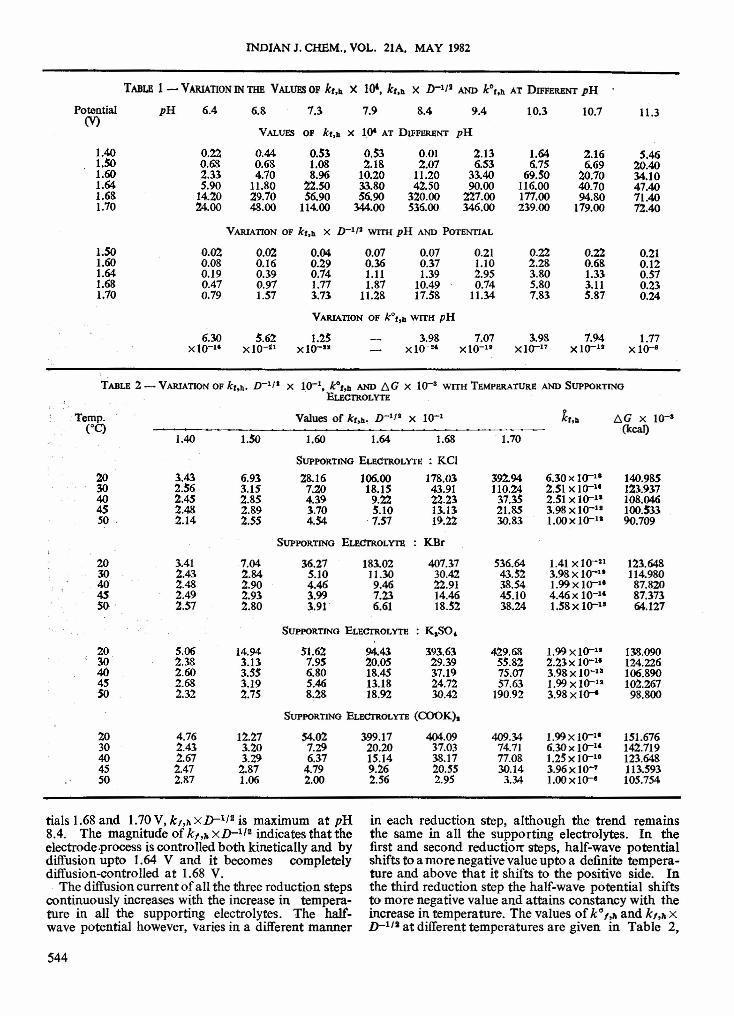
The values of k"" (Table 1) at different potentialshave been calculated by applying Koutecky's treat-ment. The variation of k,.h XD-l/2 for the thirdreduction step at all the pH 'values indicates that theprocess is completely kinetically-controlled at thefoot of the wave and becomes either completelydiffusion-controlled or tends towards it at the topof the wave. On the rising portion of the wave theprocess is partly controlled by diffusion and partlykinetically. The variation in the value of heterogene-ous rate constant kJ,1z with pH is of interest, as itdecreases first upto pH 8.4 and then increases for pHmore than 8.4 (Table 1). At pH 8.4 the value ofkr'h is minimum (3.98 X 10⁻²⁴) and as such the re-duction process is easiest. This view is also supportedby the fact that the free energy change (6G) alsoincreases from pH 6.4 to 8.4 (1.17 x 10⁵ to 1.65 x 10⁵)and then decreases from pH 9.4 to 11.3 (1.34 X 10⁵
to 0.74 X 10⁵). Table 1 shows that the value ofk,,/I xD-l/2 at potentials 1.5 to 1.64 increases conti-nuously upto pH 10.3 and then decreases. At poten-
543
INDIAN J. CHEM •• VOL. liA. MAY 1982
TABLB 1- VARIATIONINTHI! VALUESOP kt'h X 10',kr'h x D-1/' AND Pr,h AT DIFFIlRBNT pH
Potential pH 6.4 6.8 7.3 7.9 8.4 9.4 10.3 10.7 11.3(V)
VALUES Of kr,h x 10' AT DIFfERENT pH
1.40 0.22 0.44 0.53 0.53 0.01 2.13 1.64 2.16 5.461.50 0.68 0.68 1.08 2.18 2.07 6.53 6.75 6.69 20.401.60 2.33 4.70 8.96 10.20 11.20 33.40 69.SO 20.70 34.101.64 5.90 11.80 22.50 33.80 42.50 90.00 116.00 40.70 47.401.68 14.20 29.70 56.90 56.90 320.00 227.00 177.00 94.80 71.401.70 24.00 48.00 114.00 344.00 535.00 346.00 239.00 179.00 72.40
VARIATION Of kr,h x D-1/t WITH pH AND POTENTIAL
1.50 0.02 0.02 0.04 0.07 0.07 0.21 0.22 0.22 0.211.60 0.08 0.16 0.29 0.36 0.37 1.10 2.28 0.68 0.121.64 0.19 0.39 0.74 1.11 1.39 2.95 3.80 1.33 0.571.68 0.47 0.97 1.77 1.87 10.49 0.74 5.80 3.11 0.231.70 0.79 1.57 3.73 11.28 17.58 11.34 7.83 5.87 0.24
VARIATION Of kGr,h WITH pH
6.30 5.62 1.25 3.98 7.07 3.98 7.94 1.77x 10-lf X 10-11 X 10-11 X 10-2• xlO-lt X 10-11 X 10-12 x 10-"
TABLE 2 - VARIATION Of ku». /JIll x 10-1, kOr,1l AND 6,G x 10-3 WITH TEMPERATURE AND SuPPORTINGELECTROLYTE .
Temp. Values of ku». D-1/' x 10-1 kr,ll 6,G x 10-3("C) (kcal)
1.40 I.SO 1.60 1.64 1.68 1.70
SuPPORTING ELECTROLYTE: KCl
20 3.43 6.93 28.16 106.00 178.03 392.94 6.30x 10⁻¹⁸ 140.98530 2.56 3.15 7.20 18.15 43.91 110.24 2.51 x 10⁻¹& 123.93740 2.45 2.85 4.39 9.22 22.23 37.35 2.S1 X 10-11 108.04645 2.48 2.89 3.70 5.10 13.13 21.85 3.98 x 100u 100.53350· 2.14 2.55 4.54 7.57 19.22 30.83 l.ooxlO-u 90.709
SuPPORTING ELECTROLYTE KBr
20 3.41 7.04 36.27 183.02 407.37 536.64 1.41 x 10-Zl 123.64830 2.43 2.84 5.10 11.30 30.42 43.52 3.98 x 10⁻¹¹ 114.98040 2.48 2.90 4.46 9.46 22.91 38.54 1.99 x 10⁻¹¹ 87.82045 2.49 2.93 3.99 7.23 14.46 45.10 4.46 x 10⁻¹& 87.373so: 2.57 2.80 3.91' 6.61 18.52 38.24 1.58 x 100u 64.127
SuPPORTING ELECTROLYTE : KISO,
20 5.06 14.94 51.62 94.43 393.63 429.68 1.99 X 10⁻¹¹ 138.09030 2.38 3.13 7.95 20.05 29.39 55.82 2.23x 10⁻¹• 124.22640 2.60 3.55 6.80 18.45 37.19 75.07 3.98xlO-u 106.89045 2.68 3.19 5.46 13.18 24.72 57.63 1.99 x 10⁻¹² 102.267SO 2.32 2.75 8.28 18.92 30.42 190.92 3.98 x 10-- 98.800
SuPPORTING ELECTROLYTE (COOK),
20 4.76 12.27 54.02 399.17 404.09 409.34 1.99 x 10⁻¹¹ 151.67630 2.43 3.20 7.29 20.20 37.03 74.71 6.30 x 10⁻¹& 142.71940 2.67 3.29 6.37 15.14 38.17 71.08 1.25 x 10⁻¹⁰ 123.64845 2.47 2.87 4.79 9.26 20.55 30.14 3.96 X 10"" 113.593SO 2.87 1.06 2.00 2.56 2.95 3.34 1.00 x 10-- 105.754
tials1.68and 1.70V,kl,hXD-l/2is maximum at pH8.4. The magnitude of kl'h XD-l/2 indicates that theelectrodeprocess is controlled both kinetically and bydiffusion upto 1.64 V and it becomes completelydiffusion-controlled at 1.68 V.
The diffusion current of all the three reduction stepscontinuously increases with the increase in tempera-ture in all the supporting electrolytes. The half-wave potential however, varies in a different manner
in each reduction step, although the trend remainsthe same in all the supporting electrolytes. In thefirst and second reductiorr steps, half-wave potentialshifts to a more negative value upto a definite tempera-ture and above that it shifts to the positive side. Inthe third reduction step the half-wave potential shiftsto more negative value and attains constancy with theincrease in temperature. The values of k" /,71 and k,,71 XJ)-l/t at different temperatures are given in Table 2,
544

which show that the reduction process becomes easierwith the increase in temperature. The value k"" x D-I/3indicates that the electrode process remains kineticallycontrolled even at the top of the wave at higher tem-peratures. The energy of activation of the processhas been found to be 100.67kcal in KCI; 114.40 kcalin KBr; 109.82 kcal in K2S04 and 107.48 kcal in(COOK)2. The free energy change (6G) of theprocess decreases with the increase in temperature(Table 2) in all the supporting electrolytes and lendssupport to the views mentioned above.
The authors are thankful to the CSIR, New Delhifor awarding a fellowship to one of them (R.S.K.).Thanks are also due to the Principal and Head of theChemistry Department, Agra College, Agra for pro-
" viding necessary facilities.References
1. KOLTHOFF, I. M. & TOREN, P. E., J. Am. chem, Soc.,75 (1753), 1197.
2. KASHYAP, R. S., SHARMA, P. N. & ARVIND KUMAR,Indian J. Chem., 19A (1980), 535.
3. CAMBI & SZEGO, Gazz. chim. ital., 58 (1928), 71.
Dissociation of Some Coumarins & Indanediones
SHUKLA SARKAR & B. B. NATH*
Department of Chemistry, Visva-Bharati, Santiniketan 731 235
Received 29 June 1981; revised and accepted 18 November 1981
Proton association constants corresponding to the OH groupsof dicoumarate, acenoeoumarfnate and phenylindanedionate ionshave been evaluated, keeping in view the hydrogen bonding presentin different equilibrium structures of these compounds.
THE study of dissociation of OH groups ofcoumarins and indanediones is of interest
since these compounds are used as anticoagulants!and inhibit the generation of prothrombin in liverby a mechanism, not completely understood=".
Dicoumarol (Sigma, USA) solution (0.5 x IQ-2M)was prepared in 50% (v/v) dioxan-water while eachof acenocoumarol (Suhrid Geigy, India) (0.4 xIO-2M) and phenylindanedione (Biological EvansLtd., India) (0.5 x 10⁻³ M) in 50% (v/v) ethanol-water. Log K values corresponding to the protonassociation with dicoumarate, acenocoumarinate andphenylindanedionate ions were determined titri-metrically! in the presence of HCI04, at an ionicstrength of 0.1 maintained with NaCI04.pK* values,corresponding to the dissociation constant K* ofthe compounds were obtained from plots oflog [l-nA/nA] against pH as reported earlier",
On the basis of proton ligand stability and thermo-dynamic constants (Table 1), the equilibria shownin Scheme 1 for the various compounds, aresuggested.
In the case of dicomuarol, three equilibrium struc-tures (a), (b) and (c) are possible (Scheme 1). Struc-ture (a) allows both the OH group at C-4 and
NOTES
TABLE 1 -- PROTON ASSUCIATION OF LIGANDS AND THERMO-DYNAMICPARAMETERSAT 30°C
Temp. Log K -LG -LH LS(0C) (pK*) kJ mor= kJ rnol ? JK-l mol=
DICOUMAROL
23 -,.408 31.0330 5.35 ~1.04 7.4.97 20.0437 528 31 31
AL.ENOCOUMAROL
23 6.05 34.2930 5.69 33.01 76.55 -143.7037 5.44 32.29
PHENYLINDANEDIONE
23 4.33 24.5130 4.30 24.95 12.70 40.4337 4.23 25.07
C-4' to dissociate while ins tructures (b) and (c)one of the OH groups is involved in hydrogen bond-ing with ketonic oxygens at C-2 and C-2' respec-tively.
Higher log Kvalues in the case of acenocoumarol(Table 1) indicate that the dissociation of C4-OHis possible only in equilibrium structure (e), since instructure (d), hydrogen bonding is present and freedissociation is possible only to a very limited extent.
DICOUMAROL(a)
----(c)
NOz
(d)ACENOCOUMAROL
OH1
~~ ~ '\.JJ11o(9)
PHENYL INOANEOIONE
Scheme 1 - Equilibrium structures of dicoumarol, aceno-coumarol, phenylindanedione based on stability constant values.
545