j ohn hancock variable insurance trust - … prospectus.pdf · j ohn hancock variable insurance...
TRANSCRIPT
John Hancock Variable Insurance Trust601 Congress Street, Boston, Massachusetts 02210
John Hancock Variable Insurance Trust (“JHVIT” or the “Trust”) is an open-end management investment company, commonly known as a mutualfund. Shares of JHVIT are not offered directly to the public but are sold only to insurance companies and their separate accounts as the underlyinginvestment option for variable annuity and variable life insurance contracts (“variable contracts”). JHVIT provides a range of investment objectivesthrough separate investment portfolios or funds (each a “fund,” collectively the “funds”). The following funds are described in this Prospectus. OnlySeries I of certain funds have ticker symbols, which are noted below, as applicable. JHVIT offers Series NAV, Series I, Series II and Series III shares,although not all funds offer all classes of shares.
Ticker Ticker
Fund Name Series I Fund Name Series I
500 Index Trust (formerly 500 Index Trust B) JFIVX Lifecycle 2050 Trust —Active Bond Trust — Lifestyle Aggressive Portfolio (formerly Lifestyle Aggressive PS
Series)—
American Asset Allocation Trust — Lifestyle Balanced Portfolio (formerly Lifestyle Balanced PSSeries)
JHBPX
American Global Growth Trust — Lifestyle Conservative Portfolio (formerly Lifestyle ConservativePS Series)
JHCIX
American Growth Trust — Lifestyle Growth Portfolio (formerly Lifestyle Growth PS Series) JHGPXAmerican Growth-Income Trust — Lifestyle Moderate Portfolio (formerly Lifestyle Moderate PS
Series)JHMPX
American International Trust — Managed Volatility Aggressive Portfolio (formerly LifestyleAggressive MVP)
—
Blue Chip Growth Trust — Managed Volatility Balanced Portfolio (formerly LifestyleBalanced MVP)
JELBX
Capital Appreciation Trust — Managed Volatility Conservative Portfolio (formerly LifestyleConservative MVP)
JELCX
Capital Appreciation Value Trust — Managed Volatility Growth Portfolio (formerly Lifestyle GrowthMVP)
JELGX
Core Bond Trust — Managed Volatility Moderate Portfolio (formerly LifestyleModerate MVP)
JELMX
Emerging Markets Value Trust — Mid Cap Index Trust JECIXEquity Income Trust — Mid Cap Stock Trust —Financial Industries Trust JEFSX Mid Value Trust JEMUXFundamental All Cap Core Trust JEQAX Money Market Trust JHOXXFundamental Large Cap Value Trust — Mutual Shares Trust —Global Trust JEFGX New Income Trust —Global Bond Trust — Real Estate Securities Trust —Health Sciences Trust JEHSX Science & Technology Trust JESTXHigh Yield Trust — Select Bond Trust (formerly Bond Trust) —International Equity Index Trust (formerly International Equity
Index Trust B)JIEQX Short Term Government Income Trust —
International Growth Stock Trust — Small Cap Index Trust JESIXInternational Small Company Trust — Small Cap Opportunities Trust —International Value Trust — Small Cap Stock Trust (formerly Small Cap Growth Trust) JESGXInvestment Quality Bond Trust — Small Cap Value Trust JESVXLifecycle 2010 Trust — Small Company Value Trust —Lifecycle 2015 Trust — Strategic Equity Allocation Trust —Lifecycle 2020 Trust — Strategic Income Opportunities Trust JESNXLifecycle 2025 Trust — Total Bond Market Trust (formerly Total Bond Market Trust B) JTBMXLifecycle 2030 Trust — Total Stock Market Index Trust JETSXLifecycle 2035 Trust — Ultra Short Term Bond Trust JUSAXLifecycle 2040 Trust — Utilities Trust JEUTXLifecycle 2045 Trust —
Neither the Securities and Exchange Commission (the “SEC”) nor any state securities commission has approved or disapproved of thesesecurities or passed upon the adequacy of this Prospectus. Any representation to the contrary is a criminal offense. No person, including anydealer or salesperson, has been authorized to give any information or to make any representations, unless the information orrepresentation is set forth in this Prospectus. If any such unauthorized information or representation is given, it should not be relied uponas having been authorized by JHVIT, the advisor or any subadvisors to JHVIT or the principal underwriter of the shares. This Prospectus isnot an offer to sell shares of JHVIT in any state where such offer or sale would be prohibited.
Prospectus dated April 30, 2018

John Hancock Variable Insurance TrustTable of contents500 Index Trust
Active Bond Trust
American Asset Allocation Trust
American Global Growth Trust
American Growth Trust
American Growth-Income Trust
American International Trust
Blue Chip Growth Trust
Capital Appreciation Trust
Capital Appreciation Value Trust
Core Bond Trust
Emerging Markets Value Trust
Equity Income Trust
Financial Industries Trust
Fundamental All Cap Core Trust
Fundamental Large Cap Value Trust
Global Trust
Global Bond Trust
Health Sciences Trust
High Yield Trust
International Equity Index Trust
International Growth Stock Trust
International Small Company Trust
International Value Trust
Investment Quality Bond Trust
Lifecycle 2010 Trust
Lifecycle 2015 Trust
Lifecycle 2020 Trust
Lifecycle 2025 Trust
Lifecycle 2030 Trust
Lifecycle 2035 Trust
Lifecycle 2040 Trust
Lifecycle 2045 Trust
Lifecycle 2050 Trust
Lifestyle Aggressive Portfolio
Lifestyle Balanced Portfolio
Lifestyle Conservative Portfolio
Lifestyle Growth Portfolio
Lifestyle Moderate Portfolio
Managed Volatility Aggressive Portfolio
Managed Volatility Balanced Portfolio
Managed Volatility Conservative Portfolio
Managed Volatility Growth Portfolio
Managed Volatility Moderate Portfolio
Mid Cap Index Trust
Mid Cap Stock Trust
1
1
4
8
11
14
17
20
23
27
31
35
38
42
46
50
53
56
59
63
66
69
72
75
79
82
86
91
96
101
106
111
116
121
126
131
136
141
146
151
156
163
170
177
184
191
194
Mid Value Trust
Money Market Trust
Mutual Shares Trust
New Income Trust
Real Estate Securities Trust
Science & Technology Trust
Select Bond Trust
Short Term Government Income Trust
Small Cap Index Trust
Small Cap Opportunities Trust
Small Cap Stock Trust
Small Cap Value Trust
Small Company Value Trust
Strategic Equity Allocation Trust
Strategic Income Opportunities Trust
Total Bond Market Trust
Total Stock Market Index Trust
Ultra Short Term Bond Trust
Utilities Trust
ADDITIONAL INFORMATION ABOUT THE FUNDS
OTHER PERMITTED INVESTMENTS BY THE FUNDS OF FUNDS
ADDITIONAL INFORMATION ABOUT THE FUNDS OF FUNDS' PRINCIPAL RISKS
ADDITIONAL INFORMATION ABOUT THE FUNDS' PRINCIPAL RISKS
ADDITIONAL INFORMATION ABOUT THE FUNDS' INVESTMENT POLICIES (INCLUDING EACH FUND OF FUNDS)
MANAGEMENT
Board of Trustees
Investment Management
Subadvisors and Portfolio Managers
SHARE CLASSES AND RULE 12B-1 PLANS
Share classes
Rule 12b-1 Plans
GENERAL INFORMATION
Purchase and redemption of shares
Valuation of shares
Valuation of securities
Dividends
Disruptive short term trading
Policy regarding disclosure of fund portfolio holdings
XBRL filings
Additional information about fund expenses
FINANCIAL HIGHLIGHTS
APPENDIX ASCHEDULE OF MANAGEMENT FEES
FOR MORE INFORMATION
2
197
200
203
207
210
213
217
220
223
226
230
233
236
240
243
246
249
252
255
258
258
260
266
280
281
281
281
282
294
294
294
295
295
295
295
296
297
297
297
298
299
330
337
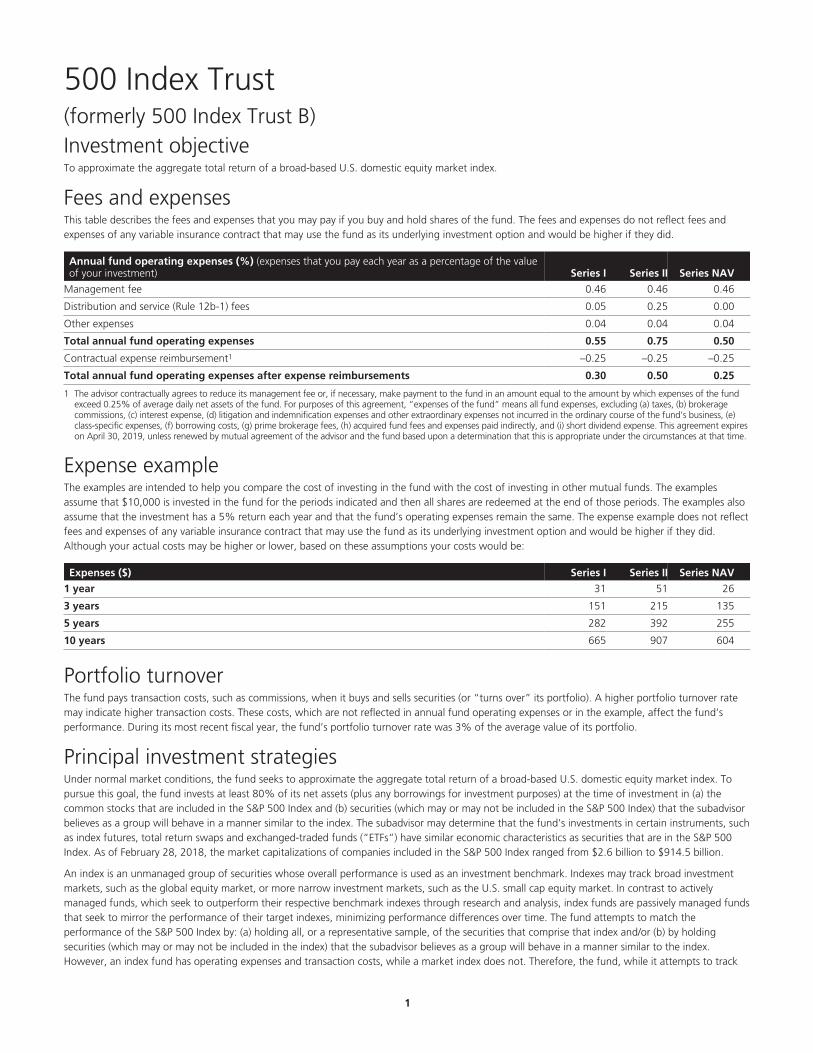
500 Index Trust (formerly 500 Index Trust B)Investment objectiveTo approximate the aggregate total return of a broad-based U.S. domestic equity market index.
Fees and expensesThis table describes the fees and expenses that you may pay if you buy and hold shares of the fund. The fees and expenses do not reflect fees andexpenses of any variable insurance contract that may use the fund as its underlying investment option and would be higher if they did.
Annual fund operating expenses (%) (expenses that you pay each year as a percentage of the valueof your investment) Series I Series II Series NAV
Management fee 0.46 0.46 0.46
Distribution and service (Rule 12b-1) fees 0.05 0.25 0.00
Other expenses 0.04 0.04 0.04
Total annual fund operating expenses 0.55 0.75 0.50
Contractual expense reimbursement1 –0.25 –0.25 –0.25
Total annual fund operating expenses after expense reimbursements 0.30 0.50 0.25
1 The advisor contractually agrees to reduce its management fee or, if necessary, make payment to the fund in an amount equal to the amount by which expenses of the fundexceed 0.25% of average daily net assets of the fund. For purposes of this agreement, “expenses of the fund” means all fund expenses, excluding (a) taxes, (b) brokeragecommissions, (c) interest expense, (d) litigation and indemnification expenses and other extraordinary expenses not incurred in the ordinary course of the fund’s business, (e)class-specific expenses, (f) borrowing costs, (g) prime brokerage fees, (h) acquired fund fees and expenses paid indirectly, and (i) short dividend expense. This agreement expireson April 30, 2019, unless renewed by mutual agreement of the advisor and the fund based upon a determination that this is appropriate under the circumstances at that time.
Expense exampleThe examples are intended to help you compare the cost of investing in the fund with the cost of investing in other mutual funds. The examplesassume that $10,000 is invested in the fund for the periods indicated and then all shares are redeemed at the end of those periods. The examples alsoassume that the investment has a 5% return each year and that the fund’s operating expenses remain the same. The expense example does not reflectfees and expenses of any variable insurance contract that may use the fund as its underlying investment option and would be higher if they did.Although your actual costs may be higher or lower, based on these assumptions your costs would be:
Expenses ($) Series I Series II Series NAV
1 year 31 51 26
3 years 151 215 135
5 years 282 392 255
10 years 665 907 604
Portfolio turnoverThe fund pays transaction costs, such as commissions, when it buys and sells securities (or “turns over” its portfolio). A higher portfolio turnover ratemay indicate higher transaction costs. These costs, which are not reflected in annual fund operating expenses or in the example, affect the fund’sperformance. During its most recent fiscal year, the fund’s portfolio turnover rate was 3% of the average value of its portfolio.
Principal investment strategiesUnder normal market conditions, the fund seeks to approximate the aggregate total return of a broad-based U.S. domestic equity market index. Topursue this goal, the fund invests at least 80% of its net assets (plus any borrowings for investment purposes) at the time of investment in (a) thecommon stocks that are included in the S&P 500 Index and (b) securities (which may or may not be included in the S&P 500 Index) that the subadvisorbelieves as a group will behave in a manner similar to the index. The subadvisor may determine that the fund’s investments in certain instruments, suchas index futures, total return swaps and exchanged-traded funds (“ETFs”) have similar economic characteristics as securities that are in the S&P 500Index. As of February 28, 2018, the market capitalizations of companies included in the S&P 500 Index ranged from $2.6 billion to $914.5 billion.
An index is an unmanaged group of securities whose overall performance is used as an investment benchmark. Indexes may track broad investmentmarkets, such as the global equity market, or more narrow investment markets, such as the U.S. small cap equity market. In contrast to activelymanaged funds, which seek to outperform their respective benchmark indexes through research and analysis, index funds are passively managed fundsthat seek to mirror the performance of their target indexes, minimizing performance differences over time. The fund attempts to match theperformance of the S&P 500 Index by: (a) holding all, or a representative sample, of the securities that comprise that index and/or (b) by holdingsecurities (which may or may not be included in the index) that the subadvisor believes as a group will behave in a manner similar to the index.However, an index fund has operating expenses and transaction costs, while a market index does not. Therefore, the fund, while it attempts to track
.1
its target index closely, typically will be unable to match the performance of the index exactly. The composition of an index changes from time to time,and the subadvisor will reflect those changes in the composition of the fund’s portfolio as soon as practicable.
Use of Hedging and Other Strategic Transactions. The fund may invest in futures contracts, swaps, and depositary receipts. The fund may invest inderivatives (investments whose value is based on securities, indexes or currencies).
Principal risksThe fund is subject to risks, and you could lose money by investing in the fund. The principal risks of investing in the fund include:
Credit and counterparty risk. The counterparty to an over-the-counter derivatives contract or a borrower of fund securities may not make timelypayments or otherwise honor its obligations.
Cybersecurity and operational risk. Cybersecurity breaches may allow an unauthorized party to gain access to fund assets, customer data, orproprietary information, or cause a fund or its service providers to suffer data corruption or lose operational functionality. Similar incidents affectingissuers of a fund’s securities may negatively impact performance. Operational risk may arise from human error, error by third parties, communicationerrors, or technology failures, among other causes.
Economic and market events risk. Events in the U.S. and global financial markets, including actions taken by the U.S. Federal Reserve or foreigncentral banks to stimulate or stabilize economic growth, may at times result in unusually high market volatility, which could negatively impactperformance. Reduced liquidity in credit and fixed-income markets could adversely affect issuers worldwide. Banks and financial services companiescould suffer losses if interest rates rise or economic conditions deteriorate.
Equity securities risk. The price of equity securities may decline due to changes in a company’s financial condition or overall market conditions.
Exchange-traded funds risk. An ETF generally reflects the risks of the underlying securities it is designed to track. A fund bears ETF fees and expensesindirectly.
Hedging, derivatives, and other strategic transactions risk. Hedging, derivatives, and other strategic transactions may increase a fund’s volatilityand could produce disproportionate losses, potentially more than the fund’s principal investment. Risks of these transactions are different from andpossibly greater than risks of investing directly in securities and other traditional instruments. Under certain market conditions, derivatives couldbecome harder to value or sell and may become subject to liquidity risk (i.e., the inability to enter into closing transactions). Regulatory changes inderivative markets could impact the cost of or the fund’s ability to engage in derivatives transactions. Derivatives and other strategic transactions thatthe fund intends to utilize include: futures contracts, depositary receipts, total return swaps, and swaps. Futures contracts and swaps generally aresubject to counterparty risk. In addition, swaps may be subject to interest-rate and settlement risk, and the risk of default of the underlying referenceobligation.
Index management risk. Certain factors may cause a fund that is an index fund to track its target index less closely. For example, a subadvisor mayselect securities that are not fully representative of the index, and the fund’s transaction expenses, and the size and timing of its cash flows, may resultin the fund’s performance being different than that of its index. Moreover, the fund will generally reflect the performance of its target index evenwhen the index does not perform well.
Liquidity risk. The extent (if at all) to which a security may be sold or a derivative position closed without negatively impacting its market value may beimpaired by reduced market activity or participation, legal restrictions, or other economic and market impediments.
Sector risk. When a fund focuses its investments in certain sectors of the economy, its performance may be driven largely by sector performance andcould fluctuate more widely than if the fund were invested more evenly across sectors.
S&P 500 Index risk An investment in the fund involves risks similar to the risks of investing directly in the equity securities included in the S&P 500Index.
Past performanceThe following information provides some indication of the risks of investing in the fund by showing changes in performance from year to year and byshowing how average annual returns for specified periods compare with those of a broad measure of market performance. Performance shown forperiods prior to the inception date of a class is the performance of the fund’s oldest share class. This pre-inception performance, with respect to anyother share class of the fund, has not been adjusted to reflect the Rule 12b-1 fees of that class. As a result, the pre-inception performance shown for ashare class other than the oldest share class may be higher or lower than it would be if adjusted to reflect the Rule 12b-1 fees of the class. Theperformance information below does not reflect fees and expenses of any variable insurance contract which may use JHVIT as its underlying investmentoption. If such fees and expenses had been reflected, performance would be lower. The past performance of the fund is not necessarily an indicationof how the fund will perform in the future.
.2

Calendar year total returns for Series NAV (%)
2008 2009 2010 2011 2012 2013 2014 2015 2016 2017
–37.19 26.35 14.86 1.87 15.80 32.03 13.43 1.15 11.64 21.54
Best quarter: Q2 ‘09, 15.85%
Worst quarter: Q4 ‘08, –22.11%
Average Annual Total Returns for Period Ended 12/31/2017
Average annual total returns (%) 1 Year 5 Year 10 YearDate of
Inception
Series I 21.52 15.45 8.23 11/05/12
Series II 21.28 15.23 8.12 11/05/12
Series NAV 21.54 15.50 8.25 05/01/96
S&P 500 Index (reflects no deduction for fees, expenses, or taxes) 21.83 15.79 8.50
Investment managementInvestment Advisor John Hancock Investment Management Services, LLC§
Subadvisor John Hancock Asset Management a division of Manulife Asset Management (North America) Limited
Portfolio managementBrett Hryb, CFAManaging Director and Senior Portfolio ManagerManaged fund since 2014
Ashikhusein Shahpurwala, CFAManaging Director and Senior Portfolio ManagerManaged fund since 2013
Other important information regarding the fundFor important information about taxes and financial intermediary compensation, please turn to “Additional information about the funds” at page258 of the Prospectus.
.3

Active Bond Trust Investment objectiveTo seek income and capital appreciation.
Fees and expensesThis table describes the fees and expenses that you may pay if you buy and hold shares of the fund. The fees and expenses do not reflect fees andexpenses of any variable insurance contract that may use the fund as its underlying investment option and would be higher if they did.
Annual fund operating expenses (%) (expenses that you pay each year as a percentage of the valueof your investment) Series I Series II Series NAV
Management fee 0.60 0.60 0.60
Distribution and service (Rule 12b-1) fees 0.05 0.25 0.00
Other expenses 0.05 0.05 0.05
Acquired fund fees and expenses1 0.01 0.01 0.01
Total annual fund operating expenses2 0.71 0.91 0.66
1 “Acquired fund fees and expenses” are based on indirect net expenses associated with the fund’s investments in underlying investment companies.2 The “Total annual fund operating expenses” shown may not correlate to the fund’s ratios of expenses to average daily net assets shown in the “Financial highlights” section of
the fund’s prospectus, which does not include “Acquired fund fees and expenses.”
Expense exampleThe examples are intended to help you compare the cost of investing in the fund with the cost of investing in other mutual funds. The examplesassume that $10,000 is invested in the fund for the periods indicated and then all shares are redeemed at the end of those periods. The examples alsoassume that the investment has a 5% return each year and that the fund’s operating expenses remain the same. The expense example does not reflectfees and expenses of any variable insurance contract that may use the fund as its underlying investment option and would be higher if they did.Although your actual costs may be higher or lower, based on these assumptions your costs would be:
Expenses ($) Series I Series II Series NAV
1 year 73 93 67
3 years 227 290 211
5 years 395 504 368
10 years 883 1,120 822
Portfolio turnoverThe fund pays transaction costs, such as commissions, when it buys and sells securities (or “turns over” its portfolio). A higher portfolio turnover ratemay indicate higher transaction costs. These costs, which are not reflected in annual fund operating expenses or in the example, affect the fund’sperformance. During its most recent fiscal year, the fund’s portfolio turnover rate was 86% of the average value of its portfolio.
Principal investment strategiesUnder normal market conditions, the fund invests at least 80% of its net assets (plus any borrowings for investment purposes) in a diversified mix ofdebt securities and instruments. The fund seeks to invest its assets in debt securities and instruments with an average duration of between 4 to 6 years,however, there is no limit on the fund’s average maturity. As part of its investment strategy, the fund may invest in mortgage-backed securities to asignificant extent.
Eligible investments include, but are not limited to:
U.S. Treasury and agency securities;
Asset-backed securities and mortgage-backed securities, both investment grade and below-investment grade, including mortgage pass-throughsecurities, commercial mortgage-backed securities (“CMBS”) and collateralized mortgage obligations (“CMOs”);
Corporate bonds, both U.S. and foreign, and without any limit on credit quality; and
Foreign government and agency securities.
The fund may invest in asset-backed securities rated, at the time of purchase, less than A (but not rated lower than B by Standard & Poor’s RatingsServices (“S&P”) or Moody’s Investors Service (“Moody’s”). The subadvisor uses proprietary research and economic and industry analysis to identifyspecific bonds, bond sectors and industries that are attractively priced. Due to this process, the fund may have a higher than average portfolio turnoverratio, which may increase expenses and affect performance results.
The foreign securities in which the fund invests may be denominated in U.S. dollars or foreign currency.
.4
John Hancock Asset Management manages the fund with two investment teams, each of which employs its own investment approach andindependently manages its portion of the fund. The fund will be rebalanced periodically so that each team manages the following portions of thefund:
50%* Securitized Asset Team
50%* Core / Core Plus Team
*Percentages are approximate. Since the fund is only rebalanced periodically, the actual portion of the fund managed by each team will vary.
This allocation methodology may change in the future.
Securitized Asset Team
The Securitized Asset Team uses a combination of proprietary research and quantitative tools and seeks to identify bonds and bond sectors that areattractively priced based upon market fundamentals and technical factors. The Securitized Asset Team opportunistically emphasizes bonds with yieldsin excess of U.S. Treasury securities.
This portion of the fund normally has no more than 10% of its total assets in high yield bonds (“junk bonds”) and normally invests in foreign securitiesonly if U.S. dollar-denominated. This portion of the fund normally has an average credit rating of “A” or “AA.”
The Core / Core Plus Team
The Core / Core Plus Team uses proprietary research to identify specific bond sectors, industries and bonds that are attractively priced. The team seeksto anticipate shifts in the business cycle, using economic and industry analysis to determine which sectors and industries might benefit over the next 12months.
This portion of the fund normally has no more than 25% of its total assets in high yield bonds (sometimes referred to as “junk bonds”) and may investin both U.S. dollar-denominated and foreign currency-denominated foreign securities. This portion of the fund normally has an average credit rating of“A” or “AA.”
Under normal circumstances, no more than 15% of the total assets of the portion of the fund managed by the Core / Core Plus Team will be investedin asset-backed securities rated lower than A by both rating agencies. The fund’s investment policies are based on credit ratings at the time ofpurchase.
Use of Hedging and Other Strategic Transactions. The fund is authorized to use all of the various investment strategies referred to under “AdditionalInformation About the Funds’ Principal Risks — Hedging, derivatives and other strategic transactions risk” including, but not limited to, U.S. Treasuryfutures and options, index derivatives, credit default swaps and forwards.
Principal risksThe fund is subject to risks, and you could lose money by investing in the fund. The principal risks of investing in the fund include:
Changing distribution levels risk. The fund may cease or reduce the level of its distribution or make a greater return of capital if income ordividends paid from its investments declines.
Credit and counterparty risk. The issuer or guarantor of a fixed-income security, the counterparty to an over-the-counter derivatives contract, or aborrower of fund securities may not make timely payments or otherwise honor its obligations. U.S. government securities are subject to varyingdegrees of credit risk depending upon the nature of their support. A downgrade or default affecting any of the fund’s securities could affect the fund’sperformance.
Cybersecurity and operational risk. Cybersecurity breaches may allow an unauthorized party to gain access to fund assets, customer data, orproprietary information, or cause a fund or its service providers to suffer data corruption or lose operational functionality. Similar incidents affectingissuers of a fund’s securities may negatively impact performance. Operational risk may arise from human error, error by third parties, communicationerrors, or technology failures, among other causes.
Economic and market events risk. Events in the U.S. and global financial markets, including actions taken by the U.S. Federal Reserve or foreigncentral banks to stimulate or stabilize economic growth, may at times result in unusually high market volatility, which could negatively impactperformance. Reduced liquidity in credit and fixed-income markets could adversely affect issuers worldwide. Banks and financial services companiescould suffer losses if interest rates rise or economic conditions deteriorate.
Fixed-income securities risk. A rise in interest rates typically causes bond prices to fall. The longer the average maturity or duration of the bonds heldby a fund, the more sensitive it will likely be to interest-rate fluctuations. An issuer may not make all interest payments or repay all or any of theprincipal borrowed. Changes in a security’s credit quality may adversely affect fund performance.
Foreign securities risk. Less information may be publicly available regarding foreign issuers. Foreign securities may be subject to foreign taxes andmay be more volatile than U.S. securities. Currency fluctuations and political and economic developments may adversely impact the value of foreignsecurities.
Hedging, derivatives, and other strategic transactions risk. Hedging, derivatives, and other strategic transactions may increase a fund’s volatilityand could produce disproportionate losses, potentially more than the fund’s principal investment. Risks of these transactions are different from andpossibly greater than risks of investing directly in securities and other traditional instruments. Under certain market conditions, derivatives couldbecome harder to value or sell and may become subject to liquidity risk (i.e., the inability to enter into closing transactions). Regulatory changes in
.5

derivative markets could impact the cost of or the fund’s ability to engage in derivatives transactions. Derivatives and other strategic transactions thatthe fund intends to utilize include: foreign currency forward contracts, futures contracts, options, and credit default swaps. Foreign currency forwardcontracts, futures contracts, options, and swaps generally are subject to counterparty risk. In addition, swaps may be subject to interest-rate andsettlement risk, and the risk of default of the underlying reference obligation.
High portfolio turnover risk. Trading securities actively and frequently can increase transaction costs (thus lowering performance) and taxabledistributions.
Liquidity risk. The extent (if at all) to which a security may be sold or a derivative position closed without negatively impacting its market value may beimpaired by reduced market activity or participation, legal restrictions, or other economic and market impediments. Liquidity risk may be magnified inrising interest rate environments due to higher than normal redemption rates. Widespread selling of fixed-income securities to satisfy redemptionsduring periods of reduced demand may adversely impact the price or salability of such securities. Periods of heavy redemption could cause the fund tosell assets at a loss or depressed value, which could negatively affect performance. Redemption risk is heightened during periods of declining or illiquidmarkets.
Lower-rated and high-yield fixed-income securities risk. Lower-rated and high-yield fixed-income securities (junk bonds) are subject to greatercredit quality risk, risk of default, and price volatility than higher-rated fixed-income securities, may be considered speculative, and can be difficult toresell.
Mortgage-backed and asset-backed securities risk. Mortgage-backed and asset-backed securities are subject to different combinations ofprepayment, extension, interest-rate, and other market risks.
Inverse interest-only securities Inverse interest-only securities that are mortgage-backed securities are subject to the same risks as othermortgage-backed securities. In addition, the coupon on an inverse interest-only security can be extremely sensitive to changes in prevailing interestrates.
Sector risk. When a fund focuses its investments in certain sectors of the economy, its performance may be driven largely by sector performance andcould fluctuate more widely than if the fund were invested more evenly across sectors.
Past performanceThe following information provides some indication of the risks of investing in the fund by showing changes in performance from year to year and byshowing how average annual returns for specified periods compare with those of a broad measure of market performance. The performanceinformation below does not reflect fees and expenses of any variable insurance contract which may use JHVIT as its underlying investment option. Ifsuch fees and expenses had been reflected, performance would be lower. The past performance of the fund is not necessarily an indication of how thefund will perform in the future.
Calendar year total returns for Series NAV (%)
2008 2009 2010 2011 2012 2013 2014 2015 2016 2017
–10.48 24.86 13.91 5.97 9.76 0.19 6.97 0.12 4.50 4.89
Best quarter: Q3 ‘09, 9.91%
Worst quarter: Q4 ‘08, –5.91%
Average Annual Total Returns for Period Ended 12/31/2017
Average annual total returns (%) 1 Year 5 Year 10 YearDate of
Inception
Series I 4.84 3.25 5.64 05/02/05
Series II 4.63 3.04 5.44 05/02/05
Series NAV 4.89 3.30 5.71 03/28/86Bloomberg Barclays U.S. Aggregate Bond Index (reflects no deduction for fees, expenses, ortaxes) 3.54 2.10 4.01
Investment managementInvestment Advisor John Hancock Investment Management Services, LLC§
Subadvisor John Hancock Asset Management a division of Manulife Asset Management (US) LLC
.6

Portfolio managementPeter M. Farley, CFASenior Managing Director and Senior Portfolio Manager; John HancockAsset Management a division of Manulife Asset Management (US) LLCManaged fund since 2005
Jeffrey N. Given, CFASenior Managing Director and Senior Portfolio Manager; John HancockAsset Management a division of Manulife Asset Management(US) LLCManaged fund since 2006
Howard C. GreeneSenior Managing Director and Senior Portfolio Manager; John HancockAsset Management a division of Manulife Asset Management (US) LLCManaged fund since 2005
Other important information regarding the fundFor important information about taxes and financial intermediary compensation, please turn to “Additional information about the funds” at page258 of the Prospectus.
.7
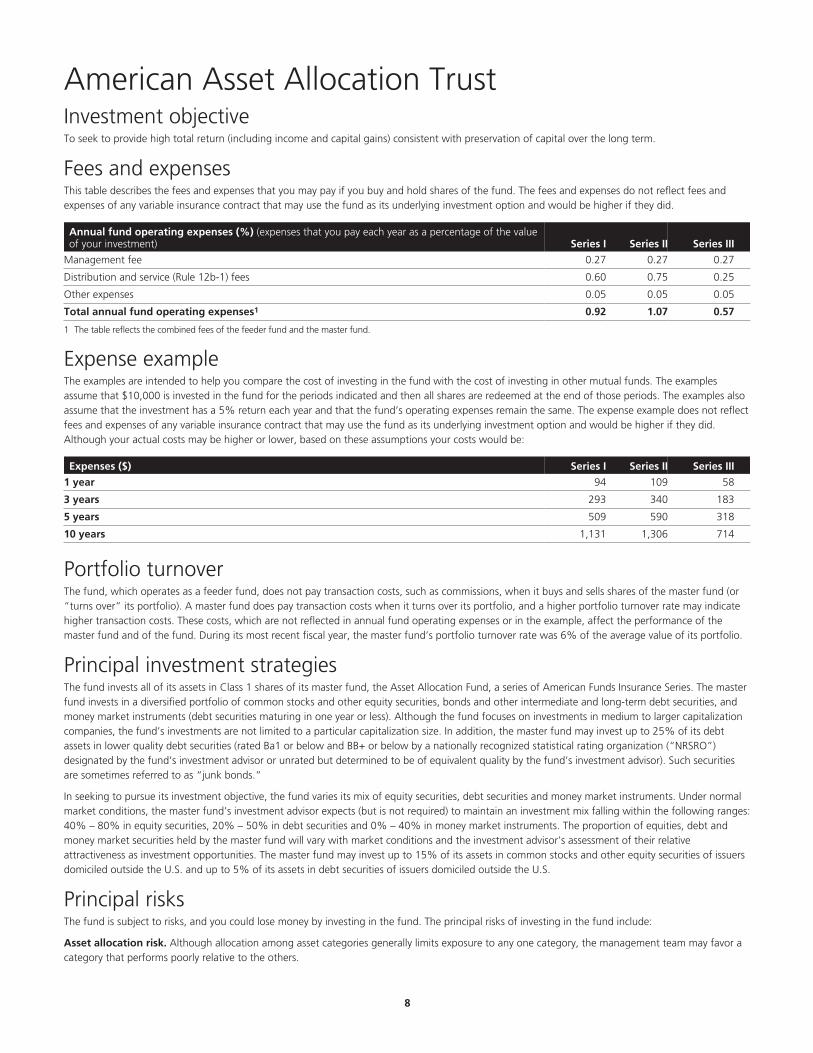
American Asset Allocation Trust Investment objectiveTo seek to provide high total return (including income and capital gains) consistent with preservation of capital over the long term.
Fees and expensesThis table describes the fees and expenses that you may pay if you buy and hold shares of the fund. The fees and expenses do not reflect fees andexpenses of any variable insurance contract that may use the fund as its underlying investment option and would be higher if they did.
Annual fund operating expenses (%) (expenses that you pay each year as a percentage of the valueof your investment) Series I Series II Series III
Management fee 0.27 0.27 0.27
Distribution and service (Rule 12b-1) fees 0.60 0.75 0.25
Other expenses 0.05 0.05 0.05
Total annual fund operating expenses1 0.92 1.07 0.57
1 The table reflects the combined fees of the feeder fund and the master fund.
Expense exampleThe examples are intended to help you compare the cost of investing in the fund with the cost of investing in other mutual funds. The examplesassume that $10,000 is invested in the fund for the periods indicated and then all shares are redeemed at the end of those periods. The examples alsoassume that the investment has a 5% return each year and that the fund’s operating expenses remain the same. The expense example does not reflectfees and expenses of any variable insurance contract that may use the fund as its underlying investment option and would be higher if they did.Although your actual costs may be higher or lower, based on these assumptions your costs would be:
Expenses ($) Series I Series II Series III
1 year 94 109 58
3 years 293 340 183
5 years 509 590 318
10 years 1,131 1,306 714
Portfolio turnoverThe fund, which operates as a feeder fund, does not pay transaction costs, such as commissions, when it buys and sells shares of the master fund (or“turns over” its portfolio). A master fund does pay transaction costs when it turns over its portfolio, and a higher portfolio turnover rate may indicatehigher transaction costs. These costs, which are not reflected in annual fund operating expenses or in the example, affect the performance of themaster fund and of the fund. During its most recent fiscal year, the master fund’s portfolio turnover rate was 6% of the average value of its portfolio.
Principal investment strategiesThe fund invests all of its assets in Class 1 shares of its master fund, the Asset Allocation Fund, a series of American Funds Insurance Series. The masterfund invests in a diversified portfolio of common stocks and other equity securities, bonds and other intermediate and long-term debt securities, andmoney market instruments (debt securities maturing in one year or less). Although the fund focuses on investments in medium to larger capitalizationcompanies, the fund’s investments are not limited to a particular capitalization size. In addition, the master fund may invest up to 25% of its debtassets in lower quality debt securities (rated Ba1 or below and BB+ or below by a nationally recognized statistical rating organization (“NRSRO”)designated by the fund’s investment advisor or unrated but determined to be of equivalent quality by the fund’s investment advisor). Such securitiesare sometimes referred to as “junk bonds.”
In seeking to pursue its investment objective, the fund varies its mix of equity securities, debt securities and money market instruments. Under normalmarket conditions, the master fund’s investment advisor expects (but is not required) to maintain an investment mix falling within the following ranges:40% – 80% in equity securities, 20% – 50% in debt securities and 0% – 40% in money market instruments. The proportion of equities, debt andmoney market securities held by the master fund will vary with market conditions and the investment advisor’s assessment of their relativeattractiveness as investment opportunities. The master fund may invest up to 15% of its assets in common stocks and other equity securities of issuersdomiciled outside the U.S. and up to 5% of its assets in debt securities of issuers domiciled outside the U.S.
Principal risksThe fund is subject to risks, and you could lose money by investing in the fund. The principal risks of investing in the fund include:
Asset allocation risk. Although allocation among asset categories generally limits exposure to any one category, the management team may favor acategory that performs poorly relative to the others.
.8
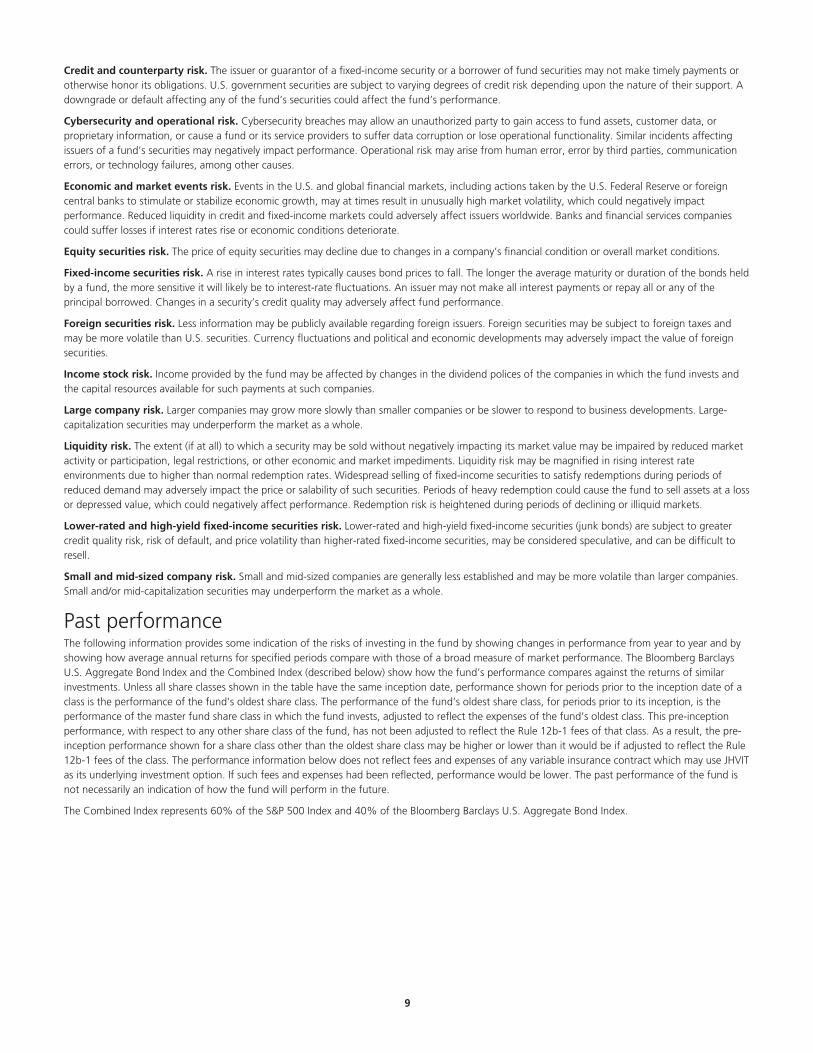
Credit and counterparty risk. The issuer or guarantor of a fixed-income security or a borrower of fund securities may not make timely payments orotherwise honor its obligations. U.S. government securities are subject to varying degrees of credit risk depending upon the nature of their support. Adowngrade or default affecting any of the fund’s securities could affect the fund’s performance.
Cybersecurity and operational risk. Cybersecurity breaches may allow an unauthorized party to gain access to fund assets, customer data, orproprietary information, or cause a fund or its service providers to suffer data corruption or lose operational functionality. Similar incidents affectingissuers of a fund’s securities may negatively impact performance. Operational risk may arise from human error, error by third parties, communicationerrors, or technology failures, among other causes.
Economic and market events risk. Events in the U.S. and global financial markets, including actions taken by the U.S. Federal Reserve or foreigncentral banks to stimulate or stabilize economic growth, may at times result in unusually high market volatility, which could negatively impactperformance. Reduced liquidity in credit and fixed-income markets could adversely affect issuers worldwide. Banks and financial services companiescould suffer losses if interest rates rise or economic conditions deteriorate.
Equity securities risk. The price of equity securities may decline due to changes in a company’s financial condition or overall market conditions.
Fixed-income securities risk. A rise in interest rates typically causes bond prices to fall. The longer the average maturity or duration of the bonds heldby a fund, the more sensitive it will likely be to interest-rate fluctuations. An issuer may not make all interest payments or repay all or any of theprincipal borrowed. Changes in a security’s credit quality may adversely affect fund performance.
Foreign securities risk. Less information may be publicly available regarding foreign issuers. Foreign securities may be subject to foreign taxes andmay be more volatile than U.S. securities. Currency fluctuations and political and economic developments may adversely impact the value of foreignsecurities.
Income stock risk. Income provided by the fund may be affected by changes in the dividend polices of the companies in which the fund invests andthe capital resources available for such payments at such companies.
Large company risk. Larger companies may grow more slowly than smaller companies or be slower to respond to business developments. Large-capitalization securities may underperform the market as a whole.
Liquidity risk. The extent (if at all) to which a security may be sold without negatively impacting its market value may be impaired by reduced marketactivity or participation, legal restrictions, or other economic and market impediments. Liquidity risk may be magnified in rising interest rateenvironments due to higher than normal redemption rates. Widespread selling of fixed-income securities to satisfy redemptions during periods ofreduced demand may adversely impact the price or salability of such securities. Periods of heavy redemption could cause the fund to sell assets at a lossor depressed value, which could negatively affect performance. Redemption risk is heightened during periods of declining or illiquid markets.
Lower-rated and high-yield fixed-income securities risk. Lower-rated and high-yield fixed-income securities (junk bonds) are subject to greatercredit quality risk, risk of default, and price volatility than higher-rated fixed-income securities, may be considered speculative, and can be difficult toresell.
Small and mid-sized company risk. Small and mid-sized companies are generally less established and may be more volatile than larger companies.Small and/or mid-capitalization securities may underperform the market as a whole.
Past performanceThe following information provides some indication of the risks of investing in the fund by showing changes in performance from year to year and byshowing how average annual returns for specified periods compare with those of a broad measure of market performance. The Bloomberg BarclaysU.S. Aggregate Bond Index and the Combined Index (described below) show how the fund’s performance compares against the returns of similarinvestments. Unless all share classes shown in the table have the same inception date, performance shown for periods prior to the inception date of aclass is the performance of the fund’s oldest share class. The performance of the fund’s oldest share class, for periods prior to its inception, is theperformance of the master fund share class in which the fund invests, adjusted to reflect the expenses of the fund’s oldest class. This pre-inceptionperformance, with respect to any other share class of the fund, has not been adjusted to reflect the Rule 12b-1 fees of that class. As a result, the pre-inception performance shown for a share class other than the oldest share class may be higher or lower than it would be if adjusted to reflect the Rule12b-1 fees of the class. The performance information below does not reflect fees and expenses of any variable insurance contract which may use JHVITas its underlying investment option. If such fees and expenses had been reflected, performance would be lower. The past performance of the fund isnot necessarily an indication of how the fund will perform in the future.
The Combined Index represents 60% of the S&P 500 Index and 40% of the Bloomberg Barclays U.S. Aggregate Bond Index.
.9

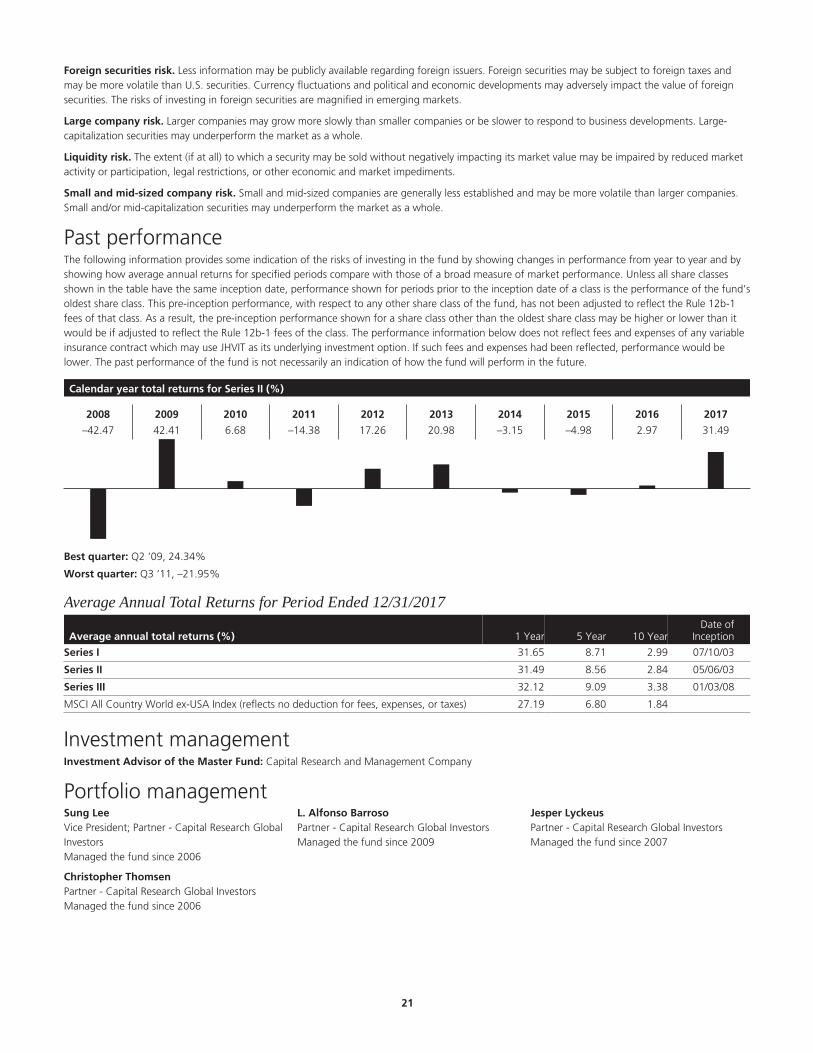
Calendar year total returns for Series II (%)
2008 2009 2010 2011 2012 2013 2014 2015 2016 2017
–29.83 23.27 11.90 0.86 15.49 23.13 4.89 0.91 8.92 15.69
Best quarter: Q3 ‘09, 11.42%
Worst quarter: Q4 ‘08, –16.41%
Average Annual Total Returns for Period Ended 12/31/2017
Average annual total returns (%) 1 Year 5 Year 10 YearDate of
Inception
Series I 15.79 10.56 6.50 04/28/08
Series II 15.69 10.43 6.35 05/01/07
Series III 16.25 10.96 6.92 01/03/08
S&P 500 Index (reflects no deduction for fees, expenses, or taxes) 21.83 15.79 8.50 Bloomberg Barclays U.S. Aggregate Bond Index (reflects no deduction for fees, expenses, ortaxes) 3.54 2.10 4.01
Combined Index (reflects no deduction for fees, expenses, or taxes) 14.21 10.25 6.98
Investment managementInvestment Advisor of the Master Fund: Capital Research and Management Company
Portfolio managementAlan N. BerroPresident; Partner - Capital World InvestorsManaged the fund since 2000
David A. DaiglePartner - Capital Fixed Income Investors, CapitalResearch and Management CompanyManaged the fund since 2009
Jeffrey T. LagerPartner - Capital World InvestorsManaged the fund since 2007
James R. MulallyPartner - Capital Fixed Income Investors, CapitalResearch and Management CompanyManaged the fund since 2006
John R. QueenVice President - Capital Fixed Income Investors,Capital Research and Management CompanyManaged the fund since 2015
Other important information regarding the fundFor important information about taxes and financial intermediary compensation, please turn to “Additional information about the funds” at page258 of the Prospectus.
.10
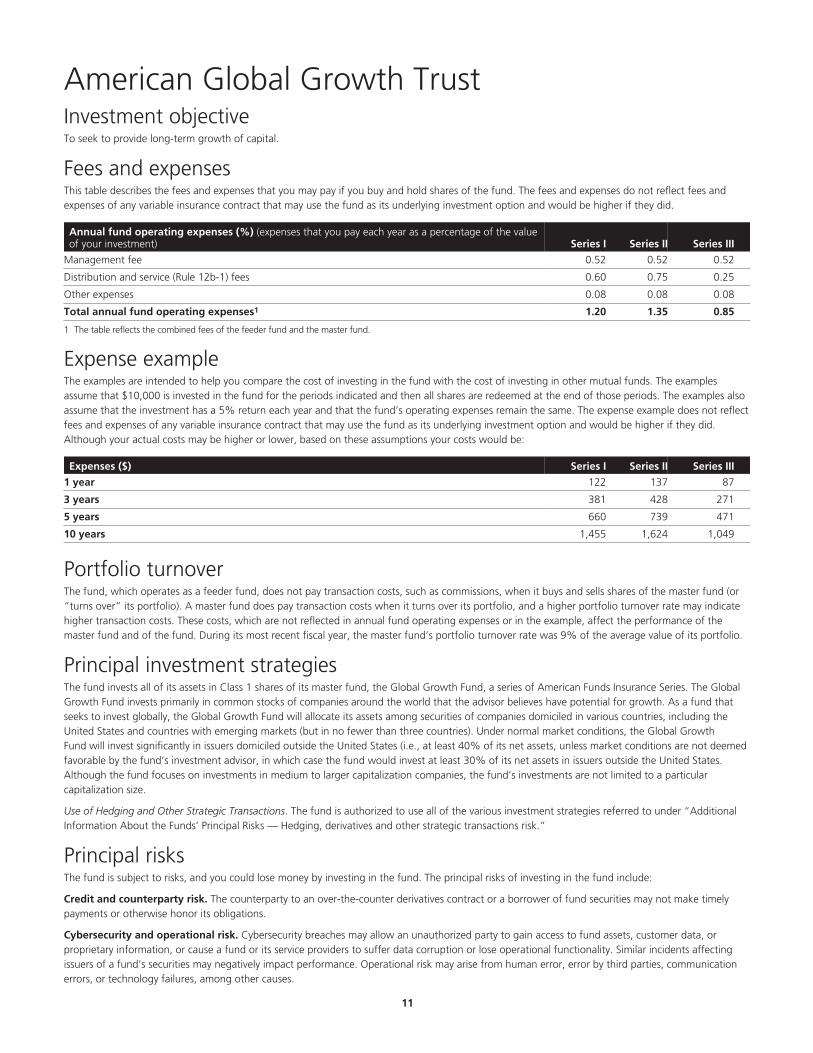
American Global Growth Trust Investment objectiveTo seek to provide long-term growth of capital.
Fees and expensesThis table describes the fees and expenses that you may pay if you buy and hold shares of the fund. The fees and expenses do not reflect fees andexpenses of any variable insurance contract that may use the fund as its underlying investment option and would be higher if they did.
Annual fund operating expenses (%) (expenses that you pay each year as a percentage of the valueof your investment) Series I Series II Series III
Management fee 0.52 0.52 0.52
Distribution and service (Rule 12b-1) fees 0.60 0.75 0.25
Other expenses 0.08 0.08 0.08
Total annual fund operating expenses1 1.20 1.35 0.85
1 The table reflects the combined fees of the feeder fund and the master fund.
Expense exampleThe examples are intended to help you compare the cost of investing in the fund with the cost of investing in other mutual funds. The examplesassume that $10,000 is invested in the fund for the periods indicated and then all shares are redeemed at the end of those periods. The examples alsoassume that the investment has a 5% return each year and that the fund’s operating expenses remain the same. The expense example does not reflectfees and expenses of any variable insurance contract that may use the fund as its underlying investment option and would be higher if they did.Although your actual costs may be higher or lower, based on these assumptions your costs would be:
Expenses ($) Series I Series II Series III
1 year 122 137 87
3 years 381 428 271
5 years 660 739 471
10 years 1,455 1,624 1,049
Portfolio turnoverThe fund, which operates as a feeder fund, does not pay transaction costs, such as commissions, when it buys and sells shares of the master fund (or“turns over” its portfolio). A master fund does pay transaction costs when it turns over its portfolio, and a higher portfolio turnover rate may indicatehigher transaction costs. These costs, which are not reflected in annual fund operating expenses or in the example, affect the performance of themaster fund and of the fund. During its most recent fiscal year, the master fund’s portfolio turnover rate was 9% of the average value of its portfolio.
Principal investment strategiesThe fund invests all of its assets in Class 1 shares of its master fund, the Global Growth Fund, a series of American Funds Insurance Series. The GlobalGrowth Fund invests primarily in common stocks of companies around the world that the advisor believes have potential for growth. As a fund thatseeks to invest globally, the Global Growth Fund will allocate its assets among securities of companies domiciled in various countries, including theUnited States and countries with emerging markets (but in no fewer than three countries). Under normal market conditions, the Global GrowthFund will invest significantly in issuers domiciled outside the United States (i.e., at least 40% of its net assets, unless market conditions are not deemedfavorable by the fund’s investment advisor, in which case the fund would invest at least 30% of its net assets in issuers outside the United States.Although the fund focuses on investments in medium to larger capitalization companies, the fund’s investments are not limited to a particularcapitalization size.
Use of Hedging and Other Strategic Transactions. The fund is authorized to use all of the various investment strategies referred to under “AdditionalInformation About the Funds’ Principal Risks — Hedging, derivatives and other strategic transactions risk.”
Principal risksThe fund is subject to risks, and you could lose money by investing in the fund. The principal risks of investing in the fund include:
Credit and counterparty risk. The counterparty to an over-the-counter derivatives contract or a borrower of fund securities may not make timelypayments or otherwise honor its obligations.
Cybersecurity and operational risk. Cybersecurity breaches may allow an unauthorized party to gain access to fund assets, customer data, orproprietary information, or cause a fund or its service providers to suffer data corruption or lose operational functionality. Similar incidents affectingissuers of a fund’s securities may negatively impact performance. Operational risk may arise from human error, error by third parties, communicationerrors, or technology failures, among other causes.
.11

Economic and market events risk. Events in the U.S. and global financial markets, including actions taken by the U.S. Federal Reserve or foreigncentral banks to stimulate or stabilize economic growth, may at times result in unusually high market volatility, which could negatively impactperformance. Reduced liquidity in credit and fixed-income markets could adversely affect issuers worldwide. Banks and financial services companiescould suffer losses if interest rates rise or economic conditions deteriorate.
Equity securities risk. The price of equity securities may decline due to changes in a company’s financial condition or overall market conditions.Growth company securities may fluctuate more in price than other securities because of the greater emphasis on earnings expectations.
Foreign securities risk. Less information may be publicly available regarding foreign issuers. Foreign securities may be subject to foreign taxes andmay be more volatile than U.S. securities. Currency fluctuations and political and economic developments may adversely impact the value of foreignsecurities. The risks of investing in foreign securities are magnified in emerging markets.
Hedging, derivatives, and other strategic transactions risk. Hedging, derivatives, and other strategic transactions may increase a fund’s volatilityand could produce disproportionate losses, potentially more than the fund’s principal investment. Risks of these transactions are different from andpossibly greater than risks of investing directly in securities and other traditional instruments. Under certain market conditions, derivatives couldbecome harder to value or sell and may become subject to liquidity risk (i.e., the inability to enter into closing transactions). Regulatory changes inderivative markets could impact the cost of or the fund’s ability to engage in derivatives transactions. Derivatives and other strategic transactions thatthe fund intends to utilize include: credit default swaps, foreign currency forward contracts, foreign currency swaps, futures contracts, futures onoptions, swaptions, interest-rate swaps, and options. Foreign currency forward contracts, futures contracts, options, and swaps generally are subject tocounterparty risk. In addition, swaps may be subject to interest-rate and settlement risk, and the risk of default of the underlying reference instrument.
Large company risk. Larger companies may grow more slowly than smaller companies or be slower to respond to business developments. Large-capitalization securities may underperform the market as a whole.
Liquidity risk. The extent (if at all) to which a security may be sold or a derivative position closed without negatively impacting its market value may beimpaired by reduced market activity or participation, legal restrictions, or other economic and market impediments.
Sector risk. When a fund focuses its investments in certain sectors of the economy, its performance may be driven largely by sector performance andcould fluctuate more widely than if the fund were invested more evenly across sectors.
Small and mid-sized company risk. Small and mid-sized companies are generally less established and may be more volatile than larger companies.Small and/or mid-capitalization securities may underperform the market as a whole.
Past performanceThe following information provides some indication of the risks of investing in the fund by showing changes in performance from year to year and byshowing how average annual returns for specified periods compare with those of a broad measure of market performance. The Lipper Global FundIndex shows how the fund’s performance compares against the returns of similar investments. Unless all share classes shown in the table have thesame inception date, performance shown for periods prior to the inception date of a class is the performance of the fund’s oldest share class. Theperformance of the fund’s oldest share class, for periods prior to its inception, is the performance of the master fund share class in which the fundinvests, adjusted to reflect the expenses of the fund’s oldest class. This pre-inception performance, with respect to any other share class of the fund,has not been adjusted to reflect the Rule 12b-1 fees of that class. As a result, the pre-inception performance shown for a share class other than theoldest share class may be higher or lower than it would be if adjusted to reflect the Rule 12b-1 fees of the class. The performance information belowdoes not reflect fees and expenses of any variable insurance contract which may use JHVIT as its underlying investment option. If such fees andexpenses had been reflected, performance would be lower. The past performance of the fund is not necessarily an indication of how the fund willperform in the future.
Calendar year total returns for Series II (%)
2008 2009 2010 2011 2012 2013 2014 2015 2016 2017
–38.68 41.42 11.17 –9.40 22.00 28.43 1.82 6.50 0.10 30.92
Best quarter: Q2 ‘09, 22.00%
Worst quarter: Q4 ‘08, –20.17%
.12
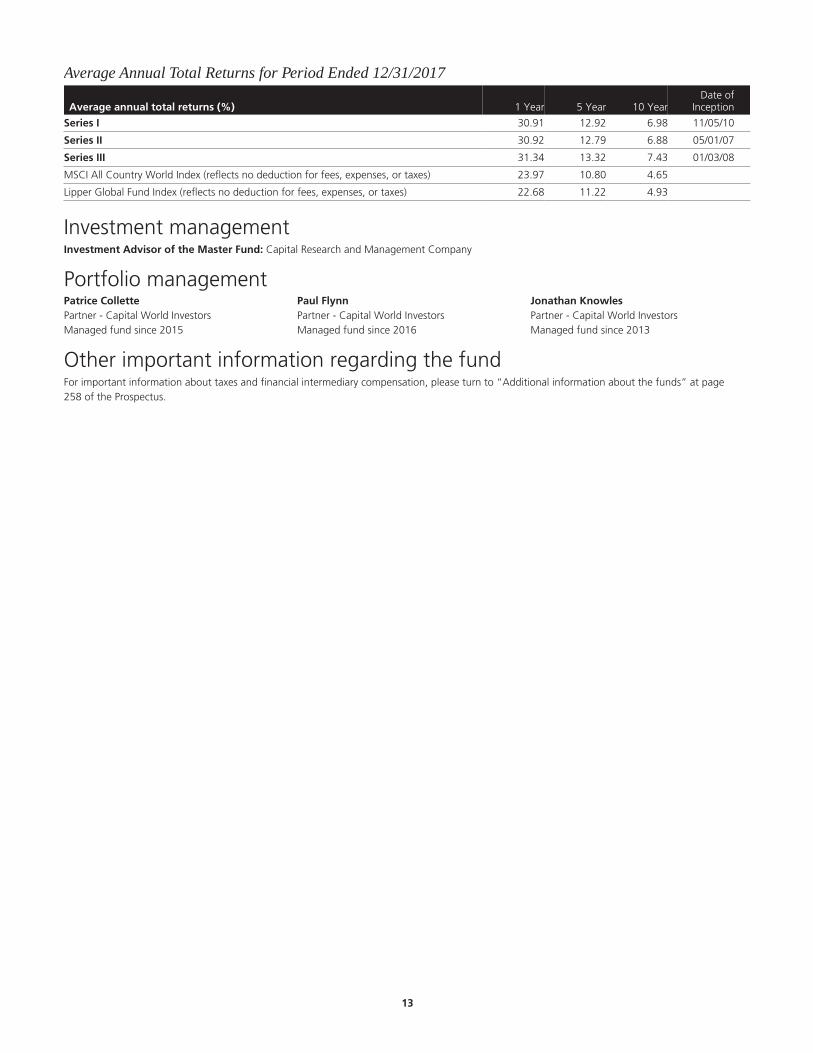
Average Annual Total Returns for Period Ended 12/31/2017
Average annual total returns (%) 1 Year 5 Year 10 YearDate of
Inception
Series I 30.91 12.92 6.98 11/05/10
Series II 30.92 12.79 6.88 05/01/07
Series III 31.34 13.32 7.43 01/03/08
MSCI All Country World Index (reflects no deduction for fees, expenses, or taxes) 23.97 10.80 4.65
Lipper Global Fund Index (reflects no deduction for fees, expenses, or taxes) 22.68 11.22 4.93
Investment managementInvestment Advisor of the Master Fund: Capital Research and Management Company
Portfolio managementPatrice CollettePartner - Capital World InvestorsManaged fund since 2015
Paul FlynnPartner - Capital World InvestorsManaged fund since 2016
Jonathan KnowlesPartner - Capital World InvestorsManaged fund since 2013
Other important information regarding the fundFor important information about taxes and financial intermediary compensation, please turn to “Additional information about the funds” at page258 of the Prospectus.
.13
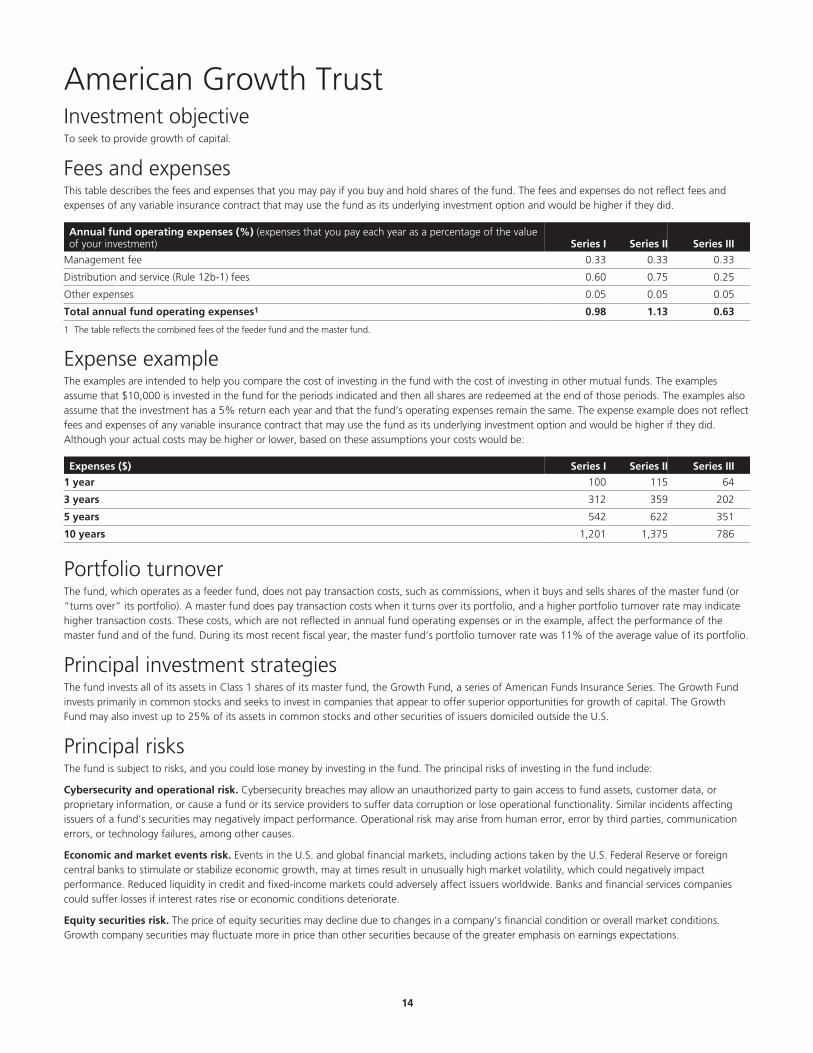
American Growth Trust Investment objectiveTo seek to provide growth of capital.
Fees and expensesThis table describes the fees and expenses that you may pay if you buy and hold shares of the fund. The fees and expenses do not reflect fees andexpenses of any variable insurance contract that may use the fund as its underlying investment option and would be higher if they did.
Annual fund operating expenses (%) (expenses that you pay each year as a percentage of the valueof your investment) Series I Series II Series III
Management fee 0.33 0.33 0.33
Distribution and service (Rule 12b-1) fees 0.60 0.75 0.25
Other expenses 0.05 0.05 0.05
Total annual fund operating expenses1 0.98 1.13 0.63
1 The table reflects the combined fees of the feeder fund and the master fund.
Expense exampleThe examples are intended to help you compare the cost of investing in the fund with the cost of investing in other mutual funds. The examplesassume that $10,000 is invested in the fund for the periods indicated and then all shares are redeemed at the end of those periods. The examples alsoassume that the investment has a 5% return each year and that the fund’s operating expenses remain the same. The expense example does not reflectfees and expenses of any variable insurance contract that may use the fund as its underlying investment option and would be higher if they did.Although your actual costs may be higher or lower, based on these assumptions your costs would be:
Expenses ($) Series I Series II Series III
1 year 100 115 64
3 years 312 359 202
5 years 542 622 351
10 years 1,201 1,375 786
Portfolio turnoverThe fund, which operates as a feeder fund, does not pay transaction costs, such as commissions, when it buys and sells shares of the master fund (or“turns over” its portfolio). A master fund does pay transaction costs when it turns over its portfolio, and a higher portfolio turnover rate may indicatehigher transaction costs. These costs, which are not reflected in annual fund operating expenses or in the example, affect the performance of themaster fund and of the fund. During its most recent fiscal year, the master fund’s portfolio turnover rate was 11% of the average value of its portfolio.
Principal investment strategiesThe fund invests all of its assets in Class 1 shares of its master fund, the Growth Fund, a series of American Funds Insurance Series. The Growth Fundinvests primarily in common stocks and seeks to invest in companies that appear to offer superior opportunities for growth of capital. The GrowthFund may also invest up to 25% of its assets in common stocks and other securities of issuers domiciled outside the U.S.
Principal risksThe fund is subject to risks, and you could lose money by investing in the fund. The principal risks of investing in the fund include:
Cybersecurity and operational risk. Cybersecurity breaches may allow an unauthorized party to gain access to fund assets, customer data, orproprietary information, or cause a fund or its service providers to suffer data corruption or lose operational functionality. Similar incidents affectingissuers of a fund’s securities may negatively impact performance. Operational risk may arise from human error, error by third parties, communicationerrors, or technology failures, among other causes.
Economic and market events risk. Events in the U.S. and global financial markets, including actions taken by the U.S. Federal Reserve or foreigncentral banks to stimulate or stabilize economic growth, may at times result in unusually high market volatility, which could negatively impactperformance. Reduced liquidity in credit and fixed-income markets could adversely affect issuers worldwide. Banks and financial services companiescould suffer losses if interest rates rise or economic conditions deteriorate.
Equity securities risk. The price of equity securities may decline due to changes in a company’s financial condition or overall market conditions.Growth company securities may fluctuate more in price than other securities because of the greater emphasis on earnings expectations.
.14

Foreign securities risk. Less information may be publicly available regarding foreign issuers. Foreign securities may be subject to foreign taxes andmay be more volatile than U.S. securities. Currency fluctuations and political and economic developments may adversely impact the value of foreignsecurities.
Large company risk. Larger companies may grow more slowly than smaller companies or be slower to respond to business developments. Large-capitalization securities may underperform the market as a whole.
Liquidity risk. The extent (if at all) to which a security may be sold without negatively impacting its market value may be impaired by reduced marketactivity or participation, legal restrictions, or other economic and market impediments.
Sector risk. When a fund focuses its investments in certain sectors of the economy, its performance may be driven largely by sector performance andcould fluctuate more widely than if the fund were invested more evenly across sectors.
Small and mid-sized company risk. Small and mid-sized companies are generally less established and may be more volatile than larger companies.Small and/or mid-capitalization securities may underperform the market as a whole.
Past performanceThe following information provides some indication of the risks of investing in the fund by showing changes in performance from year to year and byshowing how average annual returns for specified periods compare with those of a broad measure of market performance. Unless all share classesshown in the table have the same inception date, performance shown for periods prior to the inception date of a class is the performance of the fund’soldest share class. This pre-inception performance, with respect to any other share class of the fund, has not been adjusted to reflect the Rule 12b-1fees of that class. As a result, the pre-inception performance shown for a share class other than the oldest share class may be higher or lower than itwould be if adjusted to reflect the Rule 12b-1 fees of the class. The performance information below does not reflect fees and expenses of any variableinsurance contract which may use JHVIT as its underlying investment option. If such fees and expenses had been reflected, performance would belower. The past performance of the fund is not necessarily an indication of how the fund will perform in the future.
Calendar year total returns for Series II (%)
2008 2009 2010 2011 2012 2013 2014 2015 2016 2017
–44.28 38.68 18.14 –4.79 17.23 29.48 7.96 6.35 9.03 27.74
Best quarter: Q2 ‘09, 18.33%
Worst quarter: Q4 ‘08, –26.20%
Average Annual Total Returns for Period Ended 12/31/2017
Average annual total returns (%) 1 Year 5 Year 10 YearDate of
Inception
Series I 27.87 15.78 7.89 07/10/03
Series II 27.74 15.67 7.75 05/05/03
Series III 28.22 16.18 8.31 01/03/08
S&P 500 Index (reflects no deduction for fees, expenses, or taxes) 21.83 15.79 8.50
Investment managementInvestment Advisor of the Master Fund: Capital Research and Management Company
Portfolio managementMark L. CaseyPartner - Capital World InvestorsManaged the fund since 2017
Michael T. KerrPartner - Capital World InvestorsManaged the fund since 2005
Andraz RazenVice President - Capital World InvestorsManaged the fund since 2013
Martin RomoPartner - Capital World InvestorsManaged the fund since 2016
Alan J. WilsonPartner - Capital World InvestorsManaged the fund since 2014
.15

Other important information regarding the fundFor important information about taxes and financial intermediary compensation, please turn to “Additional information about the funds” at page258 of the Prospectus.
.16
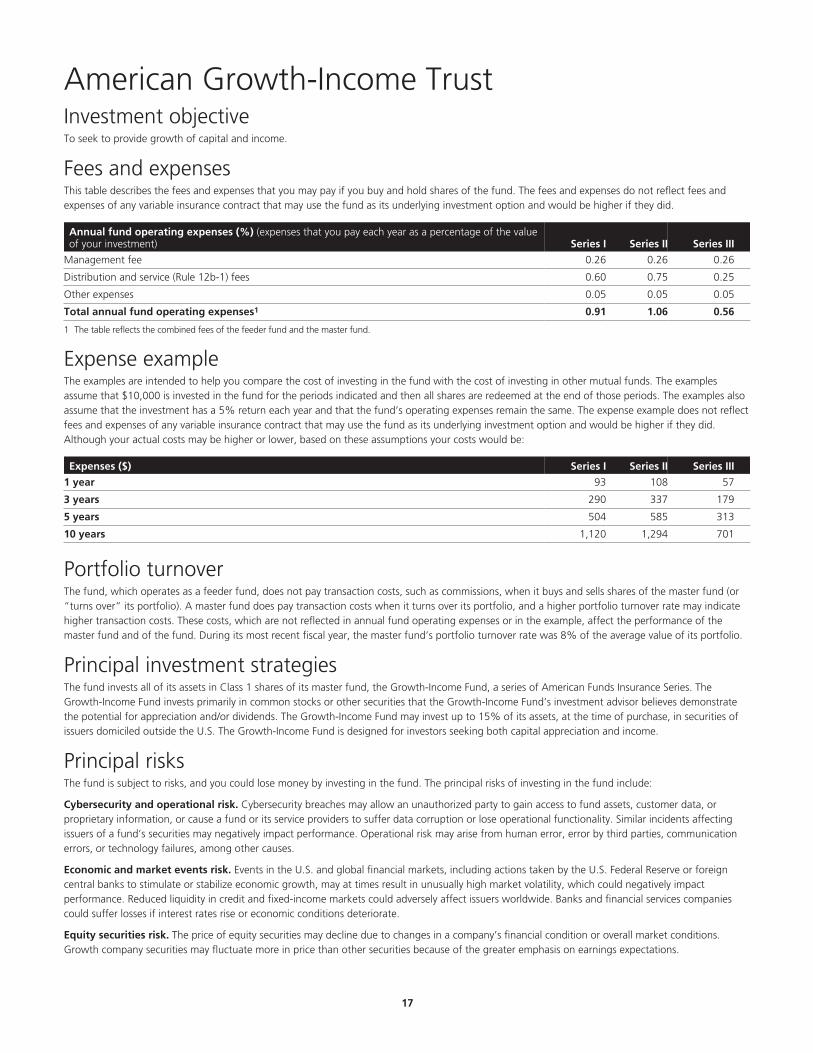
American Growth-Income Trust Investment objectiveTo seek to provide growth of capital and income.
Fees and expensesThis table describes the fees and expenses that you may pay if you buy and hold shares of the fund. The fees and expenses do not reflect fees andexpenses of any variable insurance contract that may use the fund as its underlying investment option and would be higher if they did.
Annual fund operating expenses (%) (expenses that you pay each year as a percentage of the valueof your investment) Series I Series II Series III
Management fee 0.26 0.26 0.26
Distribution and service (Rule 12b-1) fees 0.60 0.75 0.25
Other expenses 0.05 0.05 0.05
Total annual fund operating expenses1 0.91 1.06 0.56
1 The table reflects the combined fees of the feeder fund and the master fund.
Expense exampleThe examples are intended to help you compare the cost of investing in the fund with the cost of investing in other mutual funds. The examplesassume that $10,000 is invested in the fund for the periods indicated and then all shares are redeemed at the end of those periods. The examples alsoassume that the investment has a 5% return each year and that the fund’s operating expenses remain the same. The expense example does not reflectfees and expenses of any variable insurance contract that may use the fund as its underlying investment option and would be higher if they did.Although your actual costs may be higher or lower, based on these assumptions your costs would be:
Expenses ($) Series I Series II Series III
1 year 93 108 57
3 years 290 337 179
5 years 504 585 313
10 years 1,120 1,294 701
Portfolio turnoverThe fund, which operates as a feeder fund, does not pay transaction costs, such as commissions, when it buys and sells shares of the master fund (or“turns over” its portfolio). A master fund does pay transaction costs when it turns over its portfolio, and a higher portfolio turnover rate may indicatehigher transaction costs. These costs, which are not reflected in annual fund operating expenses or in the example, affect the performance of themaster fund and of the fund. During its most recent fiscal year, the master fund’s portfolio turnover rate was 8% of the average value of its portfolio.
Principal investment strategiesThe fund invests all of its assets in Class 1 shares of its master fund, the Growth-Income Fund, a series of American Funds Insurance Series. TheGrowth-Income Fund invests primarily in common stocks or other securities that the Growth-Income Fund’s investment advisor believes demonstratethe potential for appreciation and/or dividends. The Growth-Income Fund may invest up to 15% of its assets, at the time of purchase, in securities ofissuers domiciled outside the U.S. The Growth-Income Fund is designed for investors seeking both capital appreciation and income.
Principal risksThe fund is subject to risks, and you could lose money by investing in the fund. The principal risks of investing in the fund include:
Cybersecurity and operational risk. Cybersecurity breaches may allow an unauthorized party to gain access to fund assets, customer data, orproprietary information, or cause a fund or its service providers to suffer data corruption or lose operational functionality. Similar incidents affectingissuers of a fund’s securities may negatively impact performance. Operational risk may arise from human error, error by third parties, communicationerrors, or technology failures, among other causes.
Economic and market events risk. Events in the U.S. and global financial markets, including actions taken by the U.S. Federal Reserve or foreigncentral banks to stimulate or stabilize economic growth, may at times result in unusually high market volatility, which could negatively impactperformance. Reduced liquidity in credit and fixed-income markets could adversely affect issuers worldwide. Banks and financial services companiescould suffer losses if interest rates rise or economic conditions deteriorate.
Equity securities risk. The price of equity securities may decline due to changes in a company’s financial condition or overall market conditions.Growth company securities may fluctuate more in price than other securities because of the greater emphasis on earnings expectations.
.17
Foreign securities risk. Less information may be publicly available regarding foreign issuers. Foreign securities may be subject to foreign taxes andmay be more volatile than U.S. securities. Currency fluctuations and political and economic developments may adversely impact the value of foreignsecurities.
Income stock risk. Income provided by the fund may be affected by changes in the dividend polices of the companies in which the fund invests andthe capital resources available for such payments at such companies.
Large company risk. Larger companies may grow more slowly than smaller companies or be slower to respond to business developments. Large-capitalization securities may underperform the market as a whole.
Liquidity risk. The extent (if at all) to which a security may be sold without negatively impacting its market value may be impaired by reduced marketactivity or participation, legal restrictions, or other economic and market impediments.
Small and mid-sized company risk. Small and mid-sized companies are generally less established and may be more volatile than larger companies.Small and/or mid-capitalization securities may underperform the market as a whole.
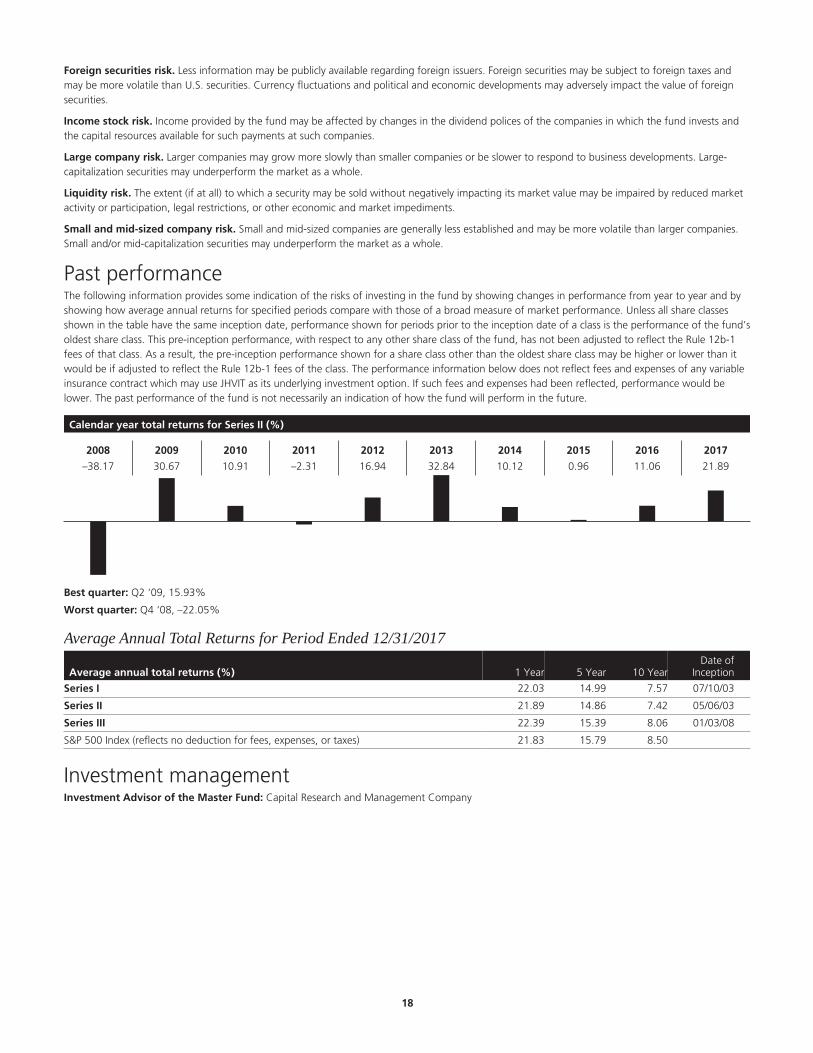
Past performanceThe following information provides some indication of the risks of investing in the fund by showing changes in performance from year to year and byshowing how average annual returns for specified periods compare with those of a broad measure of market performance. Unless all share classesshown in the table have the same inception date, performance shown for periods prior to the inception date of a class is the performance of the fund’soldest share class. This pre-inception performance, with respect to any other share class of the fund, has not been adjusted to reflect the Rule 12b-1fees of that class. As a result, the pre-inception performance shown for a share class other than the oldest share class may be higher or lower than itwould be if adjusted to reflect the Rule 12b-1 fees of the class. The performance information below does not reflect fees and expenses of any variableinsurance contract which may use JHVIT as its underlying investment option. If such fees and expenses had been reflected, performance would belower. The past performance of the fund is not necessarily an indication of how the fund will perform in the future.
Calendar year total returns for Series II (%)
2008 2009 2010 2011 2012 2013 2014 2015 2016 2017
–38.17 30.67 10.91 –2.31 16.94 32.84 10.12 0.96 11.06 21.89
Best quarter: Q2 ‘09, 15.93%
Worst quarter: Q4 ‘08, –22.05%
Average Annual Total Returns for Period Ended 12/31/2017
Average annual total returns (%) 1 Year 5 Year 10 YearDate of
Inception
Series I 22.03 14.99 7.57 07/10/03
Series II 21.89 14.86 7.42 05/06/03
Series III 22.39 15.39 8.06 01/03/08
S&P 500 Index (reflects no deduction for fees, expenses, or taxes) 21.83 15.79 8.50
Investment managementInvestment Advisor of the Master Fund: Capital Research and Management Company
.18

Portfolio managementDonald D. O’NealVice Chairman of the Board;Partner - Capital ResearchGlobal InvestorsManaged the fund since2005
J. Blair FrankPartner - Capital ResearchGlobal InvestorsManaged the fund since2006
Claudia P. HuntingtonPartner - Capital ResearchGlobal InvestorsManaged the fund since1994
Dylan YollesVice President; Partner -Capital InternationalInvestorsManaged the fund since2005
William L. RobbinsPartner - CapitalInternational InvestorsManaged fund since 2012
Other important information regarding the fundFor important information about taxes and financial intermediary compensation, please turn to “Additional information about the funds” at page258 of the Prospectus.
.19
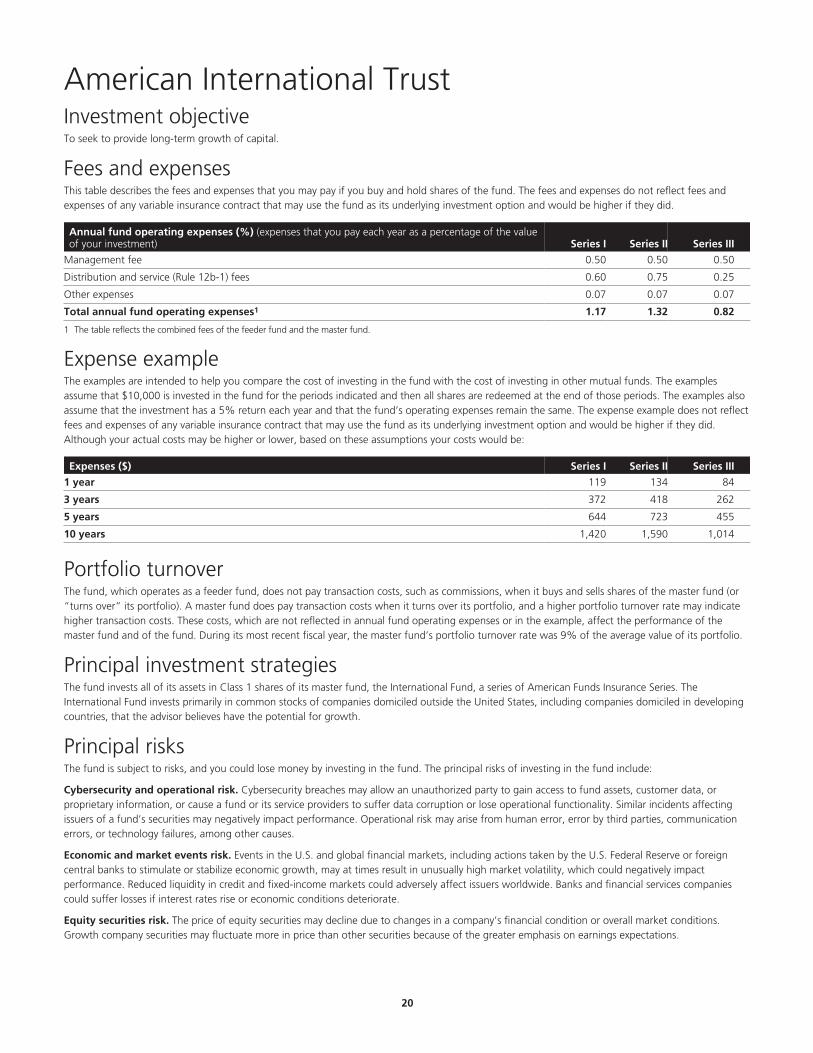
American International Trust Investment objectiveTo seek to provide long-term growth of capital.
Fees and expensesThis table describes the fees and expenses that you may pay if you buy and hold shares of the fund. The fees and expenses do not reflect fees andexpenses of any variable insurance contract that may use the fund as its underlying investment option and would be higher if they did.
Annual fund operating expenses (%) (expenses that you pay each year as a percentage of the valueof your investment) Series I Series II Series III
Management fee 0.50 0.50 0.50
Distribution and service (Rule 12b-1) fees 0.60 0.75 0.25
Other expenses 0.07 0.07 0.07
Total annual fund operating expenses1 1.17 1.32 0.82
1 The table reflects the combined fees of the feeder fund and the master fund.
Expense exampleThe examples are intended to help you compare the cost of investing in the fund with the cost of investing in other mutual funds. The examplesassume that $10,000 is invested in the fund for the periods indicated and then all shares are redeemed at the end of those periods. The examples alsoassume that the investment has a 5% return each year and that the fund’s operating expenses remain the same. The expense example does not reflectfees and expenses of any variable insurance contract that may use the fund as its underlying investment option and would be higher if they did.Although your actual costs may be higher or lower, based on these assumptions your costs would be:
Expenses ($) Series I Series II Series III
1 year 119 134 84
3 years 372 418 262
5 years 644 723 455
10 years 1,420 1,590 1,014
Portfolio turnoverThe fund, which operates as a feeder fund, does not pay transaction costs, such as commissions, when it buys and sells shares of the master fund (or“turns over” its portfolio). A master fund does pay transaction costs when it turns over its portfolio, and a higher portfolio turnover rate may indicatehigher transaction costs. These costs, which are not reflected in annual fund operating expenses or in the example, affect the performance of themaster fund and of the fund. During its most recent fiscal year, the master fund’s portfolio turnover rate was 9% of the average value of its portfolio.
Principal investment strategiesThe fund invests all of its assets in Class 1 shares of its master fund, the International Fund, a series of American Funds Insurance Series. TheInternational Fund invests primarily in common stocks of companies domiciled outside the United States, including companies domiciled in developingcountries, that the advisor believes have the potential for growth.
Principal risksThe fund is subject to risks, and you could lose money by investing in the fund. The principal risks of investing in the fund include:
Cybersecurity and operational risk. Cybersecurity breaches may allow an unauthorized party to gain access to fund assets, customer data, orproprietary information, or cause a fund or its service providers to suffer data corruption or lose operational functionality. Similar incidents affectingissuers of a fund’s securities may negatively impact performance. Operational risk may arise from human error, error by third parties, communicationerrors, or technology failures, among other causes.
Economic and market events risk. Events in the U.S. and global financial markets, including actions taken by the U.S. Federal Reserve or foreigncentral banks to stimulate or stabilize economic growth, may at times result in unusually high market volatility, which could negatively impactperformance. Reduced liquidity in credit and fixed-income markets could adversely affect issuers worldwide. Banks and financial services companiescould suffer losses if interest rates rise or economic conditions deteriorate.
Equity securities risk. The price of equity securities may decline due to changes in a company’s financial condition or overall market conditions.Growth company securities may fluctuate more in price than other securities because of the greater emphasis on earnings expectations.
.20
Foreign securities risk. Less information may be publicly available regarding foreign issuers. Foreign securities may be subject to foreign taxes andmay be more volatile than U.S. securities. Currency fluctuations and political and economic developments may adversely impact the value of foreignsecurities. The risks of investing in foreign securities are magnified in emerging markets.
Large company risk. Larger companies may grow more slowly than smaller companies or be slower to respond to business developments. Large-capitalization securities may underperform the market as a whole.
Liquidity risk. The extent (if at all) to which a security may be sold without negatively impacting its market value may be impaired by reduced marketactivity or participation, legal restrictions, or other economic and market impediments.
Small and mid-sized company risk. Small and mid-sized companies are generally less established and may be more volatile than larger companies.Small and/or mid-capitalization securities may underperform the market as a whole.
Past performanceThe following information provides some indication of the risks of investing in the fund by showing changes in performance from year to year and byshowing how average annual returns for specified periods compare with those of a broad measure of market performance. Unless all share classesshown in the table have the same inception date, performance shown for periods prior to the inception date of a class is the performance of the fund’soldest share class. This pre-inception performance, with respect to any other share class of the fund, has not been adjusted to reflect the Rule 12b-1fees of that class. As a result, the pre-inception performance shown for a share class other than the oldest share class may be higher or lower than itwould be if adjusted to reflect the Rule 12b-1 fees of the class. The performance information below does not reflect fees and expenses of any variableinsurance contract which may use JHVIT as its underlying investment option. If such fees and expenses had been reflected, performance would belower. The past performance of the fund is not necessarily an indication of how the fund will perform in the future.
Calendar year total returns for Series II (%)
2008 2009 2010 2011 2012 2013 2014 2015 2016 2017
–42.47 42.41 6.68 –14.38 17.26 20.98 –3.15 –4.98 2.97 31.49
Best quarter: Q2 ‘09, 24.34%
Worst quarter: Q3 ‘11, –21.95%
Average Annual Total Returns for Period Ended 12/31/2017
Average annual total returns (%) 1 Year 5 Year 10 YearDate of
Inception
Series I 31.65 8.71 2.99 07/10/03
Series II 31.49 8.56 2.84 05/06/03
Series III 32.12 9.09 3.38 01/03/08
MSCI All Country World ex-USA Index (reflects no deduction for fees, expenses, or taxes) 27.19 6.80 1.84
Investment managementInvestment Advisor of the Master Fund: Capital Research and Management Company
Portfolio managementSung LeeVice President; Partner - Capital Research GlobalInvestorsManaged the fund since 2006
L. Alfonso BarrosoPartner - Capital Research Global InvestorsManaged the fund since 2009
Jesper LyckeusPartner - Capital Research Global InvestorsManaged the fund since 2007
Christopher ThomsenPartner - Capital Research Global InvestorsManaged the fund since 2006
.21

Other important information regarding the fundFor important information about taxes and financial intermediary compensation, please turn to “Additional information about the funds” at page258 of the Prospectus.
.22
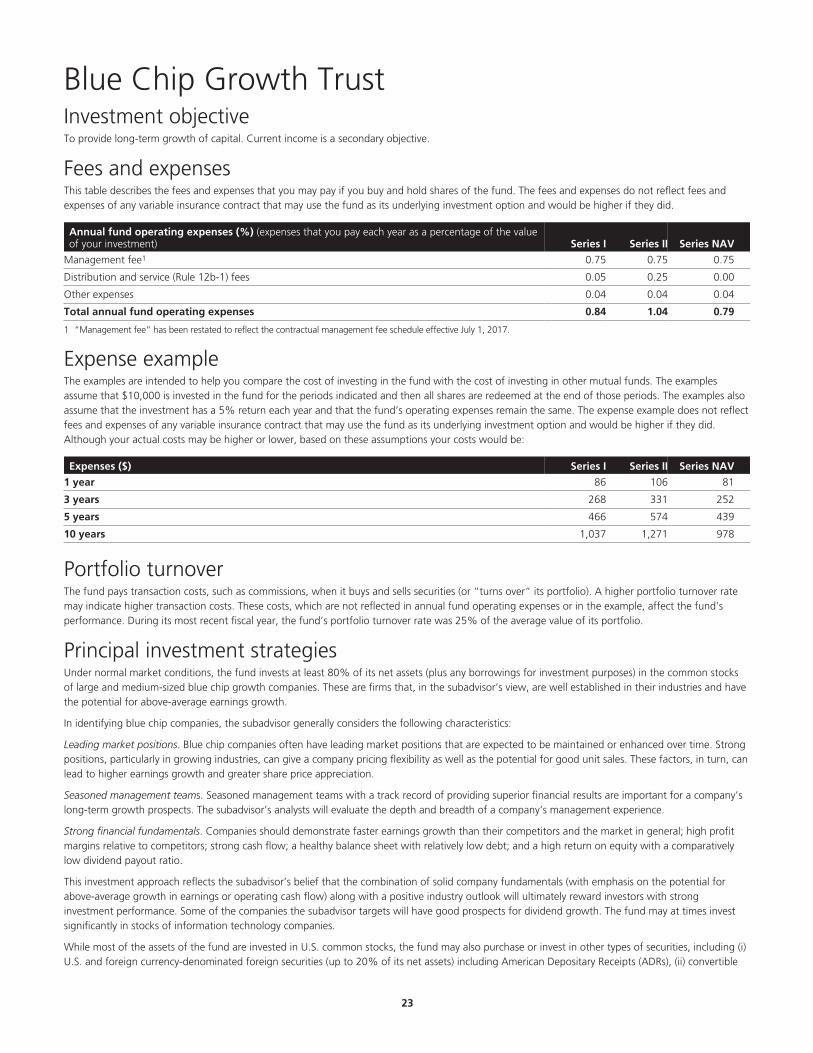
Blue Chip Growth Trust Investment objectiveTo provide long-term growth of capital. Current income is a secondary objective.
Fees and expensesThis table describes the fees and expenses that you may pay if you buy and hold shares of the fund. The fees and expenses do not reflect fees andexpenses of any variable insurance contract that may use the fund as its underlying investment option and would be higher if they did.
Annual fund operating expenses (%) (expenses that you pay each year as a percentage of the valueof your investment) Series I Series II Series NAV
Management fee1 0.75 0.75 0.75
Distribution and service (Rule 12b-1) fees 0.05 0.25 0.00
Other expenses 0.04 0.04 0.04
Total annual fund operating expenses 0.84 1.04 0.79
1 “Management fee” has been restated to reflect the contractual management fee schedule effective July 1, 2017.
Expense exampleThe examples are intended to help you compare the cost of investing in the fund with the cost of investing in other mutual funds. The examplesassume that $10,000 is invested in the fund for the periods indicated and then all shares are redeemed at the end of those periods. The examples alsoassume that the investment has a 5% return each year and that the fund’s operating expenses remain the same. The expense example does not reflectfees and expenses of any variable insurance contract that may use the fund as its underlying investment option and would be higher if they did.Although your actual costs may be higher or lower, based on these assumptions your costs would be:
Expenses ($) Series I Series II Series NAV
1 year 86 106 81
3 years 268 331 252
5 years 466 574 439
10 years 1,037 1,271 978
Portfolio turnoverThe fund pays transaction costs, such as commissions, when it buys and sells securities (or “turns over” its portfolio). A higher portfolio turnover ratemay indicate higher transaction costs. These costs, which are not reflected in annual fund operating expenses or in the example, affect the fund’sperformance. During its most recent fiscal year, the fund’s portfolio turnover rate was 25% of the average value of its portfolio.
Principal investment strategiesUnder normal market conditions, the fund invests at least 80% of its net assets (plus any borrowings for investment purposes) in the common stocksof large and medium-sized blue chip growth companies. These are firms that, in the subadvisor’s view, are well established in their industries and havethe potential for above-average earnings growth.
In identifying blue chip companies, the subadvisor generally considers the following characteristics:
Leading market positions. Blue chip companies often have leading market positions that are expected to be maintained or enhanced over time. Strongpositions, particularly in growing industries, can give a company pricing flexibility as well as the potential for good unit sales. These factors, in turn, canlead to higher earnings growth and greater share price appreciation.
Seasoned management teams. Seasoned management teams with a track record of providing superior financial results are important for a company’slong-term growth prospects. The subadvisor’s analysts will evaluate the depth and breadth of a company’s management experience.
Strong financial fundamentals. Companies should demonstrate faster earnings growth than their competitors and the market in general; high profitmargins relative to competitors; strong cash flow; a healthy balance sheet with relatively low debt; and a high return on equity with a comparativelylow dividend payout ratio.
This investment approach reflects the subadvisor’s belief that the combination of solid company fundamentals (with emphasis on the potential forabove-average growth in earnings or operating cash flow) along with a positive industry outlook will ultimately reward investors with stronginvestment performance. Some of the companies the subadvisor targets will have good prospects for dividend growth. The fund may at times investsignificantly in stocks of information technology companies.
While most of the assets of the fund are invested in U.S. common stocks, the fund may also purchase or invest in other types of securities, including (i)U.S. and foreign currency-denominated foreign securities (up to 20% of its net assets) including American Depositary Receipts (ADRs), (ii) convertible
.23
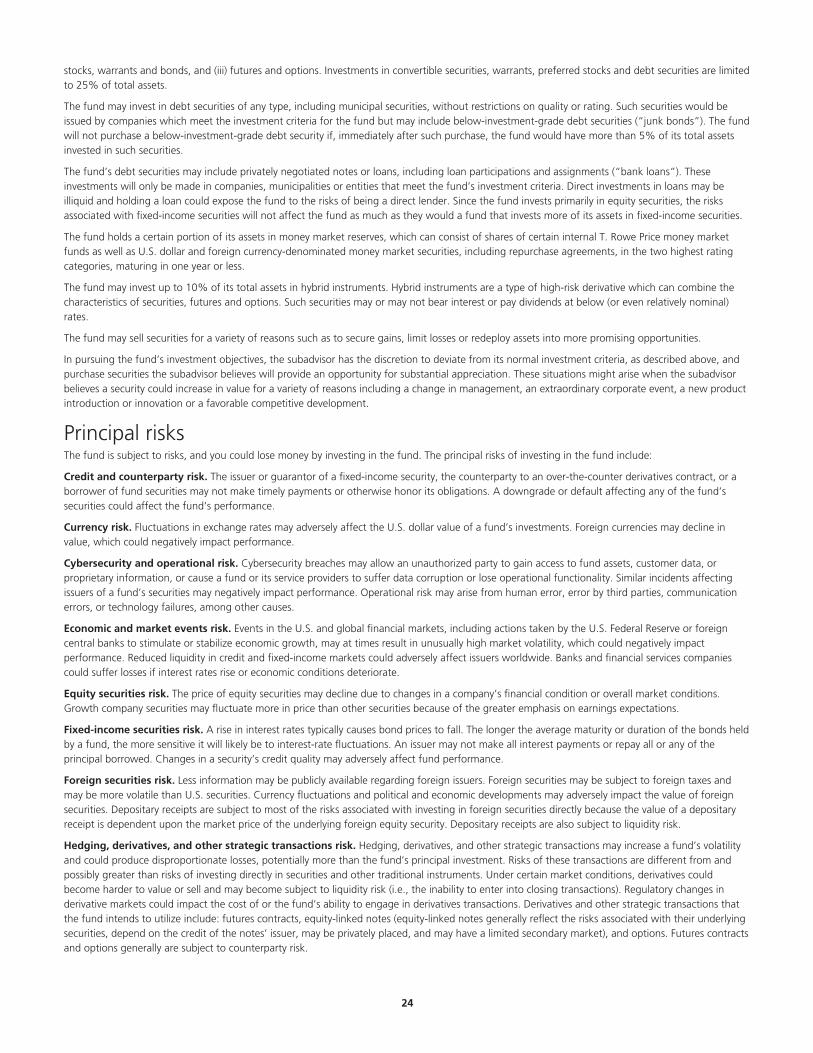
stocks, warrants and bonds, and (iii) futures and options. Investments in convertible securities, warrants, preferred stocks and debt securities are limitedto 25% of total assets.
The fund may invest in debt securities of any type, including municipal securities, without restrictions on quality or rating. Such securities would beissued by companies which meet the investment criteria for the fund but may include below-investment-grade debt securities (“junk bonds”). The fundwill not purchase a below-investment-grade debt security if, immediately after such purchase, the fund would have more than 5% of its total assetsinvested in such securities.
The fund’s debt securities may include privately negotiated notes or loans, including loan participations and assignments (“bank loans”). Theseinvestments will only be made in companies, municipalities or entities that meet the fund’s investment criteria. Direct investments in loans may beilliquid and holding a loan could expose the fund to the risks of being a direct lender. Since the fund invests primarily in equity securities, the risksassociated with fixed-income securities will not affect the fund as much as they would a fund that invests more of its assets in fixed-income securities.
The fund holds a certain portion of its assets in money market reserves, which can consist of shares of certain internal T. Rowe Price money marketfunds as well as U.S. dollar and foreign currency-denominated money market securities, including repurchase agreements, in the two highest ratingcategories, maturing in one year or less.
The fund may invest up to 10% of its total assets in hybrid instruments. Hybrid instruments are a type of high-risk derivative which can combine thecharacteristics of securities, futures and options. Such securities may or may not bear interest or pay dividends at below (or even relatively nominal)rates.
The fund may sell securities for a variety of reasons such as to secure gains, limit losses or redeploy assets into more promising opportunities.
In pursuing the fund’s investment objectives, the subadvisor has the discretion to deviate from its normal investment criteria, as described above, andpurchase securities the subadvisor believes will provide an opportunity for substantial appreciation. These situations might arise when the subadvisorbelieves a security could increase in value for a variety of reasons including a change in management, an extraordinary corporate event, a new productintroduction or innovation or a favorable competitive development.
Principal risksThe fund is subject to risks, and you could lose money by investing in the fund. The principal risks of investing in the fund include:
Credit and counterparty risk. The issuer or guarantor of a fixed-income security, the counterparty to an over-the-counter derivatives contract, or aborrower of fund securities may not make timely payments or otherwise honor its obligations. A downgrade or default affecting any of the fund’ssecurities could affect the fund’s performance.
Currency risk. Fluctuations in exchange rates may adversely affect the U.S. dollar value of a fund’s investments. Foreign currencies may decline invalue, which could negatively impact performance.
Cybersecurity and operational risk. Cybersecurity breaches may allow an unauthorized party to gain access to fund assets, customer data, orproprietary information, or cause a fund or its service providers to suffer data corruption or lose operational functionality. Similar incidents affectingissuers of a fund’s securities may negatively impact performance. Operational risk may arise from human error, error by third parties, communicationerrors, or technology failures, among other causes.
Economic and market events risk. Events in the U.S. and global financial markets, including actions taken by the U.S. Federal Reserve or foreigncentral banks to stimulate or stabilize economic growth, may at times result in unusually high market volatility, which could negatively impactperformance. Reduced liquidity in credit and fixed-income markets could adversely affect issuers worldwide. Banks and financial services companiescould suffer losses if interest rates rise or economic conditions deteriorate.
Equity securities risk. The price of equity securities may decline due to changes in a company’s financial condition or overall market conditions.Growth company securities may fluctuate more in price than other securities because of the greater emphasis on earnings expectations.
Fixed-income securities risk. A rise in interest rates typically causes bond prices to fall. The longer the average maturity or duration of the bonds heldby a fund, the more sensitive it will likely be to interest-rate fluctuations. An issuer may not make all interest payments or repay all or any of theprincipal borrowed. Changes in a security’s credit quality may adversely affect fund performance.
Foreign securities risk. Less information may be publicly available regarding foreign issuers. Foreign securities may be subject to foreign taxes andmay be more volatile than U.S. securities. Currency fluctuations and political and economic developments may adversely impact the value of foreignsecurities. Depositary receipts are subject to most of the risks associated with investing in foreign securities directly because the value of a depositaryreceipt is dependent upon the market price of the underlying foreign equity security. Depositary receipts are also subject to liquidity risk.
Hedging, derivatives, and other strategic transactions risk. Hedging, derivatives, and other strategic transactions may increase a fund’s volatilityand could produce disproportionate losses, potentially more than the fund’s principal investment. Risks of these transactions are different from andpossibly greater than risks of investing directly in securities and other traditional instruments. Under certain market conditions, derivatives couldbecome harder to value or sell and may become subject to liquidity risk (i.e., the inability to enter into closing transactions). Regulatory changes inderivative markets could impact the cost of or the fund’s ability to engage in derivatives transactions. Derivatives and other strategic transactions thatthe fund intends to utilize include: futures contracts, equity-linked notes (equity-linked notes generally reflect the risks associated with their underlyingsecurities, depend on the credit of the notes’ issuer, may be privately placed, and may have a limited secondary market), and options. Futures contractsand options generally are subject to counterparty risk.
.24
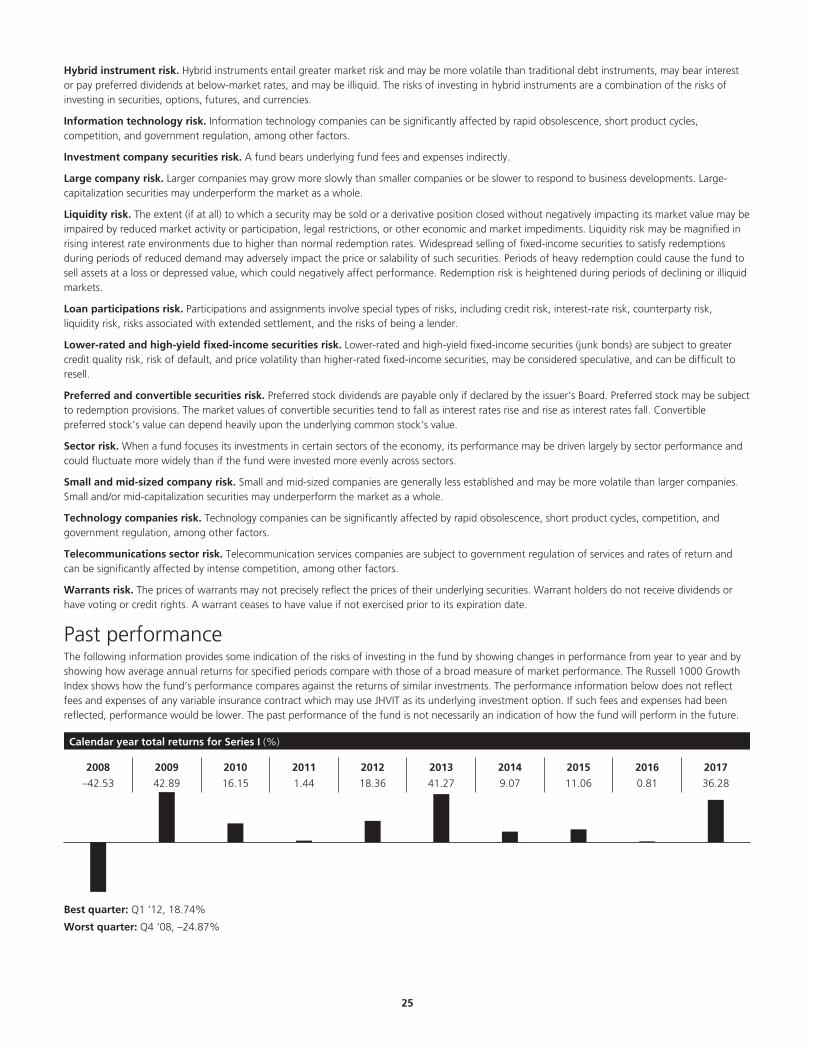
Hybrid instrument risk. Hybrid instruments entail greater market risk and may be more volatile than traditional debt instruments, may bear interestor pay preferred dividends at below-market rates, and may be illiquid. The risks of investing in hybrid instruments are a combination of the risks ofinvesting in securities, options, futures, and currencies.
Information technology risk. Information technology companies can be significantly affected by rapid obsolescence, short product cycles,competition, and government regulation, among other factors.
Investment company securities risk. A fund bears underlying fund fees and expenses indirectly.
Large company risk. Larger companies may grow more slowly than smaller companies or be slower to respond to business developments. Large-capitalization securities may underperform the market as a whole.
Liquidity risk. The extent (if at all) to which a security may be sold or a derivative position closed without negatively impacting its market value may beimpaired by reduced market activity or participation, legal restrictions, or other economic and market impediments. Liquidity risk may be magnified inrising interest rate environments due to higher than normal redemption rates. Widespread selling of fixed-income securities to satisfy redemptionsduring periods of reduced demand may adversely impact the price or salability of such securities. Periods of heavy redemption could cause the fund tosell assets at a loss or depressed value, which could negatively affect performance. Redemption risk is heightened during periods of declining or illiquidmarkets.
Loan participations risk. Participations and assignments involve special types of risks, including credit risk, interest-rate risk, counterparty risk,liquidity risk, risks associated with extended settlement, and the risks of being a lender.
Lower-rated and high-yield fixed-income securities risk. Lower-rated and high-yield fixed-income securities (junk bonds) are subject to greatercredit quality risk, risk of default, and price volatility than higher-rated fixed-income securities, may be considered speculative, and can be difficult toresell.
Preferred and convertible securities risk. Preferred stock dividends are payable only if declared by the issuer’s Board. Preferred stock may be subjectto redemption provisions. The market values of convertible securities tend to fall as interest rates rise and rise as interest rates fall. Convertiblepreferred stock’s value can depend heavily upon the underlying common stock’s value.
Sector risk. When a fund focuses its investments in certain sectors of the economy, its performance may be driven largely by sector performance andcould fluctuate more widely than if the fund were invested more evenly across sectors.
Small and mid-sized company risk. Small and mid-sized companies are generally less established and may be more volatile than larger companies.Small and/or mid-capitalization securities may underperform the market as a whole.
Technology companies risk. Technology companies can be significantly affected by rapid obsolescence, short product cycles, competition, andgovernment regulation, among other factors.
Telecommunications sector risk. Telecommunication services companies are subject to government regulation of services and rates of return andcan be significantly affected by intense competition, among other factors.
Warrants risk. The prices of warrants may not precisely reflect the prices of their underlying securities. Warrant holders do not receive dividends orhave voting or credit rights. A warrant ceases to have value if not exercised prior to its expiration date.
Past performanceThe following information provides some indication of the risks of investing in the fund by showing changes in performance from year to year and byshowing how average annual returns for specified periods compare with those of a broad measure of market performance. The Russell 1000 GrowthIndex shows how the fund’s performance compares against the returns of similar investments. The performance information below does not reflectfees and expenses of any variable insurance contract which may use JHVIT as its underlying investment option. If such fees and expenses had beenreflected, performance would be lower. The past performance of the fund is not necessarily an indication of how the fund will perform in the future.
Calendar year total returns for Series I (%)
2008 2009 2010 2011 2012 2013 2014 2015 2016 2017
–42.53 42.89 16.15 1.44 18.36 41.27 9.07 11.06 0.81 36.28
Best quarter: Q1 ‘12, 18.74%
Worst quarter: Q4 ‘08, –24.87%
.25
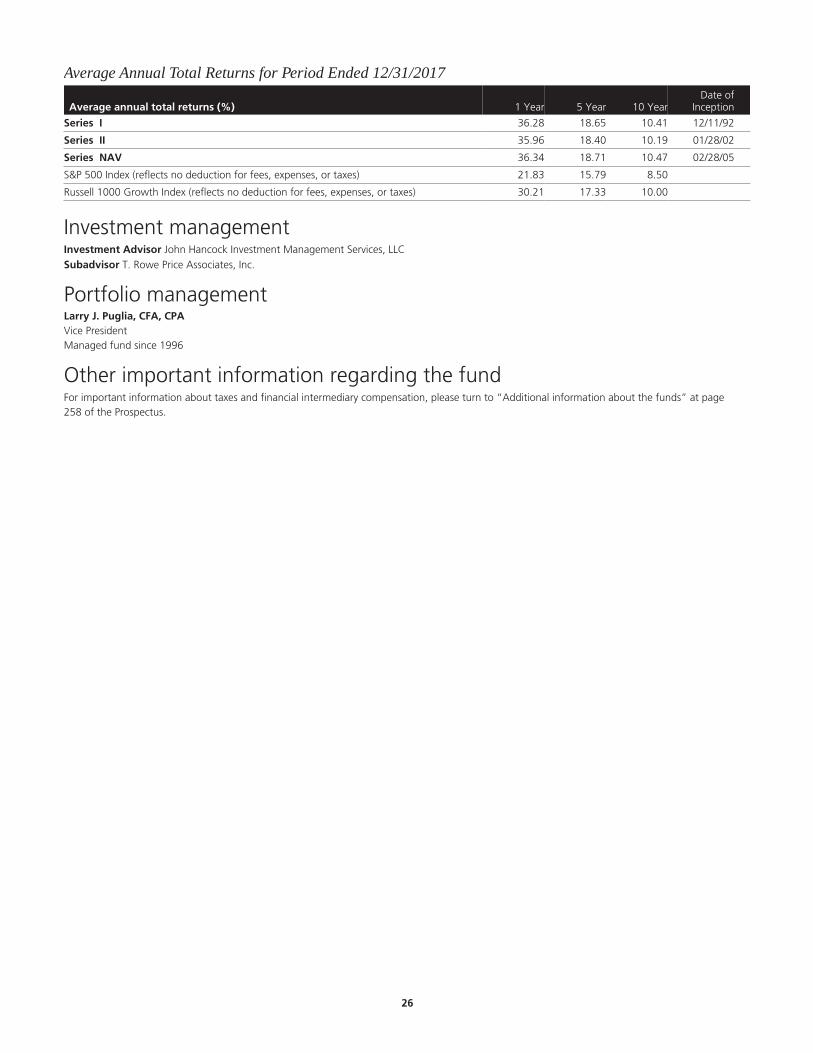
Average Annual Total Returns for Period Ended 12/31/2017
Average annual total returns (%) 1 Year 5 Year 10 YearDate of
Inception
Series I 36.28 18.65 10.41 12/11/92
Series II 35.96 18.40 10.19 01/28/02
Series NAV 36.34 18.71 10.47 02/28/05
S&P 500 Index (reflects no deduction for fees, expenses, or taxes) 21.83 15.79 8.50
Russell 1000 Growth Index (reflects no deduction for fees, expenses, or taxes) 30.21 17.33 10.00
Investment managementInvestment Advisor John Hancock Investment Management Services, LLC§
Subadvisor T. Rowe Price Associates, Inc.
Portfolio managementLarry J. Puglia, CFA, CPAVice PresidentManaged fund since 1996
Other important information regarding the fundFor important information about taxes and financial intermediary compensation, please turn to “Additional information about the funds” at page258 of the Prospectus.
.26

Capital Appreciation Trust Investment objectiveTo seek long-term growth of capital.
Fees and expensesThis table describes the fees and expenses that you may pay if you buy and hold shares of the fund. The fees and expenses do not reflect fees andexpenses of any variable insurance contract that may use the fund as its underlying investment option and would be higher if they did.
Annual fund operating expenses (%) (expenses that you pay each year as a percentage of the valueof your investment) Series I Series II Series NAV
Management fee 0.70 0.70 0.70
Distribution and service (Rule 12b-1) fees 0.05 0.25 0.00
Other expenses 0.05 0.05 0.05
Total annual fund operating expenses 0.80 1.00 0.75
Expense exampleThe examples are intended to help you compare the cost of investing in the fund with the cost of investing in other mutual funds. The examplesassume that $10,000 is invested in the fund for the periods indicated and then all shares are redeemed at the end of those periods. The examples alsoassume that the investment has a 5% return each year and that the fund’s operating expenses remain the same. The expense example does not reflectfees and expenses of any variable insurance contract that may use the fund as its underlying investment option and would be higher if they did.Although your actual costs may be higher or lower, based on these assumptions your costs would be:
Expenses ($) Series I Series II Series NAV
1 year 82 102 77
3 years 255 318 240
5 years 444 552 417
10 years 990 1,225 930
Portfolio turnoverThe fund pays transaction costs, such as commissions, when it buys and sells securities (or “turns over” its portfolio). A higher portfolio turnover ratemay indicate higher transaction costs. These costs, which are not reflected in annual fund operating expenses or in the example, affect the fund’sperformance. During its most recent fiscal year, the fund’s portfolio turnover rate was 47% of the average value of its portfolio.
Principal investment strategiesUnder normal market conditions, the fund invests at least 65% of its total assets in equity and equity-related securities of companies, at the time ofinvestment, that exceed $1 billion in market capitalization and that the subadvisor believes have above-average growth prospects. These companies aregenerally medium- to large-capitalization companies.
The subadvisor believes that growth in earnings and cash flows drives share prices over the long term; that excess returns are generated by investing inmarket-leading companies that create economic value through long-duration competitive advantages; and that a deeply researched understanding ofcompany and industry fundamentals leads to successful stock selection. The subadvisor looks for companies with unique business models that buildsustainable competitive advantages; catalysts that drive growth rates well above that of the market; superior financial characteristics; and attractivelong-term valuations. The subadvisor seeks to capture acceleration or duration of growth that is not fully reflected in a stock’s price.
Securities in which the fund invests have historically been more volatile than the S&P 500 Index. Also, companies that have an earnings growth ratehigher than that of the average S&P 500 company tend to reinvest their earnings rather than distribute them. Therefore, the fund is not likely toreceive significant dividend income on its securities. Seeking to invest in companies with above market-average growth, the fund may investsignificantly in sectors associated with such growth, including information technology.
In addition to common stocks, nonconvertible preferred stock and convertible securities, equity-related securities in which the fund invests include: (i)American Depositary Receipts (ADRs); (ii) warrants and rights; (iii) investments in various types of business ventures, including partnerships and jointventures; (iv) real estate investment trusts (REITs); and (v) initial public offerings (IPOs) and similar securities. (Convertible securities are securities — likebonds, corporate notes and preferred stocks — that the fund can convert into the company’s common stock, cash value of common stock, or someother equity security.)
In addition to the principal strategies discussed above, the fund may also use the following investment strategies to attempt to increase the fund’sreturn or protect its assets if market conditions warrant:
The fund may make short sales of a security including short sales “against the box.”
.27

The fund may invest up to 20% of the fund’s total assets in foreign equity securities. (For purposes of this 20% limit, ADRs and other similar receiptsor shares traded in U.S. markets are not considered to be foreign securities.)
The fund may invest in U.S. government securities issued or guaranteed by the U.S. government or by an agency or instrumentality of the U.S.government.
The fund may invest in mortgage-related securities issued or guaranteed by U.S. governmental entities, including collateralized mortgage obligations,multi-class pass-through securities and stripped mortgage-backed securities.
The fund may invest in fixed-income securities rated investment grade. These include corporate debt and other debt obligations of U.S. and foreignissuers. The fund may invest in obligations that are not rated, but that the subadvisor believes are of comparable quality to these obligations.
The fund may invest in repurchase agreements.
The subadvisor considers selling or reducing a stock position when, in the opinion of the subadvisor, the stock has experienced a fundamentaldisappointment in earnings, it has reached an intermediate price objective and its outlook no longer seems sufficiently promising, a relatively moreattractive stock emerges or the stock has experienced adverse price movement.
The fund’s investment process may, at times, result in a higher than average portfolio turnover ratio and increased trading expenses.
Principal risksThe fund is subject to risks, and you could lose money by investing in the fund. The principal risks of investing in the fund include:
Credit and counterparty risk. The issuer or guarantor of a fixed-income security or a borrower of fund securities may not make timely payments orotherwise honor its obligations. U.S. government securities are subject to varying degrees of credit risk depending upon the nature of their support. Adowngrade or default affecting any of the fund’s securities could affect the fund’s performance.
Cybersecurity and operational risk. Cybersecurity breaches may allow an unauthorized party to gain access to fund assets, customer data, orproprietary information, or cause a fund or its service providers to suffer data corruption or lose operational functionality. Similar incidents affectingissuers of a fund’s securities may negatively impact performance. Operational risk may arise from human error, error by third parties, communicationerrors, or technology failures, among other causes.
Economic and market events risk. Events in the U.S. and global financial markets, including actions taken by the U.S. Federal Reserve or foreigncentral banks to stimulate or stabilize economic growth, may at times result in unusually high market volatility, which could negatively impactperformance. Reduced liquidity in credit and fixed-income markets could adversely affect issuers worldwide. Banks and financial services companiescould suffer losses if interest rates rise or economic conditions deteriorate.
Equity securities risk. The price of equity securities may decline due to changes in a company’s financial condition or overall market conditions.Growth company securities may fluctuate more in price than other securities because of the greater emphasis on earnings expectations. Securities themanager believes are undervalued may never realize their full potential value, and in certain markets value stocks may underperform the market as awhole.
Fixed-income securities risk. A rise in interest rates typically causes bond prices to fall. The longer the average maturity or duration of the bonds heldby a fund, the more sensitive it will likely be to interest-rate fluctuations. An issuer may not make all interest payments or repay all or any of theprincipal borrowed. Changes in a security’s credit quality may adversely affect fund performance.
Foreign securities risk. Less information may be publicly available regarding foreign issuers. Foreign securities may be subject to foreign taxes andmay be more volatile than U.S. securities. Currency fluctuations and political and economic developments may adversely impact the value of foreignsecurities. Depositary receipts are subject to most of the risks associated with investing in foreign securities directly because the value of a depositaryreceipt is dependent upon the market price of the underlying foreign equity security. Depositary receipts are also subject to liquidity risk.
High portfolio turnover risk. Trading securities actively and frequently can increase transaction costs (thus lowering performance) and taxabledistributions.
Information technology risk. Information technology companies can be significantly affected by rapid obsolescence, short product cycles,competition, and government regulation, among other factors.
Initial public offerings risk. IPO share prices are frequently volatile and may significantly impact fund performance.
Large company risk. Larger companies may grow more slowly than smaller companies or be slower to respond to business developments. Large-capitalization securities may underperform the market as a whole.
Liquidity risk. The extent (if at all) to which a security may be sold or a derivative position closed without negatively impacting its market value may beimpaired by reduced market activity or participation, legal restrictions, or other economic and market impediments. Liquidity risk may be magnified inrising interest rate environments due to higher than normal redemption rates. Widespread selling of fixed-income securities to satisfy redemptionsduring periods of reduced demand may adversely impact the price or salability of such securities. Periods of heavy redemption could cause the fund tosell assets at a loss or depressed value, which could negatively affect performance. Redemption risk is heightened during periods of declining or illiquidmarkets.
Mortgage-backed and asset-backed securities risk. Mortgage-backed and asset-backed securities are subject to different combinations ofprepayment, extension, interest-rate, and other market risks.
.28
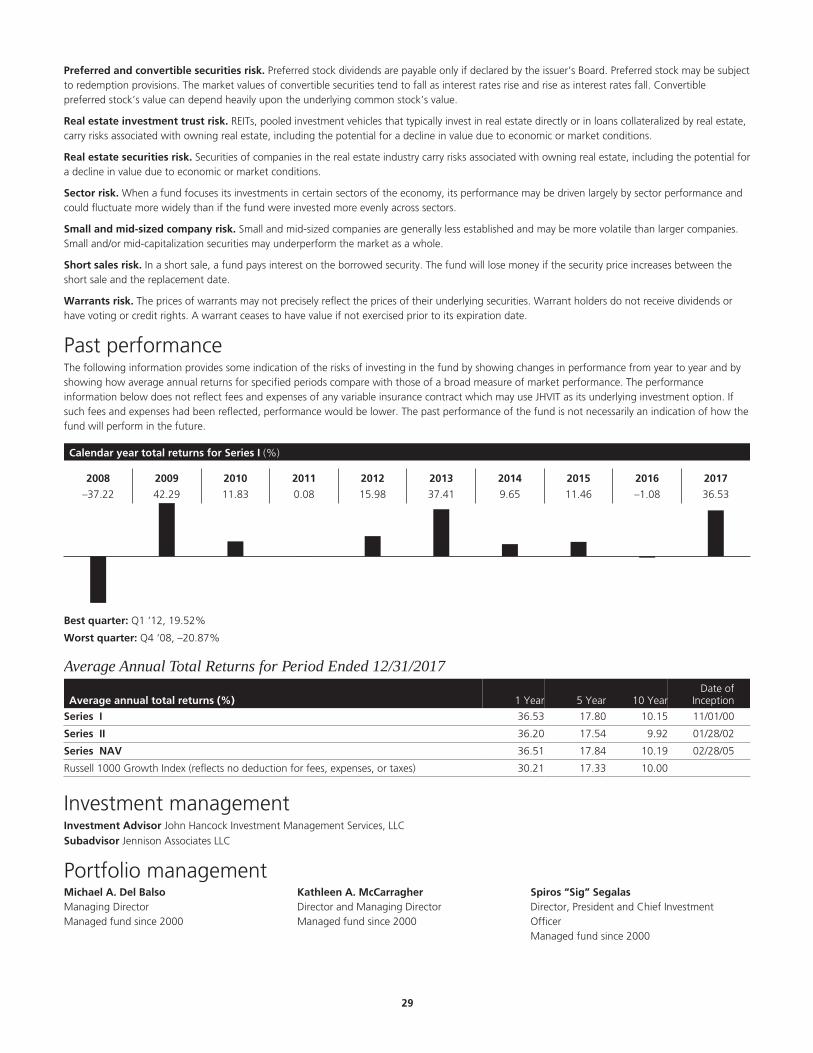
Preferred and convertible securities risk. Preferred stock dividends are payable only if declared by the issuer’s Board. Preferred stock may be subjectto redemption provisions. The market values of convertible securities tend to fall as interest rates rise and rise as interest rates fall. Convertiblepreferred stock’s value can depend heavily upon the underlying common stock’s value.
Real estate investment trust risk. REITs, pooled investment vehicles that typically invest in real estate directly or in loans collateralized by real estate,carry risks associated with owning real estate, including the potential for a decline in value due to economic or market conditions.
Real estate securities risk. Securities of companies in the real estate industry carry risks associated with owning real estate, including the potential fora decline in value due to economic or market conditions.
Sector risk. When a fund focuses its investments in certain sectors of the economy, its performance may be driven largely by sector performance andcould fluctuate more widely than if the fund were invested more evenly across sectors.
Small and mid-sized company risk. Small and mid-sized companies are generally less established and may be more volatile than larger companies.Small and/or mid-capitalization securities may underperform the market as a whole.
Short sales risk. In a short sale, a fund pays interest on the borrowed security. The fund will lose money if the security price increases between theshort sale and the replacement date.
Warrants risk. The prices of warrants may not precisely reflect the prices of their underlying securities. Warrant holders do not receive dividends orhave voting or credit rights. A warrant ceases to have value if not exercised prior to its expiration date.
Past performanceThe following information provides some indication of the risks of investing in the fund by showing changes in performance from year to year and byshowing how average annual returns for specified periods compare with those of a broad measure of market performance. The performanceinformation below does not reflect fees and expenses of any variable insurance contract which may use JHVIT as its underlying investment option. Ifsuch fees and expenses had been reflected, performance would be lower. The past performance of the fund is not necessarily an indication of how thefund will perform in the future.
Calendar year total returns for Series I (%)
2008 2009 2010 2011 2012 2013 2014 2015 2016 2017
–37.22 42.29 11.83 0.08 15.98 37.41 9.65 11.46 –1.08 36.53
Best quarter: Q1 ‘12, 19.52%
Worst quarter: Q4 ‘08, –20.87%
Average Annual Total Returns for Period Ended 12/31/2017
Average annual total returns (%) 1 Year 5 Year 10 YearDate of
Inception
Series I 36.53 17.80 10.15 11/01/00
Series II 36.20 17.54 9.92 01/28/02
Series NAV 36.51 17.84 10.19 02/28/05
Russell 1000 Growth Index (reflects no deduction for fees, expenses, or taxes) 30.21 17.33 10.00
Investment managementInvestment Advisor John Hancock Investment Management Services, LLC§
Subadvisor Jennison Associates LLC
Portfolio managementMichael A. Del BalsoManaging DirectorManaged fund since 2000
Kathleen A. McCarragherDirector and Managing DirectorManaged fund since 2000
Spiros “Sig” SegalasDirector, President and Chief InvestmentOfficerManaged fund since 2000
.29

Other important information regarding the fundFor important information about taxes and financial intermediary compensation, please turn to “Additional information about the funds” at page258 of the Prospectus.
.30

Capital Appreciation Value Trust Investment objectiveTo seek long-term capital appreciation.
Fees and expensesThis table describes the fees and expenses that you may pay if you buy and hold shares of the fund. The fees and expenses do not reflect fees andexpenses of any variable insurance contract that may use the fund as its underlying investment option and would be higher if they did.
Annual fund operating expenses (%) (expenses that you pay each year as a percentage of the valueof your investment) Series I Series II Series NAV
Management fee 0.81 0.81 0.81
Distribution and service (Rule 12b-1) fees 0.05 0.25 0.00
Other expenses 0.06 0.06 0.06
Total annual fund operating expenses 0.92 1.12 0.87
Expense exampleThe examples are intended to help you compare the cost of investing in the fund with the cost of investing in other mutual funds. The examplesassume that $10,000 is invested in the fund for the periods indicated and then all shares are redeemed at the end of those periods. The examples alsoassume that the investment has a 5% return each year and that the fund’s operating expenses remain the same. The expense example does not reflectfees and expenses of any variable insurance contract that may use the fund as its underlying investment option and would be higher if they did.Although your actual costs may be higher or lower, based on these assumptions your costs would be:
Expenses ($) Series I Series II Series NAV
1 year 94 114 89
3 years 293 356 278
5 years 509 617 482
10 years 1,131 1,363 1,073
Portfolio turnoverThe fund pays transaction costs, such as commissions, when it buys and sells securities (or “turns over” its portfolio). A higher portfolio turnover ratemay indicate higher transaction costs. These costs, which are not reflected in annual fund operating expenses or in the example, affect the fund’sperformance. During its most recent fiscal year, the fund’s portfolio turnover rate was 64% of the average value of its portfolio.
Principal investment strategiesUnder normal market conditions, the fund invests primarily in common stocks of established U.S. companies that have above-average potential forcapital growth. Common stocks typically constitute at least 50% of the fund’s total assets. The remaining assets are generally invested in othersecurities, including convertible securities, corporate and government debt (including mortgage- and asset-backed securities), bank loans (whichrepresent an interest in amounts owed by a borrower to a syndicate of lenders), foreign securities, futures and options. The fund may invest up to20% of its total assets in foreign securities.
The fund’s common stocks generally fall into one of two categories: the larger category comprises long-term core holdings whose prices whenpurchased by the fund are considered low in terms of company assets, earnings, or other factors; the smaller category comprises opportunisticinvestments whose prices the subadvisor expects to rise in the short term but not necessarily over the long term. There are no limits on the marketcapitalization of the issuers of the stocks in which the fund invests. Since the subadvisor attempts to prevent losses as well as achieve gains, thesubadvisor typically uses a value approach in selecting investments. The subadvisor’s in-house research team seeks to identify companies that seemundervalued by various measures, such as price/book value, and may be temporarily out of favor but are believed to have good prospects for capitalappreciation. The subadvisor may establish relatively large positions in companies it finds particularly attractive.
In addition, the subadvisor searches for risk/reward values among all types of securities. The portion of the fund invested in a particular type of security,such as common stocks, results largely from case-by-case investment decisions, and the size of the fund’s cash reserve may reflect the subadvisor’sability to find companies that meet valuation criteria rather than its market outlook.
Bonds, bank loans and convertible securities may be purchased to gain additional exposure to a company or for their income or other features;maturity and quality are not necessarily major considerations in determining whether to purchase a particular security. Direct investments in banks maybe illiquid and holding a loan could expose the fund to the risks of being a direct lender. The fund’s investments in below-investment grade debtsecurities and loans are limited to 15% of total assets. The fund may also purchase other securities, including bank debt, loan participations andassignments and futures and options. The fund’s investments in options, if any, will be primarily in an effort to protect against downside risk or togenerate additional income.
.31
The fund holds a certain portion of its assets in money market reserves, which can consist of shares of certain internal T. Rowe Price money marketfunds as well as U.S. dollar and foreign currency-denominated money market securities, including repurchase agreements, in the two highest ratingcategories, maturing in one year or less.
The fund may invest up to 10% of its total assets in hybrid instruments. Hybrid instruments are a type of high-risk derivative which can combine thecharacteristics of securities, futures, currencies and options. Such securities may bear interest or pay dividends at below (or even relatively nominal)rates. In addition, the fund may invest up to 10% of its total assets in mortgage- and asset-backed securities.
The fund may sell securities for a variety of reasons such as to secure gains, limit losses or redeploy assets into more promising opportunities.
In pursuing the fund’s investment objective, the subadvisor has the discretion to purchase some securities that do not meet its normal investmentcriteria, as described above, when it perceives an unusual opportunity for gain. These special situations might arise when the subadvisor believes asecurity could increase in value for a variety of reasons including a change in management, an extraordinary corporate event, a new productintroduction or a favorable competitive development.
Principal risksThe fund is subject to risks, and you could lose money by investing in the fund. The principal risks of investing in the fund include:
Convertible securities risk. The market values of convertible securities tend to fall as interest rates rise and rise as interest rates fall. As the marketprice of underlying common stock declines below the conversion price, the market value of the convertible security tends to be increasingly influencedby its yield.
Credit and counterparty risk. The issuer or guarantor of a fixed-income security, the counterparty to an over-the-counter derivatives contract, or aborrower of fund securities may not make timely payments or otherwise honor its obligations. U.S. government securities are subject to varyingdegrees of credit risk depending upon the nature of their support. A downgrade or default affecting any of the fund’s securities could affect the fund’sperformance.
Cybersecurity and operational risk. Cybersecurity breaches may allow an unauthorized party to gain access to fund assets, customer data, orproprietary information, or cause a fund or its service providers to suffer data corruption or lose operational functionality. Similar incidents affectingissuers of a fund’s securities may negatively impact performance. Operational risk may arise from human error, error by third parties, communicationerrors, or technology failures, among other causes.
Economic and market events risk. Events in the U.S. and global financial markets, including actions taken by the U.S. Federal Reserve or foreigncentral banks to stimulate or stabilize economic growth, may at times result in unusually high market volatility, which could negatively impactperformance. Reduced liquidity in credit and fixed-income markets could adversely affect issuers worldwide. Banks and financial services companiescould suffer losses if interest rates rise or economic conditions deteriorate.
Equity securities risk. The price of equity securities may decline due to changes in a company’s financial condition or overall market conditions.Growth company securities may fluctuate more in price than other securities because of the greater emphasis on earnings expectations. Securities themanager believes are undervalued may never realize their full potential value, and in certain markets value stocks may underperform the market as awhole.
Fixed-income securities risk. A rise in interest rates typically causes bond prices to fall. The longer the average maturity or duration of the bonds heldby a fund, the more sensitive it will likely be to interest-rate fluctuations. An issuer may not make all interest payments or repay all or any of theprincipal borrowed. Changes in a security’s credit quality may adversely affect fund performance.
Foreign securities risk. Less information may be publicly available regarding foreign issuers. Foreign securities may be subject to foreign taxes andmay be more volatile than U.S. securities. Currency fluctuations and political and economic developments may adversely impact the value of foreignsecurities.
Hedging, derivatives, and other strategic transactions risk. Hedging, derivatives, and other strategic transactions may increase a fund’s volatilityand could produce disproportionate losses, potentially more than the fund’s principal investment. Risks of these transactions are different from andpossibly greater than risks of investing directly in securities and other traditional instruments. Under certain market conditions, derivatives couldbecome harder to value or sell and may become subject to liquidity risk (i.e., the inability to enter into closing transactions). Regulatory changes inderivative markets could impact the cost of or the fund’s ability to engage in derivatives transactions. Derivatives and other strategic transactions thatthe fund intends to utilize include: credit default swaps, futures contracts, equity-linked notes (equity-linked notes generally reflect the risks associatedwith their underlying securities, depend on the credit of the notes’ issuer, may be privately placed, and may have a limited secondary market), andoptions. Futures contracts and options generally are subject to counterparty risk.
Hybrid instrument risk. Hybrid instruments entail greater market risk and may be more volatile than traditional debt instruments, may bear interestor pay preferred dividends at below-market rates, and may be illiquid. The risks of investing in hybrid instruments are a combination of the risks ofinvesting in securities, options, futures, and currencies.
Investment company securities risk. A fund bears underlying fund fees and expenses indirectly.
Large company risk. Larger companies may grow more slowly than smaller companies or be slower to respond to business developments. Large-capitalization securities may underperform the market as a whole.
Liquidity risk. The extent (if at all) to which a security may be sold or a derivative position closed without negatively impacting its market value may beimpaired by reduced market activity or participation, legal restrictions, or other economic and market impediments. Liquidity risk may be magnified in
.32
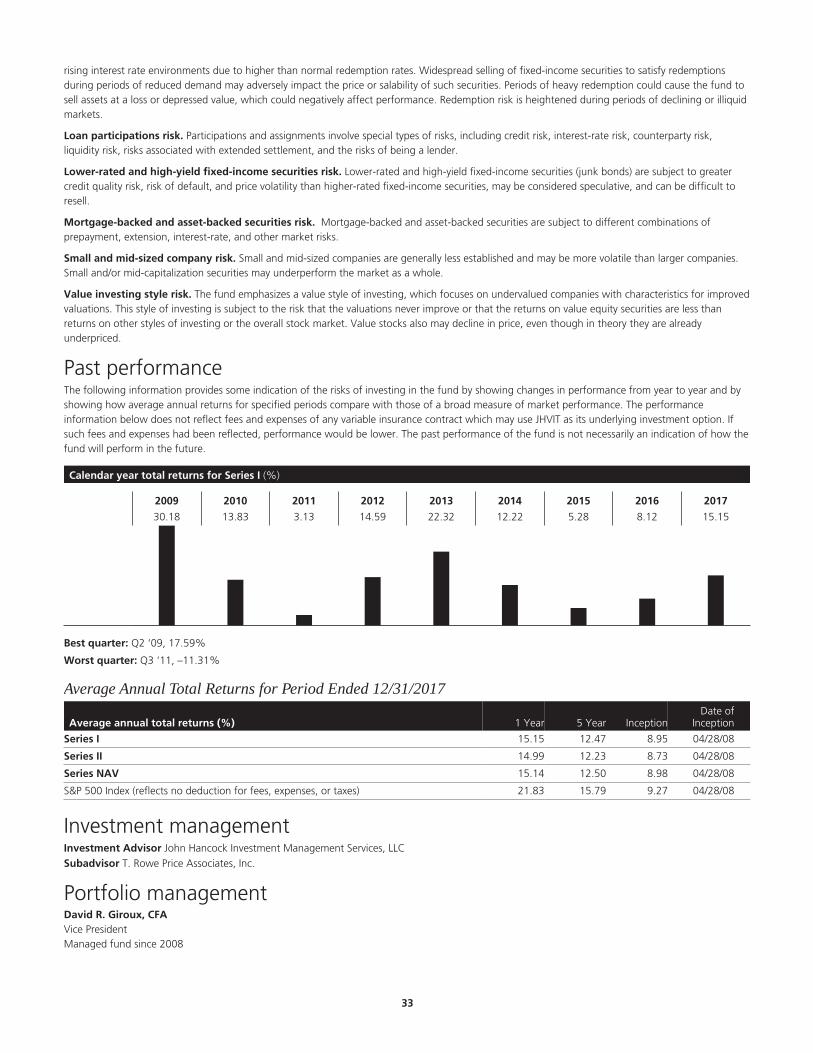
rising interest rate environments due to higher than normal redemption rates. Widespread selling of fixed-income securities to satisfy redemptionsduring periods of reduced demand may adversely impact the price or salability of such securities. Periods of heavy redemption could cause the fund tosell assets at a loss or depressed value, which could negatively affect performance. Redemption risk is heightened during periods of declining or illiquidmarkets.
Loan participations risk. Participations and assignments involve special types of risks, including credit risk, interest-rate risk, counterparty risk,liquidity risk, risks associated with extended settlement, and the risks of being a lender.
Lower-rated and high-yield fixed-income securities risk. Lower-rated and high-yield fixed-income securities (junk bonds) are subject to greatercredit quality risk, risk of default, and price volatility than higher-rated fixed-income securities, may be considered speculative, and can be difficult toresell.
Mortgage-backed and asset-backed securities risk. Mortgage-backed and asset-backed securities are subject to different combinations ofprepayment, extension, interest-rate, and other market risks.
Small and mid-sized company risk. Small and mid-sized companies are generally less established and may be more volatile than larger companies.Small and/or mid-capitalization securities may underperform the market as a whole.
Value investing style risk. The fund emphasizes a value style of investing, which focuses on undervalued companies with characteristics for improvedvaluations. This style of investing is subject to the risk that the valuations never improve or that the returns on value equity securities are less thanreturns on other styles of investing or the overall stock market. Value stocks also may decline in price, even though in theory they are alreadyunderpriced.
Past performanceThe following information provides some indication of the risks of investing in the fund by showing changes in performance from year to year and byshowing how average annual returns for specified periods compare with those of a broad measure of market performance. The performanceinformation below does not reflect fees and expenses of any variable insurance contract which may use JHVIT as its underlying investment option. Ifsuch fees and expenses had been reflected, performance would be lower. The past performance of the fund is not necessarily an indication of how thefund will perform in the future.
Calendar year total returns for Series I (%)
2009 2010 2011 2012 2013 2014 2015 2016 2017
30.18 13.83 3.13 14.59 22.32 12.22 5.28 8.12 15.15
Best quarter: Q2 ‘09, 17.59%
Worst quarter: Q3 ‘11, –11.31%
Average Annual Total Returns for Period Ended 12/31/2017
Average annual total returns (%) 1 Year 5 Year InceptionDate of
Inception
Series I 15.15 12.47 8.95 04/28/08
Series II 14.99 12.23 8.73 04/28/08
Series NAV 15.14 12.50 8.98 04/28/08
S&P 500 Index (reflects no deduction for fees, expenses, or taxes) 21.83 15.79 9.27 04/28/08
Investment managementInvestment Advisor John Hancock Investment Management Services, LLC§
Subadvisor T. Rowe Price Associates, Inc.
Portfolio managementDavid R. Giroux, CFAVice PresidentManaged fund since 2008
.33

Other important information regarding the fundFor important information about taxes and financial intermediary compensation, please turn to “Additional information about the funds” at page258 of the Prospectus.
.34
Core Bond Trust Investment objectiveTo seek total return consisting of income and capital appreciation.
Fees and expensesThis table describes the fees and expenses that you may pay if you buy and hold shares of the fund. The fees and expenses do not reflect fees andexpenses of any variable insurance contract that may use the fund as its underlying investment option and would be higher if they did.
Annual fund operating expenses (%) (expenses that you pay each year as a percentage of the valueof your investment) Series I Series II Series NAV
Management fee 0.58 0.58 0.58
Distribution and service (Rule 12b-1) fees 0.05 0.25 0.00
Other expenses 0.04 0.04 0.04
Total annual fund operating expenses 0.67 0.87 0.62
Expense exampleThe examples are intended to help you compare the cost of investing in the fund with the cost of investing in other mutual funds. The examplesassume that $10,000 is invested in the fund for the periods indicated and then all shares are redeemed at the end of those periods. The examples alsoassume that the investment has a 5% return each year and that the fund’s operating expenses remain the same. The expense example does not reflectfees and expenses of any variable insurance contract that may use the fund as its underlying investment option and would be higher if they did.Although your actual costs may be higher or lower, based on these assumptions your costs would be:
Expenses ($) Series I Series II Series NAV
1 year 68 89 63
3 years 214 278 199
5 years 373 482 346
10 years 835 1,073 774
Portfolio turnoverThe fund pays transaction costs, such as commissions, when it buys and sells securities (or “turns over” its portfolio). A higher portfolio turnover ratemay indicate higher transaction costs. These costs, which are not reflected in annual fund operating expenses or in the example, affect the fund’sperformance. During its most recent fiscal year, the fund’s portfolio turnover rate was 332% of the average value of its portfolio.
Principal investment strategiesUnder normal market conditions, the fund invests at least 80% of its net assets (plus any borrowings for investment purposes) in a broad range ofinvestment-grade debt securities, including U.S. government obligations, corporate bonds, mortgage-backed and other asset-backed securities, andmoney market instruments.
The fund invests in debt securities that the subadvisor believes offer attractive yields and are undervalued relative to issues of similar credit quality andinterest rate sensitivity. The fund may also invest in unrated bonds that the subadvisor believes are comparable to investment-grade debt securities. Thefund may invest to a significant extent in mortgage-backed securities, including collateralized mortgage obligations.
Under normal market conditions, the subadvisor expects to maintain an effective duration within 10% (in either direction) of the duration of theBloomberg Barclays U.S. Aggregate Bond Index (the duration of this index as of December 31, 2017 was 5.98 years).
The fund may invest:
Up to 25% of total assets in asset-backed securities, other than mortgage-backed securities;
Up to 20% of total assets in U.S. dollar-denominated obligations of foreign issuers; and
Up to 10% of total assets in U.S. stripped mortgage-backed securities.
As part of a mortgage-backed securities investment strategy, the fund may enter into dollar rolls. The fund may also enter into reverse repurchaseagreements to enhance return.
The fund’s investment process may, at times, result in a higher than average portfolio turnover ratio and increased trading expenses.
.35
Principal risksThe fund is subject to risks, and you could lose money by investing in the fund. The principal risks of investing in the fund include:
Changing distribution levels risk. The fund may cease or reduce the level of its distribution or make a greater return of capital if income ordividends paid from its investments declines.
Credit and counterparty risk. The issuer or guarantor of a fixed-income security, the counterparty to an over-the-counter derivatives contract, or aborrower of fund securities may not make timely payments or otherwise honor its obligations. U.S. government securities are subject to varyingdegrees of credit risk depending upon the nature of their support. A downgrade or default affecting any of the fund’s securities could affect the fund’sperformance.
Cybersecurity and operational risk. Cybersecurity breaches may allow an unauthorized party to gain access to fund assets, customer data, orproprietary information, or cause a fund or its service providers to suffer data corruption or lose operational functionality. Similar incidents affectingissuers of a fund’s securities may negatively impact performance. Operational risk may arise from human error, error by third parties, communicationerrors, or technology failures, among other causes.
Economic and market events risk. Events in the U.S. and global financial markets, including actions taken by the U.S. Federal Reserve or foreigncentral banks to stimulate or stabilize economic growth, may at times result in unusually high market volatility, which could negatively impactperformance. Reduced liquidity in credit and fixed-income markets could adversely affect issuers worldwide. Banks and financial services companiescould suffer losses if interest rates rise or economic conditions deteriorate.
Fixed-income securities risk. A rise in interest rates typically causes bond prices to fall. The longer the average maturity or duration of the bonds heldby a fund, the more sensitive it will likely be to interest-rate fluctuations. An issuer may not make all interest payments or repay all or any of theprincipal borrowed. Changes in a security’s credit quality may adversely affect fund performance.
Foreign securities risk. Less information may be publicly available regarding foreign issuers. Foreign securities may be subject to foreign taxes andmay be more volatile than U.S. securities. Currency fluctuations and political and economic developments may adversely impact the value of foreignsecurities.
Hedging, derivatives, and other strategic transactions risk. Hedging, derivatives, and other strategic transactions may increase a fund’s volatilityand could produce disproportionate losses, potentially more than the fund’s principal investment. Risks of these transactions are different from andpossibly greater than risks of investing directly in securities and other traditional instruments. Under certain market conditions, derivatives couldbecome harder to value or sell and may become subject to liquidity risk (i.e., the inability to enter into closing transactions). Regulatory changes inderivative markets could impact the cost of or the fund’s ability to engage in derivative transactions. Derivatives and other strategic transactions thatthe fund intends to utilize include: futures, options, and reverse repurchase agreements. Futures contracts and options generally are subject tocounterparty risk. An event of default or insolvency of the counterparty to a reverse repurchase agreement could result in delays or restrictions withrespect to the fund’s ability to dispose of the underlying securities. In addition, a reverse repurchase agreement may be considered a form of leverageand may, therefore, increase fluctuations in the fund’s net asset value per share (NAV).
High portfolio turnover risk. Trading securities actively and frequently can increase transaction costs (thus lowering performance) and taxabledistributions.
Liquidity risk. The extent (if at all) to which a security may be sold or a derivative position closed without negatively impacting its market value may beimpaired by reduced market activity or participation, legal restrictions, or other economic and market impediments. Liquidity risk may be magnified inrising interest rate environments due to higher than normal redemption rates. Widespread selling of fixed-income securities to satisfy redemptionsduring periods of reduced demand may adversely impact the price or salability of such securities. Periods of heavy redemption could cause the fund tosell assets at a loss or depressed value, which could negatively affect performance. Redemption risk is heightened during periods of declining or illiquidmarkets.
Mortgage-backed and asset-backed securities risk. Mortgage-backed and asset-backed securities are subject to different combinations ofprepayment, extension, interest-rate, and other market risks.
Past performanceThe following information provides some indication of the risks of investing in the fund by showing changes in performance from year to year and byshowing how average annual returns for specified periods compare with those of a broad measure of market performance. The performanceinformation below does not reflect fees and expenses of any variable insurance contract which may use JHVIT as its underlying investment option. Ifsuch fees and expenses had been reflected, performance would be lower. The past performance of the fund is not necessarily an indication of how thefund will perform in the future.
.36

Calendar year total returns for Series I (%)
2008 2009 2010 2011 2012 2013 2014 2015 2016 2017
3.38 9.93 7.08 8.32 6.47 –2.16 5.93 0.31 2.74 3.40
Best quarter: Q3 ‘09, 4.52%
Worst quarter: Q4 ‘16, –3.00%
Average Annual Total Returns for Period Ended 12/31/2017
Average annual total returns (%) 1 Year 5 Year 10 YearDate of
Inception
Series I 3.40 2.01 4.48 05/02/05
Series II 3.21 1.81 4.27 05/02/05
Series NAV 3.47 2.05 4.53 05/02/05Bloomberg Barclays U.S. Aggregate Bond Index (reflects no deduction for fees, expenses, ortaxes) 3.54 2.10 4.01
Investment managementInvestment Advisor John Hancock Investment Management Services, LLC§
Subadvisor Wells Capital Management, Incorporated
Portfolio managementMaulik Bhansali, CFASenior Portfolio ManagerManaged fund since 2017
Jarad VasquezSenior Portfolio ManagerManaged fund since 2017
Thomas O’Connor, CFASenior Portfolio ManagerManaged fund since 2007
Other important information regarding the fundFor important information about taxes and financial intermediary compensation, please turn to “Additional information about the funds” at page258 of the Prospectus.
.37
Emerging Markets Value Trust Investment objectiveTo seek long-term capital appreciation.
Fees and expensesThis table describes the fees and expenses that you may pay if you buy and hold shares of the fund. The fees and expenses do not reflect fees andexpenses of any variable insurance contract that may use the fund as its underlying investment option and would be higher if they did.
Annual fund operating expenses (%) (expenses that you pay each year as a percentage of the valueof your investment) Series I Series II Series NAV
Management fee 0.95 0.95 0.95
Distribution and service (Rule 12b-1) fees 0.05 0.25 0.00
Other expenses 0.12 0.12 0.12
Total annual fund operating expenses 1.12 1.32 1.07
Expense exampleThe examples are intended to help you compare the cost of investing in the fund with the cost of investing in other mutual funds. The examplesassume that $10,000 is invested in the fund for the periods indicated and then all shares are redeemed at the end of those periods. The examples alsoassume that the investment has a 5% return each year and that the fund’s operating expenses remain the same. The expense example does not reflectfees and expenses of any variable insurance contract that may use the fund as its underlying investment option and would be higher if they did.Although your actual costs may be higher or lower, based on these assumptions your costs would be:
Expenses ($) Series I Series II Series NAV
1 year 114 134 109
3 years 356 418 340
5 years 617 723 590
10 years 1,363 1,590 1,306
Portfolio turnoverThe fund pays transaction costs, such as commissions, when it buys and sells securities (or “turns over” its portfolio). A higher portfolio turnover ratemay indicate higher transaction costs. These costs, which are not reflected in annual fund operating expenses or in the example, affect the fund’sperformance. During its most recent fiscal year, the fund’s portfolio turnover rate was 28% of the average value of its portfolio.
Principal investment strategiesUnder normal circumstances, the fund will invest at least 80% of its net assets (plus any borrowings for investment purposes) in companies associatedwith emerging markets designated from time to time by the subadvisor.
The fund seeks long-term capital growth through investment primarily in emerging market equity securities. The fund seeks to achieve its investmentobjective by investing in companies associated with emerging markets, which may include frontier markets (emerging market countries at an earlierstage of development), authorized for investment by the subadvisor (“Approved Markets”) from time to time. The fund invests its assets primarily inApproved Markets equity securities listed on bona fide securities exchanges or actively traded on over-the-counter markets. (Approved MarketSecurities are defined below.) These exchanges may be either within or outside the issuer’s domicile country. The securities may be listed or traded inthe form of American Depositary Receipts (ADRs), European Depositary Receipts (EDRs), Global Depositary Receipts (GDRs), Non-Voting DepositaryReceipts (NVDRs) or other similar securities, including dual-listed securities.
The fund seeks to purchase emerging market equity securities that are deemed by the subadvisor to be value stocks at the time of purchase. Thesubadvisor believes securities are considered value stocks primarily because they have a low price in relation to their book value. In assessing value, thesubadvisor may consider additional factors, such as price-to-cash flow or price-to-earnings ratios, as well as economic conditions and developments inthe issuer’s industry.
In addition, the subadvisor may adjust the representation in the fund of an eligible company, or exclude a company, after considering such factors asfree float, momentum, trading strategies, liquidity, size, value, profitability, and other factors the subadvisor determines to be appropriate, givenmarket conditions. In assessing profitability, the subadvisor may consider different ratios, such as that of earnings or profits from operations relative tobook value or assets. The criteria the subadvisor uses for assessing value or profitability are subject to change from time to time.
The fund will also seek to purchase emerging market equity securities across all market capitalizations, and specifically those which are deemed by thesubadvisor to be value stocks at the time of purchase, as described in the paragraph above. The fund may not invest in certain eligible companies orApproved Markets described above because of constraints imposed within Approved Markets, restrictions on purchases by foreigners and the fund’s
.38

policy to invest no more than 25% of its total assets in any one industry at the time of purchase. The fund may have significant investments in thefinancial services sector.
The fund also may invest up to 10% of its total assets in shares of other investment companies that invest in one or more Approved Markets, althoughit tends to do so only where access to those markets is otherwise significantly limited.
In determining what countries are eligible markets for the fund, the subadvisor may consider various factors, including without limitation, the data,analysis and classification of countries published or disseminated by the World Bank, the International Finance Corporation, FTSE International, MSCIand Citigroup. Approved emerging markets may not include all emerging markets classified by such entities. In determining whether to approvemarkets for investment, the subadvisor takes into account, among other things, market liquidity, relative availability of investor information, andgovernment regulation, including fiscal and foreign exchange repatriation rules and the availability of other access to these markets for the fund andother affiliated funds.
The fund may use derivatives such as futures contracts and options on futures contracts to adjust market exposure based on actual or expected cashinflows to or outflows from the fund. The fund does not intend to use derivatives for the purposes of speculation or leveraging investment returns. Thefund may enter into futures contracts and options on futures contracts for Approved Markets or other equity market securities and indices, includingthose of the United States. The fund may also enter into forward currency contracts to facilitate the settlement of equity purchases of foreignsecurities, repatriation of foreign currency balances or exchange of one foreign currency to another currency.
The fund’s policy of seeking broad market diversification means the subadvisor will not utilize “fundamental” securities research techniques inidentifying security selections. Changes in the composition and relative ranking (in terms of book-to-market ratio) of the stocks that are eligible forpurchase by the fund take place with every trade when the securities markets are open for trading due primarily to price fluctuations of such securities.On a periodic basis, the subadvisor will identify value stocks that are eligible for investment and re-evaluate eligible value stocks no less thansemiannually.
The fund does not seek current income as an investment objective, and investments will not be based upon an issuer’s dividend payment policy orrecord. However, many of the companies whose securities will be held by the fund do pay dividends. It is anticipated, therefore, that the fund willreceive dividend income.
Approved Markets
As of the date of this prospectus, the fund is authorized to invest in the countries listed below. The subadvisor will determine in its discretion when andwhether to invest in countries that have been authorized, depending on a number of factors, such as asset growth in the fund and characteristics ofeach country’s markets. The subadvisor also may authorize other countries for investment in the future, in addition to the countries listed below. Also,the fund may continue to hold investments in countries that are not currently authorized for investment, but had been authorized for investment in thepast. Emerging markets approved for investment may include countries in an earlier stage of development that are sometimes referred to as frontiermarkets.
Brazil
Chile
China
Colombia
Czech Republic
Greece
Hungary
India
Indonesia
Malaysia
Mexico
Philippines
Poland
Russia
South Africa
South Korea
Taiwan
Thailand
Turkey
Approved Market Securities
“Approved Market Securities” are defined as securities that are associated with an Approved Market, and include, among others: (a) securities ofcompanies that are organized under the laws of, or maintain their principal place of business in, an Approved Market; (b) securities for which theprincipal trading market is in an Approved Market; (c) securities issued or guaranteed by the government of an Approved Market country, its agenciesor instrumentalities, or the central bank of such country; (d) securities denominated in an Approved Market currency issued by companies to financeoperations in Approved Markets; (e) securities of companies that derive at least 50% of their revenues or profits from goods produced or sold,
.39

investments made or services performed in Approved Markets or have at least 50% of their assets in Approved Markets; (f) Approved Market equitysecurities in the form of depositary shares; (g) securities of pooled investment vehicles that invest primarily in Approved Markets securities or derivativeinstruments that derive their value from Approved Market securities; or (h) securities included in the fund’s benchmark index. Securities of ApprovedMarkets may include securities of companies that have characteristics and business relationships common to companies in other countries. As a result,the value of the securities of such companies may reflect economic and market forces in such other countries as well as in the Approved Markets. Thesubadvisor, however, will select only those companies which, in its view, have sufficiently strong exposure to economic and market forces in ApprovedMarkets. For example, the subadvisor may invest in companies organized and located in the United States or other countries outside of ApprovedMarkets, including companies having their entire production facilities outside of Approved Markets, when such companies meet the definition ofApproved Market Securities.
Principal risksThe fund is subject to risks, and you could lose money by investing in the fund. The principal risks of investing in the fund include:
Credit and counterparty risk. The counterparty to an over-the-counter derivatives contract or a borrower of fund securities may not make timelypayments or otherwise honor its obligations.
Currency risk. Fluctuations in exchange rates may adversely affect the U.S. dollar value of a fund’s investments. Foreign currencies may decline invalue, which could negatively impact performance.
Cybersecurity and operational risk. Cybersecurity breaches may allow an unauthorized party to gain access to fund assets, customer data, orproprietary information, or cause a fund or its service providers to suffer data corruption or lose operational functionality. Similar incidents affectingissuers of a fund’s securities may negatively impact performance. Operational risk may arise from human error, error by third parties, communicationerrors, or technology failures, among other causes.
Economic and market events risk. Events in the U.S. and global financial markets, including actions taken by the U.S. Federal Reserve or foreigncentral banks to stimulate or stabilize economic growth, may at times result in unusually high market volatility, which could negatively impactperformance. Reduced liquidity in credit and fixed-income markets could adversely affect issuers worldwide. Banks and financial services companiescould suffer losses if interest rates rise or economic conditions deteriorate.
Emerging-market risk. The risks of investing in foreign securities are magnified in emerging markets. Emerging-market countries may experiencehigher inflation, interest rates, and unemployment and greater social, economic, and political uncertainties than more developed countries.
Equity securities risk. The price of equity securities may decline due to changes in a company’s financial condition or overall market conditions.Securities the manager believes are undervalued may never realize their full potential value, and in certain markets value stocks may underperform themarket as a whole.
Financial services sector risk. Financial services companies can be significantly affected by economic, market, and business developments, borrowingcosts, interest-rate fluctuations, competition, and government regulation, among other factors.
Foreign securities risk. Less information may be publicly available regarding foreign issuers. Foreign securities may be subject to foreign taxes andmay be more volatile than U.S. securities. Currency fluctuations and political and economic developments may adversely impact the value of foreignsecurities. Depositary receipts are subject to most of the risks associated with investing in foreign securities directly because the value of a depositaryreceipt is dependent upon the market price of the underlying foreign equity security. Depositary receipts are also subject to liquidity risk.
Greater China risk. Investments in the Greater China region may be subject to less developed trading markets, acute political risks such as possiblenegative repercussions resulting from China’s relationship with Taiwan or Hong Kong, and restrictions on monetary repatriation or other adversegovernment actions. For example, a government may restrict investment in companies or industries considered important to national interests, orintervene in the financial markets, such as by imposing trading restrictions, or banning or curtailing short selling. A small number of companies andindustries represent a relatively large portion of the Greater China market.
Frontier-market risk. Frontier-market countries generally have smaller economies and less-developed capital markets and political systems thantraditional emerging-market countries, which magnifies emerging-market risks.
Hedging, derivatives, and other strategic transactions risk. Hedging, derivatives, and other strategic transactions may increase a fund’s volatilityand could produce disproportionate losses, potentially more than the fund’s principal investment. Risks of these transactions are different from andpossibly greater than risks of investing directly in securities and other traditional instruments. Under certain market conditions, derivatives couldbecome harder to value or sell and may become subject to liquidity risk (i.e., the inability to enter into closing transactions). Regulatory changes inderivative markets could impact the cost of or the fund’s ability to engage in derivative transactions. Derivatives and other strategic transactions thatthe fund intends to utilize include: foreign currency forward contracts, futures contracts, futures on options, and options. Foreign currency forwardcontracts, futures contracts, and options generally are subject to counterparty risk. Derivatives associated with foreign currency transactions are subjectto currency risk.
Investment company securities risk. A fund bears underlying fund fees and expenses indirectly.
Large company risk. Larger companies may grow more slowly than smaller companies or be slower to respond to business developments. Large-capitalization securities may underperform the market as a whole.
Liquidity risk. The extent (if at all) to which a security may be sold or a derivative position closed without negatively impacting its market value may beimpaired by reduced market activity or participation, legal restrictions, or other economic and market impediments.
.40
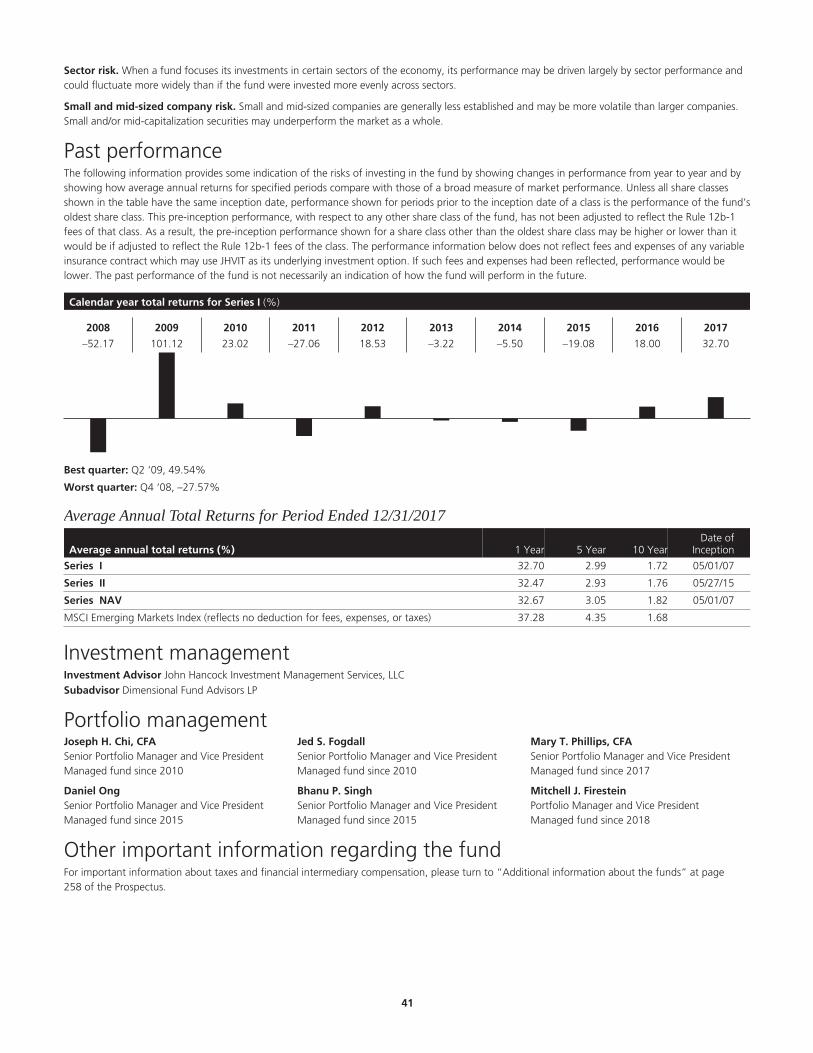
Sector risk. When a fund focuses its investments in certain sectors of the economy, its performance may be driven largely by sector performance andcould fluctuate more widely than if the fund were invested more evenly across sectors.
Small and mid-sized company risk. Small and mid-sized companies are generally less established and may be more volatile than larger companies.Small and/or mid-capitalization securities may underperform the market as a whole.
Past performanceThe following information provides some indication of the risks of investing in the fund by showing changes in performance from year to year and byshowing how average annual returns for specified periods compare with those of a broad measure of market performance. Unless all share classesshown in the table have the same inception date, performance shown for periods prior to the inception date of a class is the performance of the fund’soldest share class. This pre-inception performance, with respect to any other share class of the fund, has not been adjusted to reflect the Rule 12b-1fees of that class. As a result, the pre-inception performance shown for a share class other than the oldest share class may be higher or lower than itwould be if adjusted to reflect the Rule 12b-1 fees of the class. The performance information below does not reflect fees and expenses of any variableinsurance contract which may use JHVIT as its underlying investment option. If such fees and expenses had been reflected, performance would belower. The past performance of the fund is not necessarily an indication of how the fund will perform in the future.
Calendar year total returns for Series I (%)
2008 2009 2010 2011 2012 2013 2014 2015 2016 2017
–52.17 101.12 23.02 –27.06 18.53 –3.22 –5.50 –19.08 18.00 32.70
Best quarter: Q2 ‘09, 49.54%
Worst quarter: Q4 ‘08, –27.57%
Average Annual Total Returns for Period Ended 12/31/2017
Average annual total returns (%) 1 Year 5 Year 10 YearDate of
Inception
Series I 32.70 2.99 1.72 05/01/07
Series II 32.47 2.93 1.76 05/27/15
Series NAV 32.67 3.05 1.82 05/01/07
MSCI Emerging Markets Index (reflects no deduction for fees, expenses, or taxes) 37.28 4.35 1.68
Investment managementInvestment Advisor John Hancock Investment Management Services, LLC§
Subadvisor Dimensional Fund Advisors LP
Portfolio managementJoseph H. Chi, CFASenior Portfolio Manager and Vice PresidentManaged fund since 2010
Jed S. FogdallSenior Portfolio Manager and Vice PresidentManaged fund since 2010
Mary T. Phillips, CFASenior Portfolio Manager and Vice PresidentManaged fund since 2017
Daniel OngSenior Portfolio Manager and Vice PresidentManaged fund since 2015
Bhanu P. SinghSenior Portfolio Manager and Vice PresidentManaged fund since 2015
Mitchell J. FiresteinPortfolio Manager and Vice PresidentManaged fund since 2018
Other important information regarding the fundFor important information about taxes and financial intermediary compensation, please turn to “Additional information about the funds” at page258 of the Prospectus.
.41
Equity Income Trust Investment objectiveTo provide substantial dividend income and also long-term growth of capital.
Fees and expensesThis table describes the fees and expenses that you may pay if you buy and hold shares of the fund. The fees and expenses do not reflect fees andexpenses of any variable insurance contract that may use the fund as its underlying investment option and would be higher if they did.
Annual fund operating expenses (%) (expenses that you pay each year as a percentage of the valueof your investment) Series I Series II Series NAV
Management fee 0.72 0.72 0.72
Distribution and service (Rule 12b-1) fees 0.05 0.25 0.00
Other expenses 0.05 0.05 0.05
Total annual fund operating expenses 0.82 1.02 0.77
Expense exampleThe examples are intended to help you compare the cost of investing in the fund with the cost of investing in other mutual funds. The examplesassume that $10,000 is invested in the fund for the periods indicated and then all shares are redeemed at the end of those periods. The examples alsoassume that the investment has a 5% return each year and that the fund’s operating expenses remain the same. The expense example does not reflectfees and expenses of any variable insurance contract that may use the fund as its underlying investment option and would be higher if they did.Although your actual costs may be higher or lower, based on these assumptions your costs would be:
Expenses ($) Series I Series II Series NAV
1 year 84 104 79
3 years 262 325 246
5 years 455 563 428
10 years 1,014 1,248 954
Portfolio turnoverThe fund pays transaction costs, such as commissions, when it buys and sells securities (or “turns over” its portfolio). A higher portfolio turnover ratemay indicate higher transaction costs. These costs, which are not reflected in annual fund operating expenses or in the example, affect the fund’sperformance. During its most recent fiscal year, the fund’s portfolio turnover rate was 21% of the average value of its portfolio.
Principal investment strategiesUnder normal market conditions, the fund invests at least 80% of its net assets (plus any borrowings for investment purposes) in equity securities, withat least 65% in common stocks of well-established companies paying above-average dividends. The fund typically employs a “value” approach andinvests in stocks and other securities that appear to be undervalued by various measures and may be temporarily out of favor but have good prospectsfor capital appreciation and dividend growth.
Under normal market conditions, substantial dividend income means that the yield on the fund’s portfolio securities generally is expected to exceed theyield on the fund’s benchmark. The subadvisor believes that income can contribute significantly to total return over time and expects the fund’s yield toexceed that of the S&P 500 Index. While the price of a company’s stock can go up or down in response to earnings or to fluctuations in the generalmarket, stocks paying a high level of dividend income tend to be less volatile than those with below-average dividends and may help offset losses infalling markets.
The fund will generally consider companies in the aggregate with one or more of the following characteristics:
established operating histories;
above-average dividend yield relative to the S&P 500 Index;
low price/earnings ratios relative to the S&P 500 Index;
sound balance sheets and other positive financial characteristics; and
low stock price relative to a company’s underlying value, as measured by assets, cash flow or business franchises.
The fund may also purchase other types of securities in keeping with its investment objective, including:
U.S. dollar- and foreign currency-denominated foreign securities including American Depositary Receipts (ADRs) (up to 25% of total assets);
preferred stocks;
convertible stocks, bonds, and warrants;
.42
futures and options; and
bank debt, loan participations and assignments.
The fund may invest in fixed-income securities without restrictions on quality or rating, including up to 10% in below-investment-grade fixed-incomesecurities (“junk bonds”). The fund’s fixed-income investments may include privately negotiated notes or loans, including loan participations andassignments (“bank loans”). These investments will only be made in companies, municipalities or entities that meet the fund’s investment criteria.Direct investments in loans may be illiquid and holding a loan could expose the fund to the risks of being a direct lender. Since the fund investsprimarily in equity securities, the risks associated with fixed income securities will not affect the fund as much as they would a fund that invests moreof its assets in fixed-income securities.
The fund holds a certain portion of its assets in money market reserves, which can consist of shares of certain internal T. Rowe Price money marketfunds as well as U.S. dollar and foreign currency-denominated money market securities, including repurchase agreements, in the two highest ratingcategories, maturing in one year or less.
The fund may sell securities for a variety of reasons such as to secure gains, limit losses or redeploy assets into more promising opportunities.
The fund may invest up to 10% of its total assets in hybrid instruments. Hybrid instruments are a type of high-risk derivative which can combine thecharacteristics of securities, futures and options. Such securities may bear interest or pay dividends at below market (or even relatively nominal) rates.
In pursuing the fund’s investment objective, the subadvisor has the discretion to deviate from its normal investment criteria, as described above, andpurchase securities the subadvisor believes will provide an opportunity for substantial appreciation. These special situations might arise when thesubadvisor believes a security could increase in value for a variety of reasons including a change in management, an extraordinary corporate event, anew product introduction or a favorable competitive development.
Principal risksThe fund is subject to risks, and you could lose money by investing in the fund. The principal risks of investing in the fund include:
Credit and counterparty risk. The issuer or guarantor of a fixed-income security, the counterparty to an over-the-counter derivatives contract, or aborrower of fund securities may not make timely payments or otherwise honor its obligations. A downgrade or default affecting any of the fund’ssecurities could affect the fund’s performance.
Changing distribution levels risk. The fund may cease or reduce the level of its distribution or make a greater return of capital if income ordividends paid from its investments declines.
Currency risk. Fluctuations in exchange rates may adversely affect the U.S. dollar value of a fund’s investments. Foreign currencies may decline invalue, which could negatively impact performance.
Cybersecurity and operational risk. Cybersecurity breaches may allow an unauthorized party to gain access to fund assets, customer data, orproprietary information, or cause a fund or its service providers to suffer data corruption or lose operational functionality. Similar incidents affectingissuers of a fund’s securities may negatively impact performance. Operational risk may arise from human error, error by third parties, communicationerrors, or technology failures, among other causes.
Economic and market events risk. Events in the U.S. and global financial markets, including actions taken by the U.S. Federal Reserve or foreigncentral banks to stimulate or stabilize economic growth, may at times result in unusually high market volatility, which could negatively impactperformance. Reduced liquidity in credit and fixed-income markets could adversely affect issuers worldwide. Banks and financial services companiescould suffer losses if interest rates rise or economic conditions deteriorate.
Equity securities risk. The price of equity securities may decline due to changes in a company’s financial condition or overall market conditions.Securities the manager believes are undervalued may never realize their full potential value, and in certain markets value stocks may underperform themarket as a whole.
Fixed-income securities risk. A rise in interest rates typically causes bond prices to fall. The longer the average maturity or duration of the bonds heldby a fund, the more sensitive it will likely be to interest-rate fluctuations. An issuer may not make all interest payments or repay all or any of theprincipal borrowed. Changes in a security’s credit quality may adversely affect fund performance.
Foreign securities risk. Less information may be publicly available regarding foreign issuers. Foreign securities may be subject to foreign taxes andmay be more volatile than U.S. securities. Currency fluctuations and political and economic developments may adversely impact the value of foreignsecurities. Depositary receipts are subject to most of the risks associated with investing in foreign securities directly because the value of a depositaryreceipt is dependent upon the market price of the underlying foreign equity security. Depositary receipts are also subject to liquidity risk.
Hedging, derivatives, and other strategic transactions risk. Hedging, derivatives, and other strategic transactions may increase a fund’s volatilityand could produce disproportionate losses, potentially more than the fund’s principal investment. Risks of these transactions are different from andpossibly greater than risks of investing directly in securities and other traditional instruments. Under certain market conditions, derivatives couldbecome harder to value or sell and may become subject to liquidity risk (i.e., the inability to enter into closing transactions). Regulatory changes inderivative markets could impact the cost of or the fund’s ability to engage in derivative transactions. Derivatives and other strategic transactions thatthe fund intends to utilize include: futures contracts, equity-linked notes (equity-linked notes generally reflect the risks associated with their underlyingsecurities, depend on the credit of the notes’ issuer, may be privately placed, and may have a limited secondary market), and options. Futures contractsand options generally are subject to counterparty risk.
.43
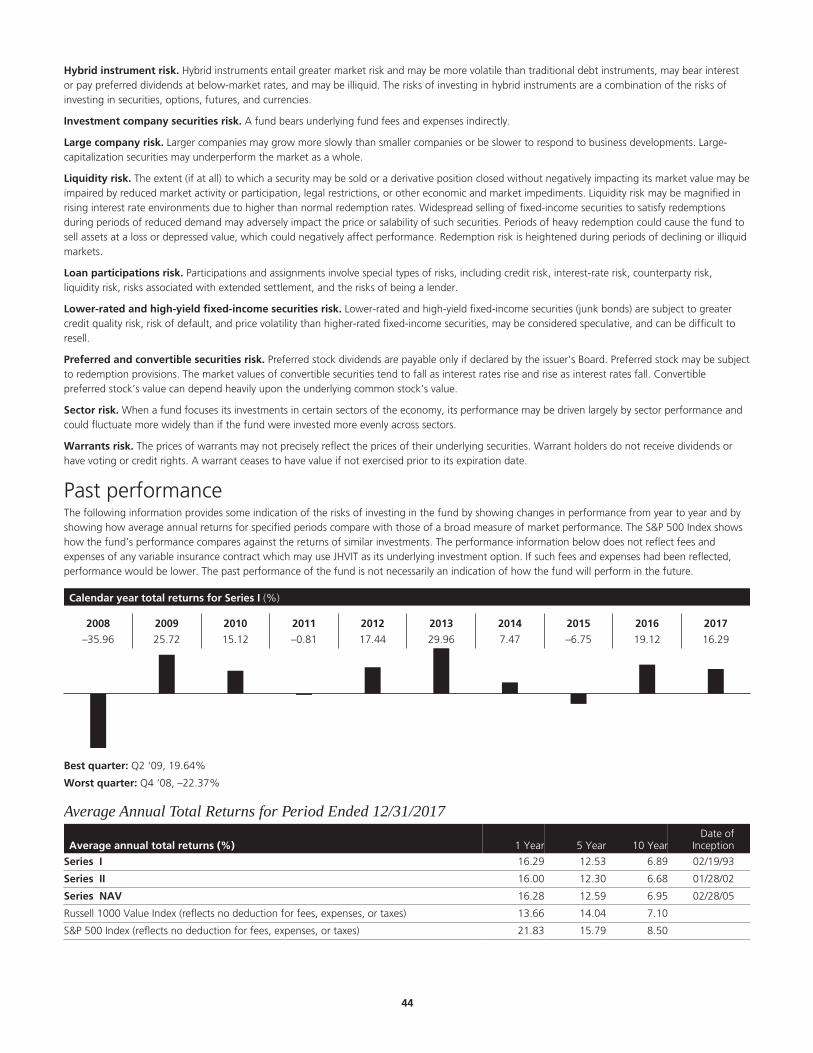
Hybrid instrument risk. Hybrid instruments entail greater market risk and may be more volatile than traditional debt instruments, may bear interestor pay preferred dividends at below-market rates, and may be illiquid. The risks of investing in hybrid instruments are a combination of the risks ofinvesting in securities, options, futures, and currencies.
Investment company securities risk. A fund bears underlying fund fees and expenses indirectly.
Large company risk. Larger companies may grow more slowly than smaller companies or be slower to respond to business developments. Large-capitalization securities may underperform the market as a whole.
Liquidity risk. The extent (if at all) to which a security may be sold or a derivative position closed without negatively impacting its market value may beimpaired by reduced market activity or participation, legal restrictions, or other economic and market impediments. Liquidity risk may be magnified inrising interest rate environments due to higher than normal redemption rates. Widespread selling of fixed-income securities to satisfy redemptionsduring periods of reduced demand may adversely impact the price or salability of such securities. Periods of heavy redemption could cause the fund tosell assets at a loss or depressed value, which could negatively affect performance. Redemption risk is heightened during periods of declining or illiquidmarkets.
Loan participations risk. Participations and assignments involve special types of risks, including credit risk, interest-rate risk, counterparty risk,liquidity risk, risks associated with extended settlement, and the risks of being a lender.
Lower-rated and high-yield fixed-income securities risk. Lower-rated and high-yield fixed-income securities (junk bonds) are subject to greatercredit quality risk, risk of default, and price volatility than higher-rated fixed-income securities, may be considered speculative, and can be difficult toresell.
Preferred and convertible securities risk. Preferred stock dividends are payable only if declared by the issuer’s Board. Preferred stock may be subjectto redemption provisions. The market values of convertible securities tend to fall as interest rates rise and rise as interest rates fall. Convertiblepreferred stock’s value can depend heavily upon the underlying common stock’s value.
Sector risk. When a fund focuses its investments in certain sectors of the economy, its performance may be driven largely by sector performance andcould fluctuate more widely than if the fund were invested more evenly across sectors.
Warrants risk. The prices of warrants may not precisely reflect the prices of their underlying securities. Warrant holders do not receive dividends orhave voting or credit rights. A warrant ceases to have value if not exercised prior to its expiration date.
Past performanceThe following information provides some indication of the risks of investing in the fund by showing changes in performance from year to year and byshowing how average annual returns for specified periods compare with those of a broad measure of market performance. The S&P 500 Index showshow the fund’s performance compares against the returns of similar investments. The performance information below does not reflect fees andexpenses of any variable insurance contract which may use JHVIT as its underlying investment option. If such fees and expenses had been reflected,performance would be lower. The past performance of the fund is not necessarily an indication of how the fund will perform in the future.
Calendar year total returns for Series I (%)
2008 2009 2010 2011 2012 2013 2014 2015 2016 2017
–35.96 25.72 15.12 –0.81 17.44 29.96 7.47 –6.75 19.12 16.29
Best quarter: Q2 ‘09, 19.64%
Worst quarter: Q4 ‘08, –22.37%
Average Annual Total Returns for Period Ended 12/31/2017
Average annual total returns (%) 1 Year 5 Year 10 YearDate of
Inception
Series I 16.29 12.53 6.89 02/19/93
Series II 16.00 12.30 6.68 01/28/02
Series NAV 16.28 12.59 6.95 02/28/05
Russell 1000 Value Index (reflects no deduction for fees, expenses, or taxes) 13.66 14.04 7.10
S&P 500 Index (reflects no deduction for fees, expenses, or taxes) 21.83 15.79 8.50
.44

Investment managementInvestment Advisor John Hancock Investment Management Services, LLC§
Subadvisor T. Rowe Price Associates, Inc.
Portfolio managementJohn D. Linehan, CFAPortfolio ManagerManaged the fund since 2015
Other important information regarding the fundFor important information about taxes and financial intermediary compensation, please turn to “Additional information about the funds” at page258 of the Prospectus.
.45

Financial Industries Trust Investment objectiveTo seek growth of capital.
Fees and expensesThis table describes the fees and expenses that you may pay if you buy and hold shares of the fund. The fees and expenses do not reflect fees andexpenses of any variable insurance contract that may use the fund as its underlying investment option and would be higher if they did.
Annual fund operating expenses (%) (expenses that you pay each year as a percentage of the valueof your investment) Series I Series II Series NAV
Management fee 0.76 0.76 0.76
Distribution and service (Rule 12b-1) fees 0.05 0.25 0.00
Other expenses 0.07 0.07 0.07
Acquired fund fees and expenses1 0.04 0.04 0.04
Total annual fund operating expenses2 0.92 1.12 0.87
1 “Acquired fund fees and expenses” are based on indirect net expenses associated with the fund’s investments in underlying investment companies.2 The “Total annual fund operating expenses” shown may not correlate to the fund’s ratios of expenses to average daily net assets shown in the “Financial highlights” section of
the fund’s prospectus, which does not include “Acquired fund fees and expenses.”
Expense exampleThe examples are intended to help you compare the cost of investing in the fund with the cost of investing in other mutual funds. The examplesassume that $10,000 is invested in the fund for the periods indicated and then all shares are redeemed at the end of those periods. The examples alsoassume that the investment has a 5% return each year and that the fund’s operating expenses remain the same. The expense example does not reflectfees and expenses of any variable insurance contract that may use the fund as its underlying investment option and would be higher if they did.Although your actual costs may be higher or lower, based on these assumptions your costs would be:
Expenses ($) Series I Series II Series NAV
1 year 94 114 89
3 years 293 356 278
5 years 509 617 482
10 years 1,131 1,363 1,073
Portfolio turnoverThe fund pays transaction costs, such as commissions, when it buys and sells securities (or “turns over” its portfolio). A higher portfolio turnover ratemay indicate higher transaction costs. These costs, which are not reflected in annual fund operating expenses or in the example, affect the fund’sperformance. During its most recent fiscal year, the fund’s portfolio turnover rate was 42% of the average value of its portfolio.
Principal investment strategiesUnder normal market conditions, the fund invests at least 80% of its net assets (plus any borrowing for investment purposes) in companies that areprincipally engaged in financial services. (The fund will provide written notice to shareholders at least 60 days prior to a change in its 80% investmentpolicy.) These companies include U.S. and foreign financial services companies of any size including banks, thrifts, finance companies, brokerage andadvisory firms, real estate-related firms, insurance companies and financial holding companies. The fund may gain exposure to securities described inthese strategies through investing in investment companies and pooled investment vehicles.
In managing the fund, the subadvisor focuses primarily on stock selection rather than industry allocation. In choosing individual stocks, the subadvisoruses fundamental financial analysis to identify securities that appear comparatively undervalued.
The fund concentrates its investments (invests more than 25% of its total assets) in companies that are principally engaged in financial services, andtherefore may experience greater volatility than funds investing in a broader range of industries.
Given the industry-wide trend toward consolidation, the subadvisor also invests in companies that appear to be positioned for a merger. Thesubadvisor generally gathers firsthand information about companies from interviews and company visits.
The fund may invest in U.S. and foreign bonds, including up to 5% of net assets in below investment-grade bonds (i.e., “junk bonds”) rated as low asCCC by Standard & Poor’s Rating Services (S&P) or Caa by Moody’s Investors Service, Inc. (Moody’s) and their unrated equivalents. It may also invest upto 15% of net assets in investment-grade short-term securities. The fund’s investment policies are based on credit ratings at the time of purchase.
In abnormal circumstances, the fund may temporarily invest up to 80% of its assets in investment-grade short-term securities. In these and other cases,the fund might not achieve its investment objective.
.46
The fund may, to a limited extent, engage in derivative transactions that include futures contracts, options and foreign currency forward contracts, ineach case for the purpose of reducing risk, obtaining efficient market exposure and/or enhancing investment returns.
The fund may invest in companies located in emerging market countries.
Principal risksThe fund is subject to risks, and you could lose money by investing in the fund. The principal risks of investing in the fund include:
Banking industry risk. Commercial banks, savings and loan associations, and holding companies of the foregoing are especially subject to adverseeffects of volatile interest rates, concentrations of loans in particular industries, and significant competition. Profitability of these businesses dependssignificantly upon the availability and cost of capital funds. Commercial banks and savings associations are subject to extensive state regulation.
Concentration risk. When a fund focuses on a single industry or sector of the economy, its performance may be largely driven by industry or sectorperformance and could fluctuate more widely than if the fund were invested more evenly across industries or sectors. Regional bank stocks couldsuffer losses if interest rates fall or economic conditions deteriorate and as a result of state and federal regulation.
Credit and counterparty risk. The issuer or guarantor of a fixed-income security, the counterparty to an over-the-counter derivatives contract, or aborrower of fund securities may not make timely payments or otherwise honor its obligations. A downgrade or default affecting any of the fund’ssecurities could affect the fund’s performance.
Cybersecurity and operational risk. Cybersecurity breaches may allow an unauthorized party to gain access to fund assets, customer data, orproprietary information, or cause a fund or its service providers to suffer data corruption or lose operational functionality. Similar incidents affectingissuers of a fund’s securities may negatively impact performance. Operational risk may arise from human error, error by third parties, communicationerrors, or technology failures, among other causes.
Economic and market events risk. Events in the U.S. and global financial markets, including actions taken by the U.S. Federal Reserve or foreigncentral banks to stimulate or stabilize economic growth, may at times result in unusually high market volatility, which could negatively impactperformance. Reduced liquidity in credit and fixed-income markets could adversely affect issuers worldwide. Banks and financial services companiescould suffer losses if interest rates rise or economic conditions deteriorate.
Equity securities risk. The price of equity securities may decline due to changes in a company’s financial condition or overall market conditions.Securities the manager believes are undervalued may never realize their full potential value, and in certain markets value stocks may underperform themarket as a whole.
Financial services sector risk. A fund investing principally in securities of companies in the financial services sector is particularly vulnerable to eventsaffecting that sector. Financial services companies can be significantly affected by economic, market, and business developments, borrowing costs,interest-rate fluctuations, competition, and government regulation, among other factors.
Fixed-income securities risk. A rise in interest rates typically causes bond prices to fall. The longer the average maturity or duration of the bonds heldby a fund, the more sensitive it will likely be to interest-rate fluctuations. An issuer may not make all interest payments or repay all or any of theprincipal borrowed. Changes in a security’s credit quality may adversely affect fund performance.
Foreign securities risk. Less information may be publicly available regarding foreign issuers. Foreign securities may be subject to foreign taxes andmay be more volatile than U.S. securities. Currency fluctuations and political and economic developments may adversely impact the value of foreignsecurities. The risks of investing in foreign securities are magnified in emerging markets. Depositary receipts are subject to most of the risks associatedwith investing in foreign securities directly because the value of a depositary receipt is dependent upon the market price of the underlying foreignequity security. Depositary receipts are also subject to liquidity risk.
Hedging, derivatives, and other strategic transactions risk. Hedging, derivatives, and other strategic transactions may increase a fund’s volatilityand could produce disproportionate losses, potentially more than the fund’s principal investment. Risks of these transactions are different from andpossibly greater than risks of investing directly in securities and other traditional instruments. Under certain market conditions, derivatives couldbecome harder to value or sell and may become subject to liquidity risk (i.e., the inability to enter into closing transactions). Regulatory changes inderivative markets could impact the cost of or the fund’s ability to engage in derivative transactions. Derivatives and other strategic transactions thatthe fund intends to utilize include: foreign currency forward contracts, futures contracts, and options. Foreign currency forward contracts, futurescontracts, and options generally are subject to counterparty risk. Derivatives associated with foreign currency transactions are subject to currency risk.
Investment company securities risk. A fund bears underlying fund fees and expenses indirectly.
Large company risk. Larger companies may grow more slowly than smaller companies or be slower to respond to business developments. Large-capitalization securities may underperform the market as a whole.
Liquidity risk. The extent (if at all) to which a security may be sold or a derivative position closed without negatively impacting its market value may beimpaired by reduced market activity or participation, legal restrictions, or other economic and market impediments. Liquidity risk may be magnified inrising interest rate environments due to higher than normal redemption rates. Widespread selling of fixed-income securities to satisfy redemptionsduring periods of reduced demand may adversely impact the price or salability of such securities. Periods of heavy redemption could cause the fund tosell assets at a loss or depressed value, which could negatively affect performance. Redemption risk is heightened during periods of declining or illiquidmarkets.
.47

Lower-rated and high-yield fixed-income securities risk. Lower-rated and high-yield fixed-income securities (junk bonds) are subject to greatercredit quality risk, risk of default, and price volatility than higher-rated fixed-income securities, may be considered speculative, and can be difficult toresell.
Master limited partnership risk. MLPs generally reflect the risks associated with their underlying assets and with pooled investment vehicles. MLPswith credit-related holdings are subject to interest-rate risk and risk of default.
Preferred and convertible securities risk. Preferred stock dividends are payable only if declared by the issuer’s Board. Preferred stock may be subjectto redemption provisions. The market values of convertible securities tend to fall as interest rates rise and rise as interest rates fall. Convertiblepreferred stock’s value can depend heavily upon the underlying common stock’s value.
Real estate securities risk. Securities of companies in the real estate industry carry risks associated with owning real estate, including the potential fora decline in value due to economic or market conditions.
Small and mid-sized company risk. Small and mid-sized companies are generally less established and may be more volatile than larger companies.Small and/or mid-capitalization securities may underperform the market as a whole.
Warrants risk. The prices of warrants may not precisely reflect the prices of their underlying securities. Warrant holders do not receive dividends orhave voting or credit rights. A warrant ceases to have value if not exercised prior to its expiration date.
Past performanceThe following information provides some indication of the risks of investing in the fund by showing changes in performance from year to year and byshowing how average annual returns for specified periods compare with those of a broad measure of market performance. The S&P 500 Index and theLipper Financial Services Index show how the fund’s performance compares against the returns of similar investments. The performance informationbelow does not reflect fees and expenses of any variable insurance contract which may use JHVIT as its underlying investment option. If such fees andexpenses had been reflected, performance would be lower. The past performance of the fund is not necessarily an indication of how the fund willperform in the future.
Calendar year total returns for Series I (%)
2008 2009 2010 2011 2012 2013 2014 2015 2016 2017
–44.65 41.41 12.25 –9.51 18.05 30.75 8.65 –2.65 19.37 15.28
Best quarter: Q2 ‘09, 27.71%
Worst quarter: Q4 ‘08, –27.18%
Average Annual Total Returns for Period Ended 12/31/2017
Average annual total returns (%) 1 Year 5 Year 10 YearDate of
Inception
Series I 15.28 13.74 5.97 04/30/01
Series II 15.02 13.50 5.75 01/28/02
Series NAV 15.29 13.79 6.02 04/29/05
S&P 500 Financials Index (reflects no deduction for fees, expenses, or taxes) 22.18 18.21 3.78
S&P 500 Index (reflects no deduction for fees, expenses, or taxes) 21.83 15.79 8.50
Lipper Financial Services Index (reflects no deduction for fees, expenses, or taxes) 15.12 15.97 4.62
Investment managementInvestment Advisor John Hancock Investment Management Services, LLC§
Subadvisor John Hancock Asset Management a division of Manulife Asset Management (US) LLC
Portfolio managementSusan A. CurryManaging Director and Portfolio ManagerManaged fund since 2014
Ryan P. Lentell, CFAManaging Director and Portfolio ManagerManaged fund since 2015
Lisa A. WelchSenior Managing Director and Senior PortfolioManagerManaged fund since 2014
.48

Other important information regarding the fundFor important information about taxes and financial intermediary compensation, please turn to “Additional information about the funds” at page258 of the Prospectus.
.49
Fundamental All Cap Core Trust Investment objectiveTo seek long-term growth of capital.
Fees and expensesThis table describes the fees and expenses that you may pay if you buy and hold shares of the fund. The fees and expenses do not reflect fees andexpenses of any variable insurance contract that may use the fund as its underlying investment option and would be higher if they did.
Annual fund operating expenses (%) (expenses that you pay each year as a percentage of the valueof your investment) Series I Series II Series NAV
Management fee 0.68 0.68 0.68
Distribution and service (Rule 12b-1) fees 0.05 0.25 0.00
Other expenses 0.03 0.03 0.03
Total annual fund operating expenses 0.76 0.96 0.71
Expense exampleThe examples are intended to help you compare the cost of investing in the fund with the cost of investing in other mutual funds. The examplesassume that $10,000 is invested in the fund for the periods indicated and then all shares are redeemed at the end of those periods. The examples alsoassume that the investment has a 5% return each year and that the fund’s operating expenses remain the same. The expense example does not reflectfees and expenses of any variable insurance contract that may use the fund as its underlying investment option and would be higher if they did.Although your actual costs may be higher or lower, based on these assumptions your costs would be:
Expenses ($) Series I Series II Series NAV
1 year 78 98 73
3 years 243 306 227
5 years 422 531 395
10 years 942 1,178 883
Portfolio turnoverThe fund pays transaction costs, such as commissions, when it buys and sells securities (or “turns over” its portfolio). A higher portfolio turnover ratemay indicate higher transaction costs. These costs, which are not reflected in annual fund operating expenses or in the example, affect the fund’sperformance. During its most recent fiscal year, the fund’s portfolio turnover rate was 42% of the average value of its portfolio.
Principal investment strategiesUnder normal market conditions, the fund invests at least 80% of its net assets (plus any borrowings for investment purposes) in equity securities.Market capitalizations of these companies will span the capitalization spectrum. Equity securities include common, convertible, and preferred securitiesand their equivalents.
In managing the fund, the subadvisor looks for companies that are highly differentiated with key growth drivers, sustainable cash flow production, andhigh returns on capital. The subadvisor seeks to identify companies with sustainable competitive advantages and high barriers to entry, strongmanagement and a focus on creating value for fund shareholders. Both growth and value opportunities are evaluated with an approach that uses thepresent value of estimated future cash flows as the core methodology for measuring intrinsic value.
The subadvisor employs a disciplined fundamental research process which produces bottom-up company assessments using key assumptions that drivesales, margins, and asset intensity. Scenario analysis is designed to provide a meaningful range of outcomes and the ability to assess investors’embedded expectations. The subadvisor seeks to purchase companies that meet the criteria above when the shares are selling at a significant discountto intrinsic value. Sell decisions are similarly driven by long term fundamental analysis.
The subadvisor constantly reviews portfolio investments and may sell a holding when it has achieved its valuation target, if it believes there is structuralor permanent deterioration in the underlying fundamentals of the business, or if it identifies what it believes is a more attractive investmentopportunity.
The fund may invest up to 20% of its net assets in equity securities of foreign issuers, including American Depositary Receipts (ADRs) and similarinvestments. For purposes of reducing risk and/or obtaining efficient investment exposure, the fund may invest in exchange-traded funds (ETFs) andderivative instruments that include options, futures contracts, and swaps. The fund may also invest in U.S. government securities and other short-termsecurities such as money market instruments and repurchase agreements.
Use of Hedging and Other Strategic Transactions. The fund is authorized to use all of the various investment strategies referred to under “AdditionalInformation About the Funds’ Principal Risks — Hedging, derivatives and other strategic transactions risk.”
.50

Principal risksThe fund is subject to risks, and you could lose money by investing in the fund. The principal risks of investing in the fund include:
Consumer discretionary risk. The consumer discretionary sector may be affected by fluctuations in supply and demand, and may also be adverselyaffected by changes in consumer spending as a result of world events, political and economic conditions, commodity price volatility, changes inexchange rates, imposition of import controls, increased competition, depletion of resources, and labor relations.
Credit and counterparty risk. The issuer or guarantor of a fixed-income security, the counterparty to an over-the-counter derivatives contract, or aborrower of fund securities may not make timely payments or otherwise honor its obligations. U.S. government securities are subject to varyingdegrees of credit risk depending upon the nature of their support. A downgrade or default affecting any of the fund’s securities could affect the fund’sperformance.
Cybersecurity and operational risk. Cybersecurity breaches may allow an unauthorized party to gain access to fund assets, customer data, orproprietary information, or cause a fund or its service providers to suffer data corruption or lose operational functionality. Similar incidents affectingissuers of a fund’s securities may negatively impact performance. Operational risk may arise from human error, error by third parties, communicationerrors, or technology failures, among other causes.
Economic and market events risk. Events in the U.S. and global financial markets, including actions taken by the U.S. Federal Reserve or foreigncentral banks to stimulate or stabilize economic growth, may at times result in unusually high market volatility, which could negatively impactperformance. Reduced liquidity in credit and fixed-income markets could adversely affect issuers worldwide. Banks and financial services companiescould suffer losses if interest rates rise or economic conditions deteriorate.
Equity securities risk. The price of equity securities may decline due to changes in a company’s financial condition or overall market conditions.Growth company securities may fluctuate more in price than other securities because of the greater emphasis on earnings expectations. Securities themanager believes are undervalued may never realize their full potential value, and in certain markets value stocks may underperform the market as awhole.
Exchange-traded funds risk. An ETF generally reflects the risks of the underlying securities it is designed to track. A fund bears ETF fees and expensesindirectly.
Financial services sector risk. Financial services companies can be significantly affected by economic, market, and business developments, borrowingcosts, interest-rate fluctuations, competition, and government regulation, among other factors.
Fixed-income securities risk. A rise in interest rates typically causes bond prices to fall. The longer the average maturity or duration of the bonds heldby a fund, the more sensitive it will likely be to interest-rate fluctuations. An issuer may not make all interest payments or repay all or any of theprincipal borrowed. Changes in a security’s credit quality may adversely affect fund performance.
Foreign securities risk. Less information may be publicly available regarding foreign issuers. Foreign securities may be subject to foreign taxes andmay be more volatile than U.S. securities. Currency fluctuations and political and economic developments may adversely impact the value of foreignsecurities. Depositary receipts are subject to most of the risks associated with investing in foreign securities directly because the value of a depositaryreceipt is dependent upon the market price of the underlying foreign equity security. Depositary receipts are also subject to liquidity risk.
Hedging, derivatives, and other strategic transactions risk. Hedging, derivatives, and other strategic transactions may increase a fund’s volatilityand could produce disproportionate losses, potentially more than the fund’s principal investment. Risks of these transactions are different from andpossibly greater than risks of investing directly in securities and other traditional instruments. Under certain market conditions, derivatives couldbecome harder to value or sell and may become subject to liquidity risk (i.e., the inability to enter into closing transactions). Regulatory changes inderivative markets could impact the cost of or the fund’s ability to engage in derivative transactions. Derivatives and other strategic transactions thatthe fund intends to utilize if any, include: futures contracts, interest-rate swaps, options and swaps. Futures contracts, options, and swaps generally aresubject to counterparty risk. In addition, swaps may be subject to interest-rate and settlement risk, and the risk of default of the underlying referenceobligations.
Large company risk. Larger companies may grow more slowly than smaller companies or be slower to respond to business developments. Large-capitalization securities may underperform the market as a whole.
Liquidity risk. The extent (if at all) to which a security may be sold or a derivative position closed without negatively impacting its market value may beimpaired by reduced market activity or participation, legal restrictions, or other economic and market impediments. Liquidity risk may be magnified inrising interest rate environments due to higher than normal redemption rates. Widespread selling of fixed-income securities to satisfy redemptionsduring periods of reduced demand may adversely impact the price or salability of such securities. Periods of heavy redemption could cause the fund tosell assets at a loss or depressed value, which could negatively affect performance. Redemption risk is heightened during periods of declining or illiquidmarkets.
Preferred and convertible securities risk. Preferred stock dividends are payable only if declared by the issuer’s Board. Preferred stock may be subjectto redemption provisions. The market values of convertible securities tend to fall as interest rates rise and rise as interest rates fall. Convertiblepreferred stock’s value can depend heavily upon the underlying common stock’s value.
Sector risk. When a fund focuses its investments in certain sectors of the economy, its performance may be driven largely by sector performance andcould fluctuate more widely than if the fund were invested more evenly across sectors.
.51
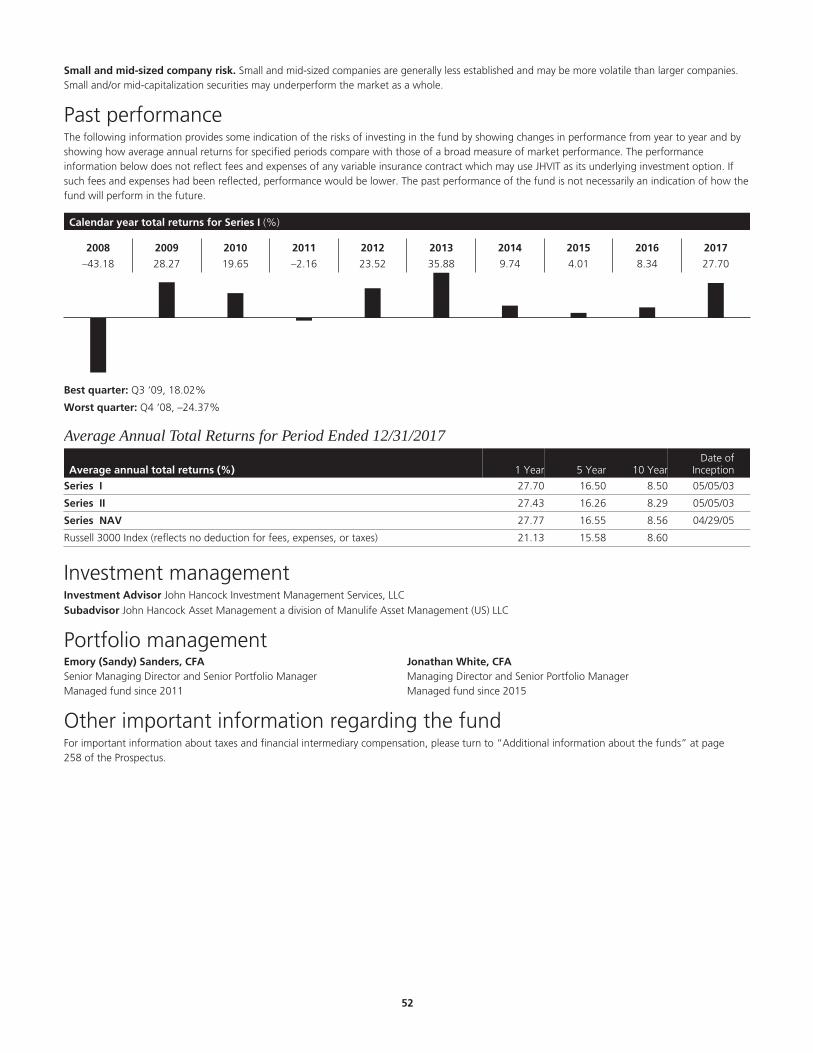
Small and mid-sized company risk. Small and mid-sized companies are generally less established and may be more volatile than larger companies.Small and/or mid-capitalization securities may underperform the market as a whole.
Past performanceThe following information provides some indication of the risks of investing in the fund by showing changes in performance from year to year and byshowing how average annual returns for specified periods compare with those of a broad measure of market performance. The performanceinformation below does not reflect fees and expenses of any variable insurance contract which may use JHVIT as its underlying investment option. Ifsuch fees and expenses had been reflected, performance would be lower. The past performance of the fund is not necessarily an indication of how thefund will perform in the future.
Calendar year total returns for Series I (%)
2008 2009 2010 2011 2012 2013 2014 2015 2016 2017
–43.18 28.27 19.65 –2.16 23.52 35.88 9.74 4.01 8.34 27.70
Best quarter: Q3 ‘09, 18.02%
Worst quarter: Q4 ‘08, –24.37%
Average Annual Total Returns for Period Ended 12/31/2017
Average annual total returns (%) 1 Year 5 Year 10 YearDate of
Inception
Series I 27.70 16.50 8.50 05/05/03
Series II 27.43 16.26 8.29 05/05/03
Series NAV 27.77 16.55 8.56 04/29/05
Russell 3000 Index (reflects no deduction for fees, expenses, or taxes) 21.13 15.58 8.60
Investment managementInvestment Advisor John Hancock Investment Management Services, LLC§
Subadvisor John Hancock Asset Management a division of Manulife Asset Management (US) LLC
Portfolio managementEmory (Sandy) Sanders, CFASenior Managing Director and Senior Portfolio ManagerManaged fund since 2011
Jonathan White, CFAManaging Director and Senior Portfolio ManagerManaged fund since 2015
Other important information regarding the fundFor important information about taxes and financial intermediary compensation, please turn to “Additional information about the funds” at page258 of the Prospectus.
.52
Fundamental Large Cap Value Trust Investment objectiveTo seek long-term capital appreciation.
Fees and expensesThis table describes the fees and expenses that you may pay if you buy and hold shares of the fund. The fees and expenses do not reflect fees andexpenses of any variable insurance contract that may use the fund as its underlying investment option and would be higher if they did.
Annual fund operating expenses (%) (expenses that you pay each year as a percentage of the valueof your investment) Series I Series II Series NAV
Management fee 0.65 0.65 0.65
Distribution and service (Rule 12b-1) fees 0.05 0.25 0.00
Other expenses 0.04 0.04 0.04
Total annual fund operating expenses 0.74 0.94 0.69
Expense exampleThe examples are intended to help you compare the cost of investing in the fund with the cost of investing in other mutual funds. The examplesassume that $10,000 is invested in the fund for the periods indicated and then all shares are redeemed at the end of those periods. The examples alsoassume that the investment has a 5% return each year and that the fund’s operating expenses remain the same. The expense example does not reflectfees and expenses of any variable insurance contract that may use the fund as its underlying investment option and would be higher if they did.Although your actual costs may be higher or lower, based on these assumptions your costs would be:
Expenses ($) Series I Series II Series NAV
1 year 76 96 70
3 years 237 300 221
5 years 411 520 384
10 years 918 1,155 859
Portfolio turnoverThe fund pays transaction costs, such as commissions, when it buys and sells securities (or “turns over” its portfolio). A higher portfolio turnover ratemay indicate higher transaction costs. These costs, which are not reflected in annual fund operating expenses or in the example, affect the fund’sperformance. During its most recent fiscal year, the fund’s portfolio turnover rate was 30% of the average value of its portfolio.
Principal investment strategiesUnder normal market conditions, the fund invests at least 80% of its net assets in equity securities of large-capitalization companies. The fundconsiders large-capitalization companies to be those that at the time of purchase have a market capitalization equal to or greater than that of the top80% of the companies that comprise the Russell 1000 Index. As of February 28, 2018, the lowest market capitalization in this group was $4.7 billion.Equity securities include common, convertible, and preferred securities and their equivalents.
In managing the fund, the subadvisor looks for companies that are highly differentiated with key growth drivers, sustainable cash flow production, andhigh returns on capital. The subadvisor seeks to identify companies with sustainable competitive advantages and high barriers to entry, strongmanagement and a focus on creating value for fund shareholders. Value opportunities are evaluated with an approach that uses the present value ofestimated future cash flows as the core methodology for measuring intrinsic value.
The subadvisor employs a disciplined fundamental research process which produces bottom-up company assessments using key assumptions that drivesales, margins, and asset intensity. Scenario analysis is designed to provide a meaningful range of outcomes and the ability to assess investors’embedded expectations. The subadvisor seeks to purchase companies that meet the criteria above when the shares are selling at a significant discountto intrinsic value. Sell decisions are similarly driven by long term fundamental analysis.
The subadvisor constantly reviews portfolio investments and may sell a holding when it has achieved its valuation target, if it believes there is structuralor permanent deterioration in the underlying fundamentals of the business, or if it identifies what it believes is a more attractive investmentopportunity.
The fund may invest up to 20% of its net assets in equity securities of foreign issuers, including American Depositary Receipts (ADRs) and similarinvestments. For purposes of reducing risk and/or obtaining efficient investment exposure, the fund may invest in exchange-traded funds (ETFs) andderivative instruments that include options, futures contracts, and swaps. The fund may also invest in U.S. government securities and other short-termsecurities such as money market instruments and repurchase agreements.
.53
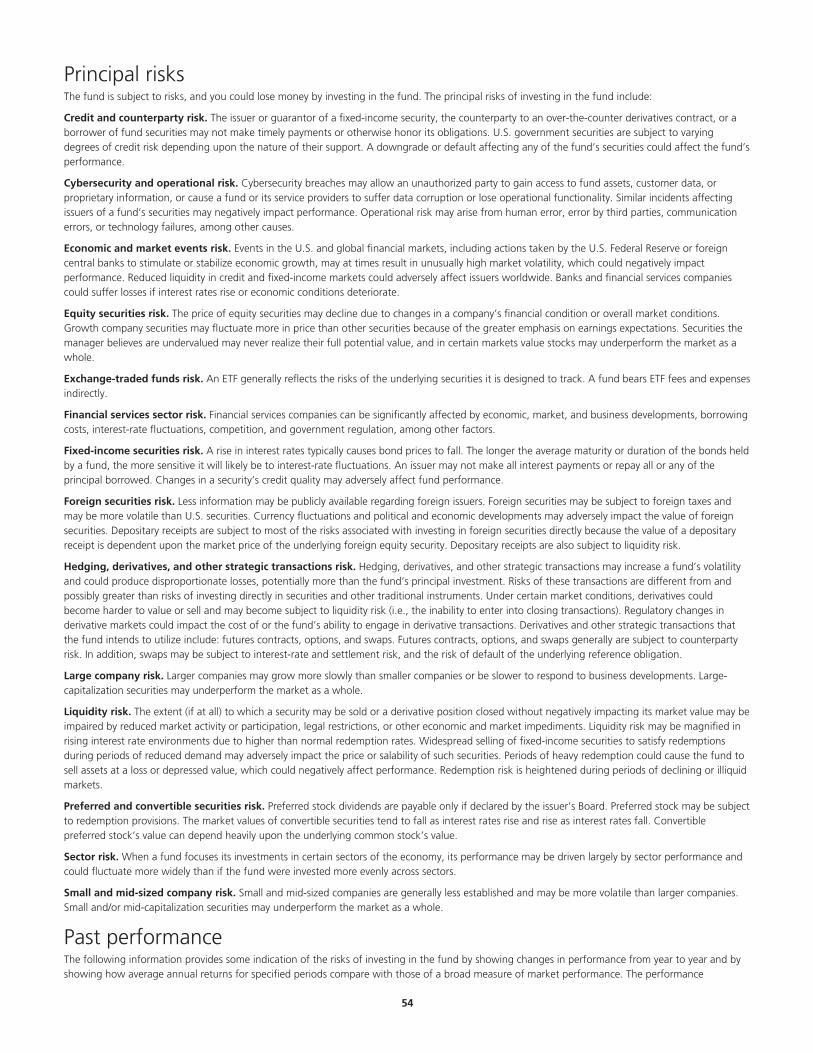
Principal risksThe fund is subject to risks, and you could lose money by investing in the fund. The principal risks of investing in the fund include:
Credit and counterparty risk. The issuer or guarantor of a fixed-income security, the counterparty to an over-the-counter derivatives contract, or aborrower of fund securities may not make timely payments or otherwise honor its obligations. U.S. government securities are subject to varyingdegrees of credit risk depending upon the nature of their support. A downgrade or default affecting any of the fund’s securities could affect the fund’sperformance.
Cybersecurity and operational risk. Cybersecurity breaches may allow an unauthorized party to gain access to fund assets, customer data, orproprietary information, or cause a fund or its service providers to suffer data corruption or lose operational functionality. Similar incidents affectingissuers of a fund’s securities may negatively impact performance. Operational risk may arise from human error, error by third parties, communicationerrors, or technology failures, among other causes.
Economic and market events risk. Events in the U.S. and global financial markets, including actions taken by the U.S. Federal Reserve or foreigncentral banks to stimulate or stabilize economic growth, may at times result in unusually high market volatility, which could negatively impactperformance. Reduced liquidity in credit and fixed-income markets could adversely affect issuers worldwide. Banks and financial services companiescould suffer losses if interest rates rise or economic conditions deteriorate.
Equity securities risk. The price of equity securities may decline due to changes in a company’s financial condition or overall market conditions.Growth company securities may fluctuate more in price than other securities because of the greater emphasis on earnings expectations. Securities themanager believes are undervalued may never realize their full potential value, and in certain markets value stocks may underperform the market as awhole.
Exchange-traded funds risk. An ETF generally reflects the risks of the underlying securities it is designed to track. A fund bears ETF fees and expensesindirectly.
Financial services sector risk. Financial services companies can be significantly affected by economic, market, and business developments, borrowingcosts, interest-rate fluctuations, competition, and government regulation, among other factors.
Fixed-income securities risk. A rise in interest rates typically causes bond prices to fall. The longer the average maturity or duration of the bonds heldby a fund, the more sensitive it will likely be to interest-rate fluctuations. An issuer may not make all interest payments or repay all or any of theprincipal borrowed. Changes in a security’s credit quality may adversely affect fund performance.
Foreign securities risk. Less information may be publicly available regarding foreign issuers. Foreign securities may be subject to foreign taxes andmay be more volatile than U.S. securities. Currency fluctuations and political and economic developments may adversely impact the value of foreignsecurities. Depositary receipts are subject to most of the risks associated with investing in foreign securities directly because the value of a depositaryreceipt is dependent upon the market price of the underlying foreign equity security. Depositary receipts are also subject to liquidity risk.
Hedging, derivatives, and other strategic transactions risk. Hedging, derivatives, and other strategic transactions may increase a fund’s volatilityand could produce disproportionate losses, potentially more than the fund’s principal investment. Risks of these transactions are different from andpossibly greater than risks of investing directly in securities and other traditional instruments. Under certain market conditions, derivatives couldbecome harder to value or sell and may become subject to liquidity risk (i.e., the inability to enter into closing transactions). Regulatory changes inderivative markets could impact the cost of or the fund’s ability to engage in derivative transactions. Derivatives and other strategic transactions thatthe fund intends to utilize include: futures contracts, options, and swaps. Futures contracts, options, and swaps generally are subject to counterpartyrisk. In addition, swaps may be subject to interest-rate and settlement risk, and the risk of default of the underlying reference obligation.
Large company risk. Larger companies may grow more slowly than smaller companies or be slower to respond to business developments. Large-capitalization securities may underperform the market as a whole.
Liquidity risk. The extent (if at all) to which a security may be sold or a derivative position closed without negatively impacting its market value may beimpaired by reduced market activity or participation, legal restrictions, or other economic and market impediments. Liquidity risk may be magnified inrising interest rate environments due to higher than normal redemption rates. Widespread selling of fixed-income securities to satisfy redemptionsduring periods of reduced demand may adversely impact the price or salability of such securities. Periods of heavy redemption could cause the fund tosell assets at a loss or depressed value, which could negatively affect performance. Redemption risk is heightened during periods of declining or illiquidmarkets.
Preferred and convertible securities risk. Preferred stock dividends are payable only if declared by the issuer’s Board. Preferred stock may be subjectto redemption provisions. The market values of convertible securities tend to fall as interest rates rise and rise as interest rates fall. Convertiblepreferred stock’s value can depend heavily upon the underlying common stock’s value.
Sector risk. When a fund focuses its investments in certain sectors of the economy, its performance may be driven largely by sector performance andcould fluctuate more widely than if the fund were invested more evenly across sectors.
Small and mid-sized company risk. Small and mid-sized companies are generally less established and may be more volatile than larger companies.Small and/or mid-capitalization securities may underperform the market as a whole.
Past performanceThe following information provides some indication of the risks of investing in the fund by showing changes in performance from year to year and byshowing how average annual returns for specified periods compare with those of a broad measure of market performance. The performance
.54
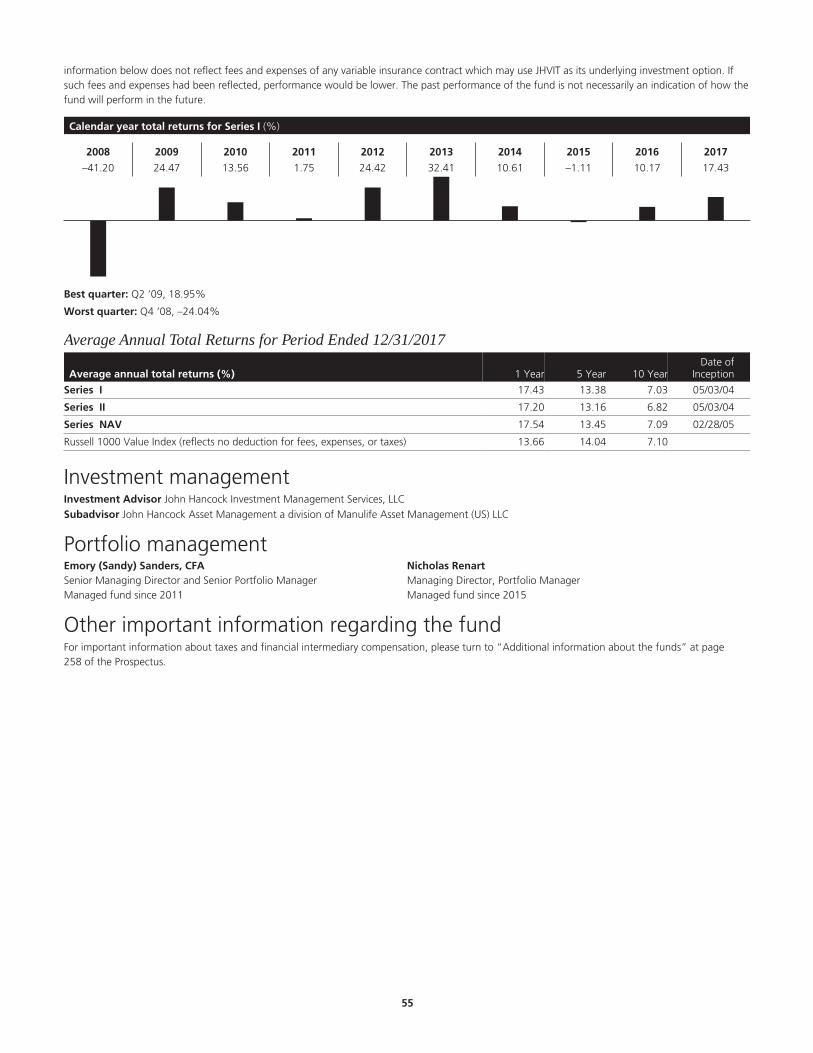
information below does not reflect fees and expenses of any variable insurance contract which may use JHVIT as its underlying investment option. Ifsuch fees and expenses had been reflected, performance would be lower. The past performance of the fund is not necessarily an indication of how thefund will perform in the future.
Calendar year total returns for Series I (%)
2008 2009 2010 2011 2012 2013 2014 2015 2016 2017
–41.20 24.47 13.56 1.75 24.42 32.41 10.61 –1.11 10.17 17.43
Best quarter: Q2 ‘09, 18.95%
Worst quarter: Q4 ‘08, –24.04%
Average Annual Total Returns for Period Ended 12/31/2017
Average annual total returns (%) 1 Year 5 Year 10 YearDate of
Inception
Series I 17.43 13.38 7.03 05/03/04
Series II 17.20 13.16 6.82 05/03/04
Series NAV 17.54 13.45 7.09 02/28/05
Russell 1000 Value Index (reflects no deduction for fees, expenses, or taxes) 13.66 14.04 7.10
Investment managementInvestment Advisor John Hancock Investment Management Services, LLC§
Subadvisor John Hancock Asset Management a division of Manulife Asset Management (US) LLC
Portfolio managementEmory (Sandy) Sanders, CFASenior Managing Director and Senior Portfolio ManagerManaged fund since 2011
Nicholas RenartManaging Director, Portfolio ManagerManaged fund since 2015
Other important information regarding the fundFor important information about taxes and financial intermediary compensation, please turn to “Additional information about the funds” at page258 of the Prospectus.
.55

Global Trust Investment objectiveTo seek long-term capital appreciation.
Fees and expensesThis table describes the fees and expenses that you may pay if you buy and hold shares of the fund. The fees and expenses do not reflect fees andexpenses of any variable insurance contract that may use the fund as its underlying investment option and would be higher if they did.
Annual fund operating expenses (%) (expenses that you pay each year as a percentage of the valueof your investment) Series I Series II Series NAV
Management fee 0.82 0.82 0.82
Distribution and service (Rule 12b-1) fees 0.05 0.25 0.00
Other expenses 0.09 0.09 0.09
Total annual fund operating expenses 0.96 1.16 0.91
Contractual expense reimbursement1 –0.02 –0.02 –0.02
Total annual fund operating expenses after expense reimbursements 0.94 1.14 0.89
1 The advisor contractually agrees to waive its management fee so that the amount retained by the advisor after payment of subadvisory fees does not exceed 0.45% of thefund’s average daily net assets. The current expense limitation agreement expires on April 30, 2019, unless renewed by mutual agreement of the fund and the advisor basedupon a determination that this is appropriate under the circumstances at that time.
Expense exampleThe examples are intended to help you compare the cost of investing in the fund with the cost of investing in other mutual funds. The examplesassume that $10,000 is invested in the fund for the periods indicated and then all shares are redeemed at the end of those periods. The examples alsoassume that the investment has a 5% return each year and that the fund’s operating expenses remain the same. The expense example does not reflectfees and expenses of any variable insurance contract that may use the fund as its underlying investment option and would be higher if they did.Although your actual costs may be higher or lower, based on these assumptions your costs would be:
Expenses ($) Series I Series II Series NAV
1 year 96 116 91
3 years 304 366 288
5 years 529 636 502
10 years 1,176 1,407 1,118
Portfolio turnoverThe fund pays transaction costs, such as commissions, when it buys and sells securities (or “turns over” its portfolio). A higher portfolio turnover ratemay indicate higher transaction costs. These costs, which are not reflected in annual fund operating expenses or in the example, affect the fund’sperformance. During its most recent fiscal year, the fund’s portfolio turnover rate was 28% of the average value of its portfolio.
Principal investment strategiesUnder normal market conditions, the fund invests primarily in the equity securities of companies located throughout the world, including emergingmarkets. Although the fund seeks investments across a number of countries and sectors, from time to time, based on economic conditions, the fundmay have significant positions in particular countries or sectors. The fund may invest in companies of any size, including small and mediumcapitalization companies.
Depending upon current market conditions, the fund may invest up to 25% of its total assets in debt securities of companies and governments locatedanywhere in the world. Debt securities represent the obligation of the issuer to repay a loan of money to it, and generally pay interest to the holder.Bonds, notes and debentures are examples of debt securities. The fund may invest in depositary receipts. Equity securities may include, among otherthings, common stocks, preferred stocks and convertible securities. The fund may lend certain of its portfolio securities to qualified banks and brokerdealers. The fund may invest in equity-linked notes, the value of which is tied to a single stock or a basket of stocks.
Use of Hedging and Other Strategic Transactions. The fund is authorized to use all of the various investment strategies referred to under “AdditionalInformation About the Funds’ Principal Risks — Hedging, derivatives and other strategic transactions risk” including entering into option transactions.
When choosing equity investments for the fund, the subadvisor applies a “bottom up,” value-oriented, long-term approach, focusing on the marketprice of a company’s securities relative to the subadvisor’s evaluation of the company’s long-term earnings, asset value and cash flow potential. Thesubadvisor also considers a company’s price/earnings ratio, price/cash flow ratio, profit margins and liquidation value.
.56
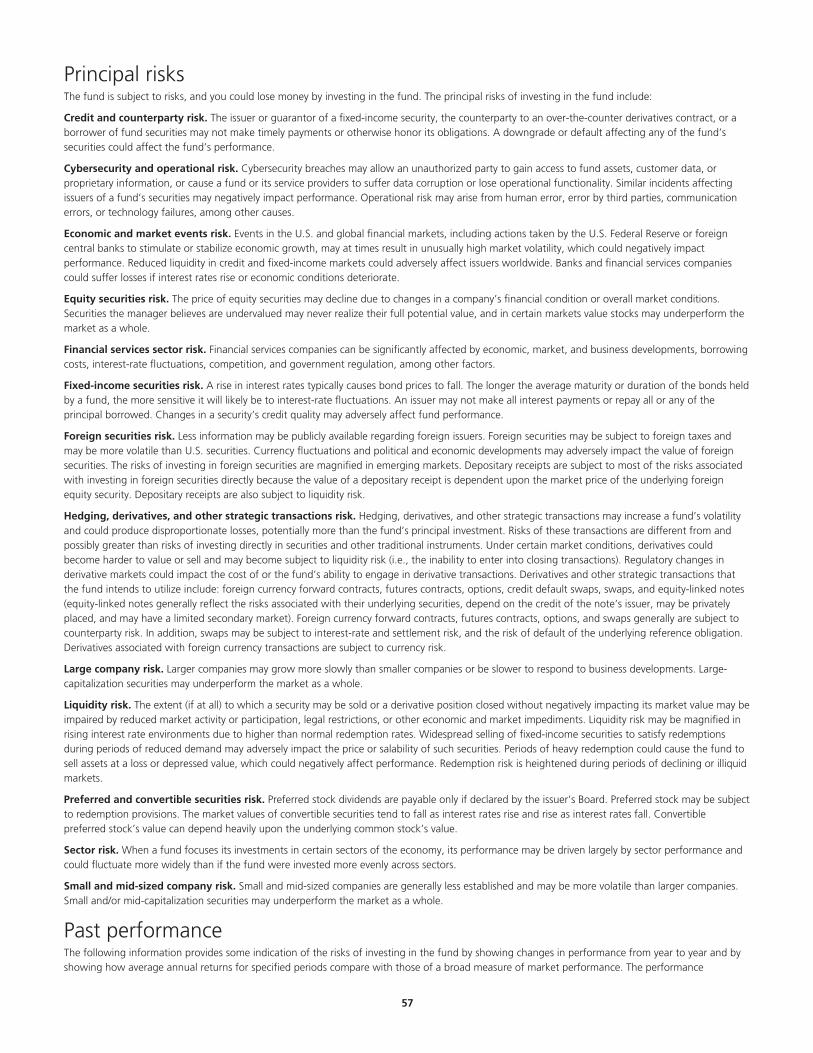
Principal risksThe fund is subject to risks, and you could lose money by investing in the fund. The principal risks of investing in the fund include:
Credit and counterparty risk. The issuer or guarantor of a fixed-income security, the counterparty to an over-the-counter derivatives contract, or aborrower of fund securities may not make timely payments or otherwise honor its obligations. A downgrade or default affecting any of the fund’ssecurities could affect the fund’s performance.
Cybersecurity and operational risk. Cybersecurity breaches may allow an unauthorized party to gain access to fund assets, customer data, orproprietary information, or cause a fund or its service providers to suffer data corruption or lose operational functionality. Similar incidents affectingissuers of a fund’s securities may negatively impact performance. Operational risk may arise from human error, error by third parties, communicationerrors, or technology failures, among other causes.
Economic and market events risk. Events in the U.S. and global financial markets, including actions taken by the U.S. Federal Reserve or foreigncentral banks to stimulate or stabilize economic growth, may at times result in unusually high market volatility, which could negatively impactperformance. Reduced liquidity in credit and fixed-income markets could adversely affect issuers worldwide. Banks and financial services companiescould suffer losses if interest rates rise or economic conditions deteriorate.
Equity securities risk. The price of equity securities may decline due to changes in a company’s financial condition or overall market conditions.Securities the manager believes are undervalued may never realize their full potential value, and in certain markets value stocks may underperform themarket as a whole.
Financial services sector risk. Financial services companies can be significantly affected by economic, market, and business developments, borrowingcosts, interest-rate fluctuations, competition, and government regulation, among other factors.
Fixed-income securities risk. A rise in interest rates typically causes bond prices to fall. The longer the average maturity or duration of the bonds heldby a fund, the more sensitive it will likely be to interest-rate fluctuations. An issuer may not make all interest payments or repay all or any of theprincipal borrowed. Changes in a security’s credit quality may adversely affect fund performance.
Foreign securities risk. Less information may be publicly available regarding foreign issuers. Foreign securities may be subject to foreign taxes andmay be more volatile than U.S. securities. Currency fluctuations and political and economic developments may adversely impact the value of foreignsecurities. The risks of investing in foreign securities are magnified in emerging markets. Depositary receipts are subject to most of the risks associatedwith investing in foreign securities directly because the value of a depositary receipt is dependent upon the market price of the underlying foreignequity security. Depositary receipts are also subject to liquidity risk.
Hedging, derivatives, and other strategic transactions risk. Hedging, derivatives, and other strategic transactions may increase a fund’s volatilityand could produce disproportionate losses, potentially more than the fund’s principal investment. Risks of these transactions are different from andpossibly greater than risks of investing directly in securities and other traditional instruments. Under certain market conditions, derivatives couldbecome harder to value or sell and may become subject to liquidity risk (i.e., the inability to enter into closing transactions). Regulatory changes inderivative markets could impact the cost of or the fund’s ability to engage in derivative transactions. Derivatives and other strategic transactions thatthe fund intends to utilize include: foreign currency forward contracts, futures contracts, options, credit default swaps, swaps, and equity-linked notes(equity-linked notes generally reflect the risks associated with their underlying securities, depend on the credit of the note’s issuer, may be privatelyplaced, and may have a limited secondary market). Foreign currency forward contracts, futures contracts, options, and swaps generally are subject tocounterparty risk. In addition, swaps may be subject to interest-rate and settlement risk, and the risk of default of the underlying reference obligation.Derivatives associated with foreign currency transactions are subject to currency risk.
Large company risk. Larger companies may grow more slowly than smaller companies or be slower to respond to business developments. Large-capitalization securities may underperform the market as a whole.
Liquidity risk. The extent (if at all) to which a security may be sold or a derivative position closed without negatively impacting its market value may beimpaired by reduced market activity or participation, legal restrictions, or other economic and market impediments. Liquidity risk may be magnified inrising interest rate environments due to higher than normal redemption rates. Widespread selling of fixed-income securities to satisfy redemptionsduring periods of reduced demand may adversely impact the price or salability of such securities. Periods of heavy redemption could cause the fund tosell assets at a loss or depressed value, which could negatively affect performance. Redemption risk is heightened during periods of declining or illiquidmarkets.
Preferred and convertible securities risk. Preferred stock dividends are payable only if declared by the issuer’s Board. Preferred stock may be subjectto redemption provisions. The market values of convertible securities tend to fall as interest rates rise and rise as interest rates fall. Convertiblepreferred stock’s value can depend heavily upon the underlying common stock’s value.
Sector risk. When a fund focuses its investments in certain sectors of the economy, its performance may be driven largely by sector performance andcould fluctuate more widely than if the fund were invested more evenly across sectors.
Small and mid-sized company risk. Small and mid-sized companies are generally less established and may be more volatile than larger companies.Small and/or mid-capitalization securities may underperform the market as a whole.
Past performanceThe following information provides some indication of the risks of investing in the fund by showing changes in performance from year to year and byshowing how average annual returns for specified periods compare with those of a broad measure of market performance. The performance
.57
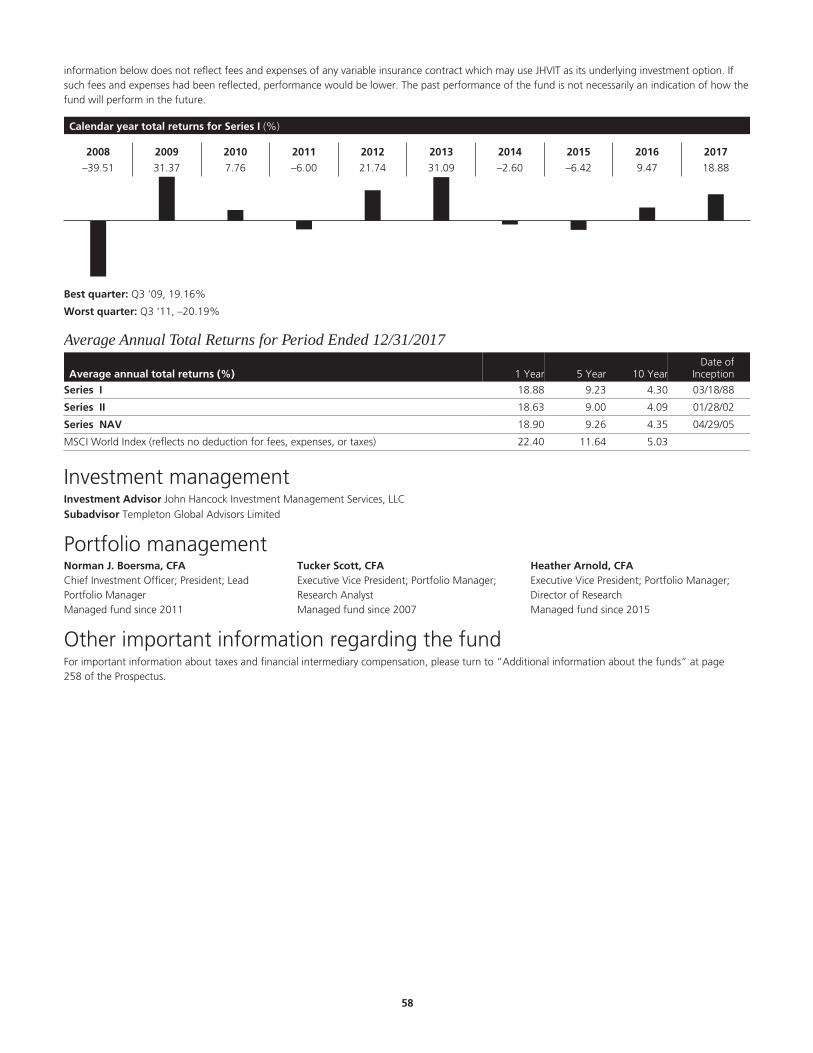
information below does not reflect fees and expenses of any variable insurance contract which may use JHVIT as its underlying investment option. Ifsuch fees and expenses had been reflected, performance would be lower. The past performance of the fund is not necessarily an indication of how thefund will perform in the future.
Calendar year total returns for Series I (%)
2008 2009 2010 2011 2012 2013 2014 2015 2016 2017
–39.51 31.37 7.76 –6.00 21.74 31.09 –2.60 –6.42 9.47 18.88
Best quarter: Q3 ‘09, 19.16%
Worst quarter: Q3 ‘11, –20.19%
Average Annual Total Returns for Period Ended 12/31/2017
Average annual total returns (%) 1 Year 5 Year 10 YearDate of
Inception
Series I 18.88 9.23 4.30 03/18/88
Series II 18.63 9.00 4.09 01/28/02
Series NAV 18.90 9.26 4.35 04/29/05
MSCI World Index (reflects no deduction for fees, expenses, or taxes) 22.40 11.64 5.03
Investment managementInvestment Advisor John Hancock Investment Management Services, LLC§
Subadvisor Templeton Global Advisors Limited
Portfolio managementNorman J. Boersma, CFAChief Investment Officer; President; LeadPortfolio ManagerManaged fund since 2011
Tucker Scott, CFAExecutive Vice President; Portfolio Manager;Research AnalystManaged fund since 2007
Heather Arnold, CFAExecutive Vice President; Portfolio Manager;Director of ResearchManaged fund since 2015
Other important information regarding the fundFor important information about taxes and financial intermediary compensation, please turn to “Additional information about the funds” at page258 of the Prospectus.
.58

Global Bond Trust Investment objectiveTo seek maximum total return, consistent with preservation of capital and prudent investment management.
Fees and expensesThis table describes the fees and expenses that you may pay if you buy and hold shares of the fund. The fees and expenses do not reflect fees andexpenses of any variable insurance contract that may use the fund as its underlying investment option and would be higher if they did.
Annual fund operating expenses (%) (expenses that you pay each year as a percentage of the valueof your investment) Series I Series II Series NAV
Management fee 0.70 0.70 0.70
Distribution and service (Rule 12b-1) fees 0.05 0.25 0.00
Other expenses 0.07 0.07 0.07
Total annual fund operating expenses 0.82 1.02 0.77
Expense exampleThe examples are intended to help you compare the cost of investing in the fund with the cost of investing in other mutual funds. The examplesassume that $10,000 is invested in the fund for the periods indicated and then all shares are redeemed at the end of those periods. The examples alsoassume that the investment has a 5% return each year and that the fund’s operating expenses remain the same. The expense example does not reflectfees and expenses of any variable insurance contract that may use the fund as its underlying investment option and would be higher if they did.Although your actual costs may be higher or lower, based on these assumptions your costs would be:
Expenses ($) Series I Series II Series NAV
1 year 84 104 79
3 years 262 325 246
5 years 455 563 428
10 years 1,014 1,248 954
Portfolio turnoverThe fund pays transaction costs, such as commissions, when it buys and sells securities (or “turns over” its portfolio). A higher portfolio turnover ratemay indicate higher transaction costs. These costs, which are not reflected in annual fund operating expenses or in the example, affect the fund’sperformance. During its most recent fiscal year, the fund’s portfolio turnover rate was 47% of the average value of its portfolio.
Principal investment strategiesUnder normal market conditions, the fund invests at least 80% of its net assets (plus any borrowings for investment purposes) in fixed-incomeinstruments that are economically tied to at least three countries (one of which may be the United States). These fixed-income instruments may bedenominated in foreign currencies or in U.S. dollars, and may be represented by forwards or derivatives, such as options, futures contracts, or swapagreements.
In selecting securities for the fund, the subadvisor utilizes economic forecasting, interest rate anticipation, credit and call risk analysis, foreign currencyexchange rate forecasting, and other security selection techniques. The proportion of the fund’s assets committed to investment in securities withparticular characteristics (such as maturity, type and coupon rate) will vary based on the subadvisor’s outlook for the U.S. and foreign economies, thefinancial markets, and other factors.
The types of fixed-income securities in which the fund may invest include the following securities which, unless otherwise noted, may be issued bydomestic or foreign issuers and may be denominated in U.S. dollars or foreign currencies:
securities issued or guaranteed by the U.S. government, its agencies or government-sponsored enterprises;
corporate debt securities of U.S. and foreign issuers, including convertible securities and corporate commercial paper;
mortgage-backed and other asset-backed securities;
inflation-indexed bonds issued by both governments and corporations;
bank capital and trust preferred securities;
structured notes, including hybrid or “indexed” securities and event-linked bonds;
loan participations and assignments;
delayed funding loans and revolving credit facilities;
bank certificates of deposit, fixed time deposits and bankers’ acceptances;
debt securities issued by states or local governments and their agencies, authorities and other government-sponsored enterprises;
.59

repurchase agreements and reverse repurchase agreements;
obligations of foreign governments or their subdivisions, agencies and government-sponsored enterprises; and
obligations of international agencies or supranational entities.
Fixed-income securities may have fixed, variable, or floating rates of interest, including rates of interest that vary inversely at a multiple of a designatedor floating rate, or that vary according to change in relative values of currencies.
Depending on the subadvisor’s current opinion as to the proper allocation of assets among domestic and foreign issuers, investments that areeconomically tied to foreign (non-U.S.) countries will normally be at least 25% of the fund’s net assets. The fund may invest, without limitation, insecurities and instruments that are economically tied to emerging countries. The fund may invest up to 10% of its total assets in fixed-income securitiesthat are rated below investment grade but rated B or higher by Moody’s or equivalently rated by S&P or Fitch, or, if unrated, determined by thesubadvisor to be of comparable quality (except that within such limitations, the fund may invest in mortgage-related securities and variable rate masterdemand notes rated below B). The fund’s investment policies are based on credit ratings at the time of purchase. The fund may invest in baskets offoreign currencies (such as the euro) and directly in currencies. The average portfolio duration of the fund normally varies within three years (plus orminus) of the duration of the benchmark index, as calculated by the subadvisor.
The fund’s investment process may, at times, result in a higher than average portfolio turnover ratio and increased trading expenses.
The fund may make short sales of a security including short sales “against the box.”
The fund is non-diversified, which means that it may invest in a smaller number of issuers than a diversified fund and may invest more of its assets inthe securities of a single issuer.
The fund may:
purchase and sell options on domestic and foreign securities, securities indexes and currencies,
purchase and sell futures and options on futures,
purchase and sell currency or securities on a forward basis, and
enter into interest rate, index, equity, total return, currency, and credit default swap agreements.
Principal risksThe fund is subject to risks, and you could lose money by investing in the fund. The principal risks of investing in the fund include:
Changing distribution levels risk. The fund may cease or reduce the level of its distribution or make a greater return of capital if income ordividends paid from its investments declines.
Credit and counterparty risk. The issuer or guarantor of a fixed-income security, the counterparty to an over-the-counter derivatives contract, or aborrower of fund securities may not make timely payments or otherwise honor its obligations. U.S. government securities are subject to varyingdegrees of credit risk depending upon the nature of their support. A downgrade or default affecting any of the fund’s securities could affect the fund’sperformance.
Currency risk. Fluctuations in exchange rates may adversely affect the U.S. dollar value of a fund’s investments. Foreign currencies may decline invalue, which could negatively impact performance.
Cybersecurity and operational risk. Cybersecurity breaches may allow an unauthorized party to gain access to fund assets, customer data, orproprietary information, or cause a fund or its service providers to suffer data corruption or lose operational functionality. Similar incidents affectingissuers of a fund’s securities may negatively impact performance. Operational risk may arise from human error, error by third parties, communicationerrors, or technology failures, among other causes.
Economic and market events risk. Events in the U.S. and global financial markets, including actions taken by the U.S. Federal Reserve or foreigncentral banks to stimulate or stabilize economic growth, may at times result in unusually high market volatility, which could negatively impactperformance. Reduced liquidity in credit and fixed-income markets could adversely affect issuers worldwide. Banks and financial services companiescould suffer losses if interest rates rise or economic conditions deteriorate.
Equity securities risk. The price of equity securities may decline due to changes in a company’s financial condition or overall market conditions.
Fixed-income securities risk. A rise in interest rates typically causes bond prices to fall. The longer the average maturity or duration of the bonds heldby a fund, the more sensitive it will likely be to interest-rate fluctuations. An issuer may not make all interest payments or repay all or any of theprincipal borrowed. Changes in a security’s credit quality may adversely affect fund performance.
Foreign securities risk. Less information may be publicly available regarding foreign issuers. Foreign securities may be subject to foreign taxes andmay be more volatile than U.S. securities. Currency fluctuations and political and economic developments may adversely impact the value of foreignsecurities. The risks of investing in foreign securities are magnified in emerging markets.
Hedging, derivatives, and other strategic transactions risk. Hedging, derivatives, and other strategic transactions may increase a fund’s volatilityand could produce disproportionate losses, potentially more than the fund’s principal investment. Risks of these transactions are different from andpossibly greater than risks of investing directly in securities and other traditional instruments. Under certain market conditions, derivatives couldbecome harder to value or sell and may become subject to liquidity risk (i.e., the inability to enter into closing transactions). Regulatory changes inderivative markets could impact the cost of or the fund’s ability to engage in derivative transactions. Derivatives and other strategic transactions thatthe fund intends to utilize include: credit default swaps, foreign currency forward contracts, foreign currency swaps, futures contracts, interest-rate
.60
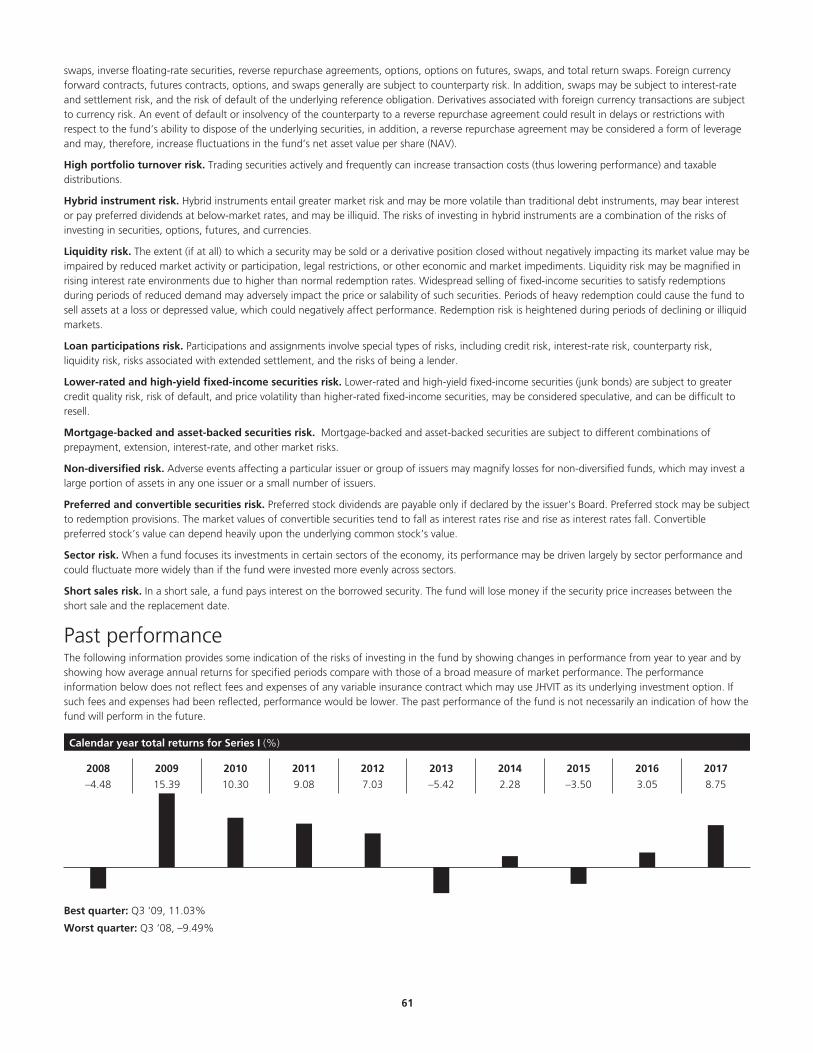
swaps, inverse floating-rate securities, reverse repurchase agreements, options, options on futures, swaps, and total return swaps. Foreign currencyforward contracts, futures contracts, options, and swaps generally are subject to counterparty risk. In addition, swaps may be subject to interest-rateand settlement risk, and the risk of default of the underlying reference obligation. Derivatives associated with foreign currency transactions are subjectto currency risk. An event of default or insolvency of the counterparty to a reverse repurchase agreement could result in delays or restrictions withrespect to the fund’s ability to dispose of the underlying securities, in addition, a reverse repurchase agreement may be considered a form of leverageand may, therefore, increase fluctuations in the fund’s net asset value per share (NAV).
High portfolio turnover risk. Trading securities actively and frequently can increase transaction costs (thus lowering performance) and taxabledistributions.
Hybrid instrument risk. Hybrid instruments entail greater market risk and may be more volatile than traditional debt instruments, may bear interestor pay preferred dividends at below-market rates, and may be illiquid. The risks of investing in hybrid instruments are a combination of the risks ofinvesting in securities, options, futures, and currencies.
Liquidity risk. The extent (if at all) to which a security may be sold or a derivative position closed without negatively impacting its market value may beimpaired by reduced market activity or participation, legal restrictions, or other economic and market impediments. Liquidity risk may be magnified inrising interest rate environments due to higher than normal redemption rates. Widespread selling of fixed-income securities to satisfy redemptionsduring periods of reduced demand may adversely impact the price or salability of such securities. Periods of heavy redemption could cause the fund tosell assets at a loss or depressed value, which could negatively affect performance. Redemption risk is heightened during periods of declining or illiquidmarkets.
Loan participations risk. Participations and assignments involve special types of risks, including credit risk, interest-rate risk, counterparty risk,liquidity risk, risks associated with extended settlement, and the risks of being a lender.
Lower-rated and high-yield fixed-income securities risk. Lower-rated and high-yield fixed-income securities (junk bonds) are subject to greatercredit quality risk, risk of default, and price volatility than higher-rated fixed-income securities, may be considered speculative, and can be difficult toresell.
Mortgage-backed and asset-backed securities risk. Mortgage-backed and asset-backed securities are subject to different combinations ofprepayment, extension, interest-rate, and other market risks.
Non-diversified risk. Adverse events affecting a particular issuer or group of issuers may magnify losses for non-diversified funds, which may invest alarge portion of assets in any one issuer or a small number of issuers.
Preferred and convertible securities risk. Preferred stock dividends are payable only if declared by the issuer’s Board. Preferred stock may be subjectto redemption provisions. The market values of convertible securities tend to fall as interest rates rise and rise as interest rates fall. Convertiblepreferred stock’s value can depend heavily upon the underlying common stock’s value.
Sector risk. When a fund focuses its investments in certain sectors of the economy, its performance may be driven largely by sector performance andcould fluctuate more widely than if the fund were invested more evenly across sectors.
Short sales risk. In a short sale, a fund pays interest on the borrowed security. The fund will lose money if the security price increases between theshort sale and the replacement date.
Past performanceThe following information provides some indication of the risks of investing in the fund by showing changes in performance from year to year and byshowing how average annual returns for specified periods compare with those of a broad measure of market performance. The performanceinformation below does not reflect fees and expenses of any variable insurance contract which may use JHVIT as its underlying investment option. Ifsuch fees and expenses had been reflected, performance would be lower. The past performance of the fund is not necessarily an indication of how thefund will perform in the future.
Calendar year total returns for Series I (%)
2008 2009 2010 2011 2012 2013 2014 2015 2016 2017
–4.48 15.39 10.30 9.08 7.03 –5.42 2.28 –3.50 3.05 8.75
Best quarter: Q3 ‘09, 11.03%
Worst quarter: Q3 ‘08, –9.49%
.61
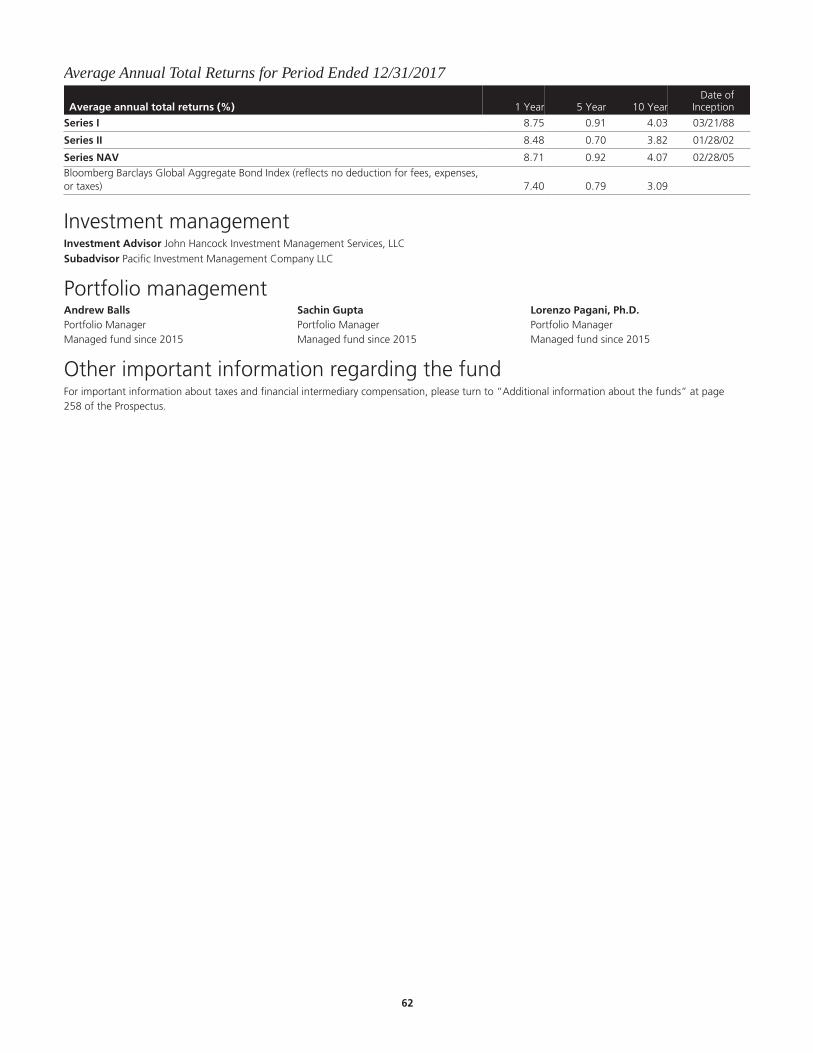
Average Annual Total Returns for Period Ended 12/31/2017
Average annual total returns (%) 1 Year 5 Year 10 YearDate of
Inception
Series I 8.75 0.91 4.03 03/21/88
Series II 8.48 0.70 3.82 01/28/02
Series NAV 8.71 0.92 4.07 02/28/05Bloomberg Barclays Global Aggregate Bond Index (reflects no deduction for fees, expenses,or taxes) 7.40 0.79 3.09
Investment managementInvestment Advisor John Hancock Investment Management Services, LLC§
Subadvisor Pacific Investment Management Company LLC
Portfolio managementAndrew BallsPortfolio ManagerManaged fund since 2015
Sachin GuptaPortfolio ManagerManaged fund since 2015
Lorenzo Pagani, Ph.D.Portfolio ManagerManaged fund since 2015
Other important information regarding the fundFor important information about taxes and financial intermediary compensation, please turn to “Additional information about the funds” at page258 of the Prospectus.
.62

Health Sciences Trust Investment objectiveTo seek long-term capital appreciation.
Fees and expensesThis table describes the fees and expenses that you may pay if you buy and hold shares of the fund. The fees and expenses do not reflect fees andexpenses of any variable insurance contract that may use the fund as its underlying investment option and would be higher if they did.
Annual fund operating expenses (%) (expenses that you pay each year as a percentage of the valueof your investment) Series I Series II Series NAV
Management fee 1.05 1.05 1.05
Distribution and service (Rule 12b-1) fees 0.05 0.25 0.00
Other expenses 0.06 0.06 0.06
Total annual fund operating expenses 1.16 1.36 1.11
Expense exampleThe examples are intended to help you compare the cost of investing in the fund with the cost of investing in other mutual funds. The examplesassume that $10,000 is invested in the fund for the periods indicated and then all shares are redeemed at the end of those periods. The examples alsoassume that the investment has a 5% return each year and that the fund’s operating expenses remain the same. The expense example does not reflectfees and expenses of any variable insurance contract that may use the fund as its underlying investment option and would be higher if they did.Although your actual costs may be higher or lower, based on these assumptions your costs would be:
Expenses ($) Series I Series II Series NAV
1 year 118 138 113
3 years 368 431 353
5 years 638 745 612
10 years 1,409 1,635 1,352
Portfolio turnoverThe fund pays transaction costs, such as commissions, when it buys and sells securities (or “turns over” its portfolio). A higher portfolio turnover ratemay indicate higher transaction costs. These costs, which are not reflected in annual fund operating expenses or in the example, affect the fund’sperformance. During its most recent fiscal year, the fund’s portfolio turnover rate was 39% of the average value of its portfolio.
Principal investment strategiesUnder normal market conditions, the fund invests at least 80% of its net assets (plus any borrowings for investment purposes) in common stocks ofcompanies engaged, at the time of investment, in the research, development, production, or distribution of products or services related to health care,medicine, or the life sciences (collectively, “health sciences”).
While the fund may invest in companies of any size, the majority of its assets are expected to be invested in large- and mid-capitalization companies.
The subadvisor’s portfolio managers divide the health sciences sector into four main areas: pharmaceutical companies, health care services companies,medical products and devices providers, and biotechnology firms. Their allocation among these four areas will vary depending on the relative potentialwithin each area and the outlook for the overall health sciences sector. While most assets will be invested in U.S. common stocks, the fund maypurchase other securities, including foreign securities, futures, and options in keeping with its investment objective. In addition, the fund writes call andput options primarily as a means of generating additional income. The fund may also use options to seek protection against a decline in the value of itssecurities or an increase in prices of securities that may be purchased. Normally, the fund will own the securities on which it writes these options. Thepremium income received by writing covered calls can help reduce but not eliminate portfolio volatility.
The fund concentrates its investments (invests more than 25% of its total assets) in securities of companies in the health sciences sector, acomparatively narrow segment of the economy, and therefore may experience greater volatility than funds investing in a broader range of industries.
In managing the fund, the subadvisor uses a fundamental, bottom-up analysis that seeks to identify high quality companies and the most compellinginvestment opportunities. In general, the fund will follow a growth investment strategy, seeking companies whose earnings are expected to growfaster than inflation and the economy in general. When stock valuations seem unusually high, however, a “value” approach, which gives preference toseemingly undervalued companies, may also be emphasized.
The fund may invest up to 35% of its total assets in foreign securities (including emerging market securities) and may have exposure to foreigncurrencies through its investment in these securities, its direct holdings of foreign currencies or through its use of foreign currency exchange contractsfor the purchase or sale of a fixed quantity of a foreign currency at a future date.
.63

In pursuing its investment objective, the fund’s management has the discretion to purchase some securities that do not meet its normal investmentcriteria, as described above, when it perceives an opportunity for substantial appreciation. These situations might arise when the fund’s managementbelieves a security could increase in value for a variety of reasons including a change in management, an extraordinary corporate event, or a newproduct introduction or innovation or a favorable competitive development.
The fund holds a certain portion of its assets in money market reserves, which can consist of shares of certain internal T. Rowe Price money marketfunds as well as U.S. dollar and foreign currency-denominated money market securities, including repurchase agreements, in the two highest ratingcategories, maturing in one year or less.
The fund may sell securities for a variety of reasons such as to secure gains, limit losses or redeploy assets into more promising opportunities.
Use of Hedging and Other Strategic Transactions. The fund is authorized to use all of the various investment strategies referred to under “AdditionalInformation About the Funds’ Principal Risks — Hedging, derivatives and other strategic transactions risk” including entering into option transactions.
Principal risksThe fund is subject to risks, and you could lose money by investing in the fund. The principal risks of investing in the fund include:
Concentration risk. Because the fund may focus on one or more industries or sectors of the economy, its performance depends in large part on theperformance of those sectors or industries. As a result, the value of an investment may fluctuate more widely than it would in a fund that is diversifiedacross industries and sectors.
Credit and counterparty risk. The counterparty to an over-the-counter derivatives contract or a borrower of fund securities may not make timelypayments or otherwise honor its obligations.
Cybersecurity and operational risk. Cybersecurity breaches may allow an unauthorized party to gain access to fund assets, customer data, orproprietary information, or cause a fund or its service providers to suffer data corruption or lose operational functionality. Similar incidents affectingissuers of a fund’s securities may negatively impact performance. Operational risk may arise from human error, error by third parties, communicationerrors, or technology failures, among other causes.
Economic and market events risk. Events in the U.S. and global financial markets, including actions taken by the U.S. Federal Reserve or foreigncentral banks to stimulate or stabilize economic growth, may at times result in unusually high market volatility, which could negatively impactperformance. Reduced liquidity in credit and fixed-income markets could adversely affect issuers worldwide. Banks and financial services companiescould suffer losses if interest rates rise or economic conditions deteriorate.
Equity securities risk. The price of equity securities may decline due to changes in a company’s financial condition or overall market conditions.Growth company securities may fluctuate more in price than other securities because of the greater emphasis on earnings expectations. Securities themanager believes are undervalued may never realize their full potential value, and in certain markets value stocks may underperform the market as awhole.
Foreign securities risk. Less information may be publicly available regarding foreign issuers. Foreign securities may be subject to foreign taxes andmay be more volatile than U.S. securities. Currency fluctuations and political and economic developments may adversely impact the value of foreignsecurities. The risks of investing in foreign securities are magnified in emerging markets.
Hong Kong Stock Connect Program (Stock Connect) risk. The fund’s investments in eligible renminbi-denominated class A shares of equitysecurities that are listed and traded on certain Chinese stock exchanges (China A-Shares) through Stock Connect are generally subject to Chinesesecurities regulations and local exchange listing rules. The fund may not sell, purchase, or otherwise transfer China A-Shares other than via StockConnect, which may restrict or preclude the fund’s ability to invest in China A-Shares. Stock Connect is subject to quota limitations when purchasingsecurities, which may restrict the fund’s ability to trade via Stock Connect on a timely basis. This may impact the fund’s ability to implement itsinvestment strategy effectively.§
Healthcare sector risk. Health sciences companies may be significantly affected by product obsolescence, thin capitalization, limited product lines andmarkets, civil liability claims, and legislative or regulatory activities, among other factors.
Hedging, derivatives, and other strategic transactions risk. Hedging, derivatives, and other strategic transactions may increase a fund’s volatilityand could produce disproportionate losses, potentially more than the fund’s principal investment. Risks of these transactions are different from andpossibly greater than risks of investing directly in securities and other traditional instruments. Under certain market conditions, derivatives couldbecome harder to value or sell and may become subject to liquidity risk (i.e., the inability to enter into closing transactions). Regulatory changes inderivative markets could impact the cost of or the fund’s ability to engage in derivative transactions. Derivatives and other strategic transactions thatthe fund intends to utilize include: foreign currency forward contracts, futures contracts, and options. Foreign currency forward contracts, futurescontracts, and options generally are subject to counterparty risk. Derivatives associated with foreign currency transactions are subject to currency risk.
Investment company securities risk. A fund bears underlying fund fees and expenses indirectly.
Large company risk. Larger companies may grow more slowly than smaller companies or be slower to respond to business developments. Large-capitalization securities may underperform the market as a whole.
Liquidity risk. The extent (if at all) to which a security may be sold or a derivative position closed without negatively impacting its market value may beimpaired by reduced market activity or participation, legal restrictions, or other economic and market impediments.
Small and mid-sized company risk. Small and mid-sized companies are generally less established and may be more volatile than larger companies.Small and/or mid-capitalization securities may underperform the market as a whole.
.64
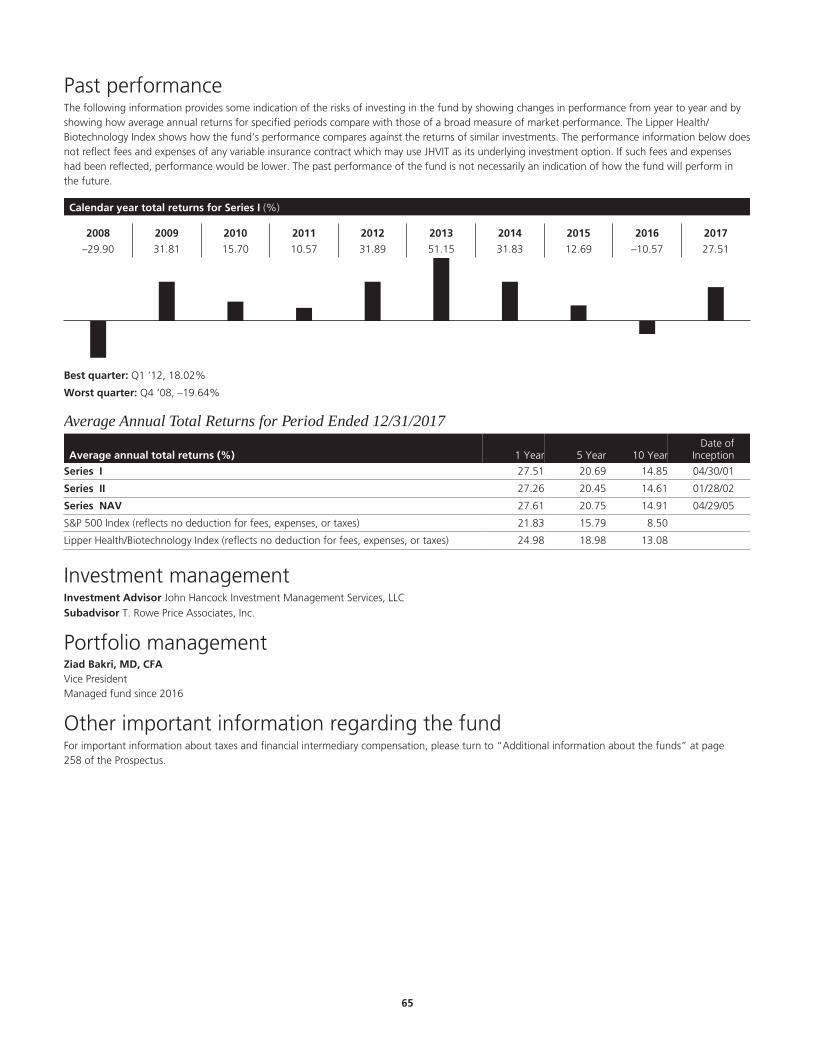
Past performanceThe following information provides some indication of the risks of investing in the fund by showing changes in performance from year to year and byshowing how average annual returns for specified periods compare with those of a broad measure of market performance. The Lipper Health/Biotechnology Index shows how the fund’s performance compares against the returns of similar investments. The performance information below doesnot reflect fees and expenses of any variable insurance contract which may use JHVIT as its underlying investment option. If such fees and expenseshad been reflected, performance would be lower. The past performance of the fund is not necessarily an indication of how the fund will perform inthe future.
Calendar year total returns for Series I (%)
2008 2009 2010 2011 2012 2013 2014 2015 2016 2017
–29.90 31.81 15.70 10.57 31.89 51.15 31.83 12.69 –10.57 27.51
Best quarter: Q1 ‘12, 18.02%
Worst quarter: Q4 ‘08, –19.64%
Average Annual Total Returns for Period Ended 12/31/2017
Average annual total returns (%) 1 Year 5 Year 10 YearDate of
Inception
Series I 27.51 20.69 14.85 04/30/01
Series II 27.26 20.45 14.61 01/28/02
Series NAV 27.61 20.75 14.91 04/29/05
S&P 500 Index (reflects no deduction for fees, expenses, or taxes) 21.83 15.79 8.50
Lipper Health/Biotechnology Index (reflects no deduction for fees, expenses, or taxes) 24.98 18.98 13.08
Investment managementInvestment Advisor John Hancock Investment Management Services, LLC§
Subadvisor T. Rowe Price Associates, Inc.
Portfolio managementZiad Bakri, MD, CFAVice PresidentManaged fund since 2016
Other important information regarding the fundFor important information about taxes and financial intermediary compensation, please turn to “Additional information about the funds” at page258 of the Prospectus.
.65

High Yield Trust Investment objectiveTo realize an above-average total return over a market cycle of three to five years, consistent with reasonable risk.
Fees and expensesThis table describes the fees and expenses that you may pay if you buy and hold shares of the fund. The fees and expenses do not reflect fees andexpenses of any variable insurance contract that may use the fund as its underlying investment option and would be higher if they did.
Annual fund operating expenses (%) (expenses that you pay each year as a percentage of the valueof your investment) Series I Series II Series NAV
Management fee 0.68 0.68 0.68
Distribution and service (Rule 12b-1) fees 0.05 0.25 0.00
Other expenses1 0.08 0.08 0.08
Total annual fund operating expenses 0.81 1.01 0.76
1 “Other expenses” shown exclude certain one-time credits received in the prior fiscal year equivalent to 0.04%.
Expense exampleThe examples are intended to help you compare the cost of investing in the fund with the cost of investing in other mutual funds. The examplesassume that $10,000 is invested in the fund for the periods indicated and then all shares are redeemed at the end of those periods. The examples alsoassume that the investment has a 5% return each year and that the fund’s operating expenses remain the same. The expense example does not reflectfees and expenses of any variable insurance contract that may use the fund as its underlying investment option and would be higher if they did.Although your actual costs may be higher or lower, based on these assumptions your costs would be:
Expenses ($) Series I Series II Series NAV
1 year 83 103 78
3 years 259 322 243
5 years 450 558 422
10 years 1,002 1,236 942
Portfolio turnoverThe fund pays transaction costs, such as commissions, when it buys and sells securities (or “turns over” its portfolio). A higher portfolio turnover ratemay indicate higher transaction costs. These costs, which are not reflected in annual fund operating expenses or in the example, affect the fund’sperformance. During its most recent fiscal year, the fund’s portfolio turnover rate was 61% of the average value of its portfolio.
Principal investment strategiesUnder normal market conditions, the fund invests at least 80% of its net assets (plus any borrowings for investment purposes) at the time ofinvestment in high yield securities. The fund’s investments may include corporate bonds, preferred stocks, U.S. government and foreign securities,mortgage-backed securities, loan assignments or participations and convertible securities which have the following ratings (or, if unrated, areconsidered by the subadvisor to be of equivalent quality):
Corporate Bonds, Preferred Stocks and Convertible Securities
Moody’s Investors Service, Inc. . . . . . . . . . . . . . . . . . . . . . . . Ba through C
Standard & Poor’s Ratings. . . . . . . . . . . . . . . . . . . . . . . . . . . BB through D
Below-investment-grade securities are commonly referred to as “junk bonds.” The fund may also invest in investment-grade securities.
As part of its investment strategy, the fund will generally invest without restrictions within these ratings category ranges, or in unrated securitiesconsidered to be of equivalent quality by the subadvisor.
The fund may invest in foreign bonds and other fixed-income securities denominated in foreign currencies, where, in the opinion of the subadvisor, thecombination of current yield and currency value offer attractive expected returns. Foreign securities in which the fund may invest include emergingmarket securities. The fund may invest up to 100% of its assets in foreign securities.
The fund may also enter into various derivative transactions for both hedging and non-hedging purposes, including for purposes of enhancing returns.These derivative transactions include, but are not limited to, futures, options, swaps and forwards. In particular, the fund may use interest rate swaps,credit default swaps (on individual securities and/or baskets of securities), futures contracts and/or mortgage-backed securities to a significant extent,although the amounts invested in these instruments may change from time to time.
The fund may invest in fixed- and floating-rate loans, generally in the form of loan participations and assignments of such loans.
.66
The fund normally maintains an average portfolio duration of between three and seven years. However, the fund may invest in individual securities ofany duration. Duration is an approximate measure of the sensitivity of the market value of a security to changes in interest rates.
Principal risksThe fund is subject to risks, and you could lose money by investing in the fund. The principal risks of investing in the fund include:
Changing distribution levels risk. The fund may cease or reduce the level of its distribution or make a greater return of capital if income ordividends paid from its investments declines.
Credit and counterparty risk. The issuer or guarantor of a fixed-income security, the counterparty to an over-the-counter derivatives contract, or aborrower of fund securities may not make timely payments or otherwise honor its obligations. U.S. government securities are subject to varyingdegrees of credit risk depending upon the nature of their support. A downgrade or default affecting any of the fund’s securities could affect the fund’sperformance.
Cybersecurity and operational risk. Cybersecurity breaches may allow an unauthorized party to gain access to fund assets, customer data, orproprietary information, or cause a fund or its service providers to suffer data corruption or lose operational functionality. Similar incidents affectingissuers of a fund’s securities may negatively impact performance. Operational risk may arise from human error, error by third parties, communicationerrors, or technology failures, among other causes.
Economic and market events risk. Events in the U.S. and global financial markets, including actions taken by the U.S. Federal Reserve or foreigncentral banks to stimulate or stabilize economic growth, may at times result in unusually high market volatility, which could negatively impactperformance. Reduced liquidity in credit and fixed-income markets could adversely affect issuers worldwide. Banks and financial services companiescould suffer losses if interest rates rise or economic conditions deteriorate.
Equity securities risk. The price of equity securities may decline due to changes in a company’s financial condition or overall market conditions.
Fixed-income securities risk. A rise in interest rates typically causes bond prices to fall. The longer the average maturity or duration of the bonds heldby a fund, the more sensitive it will likely be to interest-rate fluctuations. An issuer may not make all interest payments or repay all or any of theprincipal borrowed. Changes in a security’s credit quality may adversely affect fund performance.
Foreign securities risk. Less information may be publicly available regarding foreign issuers. Foreign securities may be subject to foreign taxes andmay be more volatile than U.S. securities. Currency fluctuations and political and economic developments may adversely impact the value of foreignsecurities. The risks of investing in foreign securities are magnified in emerging markets.
Hedging, derivatives, and other strategic transactions risk. Hedging, derivatives, and other strategic transactions may increase a fund’s volatilityand could produce disproportionate losses, potentially more than the fund’s principal investment. Risks of these transactions are different from andpossibly greater than risks of investing directly in securities and other traditional instruments. Under certain market conditions, derivatives couldbecome harder to value or sell and may become subject to liquidity risk (i.e., the inability to enter into closing transactions). Regulatory changes inderivative markets could impact the cost of or the fund’s ability to engage in derivative transactions. Derivatives and other strategic transactions thatthe fund intends to utilize include: credit default swaps; foreign currency forward contracts; foreign currency swaps; futures contracts; interest-rateswaps; and options. Foreign currency forward contracts, futures contracts, options, and swaps generally are subject to counterparty risk. In addition,swaps may be subject to interest-rate and settlement risk, and the risk of default of the underlying reference obligation. Derivatives associated withforeign currency transactions are subject to currency risk.
Liquidity risk. The extent (if at all) to which a security may be sold or a derivative position closed without negatively impacting its market value may beimpaired by reduced market activity or participation, legal restrictions, or other economic and market impediments. Liquidity risk may be magnified inrising interest rate environments due to higher than normal redemption rates. Widespread selling of fixed-income securities to satisfy redemptionsduring periods of reduced demand may adversely impact the price or salability of such securities. Periods of heavy redemption could cause the fund tosell assets at a loss or depressed value, which could negatively affect performance. Redemption risk is heightened during periods of declining or illiquidmarkets.
Loan participations risk. Participations and assignments involve special types of risks, including credit risk, interest-rate risk, counterparty risk,liquidity risk, risks associated with extended settlement, and the risks of being a lender.
Lower-rated and high-yield fixed-income securities risk. Lower-rated and high-yield fixed-income securities (junk bonds) are subject to greatercredit quality risk, risk of default, and price volatility than higher-rated fixed-income securities, may be considered speculative, and can be difficult toresell.
Mortgage-backed and asset-backed securities risk. Mortgage-backed and asset-backed securities are subject to different combinations ofprepayment, extension, interest-rate, and other market risks.
Preferred and convertible securities risk. Preferred stock dividends are payable only if declared by the issuer’s Board. Preferred stock may be subjectto redemption provisions. The market values of convertible securities tend to fall as interest rates rise and rise as interest rates fall. Convertiblepreferred stock’s value can depend heavily upon the underlying common stock’s value.
Past performanceThe following information provides some indication of the risks of investing in the fund by showing changes in performance from year to year and byshowing how average annual returns for specified periods compare with those of a broad measure of market performance. The performance
.67
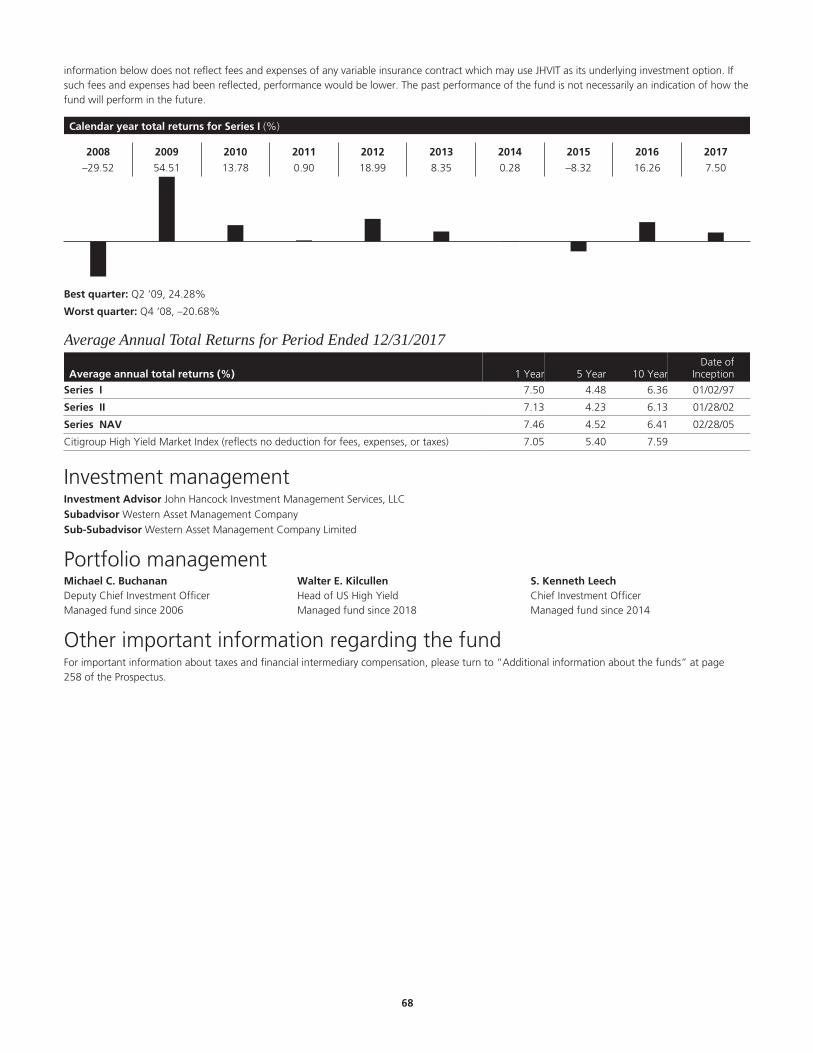
information below does not reflect fees and expenses of any variable insurance contract which may use JHVIT as its underlying investment option. Ifsuch fees and expenses had been reflected, performance would be lower. The past performance of the fund is not necessarily an indication of how thefund will perform in the future.
Calendar year total returns for Series I (%)
2008 2009 2010 2011 2012 2013 2014 2015 2016 2017
–29.52 54.51 13.78 0.90 18.99 8.35 0.28 –8.32 16.26 7.50
Best quarter: Q2 ‘09, 24.28%
Worst quarter: Q4 ‘08, –20.68%
Average Annual Total Returns for Period Ended 12/31/2017
Average annual total returns (%) 1 Year 5 Year 10 YearDate of
Inception
Series I 7.50 4.48 6.36 01/02/97
Series II 7.13 4.23 6.13 01/28/02
Series NAV 7.46 4.52 6.41 02/28/05
Citigroup High Yield Market Index (reflects no deduction for fees, expenses, or taxes) 7.05 5.40 7.59
Investment managementInvestment Advisor John Hancock Investment Management Services, LLC§
Subadvisor Western Asset Management Company§
Sub-Subadvisor Western Asset Management Company Limited
Portfolio managementMichael C. BuchananDeputy Chief Investment OfficerManaged fund since 2006
Walter E. KilcullenHead of US High YieldManaged fund since 2018
S. Kenneth LeechChief Investment OfficerManaged fund since 2014
Other important information regarding the fundFor important information about taxes and financial intermediary compensation, please turn to “Additional information about the funds” at page258 of the Prospectus.
.68

International Equity Index Trust (formerly International Equity Index Trust B)Investment objectiveTo seek to track the performance of a broad-based equity index of foreign companies primarily in developed countries and, to a lesser extent, inemerging markets.
Fees and expensesThis table describes the fees and expenses that you may pay if you buy and hold shares of the fund. The fees and expenses do not reflect fees andexpenses of any variable insurance contract that may use the fund as its underlying investment option and would be higher if they did.
Annual fund operating expenses (%) (expenses that you pay each year as a percentage of the valueof your investment) Series I Series II Series NAV
Management fee 0.53 0.53 0.53
Distribution and service (Rule 12b-1) fees 0.05 0.25 0.00
Other expenses 0.10 0.10 0.10
Total annual fund operating expenses 0.68 0.88 0.63
Contractual expense reimbursement1 –0.29 –0.29 –0.29
Total annual fund operating expenses after expense reimbursements 0.39 0.59 0.34
1 The advisor contractually agrees to reduce its management fee or, if necessary, make payment to the fund in an amount equal to the amount by which expenses of the fundexceed 0.34% of average daily net assets of the fund. For purposes of this agreement, “expenses of the fund” means all fund expenses, excluding (a) taxes, (b) brokeragecommissions, (c) interest expense, (d) litigation and indemnification expenses and other extraordinary expenses not incurred in the ordinary course of the fund’s business, (e)class-specific expenses, (f) borrowing costs, (g) prime brokerage fees, (h) acquired fund fees and expenses paid indirectly, and (i) short dividend expense. This agreement expireson April 30, 2019, unless renewed by mutual agreement of the advisor and the fund based upon a determination that this is appropriate under the circumstances at that time.
Expense exampleThe examples are intended to help you compare the cost of investing in the fund with the cost of investing in other mutual funds. The examplesassume that $10,000 is invested in the fund for the periods indicated and then all shares are redeemed at the end of those periods. The examples alsoassume that the investment has a 5% return each year and that the fund’s operating expenses remain the same. The expense example does not reflectfees and expenses of any variable insurance contract that may use the fund as its underlying investment option and would be higher if they did.Although your actual costs may be higher or lower, based on these assumptions your costs would be:
Expenses ($) Series I Series II Series NAV
1 year 40 60 35
3 years 188 252 172
5 years 350 459 322
10 years 819 1,058 759
Portfolio turnoverThe fund pays transaction costs, such as commissions, when it buys and sells securities (or “turns over” its portfolio). A higher portfolio turnover ratemay indicate higher transaction costs. These costs, which are not reflected in annual fund operating expenses or in the example, affect the fund’sperformance. During its most recent fiscal year, the fund’s portfolio turnover rate was 3% of the average value of its portfolio.
Principal investment strategiesUnder normal market conditions, the fund invests at least 80% of its assets in securities listed in the MSCI All Country World Excluding U.S. Index (the“Index”), or American Depositary Receipts (ADRs) or Global Depositary Receipts (GDRs) representing such securities. As of February 28, 2018, themarket capitalization range of the Index was $484 million to $315 billion.
The fund is an index fund and differs from an actively-managed fund. Actively-managed funds seek to outperform their benchmark indices throughresearch and analysis. Over time, their performance may differ significantly from their benchmark indices. Index funds are passively managed fundsthat seek to track the risk and return profile of market indices. An index is an unmanaged group of securities whose overall performance is used as aninvestment benchmark. Indices may track broad investment markets, such as the global equity market, or more narrow investment markets, such asthe U.S. small cap equity market. However, an index fund has operating expenses and transaction costs, while a market index does not. Therefore, thefund, while it attempts to track its target index, typically will be unable to match the performance of the index exactly due to such fees and expenses.
The fund uses “sampling” methodology in seeking to track the total return performance of the Index. This means that the fund does not intend and isnot required to purchase all of the securities in the Index, but rather intends to hold a representative sample of the securities in the Index in an effort toachieve the fund’s investment objective. The quantity of holdings in the fund will be based on a number of factors, including asset size of the fund.
.69
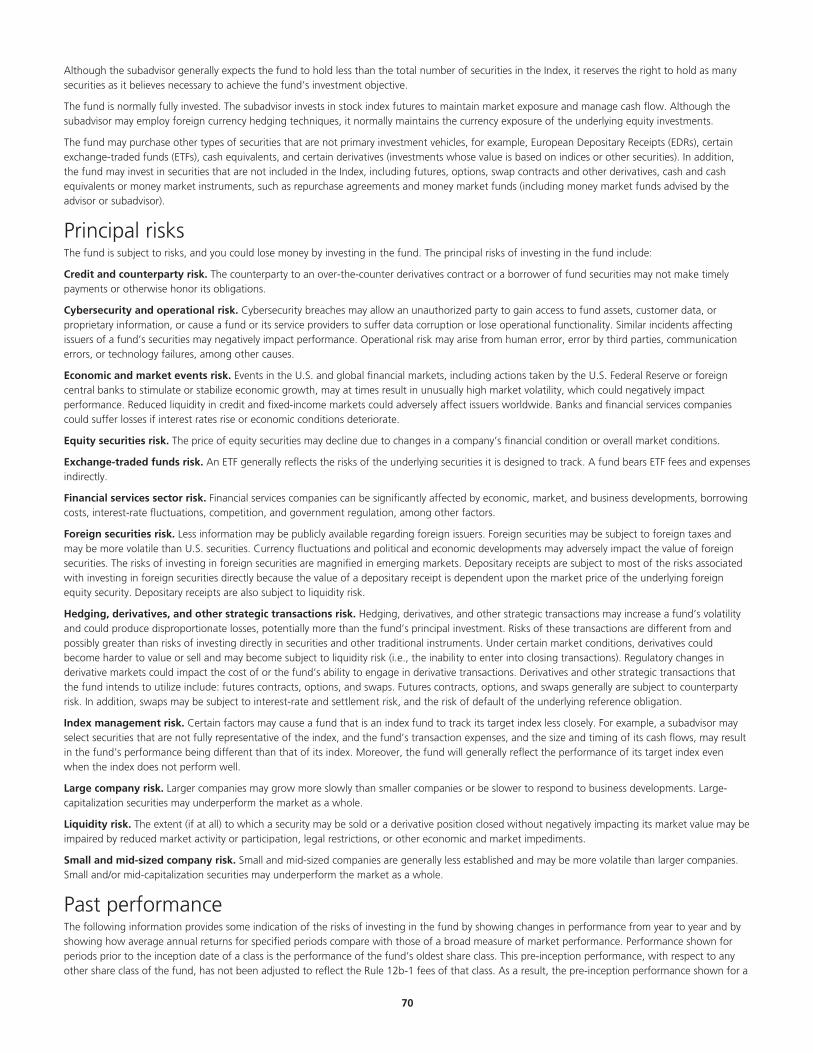
Although the subadvisor generally expects the fund to hold less than the total number of securities in the Index, it reserves the right to hold as manysecurities as it believes necessary to achieve the fund’s investment objective.
The fund is normally fully invested. The subadvisor invests in stock index futures to maintain market exposure and manage cash flow. Although thesubadvisor may employ foreign currency hedging techniques, it normally maintains the currency exposure of the underlying equity investments.
The fund may purchase other types of securities that are not primary investment vehicles, for example, European Depositary Receipts (EDRs), certainexchange-traded funds (ETFs), cash equivalents, and certain derivatives (investments whose value is based on indices or other securities). In addition,the fund may invest in securities that are not included in the Index, including futures, options, swap contracts and other derivatives, cash and cashequivalents or money market instruments, such as repurchase agreements and money market funds (including money market funds advised by theadvisor or subadvisor).
Principal risksThe fund is subject to risks, and you could lose money by investing in the fund. The principal risks of investing in the fund include:
Credit and counterparty risk. The counterparty to an over-the-counter derivatives contract or a borrower of fund securities may not make timelypayments or otherwise honor its obligations.
Cybersecurity and operational risk. Cybersecurity breaches may allow an unauthorized party to gain access to fund assets, customer data, orproprietary information, or cause a fund or its service providers to suffer data corruption or lose operational functionality. Similar incidents affectingissuers of a fund’s securities may negatively impact performance. Operational risk may arise from human error, error by third parties, communicationerrors, or technology failures, among other causes.
Economic and market events risk. Events in the U.S. and global financial markets, including actions taken by the U.S. Federal Reserve or foreigncentral banks to stimulate or stabilize economic growth, may at times result in unusually high market volatility, which could negatively impactperformance. Reduced liquidity in credit and fixed-income markets could adversely affect issuers worldwide. Banks and financial services companiescould suffer losses if interest rates rise or economic conditions deteriorate.
Equity securities risk. The price of equity securities may decline due to changes in a company’s financial condition or overall market conditions.
Exchange-traded funds risk. An ETF generally reflects the risks of the underlying securities it is designed to track. A fund bears ETF fees and expensesindirectly.
Financial services sector risk. Financial services companies can be significantly affected by economic, market, and business developments, borrowingcosts, interest-rate fluctuations, competition, and government regulation, among other factors.
Foreign securities risk. Less information may be publicly available regarding foreign issuers. Foreign securities may be subject to foreign taxes andmay be more volatile than U.S. securities. Currency fluctuations and political and economic developments may adversely impact the value of foreignsecurities. The risks of investing in foreign securities are magnified in emerging markets. Depositary receipts are subject to most of the risks associatedwith investing in foreign securities directly because the value of a depositary receipt is dependent upon the market price of the underlying foreignequity security. Depositary receipts are also subject to liquidity risk.
Hedging, derivatives, and other strategic transactions risk. Hedging, derivatives, and other strategic transactions may increase a fund’s volatilityand could produce disproportionate losses, potentially more than the fund’s principal investment. Risks of these transactions are different from andpossibly greater than risks of investing directly in securities and other traditional instruments. Under certain market conditions, derivatives couldbecome harder to value or sell and may become subject to liquidity risk (i.e., the inability to enter into closing transactions). Regulatory changes inderivative markets could impact the cost of or the fund’s ability to engage in derivative transactions. Derivatives and other strategic transactions thatthe fund intends to utilize include: futures contracts, options, and swaps. Futures contracts, options, and swaps generally are subject to counterpartyrisk. In addition, swaps may be subject to interest-rate and settlement risk, and the risk of default of the underlying reference obligation.
Index management risk. Certain factors may cause a fund that is an index fund to track its target index less closely. For example, a subadvisor mayselect securities that are not fully representative of the index, and the fund’s transaction expenses, and the size and timing of its cash flows, may resultin the fund’s performance being different than that of its index. Moreover, the fund will generally reflect the performance of its target index evenwhen the index does not perform well.
Large company risk. Larger companies may grow more slowly than smaller companies or be slower to respond to business developments. Large-capitalization securities may underperform the market as a whole.
Liquidity risk. The extent (if at all) to which a security may be sold or a derivative position closed without negatively impacting its market value may beimpaired by reduced market activity or participation, legal restrictions, or other economic and market impediments.
Small and mid-sized company risk. Small and mid-sized companies are generally less established and may be more volatile than larger companies.Small and/or mid-capitalization securities may underperform the market as a whole.
Past performanceThe following information provides some indication of the risks of investing in the fund by showing changes in performance from year to year and byshowing how average annual returns for specified periods compare with those of a broad measure of market performance. Performance shown forperiods prior to the inception date of a class is the performance of the fund’s oldest share class. This pre-inception performance, with respect to anyother share class of the fund, has not been adjusted to reflect the Rule 12b-1 fees of that class. As a result, the pre-inception performance shown for a
.70
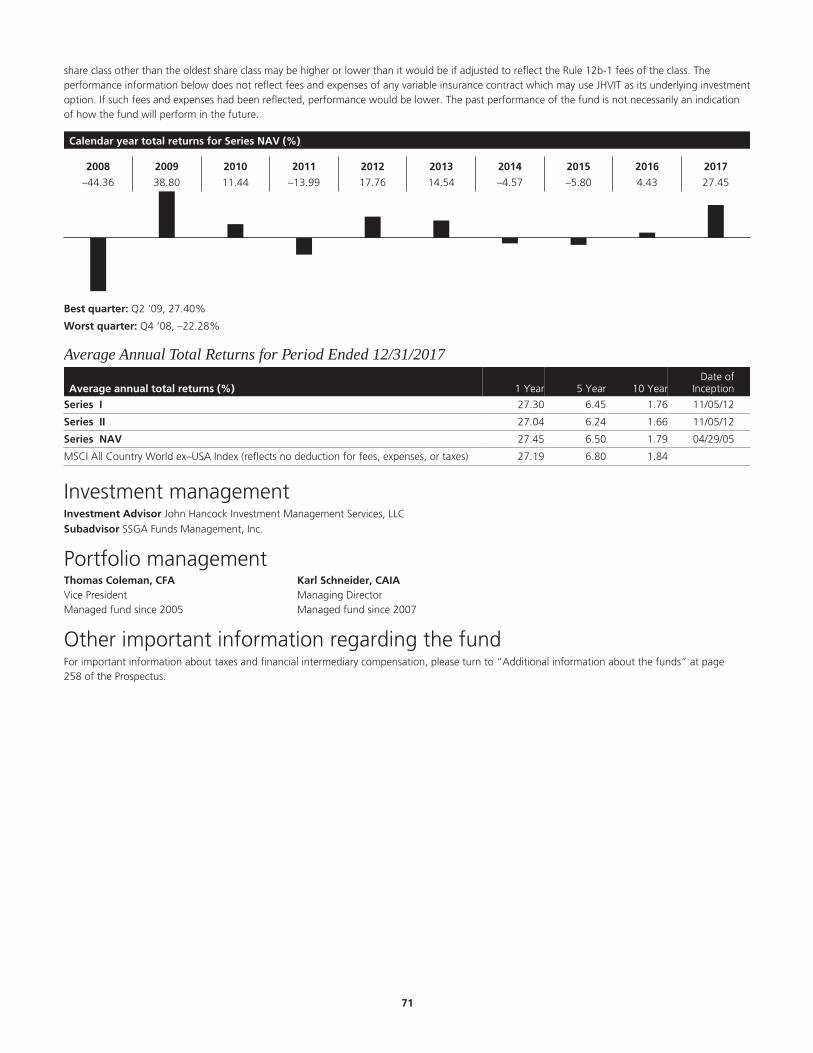
share class other than the oldest share class may be higher or lower than it would be if adjusted to reflect the Rule 12b-1 fees of the class. Theperformance information below does not reflect fees and expenses of any variable insurance contract which may use JHVIT as its underlying investmentoption. If such fees and expenses had been reflected, performance would be lower. The past performance of the fund is not necessarily an indicationof how the fund will perform in the future.
Calendar year total returns for Series NAV (%)
2008 2009 2010 2011 2012 2013 2014 2015 2016 2017
–44.36 38.80 11.44 –13.99 17.76 14.54 –4.57 –5.80 4.43 27.45
Best quarter: Q2 ‘09, 27.40%
Worst quarter: Q4 ‘08, –22.28%
Average Annual Total Returns for Period Ended 12/31/2017
Average annual total returns (%) 1 Year 5 Year 10 YearDate of
Inception
Series I 27.30 6.45 1.76 11/05/12
Series II 27.04 6.24 1.66 11/05/12
Series NAV 27.45 6.50 1.79 04/29/05
MSCI All Country World ex–USA Index (reflects no deduction for fees, expenses, or taxes) 27.19 6.80 1.84
Investment managementInvestment Advisor John Hancock Investment Management Services, LLC§
Subadvisor SSGA Funds Management, Inc.
Portfolio managementThomas Coleman, CFAVice PresidentManaged fund since 2005
Karl Schneider, CAIAManaging DirectorManaged fund since 2007
Other important information regarding the fundFor important information about taxes and financial intermediary compensation, please turn to “Additional information about the funds” at page258 of the Prospectus.
.71

International Growth Stock Trust Investment objectiveThe fund seeks to achieve long-term growth of capital.
Fees and expensesThis table describes the fees and expenses that you may pay if you buy and hold shares of the fund. The fees and expenses do not reflect fees andexpenses of any variable insurance contract that may use the fund as its underlying investment option and would be higher if they did.
Annual fund operating expenses (%) (expenses that you pay each year as a percentage of the valueof your investment) Series I Series II Series NAV
Management fee 0.79 0.79 0.79
Distribution and service (Rule 12b-1) fees 0.05 0.25 0.00
Other expenses 0.09 0.09 0.09
Acquired fund fees and expenses1 0.01 0.01 0.01
Total annual fund operating expenses2 0.94 1.14 0.89
1 “Acquired fund fees and expenses” are based on indirect net expenses associated with the fund’s investments in underlying investment companies.2 The “Total annual fund operating expenses” shown may not correlate to the fund’s ratios of expenses to average daily net assets shown in the “Financial highlights” section of
the fund’s prospectus, which does not include “Acquired fund fees and expenses.”
Expense exampleThe examples are intended to help you compare the cost of investing in the fund with the cost of investing in other mutual funds. The examplesassume that $10,000 is invested in the fund for the periods indicated and then all shares are redeemed at the end of those periods. The examples alsoassume that the investment has a 5% return each year and that the fund’s operating expenses remain the same. The expense example does not reflectfees and expenses of any variable insurance contract that may use the fund as its underlying investment option and would be higher if they did.Although your actual costs may be higher or lower, based on these assumptions your costs would be:
Expenses ($) Series I Series II Series NAV
1 year 96 116 91
3 years 300 362 284
5 years 520 628 493
10 years 1,155 1,386 1,096
Portfolio turnoverThe fund pays transaction costs, such as commissions, when it buys and sells securities (or “turns over” its portfolio). A higher portfolio turnover ratemay indicate higher transaction costs. These costs, which are not reflected in annual fund operating expenses or in the example, affect the fund’sperformance. During its most recent fiscal year, the fund’s portfolio turnover rate was 28% of the average value of its portfolio.
Principal investment strategiesThe fund invests primarily in a diversified portfolio of international securities whose issuers are considered by the fund’s subadvisor to have potential forearnings or revenue growth. The fund will, under normal circumstances, invest at least 80% of its net assets (plus any borrowings for investmentpurposes) in stocks of any market capitalization.
The fund invests significantly in foreign issuers. The fund focuses its investments in equity securities of foreign issuers that are listed on a recognizedforeign or U.S. securities exchange or traded in a foreign or U.S. over-the-counter market. The fund’s equity securities investments include China-AShares (shares of companies based in mainland China that trade on the Shanghai Stock Exchange and the Shenzhen Stock Exchange). The fundinvests, under normal circumstances, in issuers located in at least three countries outside of the U.S. The fund may invest in issuers located indeveloping countries (emerging markets). Under normal circumstances, the maximum percentage of the fund’s net assets that may be invested inthese issuers is 1.25 times of the emerging market weight of the MSCI All Country World ex-USA Growth Index.
The fund invests primarily in the securities of large-capitalization issuers and may invest a significant amount of its net assets in the securities of mid-capitalization issuers. The fund can invest in derivative instruments including forward foreign currency contracts and futures. The fund can utilizeforward foreign currency contracts to hedge against adverse movements in the foreign currencies in which portfolio securities are denominated,though the fund has not typically used these instruments. The fund can also invest in futures contracts to gain exposure to the broad market inconnection with managing cash balances or to hedge against downside risk.
The portfolio managers employ a disciplined investment strategy that emphasizes fundamental research. The fundamental research primarily focuseson identifying quality growth companies and is supported by quantitative analysis, portfolio construction and risk management. Investments for theportfolio are selected bottom-up on a security-by-security basis. The focus is on the strengths of individual issuers, rather than sector or country trends.
.72

The portfolio managers’ strategy primarily focuses on identifying issuers that they believe have sustainable earnings growth, efficient capital allocation,and attractive prices.
The fund’s portfolio managers may consider selling a security for several reasons, including when (1) its price changes such that they believe it hasbecome too expensive, (2) the original investment thesis for the company is no longer valid, or (3) a more compelling investment opportunity isidentified.
Use of Hedging and Other Strategic Transactions. The fund is authorized to use various hedging, derivatives and other strategic transactions, including,but not limited to, U.S. Treasury futures and options, index derivatives, credit default swaps and currency forwards, described under “AdditionalInformation about the Funds’ Principal Risks – Hedging, derivatives and other strategic transactions risk.”
Principal risksThe fund is subject to risks, and you could lose money by investing in the fund. The principal risks of investing in the fund include:
Credit and counterparty risk. The counterparty to an over-the-counter derivatives contract or a borrower of fund securities may not make timelypayments or otherwise honor its obligations. U.S. government securities are subject to varying degrees of credit risk based on the nature of theirsupport.
Cybersecurity and operational risk. Cybersecurity breaches may allow an unauthorized party to gain access to fund assets, customer data, orproprietary information, or cause a fund or its service providers to suffer data corruption or lose operational functionality. Similar incidents affectingissuers of a fund’s securities may negatively impact performance. Operational risk may arise from human error, error by third parties, communicationerrors, or technology failures, among other causes.
Economic and market events risk. Events in the U.S. and global financial markets, including actions taken by the U.S. Federal Reserve or foreigncentral banks to stimulate or stabilize economic growth, may at times result in unusually high market volatility, which could negatively impactperformance. Reduced liquidity in credit and fixed-income markets could adversely affect issuers worldwide. Banks and financial services companiescould suffer losses if interest rates rise or economic conditions deteriorate.
Equity securities risk. The price of equity securities may decline due to changes in a company’s financial condition or overall market conditions.Growth company securities may fluctuate more in price than other securities because of the greater emphasis on earnings expectations.
Foreign securities risk. Less information may be publicly available regarding foreign issuers. Foreign securities may be subject to foreign taxes andmay be more volatile than U.S. securities. Currency fluctuations and political and economic developments may adversely impact the value of foreignsecurities. The risks of investing in foreign securities are magnified in emerging markets.
Hong Kong Stock Connect Program (Stock Connect) risk. The fund’s investments in eligible renminbi-denominated class A shares of equitysecurities that are listed and traded on certain Chinese stock exchanges (China A-Shares) through Stock Connect are generally subject to Chinesesecurities regulations and local exchange listing rules. The fund may not sell, purchase, or otherwise transfer China A-Shares other than via StockConnect, which may restrict or preclude the fund’s ability to invest in China A-Shares. Stock Connect is subject to quota limitations when purchasingsecurities, which may restrict the fund’s ability to trade via Stock Connect on a timely basis. This may impact the fund’s ability to implement itsinvestment strategy effectively.§
Hedging, derivatives, and other strategic transactions risk. Hedging, derivatives, and other strategic transactions may increase a fund’s volatilityand could produce disproportionate losses, potentially more than the fund’s principal investment. Risks of these transactions are different from andpossibly greater than risks of investing directly in securities and other traditional instruments. Under certain market conditions, derivatives couldbecome harder to value or sell and may become subject to liquidity risk (i.e., the inability to enter into closing transactions). Regulatory changes inderivative markets could impact the cost of or the fund’s ability to engage in derivative transactions. Derivatives and other strategic transactions thatthe fund intends to utilize include: foreign currency forward contracts, futures contracts, options, and credit default swaps. Foreign currency forwardcontracts, futures contracts, options, and swaps generally are subject to counterparty risk. In addition, swaps may be subject to interest-rate andsettlement risk, and the risk of default of the underlying reference obligation. Derivatives associated with foreign currency transactions are subject tocurrency risk.
Large company risk. Larger companies may grow more slowly than smaller companies or be slower to respond to business developments. Large-capitalization securities may underperform the market as a whole.
Liquidity risk. The extent (if at all) to which a security may be sold or a derivative position closed without negatively impacting its market value may beimpaired by reduced market activity or participation, legal restrictions, or other economic and market impediments.
Sector risk. When a fund focuses its investments in certain sectors of the economy, its performance may be driven largely by sector performance andcould fluctuate more widely than if the fund were invested more evenly across sectors.
Small and mid-sized company risk. Small and mid-sized companies are generally less established and may be more volatile than larger companies.Small and/or mid-capitalization securities may underperform the market as a whole.
Past performanceThe following information provides some indication of the risks of investing in the fund by showing changes in performance from year to year and byshowing how average annual returns for specified periods compare with those of a broad measure of market performance. The MSCI EAFE GrowthIndex shows how the fund’s performance compares against the returns of similar investments. Unless all share classes shown in the table have thesame inception date, performance shown for periods prior to the inception date of a class is the performance of the fund’s oldest share class. This pre-
.73
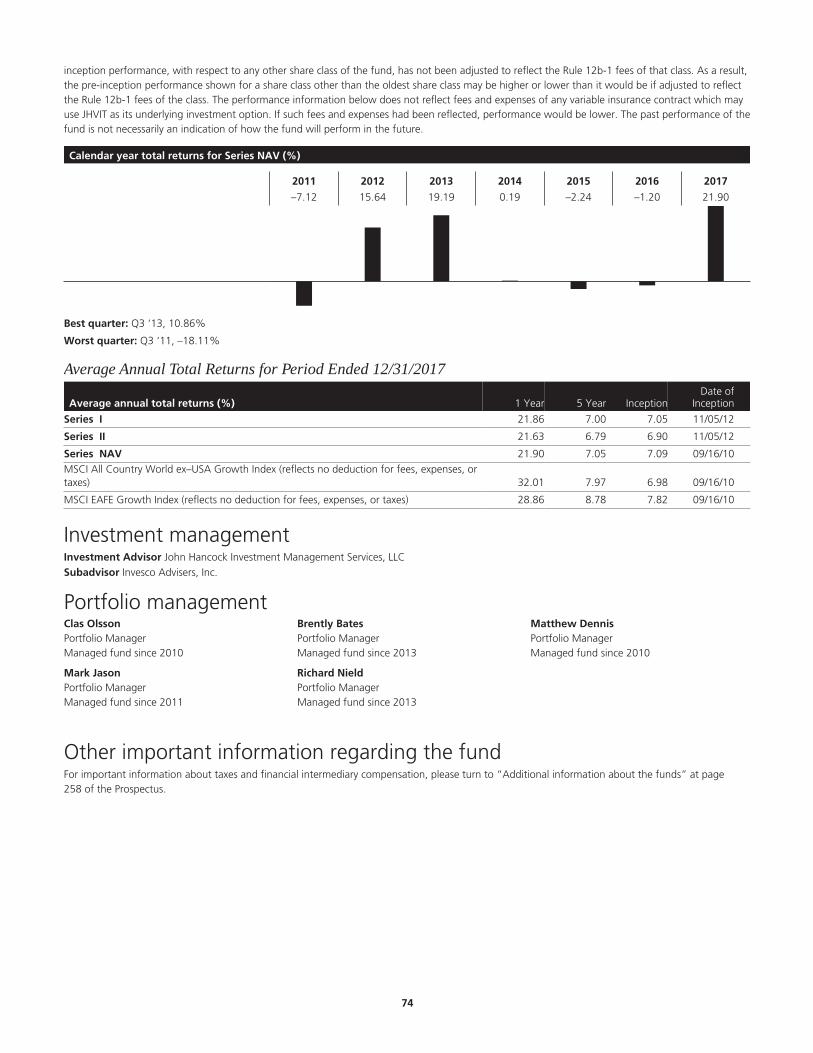
inception performance, with respect to any other share class of the fund, has not been adjusted to reflect the Rule 12b-1 fees of that class. As a result,the pre-inception performance shown for a share class other than the oldest share class may be higher or lower than it would be if adjusted to reflectthe Rule 12b-1 fees of the class. The performance information below does not reflect fees and expenses of any variable insurance contract which mayuse JHVIT as its underlying investment option. If such fees and expenses had been reflected, performance would be lower. The past performance of thefund is not necessarily an indication of how the fund will perform in the future.
Calendar year total returns for Series NAV (%)
2011 2012 2013 2014 2015 2016 2017
–7.12 15.64 19.19 0.19 –2.24 –1.20 21.90
Best quarter: Q3 ‘13, 10.86%
Worst quarter: Q3 ‘11, –18.11%
Average Annual Total Returns for Period Ended 12/31/2017
Average annual total returns (%) 1 Year 5 Year InceptionDate of
Inception
Series I 21.86 7.00 7.05 11/05/12
Series II 21.63 6.79 6.90 11/05/12
Series NAV 21.90 7.05 7.09 09/16/10MSCI All Country World ex–USA Growth Index (reflects no deduction for fees, expenses, ortaxes) 32.01 7.97 6.98 09/16/10
MSCI EAFE Growth Index (reflects no deduction for fees, expenses, or taxes) 28.86 8.78 7.82 09/16/10
Investment managementInvestment Advisor John Hancock Investment Management Services, LLC§
Subadvisor Invesco Advisers, Inc.
Portfolio managementClas OlssonPortfolio ManagerManaged fund since 2010
Brently BatesPortfolio ManagerManaged fund since 2013
Matthew DennisPortfolio ManagerManaged fund since 2010
Mark JasonPortfolio ManagerManaged fund since 2011
Richard NieldPortfolio ManagerManaged fund since 2013
Other important information regarding the fundFor important information about taxes and financial intermediary compensation, please turn to “Additional information about the funds” at page258 of the Prospectus.
.74

International Small Company Trust Investment objectiveTo seek long-term capital appreciation.
Fees and expensesThis table describes the fees and expenses that you may pay if you buy and hold shares of the fund. The fees and expenses do not reflect fees andexpenses of any variable insurance contract that may use the fund as its underlying investment option and would be higher if they did.
Annual fund operating expenses (%) (expenses that you pay each year as a percentage of the valueof your investment) Series I Series II Series NAV
Management fee 0.95 0.95 0.95
Distribution and service (Rule 12b-1) fees 0.05 0.25 0.00
Other expenses 0.18 0.18 0.18
Total annual fund operating expenses 1.18 1.38 1.13
Expense exampleThe examples are intended to help you compare the cost of investing in the fund with the cost of investing in other mutual funds. The examplesassume that $10,000 is invested in the fund for the periods indicated and then all shares are redeemed at the end of those periods. The examples alsoassume that the investment has a 5% return each year and that the fund’s operating expenses remain the same. The expense example does not reflectfees and expenses of any variable insurance contract that may use the fund as its underlying investment option and would be higher if they did.Although your actual costs may be higher or lower, based on these assumptions your costs would be:
Expenses ($) Series I Series II Series NAV
1 year 120 140 115
3 years 375 437 359
5 years 649 755 622
10 years 1,432 1,657 1,375
Portfolio turnoverThe fund pays transaction costs, such as commissions, when it buys and sells securities (or “turns over” its portfolio). A higher portfolio turnover ratemay indicate higher transaction costs. These costs, which are not reflected in annual fund operating expenses or in the example, affect the fund’sperformance. During its most recent fiscal year, the fund’s portfolio turnover rate was 14% of the average value of its portfolio.
Principal investment strategiesUnder normal market conditions, the fund invests at least 80% of its net assets (plus any borrowings for investment purposes) in securities of small capcompanies in the particular markets in which the fund invests. Based on market capitalization data as of February 28, 2018, the range of maximummarket capitalizations of companies eligible for purchase would be approximately $1,708 million to approximately $7,128 million, depending on thecountry. The fund will primarily invest in a broad and diverse group of equity securities of foreign small companies of developed markets, but may alsohold equity securities of companies located in emerging markets.
The fund invests its assets in securities listed on bona fide securities exchanges or traded on the over-the-counter markets, including securities listed ortraded in the form of International Depositary Receipts (IDRs), American Depositary Receipts (ADRs), European Depositary Receipts (EDRs), GlobalDepositary Receipts (GDRs), Non-Voting Depositary Receipts (NVDRs) and other similar securities, including dual-listed securities. Each of thesesecurities may be traded within or outside the issuer’s domicile country.
The subadvisor measures company size on a country or region specific basis and based primarily on market capitalization. In the countries or regionsauthorized for investment, the subadvisor first ranks eligible companies listed on selected exchanges based on the companies’ market capitalizations.The subadvisor then determines the universe of eligible stocks by defining the maximum market capitalization of a small company that may bepurchased by the fund with respect to each country or region. This threshold will vary by country or region, and dollar amounts will change due tomarket conditions.
The fund intends to purchase securities in each applicable country using a market capitalization weighted approach. The subadvisor, using thisapproach and its judgment, will seek to set country weights based on the relative market capitalizations of eligible small companies within eachcountry. See “Market Capitalization Weighted Approach” below. The weightings of countries in the fund may vary from their weightings ininternational indices, such as those published by FTSE International, MSCI or Citigroup.
The fund also may use derivatives such as futures contracts and options on futures contracts, to adjust market exposure based on actual or expectedcash inflows to or outflows from the fund. The fund does not intend to use derivatives for purposes of speculation or leveraging investment returns.The fund may enter into futures contracts and options on futures contracts for foreign or U.S. equity securities and indices. The fund may also enter
.75
into forward currency contracts to facilitate the settlement of equity purchases of foreign securities, repatriation of foreign currency balances orexchange of one foreign currency for another currency. In addition to money market instruments and other short-term investments, the fund mayinvest in affiliated and unaffiliated unregistered money market funds to manage the fund’s cash pending investment in other securities or to maintainliquidity for the payment of redemptions or other purposes. Investments in money market funds may involve a duplication of certain fees andexpenses.
The fund does not seek current income as an investment objective and investments will not be based upon an issuer’s dividend payment policy orrecord. However, many of the companies whose securities will be included in the fund do pay dividends. It is anticipated, therefore, that the fund willreceive dividend income.
The subadvisor will determine in its discretion when and whether to invest in countries that have been authorized for investment by its InvestmentCommittee, depending on a number of factors such as asset growth in the fund and characteristics of each country’s market. The subadvisor’sInvestment Committee may authorize other countries for investment in the future and the fund may continue to hold investments in countries notcurrently authorized for investment but that had previously been authorized for investment.
Market Capitalization Weighted Approach
The fund structure involves market capitalization weighting in determining individual security weights and, where applicable, country or regionweights. Market capitalization weighting means each security is generally purchased based on the issuer’s relative market capitalization. Marketcapitalization weighting may be adjusted by the subadvisor for a variety of reasons. The subadvisor may adjust the representation in the fund of aneligible company, or exclude a company, after considering such factors as free float, momentum, trading strategies, liquidity, value, and profitability, aswell as other factors determined to be appropriate by the subadvisor given market conditions. The subadvisor believes securities are considered valuestocks, primarily because they have a low price in relation to their book value. In assessing profitability, the subadvisor may consider different ratios,such as that of earnings or profits from operations relative to book value or assets. The criteria the subadvisor uses for assessing value or profitabilityare subject to change from time to time. The subadvisor may deviate from market capitalization weighting to limit or fix the exposure of the fund to aparticular country or issuer to a maximum proportion of the assets of the fund. The subadvisor may exclude the stock of a company that meetsapplicable market capitalization criteria if the subadvisor determines, in its judgment, that the purchase of such security is inappropriate in light ofother conditions. These adjustments will result in a deviation from traditional market capitalization weighting.
Country weights may be based on the total market capitalization of companies within each country. The calculation of country market capitalizationmay take into consideration the free float of companies within a country or whether these companies are eligible to be purchased for the particularstrategy. In addition, to maintain a satisfactory level of diversification, the Investment Committee may limit or adjust the exposure to a particularcountry or region to a maximum proportion of the assets of that vehicle. Country weights may also deviate from target weights due to general day-to-day trading patterns and price movements. The weighting of countries will likely vary from their weighting in published international indices. Also,deviation from target weights may result from holding securities from countries that are no longer authorized for future investments.
Principal risksThe fund is subject to risks, and you could lose money by investing in the fund. The principal risks of investing in the fund include:
Credit and counterparty risk. The counterparty to an over-the-counter derivatives contract or a borrower of fund securities may not make timelypayments or otherwise honor its obligations.
Cybersecurity and operational risk. Cybersecurity breaches may allow an unauthorized party to gain access to fund assets, customer data, orproprietary information, or cause a fund or its service providers to suffer data corruption or lose operational functionality. Similar incidents affectingissuers of a fund’s securities may negatively impact performance. Operational risk may arise from human error, error by third parties, communicationerrors, or technology failures, among other causes.
Economic and market events risk. Events in the U.S. and global financial markets, including actions taken by the U.S. Federal Reserve or foreigncentral banks to stimulate or stabilize economic growth, may at times result in unusually high market volatility, which could negatively impactperformance. Reduced liquidity in credit and fixed-income markets could adversely affect issuers worldwide. Banks and financial services companiescould suffer losses if interest rates rise or economic conditions deteriorate.
Equity securities risk. The price of equity securities may decline due to changes in a company’s financial condition or overall market conditions.Securities the manager believes are undervalued may never realize their full potential value, and in certain markets value stocks may underperform themarket as a whole.
Foreign securities risk. Less information may be publicly available regarding foreign issuers. Foreign securities may be subject to foreign taxes andmay be more volatile than U.S. securities. Currency fluctuations and political and economic developments may adversely impact the value of foreignsecurities. The risks of investing in foreign securities are magnified in emerging markets. Depositary receipts are subject to most of the risks associatedwith investing in foreign securities directly because the value of a depositary receipt is dependent upon the market price of the underlying foreignequity security. Depositary receipts are also subject to liquidity risk.
Hedging, derivatives, and other strategic transactions risk. Hedging, derivatives, and other strategic transactions may increase a fund’s volatilityand could produce disproportionate losses, potentially more than the fund’s principal investment. Risks of these transactions are different from andpossibly greater than risks of investing directly in securities and other traditional instruments. Under certain market conditions, derivatives couldbecome harder to value or sell and may become subject to liquidity risk (i.e., the inability to enter into closing transactions). Regulatory changes inderivative markets could impact the cost of or the fund’s ability to engage in derivatives transactions. Derivatives and other strategic transactions thatthe fund intends to utilize include: foreign currency forward contracts, futures contracts, options on futures contracts, and options. Foreign currency
.76

forward contracts, futures contracts, and options generally are subject to counterparty risk. Derivatives associated with foreign currency transactionsare subject to currency risk.
Industrials sector risk. Companies in the industrials sector may be affected by general economic conditions, commodity production and pricing,supply and demand fluctuations, environmental and other government regulations, geopolitical events, interest rates, insurance costs, technologicaldevelopments, liabilities arising from governmental or civil actions, labor relations, input controls, and government spending.
Liquidity risk. The extent (if at all) to which a security may be sold or a derivative position closed without negatively impacting its market value may beimpaired by reduced market activity or participation, legal restrictions, or other economic and market impediments.
Sector risk. When a fund focuses its investments in certain sectors of the economy, its performance may be driven largely by sector performance andcould fluctuate more widely than if the fund were invested more evenly across sectors.
Small and mid-sized company risk. Small and mid-sized companies are generally less established and may be more volatile than larger companies.Small and/or mid-capitalization securities may underperform the market as a whole.
Past performanceThe following information provides some indication of the risks of investing in the fund by showing changes in performance from year to year and byshowing how average annual returns for specified periods compare with those of a broad measure of market performance. The MSCI EAFE Small CapIndex shows how the fund’s performance compares against the returns of similar investments. Unless all share classes shown in the table have thesame inception date, performance shown for periods prior to the inception date of a class is the performance of the fund’s oldest share class. This pre-inception performance, with respect to any other share class of the fund, has not been adjusted to reflect the Rule 12b-1 fees of that class. As a result,the pre-inception performance shown for a share class other than the oldest share class may be higher or lower than it would be if adjusted to reflectthe Rule 12b-1 fees of the class. The performance information below does not reflect fees and expenses of any variable insurance contract which mayuse JHVIT as its underlying investment option. If such fees and expenses had been reflected, performance would be lower. The past performance of thefund is not necessarily an indication of how the fund will perform in the future.
Calendar year total returns for Series NAV (%)
2008 2009 2010 2011 2012 2013 2014 2015 2016 2017
–45.35 39.44 22.63 –16.18 19.24 26.29 –6.85 6.68 4.95 29.60
Best quarter: Q2 ‘09, 31.13%
Worst quarter: Q3 ‘08, –22.53%
Average Annual Total Returns for Period Ended 12/31/2017
Average annual total returns (%) 1 Year 5 Year 10 YearDate of
Inception
Series I 29.46 11.22 4.73 11/16/09
Series II 29.17 10.99 4.56 11/16/09
Series NAV 29.60 11.29 4.78 05/01/06
MSCI World ex–USA Small Cap Index (reflects no deduction for fees, expenses, or taxes) 31.04 11.37 5.16
MSCI EAFE Small Cap Index (reflects no deduction for fees, expenses, or taxes) 33.01 12.85 5.77
Investment managementInvestment Advisor John Hancock Investment Management Services, LLC§
Subadvisor Dimensional Fund Advisors LP
Portfolio managementJoseph H. Chi, CFASenior Portfolio Manager and Vice PresidentManaged fund since 2010
Jed S. FogdallSenior Portfolio Manager and Vice PresidentManaged fund since 2010
Mary T. Phillips, CFASenior Portfolio Manager and Vice PresidentManaged fund since 2017
Arun Keswani, CFASenior Portfolio Manager and Vice PresidentManaged fund since 2015
Bhanu P. SinghSenior Portfolio Manager and Vice PresidentManaged fund since 2015
.77

Other important information regarding the fundFor important information about taxes and financial intermediary compensation, please turn to “Additional information about the funds” at page258 of the Prospectus.
.78

International Value Trust Investment objectiveTo seek long-term growth of capital.
Fees and expensesThis table describes the fees and expenses that you may pay if you buy and hold shares of the fund. The fees and expenses do not reflect fees andexpenses of any variable insurance contract that may use the fund as its underlying investment option and would be higher if they did.
Annual fund operating expenses (%) (expenses that you pay each year as a percentage of the valueof your investment) Series I Series II Series NAV
Management fee 0.80 0.80 0.80
Distribution and service (Rule 12b-1) fees 0.05 0.25 0.00
Other expenses 0.08 0.08 0.08
Total annual fund operating expenses 0.93 1.13 0.88
Expense exampleThe examples are intended to help you compare the cost of investing in the fund with the cost of investing in other mutual funds. The examplesassume that $10,000 is invested in the fund for the periods indicated and then all shares are redeemed at the end of those periods. The examples alsoassume that the investment has a 5% return each year and that the fund’s operating expenses remain the same. The expense example does not reflectfees and expenses of any variable insurance contract that may use the fund as its underlying investment option and would be higher if they did.Although your actual costs may be higher or lower, based on these assumptions your costs would be:
Expenses ($) Series I Series II Series NAV
1 year 95 115 90
3 years 296 359 281
5 years 515 622 488
10 years 1,143 1,375 1,084
Portfolio turnoverThe fund pays transaction costs, such as commissions, when it buys and sells securities (or “turns over” its portfolio). A higher portfolio turnover ratemay indicate higher transaction costs. These costs, which are not reflected in annual fund operating expenses or in the example, affect the fund’sperformance. During its most recent fiscal year, the fund’s portfolio turnover rate was 27% of the average value of its portfolio.
Principal investment strategiesUnder normal market conditions, the fund invests primarily in equity securities of companies located outside the U.S., including in emerging markets.The fund may invest in securities of any size company, across the entire market capitalization spectrum, including smaller and midsize companies. Fromtime to time, based on economic conditions, the fund may have significant investments in one or more countries and/or in particular sectors.
Equity securities generally entitle the holder to participate in a company’s general operating results. These include common stocks, preferred stocks,and convertible securities. The fund also invests in American Depositary Receipts (ADRs), European Depositary Receipts (EDRs), and Global DepositaryReceipts (GDRs), which are certificates typically issued by a bank or trust company that give their holders the right to receive securities issued by aforeign or domestic company. The fund may invest in all types of equity-linked notes, which are hybrid derivative-type instruments that are speciallydesigned to combine the characteristics of one or more reference securities (usually a single stock, a stock index or a basket of stocks (underlyingsecurities)) and a related equity derivative, such as a put or call option, in a single note form.
Use of Hedging and Other Strategic Transactions. The fund is authorized to use all of the various investment strategies referred to under “AdditionalInformation About the Funds’ Principal Risks — Hedging, derivatives and other strategic transactions risk” including entering into option transactions.
The subadvisor’s investment philosophy is “bottom-up,” value-oriented, and long-term. In choosing equity investments, the subadvisor will focus onthe market price of a company’s securities relative to its evaluation of the company’s long-term earnings, asset value, and cash flow potential. Acompany’s historical value measure, including price/earnings ratio, profit margins and liquidation value, will also be considered.
Principal risksThe fund is subject to risks, and you could lose money by investing in the fund. The principal risks of investing in the fund include:
Credit and counterparty risk. The counterparty to an over-the-counter derivatives contract or a borrower of fund securities may not make timelypayments or otherwise honor its obligations.
.79

Cybersecurity and operational risk. Cybersecurity breaches may allow an unauthorized party to gain access to fund assets, customer data, orproprietary information, or cause a fund or its service providers to suffer data corruption or lose operational functionality. Similar incidents affectingissuers of a fund’s securities may negatively impact performance. Operational risk may arise from human error, error by third parties, communicationerrors, or technology failures, among other causes.
Economic and market events risk. Events in the U.S. and global financial markets, including actions taken by the U.S. Federal Reserve or foreigncentral banks to stimulate or stabilize economic growth, may at times result in unusually high market volatility, which could negatively impactperformance. Reduced liquidity in credit and fixed-income markets could adversely affect issuers worldwide. Banks and financial services companiescould suffer losses if interest rates rise or economic conditions deteriorate.
Equity securities risk. The price of equity securities may decline due to changes in a company’s financial condition or overall market conditions.Securities the manager believes are undervalued may never realize their full potential value, and in certain markets value stocks may underperform themarket as a whole.
Financial services sector risk. Financial services companies can be significantly affected by economic, market, and business developments, borrowingcosts, interest-rate fluctuations, competition, and government regulation, among other factors.
Fixed-income securities risk. A rise in interest rates typically causes bond prices to fall. The longer the average maturity or duration of the bonds heldby a fund, the more sensitive it will likely be to interest-rate fluctuations. An issuer may not make all interest payments or repay all or any of theprincipal borrowed. Changes in a security’s credit quality may adversely affect fund performance.
Foreign securities risk. Less information may be publicly available regarding foreign issuers. Foreign securities may be subject to foreign taxes andmay be more volatile than U.S. securities. Currency fluctuations and political and economic developments may adversely impact the value of foreignsecurities. The risks of investing in foreign securities are magnified in emerging markets. Depositary receipts are subject to most of the risks associatedwith investing in foreign securities directly because the value of a depositary receipt is dependent upon the market price of the underlying foreignequity security. Depositary receipts are also subject to liquidity risk.
Hedging, derivatives, and other strategic transactions risk. Hedging, derivatives, and other strategic transactions may increase a fund’s volatilityand could produce disproportionate losses, potentially more than the fund’s principal investment. Risks of these transactions are different from andpossibly greater than risks of investing directly in securities and other traditional instruments. Under certain market conditions, derivatives couldbecome harder to value or sell and may become subject to liquidity risk (i.e., the inability to enter into closing transactions). Regulatory changes inderivative markets could impact the cost of or the fund’s ability to engage in derivatives transactions. Derivatives and other strategic transactions thatthe fund intends to utilize include: equity-linked notes (equity-linked notes generally reflect the risks associated with their underlying securities, dependon the credit of the note’s issuer, may be privately placed, and may have a limited secondary market), and options. Options generally are subject tocounterparty risk.
Hybrid instrument risk. Hybrid instruments entail greater market risk and may be more volatile than traditional debt instruments, may bear interestor pay preferred dividends at below-market rates, and may be illiquid. The risks of investing in hybrid instruments are a combination of the risks ofinvesting in securities, options, futures, and currencies.
Large company risk. Larger companies may grow more slowly than smaller companies or be slower to respond to business developments. Large-capitalization securities may underperform the market as a whole.
Liquidity risk. The extent (if at all) to which a security may be sold or a derivative position closed without negatively impacting its market value may beimpaired by reduced market activity or participation, legal restrictions, or other economic and market impediments.
Preferred and convertible securities risk. Preferred stock dividends are payable only if declared by the issuer’s Board. Preferred stock may be subjectto redemption provisions. The market values of convertible securities tend to fall as interest rates rise and rise as interest rates fall. Convertiblepreferred stock’s value can depend heavily upon the underlying common stock’s value.
Sector risk. When a fund focuses its investments in certain sectors of the economy, its performance may be driven largely by sector performance andcould fluctuate more widely than if the fund were invested more evenly across sectors.
Small and mid-sized company risk. Small and mid-sized companies are generally less established and may be more volatile than larger companies.Small and/or mid-capitalization securities may underperform the market as a whole.
Telecommunications sector risk. Telecommunication services companies are subject to government regulation of services and rates of return andcan be significantly affected by intense competition, among other factors.
Value investing style risk. The fund emphasizes a value style of investing, which focuses on undervalued companies with characteristics for improvedvaluations. This style of investing is subject to the risk that the valuations never improve or that the returns on value equity securities are less thanreturns on other styles of investing or the overall stock market. Value stocks also may decline in price, even though in theory they are alreadyunderpriced.
Past performanceThe following information provides some indication of the risks of investing in the fund by showing changes in performance from year to year and byshowing how average annual returns for specified periods compare with those of a broad measure of market performance. The performanceinformation below does not reflect fees and expenses of any variable insurance contract which may use JHVIT as its underlying investment option. Ifsuch fees and expenses had been reflected, performance would be lower. The past performance of the fund is not necessarily an indication of how thefund will perform in the future.
.80

Calendar year total returns for Series I (%)
2008 2009 2010 2011 2012 2013 2014 2015 2016 2017
–42.67 35.77 7.98 –12.85 19.38 26.15 –12.51 –7.81 12.24 17.14
Best quarter: Q3 ‘09, 24.09%
Worst quarter: Q4 ‘08, –21.66%
Average Annual Total Returns for Period Ended 12/31/2017
Average annual total returns (%) 1 Year 5 Year 10 YearDate of
Inception
Series I 17.14 5.99 1.58 05/03/99
Series II 16.88 5.78 1.38 01/28/02
Series NAV 17.25 6.04 1.63 02/28/05
MSCI EAFE Index (reflects no deduction for fees, expenses, or taxes) 25.03 7.90 1.94
Investment managementInvestment Advisor John Hancock Investment Management Services, LLC§
Subadvisor Templeton Investment Counsel, LLC
Portfolio managementTucker Scott, CFALead Portfolio Manager, Executive Vice PresidentManaged fund since 1999
Peter Nori, CFAExecutive Vice President, Portfolio ManagerManaged fund since 2006
Christopher Peel, CFASenior Vice President, Research Analystand Portfolio ManagerManaged fund since 2018
Other important information regarding the fundFor important information about taxes and financial intermediary compensation, please turn to “Additional information about the funds” at page258 of the Prospectus.
.81
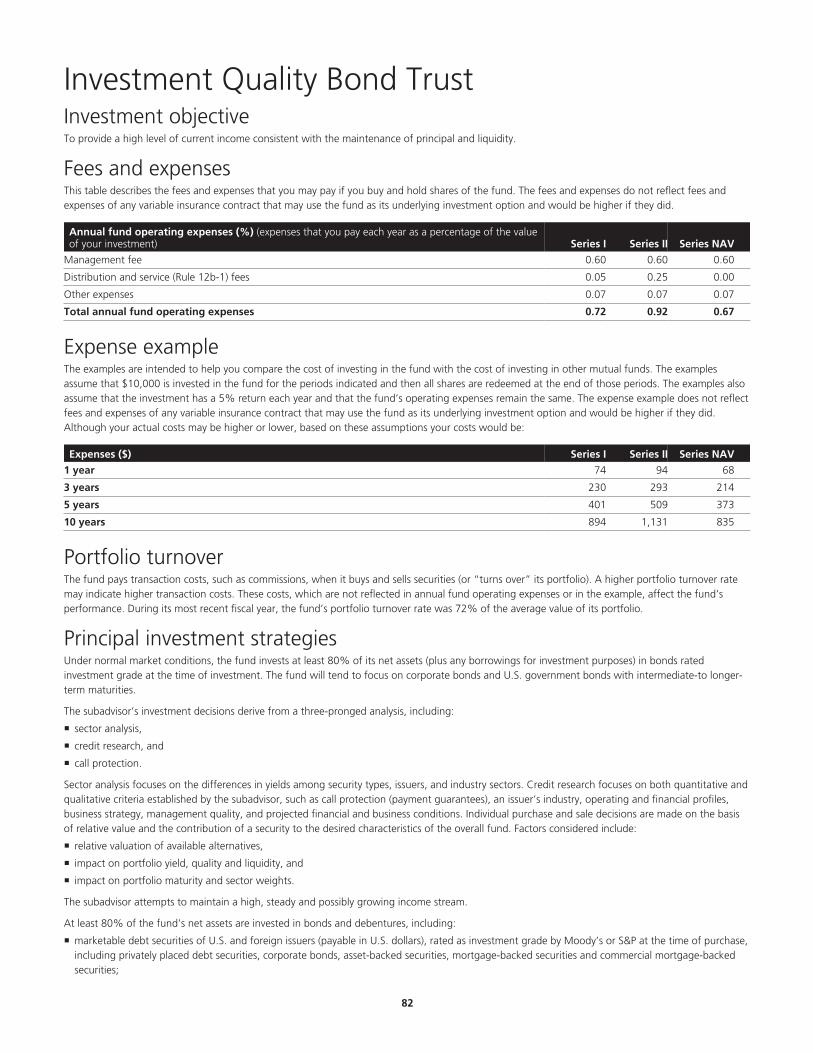
Investment Quality Bond Trust Investment objectiveTo provide a high level of current income consistent with the maintenance of principal and liquidity.
Fees and expensesThis table describes the fees and expenses that you may pay if you buy and hold shares of the fund. The fees and expenses do not reflect fees andexpenses of any variable insurance contract that may use the fund as its underlying investment option and would be higher if they did.
Annual fund operating expenses (%) (expenses that you pay each year as a percentage of the valueof your investment) Series I Series II Series NAV
Management fee 0.60 0.60 0.60
Distribution and service (Rule 12b-1) fees 0.05 0.25 0.00
Other expenses 0.07 0.07 0.07
Total annual fund operating expenses 0.72 0.92 0.67
Expense exampleThe examples are intended to help you compare the cost of investing in the fund with the cost of investing in other mutual funds. The examplesassume that $10,000 is invested in the fund for the periods indicated and then all shares are redeemed at the end of those periods. The examples alsoassume that the investment has a 5% return each year and that the fund’s operating expenses remain the same. The expense example does not reflectfees and expenses of any variable insurance contract that may use the fund as its underlying investment option and would be higher if they did.Although your actual costs may be higher or lower, based on these assumptions your costs would be:
Expenses ($) Series I Series II Series NAV
1 year 74 94 68
3 years 230 293 214
5 years 401 509 373
10 years 894 1,131 835
Portfolio turnoverThe fund pays transaction costs, such as commissions, when it buys and sells securities (or “turns over” its portfolio). A higher portfolio turnover ratemay indicate higher transaction costs. These costs, which are not reflected in annual fund operating expenses or in the example, affect the fund’sperformance. During its most recent fiscal year, the fund’s portfolio turnover rate was 72% of the average value of its portfolio.
Principal investment strategiesUnder normal market conditions, the fund invests at least 80% of its net assets (plus any borrowings for investment purposes) in bonds ratedinvestment grade at the time of investment. The fund will tend to focus on corporate bonds and U.S. government bonds with intermediate-to longer-term maturities.
The subadvisor’s investment decisions derive from a three-pronged analysis, including:
sector analysis,
credit research, and
call protection.
Sector analysis focuses on the differences in yields among security types, issuers, and industry sectors. Credit research focuses on both quantitative andqualitative criteria established by the subadvisor, such as call protection (payment guarantees), an issuer’s industry, operating and financial profiles,business strategy, management quality, and projected financial and business conditions. Individual purchase and sale decisions are made on the basisof relative value and the contribution of a security to the desired characteristics of the overall fund. Factors considered include:
relative valuation of available alternatives,
impact on portfolio yield, quality and liquidity, and
impact on portfolio maturity and sector weights.
The subadvisor attempts to maintain a high, steady and possibly growing income stream.
At least 80% of the fund’s net assets are invested in bonds and debentures, including:
marketable debt securities of U.S. and foreign issuers (payable in U.S. dollars), rated as investment grade by Moody’s or S&P at the time of purchase,including privately placed debt securities, corporate bonds, asset-backed securities, mortgage-backed securities and commercial mortgage-backedsecurities;
.82
securities issued or guaranteed as to principal or interest by the U.S. government or its agencies or instrumentalities, including mortgage-backedsecurities; and
cash and cash equivalent securities which are authorized for purchase by Money Market Trust, a series of the Trust.
The balance (no more than 20%) of the fund’s net assets may be invested in below-investment-grade bonds and other securities including privatelyplaced debt securities:
U.S. and foreign debt securities,
preferred stocks,
convertible securities (including those issued in the Euromarket),
securities carrying warrants to purchase equity securities,
foreign exchange contracts for purposes of hedging portfolio exposures to foreign currencies or for purposes of obtaining exposure to foreigncurrencies,
hybrid securities, and
below-investment-grade and investment-grade foreign currency fixed-income securities, including up to 5% emerging market fixed-incomesecurities.
In pursuing its investment objective, the fund may invest up to 20% of its net assets in U.S. and foreign high yield (high risk) corporate andgovernment debt securities (commonly known as “junk bonds”). These instruments are rated “Ba” or below by Moody’s or “BB” or below by S&P (or,if unrated, are deemed of comparable quality as determined by the subadvisor). No minimum rating standard is required for a purchase of high yieldsecurities by the fund. While the fund may only invest up to 20% of its net assets in securities rated in these rating categories, it is not required todispose of bonds that may be downgraded after purchase, even though such downgrade may cause the fund to hold more than 20% of its net assetsin high yield securities. The fund’s investment policies are based on credit ratings at the time of purchase.
The fund normally maintains an average portfolio duration of between three and seven years. However, the fund may invest in individual securities ofany duration. Duration is an approximate measure of the sensitivity of the market value of a security to changes in interest rates.
The fund may invest in derivatives such as interest rate futures and options, interest rate swaps, currency forwards, options on financial indices andcredit default swaps to manage duration and yield curve positioning, implement foreign interest rate and currency positions, hedge against risk and/oras a substitute for investing directly in a security.
The fund may make short sales of a security including short sales “against the box.”
Principal risksThe fund is subject to risks, and you could lose money by investing in the fund. The principal risks of investing in the fund include:
Changing distribution levels risk. The fund may cease or reduce the level of its distribution or make a greater return of capital if income ordividends paid from its investments declines.
Credit and counterparty risk. The issuer or guarantor of a fixed-income security, the counterparty to an over-the-counter derivatives contract, or aborrower of fund securities may not make timely payments or otherwise honor its obligations. U.S. government securities are subject to varyingdegrees of credit risk depending upon the nature of their support. A downgrade or default affecting any of the fund’s securities could affect the fund’sperformance.
Cybersecurity and operational risk. Cybersecurity breaches may allow an unauthorized party to gain access to fund assets, customer data, orproprietary information, or cause a fund or its service providers to suffer data corruption or lose operational functionality. Similar incidents affectingissuers of a fund’s securities may negatively impact performance. Operational risk may arise from human error, error by third parties, communicationerrors, or technology failures, among other causes.
Economic and market events risk. Events in the U.S. and global financial markets, including actions taken by the U.S. Federal Reserve or foreigncentral banks to stimulate or stabilize economic growth, may at times result in unusually high market volatility, which could negatively impactperformance. Reduced liquidity in credit and fixed-income markets could adversely affect issuers worldwide. Banks and financial services companiescould suffer losses if interest rates rise or economic conditions deteriorate.
Equity securities risk. The price of equity securities may decline due to changes in a company’s financial condition or overall market conditions.
Fixed-income securities risk. A rise in interest rates typically causes bond prices to fall. The longer the average maturity or duration of the bonds heldby a fund, the more sensitive it will likely be to interest-rate fluctuations. An issuer may not make all interest payments or repay all or any of theprincipal borrowed. Changes in a security’s credit quality may adversely affect fund performance.
Foreign securities risk. Less information may be publicly available regarding foreign issuers. Foreign securities may be subject to foreign taxes andmay be more volatile than U.S. securities. Currency fluctuations and political and economic developments may adversely impact the value of foreignsecurities. The risks of investing in foreign securities are magnified in emerging markets.
Hedging, derivatives, and other strategic transactions risk. Hedging, derivatives, and other strategic transactions may increase a fund’s volatilityand could produce disproportionate losses, potentially more than the fund’s principal investment. Risks of these transactions are different from andpossibly greater than risks of investing directly in securities and other traditional instruments. Under certain market conditions, derivatives couldbecome harder to value or sell and may become subject to liquidity risk (i.e., the inability to enter into closing transactions). Regulatory changes inderivative markets could impact the cost of or the fund’s ability to engage in derivative transactions. Derivatives and other strategic transactions that
.83
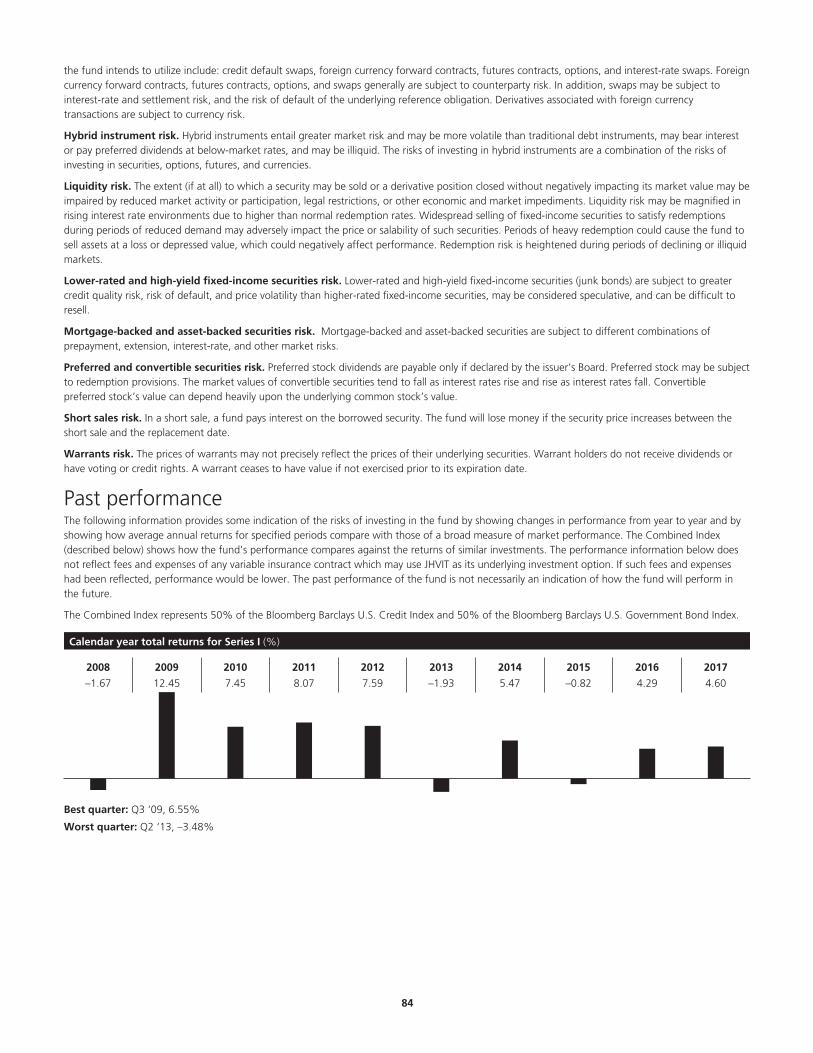
the fund intends to utilize include: credit default swaps, foreign currency forward contracts, futures contracts, options, and interest-rate swaps. Foreigncurrency forward contracts, futures contracts, options, and swaps generally are subject to counterparty risk. In addition, swaps may be subject tointerest-rate and settlement risk, and the risk of default of the underlying reference obligation. Derivatives associated with foreign currencytransactions are subject to currency risk.
Hybrid instrument risk. Hybrid instruments entail greater market risk and may be more volatile than traditional debt instruments, may bear interestor pay preferred dividends at below-market rates, and may be illiquid. The risks of investing in hybrid instruments are a combination of the risks ofinvesting in securities, options, futures, and currencies.
Liquidity risk. The extent (if at all) to which a security may be sold or a derivative position closed without negatively impacting its market value may beimpaired by reduced market activity or participation, legal restrictions, or other economic and market impediments. Liquidity risk may be magnified inrising interest rate environments due to higher than normal redemption rates. Widespread selling of fixed-income securities to satisfy redemptionsduring periods of reduced demand may adversely impact the price or salability of such securities. Periods of heavy redemption could cause the fund tosell assets at a loss or depressed value, which could negatively affect performance. Redemption risk is heightened during periods of declining or illiquidmarkets.
Lower-rated and high-yield fixed-income securities risk. Lower-rated and high-yield fixed-income securities (junk bonds) are subject to greatercredit quality risk, risk of default, and price volatility than higher-rated fixed-income securities, may be considered speculative, and can be difficult toresell.
Mortgage-backed and asset-backed securities risk. Mortgage-backed and asset-backed securities are subject to different combinations ofprepayment, extension, interest-rate, and other market risks.
Preferred and convertible securities risk. Preferred stock dividends are payable only if declared by the issuer’s Board. Preferred stock may be subjectto redemption provisions. The market values of convertible securities tend to fall as interest rates rise and rise as interest rates fall. Convertiblepreferred stock’s value can depend heavily upon the underlying common stock’s value.
Short sales risk. In a short sale, a fund pays interest on the borrowed security. The fund will lose money if the security price increases between theshort sale and the replacement date.
Warrants risk. The prices of warrants may not precisely reflect the prices of their underlying securities. Warrant holders do not receive dividends orhave voting or credit rights. A warrant ceases to have value if not exercised prior to its expiration date.
Past performanceThe following information provides some indication of the risks of investing in the fund by showing changes in performance from year to year and byshowing how average annual returns for specified periods compare with those of a broad measure of market performance. The Combined Index(described below) shows how the fund’s performance compares against the returns of similar investments. The performance information below doesnot reflect fees and expenses of any variable insurance contract which may use JHVIT as its underlying investment option. If such fees and expenseshad been reflected, performance would be lower. The past performance of the fund is not necessarily an indication of how the fund will perform inthe future.
The Combined Index represents 50% of the Bloomberg Barclays U.S. Credit Index and 50% of the Bloomberg Barclays U.S. Government Bond Index.
Calendar year total returns for Series I (%)
2008 2009 2010 2011 2012 2013 2014 2015 2016 2017
–1.67 12.45 7.45 8.07 7.59 –1.93 5.47 –0.82 4.29 4.60
Best quarter: Q3 ‘09, 6.55%
Worst quarter: Q2 ‘13, –3.48%
.84
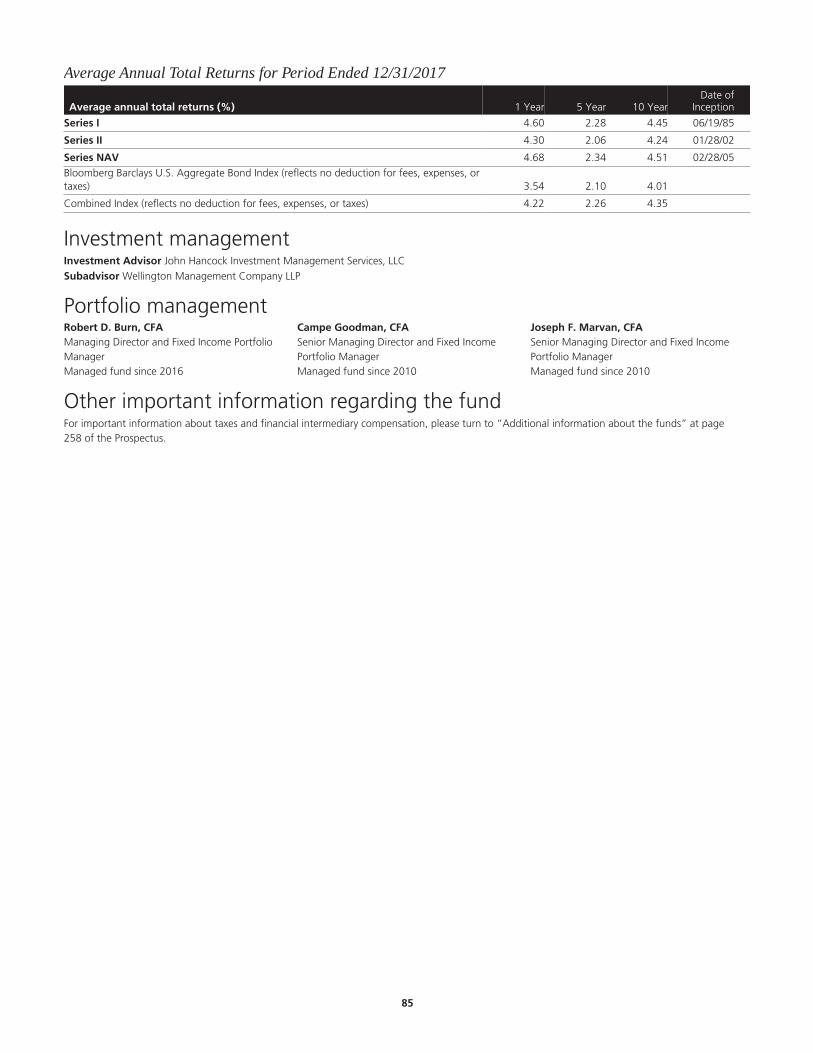
Average Annual Total Returns for Period Ended 12/31/2017
Average annual total returns (%) 1 Year 5 Year 10 YearDate of
Inception
Series I 4.60 2.28 4.45 06/19/85
Series II 4.30 2.06 4.24 01/28/02
Series NAV 4.68 2.34 4.51 02/28/05Bloomberg Barclays U.S. Aggregate Bond Index (reflects no deduction for fees, expenses, ortaxes) 3.54 2.10 4.01
Combined Index (reflects no deduction for fees, expenses, or taxes) 4.22 2.26 4.35
Investment managementInvestment Advisor John Hancock Investment Management Services, LLC§
Subadvisor Wellington Management Company LLP
Portfolio managementRobert D. Burn, CFAManaging Director and Fixed Income PortfolioManagerManaged fund since 2016
Campe Goodman, CFASenior Managing Director and Fixed IncomePortfolio ManagerManaged fund since 2010
Joseph F. Marvan, CFASenior Managing Director and Fixed IncomePortfolio ManagerManaged fund since 2010
Other important information regarding the fundFor important information about taxes and financial intermediary compensation, please turn to “Additional information about the funds” at page258 of the Prospectus.
.85

Lifecycle 2010 Trust Investment objectiveTo seek high total return until the fund’s target retirement date.
Fees and expensesThis table describes the fees and expenses that you may pay if you buy and hold shares of the fund. The fees and expenses do not reflect fees andexpenses of any variable insurance contract that may use the fund as its underlying investment option and would be higher if they did.
Annual fund operating expenses (%) (expenses that you pay each year as a percentage of the valueof your investment) Series I1 Series II1 Series NAV1
Management fee 0.06 0.06 0.06
Distribution and service (Rule 12b-1) fees 0.05 0.25 0.00
Other expenses 0.09 0.09 0.09
Acquired fund fees and expenses2 0.73 0.73 0.73
Total annual fund operating expenses 0.93 1.13 0.88
1 For funds and classes that have not commenced operations or have an inception date of less than six months as of December 31, 2017, expenses are estimated.2 The “Total annual fund operating expenses” shown may not correlate to the fund’s ratios of expenses to average daily net assets shown in the “Financial highlights” section of
the fund’s prospectus, which does not include “Acquired fund fees and expenses.”
Expense exampleThe examples are intended to help you compare the cost of investing in the fund with the cost of investing in other mutual funds. The examplesassume that $10,000 is invested in the fund for the periods indicated and then all shares are redeemed at the end of those periods. The examples alsoassume that the investment has a 5% return each year and that the fund’s operating expenses remain the same. The expense example does not reflectfees and expenses of any variable insurance contract that may use the fund as its underlying investment option and would be higher if they did.Although your actual costs may be higher or lower, based on these assumptions your costs would be:
Expenses ($) Series I Series II Series NAV
1 year 95 115 90
3 years 296 359 281
Portfolio turnoverThe fund, which operates as a fund of funds and invests in underlying funds, does not pay transaction costs, such as commissions, when it buys andsells shares of underlying funds (or “turns over” its portfolio). An underlying fund does pay transaction costs when it turns over its portfolio, and ahigher portfolio turnover rate may indicate higher transaction costs. These costs, which are not reflected in annual fund operating expenses or in theexample, affect the performance of the underlying funds and of the fund. Because the fund had not commenced operations as of the date of thisprospectus, there is no portfolio turnover to report.
Principal investment strategiesUnder normal market conditions, the fund invests substantially all of its assets in underlying funds using an asset allocation strategy designed forinvestors expected to retire around the year 2010. Over time, the asset allocation strategy will change according to a predetermined glide path as setforth below.
After December 31st of the designated retirement year of the fund, the fund will, under normal market conditions, continue to invest its assets inaccordance with the predetermined “glide path” set forth below although the subadvisors may at times determine in light of prevailing market oreconomic conditions that the fund’s asset allocations should vary from those indicated by the “glide path” in order to preserve the fund’s assets or tohelp it achieve its objective.
Within the prescribed percentage allocation, the subadvisors select the percentage level to be maintained in specific underlying funds. The subadvisorsmay, from time to time, change the allocation in specific underlying funds or rebalance the underlying funds. To maintain target allocation in theunderlying funds, daily cash flows for the fund will be directed to its underlying funds that most deviate from target.
The allocations reflected in the glide path are also referred to as “neutral” allocations because they do not reflect active decisions made by thesubadvisors to produce an overweight or an underweight position in a particular asset class based on the subadvisors’ market outlook. The fund has atarget allocation for the broad asset classes of equities and fixed income but may invest outside these target allocations to protect the fund or help itachieve its objective.
The investment performance of the fund will reflect both its subadvisors’ allocation decisions with respect to underlying funds and investments and theinvestment decisions made by the underlying funds’ subadvisors.
.86

In addition to investing in exchange-traded funds (ETFs), the fund may also invest in the securities of other investment companies and may make directinvestments in other types of investments, such as equity and fixed-income securities, including U.S. government securities, closed-end funds andpartnerships. See “Other Permitted Investments by the Funds of Funds.” The fund may also engage in short selling of securities.
The fund may invest in various underlying funds that as a group hold a wide range of equity-type securities in their portfolios. These include small-,mid- and large-capitalization stocks, domestic and foreign securities (including emerging market securities) and sector holdings such as utilities, scienceand technology stocks. Each of the underlying funds has its own investment strategy that, for example, may focus on growth stocks or value stocks ormay employ a strategy combining growth and income stocks and/or may invest in derivatives such as options on securities and futures contracts.Certain of the underlying funds focus their investment strategy on fixed income securities, which may include investment grade and below-investment-grade debt securities with maturities that range from short to longer term. The fixed-income underlying funds collectively hold various types of debtinstruments such as corporate bonds and mortgage-backed, government issued, domestic and international securities.
The fund bears its own expenses and, in addition, indirectly bears its proportionate share of the expenses of the underlying funds in which it invests.
Use of Hedging and Other Strategic Transactions. The fund is authorized to use all of the various investment strategies referred to under “AdditionalInformation About the Funds’ Principal Risks — Hedging, derivatives and other strategic transactions risk” including, without limitation, investing incredit default swaps, foreign currency forward contracts, futures contracts, interest rate swaps and options.
Fixed-income allocation
Equity allocation
Perc
ent
Equ
ity
(%)
40 35 30 25 20 15 10 5 5 10 15 20 25 30
Years to retirement Years after retirement
Retirement date
>>
>
0
10
20
30
40
50
60
70
80
90
100
Fund Combination after Designated Retirement Date
The Board of Trustees may, in its discretion, determine to combine the fund with another fund if the target allocation of the fund matches the targetallocation of the other fund. In such event, the fund’s shareholders will become shareholders of the other fund. To the extent permitted by applicableregulatory requirements, such a combination would be implemented without seeking the approval of shareholders. There is no assurance that theBoard of Trustees at any point will determine to implement such a combination.
Principal risks of investing in the fund of fundsThe fund of funds is subject to risks, and you could lose money by investing in the fund. The principal risks of investing in the fund of funds include:
Commodity risk. Commodity prices may be volatile due to fluctuating demand, supply disruption, speculation, and other factors. Certain commodityinvestments may have no active trading market at times.
Credit and counterparty risk. The issuer or guarantor of a fixed-income security, the counterparty to an over-the-counter derivatives contract, or aborrower of fund securities may not make timely payments or otherwise honor its obligations. U.S. government securities are subject to varyingdegrees of credit risk depending upon the nature of their support. A downgrade or default affecting any of the fund’s securities could affect the fund’sperformance.
Cybersecurity and operational risk. Cybersecurity breaches may allow an unauthorized party to gain access to fund assets, customer data, orproprietary information, or cause a fund or its service providers to suffer data corruption or lose operational functionality. Similar incidents affectingissuers of a fund’s securities may negatively impact performance. Operational risk may arise from human error, error by third parties, communicationerrors, or technology failures, among other causes.
Economic and market events risk. Events in the U.S. and global financial markets, including actions taken by the U.S. Federal Reserve or foreigncentral banks to stimulate or stabilize economic growth, may at times result in unusually high market volatility, which could negatively impactperformance. Reduced liquidity in credit and fixed-income markets could adversely affect issuers worldwide. Banks and financial services companiescould suffer losses if interest rates rise or economic conditions deteriorate.
Equity securities risk. The price of equity securities may decline due to changes in a company’s financial condition or overall market conditions.
Exchange-traded funds risk. An ETF generally reflects the risks of the underlying securities it is designed to track. A fund bears ETF fees and expensesindirectly.
.87

Exchange-traded notes risk. An ETN generally reflects the risks associated with the assets composing the underlying market benchmark or strategy itis designed to track. ETNs also are subject to issuer and fixed-income risks.
Fixed-income securities risk. A rise in interest rates typically causes bond prices to fall. The longer the average maturity or duration of the bonds heldby a fund, the more sensitive it will likely be to interest-rate fluctuations. An issuer may not make all interest payments or repay all or any of theprincipal borrowed. Changes in a security’s credit quality may adversely affect fund performance.
Fund of funds risk. The fund’s ability to achieve its investment objective will depend largely, in part, on: (i) the underlying funds’ performance,expenses and ability to meet their investment objectives; and (ii) properly rebalancing assets among underlying funds and different asset classes. Thefund is also subject to risks related to: (i) layering of fees of the underlying funds; and (ii) conflicts of interest associated with the subadvisor’s ability toallocate fund assets without limit to other funds it advises and/or other funds advised by affiliated subadvisors. There is no assurance that either thefund or the underlying funds will achieve their investment objectives. A fund bears underlying fund fees and expenses indirectly.
Hedging, derivatives, and other strategic transactions risk. Hedging, derivatives, and other strategic transactions may increase a fund’s volatilityand could produce disproportionate losses, potentially more than the fund’s principal investment. Risks of these transactions are different from andpossibly greater than risks of investing directly in securities and other traditional instruments. Under certain market conditions, derivatives couldbecome harder to value or sell and may become subject to liquidity risk (i.e., the inability to enter into closing transactions). Regulatory changes inderivative markets could impact the cost of or the fund’s ability to engage in derivative transactions. Derivatives and other strategic transactions thatthe fund intends to utilize include: foreign currency forward contracts, futures contracts, options, credit default swaps, and interest-rate swaps. Foreigncurrency forward contracts, futures contracts, options, and swaps generally are subject to counterparty risk. In addition, swaps may be subject tointerest-rate and settlement risk, and the risk of default of the underlying reference obligation. Derivatives associated with foreign currencytransactions are subject to currency risk.
Investment company securities risk. A fund bears underlying fund fees and expenses indirectly.
Lifecycle risk. Managers might not correctly predict market or economic conditions, and you could lose money even close to, during, or after thefund’s designated retirement year.
Liquidity risk. The extent (if at all) to which a security may be sold or a derivative position closed without negatively impacting its market value may beimpaired by reduced market activity or participation, legal restrictions, or other economic and market impediments. Liquidity risk may be magnified inrising interest rate environments due to higher than normal redemption rates. Widespread selling of fixed-income securities to satisfy redemptionsduring periods of reduced demand may adversely impact the price or salability of such securities. Periods of heavy redemption could cause the fund tosell assets at a loss or depressed value, which could negatively affect performance. Redemption risk is heightened during periods of declining or illiquidmarkets.
Short sales risk. In a short sale, a fund pays interest on the borrowed security. The fund will lose money if the security price increases between theshort sale and the replacement date.
Target allocation risk. The fund’s risk profile will change due to reallocation or rebalancing of portfolio assets as the fund approaches its target date.
Principal risks of investing in the underlying fundsThe principal risks of investing in the Underlying Funds include:
Convertible securities risk. The market values of convertible securities tend to fall as interest rates rise and rise as interest rates fall. As the marketprice of underlying common stock declines below the conversion price, the market value of the convertible security tends to be increasingly influencedby its yield.
Credit and counterparty risk. The issuer or guarantor of a fixed-income security, the counterparty to an over-the-counter derivatives contract, or aborrower of fund securities may not make timely payments or otherwise honor its obligations. U.S. government securities are subject to varyingdegrees of credit risk depending upon the nature of their support. A downgrade or default affecting any of the fund’s securities could affect the fund’sperformance.
Currency risk. Fluctuations in exchange rates may adversely affect the U.S. dollar value of a fund’s investments. Foreign currencies may decline invalue, which could negatively impact performance.
Cybersecurity and operational risk. Cybersecurity breaches may allow an unauthorized party to gain access to fund assets, customer data, orproprietary information, or cause a fund or its service providers to suffer data corruption or lose operational functionality. Similar incidents affectingissuers of a fund’s securities may negatively impact performance. Operational risk may arise from human error, error by third parties, communicationerrors, or technology failures, among other causes.
Economic and market events risk. Events in the U.S. and global financial markets, including actions taken by the U.S. Federal Reserve or foreigncentral banks to stimulate or stabilize economic growth, may at times result in unusually high market volatility, which could negatively impactperformance. Reduced liquidity in credit and fixed-income markets could adversely affect issuers worldwide. Banks and financial services companiescould suffer losses if interest rates rise or economic conditions deteriorate.
Equity securities risk. The price of equity securities may decline due to changes in a company’s financial condition or overall market conditions.Growth company securities may fluctuate more in price than other securities because of the greater emphasis on earnings expectations. Securities themanager believes are undervalued may never realize their full potential value, and in certain markets value stocks may underperform the market as awhole.
.88

Fixed-income securities risk. A rise in interest rates typically causes bond prices to fall. The longer the average maturity or duration of the bonds heldby a fund, the more sensitive it will likely be to interest-rate fluctuations. An issuer may not make all interest payments or repay all or any of theprincipal borrowed. Changes in a security’s credit quality may adversely affect fund performance.
Foreign securities risk. Less information may be publicly available regarding foreign issuers. Foreign securities may be subject to foreign taxes andmay be more volatile than U.S. securities. Currency fluctuations and political and economic developments may adversely impact the value of foreignsecurities. The risks of investing in foreign securities are magnified in emerging markets.
Hedging, derivatives, and other strategic transactions risk. Hedging, derivatives, and other strategic transactions may increase a fund’s volatilityand could produce disproportionate losses, potentially more than the fund’s principal investment. Risks of these transactions are different from andpossibly greater than risks of investing directly in securities and other traditional instruments. Under certain market conditions, derivatives couldbecome harder to value or sell and may become subject to liquidity risk (i.e., the inability to enter into closing transactions). Regulatory changes inderivative markets could impact the cost of or the fund’s ability to engage in derivative transactions. Derivatives and other strategic transactions thatthe fund intends to utilize include: foreign currency forward contracts, futures contracts, options, credit default swaps, and interest-rate swaps. Foreigncurrency forward contracts, futures contracts, options, and swaps generally are subject to counterparty risk. In addition, swaps may be subject tointerest-rate and settlement risk, and the risk of default of the underlying reference obligation. Derivatives associated with foreign currencytransactions are subject to currency risk.
Initial public offerings risk. IPO share prices are frequently volatile and may significantly impact fund performance.
Large company risk. Larger companies may grow more slowly than smaller companies or be slower to respond to business developments. Large-capitalization securities may underperform the market as a whole.
Liquidity risk. The extent (if at all) to which a security may be sold or a derivative position closed without negatively impacting its market value may beimpaired by reduced market activity or participation, legal restrictions, or other economic and market impediments. Liquidity risk may be magnified inrising interest rate environments due to higher than normal redemption rates. Widespread selling of fixed-income securities to satisfy redemptionsduring periods of reduced demand may adversely impact the price or salability of such securities. Periods of heavy redemption could cause the fund tosell assets at a loss or depressed value, which could negatively affect performance. Redemption risk is heightened during periods of declining or illiquidmarkets.
Lower-rated and high-yield fixed-income securities risk. Lower-rated and high-yield fixed-income securities (junk bonds) are subject to greatercredit quality risk, risk of default, and price volatility than higher-rated fixed-income securities, may be considered speculative, and can be difficult toresell.
Mortgage-backed and asset-backed securities risk. Mortgage-backed and asset-backed securities are subject to different combinations ofprepayment, extension, interest-rate, and other market risks.
Sector risk. When a fund focuses its investments in certain sectors of the economy, its performance may be driven largely by sector performance andcould fluctuate more widely than if the fund were invested more evenly across sectors.
Short sales risk. In a short sale, a fund pays interest on the borrowed security. The fund will lose money if the security price increases between theshort sale and the replacement date.
Small and mid-sized company risk. Small and mid-sized companies are generally less established and may be more volatile than larger companies.Small and/or mid-capitalization securities may underperform the market as a whole.
Past performanceThis section normally shows how the fund’s total returns have varied from year to year, along with a broad-based market index for reference. Becausethe fund has not commenced operations as of the date of this Prospectus, there is no past performance to report.
Investment managementInvestment Advisor John Hancock Investment Management Services, LLC§
Subadvisor John Hancock Asset Management a division of Manulife Asset Management (US) LLC§
Subadvisor John Hancock Asset Management a division of Manulife Asset Management (North America) Limited
Portfolio managementRobert BoydaHead of Capital Markets and Strategy and Co-Head of Portfolio Solutions Group, John HancockAsset Management a division of Manulife AssetManagement (US) LLCManaged fund since inception
Robert Sykes, CFAManaging Director, Portfolio Manager ofPortfolio Solutions Group,John Hancock Asset Management a division ofManulife Asset Management (US) LLCManaged fund since 2018
Nathan Thooft, CFASenior Managing Director, Senior PortfolioManager, Co-Head of Portfolio SolutionsGroup, John Hancock Asset Management adivision of Manulife Asset Management (US)LLCManaged fund since inception
.89

Other important information regarding the fundFor important information about taxes and financial intermediary compensation, please turn to “Additional information about the funds” at page258 of the Prospectus.
.90

Lifecycle 2015 Trust Investment objectiveTo seek high total return until the fund’s target retirement date.
Fees and expensesThis table describes the fees and expenses that you may pay if you buy and hold shares of the fund. The fees and expenses do not reflect fees andexpenses of any variable insurance contract that may use the fund as its underlying investment option and would be higher if they did.
Annual fund operating expenses (%) (expenses that you pay each year as a percentage of the valueof your investment) Series I1 Series II1 Series NAV1
Management fee 0.06 0.06 0.06
Distribution and service (Rule 12b-1) fees 0.05 0.25 0.00
Other expenses 0.09 0.09 0.09
Acquired fund fees and expenses2 0.74 0.74 0.74
Total annual fund operating expenses 0.94 1.14 0.89
1 For funds and classes that have not commenced operations or have an inception date of less than six months as of December 31, 2017, expenses are estimated.2 The “Total annual fund operating expenses” shown may not correlate to the fund’s ratios of expenses to average daily net assets shown in the “Financial highlights” section of
the fund’s prospectus, which does not include “Acquired fund fees and expenses.”
Expense exampleThe examples are intended to help you compare the cost of investing in the fund with the cost of investing in other mutual funds. The examplesassume that $10,000 is invested in the fund for the periods indicated and then all shares are redeemed at the end of those periods. The examples alsoassume that the investment has a 5% return each year and that the fund’s operating expenses remain the same. The expense example does not reflectfees and expenses of any variable insurance contract that may use the fund as its underlying investment option and would be higher if they did.Although your actual costs may be higher or lower, based on these assumptions your costs would be:
Expenses ($) Series I Series II Series NAV
1 year 96 116 91
3 years 300 362 284
Portfolio turnoverThe fund, which operates as a fund of funds and invests in underlying funds, does not pay transaction costs, such as commissions, when it buys andsells shares of underlying funds (or “turns over” its portfolio). An underlying fund does pay transaction costs when it turns over its portfolio, and ahigher portfolio turnover rate may indicate higher transaction costs. These costs, which are not reflected in annual fund operating expenses or in theexample, affect the performance of the underlying funds and of the fund. Because the fund had not commenced operations as of the date of thisprospectus, there is no portfolio turnover to report.
Principal investment strategiesUnder normal market conditions, the fund invests substantially all of its assets in underlying funds using an asset allocation strategy designed forinvestors expected to retire around the year 2015. Over time, the asset allocation strategy will change according to a predetermined glide path as setforth below.
After December 31st of the designated retirement year of the fund, the fund will, under normal market conditions, continue to invest its assets inaccordance with the predetermined “glide path” set forth below although the subadvisors may at times determine in light of prevailing market oreconomic conditions that the fund’s asset allocations should vary from those indicated by the “glide path” in order to preserve the fund’s assets or tohelp it achieve its objective.
Within the prescribed percentage allocation, the subadvisors select the percentage level to be maintained in specific underlying funds. The subadvisorsmay, from time to time, change the allocation in specific underlying funds or rebalance the underlying funds. To maintain target allocation in theunderlying funds, daily cash flows for the fund will be directed to its underlying funds that most deviate from target.
The allocations reflected in the glide path are also referred to as “neutral” allocations because they do not reflect active decisions made by thesubadvisors to produce an overweight or an underweight position in a particular asset class based on the subadvisors’ market outlook. The fund has atarget allocation for the broad asset classes of equities and fixed income but may invest outside these target allocations to protect the fund or help itachieve its objective.
The investment performance of the fund will reflect both its subadvisors’ allocation decisions with respect to underlying funds and investments and theinvestment decisions made by the underlying funds’ subadvisors.
.91

In addition to investing in exchange-traded funds (ETFs), the fund may also invest in the securities of other investment companies and may make directinvestments in other types of investments, such as equity and fixed-income securities, including U.S. government securities, closed-end funds andpartnerships. See “Other Permitted Investments by the Funds of Funds.” The fund may also engage in short selling of securities.
The fund may invest in various underlying funds that as a group hold a wide range of equity type securities in their portfolios. These include small-,mid- and large-capitalization stocks, domestic and foreign securities (including emerging market securities) and sector holdings such as utilities, scienceand technology stocks. Each of the underlying funds has its own investment strategy that, for example, may focus on growth stocks or value stocks ormay employ a strategy combining growth and income stocks and/or may invest in derivatives such as options on securities and futures contracts.Certain of the underlying funds focus their investment strategy on fixed income securities, which may include investment grade and below investmentgrade debt securities with maturities that range from short to longer term. The fixed income underlying funds collectively hold various types of debtinstruments such as corporate bonds and mortgage-backed, government issued, domestic and international securities.
The fund bears its own expenses and, in addition, indirectly bears its proportionate share of the expenses of the underlying funds in which it invests.
Use of Hedging and Other Strategic Transactions. The fund is authorized to use all of the various investment strategies referred to under “AdditionalInformation About the Funds’ Principal Risks — Hedging, derivatives and other strategic transactions risk” including, without limitation, investing incredit default swaps, foreign currency forward contracts, futures contracts, interest rate swaps and options.
Fixed-income allocation
Equity allocation
Perc
ent
Equ
ity
(%)
40 35 30 25 20 15 10 5 5 10 15 20 25 30
Years to retirement Years after retirement
Retirement date
>>
>
0
10
20
30
40
50
60
70
80
90
100
Fund Combination after Designated Retirement Date
The Board of Trustees may, in its discretion, determine to combine the fund with another fund if the target allocation of the fund matches the targetallocation of the other fund. In such event, the fund’s shareholders will become shareholders of the other fund. To the extent permitted by applicableregulatory requirements, such a combination would be implemented without seeking the approval of shareholders. There is no assurance that theBoard of Trustees at any point will determine to implement such a combination.
Principal risks of investing in the fund of fundsThe fund of funds is subject to risks, and you could lose money by investing in the fund. The principal risks of investing in the fund of funds include:
Commodity risk. Commodity prices may be volatile due to fluctuating demand, supply disruption, speculation, and other factors. Certain commodityinvestments may have no active trading market at times.
Credit and counterparty risk. The issuer or guarantor of a fixed-income security, the counterparty to an over-the-counter derivatives contract, or aborrower of fund securities may not make timely payments or otherwise honor its obligations. U.S. government securities are subject to varyingdegrees of credit risk depending upon the nature of their support. A downgrade or default affecting any of the fund’s securities could affect the fund’sperformance.
Cybersecurity and operational risk. Cybersecurity breaches may allow an unauthorized party to gain access to fund assets, customer data, orproprietary information, or cause a fund or its service providers to suffer data corruption or lose operational functionality. Similar incidents affectingissuers of a fund’s securities may negatively impact performance. Operational risk may arise from human error, error by third parties, communicationerrors, or technology failures, among other causes.
Economic and market events risk. Events in the U.S. and global financial markets, including actions taken by the U.S. Federal Reserve or foreigncentral banks to stimulate or stabilize economic growth, may at times result in unusually high market volatility, which could negatively impactperformance. Reduced liquidity in credit and fixed-income markets could adversely affect issuers worldwide. Banks and financial services companiescould suffer losses if interest rates rise or economic conditions deteriorate.
Equity securities risk. The price of equity securities may decline due to changes in a company’s financial condition or overall market conditions.
Exchange-traded funds risk. An ETF generally reflects the risks of the underlying securities it is designed to track. A fund bears ETF fees and expensesindirectly.
.92

Exchange-traded notes risk. An ETN generally reflects the risks associated with the assets composing the underlying market benchmark or strategy itis designed to track. ETNs also are subject to issuer and fixed-income risks.
Fixed-income securities risk. A rise in interest rates typically causes bond prices to fall. The longer the average maturity or duration of the bonds heldby a fund, the more sensitive it will likely be to interest-rate fluctuations. An issuer may not make all interest payments or repay all or any of theprincipal borrowed. Changes in a security’s credit quality may adversely affect fund performance.
Fund of funds risk. The fund’s ability to achieve its investment objective will depend largely, in part, on: (i) the underlying funds’ performance,expenses and ability to meet their investment objectives; and (ii) properly rebalancing assets among underlying funds and different asset classes. Thefund is also subject to risks related to: (i) layering of fees of the underlying funds; and (ii) conflicts of interest associated with the subadvisor’s ability toallocate fund assets without limit to other funds it advises and/or other funds advised by affiliated subadvisors. There is no assurance that either thefund or the underlying funds will achieve their investment objectives. A fund bears underlying fund fees and expenses indirectly.
Hedging, derivatives, and other strategic transactions risk. Hedging, derivatives, and other strategic transactions may increase a fund’s volatilityand could produce disproportionate losses, potentially more than the fund’s principal investment. Risks of these transactions are different from andpossibly greater than risks of investing directly in securities and other traditional instruments. Under certain market conditions, derivatives couldbecome harder to value or sell and may become subject to liquidity risk (i.e., the inability to enter into closing transactions). Regulatory changes inderivative markets could impact the cost of or the fund’s ability to engage in derivative transactions. Derivatives and other strategic transactions thatthe fund intends to utilize include: foreign currency forward contracts, futures contracts, options, credit default swaps, and interest-rate swaps. Foreigncurrency forward contracts, futures contracts, options, and swaps generally are subject to counterparty risk. In addition, swaps may be subject tointerest-rate and settlement risk, and the risk of default of the underlying reference obligation. Derivatives associated with foreign currencytransactions are subject to currency risk.
Investment company securities risk. A fund bears underlying fund fees and expenses indirectly.
Lifecycle risk. Managers might not correctly predict market or economic conditions, and you could lose money even close to, during, or after thefund’s designated retirement year.
Liquidity risk. The extent (if at all) to which a security may be sold or a derivative position closed without negatively impacting its market value may beimpaired by reduced market activity or participation, legal restrictions, or other economic and market impediments. Liquidity risk may be magnified inrising interest rate environments due to higher than normal redemption rates. Widespread selling of fixed-income securities to satisfy redemptionsduring periods of reduced demand may adversely impact the price or salability of such securities. Periods of heavy redemption could cause the fund tosell assets at a loss or depressed value, which could negatively affect performance. Redemption risk is heightened during periods of declining or illiquidmarkets.
Short sales risk. In a short sale, a fund pays interest on the borrowed security. The fund will lose money if the security price increases between theshort sale and the replacement date.
Target allocation risk. The fund’s risk profile will change due to reallocation or rebalancing of portfolio assets as the fund approaches its target date.
Principal risks of investing in the underlying fundsThe principal risks of investing in the Underlying Funds include:
Convertible securities risk. The market values of convertible securities tend to fall as interest rates rise and rise as interest rates fall. As the marketprice of underlying common stock declines below the conversion price, the market value of the convertible security tends to be increasingly influencedby its yield.
Credit and counterparty risk. The issuer or guarantor of a fixed-income security, the counterparty to an over-the-counter derivatives contract, or aborrower of fund securities may not make timely payments or otherwise honor its obligations. U.S. government securities are subject to varyingdegrees of credit risk depending upon the nature of their support. A downgrade or default affecting any of the fund’s securities could affect the fund’sperformance.
Currency risk. Fluctuations in exchange rates may adversely affect the U.S. dollar value of a fund’s investments. Foreign currencies may decline invalue, which could negatively impact performance.
Cybersecurity and operational risk. Cybersecurity breaches may allow an unauthorized party to gain access to fund assets, customer data, orproprietary information, or cause a fund or its service providers to suffer data corruption or lose operational functionality. Similar incidents affectingissuers of a fund’s securities may negatively impact performance. Operational risk may arise from human error, error by third parties, communicationerrors, or technology failures, among other causes.
Economic and market events risk. Events in the U.S. and global financial markets, including actions taken by the U.S. Federal Reserve or foreigncentral banks to stimulate or stabilize economic growth, may at times result in unusually high market volatility, which could negatively impactperformance. Reduced liquidity in credit and fixed-income markets could adversely affect issuers worldwide. Banks and financial services companiescould suffer losses if interest rates rise or economic conditions deteriorate.
Equity securities risk. The price of equity securities may decline due to changes in a company’s financial condition or overall market conditions.Growth company securities may fluctuate more in price than other securities because of the greater emphasis on earnings expectations. Securities themanager believes are undervalued may never realize their full potential value, and in certain markets value stocks may underperform the market as awhole.
.93

Fixed-income securities risk. A rise in interest rates typically causes bond prices to fall. The longer the average maturity or duration of the bonds heldby a fund, the more sensitive it will likely be to interest-rate fluctuations. An issuer may not make all interest payments or repay all or any of theprincipal borrowed. Changes in a security’s credit quality may adversely affect fund performance.
Foreign securities risk. Less information may be publicly available regarding foreign issuers. Foreign securities may be subject to foreign taxes andmay be more volatile than U.S. securities. Currency fluctuations and political and economic developments may adversely impact the value of foreignsecurities. The risks of investing in foreign securities are magnified in emerging markets.
Hedging, derivatives, and other strategic transactions risk. Hedging, derivatives, and other strategic transactions may increase a fund’s volatilityand could produce disproportionate losses, potentially more than the fund’s principal investment. Risks of these transactions are different from andpossibly greater than risks of investing directly in securities and other traditional instruments. Under certain market conditions, derivatives couldbecome harder to value or sell and may become subject to liquidity risk (i.e., the inability to enter into closing transactions). Regulatory changes inderivative markets could impact the cost of or the fund’s ability to engage in derivative transactions. Derivatives and other strategic transactions thatthe fund intends to utilize include: foreign currency forward contracts, futures contracts, options, credit default swaps, and interest-rate swaps. Foreigncurrency forward contracts, futures contracts, options, and swaps generally are subject to counterparty risk. In addition, swaps may be subject tointerest-rate and settlement risk, and the risk of default of the underlying reference obligation. Derivatives associated with foreign currencytransactions are subject to currency risk.
Initial public offerings risk. IPO share prices are frequently volatile and may significantly impact fund performance.
Large company risk. Larger companies may grow more slowly than smaller companies or be slower to respond to business developments. Large-capitalization securities may underperform the market as a whole.
Liquidity risk. The extent (if at all) to which a security may be sold or a derivative position closed without negatively impacting its market value may beimpaired by reduced market activity or participation, legal restrictions, or other economic and market impediments. Liquidity risk may be magnified inrising interest rate environments due to higher than normal redemption rates. Widespread selling of fixed-income securities to satisfy redemptionsduring periods of reduced demand may adversely impact the price or salability of such securities. Periods of heavy redemption could cause the fund tosell assets at a loss or depressed value, which could negatively affect performance. Redemption risk is heightened during periods of declining or illiquidmarkets.
Lower-rated and high-yield fixed-income securities risk. Lower-rated and high-yield fixed-income securities (junk bonds) are subject to greatercredit quality risk, risk of default, and price volatility than higher-rated fixed-income securities, may be considered speculative, and can be difficult toresell.
Mortgage-backed and asset-backed securities risk. Mortgage-backed and asset-backed securities are subject to different combinations ofprepayment, extension, interest-rate, and other market risks.
Sector risk. When a fund focuses its investments in certain sectors of the economy, its performance may be driven largely by sector performance andcould fluctuate more widely than if the fund were invested more evenly across sectors.
Short sales risk. In a short sale, a fund pays interest on the borrowed security. The fund will lose money if the security price increases between theshort sale and the replacement date.
Small and mid-sized company risk. Small and mid-sized companies are generally less established and may be more volatile than larger companies.Small and/or mid-capitalization securities may underperform the market as a whole.
Past performanceThis section normally shows how the fund’s total returns have varied from year to year, along with a broad-based market index for reference. Becausethe fund has not commenced operations as of the date of this Prospectus, there is no past performance to report.
Investment managementInvestment Advisor John Hancock Investment Management Services, LLC§
Subadvisor John Hancock Asset Management a division of Manulife Asset Management (US) LLC§
Subadvisor John Hancock Asset Management a division of Manulife Asset Management (North America) Limited
Portfolio managementRobert BoydaHead of Capital Markets and Strategy and Co-Head of Portfolio Solutions Group, John HancockAsset Management a division of Manulife AssetManagement (US) LLCManaged fund since inception
Robert Sykes, CFAManaging Director, Portfolio Manager ofPortfolio Solutions Group,John Hancock Asset Management a division ofManulife Asset Management (US) LLCManaged fund since 2018
Nathan Thooft, CFASenior Managing Director, Senior PortfolioManager, Co-Head of Portfolio SolutionsGroup, John Hancock Asset Management adivision of Manulife Asset Management (US)LLCManaged fund since inception
.94

Other important information regarding the fundFor important information about taxes and financial intermediary compensation, please turn to “Additional information about the funds” at page258 of the Prospectus.
.95

Lifecycle 2020 Trust Investment objectiveTo seek high total return until the fund’s target retirement date.
Fees and expensesThis table describes the fees and expenses that you may pay if you buy and hold shares of the fund. The fees and expenses do not reflect fees andexpenses of any variable insurance contract that may use the fund as its underlying investment option and would be higher if they did.
Annual fund operating expenses (%) (expenses that you pay each year as a percentage of the valueof your investment) Series I1 Series II1 Series NAV1
Management fee 0.06 0.06 0.06
Distribution and service (Rule 12b-1) fees 0.05 0.25 0.00
Other expenses 0.09 0.09 0.09
Acquired fund fees and expenses2 0.74 0.74 0.74
Total annual fund operating expenses 0.94 1.14 0.89
1 For funds and classes that have not commenced operations or have an inception date of less than six months as of December 31, 2017, expenses are estimated.2 The “Total annual fund operating expenses” shown may not correlate to the fund’s ratios of expenses to average daily net assets shown in the “Financial highlights” section of
the fund’s prospectus, which does not include “Acquired fund fees and expenses.”
Expense exampleThe examples are intended to help you compare the cost of investing in the fund with the cost of investing in other mutual funds. The examplesassume that $10,000 is invested in the fund for the periods indicated and then all shares are redeemed at the end of those periods. The examples alsoassume that the investment has a 5% return each year and that the fund’s operating expenses remain the same. The expense example does not reflectfees and expenses of any variable insurance contract that may use the fund as its underlying investment option and would be higher if they did.Although your actual costs may be higher or lower, based on these assumptions your costs would be:
Expenses ($) Series I Series II Series NAV
1 year 96 116 91
3 years 300 362 284
Portfolio turnoverThe fund, which operates as a fund of funds and invests in underlying funds, does not pay transaction costs, such as commissions, when it buys andsells shares of underlying funds (or “turns over” its portfolio). An underlying fund does pay transaction costs when it turns over its portfolio, and ahigher portfolio turnover rate may indicate higher transaction costs. These costs, which are not reflected in annual fund operating expenses or in theexample, affect the performance of the underlying funds and of the fund. Because the fund had not commenced operations as of the date of thisprospectus, there is no portfolio turnover to report.
Principal investment strategiesUnder normal market conditions, the fund invests substantially all of its assets in underlying funds using an asset allocation strategy designed forinvestors expected to retire around the year 2020. Over time, the asset allocation strategy will change according to a predetermined glide path as setforth below.
After December 31st of the designated retirement year of the fund, the fund will, under normal market conditions, continue to invest its assets inaccordance with the predetermined “glide path” set forth below although the subadvisors may at times determine in light of prevailing market oreconomic conditions that the fund’s asset allocations should vary from those indicated by the “glide path” in order to preserve the fund’s assets or tohelp it achieve its objective.
Within the prescribed percentage allocation, the subadvisors select the percentage level to be maintained in specific underlying funds. The subadvisorsmay, from time to time, change the allocation in specific underlying funds or rebalance the underlying funds. To maintain target allocation in theunderlying funds, daily cash flows for the fund will be directed to its underlying funds that most deviate from target.
The allocations reflected in the glide path are also referred to as “neutral” allocations because they do not reflect active decisions made by thesubadvisors to produce an overweight or an underweight position in a particular asset class based on the subadvisors’ market outlook. The fund has atarget allocation for the broad asset classes of equities and fixed income but may invest outside these target allocations to protect the fund or help itachieve its objective.
The investment performance of the fund will reflect both its subadvisors’ allocation decisions with respect to underlying funds and investments and theinvestment decisions made by the underlying funds’ subadvisors.
.96

In addition to investing in exchange-traded funds (ETFs), the fund may also invest in the securities of other investment companies and may make directinvestments in other types of investments, such as equity and fixed-income securities, including U.S. government securities, closed-end funds andpartnerships. See “Other Permitted Investments by the Funds of Funds.” The fund may also engage in short selling of securities.
The fund may invest in various underlying funds that as a group hold a wide range of equity type securities in their portfolios. These include small-,mid- and large-capitalization stocks, domestic and foreign securities (including emerging market securities) and sector holdings such as utilities, scienceand technology stocks. Each of the underlying funds has its own investment strategy that, for example, may focus on growth stocks or value stocks ormay employ a strategy combining growth and income stocks and/or may invest in derivatives such as options on securities and futures contracts.Certain of the underlying funds focus their investment strategy on fixed income securities, which may include investment grade and below investmentgrade debt securities with maturities that range from short to longer term. The fixed income underlying funds collectively hold various types of debtinstruments such as corporate bonds and mortgage-backed, government issued, domestic and international securities.
The fund bears its own expenses and, in addition, indirectly bears its proportionate share of the expenses of the underlying funds in which it invests.
Use of Hedging and Other Strategic Transactions. The fund is authorized to use all of the various investment strategies referred to under “AdditionalInformation About the Funds’ Principal Risks — Hedging, derivatives and other strategic transactions risk” including, without limitation, investing incredit default swaps, foreign currency forward contracts, futures contracts, interest rate swaps and options.
Fixed-income allocation
Equity allocation
Perc
ent
Equ
ity
(%)
40 35 30 25 20 15 10 5 5 10 15 20 25 30
Years to retirement Years after retirement
Retirement date
>>
>
0
10
20
30
40
50
60
70
80
90
100
Fund Combination after Designated Retirement Date
The Board of Trustees may, in its discretion, determine to combine the fund with another fund if the target allocation of the fund matches the targetallocation of the other fund. In such event, the fund’s shareholders will become shareholders of the other fund. To the extent permitted by applicableregulatory requirements, such a combination would be implemented without seeking the approval of shareholders. There is no assurance that theBoard of Trustees at any point will determine to implement such a combination.
Principal risks of investing in the fund of fundsThe fund of funds is subject to risks, and you could lose money by investing in the fund. The principal risks of investing in the fund of funds include:
Commodity risk. Commodity prices may be volatile due to fluctuating demand, supply disruption, speculation, and other factors. Certain commodityinvestments may have no active trading market at times.
Credit and counterparty risk. The issuer or guarantor of a fixed-income security, the counterparty to an over-the-counter derivatives contract, or aborrower of fund securities may not make timely payments or otherwise honor its obligations. U.S. government securities are subject to varyingdegrees of credit risk depending upon the nature of their support. A downgrade or default affecting any of the fund’s securities could affect the fund’sperformance.
Cybersecurity and operational risk. Cybersecurity breaches may allow an unauthorized party to gain access to fund assets, customer data, orproprietary information, or cause a fund or its service providers to suffer data corruption or lose operational functionality. Similar incidents affectingissuers of a fund’s securities may negatively impact performance. Operational risk may arise from human error, error by third parties, communicationerrors, or technology failures, among other causes.
Economic and market events risk. Events in the U.S. and global financial markets, including actions taken by the U.S. Federal Reserve or foreigncentral banks to stimulate or stabilize economic growth, may at times result in unusually high market volatility, which could negatively impactperformance. Reduced liquidity in credit and fixed-income markets could adversely affect issuers worldwide. Banks and financial services companiescould suffer losses if interest rates rise or economic conditions deteriorate.
Equity securities risk. The price of equity securities may decline due to changes in a company’s financial condition or overall market conditions.
Exchange-traded funds risk. An ETF generally reflects the risks of the underlying securities it is designed to track. A fund bears ETF fees and expensesindirectly.
.97
Exchange-traded notes risk. An ETN generally reflects the risks associated with the assets composing the underlying market benchmark or strategy itis designed to track. ETNs also are subject to issuer and fixed-income risks.
Fixed-income securities risk. A rise in interest rates typically causes bond prices to fall. The longer the average maturity or duration of the bonds heldby a fund, the more sensitive it will likely be to interest-rate fluctuations. An issuer may not make all interest payments or repay all or any of theprincipal borrowed. Changes in a security’s credit quality may adversely affect fund performance.
Fund of funds risk. The fund’s ability to achieve its investment objective will depend largely, in part, on: (i) the underlying funds’ performance,expenses and ability to meet their investment objectives; and (ii) properly rebalancing assets among underlying funds and different asset classes. Thefund is also subject to risks related to: (i) layering of fees of the underlying funds; and (ii) conflicts of interest associated with the subadvisor’s ability toallocate fund assets without limit to other funds it advises and/or other funds advised by affiliated subadvisors. There is no assurance that either thefund or the underlying funds will achieve their investment objectives. A fund bears underlying fund fees and expenses indirectly.
Hedging, derivatives, and other strategic transactions risk. Hedging, derivatives, and other strategic transactions may increase a fund’s volatilityand could produce disproportionate losses, potentially more than the fund’s principal investment. Risks of these transactions are different from andpossibly greater than risks of investing directly in securities and other traditional instruments. Under certain market conditions, derivatives couldbecome harder to value or sell and may become subject to liquidity risk (i.e., the inability to enter into closing transactions). Regulatory changes inderivative markets could impact the cost of or the fund’s ability to engage in derivative transactions. Derivatives and other strategic transactions thatthe fund intends to utilize include: foreign currency forward contracts, futures contracts, options, credit default swaps, and interest-rate swaps. Foreigncurrency forward contracts, futures contracts, options, and swaps generally are subject to counterparty risk. In addition, swaps may be subject tointerest-rate and settlement risk, and the risk of default of the underlying reference obligation. Derivatives associated with foreign currencytransactions are subject to currency risk.
Investment company securities risk. A fund bears underlying fund fees and expenses indirectly.
Lifecycle risk. Managers might not correctly predict market or economic conditions, and you could lose money even close to, during, or after thefund’s designated retirement year.
Liquidity risk. The extent (if at all) to which a security may be sold or a derivative position closed without negatively impacting its market value may beimpaired by reduced market activity or participation, legal restrictions, or other economic and market impediments. Liquidity risk may be magnified inrising interest rate environments due to higher than normal redemption rates. Widespread selling of fixed-income securities to satisfy redemptionsduring periods of reduced demand may adversely impact the price or salability of such securities. Periods of heavy redemption could cause the fund tosell assets at a loss or depressed value, which could negatively affect performance. Redemption risk is heightened during periods of declining or illiquidmarkets.
Short sales risk. In a short sale, a fund pays interest on the borrowed security. The fund will lose money if the security price increases between theshort sale and the replacement date.
Target allocation risk. The fund’s risk profile will change due to reallocation or rebalancing of portfolio assets as the fund approaches its target date.
Principal risks of investing in the underlying fundsThe principal risks of investing in the Underlying Funds include:
Convertible securities risk. The market values of convertible securities tend to fall as interest rates rise and rise as interest rates fall. As the marketprice of underlying common stock declines below the conversion price, the market value of the convertible security tends to be increasingly influencedby its yield.
Credit and counterparty risk. The issuer or guarantor of a fixed-income security, the counterparty to an over-the-counter derivatives contract, or aborrower of fund securities may not make timely payments or otherwise honor its obligations. U.S. government securities are subject to varyingdegrees of credit risk depending upon the nature of their support. A downgrade or default affecting any of the fund’s securities could affect the fund’sperformance.
Currency risk. Fluctuations in exchange rates may adversely affect the U.S. dollar value of a fund’s investments. Foreign currencies may decline invalue, which could negatively impact performance.
Cybersecurity and operational risk. Cybersecurity breaches may allow an unauthorized party to gain access to fund assets, customer data, orproprietary information, or cause a fund or its service providers to suffer data corruption or lose operational functionality. Similar incidents affectingissuers of a fund’s securities may negatively impact performance. Operational risk may arise from human error, error by third parties, communicationerrors, or technology failures, among other causes.
Economic and market events risk. Events in the U.S. and global financial markets, including actions taken by the U.S. Federal Reserve or foreigncentral banks to stimulate or stabilize economic growth, may at times result in unusually high market volatility, which could negatively impactperformance. Reduced liquidity in credit and fixed-income markets could adversely affect issuers worldwide. Banks and financial services companiescould suffer losses if interest rates rise or economic conditions deteriorate.
Equity securities risk. The price of equity securities may decline due to changes in a company’s financial condition or overall market conditions.Growth company securities may fluctuate more in price than other securities because of the greater emphasis on earnings expectations. Securities themanager believes are undervalued may never realize their full potential value, and in certain markets value stocks may underperform the market as awhole.
.98

Fixed-income securities risk. A rise in interest rates typically causes bond prices to fall. The longer the average maturity or duration of the bonds heldby a fund, the more sensitive it will likely be to interest-rate fluctuations. An issuer may not make all interest payments or repay all or any of theprincipal borrowed. Changes in a security’s credit quality may adversely affect fund performance.
Foreign securities risk. Less information may be publicly available regarding foreign issuers. Foreign securities may be subject to foreign taxes andmay be more volatile than U.S. securities. Currency fluctuations and political and economic developments may adversely impact the value of foreignsecurities. The risks of investing in foreign securities are magnified in emerging markets.
Hedging, derivatives, and other strategic transactions risk. Hedging, derivatives, and other strategic transactions may increase a fund’s volatilityand could produce disproportionate losses, potentially more than the fund’s principal investment. Risks of these transactions are different from andpossibly greater than risks of investing directly in securities and other traditional instruments. Under certain market conditions, derivatives couldbecome harder to value or sell and may become subject to liquidity risk (i.e., the inability to enter into closing transactions). Regulatory changes inderivative markets could impact the cost of or the fund’s ability to engage in derivative transactions. Derivatives and other strategic transactions thatthe fund intends to utilize include: foreign currency forward contracts, futures contracts, options, credit default swaps, and interest-rate swaps. Foreigncurrency forward contracts, futures contracts, options, and swaps generally are subject to counterparty risk. In addition, swaps may be subject tointerest-rate and settlement risk, and the risk of default of the underlying reference obligation. Derivatives associated with foreign currencytransactions are subject to currency risk.
Initial public offerings risk. IPO share prices are frequently volatile and may significantly impact fund performance.
Large company risk. Larger companies may grow more slowly than smaller companies or be slower to respond to business developments. Large-capitalization securities may underperform the market as a whole.
Liquidity risk. The extent (if at all) to which a security may be sold or a derivative position closed without negatively impacting its market value may beimpaired by reduced market activity or participation, legal restrictions, or other economic and market impediments. Liquidity risk may be magnified inrising interest rate environments due to higher than normal redemption rates. Widespread selling of fixed-income securities to satisfy redemptionsduring periods of reduced demand may adversely impact the price or salability of such securities. Periods of heavy redemption could cause the fund tosell assets at a loss or depressed value, which could negatively affect performance. Redemption risk is heightened during periods of declining or illiquidmarkets.
Lower-rated and high-yield fixed-income securities risk. Lower-rated and high-yield fixed-income securities (junk bonds) are subject to greatercredit quality risk, risk of default, and price volatility than higher-rated fixed-income securities, may be considered speculative, and can be difficult toresell.
Mortgage-backed and asset-backed securities risk. Mortgage-backed and asset-backed securities are subject to different combinations ofprepayment, extension, interest-rate, and other market risks.
Sector risk. When a fund focuses its investments in certain sectors of the economy, its performance may be driven largely by sector performance andcould fluctuate more widely than if the fund were invested more evenly across sectors.
Short sales risk. In a short sale, a fund pays interest on the borrowed security. The fund will lose money if the security price increases between theshort sale and the replacement date.
Small and mid-sized company risk. Small and mid-sized companies are generally less established and may be more volatile than larger companies.Small and/or mid-capitalization securities may underperform the market as a whole.
Past performanceThis section normally shows how the fund’s total returns have varied from year to year, along with a broad-based market index for reference. Becausethe fund has not commenced operations as of the date of this Prospectus, there is no past performance to report.
Investment managementInvestment Advisor John Hancock Investment Management Services, LLC§
Subadvisor John Hancock Asset Management a division of Manulife Asset Management (US) LLC§
Subadvisor John Hancock Asset Management a division of Manulife Asset Management (North America) Limited
Portfolio managementRobert BoydaHead of Capital Markets and Strategy and Co-Head of Portfolio Solutions Group, John HancockAsset Management a division of Manulife AssetManagement (US) LLCManaged fund since inception
Robert Sykes, CFAManaging Director, Portfolio Manager ofPortfolio Solutions Group,John Hancock Asset Management a division ofManulife Asset Management (US) LLCManaged fund since 2018
Nathan Thooft, CFASenior Managing Director, Senior PortfolioManager, Co-Head of Portfolio SolutionsGroup, John Hancock Asset Management adivision of Manulife Asset Management (US)LLCManaged fund since inception
.99

Other important information regarding the fundFor important information about taxes and financial intermediary compensation, please turn to “Additional information about the funds” at page258 of the Prospectus.
.100

Lifecycle 2025 Trust Investment objectiveTo seek high total return until the fund’s target retirement date.
Fees and expensesThis table describes the fees and expenses that you may pay if you buy and hold shares of the fund. The fees and expenses do not reflect fees andexpenses of any variable insurance contract that may use the fund as its underlying investment option and would be higher if they did.
Annual fund operating expenses (%) (expenses that you pay each year as a percentage of the valueof your investment) Series I1 Series II1 Series NAV1
Management fee 0.06 0.06 0.06
Distribution and service (Rule 12b-1) fees 0.05 0.25 0.00
Other expenses 0.09 0.09 0.09
Acquired fund fees and expenses2 0.75 0.75 0.75
Total annual fund operating expenses 0.95 1.15 0.90
1 For funds and classes that have not commenced operations or have an inception date of less than six months as of December 31, 2017, expenses are estimated.2 The “Total annual fund operating expenses” shown may not correlate to the fund’s ratios of expenses to average daily net assets shown in the “Financial highlights” section of
the fund’s prospectus, which does not include “Acquired fund fees and expenses.”
Expense exampleThe examples are intended to help you compare the cost of investing in the fund with the cost of investing in other mutual funds. The examplesassume that $10,000 is invested in the fund for the periods indicated and then all shares are redeemed at the end of those periods. The examples alsoassume that the investment has a 5% return each year and that the fund’s operating expenses remain the same. The expense example does not reflectfees and expenses of any variable insurance contract that may use the fund as its underlying investment option and would be higher if they did.Although your actual costs may be higher or lower, based on these assumptions your costs would be:
Expenses ($) Series I Series II Series NAV
1 year 97 117 92
3 years 303 365 287
Portfolio turnoverThe fund, which operates as a fund of funds and invests in underlying funds, does not pay transaction costs, such as commissions, when it buys andsells shares of underlying funds (or “turns over” its portfolio). An underlying fund does pay transaction costs when it turns over its portfolio, and ahigher portfolio turnover rate may indicate higher transaction costs. These costs, which are not reflected in annual fund operating expenses or in theexample, affect the performance of the underlying funds and of the fund. Because the fund had not commenced operations as of the date of thisprospectus, there is no portfolio turnover to report.
Principal investment strategiesUnder normal market conditions, the fund invests substantially all of its assets in underlying funds using an asset allocation strategy designed forinvestors expected to retire around the year 2025. Over time, the asset allocation strategy will change according to a predetermined glide path as setforth below.
After December 31st of the designated retirement year of the fund, the fund will, under normal market conditions, continue to invest its assets inaccordance with the predetermined “glide path” set forth below although the subadvisors may at times determine in light of prevailing market oreconomic conditions that the fund’s asset allocations should vary from those indicated by the “glide path” in order to preserve the fund’s assets or tohelp it achieve its objective.
Within the prescribed percentage allocation, the subadvisors select the percentage level to be maintained in specific underlying funds. The subadvisorsmay, from time to time, change the allocation in specific underlying funds or rebalance the underlying funds. To maintain target allocation in theunderlying funds, daily cash flows for the fund will be directed to its underlying funds that most deviate from target.
The allocations reflected in the glide path are also referred to as “neutral” allocations because they do not reflect active decisions made by thesubadvisors to produce an overweight or an underweight position in a particular asset class based on the subadvisors’ market outlook. The fund has atarget allocation for the broad asset classes of equities and fixed income but may invest outside these target allocations to protect the fund or help itachieve its objective.
The investment performance of the fund will reflect both its subadvisors’ allocation decisions with respect to underlying funds and investments and theinvestment decisions made by the underlying funds’ subadvisors.
.101

In addition to investing in exchange-traded funds (ETFs), the fund may also invest in the securities of other investment companies and may make directinvestments in other types of investments, such as equity and fixed-income securities, including U.S. government securities, closed-end funds andpartnerships. See “Other Permitted Investments by the Funds of Funds.” The fund may also engage in short selling of securities.
The fund may invest in various underlying funds that as a group hold a wide range of equity type securities in their portfolios. These include small-,mid- and large-capitalization stocks, domestic and foreign securities (including emerging market securities) and sector holdings such as utilities, scienceand technology stocks. Each of the underlying funds has its own investment strategy that, for example, may focus on growth stocks or value stocks ormay employ a strategy combining growth and income stocks and/or may invest in derivatives such as options on securities and futures contracts.Certain of the underlying funds focus their investment strategy on fixed income securities, which may include investment grade and below investmentgrade debt securities with maturities that range from short to longer term. The fixed income underlying funds collectively hold various types of debtinstruments such as corporate bonds and mortgage-backed, government issued, domestic and international securities.
The fund bears its own expenses and, in addition, indirectly bears its proportionate share of the expenses of the underlying funds in which it invests.
Use of Hedging and Other Strategic Transactions. The fund is authorized to use all of the various investment strategies referred to under “AdditionalInformation About the Funds’ Principal Risks — Hedging, derivatives and other strategic transactions risk” including, without limitation, investing incredit default swaps, foreign currency forward contracts, futures contracts, interest rate swaps and options.
Fixed-income allocation
Equity allocation
Perc
ent
Equ
ity
(%)
40 35 30 25 20 15 10 5 5 10 15 20 25 30
Years to retirement Years after retirement
Retirement date
>>
>
0
10
20
30
40
50
60
70
80
90
100
Fund Combination after Designated Retirement Date
The Board of Trustees may, in its discretion, determine to combine the fund with another fund if the target allocation of the fund matches the targetallocation of the other fund. In such event, the fund’s shareholders will become shareholders of the other fund. To the extent permitted by applicableregulatory requirements, such a combination would be implemented without seeking the approval of shareholders. There is no assurance that theBoard of Trustees at any point will determine to implement such a combination.
Principal risks of investing in the fund of fundsThe fund of funds is subject to risks, and you could lose money by investing in the fund. The principal risks of investing in the fund of funds include:
Commodity risk. Commodity prices may be volatile due to fluctuating demand, supply disruption, speculation, and other factors. Certain commodityinvestments may have no active trading market at times.
Credit and counterparty risk. The issuer or guarantor of a fixed-income security, the counterparty to an over-the-counter derivatives contract, or aborrower of fund securities may not make timely payments or otherwise honor its obligations. U.S. government securities are subject to varyingdegrees of credit risk depending upon the nature of their support. A downgrade or default affecting any of the fund’s securities could affect the fund’sperformance.
Cybersecurity and operational risk. Cybersecurity breaches may allow an unauthorized party to gain access to fund assets, customer data, orproprietary information, or cause a fund or its service providers to suffer data corruption or lose operational functionality. Similar incidents affectingissuers of a fund’s securities may negatively impact performance. Operational risk may arise from human error, error by third parties, communicationerrors, or technology failures, among other causes.
Economic and market events risk. Events in the U.S. and global financial markets, including actions taken by the U.S. Federal Reserve or foreigncentral banks to stimulate or stabilize economic growth, may at times result in unusually high market volatility, which could negatively impactperformance. Reduced liquidity in credit and fixed-income markets could adversely affect issuers worldwide. Banks and financial services companiescould suffer losses if interest rates rise or economic conditions deteriorate.
Equity securities risk. The price of equity securities may decline due to changes in a company’s financial condition or overall market conditions.
Exchange-traded funds risk. An ETF generally reflects the risks of the underlying securities it is designed to track. A fund bears ETF fees and expensesindirectly.
.102

Exchange-traded notes risk. An ETN generally reflects the risks associated with the assets composing the underlying market benchmark or strategy itis designed to track. ETNs also are subject to issuer and fixed-income risks.
Fixed-income securities risk. A rise in interest rates typically causes bond prices to fall. The longer the average maturity or duration of the bonds heldby a fund, the more sensitive it will likely be to interest-rate fluctuations. An issuer may not make all interest payments or repay all or any of theprincipal borrowed. Changes in a security’s credit quality may adversely affect fund performance.
Fund of funds risk. The fund’s ability to achieve its investment objective will depend largely, in part, on: (i) the underlying funds’ performance,expenses and ability to meet their investment objectives; and (ii) properly rebalancing assets among underlying funds and different asset classes. Thefund is also subject to risks related to: (i) layering of fees of the underlying funds; and (ii) conflicts of interest associated with the subadvisor’s ability toallocate fund assets without limit to other funds it advises and/or other funds advised by affiliated subadvisors. There is no assurance that either thefund or the underlying funds will achieve their investment objectives. A fund bears underlying fund fees and expenses indirectly.
Hedging, derivatives, and other strategic transactions risk. Hedging, derivatives, and other strategic transactions may increase a fund’s volatilityand could produce disproportionate losses, potentially more than the fund’s principal investment. Risks of these transactions are different from andpossibly greater than risks of investing directly in securities and other traditional instruments. Under certain market conditions, derivatives couldbecome harder to value or sell and may become subject to liquidity risk (i.e., the inability to enter into closing transactions). Regulatory changes inderivative markets could impact the cost of or the fund’s ability to engage in derivative transactions. Derivatives and other strategic transactions thatthe fund intends to utilize include: foreign currency forward contracts, futures contracts, options, credit default swaps, and interest-rate swaps. Foreigncurrency forward contracts, futures contracts, options, and swaps generally are subject to counterparty risk. In addition, swaps may be subject tointerest-rate and settlement risk, and the risk of default of the underlying reference obligation. Derivatives associated with foreign currencytransactions are subject to currency risk.
Investment company securities risk. A fund bears underlying fund fees and expenses indirectly.
Lifecycle risk. Managers might not correctly predict market or economic conditions, and you could lose money even close to, during, or after thefund’s designated retirement year.
Liquidity risk. The extent (if at all) to which a security may be sold or a derivative position closed without negatively impacting its market value may beimpaired by reduced market activity or participation, legal restrictions, or other economic and market impediments. Liquidity risk may be magnified inrising interest rate environments due to higher than normal redemption rates. Widespread selling of fixed-income securities to satisfy redemptionsduring periods of reduced demand may adversely impact the price or salability of such securities. Periods of heavy redemption could cause the fund tosell assets at a loss or depressed value, which could negatively affect performance. Redemption risk is heightened during periods of declining or illiquidmarkets.
Short sales risk. In a short sale, a fund pays interest on the borrowed security. The fund will lose money if the security price increases between theshort sale and the replacement date.
Target allocation risk. The fund’s risk profile will change due to reallocation or rebalancing of portfolio assets as the fund approaches its target date.
Principal risks of investing in the underlying fundsThe principal risks of investing in the Underlying Funds include:
Convertible securities risk. The market values of convertible securities tend to fall as interest rates rise and rise as interest rates fall. As the marketprice of underlying common stock declines below the conversion price, the market value of the convertible security tends to be increasingly influencedby its yield.
Credit and counterparty risk. The issuer or guarantor of a fixed-income security, the counterparty to an over-the-counter derivatives contract, or aborrower of fund securities may not make timely payments or otherwise honor its obligations. U.S. government securities are subject to varyingdegrees of credit risk depending upon the nature of their support. A downgrade or default affecting any of the fund’s securities could affect the fund’sperformance.
Currency risk. Fluctuations in exchange rates may adversely affect the U.S. dollar value of a fund’s investments. Foreign currencies may decline invalue, which could negatively impact performance.
Cybersecurity and operational risk. Cybersecurity breaches may allow an unauthorized party to gain access to fund assets, customer data, orproprietary information, or cause a fund or its service providers to suffer data corruption or lose operational functionality. Similar incidents affectingissuers of a fund’s securities may negatively impact performance. Operational risk may arise from human error, error by third parties, communicationerrors, or technology failures, among other causes.
Economic and market events risk. Events in the U.S. and global financial markets, including actions taken by the U.S. Federal Reserve or foreigncentral banks to stimulate or stabilize economic growth, may at times result in unusually high market volatility, which could negatively impactperformance. Reduced liquidity in credit and fixed-income markets could adversely affect issuers worldwide. Banks and financial services companiescould suffer losses if interest rates rise or economic conditions deteriorate.
Equity securities risk. The price of equity securities may decline due to changes in a company’s financial condition or overall market conditions.Growth company securities may fluctuate more in price than other securities because of the greater emphasis on earnings expectations. Securities themanager believes are undervalued may never realize their full potential value, and in certain markets value stocks may underperform the market as awhole.
.103

Fixed-income securities risk. A rise in interest rates typically causes bond prices to fall. The longer the average maturity or duration of the bonds heldby a fund, the more sensitive it will likely be to interest-rate fluctuations. An issuer may not make all interest payments or repay all or any of theprincipal borrowed. Changes in a security’s credit quality may adversely affect fund performance.
Foreign securities risk. Less information may be publicly available regarding foreign issuers. Foreign securities may be subject to foreign taxes andmay be more volatile than U.S. securities. Currency fluctuations and political and economic developments may adversely impact the value of foreignsecurities. The risks of investing in foreign securities are magnified in emerging markets.
Hedging, derivatives, and other strategic transactions risk. Hedging, derivatives, and other strategic transactions may increase a fund’s volatilityand could produce disproportionate losses, potentially more than the fund’s principal investment. Risks of these transactions are different from andpossibly greater than risks of investing directly in securities and other traditional instruments. Under certain market conditions, derivatives couldbecome harder to value or sell and may become subject to liquidity risk (i.e., the inability to enter into closing transactions). Regulatory changes inderivative markets could impact the cost of or the fund’s ability to engage in derivative transactions. Derivatives and other strategic transactions thatthe fund intends to utilize include: foreign currency forward contracts, futures contracts, options, credit default swaps, and interest-rate swaps. Foreigncurrency forward contracts, futures contracts, options, and swaps generally are subject to counterparty risk. In addition, swaps may be subject tointerest-rate and settlement risk, and the risk of default of the underlying reference obligation. Derivatives associated with foreign currencytransactions are subject to currency risk.
Initial public offerings risk. IPO share prices are frequently volatile and may significantly impact fund performance.
Large company risk. Larger companies may grow more slowly than smaller companies or be slower to respond to business developments. Large-capitalization securities may underperform the market as a whole.
Liquidity risk. The extent (if at all) to which a security may be sold or a derivative position closed without negatively impacting its market value may beimpaired by reduced market activity or participation, legal restrictions, or other economic and market impediments. Liquidity risk may be magnified inrising interest rate environments due to higher than normal redemption rates. Widespread selling of fixed-income securities to satisfy redemptionsduring periods of reduced demand may adversely impact the price or salability of such securities. Periods of heavy redemption could cause the fund tosell assets at a loss or depressed value, which could negatively affect performance. Redemption risk is heightened during periods of declining or illiquidmarkets.
Lower-rated and high-yield fixed-income securities risk. Lower-rated and high-yield fixed-income securities (junk bonds) are subject to greatercredit quality risk, risk of default, and price volatility than higher-rated fixed-income securities, may be considered speculative, and can be difficult toresell.
Mortgage-backed and asset-backed securities risk. Mortgage-backed and asset-backed securities are subject to different combinations ofprepayment, extension, interest-rate, and other market risks.
Sector risk. When a fund focuses its investments in certain sectors of the economy, its performance may be driven largely by sector performance andcould fluctuate more widely than if the fund were invested more evenly across sectors.
Short sales risk. In a short sale, a fund pays interest on the borrowed security. The fund will lose money if the security price increases between theshort sale and the replacement date.
Small and mid-sized company risk. Small and mid-sized companies are generally less established and may be more volatile than larger companies.Small and/or mid-capitalization securities may underperform the market as a whole.
Past performanceThis section normally shows how the fund’s total returns have varied from year to year, along with a broad-based market index for reference. Becausethe fund has not commenced operations as of the date of this Prospectus, there is no past performance to report.
Investment managementInvestment Advisor John Hancock Investment Management Services, LLC§
Subadvisor John Hancock Asset Management a division of Manulife Asset Management (US) LLC§
Subadvisor John Hancock Asset Management a division of Manulife Asset Management (North America) Limited
Portfolio managementRobert BoydaHead of Capital Markets and Strategy and Co-Head of Portfolio Solutions Group, John HancockAsset Management a division of Manulife AssetManagement (US) LLCManaged fund since inception
Robert Sykes, CFAManaging Director, Portfolio Manager ofPortfolio Solutions Group,John Hancock Asset Management a division ofManulife Asset Management (US) LLCManaged fund since 2018
Nathan Thooft, CFASenior Managing Director, Senior PortfolioManager, Co-Head of Portfolio SolutionsGroup, John Hancock Asset Management adivision of Manulife Asset Management (US)LLCManaged fund since inception
.104

Other important information regarding the fundFor important information about taxes and financial intermediary compensation, please turn to “Additional information about the funds” at page258 of the Prospectus.
.105

Lifecycle 2030 Trust Investment objectiveTo seek high total return until the fund’s target retirement date.
Fees and expensesThis table describes the fees and expenses that you may pay if you buy and hold shares of the fund. The fees and expenses do not reflect fees andexpenses of any variable insurance contract that may use the fund as its underlying investment option and would be higher if they did.
Annual fund operating expenses (%) (expenses that you pay each year as a percentage of the valueof your investment) Series I1 Series II1 Series NAV1
Management fee 0.06 0.06 0.06
Distribution and service (Rule 12b-1) fees 0.05 0.25 0.00
Other expenses 0.09 0.09 0.09
Acquired fund fees and expenses2 0.76 0.76 0.76
Total annual fund operating expenses 0.96 1.16 0.91
1 For funds and classes that have not commenced operations or have an inception date of less than six months as of December 31, 2017, expenses are estimated.2 The “Total annual fund operating expenses” shown may not correlate to the fund’s ratios of expenses to average daily net assets shown in the “Financial highlights” section of
the fund’s prospectus, which does not include “Acquired fund fees and expenses.”
Expense exampleThe examples are intended to help you compare the cost of investing in the fund with the cost of investing in other mutual funds. The examplesassume that $10,000 is invested in the fund for the periods indicated and then all shares are redeemed at the end of those periods. The examples alsoassume that the investment has a 5% return each year and that the fund’s operating expenses remain the same. The expense example does not reflectfees and expenses of any variable insurance contract that may use the fund as its underlying investment option and would be higher if they did.Although your actual costs may be higher or lower, based on these assumptions your costs would be:
Expenses ($) Series I Series II Series NAV
1 year 98 118 93
3 years 306 368 290
Portfolio turnoverThe fund, which operates as a fund of funds and invests in underlying funds, does not pay transaction costs, such as commissions, when it buys andsells shares of underlying funds (or “turns over” its portfolio). An underlying fund does pay transaction costs when it turns over its portfolio, and ahigher portfolio turnover rate may indicate higher transaction costs. These costs, which are not reflected in annual fund operating expenses or in theexample, affect the performance of the underlying funds and of the fund. Because the fund had not commenced operations as of the date of thisprospectus, there is no portfolio turnover to report.
Principal investment strategiesUnder normal market conditions, the fund invests substantially all of its assets in underlying funds using an asset allocation strategy designed forinvestors expected to retire around the year 2030. Over time, the asset allocation strategy will change according to a predetermined glide path as setforth below.
After December 31st of the designated retirement year of the fund, the fund will, under normal market conditions, continue to invest its assets inaccordance with the predetermined “glide path” set forth below although the subadvisors may at times determine in light of prevailing market oreconomic conditions that the fund’s asset allocations should vary from those indicated by the “glide path” in order to preserve the fund’s assets or tohelp it achieve its objective.
Within the prescribed percentage allocation, the subadvisors select the percentage level to be maintained in specific underlying funds. The subadvisorsmay, from time to time, change the allocation in specific underlying funds or rebalance the underlying funds. To maintain target allocation in theunderlying funds, daily cash flows for the fund will be directed to its underlying funds that most deviate from target.
The allocations reflected in the glide path are also referred to as “neutral” allocations because they do not reflect active decisions made by thesubadvisors to produce an overweight or an underweight position in a particular asset class based on the subadvisors’ market outlook. The fund has atarget allocation for the broad asset classes of equities and fixed income but may invest outside these target allocations to protect the fund or help itachieve its objective.
The investment performance of the fund will reflect both its subadvisors’ allocation decisions with respect to underlying funds and investments and theinvestment decisions made by the underlying funds’ subadvisors.
.106

In addition to investing in exchange-traded funds (ETFs), the fund may also invest in the securities of other investment companies and may make directinvestments in other types of investments, such as equity and fixed-income securities, including U.S. government securities, closed-end funds andpartnerships. See “Other Permitted Investments by the Funds of Funds.” The fund may also engage in short selling of securities.
The fund may invest in various underlying funds that as a group hold a wide range of equity type securities in their portfolios. These include small-,mid- and large-capitalization stocks, domestic and foreign securities (including emerging market securities) and sector holdings such as utilities, scienceand technology stocks. Each of the underlying funds has its own investment strategy that, for example, may focus on growth stocks or value stocks ormay employ a strategy combining growth and income stocks and/or may invest in derivatives such as options on securities and futures contracts.Certain of the underlying funds focus their investment strategy on fixed income securities, which may include investment grade and below investmentgrade debt securities with maturities that range from short to longer term. The fixed income underlying funds collectively hold various types of debtinstruments such as corporate bonds and mortgage-backed, government issued, domestic and international securities.
The fund bears its own expenses and, in addition, indirectly bears its proportionate share of the expenses of the underlying funds in which it invests.
Use of Hedging and Other Strategic Transactions. The fund is authorized to use all of the various investment strategies referred to under “AdditionalInformation About the Funds’ Principal Risks — Hedging, derivatives and other strategic transactions risk” including, without limitation, investing incredit default swaps, foreign currency forward contracts, futures contracts, interest rate swaps and options.
Fixed-income allocation
Equity allocation
Perc
ent
Equ
ity
(%)
40 35 30 25 20 15 10 5 5 10 15 20 25 30
Years to retirement Years after retirement
Retirement date
>>
>
0
10
20
30
40
50
60
70
80
90
100
Fund Combination after Designated Retirement Date
The Board of Trustees may, in its discretion, determine to combine the fund with another fund if the target allocation of the fund matches the targetallocation of the other fund. In such event, the fund’s shareholders will become shareholders of the other fund. To the extent permitted by applicableregulatory requirements, such a combination would be implemented without seeking the approval of shareholders. There is no assurance that theBoard of Trustees at any point will determine to implement such a combination.
Principal risks of investing in the fund of fundsThe fund of funds is subject to risks, and you could lose money by investing in the fund. The principal risks of investing in the fund of funds include:
Commodity risk. Commodity prices may be volatile due to fluctuating demand, supply disruption, speculation, and other factors. Certain commodityinvestments may have no active trading market at times.
Credit and counterparty risk. The issuer or guarantor of a fixed-income security, the counterparty to an over-the-counter derivatives contract, or aborrower of fund securities may not make timely payments or otherwise honor its obligations. U.S. government securities are subject to varyingdegrees of credit risk depending upon the nature of their support. A downgrade or default affecting any of the fund’s securities could affect the fund’sperformance.
Cybersecurity and operational risk. Cybersecurity breaches may allow an unauthorized party to gain access to fund assets, customer data, orproprietary information, or cause a fund or its service providers to suffer data corruption or lose operational functionality. Similar incidents affectingissuers of a fund’s securities may negatively impact performance. Operational risk may arise from human error, error by third parties, communicationerrors, or technology failures, among other causes.
Economic and market events risk. Events in the U.S. and global financial markets, including actions taken by the U.S. Federal Reserve or foreigncentral banks to stimulate or stabilize economic growth, may at times result in unusually high market volatility, which could negatively impactperformance. Reduced liquidity in credit and fixed-income markets could adversely affect issuers worldwide. Banks and financial services companiescould suffer losses if interest rates rise or economic conditions deteriorate.
Equity securities risk. The price of equity securities may decline due to changes in a company’s financial condition or overall market conditions.
Exchange-traded funds risk. An ETF generally reflects the risks of the underlying securities it is designed to track. A fund bears ETF fees and expensesindirectly.
.107

Exchange-traded notes risk. An ETN generally reflects the risks associated with the assets composing the underlying market benchmark or strategy itis designed to track. ETNs also are subject to issuer and fixed-income risks.
Fixed-income securities risk. A rise in interest rates typically causes bond prices to fall. The longer the average maturity or duration of the bonds heldby a fund, the more sensitive it will likely be to interest-rate fluctuations. An issuer may not make all interest payments or repay all or any of theprincipal borrowed. Changes in a security’s credit quality may adversely affect fund performance.
Fund of funds risk. The fund’s ability to achieve its investment objective will depend largely, in part, on: (i) the underlying funds’ performance,expenses and ability to meet their investment objectives; and (ii) properly rebalancing assets among underlying funds and different asset classes. Thefund is also subject to risks related to: (i) layering of fees of the underlying funds; and (ii) conflicts of interest associated with the subadvisor’s ability toallocate fund assets without limit to other funds it advises and/or other funds advised by affiliated subadvisors. There is no assurance that either thefund or the underlying funds will achieve their investment objectives. A fund bears underlying fund fees and expenses indirectly.
Hedging, derivatives, and other strategic transactions risk. Hedging, derivatives, and other strategic transactions may increase a fund’s volatilityand could produce disproportionate losses, potentially more than the fund’s principal investment. Risks of these transactions are different from andpossibly greater than risks of investing directly in securities and other traditional instruments. Under certain market conditions, derivatives couldbecome harder to value or sell and may become subject to liquidity risk (i.e., the inability to enter into closing transactions). Regulatory changes inderivative markets could impact the cost of or the fund’s ability to engage in derivative transactions. Derivatives and other strategic transactions thatthe fund intends to utilize include: foreign currency forward contracts, futures contracts, options, credit default swaps, and interest-rate swaps. Foreigncurrency forward contracts, futures contracts, options, and swaps generally are subject to counterparty risk. In addition, swaps may be subject tointerest-rate and settlement risk, and the risk of default of the underlying reference obligation. Derivatives associated with foreign currencytransactions are subject to currency risk.
Investment company securities risk. A fund bears underlying fund fees and expenses indirectly.
Lifecycle risk. Managers might not correctly predict market or economic conditions, and you could lose money even close to, during, or after thefund’s designated retirement year.
Liquidity risk. The extent (if at all) to which a security may be sold or a derivative position closed without negatively impacting its market value may beimpaired by reduced market activity or participation, legal restrictions, or other economic and market impediments. Liquidity risk may be magnified inrising interest rate environments due to higher than normal redemption rates. Widespread selling of fixed-income securities to satisfy redemptionsduring periods of reduced demand may adversely impact the price or salability of such securities. Periods of heavy redemption could cause the fund tosell assets at a loss or depressed value, which could negatively affect performance. Redemption risk is heightened during periods of declining or illiquidmarkets.
Short sales risk. In a short sale, a fund pays interest on the borrowed security. The fund will lose money if the security price increases between theshort sale and the replacement date.
Target allocation risk. The fund’s risk profile will change due to reallocation or rebalancing of portfolio assets as the fund approaches its target date.
Principal risks of investing in the underlying fundsThe principal risks of investing in the Underlying Funds include:
Convertible securities risk. The market values of convertible securities tend to fall as interest rates rise and rise as interest rates fall. As the marketprice of underlying common stock declines below the conversion price, the market value of the convertible security tends to be increasingly influencedby its yield.
Credit and counterparty risk. The issuer or guarantor of a fixed-income security, the counterparty to an over-the-counter derivatives contract, or aborrower of fund securities may not make timely payments or otherwise honor its obligations. U.S. government securities are subject to varyingdegrees of credit risk depending upon the nature of their support. A downgrade or default affecting any of the fund’s securities could affect the fund’sperformance.
Currency risk. Fluctuations in exchange rates may adversely affect the U.S. dollar value of a fund’s investments. Foreign currencies may decline invalue, which could negatively impact performance.
Cybersecurity and operational risk. Cybersecurity breaches may allow an unauthorized party to gain access to fund assets, customer data, orproprietary information, or cause a fund or its service providers to suffer data corruption or lose operational functionality. Similar incidents affectingissuers of a fund’s securities may negatively impact performance. Operational risk may arise from human error, error by third parties, communicationerrors, or technology failures, among other causes.
Economic and market events risk. Events in the U.S. and global financial markets, including actions taken by the U.S. Federal Reserve or foreigncentral banks to stimulate or stabilize economic growth, may at times result in unusually high market volatility, which could negatively impactperformance. Reduced liquidity in credit and fixed-income markets could adversely affect issuers worldwide. Banks and financial services companiescould suffer losses if interest rates rise or economic conditions deteriorate.
Equity securities risk. The price of equity securities may decline due to changes in a company’s financial condition or overall market conditions.Growth company securities may fluctuate more in price than other securities because of the greater emphasis on earnings expectations. Securities themanager believes are undervalued may never realize their full potential value, and in certain markets value stocks may underperform the market as awhole.
.108

Fixed-income securities risk. A rise in interest rates typically causes bond prices to fall. The longer the average maturity or duration of the bonds heldby a fund, the more sensitive it will likely be to interest-rate fluctuations. An issuer may not make all interest payments or repay all or any of theprincipal borrowed. Changes in a security’s credit quality may adversely affect fund performance.
Foreign securities risk. Less information may be publicly available regarding foreign issuers. Foreign securities may be subject to foreign taxes andmay be more volatile than U.S. securities. Currency fluctuations and political and economic developments may adversely impact the value of foreignsecurities. The risks of investing in foreign securities are magnified in emerging markets.
Hedging, derivatives, and other strategic transactions risk. Hedging, derivatives, and other strategic transactions may increase a fund’s volatilityand could produce disproportionate losses, potentially more than the fund’s principal investment. Risks of these transactions are different from andpossibly greater than risks of investing directly in securities and other traditional instruments. Under certain market conditions, derivatives couldbecome harder to value or sell and may become subject to liquidity risk (i.e., the inability to enter into closing transactions). Regulatory changes inderivative markets could impact the cost of or the fund’s ability to engage in derivative transactions. Derivatives and other strategic transactions thatthe fund intends to utilize include: foreign currency forward contracts, futures contracts, options, credit default swaps, and interest-rate swaps. Foreigncurrency forward contracts, futures contracts, options, and swaps generally are subject to counterparty risk. In addition, swaps may be subject tointerest-rate and settlement risk, and the risk of default of the underlying reference obligation. Derivatives associated with foreign currencytransactions are subject to currency risk.
Initial public offerings risk. IPO share prices are frequently volatile and may significantly impact fund performance.
Large company risk. Larger companies may grow more slowly than smaller companies or be slower to respond to business developments. Large-capitalization securities may underperform the market as a whole.
Liquidity risk. The extent (if at all) to which a security may be sold or a derivative position closed without negatively impacting its market value may beimpaired by reduced market activity or participation, legal restrictions, or other economic and market impediments. Liquidity risk may be magnified inrising interest rate environments due to higher than normal redemption rates. Widespread selling of fixed-income securities to satisfy redemptionsduring periods of reduced demand may adversely impact the price or salability of such securities. Periods of heavy redemption could cause the fund tosell assets at a loss or depressed value, which could negatively affect performance. Redemption risk is heightened during periods of declining or illiquidmarkets.
Lower-rated and high-yield fixed-income securities risk. Lower-rated and high-yield fixed-income securities (junk bonds) are subject to greatercredit quality risk, risk of default, and price volatility than higher-rated fixed-income securities, may be considered speculative, and can be difficult toresell.
Mortgage-backed and asset-backed securities risk. Mortgage-backed and asset-backed securities are subject to different combinations ofprepayment, extension, interest-rate, and other market risks.
Sector risk. When a fund focuses its investments in certain sectors of the economy, its performance may be driven largely by sector performance andcould fluctuate more widely than if the fund were invested more evenly across sectors.
Short sales risk. In a short sale, a fund pays interest on the borrowed security. The fund will lose money if the security price increases between theshort sale and the replacement date.
Small and mid-sized company risk. Small and mid-sized companies are generally less established and may be more volatile than larger companies.Small and/or mid-capitalization securities may underperform the market as a whole.
Past performanceThis section normally shows how the fund’s total returns have varied from year to year, along with a broad-based market index for reference. Becausethe fund has not commenced operations as of the date of this Prospectus, there is no past performance to report.
Investment managementInvestment Advisor John Hancock Investment Management Services, LLC§
Subadvisor John Hancock Asset Management a division of Manulife Asset Management (US) LLC§
Subadvisor John Hancock Asset Management a division of Manulife Asset Management (North America) Limited
Portfolio managementRobert BoydaHead of Capital Markets and Strategy and Co-Head of Portfolio Solutions Group, John HancockAsset Management a division of Manulife AssetManagement (US) LLCManaged fund since inception
Robert Sykes, CFAManaging Director, Portfolio Manager ofPortfolio Solutions Group,John Hancock Asset Management a division ofManulife Asset Management (US) LLCManaged fund since 2018
Nathan Thooft, CFASenior Managing Director, Senior PortfolioManager, Co-Head of Portfolio SolutionsGroup, John Hancock Asset Management adivision of Manulife Asset Management (US)LLCManaged fund since inception
.109

Other important information regarding the fundFor important information about taxes and financial intermediary compensation, please turn to “Additional information about the funds” at page258 of the Prospectus.
.110

Lifecycle 2035 Trust Investment objectiveTo seek high total return until the fund’s target retirement date.
Fees and expensesThis table describes the fees and expenses that you may pay if you buy and hold shares of the fund. The fees and expenses do not reflect fees andexpenses of any variable insurance contract that may use the fund as its underlying investment option and would be higher if they did.
Annual fund operating expenses (%) (expenses that you pay each year as a percentage of the valueof your investment) Series I1 Series II1 Series NAV1
Management fee 0.06 0.06 0.06
Distribution and service (Rule 12b-1) fees 0.05 0.25 0.00
Other expenses 0.09 0.09 0.09
Acquired fund fees and expenses2 0.77 0.77 0.77
Total annual fund operating expenses 0.97 1.17 0.92
1 For funds and classes that have not commenced operations or have an inception date of less than six months as of December 31, 2017, expenses are estimated.2 The “Total annual fund operating expenses” shown may not correlate to the fund’s ratios of expenses to average daily net assets shown in the “Financial highlights” section of
the fund’s prospectus, which does not include “Acquired fund fees and expenses.”
Expense exampleThe examples are intended to help you compare the cost of investing in the fund with the cost of investing in other mutual funds. The examplesassume that $10,000 is invested in the fund for the periods indicated and then all shares are redeemed at the end of those periods. The examples alsoassume that the investment has a 5% return each year and that the fund’s operating expenses remain the same. The expense example does not reflectfees and expenses of any variable insurance contract that may use the fund as its underlying investment option and would be higher if they did.Although your actual costs may be higher or lower, based on these assumptions your costs would be:
Expenses ($) Series I Series II Series NAV
1 year 99 119 94
3 years 309 372 293
Portfolio turnoverThe fund, which operates as a fund of funds and invests in underlying funds, does not pay transaction costs, such as commissions, when it buys andsells shares of underlying funds (or “turns over” its portfolio). An underlying fund does pay transaction costs when it turns over its portfolio, and ahigher portfolio turnover rate may indicate higher transaction costs. These costs, which are not reflected in annual fund operating expenses or in theexample, affect the performance of the underlying funds and of the fund. Because the fund had not commenced operations as of the date of thisprospectus, there is no portfolio turnover to report.
Principal investment strategiesUnder normal market conditions, the fund invests substantially all of its assets in underlying funds using an asset allocation strategy designed forinvestors expected to retire around the year 2035. Over time, the asset allocation strategy will change according to a predetermined glide path as setforth below.
After December 31st of the designated retirement year of the fund, the fund will, under normal market conditions, continue to invest its assets inaccordance with the predetermined “glide path” set forth below although the subadvisors may at times determine in light of prevailing market oreconomic conditions that the fund’s asset allocations should vary from those indicated by the “glide path” in order to preserve the fund’s assets or tohelp it achieve its objective.
Within the prescribed percentage allocation, the subadvisors select the percentage level to be maintained in specific underlying funds. The subadvisorsmay, from time to time, change the allocation in specific underlying funds or rebalance the underlying funds. To maintain target allocation in theunderlying funds, daily cash flows for the fund will be directed to its underlying funds that most deviate from target.
The allocations reflected in the glide path are also referred to as “neutral” allocations because they do not reflect active decisions made by thesubadvisors to produce an overweight or an underweight position in a particular asset class based on the subadvisors’ market outlook. The fund has atarget allocation for the broad asset classes of equities and fixed income but may invest outside these target allocations to protect the fund or help itachieve its objective.
The investment performance of the fund will reflect both its subadvisors’ allocation decisions with respect to underlying funds and investments and theinvestment decisions made by the underlying funds’ subadvisors.
.111
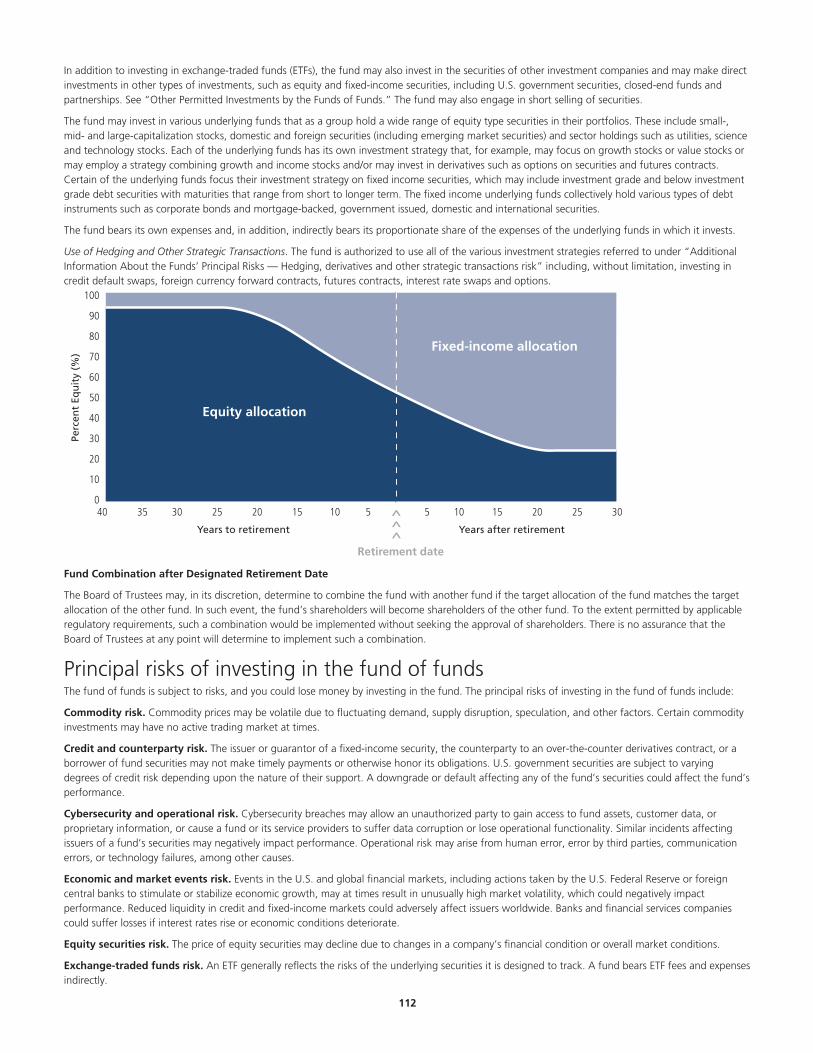
In addition to investing in exchange-traded funds (ETFs), the fund may also invest in the securities of other investment companies and may make directinvestments in other types of investments, such as equity and fixed-income securities, including U.S. government securities, closed-end funds andpartnerships. See “Other Permitted Investments by the Funds of Funds.” The fund may also engage in short selling of securities.
The fund may invest in various underlying funds that as a group hold a wide range of equity type securities in their portfolios. These include small-,mid- and large-capitalization stocks, domestic and foreign securities (including emerging market securities) and sector holdings such as utilities, scienceand technology stocks. Each of the underlying funds has its own investment strategy that, for example, may focus on growth stocks or value stocks ormay employ a strategy combining growth and income stocks and/or may invest in derivatives such as options on securities and futures contracts.Certain of the underlying funds focus their investment strategy on fixed income securities, which may include investment grade and below investmentgrade debt securities with maturities that range from short to longer term. The fixed income underlying funds collectively hold various types of debtinstruments such as corporate bonds and mortgage-backed, government issued, domestic and international securities.
The fund bears its own expenses and, in addition, indirectly bears its proportionate share of the expenses of the underlying funds in which it invests.
Use of Hedging and Other Strategic Transactions. The fund is authorized to use all of the various investment strategies referred to under “AdditionalInformation About the Funds’ Principal Risks — Hedging, derivatives and other strategic transactions risk” including, without limitation, investing incredit default swaps, foreign currency forward contracts, futures contracts, interest rate swaps and options.
Fixed-income allocation
Equity allocation
Perc
ent
Equ
ity
(%)
40 35 30 25 20 15 10 5 5 10 15 20 25 30
Years to retirement Years after retirement
Retirement date
>>
>
0
10
20
30
40
50
60
70
80
90
100
Fund Combination after Designated Retirement Date
The Board of Trustees may, in its discretion, determine to combine the fund with another fund if the target allocation of the fund matches the targetallocation of the other fund. In such event, the fund’s shareholders will become shareholders of the other fund. To the extent permitted by applicableregulatory requirements, such a combination would be implemented without seeking the approval of shareholders. There is no assurance that theBoard of Trustees at any point will determine to implement such a combination.
Principal risks of investing in the fund of fundsThe fund of funds is subject to risks, and you could lose money by investing in the fund. The principal risks of investing in the fund of funds include:
Commodity risk. Commodity prices may be volatile due to fluctuating demand, supply disruption, speculation, and other factors. Certain commodityinvestments may have no active trading market at times.
Credit and counterparty risk. The issuer or guarantor of a fixed-income security, the counterparty to an over-the-counter derivatives contract, or aborrower of fund securities may not make timely payments or otherwise honor its obligations. U.S. government securities are subject to varyingdegrees of credit risk depending upon the nature of their support. A downgrade or default affecting any of the fund’s securities could affect the fund’sperformance.
Cybersecurity and operational risk. Cybersecurity breaches may allow an unauthorized party to gain access to fund assets, customer data, orproprietary information, or cause a fund or its service providers to suffer data corruption or lose operational functionality. Similar incidents affectingissuers of a fund’s securities may negatively impact performance. Operational risk may arise from human error, error by third parties, communicationerrors, or technology failures, among other causes.
Economic and market events risk. Events in the U.S. and global financial markets, including actions taken by the U.S. Federal Reserve or foreigncentral banks to stimulate or stabilize economic growth, may at times result in unusually high market volatility, which could negatively impactperformance. Reduced liquidity in credit and fixed-income markets could adversely affect issuers worldwide. Banks and financial services companiescould suffer losses if interest rates rise or economic conditions deteriorate.
Equity securities risk. The price of equity securities may decline due to changes in a company’s financial condition or overall market conditions.
Exchange-traded funds risk. An ETF generally reflects the risks of the underlying securities it is designed to track. A fund bears ETF fees and expensesindirectly.
.112

Exchange-traded notes risk. An ETN generally reflects the risks associated with the assets composing the underlying market benchmark or strategy itis designed to track. ETNs also are subject to issuer and fixed-income risks.
Fixed-income securities risk. A rise in interest rates typically causes bond prices to fall. The longer the average maturity or duration of the bonds heldby a fund, the more sensitive it will likely be to interest-rate fluctuations. An issuer may not make all interest payments or repay all or any of theprincipal borrowed. Changes in a security’s credit quality may adversely affect fund performance.
Fund of funds risk. The fund’s ability to achieve its investment objective will depend largely, in part, on: (i) the underlying funds’ performance,expenses and ability to meet their investment objectives; and (ii) properly rebalancing assets among underlying funds and different asset classes. Thefund is also subject to risks related to: (i) layering of fees of the underlying funds; and (ii) conflicts of interest associated with the subadvisor’s ability toallocate fund assets without limit to other funds it advises and/or other funds advised by affiliated subadvisors. There is no assurance that either thefund or the underlying funds will achieve their investment objectives. A fund bears underlying fund fees and expenses indirectly.
Hedging, derivatives, and other strategic transactions risk. Hedging, derivatives, and other strategic transactions may increase a fund’s volatilityand could produce disproportionate losses, potentially more than the fund’s principal investment. Risks of these transactions are different from andpossibly greater than risks of investing directly in securities and other traditional instruments. Under certain market conditions, derivatives couldbecome harder to value or sell and may become subject to liquidity risk (i.e., the inability to enter into closing transactions). Regulatory changes inderivative markets could impact the cost of or the fund’s ability to engage in derivative transactions. Derivatives and other strategic transactions thatthe fund intends to utilize include: foreign currency forward contracts, futures contracts, options, credit default swaps, and interest-rate swaps. Foreigncurrency forward contracts, futures contracts, options, and swaps generally are subject to counterparty risk. In addition, swaps may be subject tointerest-rate and settlement risk, and the risk of default of the underlying reference obligation. Derivatives associated with foreign currencytransactions are subject to currency risk.
Investment company securities risk. A fund bears underlying fund fees and expenses indirectly.
Lifecycle risk. Managers might not correctly predict market or economic conditions, and you could lose money even close to, during, or after thefund’s designated retirement year.
Liquidity risk. The extent (if at all) to which a security may be sold or a derivative position closed without negatively impacting its market value may beimpaired by reduced market activity or participation, legal restrictions, or other economic and market impediments. Liquidity risk may be magnified inrising interest rate environments due to higher than normal redemption rates. Widespread selling of fixed-income securities to satisfy redemptionsduring periods of reduced demand may adversely impact the price or salability of such securities. Periods of heavy redemption could cause the fund tosell assets at a loss or depressed value, which could negatively affect performance. Redemption risk is heightened during periods of declining or illiquidmarkets.
Short sales risk. In a short sale, a fund pays interest on the borrowed security. The fund will lose money if the security price increases between theshort sale and the replacement date.
Target allocation risk. The fund’s risk profile will change due to reallocation or rebalancing of portfolio assets as the fund approaches its target date.
Principal risks of investing in the underlying fundsThe principal risks of investing in the Underlying Funds include:
Convertible securities risk. The market values of convertible securities tend to fall as interest rates rise and rise as interest rates fall. As the marketprice of underlying common stock declines below the conversion price, the market value of the convertible security tends to be increasingly influencedby its yield.
Credit and counterparty risk. The issuer or guarantor of a fixed-income security, the counterparty to an over-the-counter derivatives contract, or aborrower of fund securities may not make timely payments or otherwise honor its obligations. U.S. government securities are subject to varyingdegrees of credit risk depending upon the nature of their support. A downgrade or default affecting any of the fund’s securities could affect the fund’sperformance.
Currency risk. Fluctuations in exchange rates may adversely affect the U.S. dollar value of a fund’s investments. Foreign currencies may decline invalue, which could negatively impact performance.
Cybersecurity and operational risk. Cybersecurity breaches may allow an unauthorized party to gain access to fund assets, customer data, orproprietary information, or cause a fund or its service providers to suffer data corruption or lose operational functionality. Similar incidents affectingissuers of a fund’s securities may negatively impact performance. Operational risk may arise from human error, error by third parties, communicationerrors, or technology failures, among other causes.
Economic and market events risk. Events in the U.S. and global financial markets, including actions taken by the U.S. Federal Reserve or foreigncentral banks to stimulate or stabilize economic growth, may at times result in unusually high market volatility, which could negatively impactperformance. Reduced liquidity in credit and fixed-income markets could adversely affect issuers worldwide. Banks and financial services companiescould suffer losses if interest rates rise or economic conditions deteriorate.
Equity securities risk. The price of equity securities may decline due to changes in a company’s financial condition or overall market conditions.Growth company securities may fluctuate more in price than other securities because of the greater emphasis on earnings expectations. Securities themanager believes are undervalued may never realize their full potential value, and in certain markets value stocks may underperform the market as awhole.
.113

Fixed-income securities risk. A rise in interest rates typically causes bond prices to fall. The longer the average maturity or duration of the bonds heldby a fund, the more sensitive it will likely be to interest-rate fluctuations. An issuer may not make all interest payments or repay all or any of theprincipal borrowed. Changes in a security’s credit quality may adversely affect fund performance.
Foreign securities risk. Less information may be publicly available regarding foreign issuers. Foreign securities may be subject to foreign taxes andmay be more volatile than U.S. securities. Currency fluctuations and political and economic developments may adversely impact the value of foreignsecurities. The risks of investing in foreign securities are magnified in emerging markets.
Hedging, derivatives, and other strategic transactions risk. Hedging, derivatives, and other strategic transactions may increase a fund’s volatilityand could produce disproportionate losses, potentially more than the fund’s principal investment. Risks of these transactions are different from andpossibly greater than risks of investing directly in securities and other traditional instruments. Under certain market conditions, derivatives couldbecome harder to value or sell and may become subject to liquidity risk (i.e., the inability to enter into closing transactions). Regulatory changes inderivative markets could impact the cost of or the fund’s ability to engage in derivative transactions. Derivatives and other strategic transactions thatthe fund intends to utilize include: foreign currency forward contracts, futures contracts, options, credit default swaps, and interest-rate swaps. Foreigncurrency forward contracts, futures contracts, options, and swaps generally are subject to counterparty risk. In addition, swaps may be subject tointerest-rate and settlement risk, and the risk of default of the underlying reference obligation. Derivatives associated with foreign currencytransactions are subject to currency risk.
Initial public offerings risk. IPO share prices are frequently volatile and may significantly impact fund performance.
Large company risk. Larger companies may grow more slowly than smaller companies or be slower to respond to business developments. Large-capitalization securities may underperform the market as a whole.
Liquidity risk. The extent (if at all) to which a security may be sold or a derivative position closed without negatively impacting its market value may beimpaired by reduced market activity or participation, legal restrictions, or other economic and market impediments. Liquidity risk may be magnified inrising interest rate environments due to higher than normal redemption rates. Widespread selling of fixed-income securities to satisfy redemptionsduring periods of reduced demand may adversely impact the price or salability of such securities. Periods of heavy redemption could cause the fund tosell assets at a loss or depressed value, which could negatively affect performance. Redemption risk is heightened during periods of declining or illiquidmarkets.
Lower-rated and high-yield fixed-income securities risk. Lower-rated and high-yield fixed-income securities (junk bonds) are subject to greatercredit quality risk, risk of default, and price volatility than higher-rated fixed-income securities, may be considered speculative, and can be difficult toresell.
Mortgage-backed and asset-backed securities risk. Mortgage-backed and asset-backed securities are subject to different combinations ofprepayment, extension, interest-rate, and other market risks.
Sector risk. When a fund focuses its investments in certain sectors of the economy, its performance may be driven largely by sector performance andcould fluctuate more widely than if the fund were invested more evenly across sectors.
Short sales risk. In a short sale, a fund pays interest on the borrowed security. The fund will lose money if the security price increases between theshort sale and the replacement date.
Small and mid-sized company risk. Small and mid-sized companies are generally less established and may be more volatile than larger companies.Small and/or mid-capitalization securities may underperform the market as a whole.
Past performanceThis section normally shows how the fund’s total returns have varied from year to year, along with a broad-based market index for reference. Becausethe fund has not commenced operations as of the date of this Prospectus, there is no past performance to report.
Investment managementInvestment Advisor John Hancock Investment Management Services, LLC§
Subadvisor John Hancock Asset Management a division of Manulife Asset Management (US) LLC§
Subadvisor John Hancock Asset Management a division of Manulife Asset Management (North America) Limited
Portfolio managementRobert BoydaHead of Capital Markets and Strategy and Co-Head of Portfolio Solutions Group, John HancockAsset Management a division of Manulife AssetManagement (US) LLCManaged fund since inception
Robert Sykes, CFAManaging Director, Portfolio Manager ofPortfolio Solutions Group,John Hancock Asset Management a division ofManulife Asset Management (US) LLCManaged fund since 2018
Nathan Thooft, CFASenior Managing Director, Senior PortfolioManager, Co-Head of Portfolio SolutionsGroup, John Hancock Asset Management adivision of Manulife Asset Management (US)LLCManaged fund since inception
.114

Other important information regarding the fundFor important information about taxes and financial intermediary compensation, please turn to “Additional information about the funds” at page258 of the Prospectus.
.115

Lifecycle 2040 Trust Investment objectiveTo seek high total return until the fund’s target retirement date.
Fees and expensesThis table describes the fees and expenses that you may pay if you buy and hold shares of the fund. The fees and expenses do not reflect fees andexpenses of any variable insurance contract that may use the fund as its underlying investment option and would be higher if they did.
Annual fund operating expenses (%) (expenses that you pay each year as a percentage of the valueof your investment) Series I1 Series II1 Series NAV1
Management fee 0.06 0.06 0.06
Distribution and service (Rule 12b-1) fees 0.05 0.25 0.00
Other expenses 0.09 0.09 0.09
Acquired fund fees and expenses2 0.78 0.78 0.78
Total annual fund operating expenses 0.98 1.18 0.93
1 For funds and classes that have not commenced operations or have an inception date of less than six months as of December 31, 2017, expenses are estimated.2 The “Total annual fund operating expenses” shown may not correlate to the fund’s ratios of expenses to average daily net assets shown in the “Financial highlights” section of
the fund’s prospectus, which does not include “Acquired fund fees and expenses.”
Expense exampleThe examples are intended to help you compare the cost of investing in the fund with the cost of investing in other mutual funds. The examplesassume that $10,000 is invested in the fund for the periods indicated and then all shares are redeemed at the end of those periods. The examples alsoassume that the investment has a 5% return each year and that the fund’s operating expenses remain the same. The expense example does not reflectfees and expenses of any variable insurance contract that may use the fund as its underlying investment option and would be higher if they did.Although your actual costs may be higher or lower, based on these assumptions your costs would be:
Expenses ($) Series I Series II Series NAV
1 year 100 120 95
3 years 312 375 296
Portfolio turnoverThe fund, which operates as a fund of funds and invests in underlying funds, does not pay transaction costs, such as commissions, when it buys andsells shares of underlying funds (or “turns over” its portfolio). An underlying fund does pay transaction costs when it turns over its portfolio, and ahigher portfolio turnover rate may indicate higher transaction costs. These costs, which are not reflected in annual fund operating expenses or in theexample, affect the performance of the underlying funds and of the fund. Because the fund had not commenced operations as of the date of thisprospectus, there is no portfolio turnover to report.
Principal investment strategiesUnder normal market conditions, the fund invests substantially all of its assets in underlying funds using an asset allocation strategy designed forinvestors expected to retire around the year 2040. Over time, the asset allocation strategy will change according to a predetermined glide path as setforth below.
After December 31st of the designated retirement year of the fund, the fund will, under normal market conditions, continue to invest its assets inaccordance with the predetermined “glide path” set forth below although the subadvisors may at times determine in light of prevailing market oreconomic conditions that the fund’s asset allocations should vary from those indicated by the “glide path” in order to preserve the fund’s assets or tohelp it achieve its objective.
Within the prescribed percentage allocation, the subadvisors select the percentage level to be maintained in specific underlying funds. The subadvisorsmay, from time to time, change the allocation in specific underlying funds or rebalance the underlying funds. To maintain target allocation in theunderlying funds, daily cash flows for the fund will be directed to its underlying funds that most deviate from target.
The allocations reflected in the glide path are also referred to as “neutral” allocations because they do not reflect active decisions made by thesubadvisors to produce an overweight or an underweight position in a particular asset class based on the subadvisors’ market outlook. The fund has atarget allocation for the broad asset classes of equities and fixed income but may invest outside these target allocations to protect the fund or help itachieve its objective.
The investment performance of the fund will reflect both its subadvisors’ allocation decisions with respect to underlying funds and investments and theinvestment decisions made by the underlying funds’ subadvisors.
.116

In addition to investing in exchange-traded funds (ETFs), the fund may also invest in the securities of other investment companies and may make directinvestments in other types of investments, such as equity and fixed-income securities, including U.S. government securities, closed-end funds andpartnerships. See “Other Permitted Investments by the Funds of Funds.” The fund may also engage in short selling of securities.
The fund may invest in various underlying funds that as a group hold a wide range of equity type securities in their portfolios. These include small-,mid- and large-capitalization stocks, domestic and foreign securities (including emerging market securities) and sector holdings such as utilities, scienceand technology stocks. Each of the underlying funds has its own investment strategy that, for example, may focus on growth stocks or value stocks ormay employ a strategy combining growth and income stocks and/or may invest in derivatives such as options on securities and futures contracts.Certain of the underlying funds focus their investment strategy on fixed income securities, which may include investment grade and below investmentgrade debt securities with maturities that range from short to longer term. The fixed income underlying funds collectively hold various types of debtinstruments such as corporate bonds and mortgage-backed, government issued, domestic and international securities.
The fund bears its own expenses and, in addition, indirectly bears its proportionate share of the expenses of the underlying funds in which it invests.
Use of Hedging and Other Strategic Transactions. The fund is authorized to use all of the various investment strategies referred to under “AdditionalInformation About the Funds’ Principal Risks — Hedging, derivatives and other strategic transactions risk” including, without limitation, investing incredit default swaps, foreign currency forward contracts, futures contracts, interest rate swaps and options.
Fixed-income allocation
Equity allocation
Perc
ent
Equ
ity
(%)
40 35 30 25 20 15 10 5 5 10 15 20 25 30
Years to retirement Years after retirement
Retirement date
>>
>
0
10
20
30
40
50
60
70
80
90
100
Fund Combination after Designated Retirement Date
The Board of Trustees may, in its discretion, determine to combine the fund with another fund if the target allocation of the fund matches the targetallocation of the other fund. In such event, the fund’s shareholders will become shareholders of the other fund. To the extent permitted by applicableregulatory requirements, such a combination would be implemented without seeking the approval of shareholders. There is no assurance that theBoard of Trustees at any point will determine to implement such a combination.
Principal risks of investing in the fund of fundsThe fund of funds is subject to risks, and you could lose money by investing in the fund. The principal risks of investing in the fund of funds include:
Commodity risk. Commodity prices may be volatile due to fluctuating demand, supply disruption, speculation, and other factors. Certain commodityinvestments may have no active trading market at times.
Credit and counterparty risk. The issuer or guarantor of a fixed-income security, the counterparty to an over-the-counter derivatives contract, or aborrower of fund securities may not make timely payments or otherwise honor its obligations. U.S. government securities are subject to varyingdegrees of credit risk depending upon the nature of their support. A downgrade or default affecting any of the fund’s securities could affect the fund’sperformance.
Cybersecurity and operational risk. Cybersecurity breaches may allow an unauthorized party to gain access to fund assets, customer data, orproprietary information, or cause a fund or its service providers to suffer data corruption or lose operational functionality. Similar incidents affectingissuers of a fund’s securities may negatively impact performance. Operational risk may arise from human error, error by third parties, communicationerrors, or technology failures, among other causes.
Economic and market events risk. Events in the U.S. and global financial markets, including actions taken by the U.S. Federal Reserve or foreigncentral banks to stimulate or stabilize economic growth, may at times result in unusually high market volatility, which could negatively impactperformance. Reduced liquidity in credit and fixed-income markets could adversely affect issuers worldwide. Banks and financial services companiescould suffer losses if interest rates rise or economic conditions deteriorate.
Equity securities risk. The price of equity securities may decline due to changes in a company’s financial condition or overall market conditions.
Exchange-traded funds risk. An ETF generally reflects the risks of the underlying securities it is designed to track. A fund bears ETF fees and expensesindirectly.
.117

Exchange-traded notes risk. An ETN generally reflects the risks associated with the assets composing the underlying market benchmark or strategy itis designed to track. ETNs also are subject to issuer and fixed-income risks.
Fixed-income securities risk. A rise in interest rates typically causes bond prices to fall. The longer the average maturity or duration of the bonds heldby a fund, the more sensitive it will likely be to interest-rate fluctuations. An issuer may not make all interest payments or repay all or any of theprincipal borrowed. Changes in a security’s credit quality may adversely affect fund performance.
Fund of funds risk. The fund’s ability to achieve its investment objective will depend largely, in part, on: (i) the underlying funds’ performance,expenses and ability to meet their investment objectives; and (ii) properly rebalancing assets among underlying funds and different asset classes. Thefund is also subject to risks related to: (i) layering of fees of the underlying funds; and (ii) conflicts of interest associated with the subadvisor’s ability toallocate fund assets without limit to other funds it advises and/or other funds advised by affiliated subadvisors. There is no assurance that either thefund or the underlying funds will achieve their investment objectives. A fund bears underlying fund fees and expenses indirectly.
Hedging, derivatives, and other strategic transactions risk. Hedging, derivatives, and other strategic transactions may increase a fund’s volatilityand could produce disproportionate losses, potentially more than the fund’s principal investment. Risks of these transactions are different from andpossibly greater than risks of investing directly in securities and other traditional instruments. Under certain market conditions, derivatives couldbecome harder to value or sell and may become subject to liquidity risk (i.e., the inability to enter into closing transactions). Regulatory changes inderivative markets could impact the cost of or the fund’s ability to engage in derivative transactions. Derivatives and other strategic transactions thatthe fund intends to utilize include: foreign currency forward contracts, futures contracts, options, credit default swaps, and interest-rate swaps. Foreigncurrency forward contracts, futures contracts, options, and swaps generally are subject to counterparty risk. In addition, swaps may be subject tointerest-rate and settlement risk, and the risk of default of the underlying reference obligation. Derivatives associated with foreign currencytransactions are subject to currency risk.
Investment company securities risk. A fund bears underlying fund fees and expenses indirectly.
Lifecycle risk. Managers might not correctly predict market or economic conditions, and you could lose money even close to, during, or after thefund’s designated retirement year.
Liquidity risk. The extent (if at all) to which a security may be sold or a derivative position closed without negatively impacting its market value may beimpaired by reduced market activity or participation, legal restrictions, or other economic and market impediments. Liquidity risk may be magnified inrising interest rate environments due to higher than normal redemption rates. Widespread selling of fixed-income securities to satisfy redemptionsduring periods of reduced demand may adversely impact the price or salability of such securities. Periods of heavy redemption could cause the fund tosell assets at a loss or depressed value, which could negatively affect performance. Redemption risk is heightened during periods of declining or illiquidmarkets.
Short sales risk. In a short sale, a fund pays interest on the borrowed security. The fund will lose money if the security price increases between theshort sale and the replacement date.
Target allocation risk. The fund’s risk profile will change due to reallocation or rebalancing of portfolio assets as the fund approaches its target date.
Principal risks of investing in the underlying fundsThe principal risks of investing in the Underlying Funds include:
Convertible securities risk. The market values of convertible securities tend to fall as interest rates rise and rise as interest rates fall. As the marketprice of underlying common stock declines below the conversion price, the market value of the convertible security tends to be increasingly influencedby its yield.
Credit and counterparty risk. The issuer or guarantor of a fixed-income security, the counterparty to an over-the-counter derivatives contract, or aborrower of fund securities may not make timely payments or otherwise honor its obligations. U.S. government securities are subject to varyingdegrees of credit risk depending upon the nature of their support. A downgrade or default affecting any of the fund’s securities could affect the fund’sperformance.
Currency risk. Fluctuations in exchange rates may adversely affect the U.S. dollar value of a fund’s investments. Foreign currencies may decline invalue, which could negatively impact performance.
Cybersecurity and operational risk. Cybersecurity breaches may allow an unauthorized party to gain access to fund assets, customer data, orproprietary information, or cause a fund or its service providers to suffer data corruption or lose operational functionality. Similar incidents affectingissuers of a fund’s securities may negatively impact performance. Operational risk may arise from human error, error by third parties, communicationerrors, or technology failures, among other causes.
Economic and market events risk. Events in the U.S. and global financial markets, including actions taken by the U.S. Federal Reserve or foreigncentral banks to stimulate or stabilize economic growth, may at times result in unusually high market volatility, which could negatively impactperformance. Reduced liquidity in credit and fixed-income markets could adversely affect issuers worldwide. Banks and financial services companiescould suffer losses if interest rates rise or economic conditions deteriorate.
Equity securities risk. The price of equity securities may decline due to changes in a company’s financial condition or overall market conditions.Growth company securities may fluctuate more in price than other securities because of the greater emphasis on earnings expectations. Securities themanager believes are undervalued may never realize their full potential value, and in certain markets value stocks may underperform the market as awhole.
.118

Fixed-income securities risk. A rise in interest rates typically causes bond prices to fall. The longer the average maturity or duration of the bonds heldby a fund, the more sensitive it will likely be to interest-rate fluctuations. An issuer may not make all interest payments or repay all or any of theprincipal borrowed. Changes in a security’s credit quality may adversely affect fund performance.
Foreign securities risk. Less information may be publicly available regarding foreign issuers. Foreign securities may be subject to foreign taxes andmay be more volatile than U.S. securities. Currency fluctuations and political and economic developments may adversely impact the value of foreignsecurities. The risks of investing in foreign securities are magnified in emerging markets.
Hedging, derivatives, and other strategic transactions risk. Hedging, derivatives, and other strategic transactions may increase a fund’s volatilityand could produce disproportionate losses, potentially more than the fund’s principal investment. Risks of these transactions are different from andpossibly greater than risks of investing directly in securities and other traditional instruments. Under certain market conditions, derivatives couldbecome harder to value or sell and may become subject to liquidity risk (i.e., the inability to enter into closing transactions). Regulatory changes inderivative markets could impact the cost of or the fund’s ability to engage in derivative transactions. Derivatives and other strategic transactions thatthe fund intends to utilize include: foreign currency forward contracts, futures contracts, options, credit default swaps, and interest-rate swaps. Foreigncurrency forward contracts, futures contracts, options, and swaps generally are subject to counterparty risk. In addition, swaps may be subject tointerest-rate and settlement risk, and the risk of default of the underlying reference obligation. Derivatives associated with foreign currencytransactions are subject to currency risk.
Initial public offerings risk. IPO share prices are frequently volatile and may significantly impact fund performance.
Large company risk. Larger companies may grow more slowly than smaller companies or be slower to respond to business developments. Large-capitalization securities may underperform the market as a whole.
Liquidity risk. The extent (if at all) to which a security may be sold or a derivative position closed without negatively impacting its market value may beimpaired by reduced market activity or participation, legal restrictions, or other economic and market impediments. Liquidity risk may be magnified inrising interest rate environments due to higher than normal redemption rates. Widespread selling of fixed-income securities to satisfy redemptionsduring periods of reduced demand may adversely impact the price or salability of such securities. Periods of heavy redemption could cause the fund tosell assets at a loss or depressed value, which could negatively affect performance. Redemption risk is heightened during periods of declining or illiquidmarkets.
Lower-rated and high-yield fixed-income securities risk. Lower-rated and high-yield fixed-income securities (junk bonds) are subject to greatercredit quality risk, risk of default, and price volatility than higher-rated fixed-income securities, may be considered speculative, and can be difficult toresell.
Mortgage-backed and asset-backed securities risk. Mortgage-backed and asset-backed securities are subject to different combinations ofprepayment, extension, interest-rate, and other market risks.
Sector risk. When a fund focuses its investments in certain sectors of the economy, its performance may be driven largely by sector performance andcould fluctuate more widely than if the fund were invested more evenly across sectors.
Short sales risk. In a short sale, a fund pays interest on the borrowed security. The fund will lose money if the security price increases between theshort sale and the replacement date.
Small and mid-sized company risk. Small and mid-sized companies are generally less established and may be more volatile than larger companies.Small and/or mid-capitalization securities may underperform the market as a whole.
Past performanceThis section normally shows how the fund’s total returns have varied from year to year, along with a broad-based market index for reference. Becausethe fund has not commenced operations as of the date of this Prospectus, there is no past performance to report.
Investment managementInvestment Advisor John Hancock Investment Management Services, LLC§
Subadvisor John Hancock Asset Management a division of Manulife Asset Management (US) LLC§
Subadvisor John Hancock Asset Management a division of Manulife Asset Management (North America) Limited
Portfolio managementRobert BoydaHead of Capital Markets and Strategy and Co-Head of Portfolio Solutions Group, John HancockAsset Management a division of Manulife AssetManagement (US) LLCManaged fund since inception
Robert Sykes, CFAManaging Director, Portfolio Manager ofPortfolio Solutions Group,John Hancock Asset Management a division ofManulife Asset Management (US) LLCManaged fund since 2018
Nathan Thooft, CFASenior Managing Director, Senior PortfolioManager, Co-Head of Portfolio SolutionsGroup, John Hancock Asset Management adivision of Manulife Asset Management (US)LLCManaged fund since inception
.119

Other important information regarding the fundFor important information about taxes and financial intermediary compensation, please turn to “Additional information about the funds” at page258 of the Prospectus.
.120
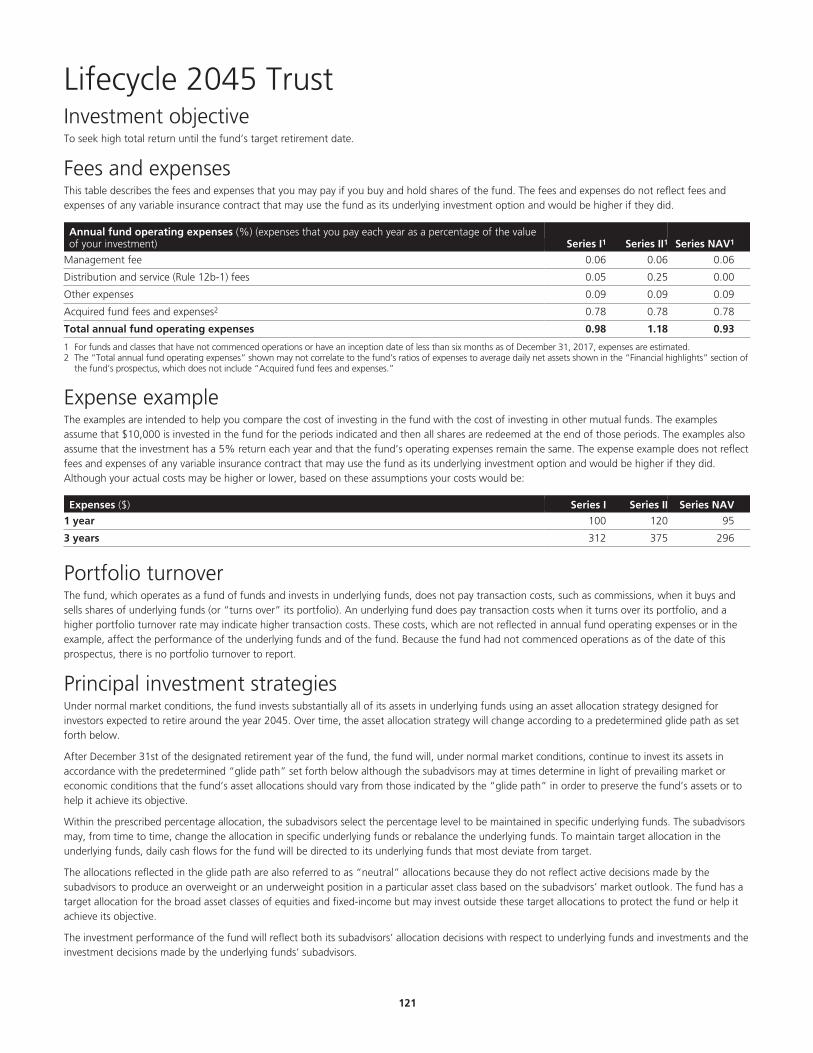
Lifecycle 2045 Trust Investment objectiveTo seek high total return until the fund’s target retirement date.
Fees and expensesThis table describes the fees and expenses that you may pay if you buy and hold shares of the fund. The fees and expenses do not reflect fees andexpenses of any variable insurance contract that may use the fund as its underlying investment option and would be higher if they did.
Annual fund operating expenses (%) (expenses that you pay each year as a percentage of the valueof your investment) Series I1 Series II1 Series NAV1
Management fee 0.06 0.06 0.06
Distribution and service (Rule 12b-1) fees 0.05 0.25 0.00
Other expenses 0.09 0.09 0.09
Acquired fund fees and expenses2 0.78 0.78 0.78
Total annual fund operating expenses 0.98 1.18 0.93
1 For funds and classes that have not commenced operations or have an inception date of less than six months as of December 31, 2017, expenses are estimated.2 The “Total annual fund operating expenses” shown may not correlate to the fund’s ratios of expenses to average daily net assets shown in the “Financial highlights” section of
the fund’s prospectus, which does not include “Acquired fund fees and expenses.”
Expense exampleThe examples are intended to help you compare the cost of investing in the fund with the cost of investing in other mutual funds. The examplesassume that $10,000 is invested in the fund for the periods indicated and then all shares are redeemed at the end of those periods. The examples alsoassume that the investment has a 5% return each year and that the fund’s operating expenses remain the same. The expense example does not reflectfees and expenses of any variable insurance contract that may use the fund as its underlying investment option and would be higher if they did.Although your actual costs may be higher or lower, based on these assumptions your costs would be:
Expenses ($) Series I Series II Series NAV
1 year 100 120 95
3 years 312 375 296
Portfolio turnoverThe fund, which operates as a fund of funds and invests in underlying funds, does not pay transaction costs, such as commissions, when it buys andsells shares of underlying funds (or “turns over” its portfolio). An underlying fund does pay transaction costs when it turns over its portfolio, and ahigher portfolio turnover rate may indicate higher transaction costs. These costs, which are not reflected in annual fund operating expenses or in theexample, affect the performance of the underlying funds and of the fund. Because the fund had not commenced operations as of the date of thisprospectus, there is no portfolio turnover to report.
Principal investment strategiesUnder normal market conditions, the fund invests substantially all of its assets in underlying funds using an asset allocation strategy designed forinvestors expected to retire around the year 2045. Over time, the asset allocation strategy will change according to a predetermined glide path as setforth below.
After December 31st of the designated retirement year of the fund, the fund will, under normal market conditions, continue to invest its assets inaccordance with the predetermined “glide path” set forth below although the subadvisors may at times determine in light of prevailing market oreconomic conditions that the fund’s asset allocations should vary from those indicated by the “glide path” in order to preserve the fund’s assets or tohelp it achieve its objective.
Within the prescribed percentage allocation, the subadvisors select the percentage level to be maintained in specific underlying funds. The subadvisorsmay, from time to time, change the allocation in specific underlying funds or rebalance the underlying funds. To maintain target allocation in theunderlying funds, daily cash flows for the fund will be directed to its underlying funds that most deviate from target.
The allocations reflected in the glide path are also referred to as “neutral” allocations because they do not reflect active decisions made by thesubadvisors to produce an overweight or an underweight position in a particular asset class based on the subadvisors’ market outlook. The fund has atarget allocation for the broad asset classes of equities and fixed-income but may invest outside these target allocations to protect the fund or help itachieve its objective.
The investment performance of the fund will reflect both its subadvisors’ allocation decisions with respect to underlying funds and investments and theinvestment decisions made by the underlying funds’ subadvisors.
.121

In addition to investing in exchange-traded funds (ETFs), the fund may also invest in the securities of other investment companies and may make directinvestments in other types of investments, such as equity and fixed-income securities, including U.S. government securities, closed-end funds andpartnerships. See “Other Permitted Investments by the Funds of Funds.” The fund may also engage in short selling of securities.
The fund may invest in various underlying funds that as a group hold a wide range of equity type securities in their portfolios. These include small-,mid- and large-capitalization stocks, domestic and foreign securities (including emerging market securities) and sector holdings such as utilities, scienceand technology stocks. Each of the underlying funds has its own investment strategy that, for example, may focus on growth stocks or value stocks ormay employ a strategy combining growth and income stocks and/or may invest in derivatives such as options on securities and futures contracts.Certain of the underlying funds focus their investment strategy on fixed income securities, which may include investment grade and below investmentgrade debt securities with maturities that range from short to longer term. The fixed income underlying funds collectively hold various types of debtinstruments such as corporate bonds and mortgage-backed, government issued, domestic and international securities.
The fund bears its own expenses and, in addition, indirectly bears its proportionate share of the expenses of the underlying funds in which it invests.
Use of Hedging and Other Strategic Transactions. The fund is authorized to use all of the various investment strategies referred to under “AdditionalInformation About the Funds’ Principal Risks — Hedging, derivatives and other strategic transactions risk” including, without limitation, investing incredit default swaps, foreign currency forward contracts, futures contracts, interest rate swaps and options.
Fixed-income allocation
Equity allocation
Perc
ent
Equ
ity
(%)
40 35 30 25 20 15 10 5 5 10 15 20 25 30
Years to retirement Years after retirement
Retirement date
>>
>
0
10
20
30
40
50
60
70
80
90
100
Fund Combination after Designated Retirement Date
The Board of Trustees may, in its discretion, determine to combine the fund with another fund if the target allocation of the fund matches the targetallocation of the other fund. In such event, the fund’s shareholders will become shareholders of the other fund. To the extent permitted by applicableregulatory requirements, such a combination would be implemented without seeking the approval of shareholders. There is no assurance that theBoard of Trustees at any point will determine to implement such a combination.
Principal risks of investing in the fund of fundsThe fund of funds is subject to risks, and you could lose money by investing in the fund. The principal risks of investing in the fund of funds include:
Commodity risk. Commodity prices may be volatile due to fluctuating demand, supply disruption, speculation, and other factors. Certain commodityinvestments may have no active trading market at times.
Credit and counterparty risk. The issuer or guarantor of a fixed-income security, the counterparty to an over-the-counter derivatives contract, or aborrower of fund securities may not make timely payments or otherwise honor its obligations. U.S. government securities are subject to varyingdegrees of credit risk depending upon the nature of their support. A downgrade or default affecting any of the fund’s securities could affect the fund’sperformance.
Cybersecurity and operational risk. Cybersecurity breaches may allow an unauthorized party to gain access to fund assets, customer data, orproprietary information, or cause a fund or its service providers to suffer data corruption or lose operational functionality. Similar incidents affectingissuers of a fund’s securities may negatively impact performance. Operational risk may arise from human error, error by third parties, communicationerrors, or technology failures, among other causes.
Economic and market events risk. Events in the U.S. and global financial markets, including actions taken by the U.S. Federal Reserve or foreigncentral banks to stimulate or stabilize economic growth, may at times result in unusually high market volatility, which could negatively impactperformance. Reduced liquidity in credit and fixed-income markets could adversely affect issuers worldwide. Banks and financial services companiescould suffer losses if interest rates rise or economic conditions deteriorate.
Equity securities risk. The price of equity securities may decline due to changes in a company’s financial condition or overall market conditions.
Exchange-traded funds risk. An ETF generally reflects the risks of the underlying securities it is designed to track. A fund bears ETF fees and expensesindirectly.
.122

Exchange-traded notes risk. An ETN generally reflects the risks associated with the assets composing the underlying market benchmark or strategy itis designed to track. ETNs also are subject to issuer and fixed-income risks.
Fixed-income securities risk. A rise in interest rates typically causes bond prices to fall. The longer the average maturity or duration of the bonds heldby a fund, the more sensitive it will likely be to interest-rate fluctuations. An issuer may not make all interest payments or repay all or any of theprincipal borrowed. Changes in a security’s credit quality may adversely affect fund performance.
Fund of funds risk. The fund’s ability to achieve its investment objective will depend largely, in part, on: (i) the underlying funds’ performance,expenses and ability to meet their investment objectives; and (ii) properly rebalancing assets among underlying funds and different asset classes. Thefund is also subject to risks related to: (i) layering of fees of the underlying funds; and (ii) conflicts of interest associated with the subadvisor’s ability toallocate fund assets without limit to other funds it advises and/or other funds advised by affiliated subadvisors. There is no assurance that either thefund or the underlying funds will achieve their investment objectives. A fund bears underlying fund fees and expenses indirectly.
Hedging, derivatives, and other strategic transactions risk. Hedging, derivatives, and other strategic transactions may increase a fund’s volatilityand could produce disproportionate losses, potentially more than the fund’s principal investment. Risks of these transactions are different from andpossibly greater than risks of investing directly in securities and other traditional instruments. Under certain market conditions, derivatives couldbecome harder to value or sell and may become subject to liquidity risk (i.e., the inability to enter into closing transactions). Regulatory changes inderivative markets could impact the cost of or the fund’s ability to engage in derivative transactions. Derivatives and other strategic transactions thatthe fund intends to utilize include: foreign currency forward contracts, futures contracts, options, credit default swaps, and interest-rate swaps. Foreigncurrency forward contracts, futures contracts, options, and swaps generally are subject to counterparty risk. In addition, swaps may be subject tointerest-rate and settlement risk, and the risk of default of the underlying reference obligation. Derivatives associated with foreign currencytransactions are subject to currency risk.
Investment company securities risk. A fund bears underlying fund fees and expenses indirectly.
Lifecycle risk. Managers might not correctly predict market or economic conditions, and you could lose money even close to, during, or after thefund’s designated retirement year.
Liquidity risk. The extent (if at all) to which a security may be sold or a derivative position closed without negatively impacting its market value may beimpaired by reduced market activity or participation, legal restrictions, or other economic and market impediments. Liquidity risk may be magnified inrising interest rate environments due to higher than normal redemption rates. Widespread selling of fixed-income securities to satisfy redemptionsduring periods of reduced demand may adversely impact the price or salability of such securities. Periods of heavy redemption could cause the fund tosell assets at a loss or depressed value, which could negatively affect performance. Redemption risk is heightened during periods of declining or illiquidmarkets.
Short sales risk. In a short sale, a fund pays interest on the borrowed security. The fund will lose money if the security price increases between theshort sale and the replacement date.
Target allocation risk. The fund’s risk profile will change due to reallocation or rebalancing of portfolio assets as the fund approaches its target date.
Principal risks of investing in the underlying fundsThe principal risks of investing in the Underlying Funds include:
Convertible securities risk. The market values of convertible securities tend to fall as interest rates rise and rise as interest rates fall. As the marketprice of underlying common stock declines below the conversion price, the market value of the convertible security tends to be increasingly influencedby its yield.
Credit and counterparty risk. The issuer or guarantor of a fixed-income security, the counterparty to an over-the-counter derivatives contract, or aborrower of fund securities may not make timely payments or otherwise honor its obligations. U.S. government securities are subject to varyingdegrees of credit risk depending upon the nature of their support. A downgrade or default affecting any of the fund’s securities could affect the fund’sperformance.
Currency risk. Fluctuations in exchange rates may adversely affect the U.S. dollar value of a fund’s investments. Foreign currencies may decline invalue, which could negatively impact performance.
Cybersecurity and operational risk. Cybersecurity breaches may allow an unauthorized party to gain access to fund assets, customer data, orproprietary information, or cause a fund or its service providers to suffer data corruption or lose operational functionality. Similar incidents affectingissuers of a fund’s securities may negatively impact performance. Operational risk may arise from human error, error by third parties, communicationerrors, or technology failures, among other causes.
Economic and market events risk. Events in the U.S. and global financial markets, including actions taken by the U.S. Federal Reserve or foreigncentral banks to stimulate or stabilize economic growth, may at times result in unusually high market volatility, which could negatively impactperformance. Reduced liquidity in credit and fixed-income markets could adversely affect issuers worldwide. Banks and financial services companiescould suffer losses if interest rates rise or economic conditions deteriorate.
Equity securities risk. The price of equity securities may decline due to changes in a company’s financial condition or overall market conditions.Growth company securities may fluctuate more in price than other securities because of the greater emphasis on earnings expectations. Securities themanager believes are undervalued may never realize their full potential value, and in certain markets value stocks may underperform the market as awhole.
.123
Fixed-income securities risk. A rise in interest rates typically causes bond prices to fall. The longer the average maturity or duration of the bonds heldby a fund, the more sensitive it will likely be to interest-rate fluctuations. An issuer may not make all interest payments or repay all or any of theprincipal borrowed. Changes in a security’s credit quality may adversely affect fund performance.
Foreign securities risk. Less information may be publicly available regarding foreign issuers. Foreign securities may be subject to foreign taxes andmay be more volatile than U.S. securities. Currency fluctuations and political and economic developments may adversely impact the value of foreignsecurities. The risks of investing in foreign securities are magnified in emerging markets.
Hedging, derivatives, and other strategic transactions risk. Hedging, derivatives, and other strategic transactions may increase a fund’s volatilityand could produce disproportionate losses, potentially more than the fund’s principal investment. Risks of these transactions are different from andpossibly greater than risks of investing directly in securities and other traditional instruments. Under certain market conditions, derivatives couldbecome harder to value or sell and may become subject to liquidity risk (i.e., the inability to enter into closing transactions). Regulatory changes inderivative markets could impact the cost of or the fund’s ability to engage in derivative transactions. Derivatives and other strategic transactions thatthe fund intends to utilize include: foreign currency forward contracts, futures contracts, options, credit default swaps, and interest-rate swaps. Foreigncurrency forward contracts, futures contracts, options, and swaps generally are subject to counterparty risk. In addition, swaps may be subject tointerest-rate and settlement risk, and the risk of default of the underlying reference obligation. Derivatives associated with foreign currencytransactions are subject to currency risk.
Initial public offerings risk. IPO share prices are frequently volatile and may significantly impact fund performance.
Large company risk. Larger companies may grow more slowly than smaller companies or be slower to respond to business developments. Large-capitalization securities may underperform the market as a whole.
Liquidity risk. The extent (if at all) to which a security may be sold or a derivative position closed without negatively impacting its market value may beimpaired by reduced market activity or participation, legal restrictions, or other economic and market impediments. Liquidity risk may be magnified inrising interest rate environments due to higher than normal redemption rates. Widespread selling of fixed-income securities to satisfy redemptionsduring periods of reduced demand may adversely impact the price or salability of such securities. Periods of heavy redemption could cause the fund tosell assets at a loss or depressed value, which could negatively affect performance. Redemption risk is heightened during periods of declining or illiquidmarkets.
Lower-rated and high-yield fixed-income securities risk. Lower-rated and high-yield fixed-income securities (junk bonds) are subject to greatercredit quality risk, risk of default, and price volatility than higher-rated fixed-income securities, may be considered speculative, and can be difficult toresell.
Mortgage-backed and asset-backed securities risk. Mortgage-backed and asset-backed securities are subject to different combinations ofprepayment, extension, interest-rate, and other market risks.
Sector risk. When a fund focuses its investments in certain sectors of the economy, its performance may be driven largely by sector performance andcould fluctuate more widely than if the fund were invested more evenly across sectors.
Short sales risk. In a short sale, a fund pays interest on the borrowed security. The fund will lose money if the security price increases between theshort sale and the replacement date.
Small and mid-sized company risk. Small and mid-sized companies are generally less established and may be more volatile than larger companies.Small and/or mid-capitalization securities may underperform the market as a whole.
Past performanceThis section normally shows how the fund’s total returns have varied from year to year, along with a broad-based market index for reference. Becausethe fund has not commenced operations as of the date of this Prospectus, there is no past performance to report.
Investment managementInvestment Advisor John Hancock Investment Management Services, LLC§
Subadvisor John Hancock Asset Management a division of Manulife Asset Management (US) LLC§
Subadvisor John Hancock Asset Management a division of Manulife Asset Management (North America) Limited
Portfolio managementRobert BoydaHead of Capital Markets and Strategy and Co-Head of Portfolio Solutions Group, John HancockAsset Management a division of Manulife AssetManagement (US) LLCManaged fund since inception
Robert Sykes, CFAManaging Director, Portfolio Manager ofPortfolio Solutions Group,John Hancock Asset Management a division ofManulife Asset Management (US) LLCManaged fund since 2018
Nathan Thooft, CFASenior Managing Director, Senior PortfolioManager, Co-Head of Portfolio SolutionsGroup, John Hancock Asset Management adivision of Manulife Asset Management (US)LLCManaged fund since inception
.124

Other important information regarding the fundFor important information about taxes and financial intermediary compensation, please turn to “Additional information about the funds” at page258 of the Prospectus.
.125

Lifecycle 2050 Trust Investment objectiveTo seek high total return until the fund’s target retirement date.
Fees and expensesThis table describes the fees and expenses that you may pay if you buy and hold shares of the fund. The fees and expenses do not reflect fees andexpenses of any variable insurance contract that may use the fund as its underlying investment option and would be higher if they did.
Annual fund operating expenses (%) (expenses that you pay each year as a percentage of the valueof your investment) Series I1 Series II1 Series NAV1
Management fee 0.06 0.06 0.06
Distribution and service (Rule 12b-1) fees 0.05 0.25 0.00
Other expenses 0.09 0.09 0.09
Acquired fund fees and expenses2 0.78 0.78 0.78
Total annual fund operating expenses 0.98 1.18 0.93
1 For funds and classes that have not commenced operations or have an inception date of less than six months as of December 31, 2017, expenses are estimated.2 The “Total annual fund operating expenses” shown may not correlate to the fund’s ratios of expenses to average daily net assets shown in the “Financial highlights” section of
the fund’s prospectus, which does not include “Acquired fund fees and expenses.”
Expense exampleThe examples are intended to help you compare the cost of investing in the fund with the cost of investing in other mutual funds. The examplesassume that $10,000 is invested in the fund for the periods indicated and then all shares are redeemed at the end of those periods. The examples alsoassume that the investment has a 5% return each year and that the fund’s operating expenses remain the same. The expense example does not reflectfees and expenses of any variable insurance contract that may use the fund as its underlying investment option and would be higher if they did.Although your actual costs may be higher or lower, based on these assumptions your costs would be:
Expenses ($) Series I Series II Series NAV
1 year 100 120 95
3 years 312 375 296
Portfolio turnoverThe fund, which operates as a fund of funds and invests in underlying funds, does not pay transaction costs, such as commissions, when it buys andsells shares of underlying funds (or “turns over” its portfolio). An underlying fund does pay transaction costs when it turns over its portfolio, and ahigher portfolio turnover rate may indicate higher transaction costs. These costs, which are not reflected in annual fund operating expenses or in theexample, affect the performance of the underlying funds and of the fund. Because the fund had not commenced operations as of the date of thisprospectus, there is no portfolio turnover to report.
Principal investment strategiesUnder normal market conditions, the fund invests substantially all of its assets in underlying funds using an asset allocation strategy designed forinvestors expected to retire around the year 2050. Over time, the asset allocation strategy will change according to a predetermined glide path as setforth below.
After December 31st of the designated retirement year of the fund, the fund will, under normal market conditions, continue to invest its assets inaccordance with the predetermined “glide path” set forth below although the subadvisors may at times determine in light of prevailing market oreconomic conditions that the fund’s asset allocations should vary from those indicated by the “glide path” in order to preserve the fund’s assets or tohelp it achieve its objective.
Within the prescribed percentage allocation, the subadvisors select the percentage level to be maintained in specific underlying funds. The subadvisorsmay, from time to time, change the allocation in specific underlying funds or rebalance the underlying funds. To maintain target allocation in theunderlying funds, daily cash flows for the fund will be directed to its underlying funds that most deviate from target.
The allocations reflected in the glide path are also referred to as “neutral” allocations because they do not reflect active decisions made by thesubadvisors to produce an overweight or an underweight position in a particular asset class based on the subadvisors’ market outlook. The fund has atarget allocation for the broad asset classes of equities and fixed income but may invest outside these target allocations to protect the fund or help itachieve its objective.
The investment performance of the fund will reflect both its subadvisors’ allocation decisions with respect to underlying funds and investments and theinvestment decisions made by the underlying funds’ subadvisors.
.126

In addition to investing in exchange-traded funds (ETFs), the fund may also invest in the securities of other investment companies and may make directinvestments in other types of investments, such as equity and fixed-income securities, including U.S. government securities, closed-end funds andpartnerships. See “Other Permitted Investments by the Funds of Funds.” The fund may also engage in short selling of securities.
The fund may invest in various underlying funds that as a group hold a wide range of equity type securities in their portfolios. These include small-,mid- and large-capitalization stocks, domestic and foreign securities (including emerging market securities) and sector holdings such as utilities, scienceand technology stocks. Each of the underlying funds has its own investment strategy that, for example, may focus on growth stocks or value stocks ormay employ a strategy combining growth and income stocks and/or may invest in derivatives such as options on securities and futures contracts.Certain of the underlying funds focus their investment strategy on fixed income securities, which may include investment grade and below investmentgrade debt securities with maturities that range from short to longer term. The fixed income underlying funds collectively hold various types of debtinstruments such as corporate bonds and mortgage-backed, government issued, domestic and international securities.
The fund bears its own expenses and, in addition, indirectly bears its proportionate share of the expenses of the underlying funds in which it invests.
Use of Hedging and Other Strategic Transactions. The fund is authorized to use all of the various investment strategies referred to under “AdditionalInformation About the Funds’ Principal Risks — Hedging, derivatives and other strategic transactions risk” including, without limitation, investing incredit default swaps, foreign currency forward contracts, futures contracts, interest rate swaps and options.
Fixed-income allocation
Equity allocation
Perc
ent
Equ
ity
(%)
40 35 30 25 20 15 10 5 5 10 15 20 25 30
Years to retirement Years after retirement
Retirement date
>>
>
0
10
20
30
40
50
60
70
80
90
100
Fund Combination after Designated Retirement Date
The Board of Trustees may, in its discretion, determine to combine the fund with another fund if the target allocation of the fund matches the targetallocation of the other fund. In such event, the fund’s shareholders will become shareholders of the other fund. To the extent permitted by applicableregulatory requirements, such a combination would be implemented without seeking the approval of shareholders. There is no assurance that theBoard of Trustees at any point will determine to implement such a combination.
Principal risks of investing in the fund of fundsThe fund of funds is subject to risks, and you could lose money by investing in the fund. The principal risks of investing in the fund of funds include:
Commodity risk. Commodity prices may be volatile due to fluctuating demand, supply disruption, speculation, and other factors. Certain commodityinvestments may have no active trading market at times.
Credit and counterparty risk. The issuer or guarantor of a fixed-income security, the counterparty to an over-the-counter derivatives contract, or aborrower of fund securities may not make timely payments or otherwise honor its obligations. U.S. government securities are subject to varyingdegrees of credit risk depending upon the nature of their support. A downgrade or default affecting any of the fund’s securities could affect the fund’sperformance.
Cybersecurity and operational risk. Cybersecurity breaches may allow an unauthorized party to gain access to fund assets, customer data, orproprietary information, or cause a fund or its service providers to suffer data corruption or lose operational functionality. Similar incidents affectingissuers of a fund’s securities may negatively impact performance. Operational risk may arise from human error, error by third parties, communicationerrors, or technology failures, among other causes.
Economic and market events risk. Events in the U.S. and global financial markets, including actions taken by the U.S. Federal Reserve or foreigncentral banks to stimulate or stabilize economic growth, may at times result in unusually high market volatility, which could negatively impactperformance. Reduced liquidity in credit and fixed-income markets could adversely affect issuers worldwide. Banks and financial services companiescould suffer losses if interest rates rise or economic conditions deteriorate.
Equity securities risk. The price of equity securities may decline due to changes in a company’s financial condition or overall market conditions.
Exchange-traded funds risk. An ETF generally reflects the risks of the underlying securities it is designed to track. A fund bears ETF fees and expensesindirectly.
.127

Exchange-traded notes risk. An ETN generally reflects the risks associated with the assets composing the underlying market benchmark or strategy itis designed to track. ETNs also are subject to issuer and fixed-income risks.
Fixed-income securities risk. A rise in interest rates typically causes bond prices to fall. The longer the average maturity or duration of the bonds heldby a fund, the more sensitive it will likely be to interest-rate fluctuations. An issuer may not make all interest payments or repay all or any of theprincipal borrowed. Changes in a security’s credit quality may adversely affect fund performance.
Fund of funds risk. The fund’s ability to achieve its investment objective will depend largely, in part, on: (i) the underlying funds’ performance,expenses and ability to meet their investment objectives; and (ii) properly rebalancing assets among underlying funds and different asset classes. Thefund is also subject to risks related to: (i) layering of fees of the underlying funds; and (ii) conflicts of interest associated with the subadvisor’s ability toallocate fund assets without limit to other funds it advises and/or other funds advised by affiliated subadvisors. There is no assurance that either thefund or the underlying funds will achieve their investment objectives. A fund bears underlying fund fees and expenses indirectly.
Hedging, derivatives, and other strategic transactions risk. Hedging, derivatives, and other strategic transactions may increase a fund’s volatilityand could produce disproportionate losses, potentially more than the fund’s principal investment. Risks of these transactions are different from andpossibly greater than risks of investing directly in securities and other traditional instruments. Under certain market conditions, derivatives couldbecome harder to value or sell and may become subject to liquidity risk (i.e., the inability to enter into closing transactions). Regulatory changes inderivative markets could impact the cost of or the fund’s ability to engage in derivative transactions. Derivatives and other strategic transactions thatthe fund intends to utilize include: foreign currency forward contracts, futures contracts, options, credit default swaps, and interest-rate swaps. Foreigncurrency forward contracts, futures contracts, options, and swaps generally are subject to counterparty risk. In addition, swaps may be subject tointerest-rate and settlement risk, and the risk of default of the underlying reference obligation. Derivatives associated with foreign currencytransactions are subject to currency risk.
Investment company securities risk. A fund bears underlying fund fees and expenses indirectly.
Lifecycle risk. Managers might not correctly predict market or economic conditions, and you could lose money even close to, during, or after thefund’s designated retirement year.
Liquidity risk. The extent (if at all) to which a security may be sold or a derivative position closed without negatively impacting its market value may beimpaired by reduced market activity or participation, legal restrictions, or other economic and market impediments. Liquidity risk may be magnified inrising interest rate environments due to higher than normal redemption rates. Widespread selling of fixed-income securities to satisfy redemptionsduring periods of reduced demand may adversely impact the price or salability of such securities. Periods of heavy redemption could cause the fund tosell assets at a loss or depressed value, which could negatively affect performance. Redemption risk is heightened during periods of declining or illiquidmarkets.
Short sales risk. In a short sale, a fund pays interest on the borrowed security. The fund will lose money if the security price increases between theshort sale and the replacement date.
Target allocation risk. The fund’s risk profile will change due to reallocation or rebalancing of portfolio assets as the fund approaches its target date.
Principal risks of investing in the underlying fundsThe principal risks of investing in the Underlying Funds include:
Convertible securities risk. The market values of convertible securities tend to fall as interest rates rise and rise as interest rates fall. As the marketprice of underlying common stock declines below the conversion price, the market value of the convertible security tends to be increasingly influencedby its yield.
Credit and counterparty risk. The issuer or guarantor of a fixed-income security, the counterparty to an over-the-counter derivatives contract, or aborrower of fund securities may not make timely payments or otherwise honor its obligations. U.S. government securities are subject to varyingdegrees of credit risk depending upon the nature of their support. A downgrade or default affecting any of the fund’s securities could affect the fund’sperformance.
Currency risk. Fluctuations in exchange rates may adversely affect the U.S. dollar value of a fund’s investments. Foreign currencies may decline invalue, which could negatively impact performance.
Cybersecurity and operational risk. Cybersecurity breaches may allow an unauthorized party to gain access to fund assets, customer data, orproprietary information, or cause a fund or its service providers to suffer data corruption or lose operational functionality. Similar incidents affectingissuers of a fund’s securities may negatively impact performance. Operational risk may arise from human error, error by third parties, communicationerrors, or technology failures, among other causes.
Economic and market events risk. Events in the U.S. and global financial markets, including actions taken by the U.S. Federal Reserve or foreigncentral banks to stimulate or stabilize economic growth, may at times result in unusually high market volatility, which could negatively impactperformance. Reduced liquidity in credit and fixed-income markets could adversely affect issuers worldwide. Banks and financial services companiescould suffer losses if interest rates rise or economic conditions deteriorate.
Equity securities risk. The price of equity securities may decline due to changes in a company’s financial condition or overall market conditions.Growth company securities may fluctuate more in price than other securities because of the greater emphasis on earnings expectations. Securities themanager believes are undervalued may never realize their full potential value, and in certain markets value stocks may underperform the market as awhole.
.128

Fixed-income securities risk. A rise in interest rates typically causes bond prices to fall. The longer the average maturity or duration of the bonds heldby a fund, the more sensitive it will likely be to interest-rate fluctuations. An issuer may not make all interest payments or repay all or any of theprincipal borrowed. Changes in a security’s credit quality may adversely affect fund performance.
Foreign securities risk. Less information may be publicly available regarding foreign issuers. Foreign securities may be subject to foreign taxes andmay be more volatile than U.S. securities. Currency fluctuations and political and economic developments may adversely impact the value of foreignsecurities. The risks of investing in foreign securities are magnified in emerging markets.
Hedging, derivatives, and other strategic transactions risk. Hedging, derivatives, and other strategic transactions may increase a fund’s volatilityand could produce disproportionate losses, potentially more than the fund’s principal investment. Risks of these transactions are different from andpossibly greater than risks of investing directly in securities and other traditional instruments. Under certain market conditions, derivatives couldbecome harder to value or sell and may become subject to liquidity risk (i.e., the inability to enter into closing transactions). Regulatory changes inderivative markets could impact the cost of or the fund’s ability to engage in derivative transactions. Derivatives and other strategic transactions thatthe fund intends to utilize include: foreign currency forward contracts, futures contracts, options, credit default swaps, and interest-rate swaps. Foreigncurrency forward contracts, futures contracts, options, and swaps generally are subject to counterparty risk. In addition, swaps may be subject tointerest-rate and settlement risk, and the risk of default of the underlying reference obligation. Derivatives associated with foreign currencytransactions are subject to currency risk.
Initial public offerings risk. IPO share prices are frequently volatile and may significantly impact fund performance.
Large company risk. Larger companies may grow more slowly than smaller companies or be slower to respond to business developments. Large-capitalization securities may underperform the market as a whole.
Liquidity risk. The extent (if at all) to which a security may be sold or a derivative position closed without negatively impacting its market value may beimpaired by reduced market activity or participation, legal restrictions, or other economic and market impediments. Liquidity risk may be magnified inrising interest rate environments due to higher than normal redemption rates. Widespread selling of fixed-income securities to satisfy redemptionsduring periods of reduced demand may adversely impact the price or salability of such securities. Periods of heavy redemption could cause the fund tosell assets at a loss or depressed value, which could negatively affect performance. Redemption risk is heightened during periods of declining or illiquidmarkets.
Lower-rated and high-yield fixed-income securities risk. Lower-rated and high-yield fixed-income securities (junk bonds) are subject to greatercredit quality risk, risk of default, and price volatility than higher-rated fixed-income securities, may be considered speculative, and can be difficult toresell.
Mortgage-backed and asset-backed securities risk. Mortgage-backed and asset-backed securities are subject to different combinations ofprepayment, extension, interest-rate, and other market risks.
Sector risk. When a fund focuses its investments in certain sectors of the economy, its performance may be driven largely by sector performance andcould fluctuate more widely than if the fund were invested more evenly across sectors.
Short sales risk. In a short sale, a fund pays interest on the borrowed security. The fund will lose money if the security price increases between theshort sale and the replacement date.
Small and mid-sized company risk. Small and mid-sized companies are generally less established and may be more volatile than larger companies.Small and/or mid-capitalization securities may underperform the market as a whole.
Past performanceThis section normally shows how the fund’s total returns have varied from year to year, along with a broad-based market index for reference. Becausethe fund has not commenced operations as of the date of this Prospectus, there is no past performance to report.
Investment managementInvestment Advisor John Hancock Investment Management Services, LLC§
Subadvisor John Hancock Asset Management a division of Manulife Asset Management (US) LLC§
Subadvisor John Hancock Asset Management a division of Manulife Asset Management (North America) Limited
Portfolio managementRobert BoydaHead of Capital Markets and Strategy and Co-Head of Portfolio Solutions Group, John HancockAsset Management a division of Manulife AssetManagement (US) LLCManaged fund since inception
Robert Sykes, CFAManaging Director, Portfolio Manager ofPortfolio Solutions Group,John Hancock Asset Management a division ofManulife Asset Management (US) LLCManaged fund since 2018
Nathan Thooft, CFASenior Managing Director, Senior PortfolioManager, Co-Head of Portfolio SolutionsGroup, John Hancock Asset Management adivision of Manulife Asset Management (US)LLCManaged fund since inception
.129

Other important information regarding the fundFor important information about taxes and financial intermediary compensation, please turn to “Additional information about the funds” at page258 of the Prospectus.
.130
Lifestyle Aggressive Portfolio (formerly Lifestyle Aggressive PS Series)Investment objectiveTo seek long-term growth of capital.
Fees and expensesThis table describes the fees and expenses that you may pay if you buy and hold shares of the fund. The fees and expenses do not reflect fees andexpenses of any variable insurance contract that may use the fund as its underlying investment option and would be higher if they did.
Annual fund operating expenses (%) (expenses that you pay each year as a percentage of the valueof your investment) Series I Series II Series NAV
Management fee 0.12 0.12 0.12
Distribution and service (Rule 12b-1) fees 0.05 0.25 0.00
Other expenses 0.28 0.28 0.28
Acquired fund fees and expenses1 0.46 0.46 0.46
Total annual fund operating expenses2 0.91 1.11 0.86
Contractual expense reimbursement3 –0.24 –0.24 –0.24
Total annual fund operating expenses after expense reimbursements 0.67 0.87 0.62
1 “Acquired fund fees and expenses” are based on indirect net expenses associated with the fund’s investments in underlying investment companies.2 The “Total annual fund operating expenses” shown may not correlate to the fund’s ratios of expenses to average daily net assets shown in the “Financial highlights” section of
the fund’s prospectus, which does not include “Acquired fund fees and expenses.”3 The advisor has contractually agreed to reduce its management fee and/or make payment to the fund in an amount equal to the amount by which “Other expenses” of the
fund exceed 0.04% of the average daily net assets of the fund. “Other expenses” means all of the expenses of the fund, excluding certain expenses such as advisory fees,taxes, brokerage commissions, interest expense, litigation and indemnification expenses and other extraordinary expenses not incurred in the ordinary course of the fund’sbusiness, distribution and service (Rule 12b-1) fees, underlying fund expenses (acquired fund fees), and short dividend expense. The current expense limitation agreementexpires on April 30, 2019 unless renewed by mutual agreement of the fund and the advisor based upon a determination that this is appropriate under the circumstances atthat time.
Expense exampleThe examples are intended to help you compare the cost of investing in the fund with the cost of investing in other mutual funds. The examplesassume that $10,000 is invested in the fund for the periods indicated and then all shares are redeemed at the end of those periods. The examples alsoassume that the investment has a 5% return each year and that the fund’s operating expenses remain the same. The expense example does not reflectfees and expenses of any variable insurance contract that may use the fund as its underlying investment option and would be higher if they did.Although your actual costs may be higher or lower, based on these assumptions your costs would be:
Expenses ($) Series I Series II Series NAV
1 year 68 89 63
3 years 266 329 250
5 years 480 588 453
10 years 1,098 1,330 1,039
Portfolio turnoverThe fund, which operates as a fund of funds and invests in underlying funds, does not pay transaction costs, such as commissions, when it buys andsells shares of underlying funds (or “turns over” its portfolio). An underlying fund does pay transaction costs when it turns over its portfolio, and ahigher portfolio turnover rate may indicate higher transaction costs. These costs, which are not reflected in annual fund operating expenses or in theexample, affect the performance of the underlying funds and of the fund. During its most recent fiscal year, the fund’s portfolio turnover ratewas 15% of the average value of its portfolio.
Principal investment strategiesThe fund, except as otherwise described below, operates as a fund of funds and normally invests approximately 100% of its assets in underlying fundsthat invest primarily in equity securities or in futures contracts on equity markets (the “Equity Allocation”) and up to 10% of its assets in underlyingfunds that invest primarily in fixed-income securities or in futures contracts on fixed-income markets (the “Fixed-Income Allocation”). Underlying fundsinclude exchange-traded funds (“ETFs”) and the fund may invest a significant portion of its assets in ETFs. At the discretion of the subadvisors, theEquity Allocation may also include direct investments in equity securities, and the Fixed-Income Allocation may also include direct investments in fixed-income securities. The subadvisors may also determine in light of market or economic conditions that the normal percentage limitations should beexceeded to protect the fund or achieve its investment objective.
.131
Within the prescribed percentage allocation, the subadvisors select the percentage level to be maintained in specific underlying funds and in futurescontracts on equity or fixed-income markets. These allocations may be changed at any time by the subadvisors.
The fund may invest in various underlying funds that as a group hold a wide range of equity type securities. The fund may also invest in underlyingfunds that purchase futures contracts on equity markets.
Certain of these underlying funds focus their investment strategy on fixed-income securities, which may include investment grade and belowinvestment grade debt securities (“junk bonds”) with maturities that range from short to longer term.
The fund may invest in derivatives, including futures contracts and options. The fund may use derivatives for hedging and non-hedging purposesincluding, without limitation, the following purposes:
To establish a position in the derivatives markets as a method of gaining exposure to a particular security or market;
To attempt to protect against possible changes in the market value of securities held or to be purchased by the fund or an underlying fund;
To manage the effective maturity or duration of the securities of the fund or an underlying fund;
To facilitate the repatriation of foreign currency and the settlement of purchases of foreign securities
The fund may invest in other types of investments, including exchange-traded notes (“ETNs”), as described under “Other Permitted Investments by theFund of Funds.”
The fund bears its own expenses and, in addition, indirectly bears its proportionate share of expenses of the underlying funds in which it invests.
Principal risks of investing in the fund of fundsThe fund of funds is subject to risks, and you could lose money by investing in the fund. The principal risks of investing in the fund of funds include:
Commodity risk. Commodity prices may be volatile due to fluctuating demand, supply disruption, speculation, and other factors. Certain commodityinvestments may have no active trading market at times.
Credit and counterparty risk. The issuer or guarantor of a fixed-income security, the counterparty to an over-the-counter derivatives contract, or aborrower of fund securities may not make timely payments or otherwise honor its obligations. A downgrade or default affecting any of the fund’ssecurities could affect the fund’s performance.
Cybersecurity and operational risk. Cybersecurity breaches may allow an unauthorized party to gain access to fund assets, customer data, orproprietary information, or cause a fund or its service providers to suffer data corruption or lose operational functionality. Similar incidents affectingissuers of a fund’s securities may negatively impact performance. Operational risk may arise from human error, error by third parties, communicationerrors, or technology failures, among other causes.
Economic and market events risk. Events in the U.S. and global financial markets, including actions taken by the U.S. Federal Reserve or foreigncentral banks to stimulate or stabilize economic growth, may at times result in unusually high market volatility, which could negatively impactperformance. Reduced liquidity in credit and fixed-income markets could adversely affect issuers worldwide. Banks and financial services companiescould suffer losses if interest rates rise or economic conditions deteriorate.
Equity securities risk. The price of equity securities may decline due to changes in a company’s financial condition or overall market conditions.
Exchange-traded funds risk. An ETF generally reflects the risks of the underlying securities it is designed to track. A fund bears ETF fees and expensesindirectly.
Exchange-traded notes risk. An ETN generally reflects the risks associated with the assets composing the underlying market benchmark or strategy itis designed to track. ETNs also are subject to issuer and fixed-income risks.
Fixed-income securities risk. A rise in interest rates typically causes bond prices to fall. The longer the average maturity or duration of the bonds heldby a fund, the more sensitive it will likely be to interest-rate fluctuations. An issuer may not make all interest payments or repay all or any of theprincipal borrowed. Changes in a security’s credit quality may adversely affect fund performance.
Fund of funds risk. The fund’s ability to achieve its investment objective will depend largely, in part, on: (i) the underlying funds’ performance,expenses and ability to meet their investment objectives; and (ii) properly rebalancing assets among underlying funds and different asset classes. Thefund is also subject to risks related to: (i) layering of fees of the underlying funds; and (ii) conflicts of interest associated with the subadvisor’s ability toallocate fund assets without limit to other funds it advises and/or other funds advised by affiliated subadvisors. There is no assurance that either thefund or the underlying funds will achieve their investment objectives. A fund bears underlying fund fees and expenses indirectly.
Hedging, derivatives, and other strategic transactions risk. Hedging, derivatives, and other strategic transactions may increase a fund’s volatilityand could produce disproportionate losses, potentially more than the fund’s principal investment. Risks of these transactions are different from andpossibly greater than risks of investing directly in securities and other traditional instruments. Under certain market conditions, derivatives couldbecome harder to value or sell and may become subject to liquidity risk (i.e., the inability to enter into closing transactions). Regulatory changes inderivative markets could impact the cost of or the fund’s ability to engage in derivative transactions. Derivatives and other strategic transactions that afund intends to utilize include: futures contracts and options. Futures contracts and options generally are subject to counterparty risk.
Investment company securities risk. A fund bears underlying fund fees and expenses indirectly.
Liquidity risk. The extent (if at all) to which a security may be sold or a derivative position closed without negatively impacting its market value may beimpaired by reduced market activity or participation, legal restrictions, or other economic and market impediments. Liquidity risk may be magnified inrising interest rate environments due to higher than normal redemption rates. Widespread selling of fixed-income securities to satisfy redemptions
.132
during periods of reduced demand may adversely impact the price or salability of such securities. Periods of heavy redemption could cause the fund tosell assets at a loss or depressed value, which could negatively affect performance. Redemption risk is heightened during periods of declining or illiquidmarkets.
Target allocation risk. The fund’s risk profile will change due to reallocation or rebalancing of portfolio assets.
Principal risks of investing in the underlying fundsThe principal risks of investing in the Underlying Funds include:
Convertible securities risk. The market values of convertible securities tend to fall as interest rates rise and rise as interest rates fall. As the marketprice of underlying common stock declines below the conversion price, the market value of the convertible security tends to be increasingly influencedby its yield.
Credit and counterparty risk. The issuer or guarantor of a fixed-income security, the counterparty to an over-the-counter derivatives contract or aborrower of a fund’s securities may be unable or unwilling to make timely principal, interest or settlement payments, or otherwise honor itsobligations. Funds that invest in fixed-income securities are subject to varying degrees of risk that the issuers of the securities will have their creditrating downgraded or will default, potentially reducing a fund’s share price and income level.
Cybersecurity and operational risk. Cybersecurity breaches may allow an unauthorized party to gain access to fund assets, customer data, orproprietary information, or cause a fund or its service providers to suffer data corruption or lose operational functionality. Similar incidents affectingissuers of a fund’s securities may negatively impact performance. Operational risk may arise from human error, error by third parties, communicationerrors, or technology failures, among other causes.
Economic and market events risk. Events in the U.S. and global financial markets, including actions taken by the U.S. Federal Reserve or foreigncentral banks to stimulate or stabilize economic growth, may at times result in unusually high market volatility, which could negatively impactperformance. Reduced liquidity in credit and fixed-income markets could adversely affect issuers worldwide. Banks and financial services companiescould suffer losses if interest rates rise or economic conditions deteriorate.
Equity securities risk. The price of equity securities may decline due to changes in a company’s financial condition or overall market conditions.Growth company securities may fluctuate more in price than other securities because of the greater emphasis on earnings expectations. Securities themanager believes are undervalued may never realize their full potential value, and in certain markets value stocks may underperform the market as awhole.
Exchange-traded funds risk. An ETF generally reflects the risks of the underlying securities it is designed to track. A fund bears ETF fees and expensesindirectly.
Fixed-income securities risk. A rise in interest rates typically causes bond prices to fall. The longer the average maturity or duration of the bonds heldby a fund, the more sensitive it will likely be to interest-rate fluctuations. An issuer may not make all interest payments or repay all or any of theprincipal borrowed. Changes in a security’s credit quality may adversely affect fund performance.
Foreign securities risk. Less information may be publicly available regarding foreign issuers. Foreign securities may be subject to foreign taxes andmay be more volatile than U.S. securities. Currency fluctuations and political and economic developments may adversely impact the value of foreignsecurities. The risks of investing in foreign securities are magnified in emerging markets.
Hedging, derivatives, and other strategic transactions risk. Hedging, derivatives, and other strategic transactions may increase a fund’s volatilityand could produce disproportionate losses, potentially more than the fund’s principal investment. Risks of these transactions are different from andpossibly greater than risks of investing directly in securities and other traditional instruments. Under certain market conditions, derivatives couldbecome harder to value or sell and may become subject to liquidity risk (i.e., the inability to enter into closing transactions). Regulatory changes inderivative markets could impact the cost of or the fund’s ability to engage in derivative transactions. Derivatives and other strategic transactions that afund intends to utilize include: futures contracts and options. Futures contracts and options generally are subject to counterparty risk.
Index management risk. Certain factors may cause a fund that is an index fund to track its target index less closely. For example, a subadvisor mayselect securities that are not fully representative of the index, and the fund’s transaction expenses, and the size and timing of its cash flows, may resultin the fund’s performance being different than that of its index. Moreover, the fund will generally reflect the performance of its target index evenwhen the index does not perform well.
Initial public offerings risk. IPO share prices are frequently volatile and may significantly impact fund performance.
Large company risk. Larger companies may grow more slowly than smaller companies or be slower to respond to business developments. Large-capitalization securities may underperform the market as a whole.
Liquidity risk. The extent (if at all) to which a security may be sold or a derivative position closed without negatively impacting its market value may beimpaired by reduced market activity or participation, legal restrictions, or other economic and market impediments. Liquidity risk may be magnified inrising interest rate environments due to higher than normal redemption rates. Widespread selling of fixed-income securities to satisfy redemptionsduring periods of reduced demand may adversely impact the price or salability of such securities. Periods of heavy redemption could cause the fund tosell assets at a loss or depressed value, which could negatively affect performance. Redemption risk is heightened during periods of declining or illiquidmarkets.
.133

Lower-rated and high-yield fixed-income securities risk. Lower-rated and high-yield fixed-income securities (junk bonds) are subject to greatercredit quality risk, risk of default, and price volatility than higher-rated fixed-income securities, may be considered speculative, and can be difficult toresell.
Mortgage-backed and asset-backed securities risk. Mortgage-backed and asset-backed securities are subject to different combinations ofprepayment, extension, interest-rate, and other market risks.
Non-diversified risk. Adverse events affecting a particular issuer or group of issuers may magnify losses for non-diversified funds, which may invest alarge portion of assets in any one issuer or a small number of issuers.
Sector risk. When a fund focuses its investments in certain sectors of the economy, its performance may be driven largely by sector performance andcould fluctuate more widely than if the fund were invested more evenly across sectors.
Short sales risk. In a short sale, a fund pays interest on the borrowed security. The fund will lose money if the security price increases between theshort sale and the replacement date.
Small and mid-sized company risk. Small and mid-sized companies are generally less established and may be more volatile than larger companies.Small and/or mid-capitalization securities may underperform the market as a whole.
Past performanceThe following information provides some indication of the risks of investing in the fund by showing changes in performance from year to year and byshowing how average annual returns for specified periods compare with those of a broad measure of market performance. The Combined Index(described below) shows how the fund’s performance compares against the returns of similar investments. The performance information below doesnot reflect fees and expenses of any variable insurance contract which may use JHVIT as its underlying investment option. If such fees and expenseshad been reflected, performance would be lower. The past performance of the fund is not necessarily an indication of how the fund will perform inthe future.
The Combined Index represents 70% of the Russell 3000 Index and 30% of the MSCI EAFE Index.
Calendar year total returns for Series II (%)
2014 2015 2016 2017
5.21 –1.75 9.35 21.56
Best quarter: Q1 ‘17, 6.25%
Worst quarter: Q3 ‘15, –8.75%
Average Annual Total Returns for Period Ended 12/31/2017
Average annual total returns (%) 1 Year InceptionDate of
Inception
Series I 21.78 9.12 11/01/13
Series II 21.56 8.91 11/01/13
Series NAV 21.84 9.17 11/01/13
S&P 500 Index (reflects no deduction for fees, expenses, or taxes) 21.83 12.95 11/01/13
Combined Index (reflects no deduction for fees, expenses, or taxes) 22.33 10.33 11/01/13
Investment managementInvestment Advisor John Hancock Investment Management Services, LLC§
Subadvisor John Hancock Asset Management a division of Manulife Asset Management (US) LLC§
Subadvisor John Hancock Asset Management a division of Manulife Asset Management (North America) Limited
.134
Portfolio managementRobert BoydaHead of Capital Markets and Strategy and Co-Head of Portfolio Solutions Group; John HancockAsset Management a division of Manulife AssetManagement (US) LLCManaged fund since 2013
Robert Sykes, CFAManaging Director, Portfolio Manager ofPortfolio Solutions Group,John Hancock Asset Management a division ofManulife Asset Management (US) LLCManaged fund since 2018
Nathan Thooft, CFASenior Managing Director, Senior PortfolioManager, Co-Head of Portfolio SolutionsGroup; John Hancock Asset Management adivision of Manulife Asset Management (US)LLCManaged fund since 2013
Other important information regarding the fundFor important information about taxes and financial intermediary compensation, please turn to “Additional information about the funds” at page258 of the Prospectus.
.135

Lifestyle Balanced Portfolio (formerly Lifestyle Balanced PS Series)Investment objectiveTo seek a balance between a high level of current income and growth of capital, with a greater emphasis on growth of capital.
Fees and expensesThis table describes the fees and expenses that you may pay if you buy and hold shares of the fund. The fees and expenses do not reflect fees andexpenses of any variable insurance contract that may use the fund as its underlying investment option and would be higher if they did.
Annual fund operating expenses (%) (expenses that you pay each year as a percentage of the valueof your investment) Series I Series II Series NAV
Management fee 0.04 0.04 0.04
Distribution and service (Rule 12b-1) fees 0.05 0.25 0.00
Other expenses 0.03 0.03 0.03
Acquired fund fees and expenses1 0.56 0.56 0.56
Total annual fund operating expenses2 0.68 0.88 0.63
1 “Acquired fund fees and expenses” are based on indirect net expenses associated with the fund’s investments in underlying investment companies.2 The “Total annual fund operating expenses” shown may not correlate to the fund’s ratios of expenses to average daily net assets shown in the “Financial highlights” section of
the fund’s prospectus, which does not include “Acquired fund fees and expenses.”
Expense exampleThe examples are intended to help you compare the cost of investing in the fund with the cost of investing in other mutual funds. The examplesassume that $10,000 is invested in the fund for the periods indicated and then all shares are redeemed at the end of those periods. The examples alsoassume that the investment has a 5% return each year and that the fund’s operating expenses remain the same. The expense example does not reflectfees and expenses of any variable insurance contract that may use the fund as its underlying investment option and would be higher if they did.Although your actual costs may be higher or lower, based on these assumptions your costs would be:
Expenses ($) Series I Series II Series NAV
1 year 69 90 64
3 years 218 281 202
5 years 379 488 351
10 years 847 1,084 786
Portfolio turnoverThe fund, which operates as a fund of funds and invests in underlying funds, does not pay transaction costs, such as commissions, when it buys andsells shares of underlying funds (or “turns over” its portfolio). An underlying fund does pay transaction costs when it turns over its portfolio, and ahigher portfolio turnover rate may indicate higher transaction costs. These costs, which are not reflected in annual fund operating expenses or in theexample, affect the performance of the underlying funds and of the fund. During its most recent fiscal year, the fund’s portfolio turnover rate was 6%of the average value of its portfolio.
Principal investment strategiesThe fund, except as otherwise described below, operates as a fund of funds and normally invests approximately 50% of its assets in underlying fundsthat invest primarily in equity securities or in futures contracts on equity markets (the “Equity Allocation”) and approximately 50% of its assets inunderlying funds that invest primarily in fixed-income securities or in futures contracts on fixed-income markets (the “Fixed Income Allocation”).Underlying funds may include exchange traded funds (“ETFs”) and the fund may invest a significant portion of its assets in ETFs. At the discretion ofthe subadvisor, the Equity Allocation may also include direct investments in equity securities and the Fixed Income Allocation may also include directinvestments in fixed-income securities. The subadvisor may also determine in light of market or economic conditions that the normal percentagelimitations should be exceeded to protect the fund or achieve its investment objective.
Within the prescribed percentage allocation, the subadvisor selects the percentage level to be maintained in specific underlying funds and in futurescontracts on equity or fixed-income markets. These allocations may be changed at any time by the subadvisor.
The fund may invest in various underlying funds that as a group hold a wide range of equity type securities. These include small-, mid- and large-capitalization stocks, domestic and foreign securities (including emerging market securities) and sector holdings such as utilities, science, andtechnology stocks. Each of these underlying funds has its own investment strategy which, for example, may focus on growth stocks or value stocks ormay employ a strategy combining growth and income stocks and/or may invest in derivatives such as options on securities and futures contracts. Thefund may also invest in underlying funds that purchase futures contracts on equity markets.
.136

Certain of these underlying funds focus their investment strategy on fixed-income securities, which may include investment grade and below-investment-grade debt securities with maturities that range from short to longer term. The fixed-income underlying funds collectively hold varioustypes of debt instruments such as corporate bonds and mortgage backed, U.S. and foreign government issued, domestic and international securities.
The fund may invest in derivatives, which are financial contracts with a value that depends on, or is derived from, the value of underlying assets,reference rates or indexes. Derivatives may relate to stocks, bonds, interest rates, currencies or currency exchange rates and related indexes. The fundmay use derivatives for hedging and nonhedging purposes including, without limitation, the following purposes:
To establish a position in the derivatives markets as a method of gaining exposure to a particular security or market;
To attempt to protect against possible changes in the market value of securities held or to be purchased by the fund or an underlying fund;
To manage the effective maturity or duration of the securities of the fund or an underlying fund; and
To facilitate the repatriation of foreign currency and the settlement of purchases of foreign securities.
The fund may invest in other types of investments including exchange-traded notes (ETNs) as described under “Other Permitted Investments of theFund of Funds.”
The fund bears its own expenses and, in addition, indirectly bears its proportionate share of the expenses of the underlying funds in which it invests.
Principal risks of investing in the fund of fundsThe fund of funds is subject to risks, and you could lose money by investing in the fund. The principal risks of investing in the fund of funds include:
Commodity risk. Commodity prices may be volatile due to fluctuating demand, supply disruption, speculation, and other factors. Certain commodityinvestments may have no active trading market at times.
Credit and counterparty risk. The issuer or guarantor of a fixed-income security, the counterparty to an over-the-counter derivatives contract, or aborrower of fund securities may not make timely payments or otherwise honor its obligations. U.S. government securities are subject to varyingdegrees of credit risk depending upon the nature of their support. A downgrade or default affecting any of the fund’s securities could affect the fund’sperformance.
Cybersecurity and operational risk. Cybersecurity breaches may allow an unauthorized party to gain access to fund assets, customer data, orproprietary information, or cause a fund or its service providers to suffer data corruption or lose operational functionality. Similar incidents affectingissuers of a fund’s securities may negatively impact performance. Operational risk may arise from human error, error by third parties, communicationerrors, or technology failures, among other causes.
Economic and market events risk. Events in the U.S. and global financial markets, including actions taken by the U.S. Federal Reserve or foreigncentral banks to stimulate or stabilize economic growth, may at times result in unusually high market volatility, which could negatively impactperformance. Reduced liquidity in credit and fixed-income markets could adversely affect issuers worldwide. Banks and financial services companiescould suffer losses if interest rates rise or economic conditions deteriorate.
Equity securities risk. The price of equity securities may decline due to changes in a company’s financial condition or overall market conditions.
Exchange-traded funds risk. An ETF generally reflects the risks of the underlying securities it is designed to track. A fund bears ETF fees and expensesindirectly.
Exchange-traded notes risk. An ETN generally reflects the risks associated with the assets composing the underlying market benchmark or strategy itis designed to track. ETNs also are subject to issuer and fixed-income risks.
Fixed-income securities risk. A rise in interest rates typically causes bond prices to fall. The longer the average maturity or duration of the bonds heldby a fund, the more sensitive it will likely be to interest-rate fluctuations. An issuer may not make all interest payments or repay all or any of theprincipal borrowed. Changes in a security’s credit quality may adversely affect fund performance.
Fund of funds risk. The fund’s ability to achieve its investment objective will depend largely, in part, on: (i) the underlying funds’ performance,expenses and ability to meet their investment objectives; and (ii) properly rebalancing assets among underlying funds and different asset classes. Thefund is also subject to risks related to: (i) layering of fees of the underlying funds; and (ii) conflicts of interest associated with the subadvisor’s ability toallocate fund assets without limit to other funds it advises and/or other funds advised by affiliated subadvisors. There is no assurance that either thefund or the underlying funds will achieve their investment objectives. A fund bears underlying fund fees and expenses indirectly.
Hedging, derivatives, and other strategic transactions risk. Hedging, derivatives, and other strategic transactions may increase a fund’s volatilityand could produce disproportionate losses, potentially more than the fund’s principal investment. Risks of these transactions are different from andpossibly greater than risks of investing directly in securities and other traditional instruments. Under certain market conditions, derivatives couldbecome harder to value or sell and may become subject to liquidity risk (i.e., the inability to enter into closing transactions). Regulatory changes inderivative markets could impact the cost of or the fund’s ability to engage in derivative transactions. Derivatives and other strategic transactions that afund intends to utilize include: futures contracts and options. Futures contracts and options generally are subject to counterparty risk.
Investment company securities risk. A fund bears underlying fund fees and expenses indirectly.
JHVIT Lifestyle Portfolio asset transfer risk. The Lifestyle Balanced Portfolio (the “JHVIT Lifestyle Portfolio”) is offered in connection with specificguaranteed benefits under variable annuity contracts (the “Contracts”) issued by John Hancock Life Insurance Company (U.S.A.) and John HancockLife Insurance Company of New York (collectively, the “John Hancock Issuers”).
.137

The Contracts provide that the John Hancock Issuers can automatically transfer contract value between the JHVIT Lifestyle Portfolio and the SelectBond Trust through a non-discretionary, systematic mathematical process. The purpose of these transfers is to attempt to protect contract value fromdeclines due to market volatility, and thereby limit the John Hancock Issuers’ exposure to risk under the guaranteed benefits under the Contracts. Thetiming and amount of any transfer of contract value under the John Hancock Issuers’ process will depend on several factors including marketmovements. In general, the higher the equity component of a JHVIT Lifestyle Portfolio, the more likely that contract value will be reallocated from theJHVIT Lifestyle Portfolio to the Select Bond Trust when equity markets fall. These asset flows may negatively affect the performance of an underlyingfund in which the JHVIT Lifestyle Portfolio invests by increasing the underlying fund’s transaction costs and causing it to purchase or sell securitieswhen it would not normally do so. It could be particularly disadvantageous for the underlying fund if it experiences outflows and needs to sellsecurities at a time of volatility in the markets, when values could be falling. Because the JHVIT Lifestyle Portfolio bear their proportionate share of thetransaction costs of the underlying funds, increased underlying fund expenses may indirectly negatively affect the performance of the JHVIT LifestylePortfolio.
Liquidity risk. The extent (if at all) to which a security may be sold or a derivative position closed without negatively impacting its market value may beimpaired by reduced market activity or participation, legal restrictions, or other economic and market impediments. Liquidity risk may be magnified inrising interest rate environments due to higher than normal redemption rates. Widespread selling of fixed-income securities to satisfy redemptionsduring periods of reduced demand may adversely impact the price or salability of such securities. Periods of heavy redemption could cause the fund tosell assets at a loss or depressed value, which could negatively affect performance. Redemption risk is heightened during periods of declining or illiquidmarkets.
Target allocation risk. The fund’s risk profile will change due to reallocation or rebalancing of portfolio assets.
Principal risks of investing in the underlying fundsThe principal risks of investing in the Underlying Funds include:
Advance trade estimate risk. The JHVIT Lifestyle Portfolio may seek to mitigate asset transfer risk by adjusting its portfolio based on advanceestimates of automatic transfers of Contract value under the Contracts. The John Hancock Issuers have provided the JHVIT Lifestyle Portfolio’ssubadvisor with an analytical tool that calculates estimates of automatic transfers based on several factors, including the mathematical process forautomatic transfers and market movements before the daily close of trading. The subadvisor may, but is not required to, use the tool to adjust theJHVIT Lifestyle Portfolio’s portfolio with the goal of trading in securities or purchasing shares of underlying funds as close to the market close aspossible in order to limit the JHVIT Lifestyle Portfolio’s exposure to cash drag (i.e., holding cash while markets are rising) and adverse overnight marketfluctuations. For example, in a rising market, if the analytical tool suggests that the JHVIT Lifestyle Portfolio will receive inflows that day (the “TradeDate”), the subadvisor could buy securities or shares of an underlying fund close to or at the closing prices on the Trade Date, as opposed to thefollowing business day, when the actual transfer amount would be known. In a falling market, if the analytical tool suggests that the JHVITLifestyle Portfolio will experience outflows on Trade Date, the subadvisor could sell securities or shares of an underlying fund close to or at the closingprices on Trade Date, as opposed to the following business day, when the actual transfer amount would be known.
If the subadvisor relies on the analytical tool or its own judgment and places trades in anticipation of purchases and redemptions of JHVIT Lifestyleshares, there can be no assurance that the prices paid by the JHVIT Lifestyle Portfolio will be better than if the JHVIT Lifestyle Portfolio had traded thefollowing business day. The estimated transfer amount may be different from the actual transfer amount for various reasons, including changes inmarket direction, contract owner behavior and faulty inputs. If the estimated transfer amount is different from the actual transfer amount, the JHVITLifestyle Portfolio will buy or sell securities or shares of an underlying fund the following business day to adjust for this difference. For example, if cashflows into the JHVIT Lifestyle Portfolio are less than estimated, the JHVIT Lifestyle Portfolio could be forced to liquidate positions it had purchased.Conversely, if cash flows out of the JHVIT Lifestyle Portfolio are less than estimated, the JHVIT Lifestyle Portfolio may be required to repurchasepositions it had sold. In addition, purchasing securities or shares of an underlying fund early could cause the JHVIT Lifestyle Portfolio to spend moremoney than it has available and, in the event of a market decline, such leverage will magnify losses because the decline also affects the securitiespurchased with amounts in excess of the JHVIT Lifestyle Portfolio’s assets. Due to these various factors, trading on the basis of advance estimates ofautomatic transfers may cause higher portfolio turnover than that based solely on automatic transfers of Contract value under the Contracts, increaseJHVIT Lifestyle Portfolio expenses and adversely affect the performance of the JHVIT Lifestyle Portfolio.
Convertible securities risk. The market values of convertible securities tend to fall as interest rates rise and rise as interest rates fall. As the marketprice of underlying common stock declines below the conversion price, the market value of the convertible security tends to be increasingly influencedby its yield.
Credit and counterparty risk. The issuer or guarantor of a fixed-income security, the counterparty to an over-the-counter derivatives contract, or aborrower of fund securities may not make timely payments or otherwise honor its obligations. U.S. government securities are subject to varyingdegrees of credit risk depending upon the nature of their support. A downgrade or default affecting any of the fund’s securities could affect the fund’sperformance.
Cybersecurity and operational risk. Cybersecurity breaches may allow an unauthorized party to gain access to fund assets, customer data, orproprietary information, or cause a fund or its service providers to suffer data corruption or lose operational functionality. Similar incidents affectingissuers of a fund’s securities may negatively impact performance. Operational risk may arise from human error, error by third parties, communicationerrors, or technology failures, among other causes.
Economic and market events risk. Events in the U.S. and global financial markets, including actions taken by the U.S. Federal Reserve or foreigncentral banks to stimulate or stabilize economic growth, may at times result in unusually high market volatility, which could negatively impactperformance. Reduced liquidity in credit and fixed-income markets could adversely affect issuers worldwide. Banks and financial services companiescould suffer losses if interest rates rise or economic conditions deteriorate.
.138
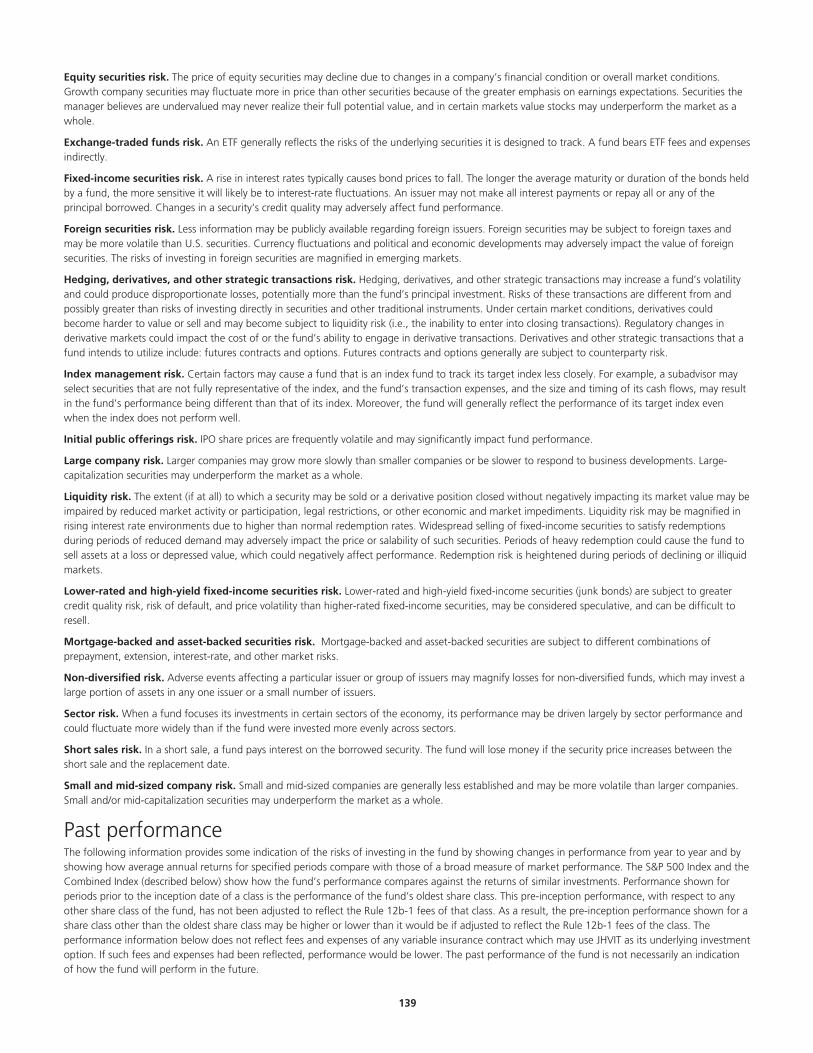
Equity securities risk. The price of equity securities may decline due to changes in a company’s financial condition or overall market conditions.Growth company securities may fluctuate more in price than other securities because of the greater emphasis on earnings expectations. Securities themanager believes are undervalued may never realize their full potential value, and in certain markets value stocks may underperform the market as awhole.
Exchange-traded funds risk. An ETF generally reflects the risks of the underlying securities it is designed to track. A fund bears ETF fees and expensesindirectly.
Fixed-income securities risk. A rise in interest rates typically causes bond prices to fall. The longer the average maturity or duration of the bonds heldby a fund, the more sensitive it will likely be to interest-rate fluctuations. An issuer may not make all interest payments or repay all or any of theprincipal borrowed. Changes in a security’s credit quality may adversely affect fund performance.
Foreign securities risk. Less information may be publicly available regarding foreign issuers. Foreign securities may be subject to foreign taxes andmay be more volatile than U.S. securities. Currency fluctuations and political and economic developments may adversely impact the value of foreignsecurities. The risks of investing in foreign securities are magnified in emerging markets.
Hedging, derivatives, and other strategic transactions risk. Hedging, derivatives, and other strategic transactions may increase a fund’s volatilityand could produce disproportionate losses, potentially more than the fund’s principal investment. Risks of these transactions are different from andpossibly greater than risks of investing directly in securities and other traditional instruments. Under certain market conditions, derivatives couldbecome harder to value or sell and may become subject to liquidity risk (i.e., the inability to enter into closing transactions). Regulatory changes inderivative markets could impact the cost of or the fund’s ability to engage in derivative transactions. Derivatives and other strategic transactions that afund intends to utilize include: futures contracts and options. Futures contracts and options generally are subject to counterparty risk.
Index management risk. Certain factors may cause a fund that is an index fund to track its target index less closely. For example, a subadvisor mayselect securities that are not fully representative of the index, and the fund’s transaction expenses, and the size and timing of its cash flows, may resultin the fund’s performance being different than that of its index. Moreover, the fund will generally reflect the performance of its target index evenwhen the index does not perform well.
Initial public offerings risk. IPO share prices are frequently volatile and may significantly impact fund performance.
Large company risk. Larger companies may grow more slowly than smaller companies or be slower to respond to business developments. Large-capitalization securities may underperform the market as a whole.
Liquidity risk. The extent (if at all) to which a security may be sold or a derivative position closed without negatively impacting its market value may beimpaired by reduced market activity or participation, legal restrictions, or other economic and market impediments. Liquidity risk may be magnified inrising interest rate environments due to higher than normal redemption rates. Widespread selling of fixed-income securities to satisfy redemptionsduring periods of reduced demand may adversely impact the price or salability of such securities. Periods of heavy redemption could cause the fund tosell assets at a loss or depressed value, which could negatively affect performance. Redemption risk is heightened during periods of declining or illiquidmarkets.
Lower-rated and high-yield fixed-income securities risk. Lower-rated and high-yield fixed-income securities (junk bonds) are subject to greatercredit quality risk, risk of default, and price volatility than higher-rated fixed-income securities, may be considered speculative, and can be difficult toresell.
Mortgage-backed and asset-backed securities risk. Mortgage-backed and asset-backed securities are subject to different combinations ofprepayment, extension, interest-rate, and other market risks.
Non-diversified risk. Adverse events affecting a particular issuer or group of issuers may magnify losses for non-diversified funds, which may invest alarge portion of assets in any one issuer or a small number of issuers.
Sector risk. When a fund focuses its investments in certain sectors of the economy, its performance may be driven largely by sector performance andcould fluctuate more widely than if the fund were invested more evenly across sectors.
Short sales risk. In a short sale, a fund pays interest on the borrowed security. The fund will lose money if the security price increases between theshort sale and the replacement date.
Small and mid-sized company risk. Small and mid-sized companies are generally less established and may be more volatile than larger companies.Small and/or mid-capitalization securities may underperform the market as a whole.
Past performanceThe following information provides some indication of the risks of investing in the fund by showing changes in performance from year to year and byshowing how average annual returns for specified periods compare with those of a broad measure of market performance. The S&P 500 Index and theCombined Index (described below) show how the fund’s performance compares against the returns of similar investments. Performance shown forperiods prior to the inception date of a class is the performance of the fund’s oldest share class. This pre-inception performance, with respect to anyother share class of the fund, has not been adjusted to reflect the Rule 12b-1 fees of that class. As a result, the pre-inception performance shown for ashare class other than the oldest share class may be higher or lower than it would be if adjusted to reflect the Rule 12b-1 fees of the class. Theperformance information below does not reflect fees and expenses of any variable insurance contract which may use JHVIT as its underlying investmentoption. If such fees and expenses had been reflected, performance would be lower. The past performance of the fund is not necessarily an indicationof how the fund will perform in the future.
.139

The Combined Index represents 35% of the Russell 3000 Index, 15% of the MSCI EAFE Index, and 50% of the Bloomberg Barclays U.S. AggregateBond Index.
Calendar year total returns for Series II (%)
2012 2013 2014 2015 2016 2017
10.54 12.68 5.74 –0.22 5.89 12.16
Best quarter: Q1 ‘12, 7.12%
Worst quarter: Q3 ‘15, –3.69%
Average Annual Total Returns for Period Ended 12/31/2017
Average annual total returns (%) 1 Year 5 Year InceptionDate of
Inception
Series I 12.31 7.31 6.28 11/01/13
Series II 12.16 7.14 6.15 04/29/11
Series NAV 12.38 7.36 6.31 11/01/13Bloomberg Barclays U.S. Aggregate Bond Index (reflects no deduction for fees, expenses, ortaxes) 3.54 2.10 3.12 04/29/11
S&P 500 Index (reflects no deduction for fees, expenses, or taxes) 21.83 15.79 13.03 04/29/11
Combined Index (reflects no deduction for fees, expenses, or taxes) 12.59 7.70 6.89 04/29/11
Investment managementInvestment Advisor John Hancock Investment Management Services, LLC§
Subadvisor John Hancock Asset Management a division of Manulife Asset Management (US) LLC§
Subadvisor John Hancock Asset Management a division of Manulife Asset Management (North America) Limited
Portfolio managementRobert BoydaHead of Capital Markets and Strategy and Co-Head of Portfolio Solutions Group; John HancockAsset Management a division of Manulife AssetManagement (US) LLCManaged fund since 2013
Robert Sykes, CFAManaging Director, Portfolio Manager ofPortfolio Solutions Group,John Hancock Asset Management a division ofManulife Asset Management (US) LLCManaged fund since 2018
Nathan Thooft, CFASenior Managing Director, Senior PortfolioManager, Co-Head of Portfolio SolutionsGroup; John Hancock Asset Management adivision of Manulife Asset Management (US)LLCManaged fund since 2013
Other important information regarding the fundFor important information about taxes and financial intermediary compensation, please turn to “Additional information about the funds” at page258 of the Prospectus.
.140

Lifestyle Conservative Portfolio (formerly Lifestyle Conservative PS Series)Investment objectiveTo seek a high level of current income with some consideration given to growth of capital.
Fees and expensesThis table describes the fees and expenses that you may pay if you buy and hold shares of the fund. The fees and expenses do not reflect fees andexpenses of any variable insurance contract that may use the fund as its underlying investment option and would be higher if they did.
Annual fund operating expenses (%) (expenses that you pay each year as a percentage of the valueof your investment) Series I Series II Series NAV
Management fee 0.04 0.04 0.04
Distribution and service (Rule 12b-1) fees 0.05 0.25 0.00
Other expenses 0.07 0.07 0.07
Acquired fund fees and expenses1 0.58 0.58 0.58
Total annual fund operating expenses2 0.74 0.94 0.69
Contractual expense reimbursement3 –0.03 –0.03 –0.03
Total annual fund operating expenses after expense reimbursements 0.71 0.91 0.66
1 “Acquired fund fees and expenses” are based on indirect net expenses associated with the fund’s investments in underlying investment companies.2 The “Total annual fund operating expenses” shown may not correlate to the fund’s ratios of expenses to average daily net assets shown in the “Financial highlights” section of
the fund’s prospectus, which does not include “Acquired fund fees and expenses.”3 The advisor has contractually agreed to reduce its management fee and/or make payment to the fund in an amount equal to the amount by which “Other expenses” of the
fund exceed 0.04% of the average daily net assets of the fund. “Other expenses” means all of the expenses of the fund, excluding certain expenses such as advisory fees,taxes, brokerage commissions, interest expense, litigation and indemnification expenses and other extraordinary expenses not incurred in the ordinary course of the fund’sbusiness, distribution and service (Rule 12b-1) fees, underlying fund expenses (acquired fund fees), and short dividend expense. The current expense limitation agreementexpires on April 30, 2019 unless renewed by mutual agreement of the fund and the advisor based upon a determination that this is appropriate under the circumstances atthat time.
Expense exampleThe examples are intended to help you compare the cost of investing in the fund with the cost of investing in other mutual funds. The examplesassume that $10,000 is invested in the fund for the periods indicated and then all shares are redeemed at the end of those periods. The examples alsoassume that the investment has a 5% return each year and that the fund’s operating expenses remain the same. The expense example does not reflectfees and expenses of any variable insurance contract that may use the fund as its underlying investment option and would be higher if they did.Although your actual costs may be higher or lower, based on these assumptions your costs would be:
Expenses ($) Series I Series II Series NAV
1 year 73 93 67
3 years 234 297 218
5 years 409 517 381
10 years 916 1,152 856
Portfolio turnoverThe fund, which operates as a fund of funds and invests in underlying funds, does not pay transaction costs, such as commissions, when it buys andsells shares of underlying funds (or “turns over” its portfolio). An underlying fund does pay transaction costs when it turns over its portfolio, and ahigher portfolio turnover rate may indicate higher transaction costs. These costs, which are not reflected in annual fund operating expenses or in theexample, affect the performance of the underlying funds and of the fund. During its most recent fiscal year, the fund’s portfolio turnover ratewas 12% of the average value of its portfolio.
Principal investment strategiesThe fund, except as otherwise described below, operates as a fund of funds and normally invests approximately 20% of its assets in underlying fundsthat invest primarily in equity securities or in futures contracts on equity markets (the “Equity Allocation”) and approximately 80% of its assets inunderlying funds that invest primarily in fixed-income securities or in futures contracts on fixed-income markets (the “Fixed Income Allocation”).Underlying funds may include exchange-traded funds (“ETFs”) and the fund may invest a significant portion of its assets in ETFs. At the discretion ofthe subadvisor, the Equity Allocation may also include direct investments in equity securities and the Fixed Income Allocation may also include directinvestments in fixed-income securities. The subadvisor may also determine in light of market or economic conditions that the normal percentagelimitations should be exceeded to protect the fund or achieve its investment objective.
.141

Within the prescribed percentage allocation, the subadvisor selects the percentage level to be maintained in specific underlying funds and in futurescontracts on equity or fixed-income markets. These allocations may be changed at any time by the subadvisor.
The fund may invest in various underlying funds that as a group hold a wide range of equity type securities. These include small-, mid- and large-capitalization stocks, domestic and foreign securities (including emerging market securities) and sector holdings such as utilities, science, andtechnology stocks. Each of these underlying funds has its own investment strategy which, for example, may focus on growth stocks or value stocks ormay employ a strategy combining growth and income stocks and/or may invest in derivatives such as options on securities and futures contracts. Thefund may also invest in underlying funds that purchase futures contracts on equity markets.
Certain of these underlying funds focus their investment strategy on fixed-income securities, which may include investment grade and belowinvestment grade debt securities with maturities that range from short to longer term. The fixed-income underlying funds collectively hold various typesof debt instruments such as corporate bonds and mortgage backed, U.S. and foreign government issued, domestic and international securities.
The fund may invest in derivatives, which are financial contracts with a value that depends on, or is derived from, the value of underlying assets,reference rates or indexes. Derivatives may relate to stocks, bonds, interest rates, currencies or currency exchange rates and related indexes. The fundmay use derivatives for hedging and nonhedging purposes including, without limitation, the following purposes:
To establish a position in the derivatives markets as a method of gaining exposure to a particular security or market;
To attempt to protect against possible changes in the market value of securities held or to be purchased by the fund or an underlying fund;
To manage the effective maturity or duration of the securities of the fund or an underlying fund; and
To facilitate the repatriation of foreign currency and the settlement of purchases of foreign securities.
The fund may invest in other types of investments including exchange-traded notes (ETNs) as described under “Other Permitted Investments of theFund of Funds.”
The fund bears its own expenses and, in addition, indirectly bears its proportionate share of the expenses of the underlying funds in which it invests.
Principal risks of investing in the fund of fundsThe fund of funds is subject to risks, and you could lose money by investing in the fund. The principal risks of investing in the fund of funds include:
Commodity risk. Commodity prices may be volatile due to fluctuating demand, supply disruption, speculation, and other factors. Certain commodityinvestments may have no active trading market at times.
Credit and counterparty risk. The issuer or guarantor of a fixed-income security, the counterparty to an over-the-counter derivatives contract, or aborrower of fund securities may not make timely payments or otherwise honor its obligations. U.S. government securities are subject to varyingdegrees of credit risk depending upon the nature of their support. A downgrade or default affecting any of the fund’s securities could affect the fund’sperformance.
Cybersecurity and operational risk. Cybersecurity breaches may allow an unauthorized party to gain access to fund assets, customer data, orproprietary information, or cause a fund or its service providers to suffer data corruption or lose operational functionality. Similar incidents affectingissuers of a fund’s securities may negatively impact performance. Operational risk may arise from human error, error by third parties, communicationerrors, or technology failures, among other causes.
Economic and market events risk. Events in the U.S. and global financial markets, including actions taken by the U.S. Federal Reserve or foreigncentral banks to stimulate or stabilize economic growth, may at times result in unusually high market volatility, which could negatively impactperformance. Reduced liquidity in credit and fixed-income markets could adversely affect issuers worldwide. Banks and financial services companiescould suffer losses if interest rates rise or economic conditions deteriorate.
Equity securities risk. The price of equity securities may decline due to changes in a company’s financial condition or overall market conditions.
Exchange-traded funds risk. An ETF generally reflects the risks of the underlying securities it is designed to track. A fund bears ETF fees and expensesindirectly.
Exchange-traded notes risk. An ETN generally reflects the risks associated with the assets composing the underlying market benchmark or strategy itis designed to track. ETNs also are subject to issuer and fixed-income risks.
Fixed-income securities risk. A rise in interest rates typically causes bond prices to fall. The longer the average maturity or duration of the bonds heldby a fund, the more sensitive it will likely be to interest-rate fluctuations. An issuer may not make all interest payments or repay all or any of theprincipal borrowed. Changes in a security’s credit quality may adversely affect fund performance.
Fund of funds risk. The fund’s ability to achieve its investment objective will depend largely, in part, on: (i) the underlying funds’ performance,expenses and ability to meet their investment objectives; and (ii) properly rebalancing assets among underlying funds and different asset classes. Thefund is also subject to risks related to: (i) layering of fees of the underlying funds; and (ii) conflicts of interest associated with the subadvisor’s ability toallocate fund assets without limit to other funds it advises and/or other funds advised by affiliated subadvisors. There is no assurance that either thefund or the underlying funds will achieve their investment objectives. A fund bears underlying fund fees and expenses indirectly.
Hedging, derivatives, and other strategic transactions risk. Hedging, derivatives, and other strategic transactions may increase a fund’s volatilityand could produce disproportionate losses, potentially more than the fund’s principal investment. Risks of these transactions are different from andpossibly greater than risks of investing directly in securities and other traditional instruments. Under certain market conditions, derivatives couldbecome harder to value or sell and may become subject to liquidity risk (i.e., the inability to enter into closing transactions). Regulatory changes in
.142

derivative markets could impact the cost of or the fund’s ability to engage in derivative transactions. Derivatives and other strategic transactions that afund intends to utilize include: futures contracts and options. Futures contracts and options generally are subject to counterparty risk.
Investment company securities risk. A fund bears underlying fund fees and expenses indirectly.
JHVIT Lifestyle Portfolio asset transfer risk. The Lifestyle Conservative Portfolio (the “JHVIT Lifestyle Portfolio”) is offered in connection withspecific guaranteed benefits under variable annuity contracts (the “Contracts”) issued by John Hancock Life Insurance Company (U.S.A.) and JohnHancock Life Insurance Company of New York (collectively, the “John Hancock Issuers”).
The Contracts provide that the John Hancock Issuers can automatically transfer contract value between the Lifestyle Portfolio and the Select Bond Trustthrough a non-discretionary, systematic mathematical process. The purpose of these transfers is to attempt to protect contract value from declines dueto market volatility, and thereby limit the John Hancock Issuers’ exposure to risk under the guaranteed benefits under the Contracts. The timing andamount of any transfer of contract value under the John Hancock Issuers’ process will depend on several factors including market movements. Ingeneral, the higher the equity component of a JHVIT Lifestyle Portfolio, the more likely that contract value will be reallocated from the JHVITLifestyle Portfolio to the Select Bond Trust when equity markets fall. These asset flows may negatively affect the performance of an underlying fund inwhich the JHVIT Lifestyle Portfolio invests by increasing the underlying fund’s transaction costs and causing it to purchase or sell securities when itwould not normally do so. It could be particularly disadvantageous for the underlying fund if it experiences outflows and needs to sell securities at atime of volatility in the markets, when values could be falling. Because the JHVIT Lifestyle Portfolio bear their proportionate share of the transactioncosts of the underlying funds, increased underlying fund expenses may indirectly negatively affect the performance of the JHVIT Lifestyle Portfolio.
Liquidity risk. The extent (if at all) to which a security may be sold or a derivative position closed without negatively impacting its market value may beimpaired by reduced market activity or participation, legal restrictions, or other economic and market impediments. Liquidity risk may be magnified inrising interest rate environments due to higher than normal redemption rates. Widespread selling of fixed-income securities to satisfy redemptionsduring periods of reduced demand may adversely impact the price or salability of such securities. Periods of heavy redemption could cause the fund tosell assets at a loss or depressed value, which could negatively affect performance. Redemption risk is heightened during periods of declining or illiquidmarkets.
Target allocation risk. The fund’s risk profile will change due to reallocation or rebalancing of portfolio assets.
Principal risks of investing in the underlying fundsThe fund is subject to risks, and you could lose money by investing in the fund. The principal risks of investing in the fund include:
Advance trade estimate risk. The JHVIT Lifestyle Portfolio may seek to mitigate asset transfer risk by adjusting its portfolio based on advanceestimates of automatic transfers of Contract value under the Contracts. The John Hancock Issuers have provided the JHVIT Lifestyle Portfolio’ssubadvisor with an analytical tool that calculates estimates of automatic transfers based on several factors, including the mathematical process forautomatic transfers and market movements before the daily close of trading. The subadvisor may, but is not required to, use the tool to adjust theJHVIT Lifestyle Portfolio’s portfolio with the goal of trading in securities or purchasing shares of underlying funds as close to the market close aspossible in order to limit the JHVIT Lifestyle Portfolio’s exposure to cash drag (i.e., holding cash while markets are rising) and adverse overnight marketfluctuations. For example, in a rising market, if the analytical tool suggests that the JHVIT Lifestyle Portfolio will receive inflows that day (the “TradeDate”), the subadvisor could buy securities or shares of an underlying fund close to or at the closing prices on the Trade Date, as opposed to thefollowing business day, when the actual transfer amount would be known. In a falling market, if the analytical tool suggests that the JHVITLifestyle Portfolio will experience outflows on Trade Date, the subadvisor could sell securities or shares of an underlying fund close to or at the closingprices on Trade Date, as opposed to the following business day, when the actual transfer amount would be known.
If the subadvisor relies on the analytical tool or its own judgment and places trades in anticipation of purchases and redemptions of JHVIT Lifestyleshares, there can be no assurance that the prices paid by the JHVIT Lifestyle Portfolio will be better than if the JHVIT Lifestyle Portfolio had traded thefollowing business day. The estimated transfer amount may be different from the actual transfer amount for various reasons, including changes inmarket direction, contract owner behavior and faulty inputs. If the estimated transfer amount is different from the actual transfer amount, the JHVITLifestyle Portfolio will buy or sell securities or shares of an underlying fund the following business day to adjust for this difference. For example, if cashflows into the JHVIT Lifestyle Portfolio are less than estimated, the JHVIT Lifestyle Portfolio could be forced to liquidate positions it had purchased.Conversely, if cash flows out of the JHVIT Lifestyle Portfolio are less than estimated, the JHVIT Lifestyle Portfolio may be required to repurchasepositions it had sold. In addition, purchasing securities or shares of an underlying fund early could cause the JHVIT Lifestyle Portfolio to spend moremoney than it has available and, in the event of a market decline, such leverage will magnify losses because the decline also affects the securitiespurchased with amounts in excess of the JHVIT Lifestyle Portfolio’s assets. Due to these various factors, trading on the basis of advance estimates ofautomatic transfers may cause higher portfolio turnover than that based solely on automatic transfers of Contract value under the Contracts, increaseJHVIT Lifestyle Portfolio expenses and adversely affect the performance of the JHVIT Lifestyle Portfolio.
Convertible securities risk. The market values of convertible securities tend to fall as interest rates rise and rise as interest rates fall. As the marketprice of underlying common stock declines below the conversion price, the market value of the convertible security tends to be increasingly influencedby its yield.
Credit and counterparty risk. The issuer or guarantor of a fixed-income security, the counterparty to an over-the-counter derivatives contract, or aborrower of fund securities may not make timely payments or otherwise honor its obligations. U.S. government securities are subject to varyingdegrees of credit risk depending upon the nature of their support. A downgrade or default affecting any of the fund’s securities could affect the fund’sperformance.
Cybersecurity and operational risk. Cybersecurity breaches may allow an unauthorized party to gain access to fund assets, customer data, orproprietary information, or cause a fund or its service providers to suffer data corruption or lose operational functionality. Similar incidents affecting
.143

issuers of a fund’s securities may negatively impact performance. Operational risk may arise from human error, error by third parties, communicationerrors, or technology failures, among other causes.
Economic and market events risk. Events in the U.S. and global financial markets, including actions taken by the U.S. Federal Reserve or foreigncentral banks to stimulate or stabilize economic growth, may at times result in unusually high market volatility, which could negatively impactperformance. Reduced liquidity in credit and fixed-income markets could adversely affect issuers worldwide. Banks and financial services companiescould suffer losses if interest rates rise or economic conditions deteriorate.
Equity securities risk. The price of equity securities may decline due to changes in a company’s financial condition or overall market conditions.Growth company securities may fluctuate more in price than other securities because of the greater emphasis on earnings expectations. Securities themanager believes are undervalued may never realize their full potential value, and in certain markets value stocks may underperform the market as awhole.
Exchange-traded funds risk. An ETF generally reflects the risks of the underlying securities it is designed to track. A fund bears ETF fees and expensesindirectly.
Fixed-income securities risk. A rise in interest rates typically causes bond prices to fall. The longer the average maturity or duration of the bonds heldby a fund, the more sensitive it will likely be to interest-rate fluctuations. An issuer may not make all interest payments or repay all or any of theprincipal borrowed. Changes in a security’s credit quality may adversely affect fund performance.
Foreign securities risk. Less information may be publicly available regarding foreign issuers. Foreign securities may be subject to foreign taxes andmay be more volatile than U.S. securities. Currency fluctuations and political and economic developments may adversely impact the value of foreignsecurities. The risks of investing in foreign securities are magnified in emerging markets.
Hedging, derivatives, and other strategic transactions risk. Hedging, derivatives, and other strategic transactions may increase a fund’s volatilityand could produce disproportionate losses, potentially more than the fund’s principal investment. Risks of these transactions are different from andpossibly greater than risks of investing directly in securities and other traditional instruments. Under certain market conditions, derivatives couldbecome harder to value or sell and may become subject to liquidity risk (i.e., the inability to enter into closing transactions). Regulatory changes inderivative markets could impact the cost of or the fund’s ability to engage in derivative transactions. Derivatives and other strategic transactions that afund intends to utilize include: futures contracts and options. Futures contracts and options generally are subject to counterparty risk.
Index management risk. Certain factors may cause a fund that is an index fund to track its target index less closely. For example, a subadvisor mayselect securities that are not fully representative of the index, and the fund’s transaction expenses, and the size and timing of its cash flows, may resultin the fund’s performance being different than that of its index. Moreover, the fund will generally reflect the performance of its target index evenwhen the index does not perform well.
Initial public offerings risk. IPO share prices are frequently volatile and may significantly impact fund performance.
Large company risk. Larger companies may grow more slowly than smaller companies or be slower to respond to business developments. Large-capitalization securities may underperform the market as a whole.
Liquidity risk. The extent (if at all) to which a security may be sold or a derivative position closed without negatively impacting its market value may beimpaired by reduced market activity or participation, legal restrictions, or other economic and market impediments. Liquidity risk may be magnified inrising interest rate environments due to higher than normal redemption rates. Widespread selling of fixed-income securities to satisfy redemptionsduring periods of reduced demand may adversely impact the price or salability of such securities. Periods of heavy redemption could cause the fund tosell assets at a loss or depressed value, which could negatively affect performance. Redemption risk is heightened during periods of declining or illiquidmarkets.
Lower-rated and high-yield fixed-income securities risk. Lower-rated and high-yield fixed-income securities (junk bonds) are subject to greatercredit quality risk, risk of default, and price volatility than higher-rated fixed-income securities, may be considered speculative, and can be difficult toresell.
Mortgage-backed and asset-backed securities risk. Mortgage-backed and asset-backed securities are subject to different combinations ofprepayment, extension, interest-rate, and other market risks.
Non-diversified risk. Adverse events affecting a particular issuer or group of issuers may magnify losses for non-diversified funds, which may invest alarge portion of assets in any one issuer or a small number of issuers.
Sector risk. When a fund focuses its investments in certain sectors of the economy, its performance may be driven largely by sector performance andcould fluctuate more widely than if the fund were invested more evenly across sectors.
Short sales risk. In a short sale, a fund pays interest on the borrowed security. The fund will lose money if the security price increases between theshort sale and the replacement date.
Small and mid-sized company risk. Small and mid-sized companies are generally less established and may be more volatile than larger companies.Small and/or mid-capitalization securities may underperform the market as a whole.
Past performanceThe following information provides some indication of the risks of investing in the fund by showing changes in performance from year to year and byshowing how average annual returns for specified periods compare with those of a broad measure of market performance. The S&P 500 Index and theCombined Index (described below) show how the fund’s performance compares against the returns of similar investments. Performance shown for
.144
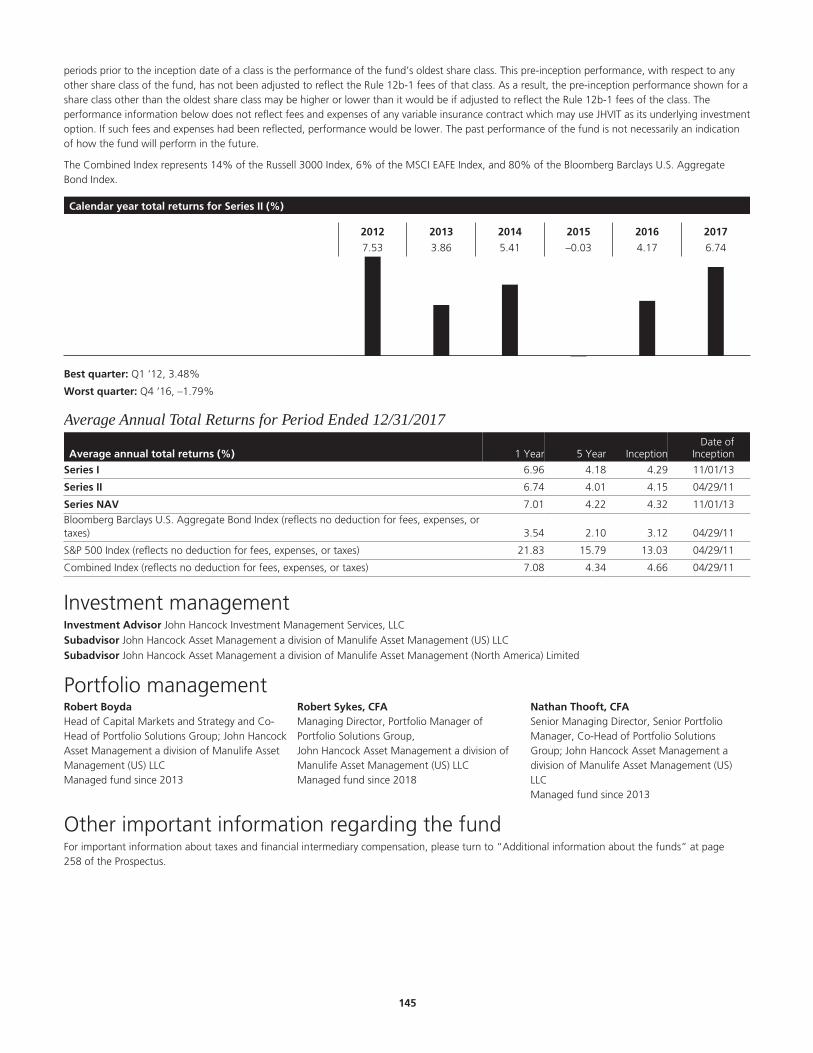
periods prior to the inception date of a class is the performance of the fund’s oldest share class. This pre-inception performance, with respect to anyother share class of the fund, has not been adjusted to reflect the Rule 12b-1 fees of that class. As a result, the pre-inception performance shown for ashare class other than the oldest share class may be higher or lower than it would be if adjusted to reflect the Rule 12b-1 fees of the class. Theperformance information below does not reflect fees and expenses of any variable insurance contract which may use JHVIT as its underlying investmentoption. If such fees and expenses had been reflected, performance would be lower. The past performance of the fund is not necessarily an indicationof how the fund will perform in the future.
The Combined Index represents 14% of the Russell 3000 Index, 6% of the MSCI EAFE Index, and 80% of the Bloomberg Barclays U.S. AggregateBond Index.
Calendar year total returns for Series II (%)
2012 2013 2014 2015 2016 2017
7.53 3.86 5.41 –0.03 4.17 6.74
Best quarter: Q1 ‘12, 3.48%
Worst quarter: Q4 ‘16, –1.79%
Average Annual Total Returns for Period Ended 12/31/2017
Average annual total returns (%) 1 Year 5 Year InceptionDate of
Inception
Series I 6.96 4.18 4.29 11/01/13
Series II 6.74 4.01 4.15 04/29/11
Series NAV 7.01 4.22 4.32 11/01/13Bloomberg Barclays U.S. Aggregate Bond Index (reflects no deduction for fees, expenses, ortaxes) 3.54 2.10 3.12 04/29/11
S&P 500 Index (reflects no deduction for fees, expenses, or taxes) 21.83 15.79 13.03 04/29/11
Combined Index (reflects no deduction for fees, expenses, or taxes) 7.08 4.34 4.66 04/29/11
Investment managementInvestment Advisor John Hancock Investment Management Services, LLC§
Subadvisor John Hancock Asset Management a division of Manulife Asset Management (US) LLC§
Subadvisor John Hancock Asset Management a division of Manulife Asset Management (North America) Limited
Portfolio managementRobert BoydaHead of Capital Markets and Strategy and Co-Head of Portfolio Solutions Group; John HancockAsset Management a division of Manulife AssetManagement (US) LLCManaged fund since 2013
Robert Sykes, CFAManaging Director, Portfolio Manager ofPortfolio Solutions Group,John Hancock Asset Management a division ofManulife Asset Management (US) LLCManaged fund since 2018
Nathan Thooft, CFASenior Managing Director, Senior PortfolioManager, Co-Head of Portfolio SolutionsGroup; John Hancock Asset Management adivision of Manulife Asset Management (US)LLCManaged fund since 2013
Other important information regarding the fundFor important information about taxes and financial intermediary compensation, please turn to “Additional information about the funds” at page258 of the Prospectus.
.145
Lifestyle Growth Portfolio (formerly Lifestyle Growth PS Series)Investment objectiveTo seek long-term growth of capital. Current income is also a consideration.
Fees and expensesThis table describes the fees and expenses that you may pay if you buy and hold shares of the fund. The fees and expenses do not reflect fees andexpenses of any variable insurance contract that may use the fund as its underlying investment option and would be higher if they did.
Annual fund operating expenses (%) (expenses that you pay each year as a percentage of the valueof your investment) Series I Series II Series NAV
Management fee 0.04 0.04 0.04
Distribution and service (Rule 12b-1) fees 0.05 0.25 0.00
Other expenses 0.03 0.03 0.03
Acquired fund fees and expenses1 0.55 0.55 0.55
Total annual fund operating expenses2 0.67 0.87 0.62
1 “Acquired fund fees and expenses” are based on indirect net expenses associated with the fund’s investments in underlying investment companies.2 The “Total annual fund operating expenses” shown may not correlate to the fund’s ratios of expenses to average daily net assets shown in the “Financial highlights” section of
the fund’s prospectus, which does not include “Acquired fund fees and expenses.”
Expense exampleThe examples are intended to help you compare the cost of investing in the fund with the cost of investing in other mutual funds. The examplesassume that $10,000 is invested in the fund for the periods indicated and then all shares are redeemed at the end of those periods. The examples alsoassume that the investment has a 5% return each year and that the fund’s operating expenses remain the same. The expense example does not reflectfees and expenses of any variable insurance contract that may use the fund as its underlying investment option and would be higher if they did.Although your actual costs may be higher or lower, based on these assumptions your costs would be:
Expenses ($) Series I Series II Series NAV
1 year 68 89 63
3 years 214 278 199
5 years 373 482 346
10 years 835 1,073 774
Portfolio turnoverThe fund, which operates as a fund of funds and invests in underlying funds, does not pay transaction costs, such as commissions, when it buys andsells shares of underlying funds (or “turns over” its portfolio). An underlying fund does pay transaction costs when it turns over its portfolio, and ahigher portfolio turnover rate may indicate higher transaction costs. These costs, which are not reflected in annual fund operating expenses or in theexample, affect the performance of the underlying funds and of the fund. During its most recent fiscal year, the fund’s portfolio turnover rate was 4%of the average value of its portfolio.
Principal investment strategiesThe fund, except as otherwise described below, operates as a fund of funds and normally invests approximately 70% of its assets in underlying fundsthat invest primarily in equity securities or in futures contracts on equity markets (the “Equity Allocation”) and approximately 30% of its assets inunderlying funds that invest primarily in fixed-income securities or in futures contracts on fixed-income markets (the “Fixed Income Allocation”).Underlying funds may include exchange traded funds (“ETFs”) and the fund may invest a significant portion of its assets in ETFs. At the discretion ofthe subadvisor, the Equity Allocation may also include direct investments in equity securities and the Fixed Income Allocation may also include directinvestments in fixed-income securities. The subadvisor may also determine in light of market or economic conditions that the normal percentagelimitations should be exceeded to protect the fund or achieve its investment objective.
Within the prescribed percentage allocation, the subadvisor selects the percentage level to be maintained in specific underlying funds and in futurescontracts on equity or fixed-income markets. These allocations may be changed at any time by the subadvisor.
The fund may invest in various underlying funds that as a group hold a wide range of equity type securities. These include small-, mid- and large-capitalization stocks, domestic and foreign securities (including emerging market securities) and sector holdings such as utilities, science, andtechnology stocks. Each of these underlying funds has its own investment strategy which, for example, may focus on growth stocks or value stocks ormay employ a strategy combining growth and income stocks and/or may invest in derivatives such as options on securities and futures contracts. Thefund may also invest in underlying funds that purchase futures contracts on equity markets.
.146

Certain of these underlying funds focus their investment strategy on fixed-income securities, which may include investment grade and belowinvestment grade debt securities with maturities that range from short to longer term. The fixed-income underlying funds collectively hold various typesof debt instruments such as corporate bonds and mortgage backed, U.S. and foreign government issued, domestic and international securities.
The fund may invest in derivatives, which are financial contracts with a value that depends on, or is derived from, the value of underlying assets,reference rates or indexes. Derivatives may relate to stocks, bonds, interest rates, currencies or currency exchange rates and related indexes. The fundmay use derivatives for hedging and nonhedging purposes including, without limitation, the following purposes:
To establish a position in the derivatives markets as a method of gaining exposure to a particular security or market;
To attempt to protect against possible changes in the market value of securities held or to be purchased by the fund or an underlying fund;
To manage the effective maturity or duration of the securities of the fund or an underlying fund; and
To facilitate the repatriation of foreign currency and the settlement of purchases of foreign securities.
The fund may invest in other types of investments including exchange-traded notes (ETNs) as described under “Other Permitted Investments of theFund of Funds.”
The fund bears its own expenses and, in addition, indirectly bears its proportionate share of the expenses of the underlying funds in which it invests.
Principal risks of investing in the fund of fundsThe fund of funds is subject to risks, and you could lose money by investing in the fund. The principal risks of investing in the fund of funds include:
Commodity risk. Commodity prices may be volatile due to fluctuating demand, supply disruption, speculation, and other factors. Certain commodityinvestments may have no active trading market at times.
Credit and counterparty risk. The issuer or guarantor of a fixed-income security, the counterparty to an over-the-counter derivatives contract, or aborrower of fund securities may not make timely payments or otherwise honor its obligations. U.S. government securities are subject to varyingdegrees of credit risk depending upon the nature of their support. A downgrade or default affecting any of the fund’s securities could affect the fund’sperformance.
Cybersecurity and operational risk. Cybersecurity breaches may allow an unauthorized party to gain access to fund assets, customer data, orproprietary information, or cause a fund or its service providers to suffer data corruption or lose operational functionality. Similar incidents affectingissuers of a fund’s securities may negatively impact performance. Operational risk may arise from human error, error by third parties, communicationerrors, or technology failures, among other causes.
Economic and market events risk. Events in the U.S. and global financial markets, including actions taken by the U.S. Federal Reserve or foreigncentral banks to stimulate or stabilize economic growth, may at times result in unusually high market volatility, which could negatively impactperformance. Reduced liquidity in credit and fixed-income markets could adversely affect issuers worldwide. Banks and financial services companiescould suffer losses if interest rates rise or economic conditions deteriorate.
Equity securities risk. The price of equity securities may decline due to changes in a company’s financial condition or overall market conditions.
Exchange-traded funds risk. An ETF generally reflects the risks of the underlying securities it is designed to track. A fund bears ETF fees and expensesindirectly.
Exchange-traded notes risk. An ETN generally reflects the risks associated with the assets composing the underlying market benchmark or strategy itis designed to track. ETNs also are subject to issuer and fixed-income risks.
Fixed-income securities risk. A rise in interest rates typically causes bond prices to fall. The longer the average maturity or duration of the bonds heldby a fund, the more sensitive it will likely be to interest-rate fluctuations. An issuer may not make all interest payments or repay all or any of theprincipal borrowed. Changes in a security’s credit quality may adversely affect fund performance.
Fund of funds risk. The fund’s ability to achieve its investment objective will depend largely, in part, on: (i) the underlying funds’ performance,expenses and ability to meet their investment objectives; and (ii) properly rebalancing assets among underlying funds and different asset classes. Thefund is also subject to risks related to: (i) layering of fees of the underlying funds; and (ii) conflicts of interest associated with the subadvisor’s ability toallocate fund assets without limit to other funds it advises and/or other funds advised by affiliated subadvisors. There is no assurance that either thefund or the underlying funds will achieve their investment objectives. A fund bears underlying fund fees and expenses indirectly.
Hedging, derivatives, and other strategic transactions risk. Hedging, derivatives, and other strategic transactions may increase a fund’s volatilityand could produce disproportionate losses, potentially more than the fund’s principal investment. Risks of these transactions are different from andpossibly greater than risks of investing directly in securities and other traditional instruments. Under certain market conditions, derivatives couldbecome harder to value or sell and may become subject to liquidity risk (i.e., the inability to enter into closing transactions). Regulatory changes inderivative markets could impact the cost of or the fund’s ability to engage in derivative transactions. Derivatives and other strategic transactions that afund intends to utilize include: futures contracts and options. Futures contracts and options generally are subject to counterparty risk.
Investment company securities risk. A fund bears underlying fund fees and expenses indirectly.
JHVIT Lifestyle Portfolio asset transfer risk. The Lifestyle Growth Portfolio (the “JHVIT Lifestyle Portfolio”) is offered in connection with specificguaranteed benefits under variable annuity contracts (the “Contracts”) issued by John Hancock Life Insurance Company (U.S.A.) and John HancockLife Insurance Company of New York (collectively, the “John Hancock Issuers”).
.147
The Contracts provide that the John Hancock Issuers can automatically transfer contract value between the Lifestyle Portfolio and the Select Bond Trustthrough a non-discretionary, systematic mathematical process. The purpose of these transfers is to attempt to protect contract value from declines dueto market volatility, and thereby limit the John Hancock Issuers’ exposure to risk under the guaranteed benefits under the Contracts. The timing andamount of any transfer of contract value under the John Hancock Issuers’ process will depend on several factors including market movements. Ingeneral, the higher the equity component of a JHVIT Lifestyle Portfolio, the more likely that contract value will be reallocated from the JHVITLifestyle Portfolio to the Select Bond Trust when equity markets fall. These asset flows may negatively affect the performance of an underlying fund inwhich the JHVIT Lifestyle Portfolio invests by increasing the underlying fund’s transaction costs and causing it to purchase or sell securities when itwould not normally do so. It could be particularly disadvantageous for the underlying fund if it experiences outflows and needs to sell securities at atime of volatility in the markets, when values could be falling. Because the JHVIT Lifestyle Portfolio bear their proportionate share of the transactioncosts of the underlying funds, increased underlying fund expenses may indirectly negatively affect the performance of the JHVIT Lifestyle Portfolio.
Liquidity risk. The extent (if at all) to which a security may be sold or a derivative position closed without negatively impacting its market value may beimpaired by reduced market activity or participation, legal restrictions, or other economic and market impediments. Liquidity risk may be magnified inrising interest rate environments due to higher than normal redemption rates. Widespread selling of fixed-income securities to satisfy redemptionsduring periods of reduced demand may adversely impact the price or salability of such securities. Periods of heavy redemption could cause the fund tosell assets at a loss or depressed value, which could negatively affect performance. Redemption risk is heightened during periods of declining or illiquidmarkets.
Target allocation risk. The fund’s risk profile will change due to reallocation or rebalancing of portfolio assets.
Principal risks of investing in the underlying fundsThe principal risks of investing in the Underlying Funds include:
Advance trade estimate risk. The JHVIT Lifestyle Portfolio may seek to mitigate asset transfer risk by adjusting its portfolio based on advanceestimates of automatic transfers of Contract value under the Contracts. The John Hancock Issuers have provided the JHVIT Lifestyle Portfolio’ssubadvisor with an analytical tool that calculates estimates of automatic transfers based on several factors, including the mathematical process forautomatic transfers and market movements before the daily close of trading. The subadvisor may, but is not required to, use the tool to adjust theJHVIT Lifestyle Portfolio’s portfolio with the goal of trading in securities or purchasing shares of underlying funds as close to the market close aspossible in order to limit the JHVIT Lifestyle Portfolio’s exposure to cash drag (i.e., holding cash while markets are rising) and adverse overnight marketfluctuations. For example, in a rising market, if the analytical tool suggests that the JHVIT Lifestyle Portfolio will receive inflows that day (the “TradeDate”), the subadvisor could buy securities or shares of an underlying fund close to or at the closing prices on the Trade Date, as opposed to thefollowing business day, when the actual transfer amount would be known. In a falling market, if the analytical tool suggests that the JHVITLifestyle Portfolio will experience outflows on Trade Date, the subadvisor could sell securities or shares of an underlying fund close to or at the closingprices on Trade Date, as opposed to the following business day, when the actual transfer amount would be known.
If the subadvisor relies on the analytical tool or its own judgment and places trades in anticipation of purchases and redemptions of JHVIT Lifestyleshares, there can be no assurance that the prices paid by the JHVIT Lifestyle Portfolio will be better than if the JHVIT Lifestyle Portfolio had traded thefollowing business day. The estimated transfer amount may be different from the actual transfer amount for various reasons, including changes inmarket direction, contract owner behavior and faulty inputs. If the estimated transfer amount is different from the actual transfer amount, the JHVITLifestyle Portfolio will buy or sell securities or shares of an underlying fund the following business day to adjust for this difference. For example, if cashflows into the JHVIT Lifestyle Portfolio are less than estimated, the JHVIT Lifestyle Portfolio could be forced to liquidate positions it had purchased.Conversely, if cash flows out of the JHVIT Lifestyle Portfolio are less than estimated, the JHVIT Lifestyle Portfolio may be required to repurchasepositions it had sold. In addition, purchasing securities or shares of an underlying fund early could cause the JHVIT Lifestyle Portfolio to spend moremoney than it has available and, in the event of a market decline, such leverage will magnify losses because the decline also affects the securitiespurchased with amounts in excess of the JHVIT Lifestyle Portfolio’s assets. Due to these various factors, trading on the basis of advance estimates ofautomatic transfers may cause higher portfolio turnover than that based solely on automatic transfers of Contract value under the Contracts, increaseJHVIT Lifestyle Portfolio expenses and adversely affect the performance of the JHVIT Lifestyle Portfolio.
Convertible securities risk. The market values of convertible securities tend to fall as interest rates rise and rise as interest rates fall. As the marketprice of underlying common stock declines below the conversion price, the market value of the convertible security tends to be increasingly influencedby its yield.
Credit and counterparty risk. The issuer or guarantor of a fixed-income security, the counterparty to an over-the-counter derivatives contract, or aborrower of fund securities may not make timely payments or otherwise honor its obligations. U.S. government securities are subject to varyingdegrees of credit risk depending upon the nature of their support. A downgrade or default affecting any of the fund’s securities could affect the fund’sperformance.
Cybersecurity and operational risk. Cybersecurity breaches may allow an unauthorized party to gain access to fund assets, customer data, orproprietary information, or cause a fund or its service providers to suffer data corruption or lose operational functionality. Similar incidents affectingissuers of a fund’s securities may negatively impact performance. Operational risk may arise from human error, error by third parties, communicationerrors, or technology failures, among other causes.
Economic and market events risk. Events in the U.S. and global financial markets, including actions taken by the U.S. Federal Reserve or foreigncentral banks to stimulate or stabilize economic growth, may at times result in unusually high market volatility, which could negatively impactperformance. Reduced liquidity in credit and fixed-income markets could adversely affect issuers worldwide. Banks and financial services companiescould suffer losses if interest rates rise or economic conditions deteriorate.
.148
Equity securities risk. The price of equity securities may decline due to changes in a company’s financial condition or overall market conditions.Growth company securities may fluctuate more in price than other securities because of the greater emphasis on earnings expectations. Securities themanager believes are undervalued may never realize their full potential value, and in certain markets value stocks may underperform the market as awhole.
Exchange-traded funds risk. An ETF generally reflects the risks of the underlying securities it is designed to track. A fund bears ETF fees and expensesindirectly.
Fixed-income securities risk. A rise in interest rates typically causes bond prices to fall. The longer the average maturity or duration of the bonds heldby a fund, the more sensitive it will likely be to interest-rate fluctuations. An issuer may not make all interest payments or repay all or any of theprincipal borrowed. Changes in a security’s credit quality may adversely affect fund performance.
Foreign securities risk. Less information may be publicly available regarding foreign issuers. Foreign securities may be subject to foreign taxes andmay be more volatile than U.S. securities. Currency fluctuations and political and economic developments may adversely impact the value of foreignsecurities. The risks of investing in foreign securities are magnified in emerging markets.
Hedging, derivatives, and other strategic transactions risk. Hedging, derivatives, and other strategic transactions may increase a fund’s volatilityand could produce disproportionate losses, potentially more than the fund’s principal investment. Risks of these transactions are different from andpossibly greater than risks of investing directly in securities and other traditional instruments. Under certain market conditions, derivatives couldbecome harder to value or sell and may become subject to liquidity risk (i.e., the inability to enter into closing transactions). Regulatory changes inderivative markets could impact the cost of or the fund’s ability to engage in derivative transactions. Derivatives and other strategic transactions that afund intends to utilize include: futures contracts and options. Futures contracts and options generally are subject to counterparty risk.
Index management risk. Certain factors may cause a fund that is an index fund to track its target index less closely. For example, a subadvisor mayselect securities that are not fully representative of the index, and the fund’s transaction expenses, and the size and timing of its cash flows, may resultin the fund’s performance being different than that of its index. Moreover, the fund will generally reflect the performance of its target index evenwhen the index does not perform well.
Initial public offerings risk. IPO share prices are frequently volatile and may significantly impact fund performance.
Large company risk. Larger companies may grow more slowly than smaller companies or be slower to respond to business developments. Large-capitalization securities may underperform the market as a whole.
Liquidity risk. The extent (if at all) to which a security may be sold or a derivative position closed without negatively impacting its market value may beimpaired by reduced market activity or participation, legal restrictions, or other economic and market impediments. Liquidity risk may be magnified inrising interest rate environments due to higher than normal redemption rates. Widespread selling of fixed-income securities to satisfy redemptionsduring periods of reduced demand may adversely impact the price or salability of such securities. Periods of heavy redemption could cause the fund tosell assets at a loss or depressed value, which could negatively affect performance. Redemption risk is heightened during periods of declining or illiquidmarkets.
Lower-rated and high-yield fixed-income securities risk. Lower-rated and high-yield fixed-income securities (junk bonds) are subject to greatercredit quality risk, risk of default, and price volatility than higher-rated fixed-income securities, may be considered speculative, and can be difficult toresell.
Mortgage-backed and asset-backed securities risk. Mortgage-backed and asset-backed securities are subject to different combinations ofprepayment, extension, interest-rate, and other market risks.
Non-diversified risk. Adverse events affecting a particular issuer or group of issuers may magnify losses for non-diversified funds, which may invest alarge portion of assets in any one issuer or a small number of issuers.
Sector risk. When a fund focuses its investments in certain sectors of the economy, its performance may be driven largely by sector performance andcould fluctuate more widely than if the fund were invested more evenly across sectors.
Short sales risk. In a short sale, a fund pays interest on the borrowed security. The fund will lose money if the security price increases between theshort sale and the replacement date.
Small and mid-sized company risk. Small and mid-sized companies are generally less established and may be more volatile than larger companies.Small and/or mid-capitalization securities may underperform the market as a whole.
Past performanceThe following information provides some indication of the risks of investing in the fund by showing changes in performance from year to year and byshowing how average annual returns for specified periods compare with those of a broad measure of market performance. The Bloomberg BarclaysU.S. Aggregate Bond Index and the Combined Index (described below) show how the fund’s performance compares against the returns of similarinvestments. Performance shown for periods prior to the inception date of a class is the performance of the fund’s oldest share class. This pre-inceptionperformance, with respect to any other share class of the fund, has not been adjusted to reflect the Rule 12b-1 fees of that class. As a result, the pre-inception performance shown for a share class other than the oldest share class may be higher or lower than it would be if adjusted to reflect the Rule12b-1 fees of the class. The performance information below does not reflect fees and expenses of any variable insurance contract which may use JHVITas its underlying investment option. If such fees and expenses had been reflected, performance would be lower. The past performance of the fund isnot necessarily an indication of how the fund will perform in the future.
.149

The Combined Index represents 49% of the Russell 3000 Index, 21% of the MSCI EAFE Index and 30% of the Bloomberg Barclays U.S. AggregateBond Index.
Calendar year total returns for Series II (%)
2012 2013 2014 2015 2016 2017
12.45 18.86 5.88 –0.25 7.02 15.90
Best quarter: Q1 ‘12, 9.44%
Worst quarter: Q3 ‘15, –5.45%
Average Annual Total Returns for Period Ended 12/31/2017
Average annual total returns (%) 1 Year 5 Year InceptionDate of
Inception
Series I 16.13 9.45 7.60 11/01/13
Series II 15.90 9.26 7.46 04/29/11
Series NAV 16.20 9.49 7.63 11/01/13
S&P 500 Index (reflects no deduction for fees, expenses, or taxes) 21.83 15.79 13.03 04/29/11Bloomberg Barclays U.S. Aggregate Bond Index (reflects no deduction for fees, expenses, ortaxes) 3.54 2.10 3.12 04/29/11
Combined Index (reflects no deduction for fees, expenses, or taxes) 16.40 9.94 8.32 04/29/11
Investment managementInvestment Advisor John Hancock Investment Management Services, LLC§
Subadvisor John Hancock Asset Management a division of Manulife Asset Management (US) LLC§
Subadvisor John Hancock Asset Management a division of Manulife Asset Management (North America) Limited
Portfolio managementRobert BoydaHead of Capital Markets and Strategy and Co-Head of Portfolio Solutions Group; John HancockAsset Management a division of Manulife AssetManagement (US) LLCManaged fund since 2013
Robert Sykes, CFAManaging Director, Portfolio Manager ofPortfolio Solutions Group,John Hancock Asset Management a division ofManulife Asset Management (US) LLCManaged fund since 2018
Nathan Thooft, CFASenior Managing Director, Senior PortfolioManager, Co-Head of Portfolio SolutionsGroup; John Hancock Asset Management adivision of Manulife Asset Management (US)LLCManaged fund since 2013
Other important information regarding the fundFor important information about taxes and financial intermediary compensation, please turn to “Additional information about the funds” at page258 of the Prospectus.
.150
Lifestyle Moderate Portfolio (formerly Lifestyle Moderate PS Series)Investment objectiveTo seek a balance between a high level of current income and growth of capital, with a greater emphasis on income.
Fees and expensesThis table describes the fees and expenses that you may pay if you buy and hold shares of the fund. The fees and expenses do not reflect fees andexpenses of any variable insurance contract that may use the fund as its underlying investment option and would be higher if they did.
Annual fund operating expenses (%) (expenses that you pay each year as a percentage of the valueof your investment) Series I Series II Series NAV
Management fee 0.04 0.04 0.04
Distribution and service (Rule 12b-1) fees 0.05 0.25 0.00
Other expenses 0.05 0.05 0.05
Acquired fund fees and expenses1 0.57 0.57 0.57
Total annual fund operating expenses2 0.71 0.91 0.66
Contractual expense reimbursement3 –0.01 –0.01 –0.01
Total annual fund operating expenses after expense reimbursements 0.70 0.90 0.65
1 “Acquired fund fees and expenses” are based on indirect net expenses associated with the fund’s investments in underlying investment companies.2 The “Total annual fund operating expenses” shown may not correlate to the fund’s ratios of expenses to average daily net assets shown in the “Financial highlights” section of
the fund’s prospectus, which does not include “Acquired fund fees and expenses.”3 The advisor has contractually agreed to reduce its management fee and/or make payment to the fund in an amount equal to the amount by which “Other expenses” of the
fund exceed 0.04% of the average daily net assets of the fund. “Other expenses” means all of the expenses of the fund, excluding certain expenses such as advisory fees,taxes, brokerage commissions, interest expense, litigation and indemnification expenses and other extraordinary expenses not incurred in the ordinary course of the fund’sbusiness, distribution and service (Rule 12b-1) fees, underlying fund expenses (acquired fund fees), and short dividend expense. The current expense limitation agreementexpires on April 30, 2019 unless renewed by mutual agreement of the fund and the advisor based upon a determination that this is appropriate under the circumstances atthat time.
Expense exampleThe examples are intended to help you compare the cost of investing in the fund with the cost of investing in other mutual funds. The examplesassume that $10,000 is invested in the fund for the periods indicated and then all shares are redeemed at the end of those periods. The examples alsoassume that the investment has a 5% return each year and that the fund’s operating expenses remain the same. The expense example does not reflectfees and expenses of any variable insurance contract that may use the fund as its underlying investment option and would be higher if they did.Although your actual costs may be higher or lower, based on these assumptions your costs would be:
Expenses ($) Series I Series II Series NAV
1 year 72 92 66
3 years 226 289 210
5 years 394 503 367
10 years 882 1,119 822
Portfolio turnoverThe fund, which operates as a fund of funds and invests in underlying funds, does not pay transaction costs, such as commissions, when it buys andsells shares of underlying funds (or “turns over” its portfolio). An underlying fund does pay transaction costs when it turns over its portfolio, and ahigher portfolio turnover rate may indicate higher transaction costs. These costs, which are not reflected in annual fund operating expenses or in theexample, affect the performance of the underlying funds and of the fund. During its most recent fiscal year, the fund’s portfolio turnover rate was 7%of the average value of its portfolio.
Principal investment strategiesThe fund, except as otherwise described below, operates as a fund of funds and normally invests approximately 40% of its assets in underlying fundsthat invest primarily in equity securities or in futures contracts on equity markets (the “Equity Allocation”) and approximately 60% of its assets inunderlying funds that invest primarily in fixed-income securities or in futures contracts on fixed-income markets (the “Fixed Income Allocation”).Underlying funds may include exchange traded funds (“ETFs”) and the fund may invest a significant portion of its assets in ETFs. At the discretion ofthe subadvisor, the Equity Allocation may also include direct investments in equity securities and the Fixed Income Allocation may also include directinvestments in fixed-income securities. The subadvisor may also determine in light of market or economic conditions that the normal percentagelimitations should be exceeded to protect the fund or achieve its investment objective.
.151
Within the prescribed percentage allocation, the subadvisor selects the percentage level to be maintained in specific underlying funds and in futurescontracts on equity or fixed-income markets. These allocations may be changed at any time by the subadvisor.
The fund may invest in various underlying funds that as a group hold a wide range of equity type securities. These include small-, mid- and large-capitalization stocks, domestic and foreign securities (including emerging market securities) and sector holdings such as utilities, science, andtechnology stocks. Each of these underlying funds has its own investment strategy which, for example, may focus on growth stocks or value stocks ormay employ a strategy combining growth and income stocks and/or may invest in derivatives such as options on securities and futures contracts. Thefund may also invest in underlying funds that purchase futures contracts on equity markets.
Certain of these underlying funds focus their investment strategy on fixed-income securities, which may include investment grade and belowinvestment grade debt securities with maturities that range from short to longer term. The fixed-income underlying funds collectively hold various typesof debt instruments such as corporate bonds and mortgage backed, U.S. and foreign government issued, domestic and international securities.
The fund may invest in derivatives, which are financial contracts with a value that depends on, or is derived from, the value of underlying assets,reference rates or indexes. Derivatives may relate to stocks, bonds, interest rates, currencies or currency exchange rates and related indexes. The fundmay use derivatives for hedging and nonhedging purposes including, without limitation, the following purposes:
To establish a position in the derivatives markets as a method of gaining exposure to a particular security or market;
To attempt to protect against possible changes in the market value of securities held or to be purchased by the fund or an underlying fund;
To manage the effective maturity or duration of the securities of the fund or an underlying fund; and
To facilitate the repatriation of foreign currency and the settlement of purchases of foreign securities.
The fund may invest in other types of investments including exchange-traded notes (ETNs) as described under “Other Permitted Investments of theFund of Funds.”
The fund bears its own expenses and, in addition, indirectly bears its proportionate share of the expenses of the underlying funds in which it invests.
Principal risks of investing in the fund of fundsThe fund of funds is subject to risks, and you could lose money by investing in the fund. The principal risks of investing in the fund of funds include:
Commodity risk. Commodity prices may be volatile due to fluctuating demand, supply disruption, speculation, and other factors. Certain commodityinvestments may have no active trading market at times.
Credit and counterparty risk. The issuer or guarantor of a fixed-income security, the counterparty to an over-the-counter derivatives contract, or aborrower of fund securities may not make timely payments or otherwise honor its obligations. U.S. government securities are subject to varyingdegrees of credit risk depending upon the nature of their support. A downgrade or default affecting any of the fund’s securities could affect the fund’sperformance.
Cybersecurity and operational risk. Cybersecurity breaches may allow an unauthorized party to gain access to fund assets, customer data, orproprietary information, or cause a fund or its service providers to suffer data corruption or lose operational functionality. Similar incidents affectingissuers of a fund’s securities may negatively impact performance. Operational risk may arise from human error, error by third parties, communicationerrors, or technology failures, among other causes.
Economic and market events risk. Events in the U.S. and global financial markets, including actions taken by the U.S. Federal Reserve or foreigncentral banks to stimulate or stabilize economic growth, may at times result in unusually high market volatility, which could negatively impactperformance. Reduced liquidity in credit and fixed-income markets could adversely affect issuers worldwide. Banks and financial services companiescould suffer losses if interest rates rise or economic conditions deteriorate.
Equity securities risk. The price of equity securities may decline due to changes in a company’s financial condition or overall market conditions.
Exchange-traded funds risk. An ETF generally reflects the risks of the underlying securities it is designed to track. A fund bears ETF fees and expensesindirectly.
Exchange-traded notes risk. An ETN generally reflects the risks associated with the assets composing the underlying market benchmark or strategy itis designed to track. ETNs also are subject to issuer and fixed-income risks.
Fixed-income securities risk. A rise in interest rates typically causes bond prices to fall. The longer the average maturity or duration of the bonds heldby a fund, the more sensitive it will likely be to interest-rate fluctuations. An issuer may not make all interest payments or repay all or any of theprincipal borrowed. Changes in a security’s credit quality may adversely affect fund performance.
Fund of funds risk. The fund’s ability to achieve its investment objective will depend largely, in part, on: (i) the underlying funds’ performance,expenses and ability to meet their investment objectives; and (ii) properly rebalancing assets among underlying funds and different asset classes. Thefund is also subject to risks related to: (i) layering of fees of the underlying funds; and (ii) conflicts of interest associated with the subadvisor’s ability toallocate fund assets without limit to other funds it advises and/or other funds advised by affiliated subadvisors. There is no assurance that either thefund or the underlying funds will achieve their investment objectives. A fund bears underlying fund fees and expenses indirectly.
Hedging, derivatives, and other strategic transactions risk. Hedging, derivatives, and other strategic transactions may increase a fund’s volatilityand could produce disproportionate losses, potentially more than the fund’s principal investment. Risks of these transactions are different from andpossibly greater than risks of investing directly in securities and other traditional instruments. Under certain market conditions, derivatives couldbecome harder to value or sell and may become subject to liquidity risk (i.e., the inability to enter into closing transactions). Regulatory changes in
.152

derivative markets could impact the cost of or the fund’s ability to engage in derivative transactions. Derivatives and other strategic transactions that afund intends to utilize include: futures contracts and options. Futures contracts and options generally are subject to counterparty risk.
Investment company securities risk. A fund bears underlying fund fees and expenses indirectly.
JHVIT Lifestyle Portfolio asset transfer risk. The Lifestyle Moderate Portfolio (the “JHVIT Lifestyle Portfolio”) is offered in connection with specificguaranteed benefits under variable annuity contracts (the “Contracts”) issued by John Hancock Life Insurance Company (U.S.A.) and John HancockLife Insurance Company of New York (collectively, the “John Hancock Issuers”).
The Contracts provide that the John Hancock Issuers can automatically transfer contract value between the Lifestyle Portfolio and the Select Bond Trustthrough a non-discretionary, systematic mathematical process. The purpose of these transfers is to attempt to protect contract value from declines dueto market volatility, and thereby limit the John Hancock Issuers’ exposure to risk under the guaranteed benefits under the Contracts. The timing andamount of any transfer of contract value under the John Hancock Issuers’ process will depend on several factors including market movements. Ingeneral, the higher the equity component of a JHVIT Lifestyle Portfolio, the more likely that contract value will be reallocated from the JHVITLifestyle Portfolio to the Select Bond Trust when equity markets fall. These asset flows may negatively affect the performance of an underlying fund inwhich the JHVIT Lifestyle Portfolio invests by increasing the underlying fund’s transaction costs and causing it to purchase or sell securities when itwould not normally do so. It could be particularly disadvantageous for the underlying fund if it experiences outflows and needs to sell securities at atime of volatility in the markets, when values could be falling. Because the JHVIT Lifestyle Portfolio bear their proportionate share of the transactioncosts of the underlying funds, increased underlying fund expenses may indirectly negatively affect the performance of the JHVIT Lifestyle Portfolio.
Liquidity risk. The extent (if at all) to which a security may be sold or a derivative position closed without negatively impacting its market value may beimpaired by reduced market activity or participation, legal restrictions, or other economic and market impediments. Liquidity risk may be magnified inrising interest rate environments due to higher than normal redemption rates. Widespread selling of fixed-income securities to satisfy redemptionsduring periods of reduced demand may adversely impact the price or salability of such securities. Periods of heavy redemption could cause the fund tosell assets at a loss or depressed value, which could negatively affect performance. Redemption risk is heightened during periods of declining or illiquidmarkets.
Target allocation risk. The fund’s risk profile will change due to reallocation or rebalancing of portfolio assets.
Principal risks of investing in the underlying fundsThe principal risks of investing in the Underlying Funds include:
Advance trade estimate risk. The JHVIT Lifestyle Portfolio may seek to mitigate asset transfer risk by adjusting its portfolio based on advanceestimates of automatic transfers of Contract value under the Contracts. The John Hancock Issuers have provided the JHVIT Lifestyle Portfolio’ssubadvisor with an analytical tool that calculates estimates of automatic transfers based on several factors, including the mathematical process forautomatic transfers and market movements before the daily close of trading. The subadvisor may, but is not required to, use the tool to adjust theJHVIT Lifestyle Portfolio’s portfolio with the goal of trading in securities or purchasing shares of underlying funds as close to the market close aspossible in order to limit the JHVIT Lifestyle Portfolio’s exposure to cash drag (i.e., holding cash while markets are rising) and adverse overnight marketfluctuations. For example, in a rising market, if the analytical tool suggests that the JHVIT Lifestyle Portfolio will receive inflows that day (the “TradeDate”), the subadvisor could buy securities or shares of an underlying fund close to or at the closing prices on the Trade Date, as opposed to thefollowing business day, when the actual transfer amount would be known. In a falling market, if the analytical tool suggests that the JHVITLifestyle Portfolio will experience outflows on Trade Date, the subadvisor could sell securities or shares of an underlying fund close to or at the closingprices on Trade Date, as opposed to the following business day, when the actual transfer amount would be known.
If the subadvisor relies on the analytical tool or its own judgment and places trades in anticipation of purchases and redemptions of JHVIT Lifestyleshares, there can be no assurance that the prices paid by the JHVIT Lifestyle Portfolio will be better than if the JHVIT Lifestyle Portfolio had traded thefollowing business day. The estimated transfer amount may be different from the actual transfer amount for various reasons, including changes inmarket direction, contract owner behavior and faulty inputs. If the estimated transfer amount is different from the actual transfer amount, the JHVITLifestyle Portfolio will buy or sell securities or shares of an underlying fund the following business day to adjust for this difference. For example, if cashflows into the JHVIT Lifestyle Portfolio are less than estimated, the JHVIT Lifestyle Portfolio could be forced to liquidate positions it had purchased.Conversely, if cash flows out of the JHVIT Lifestyle Portfolio are less than estimated, the JHVIT Lifestyle Portfolio may be required to repurchasepositions it had sold. In addition, purchasing securities or shares of an underlying fund early could cause the JHVIT Lifestyle Portfolio to spend moremoney than it has available and, in the event of a market decline, such leverage will magnify losses because the decline also affects the securitiespurchased with amounts in excess of the JHVIT Lifestyle Portfolio’s assets. Due to these various factors, trading on the basis of advance estimates ofautomatic transfers may cause higher portfolio turnover than that based solely on automatic transfers of Contract value under the Contracts, increaseJHVIT Lifestyle Portfolio expenses and adversely affect the performance of the JHVIT Lifestyle Portfolio.
Convertible securities risk. The market values of convertible securities tend to fall as interest rates rise and rise as interest rates fall. As the marketprice of underlying common stock declines below the conversion price, the market value of the convertible security tends to be increasingly influencedby its yield.
Credit and counterparty risk. The issuer or guarantor of a fixed-income security, the counterparty to an over-the-counter derivatives contract, or aborrower of fund securities may not make timely payments or otherwise honor its obligations. U.S. government securities are subject to varyingdegrees of credit risk depending upon the nature of their support. A downgrade or default affecting any of the fund’s securities could affect the fund’sperformance.
Cybersecurity and operational risk. Cybersecurity breaches may allow an unauthorized party to gain access to fund assets, customer data, orproprietary information, or cause a fund or its service providers to suffer data corruption or lose operational functionality. Similar incidents affecting
.153
issuers of a fund’s securities may negatively impact performance. Operational risk may arise from human error, error by third parties, communicationerrors, or technology failures, among other causes.
Economic and market events risk. Events in the U.S. and global financial markets, including actions taken by the U.S. Federal Reserve or foreigncentral banks to stimulate or stabilize economic growth, may at times result in unusually high market volatility, which could negatively impactperformance. Reduced liquidity in credit and fixed-income markets could adversely affect issuers worldwide. Banks and financial services companiescould suffer losses if interest rates rise or economic conditions deteriorate.
Equity securities risk. The price of equity securities may decline due to changes in a company’s financial condition or overall market conditions.Growth company securities may fluctuate more in price than other securities because of the greater emphasis on earnings expectations. Securities themanager believes are undervalued may never realize their full potential value, and in certain markets value stocks may underperform the market as awhole.
Exchange-traded funds risk. An ETF generally reflects the risks of the underlying securities it is designed to track. A fund bears ETF fees and expensesindirectly.
Fixed-income securities risk. A rise in interest rates typically causes bond prices to fall. The longer the average maturity or duration of the bonds heldby a fund, the more sensitive it will likely be to interest-rate fluctuations. An issuer may not make all interest payments or repay all or any of theprincipal borrowed. Changes in a security’s credit quality may adversely affect fund performance.
Foreign securities risk. Less information may be publicly available regarding foreign issuers. Foreign securities may be subject to foreign taxes andmay be more volatile than U.S. securities. Currency fluctuations and political and economic developments may adversely impact the value of foreignsecurities. The risks of investing in foreign securities are magnified in emerging markets.
Hedging, derivatives, and other strategic transactions risk. Hedging, derivatives, and other strategic transactions may increase a fund’s volatilityand could produce disproportionate losses, potentially more than the fund’s principal investment. Risks of these transactions are different from andpossibly greater than risks of investing directly in securities and other traditional instruments. Under certain market conditions, derivatives couldbecome harder to value or sell and may become subject to liquidity risk (i.e., the inability to enter into closing transactions). Regulatory changes inderivative markets could impact the cost of or the fund’s ability to engage in derivative transactions. Derivatives and other strategic transactions that afund intends to utilize include: futures contracts and options. Futures contracts and options generally are subject to counterparty risk.
Index management risk. Certain factors may cause a fund that is an index fund to track its target index less closely. For example, a subadvisor mayselect securities that are not fully representative of the index, and the fund’s transaction expenses, and the size and timing of its cash flows, may resultin the fund’s performance being different than that of its index. Moreover, the fund will generally reflect the performance of its target index evenwhen the index does not perform well.
Initial public offerings risk. IPO share prices are frequently volatile and may significantly impact fund performance.
Large company risk. Larger companies may grow more slowly than smaller companies or be slower to respond to business developments. Large-capitalization securities may underperform the market as a whole.
Liquidity risk. The extent (if at all) to which a security may be sold or a derivative position closed without negatively impacting its market value may beimpaired by reduced market activity or participation, legal restrictions, or other economic and market impediments. Liquidity risk may be magnified inrising interest rate environments due to higher than normal redemption rates. Widespread selling of fixed-income securities to satisfy redemptionsduring periods of reduced demand may adversely impact the price or salability of such securities. Periods of heavy redemption could cause the fund tosell assets at a loss or depressed value, which could negatively affect performance. Redemption risk is heightened during periods of declining or illiquidmarkets.
Lower-rated and high-yield fixed-income securities risk. Lower-rated and high-yield fixed-income securities (junk bonds) are subject to greatercredit quality risk, risk of default, and price volatility than higher-rated fixed-income securities, may be considered speculative, and can be difficult toresell.
Mortgage-backed and asset-backed securities risk. Mortgage-backed and asset-backed securities are subject to different combinations ofprepayment, extension, interest-rate, and other market risks.
Non-diversified risk. Adverse events affecting a particular issuer or group of issuers may magnify losses for non-diversified funds, which may invest alarge portion of assets in any one issuer or a small number of issuers.
Sector risk. When a fund focuses its investments in certain sectors of the economy, its performance may be driven largely by sector performance andcould fluctuate more widely than if the fund were invested more evenly across sectors.
Short sales risk. In a short sale, a fund pays interest on the borrowed security. The fund will lose money if the security price increases between theshort sale and the replacement date.
Small and mid-sized company risk. Small and mid-sized companies are generally less established and may be more volatile than larger companies.Small and/or mid-capitalization securities may underperform the market as a whole.
Past performanceThe following information provides some indication of the risks of investing in the fund by showing changes in performance from year to year and byshowing how average annual returns for specified periods compare with those of a broad measure of market performance. The S&P 500 Index and theCombined Index (described below) show how the fund’s performance compares against the returns of similar investments. Performance shown for
.154

periods prior to the inception date of a class is the performance of the fund’s oldest share class. This pre-inception performance, with respect to anyother share class of the fund, has not been adjusted to reflect the Rule 12b-1 fees of that class. As a result, the pre-inception performance shown for ashare class other than the oldest share class may be higher or lower than it would be if adjusted to reflect the Rule 12b-1 fees of the class. Theperformance information below does not reflect fees and expenses of any variable insurance contract which may use JHVIT as its underlying investmentoption. If such fees and expenses had been reflected, performance would be lower. The past performance of the fund is not necessarily an indicationof how the fund will perform in the future.
The Combined Index represents 28% of the Russell 3000 Index, 12% of the MSCI EAFE Index, and 60% of the Bloomberg Barclays U.S. AggregateBond Index.
Calendar year total returns for Series II (%)
2012 2013 2014 2015 2016 2017
9.55 10.12 5.61 –0.10 5.28 10.28
Best quarter: Q1 ‘12, 5.90%
Worst quarter: Q3 ‘15, –2.82%
Average Annual Total Returns for Period Ended 12/31/2017
Average annual total returns (%) 1 Year 5 Year InceptionDate of
Inception
Series I 10.43 6.34 5.74 11/01/13
Series II 10.28 6.17 5.61 04/29/11
Series NAV 10.56 6.39 5.78 11/01/13Bloomberg Barclays U.S. Aggregate Bond Index (reflects no deduction for fees, expenses, ortaxes) 3.54 2.10 3.12 04/29/11
S&P 500 Index (reflects no deduction for fees, expenses, or taxes) 21.83 15.79 13.03 04/29/11
Combined Index (reflects no deduction for fees, expenses, or taxes) 10.73 6.58 6.16 04/29/11
Investment managementInvestment Advisor John Hancock Investment Management Services, LLC§
Subadvisor John Hancock Asset Management a division of Manulife Asset Management (US) LLC§
Subadvisor John Hancock Asset Management a division of Manulife Asset Management (North America) Limited
Portfolio managementRobert BoydaHead of Capital Markets and Strategy and Co-Head of Portfolio Solutions Group; John HancockAsset Management a division of Manulife AssetManagement (US) LLCManaged fund since 2013
Robert Sykes, CFAManaging Director, Portfolio Manager ofPortfolio Solutions Group,John Hancock Asset Management a division ofManulife Asset Management (US) LLCManaged fund since 2018
Nathan Thooft, CFASenior Managing Director, Senior PortfolioManager, Co-Head of Portfolio SolutionsGroup; John Hancock Asset Management adivision of Manulife Asset Management (US)LLCManaged fund since 2013
Other important information regarding the fundFor important information about taxes and financial intermediary compensation, please turn to “Additional information about the funds” at page258 of the Prospectus.
.155
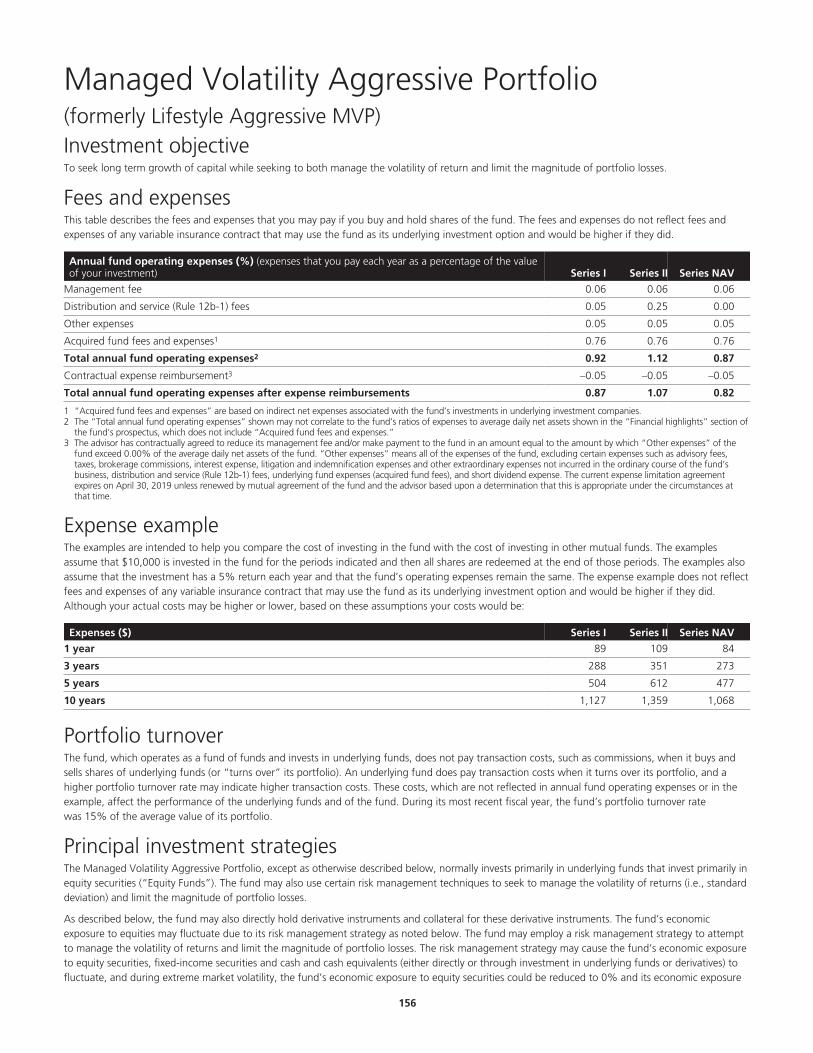
Managed Volatility Aggressive Portfolio (formerly Lifestyle Aggressive MVP)Investment objectiveTo seek long term growth of capital while seeking to both manage the volatility of return and limit the magnitude of portfolio losses.
Fees and expensesThis table describes the fees and expenses that you may pay if you buy and hold shares of the fund. The fees and expenses do not reflect fees andexpenses of any variable insurance contract that may use the fund as its underlying investment option and would be higher if they did.
Annual fund operating expenses (%) (expenses that you pay each year as a percentage of the valueof your investment) Series I Series II Series NAV
Management fee 0.06 0.06 0.06
Distribution and service (Rule 12b-1) fees 0.05 0.25 0.00
Other expenses 0.05 0.05 0.05
Acquired fund fees and expenses1 0.76 0.76 0.76
Total annual fund operating expenses2 0.92 1.12 0.87
Contractual expense reimbursement3 –0.05 –0.05 –0.05
Total annual fund operating expenses after expense reimbursements 0.87 1.07 0.82
1 “Acquired fund fees and expenses” are based on indirect net expenses associated with the fund’s investments in underlying investment companies.2 The “Total annual fund operating expenses” shown may not correlate to the fund’s ratios of expenses to average daily net assets shown in the “Financial highlights” section of
the fund’s prospectus, which does not include “Acquired fund fees and expenses.”3 The advisor has contractually agreed to reduce its management fee and/or make payment to the fund in an amount equal to the amount by which “Other expenses” of the
fund exceed 0.00% of the average daily net assets of the fund. “Other expenses” means all of the expenses of the fund, excluding certain expenses such as advisory fees,taxes, brokerage commissions, interest expense, litigation and indemnification expenses and other extraordinary expenses not incurred in the ordinary course of the fund’sbusiness, distribution and service (Rule 12b-1) fees, underlying fund expenses (acquired fund fees), and short dividend expense. The current expense limitation agreementexpires on April 30, 2019 unless renewed by mutual agreement of the fund and the advisor based upon a determination that this is appropriate under the circumstances atthat time.
Expense exampleThe examples are intended to help you compare the cost of investing in the fund with the cost of investing in other mutual funds. The examplesassume that $10,000 is invested in the fund for the periods indicated and then all shares are redeemed at the end of those periods. The examples alsoassume that the investment has a 5% return each year and that the fund’s operating expenses remain the same. The expense example does not reflectfees and expenses of any variable insurance contract that may use the fund as its underlying investment option and would be higher if they did.Although your actual costs may be higher or lower, based on these assumptions your costs would be:
Expenses ($) Series I Series II Series NAV
1 year 89 109 84
3 years 288 351 273
5 years 504 612 477
10 years 1,127 1,359 1,068
Portfolio turnoverThe fund, which operates as a fund of funds and invests in underlying funds, does not pay transaction costs, such as commissions, when it buys andsells shares of underlying funds (or “turns over” its portfolio). An underlying fund does pay transaction costs when it turns over its portfolio, and ahigher portfolio turnover rate may indicate higher transaction costs. These costs, which are not reflected in annual fund operating expenses or in theexample, affect the performance of the underlying funds and of the fund. During its most recent fiscal year, the fund’s portfolio turnover ratewas 15% of the average value of its portfolio.
Principal investment strategiesThe Managed Volatility Aggressive Portfolio, except as otherwise described below, normally invests primarily in underlying funds that invest primarily inequity securities (“Equity Funds”). The fund may also use certain risk management techniques to seek to manage the volatility of returns (i.e., standarddeviation) and limit the magnitude of portfolio losses.
As described below, the fund may also directly hold derivative instruments and collateral for these derivative instruments. The fund’s economicexposure to equities may fluctuate due to its risk management strategy as noted below. The fund may employ a risk management strategy to attemptto manage the volatility of returns and limit the magnitude of portfolio losses. The risk management strategy may cause the fund’s economic exposureto equity securities, fixed-income securities and cash and cash equivalents (either directly or through investment in underlying funds or derivatives) tofluctuate, and during extreme market volatility, the fund’s economic exposure to equity securities could be reduced to 0% and its economic exposure
.156

to cash and cash equivalents or fixed-income securities could increase to 100%. The subadvisor normally will seek to limit the fund’s exposure to equitysecurities (either directly or through investment in underlying funds or derivatives) to no more than 100% and normally will seek to reduce any equityexposure in excess of this amount as soon as practicable. However, the subadvisor may determine in light of market or economic conditions that thelimit should be exceeded to achieve the fund’s investment objective.
The fund seeks long term growth of capital while attempting to manage the volatility of returns and limit the magnitude of portfolio losses. The fundseeks to limit the volatility of returns to a range of 15% to 18.5% (as measured by annualized standard deviation of the fund’s returns). However,during periods of prolonged low market volatility the actual volatility experienced by the fund may fall below the range.
Volatility is a measure of the magnitude of up and down fluctuations in the fund’s NAV over time as measured by the annualized standard deviation ofits returns. Higher volatility generally indicates higher risk. The more a fund’s returns vary from the fund’s average return, the more volatile the fundand the higher the standard deviation. The purpose of managing the volatility of returns is to attempt to limit exposure to more volatile asset classes,including both equities and fixed-income asset classes, during periods of high volatility and protect the fund from losses during market declines. Thefund also seeks to limit the magnitude of portfolio losses in order to limit exposure during market declines. There can be no assurance that the riskmanagement strategy will be successful in managing the volatility of returns and limit the magnitude of portfolio losses.
In seeking to manage the volatility of returns and limit the magnitude of portfolio losses, the fund may employ certain risk management techniquesusing derivative instruments and may reallocate assets among the underlying Equity Funds, fixed-income securities, and cash and cash equivalents.These derivatives may be used to increase or decrease the fund’s net equity exposure and will typically consist of stock index futures, but may alsoinclude stock index options, options on stock index futures, and stock index swaps. The fund may also employ risk management techniques usingderivatives that may increase or decrease the fund’s exposure to certain types of fixed-income securities. These instruments may include governmentbond futures, swaps, and credit default swaps. For more information about these derivative instruments in which the fund may invest, please seethe “Hedging And Other Strategic Transactions” risk section in the Statement of Additional Information. Fund assets employed for its risk managementstrategy include not only derivative instruments but also fixed-income instruments, used to cover derivative positions. Because equity and fixed-incomederivative instruments may be purchased with a fraction of the assets that would be needed to purchase the securities directly, the remainder of theassets used for the risk management strategy will be invested in a variety of fixed-income instruments. The fund may be required to hold cash or otherliquid assets and post these assets with a broker as collateral to cover its obligation under the futures contracts. The fund’s risk management strategycould limit the upside participation of the fund in strong, rising markets with high volatility and could underperform funds that do not use a riskmanagement strategy.
The use of derivatives may be combined with asset allocation techniques. The timing and extent of these techniques will depend on several factors,including market movements. In general, when equity markets are more volatile or are declining, assets may be reallocated to fixed-income securities,cash and cash equivalents, and short positions in equity derivative instruments. When equity markets rise, or if volatility is lower, assets may bereallocated to Equity Funds and stock index futures, options, and swaps. Similarly, if fixed-income markets are volatile or are declining, assets may bereallocated to Equity Funds, cash and cash equivalents, and short positions in fixed-income derivative instruments. Even in periods of low volatility, thesubadvisor may continue to use risk management techniques to protect against sudden market movements, preserve gains after favorable marketconditions, and reduce losses in adverse market conditions. Due to the leverage provided by derivatives, the notional value of the fund’s derivativepositions could exceed 100% of the fund’s assets.
In determining when to employ risk management techniques, the subadvisor may use quantitative models that use historical factors such as marketmovements, and historical changes in the NAV of the fund to make this determination.
The subadvisor selects the percentage level to be maintained in specific underlying Equity Funds, fixed-income securities, and cash and cash equivalentsand may from time to time change the allocation to these investments or rebalance these holdings. To maintain a target allocation, daily cash flows forthe fund may be directed to underlying funds or other investments that most deviate from target.
The fund may invest in various Equity Funds that as a group hold a wide range of equity type securities. These include small-, mid- and large-capitalization stocks, domestic and foreign securities (including emerging market securities), and sector holdings such as utilities, science, andtechnology stocks. Each of these Equity Funds has its own investment strategy that, for example, may focus on growth stocks or value stocks or mayemploy a strategy combining growth and income stocks and/or may invest in derivatives such as options on securities and futures contracts. EquityFunds may include funds that employ a passive investment style (i.e., index funds and exchange-traded funds (ETFs)) and at times most of the fund’sassets may be invested in index funds.
The fund may also invest in the securities of other investment companies including ETFs and may invest directly in other types of investments, such asequity and fixed-income securities including U.S. government securities, closed-end funds, exchange-traded notes, and partnerships. See “OtherPermitted Investments by the Funds of Funds.” The fund may also engage in short selling. The fund may engage in active and frequent trading ofportfolio securities and other instruments to achieve its primary investment strategies.
The fund bears its own expenses and, in addition, indirectly bears its proportionate share of the expenses of the underlying funds in which it invests.
Use of Risk Management and Other Strategic Transactions. In addition to the risk management techniques described above, the fund is authorized touse other investment strategies referred to under “Hedging And Other Strategic Transactions” risk section including, without limitation, investing inforeign currency forward contracts, futures contracts including stock index and foreign currency futures, swaps including interest rate swaps, stockindex swaps and credit default swaps and options including stock index options and options on stock index futures, among others.
.157
Principal risks of investing in the fund of fundsThe fund of funds is subject to risks, and you could lose money by investing in the fund. The principal risks of investing in the fund of funds include:
Affiliated insurance companies. The Advisor may be influenced by the benefits to its affiliated life insurance companies in managing the fund andoverseeing its subadvisors. The John Hancock insurance companies issuing guaranteed benefits on variable annuity and insurance contracts investing inthe fund have a financial interest in preserving the value of the funds and reducing their volatility due to their obligations for these guaranteed benefits(the cost of providing these guaranteed benefits is related to several factors including the performance and volatility of the fund). To the extent thefund is successful in managing the volatility of returns and downside risk, the John Hancock insurance companies issuing guaranteed benefits onvariable annuity and insurance contracts investing in the fund will also benefit from a reduction in their potential investment risk which will reduce theircosts of hedging this risk and may reduce their reserve and capital requirements. These financial benefits to the John Hancock insurance companiesmay be material. The fund and the fund’s investment advisor have adopted procedures that are intended to address these conflicts and ensure that thefund is managed in accordance with its disclosed investment objectives and strategies.
Asset allocation risk. Although allocation among asset categories generally limits exposure to any one category, the management team may favor acategory that performs poorly relative to the others.
Cash collateral risk. To the extent a fund maintains cash collateral required to cover its obligations under the derivative instruments used in its riskmanagement strategy, such collateral holdings may have the effect of reducing overall portfolio returns. In addition, because such collateral positionscannot be eliminated or reduced unless the corresponding derivative obligation is eliminated or reduced, a large derivative position may materially limitthe subadvisor’s flexibility in managing the fund.
Commodity risk. Commodity prices may be volatile due to fluctuating demand, supply disruption, speculation, and other factors. Certain commodityinvestments may have no active trading market at times.
Credit and counterparty risk. The issuer or guarantor of a fixed-income security, the counterparty to an over-the-counter derivatives contract, or aborrower of fund securities may not make timely payments or otherwise honor its obligations. U.S. government securities are subject to varyingdegrees of credit risk depending upon the nature of their support. A downgrade or default affecting any of the fund’s securities could affect the fund’sperformance.
Cybersecurity and operational risk. Cybersecurity breaches may allow an unauthorized party to gain access to fund assets, customer data, orproprietary information, or cause a fund or its service providers to suffer data corruption or lose operational functionality. Similar incidents affectingissuers of a fund’s securities may negatively impact performance. Operational risk may arise from human error, error by third parties, communicationerrors, or technology failures, among other causes.
Economic and market events risk. Events in the U.S. and global financial markets, including actions taken by the U.S. Federal Reserve or foreigncentral banks to stimulate or stabilize economic growth, may at times result in unusually high market volatility, which could negatively impactperformance. Reduced liquidity in credit and fixed-income markets could adversely affect issuers worldwide. Banks and financial services companiescould suffer losses if interest rates rise or economic conditions deteriorate.
Equity securities risk. The price of equity securities may decline due to changes in a company’s financial condition or overall market conditions.
Exchange-traded funds risk. An ETF generally reflects the risks of the underlying securities it is designed to track. A fund bears ETF fees and expensesindirectly.
Exchange-traded notes risk. An ETN generally reflects the risks associated with the assets composing the underlying market benchmark or strategy itis designed to track. ETNs also are subject to issuer and fixed-income risks.
Fixed-income securities risk. A rise in interest rates typically causes bond prices to fall. The longer the average maturity or duration of the bonds heldby a fund, the more sensitive it will likely be to interest-rate fluctuations. An issuer may not make all interest payments or repay all or any of theprincipal borrowed. Changes in a security’s credit quality may adversely affect fund performance.
Fund of funds risk. The fund’s ability to achieve its investment objective will depend largely, in part, on: (i) the underlying funds’ performance,expenses and ability to meet their investment objectives; and (ii) properly rebalancing assets among underlying funds and different asset classes. Thefund is also subject to risks related to: (i) layering of fees of the underlying funds; and (ii) conflicts of interest associated with the subadvisor’s ability toallocate fund assets without limit to other funds it advises and/or other funds advised by affiliated subadvisors. There is no assurance that either thefund or the underlying funds will achieve their investment objectives. A fund bears underlying fund fees and expenses indirectly.
Hedging, derivatives, and other strategic transactions risk. Hedging, derivatives, and other strategic transactions may increase a fund’s volatilityand could produce disproportionate losses, potentially more than the fund’s principal investment. Risks of these transactions are different from andpossibly greater than risks of investing directly in securities and other traditional instruments. Under certain market conditions, derivatives couldbecome harder to value or sell and may become subject to liquidity risk (i.e., the inability to enter into closing transactions). Regulatory changes inderivative markets could impact the cost of or the fund’s ability to engage in derivatives transactions. Derivatives and other strategic transactions that afund may utilize include: credit default swaps, foreign currency forward contracts, futures contracts, interest-rate swaps, options, and swaps. Foreigncurrency forward contracts, futures contracts, options, and swaps generally are subject to counterparty risk. In addition, swaps may be subject tointerest-rate and settlement risk, and the risk of default of the underlying reference obligation. Derivatives associated with foreign currencytransactions are subject to currency risk.
Hedging risk. There may be imperfect or even negative correlation between the price of the futures contracts and the price of the underlyingsecurities. For example, futures contracts may not provide an effective hedge because changes in futures contract prices may not track those of theunderlying securities or indexes they are intended to hedge. In addition, there are significant differences between the securities and futures markets
.158
that could result in an imperfect correlation between the markets, causing a given hedge not to achieve its objectives. The degree of imperfection ofcorrelation depends on circumstances such as variations in speculative market demand for futures, including technical influences in futures trading, anddifferences between the financial instruments being hedged and the instruments underlying the standard contracts available for trading. A decision asto whether, when and how to hedge involves the exercise of skill and judgment, and even a well-conceived hedge may be unsuccessful to somedegree because of market behavior or unexpected interest rate trends. In addition, the fund’s investment in exchange-traded futures as a result of therisk management strategy could limit the upside participation of the fund in strong, rising markets with high volatility and could underperform fundsthat do not use a risk management strategy.
Investment company securities risk. A fund bears underlying fund fees and expenses indirectly.
Leverage. Certain of the risk management techniques that would be used in the strategy may involve indirect leverage. While these techniques wouldbe intended to reduce downside exposure, in some cases leverage may magnify losses.
Liquidity risk. The extent (if at all) to which a security may be sold or a derivative position closed without negatively impacting its market value may beimpaired by reduced market activity or participation, legal restrictions, or other economic and market impediments. Liquidity risk may be magnified inrising interest rate environments due to higher than normal redemption rates. Widespread selling of fixed-income securities to satisfy redemptionsduring periods of reduced demand may adversely impact the price or salability of such securities. Periods of heavy redemption could cause the fund tosell assets at a loss or depressed value, which could negatively affect performance. Redemption risk is heightened during periods of declining or illiquidmarkets.
Quantitative models may not produce the desired results. In determining when to employ risk management techniques and/or reallocateexposure among equity, fixed-income and cash, the subadvisor uses quantitative models that use historical market data. However, future marketconditions may not be consistent with historical periods, and the historical data may not, therefore, prove to be an accurate predictor of futurevolatility or losses. The model also may not measure or analyze such data effectively. Thus, the quantitative model may not produce the desired resultsand may not accurately forecast either future volatility or future large market declines, and this would affect the ability of a fund to be successful inmanaging the volatility of returns and limiting the magnitude of portfolio losses.
Risk management strategies may not be successful, may limit upside potential or may permit or result in losses. The purposes of the riskmanagement strategies are to attempt to limit the fund’s total risk exposure during periods of high market volatility and reduce the fund’s lossesduring market declines; however, there is no assurance that these strategies will be successful. These risk management strategies could limit the upsideparticipation of the fund in rising equity markets during periods of high volatility. In instances of equity market declines followed by rising equitymarkets and significant levels of market volatility, these risk management strategies may detract from fund performance and at times prevent the fundfrom fully recovering losses by limiting the levels of exposure to equity markets. Due to the use of historical data in the models used in the riskmanagement strategy, there can be delays, especially during volatile markets, in fully implementing the strategy when markets are declining causingthe fund to experience greater losses than if the strategy had been fully implemented. There can also be delays, especially during volatile markets, inremoving hedges designed to limit losses during declining markets when markets are rising strongly causing the fund to not fully participate in therising market. The application of risk management techniques can be complex, and misjudgments in implementation may result in under- or over-allocations to equity, fixed-income and/or cash and cash equivalent exposure causing the fund to underperform or experience losses. Also, futurescontracts may be subject to exchange-imposed daily price fluctuation limits, and trading may be halted if a contract’s price moves above or below thelimit on a given day. As a result, the fund may not be able to promptly liquidate unfavorable futures positions and could be required to hold suchpositions until the delivery date, regardless of changes in its value.
Since the characteristics of many securities change as markets change or time passes, the success of risk management techniques will be subject to theportfolio managers’ ability to execute the strategy. Moreover, risk management strategies may increase portfolio transaction costs, which could causeor increase losses or reduce gains. Any one or more of these factors may prevent the fund from achieving the intended risk management goals orcould cause the fund to underperform or experience losses (some of which may be sudden) or volatility for any particular period.
Short positions. In taking a short position, a fund seeks to profit from an anticipated decline in the value of a security or index of securities. If thesecurity or index instead appreciates in value, the fund will incur losses by having to pay to close out its position at a higher price than the price itreceived to open that position. Unlike losses from declines in long positions in stocks or other securities (which may not exceed the original amountinvested), the losses a fund may incur to close out a short position if the underlying security or index increases in value are potentially unlimited.
Swaps. Counterparty risk, liquidity risk (i.e., the inability to enter into closing transactions), interest-rate risk, settlement risk, risk of default of theunderlying reference obligation, and risk of disproportionate loss are the principal risks of engaging in transactions involving swaps.
Target allocation risk. The fund’s risk profile will change due to reallocation or rebalancing of portfolio assets.
Use of index futures. While the use of index futures may involve a small investment of cash, the losses to a fund could exceed the amount invested,and in certain cases even the total value of the fund’s assets, due to the embedded leverage provided by the derivative. Index futures may also result ina loss to the fund if the counterparty to the transaction does not perform.
Principal risks of investing in the underlying fundsThe principal risks of investing in the Underlying Funds include:
Convertible securities risk. The market values of convertible securities tend to fall as interest rates rise and rise as interest rates fall. As the marketprice of underlying common stock declines below the conversion price, the market value of the convertible security tends to be increasingly influencedby its yield.
.159

Credit and counterparty risk. The issuer or guarantor of a fixed-income security, the counterparty to an over-the-counter derivatives contract, or aborrower of fund securities may not make timely payments or otherwise honor its obligations. U.S. government securities are subject to varyingdegrees of credit risk depending upon the nature of their support. A downgrade or default affecting any of the fund’s securities could affect the fund’sperformance.
Cybersecurity and operational risk. Cybersecurity breaches may allow an unauthorized party to gain access to fund assets, customer data, orproprietary information, or cause a fund or its service providers to suffer data corruption or lose operational functionality. Similar incidents affectingissuers of a fund’s securities may negatively impact performance. Operational risk may arise from human error, error by third parties, communicationerrors, or technology failures, among other causes.
Economic and market events risk. Events in the U.S. and global financial markets, including actions taken by the U.S. Federal Reserve or foreigncentral banks to stimulate or stabilize economic growth, may at times result in unusually high market volatility, which could negatively impactperformance. Reduced liquidity in credit and fixed-income markets could adversely affect issuers worldwide. Banks and financial services companiescould suffer losses if interest rates rise or economic conditions deteriorate.
Equity securities risk. The price of equity securities may decline due to changes in a company’s financial condition or overall market conditions.Growth company securities may fluctuate more in price than other securities because of the greater emphasis on earnings expectations. Securities themanager believes are undervalued may never realize their full potential value, and in certain markets value stocks may underperform the market as awhole.
Exchange-traded funds risk. An ETF generally reflects the risks of the underlying securities it is designed to track. A fund bears ETF fees and expensesindirectly.
Fixed-income securities risk. A rise in interest rates typically causes bond prices to fall. The longer the average maturity or duration of the bonds heldby a fund, the more sensitive it will likely be to interest-rate fluctuations. An issuer may not make all interest payments or repay all or any of theprincipal borrowed. Changes in a security’s credit quality may adversely affect fund performance.
Foreign securities risk. Less information may be publicly available regarding foreign issuers. Foreign securities may be subject to foreign taxes andmay be more volatile than U.S. securities. Currency fluctuations and political and economic developments may adversely impact the value of foreignsecurities. The risks of investing in foreign securities are magnified in emerging markets.
Hedging, derivatives, and other strategic transactions risk. Hedging, derivatives, and other strategic transactions may increase a fund’s volatilityand could produce disproportionate losses, potentially more than the fund’s principal investment. Risks of these transactions are different from andpossibly greater than risks of investing directly in securities and other traditional instruments. Under certain market conditions, derivatives couldbecome harder to value or sell and may become subject to liquidity risk (i.e., the inability to enter into closing transactions). Regulatory changes inderivative markets could impact the cost of or the fund’s ability to engage in derivatives transactions. Derivatives and other strategic transactions that afund may utilize include: credit default swaps, foreign currency forward contracts, futures contracts, interest-rate swaps, and options. Foreign currencyforward contracts, futures contracts, options, and swaps generally are subject to counterparty risk. In addition, swaps may be subject to interest-rateand settlement risk, and the risk of default of the underlying reference obligation. Derivatives associated with foreign currency transactions are subjectto currency risk.
Index management risk. Certain factors may cause a fund that is an index fund to track its target index less closely. For example, a subadvisor mayselect securities that are not fully representative of the index, and the fund’s transaction expenses, and the size and timing of its cash flows, may resultin the fund’s performance being different than that of its index. Moreover, the fund will generally reflect the performance of its target index evenwhen the index does not perform well.
Initial public offerings risk. IPO share prices are frequently volatile and may significantly impact fund performance.
Large company risk. Larger companies may grow more slowly than smaller companies or be slower to respond to business developments. Large-capitalization securities may underperform the market as a whole.
Liquidity risk. The extent (if at all) to which a security may be sold or a derivative position closed without negatively impacting its market value may beimpaired by reduced market activity or participation, legal restrictions, or other economic and market impediments. Liquidity risk may be magnified inrising interest rate environments due to higher than normal redemption rates. Widespread selling of fixed-income securities to satisfy redemptionsduring periods of reduced demand may adversely impact the price or salability of such securities. Periods of heavy redemption could cause the fund tosell assets at a loss or depressed value, which could negatively affect performance. Redemption risk is heightened during periods of declining or illiquidmarkets.
Lower-rated and high-yield fixed-income securities risk. Lower-rated and high-yield fixed-income securities (junk bonds) are subject to greatercredit quality risk, risk of default, and price volatility than higher-rated fixed-income securities, may be considered speculative, and can be difficult toresell.
Mortgage-backed and asset-backed securities risk. Mortgage-backed and asset-backed securities are subject to different combinations ofprepayment, extension, interest-rate, and other market risks.
Sector risk. When a fund focuses its investments in certain sectors of the economy, its performance may be driven largely by sector performance andcould fluctuate more widely than if the fund were invested more evenly across sectors.
Short sales risk. In a short sale, a fund pays interest on the borrowed security. The fund will lose money if the security price increases between theshort sale and the replacement date.
.160
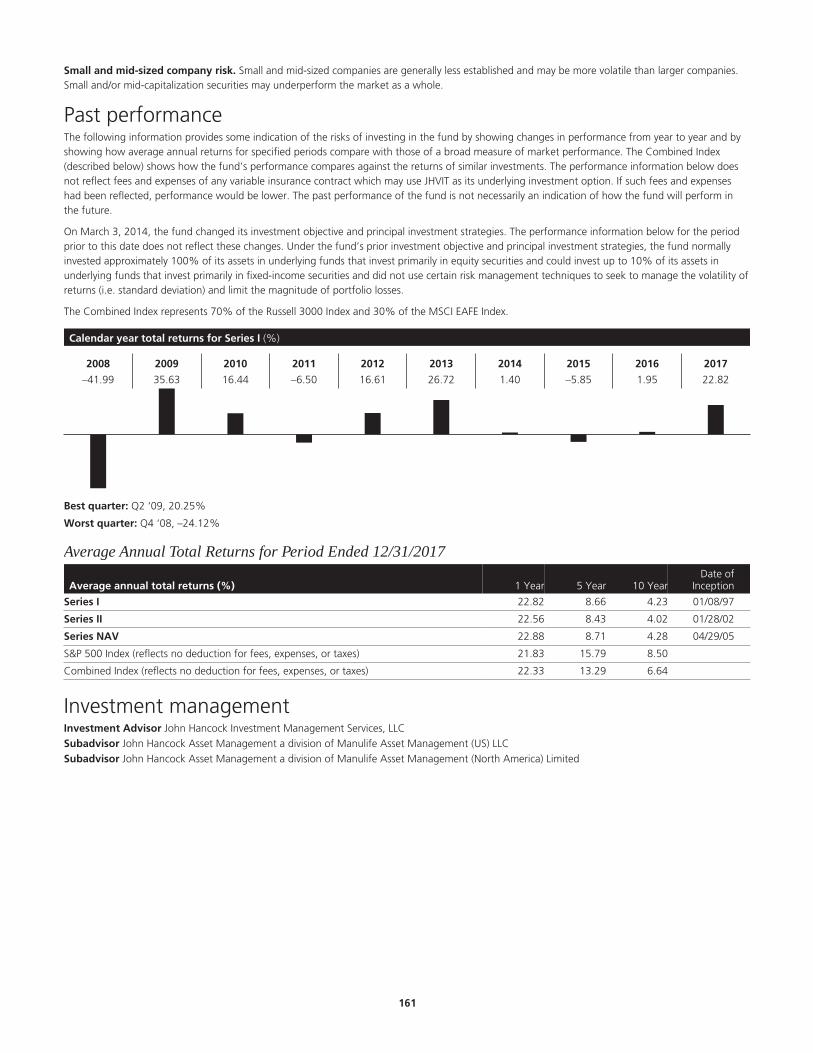
Small and mid-sized company risk. Small and mid-sized companies are generally less established and may be more volatile than larger companies.Small and/or mid-capitalization securities may underperform the market as a whole.
Past performanceThe following information provides some indication of the risks of investing in the fund by showing changes in performance from year to year and byshowing how average annual returns for specified periods compare with those of a broad measure of market performance. The Combined Index(described below) shows how the fund’s performance compares against the returns of similar investments. The performance information below doesnot reflect fees and expenses of any variable insurance contract which may use JHVIT as its underlying investment option. If such fees and expenseshad been reflected, performance would be lower. The past performance of the fund is not necessarily an indication of how the fund will perform inthe future.
On March 3, 2014, the fund changed its investment objective and principal investment strategies. The performance information below for the periodprior to this date does not reflect these changes. Under the fund’s prior investment objective and principal investment strategies, the fund normallyinvested approximately 100% of its assets in underlying funds that invest primarily in equity securities and could invest up to 10% of its assets inunderlying funds that invest primarily in fixed-income securities and did not use certain risk management techniques to seek to manage the volatility ofreturns (i.e. standard deviation) and limit the magnitude of portfolio losses.
The Combined Index represents 70% of the Russell 3000 Index and 30% of the MSCI EAFE Index.
Calendar year total returns for Series I (%)
2008 2009 2010 2011 2012 2013 2014 2015 2016 2017
–41.99 35.63 16.44 –6.50 16.61 26.72 1.40 –5.85 1.95 22.82
Best quarter: Q2 ‘09, 20.25%
Worst quarter: Q4 ‘08, –24.12%
Average Annual Total Returns for Period Ended 12/31/2017
Average annual total returns (%) 1 Year 5 Year 10 YearDate of
Inception
Series I 22.82 8.66 4.23 01/08/97
Series II 22.56 8.43 4.02 01/28/02
Series NAV 22.88 8.71 4.28 04/29/05
S&P 500 Index (reflects no deduction for fees, expenses, or taxes) 21.83 15.79 8.50
Combined Index (reflects no deduction for fees, expenses, or taxes) 22.33 13.29 6.64
Investment managementInvestment Advisor John Hancock Investment Management Services, LLC§
Subadvisor John Hancock Asset Management a division of Manulife Asset Management (US) LLC§
Subadvisor John Hancock Asset Management a division of Manulife Asset Management (North America) Limited
.161

Portfolio managementRobert BoydaHead of Capital Markets and Strategy and Co-Head of Portfolio Solutions Group, John HancockAsset Management a division of Manulife AssetManagement (US) LLCManaged fund since 2010
Jeffrey N. Given, CFASenior Managing Director and Senior PortfolioManager, John Hancock Asset Management adivision of Manulife Asset Management (US) LLCManaged fund since 2014
Luning “Gary” LiManaging Director and Senior PortfolioManager, John Hancock Asset Management adivision of Manulife Asset Management (US)LLCManaged fund since 2014
Robert Sykes, CFAManaging Director, Portfolio Manager ofPortfolio Solutions Group,John Hancock Asset Management a division ofManulife Asset Management (US) LLCManaged fund since 2018
Nathan Thooft, CFASenior Managing Director, Senior PortfolioManager, Co-Head of Portfolio Solutions Group,John Hancock Asset Management a division ofManulife Asset Management (US) LLCManaged fund since 2013
Other important information regarding the fundFor important information about taxes and financial intermediary compensation, please turn to “Additional information about the funds” at page258 of the Prospectus.
.162
Managed Volatility Balanced Portfolio (formerly Lifestyle Balanced MVP)Investment objectiveTo seek growth of capital and current income while seeking to both manage the volatility of return and limit the magnitude of portfolio losses.
Fees and expensesThis table describes the fees and expenses that you may pay if you buy and hold shares of the fund. The fees and expenses do not reflect fees andexpenses of any variable insurance contract that may use the fund as its underlying investment option and would be higher if they did.
Annual fund operating expenses (%) (expenses that you pay each year as a percentage of the valueof your investment) Series I Series II Series NAV
Management fee 0.06 0.06 0.06
Distribution and service (Rule 12b-1) fees 0.05 0.25 0.00
Other expenses 0.02 0.02 0.02
Acquired fund fees and expenses1 0.62 0.62 0.62
Total annual fund operating expenses2 0.75 0.95 0.70
Contractual expense reimbursement3 –0.02 –0.02 –0.02
Total annual fund operating expenses after expense reimbursements 0.73 0.93 0.68
1 “Acquired fund fees and expenses” are based on indirect net expenses associated with the fund’s investments in underlying investment companies.2 The “Total annual fund operating expenses” shown may not correlate to the fund’s ratios of expenses to average daily net assets shown in the “Financial highlights” section of
the fund’s prospectus, which does not include “Acquired fund fees and expenses.”3 The advisor has contractually agreed to reduce its management fee and/or make payment to the fund in an amount equal to the amount by which “Other expenses” of the
fund exceed 0.00% of the average daily net assets of the fund. “Other expenses” means all of the expenses of the fund, excluding certain expenses such as advisory fees,taxes, brokerage commissions, interest expense, litigation and indemnification expenses and other extraordinary expenses not incurred in the ordinary course of the fund’sbusiness, distribution and service (Rule 12b-1) fees, underlying fund expenses (acquired fund fees), and short dividend expense. The current expense limitation agreementexpires on April 30, 2019 unless renewed by mutual agreement of the fund and the advisor based upon a determination that this is appropriate under the circumstances atthat time.
Expense exampleThe examples are intended to help you compare the cost of investing in the fund with the cost of investing in other mutual funds. The examplesassume that $10,000 is invested in the fund for the periods indicated and then all shares are redeemed at the end of those periods. The examples alsoassume that the investment has a 5% return each year and that the fund’s operating expenses remain the same. The expense example does not reflectfees and expenses of any variable insurance contract that may use the fund as its underlying investment option and would be higher if they did.Although your actual costs may be higher or lower, based on these assumptions your costs would be:
Expenses ($) Series I Series II Series NAV
1 year 75 95 69
3 years 238 301 222
5 years 415 524 388
10 years 928 1,165 869
Portfolio turnoverThe fund, which operates as a fund of funds and invests in underlying funds, does not pay transaction costs, such as commissions, when it buys andsells shares of underlying funds (or “turns over” its portfolio). An underlying fund does pay transaction costs when it turns over its portfolio, and ahigher portfolio turnover rate may indicate higher transaction costs. These costs, which are not reflected in annual fund operating expenses or in theexample, affect the performance of the underlying funds and of the fund. During its most recent fiscal year, the fund’s portfolio turnover rate was 7%of the average value of its portfolio.
Principal investment strategiesThe Managed Volatility Balanced Portfolio, except as otherwise described below, normally invests primarily in underlying funds that invest primarily inequity securities (“Equity Funds”) and underlying funds that invest primarily in fixed-income securities (“Fixed-Income Funds”). The fund may also usecertain risk management techniques to seek to manage the volatility of returns (i.e. standard deviation) and limit the magnitude of portfolio losses.
As described below, the fund may directly hold derivative instruments and collateral for these derivative instruments. The fund’s economic exposure toequities and fixed-income securities may fluctuate due to its risk management strategy as noted below. The fund may employ a risk managementstrategy to attempt to manage the volatility of returns and limit the magnitude of portfolio losses. The risk management strategy may cause the fund’seconomic exposure to equity securities, fixed-income securities and cash and cash equivalents (either directly or through investment in underlying fundsor derivatives) to fluctuate, and during extreme market volatility, the fund’s economic exposure to either equity or fixed-income securities could be
.163

reduced to 0% and its economic exposure to cash and cash equivalents could increase to 100%. The subadvisor normally will seek to limit the fund’sexposure to equity securities (either directly or through investment in underlying funds or derivatives) to no more than 55% and normally will seek toreduce any equity exposure in excess of this amount as soon as practicable. However, the subadvisor may determine in light of market or economicconditions that the limit should be exceeded to achieve the fund’s investment objective.
The fund seeks long term growth of capital while attempting to manage the volatility of returns and limit the magnitude of portfolio losses. The fundseeks to limit the volatility of returns to a range of 8.25% to 10.25% (as measured by annualized standard deviation of the fund’s returns). However,during periods of prolonged low market volatility the actual volatility experienced by the fund may fall below the range due to maximum limits onequity and fixed-income exposures.
Volatility is a measure of the magnitude of up and down fluctuations in the fund’s NAV over time as measured by the annualized standard deviation ofits returns. Higher volatility generally indicates higher risk. The more a fund’s returns vary from the fund’s average return, the more volatile the fundand the higher the standard deviation. The purpose of managing the volatility of returns is to attempt to limit exposure to more volatile asset classes,including both equities and fixed-income asset classes, during periods of high volatility and protect the fund from losses during market declines. Thefund also seeks to limit the magnitude of portfolio losses in order to limit exposure during market declines. There can be no assurance that the riskmanagement strategy will be successful in managing the volatility of returns and limit the magnitude of portfolio losses.
In seeking to manage the volatility of returns and limit the magnitude of portfolio losses, the fund may employ certain risk management techniquesusing derivative instruments and may reallocate assets between the underlying Equity and Fixed-Income Funds. These derivatives may be used toincrease or decrease the fund’s net equity exposure and will typically consist of stock index futures, but may also include stock index options, optionson stock index futures, and stock index swaps. The fund may also employ risk management techniques using derivatives that may increase or decreasethe fund’s exposure to certain types of fixed-income securities. These instruments may include government bond futures, swaps, and credit defaultswaps. For more information about these derivative instruments in which the fund may invest, please see the “Hedging And Other StrategicTransactions” risk section in the Statement of Additional Information. Fund assets employed for its risk management strategy include not onlyderivative instruments but also fixed-income instruments, used to cover derivative positions. Because equity and fixed-income derivative instrumentsmay be purchased with a fraction of the assets that would be needed to purchase the securities directly, the remainder of the assets used for the riskmanagement strategy will be invested in a variety of fixed-income instruments. The fund may be required to hold cash or other liquid assets and postthese assets with a broker as collateral to cover its obligation under the futures contracts. The fund’s risk management strategy could limit the upsideparticipation of the fund in strong, rising markets with high volatility and could underperform funds that do not use a risk management strategy.
The use of derivatives may be combined with asset allocation techniques. The timing and extent of these techniques will depend on several factors,including market movements. In general, when equity markets are more volatile or are declining, assets may be reallocated to Fixed-Income Funds,cash and/or cash equivalents, and short positions in equity derivative instruments. When equity markets rise, or if volatility is lower, assets may bereallocated to Equity Funds and stock index futures, options, and swaps. Similarly, if fixed-income markets are volatile or are declining, assets may bereallocated to Equity Funds, cash and cash equivalents, and short positions in fixed-income derivative instruments. Even in periods of low volatility, thesubadvisor may continue to use risk management techniques to protect against sudden market movements, preserve gains after favorable marketconditions, and reduce losses in adverse market conditions. Due to the leverage provided by derivatives, the notional value of the fund’s derivativepositions could exceed 100% of the fund’s assets.
In determining when to employ risk management techniques and/or reallocate assets between Equity Funds and Fixed-Income Funds, the subadvisormay use quantitative models that use historical factors such as market movements, and historical changes in the NAV of the fund to make thisdetermination.
The subadvisor selects the percentage level to be maintained in specific underlying Equity Funds and Fixed-Income Funds, and cash and cashequivalents and may from time to time change the allocation in specific underlying funds or rebalance the underlying funds. From time to time, asignificant portion of the fund’s underlying fixed income assets may be managed by an affiliated subadvisor. To maintain a target allocation in theunderlying funds, daily cash flows for the fund may be directed to its underlying funds that most deviate from target.
The fund may invest in various Equity Funds that as a group hold a wide range of equity type securities. These include small-, mid- and large-capitalization stocks, domestic and foreign securities (including emerging market securities), and sector holdings such as utilities, science, andtechnology stocks. Each of these Equity Funds has its own investment strategy which, for example, may focus on growth stocks or value stocks or mayemploy a strategy combining growth and income stocks and/or may invest in derivatives such as options on securities and futures contracts. The fundmay also invest in Fixed-Income Funds that as a group hold a wide range of fixed-income securities including investment grade and below-investment-grade debt securities with maturities that range from short to longer term. The Fixed-Income Funds collectively hold various types of debt instruments,such as corporate bonds and mortgage backed, government issued, domestic and international securities. Equity Funds and Fixed-Income Funds mayinclude funds that employ a passive investment style (i.e., index funds and exchange-traded funds (ETFs)) and at times most of the fund’s assets may beinvested in index funds.
The fund may also invest in the securities of other investment companies including ETFs and may invest directly in other types of investments, such asequity and fixed-income securities including U.S. government securities, closed-end funds, exchange-traded notes, and partnerships. See “OtherPermitted Investments by the Funds of Funds.” The fund may also engage in short selling. The fund may engage in active and frequent trading ofportfolio securities and other instruments to achieve its primary investment strategies.
The fund bears its own expenses and, in addition, indirectly bears its proportionate share of the expenses of the underlying funds in which it invests.
Use of Risk Management and Other Strategic Transactions. In addition to the risk management techniques described above, the fund is authorized touse other investment strategies referred to under “Hedging And Other Strategic Transactions” risk section including, without limitation, investing in
.164
foreign currency forward contracts, futures contracts including stock index and foreign currency futures, swaps including interest rate swaps, stockindex swaps and credit default swaps and options including stock index options and options on stock index futures, among others.
Principal risks of investing in the fund of fundsThe fund of funds is subject to risks, and you could lose money by investing in the fund. The principal risks of investing in the fund of funds include:
Affiliated insurance companies. The Advisor may be influenced by the benefits to its affiliated life insurance companies in managing the fund andoverseeing its subadvisors. The John Hancock insurance companies issuing guaranteed benefits on variable annuity and insurance contracts investing inthe fund have a financial interest in preserving the value of the funds and reducing their volatility due to their obligations for these guaranteed benefits(the cost of providing these guaranteed benefits is related to several factors including the performance and volatility of the fund). To the extent thefund is successful in managing the volatility of returns and downside risk, the John Hancock insurance companies issuing guaranteed benefits onvariable annuity and insurance contracts investing in the fund will also benefit from a reduction in their potential investment risk which will reduce theircosts of hedging this risk and may reduce their reserve and capital requirements. These financial benefits to the John Hancock insurance companiesmay be material. The fund and the fund’s investment advisor have adopted procedures that are intended to address these conflicts and ensure that thefund is managed in accordance with its disclosed investment objectives and strategies.
Asset allocation risk. Although allocation among asset categories generally limits exposure to any one category, the management team may favor acategory that performs poorly relative to the others.
Cash collateral risk. To the extent a fund maintains cash collateral required to cover its obligations under the derivative instruments used in its riskmanagement strategy, such collateral holdings may have the effect of reducing overall portfolio returns. In addition, because such collateral positionscannot be eliminated or reduced unless the corresponding derivative obligation is eliminated or reduced, a large derivative position may materially limitthe subadvisor’s flexibility in managing the fund.
Commodity risk. Commodity prices may be volatile due to fluctuating demand, supply disruption, speculation, and other factors. Certain commodityinvestments may have no active trading market at times.
Credit and counterparty risk. The issuer or guarantor of a fixed-income security, the counterparty to an over-the-counter derivatives contract, or aborrower of fund securities may not make timely payments or otherwise honor its obligations. U.S. government securities are subject to varyingdegrees of credit risk depending upon the nature of their support. A downgrade or default affecting any of the fund’s securities could affect the fund’sperformance.
Cybersecurity and operational risk. Cybersecurity breaches may allow an unauthorized party to gain access to fund assets, customer data, orproprietary information, or cause a fund or its service providers to suffer data corruption or lose operational functionality. Similar incidents affectingissuers of a fund’s securities may negatively impact performance. Operational risk may arise from human error, error by third parties, communicationerrors, or technology failures, among other causes.
Economic and market events risk. Events in the U.S. and global financial markets, including actions taken by the U.S. Federal Reserve or foreigncentral banks to stimulate or stabilize economic growth, may at times result in unusually high market volatility, which could negatively impactperformance. Reduced liquidity in credit and fixed-income markets could adversely affect issuers worldwide. Banks and financial services companiescould suffer losses if interest rates rise or economic conditions deteriorate.
Equity securities risk. The price of equity securities may decline due to changes in a company’s financial condition or overall market conditions.
Exchange-traded funds risk. An ETF generally reflects the risks of the underlying securities it is designed to track. A fund bears ETF fees and expensesindirectly.
Exchange-traded notes risk. An ETN generally reflects the risks associated with the assets composing the underlying market benchmark or strategy itis designed to track. ETNs also are subject to issuer and fixed-income risks.
Fixed-income securities risk. A rise in interest rates typically causes bond prices to fall. The longer the average maturity or duration of the bonds heldby a fund, the more sensitive it will likely be to interest-rate fluctuations. An issuer may not make all interest payments or repay all or any of theprincipal borrowed. Changes in a security’s credit quality may adversely affect fund performance.
Fund of funds risk. The fund’s ability to achieve its investment objective will depend largely, in part, on: (i) the underlying funds’ performance,expenses and ability to meet their investment objectives; and (ii) properly rebalancing assets among underlying funds and different asset classes. Thefund is also subject to risks related to: (i) layering of fees of the underlying funds; and (ii) conflicts of interest associated with the subadvisor’s ability toallocate fund assets without limit to other funds it advises and/or other funds advised by affiliated subadvisors. There is no assurance that either thefund or the underlying funds will achieve their investment objectives. A fund bears underlying fund fees and expenses indirectly.
Hedging, derivatives, and other strategic transactions risk. Hedging, derivatives, and other strategic transactions may increase a fund’s volatilityand could produce disproportionate losses, potentially more than the fund’s principal investment. Risks of these transactions are different from andpossibly greater than risks of investing directly in securities and other traditional instruments. Under certain market conditions, derivatives couldbecome harder to value or sell and may become subject to liquidity risk (i.e., the inability to enter into closing transactions). Regulatory changes inderivative markets could impact the cost of or the fund’s ability to engage in derivatives transactions. Derivatives and other strategic transactions that afund may utilize include: credit default swaps, foreign currency forward contracts, futures contracts, interest-rate swaps, options, and swaps. Foreigncurrency forward contracts, futures contracts, options, and swaps generally are subject to counterparty risk. In addition, swaps may be subject tointerest-rate and settlement risk, and the risk of default of the underlying reference obligation. Derivatives associated with foreign currencytransactions are subject to currency risk.
.165

Hedging risk. There may be imperfect or even negative correlation between the price of the futures contracts and the price of the underlyingsecurities. For example, futures contracts may not provide an effective hedge because changes in futures contract prices may not track those of theunderlying securities or indexes they are intended to hedge. In addition, there are significant differences between the securities and futures marketsthat could result in an imperfect correlation between the markets, causing a given hedge not to achieve its objectives. The degree of imperfection ofcorrelation depends on circumstances such as variations in speculative market demand for futures, including technical influences in futures trading, anddifferences between the financial instruments being hedged and the instruments underlying the standard contracts available for trading. A decision asto whether, when and how to hedge involves the exercise of skill and judgment, and even a well-conceived hedge may be unsuccessful to somedegree because of market behavior or unexpected interest rate trends. In addition, the fund’s investment in exchange-traded futures as a result of therisk management strategy could limit the upside participation of the fund in strong, rising markets with high volatility and could underperform fundsthat do not use a risk management strategy.
Investment company securities risk. A fund bears underlying fund fees and expenses indirectly.
Leverage. Certain of the risk management techniques that would be used in the strategy may involve indirect leverage. While these techniques wouldbe intended to reduce downside exposure, in some cases leverage may magnify losses.
Liquidity risk. The extent (if at all) to which a security may be sold or a derivative position closed without negatively impacting its market value may beimpaired by reduced market activity or participation, legal restrictions, or other economic and market impediments. Liquidity risk may be magnified inrising interest rate environments due to higher than normal redemption rates. Widespread selling of fixed-income securities to satisfy redemptionsduring periods of reduced demand may adversely impact the price or salability of such securities. Periods of heavy redemption could cause the fund tosell assets at a loss or depressed value, which could negatively affect performance. Redemption risk is heightened during periods of declining or illiquidmarkets.
Quantitative models may not produce the desired results. In determining when to employ risk management techniques and/or reallocateexposure among equity, fixed-income and cash, the subadvisor uses quantitative models that use historical market data. However, future marketconditions may not be consistent with historical periods, and the historical data may not, therefore, prove to be an accurate predictor of futurevolatility or losses. The model also may not measure or analyze such data effectively. Thus, the quantitative model may not produce the desired resultsand may not accurately forecast either future volatility or future large market declines, and this would affect the ability of a fund to be successful inmanaging the volatility of returns and limiting the magnitude of portfolio losses.
Risk management strategies may not be successful, may limit upside potential or may permit or result in losses. The purposes of the riskmanagement strategies are to attempt to limit the fund’s total risk exposure during periods of high market volatility and reduce the fund’s lossesduring market declines; however, there is no assurance that these strategies will be successful. These risk management strategies could limit the upsideparticipation of the fund in rising equity markets during periods of high volatility. In instances of equity market declines followed by rising equitymarkets and significant levels of market volatility, these risk management strategies may detract from fund performance and at times prevent the fundfrom fully recovering losses by limiting the levels of exposure to equity markets. Due to the use of historical data in the models used in the riskmanagement strategy, there can be delays, especially during volatile markets, in fully implementing the strategy when markets are declining causingthe fund to experience greater losses than if the strategy had been fully implemented. There can also be delays, especially during volatile markets, inremoving hedges designed to limit losses during declining markets when markets are rising strongly causing the fund to not fully participate in therising market. The application of risk management techniques can be complex, and misjudgments in implementation may result in under- or over-allocations to equity, fixed-income and/or cash and cash equivalent exposure causing the fund to underperform or experience losses. Also, futurescontracts may be subject to exchange-imposed daily price fluctuation limits, and trading may be halted if a contract’s price moves above or below thelimit on a given day. As a result, the fund may not be able to promptly liquidate unfavorable futures positions and could be required to hold suchpositions until the delivery date, regardless of changes in its value.
Since the characteristics of many securities change as markets change or time passes, the success of risk management techniques will be subject to theportfolio managers’ ability to execute the strategy. Moreover, risk management strategies may increase portfolio transaction costs, which could causeor increase losses or reduce gains. Any one or more of these factors may prevent the fund from achieving the intended risk management goals orcould cause the fund to underperform or experience losses (some of which may be sudden) or volatility for any particular period.
Short positions. In taking a short position, a fund seeks to profit from an anticipated decline in the value of a security or index of securities. If thesecurity or index instead appreciates in value, the fund will incur losses by having to pay to close out its position at a higher price than the price itreceived to open that position. Unlike losses from declines in long positions in stocks or other securities (which may not exceed the original amountinvested), the losses a fund may incur to close out a short position if the underlying security or index increases in value are potentially unlimited.
Swaps. Counterparty risk, liquidity risk (i.e., the inability to enter into closing transactions), interest-rate risk, settlement risk, risk of default of theunderlying reference obligation, and risk of disproportionate loss are the principal risks of engaging in transactions involving swaps.
Target allocation risk. The fund’s risk profile will change due to reallocation or rebalancing of portfolio assets as the fund approaches its target date.
Use of index futures. While the use of index futures may involve a small investment of cash, the losses to a fund could exceed the amount invested,and in certain cases even the total value of the fund’s assets, due to the embedded leverage provided by the derivative. Index futures may also result ina loss to the fund if the counterparty to the transaction does not perform.
.166

Principal risks of investing in the underlying fundsThe principal risks of investing in the Underlying Funds include:
Convertible securities risk. The market values of convertible securities tend to fall as interest rates rise and rise as interest rates fall. As the marketprice of underlying common stock declines below the conversion price, the market value of the convertible security tends to be increasingly influencedby its yield.
Credit and counterparty risk. The issuer or guarantor of a fixed-income security, the counterparty to an over-the-counter derivatives contract, or aborrower of fund securities may not make timely payments or otherwise honor its obligations. U.S. government securities are subject to varyingdegrees of credit risk depending upon the nature of their support. A downgrade or default affecting any of the fund’s securities could affect the fund’sperformance.
Cybersecurity and operational risk. Cybersecurity breaches may allow an unauthorized party to gain access to fund assets, customer data, orproprietary information, or cause a fund or its service providers to suffer data corruption or lose operational functionality. Similar incidents affectingissuers of a fund’s securities may negatively impact performance. Operational risk may arise from human error, error by third parties, communicationerrors, or technology failures, among other causes.
Economic and market events risk. Events in the U.S. and global financial markets, including actions taken by the U.S. Federal Reserve or foreigncentral banks to stimulate or stabilize economic growth, may at times result in unusually high market volatility, which could negatively impactperformance. Reduced liquidity in credit and fixed-income markets could adversely affect issuers worldwide. Banks and financial services companiescould suffer losses if interest rates rise or economic conditions deteriorate.
Equity securities risk. The price of equity securities may decline due to changes in a company’s financial condition or overall market conditions.Growth company securities may fluctuate more in price than other securities because of the greater emphasis on earnings expectations. Securities themanager believes are undervalued may never realize their full potential value, and in certain markets value stocks may underperform the market as awhole.
Exchange-traded funds risk. An ETF generally reflects the risks of the underlying securities it is designed to track. A fund bears ETF fees and expensesindirectly.
Fixed-income securities risk. A rise in interest rates typically causes bond prices to fall. The longer the average maturity or duration of the bonds heldby a fund, the more sensitive it will likely be to interest-rate fluctuations. An issuer may not make all interest payments or repay all or any of theprincipal borrowed. Changes in a security’s credit quality may adversely affect fund performance.
Foreign securities risk. Less information may be publicly available regarding foreign issuers. Foreign securities may be subject to foreign taxes andmay be more volatile than U.S. securities. Currency fluctuations and political and economic developments may adversely impact the value of foreignsecurities. The risks of investing in foreign securities are magnified in emerging markets.
Hedging, derivatives, and other strategic transactions risk. Hedging, derivatives, and other strategic transactions may increase a fund’s volatilityand could produce disproportionate losses, potentially more than the fund’s principal investment. Risks of these transactions are different from andpossibly greater than risks of investing directly in securities and other traditional instruments. Under certain market conditions, derivatives couldbecome harder to value or sell and may become subject to liquidity risk (i.e., the inability to enter into closing transactions). Regulatory changes inderivative markets could impact the cost of or the fund’s ability to engage in derivatives transactions. Derivatives and other strategic transactions that afund may utilize include: credit default swaps, foreign currency forward contracts, futures contracts, interest-rate swaps, and options. Foreign currencyforward contracts, futures contracts, options, and swaps generally are subject to counterparty risk. In addition, swaps may be subject to interest-rateand settlement risk, and the risk of default of the underlying reference obligation. Derivatives associated with foreign currency transactions are subjectto currency risk.
Index management risk. Certain factors may cause a fund that is an index fund to track its target index less closely. For example, a subadvisor mayselect securities that are not fully representative of the index, and the fund’s transaction expenses, and the size and timing of its cash flows, may resultin the fund’s performance being different than that of its index. Moreover, the fund will generally reflect the performance of its target index evenwhen the index does not perform well.
Initial public offerings risk. IPO share prices are frequently volatile and may significantly impact fund performance.
Large company risk. Larger companies may grow more slowly than smaller companies or be slower to respond to business developments. Large-capitalization securities may underperform the market as a whole.
Liquidity risk. The extent (if at all) to which a security may be sold or a derivative position closed without negatively impacting its market value may beimpaired by reduced market activity or participation, legal restrictions, or other economic and market impediments. Liquidity risk may be magnified inrising interest rate environments due to higher than normal redemption rates. Widespread selling of fixed-income securities to satisfy redemptionsduring periods of reduced demand may adversely impact the price or salability of such securities. Periods of heavy redemption could cause the fund tosell assets at a loss or depressed value, which could negatively affect performance. Redemption risk is heightened during periods of declining or illiquidmarkets.
Lower-rated and high-yield fixed-income securities risk. Lower-rated and high-yield fixed-income securities (junk bonds) are subject to greatercredit quality risk, risk of default, and price volatility than higher-rated fixed-income securities, may be considered speculative, and can be difficult toresell.
.167
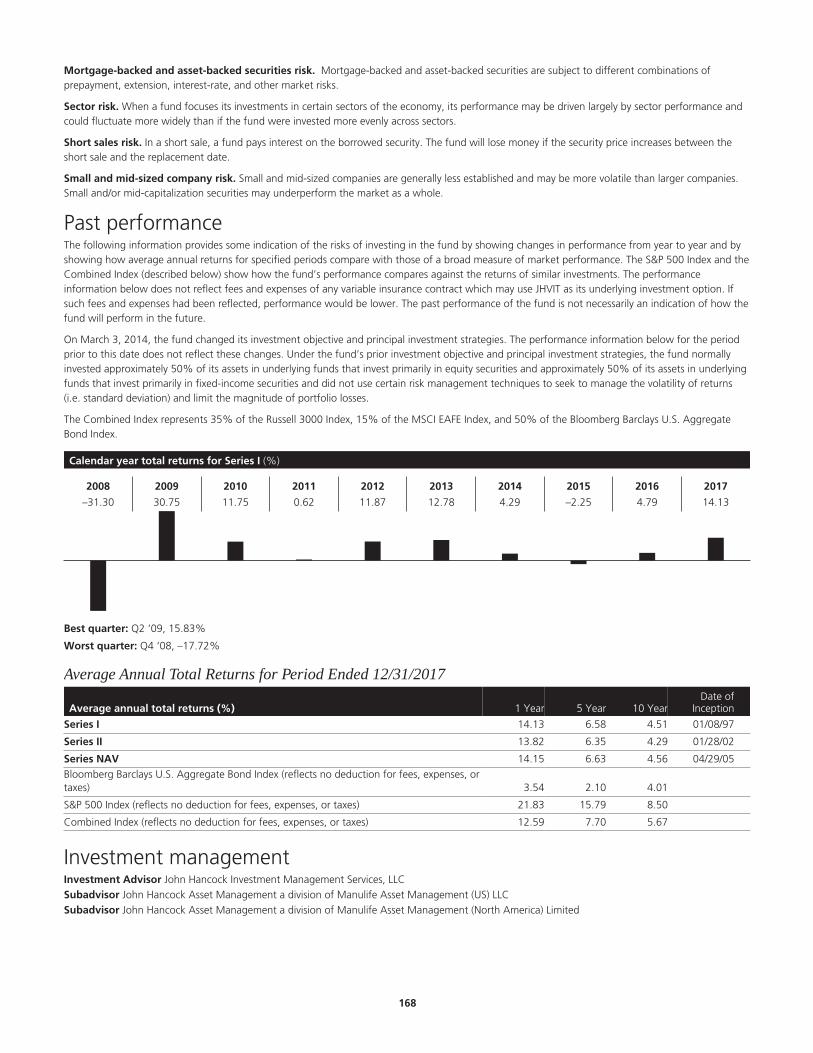
Mortgage-backed and asset-backed securities risk. Mortgage-backed and asset-backed securities are subject to different combinations ofprepayment, extension, interest-rate, and other market risks.
Sector risk. When a fund focuses its investments in certain sectors of the economy, its performance may be driven largely by sector performance andcould fluctuate more widely than if the fund were invested more evenly across sectors.
Short sales risk. In a short sale, a fund pays interest on the borrowed security. The fund will lose money if the security price increases between theshort sale and the replacement date.
Small and mid-sized company risk. Small and mid-sized companies are generally less established and may be more volatile than larger companies.Small and/or mid-capitalization securities may underperform the market as a whole.
Past performanceThe following information provides some indication of the risks of investing in the fund by showing changes in performance from year to year and byshowing how average annual returns for specified periods compare with those of a broad measure of market performance. The S&P 500 Index and theCombined Index (described below) show how the fund’s performance compares against the returns of similar investments. The performanceinformation below does not reflect fees and expenses of any variable insurance contract which may use JHVIT as its underlying investment option. Ifsuch fees and expenses had been reflected, performance would be lower. The past performance of the fund is not necessarily an indication of how thefund will perform in the future.
On March 3, 2014, the fund changed its investment objective and principal investment strategies. The performance information below for the periodprior to this date does not reflect these changes. Under the fund’s prior investment objective and principal investment strategies, the fund normallyinvested approximately 50% of its assets in underlying funds that invest primarily in equity securities and approximately 50% of its assets in underlyingfunds that invest primarily in fixed-income securities and did not use certain risk management techniques to seek to manage the volatility of returns(i.e. standard deviation) and limit the magnitude of portfolio losses.
The Combined Index represents 35% of the Russell 3000 Index, 15% of the MSCI EAFE Index, and 50% of the Bloomberg Barclays U.S. AggregateBond Index.
Calendar year total returns for Series I (%)
2008 2009 2010 2011 2012 2013 2014 2015 2016 2017
–31.30 30.75 11.75 0.62 11.87 12.78 4.29 –2.25 4.79 14.13
Best quarter: Q2 ‘09, 15.83%
Worst quarter: Q4 ‘08, –17.72%
Average Annual Total Returns for Period Ended 12/31/2017
Average annual total returns (%) 1 Year 5 Year 10 YearDate of
Inception
Series I 14.13 6.58 4.51 01/08/97
Series II 13.82 6.35 4.29 01/28/02
Series NAV 14.15 6.63 4.56 04/29/05Bloomberg Barclays U.S. Aggregate Bond Index (reflects no deduction for fees, expenses, ortaxes) 3.54 2.10 4.01
S&P 500 Index (reflects no deduction for fees, expenses, or taxes) 21.83 15.79 8.50
Combined Index (reflects no deduction for fees, expenses, or taxes) 12.59 7.70 5.67
Investment managementInvestment Advisor John Hancock Investment Management Services, LLC§
Subadvisor John Hancock Asset Management a division of Manulife Asset Management (US) LLC§
Subadvisor John Hancock Asset Management a division of Manulife Asset Management (North America) Limited
.168

Portfolio managementRobert BoydaHead of Capital Markets and Strategy and Co-Head of Portfolio Solutions Group, John HancockAsset Management a division of Manulife AssetManagement (US) LLCManaged fund since 2010
Jeffrey N. Given, CFASenior Managing Director and Senior PortfolioManager, John Hancock Asset Management adivision of Manulife Asset Management (US) LLCManaged fund since 2014
Luning “Gary” LiManaging Director and Senior PortfolioManager, John Hancock Asset Management adivision of Manulife Asset Management (US)LLCManaged fund since 2014
Robert Sykes, CFAManaging Director, Portfolio Manager ofPortfolio Solutions Group,John Hancock Asset Management a division ofManulife Asset Management (US) LLCManaged fund since 2018
Nathan Thooft, CFASenior Managing Director, Senior PortfolioManager, Co-Head of Portfolio Solutions Group,John Hancock Asset Management a division ofManulife Asset Management (US) LLCManaged fund since 2013
Other important information regarding the fundFor important information about taxes and financial intermediary compensation, please turn to “Additional information about the funds” at page258 of the Prospectus.
.169
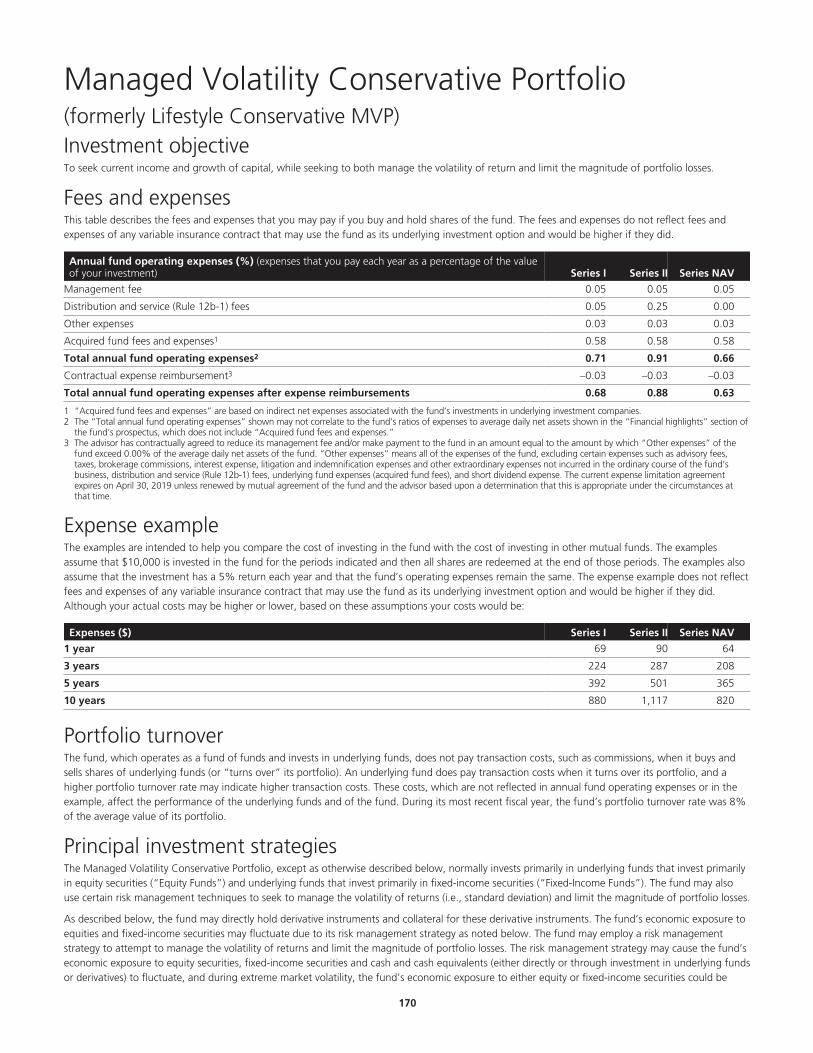
Managed Volatility Conservative Portfolio (formerly Lifestyle Conservative MVP)Investment objectiveTo seek current income and growth of capital, while seeking to both manage the volatility of return and limit the magnitude of portfolio losses.
Fees and expensesThis table describes the fees and expenses that you may pay if you buy and hold shares of the fund. The fees and expenses do not reflect fees andexpenses of any variable insurance contract that may use the fund as its underlying investment option and would be higher if they did.
Annual fund operating expenses (%) (expenses that you pay each year as a percentage of the valueof your investment) Series I Series II Series NAV
Management fee 0.05 0.05 0.05
Distribution and service (Rule 12b-1) fees 0.05 0.25 0.00
Other expenses 0.03 0.03 0.03
Acquired fund fees and expenses1 0.58 0.58 0.58
Total annual fund operating expenses2 0.71 0.91 0.66
Contractual expense reimbursement3 –0.03 –0.03 –0.03
Total annual fund operating expenses after expense reimbursements 0.68 0.88 0.63
1 “Acquired fund fees and expenses” are based on indirect net expenses associated with the fund’s investments in underlying investment companies.2 The “Total annual fund operating expenses” shown may not correlate to the fund’s ratios of expenses to average daily net assets shown in the “Financial highlights” section of
the fund’s prospectus, which does not include “Acquired fund fees and expenses.”3 The advisor has contractually agreed to reduce its management fee and/or make payment to the fund in an amount equal to the amount by which “Other expenses” of the
fund exceed 0.00% of the average daily net assets of the fund. “Other expenses” means all of the expenses of the fund, excluding certain expenses such as advisory fees,taxes, brokerage commissions, interest expense, litigation and indemnification expenses and other extraordinary expenses not incurred in the ordinary course of the fund’sbusiness, distribution and service (Rule 12b-1) fees, underlying fund expenses (acquired fund fees), and short dividend expense. The current expense limitation agreementexpires on April 30, 2019 unless renewed by mutual agreement of the fund and the advisor based upon a determination that this is appropriate under the circumstances atthat time.
Expense exampleThe examples are intended to help you compare the cost of investing in the fund with the cost of investing in other mutual funds. The examplesassume that $10,000 is invested in the fund for the periods indicated and then all shares are redeemed at the end of those periods. The examples alsoassume that the investment has a 5% return each year and that the fund’s operating expenses remain the same. The expense example does not reflectfees and expenses of any variable insurance contract that may use the fund as its underlying investment option and would be higher if they did.Although your actual costs may be higher or lower, based on these assumptions your costs would be:
Expenses ($) Series I Series II Series NAV
1 year 69 90 64
3 years 224 287 208
5 years 392 501 365
10 years 880 1,117 820
Portfolio turnoverThe fund, which operates as a fund of funds and invests in underlying funds, does not pay transaction costs, such as commissions, when it buys andsells shares of underlying funds (or “turns over” its portfolio). An underlying fund does pay transaction costs when it turns over its portfolio, and ahigher portfolio turnover rate may indicate higher transaction costs. These costs, which are not reflected in annual fund operating expenses or in theexample, affect the performance of the underlying funds and of the fund. During its most recent fiscal year, the fund’s portfolio turnover rate was 8%of the average value of its portfolio.
Principal investment strategiesThe Managed Volatility Conservative Portfolio, except as otherwise described below, normally invests primarily in underlying funds that invest primarilyin equity securities (“Equity Funds”) and underlying funds that invest primarily in fixed-income securities (“Fixed-Income Funds”). The fund may alsouse certain risk management techniques to seek to manage the volatility of returns (i.e., standard deviation) and limit the magnitude of portfolio losses.
As described below, the fund may directly hold derivative instruments and collateral for these derivative instruments. The fund’s economic exposure toequities and fixed-income securities may fluctuate due to its risk management strategy as noted below. The fund may employ a risk managementstrategy to attempt to manage the volatility of returns and limit the magnitude of portfolio losses. The risk management strategy may cause the fund’seconomic exposure to equity securities, fixed-income securities and cash and cash equivalents (either directly or through investment in underlying fundsor derivatives) to fluctuate, and during extreme market volatility, the fund’s economic exposure to either equity or fixed-income securities could be
.170

reduced to 0% and its economic exposure to cash and cash equivalents could increase to 100%. The subadvisor normally will seek to limit the fund’sexposure to equity securities (either directly or through investment in underlying funds or derivatives) to no more than 22% and normally will seek toreduce any equity exposure in excess of this amount as soon as practicable. However, the subadvisor may determine in light of market or economicconditions that the limit should be exceeded to achieve the fund’s investment objective.
The fund seeks long term growth of capital while attempting to manage the volatility of returns and limit the magnitude of portfolio losses. The fundseeks to limit the volatility of returns to a range of 5.5% to 6.5% (as measured by annualized standard deviation of the fund’s returns). However,during periods of prolonged low market volatility the actual volatility experienced by the fund may fall below the range due to maximum limits onequity and fixed-income exposures.
Volatility is a measure of the magnitude of up and down fluctuations in the fund’s NAV over time as measured by the annualized standard deviation ofits returns. Higher volatility generally indicates higher risk. The more a fund’s returns vary from the fund’s average return, the more volatile the fundand the higher the standard deviation. The purpose of managing the volatility of returns is to attempt to limit exposure to more volatile asset classes,including both equities and fixed-income asset classes, during periods of high volatility and protect the fund from losses during market declines. Thefund also seeks to limit the magnitude of portfolio losses in order to limit exposure during market declines. There can be no assurance that the riskmanagement strategy will be successful in managing the volatility of returns and limit the magnitude of portfolio losses.
In seeking to manage the volatility of returns and limit the magnitude of portfolio losses, the fund may employ certain risk management techniquesusing derivative instruments and may reallocate assets between the underlying Equity and Fixed-Income Funds. These derivatives may be used toincrease or decrease the fund’s net equity exposure and will typically consist of stock index futures, but may also include stock index options, optionson stock index futures, and stock index swaps. The fund may also employ risk management techniques using derivatives that may increase or decreasethe fund’s exposure to certain types of fixed-income securities. These instruments may include government bond futures, swaps, and credit defaultswaps. For more information about these derivative instruments in which the fund may invest, please see the “Hedging And Other StrategicTransactions” risk section in the Statement of Additional Information. Fund assets employed for its risk management strategy include not onlyderivative instruments but also fixed-income instruments, used to cover derivative positions. Because equity and fixed-income derivative instrumentsmay be purchased with a fraction of the assets that would be needed to purchase the securities directly, the remainder of the assets used for the riskmanagement strategy will be invested in a variety of fixed-income instruments. The fund may be required to hold cash or other liquid assets and postthese assets with a broker as collateral to cover its obligation under the futures contracts. The fund’s risk management strategy could limit the upsideparticipation of the fund in strong, rising markets with high volatility and could underperform funds that do not use a risk management strategy.
The use of derivatives may be combined with asset allocation techniques. The timing and extent of these techniques will depend on several factors,including market movements. In general, when equity markets are more volatile or are declining, assets may be reallocated to Fixed-Income Funds,cash and cash equivalents, and short positions in equity derivative instruments. When equity markets rise, or if volatility is lower, assets may bereallocated to Equity Funds and stock index futures, options, and swaps. Similarly, if fixed-income markets are volatile or are declining, assets may bereallocated to Equity Funds, cash and/or cash equivalents, and short positions in fixed-income derivative instruments. Even in periods of low volatility,the subadvisor may continue to use risk management techniques to protect against sudden market movements, preserve gains after favorable marketconditions, and reduce losses in adverse market conditions. Due to the leverage provided by derivatives, the notional value of the fund’s derivativepositions could exceed 100% of the fund’s assets.
In determining when to employ risk management techniques and/or reallocate assets between Equity Funds and Fixed-Income Funds, the subadvisormay use quantitative models that use historical factors such as market movements, and historical changes in the NAV of the fund to make thisdetermination.
The subadvisor selects the percentage level to be maintained in specific underlying Equity Funds and Fixed-Income Funds, and cash and cashequivalents and may from time to time change the allocation in specific underlying funds or rebalance the underlying funds. From time to time, asignificant portion of the fund’s underlying fixed income assets may be managed by an affiliated subadvisor. To maintain a target allocation in theunderlying funds, daily cash flows for the fund may be directed to its underlying funds that most deviate from target.
The fund may invest in various Equity Funds that as a group hold a wide range of equity type securities. These include small-, mid- and large-capitalization stocks, domestic and foreign securities (including emerging market securities), and sector holdings such as utilities, science, andtechnology stocks. Each of these Equity Funds has its own investment strategy which, for example, may focus on growth stocks or value stocks or mayemploy a strategy combining growth and income stocks and/or may invest in derivatives such as options on securities and futures contracts. The fundmay also invest in Fixed-Income Funds that as a group hold a wide range of fixed-income securities including investment grade and below-investment-grade debt securities with maturities that range from short to longer term. The Fixed-Income Funds collectively hold various types of debt instruments,such as corporate bonds and mortgage backed, government issued, domestic and international securities. Equity Funds and Fixed-Income Funds mayinclude funds that employ a passive investment style (i.e., index funds and exchange-traded funds (ETFs)) and at times most of the fund’s assets may beinvested in index funds.
The fund may also invest in the securities of other investment companies including ETFs and may invest directly in other types of investments, such asequity and fixed-income securities including U.S. government securities, closed-end funds, exchange-traded notes, and partnerships. See “OtherPermitted Investments by the Funds of Funds.” The fund may also engage in short selling. The fund may engage in active and frequent trading ofportfolio securities and other instruments to achieve its primary investment strategies.
The fund bears its own expenses and, in addition, indirectly bears its proportionate share of the expenses of the underlying funds in which it invests.
Use of Risk Management and Other Strategic Transactions. In addition to the risk management techniques described above, the fund is authorized touse other investment strategies referred to under “Hedging And Other Strategic Transactions” risk section including, without limitation, investing in
.171

foreign currency forward contracts, futures contracts including stock index and foreign currency futures, swaps including interest rate swaps, stockindex swaps and credit default swaps and options including stock index options and options on stock index futures, among others.
Principal risks of investing in the fund of fundsThe fund of funds is subject to risks, and you could lose money by investing in the fund. The principal risks of investing in the fund of funds include:
Affiliated insurance companies. The Advisor may be influenced by the benefits to its affiliated life insurance companies in managing the fund andoverseeing its subadvisors. The John Hancock insurance companies issuing guaranteed benefits on variable annuity and insurance contracts investing inthe fund have a financial interest in preserving the value of the funds and reducing their volatility due to their obligations for these guaranteed benefits(the cost of providing these guaranteed benefits is related to several factors including the performance and volatility of the fund). To the extent thefund is successful in managing the volatility of returns and downside risk, the John Hancock insurance companies issuing guaranteed benefits onvariable annuity and insurance contracts investing in the fund will also benefit from a reduction in their potential investment risk which will reduce theircosts of hedging this risk and may reduce their reserve and capital requirements. These financial benefits to the John Hancock insurance companiesmay be material. The fund and the fund’s investment advisor have adopted procedures that are intended to address these conflicts and ensure that thefund is managed in accordance with its disclosed investment objectives and strategies.
Asset allocation risk. Although allocation among asset categories generally limits exposure to any one category, the management team may favor acategory that performs poorly relative to the others.
Cash collateral risk. To the extent a fund maintains cash collateral required to cover its obligations under the derivative instruments used in its riskmanagement strategy, such collateral holdings may have the effect of reducing overall portfolio returns. In addition, because such collateral positionscannot be eliminated or reduced unless the corresponding derivative obligation is eliminated or reduced, a large derivative position may materially limitthe subadvisor’s flexibility in managing the fund.
Commodity risk. Commodity prices may be volatile due to fluctuating demand, supply disruption, speculation, and other factors. Certain commodityinvestments may have no active trading market at times.
Credit and counterparty risk. The issuer or guarantor of a fixed-income security, the counterparty to an over-the-counter derivatives contract, or aborrower of fund securities may not make timely payments or otherwise honor its obligations. U.S. government securities are subject to varyingdegrees of credit risk depending upon the nature of their support. A downgrade or default affecting any of the fund’s securities could affect the fund’sperformance.
Cybersecurity and operational risk. Cybersecurity breaches may allow an unauthorized party to gain access to fund assets, customer data, orproprietary information, or cause a fund or its service providers to suffer data corruption or lose operational functionality. Similar incidents affectingissuers of a fund’s securities may negatively impact performance. Operational risk may arise from human error, error by third parties, communicationerrors, or technology failures, among other causes.
Economic and market events risk. Events in the U.S. and global financial markets, including actions taken by the U.S. Federal Reserve or foreigncentral banks to stimulate or stabilize economic growth, may at times result in unusually high market volatility, which could negatively impactperformance. Reduced liquidity in credit and fixed-income markets could adversely affect issuers worldwide. Banks and financial services companiescould suffer losses if interest rates rise or economic conditions deteriorate.
Equity securities risk. The price of equity securities may decline due to changes in a company’s financial condition or overall market conditions.
Exchange-traded funds risk. An ETF generally reflects the risks of the underlying securities it is designed to track. A fund bears ETF fees and expensesindirectly.
Exchange-traded notes risk. An ETN generally reflects the risks associated with the assets composing the underlying market benchmark or strategy itis designed to track. ETNs also are subject to issuer and fixed-income risks.
Fixed-income securities risk. A rise in interest rates typically causes bond prices to fall. The longer the average maturity or duration of the bonds heldby a fund, the more sensitive it will likely be to interest-rate fluctuations. An issuer may not make all interest payments or repay all or any of theprincipal borrowed. Changes in a security’s credit quality may adversely affect fund performance.
Fund of funds risk. The fund’s ability to achieve its investment objective will depend largely, in part, on: (i) the underlying funds’ performance,expenses and ability to meet their investment objectives; and (ii) properly rebalancing assets among underlying funds and different asset classes. Thefund is also subject to risks related to: (i) layering of fees of the underlying funds; and (ii) conflicts of interest associated with the subadvisor’s ability toallocate fund assets without limit to other funds it advises and/or other funds advised by affiliated subadvisors. There is no assurance that either thefund or the underlying funds will achieve their investment objectives. A fund bears underlying fund fees and expenses indirectly.
Hedging, derivatives, and other strategic transactions risk. Hedging, derivatives, and other strategic transactions may increase a fund’s volatilityand could produce disproportionate losses, potentially more than the fund’s principal investment. Risks of these transactions are different from andpossibly greater than risks of investing directly in securities and other traditional instruments. Under certain market conditions, derivatives couldbecome harder to value or sell and may become subject to liquidity risk (i.e., the inability to enter into closing transactions). Regulatory changes inderivative markets could impact the cost of or the fund’s ability to engage in derivatives transactions. Derivatives and other strategic transactions that afund may utilize include: credit default swaps, foreign currency forward contracts, futures contracts, interest-rate swaps, options, and swaps. Foreigncurrency forward contracts, futures contracts, options, and swaps generally are subject to counterparty risk. In addition, swaps may be subject tointerest-rate and settlement risk, and the risk of default of the underlying reference obligation. Derivatives associated with foreign currencytransactions are subject to currency risk.
.172

Hedging risk. There may be imperfect or even negative correlation between the price of the futures contracts and the price of the underlyingsecurities. For example, futures contracts may not provide an effective hedge because changes in futures contract prices may not track those of theunderlying securities or indexes they are intended to hedge. In addition, there are significant differences between the securities and futures marketsthat could result in an imperfect correlation between the markets, causing a given hedge not to achieve its objectives. The degree of imperfection ofcorrelation depends on circumstances such as variations in speculative market demand for futures, including technical influences in futures trading, anddifferences between the financial instruments being hedged and the instruments underlying the standard contracts available for trading. A decision asto whether, when and how to hedge involves the exercise of skill and judgment, and even a well-conceived hedge may be unsuccessful to somedegree because of market behavior or unexpected interest rate trends. In addition, the fund’s investment in exchange-traded futures as a result of therisk management strategy could limit the upside participation of the fund in strong, rising markets with high volatility and could underperform fundsthat do not use a risk management strategy.
Investment company securities risk. A fund bears underlying fund fees and expenses indirectly.
Leverage. Certain of the risk management techniques that would be used in the strategy may involve indirect leverage. While these techniques wouldbe intended to reduce downside exposure, in some cases leverage may magnify losses.
Liquidity risk. The extent (if at all) to which a security may be sold or a derivative position closed without negatively impacting its market value may beimpaired by reduced market activity or participation, legal restrictions, or other economic and market impediments. Liquidity risk may be magnified inrising interest rate environments due to higher than normal redemption rates. Widespread selling of fixed-income securities to satisfy redemptionsduring periods of reduced demand may adversely impact the price or salability of such securities. Periods of heavy redemption could cause the fund tosell assets at a loss or depressed value, which could negatively affect performance. Redemption risk is heightened during periods of declining or illiquidmarkets.
Quantitative models may not produce the desired results. In determining when to employ risk management techniques and/or reallocateexposure among equity, fixed-income and cash, the subadvisor uses quantitative models that use historical market data. However, future marketconditions may not be consistent with historical periods, and the historical data may not, therefore, prove to be an accurate predictor of futurevolatility or losses. The model also may not measure or analyze such data effectively. Thus, the quantitative model may not produce the desired resultsand may not accurately forecast either future volatility or future large market declines, and this would affect the ability of a fund to be successful inmanaging the volatility of returns and limiting the magnitude of portfolio losses.
Risk management strategies may not be successful, may limit upside potential or may permit or result in losses. The purposes of the riskmanagement strategies are to attempt to limit the fund’s total risk exposure during periods of high market volatility and reduce the fund’s lossesduring market declines; however, there is no assurance that these strategies will be successful. These risk management strategies could limit the upsideparticipation of the fund in rising equity markets during periods of high volatility. In instances of equity market declines followed by rising equitymarkets and significant levels of market volatility, these risk management strategies may detract from fund performance and at times prevent the fundfrom fully recovering losses by limiting the levels of exposure to equity markets. Due to the use of historical data in the models used in the riskmanagement strategy, there can be delays, especially during volatile markets, in fully implementing the strategy when markets are declining causingthe fund to experience greater losses than if the strategy had been fully implemented. There can also be delays, especially during volatile markets, inremoving hedges designed to limit losses during declining markets when markets are rising strongly causing the fund to not fully participate in therising market. The application of risk management techniques can be complex, and misjudgments in implementation may result in under- or over-allocations to equity, fixed-income and/or cash and cash equivalent exposure causing the fund to underperform or experience losses. Also, futurescontracts may be subject to exchange-imposed daily price fluctuation limits, and trading may be halted if a contract’s price moves above or below thelimit on a given day. As a result, the fund may not be able to promptly liquidate unfavorable futures positions and could be required to hold suchpositions until the delivery date, regardless of changes in its value.
Since the characteristics of many securities change as markets change or time passes, the success of risk management techniques will be subject to theportfolio managers’ ability to execute the strategy. Moreover, risk management strategies may increase portfolio transaction costs, which could causeor increase losses or reduce gains. Any one or more of these factors may prevent the fund from achieving the intended risk management goals orcould cause the fund to underperform or experience losses (some of which may be sudden) or volatility for any particular period.
Short positions. In taking a short position, a fund seeks to profit from an anticipated decline in the value of a security or index of securities. If thesecurity or index instead appreciates in value, the fund will incur losses by having to pay to close out its position at a higher price than the price itreceived to open that position. Unlike losses from declines in long positions in stocks or other securities (which may not exceed the original amountinvested), the losses a fund may incur to close out a short position if the underlying security or index increases in value are potentially unlimited.
Swaps. Counterparty risk, liquidity risk (i.e., the inability to enter into closing transactions), interest-rate risk, settlement risk, risk of default of theunderlying reference obligation, and risk of disproportionate loss are the principal risks of engaging in transactions involving swaps.
Target allocation risk. The fund’s risk profile will change due to reallocation or rebalancing of portfolio assets as the fund approaches its target date.
Use of index futures. While the use of index futures may involve a small investment of cash, the losses to a fund could exceed the amount invested,and in certain cases even the total value of the fund’s assets, due to the embedded leverage provided by the derivative. Index futures may also result ina loss to the fund if the counterparty to the transaction does not perform.
.173
Principal risks of investing in the underlying fundsThe principal risks of investing in the Underlying Funds include:
Convertible securities risk. The market values of convertible securities tend to fall as interest rates rise and rise as interest rates fall. As the marketprice of underlying common stock declines below the conversion price, the market value of the convertible security tends to be increasingly influencedby its yield.
Credit and counterparty risk. The issuer or guarantor of a fixed-income security, the counterparty to an over-the-counter derivatives contract, or aborrower of fund securities may not make timely payments or otherwise honor its obligations. U.S. government securities are subject to varyingdegrees of credit risk depending upon the nature of their support. A downgrade or default affecting any of the fund’s securities could affect the fund’sperformance.
Cybersecurity and operational risk. Cybersecurity breaches may allow an unauthorized party to gain access to fund assets, customer data, orproprietary information, or cause a fund or its service providers to suffer data corruption or lose operational functionality. Similar incidents affectingissuers of a fund’s securities may negatively impact performance. Operational risk may arise from human error, error by third parties, communicationerrors, or technology failures, among other causes.
Economic and market events risk. Events in the U.S. and global financial markets, including actions taken by the U.S. Federal Reserve or foreigncentral banks to stimulate or stabilize economic growth, may at times result in unusually high market volatility, which could negatively impactperformance. Reduced liquidity in credit and fixed-income markets could adversely affect issuers worldwide. Banks and financial services companiescould suffer losses if interest rates rise or economic conditions deteriorate.
Equity securities risk. The price of equity securities may decline due to changes in a company’s financial condition or overall market conditions.Growth company securities may fluctuate more in price than other securities because of the greater emphasis on earnings expectations. Securities themanager believes are undervalued may never realize their full potential value, and in certain markets value stocks may underperform the market as awhole.
Exchange-traded funds risk. An ETF generally reflects the risks of the underlying securities it is designed to track. A fund bears ETF fees and expensesindirectly.
Fixed-income securities risk. A rise in interest rates typically causes bond prices to fall. The longer the average maturity or duration of the bonds heldby a fund, the more sensitive it will likely be to interest-rate fluctuations. An issuer may not make all interest payments or repay all or any of theprincipal borrowed. Changes in a security’s credit quality may adversely affect fund performance.
Foreign securities risk. Less information may be publicly available regarding foreign issuers. Foreign securities may be subject to foreign taxes andmay be more volatile than U.S. securities. Currency fluctuations and political and economic developments may adversely impact the value of foreignsecurities. The risks of investing in foreign securities are magnified in emerging markets.
Hedging, derivatives, and other strategic transactions risk. Hedging, derivatives, and other strategic transactions may increase a fund’s volatilityand could produce disproportionate losses, potentially more than the fund’s principal investment. Risks of these transactions are different from andpossibly greater than risks of investing directly in securities and other traditional instruments. Under certain market conditions, derivatives couldbecome harder to value or sell and may become subject to liquidity risk (i.e., the inability to enter into closing transactions). Regulatory changes inderivative markets could impact the cost of or the fund’s ability to engage in derivatives transactions. Derivatives and other strategic transactions that afund may utilize include: credit default swaps, foreign currency forward contracts, futures contracts, interest-rate swaps, and options. Foreign currencyforward contracts, futures contracts, options, and swaps generally are subject to counterparty risk. In addition, swaps may be subject to interest-rateand settlement risk, and the risk of default of the underlying reference obligation. Derivatives associated with foreign currency transactions are subjectto currency risk.
Index management risk. Certain factors may cause a fund that is an index fund to track its target index less closely. For example, a subadvisor mayselect securities that are not fully representative of the index, and the fund’s transaction expenses, and the size and timing of its cash flows, may resultin the fund’s performance being different than that of its index. Moreover, the fund will generally reflect the performance of its target index evenwhen the index does not perform well.
Initial public offerings risk. IPO share prices are frequently volatile and may significantly impact fund performance.
Large company risk. Larger companies may grow more slowly than smaller companies or be slower to respond to business developments. Large-capitalization securities may underperform the market as a whole.
Liquidity risk. The extent (if at all) to which a security may be sold or a derivative position closed without negatively impacting its market value may beimpaired by reduced market activity or participation, legal restrictions, or other economic and market impediments. Liquidity risk may be magnified inrising interest rate environments due to higher than normal redemption rates. Widespread selling of fixed-income securities to satisfy redemptionsduring periods of reduced demand may adversely impact the price or salability of such securities. Periods of heavy redemption could cause the fund tosell assets at a loss or depressed value, which could negatively affect performance. Redemption risk is heightened during periods of declining or illiquidmarkets.
Lower-rated and high-yield fixed-income securities risk. Lower-rated and high-yield fixed-income securities (junk bonds) are subject to greatercredit quality risk, risk of default, and price volatility than higher-rated fixed-income securities, may be considered speculative, and can be difficult toresell.
.174

Mortgage-backed and asset-backed securities risk. Mortgage-backed and asset-backed securities are subject to different combinations ofprepayment, extension, interest-rate, and other market risks.
Sector risk. When a fund focuses its investments in certain sectors of the economy, its performance may be driven largely by sector performance andcould fluctuate more widely than if the fund were invested more evenly across sectors.
Short sales risk. In a short sale, a fund pays interest on the borrowed security. The fund will lose money if the security price increases between theshort sale and the replacement date.
Small and mid-sized company risk. Small and mid-sized companies are generally less established and may be more volatile than larger companies.Small and/or mid-capitalization securities may underperform the market as a whole.
Past performanceThe following information provides some indication of the risks of investing in the fund by showing changes in performance from year to year and byshowing how average annual returns for specified periods compare with those of a broad measure of market performance. The S&P 500 Index and theCombined Index (described below) show how the fund’s performance compares against the returns of similar investments. The performanceinformation below does not reflect fees and expenses of any variable insurance contract which may use JHVIT as its underlying investment option. Ifsuch fees and expenses had been reflected, performance would be lower. The past performance of the fund is not necessarily an indication of how thefund will perform in the future.
On March 3, 2014, the fund changed its investment objective and principal investment strategies. The performance information below for the periodprior to this date does not reflect these changes. Under the fund’s prior investment objective and principal investment strategies, the fund normallyinvested approximately 20% of its assets in underlying funds that invest primarily in equity securities and approximately 80% of its assets in underlyingfunds that invest primarily in fixed-income securities and did not use certain risk management techniques to seek to manage the volatility of returns(i.e., standard deviation) and limit the magnitude of portfolio losses.
The Combined Index represents 14% of the Russell 3000 Index, 6% of the MSCI EAFE Index, and 80% of the Bloomberg Barclays U.S. AggregateBond Index.
Calendar year total returns for Series I (%)
2008 2009 2010 2011 2012 2013 2014 2015 2016 2017
–15.57 21.71 9.12 4.23 8.52 3.88 5.02 0.05 4.58 7.82
Best quarter: Q2 ‘09, 10.58%
Worst quarter: Q4 ‘08, –8.32%
Average Annual Total Returns for Period Ended 12/31/2017
Average annual total returns (%) 1 Year 5 Year 10 YearDate of
Inception
Series I 7.82 4.24 4.55 01/08/97
Series II 7.67 4.04 4.35 01/28/02
Series NAV 7.94 4.30 4.61 04/29/05Bloomberg Barclays U.S. Aggregate Bond Index (reflects no deduction for fees, expenses, ortaxes) 3.54 2.10 4.01
S&P 500 Index (reflects no deduction for fees, expenses, or taxes) 21.83 15.79 8.50
Combined Index (reflects no deduction for fees, expenses, or taxes) 7.08 4.34 4.75
Investment managementInvestment Advisor John Hancock Investment Management Services, LLC§
Subadvisor John Hancock Asset Management a division of Manulife Asset Management (US) LLC§
Subadvisor John Hancock Asset Management a division of Manulife Asset Management (North America) Limited
.175

Portfolio managementRobert BoydaHead of Capital Markets and Strategy and Co-Head of Portfolio Solutions Group, John HancockAsset Management a division of Manulife AssetManagement (US) LLCManaged fund since 2010
Jeffrey N. Given, CFASenior Managing Director and Senior PortfolioManager, John Hancock Asset Management adivision of Manulife Asset Management (US) LLCManaged fund since 2014
Luning “Gary” LiManaging Director and Senior PortfolioManager, John Hancock Asset Management adivision of Manulife Asset Management (US)LLCManaged fund since 2014
Robert Sykes, CFAManaging Director, Portfolio Manager ofPortfolio Solutions Group,John Hancock Asset Management a division ofManulife Asset Management (US) LLCManaged fund since 2018
Nathan Thooft, CFASenior Managing Director, Senior PortfolioManager, Co-Head of Portfolio Solutions Group,John Hancock Asset Management a division ofManulife Asset Management (US) LLCManaged fund since 2013
Other important information regarding the fundFor important information about taxes and financial intermediary compensation, please turn to “Additional information about the funds” at page258 of the Prospectus.
.176

Managed Volatility Growth Portfolio (formerly Lifestyle Growth MVP)Investment objectiveTo seek long term growth of capital while seeking to both manage the volatility of return and limit the magnitude of portfolio losses.
Fees and expensesThis table describes the fees and expenses that you may pay if you buy and hold shares of the fund. The fees and expenses do not reflect fees andexpenses of any variable insurance contract that may use the fund as its underlying investment option and would be higher if they did.
Annual fund operating expenses (%) (expenses that you pay each year as a percentage of the valueof your investment) Series I Series II Series NAV
Management fee 0.06 0.06 0.06
Distribution and service (Rule 12b-1) fees 0.05 0.25 0.00
Other expenses 0.02 0.02 0.02
Acquired fund fees and expenses1 0.65 0.65 0.65
Total annual fund operating expenses2 0.78 0.98 0.73
Contractual expense reimbursement3 –0.02 –0.02 –0.02
Total annual fund operating expenses after expense reimbursements 0.76 0.96 0.71
1 “Acquired fund fees and expenses” are based on indirect net expenses associated with the fund’s investments in underlying investment companies.2 The “Total annual fund operating expenses” shown may not correlate to the fund’s ratios of expenses to average daily net assets shown in the “Financial highlights” section of
the fund’s prospectus, which does not include “Acquired fund fees and expenses.”3 The advisor has contractually agreed to reduce its management fee and/or make payment to the fund in an amount equal to the amount by which “Other expenses” of the
fund exceed 0.00% of the average daily net assets of the fund. “Other expenses” means all of the expenses of the fund, excluding certain expenses such as advisory fees,taxes, brokerage commissions, interest expense, litigation and indemnification expenses and other extraordinary expenses not incurred in the ordinary course of the fund’sbusiness, distribution and service (Rule 12b-1) fees, underlying fund expenses (acquired fund fees), and short dividend expense. The current expense limitation agreementexpires on April 30, 2019 unless renewed by mutual agreement of the fund and the advisor based upon a determination that this is appropriate under the circumstances atthat time.
Expense exampleThe examples are intended to help you compare the cost of investing in the fund with the cost of investing in other mutual funds. The examplesassume that $10,000 is invested in the fund for the periods indicated and then all shares are redeemed at the end of those periods. The examples alsoassume that the investment has a 5% return each year and that the fund’s operating expenses remain the same. The expense example does not reflectfees and expenses of any variable insurance contract that may use the fund as its underlying investment option and would be higher if they did.Although your actual costs may be higher or lower, based on these assumptions your costs would be:
Expenses ($) Series I Series II Series NAV
1 year 78 98 73
3 years 247 310 231
5 years 431 540 404
10 years 964 1,200 905
Portfolio turnoverThe fund, which operates as a fund of funds and invests in underlying funds, does not pay transaction costs, such as commissions, when it buys andsells shares of underlying funds (or “turns over” its portfolio). An underlying fund does pay transaction costs when it turns over its portfolio, and ahigher portfolio turnover rate may indicate higher transaction costs. These costs, which are not reflected in annual fund operating expenses or in theexample, affect the performance of the underlying funds and of the fund. During its most recent fiscal year, the fund’s portfolio turnover rate was 9%of the average value of its portfolio.
Principal investment strategiesThe Managed Volatility Growth Portfolio, except as otherwise described below, normally invests primarily in underlying funds that invest primarily inequity securities (“Equity Funds”) and underlying funds that invest primarily in fixed-income securities (“Fixed-Income Funds”). The fund may also usecertain risk management techniques to seek to manage the volatility of returns (i.e., standard deviation) and limit the magnitude of portfolio losses.
As described below, the fund may directly hold derivative instruments and collateral for these derivative instruments. The fund’s economic exposure toequities and fixed-income securities may fluctuate due to its risk management strategy as noted below. The fund may employ a risk managementstrategy to attempt to manage the volatility of returns and limit the magnitude of portfolio losses. The risk management strategy may cause the fund’seconomic exposure to equity securities, fixed-income securities and cash and cash equivalents (either directly or through investment in underlying fundsor derivatives) to fluctuate, and during extreme market volatility, the fund’s economic exposure to either equity or fixed-income securities could be
.177

reduced to 0% and its economic exposure to cash and cash equivalents could increase to 100%. The subadvisor normally will seek to limit the fund’sexposure to equity securities (either directly or through investment in underlying funds or derivatives) to no more than 77% and normally will seek toreduce any equity exposure in excess of this amount as soon as practicable. However, the subadvisor may determine in light of market or economicconditions that the limit should be exceeded to achieve the fund’s investment objective.
The fund seeks long term growth of capital while attempting to manage the volatility of returns and limit the magnitude of portfolio losses. The fundseeks to limit the volatility of returns to a range of 11% to 13% (as measured by annualized standard deviation of the fund’s returns). However, duringperiods of prolonged low market volatility the actual volatility experienced by the fund may fall below the range due to maximum limits on equity andfixed-income exposures.
Volatility is a measure of the magnitude of up and down fluctuations in the fund’s NAV over time as measured by the annualized standard deviation ofits returns. Higher volatility generally indicates higher risk. The more a fund’s returns vary from the fund’s average return, the more volatile the fundand the higher the standard deviation. The purpose of managing the volatility of returns is to attempt to limit exposure to more volatile asset classes,including both equities and fixed-income asset classes, during periods of high volatility and protect the fund from losses during market declines. Thefund also seeks to limit the magnitude of portfolio losses in order to limit exposure during market declines. There can be no assurance that the riskmanagement strategy will be successful in managing the volatility of returns and limit the magnitude of portfolio losses.
In seeking to manage the volatility of returns and limit the magnitude of portfolio losses, the fund may employ certain risk management techniquesusing derivative instruments and may reallocate assets between the underlying Equity and Fixed-Income Funds. These derivatives may be used toincrease or decrease the fund’s net equity exposure and will typically consist of stock index futures, but may also include stock index options, optionson stock index futures, and stock index swaps. The fund may also employ risk management techniques using derivatives that may increase or decreasethe fund’s exposure to certain types of fixed-income securities. These instruments may include government bond futures, swaps, and credit defaultswaps. For more information about these derivative instruments in which the fund may invest, please see the “Hedging And Other StrategicTransactions” risk section in the Statement of Additional Information. Fund assets employed for its risk management strategy include not onlyderivative instruments but also fixed-income instruments, used to cover derivative positions. Because equity and fixed-income derivative instrumentsmay be purchased with a fraction of the assets that would be needed to purchase the securities directly, the remainder of the assets used for the riskmanagement strategy will be invested in a variety of fixed-income instruments. The fund may be required to hold cash or other liquid assets and postthese assets with a broker as collateral to cover its obligation under the futures contracts. The fund’s risk management strategy could limit the upsideparticipation of the fund in strong, rising markets with high volatility and could underperform funds that do not use a risk management strategy.
The use of derivatives may be combined with asset allocation techniques. The timing and extent of these techniques will depend on several factors,including market movements. In general, when equity markets are more volatile or are declining, assets may be reallocated to Fixed-Income Funds,cash and/or cash equivalents, and short positions in equity derivative instruments. When equity markets rise, or if volatility is lower, assets may bereallocated to Equity Funds and stock index futures, options, and swaps. Similarly, if fixed-income markets are volatile or are declining, assets may bereallocated to Equity Funds, cash and cash equivalents, and short positions in fixed-income derivative instruments. Even in periods of low volatility, thesubadvisor may continue to use risk management techniques to protect against sudden market movements, preserve gains after favorable marketconditions, and reduce losses in adverse market conditions. Due to the leverage provided by derivatives, the notional value of the fund’s derivativepositions could exceed 100% of the fund’s assets.
In determining when to employ risk management techniques and/or reallocate assets between Equity Funds and Fixed-Income Funds, the subadvisormay use quantitative models that use historical factors such as market movements, and historical changes in the NAV of the fund to make thisdetermination.
The subadvisor selects the percentage level to be maintained in specific underlying Equity Funds and Fixed-Income Funds, and cash and cashequivalents and may from time to time change the allocation in specific underlying funds or rebalance the underlying funds. From time to time, asignificant portion of the fund’s underlying fixed income assets may be managed by an affiliated subadvisor. To maintain a target allocation in theunderlying funds, daily cash flows for the fund may be directed to its underlying funds that most deviate from target.
The fund may invest in various Equity Funds that as a group hold a wide range of equity type securities. These include small-, mid- and large-capitalization stocks, domestic and foreign securities (including emerging market securities), and sector holdings such as utilities, science, andtechnology stocks. Each of these Equity Funds has its own investment strategy which, for example, may focus on growth stocks or value stocks or mayemploy a strategy combining growth and income stocks and/or may invest in derivatives such as options on securities and futures contracts. The fundmay also invest in Fixed-Income Funds that as a group hold a wide range of fixed-income securities including investment grade and below-investment-grade debt securities with maturities that range from short to longer term. The Fixed-Income Funds collectively hold various types of debt instruments,such as corporate bonds and mortgage backed, government issued, domestic and international securities. Equity Funds and Fixed-Income Funds mayinclude funds that employ a passive investment style (i.e., index funds and exchange-traded funds (ETFs)) and at times most of the fund’s assets may beinvested in index funds.
The fund may also invest in the securities of other investment companies including ETFs and may invest directly in other types of investments, such asequity and fixed-income securities including U.S. government securities, closed-end funds, exchange-traded notes, and partnerships. See “OtherPermitted Investments by the Funds of Funds.” The fund may also engage in short selling. The fund may engage in active and frequent trading ofportfolio securities and other instruments to achieve its primary investment strategies.
The fund bears its own expenses and, in addition, indirectly bears its proportionate share of the expenses of the underlying funds in which it invests.
Use of Risk Management and Other Strategic Transactions. In addition to the risk management techniques described above, the fund is authorized touse other investment strategies referred to under “Hedging And Other Strategic Transactions” risk section including, without limitation, investing in
.178

foreign currency forward contracts, futures contracts including stock index and foreign currency futures, swaps including interest rate swaps, stockindex swaps and credit default swaps and options including stock index options and options on stock index futures, among others.
Principal risks of investing in the fund of fundsThe fund of funds is subject to risks, and you could lose money by investing in the fund. The principal risks of investing in the fund of funds include:
Affiliated insurance companies. The Advisor may be influenced by the benefits to its affiliated life insurance companies in managing the fund andoverseeing its subadvisors. The John Hancock insurance companies issuing guaranteed benefits on variable annuity and insurance contracts investing inthe fund have a financial interest in preserving the value of the funds and reducing their volatility due to their obligations for these guaranteed benefits(the cost of providing these guaranteed benefits is related to several factors including the performance and volatility of the fund). To the extent thefund is successful in managing the volatility of returns and downside risk, the John Hancock insurance companies issuing guaranteed benefits onvariable annuity and insurance contracts investing in the fund will also benefit from a reduction in their potential investment risk which will reduce theircosts of hedging this risk and may reduce their reserve and capital requirements. These financial benefits to the John Hancock insurance companiesmay be material. The fund and the fund’s investment advisor have adopted procedures that are intended to address these conflicts and ensure that thefund is managed in accordance with its disclosed investment objectives and strategies.
Asset allocation risk. Although allocation among asset categories generally limits exposure to any one category, the management team may favor acategory that performs poorly relative to the others.
Cash collateral risk. To the extent a fund maintains cash collateral required to cover its obligations under the derivative instruments used in its riskmanagement strategy, such collateral holdings may have the effect of reducing overall portfolio returns. In addition, because such collateral positionscannot be eliminated or reduced unless the corresponding derivative obligation is eliminated or reduced, a large derivative position may materially limitthe subadvisor’s flexibility in managing the fund.
Commodity risk. Commodity prices may be volatile due to fluctuating demand, supply disruption, speculation, and other factors. Certain commodityinvestments may have no active trading market at times.
Credit and counterparty risk. The issuer or guarantor of a fixed-income security, the counterparty to an over-the-counter derivatives contract, or aborrower of fund securities may not make timely payments or otherwise honor its obligations. U.S. government securities are subject to varyingdegrees of credit risk depending upon the nature of their support. A downgrade or default affecting any of the fund’s securities could affect the fund’sperformance.
Cybersecurity and operational risk. Cybersecurity breaches may allow an unauthorized party to gain access to fund assets, customer data, orproprietary information, or cause a fund or its service providers to suffer data corruption or lose operational functionality. Similar incidents affectingissuers of a fund’s securities may negatively impact performance. Operational risk may arise from human error, error by third parties, communicationerrors, or technology failures, among other causes.
Economic and market events risk. Events in the U.S. and global financial markets, including actions taken by the U.S. Federal Reserve or foreigncentral banks to stimulate or stabilize economic growth, may at times result in unusually high market volatility, which could negatively impactperformance. Reduced liquidity in credit and fixed-income markets could adversely affect issuers worldwide. Banks and financial services companiescould suffer losses if interest rates rise or economic conditions deteriorate.
Equity securities risk. The price of equity securities may decline due to changes in a company’s financial condition or overall market conditions.
Exchange-traded funds risk. An ETF generally reflects the risks of the underlying securities it is designed to track. A fund bears ETF fees and expensesindirectly.
Exchange-traded notes risk. An ETN generally reflects the risks associated with the assets composing the underlying market benchmark or strategy itis designed to track. ETNs also are subject to issuer and fixed-income risks.
Fixed-income securities risk. A rise in interest rates typically causes bond prices to fall. The longer the average maturity or duration of the bonds heldby a fund, the more sensitive it will likely be to interest-rate fluctuations. An issuer may not make all interest payments or repay all or any of theprincipal borrowed. Changes in a security’s credit quality may adversely affect fund performance.
Fund of funds risk. The fund’s ability to achieve its investment objective will depend largely, in part, on: (i) the underlying funds’ performance,expenses and ability to meet their investment objectives; and (ii) properly rebalancing assets among underlying funds and different asset classes. Thefund is also subject to risks related to: (i) layering of fees of the underlying funds; and (ii) conflicts of interest associated with the subadvisor’s ability toallocate fund assets without limit to other funds it advises and/or other funds advised by affiliated subadvisors. There is no assurance that either thefund or the underlying funds will achieve their investment objectives. A fund bears underlying fund fees and expenses indirectly.
Hedging, derivatives, and other strategic transactions risk. Hedging, derivatives, and other strategic transactions may increase a fund’s volatilityand could produce disproportionate losses, potentially more than the fund’s principal investment. Risks of these transactions are different from andpossibly greater than risks of investing directly in securities and other traditional instruments. Under certain market conditions, derivatives couldbecome harder to value or sell and may become subject to liquidity risk (i.e., the inability to enter into closing transactions). Regulatory changes inderivative markets could impact the cost of or the fund’s ability to engage in derivatives transactions. Derivatives and other strategic transactions that afund may utilize include: credit default swaps, foreign currency forward contracts, futures contracts, interest-rate swaps, options, and swaps. Foreigncurrency forward contracts, futures contracts, options, and swaps generally are subject to counterparty risk. In addition, swaps may be subject tointerest-rate and settlement risk, and the risk of default of the underlying reference obligation. Derivatives associated with foreign currencytransactions are subject to currency risk.
.179
Hedging risk. There may be imperfect or even negative correlation between the price of the futures contracts and the price of the underlyingsecurities. For example, futures contracts may not provide an effective hedge because changes in futures contract prices may not track those of theunderlying securities or indexes they are intended to hedge. In addition, there are significant differences between the securities and futures marketsthat could result in an imperfect correlation between the markets, causing a given hedge not to achieve its objectives. The degree of imperfection ofcorrelation depends on circumstances such as variations in speculative market demand for futures, including technical influences in futures trading, anddifferences between the financial instruments being hedged and the instruments underlying the standard contracts available for trading. A decision asto whether, when and how to hedge involves the exercise of skill and judgment, and even a well-conceived hedge may be unsuccessful to somedegree because of market behavior or unexpected interest rate trends. In addition, the fund’s investment in exchange-traded futures as a result of therisk management strategy could limit the upside participation of the fund in strong, rising markets with high volatility and could underperform fundsthat do not use a risk management strategy.
Investment company securities risk. A fund bears underlying fund fees and expenses indirectly.
Leverage. Certain of the risk management techniques that would be used in the strategy may involve indirect leverage. While these techniques wouldbe intended to reduce downside exposure, in some cases leverage may magnify losses.
Liquidity risk. The extent (if at all) to which a security may be sold or a derivative position closed without negatively impacting its market value may beimpaired by reduced market activity or participation, legal restrictions, or other economic and market impediments. Liquidity risk may be magnified inrising interest rate environments due to higher than normal redemption rates. Widespread selling of fixed-income securities to satisfy redemptionsduring periods of reduced demand may adversely impact the price or salability of such securities. Periods of heavy redemption could cause the fund tosell assets at a loss or depressed value, which could negatively affect performance. Redemption risk is heightened during periods of declining or illiquidmarkets.
Quantitative models may not produce the desired results. In determining when to employ risk management techniques and/or reallocateexposure among equity, fixed-income and cash, the subadvisor uses quantitative models that use historical market data. However, future marketconditions may not be consistent with historical periods, and the historical data may not, therefore, prove to be an accurate predictor of futurevolatility or losses. The model also may not measure or analyze such data effectively. Thus, the quantitative model may not produce the desired resultsand may not accurately forecast either future volatility or future large market declines, and this would affect the ability of a fund to be successful inmanaging the volatility of returns and limiting the magnitude of portfolio losses.
Risk management strategies may not be successful, may limit upside potential or may permit or result in losses. The purposes of the riskmanagement strategies are to attempt to limit the fund’s total risk exposure during periods of high market volatility and reduce the fund’s lossesduring market declines; however, there is no assurance that these strategies will be successful. These risk management strategies could limit the upsideparticipation of the fund in rising equity markets during periods of high volatility. In instances of equity market declines followed by rising equitymarkets and significant levels of market volatility, these risk management strategies may detract from fund performance and at times prevent the fundfrom fully recovering losses by limiting the levels of exposure to equity markets. Due to the use of historical data in the models used in the riskmanagement strategy, there can be delays, especially during volatile markets, in fully implementing the strategy when markets are declining causingthe fund to experience greater losses than if the strategy had been fully implemented. There can also be delays, especially during volatile markets, inremoving hedges designed to limit losses during declining markets when markets are rising strongly causing the fund to not fully participate in therising market. The application of risk management techniques can be complex, and misjudgments in implementation may result in under- or over-allocations to equity, fixed-income and/or cash and cash equivalent exposure causing the fund to underperform or experience losses. Also, futurescontracts may be subject to exchange-imposed daily price fluctuation limits, and trading may be halted if a contract’s price moves above or below thelimit on a given day. As a result, the fund may not be able to promptly liquidate unfavorable futures positions and could be required to hold suchpositions until the delivery date, regardless of changes in its value.
Since the characteristics of many securities change as markets change or time passes, the success of risk management techniques will be subject to theportfolio managers’ ability to execute the strategy. Moreover, risk management strategies may increase portfolio transaction costs, which could causeor increase losses or reduce gains. Any one or more of these factors may prevent the fund from achieving the intended risk management goals orcould cause the fund to underperform or experience losses (some of which may be sudden) or volatility for any particular period.
Short positions. In taking a short position, a fund seeks to profit from an anticipated decline in the value of a security or index of securities. If thesecurity or index instead appreciates in value, the fund will incur losses by having to pay to close out its position at a higher price than the price itreceived to open that position. Unlike losses from declines in long positions in stocks or other securities (which may not exceed the original amountinvested), the losses a fund may incur to close out a short position if the underlying security or index increases in value are potentially unlimited.
Swaps. Counterparty risk, liquidity risk (i.e., the inability to enter into closing transactions), interest-rate risk, settlement risk, risk of default of theunderlying reference obligation, and risk of disproportionate loss are the principal risks of engaging in transactions involving swaps.
Target allocation risk. The fund’s risk profile will change due to reallocation or rebalancing of portfolio assets as the fund approaches its target date.
Use of index futures. While the use of index futures may involve a small investment of cash, the losses to a fund could exceed the amount invested,and in certain cases even the total value of the fund’s assets, due to the embedded leverage provided by the derivative. Index futures may also result ina loss to the fund if the counterparty to the transaction does not perform.
.180

Principal risks of investing in the underlying fundsThe principal risks of investing in the Underlying Funds include:
Convertible securities risk. The market values of convertible securities tend to fall as interest rates rise and rise as interest rates fall. As the marketprice of underlying common stock declines below the conversion price, the market value of the convertible security tends to be increasingly influencedby its yield.
Credit and counterparty risk. The issuer or guarantor of a fixed-income security, the counterparty to an over-the-counter derivatives contract, or aborrower of fund securities may not make timely payments or otherwise honor its obligations. U.S. government securities are subject to varyingdegrees of credit risk depending upon the nature of their support. A downgrade or default affecting any of the fund’s securities could affect the fund’sperformance.
Cybersecurity and operational risk. Cybersecurity breaches may allow an unauthorized party to gain access to fund assets, customer data, orproprietary information, or cause a fund or its service providers to suffer data corruption or lose operational functionality. Similar incidents affectingissuers of a fund’s securities may negatively impact performance. Operational risk may arise from human error, error by third parties, communicationerrors, or technology failures, among other causes.
Economic and market events risk. Events in the U.S. and global financial markets, including actions taken by the U.S. Federal Reserve or foreigncentral banks to stimulate or stabilize economic growth, may at times result in unusually high market volatility, which could negatively impactperformance. Reduced liquidity in credit and fixed-income markets could adversely affect issuers worldwide. Banks and financial services companiescould suffer losses if interest rates rise or economic conditions deteriorate.
Equity securities risk. The price of equity securities may decline due to changes in a company’s financial condition or overall market conditions.Growth company securities may fluctuate more in price than other securities because of the greater emphasis on earnings expectations. Securities themanager believes are undervalued may never realize their full potential value, and in certain markets value stocks may underperform the market as awhole.
Exchange-traded funds risk. An ETF generally reflects the risks of the underlying securities it is designed to track. A fund bears ETF fees and expensesindirectly.
Fixed-income securities risk. A rise in interest rates typically causes bond prices to fall. The longer the average maturity or duration of the bonds heldby a fund, the more sensitive it will likely be to interest-rate fluctuations. An issuer may not make all interest payments or repay all or any of theprincipal borrowed. Changes in a security’s credit quality may adversely affect fund performance.
Foreign securities risk. Less information may be publicly available regarding foreign issuers. Foreign securities may be subject to foreign taxes andmay be more volatile than U.S. securities. Currency fluctuations and political and economic developments may adversely impact the value of foreignsecurities. The risks of investing in foreign securities are magnified in emerging markets.
Hedging, derivatives, and other strategic transactions risk. Hedging, derivatives, and other strategic transactions may increase a fund’s volatilityand could produce disproportionate losses, potentially more than the fund’s principal investment. Risks of these transactions are different from andpossibly greater than risks of investing directly in securities and other traditional instruments. Under certain market conditions, derivatives couldbecome harder to value or sell and may become subject to liquidity risk (i.e., the inability to enter into closing transactions). Regulatory changes inderivative markets could impact the cost of or the fund’s ability to engage in derivatives transactions. Derivatives and other strategic transactions that afund may utilize include: credit default swaps, foreign currency forward contracts, futures contracts, interest-rate swaps, and options. Foreign currencyforward contracts, futures contracts, options, and swaps generally are subject to counterparty risk. In addition, swaps may be subject to interest-rateand settlement risk, and the risk of default of the underlying reference obligation. Derivatives associated with foreign currency transactions are subjectto currency risk.
Index management risk. Certain factors may cause a fund that is an index fund to track its target index less closely. For example, a subadvisor mayselect securities that are not fully representative of the index, and the fund’s transaction expenses, and the size and timing of its cash flows, may resultin the fund’s performance being different than that of its index. Moreover, the fund will generally reflect the performance of its target index evenwhen the index does not perform well.
Initial public offerings risk. IPO share prices are frequently volatile and may significantly impact fund performance.
Large company risk. Larger companies may grow more slowly than smaller companies or be slower to respond to business developments. Large-capitalization securities may underperform the market as a whole.
Liquidity risk. The extent (if at all) to which a security may be sold or a derivative position closed without negatively impacting its market value may beimpaired by reduced market activity or participation, legal restrictions, or other economic and market impediments. Liquidity risk may be magnified inrising interest rate environments due to higher than normal redemption rates. Widespread selling of fixed-income securities to satisfy redemptionsduring periods of reduced demand may adversely impact the price or salability of such securities. Periods of heavy redemption could cause the fund tosell assets at a loss or depressed value, which could negatively affect performance. Redemption risk is heightened during periods of declining or illiquidmarkets.
Lower-rated and high-yield fixed-income securities risk. Lower-rated and high-yield fixed-income securities (junk bonds) are subject to greatercredit quality risk, risk of default, and price volatility than higher-rated fixed-income securities, may be considered speculative, and can be difficult toresell.
.181
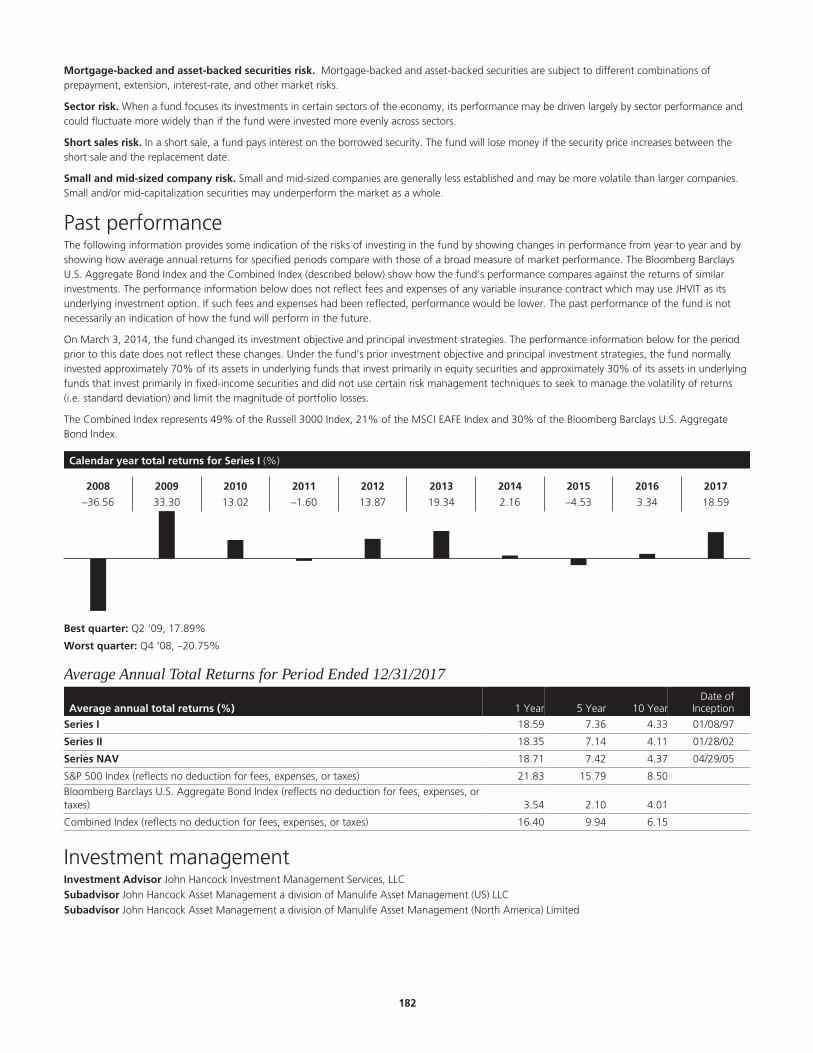
Mortgage-backed and asset-backed securities risk. Mortgage-backed and asset-backed securities are subject to different combinations ofprepayment, extension, interest-rate, and other market risks.
Sector risk. When a fund focuses its investments in certain sectors of the economy, its performance may be driven largely by sector performance andcould fluctuate more widely than if the fund were invested more evenly across sectors.
Short sales risk. In a short sale, a fund pays interest on the borrowed security. The fund will lose money if the security price increases between theshort sale and the replacement date.
Small and mid-sized company risk. Small and mid-sized companies are generally less established and may be more volatile than larger companies.Small and/or mid-capitalization securities may underperform the market as a whole.
Past performanceThe following information provides some indication of the risks of investing in the fund by showing changes in performance from year to year and byshowing how average annual returns for specified periods compare with those of a broad measure of market performance. The Bloomberg BarclaysU.S. Aggregate Bond Index and the Combined Index (described below) show how the fund’s performance compares against the returns of similarinvestments. The performance information below does not reflect fees and expenses of any variable insurance contract which may use JHVIT as itsunderlying investment option. If such fees and expenses had been reflected, performance would be lower. The past performance of the fund is notnecessarily an indication of how the fund will perform in the future.
On March 3, 2014, the fund changed its investment objective and principal investment strategies. The performance information below for the periodprior to this date does not reflect these changes. Under the fund’s prior investment objective and principal investment strategies, the fund normallyinvested approximately 70% of its assets in underlying funds that invest primarily in equity securities and approximately 30% of its assets in underlyingfunds that invest primarily in fixed-income securities and did not use certain risk management techniques to seek to manage the volatility of returns(i.e. standard deviation) and limit the magnitude of portfolio losses.
The Combined Index represents 49% of the Russell 3000 Index, 21% of the MSCI EAFE Index and 30% of the Bloomberg Barclays U.S. AggregateBond Index.
Calendar year total returns for Series I (%)
2008 2009 2010 2011 2012 2013 2014 2015 2016 2017
–36.56 33.30 13.02 –1.60 13.87 19.34 2.16 –4.53 3.34 18.59
Best quarter: Q2 ‘09, 17.89%
Worst quarter: Q4 ‘08, –20.75%
Average Annual Total Returns for Period Ended 12/31/2017
Average annual total returns (%) 1 Year 5 Year 10 YearDate of
Inception
Series I 18.59 7.36 4.33 01/08/97
Series II 18.35 7.14 4.11 01/28/02
Series NAV 18.71 7.42 4.37 04/29/05
S&P 500 Index (reflects no deduction for fees, expenses, or taxes) 21.83 15.79 8.50 Bloomberg Barclays U.S. Aggregate Bond Index (reflects no deduction for fees, expenses, ortaxes) 3.54 2.10 4.01
Combined Index (reflects no deduction for fees, expenses, or taxes) 16.40 9.94 6.15
Investment managementInvestment Advisor John Hancock Investment Management Services, LLC§
Subadvisor John Hancock Asset Management a division of Manulife Asset Management (US) LLC§
Subadvisor John Hancock Asset Management a division of Manulife Asset Management (North America) Limited
.182
Portfolio managementRobert BoydaHead of Capital Markets and Strategy and Co-Head of Portfolio Solutions Group, John HancockAsset Management a division of Manulife AssetManagement (US) LLCManaged fund since 2010
Jeffrey N. Given, CFASenior Managing Director and Senior PortfolioManager, John Hancock Asset Management adivision of Manulife Asset Management (US) LLCManaged fund since 2014
Luning “Gary” LiManaging Director and Senior PortfolioManager, John Hancock Asset Management adivision of Manulife Asset Management (US)LLCManaged fund since 2014
Robert Sykes, CFAManaging Director, Portfolio Manager ofPortfolio Solutions Group,John Hancock Asset Management a division ofManulife Asset Management (US) LLCManaged fund since 2018
Nathan Thooft, CFASenior Managing Director, Senior PortfolioManager, Co-Head of Portfolio Solutions Group,John Hancock Asset Management a division ofManulife Asset Management (US) LLCManaged fund since 2013
Other important information regarding the fundFor important information about taxes and financial intermediary compensation, please turn to “Additional information about the funds” at page258 of the Prospectus.
.183
Managed Volatility Moderate Portfolio (formerly Lifestyle Moderate MVP)Investment objectiveTo seek current income and growth of capital while seeking to both manage the volatility of return and limit the magnitude of portfolio losses.
Fees and expensesThis table describes the fees and expenses that you may pay if you buy and hold shares of the fund. The fees and expenses do not reflect fees andexpenses of any variable insurance contract that may use the fund as its underlying investment option and would be higher if they did.
Annual fund operating expenses (%) (expenses that you pay each year as a percentage of the valueof your investment) Series I Series II Series NAV
Management fee 0.05 0.05 0.05
Distribution and service (Rule 12b-1) fees 0.05 0.25 0.00
Other expenses 0.03 0.03 0.03
Acquired fund fees and expenses1 0.61 0.61 0.61
Total annual fund operating expenses2 0.74 0.94 0.69
Contractual expense reimbursement3 –0.03 –0.03 –0.03
Total annual fund operating expenses after expense reimbursements 0.71 0.91 0.66
1 “Acquired fund fees and expenses” are based on indirect net expenses associated with the fund’s investments in underlying investment companies.2 The “Total annual fund operating expenses” shown may not correlate to the fund’s ratios of expenses to average daily net assets shown in the “Financial highlights” section of
the fund’s prospectus, which does not include “Acquired fund fees and expenses.”3 The advisor has contractually agreed to reduce its management fee and/or make payment to the fund in an amount equal to the amount by which “Other expenses” of the
fund exceed 0.00% of the average daily net assets of the fund. “Other expenses” means all of the expenses of the fund, excluding certain expenses such as advisory fees,taxes, brokerage commissions, interest expense, litigation and indemnification expenses and other extraordinary expenses not incurred in the ordinary course of the fund’sbusiness, distribution and service (Rule 12b-1) fees, underlying fund expenses (acquired fund fees), and short dividend expense. The current expense limitation agreementexpires on April 30, 2019 unless renewed by mutual agreement of the fund and the advisor based upon a determination that this is appropriate under the circumstances atthat time.
Expense exampleThe examples are intended to help you compare the cost of investing in the fund with the cost of investing in other mutual funds. The examplesassume that $10,000 is invested in the fund for the periods indicated and then all shares are redeemed at the end of those periods. The examples alsoassume that the investment has a 5% return each year and that the fund’s operating expenses remain the same. The expense example does not reflectfees and expenses of any variable insurance contract that may use the fund as its underlying investment option and would be higher if they did.Although your actual costs may be higher or lower, based on these assumptions your costs would be:
Expenses ($) Series I Series II Series NAV
1 year 73 93 67
3 years 234 297 218
5 years 409 517 381
10 years 916 1,152 856
Portfolio turnoverThe fund, which operates as a fund of funds and invests in underlying funds, does not pay transaction costs, such as commissions, when it buys andsells shares of underlying funds (or “turns over” its portfolio). An underlying fund does pay transaction costs when it turns over its portfolio, and ahigher portfolio turnover rate may indicate higher transaction costs. These costs, which are not reflected in annual fund operating expenses or in theexample, affect the performance of the underlying funds and of the fund. During its most recent fiscal year, the fund’s portfolio turnover rate was 9%of the average value of its portfolio.
Principal investment strategiesThe Managed Volatility Moderate Portfolio, except as otherwise described below, normally invests primarily in underlying funds that invest primarily inequity securities (“Equity Funds”) and underlying funds that invest primarily in fixed-income securities (“Fixed-Income Funds”). The fund may also usecertain risk management techniques to seek to manage the volatility of returns (i.e., standard deviation) and limit the magnitude of portfolio losses.
As described below, the fund may directly hold derivative instruments and collateral for these derivative instruments. The fund’s economic exposure toequities and fixed-income securities may fluctuate due to its risk management strategy as noted below. The fund may employ a risk managementstrategy to attempt to manage the volatility of returns and limit the magnitude of portfolio losses. The risk management strategy may cause the fund’seconomic exposure to equity securities, fixed-income securities and cash and cash equivalents (either directly or through investment in underlying fundsor derivatives) to fluctuate, and during extreme market volatility, the fund’s economic exposure to either equity or fixed-income securities could be
.184

reduced to 0% and its economic exposure to cash and cash equivalents could increase to 100%. The subadvisor normally will seek to limit the fund’sexposure to equity securities (either directly or through investment in underlying funds or derivatives) to no more than 44% and normally will seek toreduce any equity exposure in excess of this amount as soon as practicable. However, the subadvisor may determine in light of market or economicconditions that the limit should be exceeded to achieve the fund’s investment objective.
The fund seeks long term growth of capital while attempting to manage the volatility of returns and limit the magnitude of portfolio losses. The fundseeks to limit the volatility of returns to a range of 7% to 9% (as measured by annualized standard deviation of the fund’s returns). However, duringperiods of prolonged low market volatility the actual volatility experienced by the fund may fall below the range due to maximum limits on equity andfixed-income exposures.
Volatility is a measure of the magnitude of up and down fluctuations in the fund’s NAV over time as measured by the annualized standard deviation ofits returns. Higher volatility generally indicates higher risk. The more a fund’s returns vary from the fund’s average return, the more volatile the fundand the higher the standard deviation. The purpose of managing the volatility of returns is to attempt to limit exposure to more volatile asset classes,including both equities and fixed-income asset classes, during periods of high volatility and protect the fund from losses during market declines. Thefund also seeks to limit the magnitude of portfolio losses in order to limit exposure during market declines. There can be no assurance that the riskmanagement strategy will be successful in managing the volatility of returns and limiting the magnitude of portfolio losses.
In seeking to manage the volatility of returns and limit the magnitude of portfolio losses, the fund may employ certain risk management techniquesusing derivative instruments and may reallocate assets between the underlying Equity and Fixed-Income Funds. These derivatives may be used toincrease or decrease the fund’s net equity exposure and will typically consist of stock index futures, but may also include stock index options, optionson stock index futures, and stock index swaps. The fund may also employ risk management techniques using derivatives that may increase or decreasethe fund’s exposure to certain types of fixed-income securities. These instruments may include government bond futures, swaps, and credit defaultswaps. For more information about these derivative instruments in which the fund may invest, please see the “Hedging And Other StrategicTransactions” risk section in the Statement of Additional Information. Fund assets employed for its risk management strategy include not onlyderivative instruments but also fixed-income instruments, used to cover derivative positions. Because equity and fixed-income derivative instrumentsmay be purchased with a fraction of the assets that would be needed to purchase the securities directly, the remainder of the assets used for the riskmanagement strategy will be invested in a variety of fixed-income instruments. The fund may be required to hold cash or other liquid assets and postthese assets with a broker as collateral to cover its obligation under the futures contracts. The fund’s risk management strategy could limit the upsideparticipation of the fund in strong, rising markets with high volatility and could underperform funds that do not use a risk management strategy.
The use of derivatives may be combined with asset allocation techniques. The timing and extent of these techniques will depend on several factors,including market movements. In general, when equity markets are more volatile or are declining, assets may be reallocated to Fixed-Income Funds,cash and/or cash equivalents, and short positions in equity derivative instruments. When equity markets rise, or if volatility is lower, assets may bereallocated to Equity Funds and stock index futures, options, and swaps. Similarly, if fixed-income markets are volatile or are declining, assets may bereallocated to Equity Funds, cash and cash equivalents, and short positions in fixed-income derivative instruments. Even in periods of low volatility, thesubadvisor may continue to use risk management techniques to protect against sudden market movements, preserve gains after favorable marketconditions, and reduce losses in adverse market conditions. Due to the leverage provided by derivatives, the notional value of the fund’s derivativepositions could exceed 100% of the fund’s assets.
In determining when to employ risk management techniques and/or reallocate assets between Equity Funds and Fixed-Income Funds, the subadvisormay use quantitative models that use historical factors such as market movements, and historical changes in the NAV of the fund to make thisdetermination.
The subadvisor selects the percentage level to be maintained in specific underlying Equity Funds and Fixed-Income Funds, and cash and cashequivalents and may from time to time change the allocation in specific underlying funds or rebalance the underlying funds. From time to time, asignificant portion of the fund’s underlying fixed income assets may be managed by an affiliated subadvisor. To maintain a target allocation in theunderlying funds, daily cash flows for the fund may be directed to its underlying funds that most deviate from target.
The fund may invest in various Equity Funds that as a group hold a wide range of equity type securities. These include small-, mid- and large-capitalization stocks, domestic and foreign securities (including emerging market securities), and sector holdings such as utilities, science, andtechnology stocks. Each of these Equity Funds has its own investment strategy which, for example, may focus on growth stocks or value stocks or mayemploy a strategy combining growth and income stocks and/or may invest in derivatives such as options on securities and futures contracts. The fundmay also invest in Fixed-Income Funds that as a group hold a wide range of fixed-income securities including investment grade and below-investment-grade debt securities with maturities that range from short to longer term. The Fixed-Income Funds collectively hold various types of debt instruments,such as corporate bonds and mortgage backed, government issued, domestic and international securities. Equity Funds and Fixed-Income Funds mayinclude funds that employ a passive investment style (i.e., index funds and exchange-traded funds (ETFs)) and at times most of the fund’s assets may beinvested in index funds.
The fund may also invest in the securities of other investment companies including ETFs and may invest directly in other types of investments, such asequity and fixed-income securities including U.S. government securities, closed-end funds, exchange-traded notes, and partnerships. See “OtherPermitted Investments by the Funds of Funds.” The fund may also engage in short selling. The fund may engage in active and frequent trading ofportfolio securities and other instruments to achieve its primary investment strategies.
The fund bears its own expenses and, in addition, indirectly bears its proportionate share of the expenses of the underlying funds in which it invests.
Use of Risk Management and Other Strategic Transactions. In addition to the risk management techniques described above, the fund is authorized touse other investment strategies referred to under “Hedging And Other Strategic Transactions” risk section including, without limitation, investing in
.185

foreign currency forward contracts, futures contracts including stock index and foreign currency futures, swaps including interest rate swaps, stockindex swaps and credit default swaps and options including stock index options and options on stock index futures, among others.
Principal risks of investing in the fund of fundsThe fund of funds is subject to risks, and you could lose money by investing in the fund. The principal risks of investing in the fund of funds include:
Affiliated insurance companies. The Advisor may be influenced by the benefits to its affiliated life insurance companies in managing the fund andoverseeing its subadvisors. The John Hancock insurance companies issuing guaranteed benefits on variable annuity and insurance contracts investing inthe fund have a financial interest in preserving the value of the funds and reducing their volatility due to their obligations for these guaranteed benefits(the cost of providing these guaranteed benefits is related to several factors including the performance and volatility of the fund). To the extent thefund is successful in managing the volatility of returns and downside risk, the John Hancock insurance companies issuing guaranteed benefits onvariable annuity and insurance contracts investing in the fund will also benefit from a reduction in their potential investment risk which will reduce theircosts of hedging this risk and may reduce their reserve and capital requirements. These financial benefits to the John Hancock insurance companiesmay be material. The fund and the fund’s investment advisor have adopted procedures that are intended to address these conflicts and ensure that thefund is managed in accordance with its disclosed investment objectives and strategies.
Asset allocation risk. Although allocation among asset categories generally limits exposure to any one category, the management team may favor acategory that performs poorly relative to the others.
Cash collateral risk. To the extent a fund maintains cash collateral required to cover its obligations under the derivative instruments used in its riskmanagement strategy, such collateral holdings may have the effect of reducing overall portfolio returns. In addition, because such collateral positionscannot be eliminated or reduced unless the corresponding derivative obligation is eliminated or reduced, a large derivative position may materially limitthe subadvisor’s flexibility in managing the fund.
Commodity risk. Commodity prices may be volatile due to fluctuating demand, supply disruption, speculation, and other factors. Certain commodityinvestments may have no active trading market at times.
Credit and counterparty risk. The issuer or guarantor of a fixed-income security, the counterparty to an over-the-counter derivatives contract, or aborrower of fund securities may not make timely payments or otherwise honor its obligations. U.S. government securities are subject to varyingdegrees of credit risk depending upon the nature of their support. A downgrade or default affecting any of the fund’s securities could affect the fund’sperformance.
Cybersecurity and operational risk. Cybersecurity breaches may allow an unauthorized party to gain access to fund assets, customer data, orproprietary information, or cause a fund or its service providers to suffer data corruption or lose operational functionality. Similar incidents affectingissuers of a fund’s securities may negatively impact performance. Operational risk may arise from human error, error by third parties, communicationerrors, or technology failures, among other causes.
Economic and market events risk. Events in the U.S. and global financial markets, including actions taken by the U.S. Federal Reserve or foreigncentral banks to stimulate or stabilize economic growth, may at times result in unusually high market volatility, which could negatively impactperformance. Reduced liquidity in credit and fixed-income markets could adversely affect issuers worldwide. Banks and financial services companiescould suffer losses if interest rates rise or economic conditions deteriorate.
Equity securities risk. The price of equity securities may decline due to changes in a company’s financial condition or overall market conditions.
Exchange-traded funds risk. An ETF generally reflects the risks of the underlying securities it is designed to track. A fund bears ETF fees and expensesindirectly.
Exchange-traded notes risk. An ETN generally reflects the risks associated with the assets composing the underlying market benchmark or strategy itis designed to track. ETNs also are subject to issuer and fixed-income risks.
Fixed-income securities risk. A rise in interest rates typically causes bond prices to fall. The longer the average maturity or duration of the bonds heldby a fund, the more sensitive it will likely be to interest-rate fluctuations. An issuer may not make all interest payments or repay all or any of theprincipal borrowed. Changes in a security’s credit quality may adversely affect fund performance.
Fund of funds risk. The fund’s ability to achieve its investment objective will depend largely, in part, on: (i) the underlying funds’ performance,expenses and ability to meet their investment objectives; and (ii) properly rebalancing assets among underlying funds and different asset classes. Thefund is also subject to risks related to: (i) layering of fees of the underlying funds; and (ii) conflicts of interest associated with the subadvisor’s ability toallocate fund assets without limit to other funds it advises and/or other funds advised by affiliated subadvisors. There is no assurance that either thefund or the underlying funds will achieve their investment objectives. A fund bears underlying fund fees and expenses indirectly.
Hedging, derivatives, and other strategic transactions risk. Hedging, derivatives, and other strategic transactions may increase a fund’s volatilityand could produce disproportionate losses, potentially more than the fund’s principal investment. Risks of these transactions are different from andpossibly greater than risks of investing directly in securities and other traditional instruments. Under certain market conditions, derivatives couldbecome harder to value or sell and may become subject to liquidity risk (i.e., the inability to enter into closing transactions). Regulatory changes inderivative markets could impact the cost of or the fund’s ability to engage in derivatives transactions. Derivatives and other strategic transactions that afund may utilize include: credit default swaps, foreign currency forward contracts, futures contracts, interest-rate swaps, options, and swaps. Foreigncurrency forward contracts, futures contracts, options, and swaps generally are subject to counterparty risk. In addition, swaps may be subject tointerest-rate and settlement risk, and the risk of default of the underlying reference obligation. Derivatives associated with foreign currencytransactions are subject to currency risk.
.186

Hedging risk. There may be imperfect or even negative correlation between the price of the futures contracts and the price of the underlyingsecurities. For example, futures contracts may not provide an effective hedge because changes in futures contract prices may not track those of theunderlying securities or indexes they are intended to hedge. In addition, there are significant differences between the securities and futures marketsthat could result in an imperfect correlation between the markets, causing a given hedge not to achieve its objectives. The degree of imperfection ofcorrelation depends on circumstances such as variations in speculative market demand for futures, including technical influences in futures trading, anddifferences between the financial instruments being hedged and the instruments underlying the standard contracts available for trading. A decision asto whether, when and how to hedge involves the exercise of skill and judgment, and even a well-conceived hedge may be unsuccessful to somedegree because of market behavior or unexpected interest rate trends. In addition, the fund’s investment in exchange-traded futures as a result of therisk management strategy could limit the upside participation of the fund in strong, rising markets with high volatility and could underperform fundsthat do not use a risk management strategy.
Investment company securities risk. A fund bears underlying fund fees and expenses indirectly.
Leverage. Certain of the risk management techniques that would be used in the strategy may involve indirect leverage. While these techniques wouldbe intended to reduce downside exposure, in some cases leverage may magnify losses.
Liquidity risk. The extent (if at all) to which a security may be sold or a derivative position closed without negatively impacting its market value may beimpaired by reduced market activity or participation, legal restrictions, or other economic and market impediments. Liquidity risk may be magnified inrising interest rate environments due to higher than normal redemption rates. Widespread selling of fixed-income securities to satisfy redemptionsduring periods of reduced demand may adversely impact the price or salability of such securities. Periods of heavy redemption could cause the fund tosell assets at a loss or depressed value, which could negatively affect performance. Redemption risk is heightened during periods of declining or illiquidmarkets.
Quantitative models may not produce the desired results. In determining when to employ risk management techniques and/or reallocateexposure among equity, fixed-income and cash, the subadvisor uses quantitative models that use historical market data. However, future marketconditions may not be consistent with historical periods, and the historical data may not, therefore, prove to be an accurate predictor of futurevolatility or losses. The model also may not measure or analyze such data effectively. Thus, the quantitative model may not produce the desired resultsand may not accurately forecast either future volatility or future large market declines, and this would affect the ability of a fund to be successful inmanaging the volatility of returns and limiting the magnitude of portfolio losses.
Risk management strategies may not be successful, may limit upside potential or may permit or result in losses. The purposes of the riskmanagement strategies are to attempt to limit the fund’s total risk exposure during periods of high market volatility and reduce the fund’s lossesduring market declines; however, there is no assurance that these strategies will be successful. These risk management strategies could limit the upsideparticipation of the fund in rising equity markets during periods of high volatility. In instances of equity market declines followed by rising equitymarkets and significant levels of market volatility, these risk management strategies may detract from fund performance and at times prevent the fundfrom fully recovering losses by limiting the levels of exposure to equity markets. Due to the use of historical data in the models used in the riskmanagement strategy, there can be delays, especially during volatile markets, in fully implementing the strategy when markets are declining causingthe fund to experience greater losses than if the strategy had been fully implemented. There can also be delays, especially during volatile markets, inremoving hedges designed to limit losses during declining markets when markets are rising strongly causing the fund to not fully participate in therising market. The application of risk management techniques can be complex, and misjudgments in implementation may result in under- or over-allocations to equity, fixed-income and/or cash and cash equivalent exposure causing the fund to underperform or experience losses. Also, futurescontracts may be subject to exchange-imposed daily price fluctuation limits, and trading may be halted if a contract’s price moves above or below thelimit on a given day. As a result, the fund may not be able to promptly liquidate unfavorable futures positions and could be required to hold suchpositions until the delivery date, regardless of changes in its value.
Since the characteristics of many securities change as markets change or time passes, the success of risk management techniques will be subject to theportfolio managers’ ability to execute the strategy. Moreover, risk management strategies may increase portfolio transaction costs, which could causeor increase losses or reduce gains. Any one or more of these factors may prevent the fund from achieving the intended risk management goals orcould cause the fund to underperform or experience losses (some of which may be sudden) or volatility for any particular period.
Short positions. In taking a short position, a fund seeks to profit from an anticipated decline in the value of a security or index of securities. If thesecurity or index instead appreciates in value, the fund will incur losses by having to pay to close out its position at a higher price than the price itreceived to open that position. Unlike losses from declines in long positions in stocks or other securities (which may not exceed the original amountinvested), the losses a fund may incur to close out a short position if the underlying security or index increases in value are potentially unlimited.
Swaps. Counterparty risk, liquidity risk (i.e., the inability to enter into closing transactions), interest-rate risk, settlement risk, risk of default of theunderlying reference obligation, and risk of disproportionate loss are the principal risks of engaging in transactions involving swaps.
Target allocation risk. The fund’s risk profile will change due to reallocation or rebalancing of portfolio assets as the fund approaches its target date.
Use of index futures. While the use of index futures may involve a small investment of cash, the losses to a fund could exceed the amount invested,and in certain cases even the total value of the fund’s assets, due to the embedded leverage provided by the derivative. Index futures may also result ina loss to the fund if the counterparty to the transaction does not perform.
.187

Principal risks of investing in the underlying fundsThe principal risks of investing in the Underlying Funds include:
Convertible securities risk. The market values of convertible securities tend to fall as interest rates rise and rise as interest rates fall. As the marketprice of underlying common stock declines below the conversion price, the market value of the convertible security tends to be increasingly influencedby its yield.
Credit and counterparty risk. The issuer or guarantor of a fixed-income security, the counterparty to an over-the-counter derivatives contract, or aborrower of fund securities may not make timely payments or otherwise honor its obligations. U.S. government securities are subject to varyingdegrees of credit risk depending upon the nature of their support. A downgrade or default affecting any of the fund’s securities could affect the fund’sperformance.
Cybersecurity and operational risk. Cybersecurity breaches may allow an unauthorized party to gain access to fund assets, customer data, orproprietary information, or cause a fund or its service providers to suffer data corruption or lose operational functionality. Similar incidents affectingissuers of a fund’s securities may negatively impact performance. Operational risk may arise from human error, error by third parties, communicationerrors, or technology failures, among other causes.
Economic and market events risk. Events in the U.S. and global financial markets, including actions taken by the U.S. Federal Reserve or foreigncentral banks to stimulate or stabilize economic growth, may at times result in unusually high market volatility, which could negatively impactperformance. Reduced liquidity in credit and fixed-income markets could adversely affect issuers worldwide. Banks and financial services companiescould suffer losses if interest rates rise or economic conditions deteriorate.
Equity securities risk. The price of equity securities may decline due to changes in a company’s financial condition or overall market conditions.Growth company securities may fluctuate more in price than other securities because of the greater emphasis on earnings expectations. Securities themanager believes are undervalued may never realize their full potential value, and in certain markets value stocks may underperform the market as awhole.
Exchange-traded funds risk. An ETF generally reflects the risks of the underlying securities it is designed to track. A fund bears ETF fees and expensesindirectly.
Fixed-income securities risk. A rise in interest rates typically causes bond prices to fall. The longer the average maturity or duration of the bonds heldby a fund, the more sensitive it will likely be to interest-rate fluctuations. An issuer may not make all interest payments or repay all or any of theprincipal borrowed. Changes in a security’s credit quality may adversely affect fund performance.
Foreign securities risk. Less information may be publicly available regarding foreign issuers. Foreign securities may be subject to foreign taxes andmay be more volatile than U.S. securities. Currency fluctuations and political and economic developments may adversely impact the value of foreignsecurities. The risks of investing in foreign securities are magnified in emerging markets.
Hedging, derivatives, and other strategic transactions risk. Hedging, derivatives, and other strategic transactions may increase a fund’s volatilityand could produce disproportionate losses, potentially more than the fund’s principal investment. Risks of these transactions are different from andpossibly greater than risks of investing directly in securities and other traditional instruments. Under certain market conditions, derivatives couldbecome harder to value or sell and may become subject to liquidity risk (i.e., the inability to enter into closing transactions). Regulatory changes inderivative markets could impact the cost of or the fund’s ability to engage in derivatives transactions. Derivatives and other strategic transactions that afund may utilize include: credit default swaps, foreign currency forward contracts, futures contracts, interest-rate swaps, and options. Foreign currencyforward contracts, futures contracts, options, and swaps generally are subject to counterparty risk. In addition, swaps may be subject to interest-rateand settlement risk, and the risk of default of the underlying reference obligation. Derivatives associated with foreign currency transactions are subjectto currency risk.
Index management risk. Certain factors may cause a fund that is an index fund to track its target index less closely. For example, a subadvisor mayselect securities that are not fully representative of the index, and the fund’s transaction expenses, and the size and timing of its cash flows, may resultin the fund’s performance being different than that of its index. Moreover, the fund will generally reflect the performance of its target index evenwhen the index does not perform well.
Initial public offerings risk. IPO share prices are frequently volatile and may significantly impact fund performance.
Large company risk. Larger companies may grow more slowly than smaller companies or be slower to respond to business developments. Large-capitalization securities may underperform the market as a whole.
Liquidity risk. The extent (if at all) to which a security may be sold or a derivative position closed without negatively impacting its market value may beimpaired by reduced market activity or participation, legal restrictions, or other economic and market impediments. Liquidity risk may be magnified inrising interest rate environments due to higher than normal redemption rates. Widespread selling of fixed-income securities to satisfy redemptionsduring periods of reduced demand may adversely impact the price or salability of such securities. Periods of heavy redemption could cause the fund tosell assets at a loss or depressed value, which could negatively affect performance. Redemption risk is heightened during periods of declining or illiquidmarkets.
Lower-rated and high-yield fixed-income securities risk. Lower-rated and high-yield fixed-income securities (junk bonds) are subject to greatercredit quality risk, risk of default, and price volatility than higher-rated fixed-income securities, may be considered speculative, and can be difficult toresell.
.188
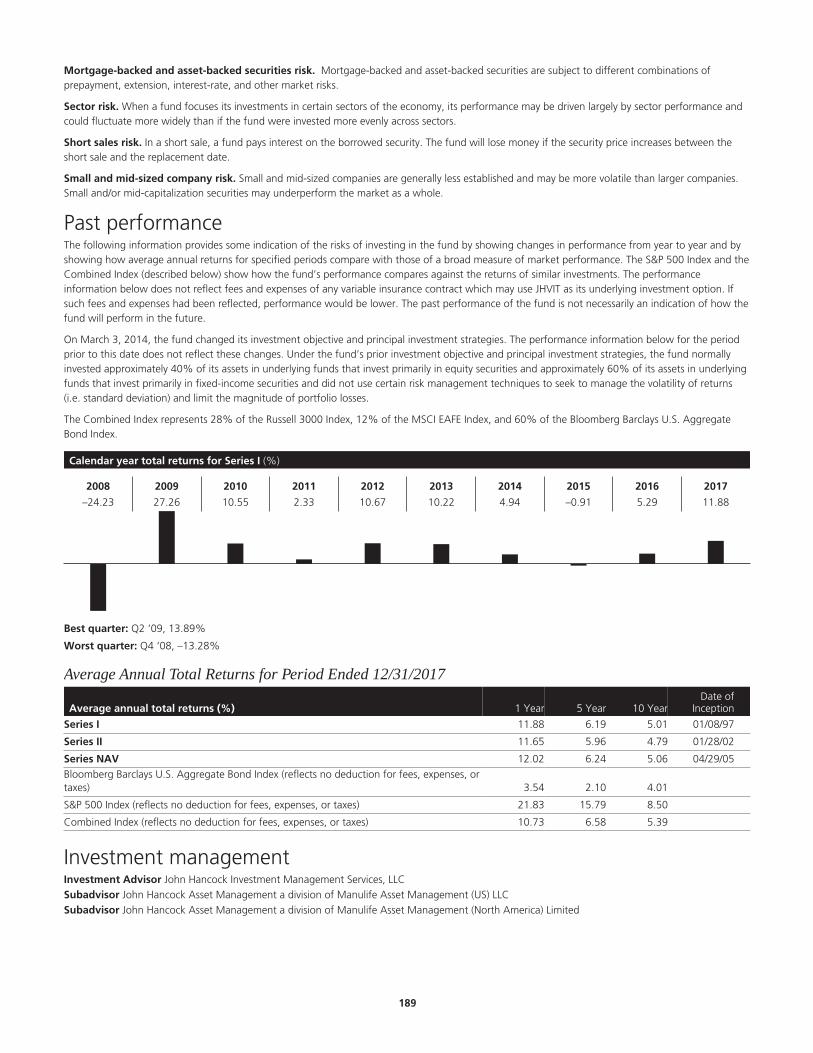
Mortgage-backed and asset-backed securities risk. Mortgage-backed and asset-backed securities are subject to different combinations ofprepayment, extension, interest-rate, and other market risks.
Sector risk. When a fund focuses its investments in certain sectors of the economy, its performance may be driven largely by sector performance andcould fluctuate more widely than if the fund were invested more evenly across sectors.
Short sales risk. In a short sale, a fund pays interest on the borrowed security. The fund will lose money if the security price increases between theshort sale and the replacement date.
Small and mid-sized company risk. Small and mid-sized companies are generally less established and may be more volatile than larger companies.Small and/or mid-capitalization securities may underperform the market as a whole.
Past performanceThe following information provides some indication of the risks of investing in the fund by showing changes in performance from year to year and byshowing how average annual returns for specified periods compare with those of a broad measure of market performance. The S&P 500 Index and theCombined Index (described below) show how the fund’s performance compares against the returns of similar investments. The performanceinformation below does not reflect fees and expenses of any variable insurance contract which may use JHVIT as its underlying investment option. Ifsuch fees and expenses had been reflected, performance would be lower. The past performance of the fund is not necessarily an indication of how thefund will perform in the future.
On March 3, 2014, the fund changed its investment objective and principal investment strategies. The performance information below for the periodprior to this date does not reflect these changes. Under the fund’s prior investment objective and principal investment strategies, the fund normallyinvested approximately 40% of its assets in underlying funds that invest primarily in equity securities and approximately 60% of its assets in underlyingfunds that invest primarily in fixed-income securities and did not use certain risk management techniques to seek to manage the volatility of returns(i.e. standard deviation) and limit the magnitude of portfolio losses.
The Combined Index represents 28% of the Russell 3000 Index, 12% of the MSCI EAFE Index, and 60% of the Bloomberg Barclays U.S. AggregateBond Index.
Calendar year total returns for Series I (%)
2008 2009 2010 2011 2012 2013 2014 2015 2016 2017
–24.23 27.26 10.55 2.33 10.67 10.22 4.94 –0.91 5.29 11.88
Best quarter: Q2 ‘09, 13.89%
Worst quarter: Q4 ‘08, –13.28%
Average Annual Total Returns for Period Ended 12/31/2017
Average annual total returns (%) 1 Year 5 Year 10 YearDate of
Inception
Series I 11.88 6.19 5.01 01/08/97
Series II 11.65 5.96 4.79 01/28/02
Series NAV 12.02 6.24 5.06 04/29/05Bloomberg Barclays U.S. Aggregate Bond Index (reflects no deduction for fees, expenses, ortaxes) 3.54 2.10 4.01
S&P 500 Index (reflects no deduction for fees, expenses, or taxes) 21.83 15.79 8.50
Combined Index (reflects no deduction for fees, expenses, or taxes) 10.73 6.58 5.39
Investment managementInvestment Advisor John Hancock Investment Management Services, LLC§
Subadvisor John Hancock Asset Management a division of Manulife Asset Management (US) LLC§
Subadvisor John Hancock Asset Management a division of Manulife Asset Management (North America) Limited
.189

Portfolio managementRobert BoydaHead of Capital Markets and Strategy and Co-Head of Portfolio Solutions Group, John HancockAsset Management a division of Manulife AssetManagement (US) LLCManaged fund since 2010
Jeffrey N. Given, CFASenior Managing Director and Senior PortfolioManager, John Hancock Asset Management adivision of Manulife Asset Management (US) LLCManaged fund since 2014
Luning “Gary” LiManaging Director and Senior PortfolioManager, John Hancock Asset Management adivision of Manulife Asset Management (US)LLCManaged fund since 2014
Robert Sykes, CFAManaging Director, Portfolio Manager ofPortfolio Solutions Group,John Hancock Asset Management a division ofManulife Asset Management (US) LLCManaged fund since 2018
Nathan Thooft, CFASenior Managing Director, Senior PortfolioManager, Co-Head of Portfolio Solutions Group,John Hancock Asset Management a division ofManulife Asset Management (US) LLCManaged fund since 2013
Other important information regarding the fundFor important information about taxes and financial intermediary compensation, please turn to “Additional information about the funds” at page258 of the Prospectus.
.190
Mid Cap Index Trust Investment objectiveSeeks to approximate the aggregate total return of a mid cap U.S. domestic equity market index.
Fees and expensesThis table describes the fees and expenses that you may pay if you buy and hold shares of the fund. The fees and expenses do not reflect fees andexpenses of any variable insurance contract that may use the fund as its underlying investment option and would be higher if they did.
Annual fund operating expenses (%) (expenses that you pay each year as a percentage of the valueof your investment) Series I Series II Series NAV
Management fee 0.47 0.47 0.47
Distribution and service (Rule 12b-1) fees 0.05 0.25 0.00
Other expenses 0.04 0.04 0.04
Total annual fund operating expenses 0.56 0.76 0.51
Contractual expense reimbursement1 –0.10 –0.10 –0.10
Total annual fund operating expenses after expense reimbursements 0.46 0.66 0.41
1 The advisor contractually agrees to reduce its management fee by an annual rate of 0.10% of the fund’s average daily net assets. This agreement expires on April 30, 2019,unless renewed by mutual agreement of the fund and the advisor based upon a determination that this is appropriate under the circumstances at that time.
Expense exampleThe examples are intended to help you compare the cost of investing in the fund with the cost of investing in other mutual funds. The examplesassume that $10,000 is invested in the fund for the periods indicated and then all shares are redeemed at the end of those periods. The examples alsoassume that the investment has a 5% return each year and that the fund’s operating expenses remain the same. The expense example does not reflectfees and expenses of any variable insurance contract that may use the fund as its underlying investment option and would be higher if they did.Although your actual costs may be higher or lower, based on these assumptions your costs would be:
Expenses ($) Series I Series II Series NAV
1 year 47 67 42
3 years 169 233 153
5 years 303 413 275
10 years 692 933 631
Portfolio turnoverThe fund pays transaction costs, such as commissions, when it buys and sells securities (or “turns over” its portfolio). A higher portfolio turnover ratemay indicate higher transaction costs. These costs, which are not reflected in annual fund operating expenses or in the example, affect the fund’sperformance. During its most recent fiscal year, the fund’s portfolio turnover rate was 19% of the average value of its portfolio.
Principal investment strategiesUnder normal market conditions, the fund invests at least 80% of its net assets (plus any borrowings for investment purposes) at the time ofinvestment in: (a) the common stocks that are included in the S&P Midcap 400 Index; and (b) securities (which may or may not be included in the S&PMidcap 400 Index) that the subadvisor believes as a group will behave in a manner similar to the index. As of February 28, 2018, the marketcapitalizations of companies included in the S&P Midcap 400 Index ranged from $790 million to $13.1 billion.
An index is an unmanaged group of securities whose overall performance is used as an investment benchmark. Indexes may track broad investmentmarkets, such as the global equity market, or more narrow investment markets, such as the U.S. small cap equity market. In contrast to activelymanaged funds, which seek to outperform their respective benchmark indexes through research and analysis, index funds are passively managed fundsthat seek to mirror the performance of their target indexes, minimizing performance differences over time. The fund attempts to match theperformance of the S&P Midcap 400 Index by: (a) holding all, or a representative sample, of the securities that comprise that index; and/or (b) byholding securities (which may or may not be included in the index) that the subadvisor believes as a group will behave in a manner similar to the index.However, the fund has operating expenses and transaction costs, while a market index does not. Therefore, the fund, while it attempts to track itstarget index closely, typically will be unable to match the performance of the target index exactly. The composition of an index changes from time totime, and the subadvisor will reflect those changes in the composition of the fund’s portfolio as soon as practicable.
The fund may invest in index futures for the purposes of replicating an index and depositary receipts.
.191
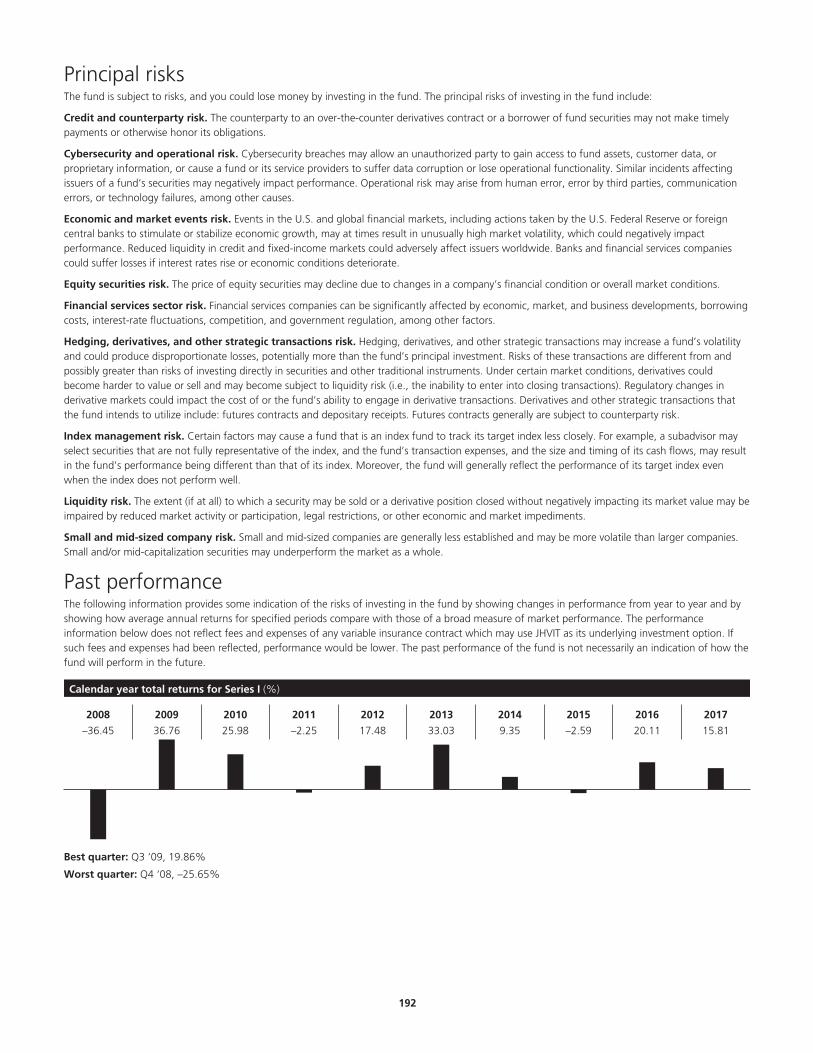
Principal risksThe fund is subject to risks, and you could lose money by investing in the fund. The principal risks of investing in the fund include:
Credit and counterparty risk. The counterparty to an over-the-counter derivatives contract or a borrower of fund securities may not make timelypayments or otherwise honor its obligations.
Cybersecurity and operational risk. Cybersecurity breaches may allow an unauthorized party to gain access to fund assets, customer data, orproprietary information, or cause a fund or its service providers to suffer data corruption or lose operational functionality. Similar incidents affectingissuers of a fund’s securities may negatively impact performance. Operational risk may arise from human error, error by third parties, communicationerrors, or technology failures, among other causes.
Economic and market events risk. Events in the U.S. and global financial markets, including actions taken by the U.S. Federal Reserve or foreigncentral banks to stimulate or stabilize economic growth, may at times result in unusually high market volatility, which could negatively impactperformance. Reduced liquidity in credit and fixed-income markets could adversely affect issuers worldwide. Banks and financial services companiescould suffer losses if interest rates rise or economic conditions deteriorate.
Equity securities risk. The price of equity securities may decline due to changes in a company’s financial condition or overall market conditions.
Financial services sector risk. Financial services companies can be significantly affected by economic, market, and business developments, borrowingcosts, interest-rate fluctuations, competition, and government regulation, among other factors.
Hedging, derivatives, and other strategic transactions risk. Hedging, derivatives, and other strategic transactions may increase a fund’s volatilityand could produce disproportionate losses, potentially more than the fund’s principal investment. Risks of these transactions are different from andpossibly greater than risks of investing directly in securities and other traditional instruments. Under certain market conditions, derivatives couldbecome harder to value or sell and may become subject to liquidity risk (i.e., the inability to enter into closing transactions). Regulatory changes inderivative markets could impact the cost of or the fund’s ability to engage in derivative transactions. Derivatives and other strategic transactions thatthe fund intends to utilize include: futures contracts and depositary receipts. Futures contracts generally are subject to counterparty risk.
Index management risk. Certain factors may cause a fund that is an index fund to track its target index less closely. For example, a subadvisor mayselect securities that are not fully representative of the index, and the fund’s transaction expenses, and the size and timing of its cash flows, may resultin the fund’s performance being different than that of its index. Moreover, the fund will generally reflect the performance of its target index evenwhen the index does not perform well.
Liquidity risk. The extent (if at all) to which a security may be sold or a derivative position closed without negatively impacting its market value may beimpaired by reduced market activity or participation, legal restrictions, or other economic and market impediments.
Small and mid-sized company risk. Small and mid-sized companies are generally less established and may be more volatile than larger companies.Small and/or mid-capitalization securities may underperform the market as a whole.
Past performanceThe following information provides some indication of the risks of investing in the fund by showing changes in performance from year to year and byshowing how average annual returns for specified periods compare with those of a broad measure of market performance. The performanceinformation below does not reflect fees and expenses of any variable insurance contract which may use JHVIT as its underlying investment option. Ifsuch fees and expenses had been reflected, performance would be lower. The past performance of the fund is not necessarily an indication of how thefund will perform in the future.
Calendar year total returns for Series I (%)
2008 2009 2010 2011 2012 2013 2014 2015 2016 2017
–36.45 36.76 25.98 –2.25 17.48 33.03 9.35 –2.59 20.11 15.81
Best quarter: Q3 ‘09, 19.86%
Worst quarter: Q4 ‘08, –25.65%
.192
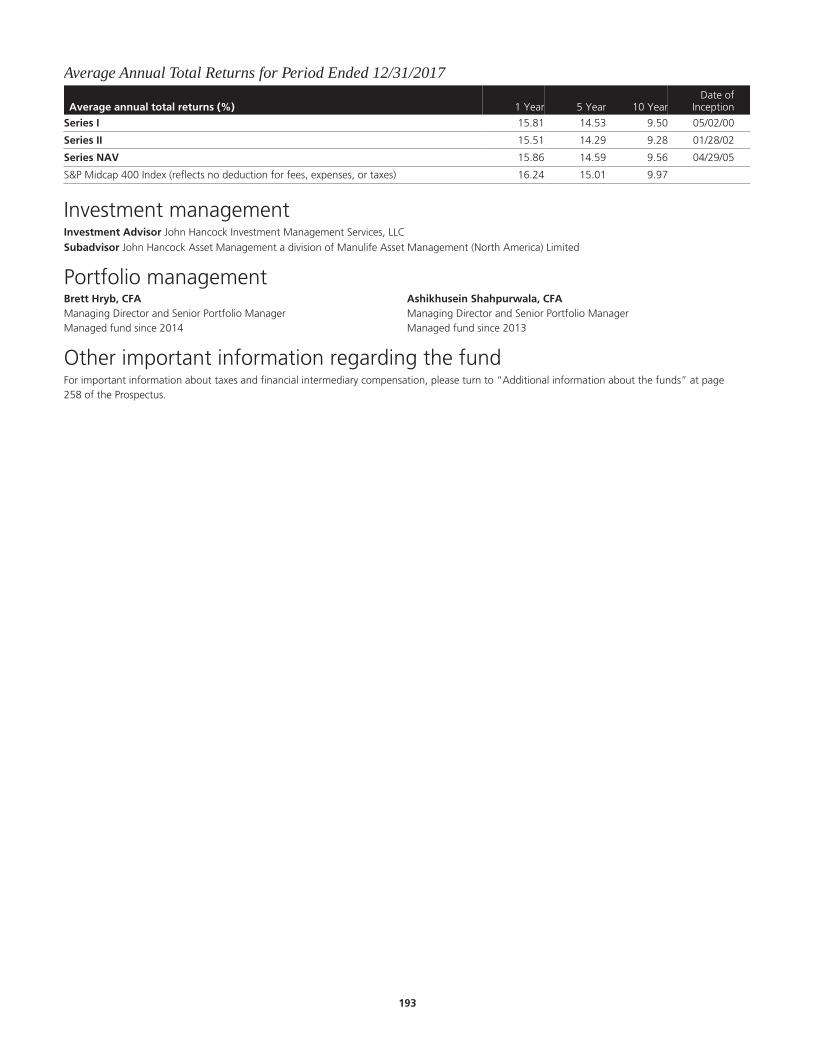
Average Annual Total Returns for Period Ended 12/31/2017
Average annual total returns (%) 1 Year 5 Year 10 YearDate of
Inception
Series I 15.81 14.53 9.50 05/02/00
Series II 15.51 14.29 9.28 01/28/02
Series NAV 15.86 14.59 9.56 04/29/05
S&P Midcap 400 Index (reflects no deduction for fees, expenses, or taxes) 16.24 15.01 9.97
Investment managementInvestment Advisor John Hancock Investment Management Services, LLC§
Subadvisor John Hancock Asset Management a division of Manulife Asset Management (North America) Limited
Portfolio managementBrett Hryb, CFAManaging Director and Senior Portfolio ManagerManaged fund since 2014
Ashikhusein Shahpurwala, CFAManaging Director and Senior Portfolio ManagerManaged fund since 2013
Other important information regarding the fundFor important information about taxes and financial intermediary compensation, please turn to “Additional information about the funds” at page258 of the Prospectus.
.193
Mid Cap Stock Trust Investment objectiveTo seek long-term growth of capital.
Fees and expensesThis table describes the fees and expenses that you may pay if you buy and hold shares of the fund. The fees and expenses do not reflect fees andexpenses of any variable insurance contract that may use the fund as its underlying investment option and would be higher if they did.
Annual fund operating expenses (%) (expenses that you pay each year as a percentage of the valueof your investment) Series I Series II Series NAV
Management fee 0.83 0.83 0.83
Distribution and service (Rule 12b-1) fees 0.05 0.25 0.00
Other expenses 0.05 0.05 0.05
Total annual fund operating expenses 0.93 1.13 0.88
Expense exampleThe examples are intended to help you compare the cost of investing in the fund with the cost of investing in other mutual funds. The examplesassume that $10,000 is invested in the fund for the periods indicated and then all shares are redeemed at the end of those periods. The examples alsoassume that the investment has a 5% return each year and that the fund’s operating expenses remain the same. The expense example does not reflectfees and expenses of any variable insurance contract that may use the fund as its underlying investment option and would be higher if they did.Although your actual costs may be higher or lower, based on these assumptions your costs would be:
Expenses ($) Series I Series II Series NAV
1 year 95 115 90
3 years 296 359 281
5 years 515 622 488
10 years 1,143 1,375 1,084
Portfolio turnoverThe fund pays transaction costs, such as commissions, when it buys and sells securities (or “turns over” its portfolio). A higher portfolio turnover ratemay indicate higher transaction costs. These costs, which are not reflected in annual fund operating expenses or in the example, affect the fund’sperformance. During its most recent fiscal year, the fund’s portfolio turnover rate was 71% of the average value of its portfolio.
Principal investment strategiesUnder normal market conditions, the fund invests at least 80% of its net assets (plus any borrowings for investment purposes) in equity securities ofmedium-sized companies with significant capital appreciation potential. For the fund, “medium-sized companies” are those with market capitalizationswithin the collective market capitalization range of companies represented in either the Russell Midcap Index ($889.4 million to $40.8 billion as ofFebruary 28, 2018) or the S&P Midcap 400 Index ($790 million to $13.1 billion as of February 28, 2018).
The subadvisor’s investment approach is based primarily on proprietary fundamental analysis. Fundamental analysis involves the assessment of acompany through such factors as its business environment, management, balance sheet, income statement, anticipated earnings, revenues and otherrelated measures of value. In analyzing companies for investment, the subadvisor looks for, among other things, a strong balance sheet, strongearnings growth, attractive industry dynamics, strong competitive advantages (e.g., strong management teams), and attractive relative value within thecontext of a security’s primary trading market. Securities are sold when the investment has achieved its intended purpose, or because it is no longerconsidered attractive. The fund may invest up to 25% of its total assets in foreign securities, including emerging market securities.
The fund’s investment process may, at times, result in a higher than average portfolio turnover ratio and increased trading expenses.
Principal risksThe fund is subject to risks, and you could lose money by investing in the fund. The principal risks of investing in the fund include:
Cybersecurity and operational risk. Cybersecurity breaches may allow an unauthorized party to gain access to fund assets, customer data, orproprietary information, or cause a fund or its service providers to suffer data corruption or lose operational functionality. Similar incidents affectingissuers of a fund’s securities may negatively impact performance. Operational risk may arise from human error, error by third parties, communicationerrors, or technology failures, among other causes.
Economic and market events risk. Events in the U.S. and global financial markets, including actions taken by the U.S. Federal Reserve or foreigncentral banks to stimulate or stabilize economic growth, may at times result in unusually high market volatility, which could negatively impact
.194

performance. Reduced liquidity in credit and fixed-income markets could adversely affect issuers worldwide. Banks and financial services companiescould suffer losses if interest rates rise or economic conditions deteriorate.
Equity securities risk. The price of equity securities may decline due to changes in a company’s financial condition or overall market conditions.
Foreign securities risk. Less information may be publicly available regarding foreign issuers. Foreign securities may be subject to foreign taxes andmay be more volatile than U.S. securities. Currency fluctuations and political and economic developments may adversely impact the value of foreignsecurities. The risks of investing in foreign securities are magnified in emerging markets.
High portfolio turnover risk. Trading securities actively and frequently can increase transaction costs (thus lowering performance) and taxabledistributions.
Information technology risk. Information technology companies can be significantly affected by rapid obsolescence, short product cycles,competition, and government regulation, among other factors.
Liquidity risk. The extent (if at all) to which a security may be sold or a derivative position closed without negatively impacting its market value may beimpaired by reduced market activity or participation, legal restrictions, or other economic and market impediments.
Privately held and newly public companies risk. Investments in the stocks of privately held companies and newly public companies involve greaterrisks than investments in stocks of companies that have traded publicly on an exchange for extended time periods. Investments in such companies areless liquid and may be difficult to value. There may be significantly less information available about these companies’ business models, quality ofmanagement, earnings growth potential, and other criteria used to evaluate their investment prospects. The extent (if at all) to which securities ofprivately held companies or newly public companies may be sold without negatively impacting its market value may be impaired by reduced marketactivity or participation, legal restrictions, or other economic and market impediments. Funds with principal investment strategies that involveinvestments in securities of privately held companies tend to have a greater exposure to liquidity risk than funds that do not invest in securities ofprivately held companies.
Sector risk. When a fund focuses its investments in certain sectors of the economy, its performance may be driven largely by sector performance andcould fluctuate more widely than if the fund were invested more evenly across sectors.
Small and mid-sized company risk. Small and mid-sized companies are generally less established and may be more volatile than larger companies.Small and/or mid-capitalization securities may underperform the market as a whole.
Past performanceThe following information provides some indication of the risks of investing in the fund by showing changes in performance from year to year and byshowing how average annual returns for specified periods compare with those of a broad measure of market performance. The performanceinformation below does not reflect fees and expenses of any variable insurance contract which may use JHVIT as its underlying investment option. Ifsuch fees and expenses had been reflected, performance would be lower. The past performance of the fund is not necessarily an indication of how thefund will perform in the future.
Calendar year total returns for Series I (%)
2008 2009 2010 2011 2012 2013 2014 2015 2016 2017
–43.76 31.35 23.08 –9.20 22.21 36.82 8.02 3.00 0.59 28.54
Best quarter: Q3 ‘09, 20.00%
Worst quarter: Q4 ‘08, –25.36%
Average Annual Total Returns for Period Ended 12/31/2017
Average annual total returns (%) 1 Year 5 Year 10 YearDate of
Inception
Series I 28.54 14.50 7.10 05/03/99
Series II 28.26 14.26 6.88 01/28/02
Series NAV 28.66 14.55 7.15 02/28/05
Russell Midcap Growth Index (reflects no deduction for fees, expenses, or taxes) 25.27 15.30 9.10
.195

Investment managementInvestment Advisor John Hancock Investment Management Services, LLC§
Subadvisor Wellington Management Company LLP
Portfolio managementMario E. Abularach, CFASenior Managing Director and Equity ResearchAnalystManaged fund since 2006
Michael T. Carmen, CFASenior Managing Director and Equity PortfolioManagerManaged fund since 1999
Stephen MortimerSenior Managing Director and Equity PortfolioManagerManaged fund since 2010
Other important information regarding the fundFor important information about taxes and financial intermediary compensation, please turn to “Additional information about the funds” at page258 of the Prospectus.
.196
Mid Value Trust Investment objectiveTo seek long-term capital appreciation.
Fees and expensesThis table describes the fees and expenses that you may pay if you buy and hold shares of the fund. The fees and expenses do not reflect fees andexpenses of any variable insurance contract that may use the fund as its underlying investment option and would be higher if they did.
Annual fund operating expenses (%) (expenses that you pay each year as a percentage of the valueof your investment) Series I Series II Series NAV
Management fee 0.95 0.95 0.95
Distribution and service (Rule 12b-1) fees 0.05 0.25 0.00
Other expenses 0.04 0.04 0.04
Total annual fund operating expenses 1.04 1.24 0.99
Expense exampleThe examples are intended to help you compare the cost of investing in the fund with the cost of investing in other mutual funds. The examplesassume that $10,000 is invested in the fund for the periods indicated and then all shares are redeemed at the end of those periods. The examples alsoassume that the investment has a 5% return each year and that the fund’s operating expenses remain the same. The expense example does not reflectfees and expenses of any variable insurance contract that may use the fund as its underlying investment option and would be higher if they did.Although your actual costs may be higher or lower, based on these assumptions your costs would be:
Expenses ($) Series I Series II Series NAV
1 year 106 126 101
3 years 331 393 315
5 years 574 681 547
10 years 1,271 1,500 1,213
Portfolio turnoverThe fund pays transaction costs, such as commissions, when it buys and sells securities (or “turns over” its portfolio). A higher portfolio turnover ratemay indicate higher transaction costs. These costs, which are not reflected in annual fund operating expenses or in the example, affect the fund’sperformance. During its most recent fiscal year, the fund’s portfolio turnover rate was 32% of the average value of its portfolio.
Principal investment strategiesUnder normal market conditions, the fund invests at least 80% of its net assets (plus any borrowings for investment purposes) in companies withmarket capitalizations that are within the Russell Midcap Value Index ($889.4 million to $40.8 billion as of February 28, 2018). The fund invests in adiversified mix of common stocks of mid-size U.S. companies that are believed to be undervalued by various measures and offer good prospects forcapital appreciation.
The subadvisor employs a value approach in selecting investments. The subadvisor’s in-house research team seeks to identify companies whose stockprices do not appear to reflect their underlying values. The subadvisor generally looks for companies with one or more of the following characteristics:
Low stock prices relative to net assets, earnings, cash flow, sales, book value, or private market value;
Demonstrated or potentially attractive operating margins, profits and/or cash flow;
Sound balance sheets;
Stock ownership by management/employees; or
Experienced and capable management.
The fund’s sector exposure is broadly diversified as a result of stock selection and therefore may vary significantly from its benchmark, the RussellMidcap Value Index. The market capitalization of companies held by the fund and included in the index changes over time. The fund will notautomatically sell or cease to purchase stock of a company it already owns just because the company’s market capitalization grows or falls outsidethese ranges.
The fund may sell securities for a variety of reasons, such as to secure gains, limit losses, or redeploy assets into more promising opportunities.
In pursuing the fund’s investment objective, the subadvisor has the discretion to deviate from its normal investment criteria, as described above, andpurchase securities that the subadvisor believes will provide an opportunity for substantial appreciation. These situations might arise when thesubadvisor believes a security could increase in value for a variety of reasons, including a change in management, an extraordinary corporate event, anew product introduction or innovation or a favorable competitive development.
.197
The fund may invest in IPOs. While most assets will be invested in U.S. common stocks, the fund may purchase other types of securities, for example:convertible securities and warrants, foreign securities (up to 20% of total assets), certain exchange-traded funds (ETFs), and certain derivatives(investments whose value is based on indices or other securities). For purposes of the fund, ETFs are considered securities with a market capitalizationequal to the weighted average market capitalization of the basket of securities comprising the ETF.
The fund holds a certain portion of its assets in money market reserves, which can consist of shares of certain internal T. Rowe Price money marketfunds as well as U.S. dollar and foreign currency-denominated money market securities, including repurchase agreements, in the two highest ratingcategories, maturing in one year or less.
The fund may invest up to 10% of its total assets in hybrid instruments. Hybrid instruments are a type of high-risk derivative that can combine thecharacteristics of securities, futures and options. Such securities may bear interest or pay dividends at below (or even relatively nominal) rates.
Except when engaged in temporary defensive investing, the fund normally has less than 10% of its assets in cash and cash equivalents. The fund mayfocus its investments in a particular sector or sectors of the economy.
Principal risksThe fund is subject to risks, and you could lose money by investing in the fund. The principal risks of investing in the fund include:
Convertible securities risk. The market values of convertible securities tend to fall as interest rates rise and rise as interest rates fall. As the marketprice of underlying common stock declines below the conversion price, the market value of the convertible security tends to be increasingly influencedby its yield.
Credit and counterparty risk. The counterparty to an over-the-counter derivatives contract or a borrower of fund securities may not make timelypayments or otherwise honor its obligations.
Cybersecurity and operational risk. Cybersecurity breaches may allow an unauthorized party to gain access to fund assets, customer data, orproprietary information, or cause a fund or its service providers to suffer data corruption or lose operational functionality. Similar incidents affectingissuers of a fund’s securities may negatively impact performance. Operational risk may arise from human error, error by third parties, communicationerrors, or technology failures, among other causes.
Economic and market events risk. Events in the U.S. and global financial markets, including actions taken by the U.S. Federal Reserve or foreigncentral banks to stimulate or stabilize economic growth, may at times result in unusually high market volatility, which could negatively impactperformance. Reduced liquidity in credit and fixed-income markets could adversely affect issuers worldwide. Banks and financial services companiescould suffer losses if interest rates rise or economic conditions deteriorate.
Equity securities risk. The price of equity securities may decline due to changes in a company’s financial condition or overall market conditions.Securities the manager believes are undervalued may never realize their full potential value, and in certain markets value stocks may underperform themarket as a whole.
Exchange-traded funds risk. An ETF generally reflects the risks of the underlying securities it is designed to track. A fund bears ETF fees and expensesindirectly.
Financial services sector risk. Financial services companies can be significantly affected by economic, market, and business developments, borrowingcosts, interest-rate fluctuations, competition, and government regulation, among other factors.
Foreign securities risk. Less information may be publicly available regarding foreign issuers. Foreign securities may be subject to foreign taxes andmay be more volatile than U.S. securities. Currency fluctuations and political and economic developments may adversely impact the value of foreignsecurities. The risks of investing in foreign securities are magnified in emerging markets.
Hedging, derivatives, and other strategic transactions risk. Hedging, derivatives, and other strategic transactions may increase a fund’s volatilityand could produce disproportionate losses, potentially more than the fund’s principal investment. Risks of these transactions are different from andpossibly greater than risks of investing directly in securities and other traditional instruments. Under certain market conditions, derivatives couldbecome harder to value or sell and may become subject to liquidity risk (i.e., the inability to enter into closing transactions). Regulatory changes inderivative markets could impact the cost of or the fund’s ability to engage in derivative transactions. Derivatives and other strategic transactions thatthe fund intends to utilize include: futures contracts and options. Futures contracts and options generally are subject to counterparty risk.
Hybrid instrument risk. Hybrid instruments entail greater market risk and may be more volatile than traditional debt instruments, may bear interestor pay preferred dividends at below-market rates, and may be illiquid. The risks of investing in hybrid instruments are a combination of the risks ofinvesting in securities, options, futures, and currencies.
Initial public offerings risk. IPO share prices are frequently volatile and may significantly impact fund performance.
Investment company securities risk. A fund bears underlying fund fees and expenses indirectly.
Sector risk. When a fund focuses its investments in certain sectors of the economy, its performance may be driven largely by sector performance andcould fluctuate more widely than if the fund were invested more evenly across sectors.
Small and mid-sized company risk. Small and mid-sized companies are generally less established and may be more volatile than larger companies.Small and/or mid-capitalization securities may underperform the market as a whole.
Value investing style risk. The fund emphasizes a value style of investing, which focuses on undervalued companies with characteristics for improvedvaluations. This style of investing is subject to the risk that the valuations never improve or that the returns on value equity securities are less than
.198
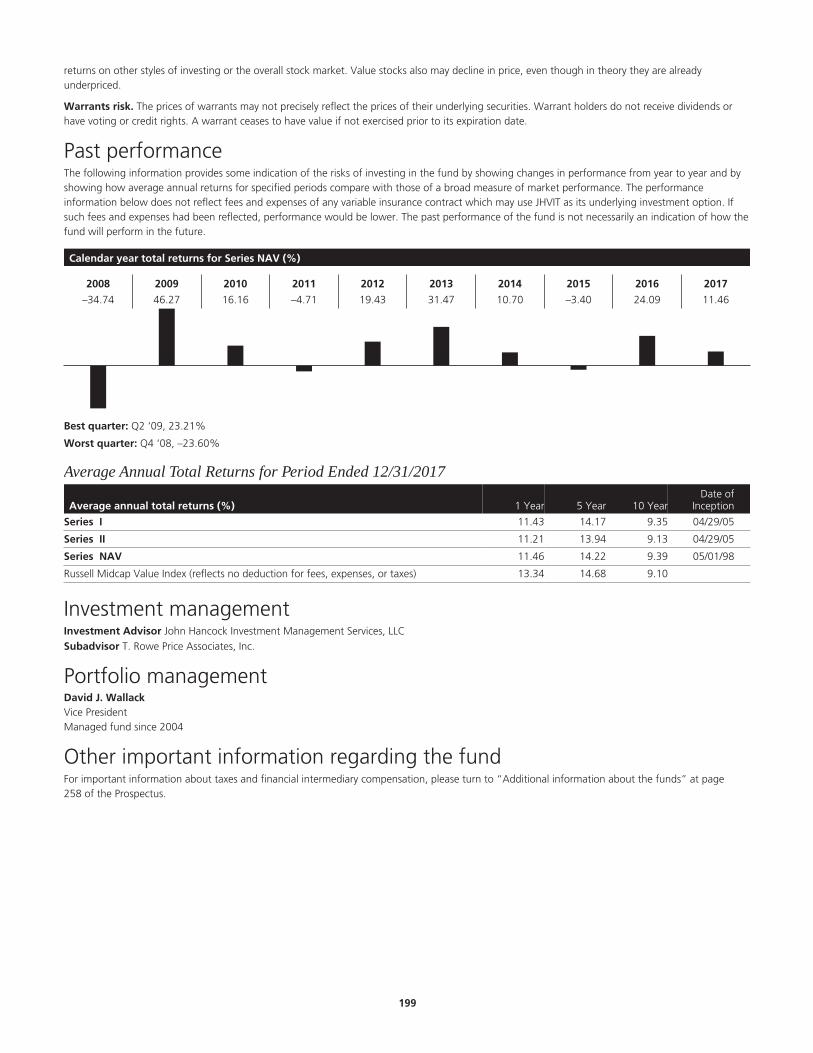
returns on other styles of investing or the overall stock market. Value stocks also may decline in price, even though in theory they are alreadyunderpriced.
Warrants risk. The prices of warrants may not precisely reflect the prices of their underlying securities. Warrant holders do not receive dividends orhave voting or credit rights. A warrant ceases to have value if not exercised prior to its expiration date.
Past performanceThe following information provides some indication of the risks of investing in the fund by showing changes in performance from year to year and byshowing how average annual returns for specified periods compare with those of a broad measure of market performance. The performanceinformation below does not reflect fees and expenses of any variable insurance contract which may use JHVIT as its underlying investment option. Ifsuch fees and expenses had been reflected, performance would be lower. The past performance of the fund is not necessarily an indication of how thefund will perform in the future.
Calendar year total returns for Series NAV (%)
2008 2009 2010 2011 2012 2013 2014 2015 2016 2017
–34.74 46.27 16.16 –4.71 19.43 31.47 10.70 –3.40 24.09 11.46
Best quarter: Q2 ‘09, 23.21%
Worst quarter: Q4 ‘08, –23.60%
Average Annual Total Returns for Period Ended 12/31/2017
Average annual total returns (%) 1 Year 5 Year 10 YearDate of
Inception
Series I 11.43 14.17 9.35 04/29/05
Series II 11.21 13.94 9.13 04/29/05
Series NAV 11.46 14.22 9.39 05/01/98
Russell Midcap Value Index (reflects no deduction for fees, expenses, or taxes) 13.34 14.68 9.10
Investment managementInvestment Advisor John Hancock Investment Management Services, LLC§
Subadvisor T. Rowe Price Associates, Inc.
Portfolio managementDavid J. WallackVice PresidentManaged fund since 2004
Other important information regarding the fundFor important information about taxes and financial intermediary compensation, please turn to “Additional information about the funds” at page258 of the Prospectus.
.199
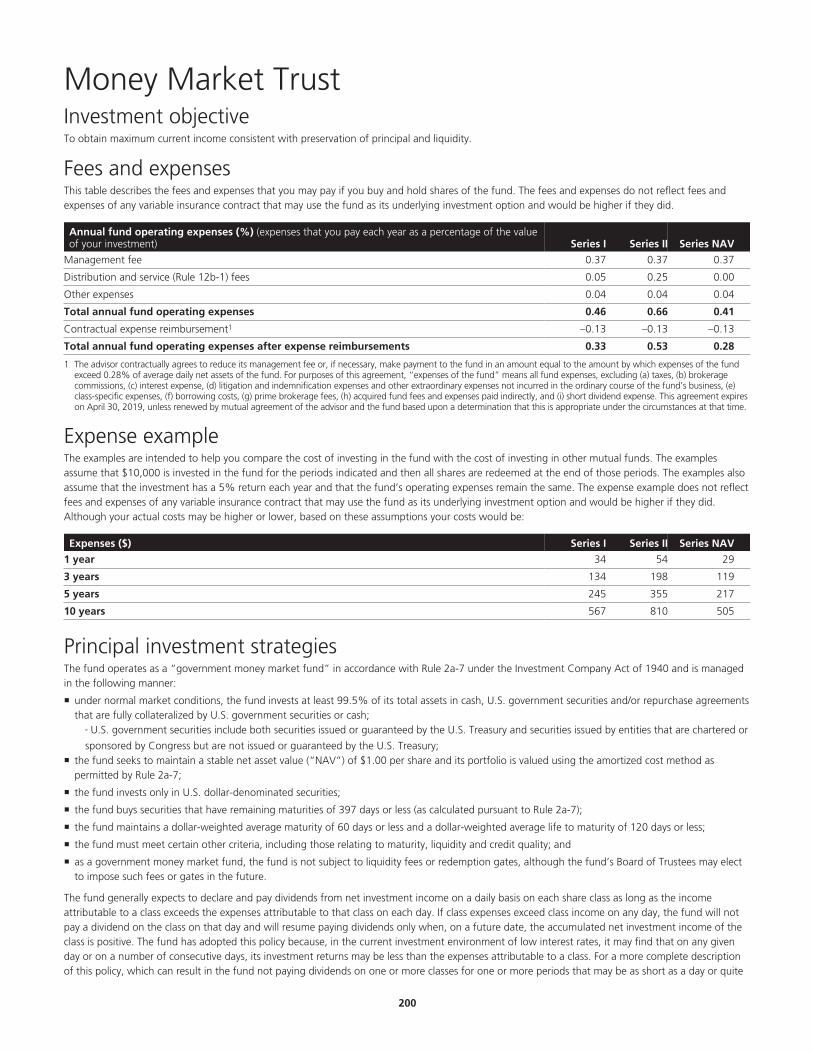
Money Market Trust Investment objectiveTo obtain maximum current income consistent with preservation of principal and liquidity.
Fees and expensesThis table describes the fees and expenses that you may pay if you buy and hold shares of the fund. The fees and expenses do not reflect fees andexpenses of any variable insurance contract that may use the fund as its underlying investment option and would be higher if they did.
Annual fund operating expenses (%) (expenses that you pay each year as a percentage of the valueof your investment) Series I Series II Series NAV
Management fee 0.37 0.37 0.37
Distribution and service (Rule 12b-1) fees 0.05 0.25 0.00
Other expenses 0.04 0.04 0.04
Total annual fund operating expenses 0.46 0.66 0.41
Contractual expense reimbursement1 –0.13 –0.13 –0.13
Total annual fund operating expenses after expense reimbursements 0.33 0.53 0.28
1 The advisor contractually agrees to reduce its management fee or, if necessary, make payment to the fund in an amount equal to the amount by which expenses of the fundexceed 0.28% of average daily net assets of the fund. For purposes of this agreement, “expenses of the fund” means all fund expenses, excluding (a) taxes, (b) brokeragecommissions, (c) interest expense, (d) litigation and indemnification expenses and other extraordinary expenses not incurred in the ordinary course of the fund’s business, (e)class-specific expenses, (f) borrowing costs, (g) prime brokerage fees, (h) acquired fund fees and expenses paid indirectly, and (i) short dividend expense. This agreement expireson April 30, 2019, unless renewed by mutual agreement of the advisor and the fund based upon a determination that this is appropriate under the circumstances at that time.
Expense exampleThe examples are intended to help you compare the cost of investing in the fund with the cost of investing in other mutual funds. The examplesassume that $10,000 is invested in the fund for the periods indicated and then all shares are redeemed at the end of those periods. The examples alsoassume that the investment has a 5% return each year and that the fund’s operating expenses remain the same. The expense example does not reflectfees and expenses of any variable insurance contract that may use the fund as its underlying investment option and would be higher if they did.Although your actual costs may be higher or lower, based on these assumptions your costs would be:
Expenses ($) Series I Series II Series NAV
1 year 34 54 29
3 years 134 198 119
5 years 245 355 217
10 years 567 810 505
Principal investment strategiesThe fund operates as a “government money market fund” in accordance with Rule 2a-7 under the Investment Company Act of 1940 and is managedin the following manner:
under normal market conditions, the fund invests at least 99.5% of its total assets in cash, U.S. government securities and/or repurchase agreementsthat are fully collateralized by U.S. government securities or cash;
° U.S. government securities include both securities issued or guaranteed by the U.S. Treasury and securities issued by entities that are chartered or
sponsored by Congress but are not issued or guaranteed by the U.S. Treasury; the fund seeks to maintain a stable net asset value (“NAV”) of $1.00 per share and its portfolio is valued using the amortized cost method as
permitted by Rule 2a-7;
the fund invests only in U.S. dollar-denominated securities;
the fund buys securities that have remaining maturities of 397 days or less (as calculated pursuant to Rule 2a-7);
the fund maintains a dollar-weighted average maturity of 60 days or less and a dollar-weighted average life to maturity of 120 days or less;
the fund must meet certain other criteria, including those relating to maturity, liquidity and credit quality; and
as a government money market fund, the fund is not subject to liquidity fees or redemption gates, although the fund’s Board of Trustees may electto impose such fees or gates in the future.
The fund generally expects to declare and pay dividends from net investment income on a daily basis on each share class as long as the incomeattributable to a class exceeds the expenses attributable to that class on each day. If class expenses exceed class income on any day, the fund will notpay a dividend on the class on that day and will resume paying dividends only when, on a future date, the accumulated net investment income of theclass is positive. The fund has adopted this policy because, in the current investment environment of low interest rates, it may find that on any givenday or on a number of consecutive days, its investment returns may be less than the expenses attributable to a class. For a more complete descriptionof this policy, which can result in the fund not paying dividends on one or more classes for one or more periods that may be as short as a day or quite
.200

lengthy, see “General Information — Dividends” below. For a description of the allocation of expenses among fund share classes, see “MulticlassPricing; Rule 12b-1 Plans” in the prospectus.
Principal risksThe fund is subject to risks, and you could lose money by investing in the fund. Although the fund seeks to preserve the value of your investment at$1.00 per share, it cannot guarantee it will do so. An investment in the fund is not a bank deposit and is not insured or guaranteed by the FederalDeposit Insurance Corporation or any other government agency. The fund’s sponsor has no legal obligation to provide financial support to the fund,and you should not expect that the sponsor will provide financial support to the fund at any time.
The principal risks of investing in the fund include:
Changing distribution levels risk. The fund may cease or reduce the level of its distribution or make a greater return of capital if income ordividends paid from its investments declines.
Credit and counterparty risk. The issuer or guarantor of a fixed-income security or a borrower of fund securities may not make timely payments orotherwise honor its obligations. U.S. government securities are subject to varying degrees of credit risk depending upon the nature of their support. Adowngrade or default affecting any of the fund’s securities could affect the fund’s performance.
Cybersecurity and operational risk. Cybersecurity breaches may allow an unauthorized party to gain access to fund assets, customer data, orproprietary information, or cause a fund or its service providers to suffer data corruption or lose operational functionality. Similar incidents affectingissuers of a fund’s securities may negatively impact performance. Operational risk may arise from human error, error by third parties, communicationerrors, or technology failures, among other causes.
Economic and market events risk. Events in the U.S. and global financial markets, including actions taken by the U.S. Federal Reserve or foreigncentral banks to stimulate or stabilize economic growth, may at times result in unusually high market volatility, which could negatively impactperformance. Reduced liquidity in credit and fixed-income markets could adversely affect issuers worldwide. Banks and financial services companiescould suffer losses if interest rates rise or economic conditions deteriorate.
Fixed-income securities risk. A rise in interest rates typically causes bond prices to fall. The longer the average maturity or duration of the bonds heldby a fund, the more sensitive it will likely be to interest-rate fluctuations. An issuer may not make all interest payments or repay all or any of theprincipal borrowed. Changes in a security’s credit quality may adversely affect fund performance.
Liquidity risk. The extent (if at all) to which a security may be sold without negatively impacting its market value may be impaired by reduced marketactivity or participation, legal restrictions, or other economic and market impediments. Liquidity risk may be magnified in rising interest rateenvironments due to higher than normal redemption rates. Widespread selling of fixed-income securities to satisfy redemptions during periods ofreduced demand may adversely impact the price or salability of such securities. Periods of heavy redemption could cause the fund to sell assets at a lossor depressed value, which could negatively affect performance. Redemption risk is heightened during periods of declining or illiquid markets.
Redemption risk. The fund may experience periods of heavy redemptions that could cause it to liquidate its assets at inopportune times or at a loss ordepressed value, particularly during periods of declining or illiquid markets, and that could affect the fund’s ability to maintain a $1.00 share price.Redemption risk is greater to the extent that the fund has investors with large shareholdings, short investment horizons or unpredictable cash flowneeds. The redemption by one or more large shareholders of their holdings in the fund could cause the remaining shareholders in the fund to losemoney. In addition, the fund may suspend redemptions and liquidate the fund when permitted by applicable regulations.
Tax diversification risk. As described above, the fund operates as a “government money market fund” in accordance with Rule 2a-7 under theInvestment Company Act of 1940 (a “Government Fund”). Additionally, the fund intends to meet the diversification requirements that are applicableto insurance company separate accounts under Subchapter L of the Code (the “Diversification Requirements”). To satisfy the DiversificationRequirements applicable to variable annuity contracts, the value of the assets of the fund invested in securities issued by the United States governmentmust remain below specified thresholds. For these purposes, each United States government agency or instrumentality is treated as a separate issuer.
Operating as a Government Fund may make it difficult for the fund to meet the Diversification Requirements. This difficulty may be exacerbated by thepotential increase in demand for the types of securities in which each fund invests as a result of changes to the rules that govern SEC registered moneymarket funds. A failure to satisfy the Diversification Requirements could have significant adverse tax consequences for variable annuity contract ownerswhose contract values are determined by investment in the fund.
U.S. Government agency obligations risk. U.S. government-sponsored entities such as Federal National Mortgage Association (Fannie Mae), FederalHome Loan Mortgage Corporation (Freddie Mac) and the Federal Home Loan Banks, although chartered or sponsored by Congress, are not funded bycongressional appropriations and the debt securities that they issue are neither guaranteed nor issued by the U.S. government. Such debt securities aresubject to the risk of default on the payment of interest and/or principal, similar to the debt securities of private issuers. The maximum potential liabilityof the issuers of some U.S. government obligations may greatly exceed their current resources, including any legal right to support from the U.S.government. Although the U.S. government has provided financial support to Fannie Mae and Freddie Mac in the past, there can be no assurance thatit will support these or other government-sponsored entities in the future.
U.S. Treasury obligations risk. The market value of direct obligations of the U.S. Treasury may vary due to changes in interest rates. In addition,changes to the financial condition or credit rating of the U.S. government may cause the value of the fund’s investments in obligations issued by theU.S. Treasury to decline.
.201
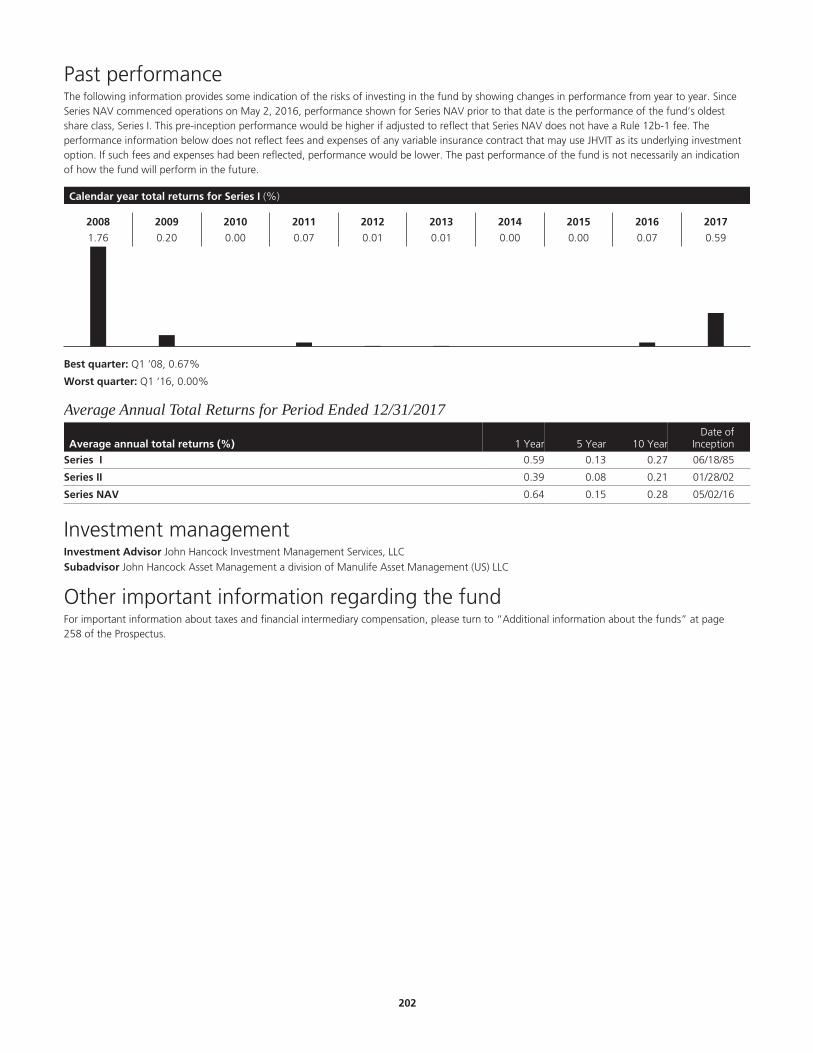
Past performanceThe following information provides some indication of the risks of investing in the fund by showing changes in performance from year to year. SinceSeries NAV commenced operations on May 2, 2016, performance shown for Series NAV prior to that date is the performance of the fund’s oldestshare class, Series I. This pre-inception performance would be higher if adjusted to reflect that Series NAV does not have a Rule 12b-1 fee. Theperformance information below does not reflect fees and expenses of any variable insurance contract that may use JHVIT as its underlying investmentoption. If such fees and expenses had been reflected, performance would be lower. The past performance of the fund is not necessarily an indicationof how the fund will perform in the future.
Calendar year total returns for Series I (%)
2008 2009 2010 2011 2012 2013 2014 2015 2016 2017
1.76 0.20 0.00 0.07 0.01 0.01 0.00 0.00 0.07 0.59
Best quarter: Q1 ‘08, 0.67%
Worst quarter: Q1 ‘16, 0.00%
Average Annual Total Returns for Period Ended 12/31/2017
Average annual total returns (%) 1 Year 5 Year 10 YearDate of
Inception
Series I 0.59 0.13 0.27 06/18/85
Series II 0.39 0.08 0.21 01/28/02
Series NAV 0.64 0.15 0.28 05/02/16
Investment managementInvestment Advisor John Hancock Investment Management Services, LLC§
Subadvisor John Hancock Asset Management a division of Manulife Asset Management (US) LLC
Other important information regarding the fundFor important information about taxes and financial intermediary compensation, please turn to “Additional information about the funds” at page258 of the Prospectus.
.202
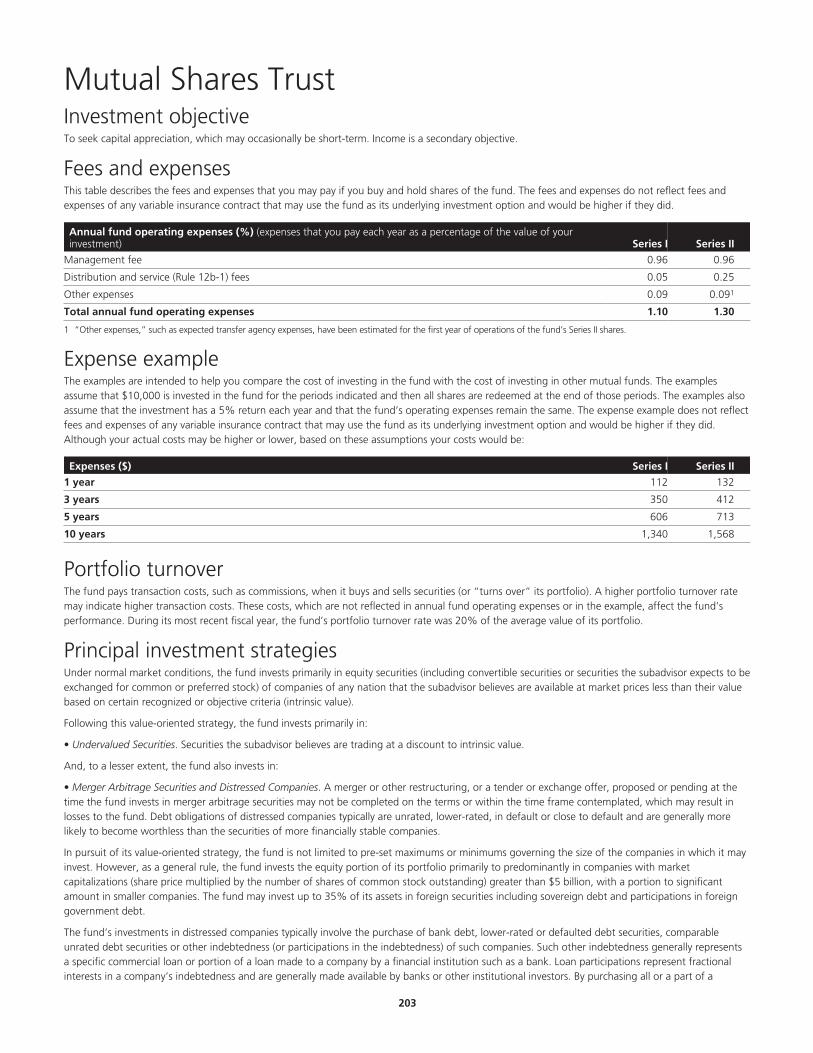
Mutual Shares Trust Investment objectiveTo seek capital appreciation, which may occasionally be short-term. Income is a secondary objective.
Fees and expensesThis table describes the fees and expenses that you may pay if you buy and hold shares of the fund. The fees and expenses do not reflect fees andexpenses of any variable insurance contract that may use the fund as its underlying investment option and would be higher if they did.
Annual fund operating expenses (%) (expenses that you pay each year as a percentage of the value of yourinvestment) Series I Series II
Management fee 0.96 0.96
Distribution and service (Rule 12b-1) fees 0.05 0.25
Other expenses 0.09 0.091
Total annual fund operating expenses 1.10 1.30
1 “Other expenses,” such as expected transfer agency expenses, have been estimated for the first year of operations of the fund’s Series II shares.
Expense exampleThe examples are intended to help you compare the cost of investing in the fund with the cost of investing in other mutual funds. The examplesassume that $10,000 is invested in the fund for the periods indicated and then all shares are redeemed at the end of those periods. The examples alsoassume that the investment has a 5% return each year and that the fund’s operating expenses remain the same. The expense example does not reflectfees and expenses of any variable insurance contract that may use the fund as its underlying investment option and would be higher if they did.Although your actual costs may be higher or lower, based on these assumptions your costs would be:
Expenses ($) Series I Series II
1 year 112 132
3 years 350 412
5 years 606 713
10 years 1,340 1,568
Portfolio turnoverThe fund pays transaction costs, such as commissions, when it buys and sells securities (or “turns over” its portfolio). A higher portfolio turnover ratemay indicate higher transaction costs. These costs, which are not reflected in annual fund operating expenses or in the example, affect the fund’sperformance. During its most recent fiscal year, the fund’s portfolio turnover rate was 20% of the average value of its portfolio.
Principal investment strategiesUnder normal market conditions, the fund invests primarily in equity securities (including convertible securities or securities the subadvisor expects to beexchanged for common or preferred stock) of companies of any nation that the subadvisor believes are available at market prices less than their valuebased on certain recognized or objective criteria (intrinsic value).
Following this value-oriented strategy, the fund invests primarily in:
• Undervalued Securities. Securities the subadvisor believes are trading at a discount to intrinsic value.
And, to a lesser extent, the fund also invests in:
• Merger Arbitrage Securities and Distressed Companies. A merger or other restructuring, or a tender or exchange offer, proposed or pending at thetime the fund invests in merger arbitrage securities may not be completed on the terms or within the time frame contemplated, which may result inlosses to the fund. Debt obligations of distressed companies typically are unrated, lower-rated, in default or close to default and are generally morelikely to become worthless than the securities of more financially stable companies.
In pursuit of its value-oriented strategy, the fund is not limited to pre-set maximums or minimums governing the size of the companies in which it mayinvest. However, as a general rule, the fund invests the equity portion of its portfolio primarily to predominantly in companies with marketcapitalizations (share price multiplied by the number of shares of common stock outstanding) greater than $5 billion, with a portion to significantamount in smaller companies. The fund may invest up to 35% of its assets in foreign securities including sovereign debt and participations in foreigngovernment debt.
The fund’s investments in distressed companies typically involve the purchase of bank debt, lower-rated or defaulted debt securities, comparableunrated debt securities or other indebtedness (or participations in the indebtedness) of such companies. Such other indebtedness generally representsa specific commercial loan or portion of a loan made to a company by a financial institution such as a bank. Loan participations represent fractionalinterests in a company’s indebtedness and are generally made available by banks or other institutional investors. By purchasing all or a part of a
.203

company’s direct indebtedness, the fund, in effect, steps into the shoes of the lender. If the loan is secured, the fund will have a priority claim to theassets of the company ahead of unsecured creditors and stockholders. Some loans may be illiquid. The fund generally makes such investments toachieve capital appreciation rather than to seek income. The fund may also engage from time to time in an “arbitrage” strategy. When engaging in anarbitrage strategy, a fund typically buys one security while at the same time selling short another security. Such fund generally buys the security thatthe manager believes is either cheap relative to the price of the other security or otherwise undervalued, and sell short the security that the managerbelieves is either expensive relative to the price of the other security or otherwise overvalued. In doing so, a fund attempts to profit from a perceivedrelationship between the values of the two securities. The fund generally engages in an arbitrage strategy in connection with an announced corporaterestructuring, such as a merger, acquisition or tender offer, or other corporate action or event.
The fund regularly attempts to hedge (protect) against currency risks using currency forward contracts when, in the investment manager’s opinion, itwould be advantageous to the fund to do so. The fund may also, from time to time, attempt to hedge against market risk using a variety of derivativesincluding put and call options on equity securities and swap agreements (which may include total return and credit default swaps). The use of thesederivative transactions may allow the fund to obtain net long or net negative (short) exposures to selected countries, currencies or issues.
The subadvisor employs a research driven, fundamental value strategy for the fund. In choosing equity investments, the subadvisor focuses on themarket price of a company’s securities relative to the subadvisor’s own evaluation of the company’s asset value, including an analysis of book value,cash flow potential, long-term earnings and multiples of earnings. Similarly, debt securities and other indebtedness, including loan participations, aregenerally selected based on the subadvisor’s own analysis of the security’s intrinsic value rather than the coupon rate or rating of the security. Thesubadvisor examines each investment separately and there are no set criteria as to specific value parameters, asset size, earnings or industry type.
Principal risksThe fund is subject to risks, and you could lose money by investing in the fund. The principal risks of investing in the fund include:
Arbitrage securities and distressed companies risk. A merger or other restructuring, tender offer, or exchange offer proposed or pending at thetime of investment in risk arbitrage securities may not be completed on the terms contemplated, resulting in losses.
Credit and counterparty risk. The issuer or guarantor of a fixed-income security, the counterparty to an over-the-counter derivatives contract, or aborrower of fund securities may not make timely payments or otherwise honor its obligations. A downgrade or default affecting any of the fund’ssecurities could affect the fund’s performance.
Cybersecurity and operational risk. Cybersecurity breaches may allow an unauthorized party to gain access to fund assets, customer data, orproprietary information, or cause a fund or its service providers to suffer data corruption or lose operational functionality. Similar incidents affectingissuers of a fund’s securities may negatively impact performance. Operational risk may arise from human error, error by third parties, communicationerrors, or technology failures, among other causes.
Distressed investments risk. Distressed investments, including loans, mortgages, bonds, and notes, may not be publicly traded and may involvesubstantial risk. A fund may lose up to its entire investment.
Economic and market events risk. Events in the U.S. and global financial markets, including actions taken by the U.S. Federal Reserve or foreigncentral banks to stimulate or stabilize economic growth, may at times result in unusually high market volatility, which could negatively impactperformance. Reduced liquidity in credit and fixed-income markets could adversely affect issuers worldwide. Banks and financial services companiescould suffer losses if interest rates rise or economic conditions deteriorate.
Equity securities risk. The price of equity securities may decline due to changes in a company’s financial condition or overall market conditions.Securities the manager believes are undervalued may never realize their full potential value, and in certain markets value stocks may underperform themarket as a whole.
Fixed-income securities risk. A rise in interest rates typically causes bond prices to fall. The longer the average maturity or duration of the bonds heldby a fund, the more sensitive it will likely be to interest-rate fluctuations. An issuer may not make all interest payments or repay all or any of theprincipal borrowed. Changes in a security’s credit quality may adversely affect fund performance.
Foreign securities risk. Less information may be publicly available regarding foreign issuers. Foreign securities may be subject to foreign taxes andmay be more volatile than U.S. securities. Currency fluctuations and political and economic developments may adversely impact the value of foreignsecurities. The risks of investing in foreign securities are magnified in emerging markets.
Hedging, derivatives, and other strategic transactions risk. Hedging, derivatives, and other strategic transactions may increase a fund’s volatilityand could produce disproportionate losses, potentially more than the fund’s principal investment. Risks of these transactions are different from andpossibly greater than risks of investing directly in securities and other traditional instruments. Under certain market conditions, derivatives couldbecome harder to value or sell and may become subject to liquidity risk (i.e., the inability to enter into closing transactions). Regulatory changes inderivative markets could impact the cost of or the fund’s ability to engage in derivative transactions. Derivatives and other strategic transactions thatthe fund intends to utilize include: foreign currency forward contracts, futures contracts, options, total return swaps, and credit default swaps. Foreigncurrency forward contracts, futures contracts, options, and swaps generally are subject to counterparty risk. In addition, swaps may be subject tointerest-rate and settlement risk, and the risk of default of the underlying reference obligation. Derivatives associated with foreign currencytransactions are subject to currency risk.
Large company risk. Larger companies may grow more slowly than smaller companies or be slower to respond to business developments. Large-capitalization securities may underperform the market as a whole.
.204
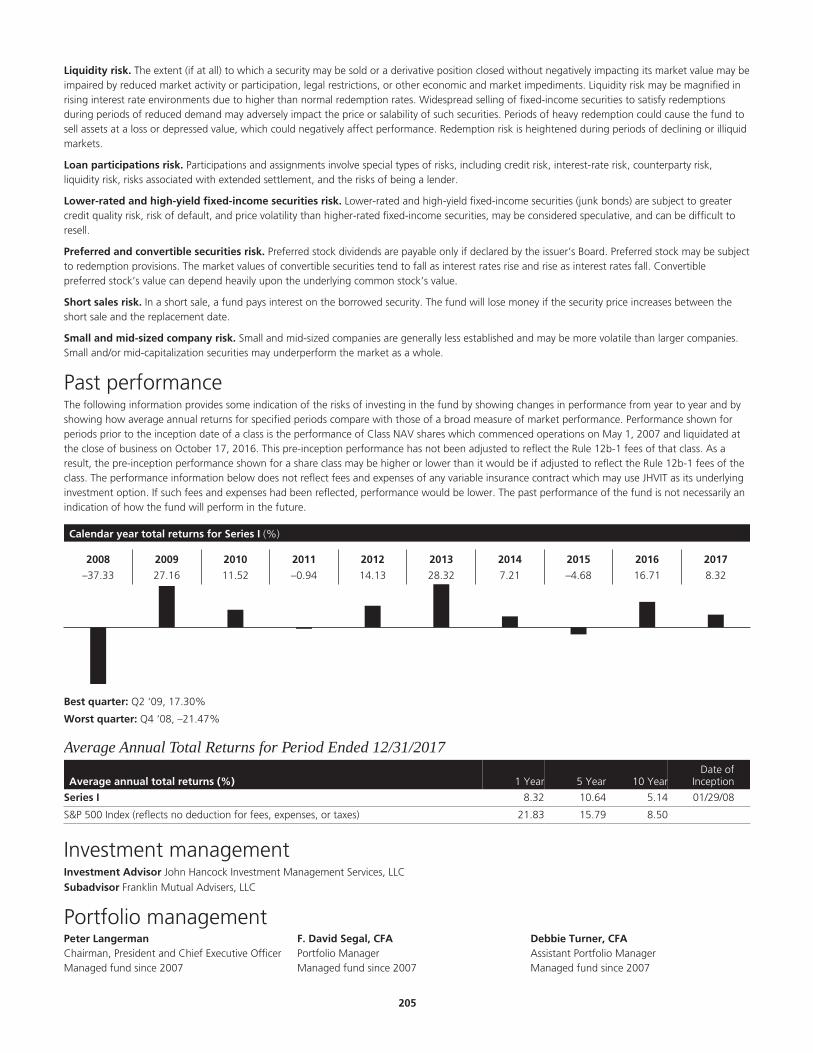
Liquidity risk. The extent (if at all) to which a security may be sold or a derivative position closed without negatively impacting its market value may beimpaired by reduced market activity or participation, legal restrictions, or other economic and market impediments. Liquidity risk may be magnified inrising interest rate environments due to higher than normal redemption rates. Widespread selling of fixed-income securities to satisfy redemptionsduring periods of reduced demand may adversely impact the price or salability of such securities. Periods of heavy redemption could cause the fund tosell assets at a loss or depressed value, which could negatively affect performance. Redemption risk is heightened during periods of declining or illiquidmarkets.
Loan participations risk. Participations and assignments involve special types of risks, including credit risk, interest-rate risk, counterparty risk,liquidity risk, risks associated with extended settlement, and the risks of being a lender.
Lower-rated and high-yield fixed-income securities risk. Lower-rated and high-yield fixed-income securities (junk bonds) are subject to greatercredit quality risk, risk of default, and price volatility than higher-rated fixed-income securities, may be considered speculative, and can be difficult toresell.
Preferred and convertible securities risk. Preferred stock dividends are payable only if declared by the issuer’s Board. Preferred stock may be subjectto redemption provisions. The market values of convertible securities tend to fall as interest rates rise and rise as interest rates fall. Convertiblepreferred stock’s value can depend heavily upon the underlying common stock’s value.
Short sales risk. In a short sale, a fund pays interest on the borrowed security. The fund will lose money if the security price increases between theshort sale and the replacement date.
Small and mid-sized company risk. Small and mid-sized companies are generally less established and may be more volatile than larger companies.Small and/or mid-capitalization securities may underperform the market as a whole.
Past performanceThe following information provides some indication of the risks of investing in the fund by showing changes in performance from year to year and byshowing how average annual returns for specified periods compare with those of a broad measure of market performance. Performance shown forperiods prior to the inception date of a class is the performance of Class NAV shares which commenced operations on May 1, 2007 and liquidated atthe close of business on October 17, 2016. This pre-inception performance has not been adjusted to reflect the Rule 12b-1 fees of that class. As aresult, the pre-inception performance shown for a share class may be higher or lower than it would be if adjusted to reflect the Rule 12b-1 fees of theclass. The performance information below does not reflect fees and expenses of any variable insurance contract which may use JHVIT as its underlyinginvestment option. If such fees and expenses had been reflected, performance would be lower. The past performance of the fund is not necessarily anindication of how the fund will perform in the future.
Calendar year total returns for Series I (%)
2008 2009 2010 2011 2012 2013 2014 2015 2016 2017
–37.33 27.16 11.52 –0.94 14.13 28.32 7.21 –4.68 16.71 8.32
Best quarter: Q2 ‘09, 17.30%
Worst quarter: Q4 ‘08, –21.47%
Average Annual Total Returns for Period Ended 12/31/2017
Average annual total returns (%) 1 Year 5 Year 10 YearDate of
Inception
Series I 8.32 10.64 5.14 01/29/08
S&P 500 Index (reflects no deduction for fees, expenses, or taxes) 21.83 15.79 8.50
Investment managementInvestment Advisor John Hancock Investment Management Services, LLC§
Subadvisor Franklin Mutual Advisers, LLC
Portfolio managementPeter LangermanChairman, President and Chief Executive OfficerManaged fund since 2007
F. David Segal, CFAPortfolio ManagerManaged fund since 2007
Debbie Turner, CFAAssistant Portfolio ManagerManaged fund since 2007
.205

Other important information regarding the fundFor important information about taxes and financial intermediary compensation, please turn to “Additional information about the funds” at page258 of the Prospectus.
.206
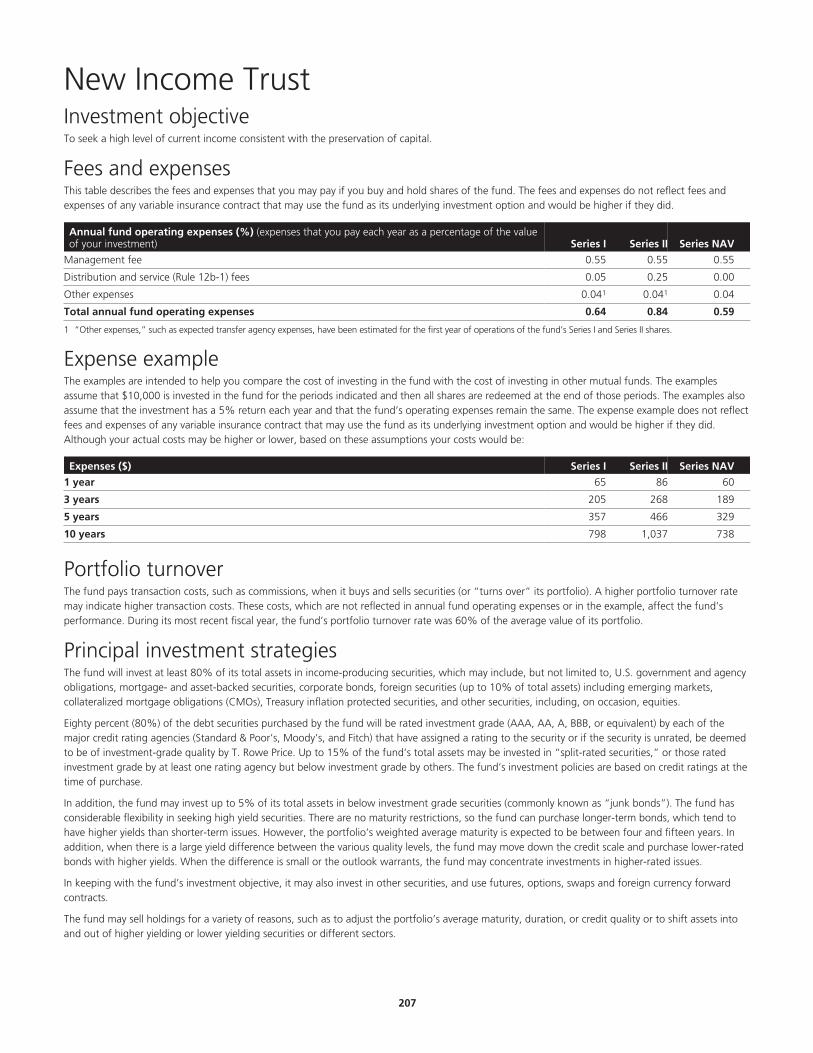
New Income Trust Investment objectiveTo seek a high level of current income consistent with the preservation of capital.
Fees and expensesThis table describes the fees and expenses that you may pay if you buy and hold shares of the fund. The fees and expenses do not reflect fees andexpenses of any variable insurance contract that may use the fund as its underlying investment option and would be higher if they did.
Annual fund operating expenses (%) (expenses that you pay each year as a percentage of the valueof your investment) Series I Series II Series NAV
Management fee 0.55 0.55 0.55
Distribution and service (Rule 12b-1) fees 0.05 0.25 0.00
Other expenses 0.041 0.041 0.04
Total annual fund operating expenses 0.64 0.84 0.59
1 “Other expenses,” such as expected transfer agency expenses, have been estimated for the first year of operations of the fund’s Series I and Series II shares.
Expense exampleThe examples are intended to help you compare the cost of investing in the fund with the cost of investing in other mutual funds. The examplesassume that $10,000 is invested in the fund for the periods indicated and then all shares are redeemed at the end of those periods. The examples alsoassume that the investment has a 5% return each year and that the fund’s operating expenses remain the same. The expense example does not reflectfees and expenses of any variable insurance contract that may use the fund as its underlying investment option and would be higher if they did.Although your actual costs may be higher or lower, based on these assumptions your costs would be:
Expenses ($) Series I Series II Series NAV
1 year 65 86 60
3 years 205 268 189
5 years 357 466 329
10 years 798 1,037 738
Portfolio turnoverThe fund pays transaction costs, such as commissions, when it buys and sells securities (or “turns over” its portfolio). A higher portfolio turnover ratemay indicate higher transaction costs. These costs, which are not reflected in annual fund operating expenses or in the example, affect the fund’sperformance. During its most recent fiscal year, the fund’s portfolio turnover rate was 60% of the average value of its portfolio.
Principal investment strategiesThe fund will invest at least 80% of its total assets in income-producing securities, which may include, but not limited to, U.S. government and agencyobligations, mortgage- and asset-backed securities, corporate bonds, foreign securities (up to 10% of total assets) including emerging markets,collateralized mortgage obligations (CMOs), Treasury inflation protected securities, and other securities, including, on occasion, equities.
Eighty percent (80%) of the debt securities purchased by the fund will be rated investment grade (AAA, AA, A, BBB, or equivalent) by each of themajor credit rating agencies (Standard & Poor’s, Moody’s, and Fitch) that have assigned a rating to the security or if the security is unrated, be deemedto be of investment-grade quality by T. Rowe Price. Up to 15% of the fund’s total assets may be invested in “split-rated securities,” or those ratedinvestment grade by at least one rating agency but below investment grade by others. The fund’s investment policies are based on credit ratings at thetime of purchase.
In addition, the fund may invest up to 5% of its total assets in below investment grade securities (commonly known as “junk bonds”). The fund hasconsiderable flexibility in seeking high yield securities. There are no maturity restrictions, so the fund can purchase longer-term bonds, which tend tohave higher yields than shorter-term issues. However, the portfolio’s weighted average maturity is expected to be between four and fifteen years. Inaddition, when there is a large yield difference between the various quality levels, the fund may move down the credit scale and purchase lower-ratedbonds with higher yields. When the difference is small or the outlook warrants, the fund may concentrate investments in higher-rated issues.
In keeping with the fund’s investment objective, it may also invest in other securities, and use futures, options, swaps and foreign currency forwardcontracts.
The fund may sell holdings for a variety of reasons, such as to adjust the portfolio’s average maturity, duration, or credit quality or to shift assets intoand out of higher yielding or lower yielding securities or different sectors.
.207
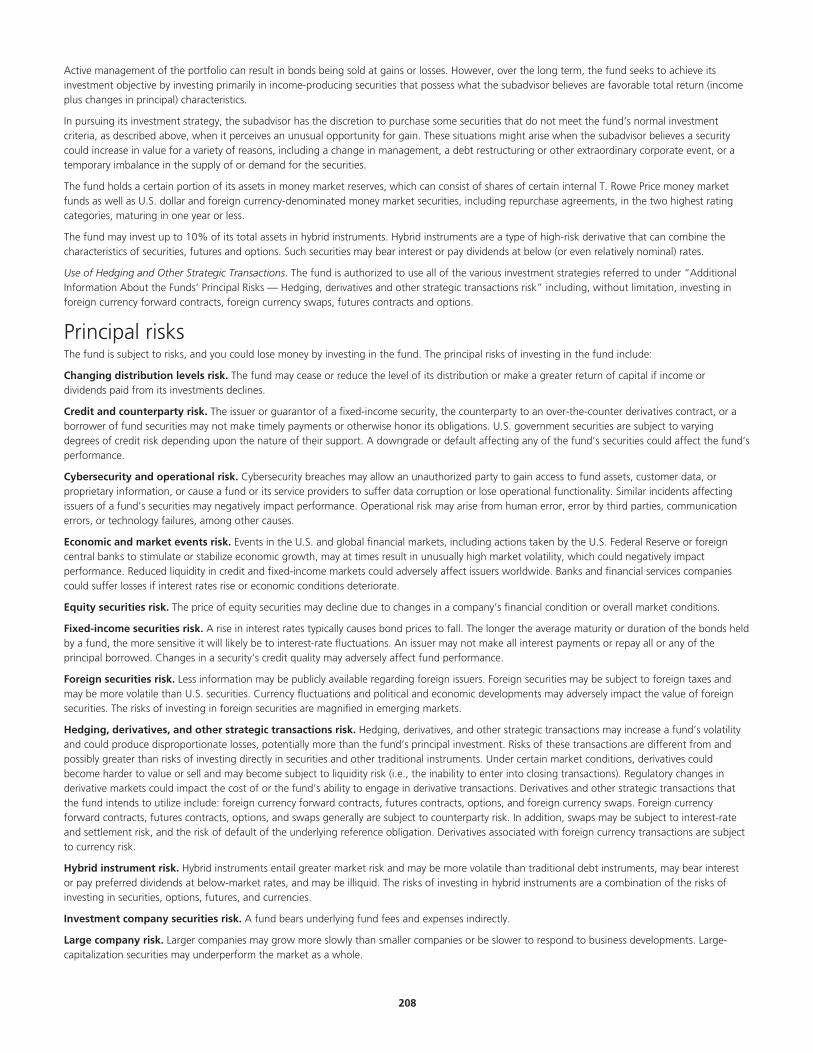
Active management of the portfolio can result in bonds being sold at gains or losses. However, over the long term, the fund seeks to achieve itsinvestment objective by investing primarily in income-producing securities that possess what the subadvisor believes are favorable total return (incomeplus changes in principal) characteristics.
In pursuing its investment strategy, the subadvisor has the discretion to purchase some securities that do not meet the fund’s normal investmentcriteria, as described above, when it perceives an unusual opportunity for gain. These situations might arise when the subadvisor believes a securitycould increase in value for a variety of reasons, including a change in management, a debt restructuring or other extraordinary corporate event, or atemporary imbalance in the supply of or demand for the securities.
The fund holds a certain portion of its assets in money market reserves, which can consist of shares of certain internal T. Rowe Price money marketfunds as well as U.S. dollar and foreign currency-denominated money market securities, including repurchase agreements, in the two highest ratingcategories, maturing in one year or less.
The fund may invest up to 10% of its total assets in hybrid instruments. Hybrid instruments are a type of high-risk derivative that can combine thecharacteristics of securities, futures and options. Such securities may bear interest or pay dividends at below (or even relatively nominal) rates.
Use of Hedging and Other Strategic Transactions. The fund is authorized to use all of the various investment strategies referred to under “AdditionalInformation About the Funds’ Principal Risks — Hedging, derivatives and other strategic transactions risk” including, without limitation, investing inforeign currency forward contracts, foreign currency swaps, futures contracts and options.
Principal risksThe fund is subject to risks, and you could lose money by investing in the fund. The principal risks of investing in the fund include:
Changing distribution levels risk. The fund may cease or reduce the level of its distribution or make a greater return of capital if income ordividends paid from its investments declines.
Credit and counterparty risk. The issuer or guarantor of a fixed-income security, the counterparty to an over-the-counter derivatives contract, or aborrower of fund securities may not make timely payments or otherwise honor its obligations. U.S. government securities are subject to varyingdegrees of credit risk depending upon the nature of their support. A downgrade or default affecting any of the fund’s securities could affect the fund’sperformance.
Cybersecurity and operational risk. Cybersecurity breaches may allow an unauthorized party to gain access to fund assets, customer data, orproprietary information, or cause a fund or its service providers to suffer data corruption or lose operational functionality. Similar incidents affectingissuers of a fund’s securities may negatively impact performance. Operational risk may arise from human error, error by third parties, communicationerrors, or technology failures, among other causes.
Economic and market events risk. Events in the U.S. and global financial markets, including actions taken by the U.S. Federal Reserve or foreigncentral banks to stimulate or stabilize economic growth, may at times result in unusually high market volatility, which could negatively impactperformance. Reduced liquidity in credit and fixed-income markets could adversely affect issuers worldwide. Banks and financial services companiescould suffer losses if interest rates rise or economic conditions deteriorate.
Equity securities risk. The price of equity securities may decline due to changes in a company’s financial condition or overall market conditions.
Fixed-income securities risk. A rise in interest rates typically causes bond prices to fall. The longer the average maturity or duration of the bonds heldby a fund, the more sensitive it will likely be to interest-rate fluctuations. An issuer may not make all interest payments or repay all or any of theprincipal borrowed. Changes in a security’s credit quality may adversely affect fund performance.
Foreign securities risk. Less information may be publicly available regarding foreign issuers. Foreign securities may be subject to foreign taxes andmay be more volatile than U.S. securities. Currency fluctuations and political and economic developments may adversely impact the value of foreignsecurities. The risks of investing in foreign securities are magnified in emerging markets.
Hedging, derivatives, and other strategic transactions risk. Hedging, derivatives, and other strategic transactions may increase a fund’s volatilityand could produce disproportionate losses, potentially more than the fund’s principal investment. Risks of these transactions are different from andpossibly greater than risks of investing directly in securities and other traditional instruments. Under certain market conditions, derivatives couldbecome harder to value or sell and may become subject to liquidity risk (i.e., the inability to enter into closing transactions). Regulatory changes inderivative markets could impact the cost of or the fund’s ability to engage in derivative transactions. Derivatives and other strategic transactions thatthe fund intends to utilize include: foreign currency forward contracts, futures contracts, options, and foreign currency swaps. Foreign currencyforward contracts, futures contracts, options, and swaps generally are subject to counterparty risk. In addition, swaps may be subject to interest-rateand settlement risk, and the risk of default of the underlying reference obligation. Derivatives associated with foreign currency transactions are subjectto currency risk.
Hybrid instrument risk. Hybrid instruments entail greater market risk and may be more volatile than traditional debt instruments, may bear interestor pay preferred dividends at below-market rates, and may be illiquid. The risks of investing in hybrid instruments are a combination of the risks ofinvesting in securities, options, futures, and currencies.
Investment company securities risk. A fund bears underlying fund fees and expenses indirectly.
Large company risk. Larger companies may grow more slowly than smaller companies or be slower to respond to business developments. Large-capitalization securities may underperform the market as a whole.
.208
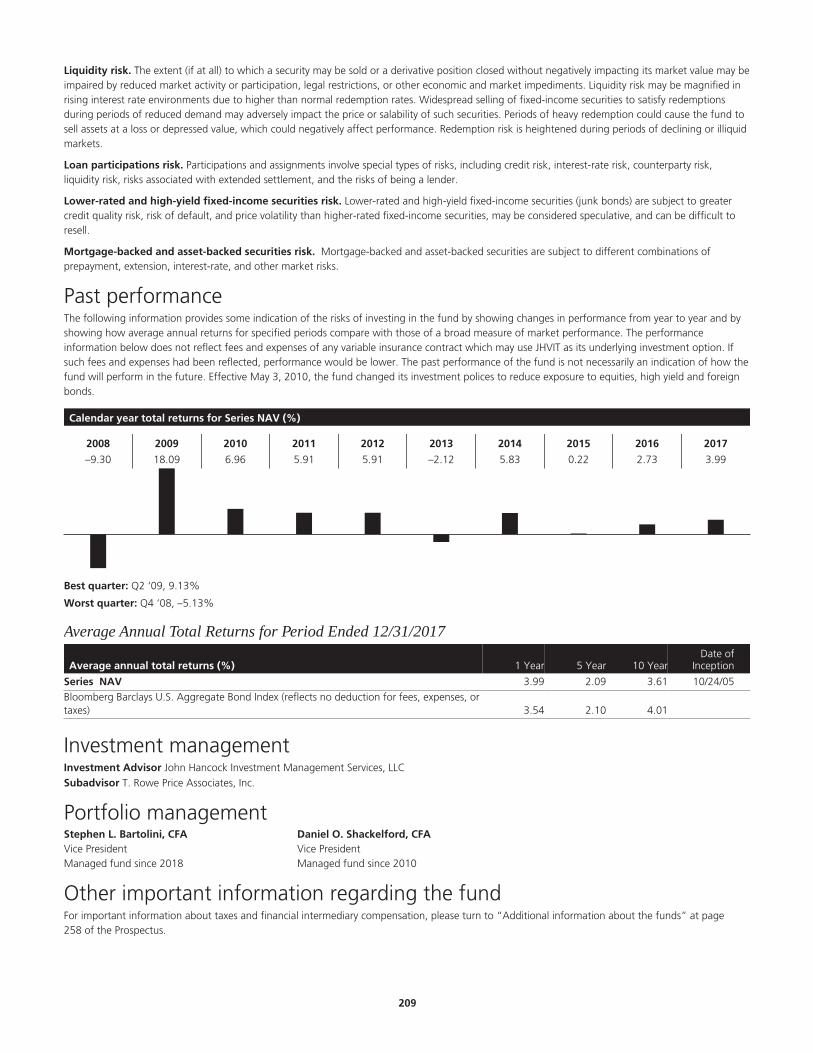
Liquidity risk. The extent (if at all) to which a security may be sold or a derivative position closed without negatively impacting its market value may beimpaired by reduced market activity or participation, legal restrictions, or other economic and market impediments. Liquidity risk may be magnified inrising interest rate environments due to higher than normal redemption rates. Widespread selling of fixed-income securities to satisfy redemptionsduring periods of reduced demand may adversely impact the price or salability of such securities. Periods of heavy redemption could cause the fund tosell assets at a loss or depressed value, which could negatively affect performance. Redemption risk is heightened during periods of declining or illiquidmarkets.
Loan participations risk. Participations and assignments involve special types of risks, including credit risk, interest-rate risk, counterparty risk,liquidity risk, risks associated with extended settlement, and the risks of being a lender.
Lower-rated and high-yield fixed-income securities risk. Lower-rated and high-yield fixed-income securities (junk bonds) are subject to greatercredit quality risk, risk of default, and price volatility than higher-rated fixed-income securities, may be considered speculative, and can be difficult toresell.
Mortgage-backed and asset-backed securities risk. Mortgage-backed and asset-backed securities are subject to different combinations ofprepayment, extension, interest-rate, and other market risks.
Past performanceThe following information provides some indication of the risks of investing in the fund by showing changes in performance from year to year and byshowing how average annual returns for specified periods compare with those of a broad measure of market performance. The performanceinformation below does not reflect fees and expenses of any variable insurance contract which may use JHVIT as its underlying investment option. Ifsuch fees and expenses had been reflected, performance would be lower. The past performance of the fund is not necessarily an indication of how thefund will perform in the future. Effective May 3, 2010, the fund changed its investment polices to reduce exposure to equities, high yield and foreignbonds.
Calendar year total returns for Series NAV (%)
2008 2009 2010 2011 2012 2013 2014 2015 2016 2017
–9.30 18.09 6.96 5.91 5.91 –2.12 5.83 0.22 2.73 3.99
Best quarter: Q2 ‘09, 9.13%
Worst quarter: Q4 ‘08, –5.13%
Average Annual Total Returns for Period Ended 12/31/2017
Average annual total returns (%) 1 Year 5 Year 10 YearDate of
Inception
Series NAV 3.99 2.09 3.61 10/24/05Bloomberg Barclays U.S. Aggregate Bond Index (reflects no deduction for fees, expenses, ortaxes) 3.54 2.10 4.01
Investment managementInvestment Advisor John Hancock Investment Management Services, LLC§
Subadvisor T. Rowe Price Associates, Inc.
Portfolio managementStephen L. Bartolini, CFAVice PresidentManaged fund since 2018
Daniel O. Shackelford, CFAVice PresidentManaged fund since 2010
Other important information regarding the fundFor important information about taxes and financial intermediary compensation, please turn to “Additional information about the funds” at page258 of the Prospectus.
.209

Real Estate Securities Trust Investment objectiveTo seek to achieve a combination of long-term capital appreciation and current income.
Fees and expensesThis table describes the fees and expenses that you may pay if you buy and hold shares of the fund. The fees and expenses do not reflect fees andexpenses of any variable insurance contract that may use the fund as its underlying investment option and would be higher if they did.
Annual fund operating expenses (%) (expenses that you pay each year as a percentage of the valueof your investment) Series I Series II Series NAV
Management fee 0.70 0.70 0.70
Distribution and service (Rule 12b-1) fees 0.05 0.25 0.00
Other expenses 0.06 0.06 0.06
Total annual fund operating expenses 0.81 1.01 0.76
Expense exampleThe examples are intended to help you compare the cost of investing in the fund with the cost of investing in other mutual funds. The examplesassume that $10,000 is invested in the fund for the periods indicated and then all shares are redeemed at the end of those periods. The examples alsoassume that the investment has a 5% return each year and that the fund’s operating expenses remain the same. The expense example does not reflectfees and expenses of any variable insurance contract that may use the fund as its underlying investment option and would be higher if they did.Although your actual costs may be higher or lower, based on these assumptions your costs would be:
Expenses ($) Series I Series II Series NAV
1 year 83 103 78
3 years 259 322 243
5 years 450 558 422
10 years 1,002 1,236 942
Portfolio turnoverThe fund pays transaction costs, such as commissions, when it buys and sells securities (or “turns over” its portfolio). A higher portfolio turnover ratemay indicate higher transaction costs. These costs, which are not reflected in annual fund operating expenses or in the example, affect the fund’sperformance. During its most recent fiscal year, the fund’s portfolio turnover rate was 166% of the average value of its portfolio.
Principal investment strategiesUnder normal market conditions, the fund invests at least 80% of its net assets (plus any borrowings for investment purposes) in equity securities ofreal estate investment trusts (“REITs”) and real estate companies. Equity securities include common stock, preferred stock and securities convertibleinto common stock.
A company is considered to be a real estate company if, in the opinion of the subadvisor, at least 50% of its revenues or 50% of the market value ofits assets at the time its securities are purchased by the fund are attributed to the ownership, construction, management or sale of real estate.
The subadvisor looks for real estate securities it believes will provide superior returns to the fund, and attempts to focus on companies with thepotential for stock price appreciation and a record of paying dividends.
To find these issuers, the subadvisor tracks economic conditions and real estate market performance in major metropolitan areas and analyzesperformance of various property types within those regions. To perform this analysis, it uses information from a nationwide network of real estateprofessionals to evaluate the holdings of real estate companies and REITs in which the fund may invest. Its analysis also considers the companies’management structure, financial structure and business strategy. The goal of these analyses is to determine which of the issuers the subadvisor believeswill be the most profitable to the fund. The subadvisor also considers the effect of the real estate securities markets in general when makinginvestment decisions. The subadvisor does not attempt to time the market.
A REIT invests primarily in income-producing real estate or makes loans to persons involved in the real estate industry.
Some REITs, called equity REITs, buy real estate and pay investors income from the rents received from the real estate owned by the REIT and from anyprofits on the sale of its properties. Other REITs, called mortgage REITs, lend money to building developers and other real estate companies and payinvestors income from the interest paid on those loans. There are also hybrid REITs which engage in both owning real estate and making loans.
If a REIT meets certain requirements, it is not taxed on the income it distributes to its investors.
.210
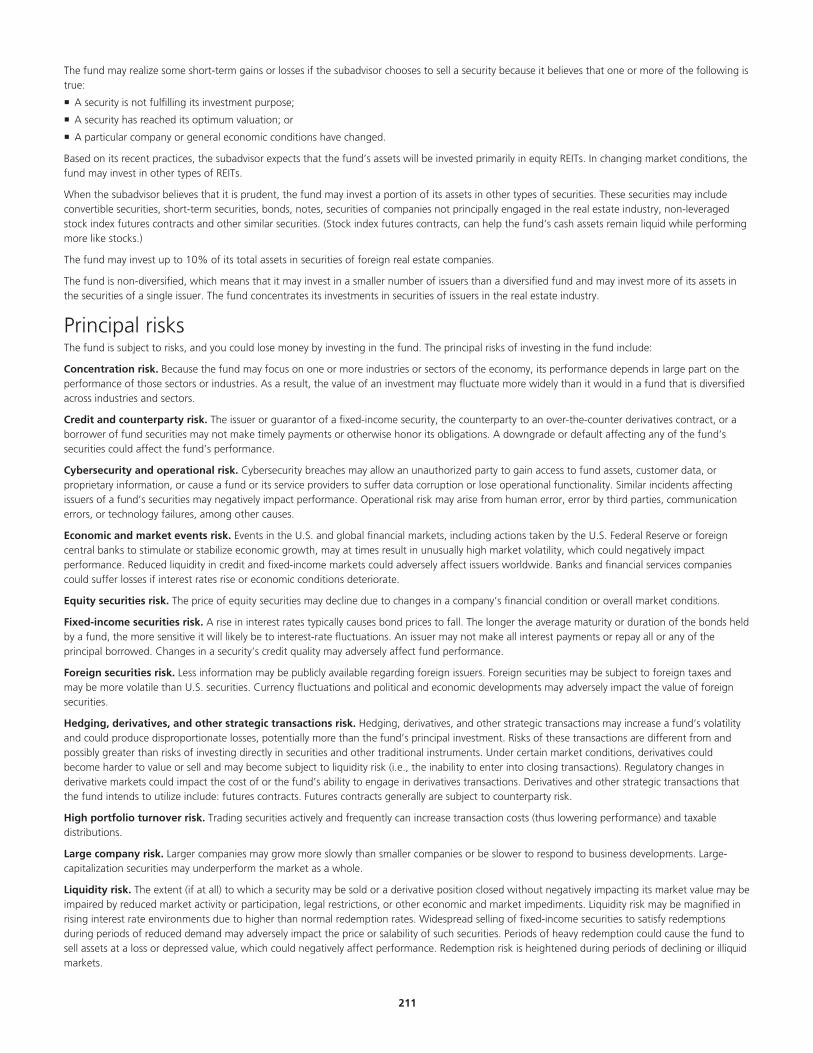
The fund may realize some short-term gains or losses if the subadvisor chooses to sell a security because it believes that one or more of the following istrue:
A security is not fulfilling its investment purpose;
A security has reached its optimum valuation; or
A particular company or general economic conditions have changed.
Based on its recent practices, the subadvisor expects that the fund’s assets will be invested primarily in equity REITs. In changing market conditions, thefund may invest in other types of REITs.
When the subadvisor believes that it is prudent, the fund may invest a portion of its assets in other types of securities. These securities may includeconvertible securities, short-term securities, bonds, notes, securities of companies not principally engaged in the real estate industry, non-leveragedstock index futures contracts and other similar securities. (Stock index futures contracts, can help the fund’s cash assets remain liquid while performingmore like stocks.)
The fund may invest up to 10% of its total assets in securities of foreign real estate companies.
The fund is non-diversified, which means that it may invest in a smaller number of issuers than a diversified fund and may invest more of its assets inthe securities of a single issuer. The fund concentrates its investments in securities of issuers in the real estate industry.
Principal risksThe fund is subject to risks, and you could lose money by investing in the fund. The principal risks of investing in the fund include:
Concentration risk. Because the fund may focus on one or more industries or sectors of the economy, its performance depends in large part on theperformance of those sectors or industries. As a result, the value of an investment may fluctuate more widely than it would in a fund that is diversifiedacross industries and sectors.
Credit and counterparty risk. The issuer or guarantor of a fixed-income security, the counterparty to an over-the-counter derivatives contract, or aborrower of fund securities may not make timely payments or otherwise honor its obligations. A downgrade or default affecting any of the fund’ssecurities could affect the fund’s performance.
Cybersecurity and operational risk. Cybersecurity breaches may allow an unauthorized party to gain access to fund assets, customer data, orproprietary information, or cause a fund or its service providers to suffer data corruption or lose operational functionality. Similar incidents affectingissuers of a fund’s securities may negatively impact performance. Operational risk may arise from human error, error by third parties, communicationerrors, or technology failures, among other causes.
Economic and market events risk. Events in the U.S. and global financial markets, including actions taken by the U.S. Federal Reserve or foreigncentral banks to stimulate or stabilize economic growth, may at times result in unusually high market volatility, which could negatively impactperformance. Reduced liquidity in credit and fixed-income markets could adversely affect issuers worldwide. Banks and financial services companiescould suffer losses if interest rates rise or economic conditions deteriorate.
Equity securities risk. The price of equity securities may decline due to changes in a company’s financial condition or overall market conditions.
Fixed-income securities risk. A rise in interest rates typically causes bond prices to fall. The longer the average maturity or duration of the bonds heldby a fund, the more sensitive it will likely be to interest-rate fluctuations. An issuer may not make all interest payments or repay all or any of theprincipal borrowed. Changes in a security’s credit quality may adversely affect fund performance.
Foreign securities risk. Less information may be publicly available regarding foreign issuers. Foreign securities may be subject to foreign taxes andmay be more volatile than U.S. securities. Currency fluctuations and political and economic developments may adversely impact the value of foreignsecurities.
Hedging, derivatives, and other strategic transactions risk. Hedging, derivatives, and other strategic transactions may increase a fund’s volatilityand could produce disproportionate losses, potentially more than the fund’s principal investment. Risks of these transactions are different from andpossibly greater than risks of investing directly in securities and other traditional instruments. Under certain market conditions, derivatives couldbecome harder to value or sell and may become subject to liquidity risk (i.e., the inability to enter into closing transactions). Regulatory changes inderivative markets could impact the cost of or the fund’s ability to engage in derivatives transactions. Derivatives and other strategic transactions thatthe fund intends to utilize include: futures contracts. Futures contracts generally are subject to counterparty risk.
High portfolio turnover risk. Trading securities actively and frequently can increase transaction costs (thus lowering performance) and taxabledistributions.
Large company risk. Larger companies may grow more slowly than smaller companies or be slower to respond to business developments. Large-capitalization securities may underperform the market as a whole.
Liquidity risk. The extent (if at all) to which a security may be sold or a derivative position closed without negatively impacting its market value may beimpaired by reduced market activity or participation, legal restrictions, or other economic and market impediments. Liquidity risk may be magnified inrising interest rate environments due to higher than normal redemption rates. Widespread selling of fixed-income securities to satisfy redemptionsduring periods of reduced demand may adversely impact the price or salability of such securities. Periods of heavy redemption could cause the fund tosell assets at a loss or depressed value, which could negatively affect performance. Redemption risk is heightened during periods of declining or illiquidmarkets.
.211
Non-diversified risk. Adverse events affecting a particular issuer or group of issuers may magnify losses for non-diversified funds, which may invest alarge portion of assets in any one issuer or a small number of issuers.
Preferred and convertible securities risk. Preferred stock dividends are payable only if declared by the issuer’s Board. Preferred stock may be subjectto redemption provisions. The market values of convertible securities tend to fall as interest rates rise and rise as interest rates fall. Convertiblepreferred stock’s value can depend heavily upon the underlying common stock’s value.
Real estate investment trust risk. REITs, pooled investment vehicles that typically invest in real estate directly or in loans collateralized by real estate,carry risks associated with owning real estate, including the potential for a decline in value due to economic or market conditions.
Real estate securities risk. Securities of companies in the real estate industry carry risks associated with owning real estate, including the potential fora decline in value due to economic or market conditions.
Small and mid-sized company risk. Small and mid-sized companies are generally less established and may be more volatile than larger companies.Small and/or mid-capitalization securities may underperform the market as a whole.
Past performanceThe following information provides some indication of the risks of investing in the fund by showing changes in performance from year to year and byshowing how average annual returns for specified periods compare with those of a broad measure of market performance. The performanceinformation below does not reflect fees and expenses of any variable insurance contract which may use JHVIT as its underlying investment option. Ifsuch fees and expenses had been reflected, performance would be lower. The past performance of the fund is not necessarily an indication of how thefund will perform in the future.
Calendar year total returns for Series I (%)
2008 2009 2010 2011 2012 2013 2014 2015 2016 2017
–39.42 30.17 29.19 9.46 17.26 –0.10 31.73 2.68 6.92 6.24
Best quarter: Q3 ‘09, 32.43%
Worst quarter: Q4 ‘08, –39.92%
Average Annual Total Returns for Period Ended 12/31/2017
Average annual total returns (%) 1 Year 5 Year 10 YearDate of
Inception
Series I 6.24 8.94 7.21 04/30/87
Series II 6.06 8.72 7.00 01/28/02
Series NAV 6.26 9.00 7.27 02/28/05
MSCI U.S. REIT Index (reflects no deduction for fees, expenses, or taxes) 5.07 9.34 7.44
Investment managementInvestment Advisor John Hancock Investment Management Services, LLC§
Subadvisor Deutsche Investment Management Americas Inc.§Sub-Subadvisor RREEF America L.L.C.
Portfolio managementDavid W. Zonavetch, CPAManaging Director; Portfolio ManagerManaged fund since 2013
John W. VojticekManaging Director; Portfolio ManagerManaged fund since 2004
Robert ThomasManaging Director; Portfolio ManagerManaged fund since 2017
Other important information regarding the fundFor important information about taxes and financial intermediary compensation, please turn to “Additional information about the funds” at page258 of the Prospectus.
.212
Science & Technology Trust Investment objectiveTo seek long-term growth of capital. Current income is incidental to the fund’s objective.
Fees and expensesThis table describes the fees and expenses that you may pay if you buy and hold shares of the fund. The fees and expenses do not reflect fees andexpenses of any variable insurance contract that may use the fund as its underlying investment option and would be higher if they did.
Annual fund operating expenses (%) (expenses that you pay each year as a percentage of the valueof your investment) Series I Series II Series NAV
Management fee 1.02 1.02 1.02
Distribution and service (Rule 12b-1) fees 0.05 0.25 0.00
Other expenses 0.05 0.05 0.05
Total annual fund operating expenses 1.12 1.32 1.07
Expense exampleThe examples are intended to help you compare the cost of investing in the fund with the cost of investing in other mutual funds. The examplesassume that $10,000 is invested in the fund for the periods indicated and then all shares are redeemed at the end of those periods. The examples alsoassume that the investment has a 5% return each year and that the fund’s operating expenses remain the same. The expense example does not reflectfees and expenses of any variable insurance contract that may use the fund as its underlying investment option and would be higher if they did.Although your actual costs may be higher or lower, based on these assumptions your costs would be:
Expenses ($) Series I Series II Series NAV
1 year 114 134 109
3 years 356 418 340
5 years 617 723 590
10 years 1,363 1,590 1,306
Portfolio turnoverThe fund pays transaction costs, such as commissions, when it buys and sells securities (or “turns over” its portfolio). A higher portfolio turnover ratemay indicate higher transaction costs. These costs, which are not reflected in annual fund operating expenses or in the example, affect the fund’sperformance. During its most recent fiscal year, the fund’s portfolio turnover rate was 91% of the average value of its portfolio.
Principal investment strategiesUnder normal market conditions, the fund invests at least 80% of its net assets (plus any borrowings for investment purposes) in the common stocksof companies expected to benefit from the development, and/or use of science and/or technology. For purposes of satisfying this requirement,common stock may include equity-linked notes and derivatives relating to common stocks, such as options on equity-linked notes.
The fund employs a multi-manager approach with two subadvisors, each of which employs its own investment approach and independently managesits portion of the fund. The fund will be rebalanced periodically so that the subadvisors manage the following portions of the fund:
50%* T. Rowe Price Associates, Inc. (“T. Rowe Price”)
50%* Allianz Global Investors U.S. LLC (“AllianzGI US”)
*Percentages are approximate. Since the fund is only rebalanced periodically, the actual portion of the fund managed by each subadvisor will vary.
This allocation methodology may change in the future.
Some industries likely to be represented in the fund include:
information technology including hardware, software, semiconductors and technology equipment
telecommunications equipment and services
media including advertising, broadcasting, cable and satellite, movies, entertainment, publishing and information services
environmental services
internet commerce and advertising
life sciences and health care, including pharmaceuticals, health care equipment and services, and biotechnology
chemicals and synthetic materials
defense and aerospace
.213
alternative energy
While most of the fund’s assets are invested in U.S. common stocks, the fund may also purchase other types of securities, including U.S. dollar- andforeign currency-denominated foreign securities, convertible stocks and bonds, and warrants, and use futures and options, in keeping with the fund’sinvestment objectives.
Stock selection for the fund generally reflects a growth approach based on an assessment of a company’s fundamental prospects for above-averageearnings, rather than on a company’s size. As a result, fund holdings can range from securities of small companies developing new technologies tosecurities of blue chip firms with established track records. The fund may also invest in companies that are expected to benefit from technologicaladvances even if they are not directly involved in research and development. The fund may invest in suitable companies through IPOs.
The fund holds a certain portion of its assets in money market reserves, which can consist of shares of certain internal T. Rowe Price money marketfunds as well as U.S. dollar and foreign currency-denominated money market securities, including repurchase agreements, in the two highest ratingcategories, maturing in one year or less.
The fund may invest up to 10% of its total assets in hybrid instruments. Hybrid instruments are a type of high-risk derivative which can combine thecharacteristics of securities, futures and options. Such securities may bear interest or pay dividends at below market (or even relatively nominal) rates.
In managing its portion of the fund, AllianzGI US may enter into short sales including short sales against the box.
In pursuing the fund’s investment objective, each subadvisor has the discretion to purchase some securities that do not meet its normal investmentcriteria, as described above, when they perceive an unusual opportunity for gain. These special situations might arise when a subadvisor believes asecurity could increase in value for a variety of reasons including a change in management, an extraordinary corporate event, a new productintroduction or a favorable competitive development.
The fund may sell securities for a variety of reasons, such as to secure gains, limit losses, or redeploy assets into more promising opportunities.
Principal risksThe fund is subject to risks, and you could lose money by investing in the fund. The principal risks of investing in the fund include:
Convertible securities risk. The market values of convertible securities tend to fall as interest rates rise and rise as interest rates fall. As the marketprice of underlying common stock declines below the conversion price, the market value of the convertible security tends to be increasingly influencedby its yield.
Credit and counterparty risk. The issuer or guarantor of a fixed-income security, the counterparty to an over-the-counter derivatives contract, or aborrower of fund securities may not make timely payments or otherwise honor its obligations. A downgrade or default affecting any of the fund’ssecurities could affect the fund’s performance.
Currency risk. Fluctuations in exchange rates may adversely affect the U.S. dollar value of a fund’s investments. Foreign currencies may decline invalue, which could negatively impact performance.
Cybersecurity and operational risk. Cybersecurity breaches may allow an unauthorized party to gain access to fund assets, customer data, orproprietary information, or cause a fund or its service providers to suffer data corruption or lose operational functionality. Similar incidents affectingissuers of a fund’s securities may negatively impact performance. Operational risk may arise from human error, error by third parties, communicationerrors, or technology failures, among other causes.
Economic and market events risk. Events in the U.S. and global financial markets, including actions taken by the U.S. Federal Reserve or foreigncentral banks to stimulate or stabilize economic growth, may at times result in unusually high market volatility, which could negatively impactperformance. Reduced liquidity in credit and fixed-income markets could adversely affect issuers worldwide. Banks and financial services companiescould suffer losses if interest rates rise or economic conditions deteriorate.
Equity securities risk. The value of a company’s equity securities is subject to changes in the company’s financial condition, and overall market andeconomic conditions. Investments in the stocks of privately held companies and newly public companies involve greater risks than investments in stocksof companies that have traded publicly on an exchange for extended time periods. Investments in such companies are less liquid and difficult to value,and there is significantly less information available about these companies’ business models, quality of management, earnings growth potential, andother criteria used to evaluate their investment prospects.
Fixed-income securities risk. A rise in interest rates typically causes bond prices to fall. The longer the average maturity or duration of the bonds heldby a fund, the more sensitive it will likely be to interest-rate fluctuations. An issuer may not make all interest payments or repay all or any of theprincipal borrowed. Changes in a security’s credit quality may adversely affect fund performance.
Foreign securities risk. Less information may be publicly available regarding foreign issuers. Foreign securities may be subject to foreign taxes andmay be more volatile than U.S. securities. Currency fluctuations and political and economic developments may adversely impact the value of foreignsecurities.
Hong Kong Stock Connect Program (Stock Connect) risk. China A-Shares listed and traded on certain Chinese stock exchanges through StockConnect, a mutual market access program designed to, among other things, enable foreign investment in the People’s Republic of China (PRC) viabrokers in Hong Kong, are subject to a number of restrictions imposed by Chinese securities regulations and local exchange listing rules. BecauseStock Connect was established in November 2014, developments are likely, which may restrict or otherwise affect the fund’s investments or returns.Furthermore, any changes in laws, regulations and policies of the China A-Shares market or rules in relation to Stock Connect may affect China A-Share prices. These risks are heightened by the underdeveloped state of the PRC’s investment and banking systems in general.
.214
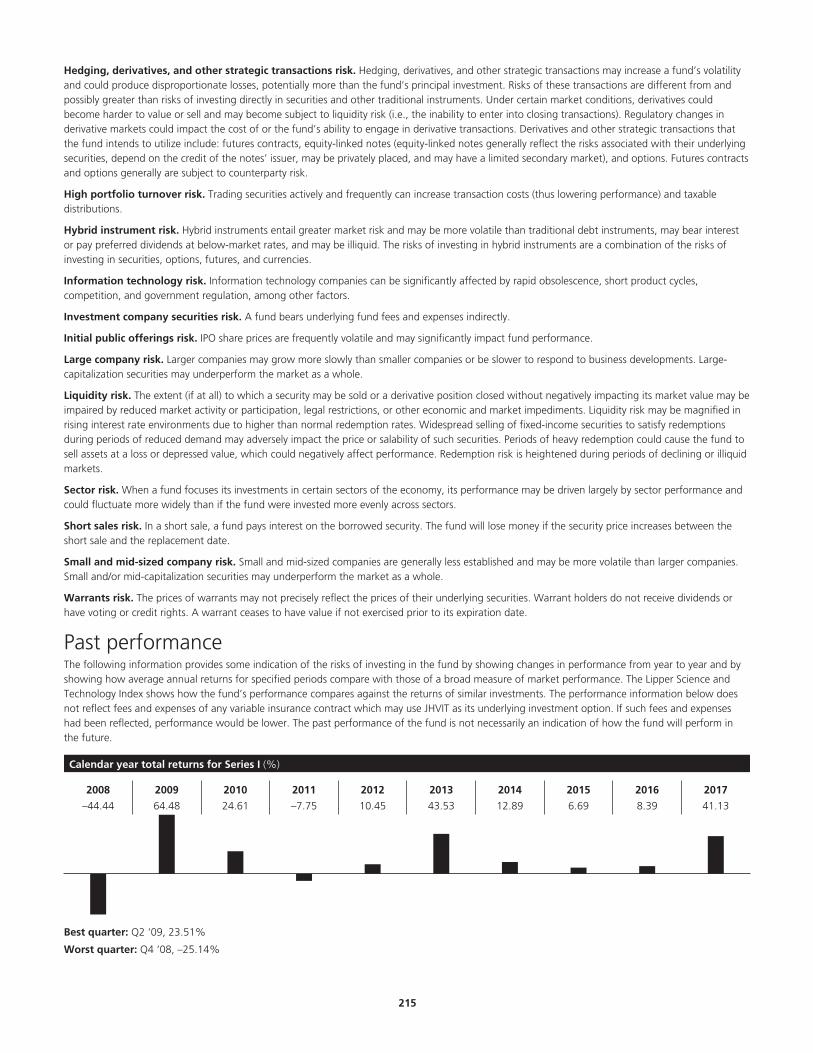
Hedging, derivatives, and other strategic transactions risk. Hedging, derivatives, and other strategic transactions may increase a fund’s volatilityand could produce disproportionate losses, potentially more than the fund’s principal investment. Risks of these transactions are different from andpossibly greater than risks of investing directly in securities and other traditional instruments. Under certain market conditions, derivatives couldbecome harder to value or sell and may become subject to liquidity risk (i.e., the inability to enter into closing transactions). Regulatory changes inderivative markets could impact the cost of or the fund’s ability to engage in derivative transactions. Derivatives and other strategic transactions thatthe fund intends to utilize include: futures contracts, equity-linked notes (equity-linked notes generally reflect the risks associated with their underlyingsecurities, depend on the credit of the notes’ issuer, may be privately placed, and may have a limited secondary market), and options. Futures contractsand options generally are subject to counterparty risk.
High portfolio turnover risk. Trading securities actively and frequently can increase transaction costs (thus lowering performance) and taxabledistributions.
Hybrid instrument risk. Hybrid instruments entail greater market risk and may be more volatile than traditional debt instruments, may bear interestor pay preferred dividends at below-market rates, and may be illiquid. The risks of investing in hybrid instruments are a combination of the risks ofinvesting in securities, options, futures, and currencies.
Information technology risk. Information technology companies can be significantly affected by rapid obsolescence, short product cycles,competition, and government regulation, among other factors.
Investment company securities risk. A fund bears underlying fund fees and expenses indirectly.
Initial public offerings risk. IPO share prices are frequently volatile and may significantly impact fund performance.
Large company risk. Larger companies may grow more slowly than smaller companies or be slower to respond to business developments. Large-capitalization securities may underperform the market as a whole.
Liquidity risk. The extent (if at all) to which a security may be sold or a derivative position closed without negatively impacting its market value may beimpaired by reduced market activity or participation, legal restrictions, or other economic and market impediments. Liquidity risk may be magnified inrising interest rate environments due to higher than normal redemption rates. Widespread selling of fixed-income securities to satisfy redemptionsduring periods of reduced demand may adversely impact the price or salability of such securities. Periods of heavy redemption could cause the fund tosell assets at a loss or depressed value, which could negatively affect performance. Redemption risk is heightened during periods of declining or illiquidmarkets.
Sector risk. When a fund focuses its investments in certain sectors of the economy, its performance may be driven largely by sector performance andcould fluctuate more widely than if the fund were invested more evenly across sectors.
Short sales risk. In a short sale, a fund pays interest on the borrowed security. The fund will lose money if the security price increases between theshort sale and the replacement date.
Small and mid-sized company risk. Small and mid-sized companies are generally less established and may be more volatile than larger companies.Small and/or mid-capitalization securities may underperform the market as a whole.
Warrants risk. The prices of warrants may not precisely reflect the prices of their underlying securities. Warrant holders do not receive dividends orhave voting or credit rights. A warrant ceases to have value if not exercised prior to its expiration date.
Past performanceThe following information provides some indication of the risks of investing in the fund by showing changes in performance from year to year and byshowing how average annual returns for specified periods compare with those of a broad measure of market performance. The Lipper Science andTechnology Index shows how the fund’s performance compares against the returns of similar investments. The performance information below doesnot reflect fees and expenses of any variable insurance contract which may use JHVIT as its underlying investment option. If such fees and expenseshad been reflected, performance would be lower. The past performance of the fund is not necessarily an indication of how the fund will perform inthe future.
Calendar year total returns for Series I (%)
2008 2009 2010 2011 2012 2013 2014 2015 2016 2017
–44.44 64.48 24.61 –7.75 10.45 43.53 12.89 6.69 8.39 41.13
Best quarter: Q2 ‘09, 23.51%
Worst quarter: Q4 ‘08, –25.14%
.215
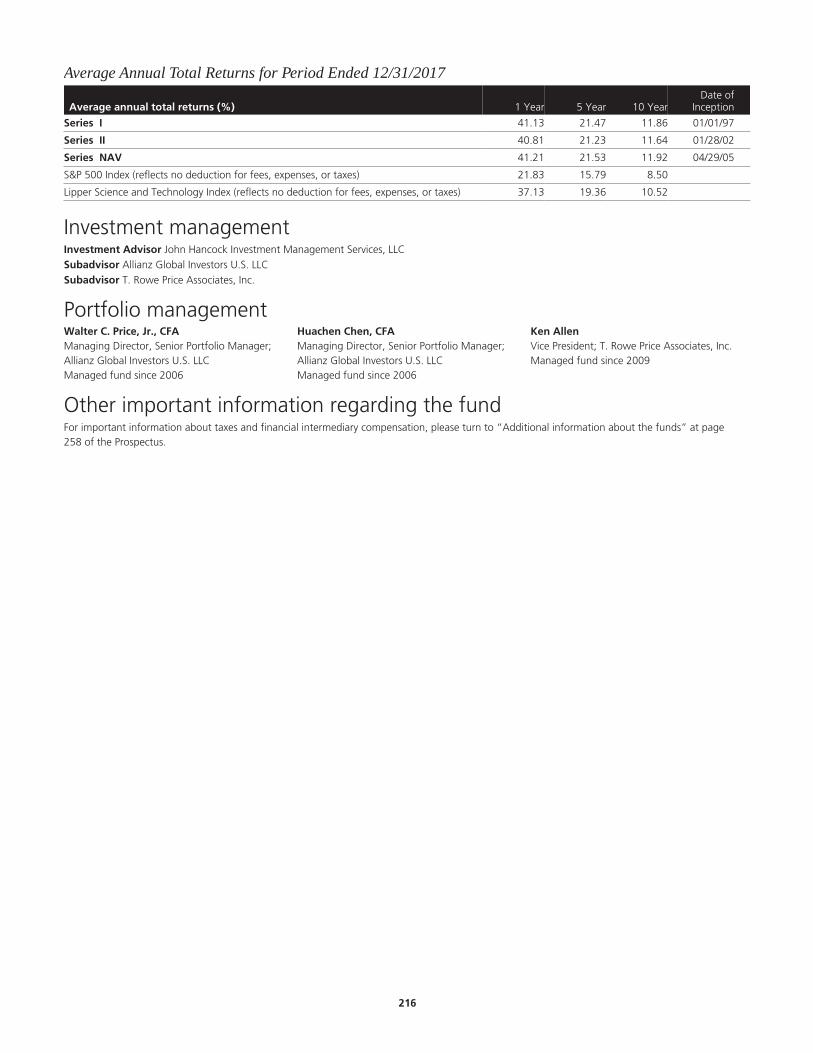
Average Annual Total Returns for Period Ended 12/31/2017
Average annual total returns (%) 1 Year 5 Year 10 YearDate of
Inception
Series I 41.13 21.47 11.86 01/01/97
Series II 40.81 21.23 11.64 01/28/02
Series NAV 41.21 21.53 11.92 04/29/05
S&P 500 Index (reflects no deduction for fees, expenses, or taxes) 21.83 15.79 8.50
Lipper Science and Technology Index (reflects no deduction for fees, expenses, or taxes) 37.13 19.36 10.52
Investment managementInvestment Advisor John Hancock Investment Management Services, LLC§
Subadvisor Allianz Global Investors U.S. LLC§
Subadvisor T. Rowe Price Associates, Inc.
Portfolio managementWalter C. Price, Jr., CFAManaging Director, Senior Portfolio Manager;Allianz Global Investors U.S. LLCManaged fund since 2006
Huachen Chen, CFAManaging Director, Senior Portfolio Manager;Allianz Global Investors U.S. LLCManaged fund since 2006
Ken AllenVice President; T. Rowe Price Associates, Inc.Managed fund since 2009
Other important information regarding the fundFor important information about taxes and financial intermediary compensation, please turn to “Additional information about the funds” at page258 of the Prospectus.
.216

Select Bond Trust (formerly Bond Trust)Investment objectiveTo seek income and capital appreciation.
Fees and expensesThis table describes the fees and expenses that you may pay if you buy and hold shares of the fund. The fees and expenses do not reflect fees andexpenses of any variable insurance contract that may use the fund as its underlying investment option and would be higher if they did.
Annual fund operating expenses (%) (expenses that you pay each year as a percentage of the valueof your investment) Series I Series II Series NAV
Management fee 0.56 0.56 0.56
Distribution and service (Rule 12b-1) fees 0.05 0.25 0.00
Other expenses 0.04 0.04 0.04
Total annual fund operating expenses 0.65 0.85 0.60
Expense exampleThe examples are intended to help you compare the cost of investing in the fund with the cost of investing in other mutual funds. The examplesassume that $10,000 is invested in the fund for the periods indicated and then all shares are redeemed at the end of those periods. The examples alsoassume that the investment has a 5% return each year and that the fund’s operating expenses remain the same. The expense example does not reflectfees and expenses of any variable insurance contract that may use the fund as its underlying investment option and would be higher if they did.Although your actual costs may be higher or lower, based on these assumptions your costs would be:
Expenses ($) Series I Series II Series NAV
1 year 66 87 61
3 years 208 271 192
5 years 362 471 335
10 years 810 1,049 750
Portfolio turnoverThe fund pays transaction costs, such as commissions, when it buys and sells securities (or “turns over” its portfolio). A higher portfolio turnover ratemay indicate higher transaction costs. These costs, which are not reflected in annual fund operating expenses or in the example, affect the fund’sperformance. During its most recent fiscal year, the fund’s portfolio turnover rate was 92% of the average value of its portfolio.
Principal investment strategiesUnder normal market conditions, the fund invests at least 80% of its net assets (plus any borrowings for investment purposes) in a diversified mix ofdebt securities and instruments. The fund seeks to invest its assets in debt securities and instruments with an average duration of between 4 to 6 years,however, there is no limit on the fund’s average maturity.
Eligible investments include, but are not limited to:
U.S. Treasury and agency securities as well as notes backed by the Federal Deposit Insurance Corporation,
Mortgage-backed securities, including mortgage pass-through securities, commercial mortgage-backed securities (“CMBS”) and collateralizedmortgage obligations (“CMOs”),
U.S. and foreign corporate bonds, and
Foreign government and agency securities.
The subadvisor uses proprietary research and economic and industry analysis to identify specific bonds, bond sectors and industries that are attractivelypriced. Due to this process, the fund may have a higher than average portfolio turnover ratio which may affect performance results.
The foreign securities in which the fund invests may be denominated in U.S. dollars or foreign currency.
Use of Hedging and Other Strategic Transactions. The fund is authorized to use all of the various investment strategies referred to under “AdditionalInformation About the Funds’ Principal Risks — Hedging, derivatives and other strategic transactions risk” including, but not limited to, U.S. Treasuryfutures and options, index derivatives, credit default swaps and forwards.
.217
Principal risksThe fund is subject to risks, and you could lose money by investing in the fund. The principal risks of investing in the fund include:
Credit and counterparty risk. The issuer or guarantor of a fixed-income security, the counterparty to an over-the-counter derivatives contract, or aborrower of fund securities may not make timely payments or otherwise honor its obligations. U.S. government securities are subject to varyingdegrees of credit risk depending upon the nature of their support. A downgrade or default affecting any of the fund’s securities could affect the fund’sperformance.
Cybersecurity and operational risk. Cybersecurity breaches may allow an unauthorized party to gain access to fund assets, customer data, orproprietary information, or cause a fund or its service providers to suffer data corruption or lose operational functionality. Similar incidents affectingissuers of a fund’s securities may negatively impact performance. Operational risk may arise from human error, error by third parties, communicationerrors, or technology failures, among other causes.
Economic and market events risk. Events in the U.S. and global financial markets, including actions taken by the U.S. Federal Reserve or foreigncentral banks to stimulate or stabilize economic growth, may at times result in unusually high market volatility, which could negatively impactperformance. Reduced liquidity in credit and fixed-income markets could adversely affect issuers worldwide. Banks and financial services companiescould suffer losses if interest rates rise or economic conditions deteriorate.
Fixed-income securities risk. A rise in interest rates typically causes bond prices to fall. The longer the average maturity or duration of the bonds heldby a fund, the more sensitive it will likely be to interest-rate fluctuations. An issuer may not make all interest payments or repay all or any of theprincipal borrowed. Changes in a security’s credit quality may adversely affect fund performance.
Foreign securities risk. Less information may be publicly available regarding foreign issuers. Foreign securities may be subject to foreign taxes andmay be more volatile than U.S. securities. Currency fluctuations and political and economic developments may adversely impact the value of foreignsecurities.
Hedging, derivatives, and other strategic transactions risk. Hedging, derivatives, and other strategic transactions may increase a fund’s volatilityand could produce disproportionate losses, potentially more than the fund’s principal investment. Risks of these transactions are different from andpossibly greater than risks of investing directly in securities and other traditional instruments. Under certain market conditions, derivatives couldbecome harder to value or sell and may become subject to liquidity risk (i.e., the inability to enter into closing transactions). Regulatory changes inderivative markets could impact the cost of or the fund’s ability to engage in derivative transactions. Derivatives and other strategic transactions thatthe fund intends to utilize include: credit default swaps; foreign currency forward contracts; foreign currency swaps; futures contracts; interest-rateswaps; and options. Foreign currency forward contracts, futures contracts, options, and swaps generally are subject to counterparty risk. In addition,swaps may be subject to interest-rate and settlement risk, and the risk of default of the underlying reference obligation. Derivatives associated withforeign currency transactions are subject to currency risk.
High portfolio turnover risk. Trading securities actively and frequently can increase transaction costs (thus lowering performance) and taxabledistributions.
Liquidity risk. The extent (if at all) to which a security may be sold or a derivative position closed without negatively impacting its market value may beimpaired by reduced market activity or participation, legal restrictions, or other economic and market impediments. Liquidity risk may be magnified inrising interest rate environments due to higher than normal redemption rates. Widespread selling of fixed-income securities to satisfy redemptionsduring periods of reduced demand may adversely impact the price or salability of such securities. Periods of heavy redemption could cause the fund tosell assets at a loss or depressed value, which could negatively affect performance. Redemption risk is heightened during periods of declining or illiquidmarkets.
Mortgage-backed and asset-backed securities risk. Mortgage-backed and asset-backed securities are subject to different combinations ofprepayment, extension, interest-rate, and other market risks.
Sector risk. When a fund focuses its investments in certain sectors of the economy, its performance may be driven largely by sector performance andcould fluctuate more widely than if the fund were invested more evenly across sectors.
Past performanceThe following information provides some indication of the risks of investing in the fund by showing changes in performance from year to year and byshowing how average annual returns for specified periods compare with those of a broad measure of market performance. Unless all share classesshown in the table have the same inception date, performance shown for periods prior to the inception date of a class is the performance of the fund’soldest share class. This pre-inception performance, with respect to any other share class of the fund, has not been adjusted to reflect the Rule 12b-1fees of that class. As a result, the pre-inception performance shown for a share class other than the oldest share class may be higher or lower than itwould be if adjusted to reflect the Rule 12b-1 fees of the class. The performance information below does not reflect fees and expenses of any variableinsurance contract which may use JHVIT as its underlying investment option. If such fees and expenses had been reflected, performance would belower. The past performance of the fund is not necessarily an indication of how the fund will perform in the future.
.218
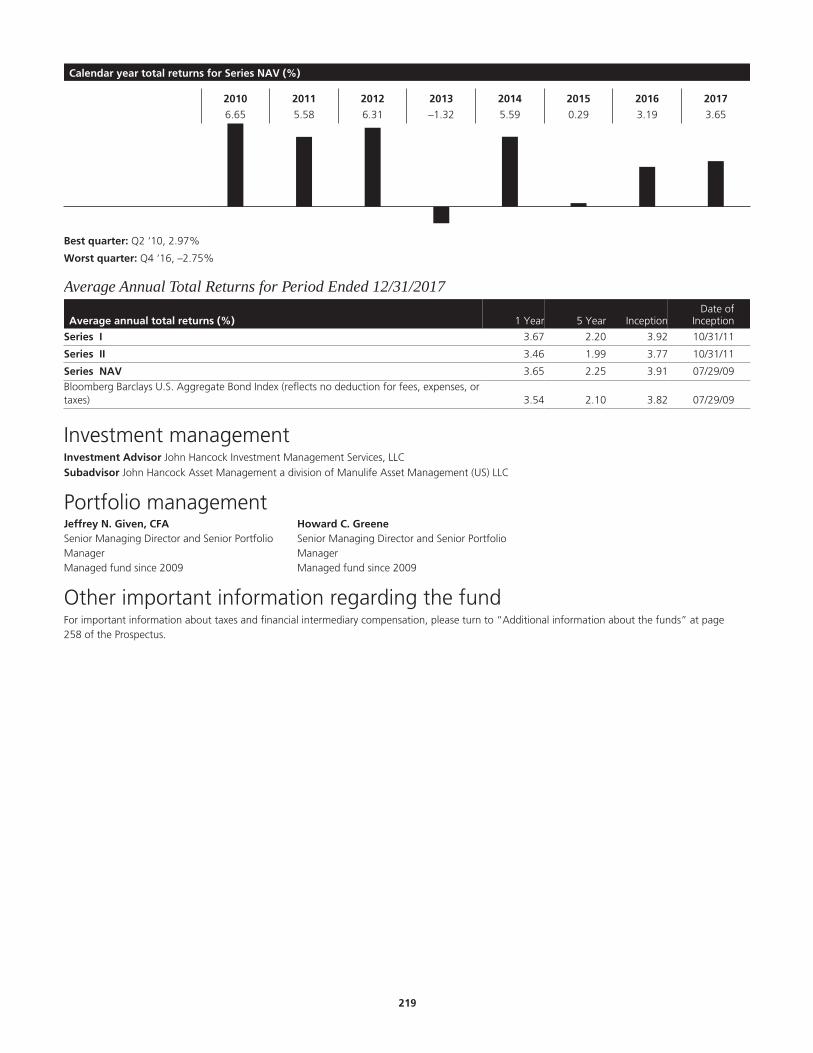
Calendar year total returns for Series NAV (%)
2010 2011 2012 2013 2014 2015 2016 2017
6.65 5.58 6.31 –1.32 5.59 0.29 3.19 3.65
Best quarter: Q2 ‘10, 2.97%
Worst quarter: Q4 ‘16, –2.75%
Average Annual Total Returns for Period Ended 12/31/2017
Average annual total returns (%) 1 Year 5 Year InceptionDate of
Inception
Series I 3.67 2.20 3.92 10/31/11
Series II 3.46 1.99 3.77 10/31/11
Series NAV 3.65 2.25 3.91 07/29/09Bloomberg Barclays U.S. Aggregate Bond Index (reflects no deduction for fees, expenses, ortaxes) 3.54 2.10 3.82 07/29/09
Investment managementInvestment Advisor John Hancock Investment Management Services, LLC§
Subadvisor John Hancock Asset Management a division of Manulife Asset Management (US) LLC
Portfolio managementJeffrey N. Given, CFASenior Managing Director and Senior PortfolioManagerManaged fund since 2009
Howard C. GreeneSenior Managing Director and Senior PortfolioManagerManaged fund since 2009
Other important information regarding the fundFor important information about taxes and financial intermediary compensation, please turn to “Additional information about the funds” at page258 of the Prospectus.
.219

Short Term Government Income Trust Investment objectiveTo seek a high level of current income consistent with preservation of capital. Maintaining a stable share price is a secondary goal.
Fees and expensesThis table describes the fees and expenses that you may pay if you buy and hold shares of the fund. The fees and expenses do not reflect fees andexpenses of any variable insurance contract that may use the fund as its underlying investment option and would be higher if they did.
Annual fund operating expenses (%) (expenses that you pay each year as a percentage of the valueof your investment) Series I Series II Series NAV
Management fee 0.56 0.56 0.56
Distribution and service (Rule 12b-1) fees 0.05 0.25 0.00
Other expenses 0.06 0.06 0.06
Total annual fund operating expenses 0.67 0.87 0.62
Expense exampleThe examples are intended to help you compare the cost of investing in the fund with the cost of investing in other mutual funds. The examplesassume that $10,000 is invested in the fund for the periods indicated and then all shares are redeemed at the end of those periods. The examples alsoassume that the investment has a 5% return each year and that the fund’s operating expenses remain the same. The expense example does not reflectfees and expenses of any variable insurance contract that may use the fund as its underlying investment option and would be higher if they did.Although your actual costs may be higher or lower, based on these assumptions your costs would be:
Expenses ($) Series I Series II Series NAV
1 year 68 89 63
3 years 214 278 199
5 years 373 482 346
10 years 835 1,073 774
Portfolio turnoverThe fund pays transaction costs, such as commissions, when it buys and sells securities (or “turns over” its portfolio). A higher portfolio turnover ratemay indicate higher transaction costs. These costs, which are not reflected in annual fund operating expenses or in the example, affect the fund’sperformance. During its most recent fiscal year, the fund’s portfolio turnover rate was 47% of the average value of its portfolio.
Principal investment strategiesThe fund seeks to achieve its investment objective by investing under normal circumstances at least 80% of its net assets in obligations issued orguaranteed by the U.S. government and its agencies, authorities or instrumentalities (U.S. government securities). Under normal circumstances, thefund’s effective duration is no more than three years.
U.S. government securities may be supported by:
The full faith and credit of the United States government, such as Treasury bills, notes and bonds, and Government National Mortgage AssociationCertificates.
The right of the issuer to borrow from the U.S. Treasury, such as obligations of the Federal Home Loan Mortgage Corporation.
The credit of the instrumentality, such as obligations of the Federal National Mortgage Association.
The fund may invest in higher-risk securities, including U.S. dollar-denominated foreign government securities and asset-backed securities. It may alsoinvest up to 10% of its net assets in foreign government high-yield securities (junk bonds) rated as low as B and their unrated equivalents.
In managing the portfolio of the fund, the subadvisor considers interest rate trends to determine which types of bonds to emphasize at a given time.The fund typically favors mortgage-related securities when it anticipates that interest rates will be relatively stable, and favors U.S. Treasuries at othertimes. Because high yield bonds often respond to market movements differently from U.S. government bonds, the fund may use them to managevolatility.
The fund may invest in mortgage-related securities and Treasury futures to protect against adverse changes and manage risks.
The fund may invest in other investment companies, including exchange traded funds (“ETFs”), and engage in short sales.
Under normal circumstances, the fund’s effective duration is no more than three years which means that the fund may purchase securities with aduration of greater than three years, as long as the fund’s average duration does not exceed three years.
The fund may trade securities actively which could increase transaction costs (thus lowering performance).
.220
Principal risksThe fund is subject to risks, and you could lose money by investing in the fund. The principal risks of investing in the fund include:
Changing distribution levels risk. The fund may cease or reduce the level of its distribution or make a greater return of capital if income ordividends paid from its investments declines.
Credit and counterparty risk. The issuer or guarantor of a fixed-income security or a borrower of fund securities may not make timely payments orotherwise honor its obligations. U.S. government securities are subject to varying degrees of credit risk depending upon the nature of their support. Adowngrade or default affecting any of the fund’s securities could affect the fund’s performance.
Cybersecurity and operational risk. Cybersecurity breaches may allow an unauthorized party to gain access to fund assets, customer data, orproprietary information, or cause a fund or its service providers to suffer data corruption or lose operational functionality. Similar incidents affectingissuers of a fund’s securities may negatively impact performance. Operational risk may arise from human error, error by third parties, communicationerrors, or technology failures, among other causes.
Economic and market events risk. Events in the U.S. and global financial markets, including actions taken by the U.S. Federal Reserve or foreigncentral banks to stimulate or stabilize economic growth, may at times result in unusually high market volatility, which could negatively impactperformance. Reduced liquidity in credit and fixed-income markets could adversely affect issuers worldwide. Banks and financial services companiescould suffer losses if interest rates rise or economic conditions deteriorate.
Exchange-traded funds risk. An ETF generally reflects the risks of the underlying securities it is designed to track. A fund bears ETF fees and expensesindirectly.
Fixed-income securities risk. A rise in interest rates typically causes bond prices to fall. The longer the average maturity or duration of the bonds heldby a fund, the more sensitive it will likely be to interest-rate fluctuations. An issuer may not make all interest payments or repay all or any of theprincipal borrowed. Changes in a security’s credit quality may adversely affect fund performance.
Foreign securities risk. Less information may be publicly available regarding foreign issuers. Foreign securities may be subject to foreign taxes andmay be more volatile than U.S. securities. Currency fluctuations and political and economic developments may adversely impact the value of foreignsecurities.
High portfolio turnover risk. Trading securities actively and frequently can increase transaction costs (thus lowering performance) and taxabledistributions.
Investment company securities risk. A fund bears underlying fund fees and expenses indirectly.
Liquidity risk. The extent (if at all) to which a security may be sold or a derivative position closed without negatively impacting its market value may beimpaired by reduced market activity or participation, legal restrictions, or other economic and market impediments. Liquidity risk may be magnified inrising interest rate environments due to higher than normal redemption rates. Widespread selling of fixed-income securities to satisfy redemptionsduring periods of reduced demand may adversely impact the price or salability of such securities. Periods of heavy redemption could cause the fund tosell assets at a loss or depressed value, which could negatively affect performance. Redemption risk is heightened during periods of declining or illiquidmarkets.
Lower-rated and high-yield fixed-income securities risk. Lower-rated and high-yield fixed-income securities (junk bonds) are subject to greatercredit quality risk, risk of default, and price volatility than higher-rated fixed-income securities, may be considered speculative, and can be difficult toresell.
Mortgage-backed and asset-backed securities risk. Mortgage-backed and asset-backed securities are subject to different combinations ofprepayment, extension, interest-rate, and other market risks.
Short sales risk. In a short sale, a fund pays interest on the borrowed security. The fund will lose money if the security price increases between theshort sale and the replacement date.
Past performanceThe following information provides some indication of the risks of investing in the fund by showing changes in performance from year to year and byshowing how average annual returns for specified periods compare with those of a broad measure of market performance. Unless all share classesshown in the table have the same inception date, performance shown for periods prior to the inception date of a class is the performance of the fund’soldest share class. This pre-inception performance, with respect to any other share class of the fund, has not been adjusted to reflect the Rule 12b-1fees of that class. As a result, the pre-inception performance shown for a share class other than the oldest share class may be higher or lower than itwould be if adjusted to reflect the Rule 12b-1 fees of the class. The performance information below does not reflect fees and expenses of any variableinsurance contract which may use JHVIT as its underlying investment option. If such fees and expenses had been reflected, performance would belower. The past performance of the fund is not necessarily an indication of how the fund will perform in the future.
.221
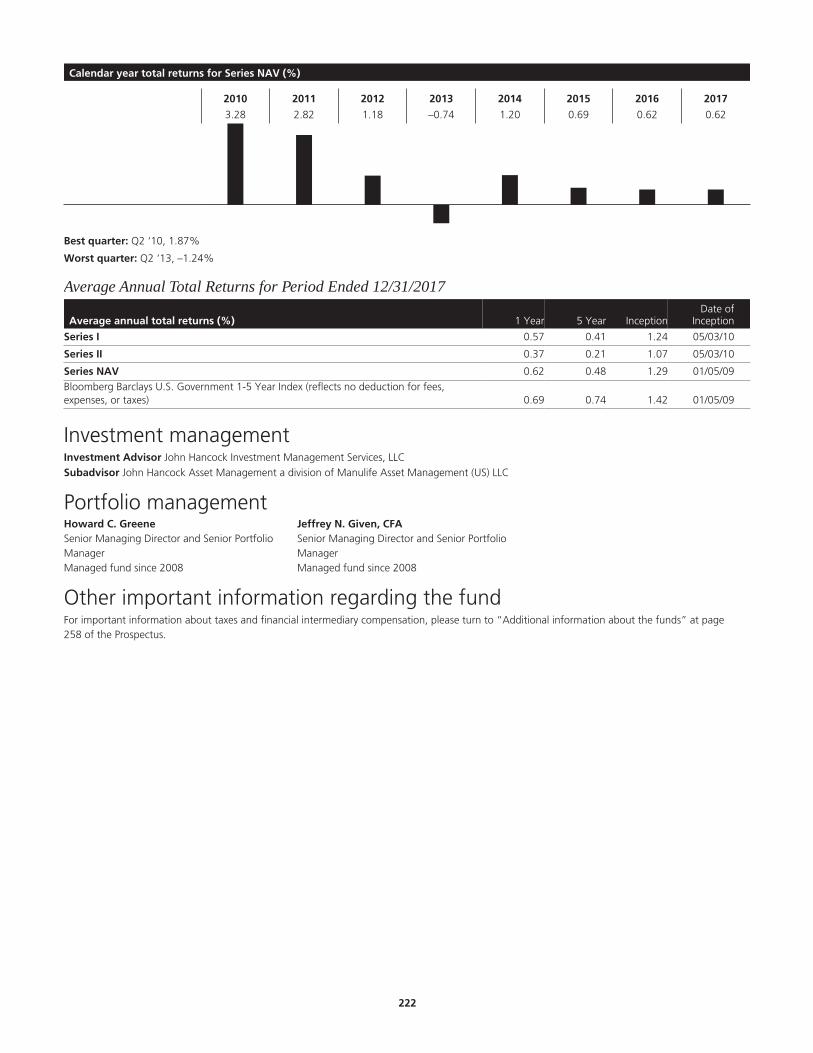
Calendar year total returns for Series NAV (%)
2010 2011 2012 2013 2014 2015 2016 2017
3.28 2.82 1.18 –0.74 1.20 0.69 0.62 0.62
Best quarter: Q2 ‘10, 1.87%
Worst quarter: Q2 ‘13, –1.24%
Average Annual Total Returns for Period Ended 12/31/2017
Average annual total returns (%) 1 Year 5 Year InceptionDate of
Inception
Series I 0.57 0.41 1.24 05/03/10
Series II 0.37 0.21 1.07 05/03/10
Series NAV 0.62 0.48 1.29 01/05/09Bloomberg Barclays U.S. Government 1-5 Year Index (reflects no deduction for fees,expenses, or taxes) 0.69 0.74 1.42 01/05/09
Investment managementInvestment Advisor John Hancock Investment Management Services, LLC§
Subadvisor John Hancock Asset Management a division of Manulife Asset Management (US) LLC
Portfolio managementHoward C. GreeneSenior Managing Director and Senior PortfolioManagerManaged fund since 2008
Jeffrey N. Given, CFASenior Managing Director and Senior PortfolioManagerManaged fund since 2008
Other important information regarding the fundFor important information about taxes and financial intermediary compensation, please turn to “Additional information about the funds” at page258 of the Prospectus.
.222
Small Cap Index Trust Investment objectiveSeeks to approximate the aggregate total return of a small cap U.S. domestic equity market index.
Fees and expensesThis table describes the fees and expenses that you may pay if you buy and hold shares of the fund. The fees and expenses do not reflect fees andexpenses of any variable insurance contract that may use the fund as its underlying investment option and would be higher if they did.
Annual fund operating expenses (%) (expenses that you pay each year as a percentage of the valueof your investment) Series I Series II Series NAV
Management fee 0.48 0.48 0.48
Distribution and service (Rule 12b-1) fees 0.05 0.25 0.00
Other expenses 0.05 0.05 0.05
Total annual fund operating expenses 0.58 0.78 0.53
Contractual expense reimbursement1 –0.05 –0.05 –0.05
Total annual fund operating expenses after expense reimbursements 0.53 0.73 0.48
1 The advisor contractually agrees to reduce its management fee by an annual rate of 0.05% of the fund’s average daily net assets. This agreement expires on April 30, 2019,unless renewed by mutual agreement of the fund and the advisor based upon a determination that this is appropriate under the circumstances at that time.
Expense exampleThe examples are intended to help you compare the cost of investing in the fund with the cost of investing in other mutual funds. The examplesassume that $10,000 is invested in the fund for the periods indicated and then all shares are redeemed at the end of those periods. The examples alsoassume that the investment has a 5% return each year and that the fund’s operating expenses remain the same. The expense example does not reflectfees and expenses of any variable insurance contract that may use the fund as its underlying investment option and would be higher if they did.Although your actual costs may be higher or lower, based on these assumptions your costs would be:
Expenses ($) Series I Series II Series NAV
1 year 54 75 49
3 years 181 244 165
5 years 319 428 291
10 years 721 961 660
Portfolio turnoverThe fund pays transaction costs, such as commissions, when it buys and sells securities (or “turns over” its portfolio). A higher portfolio turnover ratemay indicate higher transaction costs. These costs, which are not reflected in annual fund operating expenses or in the example, affect the fund’sperformance. During its most recent fiscal year, the fund’s portfolio turnover rate was 22% of the average value of its portfolio.
Principal investment strategiesUnder normal market conditions, the fund invests at least 80% of its net assets (plus any borrowings for investment purposes) at the time ofinvestment in: (a) the common stocks that are included in the Russell 2000 Index; and (b) securities (which may or may not be included in the Russell2000 Index) that the subadvisor believes as a group will behave in a manner similar to the index. As of February 28, 2018, the market capitalizations ofcompanies included in the Russell 2000 Index ranged from $8 million to $13.9 billion.
An index is an unmanaged group of securities whose overall performance is used as an investment benchmark. Indexes may track broad investmentmarkets, such as the global equity market, or more narrow investment markets, such as the U.S. small cap equity market. In contrast to activelymanaged funds, which seek to outperform their respective benchmark indexes through research and analysis, index funds are passively managed fundsthat seek to mirror the performance of their target indexes, minimizing performance differences over time. The fund attempts to match theperformance of the Russell 2000 Index by: (a) holding all, or a representative sample, of the securities that comprise that index; and/or (b) by holdingsecurities (which may or may not be included in the index) that the subadvisor believes as a group will behave in a manner similar to the index.However, the fund has operating expenses and transaction costs, while a market index does not. Therefore, the fund, while it attempts to track itstarget index closely, typically will be unable to match the performance of the target index exactly. The composition of an index changes from time totime, and the subadvisor will reflect those changes in the composition of the fund’s portfolio as soon as practicable.
.223
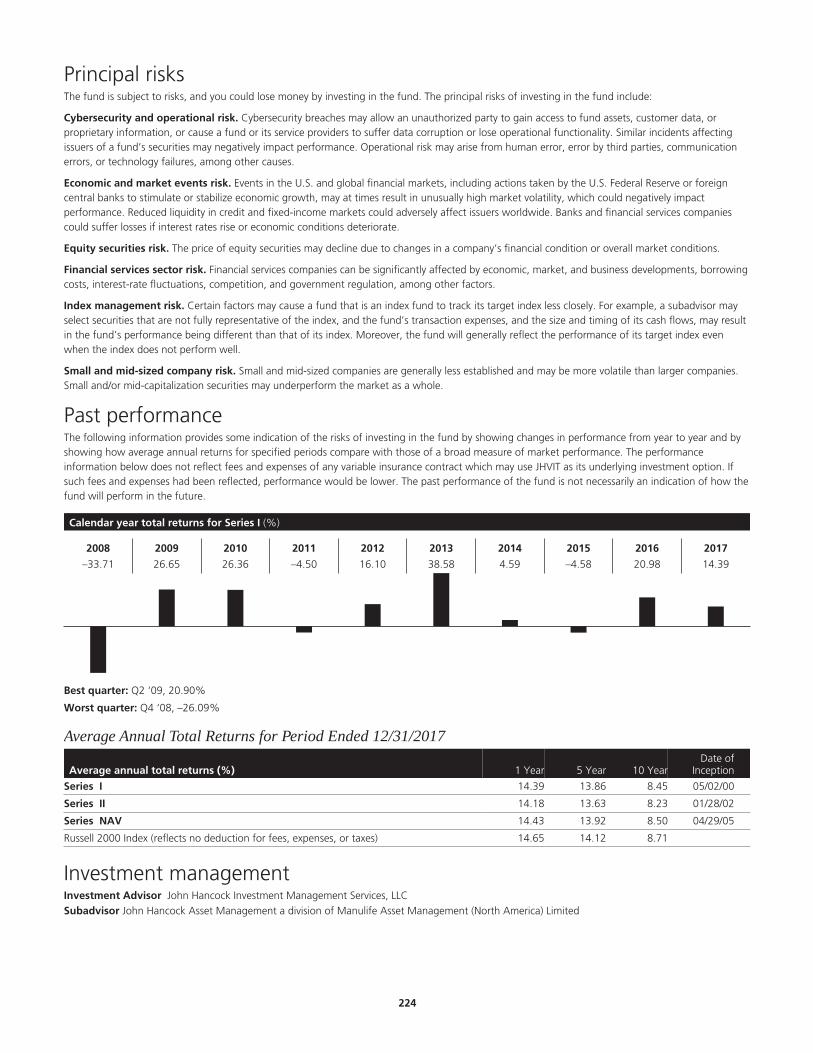
Principal risksThe fund is subject to risks, and you could lose money by investing in the fund. The principal risks of investing in the fund include:
Cybersecurity and operational risk. Cybersecurity breaches may allow an unauthorized party to gain access to fund assets, customer data, orproprietary information, or cause a fund or its service providers to suffer data corruption or lose operational functionality. Similar incidents affectingissuers of a fund’s securities may negatively impact performance. Operational risk may arise from human error, error by third parties, communicationerrors, or technology failures, among other causes.
Economic and market events risk. Events in the U.S. and global financial markets, including actions taken by the U.S. Federal Reserve or foreigncentral banks to stimulate or stabilize economic growth, may at times result in unusually high market volatility, which could negatively impactperformance. Reduced liquidity in credit and fixed-income markets could adversely affect issuers worldwide. Banks and financial services companiescould suffer losses if interest rates rise or economic conditions deteriorate.
Equity securities risk. The price of equity securities may decline due to changes in a company’s financial condition or overall market conditions.
Financial services sector risk. Financial services companies can be significantly affected by economic, market, and business developments, borrowingcosts, interest-rate fluctuations, competition, and government regulation, among other factors.
Index management risk. Certain factors may cause a fund that is an index fund to track its target index less closely. For example, a subadvisor mayselect securities that are not fully representative of the index, and the fund’s transaction expenses, and the size and timing of its cash flows, may resultin the fund’s performance being different than that of its index. Moreover, the fund will generally reflect the performance of its target index evenwhen the index does not perform well.
Small and mid-sized company risk. Small and mid-sized companies are generally less established and may be more volatile than larger companies.Small and/or mid-capitalization securities may underperform the market as a whole.
Past performanceThe following information provides some indication of the risks of investing in the fund by showing changes in performance from year to year and byshowing how average annual returns for specified periods compare with those of a broad measure of market performance. The performanceinformation below does not reflect fees and expenses of any variable insurance contract which may use JHVIT as its underlying investment option. Ifsuch fees and expenses had been reflected, performance would be lower. The past performance of the fund is not necessarily an indication of how thefund will perform in the future.
Calendar year total returns for Series I (%)
2008 2009 2010 2011 2012 2013 2014 2015 2016 2017
–33.71 26.65 26.36 –4.50 16.10 38.58 4.59 –4.58 20.98 14.39
Best quarter: Q2 ‘09, 20.90%
Worst quarter: Q4 ‘08, –26.09%
Average Annual Total Returns for Period Ended 12/31/2017
Average annual total returns (%) 1 Year 5 Year 10 YearDate of
Inception
Series I 14.39 13.86 8.45 05/02/00
Series II 14.18 13.63 8.23 01/28/02
Series NAV 14.43 13.92 8.50 04/29/05
Russell 2000 Index (reflects no deduction for fees, expenses, or taxes) 14.65 14.12 8.71
Investment managementInvestment Advisor John Hancock Investment Management Services, LLC§
Subadvisor John Hancock Asset Management a division of Manulife Asset Management (North America) Limited
.224

Portfolio managementBrett Hryb, CFAManaging Director and Senior Portfolio ManagerManaged fund since 2014
Ashikhusein Shahpurwala, CFAManaging Director and Senior Portfolio ManagerManaged fund since 2013
Other important information regarding the fundFor important information about taxes and financial intermediary compensation, please turn to “Additional information about the funds” at page258 of the Prospectus.
.225
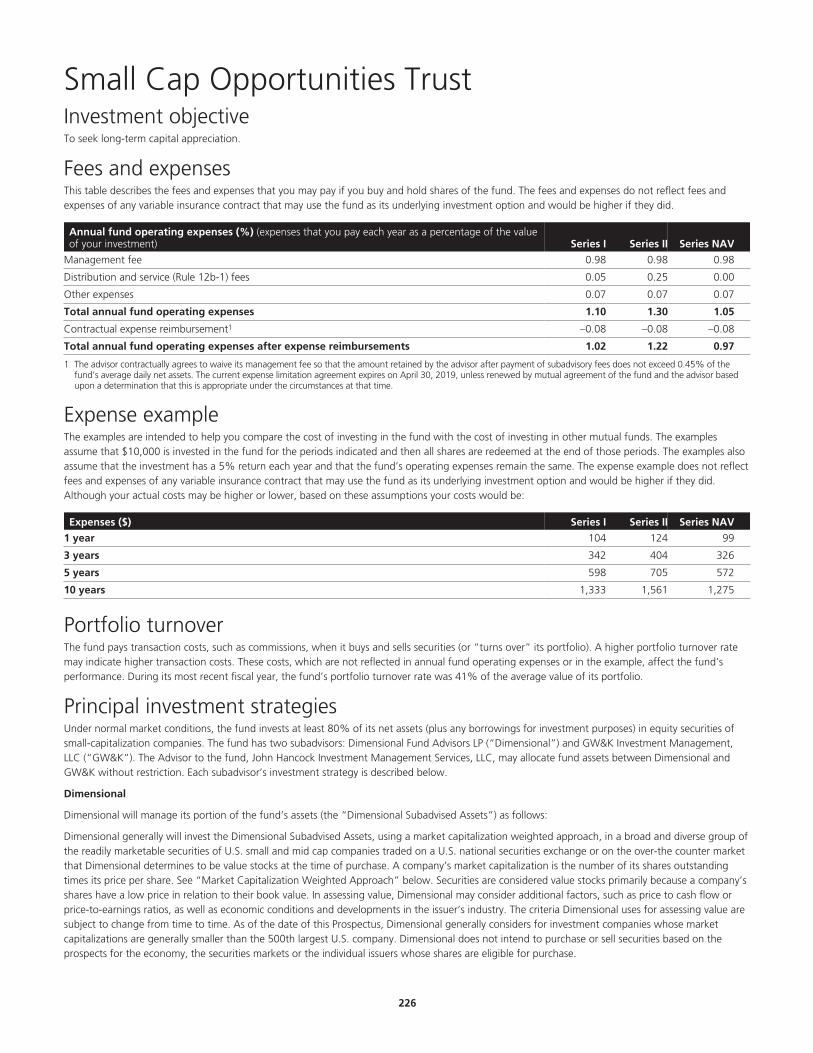
Small Cap Opportunities Trust Investment objectiveTo seek long-term capital appreciation.
Fees and expensesThis table describes the fees and expenses that you may pay if you buy and hold shares of the fund. The fees and expenses do not reflect fees andexpenses of any variable insurance contract that may use the fund as its underlying investment option and would be higher if they did.
Annual fund operating expenses (%) (expenses that you pay each year as a percentage of the valueof your investment) Series I Series II Series NAV
Management fee 0.98 0.98 0.98
Distribution and service (Rule 12b-1) fees 0.05 0.25 0.00
Other expenses 0.07 0.07 0.07
Total annual fund operating expenses 1.10 1.30 1.05
Contractual expense reimbursement1 –0.08 –0.08 –0.08
Total annual fund operating expenses after expense reimbursements 1.02 1.22 0.97
1 The advisor contractually agrees to waive its management fee so that the amount retained by the advisor after payment of subadvisory fees does not exceed 0.45% of thefund’s average daily net assets. The current expense limitation agreement expires on April 30, 2019, unless renewed by mutual agreement of the fund and the advisor basedupon a determination that this is appropriate under the circumstances at that time.
Expense exampleThe examples are intended to help you compare the cost of investing in the fund with the cost of investing in other mutual funds. The examplesassume that $10,000 is invested in the fund for the periods indicated and then all shares are redeemed at the end of those periods. The examples alsoassume that the investment has a 5% return each year and that the fund’s operating expenses remain the same. The expense example does not reflectfees and expenses of any variable insurance contract that may use the fund as its underlying investment option and would be higher if they did.Although your actual costs may be higher or lower, based on these assumptions your costs would be:
Expenses ($) Series I Series II Series NAV
1 year 104 124 99
3 years 342 404 326
5 years 598 705 572
10 years 1,333 1,561 1,275
Portfolio turnoverThe fund pays transaction costs, such as commissions, when it buys and sells securities (or “turns over” its portfolio). A higher portfolio turnover ratemay indicate higher transaction costs. These costs, which are not reflected in annual fund operating expenses or in the example, affect the fund’sperformance. During its most recent fiscal year, the fund’s portfolio turnover rate was 41% of the average value of its portfolio.
Principal investment strategiesUnder normal market conditions, the fund invests at least 80% of its net assets (plus any borrowings for investment purposes) in equity securities ofsmall-capitalization companies. The fund has two subadvisors: Dimensional Fund Advisors LP (“Dimensional”) and GW&K Investment Management,LLC (“GW&K”). The Advisor to the fund, John Hancock Investment Management Services, LLC, may allocate fund assets between Dimensional andGW&K without restriction. Each subadvisor’s investment strategy is described below.
Dimensional
Dimensional will manage its portion of the fund’s assets (the “Dimensional Subadvised Assets”) as follows:
Dimensional generally will invest the Dimensional Subadvised Assets, using a market capitalization weighted approach, in a broad and diverse group ofthe readily marketable securities of U.S. small and mid cap companies traded on a U.S. national securities exchange or on the over-the counter marketthat Dimensional determines to be value stocks at the time of purchase. A company’s market capitalization is the number of its shares outstandingtimes its price per share. See “Market Capitalization Weighted Approach” below. Securities are considered value stocks primarily because a company’sshares have a low price in relation to their book value. In assessing value, Dimensional may consider additional factors, such as price to cash flow orprice-to-earnings ratios, as well as economic conditions and developments in the issuer’s industry. The criteria Dimensional uses for assessing value aresubject to change from time to time. As of the date of this Prospectus, Dimensional generally considers for investment companies whose marketcapitalizations are generally smaller than the 500th largest U.S. company. Dimensional does not intend to purchase or sell securities based on theprospects for the economy, the securities markets or the individual issuers whose shares are eligible for purchase.
.226

Dimensional may sell portfolio securities when the issuer’s market capitalization increases to a level that exceeds that of the issuer with the largestmarket capitalization that is then eligible for investment by the Dimensional Subadvised Assets. In addition, Dimensional may sell portfolio securitieswhen their book-to market ratios fall below those of the security with the lowest such ratio that is then eligible for purchase by the DimensionalSubadvised Assets. However, Dimensional may retain securities of issuers with relatively smaller market capitalizations for longer periods, despite adecrease in the issuers’ book-to-market ratios.
The total market capitalization ranges, and the value criteria used by Dimensional for the Dimensional Subadvised Assets, as described above, generallyapply at the time of purchase. Dimensional will not be required to dispose of a security if the security’s issuer is no longer within the total marketcapitalization range or does not meet current value criteria. Similarly, Dimensional is not required to sell a security even if the decline in the marketcapitalization reflects a serious financial difficulty or potential or actual insolvency of the company. Securities that do meet the market capitalizationand/or value criteria nevertheless may be sold at any time when, in Dimensional’s judgment, circumstances warrant their sale. Dimensional may usederivatives such as futures contracts and options on futures contracts, to adjust market exposure based on actual or expected cash inflows to oroutflows from the fund. The fund does not intend to use derivatives for purposes of speculation or leveraging investment returns.
Dimensional may enter into futures contracts and options on futures contracts for U.S. equity securities and indices. Dimensional may also invest inETFs and similarly structured pooled investments for the purpose of gaining exposure to the U.S. equity markets while maintaining liquidity.
Market Capitalization Weighted Approach
The strategy used by Dimensional in managing the Dimensional Subadvised Assets involves market capitalization weighting in determining individualsecurity weights. Market capitalization weighting means each security is generally purchased based on the issuer’s relative market capitalization.
Market capitalization weighting may be adjusted by Dimensional for a variety of reasons. Dimensional may adjust the representation in theDimensional Subadvised Assets of an eligible company, or exclude a company, after considering such factors as free float, momentum, tradingstrategies, liquidity, value, profitability, and other factors determined to be appropriate by Dimensional given market conditions. In assessingprofitability, Dimensional may consider different ratios, such as that of earnings or profits from operations relative to book value or assets. The criteriaDimensional uses for assessing profitability are subject to change from time to time.
Dimensional may deviate from market capitalization weighting to limit or fix the exposure of the Dimensional Subadvised Assets to a particular issuerto a maximum proportion of the assets of the Dimensional Subadvised Assets. Dimensional may exclude the stock of a company that meets applicablemarket capitalization criteria if Dimensional determines that the purchase of such security is inappropriate in light of other conditions. Theseadjustments will result in a deviation from traditional market capitalization weighting.
GW&K
GW&K will manage its portion of the fund’s assets as follows:
GW&K utilizes fundamental research and bottom-up stock selection to identify undervalued small cap companies with sustainable earnings growth,and whose management is focused on enhancing value for shareholders. GW&K seeks to hold securities for the long term.§§
GW&K focuses on quality small-cap companies with sound management and long-term sustainable growth, regardless of style. In selecting companies,GW&K looks for firms with the following key attributes:
Experienced, tenured, high-quality management;
Business models that deliver consistent long-term growth;
Leading companies in attractive and defensible niche markets;
Strong financial characteristics; and
Appropriate valuation.
Various factors may lead GW&K to consider selling a particular security, such as a significant change in the relevant company’s senior management orits products, deterioration in its fundamental characteristics, if the company has corporate governance issues, or if GW&K believes that the security hasbecome overvalued.
Principal risksThe fund is subject to risks, and you could lose money by investing in the fund. The principal risks of investing in the fund include:
Convertible securities risk. The market values of convertible securities tend to fall as interest rates rise and rise as interest rates fall. As the marketprice of underlying common stock declines below the conversion price, the market value of the convertible security tends to be increasingly influencedby its yield.
Credit and counterparty risk. The counterparty to an over-the-counter derivatives contract or a borrower of fund securities may not make timelypayments or otherwise honor its obligations.
Cybersecurity and operational risk. Cybersecurity breaches may allow an unauthorized party to gain access to fund assets, customer data, orproprietary information, or cause a fund or its service providers to suffer data corruption or lose operational functionality. Similar incidents affectingissuers of a fund’s securities may negatively impact performance. Operational risk may arise from human error, error by third parties, communicationerrors, or technology failures, among other causes.
Economic and market events risk. Events in the U.S. and global financial markets, including actions taken by the U.S. Federal Reserve or foreigncentral banks to stimulate or stabilize economic growth, may at times result in unusually high market volatility, which could negatively impact
.227

performance. Reduced liquidity in credit and fixed-income markets could adversely affect issuers worldwide. Banks and financial services companiescould suffer losses if interest rates rise or economic conditions deteriorate.
Equity securities risk. The price of equity securities may decline due to changes in a company’s financial condition or overall market conditions.Growth company securities may fluctuate more in price than other securities because of the greater emphasis on earnings expectations. Securities themanager believes are undervalued may never realize their full potential value, and in certain markets value stocks may underperform the market as awhole.
Exchange-traded funds risk. An ETF generally reflects the risks of the underlying securities it is designed to track. A fund bears ETF fees and expensesindirectly.
Financial services sector risk. Financial services companies can be significantly affected by economic, market, and business developments, borrowingcosts, interest-rate fluctuations, competition, and government regulation, among other factors.
Foreign securities risk. Less information may be publicly available regarding foreign issuers. Foreign securities may be subject to foreign taxes andmay be more volatile than U.S. securities. Currency fluctuations and political and economic developments may adversely impact the value of foreignsecurities.
Hedging, derivatives, and other strategic transactions risk. Hedging, derivatives, and other strategic transactions may increase a fund’s volatilityand could produce disproportionate losses, potentially more than the fund’s principal investment. Risks of these transactions are different from andpossibly greater than risks of investing directly in securities and other traditional instruments. Under certain market conditions, derivatives couldbecome harder to value or sell and may become subject to liquidity risk (i.e., the inability to enter into closing transactions). Regulatory changes inderivative markets could impact the cost of or the fund’s ability to engage in derivatives transactions. Derivatives and other strategic transactions thatthe fund intends to utilize include: futures contracts and options. Futures contracts and options generally are subject to counterparty risk.
Investment company securities risk. A fund bears underlying fund fees and expenses indirectly.
Liquidity risk. The extent (if at all) to which a security may be sold or a derivative position closed without negatively impacting its market value may beimpaired by reduced market activity or participation, legal restrictions, or other economic and market impediments.
Small and mid-sized company risk. Small and mid-sized companies are generally less established and may be more volatile than larger companies.Small and/or mid-capitalization securities may underperform the market as a whole.
Past performanceThe following information provides some indication of the risks of investing in the fund by showing changes in performance from year to year and byshowing how average annual returns for specified periods compare with those of a broad measure of market performance. The Russell 2000 ValueIndex shows how the fund’s performance compares against the returns of similar investments. The performance information below does not reflectfees and expenses of any variable insurance contract which may use JHVIT as its underlying investment option. If such fees and expenses had beenreflected, performance would be lower. The past performance of the fund is not necessarily an indication of how the fund will perform in the future.
Calendar year total returns for Series I (%)
2008 2009 2010 2011 2012 2013 2014 2015 2016 2017
–42.13 33.87 29.67 –3.16 16.84 40.16 2.38 –5.17 19.47 11.07
Best quarter: Q2 ‘09, 26.43%
Worst quarter: Q4 ‘08, –26.09%
Average Annual Total Returns for Period Ended 12/31/2017
Average annual total returns (%) 1 Year 5 Year 10 YearDate of
Inception
Series I 11.07 12.55 7.46 05/05/03
Series II 10.86 12.33 7.24 05/05/03
Series NAV 11.19 12.62 7.51 02/28/05
Russell 2000 Index (reflects no deduction for fees, expenses, or taxes) 14.65 14.12 8.71
Russell 2000 Value Index (reflects no deduction for fees, expenses, or taxes) 7.84 13.01 8.17
.228
Investment managementInvestment Advisor John Hancock Investment Management Services, LLC§
Subadvisor Dimensional Fund Advisors LP§
Subadvisor GW&K Investment Management, LLC
Portfolio managementJoseph H. Chi, CFASenior Portfolio Manager and Vice President;Dimensional Fund Advisors LPManaged fund since 2012
Jed S. FogdallSenior Portfolio Manager and Vice President;Dimensional Fund Advisors LPManaged fund since 2012
Joel SchneiderSenior Portfolio Manager and Vice President;Dimensional Fund Advisors LPManaged fund since 2015
Joseph C. Craigen, CFAPartner and Equity Portfolio ManagerGW&K Investment Management, LLCManaged the fund since 2017
Daniel L. Miller, CFAPartner and Director of EquitiesGW&K Investment Management, LLCManaged the fund since 2017
Other important information regarding the fundFor important information about taxes and financial intermediary compensation, please turn to “Additional information about the funds” at page258 of the Prospectus.
.229

Small Cap Stock Trust (formerly Small Cap Growth Trust)Investment objectiveTo seek long-term capital appreciation.
Fees and expensesThis table describes the fees and expenses that you may pay if you buy and hold shares of the fund. The fees and expenses do not reflect fees andexpenses of any variable insurance contract that may use the fund as its underlying investment option and would be higher if they did.
Annual fund operating expenses (%) (expenses that you pay each year as a percentage of the valueof your investment) Series I Series II Series NAV
Management fee1 1.00 1.00 1.00
Distribution and service (Rule 12b-1) fees 0.05 0.25 0.00
Other expenses 0.06 0.06 0.06
Total annual fund operating expenses 1.11 1.31 1.06
1 “Management fee” has been restated to reflect the contractual management fee schedule effective July 1, 2017.
Expense exampleThe examples are intended to help you compare the cost of investing in the fund with the cost of investing in other mutual funds. The examplesassume that $10,000 is invested in the fund for the periods indicated and then all shares are redeemed at the end of those periods. The examples alsoassume that the investment has a 5% return each year and that the fund’s operating expenses remain the same. The expense example does not reflectfees and expenses of any variable insurance contract that may use the fund as its underlying investment option and would be higher if they did.Although your actual costs may be higher or lower, based on these assumptions your costs would be:
Expenses ($) Series I Series II Series NAV
1 year 113 133 108
3 years 353 415 337
5 years 612 718 585
10 years 1,352 1,579 1,294
Portfolio turnoverThe fund pays transaction costs, such as commissions, when it buys and sells securities (or “turns over” its portfolio). A higher portfolio turnover ratemay indicate higher transaction costs. These costs, which are not reflected in annual fund operating expenses or in the example, affect the fund’sperformance. During its most recent fiscal year, the fund’s portfolio turnover rate was 102% of the average value of its portfolio.
Principal investment strategiesUnder normal market conditions, the fund invests at least 80% of its net assets (plus any borrowings for investment purposes) in stocks of small capcompanies. For the purposes of the fund, “small cap companies” are those with market capitalizations, at the time of investment, not exceeding themaximum market capitalization of any company represented in either the Russell 2000 Index (approximately $13.4 billion as of February 28, 2018) orthe S&P Small Cap 600 Index (approximately $13.6 billion as of February 28, 2018).
The fund invests in small-cap companies that are believed to offer above-average potential for growth in revenues and earnings. Market capitalizationsof companies in the indices change over time; however, the fund will not sell a security just because a company has grown to a market capitalizationoutside the maximum range of the indices.
The subadvisor selects stocks using a combination of quantitative screens and bottom-up, fundamental security research. Quantitative screening seeksto narrow the list of small capitalization companies and to identify a group of companies with strong revenue growth and accelerating earnings.Fundamental equity research seeks to identify individual companies from that group with a higher potential for earnings growth and capitalappreciation.
The subadvisor looks for companies based on a combination of criteria including one or more of the following:
Improving market shares and positive financial trends;
Superior management with significant equity ownership; and
Attractive valuations relative to earnings growth outlook.
The fund is likely to experience periods of higher turnover in portfolio securities because the subadvisor frequently adjusts the selection of companiesand/or their position size based on these criteria. The fund’s sector exposures are broadly diversified, but are primarily a result of stock selection and
.230
therefore may vary significantly from its benchmark. The fund may invest up to 25% of its total assets in foreign securities, including emerging marketsecurities. The fund may invest significantly in the information technology sector.
Except as otherwise stated under “Additional Information About the Funds — Temporary Defensive Investing,” the fund normally has 10% or less(usually lower) of its total assets in cash and cash equivalents.
The fund may invest in Initial Public Offerings (IPOs). The fund may also purchase each of the following types of securities:
U.S. dollar-denominated foreign securities and certain exchange-traded funds (ETFs).
Principal risksThe fund is subject to risks, and you could lose money by investing in the fund. The principal risks of investing in the fund include:
Cybersecurity and operational risk. Cybersecurity breaches may allow an unauthorized party to gain access to fund assets, customer data, orproprietary information, or cause a fund or its service providers to suffer data corruption or lose operational functionality. Similar incidents affectingissuers of a fund’s securities may negatively impact performance. Operational risk may arise from human error, error by third parties, communicationerrors, or technology failures, among other causes.
Economic and market events risk. Events in the U.S. and global financial markets, including actions taken by the U.S. Federal Reserve or foreigncentral banks to stimulate or stabilize economic growth, may at times result in unusually high market volatility, which could negatively impactperformance. Reduced liquidity in credit and fixed-income markets could adversely affect issuers worldwide. Banks and financial services companiescould suffer losses if interest rates rise or economic conditions deteriorate.
Equity securities risk. The price of equity securities may decline due to changes in a company’s financial condition or overall market conditions.Growth company securities may fluctuate more in price than other securities because of the greater emphasis on earnings expectations.
Exchange-traded funds risk. An ETF generally reflects the risks of the underlying securities it is designed to track. A fund bears ETF fees and expensesindirectly.
Foreign securities risk. Less information may be publicly available regarding foreign issuers. Foreign securities may be subject to foreign taxes andmay be more volatile than U.S. securities. Currency fluctuations and political and economic developments may adversely impact the value of foreignsecurities. The risks of investing in foreign securities are magnified in emerging markets.
High portfolio turnover risk. Trading securities actively and frequently can increase transaction costs (thus lowering performance) and taxabledistributions.
Information technology risk. Information technology companies can be significantly affected by rapid obsolescence, short product cycles,competition, and government regulation, among other factors.
Initial public offerings risk. IPO share prices are frequently volatile and may significantly impact fund performance.
Liquidity risk. The extent (if at all) to which a security may be sold or a derivative position closed without negatively impacting its market value may beimpaired by reduced market activity or participation, legal restrictions, or other economic and market impediments.
Real estate securities risk. Securities of companies in the real estate industry carry risks associated with owning real estate, including the potential fora decline in value due to economic or market conditions.
Small and mid-sized company risk. Small and mid-sized companies are generally less established and may be more volatile than larger companies.Small and/or mid-capitalization securities may underperform the market as a whole.
Past performanceThe following information provides some indication of the risks of investing in the fund by showing changes in performance from year to year and byshowing how average annual returns for specified periods compare with those of a broad measure of market performance. The performanceinformation below does not reflect fees and expenses of any variable insurance contract which may use JHVIT as its underlying investment option. Ifsuch fees and expenses had been reflected, performance would be lower. The past performance of the fund is not necessarily an indication of how thefund will perform in the future.
.231
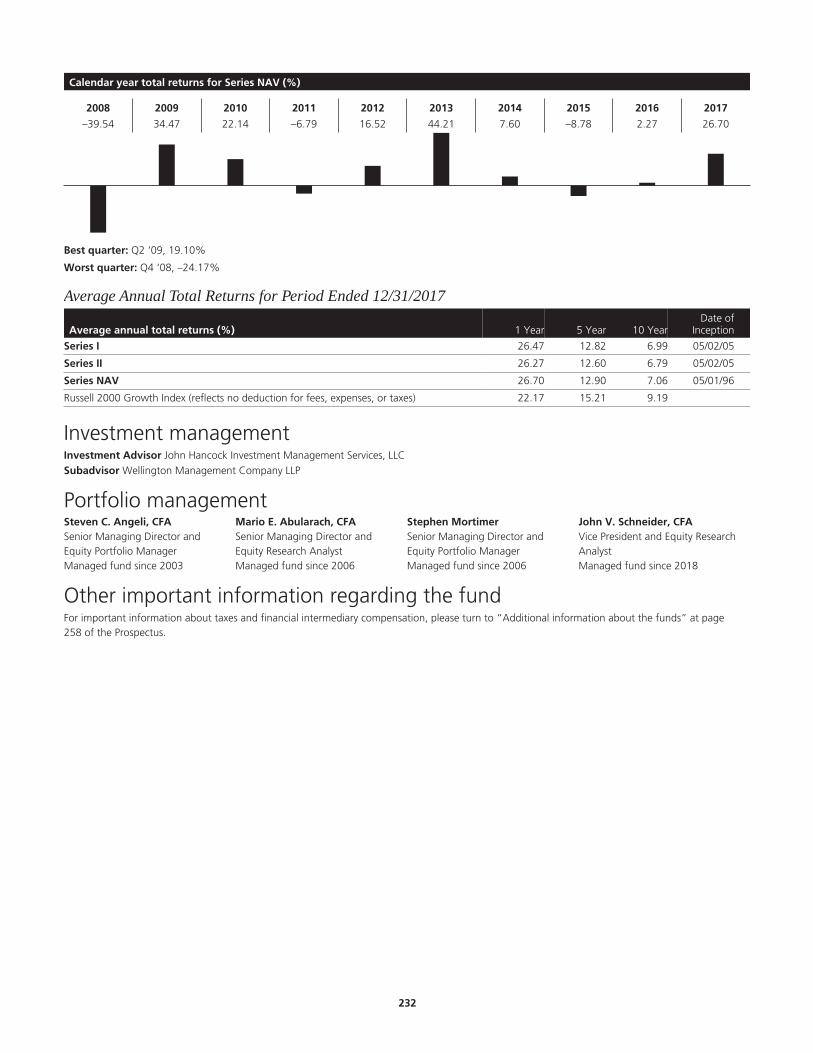
Calendar year total returns for Series NAV (%)
2008 2009 2010 2011 2012 2013 2014 2015 2016 2017
–39.54 34.47 22.14 –6.79 16.52 44.21 7.60 –8.78 2.27 26.70
Best quarter: Q2 ‘09, 19.10%
Worst quarter: Q4 ‘08, –24.17%
Average Annual Total Returns for Period Ended 12/31/2017
Average annual total returns (%) 1 Year 5 Year 10 YearDate of
Inception
Series I 26.47 12.82 6.99 05/02/05
Series II 26.27 12.60 6.79 05/02/05
Series NAV 26.70 12.90 7.06 05/01/96
Russell 2000 Growth Index (reflects no deduction for fees, expenses, or taxes) 22.17 15.21 9.19
Investment managementInvestment Advisor John Hancock Investment Management Services, LLC§
Subadvisor Wellington Management Company LLP
Portfolio managementSteven C. Angeli, CFASenior Managing Director andEquity Portfolio ManagerManaged fund since 2003
Mario E. Abularach, CFASenior Managing Director andEquity Research AnalystManaged fund since 2006
Stephen MortimerSenior Managing Director andEquity Portfolio ManagerManaged fund since 2006
John V. Schneider, CFAVice President and Equity ResearchAnalystManaged fund since 2018
Other important information regarding the fundFor important information about taxes and financial intermediary compensation, please turn to “Additional information about the funds” at page258 of the Prospectus.
.232
Small Cap Value Trust Investment objectiveTo seek long-term capital appreciation.
Fees and expensesThis table describes the fees and expenses that you may pay if you buy and hold shares of the fund. The fees and expenses do not reflect fees andexpenses of any variable insurance contract that may use the fund as its underlying investment option and would be higher if they did.
Annual fund operating expenses (%) (expenses that you pay each year as a percentage of the valueof your investment) Series I Series II Series NAV
Management fee 1.03 1.03 1.03
Distribution and service (Rule 12b-1) fees 0.05 0.25 0.00
Other expenses 0.05 0.05 0.05
Acquired fund fees and expenses1 0.05 0.05 0.05
Total annual fund operating expenses2 1.18 1.38 1.13
1 “Acquired fund fees and expenses” are based on indirect net expenses associated with the fund’s investments in underlying investment companies.2 The “Total annual fund operating expenses” shown may not correlate to the fund’s ratios of expenses to average daily net assets shown in the “Financial highlights” section of
the fund’s prospectus, which does not include “Acquired fund fees and expenses.”
Expense exampleThe examples are intended to help you compare the cost of investing in the fund with the cost of investing in other mutual funds. The examplesassume that $10,000 is invested in the fund for the periods indicated and then all shares are redeemed at the end of those periods. The examples alsoassume that the investment has a 5% return each year and that the fund’s operating expenses remain the same. The expense example does not reflectfees and expenses of any variable insurance contract that may use the fund as its underlying investment option and would be higher if they did.Although your actual costs may be higher or lower, based on these assumptions your costs would be:
Expenses ($) Series I Series II Series NAV
1 year 120 140 115
3 years 375 437 359
5 years 649 755 622
10 years 1,432 1,657 1,375
Portfolio turnoverThe fund pays transaction costs, such as commissions, when it buys and sells securities (or “turns over” its portfolio). A higher portfolio turnover ratemay indicate higher transaction costs. These costs, which are not reflected in annual fund operating expenses or in the example, affect the fund’sperformance. During its most recent fiscal year, the fund’s portfolio turnover rate was 19% of the average value of its portfolio.
Principal investment strategiesUnder normal market conditions, the fund invests at least 80% of its net assets (plus any borrowings for investment purposes) in small-cap companiesthat are believed to be undervalued by various measures and offer good prospects for capital appreciation. For the purposes of the fund, “small capcompanies” are those with market capitalizations, at the time of investment, not exceeding the maximum market capitalization of any companyrepresented in either the Russell 2000 Index ($13.4 billion as of February 28, 2018) or the S&P SmallCap 600 Index ($13.6 billion as of February 28,2018).
The fund invests primarily in a diversified mix of common stocks of U.S. small-cap companies. The subadvisor employs a value-oriented investmentapproach in selecting stocks, using proprietary fundamental research to identify stocks the subadvisor believes have distinct value characteristics basedon industry-specific valuation criteria. The subadvisor focuses on high quality companies with a proven record of above-average rates of profitabilitythat sell at a discount relative to the overall small-cap market.
Fundamental research is then used to identify those companies demonstrating one or more of the following characteristics:
Sustainable competitive advantages within a market niche;
Strong profitability and free cash flows;
Strong market share positions and trends;
Quality of and share ownership by management; and
Financial structures that are more conservative than the relevant industry average.
.233

The fund’s sector exposures are broadly diversified, but are primarily a result of stock selection and may, therefore, vary significantly from itsbenchmark. The fund may invest up to 15% of its total assets in foreign securities (with no more than 5% in emerging market securities). The fundmay have significant investments in the financial services sector.
Except as otherwise stated under “Additional Information about the Funds — Temporary Defensive Investing,” the fund normally has 10% or less(usually lower) of its total assets invested in cash and cash equivalents.
The fund may invest in initial public offerings (“IPOs”). The fund may also purchase each of the following types of securities: real estate investmenttrusts (“REITs”) or other real estate related equity securities, U.S. dollar-denominated foreign securities and certain exchange-traded funds (“ETFs”). Forpurposes of the fund, ETFs are considered securities with a market capitalization equal to the weighted average market capitalization of the basket ofsecurities comprising the ETF.
Principal risksThe fund is subject to risks, and you could lose money by investing in the fund. The principal risks of investing in the fund include:
Cybersecurity and operational risk. Cybersecurity breaches may allow an unauthorized party to gain access to fund assets, customer data, orproprietary information, or cause a fund or its service providers to suffer data corruption or lose operational functionality. Similar incidents affectingissuers of a fund’s securities may negatively impact performance. Operational risk may arise from human error, error by third parties, communicationerrors, or technology failures, among other causes.
Economic and market events risk. Events in the U.S. and global financial markets, including actions taken by the U.S. Federal Reserve or foreigncentral banks to stimulate or stabilize economic growth, may at times result in unusually high market volatility, which could negatively impactperformance. Reduced liquidity in credit and fixed-income markets could adversely affect issuers worldwide. Banks and financial services companiescould suffer losses if interest rates rise or economic conditions deteriorate.
Equity securities risk. The price of equity securities may decline due to changes in a company’s financial condition or overall market conditions.Securities the manager believes are undervalued may never realize their full potential value, and in certain markets value stocks may underperform themarket as a whole.
Exchange-traded funds risk. An ETF generally reflects the risks of the underlying securities it is designed to track. A fund bears ETF fees and expensesindirectly.
Financial services sector risk. Financial services companies can be significantly affected by economic, market, and business developments, borrowingcosts, interest-rate fluctuations, competition, and government regulation, among other factors.
Foreign securities risk. Less information may be publicly available regarding foreign issuers. Foreign securities may be subject to foreign taxes andmay be more volatile than U.S. securities. Currency fluctuations and political and economic developments may adversely impact the value of foreignsecurities. The risks of investing in foreign securities are magnified in emerging markets.
Initial public offerings risk. IPO share prices are frequently volatile and may significantly impact fund performance.
Real estate investment trust risk. REITs, pooled investment vehicles that typically invest in real estate directly or in loans collateralized by real estate,carry risks associated with owning real estate, including the potential for a decline in value due to economic or market conditions.
Real estate securities risk. Securities of companies in the real estate industry carry risks associated with owning real estate, including the potential fora decline in value due to economic or market conditions.
Sector risk. When a fund focuses its investments in certain sectors of the economy, its performance may be driven largely by sector performance andcould fluctuate more widely than if the fund were invested more evenly across sectors.
Small and mid-sized company risk. Small and mid-sized companies are generally less established and may be more volatile than larger companies.Small and/or mid-capitalization securities may underperform the market as a whole.
Value investing style risk. The fund emphasizes a value style of investing, which focuses on undervalued companies with characteristics for improvedvaluations. This style of investing is subject to the risk that the valuations never improve or that the returns on value equity securities are less thanreturns on other styles of investing or the overall stock market. Value stocks also may decline in price, even though in theory they are alreadyunderpriced.
Past performanceThe following information provides some indication of the risks of investing in the fund by showing changes in performance from year to year and byshowing how average annual returns for specified periods compare with those of a broad measure of market performance. The performanceinformation below does not reflect fees and expenses of any variable insurance contract which may use JHVIT as its underlying investment option. Ifsuch fees and expenses had been reflected, performance would be lower. The past performance of the fund is not necessarily an indication of how thefund will perform in the future.
.234
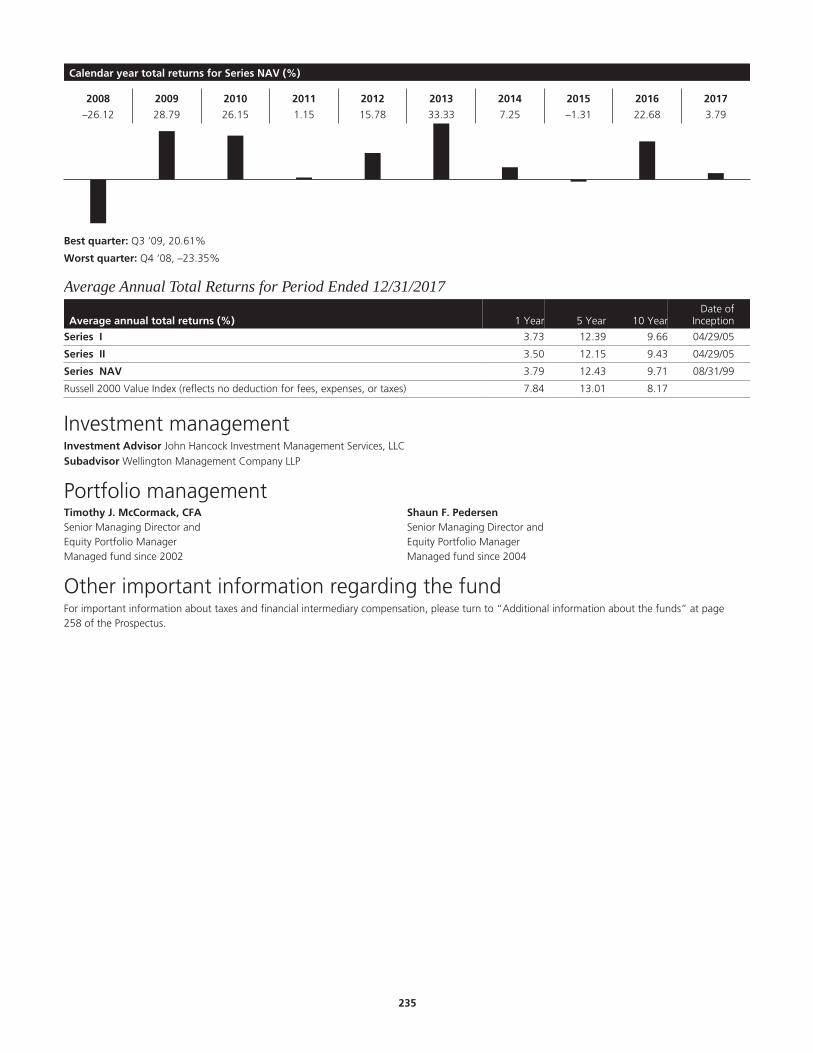
Calendar year total returns for Series NAV (%)
2008 2009 2010 2011 2012 2013 2014 2015 2016 2017
–26.12 28.79 26.15 1.15 15.78 33.33 7.25 –1.31 22.68 3.79
Best quarter: Q3 ‘09, 20.61%
Worst quarter: Q4 ‘08, –23.35%
Average Annual Total Returns for Period Ended 12/31/2017
Average annual total returns (%) 1 Year 5 Year 10 YearDate of
Inception
Series I 3.73 12.39 9.66 04/29/05
Series II 3.50 12.15 9.43 04/29/05
Series NAV 3.79 12.43 9.71 08/31/99
Russell 2000 Value Index (reflects no deduction for fees, expenses, or taxes) 7.84 13.01 8.17
Investment managementInvestment Advisor John Hancock Investment Management Services, LLC§
Subadvisor Wellington Management Company LLP
Portfolio managementTimothy J. McCormack, CFASenior Managing Director andEquity Portfolio ManagerManaged fund since 2002
Shaun F. PedersenSenior Managing Director andEquity Portfolio ManagerManaged fund since 2004
Other important information regarding the fundFor important information about taxes and financial intermediary compensation, please turn to “Additional information about the funds” at page258 of the Prospectus.
.235
Small Company Value Trust Investment objectiveTo seek long-term growth of capital.
Fees and expensesThis table describes the fees and expenses that you may pay if you buy and hold shares of the fund. The fees and expenses do not reflect fees andexpenses of any variable insurance contract that may use the fund as its underlying investment option and would be higher if they did.
Annual fund operating expenses (%) (expenses that you pay each year as a percentage of the valueof your investment) Series I Series II Series NAV
Management fee 1.05 1.05 1.05
Distribution and service (Rule 12b-1) fees 0.05 0.25 0.00
Other expenses 0.05 0.05 0.05
Acquired fund fees and expenses1 0.12 0.12 0.12
Total annual fund operating expenses2 1.27 1.47 1.22
1 “Acquired fund fees and expenses” are based on indirect net expenses associated with the fund’s investments in underlying investment companies.2 The “Total annual fund operating expenses” shown may not correlate to the fund’s ratios of expenses to average daily net assets shown in the “Financial highlights” section of
the fund’s prospectus, which does not include “Acquired fund fees and expenses.”
Expense exampleThe examples are intended to help you compare the cost of investing in the fund with the cost of investing in other mutual funds. The examplesassume that $10,000 is invested in the fund for the periods indicated and then all shares are redeemed at the end of those periods. The examples alsoassume that the investment has a 5% return each year and that the fund’s operating expenses remain the same. The expense example does not reflectfees and expenses of any variable insurance contract that may use the fund as its underlying investment option and would be higher if they did.Although your actual costs may be higher or lower, based on these assumptions your costs would be:
Expenses ($) Series I Series II Series NAV
1 year 129 150 124
3 years 403 465 387
5 years 697 803 670
10 years 1,534 1,757 1,477
Portfolio turnoverThe fund pays transaction costs, such as commissions, when it buys and sells securities (or “turns over” its portfolio). A higher portfolio turnover ratemay indicate higher transaction costs. These costs, which are not reflected in annual fund operating expenses or in the example, affect the fund’sperformance. During its most recent fiscal year, the fund’s portfolio turnover rate was 19% of the average value of its portfolio.
Principal investment strategiesUnder normal market conditions, the fund invests at least 80% of its net assets (plus any borrowings for investment purposes) in companies withmarket capitalizations, at the time of investment, that do not exceed the maximum market capitalization of any security in the Russell 2000 Index ($8million to $13.9 billion as of February 28, 2018). The fund invests in small companies whose common stocks are believed to be undervalued. Themarket capitalization of the companies in the fund’s portfolio and the Russell 2000 Index changes over time, and the fund will not sell a stock justbecause the company has grown to a market capitalization outside the range. The fund may, on occasion, purchase companies with a marketcapitalization above the range.
Reflecting a value approach to investing, the fund will seek the stocks of companies whose current stock prices do not appear to adequately reflecttheir underlying value as measured by assets, earnings, cash flow, or business franchises. The subadvisor’s in house research team seeks to identifycompanies that appear to be undervalued by various measures, and may be temporarily out of favor, but have good prospects for capital appreciation.In selecting investments, they generally look for some of the following factors:
Low price/earnings, price/book value or price/cash flow ratios relative to the Russell 2000 Index, the company’s peers or its own historic norm;
Low stock price relative to a company’s underlying asset values;
Above-average dividend yield relative to a company’s peers or its own historic norm;
A plan to improve the business through restructuring; and/or
A sound balance sheet and other positive financial characteristics.
While most assets will be invested in U.S. common stocks, including real estate investment trusts (REITs) that pool money to invest in properties andmortgages, the fund may purchase other securities, including foreign securities (up to 20% of its total net assets), futures, and options. The fund may
.236
invest in fixed-income and convertible securities without restrictions on quality or rating, including up to 10% of total assets in below-investment-gradefixed-income securities (“junk bonds”) and loans. The fund’s fixed-income investments may include privately negotiated notes or loans, including loanparticipations and assignments (“bank loans”). These investments in bank loans will be made only in companies, municipalities or entities that meetthe fund’s investment criteria. Direct investments in bank loans may be illiquid and holding a loan could expose the fund to the risks of being a directlender. Since the fund invests primarily in equity securities, the risks associated with fixed-income securities will not affect the fund as much as theywould a fund that invests more of its assets in fixed-income securities.
The fund holds a certain portion of its assets in money market reserves, which can consist of shares of certain internal T. Rowe Price money marketfunds as well as U.S. dollar and foreign currency-denominated money market securities, including repurchase agreements, in the two highest ratingcategories, maturing in one year or less.
The fund may sell securities for a variety of reasons, such as to secure gains, limit losses or redeploy assets into more promising opportunities.
The fund may invest up to 10% of its total assets in hybrid instruments. Hybrid instruments are a type of high-risk derivatives which can combine thecharacteristics of securities, futures and options. Such securities may bear interest or pay dividends at below (or even relatively nominal) rates. The fundmay focus its investments in a particular sector or sectors of the economy.
Principal risksThe fund is subject to risks, and you could lose money by investing in the fund. The principal risks of investing in the fund include:
Convertible securities risk. The market values of convertible securities tend to fall as interest rates rise and rise as interest rates fall. As the marketprice of underlying common stock declines below the conversion price, the market value of the convertible security tends to be increasingly influencedby its yield.
Credit and counterparty risk. The issuer or guarantor of a fixed-income security, the counterparty to an over-the-counter derivatives contract, or aborrower of fund securities may not make timely payments or otherwise honor its obligations. A downgrade or default affecting any of the fund’ssecurities could affect the fund’s performance.
Currency risk. Fluctuations in exchange rates may adversely affect the U.S. dollar value of a fund’s investments. Foreign currencies may decline invalue, which could negatively impact performance.
Cybersecurity and operational risk. Cybersecurity breaches may allow an unauthorized party to gain access to fund assets, customer data, orproprietary information, or cause a fund or its service providers to suffer data corruption or lose operational functionality. Similar incidents affectingissuers of a fund’s securities may negatively impact performance. Operational risk may arise from human error, error by third parties, communicationerrors, or technology failures, among other causes.
Economic and market events risk. Events in the U.S. and global financial markets, including actions taken by the U.S. Federal Reserve or foreigncentral banks to stimulate or stabilize economic growth, may at times result in unusually high market volatility, which could negatively impactperformance. Reduced liquidity in credit and fixed-income markets could adversely affect issuers worldwide. Banks and financial services companiescould suffer losses if interest rates rise or economic conditions deteriorate.
Equity securities risk. The price of equity securities may decline due to changes in a company’s financial condition or overall market conditions.Securities the manager believes are undervalued may never realize their full potential value, and in certain markets value stocks may underperform themarket as a whole.
Financial services sector risk. Financial services companies can be significantly affected by economic, market, and business developments, borrowingcosts, interest-rate fluctuations, competition, and government regulation, among other factors.
Fixed-income securities risk. A rise in interest rates typically causes bond prices to fall. The longer the average maturity or duration of the bonds heldby a fund, the more sensitive it will likely be to interest-rate fluctuations. An issuer may not make all interest payments or repay all or any of theprincipal borrowed. Changes in a security’s credit quality may adversely affect fund performance.
Foreign securities risk. Less information may be publicly available regarding foreign issuers. Foreign securities may be subject to foreign taxes andmay be more volatile than U.S. securities. Currency fluctuations and political and economic developments may adversely impact the value of foreignsecurities.
Hedging, derivatives, and other strategic transactions risk. Hedging, derivatives, and other strategic transactions may increase a fund’s volatilityand could produce disproportionate losses, potentially more than the fund’s principal investment. Risks of these transactions are different from andpossibly greater than risks of investing directly in securities and other traditional instruments. Under certain market conditions, derivatives couldbecome harder to value or sell and may become subject to liquidity risk (i.e., the inability to enter into closing transactions). Regulatory changes inderivative markets could impact the cost of or the fund’s ability to engage in derivative transactions. Derivatives and other strategic transactions thatthe fund intends to utilize include: futures contracts and options. Futures contracts and options generally are subject to counterparty risk.
Hybrid instrument risk. Hybrid instruments entail greater market risk and may be more volatile than traditional debt instruments, may bear interestor pay preferred dividends at below-market rates, and may be illiquid. The risks of investing in hybrid instruments are a combination of the risks ofinvesting in securities, options, futures, and currencies.
Investment company securities risk. A fund bears underlying fund fees and expenses indirectly.
Liquidity risk. The extent (if at all) to which a security may be sold or a derivative position closed without negatively impacting its market value may beimpaired by reduced market activity or participation, legal restrictions, or other economic and market impediments. Liquidity risk may be magnified in
.237
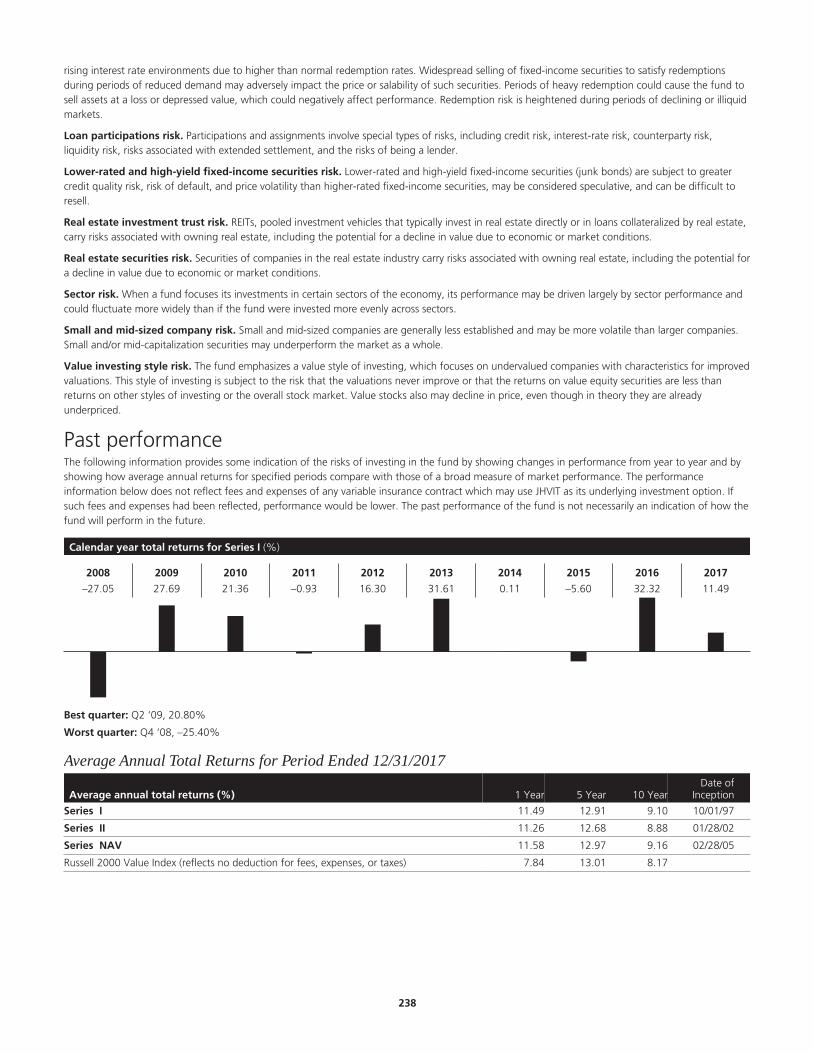
rising interest rate environments due to higher than normal redemption rates. Widespread selling of fixed-income securities to satisfy redemptionsduring periods of reduced demand may adversely impact the price or salability of such securities. Periods of heavy redemption could cause the fund tosell assets at a loss or depressed value, which could negatively affect performance. Redemption risk is heightened during periods of declining or illiquidmarkets.
Loan participations risk. Participations and assignments involve special types of risks, including credit risk, interest-rate risk, counterparty risk,liquidity risk, risks associated with extended settlement, and the risks of being a lender.
Lower-rated and high-yield fixed-income securities risk. Lower-rated and high-yield fixed-income securities (junk bonds) are subject to greatercredit quality risk, risk of default, and price volatility than higher-rated fixed-income securities, may be considered speculative, and can be difficult toresell.
Real estate investment trust risk. REITs, pooled investment vehicles that typically invest in real estate directly or in loans collateralized by real estate,carry risks associated with owning real estate, including the potential for a decline in value due to economic or market conditions.
Real estate securities risk. Securities of companies in the real estate industry carry risks associated with owning real estate, including the potential fora decline in value due to economic or market conditions.
Sector risk. When a fund focuses its investments in certain sectors of the economy, its performance may be driven largely by sector performance andcould fluctuate more widely than if the fund were invested more evenly across sectors.
Small and mid-sized company risk. Small and mid-sized companies are generally less established and may be more volatile than larger companies.Small and/or mid-capitalization securities may underperform the market as a whole.
Value investing style risk. The fund emphasizes a value style of investing, which focuses on undervalued companies with characteristics for improvedvaluations. This style of investing is subject to the risk that the valuations never improve or that the returns on value equity securities are less thanreturns on other styles of investing or the overall stock market. Value stocks also may decline in price, even though in theory they are alreadyunderpriced.
Past performanceThe following information provides some indication of the risks of investing in the fund by showing changes in performance from year to year and byshowing how average annual returns for specified periods compare with those of a broad measure of market performance. The performanceinformation below does not reflect fees and expenses of any variable insurance contract which may use JHVIT as its underlying investment option. Ifsuch fees and expenses had been reflected, performance would be lower. The past performance of the fund is not necessarily an indication of how thefund will perform in the future.
Calendar year total returns for Series I (%)
2008 2009 2010 2011 2012 2013 2014 2015 2016 2017
–27.05 27.69 21.36 –0.93 16.30 31.61 0.11 –5.60 32.32 11.49
Best quarter: Q2 ‘09, 20.80%
Worst quarter: Q4 ‘08, –25.40%
Average Annual Total Returns for Period Ended 12/31/2017
Average annual total returns (%) 1 Year 5 Year 10 YearDate of
Inception
Series I 11.49 12.91 9.10 10/01/97
Series II 11.26 12.68 8.88 01/28/02
Series NAV 11.58 12.97 9.16 02/28/05
Russell 2000 Value Index (reflects no deduction for fees, expenses, or taxes) 7.84 13.01 8.17
.238
Investment managementInvestment Advisor John Hancock Investment Management Services, LLC§
Subadvisor T. Rowe Price Associates, Inc.
Portfolio managementJ. David Wagner, CFAVice PresidentManaged fund since 2014
Other important information regarding the fundFor important information about taxes and financial intermediary compensation, please turn to “Additional information about the funds” at page258 of the Prospectus.
.239
Strategic Equity Allocation Trust Investment objectiveTo seek capital appreciation.
Fees and expensesThis table describes the fees and expenses that you may pay if you buy and hold shares of the fund. The fees and expenses do not reflect fees andexpenses of any variable insurance contract that may use the fund as its underlying investment option and would be higher if they did.
Annual fund operating expenses (%) (expenses that you pay each year as a percentage of the valueof your investment) Series I Series II Series NAV
Management fee 0.62 0.62 0.62
Distribution and service (Rule 12b-1) fees 0.05 0.25 0.00
Other expenses 0.041 0.041 0.04
Total annual fund operating expenses 0.71 0.91 0.66
1 “Other expenses,” such as expected transfer agency expenses, have been estimated for the first year of operations of the fund’s Series I and Series II shares.
Expense exampleThe examples are intended to help you compare the cost of investing in the fund with the cost of investing in other mutual funds. The examplesassume that $10,000 is invested in the fund for the periods indicated and then all shares are redeemed at the end of those periods. The examples alsoassume that the investment has a 5% return each year and that the fund’s operating expenses remain the same. The expense example does not reflectfees and expenses of any variable insurance contract that may use the fund as its underlying investment option and would be higher if they did.Although your actual costs may be higher or lower, based on these assumptions your costs would be:
Expenses ($) Series I Series II Series NAV
1 year 73 93 67
3 years 227 290 211
5 years 395 504 368
10 years 883 1,120 822
Portfolio turnoverThe fund pays transaction costs, such as commissions, when it buys and sells securities (or “turns over” its portfolio). A higher portfolio turnover ratemay indicate higher transaction costs. These costs, which are not reflected in annual fund operating expenses or in the example, affect the fund’sperformance. During its most recent fiscal year, the fund’s portfolio turnover rate was 5% of the average value of its portfolio.
Principal investment strategiesThe fund seeks to achieve its investment objective by investing under normal market conditions at least 80% of its net assets (plus any borrowings forinvestment purposes) in U.S. and foreign equity securities of any market capitalization, including futures on indexes of equity securities. The fund’sallocation to various markets and types of securities will be actively managed.
The fund may invest in both developed and emerging markets. The fund’s investment in equity securities will vary both with respect to types ofsecurities and markets in response to changing market and economic trends. The precise mix of securities will depend on the subadvisor’s outlook forthe markets and generally reflect the subadvisor’s strategic asset allocation analysis and its assessment of the relative attractiveness of a particular assetclass. When determining whether to invest in a particular market, the subadvisor considers various factors, including economic and political conditions,potential for economic growth and possible changes in currency exchange rates.
The fund also may invest in exchange-traded funds and fixed-income securities, including, but not limited to:
U.S. Treasury and agency securities as well as notes backed by the Federal Deposit Insurance Corporation,
U.S. Treasury futures contracts,
Mortgage-backed securities, including mortgage pass-through securities, commercial mortgage-backed securities (“CMBS”) and collateralizedmortgage obligations (“CMOs”),
U.S. and foreign corporate bonds,
Foreign government and agency securities, and
Lower Rated Fixed Income Securities and High Yield Securities (also known as “junk bonds”).
The foreign securities in which the fund invests may be denominated in U.S. dollars or foreign currency. The fund may actively manage its exposure toforeign currencies through the use of foreign currency forward contracts and other currency derivatives. The fund may own foreign cash equivalentsand foreign bank deposits as part of its investment strategy. The fund may invest in foreign currencies for hedging and speculative purposes.
.240

The fund will engage in derivatives transactions, including but not limited to, futures and options contracts, foreign currency forward contracts andswaps including credit default swaps and total return swaps, for hedging and nonhedging purposes including, without limitation, the followingpurposes:
to attempt to protect against possible changes in the market value of securities held or to be purchased by the fund resulting from securities marketsor currency exchange rate fluctuations,
to protect the fund’s unrealized gains in the value of its securities,
to facilitate the sale of the fund’s securities for investment purposes,
to manage the effective maturity or duration of the fund’s securities,
to establish a position in the derivatives markets as a method of gaining exposure to a particular security or market,
to facilitate the repatriation of foreign currency and the settlement of purchases of foreign securities, and
to increase or decrease exposure to a foreign currency or to shift exposure to foreign currency fluctuations from one country to another.
Principal risksThe fund is subject to risks, and you could lose money by investing in the fund. The principal risks of investing in the fund include:
Asset allocation risk. Although allocation among asset categories generally limits exposure to any one category, the management team may favor acategory that performs poorly relative to the others.
Credit and counterparty risk. The issuer or guarantor of a fixed-income security, the counterparty to an over-the-counter derivatives contract, or aborrower of fund securities may not make timely payments or otherwise honor its obligations. U.S. government securities are subject to varyingdegrees of credit risk depending upon the nature of their support. A downgrade or default affecting any of the fund’s securities could affect the fund’sperformance.
Cybersecurity and operational risk. Cybersecurity breaches may allow an unauthorized party to gain access to fund assets, customer data, orproprietary information, or cause a fund or its service providers to suffer data corruption or lose operational functionality. Similar incidents affectingissuers of a fund’s securities may negatively impact performance. Operational risk may arise from human error, error by third parties, communicationerrors, or technology failures, among other causes.
Economic and market events risk. Events in the U.S. and global financial markets, including actions taken by the U.S. Federal Reserve or foreigncentral banks to stimulate or stabilize economic growth, may at times result in unusually high market volatility, which could negatively impactperformance. Reduced liquidity in credit and fixed-income markets could adversely affect issuers worldwide. Banks and financial services companiescould suffer losses if interest rates rise or economic conditions deteriorate.
Equity securities risk. The price of equity securities may decline due to changes in a company’s financial condition or overall market conditions.Growth company securities may fluctuate more in price than other securities because of the greater emphasis on earnings expectations.
Exchange-traded funds risk. An ETF generally reflects the risks of the underlying securities it is designed to track. A fund bears ETF fees and expensesindirectly.
Fixed-income securities risk. A rise in interest rates typically causes bond prices to fall. The longer the average maturity or duration of the bonds heldby a fund, the more sensitive it will likely be to interest-rate fluctuations. An issuer may not make all interest payments or repay all or any of theprincipal borrowed. Changes in a security’s credit quality may adversely affect fund performance.
Foreign securities risk. Less information may be publicly available regarding foreign issuers. Foreign securities may be subject to foreign taxes andmay be more volatile than U.S. securities. Currency fluctuations and political and economic developments may adversely impact the value of foreignsecurities. The risks of investing in foreign securities are magnified in emerging markets.
Hedging, derivatives, and other strategic transactions risk. Hedging, derivatives, and other strategic transactions may increase a fund’s volatilityand could produce disproportionate losses, potentially more than the fund’s principal investment. Risks of these transactions are different from andpossibly greater than risks of investing directly in securities and other traditional instruments. Under certain market conditions, derivatives couldbecome harder to value or sell and may become subject to liquidity risk (i.e., the inability to enter into closing transactions). Regulatory changes inderivative markets could impact the cost of or the fund’s ability to engage in derivative transactions. Derivatives and other strategic transactions thatthe fund intends to utilize include: credit default swaps, foreign currency forward contracts, futures contracts, options, total return swaps, and swaps.Foreign currency forward contracts, futures contracts, options, and swaps generally are subject to counterparty risk. In addition, swaps may be subjectto interest-rate and settlement risk, and the risk of default of the underlying reference obligation. Derivatives associated with foreign currencytransactions are subject to currency risk.
Large company risk. Larger companies may grow more slowly than smaller companies or be slower to respond to business developments. Large-capitalization securities may underperform the market as a whole.
Liquidity risk. The extent (if at all) to which a security may be sold or a derivative position closed without negatively impacting its market value may beimpaired by reduced market activity or participation, legal restrictions, or other economic and market impediments. Liquidity risk may be magnified inrising interest rate environments due to higher than normal redemption rates. Widespread selling of fixed-income securities to satisfy redemptionsduring periods of reduced demand may adversely impact the price or salability of such securities. Periods of heavy redemption could cause the fund tosell assets at a loss or depressed value, which could negatively affect performance. Redemption risk is heightened during periods of declining or illiquidmarkets.
.241
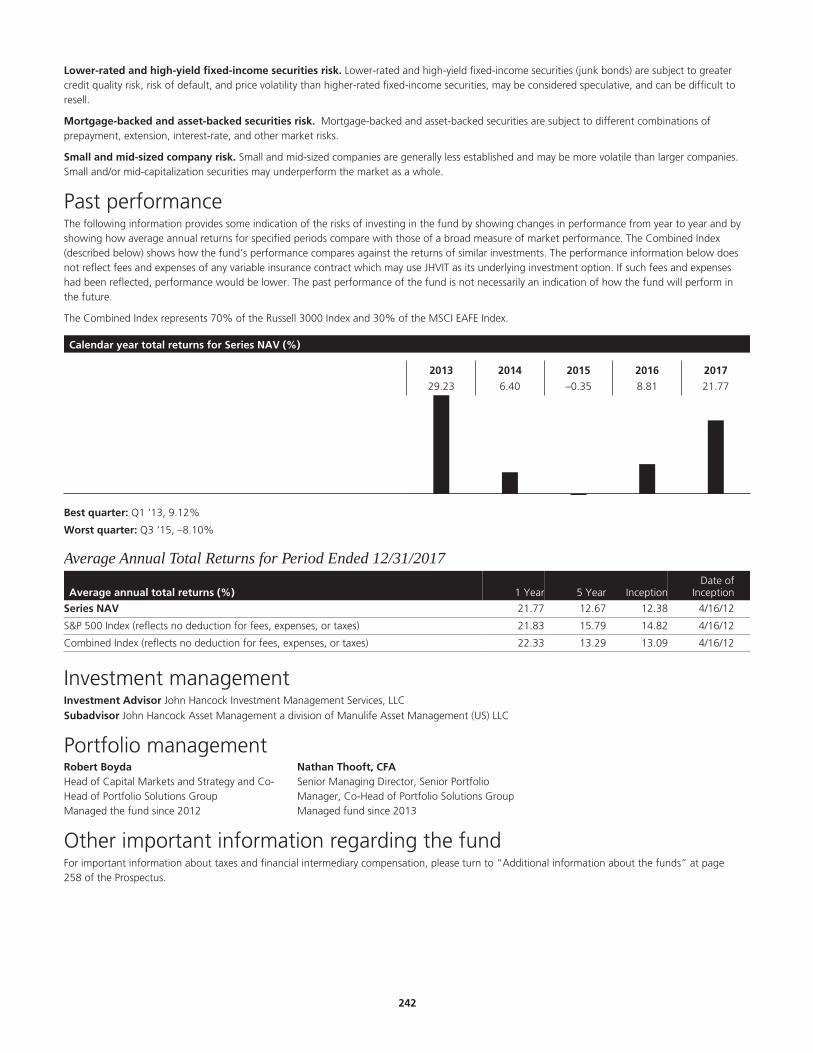
Lower-rated and high-yield fixed-income securities risk. Lower-rated and high-yield fixed-income securities (junk bonds) are subject to greatercredit quality risk, risk of default, and price volatility than higher-rated fixed-income securities, may be considered speculative, and can be difficult toresell.
Mortgage-backed and asset-backed securities risk. Mortgage-backed and asset-backed securities are subject to different combinations ofprepayment, extension, interest-rate, and other market risks.
Small and mid-sized company risk. Small and mid-sized companies are generally less established and may be more volatile than larger companies.Small and/or mid-capitalization securities may underperform the market as a whole.
Past performanceThe following information provides some indication of the risks of investing in the fund by showing changes in performance from year to year and byshowing how average annual returns for specified periods compare with those of a broad measure of market performance. The Combined Index(described below) shows how the fund’s performance compares against the returns of similar investments. The performance information below doesnot reflect fees and expenses of any variable insurance contract which may use JHVIT as its underlying investment option. If such fees and expenseshad been reflected, performance would be lower. The past performance of the fund is not necessarily an indication of how the fund will perform inthe future.
The Combined Index represents 70% of the Russell 3000 Index and 30% of the MSCI EAFE Index.
Calendar year total returns for Series NAV (%)
2013 2014 2015 2016 2017
29.23 6.40 –0.35 8.81 21.77
Best quarter: Q1 ‘13, 9.12%
Worst quarter: Q3 ‘15, –8.10%
Average Annual Total Returns for Period Ended 12/31/2017
Average annual total returns (%) 1 Year 5 Year InceptionDate of
Inception
Series NAV 21.77 12.67 12.38 4/16/12
S&P 500 Index (reflects no deduction for fees, expenses, or taxes) 21.83 15.79 14.82 4/16/12
Combined Index (reflects no deduction for fees, expenses, or taxes) 22.33 13.29 13.09 4/16/12
Investment managementInvestment Advisor John Hancock Investment Management Services, LLC§
Subadvisor John Hancock Asset Management a division of Manulife Asset Management (US) LLC
Portfolio managementRobert BoydaHead of Capital Markets and Strategy and Co-Head of Portfolio Solutions GroupManaged the fund since 2012
Nathan Thooft, CFASenior Managing Director, Senior PortfolioManager, Co-Head of Portfolio Solutions GroupManaged fund since 2013
Other important information regarding the fundFor important information about taxes and financial intermediary compensation, please turn to “Additional information about the funds” at page258 of the Prospectus.
.242

Strategic Income Opportunities Trust Investment objectiveTo seek a high level of current income.
Fees and expensesThis table describes the fees and expenses that you may pay if you buy and hold shares of the fund. The fees and expenses do not reflect fees andexpenses of any variable insurance contract that may use the fund as its underlying investment option and would be higher if they did.
Annual fund operating expenses (%) (expenses that you pay each year as a percentage of the valueof your investment) Series I Series II Series NAV
Management fee 0.63 0.63 0.63
Distribution and service (Rule 12b-1) fees 0.05 0.25 0.00
Other expenses 0.05 0.05 0.05
Total annual fund operating expenses 0.73 0.93 0.68
Expense exampleThe examples are intended to help you compare the cost of investing in the fund with the cost of investing in other mutual funds. The examplesassume that $10,000 is invested in the fund for the periods indicated and then all shares are redeemed at the end of those periods. The examples alsoassume that the investment has a 5% return each year and that the fund’s operating expenses remain the same. The expense example does not reflectfees and expenses of any variable insurance contract that may use the fund as its underlying investment option and would be higher if they did.Although your actual costs may be higher or lower, based on these assumptions your costs would be:
Expenses ($) Series I Series II Series NAV
1 year 75 95 69
3 years 233 296 218
5 years 406 515 379
10 years 906 1,143 847
Portfolio turnoverThe fund pays transaction costs, such as commissions, when it buys and sells securities (or “turns over” its portfolio). A higher portfolio turnover ratemay indicate higher transaction costs. These costs, which are not reflected in annual fund operating expenses or in the example, affect the fund’sperformance. During its most recent fiscal year, the fund’s portfolio turnover rate was 40% of the average value of its portfolio.
Principal investment strategiesUnder normal market conditions, the fund invests primarily in the following types of securities: foreign government and corporate debt securities fromdeveloped and emerging markets, U.S. government and agency securities, and high-yield bonds.
The fund may also invest in preferred stock and other types of debt securities.
Although the fund may invest up to 10% of its net assets in securities rated as low as D (in default) by Standard & Poor’s Ratings Services (“S&P”) orMoody’s Investors Service, Inc. (“Moody’s”) (or their unrated equivalents) (i.e., “junk bonds”), it seeks to keep its average credit quality in theinvestment-grade range (AAA to BBB). There is no limit on the fund’s average maturity. The fund’s investment policies are based on credit ratings atthe time of purchase.
In managing the fund, the subadvisor allocates assets among the three major types of securities (U.S. government debt and mortgages; corporate debt— primarily high yield; and foreign debt — both government and corporate, including emerging markets) based on analysis of economic factors, suchas projected international interest rate movements, industry cycles and political trends. However, the subadvisor may invest up to 100% of the fund’stotal assets in any one sector. Within each type of security, the subadvisor looks for investments that are appropriate for the overall fund in terms ofyield, credit quality, structure and industry distribution. In selecting securities, relative yields and risk/reward ratios are the primary considerations.
The fund may use certain higher-risk investments, including restricted or illiquid securities and derivatives, which include futures contracts on securities,indices and foreign currency; options on futures contracts, securities, indices and foreign currency; interest rate, foreign currency and credit defaultswaps; and foreign currency forward contracts, in each case, for the purposes of reducing risk, obtaining efficient market exposure and/or enhancinginvestment returns. In addition, the fund may invest up to 10% of its net assets in domestic or foreign common stocks.
Use of Hedging and Other Strategic Transactions. The fund is authorized to use all of the various investment strategies referred to under “AdditionalInformation About the Funds’ Principal Risks — Hedging, derivatives and other strategic transactions risk” including, but not limited to, U.S. Treasuryfutures and options, index derivatives, credit default swaps and currency forwards and options.
.243
Principal risksThe fund is subject to risks, and you could lose money by investing in the fund. The principal risks of investing in the fund include:
Asset-backed securities risk. Asset-backed securities are subject to different combinations of prepayment, extension, interest-rate, and other marketrisks.
Changing distribution levels risk. The fund may cease or reduce the level of its distribution or make a greater return of capital if income ordividends paid from its investments declines.
Credit and counterparty risk. The issuer or guarantor of a fixed-income security, the counterparty to an over-the-counter derivatives contract, or aborrower of fund securities may not make timely payments or otherwise honor its obligations. U.S. government securities are subject to varyingdegrees of credit risk depending upon the nature of their support. A downgrade or default affecting any of the fund’s securities could affect the fund’sperformance.
Currency risk. Fluctuations in exchange rates may adversely affect the U.S. dollar value of a fund’s investments. Foreign currencies may decline invalue, which could negatively impact performance.
Cybersecurity and operational risk. Cybersecurity breaches may allow an unauthorized party to gain access to fund assets, customer data, orproprietary information, or cause a fund or its service providers to suffer data corruption or lose operational functionality. Similar incidents affectingissuers of a fund’s securities may negatively impact performance. Operational risk may arise from human error, error by third parties, communicationerrors, or technology failures, among other causes.
Defaulted debt risk. Investing in defaulted debt securities is speculative and involves substantial risks in addition to those of non-defaulted high-yieldsecurities. Defaulted debt securities generally do not generate interest payments. Principal on defaulted debt might not be repaid, and a fund couldlose up to its entire investment.
Economic and market events risk. Events in the U.S. and global financial markets, including actions taken by the U.S. Federal Reserve or foreigncentral banks to stimulate or stabilize economic growth, may at times result in unusually high market volatility, which could negatively impactperformance. Reduced liquidity in credit and fixed-income markets could adversely affect issuers worldwide. Banks and financial services companiescould suffer losses if interest rates rise or economic conditions deteriorate.
Equity securities risk. The price of equity securities may decline due to changes in a company’s financial condition or overall market conditions.
Fixed-income securities risk. A rise in interest rates typically causes bond prices to fall. The longer the average maturity or duration of the bonds heldby a fund, the more sensitive it will likely be to interest-rate fluctuations. An issuer may not make all interest payments or repay all or any of theprincipal borrowed. Changes in a security’s credit quality may adversely affect fund performance.
Foreign securities risk. Less information may be publicly available regarding foreign issuers. Foreign securities may be subject to foreign taxes andmay be more volatile than U.S. securities. Currency fluctuations and political and economic developments may adversely impact the value of foreignsecurities. The risks of investing in foreign securities are magnified in emerging markets.
Hedging, derivatives, and other strategic transactions risk. Hedging, derivatives, and other strategic transactions may increase a fund’s volatilityand could produce disproportionate losses, potentially more than the fund’s principal investment. Risks of these transactions are different from andpossibly greater than risks of investing directly in securities and other traditional instruments. Under certain market conditions, derivatives couldbecome harder to value or sell and may become subject to liquidity risk (i.e., the inability to enter into closing transactions). Regulatory changes inderivative markets could impact the cost of or the fund’s ability to engage in derivative transactions. Derivatives and other strategic transactions thatthe fund intends to utilize include: credit default swaps, foreign currency forward contracts, futures contracts, options, total return swaps, and swaps.Foreign currency forward contracts, futures contracts, options, and swaps generally are subject to counterparty risk. In addition, swaps may be subjectto interest-rate and settlement risk, and the risk of default of the underlying reference obligation. Derivatives associated with foreign currencytransactions are subject to currency risk.
High portfolio turnover risk. Trading securities actively and frequently can increase transaction costs (thus lowering performance) and taxabledistributions.
Liquidity risk. The extent (if at all) to which a security may be sold or a derivative position closed without negatively impacting its market value may beimpaired by reduced market activity or participation, legal restrictions, or other economic and market impediments. Liquidity risk may be magnified inrising interest rate environments due to higher than normal redemption rates. Widespread selling of fixed-income securities to satisfy redemptionsduring periods of reduced demand may adversely impact the price or salability of such securities. Periods of heavy redemption could cause the fund tosell assets at a loss or depressed value, which could negatively affect performance. Redemption risk is heightened during periods of declining or illiquidmarkets.
Lower-rated and high-yield fixed-income securities risk. Lower-rated and high-yield fixed-income securities (junk bonds) are subject to greatercredit quality risk, risk of default, and price volatility than higher-rated fixed-income securities, may be considered speculative, and can be difficult toresell.
Mortgage-backed and asset-backed securities risk. Mortgage-backed and asset-backed securities are subject to different combinations ofprepayment, extension, interest-rate, and other market risks.
Preferred and convertible securities risk. Preferred stock dividends are payable only if declared by the issuer’s Board. Preferred stock may be subjectto redemption provisions. The market values of convertible securities tend to fall as interest rates rise and rise as interest rates fall. Convertiblepreferred stock’s value can depend heavily upon the underlying common stock’s value.
.244

Sector risk. When a fund focuses its investments in certain sectors of the economy, its performance may be driven largely by sector performance andcould fluctuate more widely than if the fund were invested more evenly across sectors.
Past performanceThe following information provides some indication of the risks of investing in the fund by showing changes in performance from year to year and byshowing how average annual returns for specified periods compare with those of a broad measure of market performance. The performanceinformation below does not reflect fees and expenses of any variable insurance contract which may use JHVIT as its underlying investment option. Ifsuch fees and expenses had been reflected, performance would be lower. The past performance of the fund is not necessarily an indication of how thefund will perform in the future.
Calendar year total returns for Series I (%)
2008 2009 2010 2011 2012 2013 2014 2015 2016 2017
–8.61 26.66 15.89 2.02 12.86 3.74 5.14 1.22 5.12 5.59
Best quarter: Q2 ‘09, 9.61%
Worst quarter: Q3 ‘11, –8.83%
Average Annual Total Returns for Period Ended 12/31/2017
Average annual total returns (%) 1 Year 5 Year 10 YearDate of
Inception
Series I 5.59 4.15 6.59 05/03/04
Series II 5.37 3.95 6.38 05/03/04
Series NAV 5.66 4.20 6.64 04/29/05Bloomberg Barclays U.S. Aggregate Bond Index (reflects no deduction for fees, expenses, ortaxes) 3.54 2.10 4.01
Investment managementInvestment Advisor John Hancock Investment Management Services, LLC§
Subadvisor John Hancock Asset Management a division of Manulife Asset Management (US) LLC
Portfolio managementDaniel S. Janis IIISenior Managing Director and Senior PortfolioManagerManaged fund since 2004
Thomas C. GogginsSenior Managing Director and Senior PortfolioManagerManaged fund since 2009
Kisoo ParkManaging Director and Portfolio ManagerManaged fund since 2015
Christopher M. Chapman, CFAManaging Director and Portfolio ManagerManaged fund since 2017
Other important information regarding the fundFor important information about taxes and financial intermediary compensation, please turn to “Additional information about the funds” at page258 of the Prospectus.
.245
Total Bond Market Trust (formerly Total Bond Market Trust B)Investment objectiveTo seek to track the performance of the Bloomberg Barclays U.S. Aggregate Bond Index (the “Bloomberg Barclays Index”) (which represents the U.S.investment grade bond market).
Fees and expensesThis table describes the fees and expenses that you may pay if you buy and hold shares of the fund. The fees and expenses do not reflect fees andexpenses of any variable insurance contract that may use the fund as its underlying investment option and would be higher if they did.
Annual fund operating expenses (%) (expenses that you pay each year as a percentage of the valueof your investment) Series I Series II Series NAV
Management fee 0.47 0.47 0.47
Distribution and service (Rule 12b-1) fees 0.05 0.25 0.00
Other expenses 0.05 0.05 0.05
Acquired fund fees and expenses1 0.01 0.01 0.01
Total annual fund operating expenses2 0.58 0.78 0.53
Contractual expense reimbursement3 –0.27 –0.27 –0.27
Total annual fund operating expenses after expense reimbursements 0.31 0.51 0.26
1 “Acquired fund fees and expenses” are based on indirect net expenses associated with the fund’s investments in underlying investment companies.2 The “Total annual fund operating expenses” shown may not correlate to the fund’s ratios of expenses to average daily net assets shown in the “Financial highlights” section of
the fund’s prospectus, which does not include “Acquired fund fees and expenses.”3 The advisor contractually agrees to reduce its management fee or, if necessary, make payment to the fund in an amount equal to the amount by which expenses of the fund
exceed 0.25% of average daily net assets of the fund. For purposes of this agreement, “expenses of the fund” means all fund expenses, excluding (a) taxes, (b) brokeragecommissions, (c) interest expense, (d) litigation and indemnification expenses and other extraordinary expenses not incurred in the ordinary course of the fund’s business, (e)class-specific expenses, (f) borrowing costs, (g) prime brokerage fees, (h) acquired fund fees and expenses paid indirectly, and (i) short dividend expense. This agreement expireson April 30, 2019, unless renewed by mutual agreement of the advisor and the fund based upon a determination that this is appropriate under the circumstances at that time.
Expense exampleThe examples are intended to help you compare the cost of investing in the fund with the cost of investing in other mutual funds. The examplesassume that $10,000 is invested in the fund for the periods indicated and then all shares are redeemed at the end of those periods. The examples alsoassume that the investment has a 5% return each year and that the fund’s operating expenses remain the same. The expense example does not reflectfees and expenses of any variable insurance contract that may use the fund as its underlying investment option and would be higher if they did.Although your actual costs may be higher or lower, based on these assumptions your costs would be:
Expenses ($) Series I Series II Series NAV
1 year 32 52 27
3 years 159 222 143
5 years 297 407 269
10 years 700 941 639
Portfolio turnoverThe fund pays transaction costs, such as commissions, when it buys and sells securities (or “turns over” its portfolio). A higher portfolio turnover ratemay indicate higher transaction costs. These costs, which are not reflected in annual fund operating expenses or in the example, affect the fund’sperformance. During its most recent fiscal year, the fund’s portfolio turnover rate was 46% of the average value of its portfolio.
Principal investment strategiesUnder normal market conditions, the fund invests at least 80% of its net assets (plus any borrowing for investment purposes) in securities listed in theBloomberg Barclays U.S. Aggregate Bond Index (the Bloomberg Barclays Index).
The fund is an index fund, which differs from actively managed funds. Actively managed funds seek to outperform their respective indices throughresearch and analysis. Over time, their performance may differ significantly from their respective indices. The fund is a passively managed fund thatseeks to mirror the performance of its target index, minimizing performance differences over time.
An index is an unmanaged group of securities whose overall performance is used as an investment benchmark. Indices may track broad investmentmarkets, such as the global equity market, or more narrow investment markets, such as the U.S. small cap equity market. The fund attempts to matchthe performance of the Bloomberg Barclays Index by holding a representative sample of the securities that comprise the Bloomberg Barclays Index.
.246

However, an index fund has operating expenses and transaction costs, while a market index does not. Therefore, the fund, while it attempts to trackits target index closely, typically will be unable to match the performance of the target index exactly.
The fund is an intermediate term bond fund of high and medium credit quality that seeks to track the performance of the Bloomberg Barclays Index,which broadly represents the U.S. investment grade bond market. The fund’s investment policies are based on credit ratings at the time of purchase.
The subadvisor employs a passive management strategy using quantitative techniques to select individual securities that provide a representativesample of the securities in the Bloomberg Barclays Index.
The Bloomberg Barclays Index consists of U.S. dollar-denominated, fixed rate, investment grade debt securities with maturities generally greater thanone year and outstanding par values of at least $200 million, including:
U.S. Treasury and agency securities;
Asset-backed and mortgage-backed securities, including mortgage pass-through securities and commercial mortgage-backed securities (“CMBS”)and collateralized mortgage offerings (“CMOs”);
Corporate bonds, both U.S. and foreign (if U.S. dollar-denominated); and
Foreign government and agency securities (if U.S. dollar-denominated).
The subadvisor selects securities to match, as closely as practicable, the Bloomberg Barclays Index’s duration, cash flow, sector, credit quality, callabilityand other key performance characteristics.
The Bloomberg Barclays Index composition may change from time to time. The subadvisor will reflect those changes as soon as practicable.
The fund may purchase other types of securities that are not primary investment vehicles. These would include, for example, certain derivatives(investments whose value is based on indexes or other securities) such as futures contracts, interest-rate swaps and options.
Use of Hedging and Other Strategic Transactions. The fund is authorized to use all of the various investment strategies referred to under “AdditionalInformation About the Funds’ Principal Risks — Hedging, derivatives and other strategic transactions risk” such as futures contracts, interest-rate swapsand options.
Principal risksThe fund is subject to risks, and you could lose money by investing in the fund. The principal risks of investing in the fund include:
Credit and counterparty risk. The issuer or guarantor of a fixed-income security, the counterparty to an over-the-counter derivatives contract, or aborrower of fund securities may not make timely payments or otherwise honor its obligations. U.S. government securities are subject to varyingdegrees of credit risk depending upon the nature of their support. A downgrade or default affecting any of the fund’s securities could affect the fund’sperformance.
Cybersecurity and operational risk. Cybersecurity breaches may allow an unauthorized party to gain access to fund assets, customer data, orproprietary information, or cause a fund or its service providers to suffer data corruption or lose operational functionality. Similar incidents affectingissuers of a fund’s securities may negatively impact performance. Operational risk may arise from human error, error by third parties, communicationerrors, or technology failures, among other causes.
Economic and market events risk. Events in the U.S. and global financial markets, including actions taken by the U.S. Federal Reserve or foreigncentral banks to stimulate or stabilize economic growth, may at times result in unusually high market volatility, which could negatively impactperformance. Reduced liquidity in credit and fixed-income markets could adversely affect issuers worldwide. Banks and financial services companiescould suffer losses if interest rates rise or economic conditions deteriorate.
Fixed-income securities risk. A rise in interest rates typically causes bond prices to fall. The longer the average maturity or duration of the bonds heldby a fund, the more sensitive it will likely be to interest-rate fluctuations. An issuer may not make all interest payments or repay all or any of theprincipal borrowed. Changes in a security’s credit quality may adversely affect fund performance.
Foreign securities risk. Less information may be publicly available regarding foreign issuers. Foreign securities may be subject to foreign taxes andmay be more volatile than U.S. securities. Currency fluctuations and political and economic developments may adversely impact the value of foreignsecurities.
Hedging, derivatives, and other strategic transactions risk. Hedging, derivatives, and other strategic transactions may increase a fund’s volatilityand could produce disproportionate losses, potentially more than the fund’s principal investment. Risks of these transactions are different from andpossibly greater than risks of investing directly in securities and other traditional instruments. Under certain market conditions, derivatives couldbecome harder to value or sell and may become subject to liquidity risk (i.e., the inability to enter into closing transactions). Regulatory changes inderivative markets could impact the cost of or the fund’s ability to engage in derivative transactions. Derivatives and other strategic transactions thatthe fund intends to utilize include: futures contracts, options, and interest-rate swaps. Futures contracts, options, and swaps generally are subject tocounterparty risk. In addition, swaps may be subject to interest-rate and settlement risk, and the risk of default of the underlying reference obligation.
Index management risk. Certain factors may cause a fund that is an index fund to track its target index less closely. For example, a subadvisor mayselect securities that are not fully representative of the index, and the fund’s transaction expenses, and the size and timing of its cash flows, may resultin the fund’s performance being different than that of its index. Moreover, the fund will generally reflect the performance of its target index evenwhen the index does not perform well.
Liquidity risk. The extent (if at all) to which a security may be sold or a derivative position closed without negatively impacting its market value may beimpaired by reduced market activity or participation, legal restrictions, or other economic and market impediments. Liquidity risk may be magnified in
.247

rising interest rate environments due to higher than normal redemption rates. Widespread selling of fixed-income securities to satisfy redemptionsduring periods of reduced demand may adversely impact the price or salability of such securities. Periods of heavy redemption could cause the fund tosell assets at a loss or depressed value, which could negatively affect performance. Redemption risk is heightened during periods of declining or illiquidmarkets.
Mortgage-backed and asset-backed securities risk. Mortgage-backed and asset-backed securities are subject to different combinations ofprepayment, extension, interest-rate, and other market risks.
TBA mortgage contracts TBA mortgage contracts involve a risk of loss if the value of the underlying security to be purchased declines prior todelivery date. The yield obtained for such securities may be higher or lower than yields available in the market on delivery date.
Past performanceThe following information provides some indication of the risks of investing in the fund by showing changes in performance from year to year and byshowing how average annual returns for specified periods compare with those of a broad measure of market performance. Unless all share classeshave the same inception date, performance shown for periods prior to the inception date of a class is the performance of the fund’s oldest share class.This pre-inception performance, with respect to any other share class of the fund, has not been adjusted to reflect the Rule 12b-1 fees of that class. Asa result, the pre-inception performance shown for a share class other than the oldest share class may be higher or lower than it would be if adjusted toreflect the Rule 12b-1 fees of the class. The performance information below does not reflect fees and expenses of any variable insurance contractwhich may use JHVIT as its underlying investment option. If such fees and expenses had been reflected, performance would be lower. The pastperformance of the fund is not necessarily an indication of how the fund will perform in the future.
Calendar year total returns for Series NAV (%)
2008 2009 2010 2011 2012 2013 2014 2015 2016 2017
5.79 6.29 6.50 7.60 4.08 –2.44 6.06 0.30 2.45 3.34
Best quarter: Q4 ‘08, 4.46%
Worst quarter: Q4 ‘16, –3.21%
Average Annual Total Returns for Period Ended 12/31/2017
Average annual total returns (%) 1 Year 5 Year 10 YearDate of
Inception
Series I 3.18 1.85 3.92 11/05/12
Series II 3.08 1.65 3.82 11/05/12
Series NAV 3.34 1.90 3.95 05/01/98Bloomberg Barclays U.S. Aggregate Bond Index (reflects no deduction for fees, expenses, ortaxes) 3.54 2.10 4.01
Investment managementInvestment Advisor John Hancock Investment Management Services, LLC§
Subadvisor John Hancock Asset Management a division of Manulife Asset Management (US) LLC
Portfolio managementPeter M. Farley, CFASenior Managing Director and Senior Portfolio ManagerManaged fund since 2005
Other important information regarding the fundFor important information about taxes and financial intermediary compensation, please turn to “Additional information about the funds” at page258 of the Prospectus.
.248

Total Stock Market Index Trust Investment objectiveSeeks to approximate the aggregate total return of a broad U.S. domestic equity market index.
Fees and expensesThis table describes the fees and expenses that you may pay if you buy and hold shares of the fund. The fees and expenses do not reflect fees andexpenses of any variable insurance contract that may use the fund as its underlying investment option and would be higher if they did.
Annual fund operating expenses (%) (expenses that you pay each year as a percentage of the valueof your investment) Series I Series II Series NAV
Management fee 0.48 0.48 0.48
Distribution and service (Rule 12b-1) fees 0.05 0.25 0.00
Other expenses 0.04 0.04 0.04
Acquired fund fees and expenses1 0.01 0.01 0.01
Total annual fund operating expenses2 0.58 0.78 0.53
1 “Acquired fund fees and expenses” are based on indirect net expenses associated with the fund’s investments in underlying investment companies.2 The “Total annual fund operating expenses” shown may not correlate to the fund’s ratios of expenses to average daily net assets shown in the “Financial highlights” section of
the fund’s prospectus, which does not include “Acquired fund fees and expenses.”
Expense exampleThe examples are intended to help you compare the cost of investing in the fund with the cost of investing in other mutual funds. The examplesassume that $10,000 is invested in the fund for the periods indicated and then all shares are redeemed at the end of those periods. The examples alsoassume that the investment has a 5% return each year and that the fund’s operating expenses remain the same. The expense example does not reflectfees and expenses of any variable insurance contract that may use the fund as its underlying investment option and would be higher if they did.Although your actual costs may be higher or lower, based on these assumptions your costs would be:
Expenses ($) Series I Series II Series NAV
1 year 59 80 54
3 years 186 249 170
5 years 324 433 296
10 years 726 966 665
Portfolio turnoverThe fund pays transaction costs, such as commissions, when it buys and sells securities (or “turns over” its portfolio). A higher portfolio turnover ratemay indicate higher transaction costs. These costs, which are not reflected in annual fund operating expenses or in the example, affect the fund’sperformance. During its most recent fiscal year, the fund’s portfolio turnover rate was 6% of the average value of its portfolio.
Principal investment strategiesUnder normal market conditions, the fund invests at least 80% of its net assets (plus any borrowings for investment purposes) at the time ofinvestment in (a) the common stocks that are included in the Wilshire 5000 Total Market Index and (b) securities (which may or may not be included inthe Wilshire 5000 Total Market Index) that the subadvisor believes as a group will behave in a manner similar to the index. As of February 28, 2018,the market capitalizations of companies included in the Wilshire 5000 Total Market Index ranged from less than $24 million to $914.6 billion.
An index is an unmanaged group of securities whose overall performance is used as an investment benchmark. Indexes may track broad investmentmarkets, such as the global equity market, or more narrow investment markets, such as the U.S. small cap equity market. In contrast to activelymanaged funds, which seek to outperform their respective benchmark indexes through research and analysis, index funds are passively managed fundsthat seek to mirror the performance of their target indexes, minimizing performance differences over time. The fund attempts to match theperformance of the Wilshire 5000 Total Market Index by: (a) holding all, or a representative sample, of the securities that comprise that index; and/or(b) holding securities (which may or may not be included in the index) that the subadvisor believes as a group will behave in a manner similar to theindex. However, the fund has operating expenses and transaction costs, while a market index does not. Therefore, the fund, while it attempts to trackits target index closely, typically will be unable to match the performance of the index exactly. The composition of an index changes from time to time,and the subadvisor will reflect those changes in the composition of the fund’s portfolio as soon as practicable.
Principal risksThe fund is subject to risks, and you could lose money by investing in the fund. The principal risks of investing in the fund include:
Cybersecurity and operational risk. Cybersecurity breaches may allow an unauthorized party to gain access to fund assets, customer data, orproprietary information, or cause a fund or its service providers to suffer data corruption or lose operational functionality. Similar incidents affecting
.249
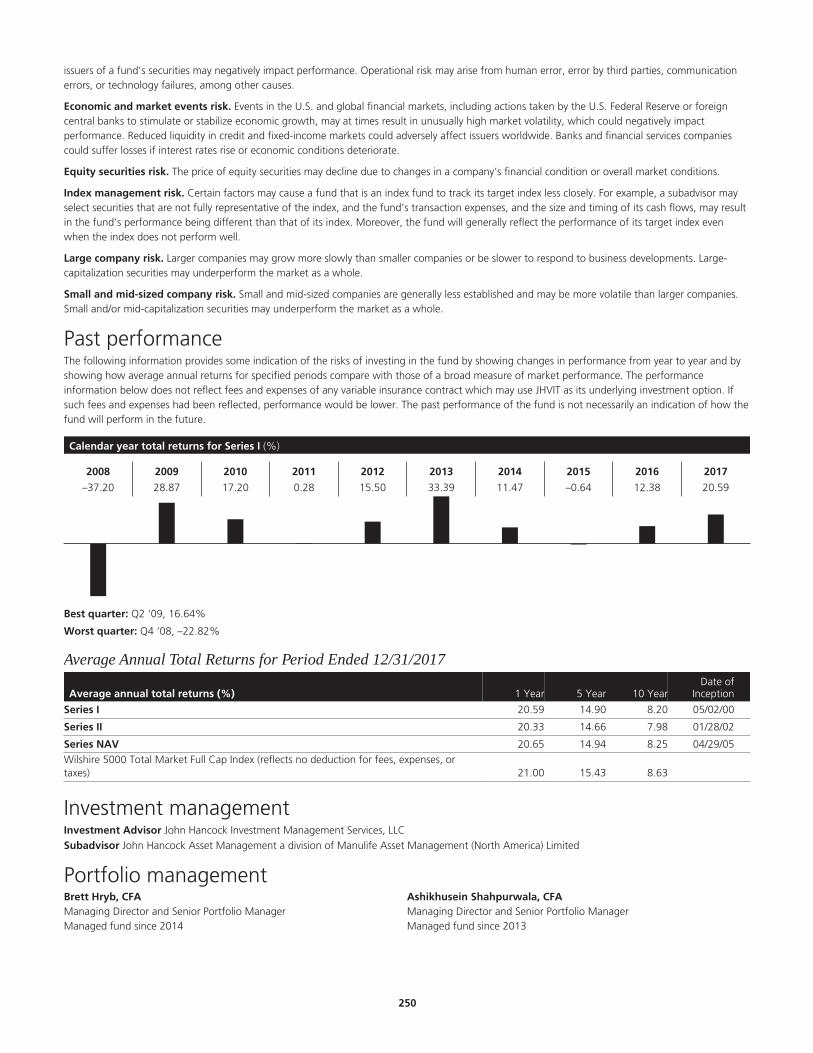
issuers of a fund’s securities may negatively impact performance. Operational risk may arise from human error, error by third parties, communicationerrors, or technology failures, among other causes.
Economic and market events risk. Events in the U.S. and global financial markets, including actions taken by the U.S. Federal Reserve or foreigncentral banks to stimulate or stabilize economic growth, may at times result in unusually high market volatility, which could negatively impactperformance. Reduced liquidity in credit and fixed-income markets could adversely affect issuers worldwide. Banks and financial services companiescould suffer losses if interest rates rise or economic conditions deteriorate.
Equity securities risk. The price of equity securities may decline due to changes in a company’s financial condition or overall market conditions.
Index management risk. Certain factors may cause a fund that is an index fund to track its target index less closely. For example, a subadvisor mayselect securities that are not fully representative of the index, and the fund’s transaction expenses, and the size and timing of its cash flows, may resultin the fund’s performance being different than that of its index. Moreover, the fund will generally reflect the performance of its target index evenwhen the index does not perform well.
Large company risk. Larger companies may grow more slowly than smaller companies or be slower to respond to business developments. Large-capitalization securities may underperform the market as a whole.
Small and mid-sized company risk. Small and mid-sized companies are generally less established and may be more volatile than larger companies.Small and/or mid-capitalization securities may underperform the market as a whole.
Past performanceThe following information provides some indication of the risks of investing in the fund by showing changes in performance from year to year and byshowing how average annual returns for specified periods compare with those of a broad measure of market performance. The performanceinformation below does not reflect fees and expenses of any variable insurance contract which may use JHVIT as its underlying investment option. Ifsuch fees and expenses had been reflected, performance would be lower. The past performance of the fund is not necessarily an indication of how thefund will perform in the future.
Calendar year total returns for Series I (%)
2008 2009 2010 2011 2012 2013 2014 2015 2016 2017
–37.20 28.87 17.20 0.28 15.50 33.39 11.47 –0.64 12.38 20.59
Best quarter: Q2 ‘09, 16.64%
Worst quarter: Q4 ‘08, –22.82%
Average Annual Total Returns for Period Ended 12/31/2017
Average annual total returns (%) 1 Year 5 Year 10 YearDate of
Inception
Series I 20.59 14.90 8.20 05/02/00
Series II 20.33 14.66 7.98 01/28/02
Series NAV 20.65 14.94 8.25 04/29/05Wilshire 5000 Total Market Full Cap Index (reflects no deduction for fees, expenses, ortaxes) 21.00 15.43 8.63
Investment managementInvestment Advisor John Hancock Investment Management Services, LLC§
Subadvisor John Hancock Asset Management a division of Manulife Asset Management (North America) Limited
Portfolio managementBrett Hryb, CFAManaging Director and Senior Portfolio ManagerManaged fund since 2014
Ashikhusein Shahpurwala, CFAManaging Director and Senior Portfolio ManagerManaged fund since 2013
.250

Other important information regarding the fundFor important information about taxes and financial intermediary compensation, please turn to “Additional information about the funds” at page258 of the Prospectus.
.251
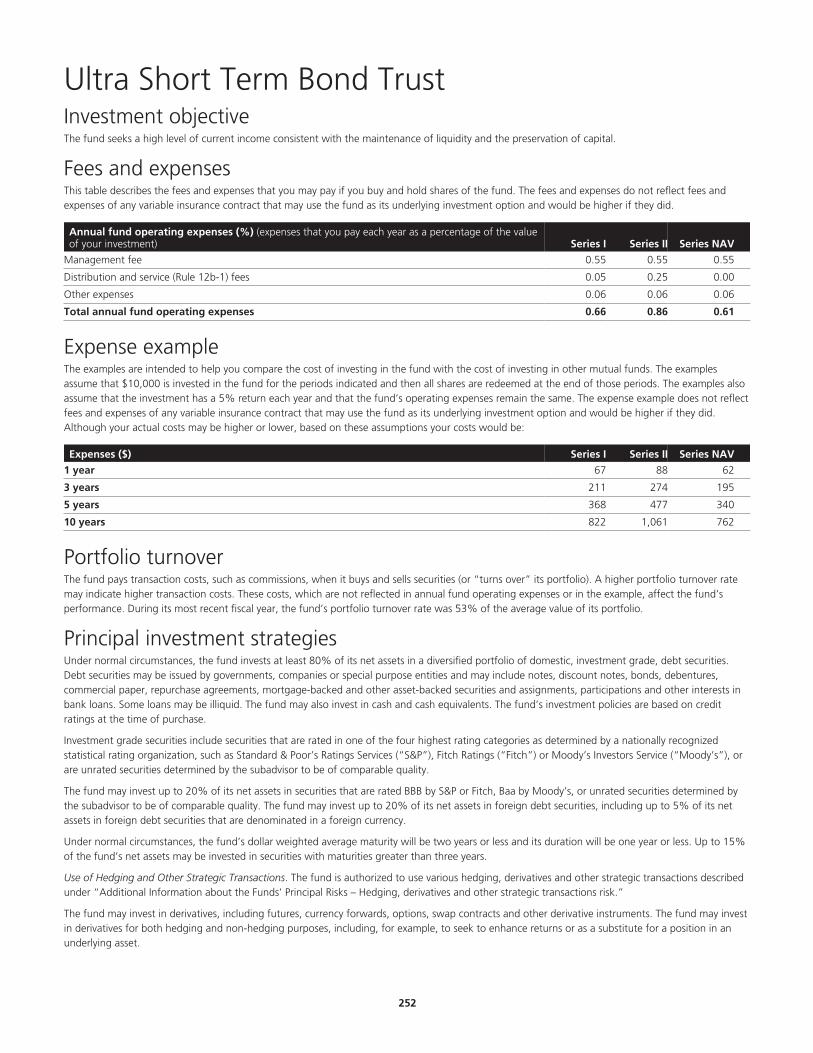
Ultra Short Term Bond Trust Investment objectiveThe fund seeks a high level of current income consistent with the maintenance of liquidity and the preservation of capital.
Fees and expensesThis table describes the fees and expenses that you may pay if you buy and hold shares of the fund. The fees and expenses do not reflect fees andexpenses of any variable insurance contract that may use the fund as its underlying investment option and would be higher if they did.
Annual fund operating expenses (%) (expenses that you pay each year as a percentage of the valueof your investment) Series I Series II Series NAV
Management fee 0.55 0.55 0.55
Distribution and service (Rule 12b-1) fees 0.05 0.25 0.00
Other expenses 0.06 0.06 0.06
Total annual fund operating expenses 0.66 0.86 0.61
Expense exampleThe examples are intended to help you compare the cost of investing in the fund with the cost of investing in other mutual funds. The examplesassume that $10,000 is invested in the fund for the periods indicated and then all shares are redeemed at the end of those periods. The examples alsoassume that the investment has a 5% return each year and that the fund’s operating expenses remain the same. The expense example does not reflectfees and expenses of any variable insurance contract that may use the fund as its underlying investment option and would be higher if they did.Although your actual costs may be higher or lower, based on these assumptions your costs would be:
Expenses ($) Series I Series II Series NAV
1 year 67 88 62
3 years 211 274 195
5 years 368 477 340
10 years 822 1,061 762
Portfolio turnoverThe fund pays transaction costs, such as commissions, when it buys and sells securities (or “turns over” its portfolio). A higher portfolio turnover ratemay indicate higher transaction costs. These costs, which are not reflected in annual fund operating expenses or in the example, affect the fund’sperformance. During its most recent fiscal year, the fund’s portfolio turnover rate was 53% of the average value of its portfolio.
Principal investment strategiesUnder normal circumstances, the fund invests at least 80% of its net assets in a diversified portfolio of domestic, investment grade, debt securities.Debt securities may be issued by governments, companies or special purpose entities and may include notes, discount notes, bonds, debentures,commercial paper, repurchase agreements, mortgage-backed and other asset-backed securities and assignments, participations and other interests inbank loans. Some loans may be illiquid. The fund may also invest in cash and cash equivalents. The fund’s investment policies are based on creditratings at the time of purchase.
Investment grade securities include securities that are rated in one of the four highest rating categories as determined by a nationally recognizedstatistical rating organization, such as Standard & Poor’s Ratings Services (“S&P”), Fitch Ratings (“Fitch”) or Moody’s Investors Service (“Moody’s”), orare unrated securities determined by the subadvisor to be of comparable quality.
The fund may invest up to 20% of its net assets in securities that are rated BBB by S&P or Fitch, Baa by Moody’s, or unrated securities determined bythe subadvisor to be of comparable quality. The fund may invest up to 20% of its net assets in foreign debt securities, including up to 5% of its netassets in foreign debt securities that are denominated in a foreign currency.
Under normal circumstances, the fund’s dollar weighted average maturity will be two years or less and its duration will be one year or less. Up to 15%of the fund’s net assets may be invested in securities with maturities greater than three years.
Use of Hedging and Other Strategic Transactions. The fund is authorized to use various hedging, derivatives and other strategic transactions describedunder “Additional Information about the Funds’ Principal Risks – Hedging, derivatives and other strategic transactions risk.”
The fund may invest in derivatives, including futures, currency forwards, options, swap contracts and other derivative instruments. The fund may investin derivatives for both hedging and non-hedging purposes, including, for example, to seek to enhance returns or as a substitute for a position in anunderlying asset.
.252

Principal risksThe fund is subject to risks, and you could lose money by investing in the fund. The principal risks of investing in the fund include:
Credit and counterparty risk. The issuer or guarantor of a fixed-income security, the counterparty to an over-the-counter derivatives contract, or aborrower of fund securities may not make timely payments or otherwise honor its obligations. U.S. government securities are subject to varyingdegrees of credit risk depending upon the nature of their support. A downgrade or default affecting any of the fund’s securities could affect the fund’sperformance.
Cybersecurity and operational risk. Cybersecurity breaches may allow an unauthorized party to gain access to fund assets, customer data, orproprietary information, or cause a fund or its service providers to suffer data corruption or lose operational functionality. Similar incidents affectingissuers of a fund’s securities may negatively impact performance. Operational risk may arise from human error, error by third parties, communicationerrors, or technology failures, among other causes.
Economic and market events risk. Events in the U.S. and global financial markets, including actions taken by the U.S. Federal Reserve or foreigncentral banks to stimulate or stabilize economic growth, may at times result in unusually high market volatility, which could negatively impactperformance. Reduced liquidity in credit and fixed-income markets could adversely affect issuers worldwide. Banks and financial services companiescould suffer losses if interest rates rise or economic conditions deteriorate.
Fixed-income securities risk. A rise in interest rates typically causes bond prices to fall. The longer the average maturity or duration of the bonds heldby a fund, the more sensitive it will likely be to interest-rate fluctuations. An issuer may not make all interest payments or repay all or any of theprincipal borrowed. Changes in a security’s credit quality may adversely affect fund performance.
Foreign securities risk. Less information may be publicly available regarding foreign issuers. Foreign securities may be subject to foreign taxes andmay be more volatile than U.S. securities. Currency fluctuations and political and economic developments may adversely impact the value of foreignsecurities.
Hedging, derivatives, and other strategic transactions risk. Hedging, derivatives, and other strategic transactions may increase a fund’s volatilityand could produce disproportionate losses, potentially more than the fund’s principal investment. Risks of these transactions are different from andpossibly greater than risks of investing directly in securities and other traditional instruments. Under certain market conditions, derivatives couldbecome harder to value or sell and may become subject to liquidity risk (i.e., the inability to enter into closing transactions). Regulatory changes inderivative markets could impact the cost of or the fund’s ability to engage in derivative transactions. Derivatives and other strategic transactions thatthe fund intends to utilize include: foreign currency forward contracts, futures contracts, options, and swaps. Foreign currency forward contracts,futures contracts, options, and swaps generally are subject to counterparty risk. In addition, swaps may be subject to interest-rate and settlement risk,and the risk of default of the underlying reference obligation. Derivatives associated with foreign currency transactions are subject to currency risk.
High portfolio turnover risk. Trading securities actively and frequently can increase transaction costs (thus lowering performance) and taxabledistributions.
Liquidity risk. The extent (if at all) to which a security may be sold or a derivative position closed without negatively impacting its market value may beimpaired by reduced market activity or participation, legal restrictions, or other economic and market impediments. Liquidity risk may be magnified inrising interest rate environments due to higher than normal redemption rates. Widespread selling of fixed-income securities to satisfy redemptionsduring periods of reduced demand may adversely impact the price or salability of such securities. Periods of heavy redemption could cause the fund tosell assets at a loss or depressed value, which could negatively affect performance. Redemption risk is heightened during periods of declining or illiquidmarkets.
Loan participations risk. Participations and assignments involve special types of risks, including credit risk, interest-rate risk, counterparty risk,liquidity risk, risks associated with extended settlement, and the risks of being a lender.
Mortgage-backed and asset-backed securities risk. Mortgage-backed and asset-backed securities are subject to different combinations ofprepayment, extension, interest-rate, and other market risks.
Past performanceThe following information provides some indication of the risks of investing in the fund by showing changes in performance from year to year and byshowing how average annual returns for specified periods compare with those of a broad measure of market performance. The performanceinformation below does not reflect fees and expenses of any variable insurance contract which may use JHVIT as its underlying investment option. Ifsuch fees and expenses had been reflected, performance would be lower. The past performance of the fund is not necessarily an indication of how thefund will perform in the future.
.253

Calendar year total returns for Series I (%)
2011 2012 2013 2014 2015 2016 2017
0.12 0.54 –0.07 –0.02 –0.04 0.52 0.66
Best quarter: Q1 ‘12, 0.41%
Worst quarter: Q2 ‘13, –0.41%
Average Annual Total Returns for Period Ended 12/31/2017
Average annual total returns (%) 1 Year 5 Year InceptionDate of
Inception
Series I 0.66 0.21 0.21 07/29/10
Series II 0.46 0.01 0.01 07/29/10
Series NAV 0.62 0.26 0.26 07/29/10ICE Bank of America Merrill Lynch 6 Month Treasury Bill Index* (reflects no deduction forfees, expenses, or taxes) 0.96 0.43 0.37 07/29/10
*Formerly known as Bank of America Merrill Lynch 6 Month Treasury Bill Index.
Investment managementInvestment Advisor John Hancock Investment Management Services, LLC§
Subadvisor John Hancock Asset Management a division of Manulife Asset Management (US) LLC
Portfolio managementHoward C. GreeneSenior Managing Director and Senior PortfolioManagerManaged fund since 2010
Jeffrey N. Given, CFASenior Managing Director and Senior PortfolioManagerManaged fund since 2010
Other important information regarding the fundFor important information about taxes and financial intermediary compensation, please turn to “Additional information about the funds” at page258 of the Prospectus.
.254

Utilities Trust Investment objectiveTo seek capital growth and current income (income above that available from the fund invested entirely in equity securities).
Fees and expensesThis table describes the fees and expenses that you may pay if you buy and hold shares of the fund. The fees and expenses do not reflect fees andexpenses of any variable insurance contract that may use the fund as its underlying investment option and would be higher if they did.
Annual fund operating expenses (%) (expenses that you pay each year as a percentage of the valueof your investment) Series I Series II Series NAV
Management fee 0.83 0.83 0.83
Distribution and service (Rule 12b-1) fees 0.05 0.25 0.00
Other expenses 0.06 0.06 0.06
Total annual fund operating expenses 0.94 1.14 0.89
Expense exampleThe examples are intended to help you compare the cost of investing in the fund with the cost of investing in other mutual funds. The examplesassume that $10,000 is invested in the fund for the periods indicated and then all shares are redeemed at the end of those periods. The examples alsoassume that the investment has a 5% return each year and that the fund’s operating expenses remain the same. The expense example does not reflectfees and expenses of any variable insurance contract that may use the fund as its underlying investment option and would be higher if they did.Although your actual costs may be higher or lower, based on these assumptions your costs would be:
Expenses ($) Series I Series II Series NAV
1 year 96 116 91
3 years 300 362 284
5 years 520 628 493
10 years 1,155 1,386 1,096
Portfolio turnoverThe fund pays transaction costs, such as commissions, when it buys and sells securities (or “turns over” its portfolio). A higher portfolio turnover ratemay indicate higher transaction costs. These costs, which are not reflected in annual fund operating expenses or in the example, affect the fund’sperformance. During its most recent fiscal year, the fund’s portfolio turnover rate was 26% of the average value of its portfolio.
Principal investment strategiesUnder normal market conditions, the fund invests at least 80% of its net assets (plus any borrowing for investment purposes) in securities ofcompanies in the utilities industry. The subadvisor considers a company to be in the utilities industry if, at the time of investment, the subadvisordetermines that a substantial portion (i.e., at least 50%) of the company’s assets or revenues are derived from one or more utilities.
Companies in the utilities industry include: (i) companies engaged in the manufacture, production, generation, transmission, sale or distribution ofelectric, gas or other types of energy, water or other sanitary services; and (ii) companies engaged in telecommunications, including telephone, cellulartelephone, satellite, microwave, cable television and other communications media (but not engaged in public broadcasting).
The fund primarily invests in equity securities, including common stocks and related securities, such as preferred stocks, convertible securities anddepositary receipts, but may also invest in corporate bonds and other debt instruments. The subadvisor may invest up to 20% of the fund’s net assetsin lower rated debt instruments (commonly known as “junk bonds”). The fund’s investment policies are based on credit ratings at the time ofpurchase. The fund may invest in securities of companies of any size.
The subadvisor uses an active bottom-up investment approach to buying and selling investments for the fund. Investments are selected primarily basedon fundamental analysis of individual issuers and/or instruments in light of issuers’ financial condition and market, economic, political, and regulatoryconditions. Factors considered for equity securities may include analysis of an issuer’s earnings, cash flows, competitive position, and managementability. Factors considered for debt instruments may include the instrument’s credit quality, collateral characteristics and indenture provisions and theissuer’s management ability, capital structure, leverage, and ability to meet its current obligations. Quantitative models that systematically evaluate thevaluation, price and earnings momentum, earnings quality, and other factors of the issuer of an equity security or the structure of a debt instrumentmay also be considered.
The subadvisor may invest the fund’s assets in U.S. and foreign securities. The fund may invest up to 40% of its net assets in foreign securities(including emerging markets securities, Brady bonds and depositary receipts). The subadvisor normally invests the fund’s assets across differentcountries and regions, but the subadvisor may invest a significant percentage of the fund’s assets in issuers in a single country or region.
.255

The fund may have exposure to foreign currencies through its investments in foreign securities, its direct holdings of foreign currencies, or through itsuse of foreign currency exchange contracts for the purchase or sale of a fixed quantity of a foreign currency at a future date.
While the fund may use derivatives for any investment purpose, to the extent the subadvisor uses derivatives, the subadvisor expects to use derivativesprimarily to increase or decrease currency exposure.§§
The fund concentrates its investments in securities of issuers in the utilities industry.
Principal risksThe fund is subject to risks, and you could lose money by investing in the fund. The principal risks of investing in the fund include:
Concentration risk. Because the fund may focus on one or more industries or sectors of the economy, its performance depends in large part on theperformance of those sectors or industries. As a result, the value of an investment may fluctuate more widely than it would in a fund that is diversifiedacross industries and sectors.
Credit and counterparty risk. The issuer or guarantor of a fixed-income security, the counterparty to an over-the-counter derivatives contract, or aborrower of fund securities may not make timely payments or otherwise honor its obligations. A downgrade or default affecting any of the fund’ssecurities could affect the fund’s performance.
Currency risk. Fluctuations in exchange rates may adversely affect the U.S. dollar value of a fund’s investments. Foreign currencies may decline invalue, which could negatively impact performance.
Cybersecurity and operational risk. Cybersecurity breaches may allow an unauthorized party to gain access to fund assets, customer data, orproprietary information, or cause a fund or its service providers to suffer data corruption or lose operational functionality. Similar incidents affectingissuers of a fund’s securities may negatively impact performance. Operational risk may arise from human error, error by third parties, communicationerrors, or technology failures, among other causes.
Economic and market events risk. Events in the U.S. and global financial markets, including actions taken by the U.S. Federal Reserve or foreigncentral banks to stimulate or stabilize economic growth, may at times result in unusually high market volatility, which could negatively impactperformance. Reduced liquidity in credit and fixed-income markets could adversely affect issuers worldwide. Banks and financial services companiescould suffer losses if interest rates rise or economic conditions deteriorate.
Equity securities risk. The price of equity securities may decline due to changes in a company’s financial condition or overall market conditions.
Fixed-income securities risk. A rise in interest rates typically causes bond prices to fall. The longer the average maturity or duration of the bonds heldby a fund, the more sensitive it will likely be to interest-rate fluctuations. An issuer may not make all interest payments or repay all or any of theprincipal borrowed. Changes in a security’s credit quality may adversely affect fund performance.
Foreign securities risk. Less information may be publicly available regarding foreign issuers. Foreign securities may be subject to foreign taxes andmay be more volatile than U.S. securities. Currency fluctuations and political and economic developments may adversely impact the value of foreignsecurities. The risks of investing in foreign securities are magnified in emerging markets. Depositary receipts are subject to most of the risks associatedwith investing in foreign securities directly because the value of a depositary receipt is dependent upon the market price of the underlying foreignequity security. Depositary receipts are also subject to liquidity risk.
Geographic focus risk. The fund’s performance will be closely tied to the market, currency, economic, political, regulatory, geopolitical, and otherconditions in the countries or regions in which the fund’s assets are invested and may be more volatile than the performance of more geographically-diversified funds.
Hedging, derivatives, and other strategic transactions risk. Hedging, derivatives, and other strategic transactions may increase a fund’s volatilityand could produce disproportionate losses, potentially more than the fund’s principal investment. Risks of these transactions are different from andpossibly greater than risks of investing directly in securities and other traditional instruments. Under certain market conditions, derivatives couldbecome harder to value or sell and may become subject to liquidity risk (i.e., the inability to enter into closing transactions). Regulatory changes inderivative markets could impact the cost of or the fund’s ability to engage in derivative transactions. Derivatives and other strategic transactions thatthe fund intends to utilize include: foreign currency forward contracts, futures contracts, and options. Foreign currency forward contracts, futurescontracts, and options generally are subject to counterparty risk. Derivatives associated with foreign currency transactions are subject to currency risk.
Large company risk. Larger companies may grow more slowly than smaller companies or be slower to respond to business developments. Large-capitalization securities may underperform the market as a whole.
Liquidity risk. The extent (if at all) to which a security may be sold or a derivative position closed without negatively impacting its market value may beimpaired by reduced market activity or participation, legal restrictions, or other economic and market impediments. Liquidity risk may be magnified inrising interest rate environments due to higher than normal redemption rates. Widespread selling of fixed-income securities to satisfy redemptionsduring periods of reduced demand may adversely impact the price or salability of such securities. Periods of heavy redemption could cause the fund tosell assets at a loss or depressed value, which could negatively affect performance. Redemption risk is heightened during periods of declining or illiquidmarkets.
Lower-rated and high-yield fixed-income securities risk. Lower-rated and high-yield fixed-income securities (junk bonds) are subject to greatercredit quality risk, risk of default, and price volatility than higher-rated fixed-income securities, may be considered speculative, and can be difficult toresell.
.256
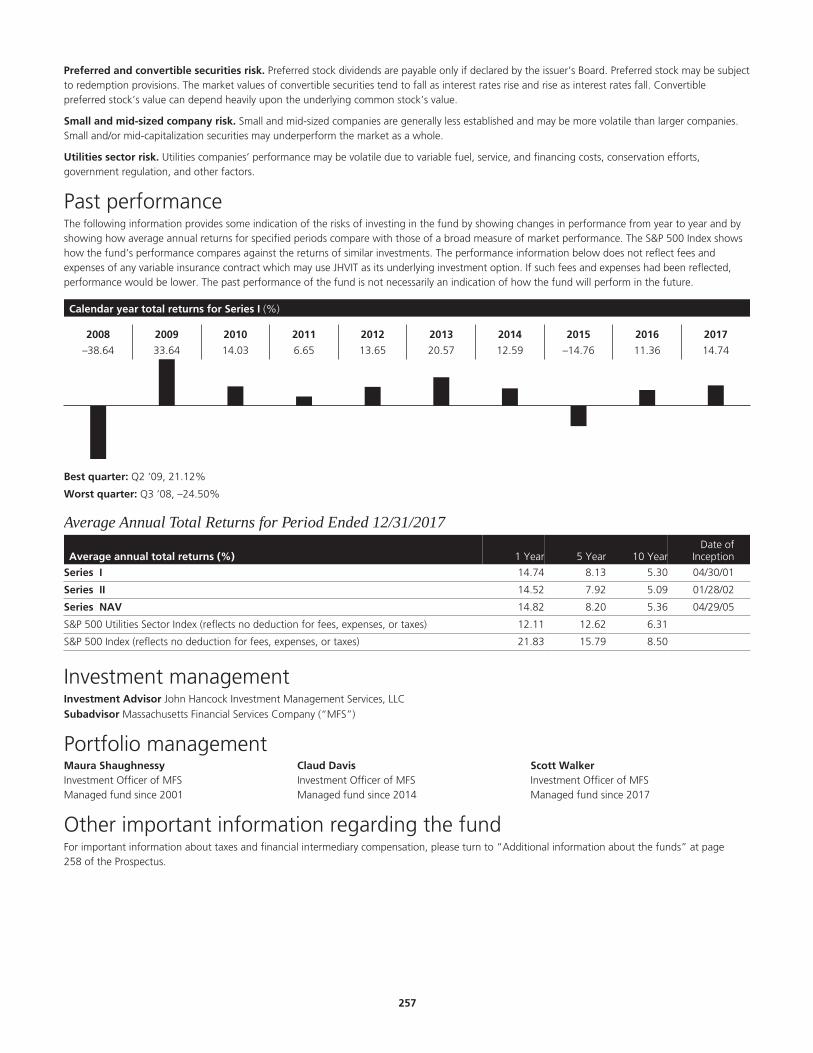
Preferred and convertible securities risk. Preferred stock dividends are payable only if declared by the issuer’s Board. Preferred stock may be subjectto redemption provisions. The market values of convertible securities tend to fall as interest rates rise and rise as interest rates fall. Convertiblepreferred stock’s value can depend heavily upon the underlying common stock’s value.
Small and mid-sized company risk. Small and mid-sized companies are generally less established and may be more volatile than larger companies.Small and/or mid-capitalization securities may underperform the market as a whole.
Utilities sector risk. Utilities companies’ performance may be volatile due to variable fuel, service, and financing costs, conservation efforts,government regulation, and other factors.
Past performanceThe following information provides some indication of the risks of investing in the fund by showing changes in performance from year to year and byshowing how average annual returns for specified periods compare with those of a broad measure of market performance. The S&P 500 Index showshow the fund’s performance compares against the returns of similar investments. The performance information below does not reflect fees andexpenses of any variable insurance contract which may use JHVIT as its underlying investment option. If such fees and expenses had been reflected,performance would be lower. The past performance of the fund is not necessarily an indication of how the fund will perform in the future.
Calendar year total returns for Series I (%)
2008 2009 2010 2011 2012 2013 2014 2015 2016 2017
–38.64 33.64 14.03 6.65 13.65 20.57 12.59 –14.76 11.36 14.74
Best quarter: Q2 ‘09, 21.12%
Worst quarter: Q3 ‘08, –24.50%
Average Annual Total Returns for Period Ended 12/31/2017
Average annual total returns (%) 1 Year 5 Year 10 YearDate of
Inception
Series I 14.74 8.13 5.30 04/30/01
Series II 14.52 7.92 5.09 01/28/02
Series NAV 14.82 8.20 5.36 04/29/05
S&P 500 Utilities Sector Index (reflects no deduction for fees, expenses, or taxes) 12.11 12.62 6.31
S&P 500 Index (reflects no deduction for fees, expenses, or taxes) 21.83 15.79 8.50
Investment managementInvestment Advisor John Hancock Investment Management Services, LLC§
Subadvisor Massachusetts Financial Services Company (“MFS”)
Portfolio managementMaura ShaughnessyInvestment Officer of MFSManaged fund since 2001
Claud DavisInvestment Officer of MFSManaged fund since 2014
Scott WalkerInvestment Officer of MFSManaged fund since 2017
Other important information regarding the fundFor important information about taxes and financial intermediary compensation, please turn to “Additional information about the funds” at page258 of the Prospectus.
.257
Additional information about the fundsTaxes
For federal income tax purposes, each of the funds is treated as a separate entity, intends to qualify as a “regulated investment company” underSubchapter M of the Internal Revenue Code of 1986, as amended (the “Code”), and intends to meet the diversification requirements that areapplicable to mutual funds that serve as underlying investments for insurance company separate accounts. A fund that qualifies as a regulatedinvestment company will not be subject to U.S. federal income tax on its net investment income and net capital gain that it distributes to itsshareholders in each taxable year (provided that it distributes at least the sum of 90% of its net investment company taxable income and 90% of itsnet tax exempt interest income for the taxable year). Insurance company separate accounts, the principal shareholders of the funds, generally do notpay tax on dividends and capital gain distributions from the funds.
Because shares of the funds may be purchased only through variable insurance contracts and qualified plans, it is expected that any dividends or capitalgains distributions made by the funds will be exempt from current federal taxation if left to accumulate within the variable contract or qualified plan.Holders of variable insurance contracts should consult the prospectuses of their respective contracts for information on the federal income taxconsequences to such holders.
Variable contract owners should consult with their own tax advisors as to the tax consequences of investments in the funds, includingthe application of state and local taxes.
More information about taxes is located in the Statement of Additional Information (SAI) under the heading “Additional Information ConcerningTaxes.”
Compensation of financial intermediaries
The funds are not sold directly to the general public but instead are offered as underlying investment options for variable insurance contracts. Thedistributors of these contracts, the insurance companies that issue the contracts and their related companies may pay compensation to broker-dealersand other intermediaries for distribution and other services and may enter into revenue sharing arrangements with certain intermediaries. The sourceof funds for these payments to intermediaries may be the fees paid by the funds under their agreements with insurance and related companies formanagement, distribution and other services. Payments by insurance and related companies to intermediaries may create a conflict of interest byinfluencing them and their salespersons to recommend such contracts over other investments. Ask your salesperson or visit your financialintermediary’s Web site for more information. In addition, payments by the funds to insurance and related companies may be a factor that aninsurance company considers in including the funds as underlying investment options in variable insurance contracts. The prospectus (or other offeringdocument) for your variable insurance contract may contain additional information about these payments.
Temporary Defensive Investing (applicable to all funds except Money Market Trust)
During unusual or unsettled market conditions, for purposes of meeting redemption requests, or pending investment of its assets, a fund generallymay invest all or a portion of its assets in cash and securities that are highly liquid, including: (a) high quality money market instruments, such as short-term U.S. government obligations, commercial paper, repurchase agreements or other cash equivalents; and (b) money market funds. In the case offunds investing extensively in foreign securities, these investments may be denominated in either U.S. dollars or foreign currencies and may includedebt of foreign corporations, governments and supranational organizations. To the extent a fund is in a defensive position, its ability to achieve itsinvestment objective will be limited.
Other permitted investments by the funds of fundsThe funds of funds may directly:
Purchase U.S. government securities and short-term paper.
Purchase shares of other registered open-end investment companies (and registered unit investment trusts) within the same “group of investmentcompanies” as that term is defined in Section 12 of the Investment Company Act of 1940, as amended (the 1940 Act).
Purchase shares of other registered open-end investment companies (and registered unit investment trusts) where the advisor is not the same as, oraffiliated with, the advisor to the fund, including ETFs.
Purchase exchange-traded notes (ETNs).
Invest in domestic and foreign equity securities, which may include common and preferred stocks of large-, medium- and small-capitalizationcompanies in both developed (including the U.S.) and emerging markets.
Invest in domestic and foreign fixed-income securities, which may include debt securities of governments throughout the world (including the U.S.),their agencies and instrumentalities, debt securities of corporations and supranationals, inflation-indexed securities, convertible bonds, mortgage-backed securities, asset-backed securities and collateralized debt securities. Investments in fixed-income securities may include securities of issuers inboth developed (including the U.S.) and emerging markets and may include fixed-income securities rated below investment grade.
Purchase securities of registered closed-end investment companies that are part of the same “group of investment companies” as that term isdefined in Section 12 of the 1940 Act.
Invest up to 15% of its net assets in illiquid securities of entities such as limited partnerships and other pooled investment vehicles, such as hedgefunds.
Make short sales of securities (borrow and sell securities not owned by the fund with the prior approval of the advisor’s Complex SecuritiesCommittee), either to realize appreciation when a security that the fund does not own declines in value or as a hedge against potential declines inthe value of a fund security.
.258
Invest in “qualified” publicly traded partnerships and other publicly traded partnerships that at the time of investment the advisor believes willgenerate only good income for purposes of qualifying as a regulated investment company under the Code, including such publicly tradedpartnerships that invest principally in commodities or commodities-linked derivatives (with the prior approval of the advisor’s Complex SecuritiesCommittee).
The funds of funds may use various investment strategies such as hedging and other related transactions. For example, a fund of funds may usederivative instruments (such as options, futures and swaps) for hedging purposes, including hedging various market risks and managing the effectivematurity or duration of debt instruments held by the fund. In addition, these strategies may be used to gain exposure to a particular security orsecurities market. A fund of funds also may purchase and sell commodities and may enter into swap contracts and other commodity-linked derivativeinstruments including those linked to physical commodities. Please refer to “Hedging and Other Strategic Transactions Risk” in the Statement ofAdditional Information (SAI).
+The Funds of Funds are:§§
Each Lifecycle Trust§§
Each Lifestyle Portfolio§
§
Each Managed Volatility Portfolio§
§
(Collectively the “Funds of Funds”)
Additional information about the risks of the Lifestyle Portfolios’ assettransfer processThe Lifestyle Growth Portfolio, Lifestyle Moderate Portfolio, Lifestyle Balanced Portfolio and Lifestyle Conservative Portfolio (collectively, the “JHVITLifestyle Portfolios”) are offered in connection with specific guaranteed benefits under variable annuity contracts (the “Contracts”) issued by JohnHancock Life Insurance Company (U.S.A.) and John Hancock Life Insurance Company of New York (collectively, the “John Hancock Issuers”). TheContracts provide that the John Hancock Issuers can automatically transfer contract value between the Lifestyle Portfolio and the Select Bond Trustthrough a nondiscretionary, systematic mathematical process. The purpose of these transfers is to attempt to protect contract value from declines dueto market volatility, and therefore limit the John Hancock Issuers’ exposure to risk under the guaranteed benefits under the Contracts. The timing andamount of any transfer of contract value under the John Hancock Issuers’ process will depend on several factors, including market movements. Ingeneral, the higher the equity component of a JHVIT Lifestyle Portfolio, the more likely that contract value will be reallocated from the JHVITLifestyle Portfolio to the Select Bond Trust when equity markets fall. These asset reallocations may result in large-scale asset flows into and out of, andmay negatively affect the performance of the JHVIT Lifestyle Portfolio and the underlying funds in which the JHVIT Lifestyle Portfolio invest.
As a result of large scale asset flows into and out of the JHVIT Lifestyle Portfolios, the underlying funds in which the JHVIT Lifestyle Portfoliosinvest, may also experience large-scale inflows and outflows. These flows may increase an underlying fund’s transaction costs and cause the fund topurchase or sell securities when it would not normally do so, which may negatively affect the underlying fund’s expense ratios and performance. Itcould be particularly disadvantageous for an underlying fund if it experiences outflows and needs to sell securities at a time of volatility in the markets,when values could be falling. Because the JHVIT Lifestyle Portfolios bear their proportionate share of the transaction costs of the underlying funds,increased underlying fund expenses may indirectly negatively affect the performance of the JHVIT Lifestyle Portfolios.
Advance trade estimate risk
The JHVIT Lifestyle Portfolios may seek to mitigate asset transfer risk by adjusting its portfolio based on advance estimates of automatic transfers ofContract value under the Contracts. The John Hancock Issuers have provided the JHVIT Lifestyle Portfolios’ subadvisor with an analytical tool thatcalculates estimates of automatic transfers based on several factors, including the mathematical process for automatic transfers and marketmovements before the daily close of trading. The subadvisor may, but is not required to, use the tool to adjust the JHVIT Lifestyle Portfolios’ portfoliowith the goal of trading in securities or purchasing shares of underlying funds as close to the market close as possible in order to limit the JHVITLifestyle Portfolios’ exposure to cash drag (i.e., holding cash while markets are rising) and adverse overnight market fluctuations. For example, in arising market, if the analytical tool suggests that the JHVIT Lifestyle Portfolios will receive inflows that day (the “Trade Date”), the subadvisor could buysecurities or shares of an underlying fund close to or at the closing prices on the Trade Date, as opposed to the following business day, when theactual transfer amount would be known. In a falling market, if the analytical tool suggests that the JHVIT Lifestyle Portfolios will experience outflowson Trade Date, the subadvisor could sell securities or shares of an underlying fund close to or at the closing prices on Trade Date, as opposed to thefollowing business day, when the actual transfer amount would be known.
If the subadvisor relies on the analytical tool or its own judgment and places trades in anticipation of purchases and redemptions of JHVIT Lifestyleshares, there can be no assurance that the prices paid by the JHVIT Lifestyle Portfolios will be better than if the JHVIT Lifestyle Portfolios had traded thefollowing business day. The estimated transfer amount may be different from the actual transfer amount for various reasons, including changes inmarket direction, contract owner behavior and faulty inputs. If the estimated transfer amount is different from the actual transfer amount, the JHVITLifestyle Portfolios will buy or sell securities or shares of an underlying fund the following business day to adjust for this difference. For example, if cashflows into the JHVIT Lifestyle Portfolios are less than estimated, the JHVIT Lifestyle Portfolios could be forced to liquidate positions it had purchased.Conversely, if cash flows out of the JHVIT Lifestyle Portfolios are less than estimated, the JHVIT Lifestyle Portfolios may be required to repurchasepositions it had sold. In addition, purchasing securities or shares of an underlying fund early could cause the JHVIT Lifestyle Portfolios to spend moremoney than it has available and, in the event of a market decline, such leverage will magnify losses because the decline also affects the securities
.259
purchased with amounts in excess of the JHVIT Lifestyle Portfolios’ assets. Due to these various factors, trading on the basis of advance estimates ofautomatic transfers may cause higher portfolio turnover than that based solely on automatic transfers of Contract value under the Contracts, increaseJHVIT Lifestyle Portfolios expenses and adversely affect the performance of the JHVIT Lifestyle Portfolios.
Additional information about the funds of funds’ principal risksThe principal risks of investing in each fund of funds are summarized in the description of that fund above. These risks are more fully described below.The risks are described in alphabetical order and not in order of importance. JHVIT’s Statement of Additional Information (the “SAI”) dated the samedate as this prospectus contains further details about these risks as well as information about additional risks.
Affiliated insurance companies
The Advisor may be influenced by the benefits to its affiliated life insurance companies in managing the fund and overseeing its subadvisors. The JohnHancock insurance companies issuing guaranteed benefits on variable annuity and insurance contracts investing in the fund have a financial interest inpreserving the value of the funds and reducing their volatility due to their obligations for these guaranteed benefits (the cost of providing theseguaranteed benefits is related to several factors including the performance and volatility of the fund). To the extent the fund is successful in managingthe volatility of returns and downside risk, the John Hancock insurance companies issuing guaranteed benefits on variable annuity and insurancecontracts investing in the fund will also benefit from a reduction in their potential investment risk which will reduce their costs of hedging this risk andmay reduce their reserve and capital requirements. These financial benefits to the John Hancock insurance companies may be material. The fund andthe fund’s investment advisor have adopted procedures that are intended to address these conflicts and ensure that the fund is managed inaccordance with its disclosed investment objectives and strategies.
Asset allocation risk
Although asset allocation among different asset categories generally limits risk and exposure to any one category, the risk remains that a manager mayfavor an asset category that performs poorly relative to the other asset categories. To the extent that alternative asset categories underperform thegeneral stock market, the fund would perform poorly relative to a fund invested primarily in the general stock market.
Cash collateral risk
To the extent a fund maintains cash collateral required to cover its obligations under the derivative instruments used in its risk management strategy,such collateral holdings may have the effect of reducing overall portfolio returns. In addition, because such collateral positions cannot be eliminated orreduced unless the corresponding derivative obligation is eliminated or reduced, a large derivative position may materially limit the subadvisor’sflexibility in managing the fund.
Commodity risk
Commodity investments involve the risk of volatile market price fluctuations of commodities resulting from fluctuating demand, supply disruption,speculation and other factors.
Credit and counterparty risk
This is the risk that the issuer or guarantor of a fixed-income security, the counterparty to an over-the-counter (OTC) derivatives contract (see“Hedging, derivatives, and other strategic transactions risk”), or a borrower of a fund’s securities will be unable or unwilling to make timely principal,interest, or settlement payments, or otherwise honor its obligations. Credit risk associated with investments in fixed-income securities relates to theability of the issuer to make scheduled payments of principal and interest on an obligation. A fund that invests in fixed-income securities is subject tovarying degrees of risk that the issuers of the securities will have their credit ratings downgraded or will default, potentially reducing the fund’s shareprice and income level. Nearly all fixed-income securities are subject to some credit risk, which may vary depending upon whether the issuers of thesecurities are corporations, domestic or foreign governments, or their subdivisions or instrumentalities. U.S. government securities are subject tovarying degrees of credit risk depending upon whether the securities are supported by the full faith and credit of the United States; supported by theability to borrow from the U.S. Treasury; supported only by the credit of the issuing U.S. government agency, instrumentality, or corporation; orotherwise supported by the United States. For example, issuers of many types of U.S. government securities (e.g., the Federal Home Loan MortgageCorporation (Freddie Mac), Federal National Mortgage Association (Fannie Mae), and Federal Home Loan Banks), although chartered or sponsored byCongress, are not funded by congressional appropriations, and their fixed-income securities, including asset-backed and mortgage-backed securities,are neither guaranteed nor insured by the U.S. government. An agency of the U.S. government has placed Fannie Mae and Freddie Mac intoconservatorship, a statutory process with the objective of returning the entities to normal business operations. It is unclear what effect thisconservatorship will have on the securities issued or guaranteed by Fannie Mae or Freddie Mac. As a result, these securities are subject to more creditrisk than U.S. government securities that are supported by the full faith and credit of the United States (e.g., U.S. Treasury bonds). When a fixed-income security is not rated, a manager may have to assess the risk of the security itself. Asset-backed securities, whose principal and interest paymentsare supported by pools of other assets, such as credit card receivables and automobile loans, are subject to further risks, including the risk that theobligors of the underlying assets default on payment of those assets.
In addition, a fund is exposed to credit risk to the extent that it makes use of OTC derivatives (such as forward foreign currency contracts and/or swapcontracts) and engages to a significant extent in the lending of fund securities or the use of repurchase agreements. OTC derivatives transactions canbe closed out with the other party to the transaction. If the counterparty defaults, a fund will have contractual remedies, but there is no assurance thatthe counterparty will be able to meet its contractual obligations or that, in the event of default, a fund will succeed in enforcing them. A fund,therefore, assumes the risk that it may be unable to obtain payments owed to it under OTC derivatives contracts or that those payments may bedelayed or made only after the fund has incurred the costs of litigation. While the manager intends to monitor the creditworthiness of contractcounterparties, there can be no assurance that the counterparty will be in a position to meet its obligations, especially during unusually adverse marketconditions.
.260
Cybersecurity and operational risk
Intentional cybersecurity breaches include unauthorized access to systems, networks, or devices (such as through “hacking” activity); infection fromcomputer viruses or other malicious software code; and attacks that shut down, disable, slow, or otherwise disrupt operations, business processes, orwebsite access or functionality. In addition, unintentional incidents can occur, such as the inadvertent release of confidential information (possiblyresulting in the violation of applicable privacy laws).
A cybersecurity breach could result in the loss or theft of customer data or funds, the inability to access electronic systems (“denial of services”), loss ortheft of proprietary information or corporate data, physical damage to a computer or network system, or costs associated with system repairs. Suchincidents could cause a fund, the advisor, a manager, or other service providers to incur regulatory penalties, reputational damage, additionalcompliance costs, or financial loss. In addition, such incidents could affect issuers in which a fund invests, and thereby cause the fund’s investments tolose value.
The fund is exposed to operational risk arising from a number of factors, including, but not limited to, human error, processing and communicationerrors, errors of the fund’s service providers, counterparties, or other third parties, failed or inadequate processes and technology or system failures.
Economic and market events risk
Events in certain sectors historically have resulted, and may in the future result, in an unusually high degree of volatility in the financial markets, bothdomestic and foreign. These events have included, but are not limited to: bankruptcies, corporate restructurings, and other events related to the sub-prime mortgage crisis in 2008; governmental efforts to limit short selling and high frequency trading; measures to address U.S. federal and statebudget deficits; social, political, and economic instability in Europe; economic stimulus by the Japanese central bank; steep declines in oil prices;dramatic changes in currency exchange rates; and China’s economic slowdown. Interconnected global economies and financial markets increase thepossibility that conditions in one country or region might adversely impact issuers in a different country or region. Both domestic and foreign equitymarkets have experienced increased volatility and turmoil, with issuers that have exposure to the real estate, mortgage, and credit markets particularlyaffected. Banks and financial services companies could suffer losses if interest rates continue to rise or economic conditions deteriorate.
In addition, relatively high market volatility and reduced liquidity in credit and fixed-income markets may adversely affect many issuers worldwide.Actions taken by the U.S. Federal Reserve (Fed) or foreign central banks to stimulate or stabilize economic growth, such as interventions in currencymarkets, could cause high volatility in the equity and fixed-income markets. Reduced liquidity may result in less money being available to purchase rawmaterials, goods, and services from emerging markets, which may, in turn, bring down the prices of these economic staples. It may also result inemerging-market issuers having more difficulty obtaining financing, which may, in turn, cause a decline in their securities prices.
In addition, while interest rates have been unusually low in recent years in the United States and abroad, the Fed’s decision to raise the target fedfunds rate in 2017, following a similar move the previous year, and the possibility that the Fed may continue with such rate increases, among otherfactors, could cause markets to experience continuing high volatility. A significant increase in interest rates may cause a decline in the market for equitysecurities. Also, regulators have expressed concern that rate increases may contribute to price volatility. These events and the possible resulting marketvolatility may have an adverse effect on the fund.
Political turmoil within the United States and abroad may also impact the fund. Although the U.S. government has honored its credit obligations, itremains possible that the United States could default on its obligations. While it is impossible to predict the consequences of such an unprecedentedevent, it is likely that a default by the United States would be highly disruptive to the U.S. and global securities markets and could significantly impairthe value of the fund’s investments. Similarly, political events within the United States at times have resulted, and may in the future result, in ashutdown of government services, which could negatively affect the U.S. economy, decrease the value of many fund investments, and increaseuncertainty in or impair the operation of the U.S. or other securities markets. The U.S. is also considering significant new investments in infrastructureand national defense which, coupled with lower federal taxes, could lead to increased government borrowing and higher interest rates. While theseproposed policies are going through the political process, the equity and debt markets may react strongly to expectations, which could increasevolatility, especially if the market’s expectations for changes in government policies are not borne out.
Uncertainties surrounding the sovereign debt of a number of European Union (EU) countries and the viability of the EU have disrupted and may in thefuture disrupt markets in the United States and around the world. If one or more countries leave the EU or the EU dissolves, the world’s securitiesmarkets likely will be significantly disrupted. In June 2016, the United Kingdom approved a referendum to leave the EU, commonly referred to as“Brexit.” There is significant market uncertainty regarding Brexit’s ramifications, and the range and potential implications of possible political,regulatory, economic, and market outcomes are difficult to predict. Political and military events, including in North Korea, Venezuela, Syria, and otherareas of the Middle East, and nationalist unrest in Europe, also may cause market disruptions.
In addition, there is a risk that the prices of goods and services in the United States and many foreign economies may decline over time, known asdeflation. Deflation may have an adverse effect on stock prices and creditworthiness and may make defaults on debt more likely. If a country’seconomy slips into a deflationary pattern, it could last for a prolonged period and may be difficult to reverse.
Equity securities risk
Common and preferred stocks represent equity ownership in a company. Stock markets are volatile. The price of equity securities will fluctuate, andcan decline and reduce the value of a fund investing in equities. The price of equity securities fluctuates based on changes in a company’s financialcondition and overall market and economic conditions. The value of equity securities purchased by a fund could decline if the financial condition of thecompanies in which the fund is invested declines, or if overall market and economic conditions deteriorate. An issuer’s financial condition could declineas a result of poor management decisions, competitive pressures, technological obsolescence, undue reliance on suppliers, labor issues, shortages,corporate restructurings, fraudulent disclosures, or other factors. Changes in the financial condition of a single issuer can impact the market as awhole.
.261
Even a fund that invests in high-quality, or blue chip, equity securities, or securities of established companies with large market capitalizations (whichgenerally have strong financial characteristics), can be negatively impacted by poor overall market and economic conditions. Companies with largemarket capitalizations may also have less growth potential than smaller companies and may be less able to react quickly to changes in the marketplace.
The fund may maintain substantial exposure to equities and generally does not attempt to time the market. Because of this exposure, the possibilitythat stock market prices in general will decline over short or extended periods subjects the fund to unpredictable declines in the value of itsinvestments, as well as periods of poor performance.
Exchange-traded funds (ETFs) risk
These are a type of investment company bought and sold on a securities exchange. An ETF represents a fixed portfolio of securities designed to track aparticular market index. A fund could purchase an ETF to temporarily gain exposure to a portion of the U.S. or a foreign market while awaitingpurchase of underlying securities. The risks of owning an ETF generally reflect the risks of owning the underlying securities it is designed to track,although lack of liquidity in an ETF could result in it being more volatile. An ETF has its own fees and expenses, which are borne indirectly by a fund.
Exchange-traded notes (ETNs) risk
ETNs are a type of unsecured, unsubordinated debt security that have characteristics and risks similar to those of fixed-income securities and trade on amajor exchange similar to shares of ETFs. This type of debt security differs, however, from other types of bonds and notes because ETN returns arebased upon the performance of a market index minus applicable fees, no period coupon payments are distributed, and no principal protections exist.The purpose of ETNs is to create a type of security that combines the aspects of both bonds and ETFs. The value of an ETN may be influenced by timeto maturity; level of supply and demand for the ETN; volatility and lack of liquidity in underlying commodities or securities markets; changes in theapplicable interest rates; changes in the issuer’s credit rating; and economic, legal, political, or geographic events that affect the referenced commodityor security. The fund’s decision to sell its ETN holdings also may be limited by the availability of a secondary market. If the fund must sell some or all ofits ETN holdings and the secondary market is weak, it may have to sell such holdings at a discount. If the fund holds its investment in an ETN untilmaturity, the issuer will give the fund a cash amount that would be equal to the principal amount (subject to the day’s index factor). ETNs are alsosubject to counterparty credit risk and fixed-income risk.
Fixed-income securities risk
Fixed-income securities are generally subject to two principal types of risk, as well as other risks described below: (1) interest-rate risk and (2) creditquality risk.
Interest-rate risk. Fixed-income securities are affected by changes in interest rates. When interest rates decline, the market value of fixed-incomesecurities generally can be expected to rise. Conversely, when interest rates rise, the market value of fixed-income securities generally can beexpected to decline. The longer the duration or maturity of a fixed-income security, the more susceptible it is to interest-rate risk. Recent andpotential future changes in government monetary policy may affect the level of interest rates.§Credit quality risk. Fixed-income securities are subject to the risk that the issuer of the security will not repay all or a portion of the principalborrowed and will not make all interest payments. If the credit quality of a fixed-income security deteriorates after a fund has purchased the security,the market value of the security may decrease and lead to a decrease in the value of the fund’s investments. An issuer’s credit quality coulddeteriorate as a result of poor management decisions, competitive pressures, technological obsolescence, undue reliance on suppliers, labor issues,shortages, corporate restructurings, fraudulent disclosures, or other factors. Funds that may invest in lower-rated fixed-income securities, commonlyreferred to as junk securities, are riskier than funds that may invest in higher-rated fixed-income securities. Additional information on the risks ofinvesting in investment-grade fixed-income securities in the lowest rating category and lower-rated fixed-income securities is set forth below.
Foreign securities risk
Funds that invest in securities traded principally in securities markets outside the United States are subject to additional and more varied risks, as thevalue of foreign securities may change more rapidly and extremely than the value of U.S. securities. Less information may be publicly availableregarding foreign issuers. Foreign securities may be subject to foreign taxes and may be more volatile than U.S. securities. Currency fluctuations andpolitical and economic developments may adversely impact the value of foreign securities. The securities markets of many foreign countries arerelatively small, with a limited number of companies representing a small number of industries. Additionally, issuers of foreign securities may not besubject to the same degree of regulation as U.S. issuers. Reporting, accounting, and auditing standards of foreign countries differ, in some casessignificantly, from U.S. standards. There are generally higher commission rates on foreign portfolio transactions, transfer taxes, higher custodial costs,and the possibility that foreign taxes will be charged on dividends and interest payable on foreign securities, some or all of which may not bereclaimable. Also, adverse changes in investment or exchange control regulations (which may include suspension of the ability to transfer currency orassets from a country); political changes; or diplomatic developments could adversely affect a fund’s investments. In the event of nationalization,expropriation, confiscatory taxation, or other confiscation, the fund could lose a substantial portion of, or its entire investment in, a foreign security.Some of the foreign risks are also applicable to funds that invest a material portion of their assets in securities of foreign issuers traded in the UnitedStates.
Depositary receipts are subject to most of the risks associated with investing in foreign securities directly because the value of a depositary receipt isdependent upon the market price of the underlying foreign equity security. Depositary receipts are also subject to liquidity risk.
Currency risk. Currency risk is the risk that fluctuations in exchange rates may adversely affect the U.S. dollar value of a fund’s investments.Currency risk includes both the risk that currencies in which a fund’s investments are traded, or currencies in which a fund has taken an activeinvestment position, will decline in value relative to the U.S. dollar and, in the case of hedging positions, that the U.S. dollar will decline in valuerelative to the currency being hedged. Currency rates in foreign countries may fluctuate significantly for a number of reasons, including the forces ofsupply and demand in the foreign exchange markets, actual or perceived changes in interest rates, intervention (or the failure to intervene) by U.S. orforeign governments or central banks, or currency controls or political developments in the United States or abroad. Certain funds may engage in
.262

proxy hedging of currencies by entering into derivative transactions with respect to a currency whose value is expected to correlate to the value of acurrency the fund owns or wants to own. This presents the risk that the two currencies may not move in relation to one another as expected. In thatcase, the fund could lose money on its investment and also lose money on the position designed to act as a proxy hedge. Certain funds may alsotake active currency positions and may cross-hedge currency exposure represented by their securities into another foreign currency. This may resultin a fund’s currency exposure being substantially different than that suggested by its securities investments. All funds with foreign currency holdingsand/or that invest or trade in securities denominated in foreign currencies or related derivative instruments may be adversely affected by changes inforeign currency exchange rates. Derivative foreign currency transactions (such as futures, forwards, and swaps) may also involve leveraging risk, inaddition to currency risk. Leverage may disproportionately increase a fund’s portfolio losses and reduce opportunities for gain when interest rates,stock prices, or currency rates are changing.
Emerging-market risk. Investments in the securities of issuers based in countries with emerging-market economies are subject to greater levels offoreign investment risk than investments in more-developed foreign markets, since emerging-market securities may present market, credit, currency,liquidity, legal, political, and other risks greater than, or in addition to, the risks of investing in developed foreign countries. These risks include highcurrency exchange-rate fluctuations; increased risk of default (including both government and private issuers); greater social, economic, and politicaluncertainty and instability (including the risk of war); more substantial governmental involvement in the economy; less governmental supervision andregulation of the securities markets and participants in those markets; controls on foreign investment and limitations on repatriation of investedcapital and on a fund’s ability to exchange local currencies for U.S. dollars; unavailability of currency hedging techniques in certain emerging-marketcountries; the fact that companies in emerging-market countries may be newly organized, smaller, and less seasoned; the difference in, or lack of,auditing and financial reporting standards, which may result in the unavailability of material information about issuers; different clearance andsettlement procedures, which may be unable to keep pace with the volume of securities transactions or otherwise make it difficult to engage in suchtransactions; difficulties in obtaining and/or enforcing legal judgments in foreign jurisdictions; and significantly smaller market capitalizations ofemerging-market issuers.
Fund of funds risk
The fund’s ability to achieve its investment objective will depend largely, in part, on: (i) the underlying funds’ performance, expenses and ability to meettheir investment objectives; and (ii) properly rebalancing assets among underlying funds and different asset classes. The fund is also subject to risksrelated to: (i) layering of fees of the underlying funds; and (ii) conflicts of interest associated with the subadvisor’s ability to allocate fund assets withoutlimit to other funds it advises and/or other funds advised by affiliated subadvisors. There is no assurance that either the fund or the underlying fundswill achieve their investment objectives.
Affiliated subadvised fund conflicts of interest risk
The subadvisor may allocate the fund’s assets without limit to underlying funds managed by the subadvisor and/or other affiliated subadvisors(affiliated subadvised funds). Accordingly, rebalancings of the assets of the fund present a conflict of interest because there is an incentive for thesubadvisor to allocate assets to the subadvisor and other affiliated subadvised funds rather than underlying funds managed by unaffiliated subadvisors.In this regard, the subadvisor and other affiliated subadvisors of affiliated subadvised funds benefit from the subadvisor’s allocations of fund assets tosuch funds through the additional subadvisory fees they earn on such allocated fund assets. The subadvisor has a duty to allocate assets only tounderlying funds it has determined are in the best interests of shareholders, and make allocations to affiliated subadvised funds on this basis withoutregard to any such economic incentive. As part of its oversight of the funds and the subadvisors, the advisor will monitor to ensure that allocations areconducted in accordance with these principles.
Multi-manager risk; limited universe of subadvisors and underlying funds
The fund’s ability to achieve its investment objective depends upon the subadvisor’s skill in determining the fund’s strategic allocation to investmentstrategies and in selecting the best mix of underlying funds. The allocation of investments among the different subadvisors managing underlying fundswith different styles and asset classes, such as equity, debt, U.S., or foreign securities, may have a more significant effect on the performance of a fundof funds when one of these investments is performing more poorly than the other. There is no assurance that allocation decisions will result in thedesired effects. Investment decisions made by the subadvisor may cause a fund of funds to incur losses or to miss profit opportunities on which itmight otherwise have capitalized. Moreover, at times, the subadvisor may invest fund assets in underlying funds managed by a limited number ofsubadvisors. In such circumstances, the fund’s performance could be substantially dependent on the performance of these subadvisors. Similarly, thesubadvisor’s allocation of a fund of fund’s assets to a limited number of underlying funds may adversely affect the performance of the fund of funds,and, in such circumstances, it will be more sensitive to the performance and risks associated with those funds and any investments in which suchunderlying funds focus.
Hedging, derivatives, and other strategic transactions risk
The ability of a fund to utilize hedging, derivatives, and other strategic transactions to benefit the fund will depend in part on its manager’s ability topredict pertinent market movements and market risk, counterparty risk, credit risk, interest-rate risk, and other risk factors, none of which can beassured. The skills required to utilize hedging and other strategic transactions are different from those needed to select a fund’s securities. Even if themanager only uses hedging and other strategic transactions in a fund primarily for hedging purposes or to gain exposure to a particular securitiesmarket, if the transaction does not have the desired outcome, it could result in a significant loss to a fund. The amount of loss could be more than theprincipal amount invested. These transactions may also increase the volatility of a fund and may involve a small investment of cash relative to themagnitude of the risks assumed, thereby magnifying the impact of any resulting gain or loss. For example, the potential loss from the use of futurescan exceed a fund’s initial investment in such contracts. In addition, these transactions could result in a loss to a fund if the counterparty to thetransaction does not perform as promised.
.263

A fund may invest in derivatives, which are financial contracts with a value that depends on, or is derived from, the value of underlying assets,reference rates, or indexes. Derivatives may relate to stocks, bonds, interest rates, currencies or currency exchange rates, and related indexes. A fundmay use derivatives for many purposes, including for hedging and as a substitute for direct investment in securities or other assets. Derivatives may beused in a way to efficiently adjust the exposure of a fund to various securities, markets, and currencies without a fund actually having to sell existinginvestments and make new investments. This generally will be done when the adjustment is expected to be relatively temporary or in anticipation ofeffecting the sale of fund assets and making new investments over time. Further, since many derivatives have a leverage component, adverse changesin the value or level of the underlying asset, reference rate, or index can result in a loss substantially greater than the amount invested in the derivativeitself. Certain derivatives have the potential for unlimited loss, regardless of the size of the initial investment. When a fund uses derivatives for leverage,investments in that fund will tend to be more volatile, resulting in larger gains or losses in response to market changes. To limit leverage risk, a fundmay segregate assets determined to be liquid or, as permitted by applicable regulation, enter into certain offsetting positions to cover its obligationsunder derivative instruments. For a description of the various derivative instruments the fund may utilize, refer to the SAI.
The regulation of the U.S. and non-U.S. derivatives markets has undergone substantial change in recent years and such change may continue. Inparticular, the Dodd-Frank Wall Street Reform and Consumer Protection Act, and regulation proposed to be promulgated thereunder require manyderivatives to be cleared and traded on an exchange, expand entity registration requirements, impose business conduct requirements on dealers thatenter into swaps with a pension plan, endowment, retirement plan or government entity, and required banks to move some derivatives trading units toa non-guaranteed affiliate separate from the deposit-taking bank or divest them altogether. Although the Commodity Futures Trading Commission(CFTC) has released final rules relating to clearing, reporting, recordkeeping and registration requirements under the legislation, many of the provisionsare subject to further final rule making, and thus its ultimate impact remains unclear. New regulations could, among other things, restrict the fund’sability to engage in derivatives transactions (for example, by making certain types of derivatives transactions no longer available to the fund) and/orincrease the costs of such derivatives transactions (for example, by increasing margin or capital requirements), and the fund may be unable to fullyexecute its investment strategies as a result. Limits or restrictions applicable to the counterparties with which the fund engages in derivativetransactions also could prevent the fund from using these instruments or affect the pricing or other factors relating to these instruments, or maychange the availability of certain investments.
At any time after the date of this prospectus, legislation may be enacted that could negatively affect the assets of the fund. Legislation or regulationmay change the way in which the fund itself is regulated. The advisor cannot predict the effects of any new governmental regulation that may beimplemented, and there can be no assurance that any new governmental regulation will not adversely affect the fund’s ability to achieve its investmentobjectives.
The use of derivative instruments may involve risks different from, or potentially greater than, the risks associated with investing directly in securitiesand other, more traditional assets. In particular, the use of derivative instruments exposes a fund to the risk that the counterparty to an OTC derivativescontract will be unable or unwilling to make timely settlement payments or otherwise honor its obligations. OTC derivatives transactions typically canonly be closed out with the other party to the transaction, although either party may engage in an offsetting transaction that puts that party in thesame economic position as if it had closed out the transaction with the counterparty or may obtain the other party’s consent to assign the transactionto a third party. If the counterparty defaults, the fund will have contractual remedies, but there is no assurance that the counterparty will meet itscontractual obligations or that, in the event of default, the fund will succeed in enforcing them. For example, because the contract for each OTCderivatives transaction is individually negotiated with a specific counterparty, a fund is subject to the risk that a counterparty may interpret contractualterms (e.g., the definition of default) differently than the fund when the fund seeks to enforce its contractual rights. If that occurs, the cost andunpredictability of the legal proceedings required for the fund to enforce its contractual rights may lead it to decide not to pursue its claims against thecounterparty. The fund, therefore, assumes the risk that it may be unable to obtain payments owed to it under OTC derivatives contracts or that thosepayments may be delayed or made only after the fund has incurred the costs of litigation. While a manager intends to monitor the creditworthiness ofcounterparties, there can be no assurance that a counterparty will meet its obligations, especially during unusually adverse market conditions. To theextent a fund contracts with a limited number of counterparties, the fund’s risk will be concentrated and events that affect the creditworthiness of anyof those counterparties may have a pronounced effect on the fund. Derivatives are also subject to a number of other risks, including market risk andliquidity risk. Since the value of derivatives is calculated and derived from the value of other assets, instruments, or references, there is a risk that theywill be improperly valued. Derivatives also involve the risk that changes in their value may not correlate perfectly with the assets, rates, or indexes theyare designed to hedge or closely track. Suitable derivatives transactions may not be available in all circumstances. The fund is also subject to the riskthat the counterparty closes out the derivatives transactions upon the occurrence of certain triggering events. In addition, a manager may determinenot to use derivatives to hedge or otherwise reduce risk exposure. Government legislation or regulation could affect the use of derivatives transactionsand could limit a fund’s ability to pursue its investment strategies.
A detailed discussion of various hedging and other strategic transactions appears in the SAI. The following is a list of certain derivatives and otherstrategic transactions that the fund intends to utilize and the main risks associated with each of them:
Credit default swaps. Counterparty risk, liquidity risk (i.e., the inability to enter into closing transactions), interest-rate risk, risk of default of theunderlying reference obligation, and risk of disproportionate loss are the principal risks of engaging in transactions involving credit default swaps.
Foreign currency forward contracts. Counterparty risk, liquidity risk (i.e., the inability to enter into closing transactions), foreign currency risk, andrisk of disproportionate loss are the principal risks of engaging in transactions involving foreign currency forward contracts.
Futures contracts. Counterparty risk, liquidity risk (i.e., the inability to enter into closing transactions), and risk of disproportionate loss are theprincipal risks of engaging in transactions involving futures contracts.
Interest-rate swaps. Counterparty risk, liquidity risk (i.e., the inability to enter into closing transactions), interest-rate risk, and risk ofdisproportionate loss are the principal risks of engaging in transactions involving interest-rate swaps.
Options. Counterparty risk, liquidity risk (i.e., the inability to enter into closing transactions), and risk of disproportionate loss are the principal risksof engaging in transactions involving options. Counterparty risk does not apply to exchange-traded options.
.264

Swaps. Counterparty risk, liquidity risk (i.e., the inability to enter into closing transactions), interest-rate risk, settlement risk, risk of default of theunderlying reference obligation, and risk of disproportionate loss are the principal risks of engaging in transactions involving swaps.
Hedging risk
There may be imperfect or even negative correlation between the price of the futures contracts and the price of the underlying securities. For example,futures contracts may not provide an effective hedge because changes in futures contract prices may not track those of the underlying securities orindexes they are intended to hedge. In addition, there are significant differences between the securities and futures markets that could result in animperfect correlation between the markets, causing a given hedge not to achieve its objectives. The degree of imperfection of correlation depends oncircumstances such as variations in speculative market demand for futures, including technical influences in futures trading, and differences betweenthe financial instruments being hedged and the instruments underlying the standard contracts available for trading. A decision as to whether, whenand how to hedge involves the exercise of skill and judgment, and even a well-conceived hedge may be unsuccessful to some degree because ofmarket behavior or unexpected interest rate trends. In addition, the fund’s investment in exchange-traded futures as a result of the risk managementstrategy could limit the upside participation of the fund in strong, rising markets with high volatility and could underperform funds that do not use arisk management strategy.
High portfolio turnover risk
A high fund portfolio turnover rate (over 100%) generally involves correspondingly greater brokerage commission and tax expenses, which must beborne directly by a fund and its shareholders, respectively. The portfolio turnover rate of a fund may vary from year to year, as well as within a year.
Investment company securities risk
A fund may invest in securities of other investment companies. The total return on such investments will be reduced by the operating expenses andfees of such other investment companies, including advisory fees. Investments in closed-end funds may involve the payment of substantial premiumsabove the value of such investment companies’ portfolio securities.
Large company risk
Larger, more established companies may be unable to respond quickly to new competitive challenges such as changes in technology and consumertastes. Many larger companies also may not be able to attain the high growth rate of successful smaller companies, especially during extended periodsof economic expansion. For purposes of the fund’s investment policies, the market capitalization of a company is based on its capitalization at the timethe fund purchases the company’s securities. Market capitalizations of companies change over time. The fund is not obligated to sell a company’ssecurity simply because, subsequent to its purchase, the company’s market capitalization has changed to be outside the capitalization range, if any, ineffect for the fund.
Leverage
Certain of the risk management techniques that would be used in the new strategy may involve indirect leverage. While these techniques would beintended to reduce downside exposure, in some cases leverage may magnify losses.
Lifecycle risk
There is no guarantee that the managers will correctly predict the market or economic conditions and, as with other mutual fund investments, youcould lose money even if the fund is at or close to its designated retirement year or in its postretirement stage.
Liquidity risk
The extent (if at all) to which a security may be sold or a derivative position closed without negatively impacting its market value may be impaired byreduced market activity or participation, legal restrictions, or other economic and market impediments. Funds with principal investment strategies thatinvolve investments in securities of companies with smaller market capitalizations, foreign securities, derivatives, or securities with substantial marketand/or credit risk tend to have the greatest exposure to liquidity risk. Exposure to liquidity risk may be heightened for funds that invest in securities ofemerging markets and related derivatives that are not widely traded, and that may be subject to purchase and sale restrictions.
The capacity of traditional dealers to engage in fixed-income trading has not kept pace with the bond market’s growth. As a result, dealer inventoriesof corporate bonds, which indicate the ability to “make markets,” i.e., buy or sell a security at the quoted bid and ask price, respectively, are at or nearhistoric lows relative to market size. Because market makers provide stability to fixed-income markets, the significant reduction in dealer inventoriescould lead to decreased liquidity and increased volatility, which may become exacerbated during periods of economic or political stress.
Quantitative models may not produce the desired results
In determining when to employ risk management techniques and/or reallocate exposure among equity, fixed-income and cash, the subadvisor usesquantitative models that use historical market data. However, future market conditions may not be consistent with historical periods, and the historicaldata may not, therefore, prove to be an accurate predictor of future volatility or losses. The model also may not measure or analyze such dataeffectively. Thus, the quantitative model may not produce the desired results and may not accurately forecast either future volatility or future largemarket declines, and this would affect the ability of a fund to be successful in managing the volatility of returns and limiting the magnitude of portfoliolosses.
Risk management strategies may not be successful, may limit upside potential or may permit or result in losses
The purpose of the risk management strategies is to attempt to limit the fund’s exposure to more volatile asset classes during periods of high volatilityand attempt to reduce the fund’s losses during market declines; however, there is no assurance that these strategies will be successful, and these riskmanagement strategies could limit the upside participation of the fund in rising markets or even result in losses in rising markets. The application of risk
.265
management techniques can be complex, and misjudgments in implementation may result in under or over allocations to equity, fixed income and/orcash and cash equivalent exposure.
Short sales risk
The funds may make short sales of securities. This means a fund may sell a security that it does not own in anticipation of a decline in the market valueof the security. A fund generally borrows the security to deliver to the buyer in a short sale. The fund must then buy the security at its market pricewhen the borrowed security must be returned to the lender. Short sales involve costs and risk. The fund must pay the lender interest on the security itborrows, and the fund will lose money if the price of the security increases between the time of the short sale and the date when the fund replaces theborrowed security. A fund may also make short sales “against the box.” In a short sale against the box, at the time of sale, the fund owns or has theright to acquire the identical security, or one equivalent in kind or amount, at no additional cost.
Until a fund closes its short position or replaces a borrowed security, a fund will (i) segregate with its custodian cash or other liquid assets at such alevel that the amount segregated plus the amount deposited with the lender as collateral will equal the current market value of the security sold shortor (ii) otherwise cover its short position. The need to maintain cash or other liquid assets in segregated accounts could limit the fund’s ability to pursueother opportunities as they arise.
Short positions
In taking a short position, a fund seeks to profit from an anticipated decline in the value of a security or index of securities. If the security or indexinstead appreciates in value, the fund will incur losses by having to pay to close out its position at a higher price than the price it received to open thatposition. Unlike losses from declines in long positions in stocks or other securities (which may not exceed the original amount invested), the losses afund may incur to close out a short position if the underlying security or index increases in value are potentially unlimited.
Small and mid-sized company risk
Market risk and liquidity risk may be pronounced for securities of companies with medium-sized market capitalizations and are particularly pronouncedfor securities of companies with smaller market capitalizations. These companies may have limited product lines, markets, or financial resources, orthey may depend on a few key employees. The securities of companies with medium and smaller market capitalizations may trade less frequently andin lesser volume than more widely held securities, and their value may fluctuate more sharply than those securities. They may also trade in the OTCmarket or on a regional exchange, or may otherwise have limited liquidity. Investments in less-seasoned companies with medium and smaller marketcapitalizations may not only present greater opportunities for growth and capital appreciation, but also involve greater risks than are customarilyassociated with more established companies with larger market capitalizations. These risks apply to all funds that invest in the securities of companieswith smaller- or medium-sized market capitalizations. For purposes of the fund’s investment policies, the market capitalization of a company is basedon its capitalization at the time the fund purchases the company’s securities. Market capitalizations of companies change over time. The fund is notobligated to sell a company’s security simply because, subsequent to its purchase, the company’s market capitalization has changed to be outside thecapitalization range, if any, in effect for the fund.
Swaps
Counterparty risk, liquidity risk (i.e., the inability to enter into closing transactions), interest-rate risk, settlement risk, risk of default of the underlyingreference obligation and risk of disproportionate loss are the principal risks of engaging in transactions involving swaps.
Target allocation risk
When a fund has a greater allocation to equity securities, it will be less conservative and have more equity securities risk exposure. These risks areexplained under “Equity securities risk.” The risks associated with fixed-income and short-term fixed-income securities are explained under “Fixed-income securities risk,” “Interest-rate risk,” “Credit and counterparty risk,” and “Lower-rated fixed-income securities risk and high yield securitiesrisk.”
Use of index futures
While the use of index futures may involve a small investment of cash, the losses to a fund could exceed the amount invested, and in certain caseseven the total value of the fund’s assets, due to the embedded leverage provided by the derivative. Index futures may also result in a loss to the fund ifthe counterparty to the transaction does not perform.
Additional information about the funds’ principal risksThe principal risks of investing in each fund are summarized in its Fund summary above. Below are descriptions of the main factors that may play a rolein shaping a fund’s overall risk profile. The risk descriptions appear in alphabetical order and not in order of importance. For further details about fundrisks, including additional risk factors that are not discussed in this prospectus because they are not considered primary factors, see the funds’Statement of Additional Information (SAI).
An investment in a fund is not a bank deposit and is not insured or guaranteed by the Federal Deposit Insurance Corporation or any other governmentagency. A fund’s shares will go up and down in price, meaning that you could lose money by investing in the fund. Many factors influence a mutualfund’s performance. A fund’s investment strategy may not produce the intended results.
Instability in the financial markets has led many governments, including the United States government, to take a number of unprecedented actionsdesigned to support certain financial institutions and segments of the financial markets that have experienced extreme volatility and, in some cases, alack of liquidity. Federal, state, and other governments, and their regulatory agencies or self-regulatory organizations, may take actions that affect theregulation of the instruments in which a fund invests, or the issuers of such instruments, in ways that are unforeseeable. Legislation or regulation mayalso change the way in which each fund itself is regulated. Such legislation or regulation could limit or preclude each fund’s ability to achieve its
.266
investment objective. In addition, political events within the United States and abroad could negatively impact financial markets and each fund’sperformance. Further, certain municipalities of the United States and its territories are financially strained and may face the possibility of default ontheir debt obligations, which could directly or indirectly detract from each fund’s performance.
Governments or their agencies may acquire distressed assets from financial institutions and acquire ownership interests in those institutions. Theimplications of government ownership and disposition of these assets are unclear, and such a program may have positive or negative effects on theliquidity, valuation and performance of each fund’s portfolio holdings. Furthermore, volatile financial markets can expose each fund to greater marketand liquidity risk and potential difficulty in valuing portfolio instruments.
Arbitrage securities and distressed companies risk
A merger or other restructuring, or a tender or exchange offer, proposed or pending at the time a fund invests in risk arbitrage securities may not becompleted on the terms contemplated, resulting in losses to the fund. Debt obligations of distressed companies typically are unrated, lower-rated, indefault or close to default. Also, securities of distressed companies are generally more likely to become worthless than the securities of more financiallystable companies.
Asset allocation risk
Although asset allocation among different asset categories generally limits risk and exposure to any one category, the risk remains that the subadvisormay favor an asset category that performs poorly relative to the other asset categories. To the extent that alternative asset categories underperform thegeneral stock market, the fund would perform poorly relative to a fund invested primarily in the general stock market.
Changing distribution levels risk
The distribution amounts paid by the fund generally depend on the amount of income and/or dividends paid by the fund’s investments. As a result ofmarket, interest rate and other circumstances, the amount of cash available for distribution by the fund and the fund’s distribution rate may vary ordecline. The risk of such variability is accentuated in currently prevailing market and interest rate circumstances.
Concentration risk
When a fund’s investments are concentrated in a particular industry or sector of the economy, they are not as diversified as the investments of mostfunds and are far less diversified than the broad securities markets. This means that concentrated funds tend to be more volatile than other funds, andthe values of their investments tend to go up and down more rapidly. In addition, a fund that invests in a particular industry or sector is particularlysusceptible to the impact of market, economic, regulatory, and other factors affecting that industry or sector. From time to time, a small number ofcompanies may represent a large portion of a single industry or a group of related industries as a whole.
Consumer discretionary risk
The consumer discretionary sector may be affected by fluctuations in supply and demand, and may also be adversely affected by changes in consumerspending as a result of world events, political and economic conditions, commodity price volatility, changes in exchange rates, imposition of importcontrols, increased competition, depletion of resources, and labor relations.
Convertible securities risk
Convertible securities generally offer lower interest or dividend yields than nonconvertible fixed-income securities of similar credit quality because ofthe potential for capital appreciation. The market values of convertible securities tend to decline as interest rates increase and, conversely, to increaseas interest rates decline. However, a convertible security’s market value also tends to reflect the market price of common stock of the issuing company,particularly when that stock price is greater than the convertible security’s conversion price. The conversion price is defined as the predetermined priceor exchange ratio at which the convertible security can be converted or exchanged for the underlying common stock. As the market price of theunderlying common stock declines below the conversion price, the price of the convertible security tends to be increasingly influenced by the yield ofthe convertible security. Thus, it may not decline in price to the same extent as the underlying common stock. In the event of a liquidation of theissuing company, convertible securities generally entail less risk than the company’s common stock.
Credit and counterparty risk
This is the risk that the issuer or guarantor of a fixed-income security, the counterparty to an over-the-counter (OTC) derivatives contract (see“Hedging, derivatives, and other strategic transactions risk”), or a borrower of a fund’s securities will be unable or unwilling to make timely principal,interest, or settlement payments, or otherwise honor its obligations. Credit risk associated with investments in fixed-income securities relates to theability of the issuer to make scheduled payments of principal and interest on an obligation. A fund that invests in fixed-income securities is subject tovarying degrees of risk that the issuers of the securities will have their credit ratings downgraded or will default, potentially reducing the fund’s shareprice and income level. Nearly all fixed-income securities are subject to some credit risk, which may vary depending upon whether the issuers of thesecurities are corporations, domestic or foreign governments, or their subdivisions or instrumentalities. U.S. government securities are subject tovarying degrees of credit risk depending upon whether the securities are supported by the full faith and credit of the United States; supported by theability to borrow from the U.S. Treasury; supported only by the credit of the issuing U.S. government agency, instrumentality, or corporation; orotherwise supported by the United States. For example, issuers of many types of U.S. government securities (e.g., the Federal Home Loan MortgageCorporation (Freddie Mac), Federal National Mortgage Association (Fannie Mae), and Federal Home Loan Banks), although chartered or sponsored byCongress, are not funded by congressional appropriations, and their fixed-income securities, including asset-backed and mortgage-backed securities,are neither guaranteed nor insured by the U.S. government. An agency of the U.S. government has placed Fannie Mae and Freddie Mac intoconservatorship, a statutory process with the objective of returning the entities to normal business operations. It is unclear what effect thisconservatorship will have on the securities issued or guaranteed by Fannie Mae or Freddie Mac. As a result, these securities are subject to more creditrisk than U.S. government securities that are supported by the full faith and credit of the United States (e.g., U.S. Treasury bonds). When a fixed-
.267
income security is not rated, a manager may have to assess the risk of the security itself. Asset-backed securities, whose principal and interest paymentsare supported by pools of other assets, such as credit card receivables and automobile loans, are subject to further risks, including the risk that theobligors of the underlying assets default on payment of those assets.
Funds that invest in below-investment-grade securities, also called junk bonds (e.g., fixed-income securities rated Ba or lower by Moody’s InvestorsService, Inc. or BB or lower by Standard & Poor’s Ratings Services, at the time of investment, or determined by a manager to be of comparable qualityto securities so rated) are subject to increased credit risk. The sovereign debt of many foreign governments, including their subdivisions andinstrumentalities, falls into this category. Below-investment-grade securities offer the potential for higher investment returns than higher-ratedsecurities, but they carry greater credit risk: their issuers’ continuing ability to meet principal and interest payments is considered speculative, they aremore susceptible to real or perceived adverse economic and competitive industry conditions, and they may be less liquid than higher-rated securities.
In addition, a fund is exposed to credit risk to the extent that it makes use of OTC derivatives (such as forward foreign currency contracts and/or swapcontracts) and engages to a significant extent in the lending of fund securities or the use of repurchase agreements. OTC derivatives transactions canbe closed out with the other party to the transaction. If the counterparty defaults, a fund will have contractual remedies, but there is no assurance thatthe counterparty will be able to meet its contractual obligations or that, in the event of default, a fund will succeed in enforcing them. A fund,therefore, assumes the risk that it may be unable to obtain payments owed to it under OTC derivatives contracts or that those payments may bedelayed or made only after the fund has incurred the costs of litigation. While the manager intends to monitor the creditworthiness of contractcounterparties, there can be no assurance that the counterparty will be in a position to meet its obligations, especially during unusually adverse marketconditions.
Cybersecurity and operational risk
Intentional cybersecurity breaches include unauthorized access to systems, networks, or devices (such as through “hacking” activity); infection fromcomputer viruses or other malicious software code; and attacks that shut down, disable, slow, or otherwise disrupt operations, business processes, orwebsite access or functionality. In addition, unintentional incidents can occur, such as the inadvertent release of confidential information (possiblyresulting in the violation of applicable privacy laws).
A cybersecurity breach could result in the loss or theft of customer data or funds, the inability to access electronic systems (“denial of services”), loss ortheft of proprietary information or corporate data, physical damage to a computer or network system, or costs associated with system repairs. Suchincidents could cause a fund, the advisor, a manager, or other service providers to incur regulatory penalties, reputational damage, additionalcompliance costs, or financial loss. In addition, such incidents could affect issuers in which a fund invests, and thereby cause the fund’s investments tolose value.
The fund is exposed to operational risk arising from a number of factors, including, but not limited to, human error, processing and communicationerrors, errors of the fund’s service providers, counterparties, or other third parties, failed or inadequate processes and technology or system failures.
Defaulted debt risk
Investing in defaulted debt securities is speculative and involves substantial risks in addition to the risks of investing in high-yield securities that have notdefaulted. The fund generally will not receive interest payments on defaulted debt securities, and there is a substantial risk that principal will not berepaid. A fund investing in defaulted debt securities may incur additional expenses to the extent that it is required to seek recovery upon a default inthe payment of principal of or interest on the securities. In any reorganization or liquidation proceeding relating to defaulted debt, a fund may lose itsentire investment in such securities or may be required to accept cash or securities with a value lower than the fund’s original investment. Defaulteddebt securities and any securities received in exchange for defaulted debt securities may be subject to restrictions on resale.
Distressed investments risk
Distressed investments include loans, loan participations, bonds, notes, and nonperforming and subperforming mortgage loans, many of which are notpublicly traded and may involve a substantial degree of risk. In certain periods, there may be little or no liquidity in the markets for these securities orinstruments. In addition, the prices of such securities or instruments may be subject to periods of abrupt and erratic market movements and above-average price volatility. It may be more difficult to value such securities, and the spread between the bid and asked prices of such securities may begreater than normally expected. If the manager’s evaluation of the risks and anticipated outcome of an investment in a distressed security should proveincorrect, the fund may lose a substantial portion or all of its investment or it may be required to accept cash or securities with a value less than thefund’s original investment.
Economic and market events risk
Events in certain sectors historically have resulted, and may in the future result, in an unusually high degree of volatility in the financial markets, bothdomestic and foreign. These events have included, but are not limited to: bankruptcies, corporate restructurings, and other events related to the sub-prime mortgage crisis in 2008; governmental efforts to limit short selling and high frequency trading; measures to address U.S. federal and statebudget deficits; social, political, and economic instability in Europe; economic stimulus by the Japanese central bank; steep declines in oil prices;dramatic changes in currency exchange rates; and China’s economic slowdown. Interconnected global economies and financial markets increase thepossibility that conditions in one country or region might adversely impact issuers in a different country or region. Both domestic and foreign equitymarkets have experienced increased volatility and turmoil, with issuers that have exposure to the real estate, mortgage, and credit markets particularlyaffected. Banks and financial services companies could suffer losses if interest rates continue to rise or economic conditions deteriorate.
In addition, relatively high market volatility and reduced liquidity in credit and fixed-income markets may adversely affect many issuers worldwide.Actions taken by the U.S. Federal Reserve (Fed) or foreign central banks to stimulate or stabilize economic growth, such as interventions in currencymarkets, could cause high volatility in the equity and fixed-income markets. Reduced liquidity may result in less money being available to purchase raw
.268
materials, goods, and services from emerging markets, which may, in turn, bring down the prices of these economic staples. It may also result inemerging-market issuers having more difficulty obtaining financing, which may, in turn, cause a decline in their securities prices.
In addition, while interest rates have been unusually low in recent years in the United States and abroad, the Fed’s decision to raise the target fedfunds rate in 2017, following a similar move the previous year, and the possibility that the Fed may continue with such rate increases, among otherfactors, could cause markets to experience continuing high volatility. A significant increase in interest rates may cause a decline in the market for equitysecurities. Also, regulators have expressed concern that rate increases may contribute to price volatility. These events and the possible resulting marketvolatility may have an adverse effect on the fund.
Political turmoil within the United States and abroad may also impact the fund. Although the U.S. government has honored its credit obligations, itremains possible that the United States could default on its obligations. While it is impossible to predict the consequences of such an unprecedentedevent, it is likely that a default by the United States would be highly disruptive to the U.S. and global securities markets and could significantly impairthe value of the fund’s investments. Similarly, political events within the United States at times have resulted, and may in the future result, in ashutdown of government services, which could negatively affect the U.S. economy, decrease the value of many fund investments, and increaseuncertainty in or impair the operation of the U.S. or other securities markets. The U.S. is also considering significant new investments in infrastructureand national defense which, coupled with lower federal taxes, could lead to increased government borrowing and higher interest rates. While theseproposed policies are going through the political process, the equity and debt markets may react strongly to expectations, which could increasevolatility, especially if the market’s expectations for changes in government policies are not borne out.
Uncertainties surrounding the sovereign debt of a number of European Union (EU) countries and the viability of the EU have disrupted and may in thefuture disrupt markets in the United States and around the world. If one or more countries leave the EU or the EU dissolves, the world’s securitiesmarkets likely will be significantly disrupted. In June 2016, the United Kingdom approved a referendum to leave the EU, commonly referred to as“Brexit.” There is significant market uncertainty regarding Brexit’s ramifications, and the range and potential implications of possible political,regulatory, economic, and market outcomes are difficult to predict. Political and military events, including in North Korea, Venezuela, Syria, and otherareas of the Middle East, and nationalist unrest in Europe, also may cause market disruptions.
In addition, there is a risk that the prices of goods and services in the United States and many foreign economies may decline over time, known asdeflation. Deflation may have an adverse effect on stock prices and creditworthiness and may make defaults on debt more likely. If a country’seconomy slips into a deflationary pattern, it could last for a prolonged period and may be difficult to reverse.
Equity securities risk
Common and preferred stocks represent equity ownership in a company. Stock markets are volatile. The price of equity securities will fluctuate, andcan decline and reduce the value of a fund investing in equities. The price of equity securities fluctuates based on changes in a company’s financialcondition and overall market and economic conditions. The value of equity securities purchased by a fund could decline if the financial condition of thecompanies in which the fund is invested declines, or if overall market and economic conditions deteriorate. An issuer’s financial condition could declineas a result of poor management decisions, competitive pressures, technological obsolescence, undue reliance on suppliers, labor issues, shortages,corporate restructurings, fraudulent disclosures, or other factors. Changes in the financial condition of a single issuer can impact the market as awhole.
Even a fund that invests in high-quality, or blue chip, equity securities, or securities of established companies with large market capitalizations (whichgenerally have strong financial characteristics), can be negatively impacted by poor overall market and economic conditions. Companies with largemarket capitalizations may also have less growth potential than smaller companies and may be less able to react quickly to changes in the marketplace.
The fund may maintain substantial exposure to equities and generally does not attempt to time the market. Because of this exposure, the possibilitythat stock market prices in general will decline over short or extended periods subjects the fund to unpredictable declines in the value of itsinvestments, as well as periods of poor performance.
Growth investing risk. Certain equity securities (generally referred to as growth securities) are purchased primarily because a manager believes thatthese securities will experience relatively rapid earnings growth. Growth securities typically trade at higher multiples of current earnings than othersecurities. Growth securities are often more sensitive to market fluctuations than other securities because their market prices are highly sensitive tofuture earnings expectations. At times when it appears that these expectations may not be met, growth stock prices typically fall.Value investing risk. Certain equity securities (generally referred to as value securities) are purchased primarily because they are selling at pricesbelow what the manager believes to be their fundamental value and not necessarily because the issuing companies are expected to experiencesignificant earnings growth. The fund bears the risk that the companies that issued these securities may not overcome the adverse businessdevelopments or other factors causing their securities to be perceived by the manager to be underpriced or that the market may never come torecognize their fundamental value. A value stock may not increase in price, as anticipated by the manager investing in such securities, if otherinvestors fail to recognize the company’s value and bid up the price or invest in markets favoring faster growing companies. The fund’s strategy ofinvesting in value stocks also carries the risk that in certain markets, value stocks will underperform growth stocks. In addition, securities issued byU.S. entities with substantial foreign operations may involve risks relating to economic, political or regulatory conditions in foreign countries.
Exchange-traded funds (ETFs) risk
These are a type of investment company bought and sold on a securities exchange. An ETF represents a fixed portfolio of securities designed to track aparticular market index. A fund could purchase an ETF to temporarily gain exposure to a portion of the U.S. or a foreign market while awaitingpurchase of underlying securities. The risks of owning an ETF generally reflect the risks of owning the underlying securities it is designed to track,although lack of liquidity in an ETF could result in it being more volatile. An ETF has its own fees and expenses, which are borne indirectly by a fund.
.269
Financial services sector risk
A fund investing principally in securities of companies in the financial services sector is particularly vulnerable to events affecting that sector.Companies in the financial services sector may include, but are not limited to, commercial and industrial banks, savings and loan associations and theirholding companies, consumer and industrial finance companies, diversified financial services companies, investment banking, securities brokerage andinvestment advisory companies, leasing companies, and insurance companies. The types of companies that compose the financial services sector maychange over time. These companies are all subject to extensive regulation, rapid business changes, volatile performance dependent upon theavailability and cost of capital, prevailing interest rates, and significant competition. General economic conditions significantly affect these companies.Credit and other losses resulting from the financial difficulty of borrowers or other third parties have a potentially adverse effect on companies in thissector. Investment banking, securities brokerage, and investment advisory companies are particularly subject to government regulation and the risksinherent in securities trading and underwriting activities. In addition, certain financial services companies face shrinking profit margins due to newcompetitors, the cost of new technology, and the pressure to compete globally.
Fixed-income securities risk
Fixed-income securities are generally subject to two principal types of risk, as well as other risks described below: (1) interest-rate risk and (2) creditquality risk.
Interest-rate risk. Fixed-income securities are affected by changes in interest rates. When interest rates decline, the market value of fixed-incomesecurities generally can be expected to rise. Conversely, when interest rates rise, the market value of fixed-income securities generally can beexpected to decline. The longer the duration or maturity of a fixed-income security, the more susceptible it is to interest-rate risk. Recent andpotential future changes in government monetary policy may affect the level of interest rates.§Credit quality risk. Fixed-income securities are subject to the risk that the issuer of the security will not repay all or a portion of the principalborrowed and will not make all interest payments. If the credit quality of a fixed-income security deteriorates after a fund has purchased the security,the market value of the security may decrease and lead to a decrease in the value of the fund’s investments. An issuer’s credit quality coulddeteriorate as a result of poor management decisions, competitive pressures, technological obsolescence, undue reliance on suppliers, labor issues,shortages, corporate restructurings, fraudulent disclosures, or other factors. Funds that may invest in lower-rated fixed-income securities, commonlyreferred to as junk securities, are riskier than funds that may invest in higher-rated fixed-income securities. Additional information on the risks ofinvesting in investment-grade fixed-income securities in the lowest rating category and lower-rated fixed-income securities is set forth below.Investment-grade fixed-income securities in the lowest rating category risk. Investment-grade fixed-income securities in the lowest ratingcategory (such as Baa by Moody’s Investors Service, Inc. or BBB by Standard & Poor’s Ratings Services and comparable unrated securities) involve ahigher degree of risk than fixed-income securities in the higher rating categories. While such securities are considered investment-grade quality andare deemed to have adequate capacity for payment of principal and interest, such securities lack outstanding investment characteristics and havespeculative characteristics as well. For example, changes in economic conditions or other circumstances are more likely to lead to a weakenedcapacity to make principal and interest payments than is the case with higher-grade securities.Prepayment of principal risk. Many types of debt securities, including floating-rate loans, are subject to prepayment risk. Prepayment risk occurswhen the issuer of a security can repay principal prior to the security’s maturity. Securities subject to prepayment risk can offer less potential forgains when the credit quality of the issuer improves.
Foreign securities risk
Funds that invest in securities traded principally in securities markets outside the United States are subject to additional and more varied risks, as thevalue of foreign securities may change more rapidly and extremely than the value of U.S. securities. Less information may be publicly availableregarding foreign issuers. Foreign securities may be subject to foreign taxes and may be more volatile than U.S. securities. Currency fluctuations andpolitical and economic developments may adversely impact the value of foreign securities. The securities markets of many foreign countries arerelatively small, with a limited number of companies representing a small number of industries. Additionally, issuers of foreign securities may not besubject to the same degree of regulation as U.S. issuers. Reporting, accounting, and auditing standards of foreign countries differ, in some casessignificantly, from U.S. standards. There are generally higher commission rates on foreign portfolio transactions, transfer taxes, higher custodial costs,and the possibility that foreign taxes will be charged on dividends and interest payable on foreign securities, some or all of which may not bereclaimable. Also, adverse changes in investment or exchange control regulations (which may include suspension of the ability to transfer currency orassets from a country); political changes; or diplomatic developments could adversely affect a fund’s investments. In the event of nationalization,expropriation, confiscatory taxation, or other confiscation, the fund could lose a substantial portion of, or its entire investment in, a foreign security.Some of the foreign risks are also applicable to funds that invest a material portion of their assets in securities of foreign issuers traded in the UnitedStates.
Depositary receipts are subject to most of the risks associated with investing in foreign securities directly because the value of a depositary receipt isdependent upon the market price of the underlying foreign equity security. Depositary receipts are also subject to liquidity risk.
Currency risk. Currency risk is the risk that fluctuations in exchange rates may adversely affect the U.S. dollar value of a fund’s investments.Currency risk includes both the risk that currencies in which a fund’s investments are traded, or currencies in which a fund has taken an activeinvestment position, will decline in value relative to the U.S. dollar and, in the case of hedging positions, that the U.S. dollar will decline in valuerelative to the currency being hedged. Currency rates in foreign countries may fluctuate significantly for a number of reasons, including the forces ofsupply and demand in the foreign exchange markets, actual or perceived changes in interest rates, intervention (or the failure to intervene) by U.S. orforeign governments or central banks, or currency controls or political developments in the United States or abroad. Certain funds may engage inproxy hedging of currencies by entering into derivative transactions with respect to a currency whose value is expected to correlate to the value of acurrency the fund owns or wants to own. This presents the risk that the two currencies may not move in relation to one another as expected. In thatcase, the fund could lose money on its investment and also lose money on the position designed to act as a proxy hedge. Certain funds may also
.270
take active currency positions and may cross-hedge currency exposure represented by their securities into another foreign currency. This may resultin a fund’s currency exposure being substantially different than that suggested by its securities investments. All funds with foreign currency holdingsand/or that invest or trade in securities denominated in foreign currencies or related derivative instruments may be adversely affected by changes inforeign currency exchange rates. Derivative foreign currency transactions (such as futures, forwards, and swaps) may also involve leveraging risk, inaddition to currency risk. Leverage may disproportionately increase a fund’s portfolio losses and reduce opportunities for gain when interest rates,stock prices, or currency rates are changing.
Emerging-market risk. Investments in the securities of issuers based in countries with emerging-market economies are subject to greater levels offoreign investment risk than investments in more-developed foreign markets, since emerging-market securities may present market, credit, currency,liquidity, legal, political, and other risks greater than, or in addition to, the risks of investing in developed foreign countries. These risks include highcurrency exchange-rate fluctuations; increased risk of default (including both government and private issuers); greater social, economic, and politicaluncertainty and instability (including the risk of war); more substantial governmental involvement in the economy; less governmental supervision andregulation of the securities markets and participants in those markets; controls on foreign investment and limitations on repatriation of investedcapital and on a fund’s ability to exchange local currencies for U.S. dollars; unavailability of currency hedging techniques in certain emerging-marketcountries; the fact that companies in emerging-market countries may be newly organized, smaller, and less seasoned; the difference in, or lack of,auditing and financial reporting standards, which may result in the unavailability of material information about issuers; different clearance andsettlement procedures, which may be unable to keep pace with the volume of securities transactions or otherwise make it difficult to engage in suchtransactions; difficulties in obtaining and/or enforcing legal judgments in foreign jurisdictions; and significantly smaller market capitalizations ofemerging-market issuers.
Frontier-market risk. Frontier-market countries generally have smaller economies and less-developed capital markets or legal, regulatory, andpolitical systems than traditional emerging-market countries. As a result, the risks of investing in emerging-market countries are magnified infrontier-market countries. Potential circumstances that may result in magnified risks in frontier-market countries include (i) extreme price volatilityand illiquidity, (ii) government ownership or control of parts of the private sector or other protectionist measures, (iii) large currency fluctuations, (iv)limited investment opportunities, and (v) inadequate investor protections and regulatory enforcement. In certain frontier-market countries, fraud andcorruption may be more prevalent than in developed-market countries.Greater China risk. Although they are larger and/or more established than many emerging markets, the markets of the Greater Chinaregion function in many ways as emerging markets, and carry the high levels of risks associated with emerging markets. In addition, there are risksparticular to the region. For example, investments in Taiwan could be adversely affected by its political relationship with China. The attitude of theChinese government toward growth and capitalism is uncertain, and the markets of Hong Kong and China could be hurt significantly by anygovernment interference or any material change in government policy. For example, a government may restrict investment in companies orindustries considered important to national interests, or intervene in the financial markets, such as by imposing trading restrictions, or banning orcurtailing short selling. A small number of companies and industries represent a relatively large portion of the Greater China market as a whole. Allof these factors mean that the fund is more likely to experience higher volatility and lower liquidity than a portfolio that invests mainly in U.S. stocks.
Hong Kong Stock Connect Program (Stock Connect) risk. China A-Shares listed and traded on certain Chinese stock exchanges through StockConnect, a mutual market access program designed to, among other things, enable foreign investment in the People’s Republic of China (PRC) viabrokers in Hong Kong, are subject to a number of restrictions imposed by Chinese securities regulations and local exchange listing rules. BecauseStock Connect was established in November 2014, developments are likely, which may restrict or otherwise affect the fund’s investments or returns.Furthermore, any changes in laws, regulations and policies of the China A-Shares market or rules in relation to Stock Connect may affect China A-Share prices. These risks are heightened by the underdeveloped state of the PRC’s investment and banking systems in general.
Geographic focus risk
The fund’s performance will be closely tied to the market, currency, political, economic, regulatory, geopolitical, and other conditions in the countriesand regions in which the fund’s assets are invested. These conditions include anticipated or actual government budget deficits or other financialdifficulties, levels of inflation and unemployment, fiscal and monetary controls, and political and social instability in such countries and regions. To theextent the fund focuses its investments in a single country, a small number of countries, or a particular geographic region, its performance may bedriven largely by country or region performance and could fluctuate more widely than if the fund were more geographically diversified.
Healthcare sector risk
Health sciences industries may be affected by product obsolescence, thin capitalization, limited product lines, markets, and financial resources, orpersonnel challenges and legislative or regulatory activities affecting the healthcare sector, such as approval policies for drugs, medical devices, orprocedures, and changes in governmental and private payment systems and product liabilities.
Hedging, derivatives, and other strategic transactions risk
The ability of a fund to utilize hedging, derivatives, and other strategic transactions to benefit the fund will depend in part on its manager’s ability topredict pertinent market movements and market risk, counterparty risk, credit risk, interest-rate risk, and other risk factors, none of which can beassured. The skills required to utilize hedging and other strategic transactions are different from those needed to select a fund’s securities. Even if themanager only uses hedging and other strategic transactions in a fund primarily for hedging purposes or to gain exposure to a particular securitiesmarket, if the transaction does not have the desired outcome, it could result in a significant loss to a fund. The amount of loss could be more than theprincipal amount invested. These transactions may also increase the volatility of a fund and may involve a small investment of cash relative to themagnitude of the risks assumed, thereby magnifying the impact of any resulting gain or loss. For example, the potential loss from the use of futurescan exceed a fund’s initial investment in such contracts. In addition, these transactions could result in a loss to a fund if the counterparty to thetransaction does not perform as promised.
.271

A fund may invest in derivatives, which are financial contracts with a value that depends on, or is derived from, the value of underlying assets,reference rates, or indexes. Derivatives may relate to stocks, bonds, interest rates, currencies or currency exchange rates, and related indexes. A fundmay use derivatives for many purposes, including for hedging and as a substitute for direct investment in securities or other assets. Derivatives may beused in a way to efficiently adjust the exposure of a fund to various securities, markets, and currencies without a fund actually having to sell existinginvestments and make new investments. This generally will be done when the adjustment is expected to be relatively temporary or in anticipation ofeffecting the sale of fund assets and making new investments over time. Further, since many derivatives have a leverage component, adverse changesin the value or level of the underlying asset, reference rate, or index can result in a loss substantially greater than the amount invested in the derivativeitself. Certain derivatives have the potential for unlimited loss, regardless of the size of the initial investment. When a fund uses derivatives for leverage,investments in that fund will tend to be more volatile, resulting in larger gains or losses in response to market changes. To limit leverage risk, a fundmay segregate assets determined to be liquid or, as permitted by applicable regulation, enter into certain offsetting positions to cover its obligationsunder derivative instruments. For a description of the various derivative instruments the fund may utilize, refer to the SAI.
The regulation of the U.S. and non-U.S. derivatives markets has undergone substantial change in recent years and such change may continue. Inparticular, the Dodd-Frank Wall Street Reform and Consumer Protection Act, and regulation proposed to be promulgated thereunder require manyderivatives to be cleared and traded on an exchange, expand entity registration requirements, impose business conduct requirements on dealers thatenter into swaps with a pension plan, endowment, retirement plan or government entity, and required banks to move some derivatives trading units toa non-guaranteed affiliate separate from the deposit-taking bank or divest them altogether. Although the Commodity Futures Trading Commission(CFTC) has released final rules relating to clearing, reporting, recordkeeping and registration requirements under the legislation, many of the provisionsare subject to further final rule making, and thus its ultimate impact remains unclear. New regulations could, among other things, restrict the fund’sability to engage in derivatives transactions (for example, by making certain types of derivatives transactions no longer available to the fund) and/orincrease the costs of such derivatives transactions (for example, by increasing margin or capital requirements), and the fund may be unable to fullyexecute its investment strategies as a result. Limits or restrictions applicable to the counterparties with which the fund engages in derivativetransactions also could prevent the fund from using these instruments or affect the pricing or other factors relating to these instruments, or maychange the availability of certain investments.
At any time after the date of this prospectus, legislation may be enacted that could negatively affect the assets of the fund. Legislation or regulationmay change the way in which the fund itself is regulated. The advisor cannot predict the effects of any new governmental regulation that may beimplemented, and there can be no assurance that any new governmental regulation will not adversely affect the fund’s ability to achieve its investmentobjectives.
The use of derivative instruments may involve risks different from, or potentially greater than, the risks associated with investing directly in securitiesand other, more traditional assets. In particular, the use of derivative instruments exposes a fund to the risk that the counterparty to an OTC derivativescontract will be unable or unwilling to make timely settlement payments or otherwise honor its obligations. OTC derivatives transactions typically canonly be closed out with the other party to the transaction, although either party may engage in an offsetting transaction that puts that party in thesame economic position as if it had closed out the transaction with the counterparty or may obtain the other party’s consent to assign the transactionto a third party. If the counterparty defaults, the fund will have contractual remedies, but there is no assurance that the counterparty will meet itscontractual obligations or that, in the event of default, the fund will succeed in enforcing them. For example, because the contract for each OTCderivatives transaction is individually negotiated with a specific counterparty, a fund is subject to the risk that a counterparty may interpret contractualterms (e.g., the definition of default) differently than the fund when the fund seeks to enforce its contractual rights. If that occurs, the cost andunpredictability of the legal proceedings required for the fund to enforce its contractual rights may lead it to decide not to pursue its claims against thecounterparty. The fund, therefore, assumes the risk that it may be unable to obtain payments owed to it under OTC derivatives contracts or that thosepayments may be delayed or made only after the fund has incurred the costs of litigation. While a manager intends to monitor the creditworthiness ofcounterparties, there can be no assurance that a counterparty will meet its obligations, especially during unusually adverse market conditions. To theextent a fund contracts with a limited number of counterparties, the fund’s risk will be concentrated and events that affect the creditworthiness of anyof those counterparties may have a pronounced effect on the fund. Derivatives are also subject to a number of other risks, including market risk andliquidity risk. Since the value of derivatives is calculated and derived from the value of other assets, instruments, or references, there is a risk that theywill be improperly valued. Derivatives also involve the risk that changes in their value may not correlate perfectly with the assets, rates, or indexes theyare designed to hedge or closely track. Suitable derivatives transactions may not be available in all circumstances. The fund is also subject to the riskthat the counterparty closes out the derivatives transactions upon the occurrence of certain triggering events. In addition, a manager may determinenot to use derivatives to hedge or otherwise reduce risk exposure. Government legislation or regulation could affect the use of derivatives transactionsand could limit a fund’s ability to pursue its investment strategies.
A detailed discussion of various hedging and other strategic transactions appears in the SAI. The following is a list of certain derivatives and otherstrategic transactions that the fund intends to utilize and the main risks associated with each of them:
Credit default swaps. Counterparty risk, liquidity risk (i.e., the inability to enter into closing transactions), interest-rate risk, risk of default of theunderlying reference obligation, and risk of disproportionate loss are the principal risks of engaging in transactions involving credit default swaps.Depositary Receipts. Depositary receipts are subject to most of the risks associated with investing in foreign and emerging market securitiesdirectly because the value of a depositary receipt is dependent upon the market price of the underlying foreign equity security. Depositary receiptsare also subject to liquidity risk.
Equity-linked notes are subject to risks similar to those related to investing in the underlying securities. An equitylinked note is dependent on theindividual credit of the note’s issuer. Equity-linked notes often are privately placed and may not be rated. The secondary market for equity-linkednotes may be limited.
Foreign currency forward contracts. Counterparty risk, liquidity risk (i.e., the inability to enter into closing transactions), foreign currency risk, andrisk of disproportionate loss are the principal risks of engaging in transactions involving foreign currency forward contracts.
.272

Foreign currency swaps. Counterparty risk, liquidity risk (i.e., the inability to enter into closing transactions), foreign currency risk, and risk ofdisproportionate loss are the principal risks of engaging in transactions involving foreign currency swaps.
Futures contracts. Counterparty risk, liquidity risk (i.e., the inability to enter into closing transactions), and risk of disproportionate loss are theprincipal risks of engaging in transactions involving futures contracts.
Interest-rate swaps. Counterparty risk, liquidity risk (i.e., the inability to enter into closing transactions), interest-rate risk, and risk ofdisproportionate loss are the principal risks of engaging in transactions involving interest-rate swaps.
Inverse floating-rate securities. Liquidity risk (i.e., the inability to enter into closing transactions), interest-rate risk, issuer risk, and risk ofdisproportionate loss are the principal risks of engaging in transactions involving inverse floating-rate securities.
Options. Counterparty risk, liquidity risk (i.e., the inability to enter into closing transactions), and risk of disproportionate loss are the principal risksof engaging in transactions involving options. Counterparty risk does not apply to exchange-traded options.
Options on futures. Counterparty risk, liquidity risk (i.e., the inability to enter into closing transactions), and risk of disproportionate loss are theprincipal risks of engaging in transactions involving options on futures. Counterparty risk does not apply to exchange-traded options.
Reverse repurchase agreements. An event of default or insolvency of the counterparty to a reverse repurchase agreement could result in delays orrestrictions with respect to the fund’s ability to dispose of the underlying securities. A reverse repurchase agreement may be considered a form ofleverage and may, therefore, increase fluctuations in the fund’s net asset value per share (NAV).
Swaps. Counterparty risk, liquidity risk (i.e., the inability to enter into closing transactions), interest-rate risk, settlement risk, risk of default of theunderlying reference obligation, and risk of disproportionate loss are the principal risks of engaging in transactions involving swaps.
Swaptions. Risks associated with swaptions include liquidity risk (i.e., the inability to enter into closing transactions), risk of default of the underlyingreference obligation, risk of disproportionate loss, and counterparty and interest-rate risk.Total return swaps. Counterparty risk, liquidity risk (i.e., the inability to enter into closing transactions), market risk, interest-rate risk, settlementrisk, risk of default of the underlying reference obligation, and risk of disproportionate loss are the principal risks of engaging in total return swaps.
High portfolio turnover risk
A high fund portfolio turnover rate (over 100%) generally involves correspondingly greater brokerage commission and tax expenses, which must beborne directly by a fund and its shareholders, respectively. The portfolio turnover rate of a fund may vary from year to year, as well as within a year.
Hybrid instrument risk
The risks of investing in hybrid instruments are a combination of the risks of investing in securities, options, futures and currencies. Therefore, aninvestment in a hybrid instrument may include significant risks not associated with a similar investment in a traditional debt instrument. The risks of aparticular hybrid instrument will depend upon the terms of the instrument, but may include, without limitation, the possibility of significant changes inthe benchmark for the hybrid instrument or the prices of underlying assets to which the instrument is linked. These risks generally depend upon factorsunrelated to the operations or credit quality of the issuer of the hybrid instrument and that may not be readily foreseen by the purchaser. Such factorsinclude economic and political events, the supply and demand for the underlying assets, and interest rate movements. In recent years, variousbenchmarks and prices for underlying assets have been highly volatile, and such volatility may be expected in the future. Hybrid instruments may bearinterest or pay preferred dividends at below-market (or even relatively nominal) rates. Hybrid instruments may also carry liquidity risk since theinstruments are often “customized” to meet the needs of a particular investor. Therefore, the number of investors that would be willing and able tobuy such instruments in the secondary market may be smaller than for more traditional debt securities.
Income stock risk
Income provided by the fund may be affected by changes in the dividend polices of the companies in which the fund invests and the capital resourcesavailable for such payments at such companies.
Index management risk
Certain factors may cause a fund that is an index fund to track its target index less closely. For example, a subadvisor may select securities that are notfully representative of the index, and the fund’s transaction expenses and the size and timing of its cash flows, may result in the fund’s performancebeing different than that of its index. Moreover, the fund will generally reflect the performance of its target index even when the index does notperform well.
Industrials sector risk
Companies in the industrials sector may be affected by general economic conditions, commodity production and pricing, supply and demandfluctuations, environmental and other government regulations, geopolitical events, interest rates, insurance costs, technological developments,liabilities arising from governmental or civil actions, labor relations, import controls and government spending. The value of securities issued bycompanies in the industrials sector may also be adversely affected by supply and demand related to their specific products or services and industrialssector products in general, as well as liability for environmental damage and product liability claims and government regulations. For example, theproducts of manufacturing companies may face obsolescence due to rapid technological developments and frequent new product introduction.Certain companies within this sector, particularly aerospace and defense companies, may be heavily affected by government spending policies becausecompanies involved in this industry rely, to a significant extent, on government demand for their products and services. In addition, securities ofindustrials companies in transportation may be cyclical and have occasional sharp price movements which may result from economic changes, fuelprices, labor relations and insurance costs, and transportation companies in certain countries may also be subject to significant government regulationand oversight, which may adversely affect their businesses.
.273
Information technology risk
The information technology sector can be significantly affected by rapid obsolescence of existing technology, short product cycles, falling prices andprofits, competition from new market entrants, government regulation and general economic conditions.
Initial public offerings (IPOs) risk
Certain funds may invest a portion of their assets in shares of IPOs. IPOs may have a magnified impact on the performance of a fund with a small assetbase. The impact of IPOs on a fund’s performance will likely decrease as the fund’s asset size increases, which could reduce the fund’s returns. IPOsmay not be consistently available to a fund for investing, particularly as the fund’s asset base grows. IPO shares are frequently volatile in price due tothe absence of a prior public market, the small number of shares available for trading, and limited information about the issuer. Therefore, a fund mayhold IPO shares for a very short period of time. This may increase the turnover of a fund and may lead to increased expenses for a fund, such ascommissions and transaction costs. In addition, IPO shares can experience an immediate drop in value if the demand for the securities does notcontinue to support the offering price.
Investment company securities risk
A fund may invest in securities of other investment companies. The total return on such investments will be reduced by the operating expenses andfees of such other investment companies, including advisory fees. Investments in closed-end funds may involve the payment of substantial premiumsabove the value of such investment companies’ portfolio securities.
Large company risk
Larger, more established companies may be unable to respond quickly to new competitive challenges such as changes in technology and consumertastes. Many larger companies also may not be able to attain the high growth rate of successful smaller companies, especially during extended periodsof economic expansion. For purposes of the fund’s investment policies, the market capitalization of a company is based on its capitalization at the timethe fund purchases the company’s securities. Market capitalizations of companies change over time. The fund is not obligated to sell a company’ssecurity simply because, subsequent to its purchase, the company’s market capitalization has changed to be outside the capitalization range, if any, ineffect for the fund.
Liquidity risk
The extent (if at all) to which a security may be sold or a derivative position closed without negatively impacting its market value may be impaired byreduced market activity or participation, legal restrictions, or other economic and market impediments. Funds with principal investment strategies thatinvolve investments in securities of companies with smaller market capitalizations, foreign securities, derivatives, or securities with substantial marketand/or credit risk tend to have the greatest exposure to liquidity risk. Exposure to liquidity risk may be heightened for funds that invest in securities ofemerging markets and related derivatives that are not widely traded, and that may be subject to purchase and sale restrictions.
The capacity of traditional dealers to engage in fixed-income trading has not kept pace with the bond market’s growth. As a result, dealer inventoriesof corporate bonds, which indicate the ability to “make markets,” i.e., buy or sell a security at the quoted bid and ask price, respectively, are at or nearhistoric lows relative to market size. Because market makers provide stability to fixed-income markets, the significant reduction in dealer inventoriescould lead to decreased liquidity and increased volatility, which may become exacerbated during periods of economic or political stress.
Money Market Trust Only
A fund is exposed to liquidity risk when reduced trading volume, a relative lack of market makers, or legal restrictions impair the fund’s ability to sell itsportfolio securities at an advantageous market price. While the fund endeavors to maintain a high level of liquidity in its portfolio, its ability to sellportfolio securities can deteriorate rapidly due to a lack of willing buyers, a reduced number of traditional market participants, the reduced capacity oftraditional market participants to make a market in fixed-income securities, or general market conditions.
In addition, liquidity risk may be magnified in a rising interest rate environment in which investor redemptions from money market funds may be higherthan normal. The selling of fixed-income securities to satisfy fund shareholder redemptions may result in an increased supply of such securities duringperiods of reduced investor demand, thereby impairing the fund’s ability to sell such securities. The inability to sell portfolio securities or the need tosell such securities under unfavorable market conditions may adversely affect the fund’s ability to maintain a stable $1.00 share price.
Loan participations risk
A fund’s ability to receive payments of principal and interest and other amounts in connection with loans (whether through participations,assignments, or otherwise) will depend primarily on the financial condition of the borrower. The failure by a fund to receive scheduled interest orprincipal payments on a loan or a loan participation, because of a default, bankruptcy, or any other reason, would adversely affect the income of thefund and would likely reduce the value of its assets. Transactions in loan investments may take a significant amount of time (i.e., seven days or longer)to settle. This could pose a liquidity risk to the fund and, if the fund’s exposure to such investments is substantial, could impair the fund’s ability tomeet shareholder redemptions in a timely manner. Investments in loan participations and assignments present the possibility that a fund could be heldliable as a co-lender under emerging legal theories of lender liability. Even with secured loans, there is no assurance that the collateral securing the loanwill be sufficient to protect a fund against losses in value or a decline in income in the event of a borrower’s nonpayment of principal or interest, and inthe event of a bankruptcy of a borrower, the fund could experience delays or limitations in its ability to realize the benefits of any collateral securingthe loan. Unless, under the terms of the loan or other indebtedness, a fund has direct recourse against the corporate borrower, the fund may have torely on the agent bank or other financial intermediary to apply appropriate credit remedies against a corporate borrower. Furthermore, the value of anysuch collateral may decline and may be difficult to liquidate. The amount of public information available with respect to loans may be less extensivethan that available for registered or exchange-listed securities. Because a significant percent of loans and loan participations are not generally rated byindependent credit rating agencies, a decision by a fund to invest in a particular loan or loan participation could depend exclusively on the manager’s
.274
credit analysis of the borrower, and in the case of a loan participation, the intermediary. A fund may have limited rights to enforce the terms of anunderlying loan.
It is unclear whether U.S. federal securities laws afford protections against fraud and misrepresentation, as well as market manipulation, to investmentsin loans and other forms of direct indebtedness under certain circumstances. In the absence of definitive regulatory guidance, a fund relies on themanager’s research in an attempt to avoid situations where fraud, misrepresentation, or market manipulation could adversely affect the fund.
A fund also may be in possession of material non-public information about a borrower as a result of owning a floating-rate instrument issued by suchborrower. Because of prohibitions on trading in securities of issuers while in possession of such information, a fund might be unable to enter into atransaction in a publicly traded security issued by that borrower when it would otherwise be advantageous to do so.
Lower-rated and high-yield fixed-income securities risk
Lower-rated fixed-income securities are defined as securities rated below investment grade (such as Ba and below by Moody’s InvestorsService, Inc. and BB and below by Standard & Poor’s Ratings Services) (also called junk bonds). The general risks of investing in these securities are asfollows:
Risk to principal and income. Investing in lower-rated fixed-income securities is considered speculative. While these securities generally providegreater income potential than investments in higher-rated securities, there is a greater risk that principal and interest payments will not be made.Issuers of these securities may even go into default or become bankrupt.
Price volatility. The price of lower-rated fixed-income securities may be more volatile than securities in the higher-rated categories. This volatilitymay increase during periods of economic uncertainty or change. The price of these securities is affected more than higher-rated fixed-incomesecurities by the market’s perception of their credit quality, especially during times of adverse publicity. In the past, economic downturns or increasesin interest rates have, at times, caused more defaults by issuers of these securities and may do so in the future. Economic downturns and increases ininterest rates have an even greater effect on highly leveraged issuers of these securities.
Liquidity. The market for lower-rated fixed-income securities may have more limited trading than the market for investment-grade fixed-incomesecurities. Therefore, it may be more difficult to sell these securities, and these securities may have to be sold at prices below their market value inorder to meet redemption requests or to respond to changes in market conditions.
Dependence on manager’s own credit analysis. While a manager may rely on ratings by established credit rating agencies, it will alsosupplement such ratings with its own independent review of the credit quality of the issuer. Therefore, the assessment of the credit risk of lower-rated fixed-income securities is more dependent on the manager’s evaluation than the assessment of the credit risk of higher-rated securities.Additional risks regarding lower-rated corporate fixed-income securities. Lower-rated corporate fixed-income securities (and comparableunrated securities) tend to be more sensitive to individual corporate developments and changes in economic conditions than higher-rated corporatefixed-income securities. Issuers of lower-rated corporate fixed-income securities may also be highly leveraged, increasing the risk that principal andincome will not be repaid.
Additional risks regarding lower-rated foreign government fixed-income securities. Lower-rated foreign government fixed-income securitiesare subject to the risks of investing in foreign countries described under “Foreign securities risk.” In addition, the ability and willingness of a foreigngovernment to make payments on debt when due may be affected by the prevailing economic and political conditions within the country.Emerging-market countries may experience high inflation, interest rates, and unemployment, as well as exchange-rate fluctuations which adverselyaffect trade and political uncertainty or instability. These factors increase the risk that a foreign government will not make payments when due.
Master limited partnership (MLP) risk
Investing in MLPs involves certain risks related to investing in the underlying assets of MLPs and risks associated with pooled investment vehicles. MLPsholding credit-related investments are subject to interest-rate risk and the risk of default on payment obligations by debt securities. In addition,investments in the debt and securities of MLPs involve certain other risks, including risks related to limited control and limited rights to vote on mattersaffecting MLPs, risks related to potential conflicts of interest between an MLP and the MLP’s general partner, cash flow risks, dilution risks and risksrelated to the general partner’s right to require unit-holders to sell their common units at an undesirable time or price. The fund’s investments in MLPsmay be subject to legal and other restrictions on resale or may be less liquid than publicly traded securities. Certain MLP securities may trade in lowervolumes due to their smaller capitalizations, and may be subject to more abrupt or erratic price movements and may lack sufficient market liquidity toenable the fund to effect sales at an advantageous time or without a substantial drop in price. If the fund is one of the largest investors in an MLP, itmay be more difficult for the fund to buy and sell significant amounts of such investments without an unfavorable impact on prevailing market prices.Larger purchases or sales of MLP investments by the fund in a short period of time may cause abnormal movements in the market price of theseinvestments. As a result, these investments may be difficult to dispose of at an advantageous price when the fund desires to do so. During periods ofinterest rate volatility, these investments may not provide attractive returns, which may adversely impact the overall performance of the fund. MLPs inwhich the fund may invest operate oil, natural gas, petroleum, or other facilities within the energy sector. As a result, the fund will be susceptible toadverse economic, environmental, or regulatory occurrences impacting the energy sector.
Mortgage-backed and asset-backed securities riskMortgage-backed securities. Mortgage-backed securities represent participating interests in pools of residential mortgage loans, which areguaranteed by the U.S. government, its agencies, or its instrumentalities. However, the guarantee of these types of securities relates to the principaland interest payments, and not to the market value of such securities. In addition, the guarantee only relates to the mortgage-backed securities heldby the fund and not the purchase of shares of the fund.
Mortgage-backed securities are issued by lenders, such as mortgage bankers, commercial banks, and savings and loan associations. Such securitiesdiffer from conventional debt securities, which provide for the periodic payment of interest in fixed amounts (usually semiannually) with principalpayments at maturity or on specified dates. Mortgage-backed securities provide periodic payments which are, in effect, a pass through of the
.275
interest and principal payments (including any prepayments) made by the individual borrowers on the pooled mortgage loans. A mortgage-backedsecurity will mature when all the mortgages in the pool mature or are prepaid. Therefore, mortgage-backed securities do not have a fixed maturityand their expected maturities may vary when interest rates rise or fall.
When interest rates fall, homeowners are more likely to prepay their mortgage loans. An increased rate of prepayments on the fund’s mortgage-backed securities will result in an unforeseen loss of interest income to the fund as the fund may be required to reinvest assets at a lower interestrate. Because prepayments increase when interest rates fall, the prices of mortgage-backed securities do not increase as much as other fixed-incomesecurities when interest rates fall.
When interest rates rise, homeowners are less likely to prepay their mortgage loans. A decreased rate of prepayments lengthens the expectedmaturity of a mortgage-backed security. Therefore, the prices of mortgage-backed securities may decrease more than prices of other fixed-incomesecurities when interest rates rise.
The yield of mortgage-backed securities is based on the average life of the underlying pool of mortgage loans. The actual life of any particular poolmay be shortened by unscheduled or early payments of principal and interest. Principal prepayments may result from the sale of the underlyingproperty, or the refinancing or foreclosure of underlying mortgages. The occurrence of prepayments is affected by a wide range of economic,demographic, and social factors, and, accordingly, it is not possible to accurately predict the average life of a particular pool. The actual prepaymentexperience of a pool of mortgage loans may cause the yield realized by the fund to differ from the yield calculated on the basis of the average life ofthe pool. In addition, if the fund purchases mortgage-backed securities at a premium, the premium may be lost in the event of early prepayment,which may result in a loss to the fund.
Prepayments tend to increase during periods of falling interest rates, while during periods of rising interest rates, prepayments are likely to decline.Monthly interest payments received by a fund have a compounding effect, which will increase the yield to shareholders as compared with debtobligations that pay interest semiannually. Because of the reinvestment of prepayments of principal at current rates, mortgage-backed securities maybe less effective than U.S. Treasury bonds of similar maturity at maintaining yields during periods of declining interest rates. Also, although the valueof debt securities may increase as interest rates decline, the value of these pass through types of securities may not increase as much, due to theirprepayment feature.
Collateralized mortgage obligations (CMOs). A fund may invest in mortgage-backed securities called CMOs. CMOs are issued in separate classeswith different stated maturities. As the mortgage pool experiences prepayments, the pool pays off investors in classes with shorter maturities first. Byinvesting in CMOs, a fund may manage the prepayment risk of mortgage-backed securities. However, prepayments may cause the actual maturity ofa CMO to be substantially shorter than its stated maturity.
Asset-backed securities. Asset-backed securities include interests in pools of debt securities, commercial or consumer loans, or other receivables.The value of these securities depends on many factors, including changes in interest rates, the availability of information concerning the pool and itsstructure, the credit quality of the underlying assets, the market’s perception of the servicer of the pool, and any credit enhancement provided. Inaddition, asset-backed securities have prepayment risks similar to mortgage-backed securities.
Inverse interest-only securities Inverse interest-only securities that are mortgage-backed securities are subject to the same risks as othermortgage-backed securities. In addition, the coupon on an inverse interest-only security can be extremely sensitive to changes in prevailing interestrates.
TBA mortgage contracts TBA mortgage contracts involve a risk of loss if the value of the underlying security to be purchased declines prior todelivery date. The yield obtained for such securities may be higher or lower than yields available in the market on delivery date.
Non-diversified risk
Overall risk can be reduced by investing in securities from a diversified pool of issuers, while overall risk is increased by investing in securities of a smallnumber of issuers. If a fund is not diversified within the meaning of the Investment Company Act of 1940, that means it is allowed to invest a largeportion of assets in any one issuer or a small number of issuers, which may result in greater susceptibility to associated risks. As a result, credit, market,and other risks associated with a non-diversified fund’s investment strategies or techniques may be more pronounced than for funds that arediversified.
Preferred and convertible securities risk
Unlike interest on debt securities, preferred stock dividends are payable only if declared by the issuer’s Board. Also, preferred stock may be subject tooptional or mandatory redemption provisions. The market values of convertible securities tend to fall as interest rates rise and rise as interest rates fall.The value of convertible preferred stock can depend heavily upon the value of the security into which such convertible preferred stock is converted,depending on whether the market price of the underlying security exceeds the conversion price.
Privately held and newly public companies risk
Investments in the stocks of privately held companies and newly public companies involve greater risks than investments in stocks of companies thathave traded publicly on an exchange for extended time periods. Investments in such companies are less liquid and may be difficult to value. There maybe significantly less information available about these companies’ business models, quality of management, earnings growth potential, and othercriteria used to evaluate their investment prospects. The extent (if at all) to which securities of privately held companies or newly public companies maybe sold without negatively impacting its market value may be impaired by reduced market activity or participation, legal restrictions, or other economicand market impediments. Funds with principal investment strategies that involve investments in securities of privately held companies tend to have agreater exposure to liquidity risk than funds that do not invest in securities of privately held companies.
.276

Real estate investment trust (REIT) risk
REITs are subject to risks associated with the ownership of real estate. Some REITs experience market risk and liquidity risk due to investment in alimited number of properties, in a narrow geographic area, or in a single property type, which increases the risk that such REIT could be unfavorablyaffected by the poor performance of a single investment or investment type. These companies are also sensitive to factors such as changes in realestate values and property taxes, interest rates, cash flow of underlying real estate assets, supply and demand, and the management skill andcreditworthiness of the issuer. Borrowers could default on or sell investments that a REIT holds, which could reduce the cash flow needed to makedistributions to investors. In addition, REITs may also be affected by tax and regulatory requirements impacting the REITs’ ability to qualify forpreferential tax treatments or exemptions. REITs require specialized management and pay management expenses. REITs also are subject to physicalrisks to real property, including weather, natural disasters, terrorist attacks, war, or other events that destroy real property.
REITs include equity REITs and mortgage REITs. Equity REITs may be affected by changes in the value of the underlying property owned by the trusts,while mortgage REITs may be affected by the quality of any credit extended. Further, equity and mortgage REITs are dependent upon managementskills and generally may not be diversified. Equity and mortgage REITs are also subject to heavy cash flow dependency, defaults by borrowers, and self-liquidations. In addition, equity and mortgage REITs could possibly fail to qualify for tax-free pass-through of income under the Internal Revenue Codeof 1986, as amended (the Code), or to maintain their exemptions from registration under the Investment Company Act of 1940 (1940 Act). The abovefactors may also adversely affect a borrower’s or a lessee’s ability to meet its obligations to the REIT. In the event of a default by a borrower or lessee,the REIT may experience delays in enforcing its rights as a mortgagee or lessor and may incur substantial costs associated with protecting itsinvestments. In addition, even many of the larger REITs in the industry tend to be small to medium-sized companies in relation to the equity markets asa whole. Moreover, shares of REITs may trade less frequently and, therefore, are subject to more erratic price movements than securities of largerissuers.
Real estate securities risk
Investing in securities of companies in the real estate industry subjects a fund to the risks associated with the direct ownership of real estate.§These risks include:
Declines in the value of real estate
Risks related to general and local economic conditions
Possible lack of availability of mortgage funds
Overbuilding
Extended vacancies of properties
Increased competition
Increases in property taxes and operating expenses
Changes in zoning laws
Losses due to costs resulting from the cleanup of environmental problems
Liability to third parties for damages resulting from environmental problems
Casualty or condemnation losses
Limitations on rents
Changes in neighborhood values and the appeal of properties to tenants
Changes in interest rates and
Liquidity risk
Therefore, for a fund investing a substantial amount of its assets in securities of companies in the real estate industry, the value of the fund’s sharesmay change at different rates compared with the value of shares of a fund with investments in a mix of different industries.
Securities of companies in the real estate industry include equity REITs and mortgage REITs. Equity REITs may be affected by changes in the value of theunderlying property owned by the REIT, while mortgage REITs may be affected by the quality of any credit extended. Further, equity and mortgageREITs are dependent upon management skills and generally may not be diversified. Equity and mortgage REITs are also subject to heavy cash flowdependency, defaults by borrowers, and self-liquidations. In addition, equity and mortgage REITs could possibly fail to qualify for tax-free pass throughof income under the Internal Revenue Code of 1986 (the Code) or to maintain their exemptions from registration under the 1940 Act. The abovefactors may also adversely affect a borrower’s or a lessee’s ability to meet its obligations to a REIT. In the event of a default by a borrower or lessee, aREIT may experience delays in enforcing its rights as a mortgagee or lessor and may incur substantial costs associated with protecting its investments.
In addition, even the larger REITs in the industry tend to be small to medium-sized companies in relation to the equity markets as a whole. Moreover,shares of REITs may trade less frequently and, therefore, are subject to more erratic price movements than securities of larger issuers.
Redemption risk
Money Market Trust may experience periods of heavy redemptions that could cause the fund to liquidate its assets at inopportune times or at a loss ordepressed value, particularly during periods of declining or illiquid markets, and that could affect the fund’s ability to maintain a $1.00 share price.Redemption risk is greater to the extent that the fund has investors with large shareholdings, short investment horizons or unpredictable cash flowneeds. The redemption by one or more large shareholders of their holdings in the fund could cause the remaining shareholders in the fund to losemoney. In addition, the fund may suspend redemptions and liquidate the fund when permitted by applicable regulations.
.277
S&P 500 Index risk
An investment in the fund involves risks similar to the risks of investing directly in the equity securities included in the S&P 500 Index.
Sector risk
When a fund’s investments are focused in one or more sectors of the economy, they are not as diversified as the investments of most funds and are farless diversified than the broad securities markets. This means that focused funds tend to be more volatile than other funds, and the values of theirinvestments tend to go up and down more rapidly. In addition, a fund which invests in particular sectors is particularly susceptible to the impact ofmarket, economic, regulatory, and other factors affecting those sectors. From time to time, a small number of companies may represent a largeportion of a particular sector or sectors.
Banking. Commercial banks (including “money center” regional and community banks), savings and loan associations and holding companies of theforegoing are especially subject to adverse effects of volatile interest rates, concentrations of loans in particular industries (such as real estate or energy)and significant competition. The profitability of these businesses is to a significant degree dependent upon the availability and cost of capital funds.Banks, thrifts and their holding companies are especially subject to the adverse effects of economic recession. Economic conditions in the real estatemarket may have a particularly strong effect on certain banks and savings associations. Commercial banks and savings associations are subject toextensive federal and, in many instances, state regulation. Neither such extensive regulation nor the federal insurance of deposits ensures the solvencyor profitability of companies in this industry, and there is no assurance against losses in securities issued by such companies.
Financial Services Sector. A fund investing principally in securities of companies in the financial services sector is particularly vulnerable to eventsaffecting that sector. Companies in the financial services sector may include, but are not limited to, commercial and industrial banks, savings and loanassociations and their holding companies, consumer and industrial finance companies, diversified financial services companies, investment banking,securities brokerage and investment advisory companies, leasing companies and insurance companies. The types of companies that comprise thefinancial services sector may change over time.
These companies compete with banks and thrifts to provide traditional financial service products, in addition to their traditional services, such asbrokerage and investment advice. In addition, certain financial service companies face shrinking profit margins due to new competitors, the cost ofnew technology and the pressure to compete globally.
Health Sciences. Companies in this sector are subject to the additional risks of increased competition within the health care industry, changes inlegislation or government regulations, reductions in government funding, the uncertainty of governmental approval of a particular product, productliability or other litigation, patent expirations and the obsolescence of popular products. The prices of the securities of health sciences companies mayfluctuate widely due to government regulation and approval of their products and services, which may have a significant effect on their price andavailability. In addition, the types of products or services produced or provided by these companies may quickly become obsolete. Moreover, liability forproducts that are later alleged to be harmful or unsafe may be substantial and may have a significant impact on a company’s market value or shareprice.
Insurance Companies. Insurance companies are engaged in underwriting, selling, distributing or placing of property and casualty, life or healthinsurance. Insurance company profits are affected by many factors, including interest rate movements, the imposition of premium rate caps,competition and pressure to compete globally. Property and casualty insurance profits may also be affected by weather catastrophes and otherdisasters. Already extensively regulated, insurance companies’ profits may also be adversely affected by increased government regulations or tax lawchanges. Insurance companies are particularly subject to government regulation and rate setting, potential anti-trust and tax law changes, andindustry-wide pricing and competition cycles. Property and casualty insurance companies may also be affected by weather and other catastrophes. Lifeand health insurance companies may be affected by mortality and morbidity rates, including the effects of epidemics. Individual insurance companiesmay be exposed to reserve inadequacies, problems in investment portfolios (for example, due to real estate or “junk” bond holdings) and failures ofreinsurance carriers.
Materials. Issuers in the materials sector could be adversely affected by commodity price volatility, exchange rates, import controls and increasedcompetition. Production of industrial materials often exceeds demand as a result of over-building or economic downturns, leading to poor investmentreturns. Issuers in the materials sector are at risk for environmental damage and product liability claims and may be adversely affected by depletion ofresources, technical progress, labor relations and government regulations.
Metals. The specific political and economic risks affecting the price of metals include changes in U.S. or foreign tax, currency or mining laws, increasedenvironmental costs, international monetary and political policies, economic conditions within an individual country, trade imbalances, and trade orcurrency restrictions between countries. The prices of metals, in turn, are likely to affect the market prices of securities of companies mining orprocessing metals, and accordingly, the value of investments in such securities may also be affected. Metal-related investments as a group have notperformed as well as the stock market in general during periods when the U.S. dollar is strong, inflation is low and general economic conditions arestable. In addition, returns on metal-related investments have traditionally been more volatile than investments in broader equity or debt markets.
Other Financial Services Companies. Many of the investment considerations discussed in connection with banks and insurance companies also apply tofinancial services companies. These companies are all subject to extensive regulation, rapid business changes, volatile performance dependent upon theavailability and cost of capital and prevailing interest rates and significant competition. General economic conditions significantly affect thesecompanies. Credit and other losses resulting from the financial difficulty of borrowers or other third parties have a potentially adverse effect oncompanies in this sector. Investment banking, securities brokerage and investment advisory companies are particularly subject to governmentregulation and the risks inherent in securities trading and underwriting activities.
Technology companies. A fund investing in technology companies, including companies engaged in Internet-related activities, is subject to the risk ofshort product cycles and rapid obsolescence of products and services and competition from new and existing companies. The realization of any one of
.278
these risks may result in significant earnings loss and price volatility. Some technology companies also have limited operating histories and are subjectto the risks of a small or unseasoned company described under “Small and mid-size company risk.”
Telecommunications. Companies in the telecommunications sector are subject to the additional risks of rapid obsolescence, lack of standardization orcompatibility with existing technologies, an unfavorable regulatory environment and a dependency on patent and copyright protection. The prices ofthe securities of companies in the telecommunications sector may fluctuate widely due to both federal and state regulations governing rates of returnand services that may be offered, fierce competition for market share, and competitive challenges in the U.S. from foreign competitors engaged instrategic joint ventures with U.S. companies and in foreign markets from both U.S. and foreign competitors. In addition, recent industry consolidationtrends may lead to increased regulation of telecommunications companies in their primary markets.
Utilities. Issuers in the utilities sector are subject to many risks, including the following: increases in fuel and other operating costs; restrictions onoperations; increased costs and delays as a result of environmental and safety regulations; coping with the impact of energy conservation and otherfactors reducing the demand for services; technological innovations that may render existing plants, equipment or products obsolete; the potentialimpact of natural or man-made disasters; difficulty in obtaining adequate returns on invested capital; difficulty in obtaining approval for rate increases;the high cost of obtaining financing, particularly during periods of inflation; increased competition resulting from deregulation, overcapacity andpricing pressures; and the negative impact of regulation. Because utility companies are faced with the same obstacles, issues and regulatory burdens,their securities may react similarly and more in unison to these or other market conditions.
Short sales risk
The funds may make short sales of securities. This means a fund may sell a security that it does not own in anticipation of a decline in the market valueof the security. A fund generally borrows the security to deliver to the buyer in a short sale. The fund must then buy the security at its market pricewhen the borrowed security must be returned to the lender. Short sales involve costs and risk. The fund must pay the lender interest on the security itborrows, and the fund will lose money if the price of the security increases between the time of the short sale and the date when the fund replaces theborrowed security. A fund may also make short sales “against the box.” In a short sale against the box, at the time of sale, the fund owns or has theright to acquire the identical security, or one equivalent in kind or amount, at no additional cost.
Until a fund closes its short position or replaces a borrowed security, a fund will (i) segregate with its custodian cash or other liquid assets at such alevel that the amount segregated plus the amount deposited with the lender as collateral will equal the current market value of the security sold shortor (ii) otherwise cover its short position. The need to maintain cash or other liquid assets in segregated accounts could limit the fund’s ability to pursueother opportunities as they arise.
Small and mid-sized company risk
Market risk and liquidity risk may be pronounced for securities of companies with medium-sized market capitalizations and are particularly pronouncedfor securities of companies with smaller market capitalizations. These companies may have limited product lines, markets, or financial resources, orthey may depend on a few key employees. The securities of companies with medium and smaller market capitalizations may trade less frequently andin lesser volume than more widely held securities, and their value may fluctuate more sharply than those securities. They may also trade in the OTCmarket or on a regional exchange, or may otherwise have limited liquidity. Investments in less-seasoned companies with medium and smaller marketcapitalizations may not only present greater opportunities for growth and capital appreciation, but also involve greater risks than are customarilyassociated with more established companies with larger market capitalizations. These risks apply to all funds that invest in the securities of companieswith smaller- or medium-sized market capitalizations. For purposes of the fund’s investment policies, the market capitalization of a company is basedon its capitalization at the time the fund purchases the company’s securities. Market capitalizations of companies change over time. The fund is notobligated to sell a company’s security simply because, subsequent to its purchase, the company’s market capitalization has changed to be outside thecapitalization range, if any, in effect for the fund.
Tax diversification risk
As described above, Money Market Trust operates as a “government money market fund” in accordance with Rule 2a-7 under the InvestmentCompany Act of 1940 (a “Government Fund”). Additionally, the fund intends to meet the diversification requirements that are applicable to insurancecompany separate accounts under Subchapter L of the Code (the “Diversification Requirements”). To satisfy the Diversification Requirementsapplicable to variable annuity contracts, the value of the assets of the fund invested in securities issued by the United States government must remainbelow specified thresholds. For these purposes, each United States government agency or instrumentality is treated as a separate issuer.
Operating as a Government Fund may make it difficult for the fund to meet the Diversification Requirements. This difficulty may be exacerbated by thepotential increase in demand for the types of securities in which the fund invests as a result of changes to the rules that govern SEC registered moneymarket funds. A failure to satisfy the Diversification Requirements could have significant adverse tax consequences for variable annuity contract ownerswhose contract values are determined by investment in the fund.
U.S. Government agency obligations risk
Government-sponsored entities such as Federal National Mortgage Association (Fannie Mae), Federal Home Loan Mortgage Corporation (Freddie Mac)and the Federal Home Loan Banks, although chartered or sponsored by Congress, are not funded by congressional appropriations and the debtsecurities that they issue are neither guaranteed nor issued by the U.S. government. Such debt securities are subject to the risk of default on thepayment of interest and/or principal, similar to the debt securities of private issuers. The maximum potential liability of the issuers of some U.S.government obligations may greatly exceed their current resources, including any legal right to support from the U.S. government. Although the U.S.government has provided financial support to Fannie Mae and Freddie Mac in the past, there can be no assurance that it will support these or othergovernment-sponsored entities in the future.
.279
U.S. Treasury obligations risk
The market value of direct obligations of the U.S. Treasury may vary due to changes in interest rates. In addition, changes to the financial condition orcredit rating of the U.S. government may cause the value of the fund’s investments in obligations issued by the U.S. Treasury to decline.
Utilities sector risk
Issuers in the utilities sector are subject to many risks, including: increases in fuel and other operating costs; increased costs and delays as a result ofenvironmental and safety regulations; difficulty in obtaining approval of rate increases; the negative impact of regulation; the potential impact ofnatural and man-made disaster; and technological innovations that may render existing plants, equipment, or products obsolete. Because utilitycompanies are faced with the same obstacles, issues, and regulatory burdens, their securities may react similarly and more in unison to these or othermarket conditions.
Value investing style risk
Certain equity securities (generally referred to as value securities) are purchased primarily because they are selling at prices below what the managerbelieves to be their fundamental value and not necessarily because the issuing companies are expected to experience significant earnings growth. Thefund bears the risk that the companies that issued these securities may not overcome the adverse business developments or other factors causing theirsecurities to be perceived by the manager to be underpriced or that the market may never come to recognize their fundamental value. A value stockmay not increase in price, as anticipated by the manager investing in such securities, if other investors fail to recognize the company’s value and bid upthe price or invest in markets favoring faster growing companies. The fund’s strategy of investing in value stocks also carries the risk that in certainmarkets, value stocks will underperform growth stocks. In addition, securities issued by U.S. entities with substantial foreign operations may involverisks relating to economic, political or regulatory conditions in foreign countries.
Warrants risk
The fund may, subject to certain restrictions, purchase warrants, including warrants traded independently of the underlying securities. Warrants arerights to purchase securities at specific prices valid for a specific period of time. Their prices do not necessarily move parallel to the prices of theunderlying securities, and warrant holders receive no dividends and have no voting rights or rights with respect to the assets of an issuer. Warrantscease to have value if not exercised prior to their expiration dates.
Additional information about the funds’ investment policies (including eachfund of funds)Subject to certain restrictions and except as noted below, a fund may use the following investment strategies and purchase the following types ofsecurities.
Foreign Repurchase Agreements
A fund may enter into foreign repurchase agreements. Foreign repurchase agreements may be less well secured than U.S. repurchase agreements, andmay be denominated in foreign currencies. They also may involve greater risk of loss if the counterparty defaults. Some counterparties in thesetransactions may be less creditworthy than those in U.S. markets.
Illiquid Securities
A fund is precluded from investing in excess of 15% of its net assets (or 5% in the case of Money Market Trust) in securities that are not readilymarketable. Investment in illiquid securities involves the risk that, because of the lack of consistent market demand for such securities, a fund may beforced to sell them at a discount from the last offer price.
Indexed/Structured Securities
Funds may invest in indexed/structured securities. These securities are typically short-to intermediate-term debt securities whose value at maturity orinterest rate is linked to currencies, interest rates, equity securities, indices, commodity prices or other financial indicators. Such securities may bepositively or negatively indexed (i.e., their value may increase or decrease if the reference index or instrument appreciates). Indexed/structured securitiesmay have return characteristics similar to direct investments in the underlying instruments. A fund bears the market risk of an investment in theunderlying instruments, as well as the credit risk of the issuer.
Lending of Fund Securities
A fund may lend its securities so long as such loans do not represent more than 33 1/3% of the fund’s total assets. As collateral for the loanedsecurities, the borrower gives the lending portfolio collateral equal to at least 100% of the value of the loaned securities. The collateral may consist ofcash, cash equivalents or securities issued or guaranteed by the U.S. government or its agencies or instrumentalities. The borrower must also agree toincrease the collateral if the value of the loaned securities increases. As with other extensions of credit, there are risks of delay in recovery or even lossof rights in the collateral should the borrower of the securities fail financially.
Loan Participations
The funds may invest in fixed-and floating-rate loans, which investments generally will be in the form of loan participations and assignments of suchloans. Participations and assignments involve special types of risks, including credit risk, interest rate risk, liquidity risk, and the risks of being a lender.Investments in loan participations and assignments present the possibility that a fund could be held liable as a co-lender under emerging legal theoriesof lender liability. If a fund purchases a participation, it may only be able to enforce its rights through the lender and may assume the credit risk of thelender in addition to the borrower.
.280
Mortgage Dollar Rolls
The funds may enter into mortgage dollar rolls. Under a mortgage dollar roll, a fund sells mortgage-backed securities for delivery in the future(generally within 30 days) and simultaneously contracts to repurchase substantially similar (same type, coupon and maturity) securities on a specifiedfuture date.
At the time a fund enters into a mortgage dollar roll, it will maintain on its records liquid assets such as cash or U.S. government securities equal invalue to its obligations in respect of dollar rolls, and accordingly, such dollar rolls will not be considered borrowings.
The funds may only enter into covered rolls. A “covered roll” is a specific type of dollar roll for which there is an offsetting cash or cash equivalentsecurity position that matures on or before the forward settlement date of the dollar roll transaction. Dollar roll transactions involve the risk that themarket value of the securities sold by the funds may decline below the repurchase price of those securities. While a mortgage dollar roll may beconsidered a form of leveraging, and may, therefore, increase fluctuations in a fund’s NAV per share, the funds will cover the transaction as describedabove.
Repurchase Agreements
The funds may enter into repurchase agreements. Repurchase agreements involve the acquisition by a fund of debt securities subject to an agreementto resell them at an agreed-upon price. The arrangement is in economic effect a loan collateralized by securities. The fund’s risk in a repurchasetransaction is limited to the ability of the seller to pay the agreed-upon sum on the delivery date. In the event of bankruptcy or other default by theseller, the instrument purchased may decline in value, interest payable on the instrument may be lost and there may be possible delays and expense inliquidating the instrument. Securities subject to repurchase agreements will be valued every business day and additional collateral will be requested ifnecessary so that the value of the collateral is at least equal to the value of the repurchased obligation, including the interest accrued thereon.Repurchases agreements maturing in more than seven days are deemed to be illiquid.
Reverse Repurchase Agreements
The funds may enter into “reverse” repurchase agreements. Under a reverse repurchase agreement, a fund may sell a debt security and agree torepurchase it at an agreed-upon time and at an agreed-upon price. The funds will maintain liquid assets such as cash, Treasury bills or other U.S.government securities having an aggregate value equal to the amount of such commitment to repurchase including accrued interest, until payment ismade. While a reverse repurchase agreement may be considered a form of leveraging and may, therefore, increase fluctuations in a fund’s NAV pershare, the funds will cover the transaction as described above.
U.S. Government Securities
The funds may invest in U.S. government securities issued or guaranteed by the U.S. government or by an agency or instrumentality of the U.S.government. Not all U.S. government securities are backed by the full faith and credit of the United States. Some are supported only by the credit ofthe issuing agency or instrumentality, which depends entirely on its own resources to repay the debt. U.S. government securities that are backed by thefull faith and credit of the United States include U.S. Treasuries and mortgage-backed securities guaranteed by the Government National MortgageAssociation. Securities that are only supported by the credit of the issuing agency or instrumentality include Fannie Mae, FHLBs and Freddie Mac. See“Credit and counterparty risk” for additional information on Fannie Mae and Freddie Mac securities.
Warrants risk
The funds may, subject to certain restrictions, purchase warrants, including warrants traded independently of the underlying securities. Warrants arerights to purchase securities at specific prices valid for a specific period of time. Their prices do not necessarily move parallel to the prices of theunderlying securities, and warrant holders receive no dividends and have no voting rights or rights with respect to the assets of an issuer. Warrantscease to have value if not exercised prior to their expiration dates.
When-Issued/Delayed-Delivery/Forward Commitment Securities
A fund may purchase or sell debt or equity securities on a “when-issued,” delayed-delivery or “forward commitment” basis. These terms mean thatthe fund will purchase or sell securities at a future date beyond customary settlement (typically trade date plus 30 days or longer) at a stated price and/or yield. At the time delivery is made, the value of when-issued, delayed-delivery or forward commitment securities may be more or less than thetransaction price, and the yields then available in the market may be higher or lower than those obtained in the transaction.
These investment strategies and securities are described further in the SAI.
ManagementBoard of Trustees
JHVIT is managed under the direction of its Trustees. The Board of Trustees oversees the business activities of the funds and retains the services of thevarious firms that carry out the operations of the funds. The Board may change the investment objective and strategy of a fund without shareholderapproval.
Investment Management
John Hancock Investment Management Services, LLC (the “Advisor”) is the investment advisor to JHVIT and is registered with the SEC as an investmentadvisor under the Investment Advisers Act of 1940, as amended (the “Advisers Act”). The Advisor is a Delaware limited liability company with itsprincipal offices located at 601 Congress Street, Boston, Massachusetts 02210. Its ultimate controlling parent is Manulife Financial Corporation(“MFC”), a publicly traded company based in Toronto, Canada. MFC and its subsidiaries operate as “Manulife Financial” in Canada and Asia andprincipally as “John Hancock” in the United States.§
.281
§
JHVIT fund shares are sold only to insurance companies and their separate accounts as the underlying investment option for variable annuity andvariable life insurance contracts and group annuity contract offered to 401(k) plans (“variable contracts”). Two of these insurance companies, JohnHancock Life Insurance Company (U.S.A.) and John Hancock Life Insurance Company of New York, are affiliates of the Advisor (the “AffiliatedInsurance Companies”). The Affiliated Insurance Companies perform administrative services for the JHVIT funds in connection with the variablecontracts for which they serve as the underlying investment option. To compensate the Affiliated Insurance Companies for providing these services, theAdvisor, not the JHVIT funds, pays each Affiliated Insurance Company an administrative fee equal to 0.25% of the total average daily net assets of theJHVIT funds attributable to variable contracts issued by the Affiliated Insurance Company. The Advisor may also pay insurance companies not affiliatedwith the Advisor an administrative fee for performing similar administrative services for the JHVIT funds.§§
Subject to general oversight by the Board of Trustees, the Advisor manages and supervises the investment operations and business affairs of the fund.The Advisor selects, contracts with and compensates one or more subadvisors to manage all or a portion of the fund’s portfolio assets, subject tooversight by the Advisor. In this role, the Advisor has supervisory responsibility for managing the investment and reinvestment of the funds’ portfolioassets through proactive oversight and monitoring of the subadvisor and the funds, as described in further detail below. The Advisor is responsible fordeveloping overall investment strategies for the funds and overseeing and implementing the funds’ continuous investment programs and provides avariety of advisory oversight and investment research services. The Advisor also provides management and transition services associated with certainfund events (e.g., strategy, portfolio manager or subadvisor changes) and coordinates and oversees services provided under other agreements.§§
The Advisor has ultimate responsibility to oversee a subadvisor and recommend to the Board of Trustees its hiring, termination, and replacement. Inthis capacity, the Advisor, among other things: (i) monitors on a daily basis the compliance of the subadvisor with the investment objectives and relatedpolicies of the fund; (ii) monitors significant changes that may impact the subadvisor’s overall business and regularly performs due diligence reviews ofthe subadvisor; (iii) reviews the performance of the subadvisor; and (iv) reports periodically on such performance to the Board of Trustees. The Advisoremploys a team of investment professionals who provide these ongoing research and monitoring services.§§
Subject to approval by the Board of Trustees, the Advisor may elect to manage fund assets directly and currently manages the assets of certain funds.As compensation for its services, the Advisor receives a fee from JHVIT computed separately for each fund. Appendix A to this Prospectus is a scheduleof the management fees each fund currently is obligated to pay the Advisor. The subadvisors are compensated by the Advisor and not by the funds.§§
The funds rely on an order from the Securities and Exchange Commission (SEC) permitting the Advisor, subject to approval by the Board of Trustees, toappoint a subadvisor or change the terms of a subadvisory agreement without obtaining shareholder approval. Each fund, therefore, is able to changesubadvisors or the fees paid to a subadvisor from time to time without the expense and delays associated with obtaining shareholder approval of thechange. This order does not, however, permit the Advisor to appoint a subadvisor that is an affiliate of the Advisor or JHVIT (other than by reason ofserving as a subadvisor to a fund), or to increase the subadvisory fee of an affiliated subadvisor, without the approval of the shareholders.§§
A discussion regarding the basis for the Board’s approval of the advisory and subadvisory agreements for the funds is available in the funds’ semi-annual and annual reports to shareholders for the periods ended June 30, 2017 and December 31, 2017, respectively.§§
For information on the advisory fee for the master fund for each of the JHVIT Feeder Funds, please refer to the master fund prospectus (the AmericanFunds Insurance Series prospectus) which accompanies this Prospectus.
Additional information about fund expenses
Each fund’s annual operating expenses will likely vary throughout the period and from year to year. A fund’s expenses for the current fiscal year maybe higher than the expenses listed in the fund’s “Annual fund operating expenses” table for some of the following reasons: (i) a significant decrease inaverage net assets may result in a higher advisory fee rate if advisory fee breakpoints are not achieved; (ii) a significant decrease in average net assetsmay result in an increase in the expense ratio because certain fund expenses do not decrease as asset levels decrease; or (iii) fees may be incurred forextraordinary events such as fund tax expenses.
The Advisor has contractually agreed to waive its management fee or reimburse expenses (the Reimbursement) for certain participating funds of theTrust and other John Hancock Funds. The Reimbursement equals, on an annualized basis, 0.01% of that portion of the aggregate net assets of all theparticipating funds that exceeds $75 billion but is less than or equal to $125 billion, 0.0125% of that portion of the aggregate net assets of all theparticipating funds that exceeds $125 billion but is less than or equal to $150 billion, 0.0150% of that portion of the aggregate net assets of all theparticipating funds that exceeds $150 billion but is less than or equal to $175 billion, 0.0175% of that portion of the aggregate net assets of all theparticipating funds that exceeds $175 billion but is less than or equal to $200 billion, 0.02% of that portion of the aggregate net assets of all theparticipating funds that exceeds $200 billion but is less than or equal to $225 billion, and 0.0225% of that portion of the aggregate net assets of allthe participating funds that exceeds $225 billion. The amount of the Reimbursement is calculated daily and allocated among all the participating fundsin proportion to the daily net assets of each such fund. The Reimbursement may be terminated or modified at any time by the Advisor with theapproval of the Trust’s Board of Trustees (the Board).
Subadvisors and Portfolio Managers
Set forth below, in alphabetical order by subadvisor, is additional information about the subadvisors and the fund portfolio managers. The SAI includesadditional details about the portfolio managers, including information about their compensation, accounts they manage other than the funds and theirownership of fund securities.
.282

Funds of Funds
The subadvisor will benefit from increased subadvisory fees when assets are allocated to affiliated subadvised funds that it manages. In addition, MFC,as the parent company of each subadvisor and all affiliated investment advisors, will benefit through increased revenue generated from the fees onassets managed by the affiliated subadvisors. Accordingly, there is a conflict of interest in that there is an incentive for each subadvisor to allocate fundassets to funds subadvised by the subadvisor and other affiliated subadvised funds. However, the subadvisor has a duty to allocate assets to anaffiliated subadvised fund only when the subadvisor believes it is in the best interests of fund shareholders, without regard to such economic incentive.As part of its oversight of the funds and the subadvisors, the advisor will monitor to ensure that allocations are conducted in accordance with theseprinciples. This conflict of interest is also considered by the Independent Trustees when approving or replacing affiliated subadvisors.
Allianz Global Investors U.S. LLC (“AllianzGI US”)
AllianzGI US, a Delaware limited liability company, is a registered investment advisor with offices in New York, Dallas, San Diego and San Francisco.AllianzGI US is a direct, wholly-owned subsidiary of Allianz Global Investors U.S. Holdings LLC, which in turn is owned indirectly by Allianz SE, adiversified global financial institution. AllianzGI US provides advisory services to mutual funds and institutional accounts. The Global Technologyinvestment team is based out of their San Francisco office at 555 Mission Street, San Francisco, California 94105.
AllianzGI US has identified the following persons as jointly and primarily responsible for the day-to-day management of the fund’s portfolio as set forthbelow. These managers are employed by AllianzGI US.
Fund Portfolio Managers
Science & Technology Trust Huachen Chen, CFAWalter C. Price, Jr., CFA
Huachen Chen, CFA. Managing Director, Senior Portfolio Manager. Mr. Chen joined AllianzGI US in 1984. He has 35 years of investment-industryexperience and is co-lead portfolio manager of the Global Technology strategy.
Walter C. Price, Jr., CFA. Managing Director, Senior Portfolio Manager. Mr. Price joined AllianzGI US in 1974. He has 45 years of investment-industryexperience and is co-lead portfolio manager of the Global Technology strategy.
Capital Research and Management Company (“CRMC”)
CRMC is located at 333 South Hope Street, Los Angeles, California 90071. CRMC is a wholly-owned subsidiary of The Capital Group Companies, Inc.CRMC has been providing investment management services since 1931.
CRMC manages equity assets through three equity investment divisions and fixed-income assets through its fixed-income investment division, CapitalFixed Income Investors. The three equity investment divisions - Capital World Investors, Capital Research Global Investors and Capital InternationalInvestors - make investment decisions independently of one another.
CRMC has identified the following persons as jointly and primarily responsible for the day-to-day management of the master funds’ portfolios as setforth below. These managers are employed by CRMC.
Portfolio Managerfor the Series/Title(If Applicable)
Primary Title with Investment Advisor(or Affiliate) and Investment ExperienceDuring Past Five Years
Portfolio Manager’s Role inManagement of the Fund(s)
Donald D. O’NealVice Chairman of the Board
Partner — Capital Research Global InvestorsInvestment professional for 33 years, all withCRMC or affiliate
Serves as an equity portfolio manager for Growth-Income Fund
Alan N. BerroPresident
Partner — Capital World InvestorsInvestment professional for 32 years in total;27 years with CRMC or affiliate
Serves as an equity portfolio manager for AssetAllocation Fund
Sung LeeVice President
Partner — Capital Research Global InvestorsInvestment professional for 24 years, all withCRMC or affiliate
Serves as an equity portfolio manager forInternational Fund
Dylan YollesVice President
Partner — Capital International InvestorsInvestment professional for 21 years in total;18 years with CRMC or affiliate
Serves as an equity portfolio manager for Growth-Income Fund
L. Alfonso Barroso Partner — Capital Research Global InvestorsInvestment professional for 24 years, all withCRMC or affiliate
Serves as an equity portfolio manager forInternational Fund
Mark L. Casey Partner — Capital World Investors Investmentprofessional for 18 years, all with CRMC oraffiliate
Serves as an equity portfolio manager for GrowthFund
Patrice Collette Partner — Capital World Investors Investmentprofessional for 24 years in total; 18 years withCRMC or affiliate
Serves as an equity portfolio manager for GlobalGrowth Fund
.283
David A. Daigle Partner — Capital Fixed Income Investors, CRMCInvestment professional for 24 years in total, allwith CRMC or affiliate
Serves as a fixed-income portfolio manager forAsset Allocation Fund
Paul Flynn Partner — Capital World InvestorsInvestment professional for 22 years in total;20 years with CRMC or affiliate
Serves as an equity/fixed-income portfolio managerfor Global Growth Fund
J. Blair Frank Partner — Capital Research Global InvestorsInvestment professional for 25 years in total;24 years with CRMC or affiliate
Serves as an equity portfolio manager for Growth-Income Fund
Claudia P. Huntington Partner — Capital Research Global InvestorsInvestment professional for 45 years in total;43 years with CRMC or affiliate
Serves as an equity portfolio manager for Growth-Income Fund
Michael T. Kerr Partner — Capital World InvestorsInvestment professional for 35 years in total;33 years with CRMC or affiliate
Serves as an equity portfolio manager for GrowthFund
Jonathan Knowles Partner — Capital World InvestorsInvestment professional for 26 years in total; allwith CRMC or affiliate
Serves as an equity portfolio manager for GlobalGrowth Fund
Jeffrey T. Lager Partner — Capital World InvestorsInvestment professional for 23 years in total;22 years with CRMC or affiliate
Serves as an equity portfolio manager for AssetAllocation Fund
Jesper Lyckeus Partner — Capital Research Global InvestorsInvestment professional for 23 years in total;22 years with CRMC or affiliate
Serves as an equity portfolio manager forInternational Fund
James R. Mulally Partner — Capital Fixed-Income Investors, CRMCInvestment professional for 42 years in total;38 years with CRMC or affiliate
Serves as a fixed-income portfolio manager forAsset Allocation Fund
John R. Queen Vice President — Capital Fixed Income Investors,CRMC Investment professional for 27 years intotal; 15 years with CRMC or affiliate
Serves as a fixed-income portfolio manager forAsset Allocation Fund
Andraz Razen Vice President — Capital World InvestorsInvestment professional for 20 years in total;14 years with CRMC or affiliate
Serves as an equity portfolio manager for GrowthFund
William L. Robbins Partner — Capital International InvestorsInvestment professional for 26 years in total;23 years with CRMC or affiliate
Serves as an equity portfolio manager for Growth-Income Fund
Martin Romo Partner — Capital World Investors Investmentprofessional for 26 years in total;25 years with Capital Research and ManagementCompany or affiliate
Serves as an equity portfolio manager for GrowthFund
Christopher Thomsen Partner — Capital Research Global InvestorsInvestment professional for 21 years in total, allwith CRMC or affiliate
Serves as an equity portfolio manager forInternational Fund
Alan J. Wilson Partner — Capital World InvestorsInvestment professional for 33 years in total;27 years with CRMC or affiliate
Serves as an equity portfolio manager for GrowthFund
Additional information regarding the portfolio managers’ compensation, management of other accounts, and ownership of securities in The AmericanFunds Insurance Series can be found in the SAI.
Deutsche Investment Management Americas Inc. (“DIMA”)RREEF America L.L.C. (“RREEF”)
DIMA, located at 345 Park Avenue, New York, New York 10154, is an indirect wholly-owned subsidiary of Deutsche Bank AG, an internationalcommercial and investment banking group. Deutsche Bank AG is a major banking institution that is engaged in a wide range of financial services,including investment management, mutual fund, retail, private and commercial banking, investment banking and insurance. DIMA provides a fullrange of investment advisory services to retail and institutional clients.
RREEF, located at 222 South Riverside Plaza, 26th Floor, Chicago, Illinois 60606, is an indirect wholly-owned subsidiary of Deutsche Bank AG. RREEFhas provided real estate investment management services to institutional investors since 1975.
DIMA has identified the following persons as jointly and primarily responsible for the day-to-day management of the fund’s portfolio as set forthbelow. These managers are employed by RREEF.
.284
Fund Portfolio Managers
Real Estate Securities Trust John W. VojticekDavid W. Zonavetch, CPARobert Thomas
John W. Vojticek. Managing Director and Portfolio Manager. Joined RREEF in 1996.
David W. Zonavetch, CPA. Managing Director and Portfolio Manager. Joined the company in 1998.
Robert Thomas. Managing Director and Portfolio Manager. Joined the company in 2017.
Dimensional Fund Advisors LP (“Dimensional”)
Dimensional was organized in 1981 as “Dimensional Fund Advisors, Inc.,” a Delaware corporation, and in 2006, it converted its legal name andorganizational form to “Dimensional Fund Advisors LP,” a Delaware limited partnership. Dimensional is engaged in the business of providinginvestment management services. Dimensional is located at 6300 Bee Cave Road, Building One, Austin, Texas 78746.
Dimensional uses a team approach. The investment team includes the Investment Committee of Dimensional, portfolio managers and tradingpersonnel. The Investment Committee is composed primarily of certain officers and directors of Dimensional who are appointed annually. Investmentstrategies for funds managed by Dimensional are set by the Investment Committee, which meets on a regular basis and also as needed to considerinvestment issues. The Investment Committee also sets and reviews all investment related policies and procedures and approves any changes in regardsto approved countries, security types and brokers.
In accordance with the team approach, the portfolio managers and portfolio traders implement the policies and procedures established by theInvestment Committee. The portfolio managers and portfolio traders also make daily investment decisions regarding fund management based on theparameters established by the Investment Committee. Dimensional has identified the following persons as jointly and primarily responsible forcoordinating the day-to-day management of the funds’ portfolios as set forth below. These managers are employed by Dimensional.
Funds Portfolio Managers
Emerging Markets Value Trust Joseph H. Chi, CFAMitchell J. FiresteinJed S. FogdallDaniel OngMary T. Phillips, CFABhanu P. Singh
International Small Company Trust Joseph H. Chi, CFAJed S. FogdallArun Keswani, CFAMary T. Phillips, CFABhanu P. Singh
Small Cap Opportunities Trust Joseph H. Chi, CFAJed S. FogdallJoel Schneider
Joseph H. Chi, CFA. Co-Head of Portfolio Management, Senior Portfolio Manager and Vice President at Dimensional and chairman of the InvestmentCommittee. Mr. Chi joined Dimensional as a Portfolio Manager in 2005 and has been Co-Head of the portfolio management group since 2012.
Mitchell J. Firestein. Portfolio Manager and Vice President at Dimensional. Mr. Firestein joined Dimensional in 2005 and has been a portfoliomanager since 2014.
Jed S. Fogdall. Co-Head of Portfolio Management, Senior Portfolio Manager and Vice President at Dimensional and a member of the InvestmentCommittee. Mr. Fogdall joined Dimensional as a Portfolio Manager in 2004 and has been Co-Head of the portfolio management group since 2012.
Arun Keswani, CFA. Senior Portfolio Manager and Vice President at Dimensional. Mr. Keswani joined Dimensional in 2011 and has been a portfoliomanager since 2013. Prior to joining Dimensional, Mr. Keswani worked as an investment banking associate at Morgan Stanley.
Daniel Ong. Senior Portfolio Manager and Vice President at Dimensional. Mr. Ong joined Dimensional in 2005 and has been a portfolio managersince 2005.
Mary T. Phillips, CFA. Senior Portfolio Manager and Vice President at Dimensional and member of the Investment Committee. Ms. Phillips joinedDimensional in 2012 and has been a portfolio manager since 2014.
Joel Schneider. Senior Portfolio Manager and Vice President at Dimensional. Mr. Schneider joined Dimensional in 2011, has been a portfoliomanager since 2013. Prior to joining Dimensional, Mr. Schneider worked as a management consultant at ZS Associates.
Bhanu P. Singh. Senior Portfolio Manager and Vice President at Dimensional. Mr. Singh joined Dimensional in 2003 and has been a portfoliomanager since 2012.
Franklin Mutual Advisers (“Franklin Mutual”)
Franklin Mutual is located at 101 John F. Kennedy Parkway, Short Hills, New Jersey 07078. Franklin Mutual is an indirect wholly owned subsidiary ofFranklin Resources, Inc.
Franklin Mutual has identified the following persons as jointly and primarily responsible for the day-to-day management of the fund’s portfolio as setforth below. These managers are employed by Franklin Mutual.
.285
Fund Portfolio Managers
Mutual Shares Trust Peter LangermanDebbie Turner, CFAF. David Segal, CFA
Peter Langerman. Chairman, President and CEO of Franklin Mutual Series. He is a co-portfolio manager of the Franklin Mutual Shares Fund, theFranklin Mutual Global Discovery Fund and related strategies. Mr. Langerman initially joined Heine Securities Corporation (predecessor of FranklinMutual Advisers, LLC) in June 1986. He served as CEO of Franklin Mutual Series beginning in 1998 and as the chairman of the fund boardsbeginning in 2001, before leaving in 2002 to serve as the director of New Jersey’s Division of Investment, overseeing employee pension funds. Herejoined Franklin Mutual Series in 2005.
Debbie Turner, CFA. Assistant Portfolio Manager, Research Analyst, Franklin Mutual Series, Franklin Mutual Advisers, LLC, Short Hills, New Jersey,United States. Debbie Turner is an assistant portfolio manager of Franklin Mutual Shares Fund for Franklin Mutual Series. Ms. Turner has researchresponsibilities for consumer industries in North America and Europe, including food, beverage, tobacco, retail, gaming, lodging, leisure andrestaurants. She joined Franklin Mutual Series in 1993.
F. David Segal, CFA. Portfolio Manager, Research Analyst, Franklin Mutual Series, Franklin Mutual Advisers, LLC, Short Hills, New Jersey, UnitedStates. F. David Segal is a research analyst and a portfolio manager for Franklin Mutual Series. He is co-portfolio manager of Franklin Mutual SharesFund and portfolio manager of the Luxembourg-registered FTIF Franklin Mutual Beacon Fund. He has global research responsibilities for the autosand auto parts, paper and forest products, defense and metals and mining industries, as well as special situations. He joined Franklin Mutual Seriesin 2002.
GW&K Investment Management, LLC (“GW&K”)
Founded in 1974, GW&K serves as an investment advisor or subadvisor to private clients, pension and profit-sharing plans, mutual funds, estates,charitable foundations, endowments, corporations, and other entities. GW&K is located at 222 Berkeley Street, Boston, Massachusetts 02116.Affiliated Managers Group, Inc., a publicly traded asset management company (NYSE: AMG), holds a majority equity interest in GW&K.
GW&K has identified the following persons as jointly and primarily responsible for the day-to-day management of the fund’s portfolio as set forthbelow. These managers are employed by GW&K.
Fund Portfolio Manager
Small Cap Opportunities Trust Joseph C. Craigen, CFADaniel L. Miller, CFA
Joseph C. Craigen, CFA. Partner and Equity Portfolio Manager, who has been with GW&K since 2008; formerly a research analyst at Citizens Fundsand Needham & Company.
Daniel L. Miller, CFA. Partner and Director of Equities, who has been with GW&K since 2008; formerly an independent investment and financialconsultant, and the Chief Investment Officer for the Specialty Growth Group at Putnam Investments.
Invesco Advisers, Inc. (“Invesco”)
Invesco is an indirect wholly owned subsidiary of Invesco Ltd., whose principal business address is 1555 Peachtree Street, N.E., Atlanta, Georgia 30309.Invesco, an investment advisor since 1976, is a publicly traded company that, through its subsidiaries, engages in the business of investmentmanagement on an international basis. Invesco, and/or its affiliates is the investment advisor for mutual funds, separately managed accounts, such ascorporate and municipal pension plans, charitable institutions and private individuals.
Invesco has identified the following persons as jointly and primarily responsible for the day-to-day management of the fund’s portfolio as set forthbelow. These managers are employed by Invesco.
Funds Portfolio Managers
International Growth Stock Trust Clas OlssonBrently BatesMatthew DennisMark JasonRichard Nield
Clas Olsson. Portfolio Manager, who has been with the Invesco and/or its affiliates since 1994.
Brently Bates. Portfolio Manager, who has been with Invesco and/or affiliates since 1996.
Matthew Dennis. Portfolio Manager, who has been with Invesco and/or its affiliates since 2000.
Mark Jason. Portfolio Manager, who has been with Invesco and/or its affiliates since 2001.
Richard Nield. Portfolio Manager, who has been with Invesco and/or affiliates since 2000.
.286
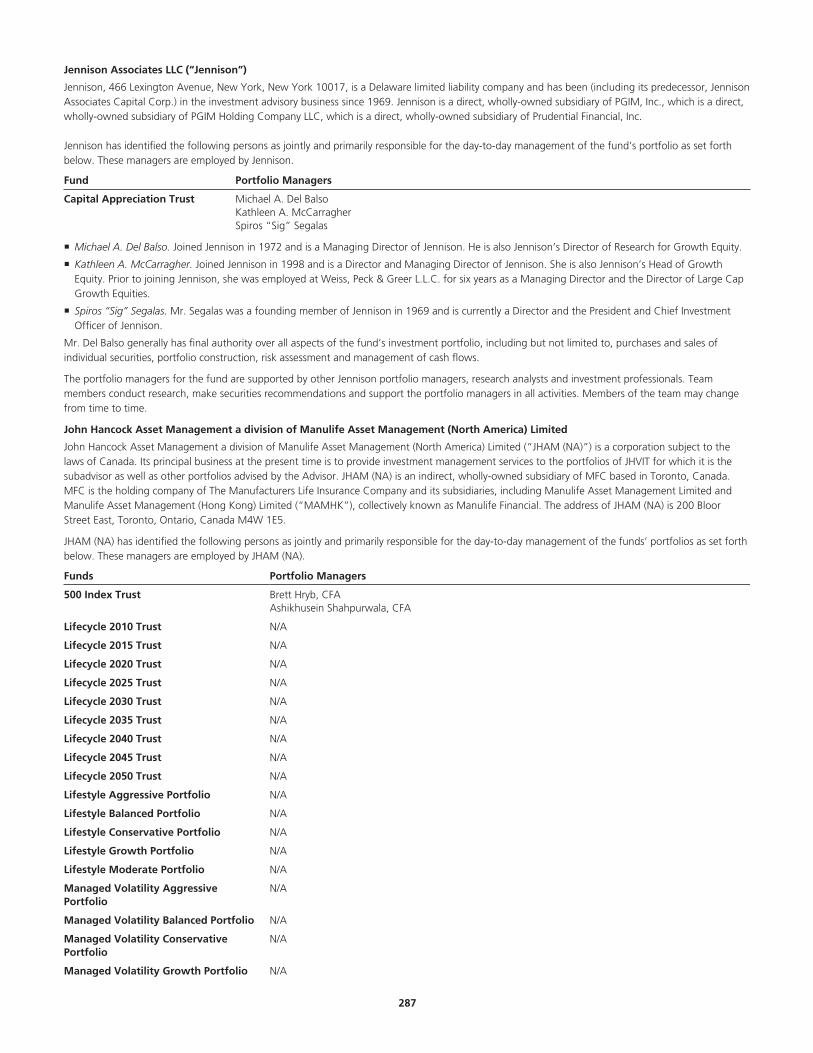
Jennison Associates LLC (“Jennison”)
Jennison, 466 Lexington Avenue, New York, New York 10017, is a Delaware limited liability company and has been (including its predecessor, JennisonAssociates Capital Corp.) in the investment advisory business since 1969. Jennison is a direct, wholly-owned subsidiary of PGIM, Inc., which is a direct,wholly-owned subsidiary of PGIM Holding Company LLC, which is a direct, wholly-owned subsidiary of Prudential Financial, Inc.
Jennison has identified the following persons as jointly and primarily responsible for the day-to-day management of the fund’s portfolio as set forthbelow. These managers are employed by Jennison.
Fund Portfolio Managers
Capital Appreciation Trust Michael A. Del BalsoKathleen A. McCarragherSpiros “Sig” Segalas
Michael A. Del Balso. Joined Jennison in 1972 and is a Managing Director of Jennison. He is also Jennison’s Director of Research for Growth Equity.
Kathleen A. McCarragher. Joined Jennison in 1998 and is a Director and Managing Director of Jennison. She is also Jennison’s Head of GrowthEquity. Prior to joining Jennison, she was employed at Weiss, Peck & Greer L.L.C. for six years as a Managing Director and the Director of Large CapGrowth Equities.
Spiros “Sig” Segalas. Mr. Segalas was a founding member of Jennison in 1969 and is currently a Director and the President and Chief InvestmentOfficer of Jennison.
Mr. Del Balso generally has final authority over all aspects of the fund’s investment portfolio, including but not limited to, purchases and sales ofindividual securities, portfolio construction, risk assessment and management of cash flows.
The portfolio managers for the fund are supported by other Jennison portfolio managers, research analysts and investment professionals. Teammembers conduct research, make securities recommendations and support the portfolio managers in all activities. Members of the team may changefrom time to time.
John Hancock Asset Management a division of Manulife Asset Management (North America) Limited
John Hancock Asset Management a division of Manulife Asset Management (North America) Limited (“JHAM (NA)”) is a corporation subject to thelaws of Canada. Its principal business at the present time is to provide investment management services to the portfolios of JHVIT for which it is thesubadvisor as well as other portfolios advised by the Advisor. JHAM (NA) is an indirect, wholly-owned subsidiary of MFC based in Toronto, Canada.MFC is the holding company of The Manufacturers Life Insurance Company and its subsidiaries, including Manulife Asset Management Limited andManulife Asset Management (Hong Kong) Limited (“MAMHK”), collectively known as Manulife Financial. The address of JHAM (NA) is 200 BloorStreet East, Toronto, Ontario, Canada M4W 1E5.
JHAM (NA) has identified the following persons as jointly and primarily responsible for the day-to-day management of the funds’ portfolios as set forthbelow. These managers are employed by JHAM (NA).
Funds Portfolio Managers
500 Index Trust Brett Hryb, CFAAshikhusein Shahpurwala, CFA
Lifecycle 2010 Trust N/A
Lifecycle 2015 Trust N/A
Lifecycle 2020 Trust N/A
Lifecycle 2025 Trust N/A
Lifecycle 2030 Trust N/A
Lifecycle 2035 Trust N/A
Lifecycle 2040 Trust N/A
Lifecycle 2045 Trust N/A
Lifecycle 2050 Trust N/A
Lifestyle Aggressive Portfolio N/A
Lifestyle Balanced Portfolio N/A
Lifestyle Conservative Portfolio N/A
Lifestyle Growth Portfolio N/A
Lifestyle Moderate Portfolio N/A
Managed Volatility AggressivePortfolio
N/A
Managed Volatility Balanced Portfolio N/A
Managed Volatility ConservativePortfolio
N/A
Managed Volatility Growth Portfolio N/A
.287
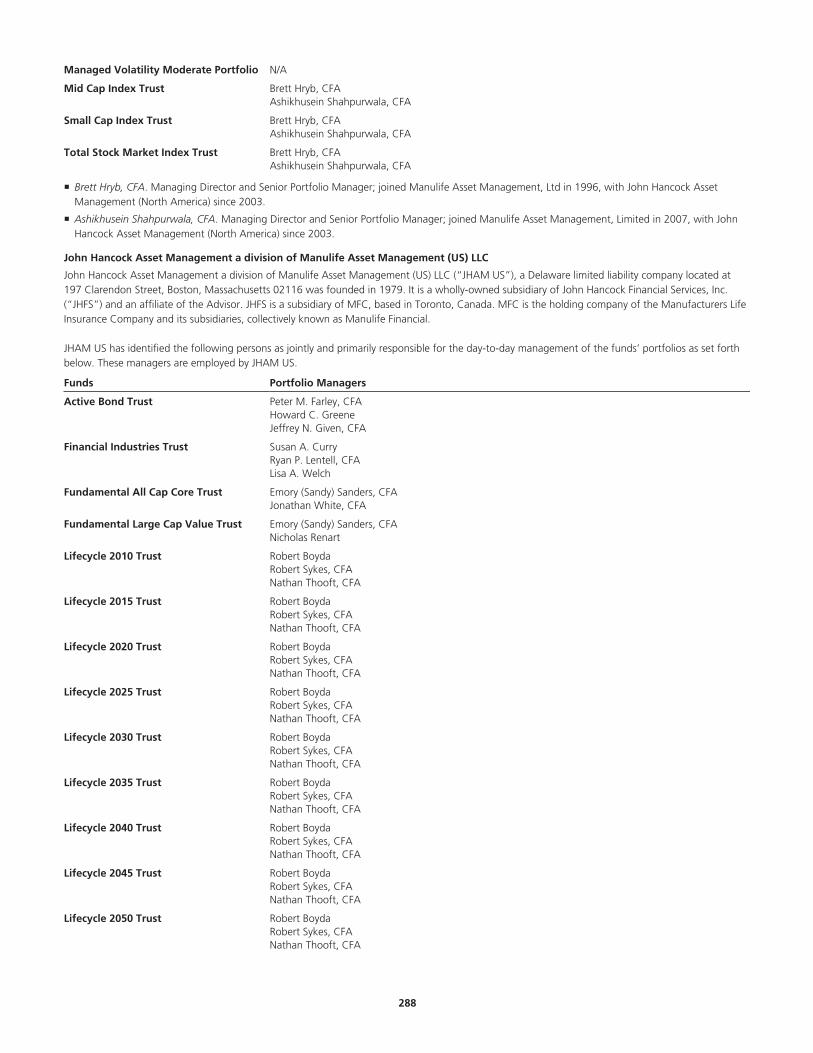
Managed Volatility Moderate Portfolio N/A
Mid Cap Index Trust Brett Hryb, CFAAshikhusein Shahpurwala, CFA
Small Cap Index Trust Brett Hryb, CFAAshikhusein Shahpurwala, CFA
Total Stock Market Index Trust Brett Hryb, CFAAshikhusein Shahpurwala, CFA
Brett Hryb, CFA. Managing Director and Senior Portfolio Manager; joined Manulife Asset Management, Ltd in 1996, with John Hancock AssetManagement (North America) since 2003.
Ashikhusein Shahpurwala, CFA. Managing Director and Senior Portfolio Manager; joined Manulife Asset Management, Limited in 2007, with JohnHancock Asset Management (North America) since 2003.
John Hancock Asset Management a division of Manulife Asset Management (US) LLC
John Hancock Asset Management a division of Manulife Asset Management (US) LLC (“JHAM US”), a Delaware limited liability company located at197 Clarendon Street, Boston, Massachusetts 02116 was founded in 1979. It is a wholly-owned subsidiary of John Hancock Financial Services, Inc.(“JHFS”) and an affiliate of the Advisor. JHFS is a subsidiary of MFC, based in Toronto, Canada. MFC is the holding company of the Manufacturers LifeInsurance Company and its subsidiaries, collectively known as Manulife Financial.
JHAM US has identified the following persons as jointly and primarily responsible for the day-to-day management of the funds’ portfolios as set forthbelow. These managers are employed by JHAM US.
Funds Portfolio Managers
Active Bond Trust Peter M. Farley, CFAHoward C. GreeneJeffrey N. Given, CFA
Financial Industries Trust Susan A. CurryRyan P. Lentell, CFALisa A. Welch
Fundamental All Cap Core Trust Emory (Sandy) Sanders, CFAJonathan White, CFA
Fundamental Large Cap Value Trust Emory (Sandy) Sanders, CFANicholas Renart
Lifecycle 2010 Trust Robert BoydaRobert Sykes, CFANathan Thooft, CFA
Lifecycle 2015 Trust Robert BoydaRobert Sykes, CFANathan Thooft, CFA
Lifecycle 2020 Trust Robert BoydaRobert Sykes, CFANathan Thooft, CFA
Lifecycle 2025 Trust Robert BoydaRobert Sykes, CFANathan Thooft, CFA
Lifecycle 2030 Trust Robert BoydaRobert Sykes, CFANathan Thooft, CFA
Lifecycle 2035 Trust Robert BoydaRobert Sykes, CFANathan Thooft, CFA
Lifecycle 2040 Trust Robert BoydaRobert Sykes, CFANathan Thooft, CFA
Lifecycle 2045 Trust Robert BoydaRobert Sykes, CFANathan Thooft, CFA
Lifecycle 2050 Trust Robert BoydaRobert Sykes, CFANathan Thooft, CFA
.288
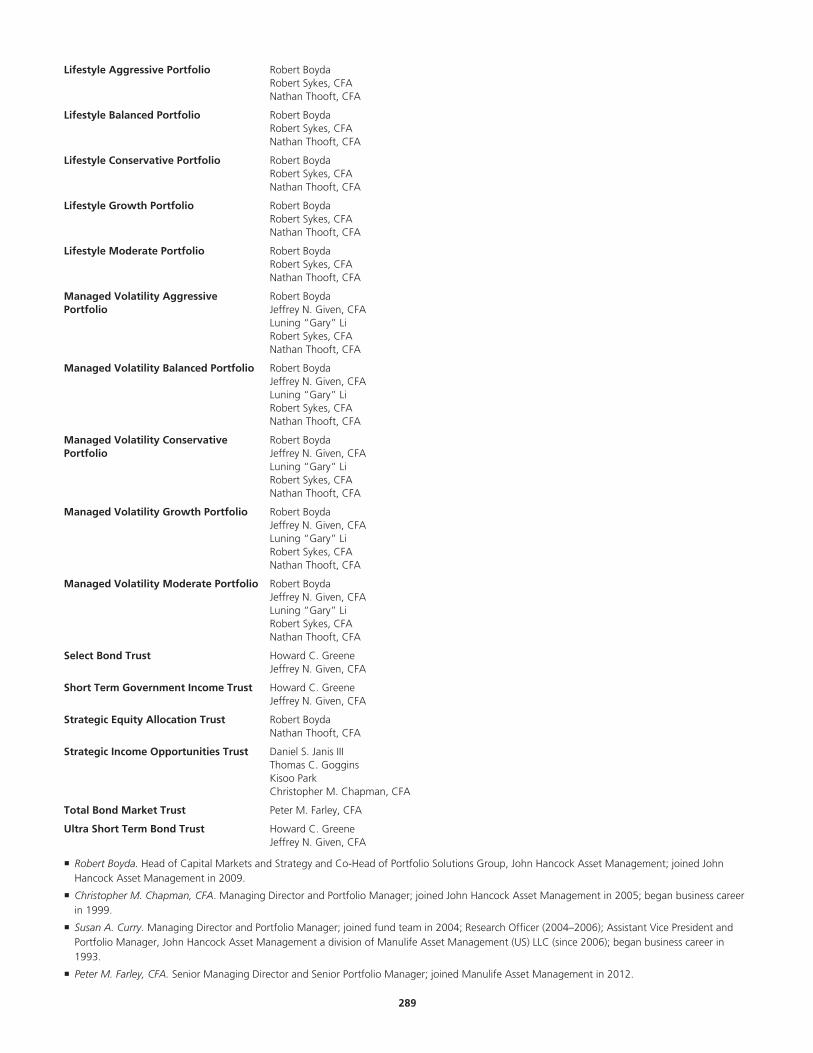
Lifestyle Aggressive Portfolio Robert BoydaRobert Sykes, CFANathan Thooft, CFA
Lifestyle Balanced Portfolio Robert BoydaRobert Sykes, CFANathan Thooft, CFA
Lifestyle Conservative Portfolio Robert BoydaRobert Sykes, CFANathan Thooft, CFA
Lifestyle Growth Portfolio Robert BoydaRobert Sykes, CFANathan Thooft, CFA
Lifestyle Moderate Portfolio Robert BoydaRobert Sykes, CFANathan Thooft, CFA
Managed Volatility AggressivePortfolio
Robert BoydaJeffrey N. Given, CFALuning “Gary” LiRobert Sykes, CFANathan Thooft, CFA
Managed Volatility Balanced Portfolio Robert BoydaJeffrey N. Given, CFALuning “Gary” LiRobert Sykes, CFANathan Thooft, CFA
Managed Volatility ConservativePortfolio
Robert BoydaJeffrey N. Given, CFALuning “Gary” LiRobert Sykes, CFANathan Thooft, CFA
Managed Volatility Growth Portfolio Robert BoydaJeffrey N. Given, CFALuning “Gary” LiRobert Sykes, CFANathan Thooft, CFA
Managed Volatility Moderate Portfolio Robert BoydaJeffrey N. Given, CFALuning “Gary” LiRobert Sykes, CFANathan Thooft, CFA
Select Bond Trust Howard C. GreeneJeffrey N. Given, CFA
Short Term Government Income Trust Howard C. GreeneJeffrey N. Given, CFA
Strategic Equity Allocation Trust Robert BoydaNathan Thooft, CFA
Strategic Income Opportunities Trust Daniel S. Janis IIIThomas C. GogginsKisoo ParkChristopher M. Chapman, CFA
Total Bond Market Trust Peter M. Farley, CFA
Ultra Short Term Bond Trust Howard C. GreeneJeffrey N. Given, CFA
Robert Boyda. Head of Capital Markets and Strategy and Co-Head of Portfolio Solutions Group, John Hancock Asset Management; joined JohnHancock Asset Management in 2009.
Christopher M. Chapman, CFA. Managing Director and Portfolio Manager; joined John Hancock Asset Management in 2005; began business careerin 1999.
Susan A. Curry. Managing Director and Portfolio Manager; joined fund team in 2004; Research Officer (2004–2006); Assistant Vice President andPortfolio Manager, John Hancock Asset Management a division of Manulife Asset Management (US) LLC (since 2006); began business career in1993.
Peter M. Farley, CFA. Senior Managing Director and Senior Portfolio Manager; joined Manulife Asset Management in 2012.
.289

Jeffrey N. Given, CFA. Senior Managing Director and Senior Portfolio Manager; joined John Hancock Asset Management in 1993.
Thomas C. Goggins. Senior Managing Director and Senior Portfolio Manager, John Hancock Asset Management (since 2009); Co-founder andDirector of Research, Fontana Capital (2005–2009).
Howard C. Greene. Senior Managing Director and Senior Portfolio Manager; joined John Hancock Asset Management in 2002; previously a VicePresident of Sun Life Financial Services Company of Canada.
Daniel S. Janis III. Senior Managing Director and Senior Portfolio Manager; joined John Hancock Asset Management in 1999; previously a senior riskmanager at BankBoston (1997–1999).
Ryan P. Lentell, CFA. Managing Director and Portfolio Manager; joined John Hancock Asset Management a division of Manulife Asset Management(US) LLC in 2008; began business career in 1999.
Luning “Gary” Li. Managing Director and Senior Portfolio Manager, John Hancock Asset Management a division of Manulife Asset Management (US)LLC; joined John Hancock Asset Management in 2013; Manager of Derivatives Risk Management at MetLife (2012-2013); Director of RiskManagement and Asset Allocation at the South Carolina Retirement System Investment Commission (2011-2012); Director of Derivatives andAlternative Strategies at Evergreen Investments (2006-2011).
Kisoo Park. Managing Director and Portfolio Manager, Global Multi-Sector Fixed Income team for John Hancock Asset Management a division ofManulife Asset Management (US) LLC; responsible for portfolio management and research of global bonds and currencies. Mr. Park joined JohnHancock Asset Management in 2011 from Ardon Maroon Fund Management HK Ltd, a hedge fund advisory firm based in Hong Kong, where hewas a founding member and COO.
Nicholas Renart. Managing Director, Portfolio Manager; prior to joining Manulife Asset Management in 2011, Nicholas Renart was an associate withCiti Venture Capital International. Mr. Renart began his investment career in 2005.
Emory (Sandy) Sanders, CFA. Senior Managing Director, Senior Portfolio Manager; prior to joining Manulife Asset Management in 2010, SandySanders was a portfolio manager on the Berkeley Street Equity Team at Wells Capital Management. Mr. Sanders began his investment career in1997.
Robert Sykes, CFA. Managing Director, Portfolio Manager of Portfolio Solutions Group; joined John Hancock Asset Management in 2008; beganbusiness career in 2001.
Nathan Thooft, CFA. Senior Managing Director, Senior Portfolio Manager, Co-Head of Portfolio Solutions Group; previously Vice President andDirector of Investments for Investment Management Services, John Hancock Financial (2008-2011); joined Manulife Financial in 2008.
Lisa A. Welch. Senior Managing Director and Senior Portfolio Manager; joined fund team in 1998; Vice President and Portfolio Manager, JohnHancock Advisers, LLC (2003–2005); Vice President, John Hancock Asset Management a division of Manulife Asset Management (US) LLC (2005–2007); began business career in 1986.
Jonathan White, CFA. Managing Director, Senior Portfolio Manager; prior to joining Manulife Asset Management in 2011, Jonathan White was asenior analyst with the Berkeley Street Equity team at Wells Capital Management. Mr. White began his investment career in 1997.
Massachusetts Financial Services Company (“MFS”)
MFS is America’s oldest mutual fund organization. MFS and its predecessor organizations have a history of money management dating from 1924 andthe founding of the first mutual fund, Massachusetts Investors Trust. MFS is a subsidiary of Sun Life of Canada (U.S.) Financial Services Holdings, Inc.,which in turn is an indirect majority-owned subsidiary of Sun Life Financial Inc. (a diversified financial services company). MFS is located at 111Huntington Avenue, Boston, Massachusetts 02199.
MFS has identified the following persons as jointly and primarily responsible for the day-to-day management of the fund’s portfolio as set forth below.These managers are employed by MFS.
Fund Portfolio Manager
Utilities Trust Maura ShaughnessyClaud DavisScott Walker
Maura Shaughnessy. Investment Officer; employed in the investment area of MFS since 1991.
Claud Davis. Investment Officer; employed in the investment area of MFS since 1994.
Scott Walker. Investment Officer; employed in the investment area of MFS since 2008.
Pacific Investment Management Company LLC (“PIMCO”)
PIMCO is a majority owned subsidiary of Allianz Asset Management with minority interests held by certain of its current and former officers, by AllianzAsset Management of America LLC, and by PIMCO Partners, LLC, a California limited liability company. PIMCO Partners, LLC is owned by certaincurrent and former officers of PIMCO. Through various holding company structures, Allianz Asset Management is majority owned by Allianz SE.
PIMCO identified the following persons as jointly and primarily responsible for the day-to-day management of the fund’s portfolio as set forth below.These managers are employed by PIMCO.
Funds Portfolio Managers
Global Bond Trust Andrew BallsSachin GuptaLorenzo Pagani, Ph.D.
.290
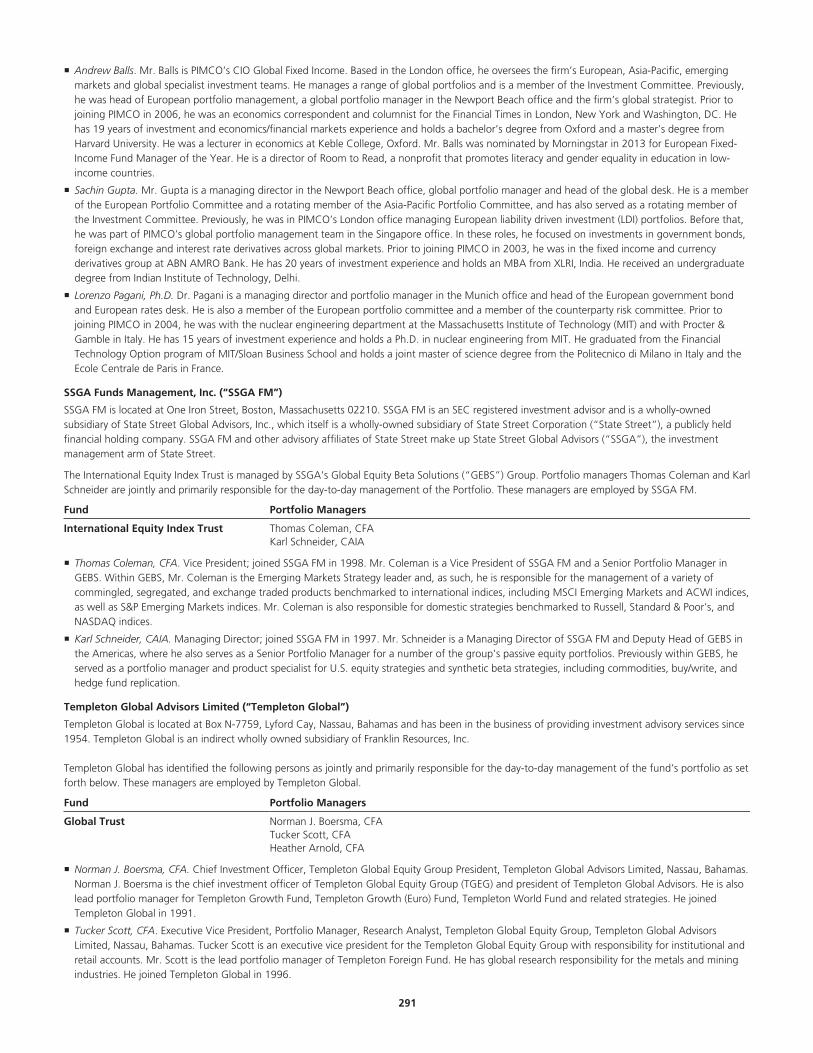
Andrew Balls. Mr. Balls is PIMCO’s CIO Global Fixed Income. Based in the London office, he oversees the firm’s European, Asia-Pacific, emergingmarkets and global specialist investment teams. He manages a range of global portfolios and is a member of the Investment Committee. Previously,he was head of European portfolio management, a global portfolio manager in the Newport Beach office and the firm’s global strategist. Prior tojoining PIMCO in 2006, he was an economics correspondent and columnist for the Financial Times in London, New York and Washington, DC. Hehas 19 years of investment and economics/financial markets experience and holds a bachelor’s degree from Oxford and a master’s degree fromHarvard University. He was a lecturer in economics at Keble College, Oxford. Mr. Balls was nominated by Morningstar in 2013 for European Fixed-Income Fund Manager of the Year. He is a director of Room to Read, a nonprofit that promotes literacy and gender equality in education in low-income countries.
Sachin Gupta. Mr. Gupta is a managing director in the Newport Beach office, global portfolio manager and head of the global desk. He is a memberof the European Portfolio Committee and a rotating member of the Asia-Pacific Portfolio Committee, and has also served as a rotating member ofthe Investment Committee. Previously, he was in PIMCO’s London office managing European liability driven investment (LDI) portfolios. Before that,he was part of PIMCO’s global portfolio management team in the Singapore office. In these roles, he focused on investments in government bonds,foreign exchange and interest rate derivatives across global markets. Prior to joining PIMCO in 2003, he was in the fixed income and currencyderivatives group at ABN AMRO Bank. He has 20 years of investment experience and holds an MBA from XLRI, India. He received an undergraduatedegree from Indian Institute of Technology, Delhi.
Lorenzo Pagani, Ph.D. Dr. Pagani is a managing director and portfolio manager in the Munich office and head of the European government bondand European rates desk. He is also a member of the European portfolio committee and a member of the counterparty risk committee. Prior tojoining PIMCO in 2004, he was with the nuclear engineering department at the Massachusetts Institute of Technology (MIT) and with Procter &Gamble in Italy. He has 15 years of investment experience and holds a Ph.D. in nuclear engineering from MIT. He graduated from the FinancialTechnology Option program of MIT/Sloan Business School and holds a joint master of science degree from the Politecnico di Milano in Italy and theEcole Centrale de Paris in France.
SSGA Funds Management, Inc. (“SSGA FM”)
SSGA FM is located at One Iron Street, Boston, Massachusetts 02210. SSGA FM is an SEC registered investment advisor and is a wholly-ownedsubsidiary of State Street Global Advisors, Inc., which itself is a wholly-owned subsidiary of State Street Corporation (“State Street”), a publicly heldfinancial holding company. SSGA FM and other advisory affiliates of State Street make up State Street Global Advisors (“SSGA”), the investmentmanagement arm of State Street.
The International Equity Index Trust is managed by SSGA’s Global Equity Beta Solutions (“GEBS”) Group. Portfolio managers Thomas Coleman and KarlSchneider are jointly and primarily responsible for the day-to-day management of the Portfolio. These managers are employed by SSGA FM.
Fund Portfolio Managers
International Equity Index Trust Thomas Coleman, CFAKarl Schneider, CAIA
Thomas Coleman, CFA. Vice President; joined SSGA FM in 1998. Mr. Coleman is a Vice President of SSGA FM and a Senior Portfolio Manager inGEBS. Within GEBS, Mr. Coleman is the Emerging Markets Strategy leader and, as such, he is responsible for the management of a variety ofcommingled, segregated, and exchange traded products benchmarked to international indices, including MSCI Emerging Markets and ACWI indices,as well as S&P Emerging Markets indices. Mr. Coleman is also responsible for domestic strategies benchmarked to Russell, Standard & Poor’s, andNASDAQ indices.
Karl Schneider, CAIA. Managing Director; joined SSGA FM in 1997. Mr. Schneider is a Managing Director of SSGA FM and Deputy Head of GEBS inthe Americas, where he also serves as a Senior Portfolio Manager for a number of the group’s passive equity portfolios. Previously within GEBS, heserved as a portfolio manager and product specialist for U.S. equity strategies and synthetic beta strategies, including commodities, buy/write, andhedge fund replication.
Templeton Global Advisors Limited (“Templeton Global”)
Templeton Global is located at Box N-7759, Lyford Cay, Nassau, Bahamas and has been in the business of providing investment advisory services since1954. Templeton Global is an indirect wholly owned subsidiary of Franklin Resources, Inc.
Templeton Global has identified the following persons as jointly and primarily responsible for the day-to-day management of the fund’s portfolio as setforth below. These managers are employed by Templeton Global.
Fund Portfolio Managers
Global Trust Norman J. Boersma, CFATucker Scott, CFAHeather Arnold, CFA
Norman J. Boersma, CFA. Chief Investment Officer, Templeton Global Equity Group President, Templeton Global Advisors Limited, Nassau, Bahamas.Norman J. Boersma is the chief investment officer of Templeton Global Equity Group (TGEG) and president of Templeton Global Advisors. He is alsolead portfolio manager for Templeton Growth Fund, Templeton Growth (Euro) Fund, Templeton World Fund and related strategies. He joinedTempleton Global in 1991.
Tucker Scott, CFA. Executive Vice President, Portfolio Manager, Research Analyst, Templeton Global Equity Group, Templeton Global AdvisorsLimited, Nassau, Bahamas. Tucker Scott is an executive vice president for the Templeton Global Equity Group with responsibility for institutional andretail accounts. Mr. Scott is the lead portfolio manager of Templeton Foreign Fund. He has global research responsibility for the metals and miningindustries. He joined Templeton Global in 1996.
.291

Heather Arnold, CFA. Executive Vice President, Director of Research, Portfolio Manager, Research Analyst, Templeton Global Equity Group,Templeton Global Advisors Limited, Nassau, Bahamas. Heather Arnold is the director of research for the Templeton Global Equity Group, as well as aportfolio manager and research analyst. Ms. Arnold is the lead portfolio manager for the Templeton Global Fund as well as the lead portfoliomanager on a number of Global and International separate accounts. She is also the lead equity portfolio manager of TGIT Templeton GlobalBalanced Fund, FTIF Templeton Global Income Fund and Templeton Global Balanced Fund in Canada. Ms. Arnold has 30 years industry experience,11 of which have been at Templeton. She rejoined Templeton Global Equity Group in 2008, having previously served as a Senior Vice President,Portfolio Manager and Research Analyst with Templeton Global Equity Group from 1997 to 2001.
Templeton Investment Counsel, LLC (“Templeton”)
Templeton is located at 300 S. E. 2nd Street, Ft. Lauderdale, Florida 33301, and has been in the business of providing investment advisory servicessince 1954. Templeton is an indirect wholly owned subsidiary of Franklin Resources, Inc.
Templeton has identified the following persons as jointly and primarily responsible for the day-to-day management of the fund’s portfolio as set forthbelow. These managers are employed by Templeton.
Fund Portfolio Managers
International Value Trust Tucker Scott, CFAPeter Nori, CFAChristopher Peel, CFA
Tucker Scott, CFA. Lead Portfolio Manager, Executive Vice President, Templeton Global Equity Group, Templeton Global Advisors Limited, Nassau,Bahamas. Tucker Scott is an executive vice president for the Templeton Global Equity Group with responsibility for institutional and retail accounts.Mr. Scott is the lead portfolio manager of Templeton Foreign Fund. He has global research responsibility for the metals and mining industries. Hejoined Templeton Global in 1996.
Peter Nori, CFA. Executive Vice President, Portfolio Manager, Templeton Global Equity Group, Templeton Investment Counsel, LLC, Fort Lauderdale,Florida, United States. Peter A. Nori is an executive vice president and portfolio manager for the Templeton Global Equity Group with researchresponsibility for the global semiconductor industry and is the information technology sector team leader. In addition, he manages severalinstitutional and sub-advised portfolios. He joined Templeton in 1987.
Christopher Peel, CFA. Senior Vice President, Research Analyst and Portfolio Manager, Templeton Global Equity Group, Nassau, Bahamas. Hejoined Templeton in 2007.
T. Rowe Price Associates, Inc. (“T. Rowe Price”)
T. Rowe Price, 100 East Pratt Street, Baltimore, Maryland 21202, was founded in 1937. T. Rowe Price and its affiliates manage over eleven millionindividual and institutional investor accounts.
T. Rowe has identified the following persons as jointly and primarily responsible for the day-to-day management of the funds’ portfolios as set forthbelow. These managers are employed by T. Rowe.
Funds Portfolio Managers
Blue Chip Growth Trust Larry J. Puglia, CFA, CPA
Capital Appreciation Value Trust David R. Giroux, CFA
Equity Income Trust John D. Linehan, CFA
Health Sciences Trust Ziad Bakri, MD, CFA
Mid Value Trust David J. Wallack
New Income Trust Stephen L. Bartolini, CFADaniel O. Shackelford, CFA
Science & Technology Trust Ken Allen
Small Company Value Trust J. David Wagner, CFA
Ken Allen. Vice President; joined T. Rowe Price in 2000.
Ziad Bakri, MD, CFA. Vice President; joined T. Rowe Price in 2011.
Stephen L. Bartolini, CFA. Vice President; joined T. Rowe Price in 2010.
David R. Giroux, CFA. Vice President; joined T. Rowe Price in 1998.
John D. Linehan, CFA. Vice President; joined T. Rowe Price in 1998.
Larry J. Puglia, CFA, CPA. Vice President; joined T. Rowe Price in 1990.
Daniel O. Shackelford, CFA. Vice President; joined T. Rowe Price in 1999.
J. David Wagner, CFA. Vice President; joined T. Rowe Price in 2000.
David J. Wallack. Vice President; joined T. Rowe Price in 1990.
.292
Wellington Management Company LLP (“Wellington Management”)
Wellington Management is a Delaware limited liability partnership with principal offices at 280 Congress Street, Boston, Massachusetts 02210.Wellington Management is a professional investment counseling firm which provides investment services to investment companies, employee benefitplans, endowments, foundations and other institutions. Wellington Management and its predecessor organizations have provided investment advisoryservices for over 80 years. Wellington Management is owned by the partners of Wellington Management Group LLP, a Massachusetts limited liabilitypartnership. Wellington Management has identified the following persons as jointly and primarily responsible for the day-to-day management of thefunds’ portfolios as set forth below. These managers are employed by Wellington Management.
Funds Portfolio Managers
Investment Quality Bond Trust Robert D. Burn, CFACampe Goodman, CFAJoseph F. Marvan, CFA
Mid Cap Stock Trust Michael T. Carmen, CFAMario E. Abularach, CFAStephen Mortimer
Small Cap Stock Trust Steven C. Angeli, CFAMario E. Abularach, CFAStephen MortimerJohn V. Schneider, CFA
Small Cap Value Trust Timothy J. McCormack, CFAShaun F. Pedersen
Mario E. Abularach, CFA. Senior Managing Director and Equity Research Analyst of Wellington Management; joined the firm as an investmentprofessional in 2001.
Steven C. Angeli, CFA. Senior Managing Director and Equity Portfolio Manager of Wellington Management; joined the firm as an investmentprofessional in 1994.
Robert D. Burn, CFA. Managing Director and Fixed Income Portfolio Manager of Wellington Management; joined the firm as an investmentprofessional in 2007.
Michael T. Carmen, CFA. Senior Managing Director and Equity Portfolio Manager of Wellington Management; joined the firm as an investmentprofessional in 1999.
Campe Goodman, CFA. Senior Managing Director and Fixed Income Portfolio Manager of Wellington Management; joined the firm as an investmentprofessional in 2000.
Joseph F. Marvan, CFA. Senior Managing Director and Fixed Income Portfolio Manager of Wellington Management; joined the firm as an investmentprofessional in 2003.
Timothy J. McCormack, CFA. Senior Managing Director and Equity Portfolio Manager of Wellington Management; joined the firm as an investmentprofessional in 2000.
Stephen Mortimer. Senior Managing Director and Equity Portfolio Manager of Wellington Management; joined the firm as an investmentprofessional in 2001.
Shaun F. Pedersen. Senior Managing Director and Equity Portfolio Manager of Wellington Management; joined the firm as an investmentprofessional in 2004.
John V. Schneider, CFA. Vice President and Equity Research Analyst of Wellington Management; joined the firm as an investment professional in2016.
Wells Capital Management, Incorporated (“WellsCap”)
WellsCap, located at 525 Market St., San Francisco, California, is a registered investment advisor that provides investment advisory services forregistered mutual funds, company retirement plans, foundations, endowments, trust companies and high net-worth individuals. WellsCap is a wholly-owned subsidiary of WFAM Holdings, LLC, which in turn is indirectly wholly-owned by Wells Fargo & Company, a publicly listed company.
WellsCap has identified the following persons as jointly and primarily responsible for the day-to-day management of the fund’s portfolio as set forthbelow. These managers are employed by WellsCap.
Fund Portfolio Managers
Core Bond Trust Maulik Bhansali, CFAJarad VasquezThomas O’Connor, CFA
Maulik Bhansali, CFA. Mr. Bhansali joined Wells Capital Management in 2001, where he currently serves as a Senior Portfolio Manager.
Jarad Vasquez. Mr. Vasquez joined Wells Capital Management in 2007, where he currently serves as a Senior Portfolio Manager.
Thomas O’Connor, CFA. Senior Portfolio Manager and Co-Head of the Montgomery Fixed Income team at Wells Capital Management; joined WellsCapital Management in 2000.
.293

Western Asset Management Company (“Western Asset”)Western Asset Management Company Limited serves as sub-subadvisor
Western Asset, 385 E. Colorado Boulevard, Pasadena, California 91101, is one of the world’s leading investment management firms. Its sole businessis managing fixed-income portfolios, an activity the Firm has pursued since 1971. From offices in Pasadena, New York, Sao Paulo, London, Dubai,Singapore, Hong Kong, Tokyo and Melbourne, Western Asset’s 865 employees perform investment services for a wide variety of global clients. TheFirm’s clients include charitable, corporate, health care, insurance, mutual fund, public and union organizations, and client portfolios range across anequally wide variety of mandates, from money markets to emerging markets. Western Asset’s client base totals 509, representing 40 countries and1,046 accounts.
Western Asset has identified the following persons as jointly and primarily responsible for the day-to-day management of the fund’s portfolio as setforth below. These managers are employed by Western Asset.
Fund Portfolio Manager
High Yield Trust Michael C. BuchananWalter E. KilcullenS. Kenneth Leech
Michael C. Buchanan. Deputy Chief Investment Officer; joined Western Asset in 2005.
Walter E. Kilcullen. Head of US High Yield; joined Western Asset in 2002.
S. Kenneth Leech. Chief Investment Officer of Western Asset; joined Western Asset in 1990.
Share classes and Rule 12b-1 plansShare classes
The funds may issue four classes of shares: Series I, Series II, Series III and NAV shares (not all funds issue all share classes). Each share class is the sameexcept for differences in the allocation of fund expenses and voting rights as described below.
The expenses of each fund are generally borne by its Series I, Series II, Series III and NAV shares (as applicable) based on the net assets of the fundattributable to shares of each class. “Class expenses,” however, are allocated to each class. “Class expenses” include Rule 12b-1 fees (if any) paid by ashare class and other expenses determined by the Advisor to be properly allocable to a particular class. The Advisor will make such allocations in amanner and using such methodology as it determines to be reasonably appropriate, subject to ratification or approval by the Board. The kinds ofexpenses that the Advisor may allocate to a particular class include the following: (i) printing and postage expenses related to preparing anddistributing to the shareholders of a specific class (or owners of contracts funded by shares of such class) materials such as shareholder reports,prospectuses and proxies; (ii) professional fees relating solely to such class; (iii) Trustees’ fees, including independent counsel fees, relating specifically toone class; and (iv) expenses associated with meetings of shareholders of a particular class.
All shares of each fund have equal voting rights and are voted in the aggregate, and not by class, except that shares of each class have exclusive votingrights on any matter submitted to shareholders that relates solely to the arrangement of that class and have separate voting rights when any matter issubmitted to shareholders in which the interests of one class differ from the interests of any other class or when voting by class is otherwise requiredby law.
Rule 12b-1 Plans
Rule 12b-1 fees will be paid to JHVIT’s Distributor, John Hancock Distributors, LLC, or any successor thereto (the “Distributor”).
To the extent consistent with applicable laws, regulations and rules, the Distributor may use Rule 12b-1 fees:
(i) for any expenses relating to the distribution of the shares of the class,§(ii) for any expenses relating to shareholder or administrative services for holders of the shares of the class (or owners of contracts funded in insurancecompany separate accounts that invest in the shares of the class) and§
(iii) for the payment of “service fees” that come within Rule 2341 of the Conduct Rules of the Financial Industry Regulatory Authority.
Without limiting the foregoing, the Distributor may pay all or part of the Rule 12b-1 fees from a fund to one or more affiliated and unaffiliatedinsurance companies that have issued variable insurance contracts for which the fund serves as an investment vehicle as compensation for providingsome or all of the types of services described in the preceding sentence; this provision, however, does not obligate the Distributor to make anypayments of Rule 12b-1 fees and does not limit the use that the Distributor may make of the Rule 12b-1 fees it receives. Currently, all such paymentsare made to insurance companies affiliated with JHVIT’s investment advisor and Distributor. However, payments may be made to nonaffiliatedinsurance companies in the future.
The annual Rule 12b-1 fee rate currently accrued by each fund is set forth in the expense table of each fund. Subject to the approval of the Board,each fund may under the 12b-1 Plans charge Rule 12b-1 fees up to the following maximum annual rates:
Series I shares§
an annual rate of up to 0.15%* of the net assets of the Series I shares
*0.60% in the case of American Asset Allocation Trust, American Global Growth Trust, American Growth-Income Trust, American Growth Trust andAmerican International Trust.
.294

Series II shares§
an annual rate of up to 0.35%* of the net assets of the Series II shares
*0.75% in the case of American Asset Allocation Trust, American Global Growth Trust, American Growth-Income Trust, American Growth Trust andAmerican International Trust.
Series III shares§
an annual rate of up to 0.25% of the net assets of the Series III shares
Rule 12b-1 fees are paid out of a fund’s assets on an ongoing basis. Therefore, these fees will increase the cost of an investment in a fund and may,over time, be greater than other types of sales charges.
General informationPurchase and redemption of shares
Shares of each fund are offered continuously, without sales charge, and are sold and redeemed at a price equal to their net asset value (NAV) nextcomputed after a purchase payment or redemption request is received. Depending upon the NAV at that time, the amount paid upon redemption maybe more or less than the cost of the shares redeemed. Payment for shares redeemed will generally be made within seven days after receipt of a propernotice of redemption. However, JHVIT may suspend the right of redemption or postpone the date of payment beyond seven days during any periodwhen:
trading on the New York Stock Exchange (“NYSE”) is restricted, as determined by the SEC, or the NYSE is closed for other than weekends andholidays;
an emergency exists, as determined by the SEC, as a result of which disposal by JHVIT of securities owned by it is not reasonably practicable or it isnot reasonably practicable for JHVIT fairly to determine the value of its net assets; or
the SEC by order so permits for the protection of security holders of JHVIT.
Shares of the funds are not sold directly to the public but generally may be sold only to insurance companies and their separate accounts as theunderlying investment options for variable annuity and variable life insurance contracts issued by such companies, to certain entities affiliated with theinsurance companies, to those funds of JHVIT that operate as funds of funds and invest in other funds (“Underlying Funds”) and to certain qualifiedretirement plans (“qualified plans”).
Due to differences in tax treatments and other considerations, the interests of holders of variable annuity and variable life insurance contracts, and theinterests of holders of variable contracts and qualified plan investors, that participate in JHVIT may conflict. The Board of Trustees of JHVIT (the“Board” or “Trustees”) will monitor events in order to identify the existence of any material irreconcilable conflicts and determine what action, if any,should be taken in response to any such conflict.
Money Market Trust Only
If the Board of Trustees, including a majority of the Independent Trustees, determines that the deviation between the fund’s amortized cost price pershare and the market-based NAV per share may result in material dilution or other unfair results, the Board of Trustees, subject to certain conditions,may suspend redemptions and payments in order to facilitate the permanent termination of the fund in an orderly manner. If this were to occur, itwould likely result in a delay in your receipt of your redemption proceeds.
Valuation of shares
The net asset value (NAV) for each class of shares of the funds is normally determined once daily as of the close of regular trading on the New YorkStock Exchange (NYSE) (typically 4:00 P.M., Eastern time, on each business day that the NYSE is open). In case of emergency or other disruptionresulting in the NYSE not opening for trading or the NYSE closing at a time other than the regularly scheduled close, the NAV may be determined as ofthe regularly scheduled close of the NYSE pursuant to the fund’s Valuation Policies and Procedures. The time at which shares and transactions arepriced and until which orders are accepted may vary to the extent permitted by the Securities and Exchange Commission and applicable regulations.On holidays or other days when the NYSE is closed, the NAV is not calculated and the funds do not transact purchase or redemption requests. Tradingof securities that are primarily listed on foreign exchanges may take place on weekends and U.S. business holidays on which the funds’ NAV is notcalculated. Consequently, each fund’s portfolio securities may trade and the NAV of the fund’s shares may be significantly affected on days when ashareholder will not be able to purchase or redeem shares of the fund.
Each class of shares of each fund (except Money Market Trust) has its own NAV, which is computed by dividing the total assets, minus liabilities,allocated to each share class by the number of fund shares outstanding for that class.
Money Market Trust Only
To help Money Market Trust maintain its $1.00 stable share price, portfolio investments are valued at cost, and any discount or premium in the fund’sacquisition price is amortized to maturity.
Valuation of securities
(all funds other than Money Market Trust)
Portfolio securities are valued by various methods that are generally described below. Portfolio securities also may be fair valued by the funds’ PricingCommittee in certain instances pursuant to procedures established by the Trustees. Equity securities are generally valued at the last sale price or, forcertain markets, the official closing price as of the close of the relevant exchange. Securities not traded on a particular day are valued using last
.295

available bid prices. A security that is listed or traded on more than one exchange is typically valued at the price on the exchange where the securitywas acquired or most likely will be sold. In certain instances, the Pricing Committee may determine to value equity securities using prices obtained fromanother exchange or market if trading on the exchange or market on which prices are typically obtained did not open for trading as scheduled, or iftrading closed earlier than scheduled, and trading occurred as normal on another exchange or market. Debt obligations are valued based on evaluatedprices provided by an independent pricing vendor. The value of securities denominated in foreign currencies is converted into U.S. dollars at theexchange rate supplied by an independent pricing vendor. Exchange-traded options are valued at the mean of the most recent bid and ask prices.Futures contracts are typically valued at settlement prices. If settlement prices are not available, futures contracts may be valued using last tradedprices. Shares of other open-end investment companies that are not ETFs (underlying funds) are valued based on the NAVs of such underlying funds.§§
Pricing vendors may use matrix pricing or valuation models that utilize certain inputs and assumptions to derive values, including transaction data,credit quality information, general market conditions, news, and other factors and assumptions. Special valuation considerations may apply withrespect to a fund’s “odd-lot” positions, as the fund may receive different prices when it sells such positions than it would receive for sales ofinstitutional round lot positions. Pricing vendors generally value securities assuming orderly transactions of institutional round lot sizes, but a fund mayhold or transact in such securities in smaller, odd lot sizes.§§
The Pricing Committee engages in oversight activities with respect to the funds’ pricing vendors, which includes, among other things, monitoringsignificant or unusual price fluctuations above predetermined tolerance levels from the prior day, back-testing of pricing vendor prices against actualtrades, conducting periodic due diligence meetings and reviews, and periodically reviewing the inputs, assumptions and methodologies used by thesevendors.§§
If market quotations, official closing prices, or information furnished by a pricing vendor are not readily available or are otherwise deemed unreliable ornot representative of the fair value of such security because of market- or issuer-specific events, a security will be valued at its fair value as determinedin good faith by the Trustees. The Trustees are assisted in their responsibility to fair value securities by the funds’ Pricing Committee, and the actualcalculation of a security’s fair value may be made by the Pricing Committee acting pursuant to the procedures established by the Trustees. In certaininstances, therefore, the Pricing Committee may determine that a reported valuation does not reflect fair value, based on additional informationavailable or other factors, and may accordingly determine in good faith the fair value of the assets, which may differ from the reported valuation.§§
Fair value pricing of securities is intended to help ensure that a fund’s NAV reflects the fair market value of the fund’s portfolio securities as of the closeof regular trading on the NYSE (as opposed to a value that no longer reflects market value as of such close), thus limiting the opportunity foraggressive traders or market timers to purchase shares of the fund at deflated prices reflecting stale security valuations and promptly sell such shares ata gain, thereby diluting the interests of long- term shareholders. However, a security’s valuation may differ depending on the method used fordetermining value, and no assurance can be given that fair value pricing of securities will successfully eliminate all potential opportunities for suchtrading gains.§§
The use of fair value pricing has the effect of valuing a security based upon the price a fund might reasonably expect to receive if it sold that security inan orderly transaction between market participants, but does not guarantee that the security can be sold at the fair value price. Further, because of theinherent uncertainty and subjective nature of fair valuation, a fair valuation price may differ significantly from the value that would have been used hada readily available market price for the investment existed and these differences could be material.§§
Regarding a fund’s investment in an underlying fund that is not an ETF, which (as noted above) is valued at such underlying fund’s NAV, theprospectus for such underlying fund explains the circumstances and effects of fair value pricing for that underlying fund.
Dividends
JHVIT intends to declare as dividends substantially all of the net investment income, if any, of each fund. Dividends from the net investment incomeand the net capital gain, if any, for each fund will be declared not less frequently than annually and reinvested in additional full and fractional shares ofthat fund or paid in cash.
Money Market Trust Only
Money Market Trust seeks to maintain a constant per share NAV of $1.00. Dividends from net investment income for the fund will generally bedeclared and reinvested, or paid in cash, as to a share class daily. However, if class expenses exceed class income on any given day, as may occur fromtime to time in the current investment environment, the fund may determine not to pay a dividend on the class on that day and to resume payingdividends on that class only when, on a future date, the accumulated net investment income of the class is positive. The accumulated net investmentincome for a class on any day is equal to the accumulated income attributable to that class less the accumulated expenses attributable to that classsince the last payment of a dividend on that class. When the fund resumes paying a dividend on a class, the amount of the initial dividend will be theaccumulated net investment income for the class on the date of payment. As a result of this policy, the fund: (1) on any given day, may pay a dividendon all of its classes, on none of its classes or on some but not all of its classes; (2) may not pay a dividend on one or more classes for one or moreindeterminate periods which may be as short as a day or quite lengthy; and (3) may, during a period in which it does not pay a dividend on a class,have days on which the net investment income for that class is positive but is not paid as a dividend because the accumulated net investment incomefor the class continues to be negative. In addition, a shareholder who purchases shares of a class with a negative accumulated net investment incomecould hold those shares during a period of positive net investment income and never receive a dividend unless and until that accumulated positive netinvestment income exceeded the negative accumulated net investment income at the time of purchase.
.296

Disruptive short term trading
None of the funds are designed for short-term trading (frequent purchases and redemption of shares) or market timing activities, which may increaseportfolio transaction costs, disrupt management of a fund (affecting a subadvisor’s ability to effectively manage a fund in accordance with itsinvestment objective and policies), dilute the interest in a fund held for long-term investment or adversely affect a fund’s performance (“DisruptiveShort-Term Trading”).
The Board has adopted procedures to deter Disruptive Short-Term Trading and JHVIT seeks to deter and prevent such trading through several methods:
First, to the extent that there is a delay between a change in the value of a fund’s holdings, and the time when that change is reflected in the NAV ofthe fund’s shares, the fund is exposed to the risk that investors may seek to exploit this delay by purchasing or redeeming shares at NAVs that do notreflect appropriate fair value prices. JHVIT seeks to deter and prevent this activity, sometimes referred to as “market timing” or “stale price arbitrage,”by the appropriate use of “fair value” pricing of the funds’ portfolio securities. See “Purchases and Redemption of Shares” above for furtherinformation on fair value pricing.
Second, management of JHVIT will monitor purchases and redemptions of JHVIT shares either directly or through procedures adopted by the affiliatedinsurance companies that use JHVIT as their underlying investment vehicle. If management of JHVIT becomes aware of short-term trading that itbelieves, in its sole discretion, is having or may potentially have the effect of materially increasing portfolio transaction costs, significantly disruptingportfolio management or significantly diluting the interest in a fund held for long-term investment i.e. Disruptive Short-Term Trading, JHVIT mayimpose restrictions on such trading as described below.
Pursuant to Rule 22c-2 under the 1940 Act, JHVIT and each insurance company that uses JHVIT as an underlying investment vehicle have entered intoinformation sharing agreements under which the insurance companies are obligated to: (i) adopt, and enforce during the term of the agreement, ashort-term trading policy that the insurance company reasonably believes is designed to deter disruptive short-term trading; (ii) furnish JHVIT, upon itsrequest, with information regarding contract holder trading activities in shares of JHVIT; and (iii) enforce its short term trading policy with respect tocontract holders identified by JHVIT as having engaged in Disruptive Short-Term Trading. Further, when requested information regarding contractholder trading activities is in the possession of a financial intermediary rather than the insurance company, the agreement obligates the insurancecompany to undertake to obtain such information from the financial intermediary or, if directed by JHVIT, to cease to accept trading instructions fromthe financial intermediary for the contract holder unless such instructions are sent to the financial intermediary by regular U.S. mail.
Investors in JHVIT should note that insurance companies have legal and technological limitations on their ability to impose restrictions on DisruptiveShort-Term Trading that such limitations and ability may vary among insurance companies and by insurance product. Investors should also note thatinsurance company separate accounts and omnibus or other nominee accounts, in which purchases and sales of fund shares by multiple investors areaggregated for presentation to a fund on a net basis, inherently make it more difficult for JHVIT to identify short-term transactions in a fund and theinvestor who is effecting the transaction. Therefore, no assurance can be given that JHVIT will be able to impose uniform restrictions on all insurancecompanies and all insurance products or that it will be able to successfully impose restrictions on all Disruptive Short-Term Trading. If JHVIT isunsuccessful in restricting Disruptive Short-Term Trading, the affected funds may incur higher brokerage costs, may maintain higher cash levels(limiting their ability to achieve their investment objective and affecting the subadvisor’s ability to effectively manage them) and may be exposed todilution with respect to interests held for long-term investment.
Market timers may target funds with the following types of investments:
i. Funds with significant investments in foreign securities traded on markets that close before the fund determines its NAV;
ii. Funds with significant investments in high yield securities that are infrequently traded; and
iii.Funds with significant investments in small cap securities.
Market timers may also target funds with other types of investments for frequent trading of shares.
Money Market Trust Only
The fund does not knowingly accept shareholders who engage in market timing or other types of excessive short-term trading. Short-term trading intoand out of the fund can disrupt portfolio investment strategies and may increase fund expenses for all shareholders, including long-term shareholderswho do not generate these costs. However, money market funds are typically utilized by investors for short-term investments. Investors in moneymarket funds value the ability to add and withdraw their funds quickly and without restrictions.
Moreover, because Government money market funds seek to maintain a $1.00 per share price and typically do not fluctuate in market value, theygenerally are not the targets of abusive trading practices. For these reasons, the fund’s Board of Trustees has not adopted policies and procedures withrespect to frequent purchases and redemptions of the fund’s shares, and the fund does not impose redemption fees or minimum holding periods fortheir investors. However, the fund’s management will seek to prevent an investor from utilizing the fund to facilitate frequent purchases andredemptions of shares in other JHVIT funds that are not money market funds. The JHVIT funds have adopted policies and procedures with respect toexcessive trading and potential market timing activity for the non-money market JHVIT funds (as described in the prospectus for the non-money marketJHVIT funds), and a contract holder will be prevented from purchasing additional shares or making further exchanges if the fund’s managementdetermines that a contract holder has engaged in timing activities in contravention of a non-money market JHVIT fund’s policies.
Policy regarding disclosure of fund portfolio holdings
A description of the funds’ policies and procedures regarding disclosure of portfolio holdings can be found in the SAI.
XBRL filings
A fund’s XBRL filings are located at http://www.johnhancock.com/XBRL/JHT.html.
.297

Additional information about fund expenses
Each fund’s annual operating expenses will likely vary throughout the period and from year to year. Each fund’s expenses for the current fiscal yearmay be higher than the expenses listed in the fund’s “Annual fund operating expenses” table, for some of the following reasons: (i) a significantdecrease in average net assets may result in a higher advisory fee rate if advisory fee breakpoints are not achieved; (ii) a significant decrease in averagenet assets may result in an increase in the expense ratio because certain fund expenses do not decrease as asset levels decrease; or (iii) fees may beincurred for extraordinary events such as fund tax expenses.
.298

Financial highlightsThe financial highlights table below for each fund is intended to help investors understand the financial performance of the fund for the past five years(or since inception in the case of a fund in operation for less than five years.) Certain information reflects financial results for a single share of a fund.The total returns presented in the table represent the rate that an investor would have earned (or lost) on an investment in a particular fund (assumingreinvestment of all dividends and distributions). The total return information shown in the Financial Highlights tables does not reflect the fees andexpenses of any separate account that may use John Hancock Variable Insurance Trust (“JHVIT”) as its underlying investment option or of any variableinsurance contract that may be funded in such a separate account. If these fees and expenses were included, the total return figures for all periodsshown would be reduced.
The following funds have not commenced operations as of the date of this prospectus; therefore, no financial highlights are reported: Lifecycle 2010Trust, Lifecycle 2015 Trust, Lifecycle 2020 Trust, Lifecycle 2025 Trust, Lifecycle 2030 Trust, Lifecycle 2035 Trust, Lifecycle 2040 Trust, Lifecycle 2045Trust and Lifecycle 2050 Trust.
The financial statements of JHVIT as of December 31, 2017, have been audited by PricewaterhouseCoopers LLP, independent registered publicaccounting firm. The report of PricewaterhouseCoopers LLP, along with JHVIT’s financial statements, as they appear in JHVIT’s annual report, has beenincorporated by reference into the SAI. Copies of JHVIT’s annual report are available upon request.
500 Index Trust
Per share operating performance for a share outstanding throughout each period Ratios and supplemental data
Income (loss) frominvestment operations Less Distributions Ratios to average net assets
Period ended
Netassetvalue,beginning
of period($)
Netinvestment
income(loss) ($)1
Net real-ized
and unrealized gain(loss) on
invest-ments ($)
Total frominvestmentoper-ations
($)
From netinvestmentincome ($)
From netrealizedgain ($)
From taxreturn of
capital ($)Total distrib
utions ($)
Net assetvalue, end
of period ($)Total return
(%)2
Expensesbefore
reductions(%)
Expensesincluding re
ductions (%)
Net investment
income(loss) (%)
Net assets,end of
period (inmillions)
Portfolioturnover
(%)
Series I
12-31-2017 27.29 0.50 5.31 5.81 (0.52) (0.38) — (0.90) 32.20 21.52 0.55 0.30 1.69 3,135 312-31-2016 25.26 0.50 2.40 2.90 (0.45) (0.42) — (0.87) 27.29 11.59 0.54 0.30 1.91 2,529 4 .
3
12-31-2015 25.68 0.48 (0.20) 0.28 (0.44) (0.26) — (0.70) 25.26 1.10 0.54 0.30 1.85 2,024 412-31-2014 23.34 0.42 2.68 3.10 (0.39) (0.37) — (0.76) 25.68 13.33 0.54 0.30 1.71 1,880 212-31-2013 18.01 0.37 5.38 5.75 (0.38) (0.04) — (0.42) 23.34 32.03 0.53 0.30 1.75 1,581 4
Series II
12-31-2017 27.31 0.45 5.30 5.75 (0.46) (0.38) — (0.84) 32.22 21.28 0.75 0.50 1.50 74 312-31-2016 25.29 0.45 2.39 2.84 (0.40) (0.42) — (0.82) 27.31 11.37 0.74 0.50 1.72 64 4 .
3
12-31-2015 25.71 0.42 (0.20) 0.22 (0.38) (0.26) — (0.64) 25.29 0.86 0.74 0.50 1.64 51 412-31-2014 23.36 0.37 2.69 3.06 (0.34) (0.37) — (0.71) 25.71 13.15 0.74 0.50 1.51 55 212-31-2013 18.03 0.32 5.39 5.71 (0.34) (0.04) — (0.38) 23.36 31.76 0.73 0.50 1.55 52 4
Series NAV
12-31-2017 27.29 0.52 5.29 5.81 (0.53) (0.38) — (0.91) 32.19 21.54 0.50 0.25 1.75 1,892 312-31-2016 25.26 0.51 2.40 2.91 (0.46) (0.42) — (0.88) 27.29 11.64 0.49 0.25 1.96 1,641 4 .
3
12-31-2015 25.68 0.49 (0.20) 0.29 (0.45) (0.26) — (0.71) 25.26 1.15 0.49 0.25 1.89 1,442 412-31-2014 23.33 0.43 2.69 3.12 (0.40) (0.37) — (0.77) 25.68 13.43 0.49 0.25 1.76 1,530 212-31-2013 18.01 0.38 5.37 5.75 (0.39) (0.04) — (0.43) 23.33 32.03 0.48 0.25 1.80 1,397 4
1 Based on average daily shares outstanding.2 Total returns would have been lower had certain expenses not been reduced during the applicable periods.3 Excludes merger activity.
.299
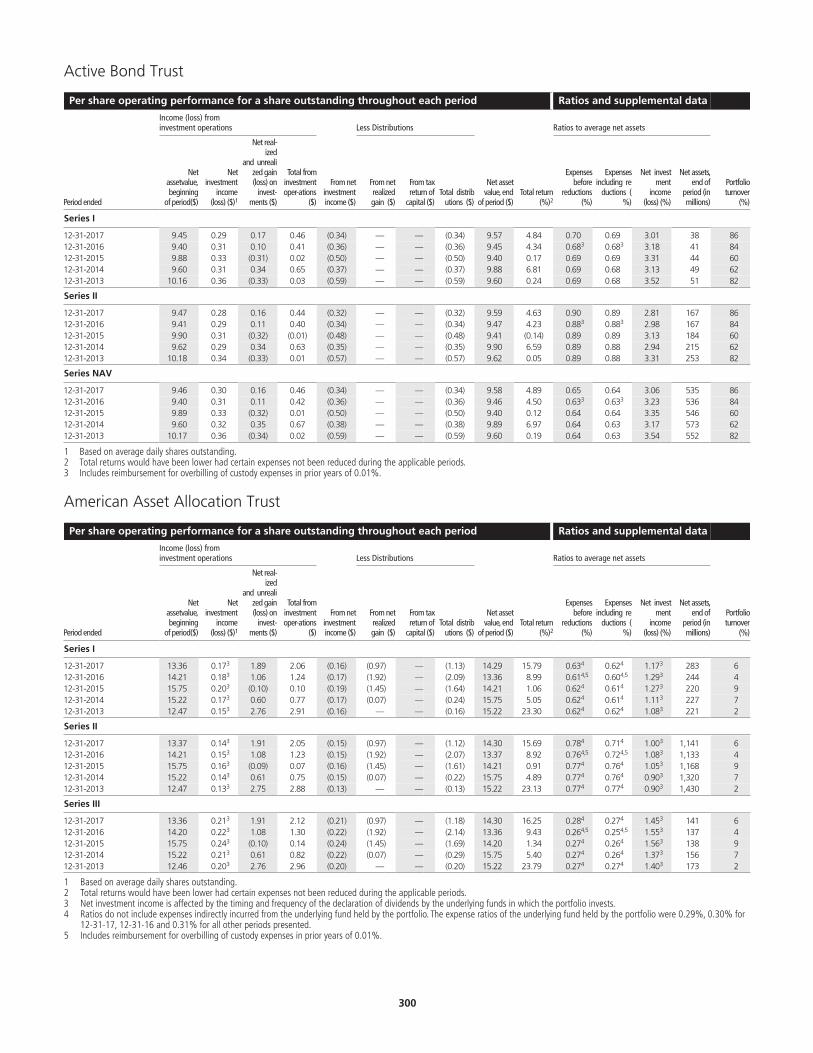
Active Bond Trust
Per share operating performance for a share outstanding throughout each period Ratios and supplemental data
Income (loss) frominvestment operations Less Distributions Ratios to average net assets
Period ended
Netassetvalue,beginning
of period($)
Netinvestment
income(loss) ($)1
Net real-ized
and unrealized gain(loss) on
invest-ments ($)
Total frominvestmentoper-ations
($)
From netinvestmentincome ($)
From netrealizedgain ($)
From taxreturn of
capital ($)Total distrib
utions ($)
Net assetvalue, end
of period ($)Total return
(%)2
Expensesbefore
reductions(%)
Expensesincluding re
ductions (%)
Net investment
income(loss) (%)
Net assets,end of
period (inmillions)
Portfolioturnover
(%)
Series I
12-31-2017 9.45 0.29 0.17 0.46 (0.34) — — (0.34) 9.57 4.84 0.70 0.69 3.01 38 8612-31-2016 9.40 0.31 0.10 0.41 (0.36) — — (0.36) 9.45 4.34 0.68 .
3 0.68 .
3 3.18 41 8412-31-2015 9.88 0.33 (0.31) 0.02 (0.50) — — (0.50) 9.40 0.17 0.69 0.69 3.31 44 6012-31-2014 9.60 0.31 0.34 0.65 (0.37) — — (0.37) 9.88 6.81 0.69 0.68 3.13 49 6212-31-2013 10.16 0.36 (0.33) 0.03 (0.59) — — (0.59) 9.60 0.24 0.69 0.68 3.52 51 82
Series II
12-31-2017 9.47 0.28 0.16 0.44 (0.32) — — (0.32) 9.59 4.63 0.90 0.89 2.81 167 8612-31-2016 9.41 0.29 0.11 0.40 (0.34) — — (0.34) 9.47 4.23 0.88 .
3 0.88 .
3 2.98 167 8412-31-2015 9.90 0.31 (0.32) (0.01) (0.48) — — (0.48) 9.41 (0.14) 0.89 0.89 3.13 184 6012-31-2014 9.62 0.29 0.34 0.63 (0.35) — — (0.35) 9.90 6.59 0.89 0.88 2.94 215 6212-31-2013 10.18 0.34 (0.33) 0.01 (0.57) — — (0.57) 9.62 0.05 0.89 0.88 3.31 253 82
Series NAV
12-31-2017 9.46 0.30 0.16 0.46 (0.34) — — (0.34) 9.58 4.89 0.65 0.64 3.06 535 8612-31-2016 9.40 0.31 0.11 0.42 (0.36) — — (0.36) 9.46 4.50 0.63 .
3 0.63 .
3 3.23 536 8412-31-2015 9.89 0.33 (0.32) 0.01 (0.50) — — (0.50) 9.40 0.12 0.64 0.64 3.35 546 6012-31-2014 9.60 0.32 0.35 0.67 (0.38) — — (0.38) 9.89 6.97 0.64 0.63 3.17 573 6212-31-2013 10.17 0.36 (0.34) 0.02 (0.59) — — (0.59) 9.60 0.19 0.64 0.63 3.54 552 82
1 Based on average daily shares outstanding.2 Total returns would have been lower had certain expenses not been reduced during the applicable periods.3 Includes reimbursement for overbilling of custody expenses in prior years of 0.01%.
American Asset Allocation Trust
Per share operating performance for a share outstanding throughout each period Ratios and supplemental data
Income (loss) frominvestment operations Less Distributions Ratios to average net assets
Period ended
Netassetvalue,beginning
of period($)
Netinvestment
income(loss) ($)1
Net real-ized
and unrealized gain(loss) on
invest-ments ($)
Total frominvestmentoper-ations
($)
From netinvestmentincome ($)
From netrealizedgain ($)
From taxreturn of
capital ($)Total distrib
utions ($)
Net assetvalue, end
of period ($)Total return
(%)2
Expensesbefore
reductions(%)
Expensesincluding re
ductions (%)
Net investment
income(loss) (%)
Net assets,end of
period (inmillions)
Portfolioturnover
(%)
Series I
12-31-2017 13.36 0.17 .
3 1.89 2.06 (0.16) (0.97) — (1.13) 14.29 15.79 0.63 .
4 0.62 .
4 1.17 .
3 283 612-31-2016 14.21 0.18 .
3 1.06 1.24 (0.17) (1.92) — (2.09) 13.36 8.99 0.61 .
4,5 0.60 .
4,5 1.29 .
3 244 412-31-2015 15.75 0.20 .
3 (0.10) 0.10 (0.19) (1.45) — (1.64) 14.21 1.06 0.62 .
4 0.61 .
4 1.27 .
3 220 912-31-2014 15.22 0.17 .
3 0.60 0.77 (0.17) (0.07) — (0.24) 15.75 5.05 0.62 .
4 0.61 .
4 1.11 .
3 227 712-31-2013 12.47 0.15 .
3 2.76 2.91 (0.16) — — (0.16) 15.22 23.30 0.62 .
4 0.62 .
4 1.08 .
3 221 2
Series II
12-31-2017 13.37 0.14 .
3 1.91 2.05 (0.15) (0.97) — (1.12) 14.30 15.69 0.78 .
4 0.71 .
4 1.00 .
3 1,141 612-31-2016 14.21 0.15 .
3 1.08 1.23 (0.15) (1.92) — (2.07) 13.37 8.92 0.76 .
4,5 0.72 .
4,5 1.08 .
3 1,133 412-31-2015 15.75 0.16 .
3 (0.09) 0.07 (0.16) (1.45) — (1.61) 14.21 0.91 0.77 .
4 0.76 .
4 1.05 .
3 1,168 912-31-2014 15.22 0.14 .
3 0.61 0.75 (0.15) (0.07) — (0.22) 15.75 4.89 0.77 .
4 0.76 .
4 0.90 .
3 1,320 712-31-2013 12.47 0.13 .
3 2.75 2.88 (0.13) — — (0.13) 15.22 23.13 0.77 .
4 0.77 .
4 0.90 .
3 1,430 2
Series III
12-31-2017 13.36 0.21 .
3 1.91 2.12 (0.21) (0.97) — (1.18) 14.30 16.25 0.28 .
4 0.27 .
4 1.45 .
3 141 612-31-2016 14.20 0.22 .
3 1.08 1.30 (0.22) (1.92) — (2.14) 13.36 9.43 0.26 .
4,5 0.25 .
4,5 1.55 .
3 137 412-31-2015 15.75 0.24 .
3 (0.10) 0.14 (0.24) (1.45) — (1.69) 14.20 1.34 0.27 .
4 0.26 .
4 1.56 .
3 138 912-31-2014 15.22 0.21 .
3 0.61 0.82 (0.22) (0.07) — (0.29) 15.75 5.40 0.27 .
4 0.26 .
4 1.37 .
3 156 712-31-2013 12.46 0.20 .
3 2.76 2.96 (0.20) — — (0.20) 15.22 23.79 0.27 .
4 0.27 .
4 1.40 .
3 173 2
1 Based on average daily shares outstanding.2 Total returns would have been lower had certain expenses not been reduced during the applicable periods.3 Net investment income is affected by the timing and frequency of the declaration of dividends by the underlying funds in which the portfolio invests.4 Ratios do not include expenses indirectly incurred from the underlying fund held by the portfolio. The expense ratios of the underlying fund held by the portfolio were 0.29%, 0.30% for
12-31-17, 12-31-16 and 0.31% for all other periods presented.5 Includes reimbursement for overbilling of custody expenses in prior years of 0.01%.
.300
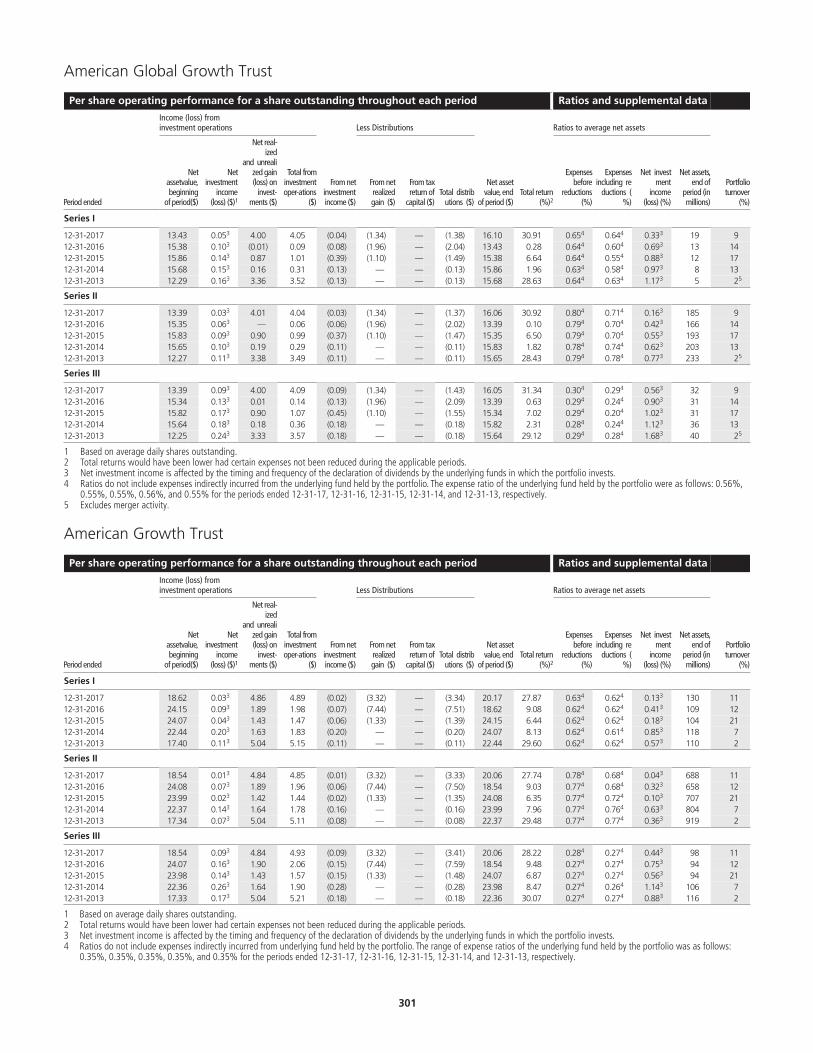
American Global Growth Trust
Per share operating performance for a share outstanding throughout each period Ratios and supplemental data
Income (loss) frominvestment operations Less Distributions Ratios to average net assets
Period ended
Netassetvalue,beginning
of period($)
Netinvestment
income(loss) ($)1
Net real-ized
and unrealized gain(loss) on
invest-ments ($)
Total frominvestmentoper-ations
($)
From netinvestmentincome ($)
From netrealizedgain ($)
From taxreturn of
capital ($)Total distrib
utions ($)
Net assetvalue, end
of period ($)Total return
(%)2
Expensesbefore
reductions(%)
Expensesincluding re
ductions (%)
Net investment
income(loss) (%)
Net assets,end of
period (inmillions)
Portfolioturnover
(%)
Series I
12-31-2017 13.43 0.05 .
3 4.00 4.05 (0.04) (1.34) — (1.38) 16.10 30.91 0.65 .
4 0.64 .
4 0.33 .
3 19 912-31-2016 15.38 0.10 .
3 (0.01) 0.09 (0.08) (1.96) — (2.04) 13.43 0.28 0.64 .
4 0.60 .
4 0.69 .
3 13 1412-31-2015 15.86 0.14 .
3 0.87 1.01 (0.39) (1.10) — (1.49) 15.38 6.64 0.64 .
4 0.55 .
4 0.88 .
3 12 1712-31-2014 15.68 0.15 .
3 0.16 0.31 (0.13) — — (0.13) 15.86 1.96 0.63 .
4 0.58 .
4 0.97 .
3 8 1312-31-2013 12.29 0.16 .
3 3.36 3.52 (0.13) — — (0.13) 15.68 28.63 0.64 .
4 0.63 .
4 1.17 .
3 5 2 .
5
Series II
12-31-2017 13.39 0.03 .
3 4.01 4.04 (0.03) (1.34) — (1.37) 16.06 30.92 0.80 .
4 0.71 .
4 0.16 .
3 185 912-31-2016 15.35 0.06 .
3 — 0.06 (0.06) (1.96) — (2.02) 13.39 0.10 0.79 .
4 0.70 .
4 0.42 .
3 166 1412-31-2015 15.83 0.09 .
3 0.90 0.99 (0.37) (1.10) — (1.47) 15.35 6.50 0.79 .
4 0.70 .
4 0.55 .
3 193 1712-31-2014 15.65 0.10 .
3 0.19 0.29 (0.11) — — (0.11) 15.83 1.82 0.78 .
4 0.74 .
4 0.62 .
3 203 1312-31-2013 12.27 0.11 .
3 3.38 3.49 (0.11) — — (0.11) 15.65 28.43 0.79 .
4 0.78 .
4 0.77 .
3 233 2 .
5
Series III
12-31-2017 13.39 0.09 .
3 4.00 4.09 (0.09) (1.34) — (1.43) 16.05 31.34 0.30 .
4 0.29 .
4 0.56 .
3 32 912-31-2016 15.34 0.13 .
3 0.01 0.14 (0.13) (1.96) — (2.09) 13.39 0.63 0.29 .
4 0.24 .
4 0.90 .
3 31 1412-31-2015 15.82 0.17 .
3 0.90 1.07 (0.45) (1.10) — (1.55) 15.34 7.02 0.29 .
4 0.20 .
4 1.02 .
3 31 1712-31-2014 15.64 0.18 .
3 0.18 0.36 (0.18) — — (0.18) 15.82 2.31 0.28 .
4 0.24 .
4 1.12 .
3 36 1312-31-2013 12.25 0.24 .
3 3.33 3.57 (0.18) — — (0.18) 15.64 29.12 0.29 .
4 0.28 .
4 1.68 .
3 40 2 .
5
1 Based on average daily shares outstanding.2 Total returns would have been lower had certain expenses not been reduced during the applicable periods.3 Net investment income is affected by the timing and frequency of the declaration of dividends by the underlying funds in which the portfolio invests.4 Ratios do not include expenses indirectly incurred from the underlying fund held by the portfolio. The expense ratio of the underlying fund held by the portfolio were as follows: 0.56%,
0.55%, 0.55%, 0.56%, and 0.55% for the periods ended 12-31-17, 12-31-16, 12-31-15, 12-31-14, and 12-31-13, respectively.5 Excludes merger activity.
American Growth Trust
Per share operating performance for a share outstanding throughout each period Ratios and supplemental data
Income (loss) frominvestment operations Less Distributions Ratios to average net assets
Period ended
Netassetvalue,beginning
of period($)
Netinvestment
income(loss) ($)1
Net real-ized
and unrealized gain(loss) on
invest-ments ($)
Total frominvestmentoper-ations
($)
From netinvestmentincome ($)
From netrealizedgain ($)
From taxreturn of
capital ($)Total distrib
utions ($)
Net assetvalue, end
of period ($)Total return
(%)2
Expensesbefore
reductions(%)
Expensesincluding re
ductions (%)
Net investment
income(loss) (%)
Net assets,end of
period (inmillions)
Portfolioturnover
(%)
Series I
12-31-2017 18.62 0.03 .
3 4.86 4.89 (0.02) (3.32) — (3.34) 20.17 27.87 0.63 .
4 0.62 .
4 0.13 .
3 130 1112-31-2016 24.15 0.09 .
3 1.89 1.98 (0.07) (7.44) — (7.51) 18.62 9.08 0.62 .
4 0.62 .
4 0.41 .
3 109 1212-31-2015 24.07 0.04 .
3 1.43 1.47 (0.06) (1.33) — (1.39) 24.15 6.44 0.62 .
4 0.62 .
4 0.18 .
3 104 2112-31-2014 22.44 0.20 .
3 1.63 1.83 (0.20) — — (0.20) 24.07 8.13 0.62 .
4 0.61 .
4 0.85 .
3 118 712-31-2013 17.40 0.11 .
3 5.04 5.15 (0.11) — — (0.11) 22.44 29.60 0.62 .
4 0.62 .
4 0.57 .
3 110 2
Series II
12-31-2017 18.54 0.01 .
3 4.84 4.85 (0.01) (3.32) — (3.33) 20.06 27.74 0.78 .
4 0.68 .
4 0.04 .
3 688 1112-31-2016 24.08 0.07 .
3 1.89 1.96 (0.06) (7.44) — (7.50) 18.54 9.03 0.77 .
4 0.68 .
4 0.32 .
3 658 1212-31-2015 23.99 0.02 .
3 1.42 1.44 (0.02) (1.33) — (1.35) 24.08 6.35 0.77 .
4 0.72 .
4 0.10 .
3 707 2112-31-2014 22.37 0.14 .
3 1.64 1.78 (0.16) — — (0.16) 23.99 7.96 0.77 .
4 0.76 .
4 0.63 .
3 804 712-31-2013 17.34 0.07 .
3 5.04 5.11 (0.08) — — (0.08) 22.37 29.48 0.77 .
4 0.77 .
4 0.36 .
3 919 2
Series III
12-31-2017 18.54 0.09 .
3 4.84 4.93 (0.09) (3.32) — (3.41) 20.06 28.22 0.28 .
4 0.27 .
4 0.44 .
3 98 1112-31-2016 24.07 0.16 .
3 1.90 2.06 (0.15) (7.44) — (7.59) 18.54 9.48 0.27 .
4 0.27 .
4 0.75 .
3 94 1212-31-2015 23.98 0.14 .
3 1.43 1.57 (0.15) (1.33) — (1.48) 24.07 6.87 0.27 .
4 0.27 .
4 0.56 .
3 94 2112-31-2014 22.36 0.26 .
3 1.64 1.90 (0.28) — — (0.28) 23.98 8.47 0.27 .
4 0.26 .
4 1.14 .
3 106 712-31-2013 17.33 0.17 .
3 5.04 5.21 (0.18) — — (0.18) 22.36 30.07 0.27 .
4 0.27 .
4 0.88 .
3 116 2
1 Based on average daily shares outstanding.2 Total returns would have been lower had certain expenses not been reduced during the applicable periods.3 Net investment income is affected by the timing and frequency of the declaration of dividends by the underlying funds in which the portfolio invests.4 Ratios do not include expenses indirectly incurred from underlying fund held by the portfolio. The range of expense ratios of the underlying fund held by the portfolio was as follows:
0.35%, 0.35%, 0.35%, 0.35%, and 0.35% for the periods ended 12-31-17, 12-31-16, 12-31-15, 12-31-14, and 12-31-13, respectively.
.301
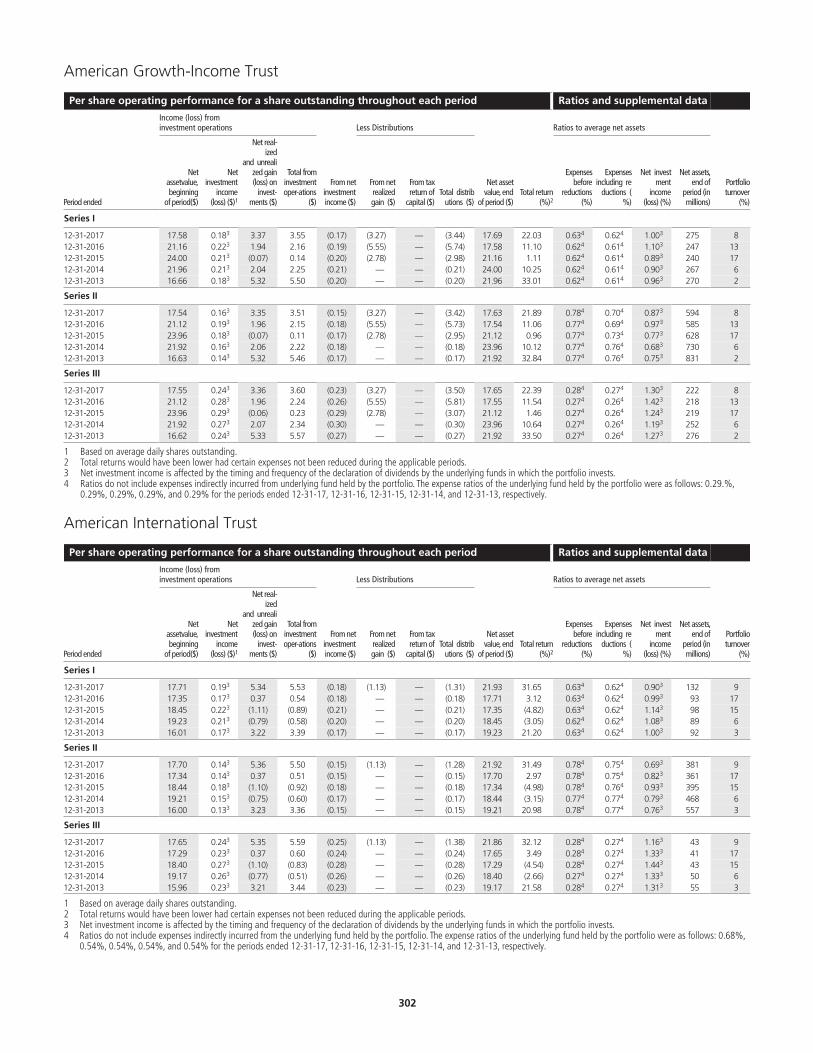
American Growth-Income Trust
Per share operating performance for a share outstanding throughout each period Ratios and supplemental data
Income (loss) frominvestment operations Less Distributions Ratios to average net assets
Period ended
Netassetvalue,beginning
of period($)
Netinvestment
income(loss) ($)1
Net real-ized
and unrealized gain(loss) on
invest-ments ($)
Total frominvestmentoper-ations
($)
From netinvestmentincome ($)
From netrealizedgain ($)
From taxreturn of
capital ($)Total distrib
utions ($)
Net assetvalue, end
of period ($)Total return
(%)2
Expensesbefore
reductions(%)
Expensesincluding re
ductions (%)
Net investment
income(loss) (%)
Net assets,end of
period (inmillions)
Portfolioturnover
(%)
Series I
12-31-2017 17.58 0.18 .
3 3.37 3.55 (0.17) (3.27) — (3.44) 17.69 22.03 0.63 .
4 0.62 .
4 1.00 .
3 275 812-31-2016 21.16 0.22 .
3 1.94 2.16 (0.19) (5.55) — (5.74) 17.58 11.10 0.62 .
4 0.61 .
4 1.10 .
3 247 1312-31-2015 24.00 0.21 .
3 (0.07) 0.14 (0.20) (2.78) — (2.98) 21.16 1.11 0.62 .
4 0.61 .
4 0.89 .
3 240 1712-31-2014 21.96 0.21 .
3 2.04 2.25 (0.21) — — (0.21) 24.00 10.25 0.62 .
4 0.61 .
4 0.90 .
3 267 612-31-2013 16.66 0.18 .
3 5.32 5.50 (0.20) — — (0.20) 21.96 33.01 0.62 .
4 0.61 .
4 0.96 .
3 270 2
Series II
12-31-2017 17.54 0.16 .
3 3.35 3.51 (0.15) (3.27) — (3.42) 17.63 21.89 0.78 .
4 0.70 .
4 0.87 .
3 594 812-31-2016 21.12 0.19 .
3 1.96 2.15 (0.18) (5.55) — (5.73) 17.54 11.06 0.77 .
4 0.69 .
4 0.97 .
3 585 1312-31-2015 23.96 0.18 .
3 (0.07) 0.11 (0.17) (2.78) — (2.95) 21.12 0.96 0.77 .
4 0.73 .
4 0.77 .
3 628 1712-31-2014 21.92 0.16 .
3 2.06 2.22 (0.18) — — (0.18) 23.96 10.12 0.77 .
4 0.76 .
4 0.68 .
3 730 612-31-2013 16.63 0.14 .
3 5.32 5.46 (0.17) — — (0.17) 21.92 32.84 0.77 .
4 0.76 .
4 0.75 .
3 831 2
Series III
12-31-2017 17.55 0.24 .
3 3.36 3.60 (0.23) (3.27) — (3.50) 17.65 22.39 0.28 .
4 0.27 .
4 1.30 .
3 222 812-31-2016 21.12 0.28 .
3 1.96 2.24 (0.26) (5.55) — (5.81) 17.55 11.54 0.27 .
4 0.26 .
4 1.42 .
3 218 1312-31-2015 23.96 0.29 .
3 (0.06) 0.23 (0.29) (2.78) — (3.07) 21.12 1.46 0.27 .
4 0.26 .
4 1.24 .
3 219 1712-31-2014 21.92 0.27 .
3 2.07 2.34 (0.30) — — (0.30) 23.96 10.64 0.27 .
4 0.26 .
4 1.19 .
3 252 612-31-2013 16.62 0.24 .
3 5.33 5.57 (0.27) — — (0.27) 21.92 33.50 0.27 .
4 0.26 .
4 1.27 .
3 276 2
1 Based on average daily shares outstanding.2 Total returns would have been lower had certain expenses not been reduced during the applicable periods.3 Net investment income is affected by the timing and frequency of the declaration of dividends by the underlying funds in which the portfolio invests.4 Ratios do not include expenses indirectly incurred from underlying fund held by the portfolio. The expense ratios of the underlying fund held by the portfolio were as follows: 0.29.%,
0.29%, 0.29%, 0.29%, and 0.29% for the periods ended 12-31-17, 12-31-16, 12-31-15, 12-31-14, and 12-31-13, respectively.
American International Trust
Per share operating performance for a share outstanding throughout each period Ratios and supplemental data
Income (loss) frominvestment operations Less Distributions Ratios to average net assets
Period ended
Netassetvalue,beginning
of period($)
Netinvestment
income(loss) ($)1
Net real-ized
and unrealized gain(loss) on
invest-ments ($)
Total frominvestmentoper-ations
($)
From netinvestmentincome ($)
From netrealizedgain ($)
From taxreturn of
capital ($)Total distrib
utions ($)
Net assetvalue, end
of period ($)Total return
(%)2
Expensesbefore
reductions(%)
Expensesincluding re
ductions (%)
Net investment
income(loss) (%)
Net assets,end of
period (inmillions)
Portfolioturnover
(%)
Series I
12-31-2017 17.71 0.19 .
3 5.34 5.53 (0.18) (1.13) — (1.31) 21.93 31.65 0.63 .
4 0.62 .
4 0.90 .
3 132 912-31-2016 17.35 0.17 .
3 0.37 0.54 (0.18) — — (0.18) 17.71 3.12 0.63 .
4 0.62 .
4 0.99 .
3 93 1712-31-2015 18.45 0.22 .
3 (1.11) (0.89) (0.21) — — (0.21) 17.35 (4.82) 0.63 .
4 0.62 .
4 1.14 .
3 98 1512-31-2014 19.23 0.21 .
3 (0.79) (0.58) (0.20) — — (0.20) 18.45 (3.05) 0.62 .
4 0.62 .
4 1.08 .
3 89 612-31-2013 16.01 0.17 .
3 3.22 3.39 (0.17) — — (0.17) 19.23 21.20 0.63 .
4 0.62 .
4 1.00 .
3 92 3
Series II
12-31-2017 17.70 0.14 .
3 5.36 5.50 (0.15) (1.13) — (1.28) 21.92 31.49 0.78 .
4 0.75 .
4 0.69 .
3 381 912-31-2016 17.34 0.14 .
3 0.37 0.51 (0.15) — — (0.15) 17.70 2.97 0.78 .
4 0.75 .
4 0.82 .
3 361 1712-31-2015 18.44 0.18 .
3 (1.10) (0.92) (0.18) — — (0.18) 17.34 (4.98) 0.78 .
4 0.76 .
4 0.93 .
3 395 1512-31-2014 19.21 0.15 .
3 (0.75) (0.60) (0.17) — — (0.17) 18.44 (3.15) 0.77 .
4 0.77 .
4 0.79 .
3 468 612-31-2013 16.00 0.13 .
3 3.23 3.36 (0.15) — — (0.15) 19.21 20.98 0.78 .
4 0.77 .
4 0.76 .
3 557 3
Series III
12-31-2017 17.65 0.24 .
3 5.35 5.59 (0.25) (1.13) — (1.38) 21.86 32.12 0.28 .
4 0.27 .
4 1.16 .
3 43 912-31-2016 17.29 0.23 .
3 0.37 0.60 (0.24) — — (0.24) 17.65 3.49 0.28 .
4 0.27 .
4 1.33 .
3 41 1712-31-2015 18.40 0.27 .
3 (1.10) (0.83) (0.28) — — (0.28) 17.29 (4.54) 0.28 .
4 0.27 .
4 1.44 .
3 43 1512-31-2014 19.17 0.26 .
3 (0.77) (0.51) (0.26) — — (0.26) 18.40 (2.66) 0.27 .
4 0.27 .
4 1.33 .
3 50 612-31-2013 15.96 0.23 .
3 3.21 3.44 (0.23) — — (0.23) 19.17 21.58 0.28 .
4 0.27 .
4 1.31 .
3 55 3
1 Based on average daily shares outstanding.2 Total returns would have been lower had certain expenses not been reduced during the applicable periods.3 Net investment income is affected by the timing and frequency of the declaration of dividends by the underlying funds in which the portfolio invests.4 Ratios do not include expenses indirectly incurred from the underlying fund held by the portfolio. The expense ratios of the underlying fund held by the portfolio were as follows: 0.68%,
0.54%, 0.54%, 0.54%, and 0.54% for the periods ended 12-31-17, 12-31-16, 12-31-15, 12-31-14, and 12-31-13, respectively.
.302
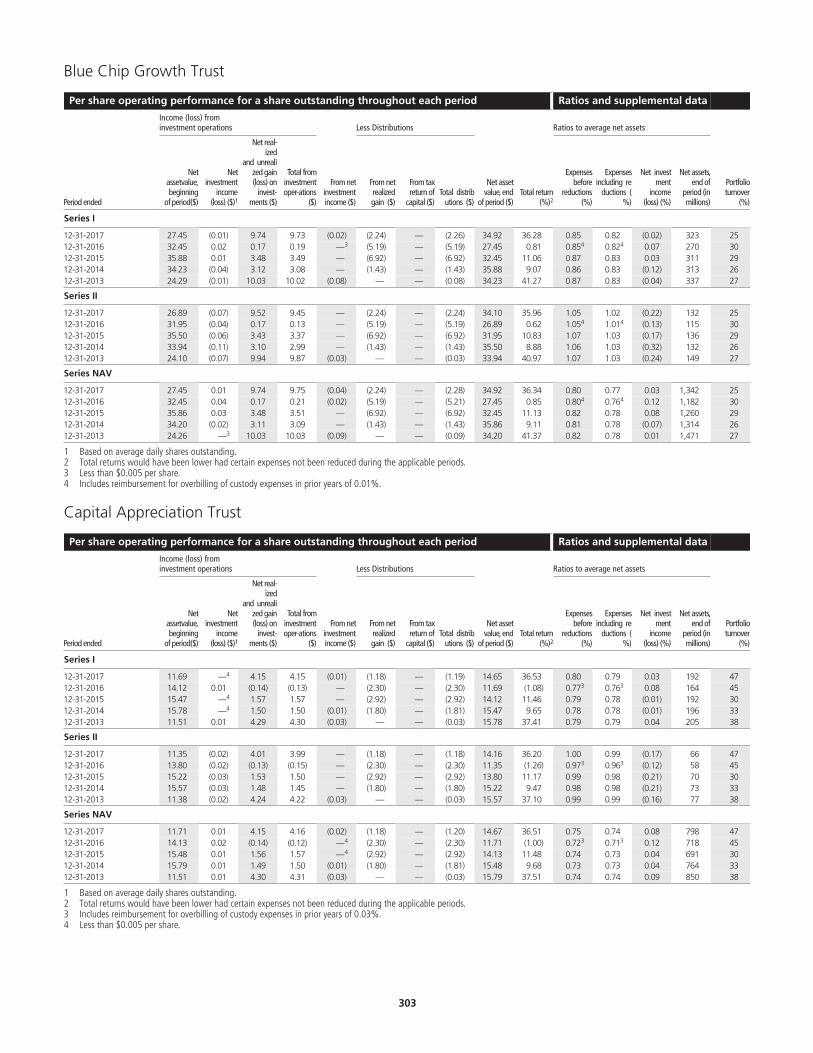
Blue Chip Growth Trust
Per share operating performance for a share outstanding throughout each period Ratios and supplemental data
Income (loss) frominvestment operations Less Distributions Ratios to average net assets
Period ended
Netassetvalue,beginning
of period($)
Netinvestment
income(loss) ($)1
Net real-ized
and unrealized gain(loss) on
invest-ments ($)
Total frominvestmentoper-ations
($)
From netinvestmentincome ($)
From netrealizedgain ($)
From taxreturn of
capital ($)Total distrib
utions ($)
Net assetvalue, end
of period ($)Total return
(%)2
Expensesbefore
reductions(%)
Expensesincluding re
ductions (%)
Net investment
income(loss) (%)
Net assets,end of
period (inmillions)
Portfolioturnover
(%)
Series I
12-31-2017 27.45 (0.01) 9.74 9.73 (0.02) (2.24) — (2.26) 34.92 36.28 0.85 0.82 (0.02) 323 2512-31-2016 32.45 0.02 0.17 0.19 — .
3 (5.19) — (5.19) 27.45 0.81 0.85 .
4 0.82 .
4 0.07 270 3012-31-2015 35.88 0.01 3.48 3.49 — (6.92) — (6.92) 32.45 11.06 0.87 0.83 0.03 311 2912-31-2014 34.23 (0.04) 3.12 3.08 — (1.43) — (1.43) 35.88 9.07 0.86 0.83 (0.12) 313 2612-31-2013 24.29 (0.01) 10.03 10.02 (0.08) — — (0.08) 34.23 41.27 0.87 0.83 (0.04) 337 27
Series II
12-31-2017 26.89 (0.07) 9.52 9.45 — (2.24) — (2.24) 34.10 35.96 1.05 1.02 (0.22) 132 2512-31-2016 31.95 (0.04) 0.17 0.13 — (5.19) — (5.19) 26.89 0.62 1.05 .
4 1.01 .
4 (0.13) 115 3012-31-2015 35.50 (0.06) 3.43 3.37 — (6.92) — (6.92) 31.95 10.83 1.07 1.03 (0.17) 136 2912-31-2014 33.94 (0.11) 3.10 2.99 — (1.43) — (1.43) 35.50 8.88 1.06 1.03 (0.32) 132 2612-31-2013 24.10 (0.07) 9.94 9.87 (0.03) — — (0.03) 33.94 40.97 1.07 1.03 (0.24) 149 27
Series NAV
12-31-2017 27.45 0.01 9.74 9.75 (0.04) (2.24) — (2.28) 34.92 36.34 0.80 0.77 0.03 1,342 2512-31-2016 32.45 0.04 0.17 0.21 (0.02) (5.19) — (5.21) 27.45 0.85 0.80 .
4 0.76 .
4 0.12 1,182 3012-31-2015 35.86 0.03 3.48 3.51 — (6.92) — (6.92) 32.45 11.13 0.82 0.78 0.08 1,260 2912-31-2014 34.20 (0.02) 3.11 3.09 — (1.43) — (1.43) 35.86 9.11 0.81 0.78 (0.07) 1,314 2612-31-2013 24.26 — .
3 10.03 10.03 (0.09) — — (0.09) 34.20 41.37 0.82 0.78 0.01 1,471 27
1 Based on average daily shares outstanding.2 Total returns would have been lower had certain expenses not been reduced during the applicable periods.3 Less than $0.005 per share.4 Includes reimbursement for overbilling of custody expenses in prior years of 0.01%.
Capital Appreciation Trust
Per share operating performance for a share outstanding throughout each period Ratios and supplemental data
Income (loss) frominvestment operations Less Distributions Ratios to average net assets
Period ended
Netassetvalue,beginning
of period($)
Netinvestment
income(loss) ($)1
Net real-ized
and unrealized gain(loss) on
invest-ments ($)
Total frominvestmentoper-ations
($)
From netinvestmentincome ($)
From netrealizedgain ($)
From taxreturn of
capital ($)Total distrib
utions ($)
Net assetvalue, end
of period ($)Total return
(%)2
Expensesbefore
reductions(%)
Expensesincluding re
ductions (%)
Net investment
income(loss) (%)
Net assets,end of
period (inmillions)
Portfolioturnover
(%)
Series I
12-31-2017 11.69 — .
4 4.15 4.15 (0.01) (1.18) — (1.19) 14.65 36.53 0.80 0.79 0.03 192 4712-31-2016 14.12 0.01 (0.14) (0.13) — (2.30) — (2.30) 11.69 (1.08) 0.77 .
3 0.76 .
3 0.08 164 4512-31-2015 15.47 — .
4 1.57 1.57 — (2.92) — (2.92) 14.12 11.46 0.79 0.78 (0.01) 192 3012-31-2014 15.78 — .
4 1.50 1.50 (0.01) (1.80) — (1.81) 15.47 9.65 0.78 0.78 (0.01) 196 3312-31-2013 11.51 0.01 4.29 4.30 (0.03) — — (0.03) 15.78 37.41 0.79 0.79 0.04 205 38
Series II
12-31-2017 11.35 (0.02) 4.01 3.99 — (1.18) — (1.18) 14.16 36.20 1.00 0.99 (0.17) 66 4712-31-2016 13.80 (0.02) (0.13) (0.15) — (2.30) — (2.30) 11.35 (1.26) 0.97 .
3 0.96 .
3 (0.12) 58 4512-31-2015 15.22 (0.03) 1.53 1.50 — (2.92) — (2.92) 13.80 11.17 0.99 0.98 (0.21) 70 3012-31-2014 15.57 (0.03) 1.48 1.45 — (1.80) — (1.80) 15.22 9.47 0.98 0.98 (0.21) 73 3312-31-2013 11.38 (0.02) 4.24 4.22 (0.03) — — (0.03) 15.57 37.10 0.99 0.99 (0.16) 77 38
Series NAV
12-31-2017 11.71 0.01 4.15 4.16 (0.02) (1.18) — (1.20) 14.67 36.51 0.75 0.74 0.08 798 4712-31-2016 14.13 0.02 (0.14) (0.12) — .
4 (2.30) — (2.30) 11.71 (1.00) 0.72 .
3 0.71 .
3 0.12 718 4512-31-2015 15.48 0.01 1.56 1.57 — .
4 (2.92) — (2.92) 14.13 11.48 0.74 0.73 0.04 691 3012-31-2014 15.79 0.01 1.49 1.50 (0.01) (1.80) — (1.81) 15.48 9.68 0.73 0.73 0.04 764 3312-31-2013 11.51 0.01 4.30 4.31 (0.03) — — (0.03) 15.79 37.51 0.74 0.74 0.09 850 38
1 Based on average daily shares outstanding.2 Total returns would have been lower had certain expenses not been reduced during the applicable periods.3 Includes reimbursement for overbilling of custody expenses in prior years of 0.03%.4 Less than $0.005 per share.
.303
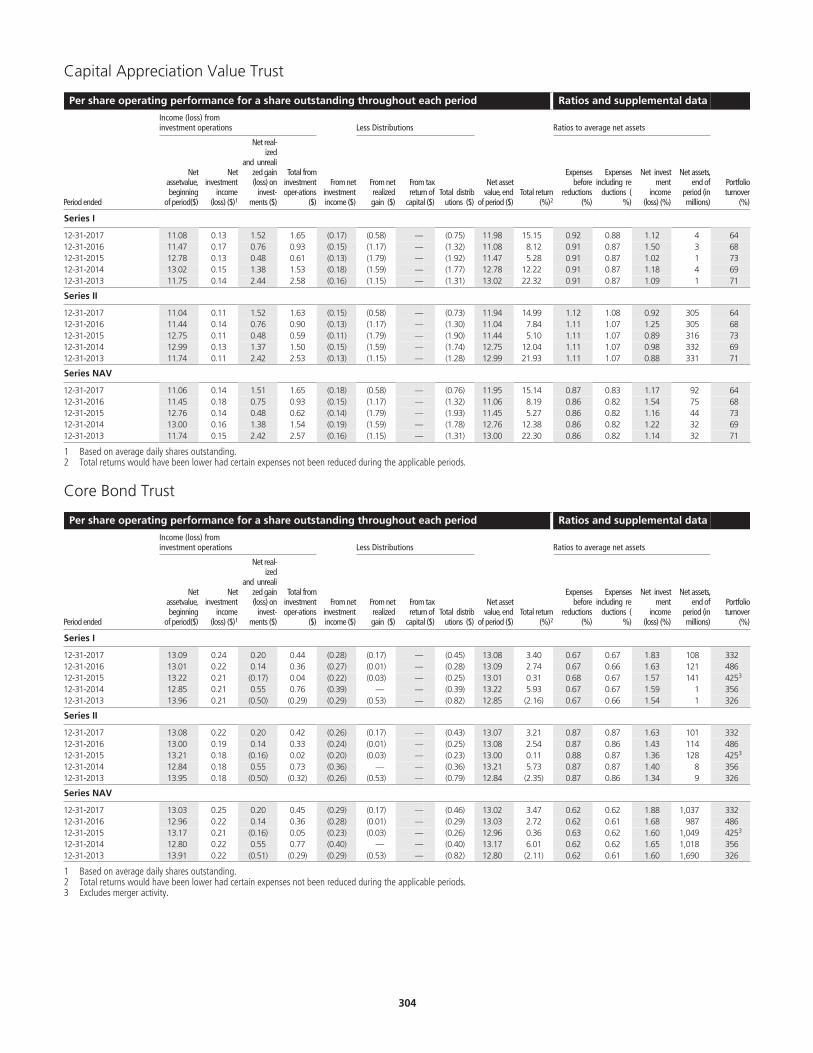
Capital Appreciation Value Trust
Per share operating performance for a share outstanding throughout each period Ratios and supplemental data
Income (loss) frominvestment operations Less Distributions Ratios to average net assets
Period ended
Netassetvalue,beginning
of period($)
Netinvestment
income(loss) ($)1
Net real-ized
and unrealized gain(loss) on
invest-ments ($)
Total frominvestmentoper-ations
($)
From netinvestmentincome ($)
From netrealizedgain ($)
From taxreturn of
capital ($)Total distrib
utions ($)
Net assetvalue, end
of period ($)Total return
(%)2
Expensesbefore
reductions(%)
Expensesincluding re
ductions (%)
Net investment
income(loss) (%)
Net assets,end of
period (inmillions)
Portfolioturnover
(%)
Series I
12-31-2017 11.08 0.13 1.52 1.65 (0.17) (0.58) — (0.75) 11.98 15.15 0.92 0.88 1.12 4 6412-31-2016 11.47 0.17 0.76 0.93 (0.15) (1.17) — (1.32) 11.08 8.12 0.91 0.87 1.50 3 6812-31-2015 12.78 0.13 0.48 0.61 (0.13) (1.79) — (1.92) 11.47 5.28 0.91 0.87 1.02 1 7312-31-2014 13.02 0.15 1.38 1.53 (0.18) (1.59) — (1.77) 12.78 12.22 0.91 0.87 1.18 4 6912-31-2013 11.75 0.14 2.44 2.58 (0.16) (1.15) — (1.31) 13.02 22.32 0.91 0.87 1.09 1 71
Series II
12-31-2017 11.04 0.11 1.52 1.63 (0.15) (0.58) — (0.73) 11.94 14.99 1.12 1.08 0.92 305 6412-31-2016 11.44 0.14 0.76 0.90 (0.13) (1.17) — (1.30) 11.04 7.84 1.11 1.07 1.25 305 6812-31-2015 12.75 0.11 0.48 0.59 (0.11) (1.79) — (1.90) 11.44 5.10 1.11 1.07 0.89 316 7312-31-2014 12.99 0.13 1.37 1.50 (0.15) (1.59) — (1.74) 12.75 12.04 1.11 1.07 0.98 332 6912-31-2013 11.74 0.11 2.42 2.53 (0.13) (1.15) — (1.28) 12.99 21.93 1.11 1.07 0.88 331 71
Series NAV
12-31-2017 11.06 0.14 1.51 1.65 (0.18) (0.58) — (0.76) 11.95 15.14 0.87 0.83 1.17 92 6412-31-2016 11.45 0.18 0.75 0.93 (0.15) (1.17) — (1.32) 11.06 8.19 0.86 0.82 1.54 75 6812-31-2015 12.76 0.14 0.48 0.62 (0.14) (1.79) — (1.93) 11.45 5.27 0.86 0.82 1.16 44 7312-31-2014 13.00 0.16 1.38 1.54 (0.19) (1.59) — (1.78) 12.76 12.38 0.86 0.82 1.22 32 6912-31-2013 11.74 0.15 2.42 2.57 (0.16) (1.15) — (1.31) 13.00 22.30 0.86 0.82 1.14 32 71
1 Based on average daily shares outstanding.2 Total returns would have been lower had certain expenses not been reduced during the applicable periods.
Core Bond Trust
Per share operating performance for a share outstanding throughout each period Ratios and supplemental data
Income (loss) frominvestment operations Less Distributions Ratios to average net assets
Period ended
Netassetvalue,beginning
of period($)
Netinvestment
income(loss) ($)1
Net real-ized
and unrealized gain(loss) on
invest-ments ($)
Total frominvestmentoper-ations
($)
From netinvestmentincome ($)
From netrealizedgain ($)
From taxreturn of
capital ($)Total distrib
utions ($)
Net assetvalue, end
of period ($)Total return
(%)2
Expensesbefore
reductions(%)
Expensesincluding re
ductions (%)
Net investment
income(loss) (%)
Net assets,end of
period (inmillions)
Portfolioturnover
(%)
Series I
12-31-2017 13.09 0.24 0.20 0.44 (0.28) (0.17) — (0.45) 13.08 3.40 0.67 0.67 1.83 108 33212-31-2016 13.01 0.22 0.14 0.36 (0.27) (0.01) — (0.28) 13.09 2.74 0.67 0.66 1.63 121 48612-31-2015 13.22 0.21 (0.17) 0.04 (0.22) (0.03) — (0.25) 13.01 0.31 0.68 0.67 1.57 141 425 .
3
12-31-2014 12.85 0.21 0.55 0.76 (0.39) — — (0.39) 13.22 5.93 0.67 0.67 1.59 1 35612-31-2013 13.96 0.21 (0.50) (0.29) (0.29) (0.53) — (0.82) 12.85 (2.16) 0.67 0.66 1.54 1 326
Series II
12-31-2017 13.08 0.22 0.20 0.42 (0.26) (0.17) — (0.43) 13.07 3.21 0.87 0.87 1.63 101 33212-31-2016 13.00 0.19 0.14 0.33 (0.24) (0.01) — (0.25) 13.08 2.54 0.87 0.86 1.43 114 48612-31-2015 13.21 0.18 (0.16) 0.02 (0.20) (0.03) — (0.23) 13.00 0.11 0.88 0.87 1.36 128 425 .
3
12-31-2014 12.84 0.18 0.55 0.73 (0.36) — — (0.36) 13.21 5.73 0.87 0.87 1.40 8 35612-31-2013 13.95 0.18 (0.50) (0.32) (0.26) (0.53) — (0.79) 12.84 (2.35) 0.87 0.86 1.34 9 326
Series NAV
12-31-2017 13.03 0.25 0.20 0.45 (0.29) (0.17) — (0.46) 13.02 3.47 0.62 0.62 1.88 1,037 33212-31-2016 12.96 0.22 0.14 0.36 (0.28) (0.01) — (0.29) 13.03 2.72 0.62 0.61 1.68 987 48612-31-2015 13.17 0.21 (0.16) 0.05 (0.23) (0.03) — (0.26) 12.96 0.36 0.63 0.62 1.60 1,049 425 .
3
12-31-2014 12.80 0.22 0.55 0.77 (0.40) — — (0.40) 13.17 6.01 0.62 0.62 1.65 1,018 35612-31-2013 13.91 0.22 (0.51) (0.29) (0.29) (0.53) — (0.82) 12.80 (2.11) 0.62 0.61 1.60 1,690 326
1 Based on average daily shares outstanding.2 Total returns would have been lower had certain expenses not been reduced during the applicable periods.3 Excludes merger activity.
.304
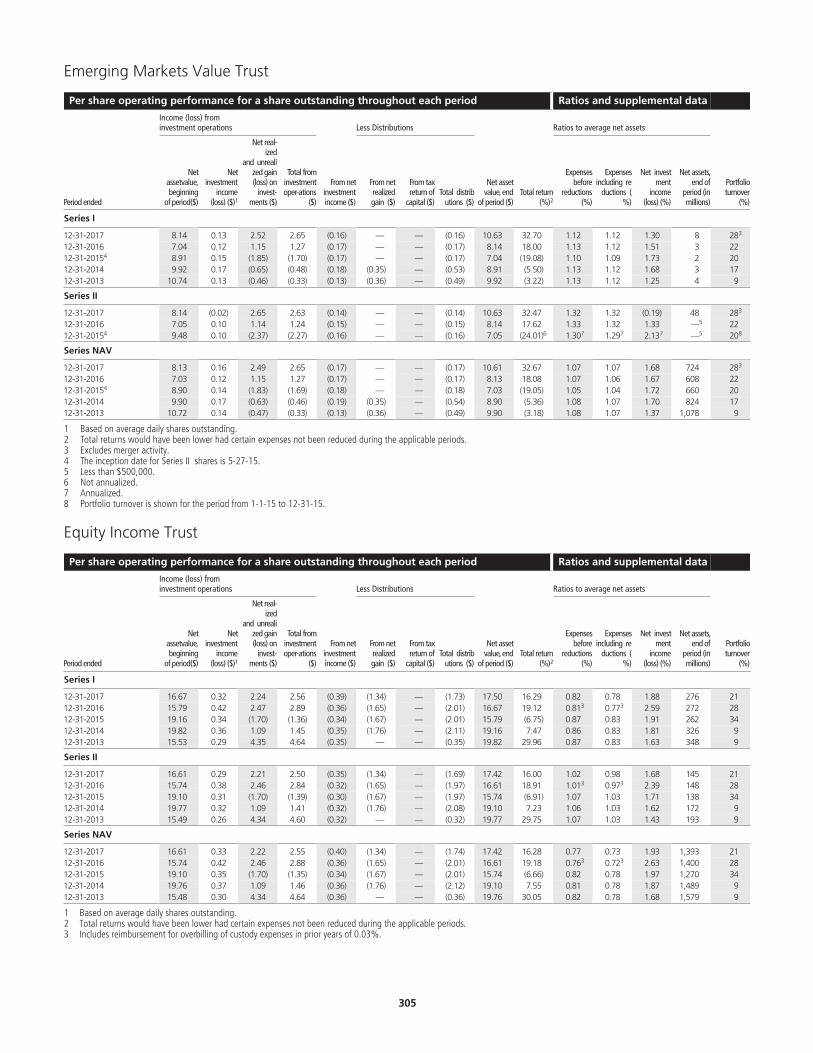
Emerging Markets Value Trust
Per share operating performance for a share outstanding throughout each period Ratios and supplemental data
Income (loss) frominvestment operations Less Distributions Ratios to average net assets
Period ended
Netassetvalue,beginning
of period($)
Netinvestment
income(loss) ($)1
Net real-ized
and unrealized gain(loss) on
invest-ments ($)
Total frominvestmentoper-ations
($)
From netinvestmentincome ($)
From netrealizedgain ($)
From taxreturn of
capital ($)Total distrib
utions ($)
Net assetvalue, end
of period ($)Total return
(%)2
Expensesbefore
reductions(%)
Expensesincluding re
ductions (%)
Net investment
income(loss) (%)
Net assets,end of
period (inmillions)
Portfolioturnover
(%)
Series I
12-31-2017 8.14 0.13 2.52 2.65 (0.16) — — (0.16) 10.63 32.70 1.12 1.12 1.30 8 28 .
3
12-31-2016 7.04 0.12 1.15 1.27 (0.17) — — (0.17) 8.14 18.00 1.13 1.12 1.51 3 2212-31-20154 8.91 0.15 (1.85) (1.70) (0.17) — — (0.17) 7.04 (19.08) 1.10 1.09 1.73 2 2012-31-2014 9.92 0.17 (0.65) (0.48) (0.18) (0.35) — (0.53) 8.91 (5.50) 1.13 1.12 1.68 3 1712-31-2013 10.74 0.13 (0.46) (0.33) (0.13) (0.36) — (0.49) 9.92 (3.22) 1.13 1.12 1.25 4 9
Series II
12-31-2017 8.14 (0.02) 2.65 2.63 (0.14) — — (0.14) 10.63 32.47 1.32 1.32 (0.19) 48 28 .
3
12-31-2016 7.05 0.10 1.14 1.24 (0.15) — — (0.15) 8.14 17.62 1.33 1.32 1.33 — .
5 2212-31-20154 9.48 0.10 (2.37) (2.27) (0.16) — — (0.16) 7.05 (24.01)6 1.30 .
7 1.29 .
7 2.13 .
7 — .
5 20 .
8
Series NAV
12-31-2017 8.13 0.16 2.49 2.65 (0.17) — — (0.17) 10.61 32.67 1.07 1.07 1.68 724 28 .
3
12-31-2016 7.03 0.12 1.15 1.27 (0.17) — — (0.17) 8.13 18.08 1.07 1.06 1.67 608 2212-31-20154 8.90 0.14 (1.83) (1.69) (0.18) — — (0.18) 7.03 (19.05) 1.05 1.04 1.72 660 2012-31-2014 9.90 0.17 (0.63) (0.46) (0.19) (0.35) — (0.54) 8.90 (5.36) 1.08 1.07 1.70 824 1712-31-2013 10.72 0.14 (0.47) (0.33) (0.13) (0.36) — (0.49) 9.90 (3.18) 1.08 1.07 1.37 1,078 9
1 Based on average daily shares outstanding.2 Total returns would have been lower had certain expenses not been reduced during the applicable periods.3 Excludes merger activity.4 The inception date for Series II shares is 5-27-15.5 Less than $500,000.6 Not annualized.7 Annualized.8 Portfolio turnover is shown for the period from 1-1-15 to 12-31-15.
Equity Income Trust
Per share operating performance for a share outstanding throughout each period Ratios and supplemental data
Income (loss) frominvestment operations Less Distributions Ratios to average net assets
Period ended
Netassetvalue,beginning
of period($)
Netinvestment
income(loss) ($)1
Net real-ized
and unrealized gain(loss) on
invest-ments ($)
Total frominvestmentoper-ations
($)
From netinvestmentincome ($)
From netrealizedgain ($)
From taxreturn of
capital ($)Total distrib
utions ($)
Net assetvalue, end
of period ($)Total return
(%)2
Expensesbefore
reductions(%)
Expensesincluding re
ductions (%)
Net investment
income(loss) (%)
Net assets,end of
period (inmillions)
Portfolioturnover
(%)
Series I
12-31-2017 16.67 0.32 2.24 2.56 (0.39) (1.34) — (1.73) 17.50 16.29 0.82 0.78 1.88 276 2112-31-2016 15.79 0.42 2.47 2.89 (0.36) (1.65) — (2.01) 16.67 19.12 0.81 .
3 0.77 .
3 2.59 272 2812-31-2015 19.16 0.34 (1.70) (1.36) (0.34) (1.67) — (2.01) 15.79 (6.75) 0.87 0.83 1.91 262 3412-31-2014 19.82 0.36 1.09 1.45 (0.35) (1.76) — (2.11) 19.16 7.47 0.86 0.83 1.81 326 912-31-2013 15.53 0.29 4.35 4.64 (0.35) — — (0.35) 19.82 29.96 0.87 0.83 1.63 348 9
Series II
12-31-2017 16.61 0.29 2.21 2.50 (0.35) (1.34) — (1.69) 17.42 16.00 1.02 0.98 1.68 145 2112-31-2016 15.74 0.38 2.46 2.84 (0.32) (1.65) — (1.97) 16.61 18.91 1.01 .
3 0.97 .
3 2.39 148 2812-31-2015 19.10 0.31 (1.70) (1.39) (0.30) (1.67) — (1.97) 15.74 (6.91) 1.07 1.03 1.71 138 3412-31-2014 19.77 0.32 1.09 1.41 (0.32) (1.76) — (2.08) 19.10 7.23 1.06 1.03 1.62 172 912-31-2013 15.49 0.26 4.34 4.60 (0.32) — — (0.32) 19.77 29.75 1.07 1.03 1.43 193 9
Series NAV
12-31-2017 16.61 0.33 2.22 2.55 (0.40) (1.34) — (1.74) 17.42 16.28 0.77 0.73 1.93 1,393 2112-31-2016 15.74 0.42 2.46 2.88 (0.36) (1.65) — (2.01) 16.61 19.18 0.76 .
3 0.72 .
3 2.63 1,400 2812-31-2015 19.10 0.35 (1.70) (1.35) (0.34) (1.67) — (2.01) 15.74 (6.66) 0.82 0.78 1.97 1,270 3412-31-2014 19.76 0.37 1.09 1.46 (0.36) (1.76) — (2.12) 19.10 7.55 0.81 0.78 1.87 1,489 912-31-2013 15.48 0.30 4.34 4.64 (0.36) — — (0.36) 19.76 30.05 0.82 0.78 1.68 1,579 9
1 Based on average daily shares outstanding.2 Total returns would have been lower had certain expenses not been reduced during the applicable periods.3 Includes reimbursement for overbilling of custody expenses in prior years of 0.03%.
.305
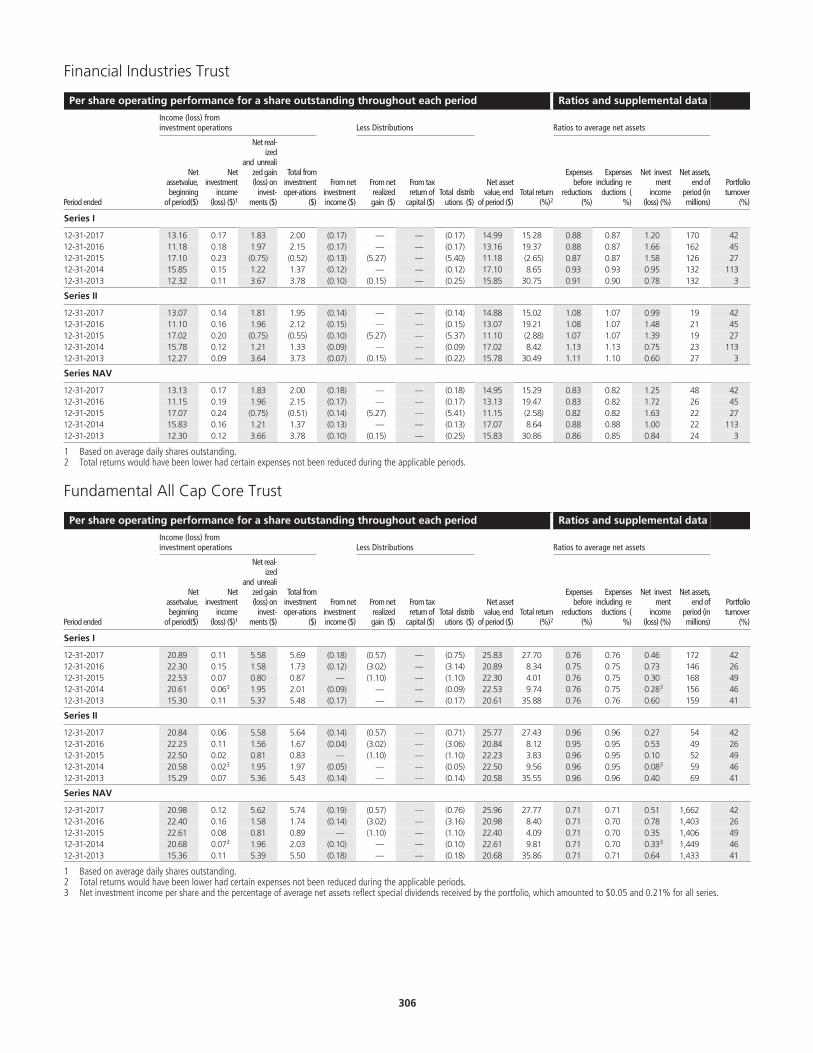
Financial Industries Trust
Per share operating performance for a share outstanding throughout each period Ratios and supplemental data
Income (loss) frominvestment operations Less Distributions Ratios to average net assets
Period ended
Netassetvalue,beginning
of period($)
Netinvestment
income(loss) ($)1
Net real-ized
and unrealized gain(loss) on
invest-ments ($)
Total frominvestmentoper-ations
($)
From netinvestmentincome ($)
From netrealizedgain ($)
From taxreturn of
capital ($)Total distrib
utions ($)
Net assetvalue, end
of period ($)Total return
(%)2
Expensesbefore
reductions(%)
Expensesincluding re
ductions (%)
Net investment
income(loss) (%)
Net assets,end of
period (inmillions)
Portfolioturnover
(%)
Series I
12-31-2017 13.16 0.17 1.83 2.00 (0.17) — — (0.17) 14.99 15.28 0.88 0.87 1.20 170 4212-31-2016 11.18 0.18 1.97 2.15 (0.17) — — (0.17) 13.16 19.37 0.88 0.87 1.66 162 4512-31-2015 17.10 0.23 (0.75) (0.52) (0.13) (5.27) — (5.40) 11.18 (2.65) 0.87 0.87 1.58 126 2712-31-2014 15.85 0.15 1.22 1.37 (0.12) — — (0.12) 17.10 8.65 0.93 0.93 0.95 132 11312-31-2013 12.32 0.11 3.67 3.78 (0.10) (0.15) — (0.25) 15.85 30.75 0.91 0.90 0.78 132 3
Series II
12-31-2017 13.07 0.14 1.81 1.95 (0.14) — — (0.14) 14.88 15.02 1.08 1.07 0.99 19 4212-31-2016 11.10 0.16 1.96 2.12 (0.15) — — (0.15) 13.07 19.21 1.08 1.07 1.48 21 4512-31-2015 17.02 0.20 (0.75) (0.55) (0.10) (5.27) — (5.37) 11.10 (2.88) 1.07 1.07 1.39 19 2712-31-2014 15.78 0.12 1.21 1.33 (0.09) — — (0.09) 17.02 8.42 1.13 1.13 0.75 23 11312-31-2013 12.27 0.09 3.64 3.73 (0.07) (0.15) — (0.22) 15.78 30.49 1.11 1.10 0.60 27 3
Series NAV
12-31-2017 13.13 0.17 1.83 2.00 (0.18) — — (0.18) 14.95 15.29 0.83 0.82 1.25 48 4212-31-2016 11.15 0.19 1.96 2.15 (0.17) — — (0.17) 13.13 19.47 0.83 0.82 1.72 26 4512-31-2015 17.07 0.24 (0.75) (0.51) (0.14) (5.27) — (5.41) 11.15 (2.58) 0.82 0.82 1.63 22 2712-31-2014 15.83 0.16 1.21 1.37 (0.13) — — (0.13) 17.07 8.64 0.88 0.88 1.00 22 11312-31-2013 12.30 0.12 3.66 3.78 (0.10) (0.15) — (0.25) 15.83 30.86 0.86 0.85 0.84 24 3
1 Based on average daily shares outstanding.2 Total returns would have been lower had certain expenses not been reduced during the applicable periods.
Fundamental All Cap Core Trust
Per share operating performance for a share outstanding throughout each period Ratios and supplemental data
Income (loss) frominvestment operations Less Distributions Ratios to average net assets
Period ended
Netassetvalue,beginning
of period($)
Netinvestment
income(loss) ($)1
Net real-ized
and unrealized gain(loss) on
invest-ments ($)
Total frominvestmentoper-ations
($)
From netinvestmentincome ($)
From netrealizedgain ($)
From taxreturn of
capital ($)Total distrib
utions ($)
Net assetvalue, end
of period ($)Total return
(%)2
Expensesbefore
reductions(%)
Expensesincluding re
ductions (%)
Net investment
income(loss) (%)
Net assets,end of
period (inmillions)
Portfolioturnover
(%)
Series I
12-31-2017 20.89 0.11 5.58 5.69 (0.18) (0.57) — (0.75) 25.83 27.70 0.76 0.76 0.46 172 4212-31-2016 22.30 0.15 1.58 1.73 (0.12) (3.02) — (3.14) 20.89 8.34 0.75 0.75 0.73 146 2612-31-2015 22.53 0.07 0.80 0.87 — (1.10) — (1.10) 22.30 4.01 0.76 0.75 0.30 168 4912-31-2014 20.61 0.06 .
3 1.95 2.01 (0.09) — — (0.09) 22.53 9.74 0.76 0.75 0.28 .
3 156 4612-31-2013 15.30 0.11 5.37 5.48 (0.17) — — (0.17) 20.61 35.88 0.76 0.76 0.60 159 41
Series II
12-31-2017 20.84 0.06 5.58 5.64 (0.14) (0.57) — (0.71) 25.77 27.43 0.96 0.96 0.27 54 4212-31-2016 22.23 0.11 1.56 1.67 (0.04) (3.02) — (3.06) 20.84 8.12 0.95 0.95 0.53 49 2612-31-2015 22.50 0.02 0.81 0.83 — (1.10) — (1.10) 22.23 3.83 0.96 0.95 0.10 52 4912-31-2014 20.58 0.02 .
3 1.95 1.97 (0.05) — — (0.05) 22.50 9.56 0.96 0.95 0.08 .
3 59 4612-31-2013 15.29 0.07 5.36 5.43 (0.14) — — (0.14) 20.58 35.55 0.96 0.96 0.40 69 41
Series NAV
12-31-2017 20.98 0.12 5.62 5.74 (0.19) (0.57) — (0.76) 25.96 27.77 0.71 0.71 0.51 1,662 4212-31-2016 22.40 0.16 1.58 1.74 (0.14) (3.02) — (3.16) 20.98 8.40 0.71 0.70 0.78 1,403 2612-31-2015 22.61 0.08 0.81 0.89 — (1.10) — (1.10) 22.40 4.09 0.71 0.70 0.35 1,406 4912-31-2014 20.68 0.07 .
3 1.96 2.03 (0.10) — — (0.10) 22.61 9.81 0.71 0.70 0.33 .
3 1,449 4612-31-2013 15.36 0.11 5.39 5.50 (0.18) — — (0.18) 20.68 35.86 0.71 0.71 0.64 1,433 41
1 Based on average daily shares outstanding.2 Total returns would have been lower had certain expenses not been reduced during the applicable periods.3 Net investment income per share and the percentage of average net assets reflect special dividends received by the portfolio, which amounted to $0.05 and 0.21% for all series.
.306
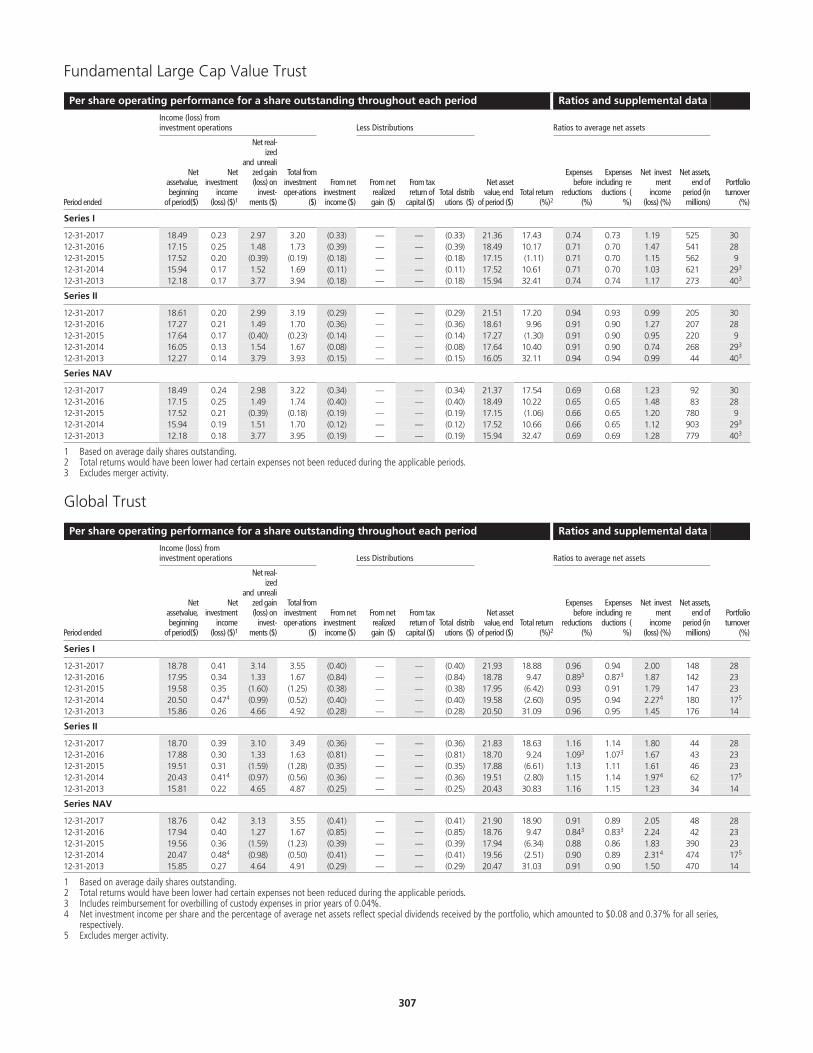
Fundamental Large Cap Value Trust
Per share operating performance for a share outstanding throughout each period Ratios and supplemental data
Income (loss) frominvestment operations Less Distributions Ratios to average net assets
Period ended
Netassetvalue,beginning
of period($)
Netinvestment
income(loss) ($)1
Net real-ized
and unrealized gain(loss) on
invest-ments ($)
Total frominvestmentoper-ations
($)
From netinvestmentincome ($)
From netrealizedgain ($)
From taxreturn of
capital ($)Total distrib
utions ($)
Net assetvalue, end
of period ($)Total return
(%)2
Expensesbefore
reductions(%)
Expensesincluding re
ductions (%)
Net investment
income(loss) (%)
Net assets,end of
period (inmillions)
Portfolioturnover
(%)
Series I
12-31-2017 18.49 0.23 2.97 3.20 (0.33) — — (0.33) 21.36 17.43 0.74 0.73 1.19 525 3012-31-2016 17.15 0.25 1.48 1.73 (0.39) — — (0.39) 18.49 10.17 0.71 0.70 1.47 541 2812-31-2015 17.52 0.20 (0.39) (0.19) (0.18) — — (0.18) 17.15 (1.11) 0.71 0.70 1.15 562 912-31-2014 15.94 0.17 1.52 1.69 (0.11) — — (0.11) 17.52 10.61 0.71 0.70 1.03 621 29 .
3
12-31-2013 12.18 0.17 3.77 3.94 (0.18) — — (0.18) 15.94 32.41 0.74 0.74 1.17 273 40 .
3
Series II
12-31-2017 18.61 0.20 2.99 3.19 (0.29) — — (0.29) 21.51 17.20 0.94 0.93 0.99 205 3012-31-2016 17.27 0.21 1.49 1.70 (0.36) — — (0.36) 18.61 9.96 0.91 0.90 1.27 207 2812-31-2015 17.64 0.17 (0.40) (0.23) (0.14) — — (0.14) 17.27 (1.30) 0.91 0.90 0.95 220 912-31-2014 16.05 0.13 1.54 1.67 (0.08) — — (0.08) 17.64 10.40 0.91 0.90 0.74 268 29 .
3
12-31-2013 12.27 0.14 3.79 3.93 (0.15) — — (0.15) 16.05 32.11 0.94 0.94 0.99 44 40 .
3
Series NAV
12-31-2017 18.49 0.24 2.98 3.22 (0.34) — — (0.34) 21.37 17.54 0.69 0.68 1.23 92 3012-31-2016 17.15 0.25 1.49 1.74 (0.40) — — (0.40) 18.49 10.22 0.65 0.65 1.48 83 2812-31-2015 17.52 0.21 (0.39) (0.18) (0.19) — — (0.19) 17.15 (1.06) 0.66 0.65 1.20 780 912-31-2014 15.94 0.19 1.51 1.70 (0.12) — — (0.12) 17.52 10.66 0.66 0.65 1.12 903 29 .
3
12-31-2013 12.18 0.18 3.77 3.95 (0.19) — — (0.19) 15.94 32.47 0.69 0.69 1.28 779 40 .
3
1 Based on average daily shares outstanding.2 Total returns would have been lower had certain expenses not been reduced during the applicable periods.3 Excludes merger activity.
Global Trust
Per share operating performance for a share outstanding throughout each period Ratios and supplemental data
Income (loss) frominvestment operations Less Distributions Ratios to average net assets
Period ended
Netassetvalue,beginning
of period($)
Netinvestment
income(loss) ($)1
Net real-ized
and unrealized gain(loss) on
invest-ments ($)
Total frominvestmentoper-ations
($)
From netinvestmentincome ($)
From netrealizedgain ($)
From taxreturn of
capital ($)Total distrib
utions ($)
Net assetvalue, end
of period ($)Total return
(%)2
Expensesbefore
reductions(%)
Expensesincluding re
ductions (%)
Net investment
income(loss) (%)
Net assets,end of
period (inmillions)
Portfolioturnover
(%)
Series I
12-31-2017 18.78 0.41 3.14 3.55 (0.40) — — (0.40) 21.93 18.88 0.96 0.94 2.00 148 2812-31-2016 17.95 0.34 1.33 1.67 (0.84) — — (0.84) 18.78 9.47 0.89 .
3 0.87 .
3 1.87 142 2312-31-2015 19.58 0.35 (1.60) (1.25) (0.38) — — (0.38) 17.95 (6.42) 0.93 0.91 1.79 147 2312-31-2014 20.50 0.47 .
4 (0.99) (0.52) (0.40) — — (0.40) 19.58 (2.60) 0.95 0.94 2.27 .
4 180 17 .
5
12-31-2013 15.86 0.26 4.66 4.92 (0.28) — — (0.28) 20.50 31.09 0.96 0.95 1.45 176 14
Series II
12-31-2017 18.70 0.39 3.10 3.49 (0.36) — — (0.36) 21.83 18.63 1.16 1.14 1.80 44 2812-31-2016 17.88 0.30 1.33 1.63 (0.81) — — (0.81) 18.70 9.24 1.09 .
3 1.07 .
3 1.67 43 2312-31-2015 19.51 0.31 (1.59) (1.28) (0.35) — — (0.35) 17.88 (6.61) 1.13 1.11 1.61 46 2312-31-2014 20.43 0.41 .
4 (0.97) (0.56) (0.36) — — (0.36) 19.51 (2.80) 1.15 1.14 1.97 .
4 62 17 .
5
12-31-2013 15.81 0.22 4.65 4.87 (0.25) — — (0.25) 20.43 30.83 1.16 1.15 1.23 34 14
Series NAV
12-31-2017 18.76 0.42 3.13 3.55 (0.41) — — (0.41) 21.90 18.90 0.91 0.89 2.05 48 2812-31-2016 17.94 0.40 1.27 1.67 (0.85) — — (0.85) 18.76 9.47 0.84 .
3 0.83 .
3 2.24 42 2312-31-2015 19.56 0.36 (1.59) (1.23) (0.39) — — (0.39) 17.94 (6.34) 0.88 0.86 1.83 390 2312-31-2014 20.47 0.48 .
4 (0.98) (0.50) (0.41) — — (0.41) 19.56 (2.51) 0.90 0.89 2.31 .
4 474 17 .
5
12-31-2013 15.85 0.27 4.64 4.91 (0.29) — — (0.29) 20.47 31.03 0.91 0.90 1.50 470 14
1 Based on average daily shares outstanding.2 Total returns would have been lower had certain expenses not been reduced during the applicable periods.3 Includes reimbursement for overbilling of custody expenses in prior years of 0.04%.4 Net investment income per share and the percentage of average net assets reflect special dividends received by the portfolio, which amounted to $0.08 and 0.37% for all series,
respectively.5 Excludes merger activity.
.307

Global Bond Trust
Per share operating performance for a share outstanding throughout each period Ratios and supplemental data
Income (loss) frominvestment operations Less Distributions Ratios to average net assets
Period ended
Netassetvalue,beginning
of period($)
Netinvestment
income(loss) ($)1
Net real-ized
and unrealized gain(loss) on
invest-ments ($)
Total frominvestmentoper-ations
($)
From netinvestmentincome ($)
From netrealizedgain ($)
From taxreturn of
capital ($)Total distrib
utions ($)
Net assetvalue, end
of period ($)Total return
(%)2
Expensesbefore
reductions(%)
Expensesincluding re
ductions (%)
Net investment
income(loss) (%)
Net assets,end of
period (inmillions)
Portfolioturnover
(%)
Series I
12-31-2017 12.16 0.24 0.82 1.06 (0.29) — — (0.29) 12.93 8.75 0.83 0.82 1.87 37 4712-31-2016 11.80 0.28 0.08 0.36 — — — — 12.16 3.05 0.81 .
3 0.80 .
3 2.18 40 5712-31-2015 12.54 0.24 (0.66) (0.42) (0.32) — — (0.32) 11.80 (3.50) 0.83 0.82 1.95 42 8112-31-2014 12.39 0.31 (0.04) 0.27 (0.12) — — (0.12) 12.54 2.28 0.83 0.83 2.43 52 6912-31-2013 13.16 0.27 (0.98) (0.71) (0.06) — — (0.06) 12.39 (5.42) 0.85 0.85 2.11 60 123
Series II
12-31-2017 12.00 0.21 0.81 1.02 (0.25) — — (0.25) 12.77 8.48 1.03 1.02 1.67 80 4712-31-2016 11.66 0.25 0.09 0.34 — — — — 12.00 2.92 1.01 .
3 1.00 .
3 1.98 81 5712-31-2015 12.42 0.21 (0.66) (0.45) (0.31) — — (0.31) 11.66 (3.73) 1.03 1.02 1.75 88 8112-31-2014 12.27 0.28 (0.03) 0.25 (0.10) — — (0.10) 12.42 2.13 1.03 1.03 2.23 113 6912-31-2013 13.04 0.24 (0.98) (0.74) (0.03) — — (0.03) 12.27 (5.67) 1.05 1.05 1.91 137 123
Series NAV
12-31-2017 12.12 0.24 0.82 1.06 (0.30) — — (0.30) 12.88 8.71 0.78 0.77 1.92 472 4712-31-2016 11.75 0.28 0.09 0.37 — — — — 12.12 3.15 0.76 .
3 0.75 .
3 2.22 446 5712-31-2015 12.49 0.24 (0.66) (0.42) (0.32) — — (0.32) 11.75 (3.50) 0.78 0.77 2.00 495 8112-31-2014 12.33 0.32 (0.03) 0.29 (0.13) — — (0.13) 12.49 2.42 0.78 0.78 2.48 557 6912-31-2013 13.12 0.27 (1.00) (0.73) (0.06) — — (0.06) 12.33 (5.54) 0.80 0.80 2.17 683 123
1 Based on average daily shares outstanding.2 Total returns would have been lower had certain expenses not been reduced during the applicable periods.3 Includes reimbursement for overbilling of custody expenses in prior years of 0.02%.
Health Sciences Trust
Per share operating performance for a share outstanding throughout each period Ratios and supplemental data
Income (loss) frominvestment operations Less Distributions Ratios to average net assets
Period ended
Netassetvalue,beginning
of period($)
Netinvestment
income(loss) ($)1
Net real-ized
and unrealized gain(loss) on
invest-ments ($)
Total frominvestmentoper-ations
($)
From netinvestmentincome ($)
From netrealizedgain ($)
From taxreturn of
capital ($)Total distrib
utions ($)
Net assetvalue, end
of period ($)Total return
(%)2
Expensesbefore
reductions(%)
Expensesincluding re
ductions (%)
Net investment
income(loss) (%)
Net assets,end of
period (inmillions)
Portfolioturnover
(%)
Series I
12-31-2017 21.83 (0.08) 5.91 5.83 — (2.63) — (2.63) 25.03 27.51 1.16 1.10 (0.31) 107 3912-31-2016 31.92 (0.09) (3.02) (3.11) (0.02) (6.96) — (6.98) 21.83 (10.57) 1.10 .
3 1.04 .
3 (0.34) 94 2712-31-2015 33.55 0.03 4.30 4.33 — (5.96) — (5.96) 31.92 12.69 1.07 1.02 0.09 146 4312-31-2014 29.19 (0.16) 8.98 8.82 — (4.46) — (4.46) 33.55 31.83 1.07 1.02 (0.51) 135 5012-31-2013 20.98 (0.14) 10.72 10.58 — (2.37) — (2.37) 29.19 51.15 1.16 1.10 (0.54) 106 57
Series II
12-31-2017 20.48 (0.12) 5.53 5.41 — (2.63) — (2.63) 23.26 27.26 1.36 1.30 (0.51) 75 3912-31-2016 30.45 (0.14) (2.87) (3.01) — (6.96) — (6.96) 20.48 (10.77) 1.30 .
3 1.24 .
3 (0.54) 71 2712-31-2015 32.30 (0.03) 4.14 4.11 — (5.96) — (5.96) 30.45 12.49 1.27 1.22 (0.10) 102 4312-31-2014 28.30 (0.22) 8.68 8.46 — (4.46) — (4.46) 32.30 31.54 1.27 1.22 (0.71) 103 5012-31-2013 20.43 (0.19) 10.43 10.24 — (2.37) — (2.37) 28.30 50.86 1.36 1.30 (0.74) 91 57
Series NAV
12-31-2017 22.09 (0.07) 5.98 5.91 — (2.63) — (2.63) 25.37 27.61 1.11 1.05 (0.26) 108 3912-31-2016 32.20 (0.08) (3.04) (3.12) (0.03) (6.96) — (6.99) 22.09 (10.54) 1.06 .
3 0.99 .
3 (0.29) 96 2712-31-2015 33.78 0.05 4.33 4.38 — (5.96) — (5.96) 32.20 12.76 1.02 0.97 0.13 118 4312-31-2014 29.36 (0.15) 9.03 8.88 — (4.46) — (4.46) 33.78 31.85 1.02 0.97 (0.46) 101 5012-31-2013 21.08 (0.13) 10.78 10.65 — (2.37) — (2.37) 29.36 51.24 1.11 1.05 (0.49) 73 57
1 Based on average daily shares outstanding.2 Total returns would have been lower had certain expenses not been reduced during the applicable periods.3 Includes reimbursement for overbilling of custody expenses in prior years of 0.05%.
.308

High Yield Trust
Per share operating performance for a share outstanding throughout each period Ratios and supplemental data
Income (loss) frominvestment operations Less Distributions Ratios to average net assets
Period ended
Netassetvalue,beginning
of period($)
Netinvestment
income(loss) ($)1
Net real-ized
and unrealized gain(loss) on
invest-ments ($)
Total frominvestmentoper-ations
($)
From netinvestmentincome ($)
From netrealizedgain ($)
From taxreturn of
capital ($)Total distrib
utions ($)
Net assetvalue, end
of period ($)Total return
(%)2
Expensesbefore
reductions(%)
Expensesincluding re
ductions (%)
Net investment
income(loss) (%)
Net assets,end of
period (inmillions)
Portfolioturnover
(%)
Series I
12-31-2017 5.23 0.30 0.09 0.39 (0.30) — — (0.30) 5.32 7.50 0.85 0.84 5.62 81 6112-31-2016 4.81 0.34 0.45 0.79 (0.37) — — (0.37) 5.23 16.26 0.75 .
3 0.74 .
3 6.74 88 6112-31-2015 5.70 0.37 (0.84) (0.47) (0.42) — — (0.42) 4.81 (8.32) 0.80 0.79 6.51 83 7412-31-2014 6.09 0.39 (0.36) 0.03 (0.42) — — (0.42) 5.70 0.28 0.78 0.77 6.33 105 7212-31-2013 6.01 0.40 0.10 0.50 (0.42) — — (0.42) 6.09 8.35 0.79 0.78 6.44 122 99
Series II
12-31-2017 5.34 0.30 0.08 0.38 (0.29) — — (0.29) 5.43 7.13 1.05 1.04 5.42 62 6112-31-2016 4.91 0.34 0.45 0.79 (0.36) — — (0.36) 5.34 16.16 0.95 .
3 0.94 .
3 6.54 65 6112-31-2015 5.80 0.36 (0.84) (0.48) (0.41) — — (0.41) 4.91 (8.55) 1.00 0.99 6.32 69 7412-31-2014 6.19 0.39 (0.37) 0.02 (0.41) — — (0.41) 5.80 0.08 0.98 0.97 6.12 90 7212-31-2013 6.11 0.40 0.09 0.49 (0.41) — — (0.41) 6.19 8.01 0.99 0.98 6.24 116 99
Series NAV
12-31-2017 5.16 0.30 0.08 0.38 (0.30) — — (0.30) 5.24 7.46 0.80 0.79 5.67 88 6112-31-2016 4.75 0.34 0.44 0.78 (0.37) — — (0.37) 5.16 16.56 0.70 .
3 0.70 .
3 6.77 97 6112-31-2015 5.63 0.36 (0.81) (0.45) (0.43) — — (0.43) 4.75 (8.38) 0.75 0.74 6.56 81 7412-31-2014 6.02 0.39 (0.36) 0.03 (0.42) — — (0.42) 5.63 0.33 0.73 0.72 6.38 90 7212-31-2013 5.95 0.40 0.09 0.49 (0.42) — — (0.42) 6.02 8.31 0.74 0.73 6.46 97 99
1 Based on average daily shares outstanding.2 Total returns would have been lower had certain expenses not been reduced during the applicable periods.3 Includes reimbursement for overbilling of custody expenses in prior years of 0.06%.
International Equity Index Trust
Per share operating performance for a share outstanding throughout each period Ratios and supplemental data
Income (loss) frominvestment operations Less Distributions Ratios to average net assets
Period ended
Netassetvalue,beginning
of period($)
Netinvestment
income(loss) ($)1
Net real-ized
and unrealized gain(loss) on
invest-ments ($)
Total frominvestmentoper-ations
($)
From netinvestmentincome ($)
From netrealizedgain ($)
From taxreturn of
capital ($)Total distrib
utions ($)
Net assetvalue, end
of period ($)Total return
(%)2
Expensesbefore
reductions(%)
Expensesincluding re
ductions (%)
Net investment
income(loss) (%)
Net assets,end of
period (inmillions)
Portfolioturnover
(%)
Series I
12-31-2017 14.79 0.40 3.63 4.03 (0.38) — — (0.38) 18.44 27.30 0.68 0.39 2.33 399 312-31-2016 14.54 0.39 0.25 0.64 (0.39) — — (0.39) 14.79 4.45 0.65 .
3 0.39 .
3 2.65 277 512-31-2015 15.85 0.39 (1.32) (0.93) (0.38) — — (0.38) 14.54 (5.91) 0.66 0.39 2.42 263 412-31-2014 17.14 0.52 .
4 (1.28) (0.76) (0.53) — — (0.53) 15.85 (4.61) 0.62 0.39 3.03 .
4 277 312-31-2013 15.32 0.42 1.80 2.22 (0.40) — — (0.40) 17.14 14.55 0.61 0.39 2.59 293 3
Series II
12-31-2017 14.81 0.36 3.63 3.99 (0.34) — — (0.34) 18.46 27.04 0.88 0.59 2.14 18 312-31-2016 14.56 0.36 0.25 0.61 (0.36) — — (0.36) 14.81 4.24 0.85 .
3 0.59 .
3 2.47 14 512-31-2015 15.87 0.36 (1.32) (0.96) (0.35) — — (0.35) 14.56 (6.11) 0.86 0.59 2.25 16 412-31-2014 17.16 0.50 .
4 (1.30) (0.80) (0.49) — — (0.49) 15.87 (4.80) 0.82 0.59 2.88 .
4 21 312-31-2013 15.34 0.39 1.80 2.19 (0.37) — — (0.37) 17.16 14.32 0.81 0.59 2.43 27 3
Series NAV
12-31-2017 14.78 0.41 3.63 4.04 (0.38) — — (0.38) 18.44 27.45 0.63 0.34 2.39 377 312-31-2016 14.54 0.39 0.25 0.64 (0.40) — — (0.40) 14.78 4.43 0.60 .
3 0.34 .
3 2.70 298 512-31-2015 15.84 0.39 (1.30) (0.91) (0.39) — — (0.39) 14.54 (5.80) 0.61 0.34 2.46 293 412-31-2014 17.13 0.54 .
4 (1.29) (0.75) (0.54) — — (0.54) 15.84 (4.57) 0.57 0.34 3.13 .
4 322 312-31-2013 15.32 0.43 1.79 2.22 (0.41) — — (0.41) 17.13 14.54 0.56 0.34 2.65 373 3
1 Based on average daily shares outstanding.2 Total returns would have been lower had certain expenses not been reduced during the applicable periods.3 Includes reimbursement for overbilling of custody expenses in prior years of 0.04%.4 Net investment income per share and the percentage of average net assets reflect special dividends received by the portfolio, which amounted to $0.03 and 0.33% for all series,
respectively.
.309

International Growth Stock Trust
Per share operating performance for a share outstanding throughout each period Ratios and supplemental data
Income (loss) frominvestment operations Less Distributions Ratios to average net assets
Period ended
Netassetvalue,beginning
of period($)
Netinvestment
income(loss) ($)1
Net real-ized
and unrealized gain(loss) on
invest-ments ($)
Total frominvestmentoper-ations
($)
From netinvestmentincome ($)
From netrealizedgain ($)
From taxreturn of
capital ($)Total distrib
utions ($)
Net assetvalue, end
of period ($)Total return
(%)2
Expensesbefore
reductions(%)
Expensesincluding re
ductions (%)
Net investment
income(loss) (%)
Net assets,end of
period (inmillions)
Portfolioturnover
(%)
Series I
12-31-2017 15.43 0.24 3.13 3.37 (0.25) — — (0.25) 18.55 21.86 0.93 0.92 1.35 6 2812-31-2016 15.91 0.25 (0.46) (0.21) (0.27) — — (0.27) 15.43 (1.31) 0.91 0.91 1.57 4 1412-31-2015 16.58 0.23 (0.61) (0.38) (0.29) — — (0.29) 15.91 (2.27) 0.92 0.91 1.36 3 2212-31-2014 16.85 0.28 (0.23) 0.05 (0.32) — — (0.32) 16.58 0.20 0.97 0.97 1.65 2 2312-31-2013 14.31 0.22 2.51 2.73 (0.19) — — (0.19) 16.85 19.11 0.97 0.97 1.40 3 29
Series II
12-31-2017 15.44 0.20 3.13 3.33 (0.21) — — (0.21) 18.56 21.63 1.13 1.12 1.17 20 2812-31-2016 15.91 0.22 (0.45) (0.23) (0.24) — — (0.24) 15.44 (1.45) 1.11 1.10 1.38 18 1412-31-2015 16.60 0.21 (0.63) (0.42) (0.27) — — (0.27) 15.91 (2.53) 1.12 1.11 1.26 20 2212-31-2014 16.87 0.25 (0.24) 0.01 (0.28) — — (0.28) 16.60 — 1.17 1.17 1.44 21 2312-31-2013 14.33 0.19 2.51 2.70 (0.16) — — (0.16) 16.87 18.87 1.17 1.17 1.23 23 29
Series NAV
12-31-2017 15.44 0.25 3.12 3.37 (0.25) — — (0.25) 18.56 21.90 0.88 0.87 1.42 370 2812-31-2016 15.91 0.25 (0.44) (0.19) (0.28) — — (0.28) 15.44 (1.20) 0.86 0.85 1.61 351 1412-31-2015 16.58 0.25 (0.62) (0.37) (0.30) — — (0.30) 15.91 (2.24) 0.87 0.86 1.52 395 2212-31-2014 16.86 0.29 (0.25) 0.04 (0.32) — — (0.32) 16.58 0.19 0.92 0.92 1.70 479 2312-31-2013 14.31 0.23 2.51 2.74 (0.19) — — (0.19) 16.86 19.19 0.92 0.92 1.47 550 29
1 Based on average daily shares outstanding.2 Total returns would have been lower had certain expenses not been reduced during the applicable periods.
International Small Company Trust
Per share operating performance for a share outstanding throughout each period Ratios and supplemental data
Income (loss) frominvestment operations Less Distributions Ratios to average net assets
Period ended
Netassetvalue,beginning
of period($)
Netinvestment
income(loss) ($)1
Net real-ized
and unrealized gain(loss) on
invest-ments ($)
Total frominvestmentoper-ations
($)
From netinvestmentincome ($)
From netrealizedgain ($)
From taxreturn of
capital ($)Total distrib
utions ($)
Net assetvalue, end
of period ($)Total return
(%)2
Expensesbefore
reductions(%)
Expensesincluding re
ductions (%)
Net investment
income(loss) (%)
Net assets,end of
period (inmillions)
Portfolioturnover
(%)
Series I
12-31-2017 12.46 0.20 3.50 3.70 (0.21) — — (0.21) 15.95 29.46 1.18 1.17 1.42 38 1412-31-2016 12.11 0.24 0.35 0.59 (0.24) — — (0.24) 12.46 4.90 0.91 .
3 0.90 .
3 1.96 32 1212-31-2015 11.58 0.17 0.58 0.75 (0.22) — — (0.22) 12.11 6.54 1.22 1.22 1.40 34 1712-31-2014 12.61 0.18 (1.04) (0.86) (0.17) — — (0.17) 11.58 (6.89) 1.19 1.18 1.46 37 2012-31-2013 10.15 0.18 2.49 2.67 (0.21) — — (0.21) 12.61 26.34 1.17 1.17 1.61 46 10
Series II
12-31-2017 12.45 0.18 3.48 3.66 (0.18) — — (0.18) 15.93 29.17 1.38 1.37 1.22 21 1412-31-2016 12.10 0.22 0.35 0.57 (0.22) — — (0.22) 12.45 4.70 1.12 .
3 1.11 .
3 1.79 18 1212-31-2015 11.57 0.15 0.59 0.74 (0.21) — — (0.21) 12.10 6.39 1.42 1.42 1.21 20 1712-31-2014 12.60 0.16 (1.04) (0.88) (0.15) — — (0.15) 11.57 (7.10) 1.39 1.38 1.26 21 2012-31-2013 10.15 0.16 2.48 2.64 (0.19) — — (0.19) 12.60 26.02 1.37 1.37 1.42 28 10
Series NAV
12-31-2017 12.46 0.21 3.50 3.71 (0.21) — — (0.21) 15.96 29.60 1.13 1.12 1.42 93 1412-31-2016 12.11 0.24 0.36 0.60 (0.25) — — (0.25) 12.46 4.95 0.87 .
3 0.86 .
3 2.00 58 1212-31-2015 11.57 0.18 0.59 0.77 (0.23) — — (0.23) 12.11 6.68 1.17 1.17 1.43 53 1712-31-2014 12.60 0.18 (1.03) (0.85) (0.18) — — (0.18) 11.57 (6.85) 1.14 1.13 1.44 46 2012-31-2013 10.15 0.19 2.47 2.66 (0.21) — — (0.21) 12.60 26.29 1.12 1.12 1.65 44 10
1 Based on average daily shares outstanding.2 Total returns would have been lower had certain expenses not been reduced during the applicable periods.3 Includes reimbursement for overbilling of custody expenses in prior years of 0.33%.
.310
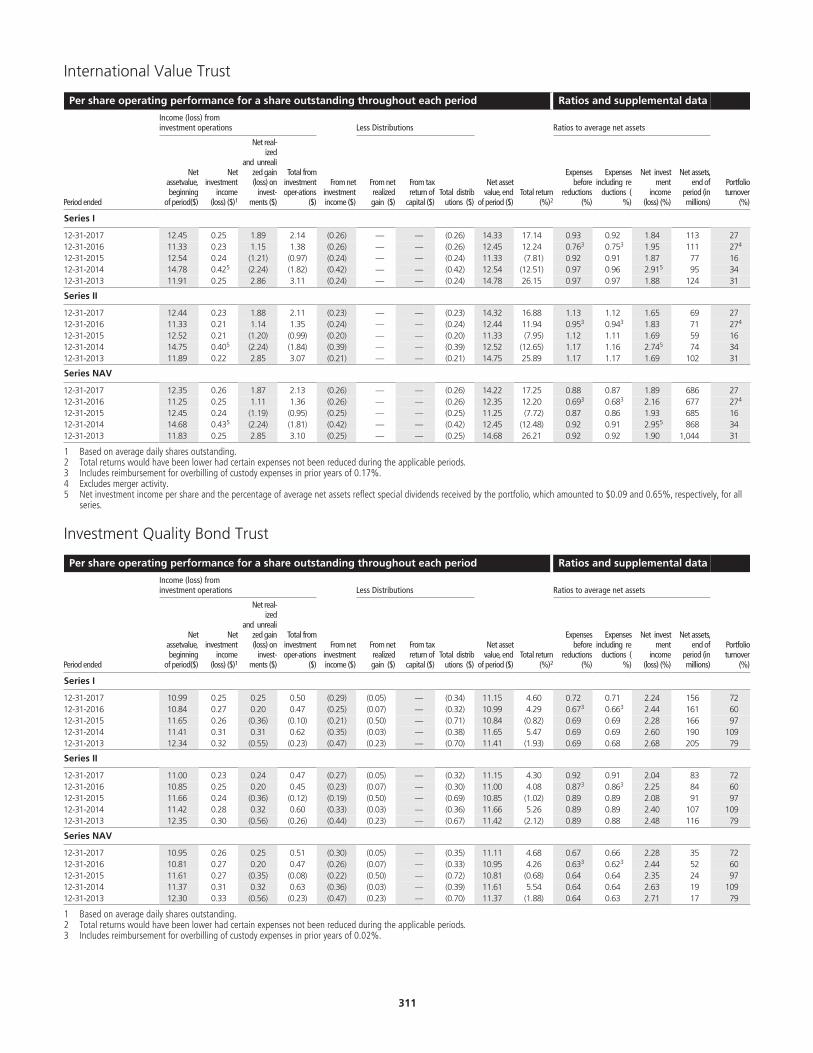
International Value Trust
Per share operating performance for a share outstanding throughout each period Ratios and supplemental data
Income (loss) frominvestment operations Less Distributions Ratios to average net assets
Period ended
Netassetvalue,beginning
of period($)
Netinvestment
income(loss) ($)1
Net real-ized
and unrealized gain(loss) on
invest-ments ($)
Total frominvestmentoper-ations
($)
From netinvestmentincome ($)
From netrealizedgain ($)
From taxreturn of
capital ($)Total distrib
utions ($)
Net assetvalue, end
of period ($)Total return
(%)2
Expensesbefore
reductions(%)
Expensesincluding re
ductions (%)
Net investment
income(loss) (%)
Net assets,end of
period (inmillions)
Portfolioturnover
(%)
Series I
12-31-2017 12.45 0.25 1.89 2.14 (0.26) — — (0.26) 14.33 17.14 0.93 0.92 1.84 113 2712-31-2016 11.33 0.23 1.15 1.38 (0.26) — — (0.26) 12.45 12.24 0.76 .
3 0.75 .
3 1.95 111 27 .
4
12-31-2015 12.54 0.24 (1.21) (0.97) (0.24) — — (0.24) 11.33 (7.81) 0.92 0.91 1.87 77 1612-31-2014 14.78 0.42 .
5 (2.24) (1.82) (0.42) — — (0.42) 12.54 (12.51) 0.97 0.96 2.91 .
5 95 3412-31-2013 11.91 0.25 2.86 3.11 (0.24) — — (0.24) 14.78 26.15 0.97 0.97 1.88 124 31
Series II
12-31-2017 12.44 0.23 1.88 2.11 (0.23) — — (0.23) 14.32 16.88 1.13 1.12 1.65 69 2712-31-2016 11.33 0.21 1.14 1.35 (0.24) — — (0.24) 12.44 11.94 0.95 .
3 0.94 .
3 1.83 71 27 .
4
12-31-2015 12.52 0.21 (1.20) (0.99) (0.20) — — (0.20) 11.33 (7.95) 1.12 1.11 1.69 59 1612-31-2014 14.75 0.40 .
5 (2.24) (1.84) (0.39) — — (0.39) 12.52 (12.65) 1.17 1.16 2.74 .
5 74 3412-31-2013 11.89 0.22 2.85 3.07 (0.21) — — (0.21) 14.75 25.89 1.17 1.17 1.69 102 31
Series NAV
12-31-2017 12.35 0.26 1.87 2.13 (0.26) — — (0.26) 14.22 17.25 0.88 0.87 1.89 686 2712-31-2016 11.25 0.25 1.11 1.36 (0.26) — — (0.26) 12.35 12.20 0.69 .
3 0.68 .
3 2.16 677 27 .
4
12-31-2015 12.45 0.24 (1.19) (0.95) (0.25) — — (0.25) 11.25 (7.72) 0.87 0.86 1.93 685 1612-31-2014 14.68 0.43 .
5 (2.24) (1.81) (0.42) — — (0.42) 12.45 (12.48) 0.92 0.91 2.95 .
5 868 3412-31-2013 11.83 0.25 2.85 3.10 (0.25) — — (0.25) 14.68 26.21 0.92 0.92 1.90 1,044 31
1 Based on average daily shares outstanding.2 Total returns would have been lower had certain expenses not been reduced during the applicable periods.3 Includes reimbursement for overbilling of custody expenses in prior years of 0.17%.4 Excludes merger activity.5 Net investment income per share and the percentage of average net assets reflect special dividends received by the portfolio, which amounted to $0.09 and 0.65%, respectively, for all
series.
Investment Quality Bond Trust
Per share operating performance for a share outstanding throughout each period Ratios and supplemental data
Income (loss) frominvestment operations Less Distributions Ratios to average net assets
Period ended
Netassetvalue,beginning
of period($)
Netinvestment
income(loss) ($)1
Net real-ized
and unrealized gain(loss) on
invest-ments ($)
Total frominvestmentoper-ations
($)
From netinvestmentincome ($)
From netrealizedgain ($)
From taxreturn of
capital ($)Total distrib
utions ($)
Net assetvalue, end
of period ($)Total return
(%)2
Expensesbefore
reductions(%)
Expensesincluding re
ductions (%)
Net investment
income(loss) (%)
Net assets,end of
period (inmillions)
Portfolioturnover
(%)
Series I
12-31-2017 10.99 0.25 0.25 0.50 (0.29) (0.05) — (0.34) 11.15 4.60 0.72 0.71 2.24 156 7212-31-2016 10.84 0.27 0.20 0.47 (0.25) (0.07) — (0.32) 10.99 4.29 0.67 .
3 0.66 .
3 2.44 161 6012-31-2015 11.65 0.26 (0.36) (0.10) (0.21) (0.50) — (0.71) 10.84 (0.82) 0.69 0.69 2.28 166 9712-31-2014 11.41 0.31 0.31 0.62 (0.35) (0.03) — (0.38) 11.65 5.47 0.69 0.69 2.60 190 10912-31-2013 12.34 0.32 (0.55) (0.23) (0.47) (0.23) — (0.70) 11.41 (1.93) 0.69 0.68 2.68 205 79
Series II
12-31-2017 11.00 0.23 0.24 0.47 (0.27) (0.05) — (0.32) 11.15 4.30 0.92 0.91 2.04 83 7212-31-2016 10.85 0.25 0.20 0.45 (0.23) (0.07) — (0.30) 11.00 4.08 0.87 .
3 0.86 .
3 2.25 84 6012-31-2015 11.66 0.24 (0.36) (0.12) (0.19) (0.50) — (0.69) 10.85 (1.02) 0.89 0.89 2.08 91 9712-31-2014 11.42 0.28 0.32 0.60 (0.33) (0.03) — (0.36) 11.66 5.26 0.89 0.89 2.40 107 10912-31-2013 12.35 0.30 (0.56) (0.26) (0.44) (0.23) — (0.67) 11.42 (2.12) 0.89 0.88 2.48 116 79
Series NAV
12-31-2017 10.95 0.26 0.25 0.51 (0.30) (0.05) — (0.35) 11.11 4.68 0.67 0.66 2.28 35 7212-31-2016 10.81 0.27 0.20 0.47 (0.26) (0.07) — (0.33) 10.95 4.26 0.63 .
3 0.62 .
3 2.44 52 6012-31-2015 11.61 0.27 (0.35) (0.08) (0.22) (0.50) — (0.72) 10.81 (0.68) 0.64 0.64 2.35 24 9712-31-2014 11.37 0.31 0.32 0.63 (0.36) (0.03) — (0.39) 11.61 5.54 0.64 0.64 2.63 19 10912-31-2013 12.30 0.33 (0.56) (0.23) (0.47) (0.23) — (0.70) 11.37 (1.88) 0.64 0.63 2.71 17 79
1 Based on average daily shares outstanding.2 Total returns would have been lower had certain expenses not been reduced during the applicable periods.3 Includes reimbursement for overbilling of custody expenses in prior years of 0.02%.
.311
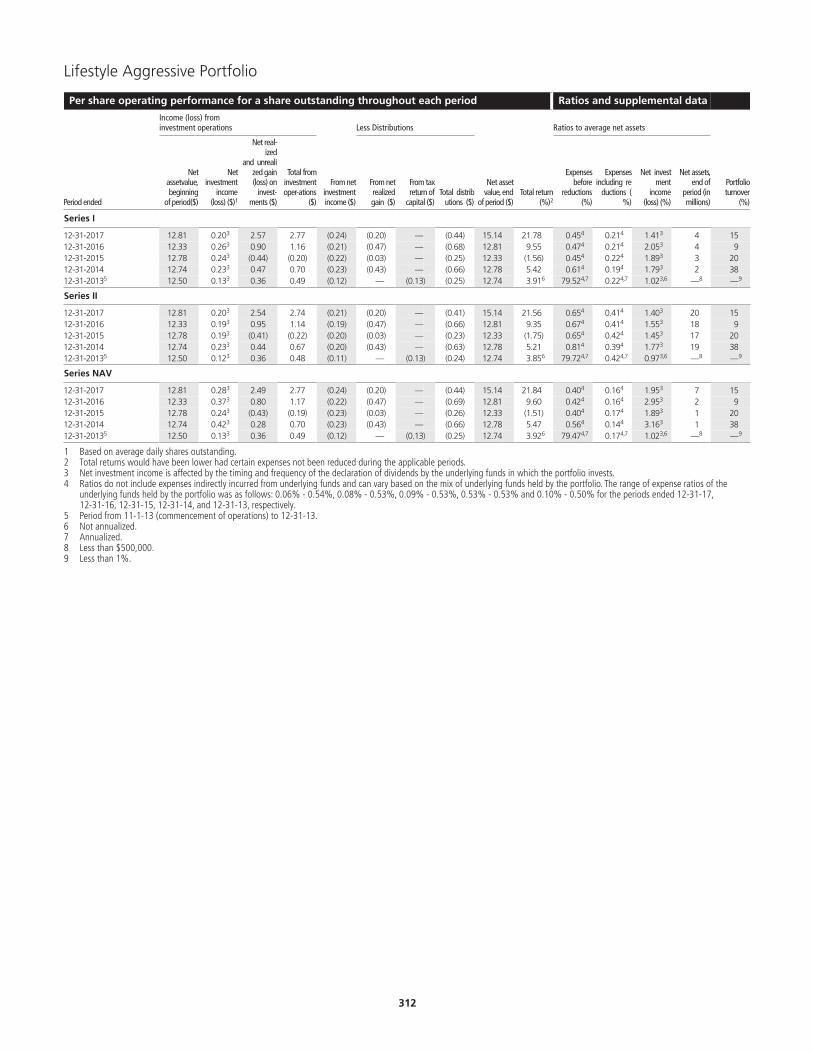
Lifestyle Aggressive Portfolio
Per share operating performance for a share outstanding throughout each period Ratios and supplemental data
Income (loss) frominvestment operations Less Distributions Ratios to average net assets
Period ended
Netassetvalue,beginning
of period($)
Netinvestment
income(loss) ($)1
Net real-ized
and unrealized gain(loss) on
invest-ments ($)
Total frominvestmentoper-ations
($)
From netinvestmentincome ($)
From netrealizedgain ($)
From taxreturn of
capital ($)Total distrib
utions ($)
Net assetvalue, end
of period ($)Total return
(%)2
Expensesbefore
reductions(%)
Expensesincluding re
ductions (%)
Net investment
income(loss) (%)
Net assets,end of
period (inmillions)
Portfolioturnover
(%)
Series I
12-31-2017 12.81 0.20 .
3 2.57 2.77 (0.24) (0.20) — (0.44) 15.14 21.78 0.45 .
4 0.21 .
4 1.41 .
3 4 1512-31-2016 12.33 0.26 .
3 0.90 1.16 (0.21) (0.47) — (0.68) 12.81 9.55 0.47 .
4 0.21 .
4 2.05 .
3 4 912-31-2015 12.78 0.24 .
3 (0.44) (0.20) (0.22) (0.03) — (0.25) 12.33 (1.56) 0.45 .
4 0.22 .
4 1.89 .
3 3 2012-31-2014 12.74 0.23 .
3 0.47 0.70 (0.23) (0.43) — (0.66) 12.78 5.42 0.61 .
4 0.19 .
4 1.79 .
3 2 3812-31-20135 12.50 0.13 .
3 0.36 0.49 (0.12) — (0.13) (0.25) 12.74 3.91 .
6 79.52 .
4,7 0.22 .
4,7 1.02 .
3,6 — .
8 — .
9
Series II
12-31-2017 12.81 0.20 .
3 2.54 2.74 (0.21) (0.20) — (0.41) 15.14 21.56 0.65 .
4 0.41 .
4 1.40 .
3 20 1512-31-2016 12.33 0.19 .
3 0.95 1.14 (0.19) (0.47) — (0.66) 12.81 9.35 0.67 .
4 0.41 .
4 1.55 .
3 18 912-31-2015 12.78 0.19 .
3 (0.41) (0.22) (0.20) (0.03) — (0.23) 12.33 (1.75) 0.65 .
4 0.42 .
4 1.45 .
3 17 2012-31-2014 12.74 0.23 .
3 0.44 0.67 (0.20) (0.43) — (0.63) 12.78 5.21 0.81 .
4 0.39 .
4 1.77 .
3 19 3812-31-20135 12.50 0.12 .
3 0.36 0.48 (0.11) — (0.13) (0.24) 12.74 3.85 .
6 79.72 .
4,7 0.42 .
4,7 0.97 .
3,6 — .
8 — .
9
Series NAV
12-31-2017 12.81 0.28 .
3 2.49 2.77 (0.24) (0.20) — (0.44) 15.14 21.84 0.40 .
4 0.16 .
4 1.95 .
3 7 1512-31-2016 12.33 0.37 .
3 0.80 1.17 (0.22) (0.47) — (0.69) 12.81 9.60 0.42 .
4 0.16 .
4 2.95 .
3 2 912-31-2015 12.78 0.24 .
3 (0.43) (0.19) (0.23) (0.03) — (0.26) 12.33 (1.51) 0.40 .
4 0.17 .
4 1.89 .
3 1 2012-31-2014 12.74 0.42 .
3 0.28 0.70 (0.23) (0.43) — (0.66) 12.78 5.47 0.56 .
4 0.14 .
4 3.16 .
3 1 3812-31-20135 12.50 0.13 .
3 0.36 0.49 (0.12) — (0.13) (0.25) 12.74 3.92 .
6 79.47 .
4,7 0.17 .
4,7 1.02 .
3,6 — .
8 — .
9
1 Based on average daily shares outstanding.2 Total returns would have been lower had certain expenses not been reduced during the applicable periods.3 Net investment income is affected by the timing and frequency of the declaration of dividends by the underlying funds in which the portfolio invests.4 Ratios do not include expenses indirectly incurred from underlying funds and can vary based on the mix of underlying funds held by the portfolio. The range of expense ratios of the
underlying funds held by the portfolio was as follows: 0.06% - 0.54%, 0.08% - 0.53%, 0.09% - 0.53%, 0.53% - 0.53% and 0.10% - 0.50% for the periods ended 12-31-17,12-31-16, 12-31-15, 12-31-14, and 12-31-13, respectively.
5 Period from 11-1-13 (commencement of operations) to 12-31-13.6 Not annualized.7 Annualized.8 Less than $500,000.9 Less than 1%.
.312
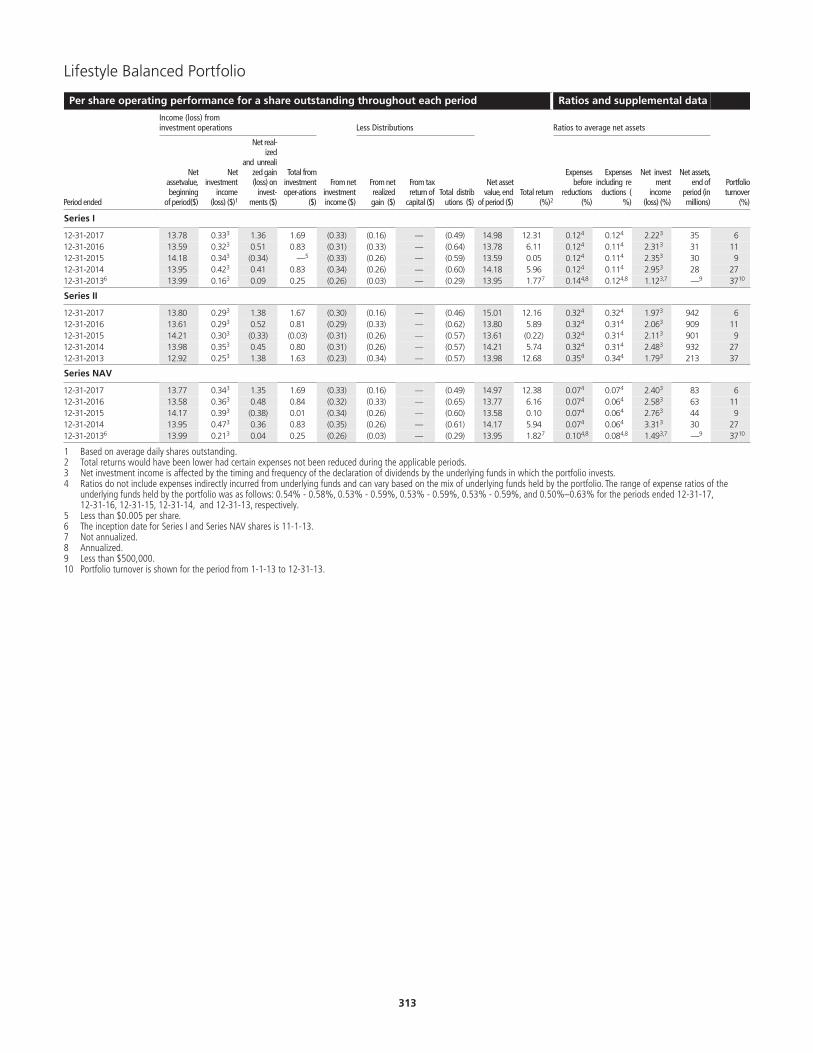
Lifestyle Balanced Portfolio
Per share operating performance for a share outstanding throughout each period Ratios and supplemental data
Income (loss) frominvestment operations Less Distributions Ratios to average net assets
Period ended
Netassetvalue,beginning
of period($)
Netinvestment
income(loss) ($)1
Net real-ized
and unrealized gain(loss) on
invest-ments ($)
Total frominvestmentoper-ations
($)
From netinvestmentincome ($)
From netrealizedgain ($)
From taxreturn of
capital ($)Total distrib
utions ($)
Net assetvalue, end
of period ($)Total return
(%)2
Expensesbefore
reductions(%)
Expensesincluding re
ductions (%)
Net investment
income(loss) (%)
Net assets,end of
period (inmillions)
Portfolioturnover
(%)
Series I
12-31-2017 13.78 0.33 .
3 1.36 1.69 (0.33) (0.16) — (0.49) 14.98 12.31 0.12 .
4 0.12 .
4 2.22 .
3 35 612-31-2016 13.59 0.32 .
3 0.51 0.83 (0.31) (0.33) — (0.64) 13.78 6.11 0.12 .
4 0.11 .
4 2.31 .
3 31 1112-31-2015 14.18 0.34 .
3 (0.34) — .
5 (0.33) (0.26) — (0.59) 13.59 0.05 0.12 .
4 0.11 .
4 2.35 .
3 30 912-31-2014 13.95 0.42 .
3 0.41 0.83 (0.34) (0.26) — (0.60) 14.18 5.96 0.12 .
4 0.11 .
4 2.95 .
3 28 2712-31-20136 13.99 0.16 .
3 0.09 0.25 (0.26) (0.03) — (0.29) 13.95 1.77 .
7 0.14 .
4,8 0.12 .
4,8 1.12 .
3,7 — .
9 37 .
10
Series II
12-31-2017 13.80 0.29 .
3 1.38 1.67 (0.30) (0.16) — (0.46) 15.01 12.16 0.32 .
4 0.32 .
4 1.97 .
3 942 612-31-2016 13.61 0.29 .
3 0.52 0.81 (0.29) (0.33) — (0.62) 13.80 5.89 0.32 .
4 0.31 .
4 2.06 .
3 909 1112-31-2015 14.21 0.30 .
3 (0.33) (0.03) (0.31) (0.26) — (0.57) 13.61 (0.22) 0.32 .
4 0.31 .
4 2.11 .
3 901 912-31-2014 13.98 0.35 .
3 0.45 0.80 (0.31) (0.26) — (0.57) 14.21 5.74 0.32 .
4 0.31 .
4 2.48 .
3 932 2712-31-2013 12.92 0.25 .
3 1.38 1.63 (0.23) (0.34) — (0.57) 13.98 12.68 0.35 .
4 0.34 .
4 1.79 .
3 213 37
Series NAV
12-31-2017 13.77 0.34 .
3 1.35 1.69 (0.33) (0.16) — (0.49) 14.97 12.38 0.07 .
4 0.07 .
4 2.40 .
3 83 612-31-2016 13.58 0.36 .
3 0.48 0.84 (0.32) (0.33) — (0.65) 13.77 6.16 0.07 .
4 0.06 .
4 2.58 .
3 63 1112-31-2015 14.17 0.39 .
3 (0.38) 0.01 (0.34) (0.26) — (0.60) 13.58 0.10 0.07 .
4 0.06 .
4 2.76 .
3 44 912-31-2014 13.95 0.47 .
3 0.36 0.83 (0.35) (0.26) — (0.61) 14.17 5.94 0.07 .
4 0.06 .
4 3.31 .
3 30 2712-31-20136 13.99 0.21 .
3 0.04 0.25 (0.26) (0.03) — (0.29) 13.95 1.82 .
7 0.10 .
4,8 0.08 .
4,8 1.49 .
3,7 — .
9 37 .
10
1 Based on average daily shares outstanding.2 Total returns would have been lower had certain expenses not been reduced during the applicable periods.3 Net investment income is affected by the timing and frequency of the declaration of dividends by the underlying funds in which the portfolio invests.4 Ratios do not include expenses indirectly incurred from underlying funds and can vary based on the mix of underlying funds held by the portfolio. The range of expense ratios of the
underlying funds held by the portfolio was as follows: 0.54% - 0.58%, 0.53% - 0.59%, 0.53% - 0.59%, 0.53% - 0.59%, and 0.50%–0.63% for the periods ended 12-31-17,12-31-16, 12-31-15, 12-31-14, and 12-31-13, respectively.
5 Less than $0.005 per share.6 The inception date for Series I and Series NAV shares is 11-1-13.7 Not annualized.8 Annualized.9 Less than $500,000.10 Portfolio turnover is shown for the period from 1-1-13 to 12-31-13.
.313

Lifestyle Conservative Portfolio
Per share operating performance for a share outstanding throughout each period Ratios and supplemental data
Income (loss) frominvestment operations Less Distributions Ratios to average net assets
Period ended
Netassetvalue,beginning
of period($)
Netinvestment
income(loss) ($)1
Net real-ized
and unrealized gain(loss) on
invest-ments ($)
Total frominvestmentoper-ations
($)
From netinvestmentincome ($)
From netrealizedgain ($)
From taxreturn of
capital ($)Total distrib
utions ($)
Net assetvalue, end
of period ($)Total return
(%)2
Expensesbefore
reductions(%)
Expensesincluding re
ductions (%)
Net investment
income(loss) (%)
Net assets,end of
period (inmillions)
Portfolioturnover
(%)
Series I
12-31-2017 12.91 0.34 .
3 0.56 0.90 (0.34) (0.08) — (0.42) 13.39 6.96 0.16 .
4 0.13 .
4 2.69 .
3 12 1212-31-2016 12.85 0.35 .
3 0.21 0.56 (0.36) (0.14) — (0.50) 12.91 4.39 0.14 .
4 0.13 .
4 2.65 .
3 9 1912-31-2015 13.33 0.39 .
3 (0.37) 0.02 (0.36) (0.14) — (0.50) 12.85 0.17 0.14 .
4 0.13 .
4 2.87 .
3 8 1712-31-2014 13.18 0.53 .
3 0.20 0.73 (0.38) (0.20) — (0.58) 13.33 5.55 0.15 .
4 0.13 .
4 3.96 .
3 8 5612-31-20135 13.48 0.23 .
3 (0.20) 0.03 (0.28) (0.05) — (0.33) 13.18 0.20 .
6 0.27 .
4,7 0.12 .
4,7 1.74 .
3,6 — .
8 22 .
9
Series II
12-31-2017 12.93 0.30 .
3 0.58 0.88 (0.32) (0.08) — (0.40) 13.41 6.74 0.36 .
4 0.33 .
4 2.21 .
3 166 1212-31-2016 12.87 0.31 .
3 0.23 0.54 (0.34) (0.14) — (0.48) 12.93 4.17 0.34 .
4 0.33 .
4 2.37 .
3 178 1912-31-2015 13.35 0.33 .
3 (0.33) — .
10 (0.34) (0.14) — (0.48) 12.87 (0.03) 0.34 .
4 0.33 .
4 2.44 .
3 181 1712-31-2014 13.19 0.40 .
3 0.31 0.71 (0.35) (0.20) — (0.55) 13.35 5.41 0.35 .
4 0.33 .
4 2.99 .
3 188 5612-31-2013 13.15 0.23 .
3 0.28 0.51 (0.25) (0.22) — (0.47) 13.19 3.86 0.43 .
4 0.38 .
4 1.75 .
3 50 22
Series NAV
12-31-2017 12.90 0.35 .
3 0.56 0.91 (0.35) (0.08) — (0.43) 13.38 7.01 0.11 .
4 0.08 .
4 2.75 .
3 4 1212-31-2016 12.85 0.61 .
3 (0.05) 0.56 (0.37) (0.14) — (0.51) 12.90 4.36 0.10 .
4 0.08 .
4 4.67 .
3 3 1912-31-2015 13.33 0.46 .
3 (0.43) 0.03 (0.37) (0.14) — (0.51) 12.85 0.22 0.09 .
4 0.08 .
4 3.44 .
3 1 1712-31-2014 13.17 0.60 .
3 0.15 0.75 (0.39) (0.20) — (0.59) 13.33 5.68 0.10 .
4 0.08 .
4 4.44 .
3 — .
8 5612-31-20135 13.48 0.23 .
3 (0.21) 0.02 (0.28) (0.05) — (0.33) 13.17 0.18 .
6 0.22 .
4,7 0.08 .
4,7 1.74 .
3,6 — .
8 22 .
9
1 Based on average daily shares outstanding.2 Total returns would have been lower had certain expenses not been reduced during the applicable periods.3 Net investment income is affected by the timing and frequency of the declaration of dividends by the underlying funds in which the portfolio invests.4 Ratios do not include expenses indirectly incurred from underlying funds and can vary based on the mix of underlying funds held by the portfolio. The range of expense ratios of the
underlying funds held by the portfolio was as follows: 0.54% - 0.58%, 0.53% - 0.59%, 0.53% - 0.59%, 0.53% - 0.59%, and 0.50%–0.63% for the periods ended 12-31-17,12-31-1654, and 12-31-13, respectively.
5 The inception date for Series I and Series NAV shares is 11-1-13.6 Not annualized.7 Annualized.8 Less than $500,000.9 Portfolio turnover is shown for the period from 1-1-13 to 12-31-13.10 Less than $0.005 per share.
.314
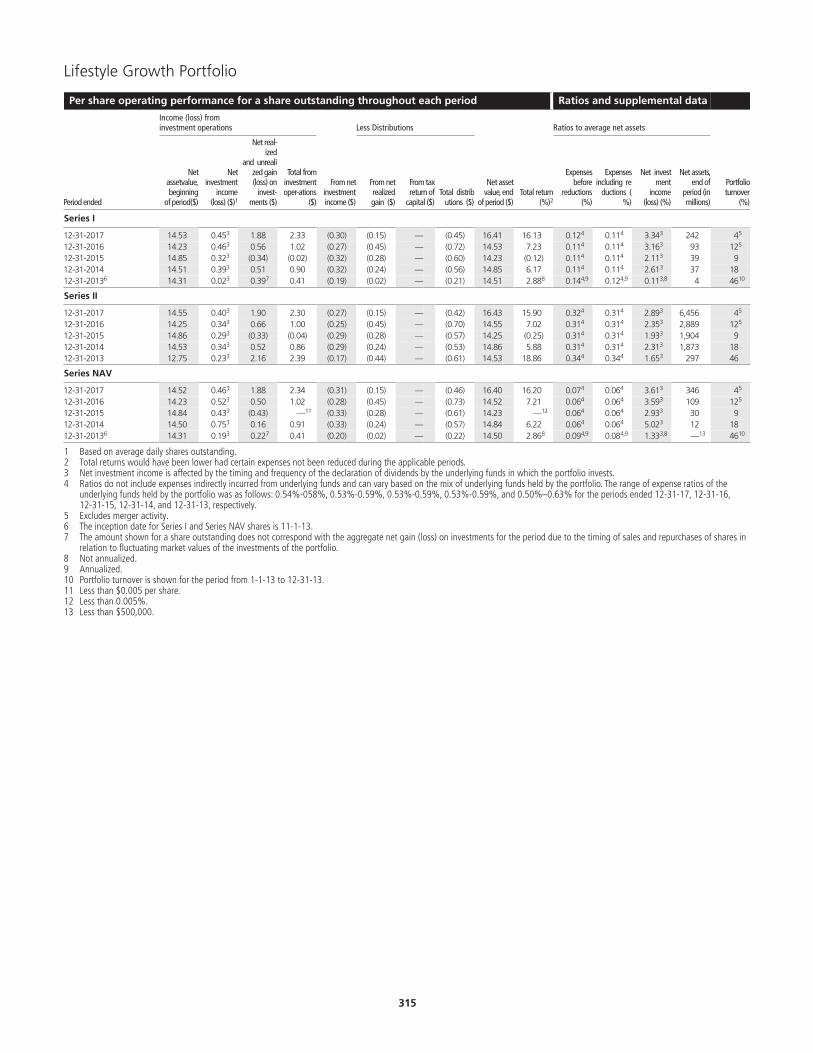
Lifestyle Growth Portfolio
Per share operating performance for a share outstanding throughout each period Ratios and supplemental data
Income (loss) frominvestment operations Less Distributions Ratios to average net assets
Period ended
Netassetvalue,beginning
of period($)
Netinvestment
income(loss) ($)1
Net real-ized
and unrealized gain(loss) on
invest-ments ($)
Total frominvestmentoper-ations
($)
From netinvestmentincome ($)
From netrealizedgain ($)
From taxreturn of
capital ($)Total distrib
utions ($)
Net assetvalue, end
of period ($)Total return
(%)2
Expensesbefore
reductions(%)
Expensesincluding re
ductions (%)
Net investment
income(loss) (%)
Net assets,end of
period (inmillions)
Portfolioturnover
(%)
Series I
12-31-2017 14.53 0.45 .
3 1.88 2.33 (0.30) (0.15) — (0.45) 16.41 16.13 0.12 .
4 0.11 .
4 3.34 .
3 242 4 .
5
12-31-2016 14.23 0.46 .
3 0.56 1.02 (0.27) (0.45) — (0.72) 14.53 7.23 0.11 .
4 0.11 .
4 3.16 .
3 93 12 .
5
12-31-2015 14.85 0.32 .
3 (0.34) (0.02) (0.32) (0.28) — (0.60) 14.23 (0.12) 0.11 .
4 0.11 .
4 2.11 .
3 39 912-31-2014 14.51 0.39 .
3 0.51 0.90 (0.32) (0.24) — (0.56) 14.85 6.17 0.11 .
4 0.11 .
4 2.61 .
3 37 1812-31-20136 14.31 0.02 .
3 0.39 .
7 0.41 (0.19) (0.02) — (0.21) 14.51 2.88 .
8 0.14 .
4,9 0.12 .
4,9 0.11 .
3,8 4 46 .
10
Series II
12-31-2017 14.55 0.40 .
3 1.90 2.30 (0.27) (0.15) — (0.42) 16.43 15.90 0.32 .
4 0.31 .
4 2.89 .
3 6,456 4 .
5
12-31-2016 14.25 0.34 .
3 0.66 1.00 (0.25) (0.45) — (0.70) 14.55 7.02 0.31 .
4 0.31 .
4 2.35 .
3 2,889 12 .
5
12-31-2015 14.86 0.29 .
3 (0.33) (0.04) (0.29) (0.28) — (0.57) 14.25 (0.25) 0.31 .
4 0.31 .
4 1.93 .
3 1,904 912-31-2014 14.53 0.34 .
3 0.52 0.86 (0.29) (0.24) — (0.53) 14.86 5.88 0.31 .
4 0.31 .
4 2.31 .
3 1,873 1812-31-2013 12.75 0.23 .
3 2.16 2.39 (0.17) (0.44) — (0.61) 14.53 18.86 0.34 .
4 0.34 .
4 1.65 .
3 297 46
Series NAV
12-31-2017 14.52 0.46 .
3 1.88 2.34 (0.31) (0.15) — (0.46) 16.40 16.20 0.07 .
4 0.06 .
4 3.61 .
3 346 4 .
5
12-31-2016 14.23 0.52 .
3 0.50 1.02 (0.28) (0.45) — (0.73) 14.52 7.21 0.06 .
4 0.06 .
4 3.59 .
3 109 12 .
5
12-31-2015 14.84 0.43 .
3 (0.43) — .
11 (0.33) (0.28) — (0.61) 14.23 — .
12 0.06 .
4 0.06 .
4 2.93 .
3 30 912-31-2014 14.50 0.75 .
3 0.16 0.91 (0.33) (0.24) — (0.57) 14.84 6.22 0.06 .
4 0.06 .
4 5.02 .
3 12 1812-31-20136 14.31 0.19 .
3 0.22 .
7 0.41 (0.20) (0.02) — (0.22) 14.50 2.86 .
8 0.09 .
4,9 0.08 .
4,9 1.33 .
3,8 — .
13 46 .
10
1 Based on average daily shares outstanding.2 Total returns would have been lower had certain expenses not been reduced during the applicable periods.3 Net investment income is affected by the timing and frequency of the declaration of dividends by the underlying funds in which the portfolio invests.4 Ratios do not include expenses indirectly incurred from underlying funds and can vary based on the mix of underlying funds held by the portfolio. The range of expense ratios of the
underlying funds held by the portfolio was as follows: 0.54%-058%, 0.53%-0.59%, 0.53%-0.59%, 0.53%-0.59%, and 0.50%–0.63% for the periods ended 12-31-17, 12-31-16,12-31-15, 12-31-14, and 12-31-13, respectively.
5 Excludes merger activity.6 The inception date for Series I and Series NAV shares is 11-1-13.7 The amount shown for a share outstanding does not correspond with the aggregate net gain (loss) on investments for the period due to the timing of sales and repurchases of shares in
relation to fluctuating market values of the investments of the portfolio.8 Not annualized.9 Annualized.10 Portfolio turnover is shown for the period from 1-1-13 to 12-31-13.11 Less than $0.005 per share.12 Less than 0.005%.13 Less than $500,000.
.315
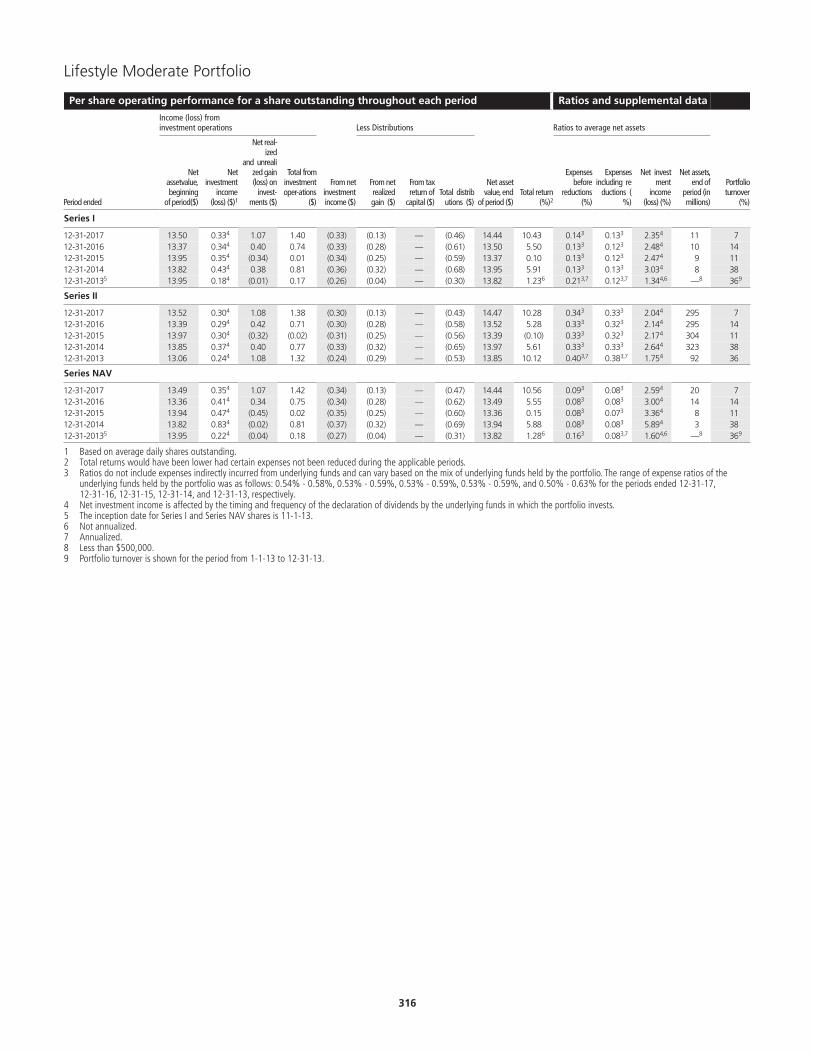
Lifestyle Moderate Portfolio
Per share operating performance for a share outstanding throughout each period Ratios and supplemental data
Income (loss) frominvestment operations Less Distributions Ratios to average net assets
Period ended
Netassetvalue,beginning
of period($)
Netinvestment
income(loss) ($)1
Net real-ized
and unrealized gain(loss) on
invest-ments ($)
Total frominvestmentoper-ations
($)
From netinvestmentincome ($)
From netrealizedgain ($)
From taxreturn of
capital ($)Total distrib
utions ($)
Net assetvalue, end
of period ($)Total return
(%)2
Expensesbefore
reductions(%)
Expensesincluding re
ductions (%)
Net investment
income(loss) (%)
Net assets,end of
period (inmillions)
Portfolioturnover
(%)
Series I
12-31-2017 13.50 0.33 .
4 1.07 1.40 (0.33) (0.13) — (0.46) 14.44 10.43 0.14 .
3 0.13 .
3 2.35 .
4 11 712-31-2016 13.37 0.34 .
4 0.40 0.74 (0.33) (0.28) — (0.61) 13.50 5.50 0.13 .
3 0.12 .
3 2.48 .
4 10 1412-31-2015 13.95 0.35 .
4 (0.34) 0.01 (0.34) (0.25) — (0.59) 13.37 0.10 0.13 .
3 0.12 .
3 2.47 .
4 9 1112-31-2014 13.82 0.43 .
4 0.38 0.81 (0.36) (0.32) — (0.68) 13.95 5.91 0.13 .
3 0.13 .
3 3.03 .
4 8 3812-31-20135 13.95 0.18 .
4 (0.01) 0.17 (0.26) (0.04) — (0.30) 13.82 1.23 .
6 0.21 .
3,7 0.12 .
3,7 1.34 .
4,6 — .
8 36 .
9
Series II
12-31-2017 13.52 0.30 .
4 1.08 1.38 (0.30) (0.13) — (0.43) 14.47 10.28 0.34 .
3 0.33 .
3 2.04 .
4 295 712-31-2016 13.39 0.29 .
4 0.42 0.71 (0.30) (0.28) — (0.58) 13.52 5.28 0.33 .
3 0.32 .
3 2.14 .
4 295 1412-31-2015 13.97 0.30 .
4 (0.32) (0.02) (0.31) (0.25) — (0.56) 13.39 (0.10) 0.33 .
3 0.32 .
3 2.17 .
4 304 1112-31-2014 13.85 0.37 .
4 0.40 0.77 (0.33) (0.32) — (0.65) 13.97 5.61 0.33 .
3 0.33 .
3 2.64 .
4 323 3812-31-2013 13.06 0.24 .
4 1.08 1.32 (0.24) (0.29) — (0.53) 13.85 10.12 0.40 .
3,7 0.38 .
3,7 1.75 .
4 92 36
Series NAV
12-31-2017 13.49 0.35 .
4 1.07 1.42 (0.34) (0.13) — (0.47) 14.44 10.56 0.09 .
3 0.08 .
3 2.59 .
4 20 712-31-2016 13.36 0.41 .
4 0.34 0.75 (0.34) (0.28) — (0.62) 13.49 5.55 0.08 .
3 0.08 .
3 3.00 .
4 14 1412-31-2015 13.94 0.47 .
4 (0.45) 0.02 (0.35) (0.25) — (0.60) 13.36 0.15 0.08 .
3 0.07 .
3 3.36 .
4 8 1112-31-2014 13.82 0.83 .
4 (0.02) 0.81 (0.37) (0.32) — (0.69) 13.94 5.88 0.08 .
3 0.08 .
3 5.89 .
4 3 3812-31-20135 13.95 0.22 .
4 (0.04) 0.18 (0.27) (0.04) — (0.31) 13.82 1.28 .
6 0.16 .
3 0.08 .
3,7 1.60 .
4,6 — .
8 36 .
9
1 Based on average daily shares outstanding.2 Total returns would have been lower had certain expenses not been reduced during the applicable periods.3 Ratios do not include expenses indirectly incurred from underlying funds and can vary based on the mix of underlying funds held by the portfolio. The range of expense ratios of the
underlying funds held by the portfolio was as follows: 0.54% - 0.58%, 0.53% - 0.59%, 0.53% - 0.59%, 0.53% - 0.59%, and 0.50% - 0.63% for the periods ended 12-31-17,12-31-16, 12-31-15, 12-31-14, and 12-31-13, respectively.
4 Net investment income is affected by the timing and frequency of the declaration of dividends by the underlying funds in which the portfolio invests.5 The inception date for Series I and Series NAV shares is 11-1-13.6 Not annualized.7 Annualized.8 Less than $500,000.9 Portfolio turnover is shown for the period from 1-1-13 to 12-31-13.
.316

Managed Volatility Aggressive Portfolio
Per share operating performance for a share outstanding throughout each period Ratios and supplemental data
Income (loss) frominvestment operations Less Distributions Ratios to average net assets
Period ended
Netassetvalue,beginning
of period($)
Netinvestment
income(loss) ($)1,2
Net real-ized
and unrealized gain(loss) on
invest-ments ($)
Total frominvestmentoper-ations
($)
From netinvestmentincome ($)
From netrealizedgain ($)
From taxreturn of
capital ($)Total distrib
utions ($)
Net assetvalue, end
of period ($)Total return
(%)3
Expensesbefore
reductions(%)4
Expensesincluding re
ductions (%)4
Net investment
income(loss) (%)1
Net assets,end of
period (inmillions)
Portfolioturnover
(%)
Series I
12-31-2017 9.85 0.13 2.11 2.24 (0.13) (0.06) — (0.19) 11.90 22.82 0.16 0.09 1.15 80 1512-31-2016 9.91 0.14 0.05 0.19 (0.14) (0.11) — (0.25) 9.85 1.95 0.15 0.10 1.40 76 5512-31-2015 10.75 0.12 (0.75) (0.63) (0.12) (0.09) — (0.21) 9.91 (5.85) 0.13 0.10 1.09 83 1612-31-2014 10.91 0.11 0.05 0.16 (0.12) (0.20) — (0.32) 10.75 1.40 0.13 0.10 1.03 105 3112-31-2013 8.81 0.11 2.24 2.35 (0.11) (0.14) — (0.25) 10.91 26.72 0.13 0.12 1.13 123 21
Series II
12-31-2017 9.82 0.10 2.12 2.22 (0.12) (0.06) — (0.18) 11.86 22.56 0.36 0.29 0.94 88 1512-31-2016 9.89 0.11 0.05 0.16 (0.12) (0.11) — (0.23) 9.82 1.66 0.35 0.30 1.17 87 5512-31-2015 10.73 0.09 (0.74) (0.65) (0.10) (0.09) — (0.19) 9.89 (6.05) 0.33 0.30 0.86 102 1612-31-2014 10.88 0.09 0.06 0.15 (0.10) (0.20) — (0.30) 10.73 1.29 0.33 0.30 0.78 136 3112-31-2013 8.79 0.08 2.24 2.32 (0.09) (0.14) — (0.23) 10.88 26.43 0.33 0.32 0.83 189 21
Series NAV
12-31-2017 9.85 0.14 2.11 2.25 (0.14) (0.06) — (0.20) 11.90 22.88 0.11 0.04 1.25 227 1512-31-2016 9.91 0.14 0.06 0.20 (0.15) (0.11) — (0.26) 9.85 1.90 0.10 0.05 1.46 194 5512-31-2015 10.76 0.13 (0.76) (0.63) (0.13) (0.09) — (0.22) 9.91 (5.79) 0.08 0.05 1.21 201 1612-31-2014 10.91 0.13 0.05 0.18 (0.13) (0.20) — (0.33) 10.76 1.54 0.08 0.05 1.15 210 3112-31-2013 8.81 0.12 2.24 2.36 (0.12) (0.14) — (0.26) 10.91 26.77 0.08 0.07 1.17 196 21
1 Net investment income is affected by the timing and frequency of the declaration of dividends by the underlying funds in which the portfolio invests.2 Based on average daily shares outstanding.3 Total returns would have been lower had certain expenses not been reduced during the applicable periods.4 Ratios do not include expenses indirectly incurred from underlying funds and can vary based on the mix of underlying funds held by the portfolio. The range of expense ratios of the
underlying funds held by the portfolio was as follows: 0.35% - 1.09%, 0.53% - 1.16%, 0.53% - 1.08%, 0.52% - 1.08% and 0.69% - 1.12% for the periods ended 12-31-17,12-31-16, 12-31-15, 12-31-14 and 12-31-13, respectively.
Managed Volatility Balanced Portfolio
Per share operating performance for a share outstanding throughout each period Ratios and supplemental data
Income (loss) frominvestment operations Less Distributions Ratios to average net assets
Period ended
Netassetvalue,beginning
of period($)
Netinvestment
income(loss) ($)1,2
Net real-ized
and unrealized gain(loss) on
invest-ments ($)
Total frominvestmentoper-ations
($)
From netinvestmentincome ($)
From netrealizedgain ($)
From taxreturn of
capital ($)Total distrib
utions ($)
Net assetvalue, end
of period ($)Total return
(%)3
Expensesbefore
reductions(%)4
Expensesincluding re
ductions (%)4
Net investment
income(loss) (%)1
Net assets,end of
period (inmillions)
Portfolioturnover
(%)
Series I
12-31-2017 12.05 0.24 1.44 1.68 (0.25) (0.52) — (0.77) 12.96 14.13 0.13 0.09 1.91 642 712-31-2016 12.24 0.24 0.35 0.59 (0.25) (0.53) — (0.78) 12.05 4.79 0.12 0.09 1.97 629 1712-31-2015 13.87 0.27 (0.58) (0.31) (0.27) (1.05) — (1.32) 12.24 (2.25) 0.12 0.09 1.97 671 912-31-2014 13.69 0.29 0.30 0.59 (0.31) (0.10) — (0.41) 13.87 4.29 0.11 0.10 2.05 768 2012-31-2013 12.48 0.26 1.33 1.59 (0.27) (0.11) — (0.38) 13.69 12.78 0.11 0.11 1.98 863 9
Series II
12-31-2017 11.99 0.21 1.43 1.64 (0.22) (0.52) — (0.74) 12.89 13.82 0.33 0.29 1.68 5,985 712-31-2016 12.18 0.21 0.35 0.56 (0.22) (0.53) — (0.75) 11.99 4.61 0.32 0.29 1.75 6,054 1712-31-2015 13.80 0.24 (0.57) (0.33) (0.24) (1.05) — (1.29) 12.18 (2.39) 0.32 0.29 1.74 6,646 912-31-2014 13.63 0.25 0.30 0.55 (0.28) (0.10) — (0.38) 13.80 4.03 0.31 0.30 1.80 7,970 2012-31-2013 12.43 0.23 1.33 1.56 (0.25) (0.11) — (0.36) 13.63 12.54 0.31 0.31 1.75 9,777 9
Series NAV
12-31-2017 12.08 0.25 1.44 1.69 (0.26) (0.52) — (0.78) 12.99 14.15 0.08 0.04 1.99 1,272 712-31-2016 12.26 0.25 0.35 0.60 (0.25) (0.53) — (0.78) 12.08 4.92 0.07 0.04 2.06 1,183 1712-31-2015 13.89 0.28 (0.58) (0.30) (0.28) (1.05) — (1.33) 12.26 (2.20) 0.07 0.04 2.06 1,192 912-31-2014 13.72 0.30 0.28 0.58 (0.31) (0.10) — (0.41) 13.89 4.26 0.06 0.05 2.15 1,293 2012-31-2013 12.50 0.28 1.33 1.61 (0.28) (0.11) — (0.39) 13.72 12.90 0.06 0.06 2.07 1,344 9
1 Net investment income is affected by the timing and frequency of the declaration of dividends by the underlying funds in which the portfolio invests.2 Based on average daily shares outstanding.3 Total returns would have been lower had certain expenses not been reduced during the applicable periods.4 Ratios do not include expenses indirectly incurred from underlying funds and can vary based on the mix of underlying funds held by the portfolio. The range of expense ratios of the
underlying funds held by the portfolio was as follows: 0.35% - 1.09%, 0.53% - 1.16%, 0.53% - 1.09%, 0.52% - 1.09%, and 0.50% - 1.10% for the periods ended 12-31-17,12-31-16, 12-31-15, 12-31-14, and 12-31-13, respectively.
.317
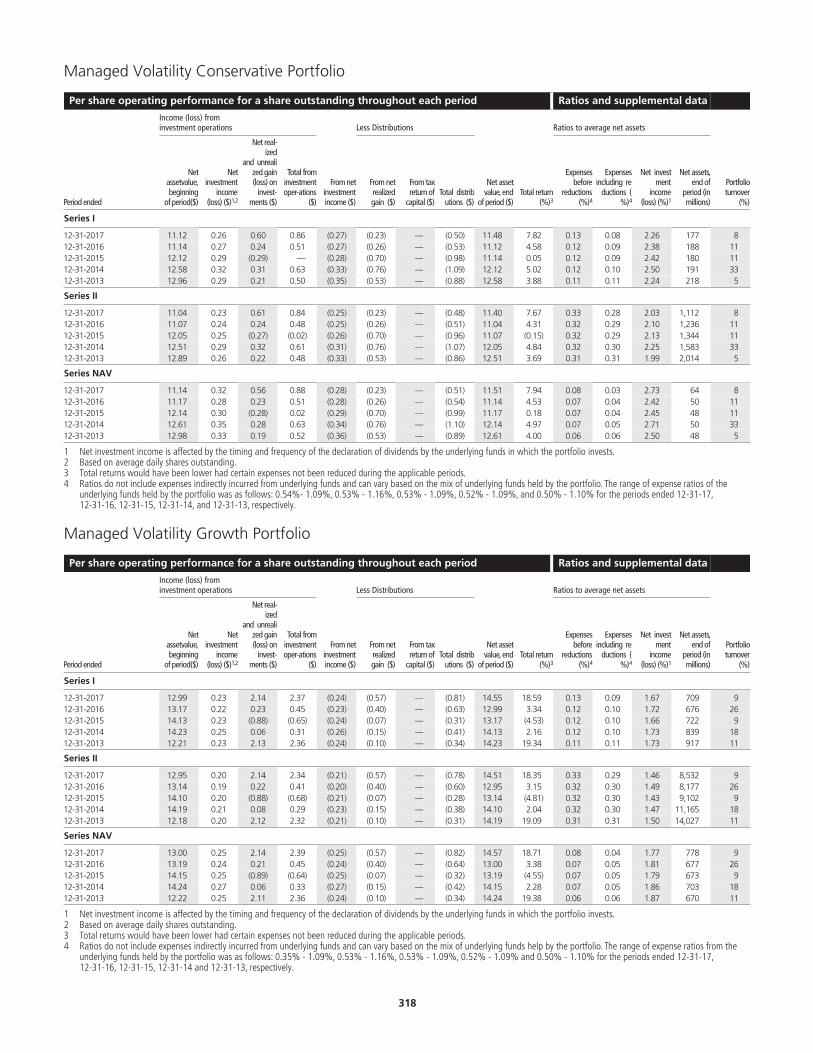
Managed Volatility Conservative Portfolio
Per share operating performance for a share outstanding throughout each period Ratios and supplemental data
Income (loss) frominvestment operations Less Distributions Ratios to average net assets
Period ended
Netassetvalue,beginning
of period($)
Netinvestment
income(loss) ($)1,2
Net real-ized
and unrealized gain(loss) on
invest-ments ($)
Total frominvestmentoper-ations
($)
From netinvestmentincome ($)
From netrealizedgain ($)
From taxreturn of
capital ($)Total distrib
utions ($)
Net assetvalue, end
of period ($)Total return
(%)3
Expensesbefore
reductions(%)4
Expensesincluding re
ductions (%)4
Net investment
income(loss) (%)1
Net assets,end of
period (inmillions)
Portfolioturnover
(%)
Series I
12-31-2017 11.12 0.26 0.60 0.86 (0.27) (0.23) — (0.50) 11.48 7.82 0.13 0.08 2.26 177 812-31-2016 11.14 0.27 0.24 0.51 (0.27) (0.26) — (0.53) 11.12 4.58 0.12 0.09 2.38 188 1112-31-2015 12.12 0.29 (0.29) — (0.28) (0.70) — (0.98) 11.14 0.05 0.12 0.09 2.42 180 1112-31-2014 12.58 0.32 0.31 0.63 (0.33) (0.76) — (1.09) 12.12 5.02 0.12 0.10 2.50 191 3312-31-2013 12.96 0.29 0.21 0.50 (0.35) (0.53) — (0.88) 12.58 3.88 0.11 0.11 2.24 218 5
Series II
12-31-2017 11.04 0.23 0.61 0.84 (0.25) (0.23) — (0.48) 11.40 7.67 0.33 0.28 2.03 1,112 812-31-2016 11.07 0.24 0.24 0.48 (0.25) (0.26) — (0.51) 11.04 4.31 0.32 0.29 2.10 1,236 1112-31-2015 12.05 0.25 (0.27) (0.02) (0.26) (0.70) — (0.96) 11.07 (0.15) 0.32 0.29 2.13 1,344 1112-31-2014 12.51 0.29 0.32 0.61 (0.31) (0.76) — (1.07) 12.05 4.84 0.32 0.30 2.25 1,583 3312-31-2013 12.89 0.26 0.22 0.48 (0.33) (0.53) — (0.86) 12.51 3.69 0.31 0.31 1.99 2,014 5
Series NAV
12-31-2017 11.14 0.32 0.56 0.88 (0.28) (0.23) — (0.51) 11.51 7.94 0.08 0.03 2.73 64 812-31-2016 11.17 0.28 0.23 0.51 (0.28) (0.26) — (0.54) 11.14 4.53 0.07 0.04 2.42 50 1112-31-2015 12.14 0.30 (0.28) 0.02 (0.29) (0.70) — (0.99) 11.17 0.18 0.07 0.04 2.45 48 1112-31-2014 12.61 0.35 0.28 0.63 (0.34) (0.76) — (1.10) 12.14 4.97 0.07 0.05 2.71 50 3312-31-2013 12.98 0.33 0.19 0.52 (0.36) (0.53) — (0.89) 12.61 4.00 0.06 0.06 2.50 48 5
1 Net investment income is affected by the timing and frequency of the declaration of dividends by the underlying funds in which the portfolio invests.2 Based on average daily shares outstanding.3 Total returns would have been lower had certain expenses not been reduced during the applicable periods.4 Ratios do not include expenses indirectly incurred from underlying funds and can vary based on the mix of underlying funds held by the portfolio. The range of expense ratios of the
underlying funds held by the portfolio was as follows: 0.54%- 1.09%, 0.53% - 1.16%, 0.53% - 1.09%, 0.52% - 1.09%, and 0.50% - 1.10% for the periods ended 12-31-17,12-31-16, 12-31-15, 12-31-14, and 12-31-13, respectively.
Managed Volatility Growth Portfolio
Per share operating performance for a share outstanding throughout each period Ratios and supplemental data
Income (loss) frominvestment operations Less Distributions Ratios to average net assets
Period ended
Netassetvalue,beginning
of period($)
Netinvestment
income(loss) ($)1,2
Net real-ized
and unrealized gain(loss) on
invest-ments ($)
Total frominvestmentoper-ations
($)
From netinvestmentincome ($)
From netrealizedgain ($)
From taxreturn of
capital ($)Total distrib
utions ($)
Net assetvalue, end
of period ($)Total return
(%)3
Expensesbefore
reductions(%)4
Expensesincluding re
ductions (%)4
Net investment
income(loss) (%)1
Net assets,end of
period (inmillions)
Portfolioturnover
(%)
Series I
12-31-2017 12.99 0.23 2.14 2.37 (0.24) (0.57) — (0.81) 14.55 18.59 0.13 0.09 1.67 709 912-31-2016 13.17 0.22 0.23 0.45 (0.23) (0.40) — (0.63) 12.99 3.34 0.12 0.10 1.72 676 2612-31-2015 14.13 0.23 (0.88) (0.65) (0.24) (0.07) — (0.31) 13.17 (4.53) 0.12 0.10 1.66 722 912-31-2014 14.23 0.25 0.06 0.31 (0.26) (0.15) — (0.41) 14.13 2.16 0.12 0.10 1.73 839 1812-31-2013 12.21 0.23 2.13 2.36 (0.24) (0.10) — (0.34) 14.23 19.34 0.11 0.11 1.73 917 11
Series II
12-31-2017 12.95 0.20 2.14 2.34 (0.21) (0.57) — (0.78) 14.51 18.35 0.33 0.29 1.46 8,532 912-31-2016 13.14 0.19 0.22 0.41 (0.20) (0.40) — (0.60) 12.95 3.15 0.32 0.30 1.49 8,177 2612-31-2015 14.10 0.20 (0.88) (0.68) (0.21) (0.07) — (0.28) 13.14 (4.81) 0.32 0.30 1.43 9,102 912-31-2014 14.19 0.21 0.08 0.29 (0.23) (0.15) — (0.38) 14.10 2.04 0.32 0.30 1.47 11,165 1812-31-2013 12.18 0.20 2.12 2.32 (0.21) (0.10) — (0.31) 14.19 19.09 0.31 0.31 1.50 14,027 11
Series NAV
12-31-2017 13.00 0.25 2.14 2.39 (0.25) (0.57) — (0.82) 14.57 18.71 0.08 0.04 1.77 778 912-31-2016 13.19 0.24 0.21 0.45 (0.24) (0.40) — (0.64) 13.00 3.38 0.07 0.05 1.81 677 2612-31-2015 14.15 0.25 (0.89) (0.64) (0.25) (0.07) — (0.32) 13.19 (4.55) 0.07 0.05 1.79 673 912-31-2014 14.24 0.27 0.06 0.33 (0.27) (0.15) — (0.42) 14.15 2.28 0.07 0.05 1.86 703 1812-31-2013 12.22 0.25 2.11 2.36 (0.24) (0.10) — (0.34) 14.24 19.38 0.06 0.06 1.87 670 11
1 Net investment income is affected by the timing and frequency of the declaration of dividends by the underlying funds in which the portfolio invests.2 Based on average daily shares outstanding.3 Total returns would have been lower had certain expenses not been reduced during the applicable periods.4 Ratios do not include expenses indirectly incurred from underlying funds and can vary based on the mix of underlying funds help by the portfolio. The range of expense ratios from the
underlying funds held by the portfolio was as follows: 0.35% - 1.09%, 0.53% - 1.16%, 0.53% - 1.09%, 0.52% - 1.09% and 0.50% - 1.10% for the periods ended 12-31-17,12-31-16, 12-31-15, 12-31-14 and 12-31-13, respectively.
.318

Managed Volatility Moderate Portfolio
Per share operating performance for a share outstanding throughout each period Ratios and supplemental data
Income (loss) frominvestment operations Less Distributions Ratios to average net assets
Period ended
Netassetvalue,beginning
of period($)
Netinvestment
income(loss) ($)1,2
Net real-ized
and unrealized gain(loss) on
invest-ments ($)
Total frominvestmentoper-ations
($)
From netinvestmentincome ($)
From netrealizedgain ($)
From taxreturn of
capital ($)Total distrib
utions ($)
Net assetvalue, end
of period ($)Total return
(%)3
Expensesbefore
reductions(%)4
Expensesincluding re
ductions (%)4
Net investment
income(loss) (%)1
Net assets,end of
period (inmillions)
Portfolioturnover
(%)
Series I
12-31-2017 11.65 0.25 1.12 1.37 (0.26) (0.43) — (0.69) 12.33 11.88 0.13 0.09 2.05 266 912-31-2016 11.72 0.25 0.38 0.63 (0.25) (0.45) — (0.70) 11.65 5.29 0.12 0.09 2.07 259 1312-31-2015 13.30 0.28 (0.41) (0.13) (0.27) (1.18) — (1.45) 11.72 (0.91) 0.12 0.09 2.14 257 1012-31-2014 13.68 0.31 0.37 0.68 (0.32) (0.74) — (1.06) 13.30 4.94 0.12 0.10 2.24 289 2612-31-2013 12.78 0.29 1.02 1.31 (0.30) (0.11) — (0.41) 13.68 10.22 0.11 0.11 2.14 320 7
Series II
12-31-2017 11.58 0.22 1.11 1.33 (0.23) (0.43) — (0.66) 12.25 11.65 0.33 0.29 1.80 1,891 912-31-2016 11.65 0.22 0.38 0.60 (0.22) (0.45) — (0.67) 11.58 5.12 0.32 0.29 1.83 1,966 1312-31-2015 13.23 0.24 (0.39) (0.15) (0.25) (1.18) — (1.43) 11.65 (1.12) 0.32 0.29 1.88 2,131 1012-31-2014 13.62 0.27 0.37 0.64 (0.29) (0.74) — (1.03) 13.23 4.68 0.32 0.30 1.98 2,513 2612-31-2013 12.73 0.25 1.02 1.27 (0.27) (0.11) — (0.38) 13.62 9.97 0.31 0.31 1.89 3,037 7
Series NAV
12-31-2017 11.65 0.26 1.12 1.38 (0.26) (0.43) — (0.69) 12.34 12.02 0.08 0.04 2.11 134 912-31-2016 11.73 0.26 0.36 0.62 (0.25) (0.45) — (0.70) 11.65 5.25 0.07 0.04 2.15 116 1312-31-2015 13.31 0.29 (0.41) (0.12) (0.28) (1.18) — (1.46) 11.73 (0.86) 0.07 0.04 2.20 112 1012-31-2014 13.69 0.34 0.35 0.69 (0.33) (0.74) — (1.07) 13.31 4.99 0.07 0.05 2.46 115 2612-31-2013 12.79 0.30 1.02 1.32 (0.31) (0.11) — (0.42) 13.69 10.27 0.06 0.06 2.23 102 7
1 Net investment income is affected by the timing and frequency of the declaration of dividends by the underlying funds in which the portfolio invests.2 Based on average daily shares outstanding.3 Total returns would have been lower had certain expenses not been reduced during the applicable periods.4 Ratios do not include expenses indirectly incurred from underlying funds and can vary based on the mix of underlying funds held by the portfolio. The range of expense ratios of the
underlying funds held by the portfolio was as follows: 0.54% – 1.09%, 0..53% - 1.16%, 0.53% - 1.09%, 0.52% - 1.09% and 0.50% - 1.10% for the periods ended 12-31-17,12-31-16, 12-31-15, 12-31-14, and 12-31-13, respectively.
Mid Cap Index Trust
Per share operating performance for a share outstanding throughout each period Ratios and supplemental data
Income (loss) frominvestment operations Less Distributions Ratios to average net assets
Period ended
Netassetvalue,beginning
of period($)
Netinvestment
income(loss) ($)1
Net real-ized
and unrealized gain(loss) on
invest-ments ($)
Total frominvestmentoper-ations
($)
From netinvestmentincome ($)
From netrealizedgain ($)
From taxreturn of
capital ($)Total distrib
utions ($)
Net assetvalue, end
of period ($)Total return
(%)2
Expensesbefore
reductions(%)
Expensesincluding re
ductions (%)
Net investment
income(loss) (%)
Net assets,end of
period (inmillions)
Portfolioturnover
(%)
Series I
12-31-2017 21.32 0.24 2.95 3.19 (0.11) (1.40) — (1.51) 23.00 15.81 0.56 0.45 1.07 1,277 19 .
3
12-31-2016 19.66 0.25 3.56 3.81 (0.24) (1.91) — (2.15) 21.32 20.11 0.56 0.45 1.24 805 2212-31-2015 22.29 0.24 (0.83) (0.59) (0.22) (1.82) — (2.04) 19.66 (2.59) 0.56 0.45 1.10 661 2312-31-2014 21.82 0.23 1.79 2.02 (0.22) (1.33) — (1.55) 22.29 9.35 0.56 0.46 1.05 679 1412-31-2013 17.45 0.21 5.50 5.71 (0.22) (1.12) — (1.34) 21.82 33.03 0.55 0.45 1.02 657 14
Series II
12-31-2017 21.24 0.19 2.93 3.12 (0.07) (1.40) — (1.47) 22.89 15.51 0.76 0.65 0.85 90 19 .
3
12-31-2016 19.58 0.21 3.56 3.77 (0.20) (1.91) — (2.11) 21.24 19.92 0.76 0.65 1.03 68 2212-31-2015 22.22 0.20 (0.84) (0.64) (0.18) (1.82) — (2.00) 19.58 (2.80) 0.76 0.65 0.89 63 2312-31-2014 21.76 0.19 1.77 1.96 (0.17) (1.33) — (1.50) 22.22 9.12 0.76 0.66 0.84 71 1412-31-2013 17.41 0.16 5.49 5.65 (0.18) (1.12) — (1.30) 21.76 32.76 0.75 0.65 0.81 82 14
Series NAV
12-31-2017 21.32 0.24 2.96 3.20 (0.12) (1.40) — (1.52) 23.00 15.86 0.51 0.40 1.10 198 19 .
3
12-31-2016 19.65 0.26 3.57 3.83 (0.25) (1.91) — (2.16) 21.32 20.17 0.51 0.40 1.30 134 2212-31-2015 22.29 0.25 (0.84) (0.59) (0.23) (1.82) — (2.05) 19.65 (2.54) 0.51 0.40 1.15 105 2312-31-2014 21.82 0.25 1.78 2.03 (0.23) (1.33) — (1.56) 22.29 9.40 0.51 0.41 1.11 106 1412-31-2013 17.45 0.22 5.50 5.72 (0.23) (1.12) — (1.35) 21.82 33.09 0.50 0.40 1.06 88 14
1 Based on average daily shares outstanding.2 Total returns would have been lower had certain expenses not been reduced during the applicable periods.3 Excludes merger activity and in-kind transactions.
.319

Mid Cap Stock Trust
Per share operating performance for a share outstanding throughout each period Ratios and supplemental data
Income (loss) frominvestment operations Less Distributions Ratios to average net assets
Period ended
Netassetvalue,beginning
of period($)
Netinvestment
income(loss) ($)1
Net real-ized
and unrealized gain(loss) on
invest-ments ($)
Total frominvestmentoper-ations
($)
From netinvestmentincome ($)
From netrealizedgain ($)
From taxreturn of
capital ($)Total distrib
utions ($)
Net assetvalue, end
of period ($)Total return
(%)2
Expensesbefore
reductions(%)
Expensesincluding re
ductions (%)
Net investment
income(loss) (%)
Net assets,end of
period (inmillions)
Portfolioturnover
(%)
Series I
12-31-2017 14.16 (0.03) 4.04 4.01 — (0.35) — (0.35) 17.82 28.54 0.93 0.92 (0.16) 166 7112-31-2016 15.17 (0.04) 0.16 0.12 — (1.13) — (1.13) 14.16 0.59 0.90 .
3 0.89 (0.27) 150 8512-31-2015 18.61 (0.05) 0.55 0.50 — (3.94) — (3.94) 15.17 3.00 0.92 0.91 (0.28) 170 7812-31-2014 21.07 (0.08) 1.68 1.60 (0.02) (4.04) — (4.06) 18.61 8.02 0.92 0.91 (0.37) 188 10312-31-2013 15.68 (0.05) 5.80 5.75 (0.01) (0.35) — (0.36) 21.07 36.82 0.92 0.92 (0.27) 207 116
Series II
12-31-2017 13.45 (0.06) 3.83 3.77 — (0.35) — (0.35) 16.87 28.26 1.13 1.12 (0.36) 85 7112-31-2016 14.49 (0.06) 0.15 0.09 — (1.13) — (1.13) 13.45 0.41 1.10 .
3 1.09 (0.47) 76 8512-31-2015 17.99 (0.08) 0.52 0.44 — (3.94) — (3.94) 14.49 2.75 1.12 1.11 (0.48) 91 7812-31-2014 20.51 (0.11) 1.63 1.52 — (4.04) — (4.04) 17.99 7.82 1.12 1.11 (0.58) 99 10312-31-2013 15.30 (0.08) 5.64 5.56 — (0.35) — (0.35) 20.51 36.51 1.12 1.12 (0.47) 121 116
Series NAV
12-31-2017 14.31 (0.02) 4.09 4.07 — (0.35) — (0.35) 18.03 28.66 0.88 0.87 (0.12) 501 7112-31-2016 15.32 (0.03) 0.15 0.12 — (1.13) — (1.13) 14.31 0.58 0.85 .
3 0.84 (0.22) 449 8512-31-2015 18.75 (0.04) 0.55 0.51 — (3.94) — (3.94) 15.32 3.04 0.87 0.86 (0.23) 506 7812-31-2014 21.19 (0.07) 1.70 1.63 (0.03) (4.04) — (4.07) 18.75 8.12 0.87 0.86 (0.32) 562 10312-31-2013 15.77 (0.04) 5.82 5.78 (0.01) (0.35) — (0.36) 21.19 36.84 0.87 0.87 (0.23) 615 116
1 Based on average daily shares outstanding.2 Total returns would have been lower had certain expenses not been reduced during the applicable periods.3 Includes reimbursement for overbilling of custody expenses in prior years of 0.03%.
Mid Value Trust
Per share operating performance for a share outstanding throughout each period Ratios and supplemental data
Income (loss) frominvestment operations Less Distributions Ratios to average net assets
Period ended
Netassetvalue,beginning
of period($)
Netinvestment
income(loss) ($)1
Net real-ized
and unrealized gain(loss) on
invest-ments ($)
Total frominvestmentoper-ations
($)
From netinvestmentincome ($)
From netrealizedgain ($)
From taxreturn of
capital ($)Total distrib
utions ($)
Net assetvalue, end
of period ($)Total return
(%)2
Expensesbefore
reductions(%)
Expensesincluding re
ductions (%)
Net investment
income(loss) (%)
Net assets,end of
period (inmillions)
Portfolioturnover
(%)
Series I
12-31-2017 11.62 0.11 1.10 1.21 (0.11) (1.12) — (1.23) 11.60 11.43 1.04 0.99 0.96 312 3212-31-2016 10.72 0.12 2.35 2.47 (0.13) (1.44) — (1.57) 11.62 24.02 1.02 .
3 0.96 .
3 1.03 339 5612-31-2015 13.96 0.13 (0.68) (0.55) (0.14) (2.55) — (2.69) 10.72 (3.43) 1.04 0.98 0.99 276 47 .
4
12-31-2014 13.99 0.11 1.37 1.48 (0.10) (1.41) — (1.51) 13.96 10.60 1.04 0.98 0.77 347 3212-31-2013 11.49 0.09 3.47 3.56 (0.13) (0.93) — (1.06) 13.99 31.39 1.04 0.99 0.67 347 37
Series II
12-31-2017 11.63 0.09 1.10 1.19 (0.09) (1.12) — (1.21) 11.61 11.21 1.24 1.19 0.76 62 3212-31-2016 10.73 0.09 2.36 2.45 (0.11) (1.44) — (1.55) 11.63 23.77 1.21 .
3 1.16 .
3 0.83 67 5612-31-2015 13.97 0.10 (0.67) (0.57) (0.12) (2.55) — (2.67) 10.73 (3.64) 1.24 1.18 0.79 59 47 .
4
12-31-2014 14.00 0.08 1.38 1.46 (0.08) (1.41) — (1.49) 13.97 10.39 1.24 1.18 0.57 76 3212-31-2013 11.50 0.06 3.48 3.54 (0.11) (0.93) — (1.04) 14.00 31.14 1.24 1.19 0.47 86 37
Series NAV
12-31-2017 11.56 0.11 1.10 1.21 (0.12) (1.12) — (1.24) 11.53 11.46 0.99 0.94 0.99 434 3212-31-2016 10.67 0.12 2.34 2.46 (0.13) (1.44) — (1.57) 11.56 24.09 0.97 .
3 0.91 .
3 1.09 425 5612-31-2015 13.91 0.13 (0.67) (0.54) (0.15) (2.55) — (2.70) 10.67 (3.40) 0.99 0.93 1.04 408 47 .
4
12-31-2014 13.94 0.12 1.37 1.49 (0.11) (1.41) — (1.52) 13.91 10.70 0.99 0.93 0.82 481 3212-31-2013 11.45 0.09 3.47 3.56 (0.14) (0.93) — (1.07) 13.94 31.47 0.99 0.94 0.72 532 37
1 Based on average daily shares outstanding.2 Total returns would have been lower had certain expenses not been reduced during the applicable periods.3 Includes reimbursement for overbilling of custody expenses in prior years of 0.02%.4 The portfolio turnover rate for the year ended 12-31-15 has been revised from what was previously reported to exclude the effect of certain short-term investments in a collateral
management vehicle.
.320

Money Market Trust
Per share operating performance for a share outstanding throughout each period Ratios and supplemental data
Income (loss) frominvestment operations Less Distributions Ratios to average net assets
Period ended
Netassetvalue,beginning
of period($)
Netinvestment
income(loss) ($)1
Net real-ized
and unrealized gain(loss) on
invest-ments ($)
Total frominvestmentoper-ations
($)
From netinvestmentincome ($)
From netrealizedgain ($)
From taxreturn of
capital ($)Total distrib
utions ($)
Net assetvalue, end
of period ($)Total return
(%)2
Expensesbefore
reductions(%)
Expensesincluding re
ductions (%)
Net investment
income(loss) (%)
Net assets,end of
period (inmillions)
Portfolioturnover
(%)
Series I
12-31-2017 1.00 0.006 — .
3 0.006 (0.006) — .
3 — (0.006) 1.00 0.59 0.46 0.33 0.58 1,372 —12-31-2016 1.00 0.001 — .
3 0.001 (0.001) — — (0.001) 1.00 0.07 0.48 0.35 0.07 1,718 —12-31-2015 1.00 — — .
3 — .
3 — — .
3 — — .
3 1.00 0.00 .
4 0.56 0.17 — 1,714 —12-31-2014 1.00 — — .
3 — .
3 — — .
3 — — .
3 1.00 0.00 .
4 0.56 0.16 — 1,794 —12-31-2013 1.00 — — .
3 — .
3 — — .
3 — — .
3 1.00 0.01 0.56 0.24 — 2,110 —
Series II
12-31-2017 1.00 0.004 — .
3 0.004 (0.004) — .
3 — (0.004) 1.00 0.39 0.66 0.53 0.38 173 —12-31-2016 1.00 — — .
3 — .
3 — — — — 1.00 0.00 0.68 0.42 — 211 —12-31-2015 1.00 — — .
3 — .
3 — — .
3 — — .
3 1.00 0.00 .
4 0.76 0.17 — 253 —12-31-2014 1.00 — — .
3 — .
3 — — .
3 — — .
3 1.00 0.00 .
4 0.76 0.16 — 315 —12-31-2013 1.00 — — .
3 — .
3 — — .
3 — — .
3 1.00 0.01 0.76 0.24 — 436 —
Series NAV
12-31-2017 1.00 0.006 — .
3 0.006 (0.006) — .
3 — (0.006) 1.00 0.64 0.41 0.28 0.63 398 —12-31-20167,8 1.00 0.001 — .
3 0.001 (0.001) — — (0.001) 1.00 0.11 .
5 0.43 .
6 0.34 .
6 0.16 .
6 394 —
1 Based on average daily shares outstanding.2 Total returns would have been lower had certain expenses not been reduced during the applicable periods.3 Less than $0.0005 per share.4 Less than 0.005%5 Not annualized6 Annualized7 After the close of business on April 29, 2016, holders of Series NAV shares of Money Market Trust B became owners of an equal number of full and fractional Series NAV shares of
Money Market Trust. These shares were first offered on 5-2-16.8 Prior period per share data has been recast from two to three decimal places for comparative purposes.
Mutual Shares Trust
Per share operating performance for a share outstanding throughout each period Ratios and supplemental data
Income (loss) frominvestment operations Less Distributions Ratios to average net assets
Period ended
Netassetvalue,beginning
of period($)
Netinvestment
income(loss) ($)1
Net real-ized
and unrealized gain(loss) on
invest-ments ($)
Total frominvestmentoper-ations
($)
From netinvestmentincome ($)
From netrealizedgain ($)
From taxreturn of
capital ($)Total distrib
utions ($)
Net assetvalue, end
of period ($)Total return
(%)2
Expensesbefore
reductions(%)
Expensesincluding re
ductions (%)
Net investment
income(loss) (%)
Net assets,end of
period (inmillions)
Portfolioturnover
(%)
Series I
12-31-2017 11.74 0.18 0.52 0.70 (0.66) (5.11) — (5.77) 6.67 8.32 1.10 1.09 1.95 172 2012-31-2016 11.76 0.28 1.56 1.84 (0.76) (1.10) — (1.86) 11.74 16.71 1.06 1.05 2.35 173 2612-31-2015 14.02 0.24 (0.90) (0.66) (0.29) (1.31) — (1.60) 11.76 (4.68) 1.06 1.05 1.74 172 2212-31-2014 13.75 0.37 .
3 0.63 1.00 (0.47) (0.26) — (0.73) 14.02 7.21 1.03 1.03 2.62 .
3 200 1912-31-2013 10.86 0.20 2.87 3.07 (0.18) — — (0.18) 13.75 28.32 1.03 1.02 1.63 220 27
1 Based on average daily shares outstanding.2 Total returns would have been lower had certain expenses not been reduced during the applicable periods.3 Net investment income per share and the percentage of average net assets reflect special dividends received by the portfolio, which amounted to $0.10 and 0.74%, respectively.
.321

New Income Trust
Per share operating performance for a share outstanding throughout each period Ratios and supplemental data
Income (loss) frominvestment operations Less Distributions Ratios to average net assets
Period ended
Netassetvalue,beginning
of period($)
Netinvestment
income(loss) ($)1
Net real-ized
and unrealized gain(loss) on
invest-ments ($)
Total frominvestmentoper-ations
($)
From netinvestmentincome ($)
From netrealizedgain ($)
From taxreturn of
capital ($)Total distrib
utions ($)
Net assetvalue, end
of period ($)Total return
(%)2
Expensesbefore
reductions(%)
Expensesincluding re
ductions (%)
Net investment
income(loss) (%)
Net assets,end of
period (inmillions)
Portfolioturnover
(%)
Series NAV
12-31-2017 12.54 0.32 0.18 0.50 (0.36) — — (0.36) 12.68 3.99 0.59 0.58 2.48 1,403 6012-31-2016 12.63 0.30 0.05 0.35 (0.38) (0.06) — (0.44) 12.54 2.73 0.57 .
3 0.56 .
3 2.34 1,355 5112-31-2015 13.04 0.31 (0.28) 0.03 (0.40) (0.04) — (0.44) 12.63 0.22 0.59 0.57 2.38 1,464 4712-31-2014 12.90 0.33 0.42 0.75 (0.61) — — (0.61) 13.04 5.83 0.62 0.60 2.52 1,734 5412-31-2013 13.80 0.33 (0.62) (0.29) (0.43) (0.18) — (0.61) 12.90 (2.12) 0.65 0.63 2.40 2,783 57
1 Based on average daily shares outstanding.2 Total returns would have been lower had certain expenses not been reduced during the applicable periods.3 Includes reimbursement for overbilling of custody expenses in prior years of 0.02%.
Real Estate Securities Trust
Per share operating performance for a share outstanding throughout each period Ratios and supplemental data
Income (loss) frominvestment operations Less Distributions Ratios to average net assets
Period ended
Netassetvalue,beginning
of period($)
Netinvestment
income(loss) ($)1
Net real-ized
and unrealized gain(loss) on
invest-ments ($)
Total frominvestmentoper-ations
($)
From netinvestmentincome ($)
From netrealizedgain ($)
From taxreturn of
capital ($)Total distrib
utions ($)
Net assetvalue, end
of period ($)Total return
(%)2
Expensesbefore
reductions(%)
Expensesincluding re
ductions (%)
Net investment
income(loss) (%)
Net assets,end of
period (inmillions)
Portfolioturnover
(%)
Series I
12-31-2017 18.65 0.40 0.76 1.16 (0.10) — — (0.10) 19.71 6.24 0.81 0.80 2.08 77 16612-31-2016 18.08 0.44 0.78 1.22 (0.65) — — (0.65) 18.65 6.92 0.74 .
3 0.74 .
3 2.32 85 14712-31-2015 17.95 0.36 0.11 0.47 (0.34) — — (0.34) 18.08 2.68 0.79 0.79 2.02 90 15212-31-2014 13.84 0.30 4.08 4.38 (0.27) — — (0.27) 17.95 31.73 0.79 0.79 1.88 104 13112-31-2013 14.13 0.30 (0.31) (0.01) (0.28) — — (0.28) 13.84 (0.10) 0.80 0.79 2.02 83 104
Series II
12-31-2017 18.68 0.36 0.77 1.13 (0.07) — — (0.07) 19.74 6.06 1.01 1.00 1.88 45 16612-31-2016 18.11 0.40 0.78 1.18 (0.61) — — (0.61) 18.68 6.69 0.94 .
3 0.93 .
3 2.11 51 14712-31-2015 17.97 0.32 0.13 0.45 (0.31) — — (0.31) 18.11 2.46 0.99 0.99 1.80 55 15212-31-2014 13.86 0.27 4.08 4.35 (0.24) — — (0.24) 17.97 31.52 0.99 0.99 1.65 66 13112-31-2013 14.16 0.27 (0.32) (0.05) (0.25) — — (0.25) 13.86 (0.38) 1.00 0.99 1.80 58 104
Series NAV
12-31-2017 18.53 0.41 0.76 1.17 (0.11) — — (0.11) 19.59 6.26 0.76 0.75 2.15 254 16612-31-2016 17.97 0.45 0.77 1.22 (0.66) — — (0.66) 18.53 6.96 0.69 .
3 0.69 .
3 2.37 267 14712-31-2015 17.84 0.38 0.10 0.48 (0.35) — — (0.35) 17.97 2.80 0.74 0.74 2.12 271 15212-31-2014 13.76 0.31 4.05 4.36 (0.28) — — (0.28) 17.84 31.75 0.74 0.74 1.93 283 13112-31-2013 14.05 0.31 (0.31) — .
4 (0.29) — — (0.29) 13.76 (0.05) 0.75 0.74 2.10 224 104
1 Based on average daily shares outstanding.2 Total returns would have been lower had certain expenses not been reduced during the applicable periods.3 Includes reimbursement for overbilling of custody expenses in prior years of 0.06%.4 Less than $0.005 per share.
.322
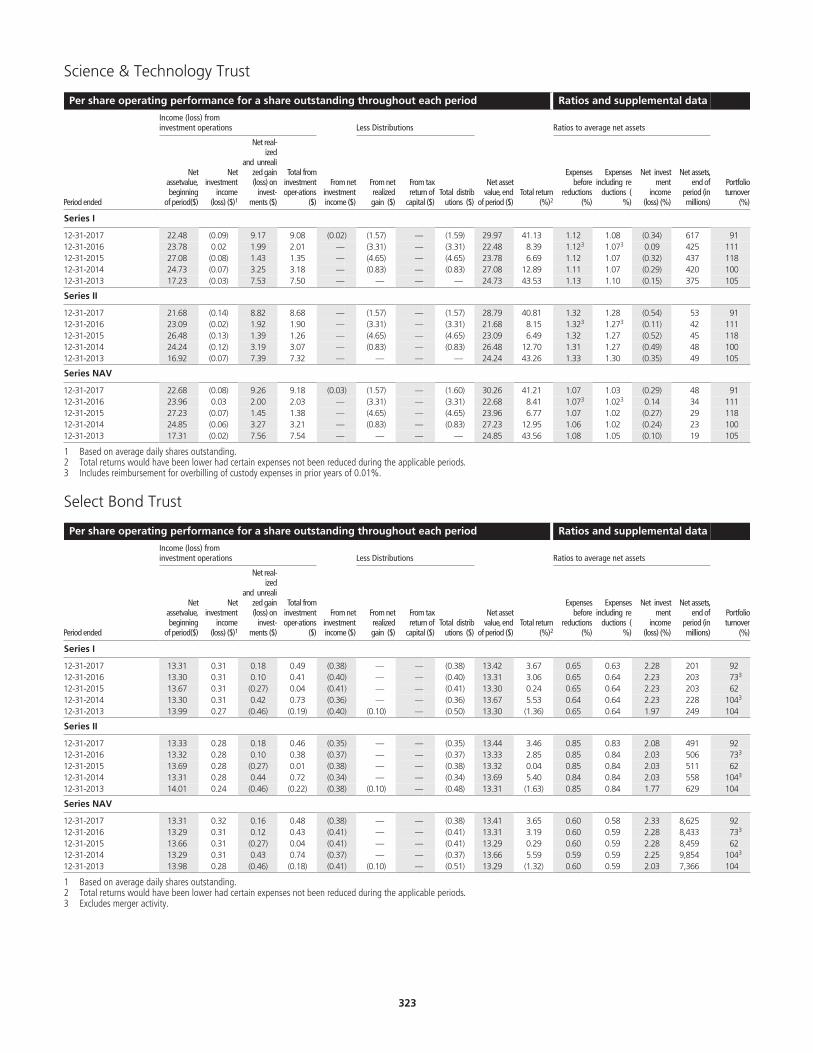
Science & Technology Trust
Per share operating performance for a share outstanding throughout each period Ratios and supplemental data
Income (loss) frominvestment operations Less Distributions Ratios to average net assets
Period ended
Netassetvalue,beginning
of period($)
Netinvestment
income(loss) ($)1
Net real-ized
and unrealized gain(loss) on
invest-ments ($)
Total frominvestmentoper-ations
($)
From netinvestmentincome ($)
From netrealizedgain ($)
From taxreturn of
capital ($)Total distrib
utions ($)
Net assetvalue, end
of period ($)Total return
(%)2
Expensesbefore
reductions(%)
Expensesincluding re
ductions (%)
Net investment
income(loss) (%)
Net assets,end of
period (inmillions)
Portfolioturnover
(%)
Series I
12-31-2017 22.48 (0.09) 9.17 9.08 (0.02) (1.57) — (1.59) 29.97 41.13 1.12 1.08 (0.34) 617 9112-31-2016 23.78 0.02 1.99 2.01 — (3.31) — (3.31) 22.48 8.39 1.12 .
3 1.07 .
3 0.09 425 11112-31-2015 27.08 (0.08) 1.43 1.35 — (4.65) — (4.65) 23.78 6.69 1.12 1.07 (0.32) 437 11812-31-2014 24.73 (0.07) 3.25 3.18 — (0.83) — (0.83) 27.08 12.89 1.11 1.07 (0.29) 420 10012-31-2013 17.23 (0.03) 7.53 7.50 — — — — 24.73 43.53 1.13 1.10 (0.15) 375 105
Series II
12-31-2017 21.68 (0.14) 8.82 8.68 — (1.57) — (1.57) 28.79 40.81 1.32 1.28 (0.54) 53 9112-31-2016 23.09 (0.02) 1.92 1.90 — (3.31) — (3.31) 21.68 8.15 1.32 .
3 1.27 .
3 (0.11) 42 11112-31-2015 26.48 (0.13) 1.39 1.26 — (4.65) — (4.65) 23.09 6.49 1.32 1.27 (0.52) 45 11812-31-2014 24.24 (0.12) 3.19 3.07 — (0.83) — (0.83) 26.48 12.70 1.31 1.27 (0.49) 48 10012-31-2013 16.92 (0.07) 7.39 7.32 — — — — 24.24 43.26 1.33 1.30 (0.35) 49 105
Series NAV
12-31-2017 22.68 (0.08) 9.26 9.18 (0.03) (1.57) — (1.60) 30.26 41.21 1.07 1.03 (0.29) 48 9112-31-2016 23.96 0.03 2.00 2.03 — (3.31) — (3.31) 22.68 8.41 1.07 .
3 1.02 .
3 0.14 34 11112-31-2015 27.23 (0.07) 1.45 1.38 — (4.65) — (4.65) 23.96 6.77 1.07 1.02 (0.27) 29 11812-31-2014 24.85 (0.06) 3.27 3.21 — (0.83) — (0.83) 27.23 12.95 1.06 1.02 (0.24) 23 10012-31-2013 17.31 (0.02) 7.56 7.54 — — — — 24.85 43.56 1.08 1.05 (0.10) 19 105
1 Based on average daily shares outstanding.2 Total returns would have been lower had certain expenses not been reduced during the applicable periods.3 Includes reimbursement for overbilling of custody expenses in prior years of 0.01%.
Select Bond Trust
Per share operating performance for a share outstanding throughout each period Ratios and supplemental data
Income (loss) frominvestment operations Less Distributions Ratios to average net assets
Period ended
Netassetvalue,beginning
of period($)
Netinvestment
income(loss) ($)1
Net real-ized
and unrealized gain(loss) on
invest-ments ($)
Total frominvestmentoper-ations
($)
From netinvestmentincome ($)
From netrealizedgain ($)
From taxreturn of
capital ($)Total distrib
utions ($)
Net assetvalue, end
of period ($)Total return
(%)2
Expensesbefore
reductions(%)
Expensesincluding re
ductions (%)
Net investment
income(loss) (%)
Net assets,end of
period (inmillions)
Portfolioturnover
(%)
Series I
12-31-2017 13.31 0.31 0.18 0.49 (0.38) — — (0.38) 13.42 3.67 0.65 0.63 2.28 201 9212-31-2016 13.30 0.31 0.10 0.41 (0.40) — — (0.40) 13.31 3.06 0.65 0.64 2.23 203 73 .
3
12-31-2015 13.67 0.31 (0.27) 0.04 (0.41) — — (0.41) 13.30 0.24 0.65 0.64 2.23 203 6212-31-2014 13.30 0.31 0.42 0.73 (0.36) — — (0.36) 13.67 5.53 0.64 0.64 2.23 228 104 .
3
12-31-2013 13.99 0.27 (0.46) (0.19) (0.40) (0.10) — (0.50) 13.30 (1.36) 0.65 0.64 1.97 249 104
Series II
12-31-2017 13.33 0.28 0.18 0.46 (0.35) — — (0.35) 13.44 3.46 0.85 0.83 2.08 491 9212-31-2016 13.32 0.28 0.10 0.38 (0.37) — — (0.37) 13.33 2.85 0.85 0.84 2.03 506 73 .
3
12-31-2015 13.69 0.28 (0.27) 0.01 (0.38) — — (0.38) 13.32 0.04 0.85 0.84 2.03 511 6212-31-2014 13.31 0.28 0.44 0.72 (0.34) — — (0.34) 13.69 5.40 0.84 0.84 2.03 558 104 .
3
12-31-2013 14.01 0.24 (0.46) (0.22) (0.38) (0.10) — (0.48) 13.31 (1.63) 0.85 0.84 1.77 629 104
Series NAV
12-31-2017 13.31 0.32 0.16 0.48 (0.38) — — (0.38) 13.41 3.65 0.60 0.58 2.33 8,625 9212-31-2016 13.29 0.31 0.12 0.43 (0.41) — — (0.41) 13.31 3.19 0.60 0.59 2.28 8,433 73 .
3
12-31-2015 13.66 0.31 (0.27) 0.04 (0.41) — — (0.41) 13.29 0.29 0.60 0.59 2.28 8,459 6212-31-2014 13.29 0.31 0.43 0.74 (0.37) — — (0.37) 13.66 5.59 0.59 0.59 2.25 9,854 104 .
3
12-31-2013 13.98 0.28 (0.46) (0.18) (0.41) (0.10) — (0.51) 13.29 (1.32) 0.60 0.59 2.03 7,366 104
1 Based on average daily shares outstanding.2 Total returns would have been lower had certain expenses not been reduced during the applicable periods.3 Excludes merger activity.
.323
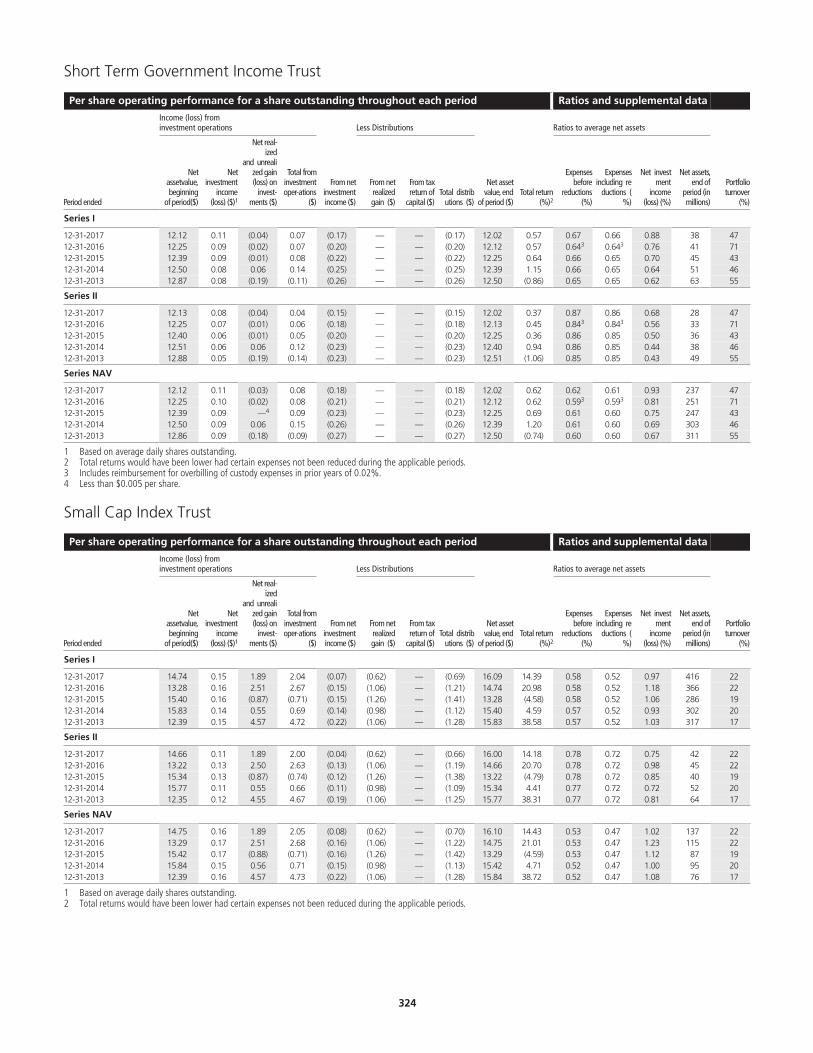
Short Term Government Income Trust
Per share operating performance for a share outstanding throughout each period Ratios and supplemental data
Income (loss) frominvestment operations Less Distributions Ratios to average net assets
Period ended
Netassetvalue,beginning
of period($)
Netinvestment
income(loss) ($)1
Net real-ized
and unrealized gain(loss) on
invest-ments ($)
Total frominvestmentoper-ations
($)
From netinvestmentincome ($)
From netrealizedgain ($)
From taxreturn of
capital ($)Total distrib
utions ($)
Net assetvalue, end
of period ($)Total return
(%)2
Expensesbefore
reductions(%)
Expensesincluding re
ductions (%)
Net investment
income(loss) (%)
Net assets,end of
period (inmillions)
Portfolioturnover
(%)
Series I
12-31-2017 12.12 0.11 (0.04) 0.07 (0.17) — — (0.17) 12.02 0.57 0.67 0.66 0.88 38 4712-31-2016 12.25 0.09 (0.02) 0.07 (0.20) — — (0.20) 12.12 0.57 0.64 .
3 0.64 .
3 0.76 41 7112-31-2015 12.39 0.09 (0.01) 0.08 (0.22) — — (0.22) 12.25 0.64 0.66 0.65 0.70 45 4312-31-2014 12.50 0.08 0.06 0.14 (0.25) — — (0.25) 12.39 1.15 0.66 0.65 0.64 51 4612-31-2013 12.87 0.08 (0.19) (0.11) (0.26) — — (0.26) 12.50 (0.86) 0.65 0.65 0.62 63 55
Series II
12-31-2017 12.13 0.08 (0.04) 0.04 (0.15) — — (0.15) 12.02 0.37 0.87 0.86 0.68 28 4712-31-2016 12.25 0.07 (0.01) 0.06 (0.18) — — (0.18) 12.13 0.45 0.84 .
3 0.84 .
3 0.56 33 7112-31-2015 12.40 0.06 (0.01) 0.05 (0.20) — — (0.20) 12.25 0.36 0.86 0.85 0.50 36 4312-31-2014 12.51 0.06 0.06 0.12 (0.23) — — (0.23) 12.40 0.94 0.86 0.85 0.44 38 4612-31-2013 12.88 0.05 (0.19) (0.14) (0.23) — — (0.23) 12.51 (1.06) 0.85 0.85 0.43 49 55
Series NAV
12-31-2017 12.12 0.11 (0.03) 0.08 (0.18) — — (0.18) 12.02 0.62 0.62 0.61 0.93 237 4712-31-2016 12.25 0.10 (0.02) 0.08 (0.21) — — (0.21) 12.12 0.62 0.59 .
3 0.59 .
3 0.81 251 7112-31-2015 12.39 0.09 — .
4 0.09 (0.23) — — (0.23) 12.25 0.69 0.61 0.60 0.75 247 4312-31-2014 12.50 0.09 0.06 0.15 (0.26) — — (0.26) 12.39 1.20 0.61 0.60 0.69 303 4612-31-2013 12.86 0.09 (0.18) (0.09) (0.27) — — (0.27) 12.50 (0.74) 0.60 0.60 0.67 311 55
1 Based on average daily shares outstanding.2 Total returns would have been lower had certain expenses not been reduced during the applicable periods.3 Includes reimbursement for overbilling of custody expenses in prior years of 0.02%.4 Less than $0.005 per share.
Small Cap Index Trust
Per share operating performance for a share outstanding throughout each period Ratios and supplemental data
Income (loss) frominvestment operations Less Distributions Ratios to average net assets
Period ended
Netassetvalue,beginning
of period($)
Netinvestment
income(loss) ($)1
Net real-ized
and unrealized gain(loss) on
invest-ments ($)
Total frominvestmentoper-ations
($)
From netinvestmentincome ($)
From netrealizedgain ($)
From taxreturn of
capital ($)Total distrib
utions ($)
Net assetvalue, end
of period ($)Total return
(%)2
Expensesbefore
reductions(%)
Expensesincluding re
ductions (%)
Net investment
income(loss) (%)
Net assets,end of
period (inmillions)
Portfolioturnover
(%)
Series I
12-31-2017 14.74 0.15 1.89 2.04 (0.07) (0.62) — (0.69) 16.09 14.39 0.58 0.52 0.97 416 2212-31-2016 13.28 0.16 2.51 2.67 (0.15) (1.06) — (1.21) 14.74 20.98 0.58 0.52 1.18 366 2212-31-2015 15.40 0.16 (0.87) (0.71) (0.15) (1.26) — (1.41) 13.28 (4.58) 0.58 0.52 1.06 286 1912-31-2014 15.83 0.14 0.55 0.69 (0.14) (0.98) — (1.12) 15.40 4.59 0.57 0.52 0.93 302 2012-31-2013 12.39 0.15 4.57 4.72 (0.22) (1.06) — (1.28) 15.83 38.58 0.57 0.52 1.03 317 17
Series II
12-31-2017 14.66 0.11 1.89 2.00 (0.04) (0.62) — (0.66) 16.00 14.18 0.78 0.72 0.75 42 2212-31-2016 13.22 0.13 2.50 2.63 (0.13) (1.06) — (1.19) 14.66 20.70 0.78 0.72 0.98 45 2212-31-2015 15.34 0.13 (0.87) (0.74) (0.12) (1.26) — (1.38) 13.22 (4.79) 0.78 0.72 0.85 40 1912-31-2014 15.77 0.11 0.55 0.66 (0.11) (0.98) — (1.09) 15.34 4.41 0.77 0.72 0.72 52 2012-31-2013 12.35 0.12 4.55 4.67 (0.19) (1.06) — (1.25) 15.77 38.31 0.77 0.72 0.81 64 17
Series NAV
12-31-2017 14.75 0.16 1.89 2.05 (0.08) (0.62) — (0.70) 16.10 14.43 0.53 0.47 1.02 137 2212-31-2016 13.29 0.17 2.51 2.68 (0.16) (1.06) — (1.22) 14.75 21.01 0.53 0.47 1.23 115 2212-31-2015 15.42 0.17 (0.88) (0.71) (0.16) (1.26) — (1.42) 13.29 (4.59) 0.53 0.47 1.12 87 1912-31-2014 15.84 0.15 0.56 0.71 (0.15) (0.98) — (1.13) 15.42 4.71 0.52 0.47 1.00 95 2012-31-2013 12.39 0.16 4.57 4.73 (0.22) (1.06) — (1.28) 15.84 38.72 0.52 0.47 1.08 76 17
1 Based on average daily shares outstanding.2 Total returns would have been lower had certain expenses not been reduced during the applicable periods.
.324
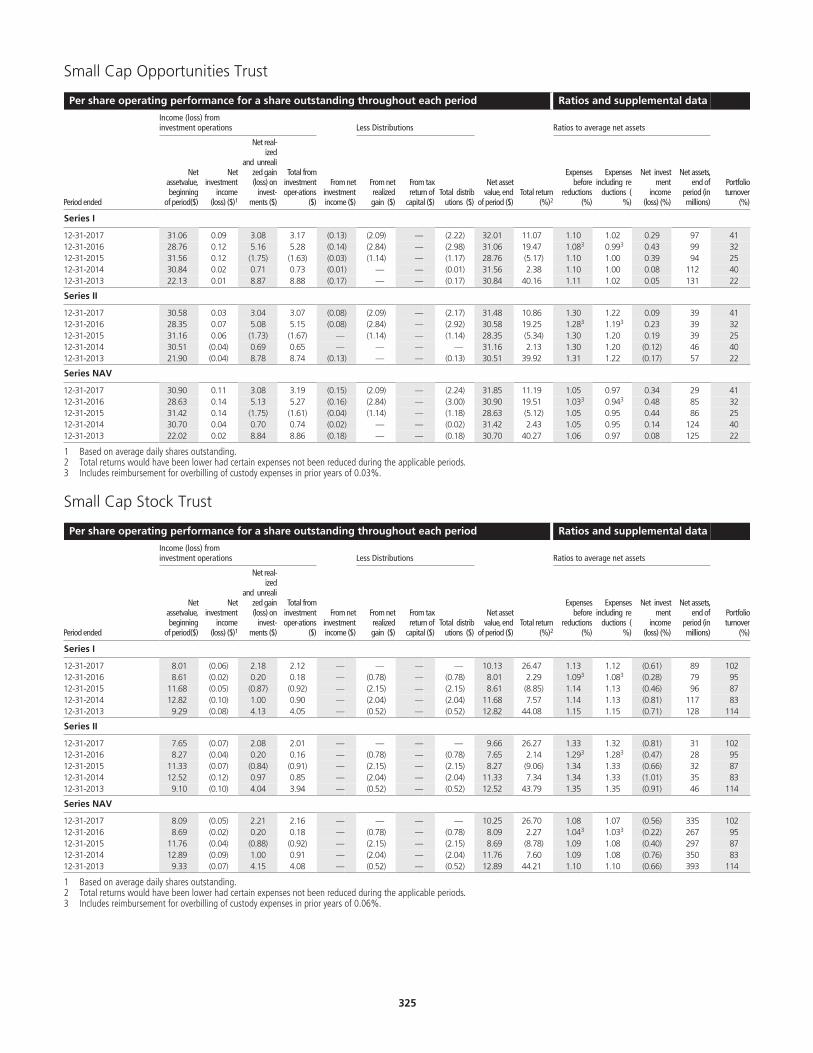
Small Cap Opportunities Trust
Per share operating performance for a share outstanding throughout each period Ratios and supplemental data
Income (loss) frominvestment operations Less Distributions Ratios to average net assets
Period ended
Netassetvalue,beginning
of period($)
Netinvestment
income(loss) ($)1
Net real-ized
and unrealized gain(loss) on
invest-ments ($)
Total frominvestmentoper-ations
($)
From netinvestmentincome ($)
From netrealizedgain ($)
From taxreturn of
capital ($)Total distrib
utions ($)
Net assetvalue, end
of period ($)Total return
(%)2
Expensesbefore
reductions(%)
Expensesincluding re
ductions (%)
Net investment
income(loss) (%)
Net assets,end of
period (inmillions)
Portfolioturnover
(%)
Series I
12-31-2017 31.06 0.09 3.08 3.17 (0.13) (2.09) — (2.22) 32.01 11.07 1.10 1.02 0.29 97 4112-31-2016 28.76 0.12 5.16 5.28 (0.14) (2.84) — (2.98) 31.06 19.47 1.08 .
3 0.99 .
3 0.43 99 3212-31-2015 31.56 0.12 (1.75) (1.63) (0.03) (1.14) — (1.17) 28.76 (5.17) 1.10 1.00 0.39 94 2512-31-2014 30.84 0.02 0.71 0.73 (0.01) — — (0.01) 31.56 2.38 1.10 1.00 0.08 112 4012-31-2013 22.13 0.01 8.87 8.88 (0.17) — — (0.17) 30.84 40.16 1.11 1.02 0.05 131 22
Series II
12-31-2017 30.58 0.03 3.04 3.07 (0.08) (2.09) — (2.17) 31.48 10.86 1.30 1.22 0.09 39 4112-31-2016 28.35 0.07 5.08 5.15 (0.08) (2.84) — (2.92) 30.58 19.25 1.28 .
3 1.19 .
3 0.23 39 3212-31-2015 31.16 0.06 (1.73) (1.67) — (1.14) — (1.14) 28.35 (5.34) 1.30 1.20 0.19 39 2512-31-2014 30.51 (0.04) 0.69 0.65 — — — — 31.16 2.13 1.30 1.20 (0.12) 46 4012-31-2013 21.90 (0.04) 8.78 8.74 (0.13) — — (0.13) 30.51 39.92 1.31 1.22 (0.17) 57 22
Series NAV
12-31-2017 30.90 0.11 3.08 3.19 (0.15) (2.09) — (2.24) 31.85 11.19 1.05 0.97 0.34 29 4112-31-2016 28.63 0.14 5.13 5.27 (0.16) (2.84) — (3.00) 30.90 19.51 1.03 .
3 0.94 .
3 0.48 85 3212-31-2015 31.42 0.14 (1.75) (1.61) (0.04) (1.14) — (1.18) 28.63 (5.12) 1.05 0.95 0.44 86 2512-31-2014 30.70 0.04 0.70 0.74 (0.02) — — (0.02) 31.42 2.43 1.05 0.95 0.14 124 4012-31-2013 22.02 0.02 8.84 8.86 (0.18) — — (0.18) 30.70 40.27 1.06 0.97 0.08 125 22
1 Based on average daily shares outstanding.2 Total returns would have been lower had certain expenses not been reduced during the applicable periods.3 Includes reimbursement for overbilling of custody expenses in prior years of 0.03%.
Small Cap Stock Trust
Per share operating performance for a share outstanding throughout each period Ratios and supplemental data
Income (loss) frominvestment operations Less Distributions Ratios to average net assets
Period ended
Netassetvalue,beginning
of period($)
Netinvestment
income(loss) ($)1
Net real-ized
and unrealized gain(loss) on
invest-ments ($)
Total frominvestmentoper-ations
($)
From netinvestmentincome ($)
From netrealizedgain ($)
From taxreturn of
capital ($)Total distrib
utions ($)
Net assetvalue, end
of period ($)Total return
(%)2
Expensesbefore
reductions(%)
Expensesincluding re
ductions (%)
Net investment
income(loss) (%)
Net assets,end of
period (inmillions)
Portfolioturnover
(%)
Series I
12-31-2017 8.01 (0.06) 2.18 2.12 — — — — 10.13 26.47 1.13 1.12 (0.61) 89 10212-31-2016 8.61 (0.02) 0.20 0.18 — (0.78) — (0.78) 8.01 2.29 1.09 .
3 1.08 .
3 (0.28) 79 9512-31-2015 11.68 (0.05) (0.87) (0.92) — (2.15) — (2.15) 8.61 (8.85) 1.14 1.13 (0.46) 96 8712-31-2014 12.82 (0.10) 1.00 0.90 — (2.04) — (2.04) 11.68 7.57 1.14 1.13 (0.81) 117 8312-31-2013 9.29 (0.08) 4.13 4.05 — (0.52) — (0.52) 12.82 44.08 1.15 1.15 (0.71) 128 114
Series II
12-31-2017 7.65 (0.07) 2.08 2.01 — — — — 9.66 26.27 1.33 1.32 (0.81) 31 10212-31-2016 8.27 (0.04) 0.20 0.16 — (0.78) — (0.78) 7.65 2.14 1.29 .
3 1.28 .
3 (0.47) 28 9512-31-2015 11.33 (0.07) (0.84) (0.91) — (2.15) — (2.15) 8.27 (9.06) 1.34 1.33 (0.66) 32 8712-31-2014 12.52 (0.12) 0.97 0.85 — (2.04) — (2.04) 11.33 7.34 1.34 1.33 (1.01) 35 8312-31-2013 9.10 (0.10) 4.04 3.94 — (0.52) — (0.52) 12.52 43.79 1.35 1.35 (0.91) 46 114
Series NAV
12-31-2017 8.09 (0.05) 2.21 2.16 — — — — 10.25 26.70 1.08 1.07 (0.56) 335 10212-31-2016 8.69 (0.02) 0.20 0.18 — (0.78) — (0.78) 8.09 2.27 1.04 .
3 1.03 .
3 (0.22) 267 9512-31-2015 11.76 (0.04) (0.88) (0.92) — (2.15) — (2.15) 8.69 (8.78) 1.09 1.08 (0.40) 297 8712-31-2014 12.89 (0.09) 1.00 0.91 — (2.04) — (2.04) 11.76 7.60 1.09 1.08 (0.76) 350 8312-31-2013 9.33 (0.07) 4.15 4.08 — (0.52) — (0.52) 12.89 44.21 1.10 1.10 (0.66) 393 114
1 Based on average daily shares outstanding.2 Total returns would have been lower had certain expenses not been reduced during the applicable periods.3 Includes reimbursement for overbilling of custody expenses in prior years of 0.06%.
.325
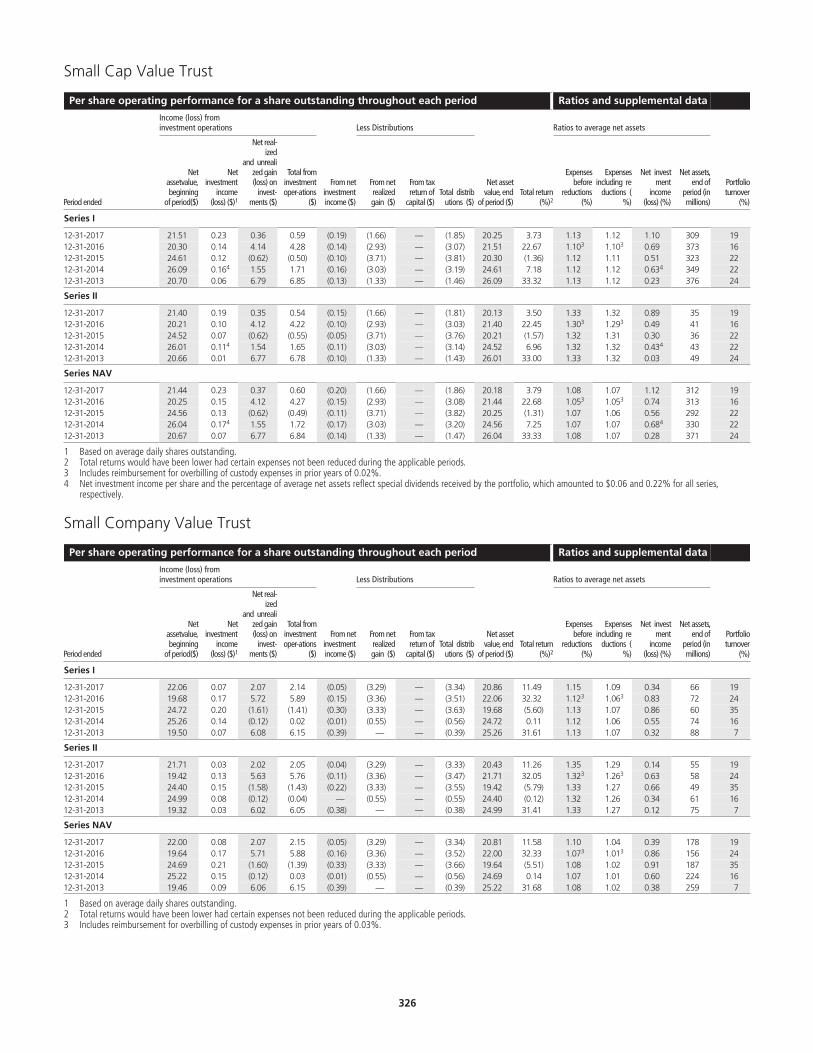
Small Cap Value Trust
Per share operating performance for a share outstanding throughout each period Ratios and supplemental data
Income (loss) frominvestment operations Less Distributions Ratios to average net assets
Period ended
Netassetvalue,beginning
of period($)
Netinvestment
income(loss) ($)1
Net real-ized
and unrealized gain(loss) on
invest-ments ($)
Total frominvestmentoper-ations
($)
From netinvestmentincome ($)
From netrealizedgain ($)
From taxreturn of
capital ($)Total distrib
utions ($)
Net assetvalue, end
of period ($)Total return
(%)2
Expensesbefore
reductions(%)
Expensesincluding re
ductions (%)
Net investment
income(loss) (%)
Net assets,end of
period (inmillions)
Portfolioturnover
(%)
Series I
12-31-2017 21.51 0.23 0.36 0.59 (0.19) (1.66) — (1.85) 20.25 3.73 1.13 1.12 1.10 309 1912-31-2016 20.30 0.14 4.14 4.28 (0.14) (2.93) — (3.07) 21.51 22.67 1.10 .
3 1.10 .
3 0.69 373 1612-31-2015 24.61 0.12 (0.62) (0.50) (0.10) (3.71) — (3.81) 20.30 (1.36) 1.12 1.11 0.51 323 2212-31-2014 26.09 0.16 .
4 1.55 1.71 (0.16) (3.03) — (3.19) 24.61 7.18 1.12 1.12 0.63 .
4 349 2212-31-2013 20.70 0.06 6.79 6.85 (0.13) (1.33) — (1.46) 26.09 33.32 1.13 1.12 0.23 376 24
Series II
12-31-2017 21.40 0.19 0.35 0.54 (0.15) (1.66) — (1.81) 20.13 3.50 1.33 1.32 0.89 35 1912-31-2016 20.21 0.10 4.12 4.22 (0.10) (2.93) — (3.03) 21.40 22.45 1.30 .
3 1.29 .
3 0.49 41 1612-31-2015 24.52 0.07 (0.62) (0.55) (0.05) (3.71) — (3.76) 20.21 (1.57) 1.32 1.31 0.30 36 2212-31-2014 26.01 0.11 .
4 1.54 1.65 (0.11) (3.03) — (3.14) 24.52 6.96 1.32 1.32 0.43 .
4 43 2212-31-2013 20.66 0.01 6.77 6.78 (0.10) (1.33) — (1.43) 26.01 33.00 1.33 1.32 0.03 49 24
Series NAV
12-31-2017 21.44 0.23 0.37 0.60 (0.20) (1.66) — (1.86) 20.18 3.79 1.08 1.07 1.12 312 1912-31-2016 20.25 0.15 4.12 4.27 (0.15) (2.93) — (3.08) 21.44 22.68 1.05 .
3 1.05 .
3 0.74 313 1612-31-2015 24.56 0.13 (0.62) (0.49) (0.11) (3.71) — (3.82) 20.25 (1.31) 1.07 1.06 0.56 292 2212-31-2014 26.04 0.17 .
4 1.55 1.72 (0.17) (3.03) — (3.20) 24.56 7.25 1.07 1.07 0.68 .
4 330 2212-31-2013 20.67 0.07 6.77 6.84 (0.14) (1.33) — (1.47) 26.04 33.33 1.08 1.07 0.28 371 24
1 Based on average daily shares outstanding.2 Total returns would have been lower had certain expenses not been reduced during the applicable periods.3 Includes reimbursement for overbilling of custody expenses in prior years of 0.02%.4 Net investment income per share and the percentage of average net assets reflect special dividends received by the portfolio, which amounted to $0.06 and 0.22% for all series,
respectively.
Small Company Value Trust
Per share operating performance for a share outstanding throughout each period Ratios and supplemental data
Income (loss) frominvestment operations Less Distributions Ratios to average net assets
Period ended
Netassetvalue,beginning
of period($)
Netinvestment
income(loss) ($)1
Net real-ized
and unrealized gain(loss) on
invest-ments ($)
Total frominvestmentoper-ations
($)
From netinvestmentincome ($)
From netrealizedgain ($)
From taxreturn of
capital ($)Total distrib
utions ($)
Net assetvalue, end
of period ($)Total return
(%)2
Expensesbefore
reductions(%)
Expensesincluding re
ductions (%)
Net investment
income(loss) (%)
Net assets,end of
period (inmillions)
Portfolioturnover
(%)
Series I
12-31-2017 22.06 0.07 2.07 2.14 (0.05) (3.29) — (3.34) 20.86 11.49 1.15 1.09 0.34 66 1912-31-2016 19.68 0.17 5.72 5.89 (0.15) (3.36) — (3.51) 22.06 32.32 1.12 .
3 1.06 .
3 0.83 72 2412-31-2015 24.72 0.20 (1.61) (1.41) (0.30) (3.33) — (3.63) 19.68 (5.60) 1.13 1.07 0.86 60 3512-31-2014 25.26 0.14 (0.12) 0.02 (0.01) (0.55) — (0.56) 24.72 0.11 1.12 1.06 0.55 74 1612-31-2013 19.50 0.07 6.08 6.15 (0.39) — — (0.39) 25.26 31.61 1.13 1.07 0.32 88 7
Series II
12-31-2017 21.71 0.03 2.02 2.05 (0.04) (3.29) — (3.33) 20.43 11.26 1.35 1.29 0.14 55 1912-31-2016 19.42 0.13 5.63 5.76 (0.11) (3.36) — (3.47) 21.71 32.05 1.32 .
3 1.26 .
3 0.63 58 2412-31-2015 24.40 0.15 (1.58) (1.43) (0.22) (3.33) — (3.55) 19.42 (5.79) 1.33 1.27 0.66 49 3512-31-2014 24.99 0.08 (0.12) (0.04) — (0.55) — (0.55) 24.40 (0.12) 1.32 1.26 0.34 61 1612-31-2013 19.32 0.03 6.02 6.05 (0.38) — — (0.38) 24.99 31.41 1.33 1.27 0.12 75 7
Series NAV
12-31-2017 22.00 0.08 2.07 2.15 (0.05) (3.29) — (3.34) 20.81 11.58 1.10 1.04 0.39 178 1912-31-2016 19.64 0.17 5.71 5.88 (0.16) (3.36) — (3.52) 22.00 32.33 1.07 .
3 1.01 .
3 0.86 156 2412-31-2015 24.69 0.21 (1.60) (1.39) (0.33) (3.33) — (3.66) 19.64 (5.51) 1.08 1.02 0.91 187 3512-31-2014 25.22 0.15 (0.12) 0.03 (0.01) (0.55) — (0.56) 24.69 0.14 1.07 1.01 0.60 224 1612-31-2013 19.46 0.09 6.06 6.15 (0.39) — — (0.39) 25.22 31.68 1.08 1.02 0.38 259 7
1 Based on average daily shares outstanding.2 Total returns would have been lower had certain expenses not been reduced during the applicable periods.3 Includes reimbursement for overbilling of custody expenses in prior years of 0.03%.
.326
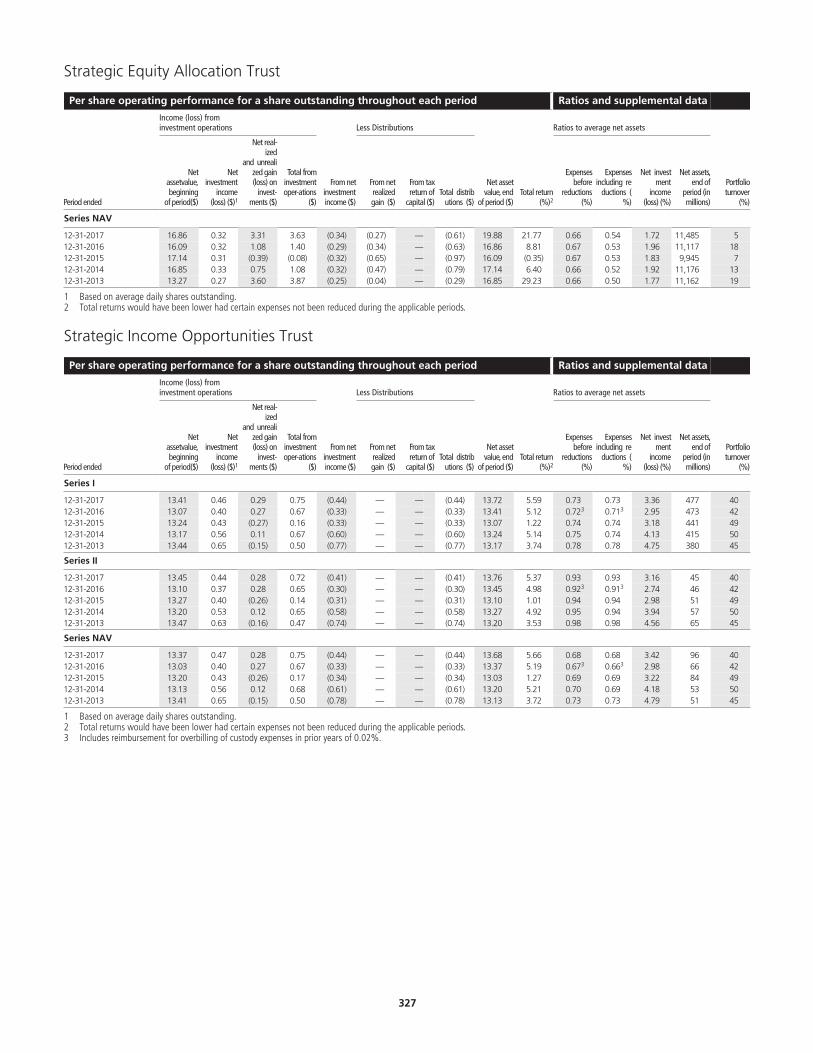
Strategic Equity Allocation Trust
Per share operating performance for a share outstanding throughout each period Ratios and supplemental data
Income (loss) frominvestment operations Less Distributions Ratios to average net assets
Period ended
Netassetvalue,beginning
of period($)
Netinvestment
income(loss) ($)1
Net real-ized
and unrealized gain(loss) on
invest-ments ($)
Total frominvestmentoper-ations
($)
From netinvestmentincome ($)
From netrealizedgain ($)
From taxreturn of
capital ($)Total distrib
utions ($)
Net assetvalue, end
of period ($)Total return
(%)2
Expensesbefore
reductions(%)
Expensesincluding re
ductions (%)
Net investment
income(loss) (%)
Net assets,end of
period (inmillions)
Portfolioturnover
(%)
Series NAV
12-31-2017 16.86 0.32 3.31 3.63 (0.34) (0.27) — (0.61) 19.88 21.77 0.66 0.54 1.72 11,485 512-31-2016 16.09 0.32 1.08 1.40 (0.29) (0.34) — (0.63) 16.86 8.81 0.67 0.53 1.96 11,117 1812-31-2015 17.14 0.31 (0.39) (0.08) (0.32) (0.65) — (0.97) 16.09 (0.35) 0.67 0.53 1.83 9,945 712-31-2014 16.85 0.33 0.75 1.08 (0.32) (0.47) — (0.79) 17.14 6.40 0.66 0.52 1.92 11,176 1312-31-2013 13.27 0.27 3.60 3.87 (0.25) (0.04) — (0.29) 16.85 29.23 0.66 0.50 1.77 11,162 19
1 Based on average daily shares outstanding.2 Total returns would have been lower had certain expenses not been reduced during the applicable periods.
Strategic Income Opportunities Trust
Per share operating performance for a share outstanding throughout each period Ratios and supplemental data
Income (loss) frominvestment operations Less Distributions Ratios to average net assets
Period ended
Netassetvalue,beginning
of period($)
Netinvestment
income(loss) ($)1
Net real-ized
and unrealized gain(loss) on
invest-ments ($)
Total frominvestmentoper-ations
($)
From netinvestmentincome ($)
From netrealizedgain ($)
From taxreturn of
capital ($)Total distrib
utions ($)
Net assetvalue, end
of period ($)Total return
(%)2
Expensesbefore
reductions(%)
Expensesincluding re
ductions (%)
Net investment
income(loss) (%)
Net assets,end of
period (inmillions)
Portfolioturnover
(%)
Series I
12-31-2017 13.41 0.46 0.29 0.75 (0.44) — — (0.44) 13.72 5.59 0.73 0.73 3.36 477 4012-31-2016 13.07 0.40 0.27 0.67 (0.33) — — (0.33) 13.41 5.12 0.72 .
3 0.71 .
3 2.95 473 4212-31-2015 13.24 0.43 (0.27) 0.16 (0.33) — — (0.33) 13.07 1.22 0.74 0.74 3.18 441 4912-31-2014 13.17 0.56 0.11 0.67 (0.60) — — (0.60) 13.24 5.14 0.75 0.74 4.13 415 5012-31-2013 13.44 0.65 (0.15) 0.50 (0.77) — — (0.77) 13.17 3.74 0.78 0.78 4.75 380 45
Series II
12-31-2017 13.45 0.44 0.28 0.72 (0.41) — — (0.41) 13.76 5.37 0.93 0.93 3.16 45 4012-31-2016 13.10 0.37 0.28 0.65 (0.30) — — (0.30) 13.45 4.98 0.92 .
3 0.91 .
3 2.74 46 4212-31-2015 13.27 0.40 (0.26) 0.14 (0.31) — — (0.31) 13.10 1.01 0.94 0.94 2.98 51 4912-31-2014 13.20 0.53 0.12 0.65 (0.58) — — (0.58) 13.27 4.92 0.95 0.94 3.94 57 5012-31-2013 13.47 0.63 (0.16) 0.47 (0.74) — — (0.74) 13.20 3.53 0.98 0.98 4.56 65 45
Series NAV
12-31-2017 13.37 0.47 0.28 0.75 (0.44) — — (0.44) 13.68 5.66 0.68 0.68 3.42 96 4012-31-2016 13.03 0.40 0.27 0.67 (0.33) — — (0.33) 13.37 5.19 0.67 .
3 0.66 .
3 2.98 66 4212-31-2015 13.20 0.43 (0.26) 0.17 (0.34) — — (0.34) 13.03 1.27 0.69 0.69 3.22 84 4912-31-2014 13.13 0.56 0.12 0.68 (0.61) — — (0.61) 13.20 5.21 0.70 0.69 4.18 53 5012-31-2013 13.41 0.65 (0.15) 0.50 (0.78) — — (0.78) 13.13 3.72 0.73 0.73 4.79 51 45
1 Based on average daily shares outstanding.2 Total returns would have been lower had certain expenses not been reduced during the applicable periods.3 Includes reimbursement for overbilling of custody expenses in prior years of 0.02%.
.327
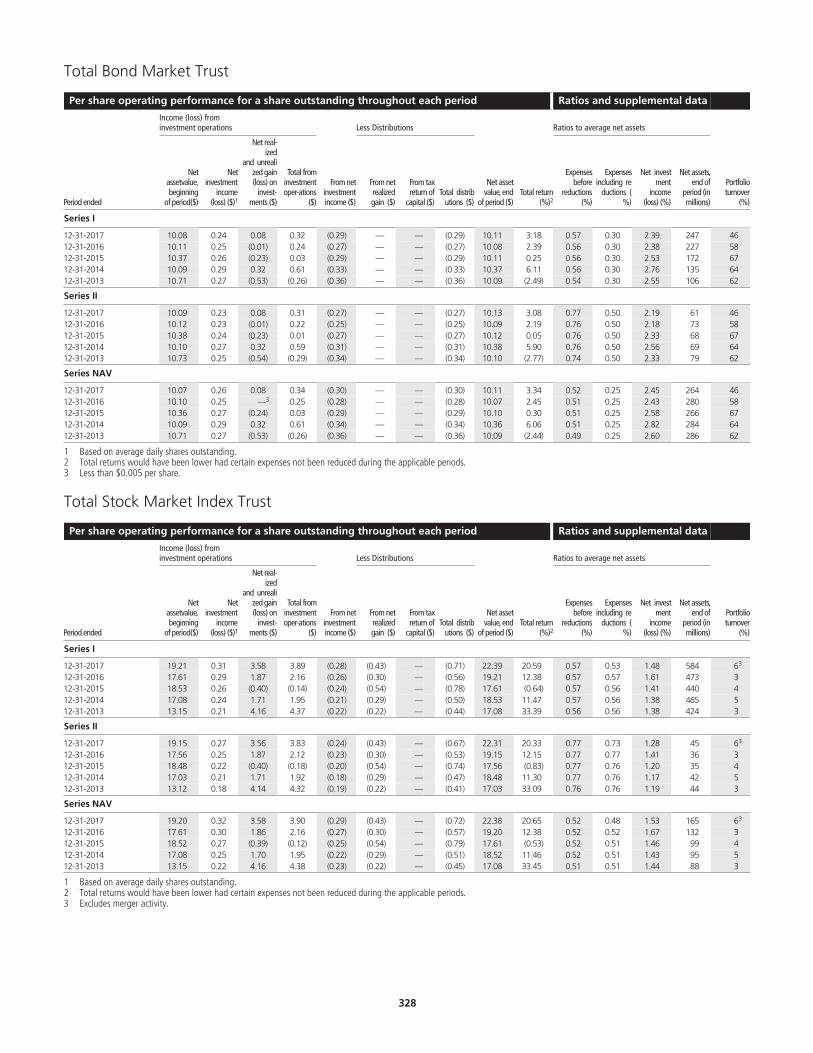
Total Bond Market Trust
Per share operating performance for a share outstanding throughout each period Ratios and supplemental data
Income (loss) frominvestment operations Less Distributions Ratios to average net assets
Period ended
Netassetvalue,beginning
of period($)
Netinvestment
income(loss) ($)1
Net real-ized
and unrealized gain(loss) on
invest-ments ($)
Total frominvestmentoper-ations
($)
From netinvestmentincome ($)
From netrealizedgain ($)
From taxreturn of
capital ($)Total distrib
utions ($)
Net assetvalue, end
of period ($)Total return
(%)2
Expensesbefore
reductions(%)
Expensesincluding re
ductions (%)
Net investment
income(loss) (%)
Net assets,end of
period (inmillions)
Portfolioturnover
(%)
Series I
12-31-2017 10.08 0.24 0.08 0.32 (0.29) — — (0.29) 10.11 3.18 0.57 0.30 2.39 247 4612-31-2016 10.11 0.25 (0.01) 0.24 (0.27) — — (0.27) 10.08 2.39 0.56 0.30 2.38 227 5812-31-2015 10.37 0.26 (0.23) 0.03 (0.29) — — (0.29) 10.11 0.25 0.56 0.30 2.53 172 6712-31-2014 10.09 0.29 0.32 0.61 (0.33) — — (0.33) 10.37 6.11 0.56 0.30 2.76 135 6412-31-2013 10.71 0.27 (0.53) (0.26) (0.36) — — (0.36) 10.09 (2.49) 0.54 0.30 2.55 106 62
Series II
12-31-2017 10.09 0.23 0.08 0.31 (0.27) — — (0.27) 10.13 3.08 0.77 0.50 2.19 61 4612-31-2016 10.12 0.23 (0.01) 0.22 (0.25) — — (0.25) 10.09 2.19 0.76 0.50 2.18 73 5812-31-2015 10.38 0.24 (0.23) 0.01 (0.27) — — (0.27) 10.12 0.05 0.76 0.50 2.33 68 6712-31-2014 10.10 0.27 0.32 0.59 (0.31) — — (0.31) 10.38 5.90 0.76 0.50 2.56 69 6412-31-2013 10.73 0.25 (0.54) (0.29) (0.34) — — (0.34) 10.10 (2.77) 0.74 0.50 2.33 79 62
Series NAV
12-31-2017 10.07 0.26 0.08 0.34 (0.30) — — (0.30) 10.11 3.34 0.52 0.25 2.45 264 4612-31-2016 10.10 0.25 — .
3 0.25 (0.28) — — (0.28) 10.07 2.45 0.51 0.25 2.43 280 5812-31-2015 10.36 0.27 (0.24) 0.03 (0.29) — — (0.29) 10.10 0.30 0.51 0.25 2.58 266 6712-31-2014 10.09 0.29 0.32 0.61 (0.34) — — (0.34) 10.36 6.06 0.51 0.25 2.82 284 6412-31-2013 10.71 0.27 (0.53) (0.26) (0.36) — — (0.36) 10.09 (2.44) 0.49 0.25 2.60 286 62
1 Based on average daily shares outstanding.2 Total returns would have been lower had certain expenses not been reduced during the applicable periods.3 Less than $0.005 per share.
Total Stock Market Index Trust
Per share operating performance for a share outstanding throughout each period Ratios and supplemental data
Income (loss) frominvestment operations Less Distributions Ratios to average net assets
Period ended
Netassetvalue,beginning
of period($)
Netinvestment
income(loss) ($)1
Net real-ized
and unrealized gain(loss) on
invest-ments ($)
Total frominvestmentoper-ations
($)
From netinvestmentincome ($)
From netrealizedgain ($)
From taxreturn of
capital ($)Total distrib
utions ($)
Net assetvalue, end
of period ($)Total return
(%)2
Expensesbefore
reductions(%)
Expensesincluding re
ductions (%)
Net investment
income(loss) (%)
Net assets,end of
period (inmillions)
Portfolioturnover
(%)
Series I
12-31-2017 19.21 0.31 3.58 3.89 (0.28) (0.43) — (0.71) 22.39 20.59 0.57 0.53 1.48 584 6 .
3
12-31-2016 17.61 0.29 1.87 2.16 (0.26) (0.30) — (0.56) 19.21 12.38 0.57 0.57 1.61 473 312-31-2015 18.53 0.26 (0.40) (0.14) (0.24) (0.54) — (0.78) 17.61 (0.64) 0.57 0.56 1.41 440 412-31-2014 17.08 0.24 1.71 1.95 (0.21) (0.29) — (0.50) 18.53 11.47 0.57 0.56 1.38 465 512-31-2013 13.15 0.21 4.16 4.37 (0.22) (0.22) — (0.44) 17.08 33.39 0.56 0.56 1.38 424 3
Series II
12-31-2017 19.15 0.27 3.56 3.83 (0.24) (0.43) — (0.67) 22.31 20.33 0.77 0.73 1.28 45 6 .
3
12-31-2016 17.56 0.25 1.87 2.12 (0.23) (0.30) — (0.53) 19.15 12.15 0.77 0.77 1.41 36 312-31-2015 18.48 0.22 (0.40) (0.18) (0.20) (0.54) — (0.74) 17.56 (0.83) 0.77 0.76 1.20 35 412-31-2014 17.03 0.21 1.71 1.92 (0.18) (0.29) — (0.47) 18.48 11.30 0.77 0.76 1.17 42 512-31-2013 13.12 0.18 4.14 4.32 (0.19) (0.22) — (0.41) 17.03 33.09 0.76 0.76 1.19 44 3
Series NAV
12-31-2017 19.20 0.32 3.58 3.90 (0.29) (0.43) — (0.72) 22.38 20.65 0.52 0.48 1.53 165 6 .
3
12-31-2016 17.61 0.30 1.86 2.16 (0.27) (0.30) — (0.57) 19.20 12.38 0.52 0.52 1.67 132 312-31-2015 18.52 0.27 (0.39) (0.12) (0.25) (0.54) — (0.79) 17.61 (0.53) 0.52 0.51 1.46 99 412-31-2014 17.08 0.25 1.70 1.95 (0.22) (0.29) — (0.51) 18.52 11.46 0.52 0.51 1.43 95 512-31-2013 13.15 0.22 4.16 4.38 (0.23) (0.22) — (0.45) 17.08 33.45 0.51 0.51 1.44 88 3
1 Based on average daily shares outstanding.2 Total returns would have been lower had certain expenses not been reduced during the applicable periods.3 Excludes merger activity.
.328
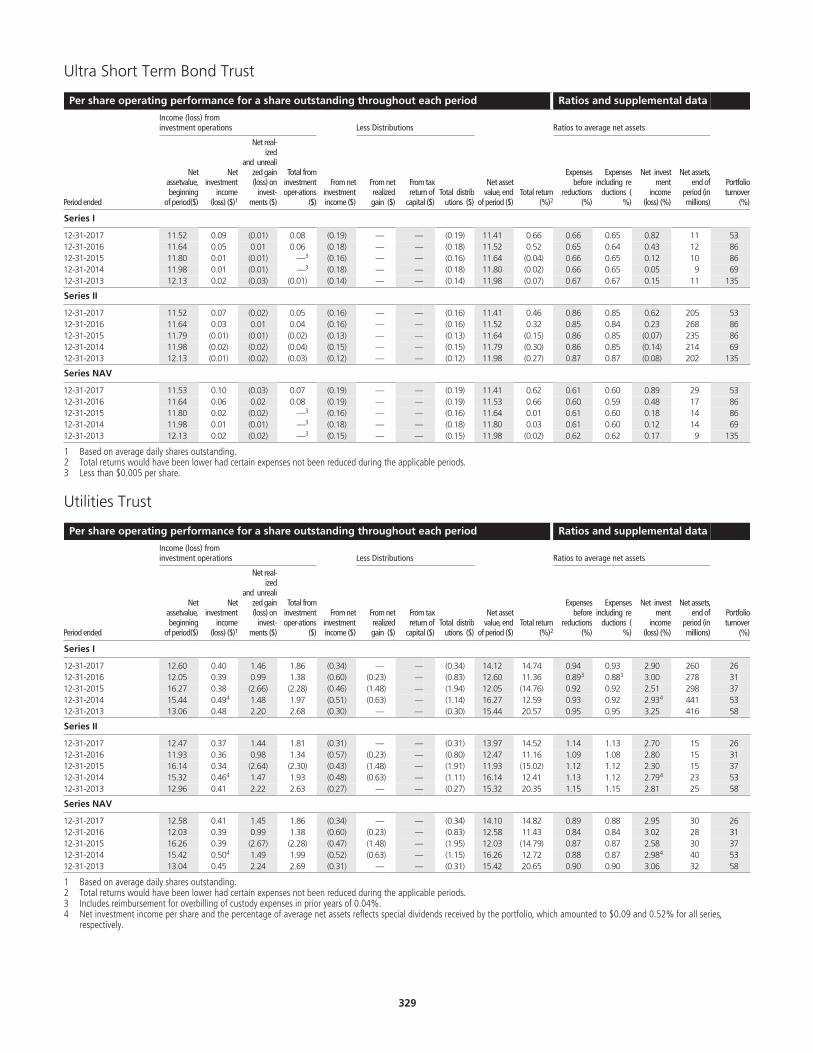
Ultra Short Term Bond Trust
Per share operating performance for a share outstanding throughout each period Ratios and supplemental data
Income (loss) frominvestment operations Less Distributions Ratios to average net assets
Period ended
Netassetvalue,beginning
of period($)
Netinvestment
income(loss) ($)1
Net real-ized
and unrealized gain(loss) on
invest-ments ($)
Total frominvestmentoper-ations
($)
From netinvestmentincome ($)
From netrealizedgain ($)
From taxreturn of
capital ($)Total distrib
utions ($)
Net assetvalue, end
of period ($)Total return
(%)2
Expensesbefore
reductions(%)
Expensesincluding re
ductions (%)
Net investment
income(loss) (%)
Net assets,end of
period (inmillions)
Portfolioturnover
(%)
Series I
12-31-2017 11.52 0.09 (0.01) 0.08 (0.19) — — (0.19) 11.41 0.66 0.66 0.65 0.82 11 5312-31-2016 11.64 0.05 0.01 0.06 (0.18) — — (0.18) 11.52 0.52 0.65 0.64 0.43 12 8612-31-2015 11.80 0.01 (0.01) — .
3 (0.16) — — (0.16) 11.64 (0.04) 0.66 0.65 0.12 10 8612-31-2014 11.98 0.01 (0.01) — .
3 (0.18) — — (0.18) 11.80 (0.02) 0.66 0.65 0.05 9 6912-31-2013 12.13 0.02 (0.03) (0.01) (0.14) — — (0.14) 11.98 (0.07) 0.67 0.67 0.15 11 135
Series II
12-31-2017 11.52 0.07 (0.02) 0.05 (0.16) — — (0.16) 11.41 0.46 0.86 0.85 0.62 205 5312-31-2016 11.64 0.03 0.01 0.04 (0.16) — — (0.16) 11.52 0.32 0.85 0.84 0.23 268 8612-31-2015 11.79 (0.01) (0.01) (0.02) (0.13) — — (0.13) 11.64 (0.15) 0.86 0.85 (0.07) 235 8612-31-2014 11.98 (0.02) (0.02) (0.04) (0.15) — — (0.15) 11.79 (0.30) 0.86 0.85 (0.14) 214 6912-31-2013 12.13 (0.01) (0.02) (0.03) (0.12) — — (0.12) 11.98 (0.27) 0.87 0.87 (0.08) 202 135
Series NAV
12-31-2017 11.53 0.10 (0.03) 0.07 (0.19) — — (0.19) 11.41 0.62 0.61 0.60 0.89 29 5312-31-2016 11.64 0.06 0.02 0.08 (0.19) — — (0.19) 11.53 0.66 0.60 0.59 0.48 17 8612-31-2015 11.80 0.02 (0.02) — .
3 (0.16) — — (0.16) 11.64 0.01 0.61 0.60 0.18 14 8612-31-2014 11.98 0.01 (0.01) — .
3 (0.18) — — (0.18) 11.80 0.03 0.61 0.60 0.12 14 6912-31-2013 12.13 0.02 (0.02) — .
3 (0.15) — — (0.15) 11.98 (0.02) 0.62 0.62 0.17 9 135
1 Based on average daily shares outstanding.2 Total returns would have been lower had certain expenses not been reduced during the applicable periods.3 Less than $0.005 per share.
Utilities Trust
Per share operating performance for a share outstanding throughout each period Ratios and supplemental data
Income (loss) frominvestment operations Less Distributions Ratios to average net assets
Period ended
Netassetvalue,beginning
of period($)
Netinvestment
income(loss) ($)1
Net real-ized
and unrealized gain(loss) on
invest-ments ($)
Total frominvestmentoper-ations
($)
From netinvestmentincome ($)
From netrealizedgain ($)
From taxreturn of
capital ($)Total distrib
utions ($)
Net assetvalue, end
of period ($)Total return
(%)2
Expensesbefore
reductions(%)
Expensesincluding re
ductions (%)
Net investment
income(loss) (%)
Net assets,end of
period (inmillions)
Portfolioturnover
(%)
Series I
12-31-2017 12.60 0.40 1.46 1.86 (0.34) — — (0.34) 14.12 14.74 0.94 0.93 2.90 260 2612-31-2016 12.05 0.39 0.99 1.38 (0.60) (0.23) — (0.83) 12.60 11.36 0.89 .
3 0.88 .
3 3.00 278 3112-31-2015 16.27 0.38 (2.66) (2.28) (0.46) (1.48) — (1.94) 12.05 (14.76) 0.92 0.92 2.51 298 3712-31-2014 15.44 0.49 .
4 1.48 1.97 (0.51) (0.63) — (1.14) 16.27 12.59 0.93 0.92 2.93 .
4 441 5312-31-2013 13.06 0.48 2.20 2.68 (0.30) — — (0.30) 15.44 20.57 0.95 0.95 3.25 416 58
Series II
12-31-2017 12.47 0.37 1.44 1.81 (0.31) — — (0.31) 13.97 14.52 1.14 1.13 2.70 15 2612-31-2016 11.93 0.36 0.98 1.34 (0.57) (0.23) — (0.80) 12.47 11.16 1.09 1.08 2.80 15 3112-31-2015 16.14 0.34 (2.64) (2.30) (0.43) (1.48) — (1.91) 11.93 (15.02) 1.12 1.12 2.30 15 3712-31-2014 15.32 0.46 .
4 1.47 1.93 (0.48) (0.63) — (1.11) 16.14 12.41 1.13 1.12 2.79 .
4 23 5312-31-2013 12.96 0.41 2.22 2.63 (0.27) — — (0.27) 15.32 20.35 1.15 1.15 2.81 25 58
Series NAV
12-31-2017 12.58 0.41 1.45 1.86 (0.34) — — (0.34) 14.10 14.82 0.89 0.88 2.95 30 2612-31-2016 12.03 0.39 0.99 1.38 (0.60) (0.23) — (0.83) 12.58 11.43 0.84 0.84 3.02 28 3112-31-2015 16.26 0.39 (2.67) (2.28) (0.47) (1.48) — (1.95) 12.03 (14.79) 0.87 0.87 2.58 30 3712-31-2014 15.42 0.50 .
4 1.49 1.99 (0.52) (0.63) — (1.15) 16.26 12.72 0.88 0.87 2.98 .
4 40 5312-31-2013 13.04 0.45 2.24 2.69 (0.31) — — (0.31) 15.42 20.65 0.90 0.90 3.06 32 58
1 Based on average daily shares outstanding.2 Total returns would have been lower had certain expenses not been reduced during the applicable periods.3 Includes reimbursement for overbilling of custody expenses in prior years of 0.04%.4 Net investment income per share and the percentage of average net assets reflects special dividends received by the portfolio, which amounted to $0.09 and 0.52% for all series,
respectively.
.329

Appendix ASchedule of Management Fees
Set forth below is the schedule of the annual percentage rates of the management fees for the funds. For certain funds the advisory or managementfee for the fund is calculated by applying to the net assets of the fund an annual fee rate, which is determined based on the application of the annualpercentage rates for the fund to the “Aggregate Net Assets” of the fund. Aggregate Net Assets of a fund include the net assets of the fund, and inmost cases, the net assets of one or more other John Hancock Fund Complex funds (or portions thereof) indicated below that have the samesubadvisor as the fund. If a fund and such other fund(s) (or portions thereof) cease to have the same subadvisor, their assets will no longer beaggregated for purposes of determining the applicable annual fee rate for the fund.
Fund APR Advisory Fee Breakpoint
500 Index Trust 0.470% — first $500 million; and
0.460% — excess over $500 million.
Active Bond Trust 0.600% — first $2.5 billion;
0.575% — next $2.5 billion; and
0.550% — excess over $5 billion.
Blue Chip Growth Trust 0.825% — first $500 million;
0.800% — next $500 million; and
0.750% — excess over $1 billion.*+
(Aggregate Net Assets include the net assets of the fund and the Blue ChipGrowth Fund, a series of JHF II.)
*When Aggregate Net Assets exceed $1 billion on any day, the annual rateof advisory fee for that day is 0.750% on the first $1 billion of AggregateNet Assets.
+The Fee schedule above became effective July 1, 2017.
Capital Appreciation Trust 0.850% — first $300 million;
0.800% — next $200 million;
0.700% — next $500 million; and
0.670% — excess over $1 billion.
(Aggregate Net Assets include the net assets of the fund and the CapitalAppreciation Fund, a series of JHF II.)
Capital Appreciation Value Trust If net assets are less than $500 million, the following fee schedule shallapply:
0.950% — first $250 million; and
0.850% — excess over $250 million.
If net assets equal or exceed $500 million but are less than $2 billion, thefollowing fee schedule shall apply:
0.850% — first $1 billion; and
0.800% — excess over $1 billion.
If net assets equal or exceed $2 billion but are less than $3 billion, thefollowing fee schedule shall apply:
0.850% — first $500 million; and
0.800% — excess over $500 million.
If net assets equal or exceed $3 billion, the following fee schedule shallapply:
0.800% — all asset levels.
(Aggregate Net Assets include the net assets of the fund and the CapitalAppreciation Value Trust, a series of JHF II.)
.330
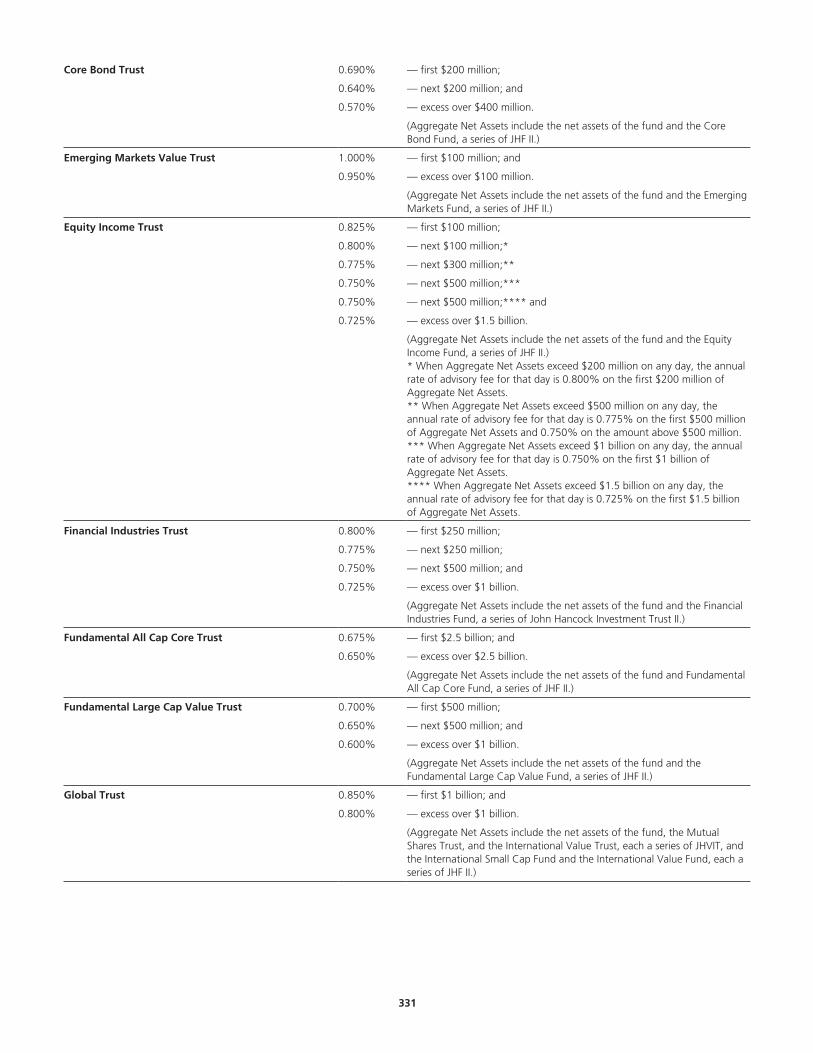
Core Bond Trust 0.690% — first $200 million;
0.640% — next $200 million; and
0.570% — excess over $400 million.
(Aggregate Net Assets include the net assets of the fund and the CoreBond Fund, a series of JHF II.)
Emerging Markets Value Trust 1.000% — first $100 million; and
0.950% — excess over $100 million.
(Aggregate Net Assets include the net assets of the fund and the EmergingMarkets Fund, a series of JHF II.)
Equity Income Trust 0.825% — first $100 million;
0.800% — next $100 million;*
0.775% — next $300 million;**
0.750% — next $500 million;***
0.750% — next $500 million;**** and
0.725% — excess over $1.5 billion.
(Aggregate Net Assets include the net assets of the fund and the EquityIncome Fund, a series of JHF II.)* When Aggregate Net Assets exceed $200 million on any day, the annualrate of advisory fee for that day is 0.800% on the first $200 million ofAggregate Net Assets.** When Aggregate Net Assets exceed $500 million on any day, theannual rate of advisory fee for that day is 0.775% on the first $500 millionof Aggregate Net Assets and 0.750% on the amount above $500 million.*** When Aggregate Net Assets exceed $1 billion on any day, the annualrate of advisory fee for that day is 0.750% on the first $1 billion ofAggregate Net Assets.**** When Aggregate Net Assets exceed $1.5 billion on any day, theannual rate of advisory fee for that day is 0.725% on the first $1.5 billionof Aggregate Net Assets.
Financial Industries Trust 0.800% — first $250 million;
0.775% — next $250 million;
0.750% — next $500 million; and
0.725% — excess over $1 billion.
(Aggregate Net Assets include the net assets of the fund and the FinancialIndustries Fund, a series of John Hancock Investment Trust II.)
Fundamental All Cap Core Trust 0.675% — first $2.5 billion; and
0.650% — excess over $2.5 billion.
(Aggregate Net Assets include the net assets of the fund and FundamentalAll Cap Core Fund, a series of JHF II.)
Fundamental Large Cap Value Trust 0.700% — first $500 million;
0.650% — next $500 million; and
0.600% — excess over $1 billion.
(Aggregate Net Assets include the net assets of the fund and theFundamental Large Cap Value Fund, a series of JHF II.)
Global Trust 0.850% — first $1 billion; and
0.800% — excess over $1 billion.
(Aggregate Net Assets include the net assets of the fund, the MutualShares Trust, and the International Value Trust, each a series of JHVIT, andthe International Small Cap Fund and the International Value Fund, each aseries of JHF II.)
.331
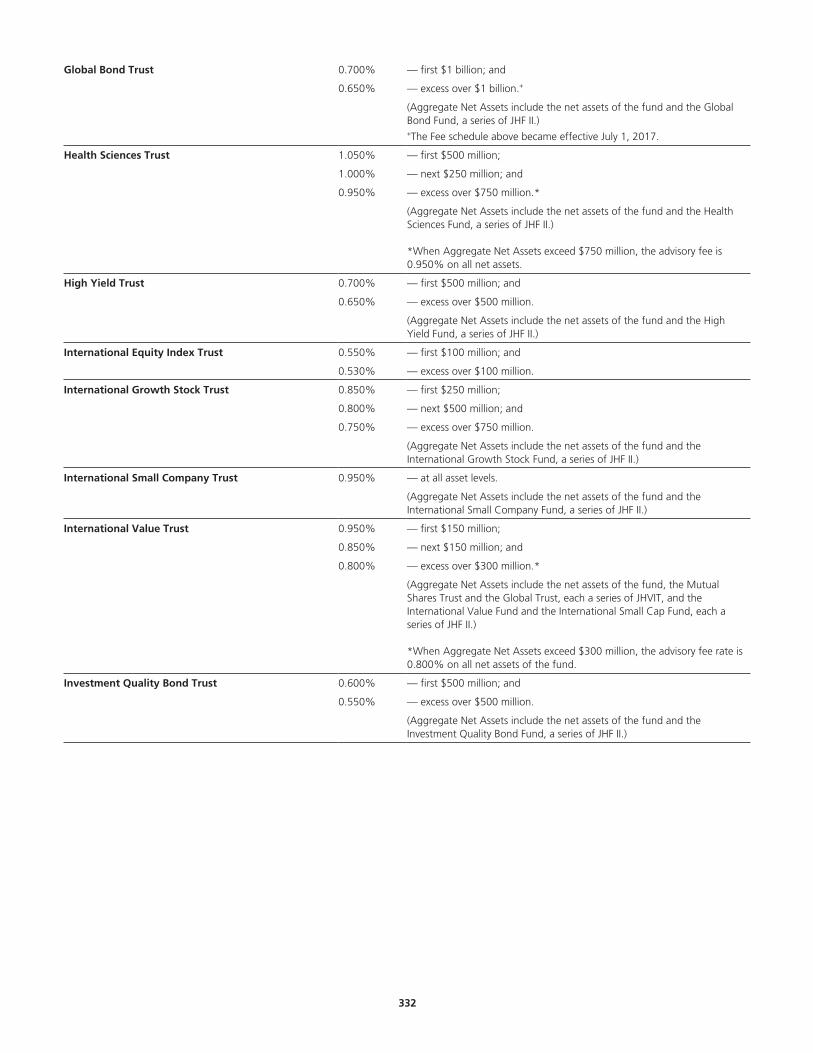
Global Bond Trust 0.700% — first $1 billion; and
0.650% — excess over $1 billion.+
(Aggregate Net Assets include the net assets of the fund and the GlobalBond Fund, a series of JHF II.)+The Fee schedule above became effective July 1, 2017.
Health Sciences Trust 1.050% — first $500 million;
1.000% — next $250 million; and
0.950% — excess over $750 million.*
(Aggregate Net Assets include the net assets of the fund and the HealthSciences Fund, a series of JHF II.)
*When Aggregate Net Assets exceed $750 million, the advisory fee is0.950% on all net assets.
High Yield Trust 0.700% — first $500 million; and
0.650% — excess over $500 million.
(Aggregate Net Assets include the net assets of the fund and the HighYield Fund, a series of JHF II.)
International Equity Index Trust 0.550% — first $100 million; and
0.530% — excess over $100 million.
International Growth Stock Trust 0.850% — first $250 million;
0.800% — next $500 million; and
0.750% — excess over $750 million.
(Aggregate Net Assets include the net assets of the fund and theInternational Growth Stock Fund, a series of JHF II.)
International Small Company Trust 0.950% — at all asset levels.
(Aggregate Net Assets include the net assets of the fund and theInternational Small Company Fund, a series of JHF II.)
International Value Trust 0.950% — first $150 million;
0.850% — next $150 million; and
0.800% — excess over $300 million.*
(Aggregate Net Assets include the net assets of the fund, the MutualShares Trust and the Global Trust, each a series of JHVIT, and theInternational Value Fund and the International Small Cap Fund, each aseries of JHF II.)
*When Aggregate Net Assets exceed $300 million, the advisory fee rate is0.800% on all net assets of the fund.
Investment Quality Bond Trust 0.600% — first $500 million; and
0.550% — excess over $500 million.
(Aggregate Net Assets include the net assets of the fund and theInvestment Quality Bond Fund, a series of JHF II.)
.332

The JHVIT Lifecycle Trusts:Lifecycle 2010 TrustLifecycle 2015 TrustLifecycle 2020 TrustLifecycle 2025 TrustLifecycle 2030 TrustLifecycle 2035 TrustLifecycle 2040 TrustLifecycle 2045 TrustLifecycle 2050 Trust
The management fee has two components: (a) a fee on assets invested infunds of JHVIT, JHF II or JHF III (“Affiliated Funds Assets”)* and (b) a fee onassets not invested in Affiliated Funds Assets (“Other Assets”).
*The following JHVIT funds are not included in Affiliated FundsAssets: 500 Index Trust, International Equity Index Trust and Total BondMarket Trust.
(a) The fee on Affiliated Funds Assets is stated as an annual percentage ofthe current value of the aggregate net assets of the JHVIT Lifecycle Trustsand net assets of all the Multi-Index Preservation Portfolios, MultimanagerLifetime Portfolios and Multi-Index Lifetime Portfolios that are series of JHFII determined in accordance with the following schedule and that rate isapplied to the Affiliated Funds Assets of the fund.
0.060% — first $7.5 billion; and
0.050% — excess over $7.5 billion.
(b) The fee on Other Assets is stated as an annual percentage of thecurrent value of the aggregate net assets of the JHVIT Lifecycle Trusts andthe Multi-Index Preservation Portfolios, Multimanager Lifetime Portfoliosand Multi-Index Lifetime Portfolios that are series of JHF II determined inaccordance with the following schedule and that rate is applied to theOther Assets of the fund.
0.510% — first $7.5 billion; and
0.500% — excess over $7.5 billion.
Lifestyle Aggressive PortfolioLifestyle Balanced PortfolioLifestyle Conservative PortfolioLifestyle Growth PortfolioLifestyle Moderate Portfolio(Collectively, the “JHVIT Lifestyle Portfolios”)
The management fee has two components: (a) a fee on assets invested infunds of JHVIT, JHF II, or JHF III (“Affiliated Funds Assets”)* and (b) a fee onassets not invested in Affiliated Funds Assets (“Other Assets”).
*The following JHVIT funds are not included in Affiliated FundsAssets: 500 Index Trust, International Equity Index Trust and Total BondMarket Trust.
(a) The fee on Affiliated Funds Assets is stated as an annual percentage ofthe current value of the aggregate net assets of the JHVIT ManagedVolatility Portfolios, the JHVIT Lifestyle Portfolios, and the MultimanagerLifestyle Portfolios and Multi-Index Lifestyle Portfolios that are series of JHFII determined in accordance with the following schedule and that rate isapplied to the Affiliated Funds Assets of the fund.
0.050% — first $7.5 billion; and
0.040% — excess over $7.5 billion.
(b) The fee on Other Assets is stated as an annual percentage of thecurrent value of the aggregate net assets of the JHVIT Managed VolatilityPortfolios, the JHVIT Lifestyle Portfolios and the Multimanager LifestylePortfolios and Multi-Index Lifestyle Portfolios that are series of JHF IIdetermined in accordance with the following schedule and that rate isapplied to the Other Assets of the fund.
0.500% — first $7.5 billion; and
0.490% — excess over $7.5 billion.
.333

Managed Volatility Aggressive PortfolioManaged Volatility Balanced PortfolioManaged Volatility Conservative PortfolioManaged Volatility Growth PortfolioManaged Volatility Moderate Portfolio(Collectively, the “JHVIT Managed VolatilityPortfolios”)
The management fee has two components: (a) a fee on assets invested infunds of JHVIT, JHF II or JHF III (“Affiliated Funds Assets”)* and (b) a fee onassets not invested in Affiliated Funds Assets (“Other Assets”).
*The following JHVIT funds are not included in Affiliated FundsAssets: 500 Index Trust, International Equity Index Trust and Total BondMarket Trust.
(a) The fee on Affiliated Funds Assets is stated as an annual percentage ofthe current value of the aggregate net assets of the JHVIT ManagedVolatility Portfolios, the JHVIT Lifestyle Portfolios, and the MultimanagerLifestyle Portfolios and Multi-Index Lifestyle Portfolios that are series of JHFII determined in accordance with the following schedule and that rate isapplied to the Affiliated Funds Assets of the fund.
0.050% — first $7.5 billion; and
0.040% — excess over $7.5 billion.
(b) The fee on Other Assets is stated as an annual percentage of thecurrent value of the aggregate net assets of the JHVIT Managed VolatilityPortfolios, the JHVIT Lifestyle Portfolios, and the Multimanager LifestylePortfolios and Multi-Index Lifestyle Portfolios that are series of JHF IIdetermined in accordance with the following schedule and that rate isapplied to the Other Assets of the fund.
0.500% — first $7.5 billion; and
0.490% — excess over $7.5 billion.
Mid Cap Index Trust 0.490% — first $250 million;
0.480% — next $250 million; and
0.460% — excess over $500 million.
Mid Cap Stock Trust 0.875% — first $200 million;
0.850% — next $300 million; and
0.825% — excess over $500 million.
(Aggregate Net Assets include the net assets of the fund and the Mid CapStock Fund, a series of JHF II.)
Mid Value Trust 1.050% — first $20 million;
0.950% — next $30 million; and
0.950% — excess over $50 million*.
(Aggregate Net Assets include the net assets of the fund and the Mid ValueFund, a series of JHF II.)
*When Aggregate Net Assets exceed $50 million on any day, the annualrate of advisory fee for that day is 0.950% on all assets.
Money Market Trust 0.500% — first $500 million;
0.425% — next $250 million;
0.375% — next $250 million;
0.350% — next $500 million;
0.325% — next $500 million;
0.300% — next $500 million; and
0.275% — excess over $2.5 billion.
(Aggregate Net Assets include the net assets of the fund and the MoneyMarket Fund, a series of John Hancock Current Interest.)
Mutual Shares Trust 0.960% — first $750 million; and
0.920% — excess over $750 million.*
*When Aggregate Net Assets exceed $750 million on any day, the annualrate of advisory fee for that day is 0.920% on all assets.
.334
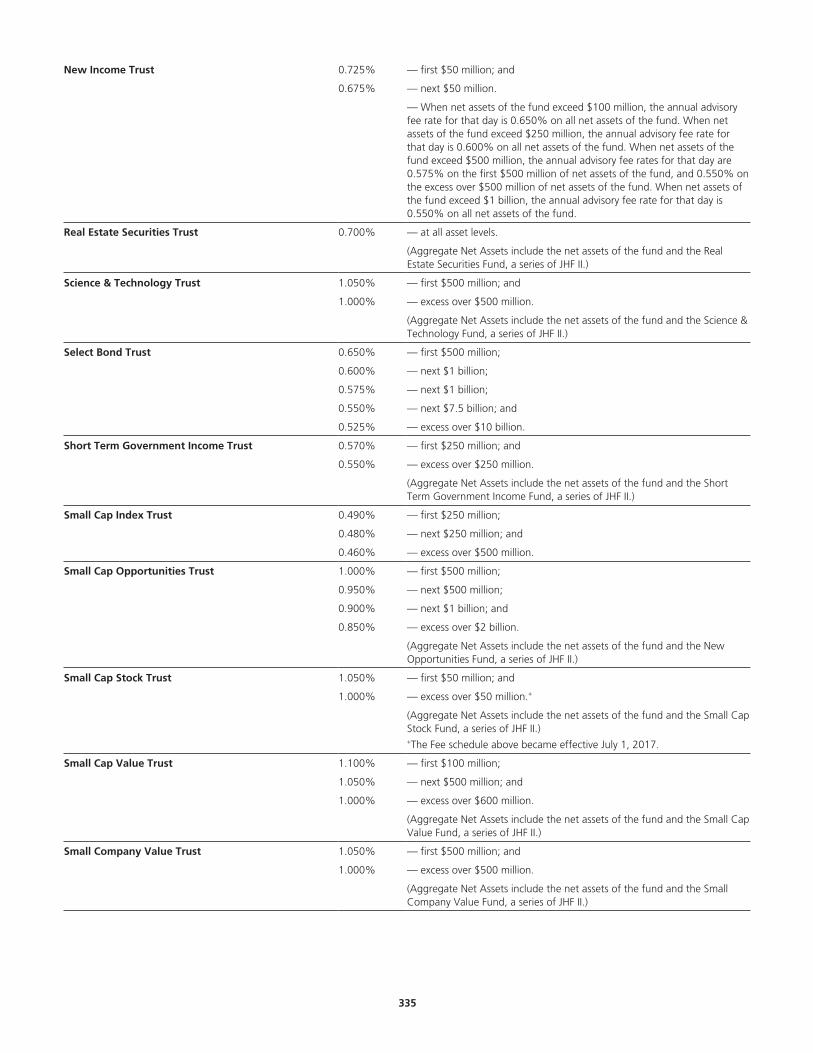
New Income Trust 0.725% — first $50 million; and
0.675% — next $50 million.
— When net assets of the fund exceed $100 million, the annual advisoryfee rate for that day is 0.650% on all net assets of the fund. When netassets of the fund exceed $250 million, the annual advisory fee rate forthat day is 0.600% on all net assets of the fund. When net assets of thefund exceed $500 million, the annual advisory fee rates for that day are0.575% on the first $500 million of net assets of the fund, and 0.550% onthe excess over $500 million of net assets of the fund. When net assets ofthe fund exceed $1 billion, the annual advisory fee rate for that day is0.550% on all net assets of the fund.
Real Estate Securities Trust 0.700% — at all asset levels.
(Aggregate Net Assets include the net assets of the fund and the RealEstate Securities Fund, a series of JHF II.)
Science & Technology Trust 1.050% — first $500 million; and
1.000% — excess over $500 million.
(Aggregate Net Assets include the net assets of the fund and the Science &Technology Fund, a series of JHF II.)
Select Bond Trust 0.650% — first $500 million;
0.600% — next $1 billion;
0.575% — next $1 billion;
0.550% — next $7.5 billion; and
0.525% — excess over $10 billion.
Short Term Government Income Trust 0.570% — first $250 million; and
0.550% — excess over $250 million.
(Aggregate Net Assets include the net assets of the fund and the ShortTerm Government Income Fund, a series of JHF II.)
Small Cap Index Trust 0.490% — first $250 million;
0.480% — next $250 million; and
0.460% — excess over $500 million.
Small Cap Opportunities Trust 1.000% — first $500 million;
0.950% — next $500 million;
0.900% — next $1 billion; and
0.850% — excess over $2 billion.
(Aggregate Net Assets include the net assets of the fund and the NewOpportunities Fund, a series of JHF II.)
Small Cap Stock Trust 1.050% — first $50 million; and
1.000% — excess over $50 million.+
(Aggregate Net Assets include the net assets of the fund and the Small CapStock Fund, a series of JHF II.)+The Fee schedule above became effective July 1, 2017.
Small Cap Value Trust 1.100% — first $100 million;
1.050% — next $500 million; and
1.000% — excess over $600 million.
(Aggregate Net Assets include the net assets of the fund and the Small CapValue Fund, a series of JHF II.)
Small Company Value Trust 1.050% — first $500 million; and
1.000% — excess over $500 million.
(Aggregate Net Assets include the net assets of the fund and the SmallCompany Value Fund, a series of JHF II.)
.335
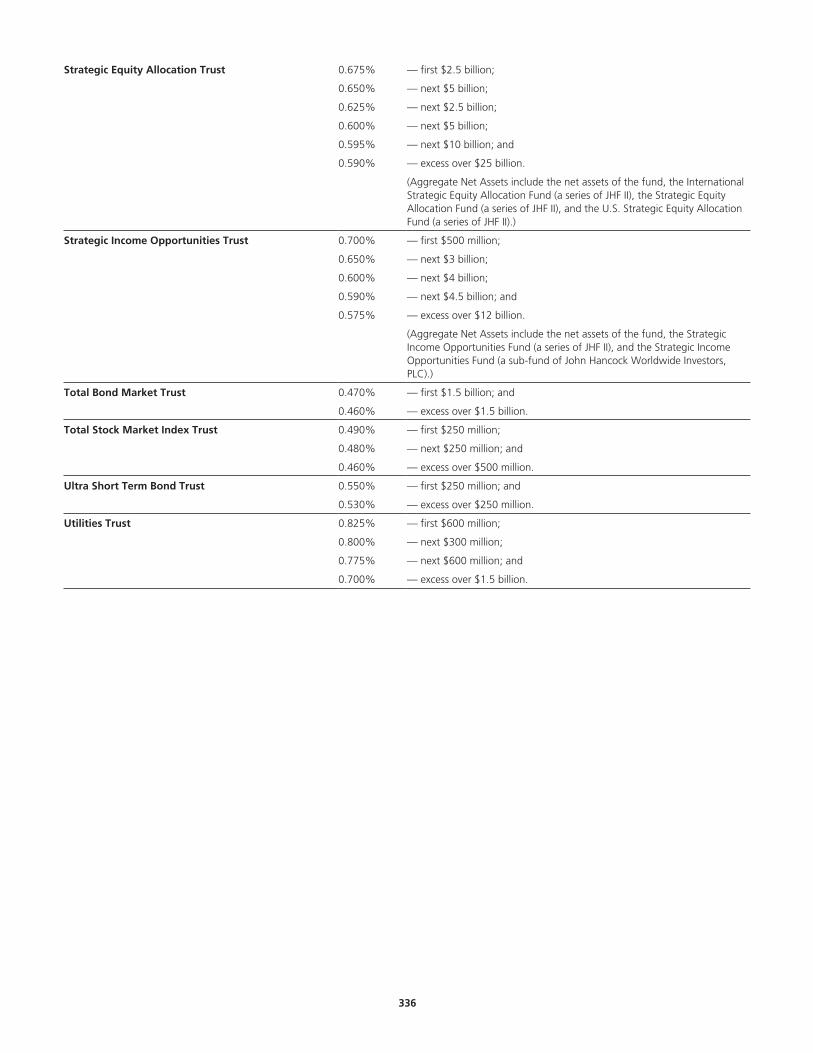
Strategic Equity Allocation Trust 0.675% — first $2.5 billion;
0.650% — next $5 billion;
0.625% — next $2.5 billion;
0.600% — next $5 billion;
0.595% — next $10 billion; and
0.590% — excess over $25 billion.
(Aggregate Net Assets include the net assets of the fund, the InternationalStrategic Equity Allocation Fund (a series of JHF II), the Strategic EquityAllocation Fund (a series of JHF II), and the U.S. Strategic Equity AllocationFund (a series of JHF II).)
Strategic Income Opportunities Trust 0.700% — first $500 million;
0.650% — next $3 billion;
0.600% — next $4 billion;
0.590% — next $4.5 billion; and
0.575% — excess over $12 billion.
(Aggregate Net Assets include the net assets of the fund, the StrategicIncome Opportunities Fund (a series of JHF II), and the Strategic IncomeOpportunities Fund (a sub-fund of John Hancock Worldwide Investors,PLC).)
Total Bond Market Trust 0.470% — first $1.5 billion; and
0.460% — excess over $1.5 billion.
Total Stock Market Index Trust 0.490% — first $250 million;
0.480% — next $250 million; and
0.460% — excess over $500 million.
Ultra Short Term Bond Trust 0.550% — first $250 million; and
0.530% — excess over $250 million.
Utilities Trust 0.825% — first $600 million;
0.800% — next $300 million;
0.775% — next $600 million; and
0.700% — excess over $1.5 billion.
.336

For more informationThe following documents are available, which offer further information on JHVIT:
Annual/semiannual reports to shareholdersAdditional information about a fund’s investments is available in the fund’s annual and semiannual reports to shareholders. In a fund’s annual report,you will find a discussion of the market conditions and investment strategies that significantly affected the fund’s performance during its last fiscalyear.
Statement of Additional Information (SAI)The SAI contains more detailed information on all aspects of the Funds. The SAI includes a summary of JHVIT’s policy regarding disclosure of portfolioholdings as well as legal and regulatory matters. The current SAI has been filed with the SEC and is incorporated by reference into (and is legally a partof) this Prospectus.
To request a free copy of the current annual/semiannual report or the SAI, please contact John Hancock:By mail:§John Hancock Variable Insurance Trust§601 Congress Street§Boston, MA 02210-2805By phone: 800-344-1029On the internet: johnhancock.com
Or you may obtain these documents and other information about the Funds from the SEC:By mail: Public Reference Section Securities and Exchange Commission Washington, DC 20549-0102 (duplicating fee required)In person: at the SEC’s Public Reference Room in Washington, DC For access to the Reference Room call 1-202-551-8090By electronic request: [email protected] (duplicating fee required)On the Internet: sec.gov
1940 Act File No. 811-04146
.337