j usda sustaining recruitment : ,...
TRANSCRIPT
J
l
USDA United States
AgricultureDepartment°f Sustaining Recruitment_:_,_ of Oak Reproduction in.o_,0e0_a,0_Uneven.aged Stands in_,_,,on the Ozark HighlandsGeneralTechnicalReport NC- 203
David R. Larsen, Edward F. Loewenstein,and Paul S. Johnson

North Central Research Station
Forest Service--U.S. Department of Agriculture1992 Folweli Avenue
St. Paul, Minnesota 55108
Manuscript approved for publication April 5, 19991999
i'ii
Sustaining Recruitment of Oak Reproduction inUneven-aged Stands in the Ozark Highlands
David R. Larsen, Edward F. Loewenstein, and Paul S. Johnson
IMPORTANCE OF OVERSTORY DENSITY for selecting a residual stand structure andTO THE DEVELOPMENT OF OAK density appropriate to the single-tree selection
REPRODUCTION method in the Ozark Highlands that is consis-tent with the regeneration ecology of oaks and
There is evidence that the single-tree selection thus sustaining a forest dominated by oaks.method can be successfully applied to oakstands in the Ozark Highlands of Missouri PRINCIPLES OF OAK REGENERATION(Loewenstein 1996, Wang 1997). However, the APPLIED TO UNEVEN-AGED FORESTSsuccess of the method depends on sustainingadequate growth (recruitment) of oak repro- Uneven-aged silviculture involves creating andduction into the overstory. A major limitation maintaining uneven-aged stands. Trees of atin obtaining the requisite recruitment is high least three age classes (e.g,, 20-year classes)overstory density. Oak reproduction is rela- must be present for a stand to be categorizedtively intolerant of shade and therefore re- as uneven-aged (Smith 1986). In an idealizedquires a low to moderate overstory density to uneven-aged stand, trees of every age classprovide the light necessary for its establish- would be present. Such a distribution reflectsment and growth beneath the forest canopy, the continual or frequently periodic growth ofSilviculturists have generally concluded that trees, including reproduction, into succes-the single-tree selection method is unsuitable sively older age classes. However, only part offor oaks because the method maintains a the trees in any age class survive to becomerelatively uniform Overhead shade (Roach members of the next older class. Maintaining1962, 1974; Gingrich 1967; Sander and Clark an uneven-aged distribution of trees is thus an1971; Trimble 1973; Sander et al. 1983; essential feature of sustaining an uneven-agedMarquis and Johnson 1989; Sander and stand. However, because of the impracticalityGraney 1993). However, we propose that the of determining the age of every tree, an un-method's suitability depends on the dynamics even-aged stand is silviculturally maintainedof the ecosystem it is applied to. The charac- by controlling its diameter distribution.teristics of the oak regeneration process, whichdiffer greatly among the oak-dominated forests Such control is usually obtained through theof the Eastern States, are therefore a key creation and maintenance of a diameterfactor in the method's successful application frequency distribution that forms a reverse J-(Johnson 1993a, 1993b). shape (fig. I). Such distributions often develop
naturally in old-growth forests (Meyer et aLThis paper describes some relations between 1952). However, reverse J-shaped distribu-overstory density and oak reproduction, tions also may characterize even-aged standsBased on these relations, we present criteria when they are young or where species differ
greatly in growth rate or shade tolerance. It isDavid R. Larsen is an Associate Professor, The important to have information on the currentSchool of Natural Resources, University of diameter distribution at the outset of a stand'sMissouri-Columbia, Columbia, MO. management. Ideally, the forest manager
should have information on both age andEdward F. Loewenstein is a Silviculturist and diameter distributions, and on the variation in
Paul S. Johnson is a Principal Silviculturist those distributions among species. However,with the Central Hardwood Silviculture and in most cases, it is impractical to determine
Ecology unit of the North Central Research age distributions. It is not unusual for shade-Station, Columbia, Missouri. tolerant species forming an uneven-aged

population with a reverse J-shaped diameter new species. In many oak forests, the rela-distribution to co-occur with an even-aged tively shade-intolerant oaks are successionaUypopulation of shade-intolerant species forming replaced by more shade-tolerant speciesa bell-shaped distribution (Stout 1991). Even- (Nowacki et a£ 1990, Abrams and Nowackiaged oak forests commonly form bell-shaped 1992, Nowacki and Abrams 1992).diameter distributions by the time they reacha mean diameter of 8 inches d.b.h. (Schnur Although the theory underlying the silvicul-1937, Gingrich 1967). The paucity of small- tural application of reverse-J diameter distri-diameter trees in sudh distributions reflects butions has been widely presented in silvicul-the inability of oak reproduction to become tural textbooks and other sources (e.g., Roachestablished, survive in a subordinate crown 1974, Smith 1986, Nyland 1996), there hasposition, and grow into the overstory. Such been relatively little discussion of how suchrelations are implicit in Schnur's (1937) stand distributions are related to forest regeneration.tables for "normal" even-aged oak stands (i.e., We propose that selecting an appropriatestands at average maximum density) in the reverse-J distribution depends on: (1) silvicul-Eastern United States. tural objectives, and (2)the natural dynamics
of the forest where it is to be applied. Silvicul-tural objectives that do not consider naturalforest dynamics are unlikely to be realized. Toensure success, the selected diameter distri-bution therefore must be compatible with thenatural dynamic of the stand being managed.
Compatibility, in turn, depends largely on thecharacteristics of the regeneration process and
the likelihoodofsustainingadequaterecruit-mentofreproductionintothe overstory.
TheuplandforestsofsouthernMissouriliewithin the Ozark Highlands Section of theEastern Broadleaf Forest (continental) Prov-ince as defined by McNab and Avers (1994).These forests are typically dominated by some
_" combination of white oak (Quercus alba L.),black oak (Q. velutina Lam.), scarlet oak (Q.coccineaMuenchh.), northern red oak (Q.
D.b.h. _ rubra L.), and post oak (Q. stellata Wangenh.).The oaks tend to persist as canopy dominantsover successive generations. Unlike oakFigure 1.--A reverse J-shaped diameter distri-
bution, forests in many other regions of the EasternUnited States, Ozark Highland oak forests aregenerally not successional to non-oaks. The
As even-aged stands grow older, and in the persistence of oaks in the Ozarks is largelyabsence of stand-replacing disturbance, related to this regenera_on dynamic and to thenatural canopy gaps develop whenever large frequency of stand disturbance. The oaktrees die singly or in small groups. The va- reproduction beneath mature stands typicallycated growing space is subsequently captured accumulates over several decades (Liming andby preestablished tree reproduction, which can Johnston 1944, Johnson 1993a). This a_cu-
respond to the increased light and availability mulation produces populations of oak seedlingof other resources. If this gap-formation sprouts. Some of these have large root sys-process continues, even-aged stands can tems and the potential for rapid shoot growtheventually evolve into uneven-aged stands when natural or human-caused disturbancescomprised of complex mosaics of very small sufficiently reduce overstory density (Johnsoneven-aged groups of trees. Depending on 1979, Dey eta/. 1996) (fig. 2). The resultantecosystem-specific successional processes, regeneration process is typical of the relativelywhich differ among the many different kinds of dry sites that characterize the Ozark High-forests, the species currently dominating the lands, where the site index for black and
main canopy may or may not be replaced by scarlet oaks ranges from about 40 to 80 ft at2
s_
_
i

an index age of 50 years (McQuilkin 1974). persist in xeric Missouri Ozark forests, theirTotal oak reproduction densities typically dominance in canopy gaps is usually limited torange from 1,000 to 3,000 seedlings and the first I0 to 15 years of recovery. However;seedling sprouts per acre. However, most of by the end of the second decade, oaks usuallythese seedlings and seedling sprouts are have reemerged as the dominant species. Thetypically less than I ft tall (Sander 1979). oak's capacity to persist as a dominant mem-Only a small proportion attain large size (e.g., ber of uneven-aged forests is evidenced by the>4.5 ft tall) (Larsen et aL 1997). In uneven- successful application of the single-tree selec-aged silviculture, the presence of large oak tion method in a large privately owned forestreproduction nevertheless is necessary for in the Ozark Highlands. After the method hadsustaining recruitment into the overstory, been applied for 40 years, oaks accounted forBecause white oak is more tolerant of shade 70 percent of total basal area of trees >5than the other oaks, it is often better repre- inches d.b.h., and there was no evidence thatsented in the large reproduction size classes their importance as a camopy dominant wasand small overstory d.b.h, classes than the declining (Loewenstein et al. 1995,other oaks. White oak's presence in these size Loewenstein 1996).classes is essential to the success of the
single-tree selection method in the Ozarks In uneven-aged silviculture, the objective of(Loewenstein 1996, Wang 1997). creating and maintaining a reverse J-shaped
d.b.h, distribution is to facilitate a predictablerate of movement (recruitment) of trees from
_ _ ._
¢i _ :_ one diameter class to the next. This property
_:__ _!:. ofthe distributionis keyto the systematic
°_ management, regulation, and sustainability ofan uneven-aged forest. Specifying a d.b.h.distribution for this purpose is often limited to
' _'_ ? '_'.l? _ trees above some arbitrary minimum d.b.h.1 ' suchas 5 or6 inches. However,ifthe distri-
_"_:_ _'__ -z_F_'_ T_ _ butionls to be sustained, ltmustinrealltyextend downward into the smaller size classes
including reproduction (i.e., trees <1.5 inchesd.b.h.).
Figure 2.--Oak reproduction growing beneathan uneven-aged forest canopy. In the Ozark A common assumption in uneven'aged sflvi-Highlands, the shoots of oak seedlings typi- culture is that the requisite recruitment ofcally die back one or more times to form trees follows a more or less constant rate"seedling sprouts." Some of these eventually among d.b.h, classes. Such a rate, in tum, isdevelop large roots and thereby the capacity represented by a constant ratio of trees be-for rapid shoot growth and the ability to tween adjacent d.b.h, classes. Silviculturistscapture canopy gaps created when overstory usually express this as the constant ratio oftrees are harvested, trees in one d.b.h, class to that in the next
larger class. The use of this ratio, or quotient(generally referred to simply as q), originated in
The predominant non-oaks in xeric Missouri 19th century French forestry (de LiocourtOzark forests include hickories (Carya spp.), 1898). In silvicultural application in Northsassafras (Sassafras albidum (Nutt.) Nees), American hardwood forests, commonly recom-flowering dogwood (CornusJlorida L.), mended values of q range from 1.1 to 1.4blackgum (Nyssa sylvatica Marsh.), red maple based on 1-inch d.b.h, classes (1.2-2.0 for 2-(Acer rubrum L,), and shortleaf pine (Ptnus inch classes) (Trimble 1970; Leak 1978, 1987;echinata Mill.). These species are usually Leak et al. 1987; Smith 1980; Smith andrelegated to subordinate crown classes in Lamson 1982; Law and Lorimer 1989). Themature stands. Exceptions are the hickories related progression of diameters mathemati-and shortleaf pine, which commonly attain cally follows the negative exponentta/functiondominance but usually make up only a small whereby numbers of trees decrease Iogarithmi-proportion of the main canopy of a mature caUy with increasing d.b.h. However, otherforest. Although the broadleaf non-oaks types of diameter distributions generally
characterized by declining numbers of trees silvicultural applications, the idea is analogouswith increasing d.b.h, also have been de- to predicting the weather. Thus, a 60 percentscribed and applied to uneven-aged silvicul- probability of rain means that during 100 daysture (Leak 1996). with the same weather indicators, on the
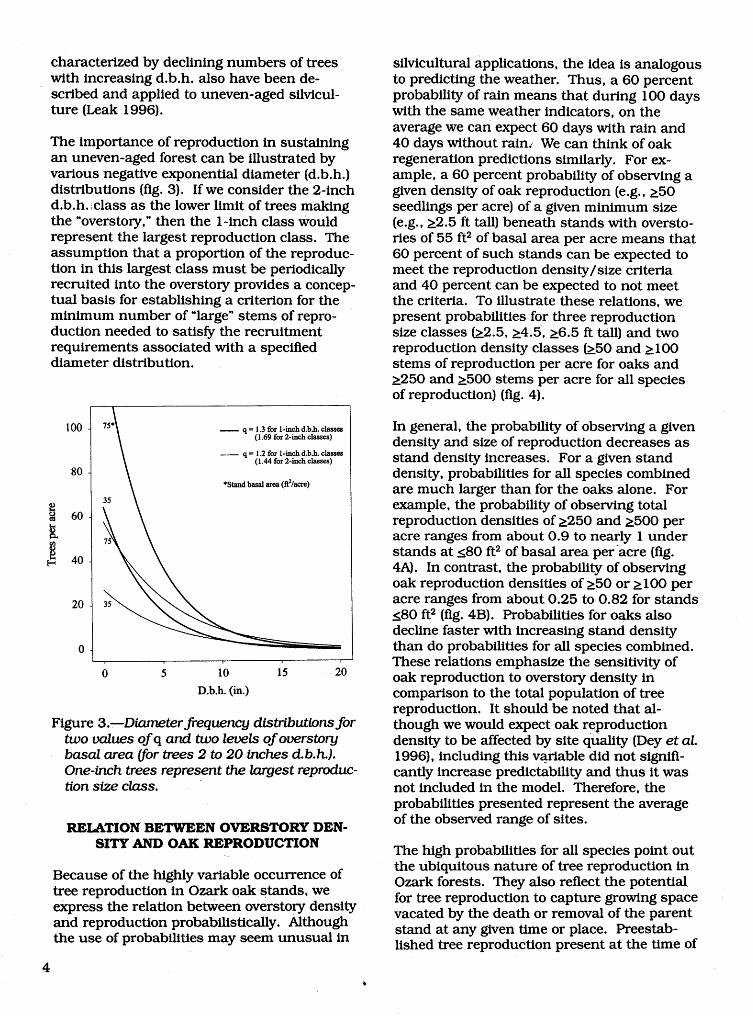
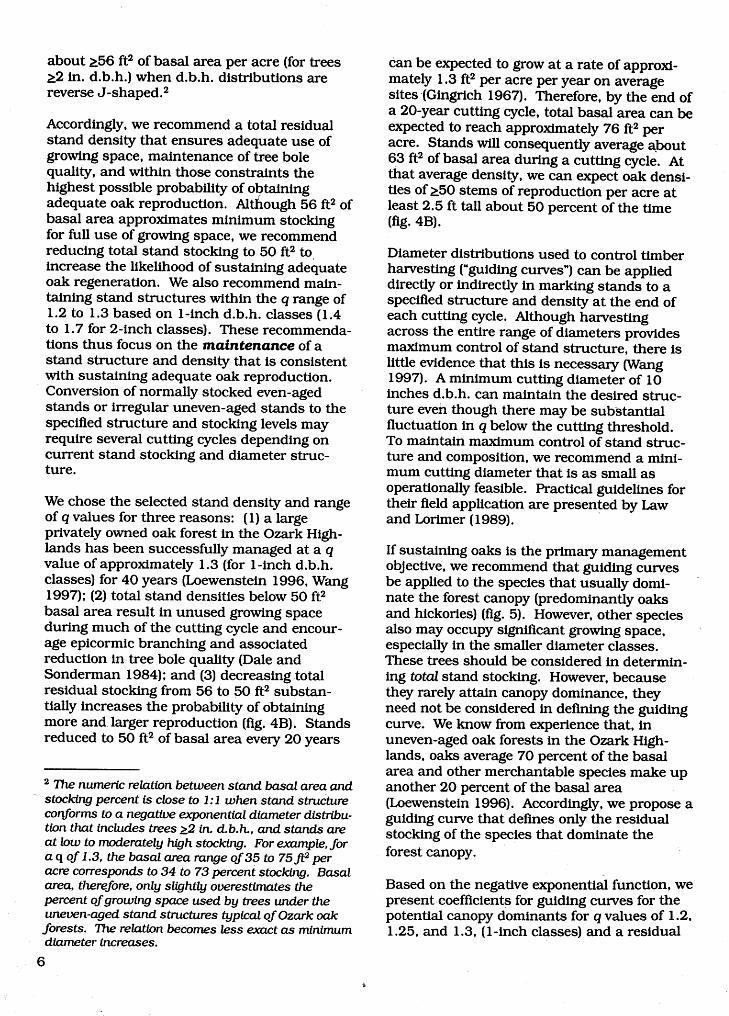
average we can expect 60 days with rain andThe importance of reproduction in sustaining 40 days without rain, We can think of oakan uneven-aged forest can be illustrated by regeneration predictions similarly. For ex-various negative exponential diameter (d.b.h.) ample; a 60 percent probability of observing adistributions (fig. 3). If we consider the 2-inch given density of oak reproduction (e.g., >50d.b.h, iclass as the lower limit of trees making seedlings per acre) of a given minimum sizethe "overstory," then the 1-inch class would (e.g., >2.5 ft tall) beneath stands with oversto-represent the largest reproduction class. The ries of 55 ft2 of basal area per acre means thatassumption that a proportion of the reproduc- 60 percent of such stands can be expected totlon in this largest class must be periodically meet the reproduction density/size criteriarecruited into the overstory provides a concep- and 40 percent can be expected to not meettual basis for establishing a criterion for the the criteria. To illustrate these relations, weminimum number of "large" stems of repro- present probabilities for three reproductionduction needed to satisfy the recruitment size classes _2.5, >4.5, >6.5 ft tall) and tworequirements associated with a specified reproduction density classes _50 and > 100diameter distribution, stems of reproduction per acre for oaks and
>_250 and >_500 stems per acre for all speciesof reproduction) (fig.4).
too 75\ _.69for2-_ho_ses) In general, the probability of observing a givenq = 1.3 for l-inch d.b.h, classes
density and size of reproduction decreases as_ q = 1.2 for l-inch d.b.h, classes
(1.44for2-m_ho_es) stand density increases. For a given stand80 \ *S_dba_,__e/,_) density, probabilities for all species combinedare much larger than for the oaks alone. For
60 35 example, the probability of observing totalreproductiondensitiesof>_250and >500per
75 acrerangesfromabout0.9 to nearly1understands at <80 ft2 of basal area per acre (fig.40 4A). In contrast, the probability of observing
oak reproduction densities of >50 or >-100 per20 acre rangesfromabout0.25 to 0.82forstands
<80 ft2 (fig. 4B). Probabilities for oaks alsodecline faster with increasing stand density
0 than do probabilitiesforall speciescombined...... Theserelations emphasizethe sensitivityof0 5 I0 I5 20 oak reproduction to overstorydensity in
D.b.h. (in.) comparison to the total population of treereproduction. It should be noted that al-
Figure 3._Diameterfrequency distributions for though we would expect oak reproductiontwo values of q and two levels of overstory density to be affected by site quality (Dey et al.basal area (]'or trees 2 to 20 inches d.b.h.). 1996), including this variable did not signifl-One-inch trees represent the largest reproduc- canfly increase predictability and thus it wastton size class, not included in the model. Therefore, the
probabilities presented represent the averageof the observed range of sites.RELATION BETWEEN OVERSTORY DEN-
SITY AND OAK REPRODUCTION.... The high probabilities for all species point out
Because of the highly variable occurrence of the ubiquitous nature of tree reproduction inOzark forests, They also reflect the potential
tree reproduction in Ozark Oak stands, we
express the relation between overstory density for tree reproduction to capture growing space iand reproduction probabilisticaUy. Although vacated by the death or removal of the parent lstand at any given time or place. Preestab-
the use of probabilities may seem unusual in lished tree reproduction present at the time of
4

1.0-- greatest chance ofgrowinginto the overstory.
__All Species The larger reproduction, modified by Its spe.cies-dependent persistence as a canopy domi-
0.8 _ ___x_ nant, largely predetermines future stand
composition and structure.
Nevertheless, even small reproduction has0.6 someprobabilityofgrowinginto the oversto.ry
(Dey eta/. 1996). This is especially true of theoaks, some of which recurrently die back and
0.4 resprout to produce populations of seedlingsprouts with highly variable root:shoot rela-
tions and thus highly variable growth poten-0.2 tials(Johnson1979)(fig.2). Forexample,a 6-
inch-tall Oak seedling sprout with a basal(0500_ 6.5_ diameter of one-half inch (and a correlated,,,_
0.0 . largerootsystem)is likelytogrowmuch fasterin a canopy gap than a 6-inch tall oak seedling
D,,,i_ H_t that has recently germinated (Sander 197 I).(a)50 > 2.5
co)_00_ z5a Consequently, the probability of recruiting0.8 to)so _4.sa reproduction into the overstory is highly
td)_00_ 4.s_ variable within a reproduction height class.(d)50 > 6.5
Co,,_ _ <0loo_ 6.5_ Conceptualizing reproduction as an extension
0.6 ,,,_)_ _ of the overstory diameter distribution (fig. 3)
and estimating reproduction probabilities from
(o__ __,__ overstory denslty (fig. 4) nonetheless provide a
basis for understanding how regeneration0.4 dynamics are linked to overstory density and
structure in uneven-aged oak stands in theOzark Highlands.
0.2SELECTING AN APPROPRIATE OVERSTORY
DENSITY AND STAND STRUCTURE(B) Oaks
0.0 ...... Despite the highly variable growth potential of20 40 60 80 100 120 oak reproduction of a given size, it is apparent
OverstoryBasalArea(ii2/acre) from figure 4 that lower stand densities areassociated with larger probabilities of occur-rence of high oak reproduction densities and
Figure 4.raThe probability of occurrence of tree large reproduction size. However, there is areproduction of a given height and density practical lower stand density limit for manag-(number per acre) in relation to overstory ing oak forests. This limit is determined bydensity (trees >2 in. d.b.h.). (A) Probabilities two factors: (1) the utilization of growingfor all tree species; (B) probabilities for oaks. space by trees, and (2) tree bole quality. We(Adapted from Larsen et al. 1997). propose managing oak stands at densities that
fully utilize growing space most of the timeand that are sufficient to prevent bole degrade
canopy disturbance largely determines the from epicormic branching associated with lowfuture composition of canopy gaps created by stand densities (Dale and Sonderman 1984).the single-tree selection method. However, for Based on Gingrich's (1967) stocking equation,either level of reproduction density (i.e., >50 or full use of growing space occurs at approxi->100 per acre for oaks, >250 or >500 per acre mately >55 percent stocking. _ This equates tofor all species), probabilities decline rapidly forany given overstory density as the reproduc-tion height criterion increases. Thus, there isrelatively little reproduction >4.5 or >6.5 ft tall. t Gin[g]rich (1967) tested his stocking equation across
a wide range of stand structures and concluded thatYet, it is the larger reproduction that has thestocking is independent of diameter distribution.
5
about >56 ft2 of basal area per acre (for trees can be expected to grow at a rate of approxi->2 in. d.b.h.) when d.b.h, distributions are mately 1.3 ft2 per acre per year on averagereverse J-shaped. 2 sites (Gingrich 1967). Therefore, by the end of
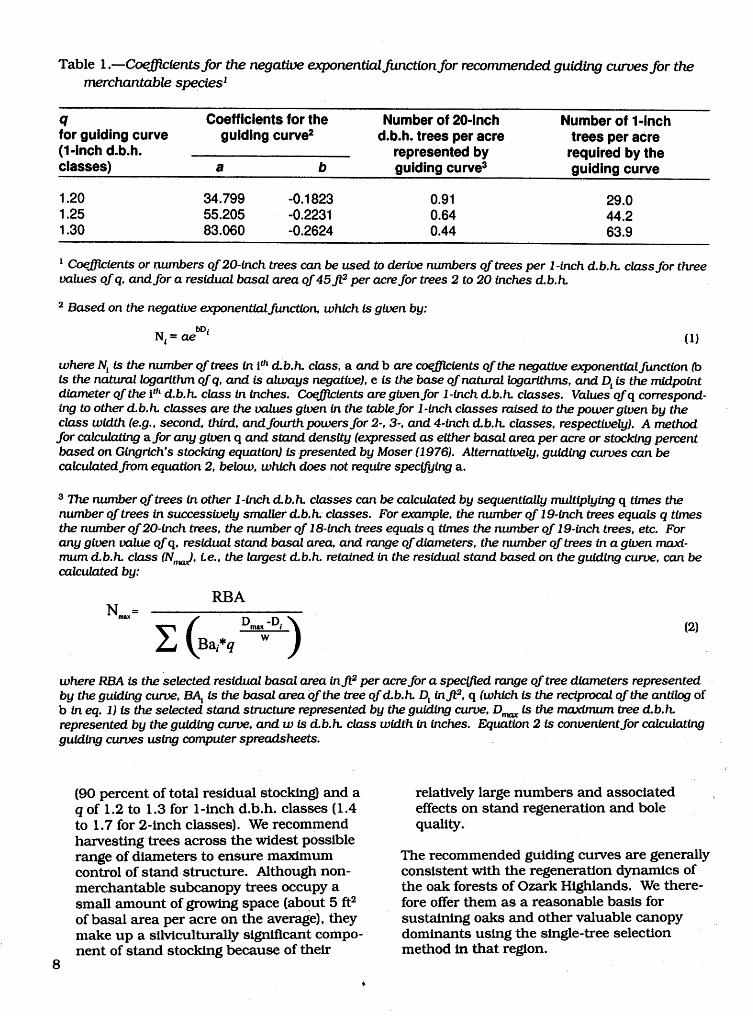
a 20-year cutting cycle, total basal area can beAccordingly, we recommend a total residual expected to reach approximately 76 ft2 perstand density that ensures adequate use of acre. Stands will consequently average aboutgrowing space, maintenance of tree bole 63 ft2 of basal area during a cutting cycle. Atquality, and within those constraints the that average density, we can expect oak densi-highest possible probability of obtaining ties of >50 stems of reproduction per acre atadequate oak reproduction. Altl_ough 56 ft2 of least 2.5 ft tall about 50 percent of the timebasal area approximates minimum stocking (fig. 4B).for full use of growing space, we recommendreducing total stand stocking to 50 ft 2 to Diameter distributions used to control timberincrease the likelihood of sustaining adequate harvesting ("guiding curves") can be appliedoak regeneration. We also recommend main- directly or indirectly in marking stands to ataining stand structures within the q range of specified structure and density at the end of1.2 to 1.3 based on 1-inch d.b.h, classes (1.4 each cutting cycle. Although harvestingto 1.7 for 2-inch classes). These recommenda- across the entire range of diameters providestions thus focus on the maintenance of a maximum control of stand structure, there isstand structure and density that is consistent little evidence that this is necessary (Wangwith sustaining adequate oak reproduction. 1997). A minimum cutting diameter of 10Conversion of normally stocked even-aged inches d.b.h, can maintain the desired struc-stands or irregular uneven-aged stands to the ture even though there may be substantialspecified structure and stocking levels may fluctuation in q below the cutting threshold.require several cutting cycles depending on To maintain maximum control of stand struc-current stand stocking and diameter struc- ture and composition, we recommend a mini-ture. mumcuttingdiameterthat is as smallas
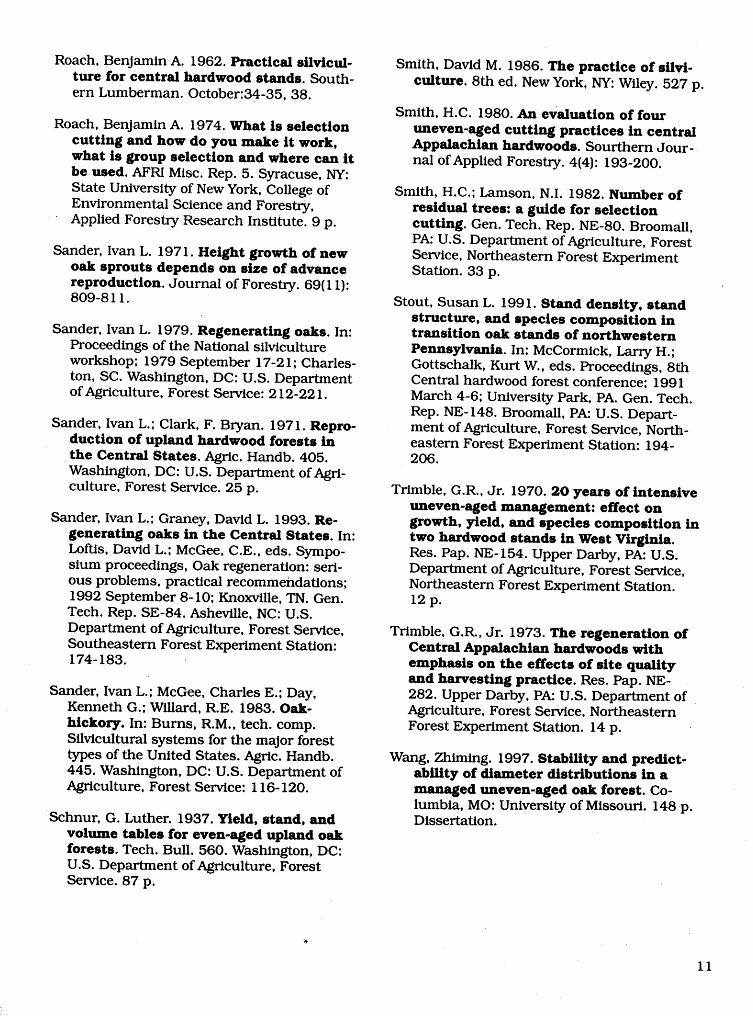
operationally feasible. Practical guidelines forWe chose the selected stand density and range their field application are presented by Lawof q values for three reasons: (I) a large and Lorimer (1989).privately owned oak forest in the Ozark High-lands has been successfully managed at a q If sustaining oaks is the primary managementvalue of approximately 1.3 (for 1-inch d.b.h, objective, we recommend that guiding curvesclasses) for 40 years (Loewenstein 1996, Wang be applied to the species that usually domi-1997); (2) total stand densities below 50 ft2 nate the forest canopy (predominantly oaksbasal area result in unused growing space and hickories) (fig. 5). However, other speciesduring much of the cutting cycle and encour- also may occupy significant growing space,age epicormic branching and associated especially in the smaller diameter classes.reduction in tree bole quality (Dale and These trees should be considered in determin-Sonderman 1984); and (3) decreasing total ing total stand stocking. However, becauseresidual stocking from 56 to 50 ft2 substan- they rarely attain canopy dominance, theytially increases the probability of obtaining need not be considered in defining the guidingmore and larger reproduction (fig. 4B). Stands curve. We know from experience that, inreduced to 50 ft2 of basal area every 20 years uneven-aged oak forests in the Ozark High-
lands, oaks average 70 percent of the basalarea and other merchantable species make up
2 The numeric relation between stand basal area and another 20 percent of the basal areastocking percent is close to 1:1 when stand structure (Loewenstein 1996). Accordingly, we propose aconforms to a negative exponential diameter distribu- guiding curve that defines only the residualtion that includes trees >2 in. d.b.tu, and stands are stocking of the species that dominate theat low to moderately hlgh stocking. For example, for •a q of 1.3, the basal area range of 35 to 75ft 2per forest canopy.acre corresponds to 34 to 73 percent stocking. Basalarea, therefore, only slightly overestimates the Based on the negative exponential function, wepercent of growlng space used by trees under the presentcoefficients for guiding curves for theuneven-aged stand structures typical of Ozark oak potential canopy dominants for q values of 1.2,forests. The relation becomes less exact as minimum 1.25, and 1.3, (1-inch classes) and a residualdiameter increases.
ii
6

SUMMARY AND CONCLUSIONS
_,, 0f,_.me_e This knowledge and the resultant silvicultural_y _0_' recommendations are based primarily on thes_i,_0f,_.o_ analysis of 40 years of records from a large60 _ c_0pyd_i_ts
O;k,to_g managed uneven-aged forest in the OzarkHighlands. This represents the largest andmost completedatabase currently availablefor
40 evaluating the application of the single-treeeL
selectionmethodin that region. Success inapplying the single-tree selection method tothe oak forests of the Ozark Highlands de-
20 pends on severalfactors including:
• Sustaining adequate recruitment of oakreproduction into the overstory. Ad-
o equate recruitment of oak reproduction0 5 I0 15 20 depends on maintaining a population of
D.b.l_ (in.) large oak seedling sprouts beneath thecanopy of the parent stand. Such reproduc-tion has the growth potential to capture
Figure 5._Components of stocking in relation to canopy gaps created by the single-treea guiding curve. The guiding curve excludes selection method.non-merchantable subcanopy species (prima-
rtly sassafras, flowering dogwood, blackgurn, * Maintaining ecologically appropriateand red maple). Although non-merchantable stand densities. Because high standsubcanopy species are disregarded in defin- densities severely limit the survival anding the guiding curve, they nevertheless may development of the relatively shade-intoler-occupy significant growing space. The illus- ant oak reproduction, stands should betrated stocking of non-oak canopy dominants managed at densities compatible with the(primarilyhickories and shortleafpine) and survival and development of oak reproduc-non-merchantable subcanopy species repre- tion of adequate number and size.sents typical stand conditions but may vary
in time and space. * Maintaining silviculturally adequateoverstory densities. There also is a lowerpractical limit in overstory density that isdetermined by the minimum density for full
density of 45 ft 2 per acre (table 1). Because or nearly full utilization of growing space bythe guiding curve is based only on the poten- trees and the related maintenance of treetial canopy dominants, residual basal area is bole quality. Based on those considerations,90 percent of 50 ft2 or 45 ft2. Table 1 assumes together with oak regeneration require-that 20-1nch trees represent the largest trees ments, we recommend reducing total standretained at the end of a cutting cycle. For density to approximately 50 ft 2 of basal areaeach q, the number of 20-inch trees is pre- per acre (for trees >_2 inches d.b.h.) every 20sented to facilitate calculation of the number years or less.of trees in each 1-inch d.b.h, class (see table 1,
footnote b). A q near 1.2 results in proportion- * Controlling stand density and structure
ately more stocking in large diameter trees with an appropriate guiding curve. Weand, hypothetically, the need for fewer num- recommend controlling stand density andbers of large reproduction stems than a q of structure using a guiding curve based only1.3 or larger (fig. 3). For convenience, we also on the oaks and other potential canopypresent the number of trees by 1- and 2-inch dominants. Assuming that this merchant-d.b.h, classes for three values of q (tables 2 able component accounts for approximatelyand 3, respectively). 90 percent of total residual (after harvest)
stocking, we recommend a guiding curvebased on a residual basal area of 45 ft2/acre
7:
I i
Table 1.mCoe_lentsfor the negative exponential function for recommended guiding cur_s for the
merchantable species I
q Coefficients for the Number of 20-inch Number of 1-inchfor guiding curve guiding curve 2 d,b.h, trees per acre trees per acre(l-inch d.b.h, represented by required by theclasses) a b guiding curve s guiding curve
1.20 34.799 -0.1823 0.91 29.01.25 55.205 -0.2231 0.64 44.21.30 83.060 -0.2624 0.44 63.9
i Coefficients or numbers of 20-inch trees can be used to derive numbers of trees per 1-inch d.b.h, class for threevalues of q, and for a residual basal area of 45 ft 2 per acre for trees 2 to 20 inches d.b.h.
2 Based on the negative exponentlalfunction, which is given by:
N_= ae bD_ (I)
where Ni is the number of trees in ithd.b.h, class, a and b are coeJTicients of the negative exponentlal function _ois the natural logarithm of q, and is always negative), e is the base of natural logarithms, and Di is the midpointdiameter of the ithd.b.h, class in inches. Coej_ients are glven for 1-inch d.b.h, classes. Values ofq correspond-Ing to other d.b.tL classes are the values given in the table for 1-inch classes raised to the power given by theclass width (e.g., second, third, and fourth powers for 2-, 3-, and 4-inch d.b.h, classes, respectively). A methodfor calcul_atlng a for any given q and stand density (expressed as either basal area per acre or stocking percentbased on Gingrich's stocking equation) is presented by Moser (1976). Alternatively, guiding curves can becalculated from equation 2, below, which does not require spec_ying a.
3 The number of trees in other 1-inch d.b.h, classes can be calculated by sequentially multiplying q times thenumber of trees in successively smaller d.b.h, classes. For example, the number of 19-inch trees equals q timesthe number of 20-inch trees, the number of18-inch trees equals q times the number of19-inch trees, etc. Forany given value of q, residual stand basal area, and range of diameters, the number of trees in a given maxi-mum d.b.h, class (Nmax), Le., the largest d.b.h, retained in the residual stand based on the guiding curve, can becalculated by:
RBANmax =
where RBA is the selected residual basal area in ft 2 per acre for a spec_wd range of tree diameters represented
by the guiding curve, BA_ is the basal area of the tree of d.b.h. Di in ft 2, q (which is the reciprocal of the antilog ofb in eq. 1) is the selected stand structure represented by the guiding curve, D,_ x is the maximum tree d.b.h.represented by the guiding curve, and w is d.b.h, class width in inches. Equation 2 is convenlent for calculatingguiding curves using computer spreadsheets.
i
(90 percent of total residual stocking) and a relatively large numbers and associated .q of 1.2 to 1.3 for 1-inch d.b.h, classes (1.4 effects on stand regeneration and boleto 1.7 for 2-inch classes). We recommend quality.harvesting trees across the widest possiblerange of diameters to ensure maximum The recommended guiding curves are generallycontrol of stand structure, Although non- consistent with the regeneration dynamics of
merchantable subcanopy trees occupy a the oak forests of Ozark Highlands, We there-small amount of growing space (about 5 ft 2 fore offer them as a reasonable basis forof basal area per acre on the average), they sustaining oaks and other valuable canopy imake up a silviculturally significant compo- dominants using the single-tree selectionnent of stand stocking because of their method in that region.
8

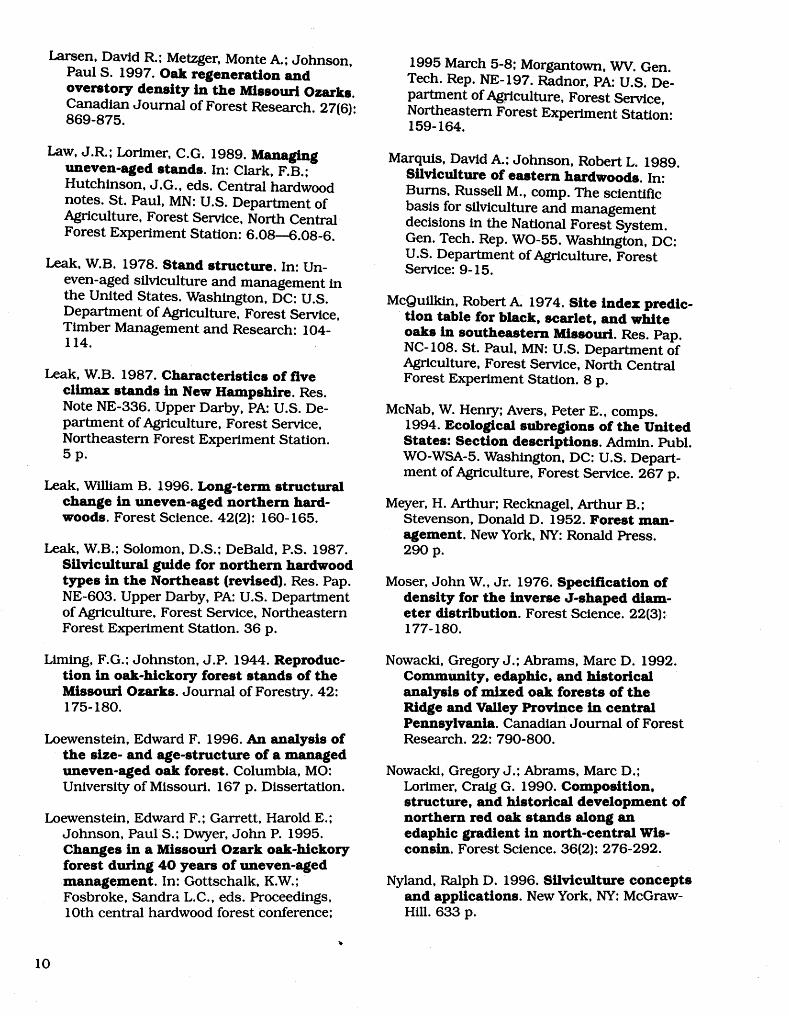
Table 2.--Number of trees in 1-inch d.b.h. LITERATURE CITED
classes for a residual basal area of 45 ft 2 peracre for three q values I Abrams, M.D.; Nowacki, G.J. 1992. Historical
variation in fire, oak recruitment, and
Number of trees per 1-1nch d.b.h, post-logging accelerated succession incentral Pennsylvania. Bulletin of theclass for qof
D.b.h.(In.) 1.2 1.25 1.3 Torrey Botanical Club. 119: 19-28.
2 24.2 35.3 49.1 Dale, M.E.; Sonderman, D.L. 1984. Effect of3 20.1 28.3 37.8 thinning on growth and potential quality4 16.8 22.6 29. I of young white oak crop trees. Res. Pap.5 14.0 18.1 22.4 NE-539. Radnor, PA: U.S. Department of6 11.7 14.5 17.2 Agriculture, Forest Service, Northeastern7 9.7 11.6 13.2 Forest Experiment Station. 11 p.8 8.1 9.3 10.29 6.7 7.4 7.8 de Liocourt, F. 1898. De l'ame_ement des
I0 5.6 5.9 6.0 Sapixderes. Bulletin de la Societe forestiere11 4.7 4.7 4.6 de Franche-Comte et du Territorie de12 3.9 3.8 3.6 Belfort. 4: 396-409, 645-647.13 3.3 3.0 2.714 2.7 2.4 2.1 Dey, Daniel C., Johnson, Paul S.; Garrett, H.E.15 2.3 1.9 1.6 1996. ModeUng the regeneration of oak16 1.9 1.6 1.2 stands in the Missouri Ozark Highlands.17 1.6 1.2 1.0 Canadian Journal of Forest Research. 26(4):
18 1.3 1.0 0.7 573-583.19 1.1 0.8 0.620 0.9 0.6 0.4 Gin[g]rich, S.F. 1967. Measuring and evaluat-
ing stocking and stand density in uplandhardwood forests in the Central States.
i Values were calculated using the method presented Forest Science. 13(1): 38-53.in table 1, footnote 2.
Johnson, Paul S. 1979. Shoot elongation ofblack oak and white oak sprouts. Cana-dian Journal of Forest Research. 9(4): 489-494.
Table 3.--Number of trees in 2-inch d.b,h.
classes for a residual basal area of 45 ft 2 per Johnson, Paul S. 1993a. Perspectives on theacre for four q values I ecology and silviculture of oak-domi-
nated forests in the central and eastern
Diameter Number of trees per 2-inch states. Gen. Tech. Rep. NC-153. St. Paul,class class for qof MN: U.S. Department of Agriculture, Forest
1.4 1.5 1.6 1.7 Service, North Central Forest ExperimentStation. 28 p.
2 40.9 57.5 76.9 98.94 29.2 38.3 48.1 58.2 Johnson, Paul S. 1993b. Sources of oak
6 20.9 25.5 30.0 34.2 reproduction. In: Loftis, David L.; McGee,8 14.9 17.0 18.8 20. I Charles E., eds. Symposium proceedings,
I 0 10.7 11.4 11.7 11.8 Oak regeneration: serious problems, practi-12 7.6 7.6 7.3 7.0 cal recommendations; 1992 September 8-14 5.4 5.0 4.6 4.1 I0; Knoxville, TN. Gen. Tech. Rep. SE,84.16 3.9 3.4 2.9 214 Asheviile, NC: U.S. Department of Agricul-
18 2.8 2.2 1.8 1.4 ture, Forest Service, Southeastern Forest20 2.0 1.5 I .I 0.8 Experiment Station: 112-131.
i Values were calculated using the method presentedin table 1, footnote 2.
9
-.-._
Larsen, David R.; Metzger, Monte A.; Johnson, 1995 March 5-8; Morgantown, WV. Gen.Paul S. 1997. Oak regeneration and Tech. Rep. NE-197. Radnor, PA: U.S. De-
overstory density in the Missouri Ozarks. partment of Agriculture, Forest Service,Canadian Journal of Forest Research. 27(6): Northeastern Forest Experiment Station:869-875. 159-164.
Law, J.R.; Lorimer, C.G. 1989. Managing Marquis, David A.; Johnson, Robert L. 1989.uneven-aged stands. In: Clark, F.B.; Silviculture of eastern hardwoods. In:
Hutchinson, J.G., eds. Central hardwood Burns, Russell M., comp. The scientific
notes. St. Paul, MN: U.S. Department of basis for silviculture and managementAgriculture, Forest Service, North Central decisions in the National Forest System.Forest Experiment Station: 6.08--6.08-6. Gen. Tech. Rep. WO-55. Washington, DC:
U.S. Department of Agriculture, ForestLeak, W.B. 1978. Stand structure. In: Un- Service: 9-15.
even-aged silviculture and management in
the United States. Washington, DC: U.S. McQuilkin, Robert A. 1974. Site index predic-Department of Agriculture, Forest Service, tion table for black, scarlet, and white
Timber Management and Research: I04- oaks in southeastern Missouri. Res. Pap.114. NC-108. St. Paul, MN: U.S. Department of
Agriculture, Forest Service, North Central
Leak, W.B. 1987. Characteristics of five Forest Experiment Station. 8 p.climax stands in New Hampshire. Res.
Note NE-336. Upper Darby, PA: U.S. De- McNab, W. Henry; Avers, Peter E., comps.partment of Agriculture, Forest Service, 1994. Ecological subregions of the UnitedNortheastern Forest Experiment Station. States: Section descriptions. Admin. Publ.
5 p. WO-WSA-5. Washington, DC: U.S. Depart-ment of Agriculture, Forest Service. 267 p.
Leak, William B. 1996. Long-term structural
change in uneven-aged northern hard- Meyer, H. Arthur; Recknagel, Arthur B.;woods. Forest Science. 42(2): 160-165. Stevenson, Donald D. 1952. Forest man-
agement. New York, NY: Ronald Press.Leak, W.B.; Solomon, D.S.; DeBald, P.S. 1987. 290 p.
Silvicultural guide for northern hardwood
types in the Northeast (revised). Res. Pap. Moser, John W., Jr. 1976. Specification ofNE-603. Upper Darby, PA: U.S. Department density for the inverse J-shaped diam-of Agriculture, Forest Service, Northeastern eter distribution. Forest Science. 22(3):Forest Experiment Station. 36 p. 177-180.
Liming, F.G.; Johnston, J.P. 1944. Reproduc- Nowacki, Gregory J.; Abrams, Marc D. 1992.tion in oak-hickory forest stands of the Community, edaphic, and historicalMissouri Ozarks. Journal of Forestry. 42: analysis of rn_i_ed oak forests of the175-180. Ridge and Valley Province in central
Pennsylvania. Canadian Journal of ForestLoewenstein, Edward F. 1996. An analysis of Research. 22: 790-800.
the size- and age-structure of a manageduneven-aged oak forest. Columbia, MO: Nowacki, Gregory J.; Abrams, Marc D.;University of Missouri. 167 p. Dissertation. Lorimer, Craig G. 1990. Composition,
structure, and historical development ofLoewenstein, Edward F.; Garrett, Harold E.; northern red oak stands along an
Johnson, Paul S.; Dwyer, John P. 1995. edaphic gradient in north-central Wis-Changes in a Missouri Ozark oak-hickory consin. Forest Science. 36(2): 276-292.forest during 40 years of uneven-agedmanagement. In: Gottschalk, K.W.; Nyland, Ralph D. 1996. Silviculture conceptsFosbroke, Sandra L.C., eds. Proceedings, and applications. New York, NY: McGraw-10th central hardwood forest conference; Hill. 633 p.
10
Roach, Benjamin A. 1962. Practical silvlcul- Smith, David M. 1986. The practice of sIIVl-ture for central hardwood stands. South- culture. 8th ed. New York, NY: Wiley. 527 p.ern Lumberman. October:34-35, 38.
Smith, H.C. 1980. An evaluation of four
Roach, Benjamin A. 1974. What is selection uneven-aged cutting practices in centralcutting and how do you make it work, Appalachian hardwoods. Sourthern Jour-what is group selection and where can it nal of Applied Forestry. 4(4): 193-200.be used. AFRI Misc. Rep. 5. Syracuse, NY:State University of New York, College of Smith, H.C.; Lamson, N.I. 1982. Number of
Environmental Science and Forestry, residual trees: a guide for selectionApplied Forestry Research Institute. 9 p. cutting. Gen. Tech. Rep. NE-80. Broomall,
PA: U.S. Department of Agriculture, ForestSander, Ivan L. 1971. Height growth of new Service, Northeastern Forest Experiment
oak sprouts depends on size of advance Station. 33 p.reproduction. Journal of Forestry. 69(11):809-811. Stout, Susan L. 1991. Stand density, stand
structure, and species composition inSander, Ivan L. 1979. Regenerating oaks. In: transition oak stands of northwestern
Proceedings of the National silviculture Pennsylvania. In: McCormick, Larry H.;workshop; 1979 September 17-21; Charles- Gottschalk, Kurt W., eds. Proceedings, 8thton, SC. Washington, DC: U.S. Department Central hardwood forest conference; 1991of Agriculture, Forest Service: 212-221. March 4-6; University Park, PA. Gen. Tech.
Rep. NE-148. Broomall, PA: U.S. Depart-Sander, Ivan L.; Clark, F. Bryan. 1971. Repro- ment of Agriculture, Forest Service, North-
duction of upland hardwood forests in eastern Forest Experiment Station: 194-the Central States. Agric. Handb. 405. 206.Washington, DC: U.S. Department of Agri-culture, Forest Service. 25 p. Trimble, G.R., Jr. 1970.20 years of intensive
uneven-aged management: effect onSander, Ivan L.; Graney, David L. 1993. Re- growth, yield, and species composition in
generating oaks in the Central States. In: two hardwood stands in West Virginia.Loftis, David L.; McGee, C.E., eds. Sympo- Res. Pap. NE-154. Upper Darby, PA: U.S.sium proceedings, Oak regeneration: seri- Department of Agriculture, Forest Service,ous problems, practical recommeildations; Northeastern Forest Experiment Station.1992 September 8- I0; Knoxville, TN. Gen. 12 p.Tech. Rep. SE-84. Ashevflle, NC: U.S.Department of Agriculture, Forest Service, Trimble, G.R., Jr. 1973. The regeneration ofSoutheastern Forest Experiment Station: Central Appalachian hardwoods with174-183. emphasis on the effects of site quality
and harvesting practice. Res. Pap. NE-Sander, Ivan L.; McGee, Charles E.; Day, 282. Upper Darby, PA: U.S. Department of
Kenneth G.; Willard, R.E. 1983. Oak- Agriculture, Forest Service, Northeastern
hickory. In: Burns, R.M., tech. comp. Forest Experiment Station. 14 p.Silvicultural systems for the major forest
..... types of the United States. Agric. Handb. Wang, Zhiming. 1997. Stability and predict-445. Washington, DC: U.S. Department of ability of diameter distributions in aAgriculture, Forest Service: 116-120. managed uneven-aged oak forest. Co-
lumbia, MO: University of Missouri. 148 p.Schnur, G. Luther. 1937. Yield, stand, and Dissertation.
_Ji_ volume tables for even-aged upland oak_i_:: forests. Tech. Bull. 560. Washington, DC:
_i U.S. Department of Agriculture, Forest
Service. 87 p.
_
11

The U.S. Departmentof Agriculture(USDA) prohibitsdiscriminationinall its programsand activitiesonthe basis of race, color,nationalorigin,gender,religion,age, disability,politicalbeliefs,sexualorientation,end maritalorfamilystatus. (Not all prohibitedbases applyto allprograms.) Personswith disabilitieswho requirealternativemeansfor communicationof program information(Braille,largeprint, audiotape,etc.) shouldcontactUSDA'sTARGET Center at (202) 720-2600 (voiceandTDD).
To file a complaint of discrimination, write USDA, Director, Office of Civil Rights, Room
326.W, WhittenBuilding,14th and IndependenceAvenue, SW, Washington,DC20250-9410, or call (202) 720-5964 (voice or TDD). USDA is an equalopportunity
providerandemployer.
O Pdntedon recyclablepaper. _,

i,
Larsen, David I_; Loewenstein, Edward F.; Johnson, Paul S.1999. Sustaining recruitment of oak reproduction in uneven-
aged stands in the Ozark Highlands, Gen. Tech. Rep. NC-203.St. Paul, MN: U.S. Department of Agriculture, Forest Service,North Central Research Station. 11 p.
Successful application of the single-tree selection system inOzark oak forests depends on sustaining adequate recruitment ofreproduction into the overstory. In turn, this requires maintainingstand density at ecologically appropriate levels. The ecologicalrequirements for oak recruitment are discussed and guidingcurves are presented that meet those requirements.
KEY WORDS: Uneven-aged silviculture, stand structure, standdensity, diameter distributions.

Our job at the North Central Forest Experiment Station is discovering andcreating new knowledge and technology in the field of natural resources andconveying this information to the people who can use it. As a new generationof forests emerges in our region, managers are confronted with two uniquechallenges: (1) Dealing with the great diversity in composition, quality, andownership of the forests, and (2) Reconciling the conflicting demands of thepeople who use them. Helping the forest manager meet these challengeswhile protecting the environment is what research at North Central is allabout.
NORTH
EHPERImENTSTATION
_[1._I. ('.OVI_.R_ I_INTIhlO Ol_lClt.: Ig419-7_I_.9._I/II{I_5