jack johnsonuwgarbology.weebly.com/uploads/1/3/0/1/13017489/fall_2012_final... · jack johnson...
TRANSCRIPT

Jack Johnson [email protected] UW Garbology Project Fall 2012 Final Report 12/12/2012 Abstract This document summarizes the work and findings of the UW Garbology Project’s autumn 2012 trash sorting and analysis. An overview of fall 2012 sorting and analysis objectives are briefly detailed below, followed by a description of our efforts to meet these objectives through the analysis of a limited sample of campus trash. Resultant data are then discussed at length, although data and figures are appended to the end of this document for ease of reference and visual comparison. Insights derived from these data are then provided, followed by a small set of recommendations for future work. Concurrent project initiatives which are unrelated to trash sorting and analysis are not discussed here. Overview Ultimately, our current work aims to help UW Recycling meet its goal of improving the efficiency and sustainability of campus waste management by reducing the amount of waste we send to landfills and increasing the proportion of our waste which is recycled or composted. At present, the UW sends an estimated 43% of its solid waste to landfills – the other 57% is diverted away from landfills through strategies such as composting and recycling – but UW Recycling wants to achieve a minimum of 70% diversion by FY 20201. Importantly, because landfill costs are higher per ton of solid waste than costs for recycling or composting, meeting UW’s Recycling’s goal of 70% waste diversion carries a significant financial incentive in addition to its obvious environmental incentives.
Meeting this goal also poses a significant challenge, however, since it involves making profound improvements in the overall efficiency of a complex campus-wide waste system involving myriad users, materials, contexts, tools, facilities, administrative bodies, and workers. In general, such improvements will require a thorough and accurate documentation of our current waste issues, an identification of specific areas where improvement is most needed, easiest to achieve, and/or potentially beneficial, and the development of systemic changes which strategically target these identified areas of need. Obviously, we cannot fully meet this challenge campus-wide with our project’s current efforts. Instead, our aim for fall 2012 was merely to continue to tackle this challenge for a distinct and significant sub-portion of our overall campus waste: outdoor waste bins in high-traffic public areas.
This portion of campus waste was chosen as a project focus for two very different reasons. First, outdoor bins are numerous, ubiquitous, easily accessible (having no temporal or status-related barriers to use), highly visible, and (especially in high-traffic public areas) frequently-used. Simply put, these bins most rapidly accumulate waste from the broadest cross-section of the UW community, and they are therefore probably the best single representation of campus waste overall. As such, we considered outdoor bins to be a good conceptual point of departure in examining waste diversion issues campus-wide. Second, we undertook a more limited study of outdoor bins during our summer 2012 efforts2, and re-examining these bins during our fall 2012 efforts afforded us the practical advantage of building upon and complementing previous data and insights in project planning and execution. In other words, we chose to focus our limited resources – 5 workers, no devoted budget, and facilities and equipment donated by UW Recycling – to deepen our understanding of outdoor waste bins rather than diluting these resources by attempting to break new investigative ground altogether.
Within the full set of outdoor waste bins, we elected to further limit the scope of our fall efforts to the examination of BigBelly solar kiosks located in Red Square, for three reasons. First, we examined these kiosks as part of our summer 2012 efforts, and as such re-examination of these bins accommodated the aforementioned practical concerns. Second, re-examination of these specific kiosks – as opposed to others near the HUB, for example – facilitated a direct time-transgressive comparison of kiosk waste between summer and fall, allowing us to begin to interpret how seasonal changes in UW’s trash stream might affect our larger conclusions from both summer and fall. Third, the BigBelly kiosks in many ways represent UW Recycling’s future vision for outdoor composting and recycling on campus3, and we were again (as in summer) attracted by the opportunity to contribute our perspective to the value of these kiosks as an emerging campus initiative. In particular, we were interested in examining both 1) how well these kiosks are diverting waste at present, and 2) how we might improve their effective waste diversion rates in the future, since we feel that doing so will help make kiosk implementation as effective as possible, thereby directly contributing to UW Recycling’s larger waste-diversion goals. Given these interests, we identified three specific objectives for this season’s sorting work. First, we wanted to compare patterns in outdoor waste disposal between summer and fall academic quarters as a means of beginning to explore time-transgressive trends in campus waste. Second, we wanted to examine kiosk waste diversion effectiveness by calculating current diversion rates. Third, we wanted to examine contamination rates (i.e. waste items deposited in inappropriate bins, such as compost deposited in the bin for landfill-bound trash) in kiosks as a means of documenting significant endemic inefficiencies in current kiosk use. In doing so, we were particularly interested in quantifying the prevalence of specific categories of contaminants, since this information could be used to help target systematic responses in the future. From previous experience, we identified food waste, plastics, and paper cups as likely sources of significant contamination, and as such a further goal was to directly quantify the abundance of each of these categories. Methods Our general investigative strategy aimed to address the above objectives within the limited resources at our disposal. As such, our investigation centered on a limited sample drawn from among the Red Square kiosks examined during our summer 2012 project. Our specific tactics for sampling, sorting, and measuring materials from these kiosks are each detailed below. Sampling Two Red Square kiosks were sampled for this quarter’s analysis: the Spokane Lane kiosk (located at the southwestern edge of the UW Quadrangle) and the Odegaard 2 kiosk (located at the western entrance to Red Square). These two kiosks were selected from the seven located in Red Square because previous data indicated they were the two which most rapidly accumulate waste; this high accumulation rate was favored for its robustness against the influence of infrequent or unusual depositional events on final data, and therefore interpretations. Waste from all three within-kiosk bin types – trash, compost, and recycling – was always collected so that the total waste stream passing through these kiosks could be comprehensively examined. This measure is noteworthy because it differs from our summer analysis, which examined kiosk landfill-bound trash bins only, excluding compost and recycling bins from analysis. Kiosks were sampled in such a way that waste from separate bins was kept distinct, however, allowing independent examination of waste from each bin type. Collection took place each Wednesday for five weeks between October 17th and November 14th, inclusive, and this repeated sampling helped increase sample size while again helping to account for random variation in waste deposition week-to-week. Importantly, Wednesday sample collection always followed a preparatory emptying of kiosk bins on the preceding Monday. This approach effectively re-set all waste bins to zero accumulation on Monday, in turn allowing Wednesday collection to harvest a sample representing an accumulation interval which was standardized across all waste bin types. In
1 http://www.washington.edu/facilities/building/recyclingandsolidwaste/files/2011Report.pdf
2 http://uwgarbology.weebly.com/uploads/1/3/0/1/13017489/summer_2012_garbology_report.pdf
3 http://f2.washington.edu/ess/promote/snapshots/hi-tech-solar-kiosks
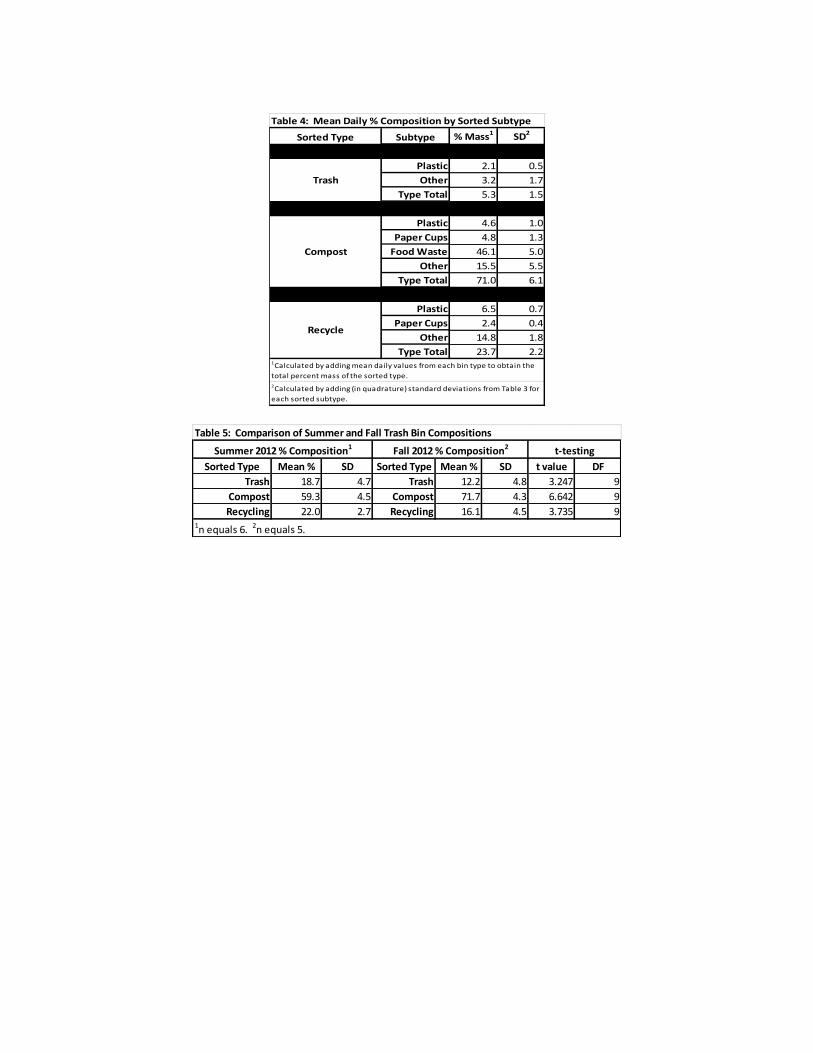
other words, sampled trash, compost, and recycling had always been accumulating for the same amount of time before collection, allowing for the direct comparison of accumulation rates between all sampled bins and materials. Sample collection and transportation were graciously carried out by UW Recycling personnel. Sorting Once collected, materials were sorted at UW Recycling’s Bryants Annex facility following the three-tiered system of categorization depicted in Figure 1. The highest tier divided sampled waste by the type of bin into which each piece of waste was discarded by kiosk users. In other words, this tier was determined entirely by the bin in which we recovered each item. These “source bin types” are therefore emic; they represent the conceptual categories kiosk users actually employed when throwing stuff away. The middle tier of categorization separated collected materials into three “sorted types” according to the bin type into which each item should have been placed if discarded correctly. The lower tier was composed of a total of nine “sorted subtypes” which reflect our specific interest in examining the role of plastics, food waste, and paper cups in detail. Every item from all sampled bins was categorized by bin type, sorted type, and sorted subtype in this way. In some cases, individual waste items were composed of more than one sorted subtype or sorted type. For example, plastics such as bottles, storage bags, or carry-out containers often held food or liquids. In such cases, we divided the waste item into its constituent components and categorized each component individually; plastic containers were therefore sorted into one of the three subtypes for plastic materials while food and/or liquid contents of these containers were separated and sorted into the “food waste” category. In the case that absorbent materials such as paper were saturated by waste effluent, we wrung out as much of the absorbed liquid as possible into the “food waste” and categorized the paper item separately. As a result, it is important to note that subtypes likely to contain absorbent materials – primarily “other compost” and “other recyclables” – also typically included some residual absorbed effluent liquids. The measured prevalence of these categories is therefore likely to be a slight overestimate, while the inverse is true of the “food waste” category. This situation is somewhat frustrating, but it is also ubiquitous and unavoidable, and it is not necessarily damaging to interpretations if simply kept in mind as a small confounding factor. Measurement After each weekly sorting, the total mass of each of the nine sorted subtypes from each of the three collected bin types was weighed to 1-gram precision to yield a total of 27 weekly mass measurements. These data were recorded for each weekly sample, allowing week-to-week comparison of sorting results. Again, recorded weights of sorted subtypes which contained absorbent materials are likely to be slight overestimates due to the inadvertent inclusion of residual liquids in measurement. Results Numerical results are shown in Tables 1-4. Table 1 provides the raw measurements of weights of all sorted subtypes (rows) divided by source bin types (columns) and sorting date (column clusters). The “Type Total” field provides the total amount of sorted trash, compost, or recycling identified within each sampled bin type. The “Source Type Total” field provides the total weight recovered from each sampled bin type. The “Grand Total (Daily)” field provides the total sampled weight of all waste examined during each sorting session. At right summary descriptive statistics are displayed, including means and standard deviations.
Table 2 converts the raw weights from Table 1 into percentages of the total daily mass of each sampled bin type. In other words, Table 2 gives Table 1 values as a percentage of their respective column’s “Source Type Total” from Table 1. This conversion highlights the relative contribution of each sorted subtype to each sampled bin, making it easy to see which subtypes predominate within each kiosk bin type. The “%Contamination” field indicates the portion of each sampled bin that was composed of materials identified as belonging to a sorted type incongruent with the sampled bin type. For example, if compost or recyclable materials were recovered from the trash bin, they were considered to be contaminants in this bin and were incorporated into the “%Contamination” metric for the bin as a whole. For sampled compost bins, “%Contamination” instead indicates the total trash and recycling present, and for sampled recycling bins this field represents the total compost and trash present. This row of values is therefore significant as a measure of how well users identified appropriate bins during waste disposal. Individual fields in Table 2 are also valuable for identifying which sorted subtypes are most likely to be mis-categorized during waste disposal. Again, summary descriptive statistics are displayed at right.
Table 3 is similar to Table 2, but presents values as percentages of the total daily sample rather than as percentages within each bin type for each day. Values here therefore show the prevalence of each source bin, sorted type, and sorted subtype relative to the total mass of that day’s sorted materials. Here, several unique rows of data are also included at the bottom of the table. The “Source Type Total” row shows composition of the day’s sample as divided between sampled bin types. This gives the relative accumulation between kiosk trash, compost, and recycling bins as a simple product of user behavior. The “Sorted Type” row shows the composition of the day’s sample as divided between sorted types. This gives the actual composition of the waste sampled, and by contrast with the “Source Type Total” row helps highlight inefficiencies in user waste behaviors. The “Total % Diverted from Landfills” row indicates the summed non-trash bin portion of the daily sample, and reflects the actual amount of waste kiosk users diverted from landfills by placing items in compost or recycling bins. The “% Successfully Diverted” row is similar, but gives a more realistic view of user waste-diversion efficiency by subtracting the weight of contaminants in compost or recycling bins. The “% Potentially Diverted” row indicates the portion of the daily sample which would have been diverted from landfills had kiosk users universally placed waste items into appropriate bins. In other words, this row reflects ideal waste disposal behavior and zero contamination in all bin types. Summary statistics are again at right.
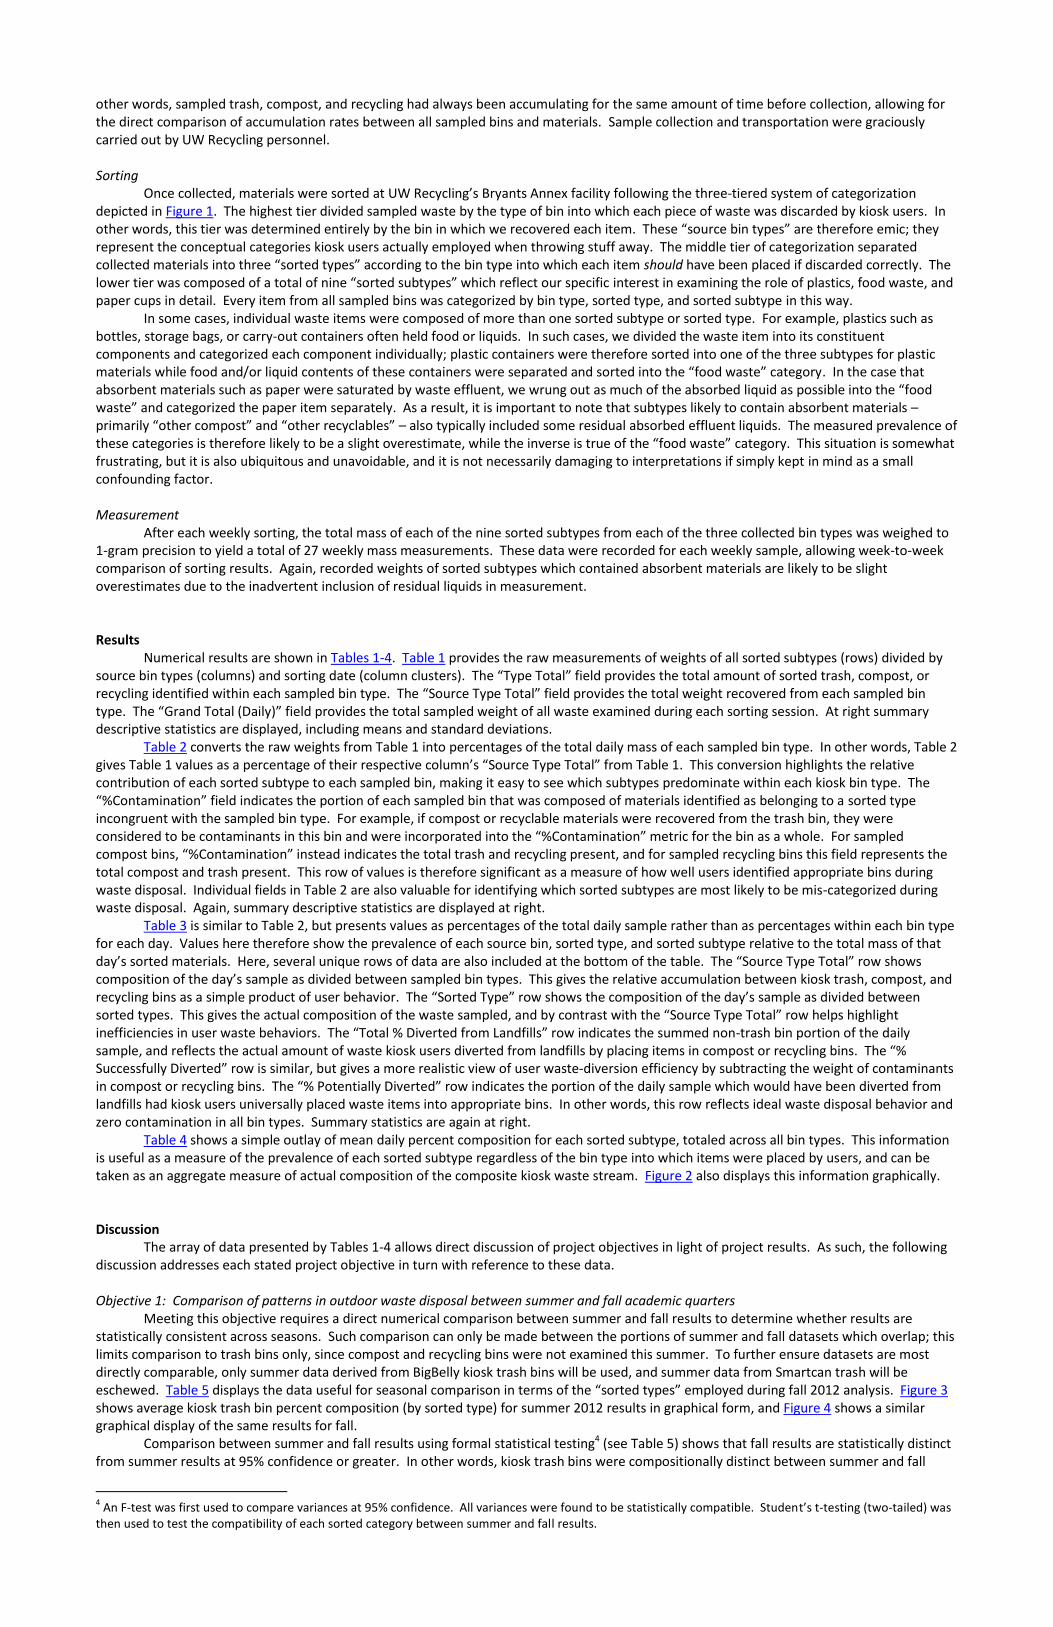
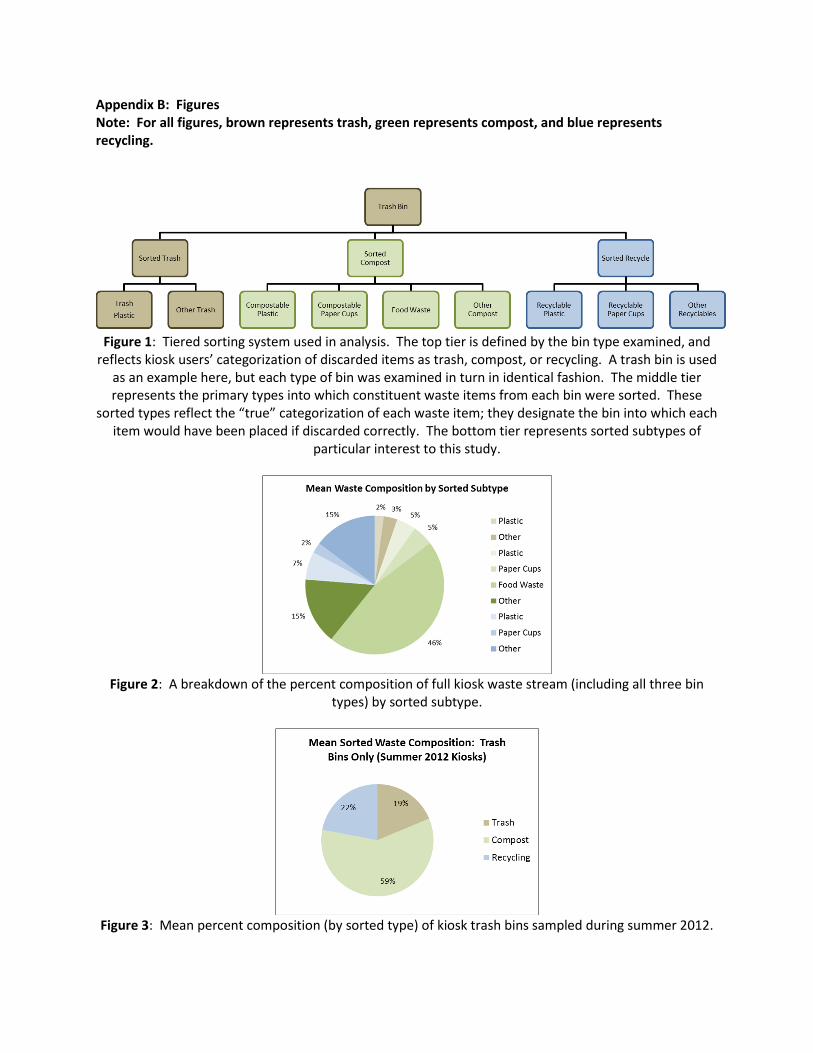
Table 4 shows a simple outlay of mean daily percent composition for each sorted subtype, totaled across all bin types. This information is useful as a measure of the prevalence of each sorted subtype regardless of the bin type into which items were placed by users, and can be taken as an aggregate measure of actual composition of the composite kiosk waste stream. Figure 2 also displays this information graphically. Discussion The array of data presented by Tables 1-4 allows direct discussion of project objectives in light of project results. As such, the following discussion addresses each stated project objective in turn with reference to these data. Objective 1: Comparison of patterns in outdoor waste disposal between summer and fall academic quarters Meeting this objective requires a direct numerical comparison between summer and fall results to determine whether results are statistically consistent across seasons. Such comparison can only be made between the portions of summer and fall datasets which overlap; this limits comparison to trash bins only, since compost and recycling bins were not examined this summer. To further ensure datasets are most directly comparable, only summer data derived from BigBelly kiosk trash bins will be used, and summer data from Smartcan trash will be eschewed. Table 5 displays the data useful for seasonal comparison in terms of the “sorted types” employed during fall 2012 analysis. Figure 3 shows average kiosk trash bin percent composition (by sorted type) for summer 2012 results in graphical form, and Figure 4 shows a similar graphical display of the same results for fall.
Comparison between summer and fall results using formal statistical testing4 (see Table 5) shows that fall results are statistically distinct from summer results at 95% confidence or greater. In other words, kiosk trash bins were compositionally distinct between summer and fall
4 An F-test was first used to compare variances at 95% confidence. All variances were found to be statistically compatible. Student’s t-testing (two-tailed) was
then used to test the compatibility of each sorted category between summer and fall results.

sampling. In summer, for example, contamination due to the deposition of recyclable materials in landfill-bound trash was about 6% higher on average, while contamination due to the presence of compost was about 13% lower on average. Fall users showed a significantly higher propensity to incorrectly place compost or recyclables in kiosk trash bins (88% contamination for fall versus 81% for summer), indicating fall kiosk users sent a higher rate of waste to landfills unnecessarily.
This apparent seasonal difference carries at least two significant implications. First, because waste composition within the same set of kiosks can demonstrably differ by season, we should be extremely cautious in using seasonal results to characterize our annual waste stream until more cross-seasonal data become available. Future testing may alleviate this concern to some extent – for example, by showing that summer (when campus population plummets) is an outlier compared to the rest of the academic year, which shows little inter-quarter seasonality between autumn, winter, and spring – but more data will be needed before this claim can be made, and the above concern laid to rest. At present, it is therefore prudent to assume the results presented in Tables 1-4 represent the fall quarter waste stream only. Second, given the fact that some seasonality inheres in kiosk use, exploration of the root cause of these seasonal differences becomes an interesting prospect for future work. Whether this cause is due to demographic shifts during summer (e.g. fewer undergraduates on campus, or perhaps a higher number of campus visitors), shifts in campus use-behaviors (e.g. nice weather leading to different activities taking place near kiosks), or something else entirely, further testing could help isolate these causes and yield insights into the variables affecting our waste stream over time. With any luck, this knowledge could help us target these variables for future study and/or waste-reduction initiatives. Objective 2: Quantification of the current waste-diversion efficacy of the BigBelly kiosks in Red Square
Diverted waste materials are by definition those items which are composted or recycled instead of being sent to landfills. In kiosks, this means that the proportion diverted from landfills is comprised of the summed proportions deposited in kiosk compost and recycling bins. As such, source bin type is the dimension of primary relevance here, and sorted types and subtypes are (for the moment) irrelevant.
Figure 5 displays the mean proportional mass of all three kiosk bin types, while Figure 6 displays current diversion rates (in terms of actual accumulations and in terms of accumulations adjusted for contamination in kiosk compost and recycling bins), as well as potential diversion rates if campus users placed waste in appropriate bin types with 100% frequency. In sum, about 66.9% of the waste stream passing through these kiosks is currently diverted from landfills. That rate is about 10% higher than the campus-wide average of 57%1, indicating kiosks are likely a positive influence on current campus diversion rates overall. When one also considers the fact that these kiosks represent an alternative to campus Smartcans – which currently predominate campus outdoor waste collection points yet have limited diversion potential for recyclables and no diversion potential for compost – it is clear that kiosks are an improvement over other common campus strategies for waste diversion. Kiosks, for example, can accommodate the fact that most of our waste stream is compost (about 71%; See Figure 2), while Smartcans cannot. Our data therefore generally support the idea that kiosks are helping the UW move towards 70% waste diversion, and in fact waste diversion rates exhibited by these kiosks very nearly meet this goal already.
Unfortunately, our data also show that this diversion rate of about 66.9% fails to tell the whole story of kiosk effectiveness, since a significant portion of diverted waste was actually diverted incorrectly. In other words, a portion of the waste in kiosk compost and/or recycling bins was, in fact, due to the inclusion of contaminants. If contaminants in compost and recycling bins are subtracted from kiosk diversion rates, we see that kiosks actually “successfully” diverted only about 53.9% of all waste mass from landfills. The gap between our actual diversion rates and this successful diversion rate is therefore significant, and we should seek to close this gap by striving to reduce contamination in kiosk compost and recycling bins, thereby helping to ensure that the materials we are actually diverting should be diverted. If this reduction is accomplished in tandem with reducing contamination in trash bins – which accumulate 33% of overall kiosk waste but exhibit extremely high rates of contamination (about 88% contamination (see below), meaning 29% of all materials accumulated in kiosks are recyclables or compost inappropriately deposited in trash bins) – we’ll see tremendous improvements in overall diversion rates. In fact, if users had perfectly identified the appropriate bin for each waste item, kiosks would have diverted about 94.7% of the overall waste load. Thus while kiosks are already arguably helping the UW reach its current goals by improving upon Smartcans, finding ways to encourage users to make continued improvements in kiosk use nonetheless carries significant untapped potential for future waste diversion efforts. Objective 3: Examination of bin-by-bin contamination rates, with attention to the contribution of food waste, plastics, and paper cups Contamination – again defined here as waste items deposited in inappropriate bins – for each bin type is summarized by Figure 7. In general, trash bins were most contaminated (about 88% contamination), followed by recycling bins (about 39% contamination), with compost bins representing the least contaminated bin type (about 7% contamination).
Contamination in trash bins is of course extremely significant, and represents the single most substantial area of potential improvement in efficiency of kiosk use. Figure 4 again shows that most of this contamination is due to folks putting compost in trash bins, as about 72% of waste accumulation in trash bins was attributable to compost alone. About 16% of this contamination was due to the inclusion of recyclables. Future efforts to reduce contamination – and improve diversion rates – should therefore focus on encouraging composting first and foremost, while recognizing that significant improvements to our recycling efficiency can also be made. Figure 8 shows a detailed breakdown of trash bin contamination by sorted subtype prevalence, and indicates that food waste is the single most significant contaminant in trash bins (52% of contamination), followed by “other compost” (primarily compostable paper packaging, most of which sources to on-campus food vendors; 21% of contamination) and “other recyclables” (primarily non-compostable paper products; 10% of contamination). As a result, it is clear that most contamination stems from people throwing the contents of their on-campus meals, including foods and compostable/recyclable packaging, into trash bins. Given the fact that compost bins are readily available at these locations, this result surely stems in part from users’ ignorance as to what is compostable or their downright unwillingness to engage in composting behavior. While the latter issue may be intractable at present, the former issue of ignorance might be at least partially addressed by attempting to increase awareness of composting programs on campus. Greater awareness of the array of compostable containers available on campus may be particularly productive, since our sample exhibited a significant pattern of compostable containers placed in the trash with food contents remaining; users seemed especially unaware of instances where it was correct put their containers and food leftovers in compost bins, so they threw it all in the trash instead. In other words, we think that many users don’t know their containers can go in the compost bin, so they simply throw them (and their contents) into trash bins, amplifying contamination by including multiple subtypes of compostable materials as a byproduct of ignorance related to the container subtype only. Regardless of whether this conjecture is ultimately borne out, the larger point that we must improve our rates of composting remains extremely salient. At an average rate of 39%, contamination in recycling bins is also pronounced, perhaps somewhat surprisingly so. Figure 9 shows a breakdown of recycling bin composition by sorted type, and Figure 10 displays recycling bin contamination by sorted subtype. Taken together, they paint a picture of recycling bin contamination which is driven primarily by the inclusion of compostable materials in recycling bins, especially food waste (68% of contamination), packaging (“other”; 9%), and paper cups (8%), although plastic contaminants also make up a significant element (trash plastics and compostable plastics total 13% of contamination when combined together). As such, it is again apparent that improving rates of composting will make the largest single improvement to the efficiency with which kiosk recycling bins isolate appropriate materials. We need to prevent food waste in particular from ending up in recycling bins, and this should be a relatively easy task due to the fact that this type of contamination largely derives from a single culprit: liquids contained in plastic bottles and/or paper cups. In other words, during sorting it was readily apparent to us that if kiosk recycling bin users had simply poured out their liquids before recycling their containers, the majority (well over 60%) of contamination in these bins would be eliminated entirely. Also apparent is the fact that categories of trash which can generally be difficult for users to properly assign to bins such as plastics (which can be trash, compost, or recyclable, depending on the composition of the particular plastic) and paper cups (which can be either recyclable or compostable, again depending on the composition of the cup) show up as reasonably significant contributors to contamination. Addressing this issue may prove difficult, as it will involve either 1) more thoroughly educating kiosk users about very nuanced distinctions between subtypes of plastics and/or paper cups, or 2) more thoroughly

limiting the availability of distinct subtypes on campus as a means of eliminating the need for users to make nuanced distinctions on their own. Both approaches are likely to pose significant practical challenges, although not necessarily insurmountable ones. For the present, however, we should focus most of our attention on the larger issue of contamination due to food waste, since this is where the potential for improvement is greatest and most needed. Within compost bins, contamination is a much lower 7% overall. Figure 11 shows a breakdown of compost bin composition by sorted type, and Figure 12 displays compost bin contamination by sorted subtype. Most contamination in compost bins was caused by the inclusion of recyclable materials such as paper (the predominant contributor to the “other” category), paper cups, and recyclable plastics, reinforcing the above assertion that many users are having difficulty distinguishing between recyclable and compostable materials which are outwardly similar in form. Overall, however, compost bin users earned high marks for their willingness and ability to properly sort waste materials into appropriate bins. Since kiosk users as a whole don’t exhibit this same willingness and ability (as evidenced by the fact that lots of compost ends up in trash bins, which are about 72% compost), the low contamination within compost bins is likely due to the predominance of a dedicated subset of compost-conscious users making use of compost bins. In other words, it is likely that accumulations in compost bins represent a subsample of kiosk users which is relatively distinct from kiosk trash bin users. If we could somehow get all kiosk users to interface with trash and recycling bins in the manner these compost-conscious users interface with compost bins, our contamination rates would be much lower, and our diversion rates much higher. As a future initiative, it might therefore be worthwhile to attempt to study the habits of compost bin users as a means of attempting to derive insights about their behaviors which might help translate these behaviors to the full set of kiosk users. Summary of Findings In sum, then, we have found that kiosks are already helping us approach UW Recycling’s waste diversion goals, although it is also obvious that kiosk effectiveness exhibits both 1) statistically significant seasonal dependence and 2) ample room for improvement. Contamination remains a significant issue, especially in trash bins, but also for recycling bins and to a much lesser extent compost bins. The issues driving contamination are certainly complex and merit further examination, but it is clear that some categories of waste such as food waste, food containers (paper and plastic), and paper cups are the primary recurring issues and therefore most merit further action. We also need to find ways to broadly encourage more composting as a primary means of reducing contamination in both trash and recycling bins (see Figure 13), as the vast majority of both 1) what gets sent to landfills and 2) contamination in recycling bins is in fact compostable. In other words, the biggest single improvement we can make to kiosk effectiveness is to find ways to encourage users to compost more. Since the data also suggest that active engagement in composting is linked with relatively low contamination rates, and possibly with increased user awareness, increasing composting on campus may carry the additional advantage of helping to reduce contamination resulting from other, non-compostable materials. Recommendations
To the extent that the above analysis and discussion applies to outdoor campus waste bins as a whole, we can begin to use these results as a basis for strategic responses to some of the more significant extant inefficiencies within our outdoor bins. With this in mind, our participants offer a few suggestions for improving the waste diversion rates of these bins. These suggestions are of course not comprehensive, but instead represent some of the more salient general insights garnered from two seasons of examining patterns in kiosk waste. Recommendation 1: Greatly increase the number of compost bins available on campus. As detailed above, most (about 71%) of the total waste mass in kiosks was compostable (72% of materials in trash bins alone was compost). In fact, the mass ratio of sorted compost to sorted trash was over 14:1, meaning kiosks accumulated more than 14 times as much compost as trash belonging in a landfill. Yet the ratio of compost to trash bins on campus is a striking inversion of this ratio, as there are perhaps 20 times as many outdoor trash bins as there are compost bins on campus, meaning we designate most of our infrastructure to the collection of about 5% of our overall waste stream. The current abundance and distribution of trash and compost bins on campus is therefore wholly incongruent with the reality of UW’s outdoor trash, and if we are to facilitate more composting we must begin by improving our infrastructure for composting. While this may not fully solve the particular issue of compost finding its way into trash cans, more compost bins are clearly a pre-requisite to addressing this issue, and may also have the added advantage of raising general awareness of composting while making it easy for campus users to get in the habit of composting regularly. Either way, composting more is clearly the key to increasing waste diversion on campus, and our current network of compost bins – although growing – is woefully inadequate for our needs. One additional striking fact will help drive this point home: if we were to simply use compost bins to collect all outdoor campus waste – thus placing no recycling or trash bins on campus – those compost bins would have less contamination than our trash and recycling bins exhibit now. This is again because 71% of our waste is now compost, meaning a single compost bin collecting all waste would be 29% contaminated as compared to the current rates 88% contamination for trash bins and 39% for recycling bins. In other words, so much of our waste is compost that we could actually improve our current system in aggregate (from a contamination perspective) if we just treated all our outdoor campus waste as compost. That’s how significant compost is in our current outdoor waste stream, and we would be wise to treat it as such.
Recommendation 2: Get people to pour out their liquids before depositing solids.
Because waste-related costs accrue by the ton, liquids are generally heavy compared to common waste solids such as packaging, and liquids make up a large portion of the food waste contaminating recycling and trash bins, we should be able to save a lot of money if we can simply get people in the habit of pouring out their liquids before tossing their beverage containers in collection bins. This is especially true for recycling bins, where as much as 68% of accumulated contaminants – or about 25.5% of all the mass accumulated in recycling bins – was compostable food waste, most of which was composed of liquids. This should be a simple message to get across to users, since a single sign on each recycling bin reading “POUR IT OUT!” would convey all the nuance necessary. Of course, getting users to pour their liquids into compost bins or some other acceptable receptacle such as a nearby sink, drain, or the like may prove to be a sticking point. Also, given the volumes of liquids involved there may be small implications for UW’s wastewater treatment costs should these liquids go down the drain. Still, if these practical concerns can be taken into consideration, there is plenty of incentive to get folks to pour out their liquids moving forward.
Recommendation 3: Better educate people about how to dispose of carry-out containers. So much bin contamination was due to the presence of carry-out containers (included in the “other” category of either recyclables or compost, depending on the type of container) that it became clear to us that the average kiosk user typically didn’t know (or didn’t care) if/when their container was compostable or recyclable. In other words, it seemed like more people got it wrong than right. For some containers, especially those made of paper and/or cardboard, this confusion was likely often due to the fact that the containers themselves were poorly marked or ambiguous in terms of their composition and optimal method of disposal. Other containers were well-marked as recyclable or compostable, but this often made little difference in terms of how often these containers found their way into appropriate waste bins. It seems therefore that the point isn’t coming across at present. Our participants have discussed several ideas as to why this might be the case, and some are beginning to explore this topic in detail, so for the present detailed elaboration on strategies for educating kiosks users will be eschewed here. Instead, it must suffice for the present to note that the issue exists, and some of our members are beginning to explore possible remedies involving (but not limited to) 1) changing signage on collection bins, 2) advertising at source vendors, and/or 3) outreach efforts through UW classes, student groups, and events. Recommendation 4: Explore the possibility of subsidizing incentives to use re-usable cups.

About 7% of our total sample was composed solely of recyclable or compostable paper cups, representing several hundred cups of coffee, soda, and soup sourced primarily to campus cafes. If the mass of plastic cups was also considered, this number would easily leap into the double-digits. Thus, a sizeable portion of our outdoor trash load is due solely to single-use beverage containers from campus cafes. This seems like wanton wastefulness, especially in light of the fact that users are likely repeating these single-use episodes routinely, and the accumulation of these cups – in addition to the accumulation of a portion of their contents – in the trash could be largely averted if greater numbers of campus users were to take advantage of re-usable cups and containers. Many cafes already offer incentives in the form of price reductions for those who bring their own cups, but in light of the continued prevalence of disposable cups it may be worthwhile to examine the possibility of strengthening this incentive by subsidizing additional discounts and/or cultivating a system for distributing low-cost re-useable cups on campus. The economic bottom line of this proposition is well beyond the scope of this analysis, but given the significant costs we are already incurring in disposing of these single-use cups, it certainly behooves the UW to explore the idea of investing a bit of money into measures that will save money by reducing their abundance in our waste stream.

Appendix A: Tables
Table 3: Sample Composition (As a Percent of Total Daily Mass)
Trash Compost Recycle Trash Compost Recycle Trash Compost Recycle Trash Compost Recycle Trash Compost Recycle Trash Compost Recycle Trash Compost Recycle
Sorted Type Subtype %Daily %Daily %Daily %Daily %Daily %Daily %Daily %Daily %Daily %Daily %Daily %Daily %Daily %Daily %Daily %Daily %Daily %Daily %Daily %Daily %Daily
Plastic 0.7 0.2 0.7 1.8 0.3 0.5 1.2 0.0 0.4 1.7 0.2 0.5 1.6 0.3 0.4 1.4 0.2 0.5 0.4 0.1 0.1
Other 3.4 0.3 0.3 2.0 0.6 0.4 5.4 0.2 0.3 0.7 0.1 0.3 1.5 0.5 0.1 2.6 0.3 0.3 1.7 0.2 0.0
Type Total 4.1 0.4 1.0 3.8 1.0 0.8 6.6 0.2 0.6 2.4 0.3 0.8 3.1 0.7 0.5 4.0 0.5 0.8 1.5 0.3 0.1
Plastic 1.7 4.1 1.0 0.8 2.5 0.3 1.1 1.7 0.7 1.5 2.4 0.8 1.7 1.9 0.8 1.3 2.5 0.7 0.4 0.9 0.3
Paper Cups 2.1 4.1 1.1 1.6 3.9 0.9 1.4 1.9 1.0 0.6 1.5 0.2 0.9 2.1 0.7 1.3 2.7 0.8 0.5 1.2 0.3
Food Waste 15.3 21.2 6.9 14.2 28.5 7.6 15.0 31.8 8.8 15.0 20.1 7.7 15.0 20.5 3.4 14.9 24.4 6.9 0.4 4.9 0.8
Other 11.2 3.0 1.0 3.1 9.2 0.2 5.0 7.4 1.1 5.6 15.9 1.3 6.5 5.8 1.2 6.3 8.3 1.0 3.0 4.6 0.4
Type Total 30.3 32.4 10.0 19.6 44.0 9.1 22.4 42.7 11.6 22.7 39.9 10.0 24.0 30.2 6.1 23.8 37.9 9.3 3.9 4.6 1.0
Plastic 1.6 0.7 5.4 1.2 0.3 4.8 1.0 0.4 3.9 1.5 0.6 4.1 1.7 0.7 4.6 1.4 0.6 4.6 0.3 0.2 0.6
Paper Cups 0.7 0.5 0.8 1.0 1.0 0.3 0.7 0.4 0.4 0.6 0.5 0.9 1.6 1.4 1.4 0.9 0.7 0.8 0.2 0.2 0.2
Other 1.4 1.6 9.1 3.0 0.8 9.2 1.3 0.3 7.4 3.5 1.5 10.7 5.7 0.9 17.4 3.0 1.0 10.8 1.0 0.5 1.4
Type Total 3.7 2.8 15.3 5.2 2.1 14.3 3.0 1.1 11.7 5.7 2.6 15.7 9.0 2.9 23.4 5.3 2.3 16.1 1.2 0.7 1.7
38.0 35.7 26.3 28.7 47.1 24.2 32.0 44.1 23.9 30.7 42.8 26.4 36.2 33.8 30.0 33.1 40.7 26.2 3.5 4.3 1.2
5.5 72.7 21.8 5.6 72.7 21.7 7.4 76.7 15.8 3.5 72.5 24.0 4.3 60.3 35.3 5.3 71.0 23.7 1.4 2.1 3.3
62.0 71.3 68.0 69.3 63.8 66.9 3.5
47.7 58.4 54.4 55.6 53.6 53.9 3.9
94.5 94.4 92.6 96.5 95.7 94.7 1.4% Potentially Diverted (total % of non-trash items)
7-Nov Means Standard Deviations31-Oct Sort Date: 17-Oct 14-Nov
Trash
24-Oct
Source Bin Type:
Source Type Total
Total % Diverted from Landfills
Compost
Recycle
Sorted Type Total
% Successfully Diverted (amount of correctly-placed compost and recycling)
Table 1: Raw Weights
Trash Compost Recycle Trash Compost Recycle Trash Compost Recycle Trash Compost Recycle Trash Compost Recycle Trash Compost Recycle Trash Compost Recycle
Sorted Type Subtype Mass (g) Mass (g) Mass (g) Mass (g) Mass (g) Mass (g) Mass (g) Mass (g) Mass (g) Mass (g) Mass (g) Mass (g) Mass (g) Mass (g) Mass (g) Mass (g) Mass (g) Mass (g) Mass (g) Mass (g) Mass (g)
Plastic 191 46 200 500 94 130 356 12 110 530 66 172 446 70 98 404.5 57.7 142.0 134.7 29.9 35.5
Other 927 72 85 568 179 106 1620 58 78 230 38 86 406 128 24 750.1 95.1 75.7 516.7 54.7 11.9
Type Total 1117 119 285 1068 273 236 1976 70 188 760 104 258 852 198 122 1154.7 152.7 217.8 453.0 78.2 37.1
Plastic 474 1139 272 212 707 82 324 500 216 466 772 244 460 502 204 387.1 724.0 203.6 108.7 231.8 72.9
Paper Cups 574 1133 301 454 1098 261 426 560 308 182 490 72 248 568 190 376.8 769.7 226.4 143.2 297.3 96.2
Food Waste 4210 5837 1892 4004 8035 2157 4502 9563 2638 4796 6424 2454 4060 5546 924 4314.4 7081.0 2013.1 300.6 1464.5 309.4
Other 3084 836 286 873 2592 58 1500 2232 324 1802 5080 418 1748 1562 338 1801.3 2460.3 284.9 805.6 1533.8 132.4
Type Total 8342 8944 2752 5543 12432 2558 6752 12855 3486 7246 12766 3188 6516 8178 1656 6879.7 11035.0 2728.0 1006.0 1658.4 382.7
Plastic 449 199 1477 349 90 1353 292 126 1176 478 200 1308 456 182 1252 404.9 159.4 1313.1 75.3 47.6 107.7
Paper Cups 193 132 219 296 277 92 210 114 120 202 166 272 430 366 380 266.2 211.0 216.5 45.2 65.6 75.1
Other 382 442 2522 834 231 2603 396 98 2230 1134 468 3432 1544 248 4718 858.0 297.4 3101.0 325.1 153.0 481.8
Type Total 1024 773 4217 1479 598 4048 898 338 3526 1814 834 5012 2430 796 6350 1529.0 667.8 4630.7 379.0 193.0 566.8
10485 9835 7254 8090 13303 6842 9626 13263 7200 9820 13704 8458 9798 9172 8128 9563.9 11855.5 7576.4 877.5 1591.7 612.6
27575 28235 30089 31982 27098 28995.8 1731.3
Standard DeviationsMeans31-Oct 7-Nov 14-Nov
Trash
Compost
24-Oct
Source Bin Type:
Sort Date: 17-Oct
Recycle
Source Type Total
Grand Total (Daily)Table 2: Sample Composition (As a Percent of Total Daily Source Bin Mass)
Trash Compost Recycle Trash Compost Recycle Trash Compost Recycle Trash Compost Recycle Trash Compost Recycle Trash Compost Recycle Trash Compost Recycle
Sorted Type Subtype %Source %Source %Source %Source %Source %Source %Source %Source %Source %Source %Source %Source %Source %Source %Source %Source %Source %Source %Source %Source %Source
Plastic 1.8 0.5 2.8 6.2 0.7 1.9 3.7 0.1 1.5 5.4 0.5 2.0 4.6 0.8 1.2 4.3 0.5 1.9 1.7 0.2 0.5
Other 8.8 0.7 1.2 7.0 1.3 1.5 16.8 0.4 1.1 2.3 0.3 1.0 4.1 1.4 0.3 7.8 0.8 1.0 5.2 0.4 0.2
Type Total 10.7 1.2 3.9 13.2 2.1 3.4 20.5 0.5 2.6 7.7 0.8 3.1 8.7 2.2 1.5 12.2 1.3 2.9 4.8 0.6 0.5
Plastic 4.5 11.6 3.7 2.6 5.3 1.2 3.4 3.8 3.0 4.7 5.6 2.9 4.7 5.5 2.5 4.0 6.4 2.7 0.9 3.0 0.9
Paper Cups 5.5 11.5 4.2 5.6 8.3 3.8 4.4 4.2 4.3 1.9 3.6 0.9 2.5 6.2 2.3 4.0 6.8 3.1 1.5 3.2 1.4
Food Waste 40.2 59.3 26.1 49.5 60.4 31.5 46.8 72.1 36.6 48.8 46.9 29.0 41.4 60.5 11.4 45.3 59.8 26.9 3.7 8.9 4.2
Other 29.4 8.5 3.9 10.8 19.5 0.8 15.6 16.8 4.5 18.4 37.1 4.9 17.8 17.0 4.2 18.4 19.8 3.7 6.8 10.4 1.6
Type Total 79.6 90.9 37.9 68.5 93.5 37.4 70.1 96.9 48.4 73.8 93.2 37.7 66.5 89.2 20.4 71.7 92.7 36.4 4.3 2.2 5.0
Plastic 4.3 2.0 20.4 4.3 0.7 19.8 3.0 1.0 16.3 4.9 1.5 15.5 4.7 2.0 15.4 4.2 1.4 17.5 0.7 0.5 2.1
Paper Cups 1.8 1.3 3.0 3.7 2.1 1.3 2.2 0.9 1.7 2.1 1.2 3.2 4.4 4.0 4.7 2.8 1.9 2.8 0.7 0.5 0.8
Other 3.6 4.5 34.8 10.3 1.7 38.0 4.1 0.7 31.0 11.5 3.4 40.6 15.8 2.7 58.0 9.1 2.6 40.5 3.6 1.5 4.1
Type Total 9.8 7.9 58.1 18.3 4.5 59.2 9.3 2.5 49.0 18.5 6.1 59.3 24.8 8.7 78.1 16.1 5.9 60.7 4.5 2.0 4.7
89.3 9.1 41.9 86.8 6.5 40.8 79.5 3.1 51.0 92.3 6.8 40.7 91.3 10.8 21.9 87.8 7.3 39.3 4.8 2.2 4.7
Source Bin Type:
Sort Date: 17-Oct 24-Oct
Trash
Compost
Recycle
% Contamination
Means Standard Deviations31-Oct 7-Nov 14-Nov
Sorted Type Subtype % Mass1 SD2
Plastic 2.1 0.5
Other 3.2 1.7
Type Total 5.3 1.5
Plastic 4.6 1.0
Paper Cups 4.8 1.3
Food Waste 46.1 5.0
Other 15.5 5.5
Type Total 71.0 6.1
Plastic 6.5 0.7
Paper Cups 2.4 0.4
Other 14.8 1.8
Type Total 23.7 2.21Calculated by adding mean daily values from each bin type to obtain the
total percent mass of the sorted type.
2Calculated by adding (in quadrature) standard deviations from Table 3 for
each sorted subtype.
Table 4: Mean Daily % Composition by Sorted Subtype
Recycle
Trash
Compost
Sorted Type Mean % SD Sorted Type Mean % SD t value DF
Trash 18.7 4.7 Trash 12.2 4.8 3.247 9
Compost 59.3 4.5 Compost 71.7 4.3 6.642 9
Recycling 22.0 2.7 Recycling 16.1 4.5 3.735 9
t-testing
1n equals 6. 2n equals 5.
Table 5: Comparison of Summer and Fall Trash Bin Compositions
Summer 2012 % Composition1 Fall 2012 % Composition2
Appendix B: Figures Note: For all figures, brown represents trash, green represents compost, and blue represents recycling.
Figure 1: Tiered sorting system used in analysis. The top tier is defined by the bin type examined, and
reflects kiosk users’ categorization of discarded items as trash, compost, or recycling. A trash bin is used as an example here, but each type of bin was examined in turn in identical fashion. The middle tier represents the primary types into which constituent waste items from each bin were sorted. These
sorted types reflect the “true” categorization of each waste item; they designate the bin into which each item would have been placed if discarded correctly. The bottom tier represents sorted subtypes of
particular interest to this study.
Figure 2: A breakdown of the percent composition of full kiosk waste stream (including all three bin
types) by sorted subtype.
Figure 3: Mean percent composition (by sorted type) of kiosk trash bins sampled during summer 2012.
Figure 4: Mean percent composition (by sorted type) of kiosk trash bins sampled during fall 2012.
Figure 5: Average weights of each sampled bin type prior to sorting. These values directly reflect the
relative accumulation rates of kiosk bin types.
66.9
53.9
94.7
0
20
40
60
80
100
Actually Diverted Successfully Diverted Potentially Diverted
Mean Percent Diversion from Landfills
Figure 6: Mean diversion rates for the 5-week sample. “Actually Diverted” reflects the total measured % mass of compost and recycling bins summed together. “Successfully Diverted” reflects this value less contamination. “Potentially Diverted” reflects the proportion of overall waste which could have been
diverted if it had been universally disposed of correctly.
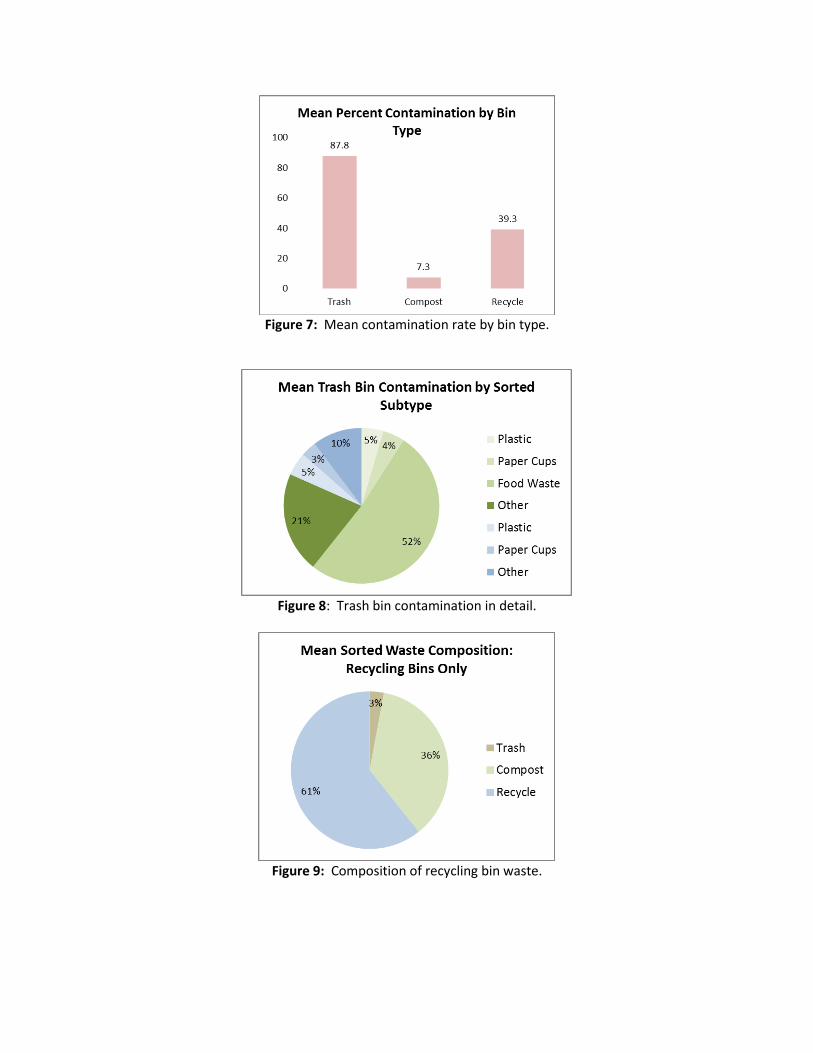
Figure 7: Mean contamination rate by bin type.
Figure 8: Trash bin contamination in detail.
Figure 9: Composition of recycling bin waste.

Figure 10: Recycling bin contamination in detail.
Figure 11: Composition of compost bin waste.
Figure 12: Compost bin contamination in detail.
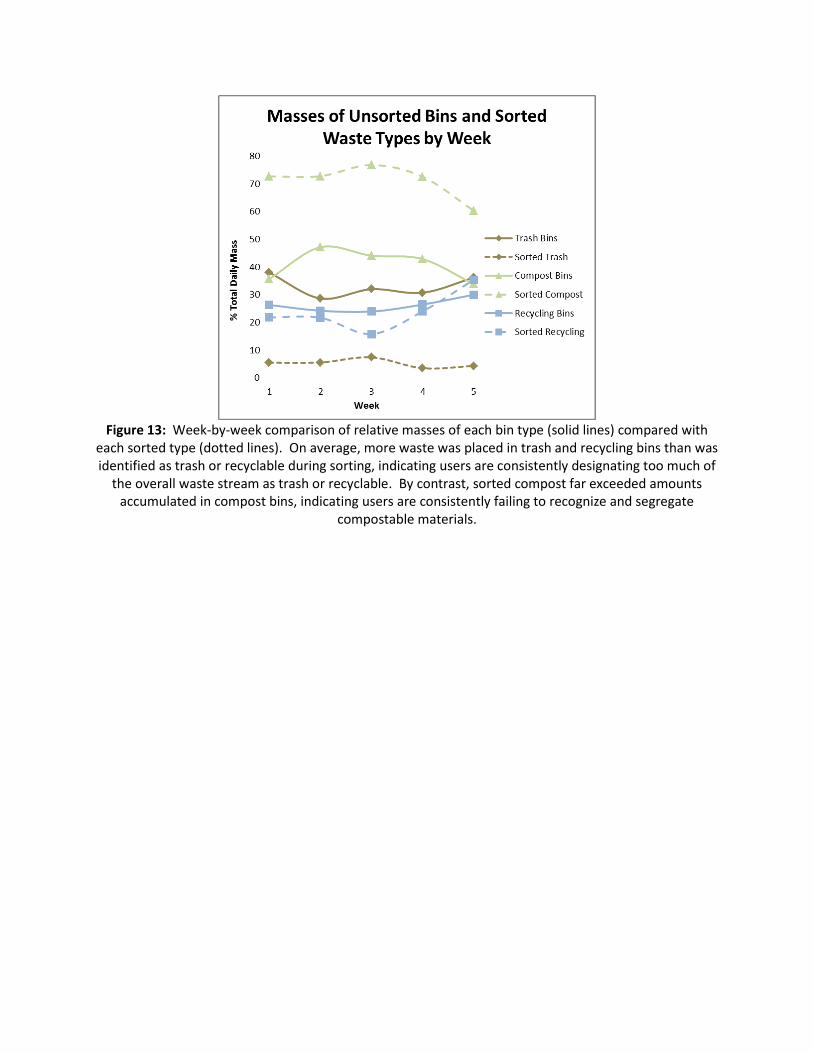
Figure 13: Week-by-week comparison of relative masses of each bin type (solid lines) compared with
each sorted type (dotted lines). On average, more waste was placed in trash and recycling bins than was identified as trash or recyclable during sorting, indicating users are consistently designating too much of
the overall waste stream as trash or recyclable. By contrast, sorted compost far exceeded amounts accumulated in compost bins, indicating users are consistently failing to recognize and segregate
compostable materials.