jak–stat pathway activation in malignant and nonmalignant...
TRANSCRIPT

JAK–STAT Pathway Activation in Malignant and Nonmalignant Cells Contributes to MPN Pathogenesis and Therapeutic Response Maria Kleppe 1 , Minsuk Kwak 2 , Priya Koppikar 1 , Markus Riester 3,4 , Matthew Keller 1 , Lennart Bastian 1 , Todd Hricik 1 , Neha Bhagwat 1,5 , Anna Sophia McKenney 1,5,6 , Efthymia Papalexi 1 , Omar Abdel-Wahab 1,7 , Raajit Rampal 1,7 , Sachie Marubayashi 1 , Jonathan J. Chen 2 , Vincent Romanet 8 , Jordan S. Fridman 9 , Jacqueline Bromberg 10 , Julie Teruya-Feldstein 11 , Masato Murakami 8 , Thomas Radimerski 8 , Franziska Michor 3,4 , Rong Fan 2,12 , and Ross L. Levine 1,7
RESEARCH ARTICLE
on March 31, 2015. © 2015 American Association for Cancer Research. cancerdiscovery.aacrjournals.org Downloaded from
Published OnlineFirst January 8, 2015; DOI: 10.1158/2159-8290.CD-14-0736

MARCH 2015�CANCER DISCOVERY | 317
ABSTRACT The identifi cation of JAK2/MPL mutations in patients with myeloproliferative neo-
plasms (MPN) has led to the clinical development of JAK kinase inhibitors, including
ruxolitinib. Ruxolitinib reduces splenomegaly and systemic symptoms in myelofi brosis and improves
overall survival; however, the mechanism by which JAK inhibitors achieve effi cacy has not been deline-
ated. Patients with MPN present with increased levels of circulating proinfl ammatory cytokines, which
are mitigated by JAK inhibitor therapy. We sought to elucidate mechanisms by which JAK inhibitors
attenuate cytokine-mediated pathophysiology. Single-cell profi ling demonstrated that hematopoietic
cells from myelofi brosis models and patient samples aberrantly secrete infl ammatory cytokines. Pan-
hematopoietic Stat3 deletion reduced disease severity and attenuated cytokine secretion, with similar
effi cacy as observed with ruxolitinib therapy. In contrast, Stat3 deletion restricted to MPN cells did
not reduce disease severity or cytokine production. Consistent with these observations, we found that
malignant and nonmalignant cells aberrantly secrete cytokines and JAK inhibition reduces cytokine
production from both populations.
SIGNIFICANCE: Our results demonstrate that JAK–STAT3-mediated cytokine production from malignant
and nonmalignant cells contributes to MPN pathogenesis and that JAK inhibition in both populations is
required for therapeutic effi cacy. These fi ndings provide novel insight into the mechanisms by which
JAK kinase inhibition achieves therapeutic effi cacy in MPNs. Cancer Discov; 5(3); 316–31. ©2015 AACR.
See related commentary by Belver and Ferrando, p. 234.
1 Human Oncology and Pathogenesis Program, Memorial Sloan Kettering Cancer Center, New York, New York. 2 Department of Biomedical Engineer-ing, Yale University, New Haven, Connecticut. 3 Department of Biostatistics and Computational Biology, Dana-Farber Cancer Institute, Boston, Mas-sachusetts. 4 Department of Biostatistics, Harvard School of Public Health, Boston, Massachusetts. 5 Gerstner Sloan Kettering Graduate School of Biomedical Sciences, New York, New York. 6 Weill Cornell/Rockefeller/Sloan Kettering Tri-Institutional MD–PhD Program, New York, New York. 7 Leuke-mia Service, Department of Medicine, Memorial Sloan Kettering Cancer Center, New York, New York. 8 Disease Area Oncology, Novartis Institutes for BioMedical Research, Basel, Switzerland. 9 Incyte Corporation, Wilming-ton, Delaware. 10 Breast Cancer Service, Department of Medicine, Memo-rial Sloan Kettering Cancer Center, New York, New York. 11 Department of Pathology, Memorial Sloan Kettering Cancer Center, New York, New York. 12 Yale Comprehensive Cancer Center, New Haven, Connecticut.
Note: Supplementary data for this article are available at Cancer Discovery Online (http://cancerdiscovery.aacrjournals.org/).
M. Kleppe and M. Kwak contributed equally to this article.
Corresponding Authors: Ross L. Levine, Human Oncology and Pathogen-esis Program, Leukemia Service, Department of Medicine, Memorial Sloan Kettering Cancer Center, 415 East 68th Street, 1275 York Avenue, Box 20, New York, NY 10065. Phone: 646-888-2796; Fax: 646-422-0856; E-mail: [email protected] ; and Rong Fan, Department of Biomedical Engineering, 55 Prospect Street, New Haven, CT 06520. E-mail: [email protected]
doi: 10.1158/2159-8290.CD-14-0736
©2015 American Association for Cancer Research.
INTRODUCTION Myeloproliferative neoplasms (MPN) are clonal hemato-
poietic disorders characterized by the proliferation of one
or more myeloid lineages ( 1 ). Patients with MPN develop
progressive splenomegaly, thrombosis, bleeding, and/or
infection. Patients with MPN are also at cumulative risk to
develop progressive bone marrow failure and/or transform
to acute myeloid leukemia (AML), conditions which are asso-
ciated with dismal clinical outcome ( 2 ). The discovery of
cytokine-independent colony formation of MPN progenitors
suggested that constitutive cytokine signaling contributes to
MPN pathogenesis ( 3 ). The observation of somatic activating
JAK2 V617F mutations in patients with polycythemia vera (PV),
essential thrombocythemia (ET), and primary myelofi brosis
(PMF) provided the fi rst insight into the molecular basis
of MPN ( 4–7 ). Subsequent studies identifi ed somatic JAK–
STAT pathway mutations in JAK2 V617F -negative MPN, most
commonly in the CALR gene ( 8, 9 ) and the thrombopoietin
receptor ( MPL W515L ; ref. 10 ). These data underscore the central
importance of genetic alterations in the JAK–STAT signaling
pathway in MPN pathogenesis.
The discovery of JAK2/MPL mutations in the majority of
patients with MPN provided the rationale for the clinical
development of JAK kinase inhibitors for patients with MPN
and subsequently for other malignancies. Clinical studies with
JAK kinase inhibitors have shown that these agents improve
splenomegaly, systemic symptoms, and overall survival ( 11 ).
On the basis of these data, ruxolitinib, a JAK1/JAK2 kinase
inhibitor, was approved for patients with myelofi brosis, and
several other JAK inhibitors are in late-phase clinical tri-
als. Although JAK inhibitors offer substantial clinical ben-
efi t to patients with MPN, the mechanisms by which these
agents achieve clinical effi cacy have not been fully delineated.
Patients with MPN have signifi cantly elevated circulating lev-
els of proinfl ammatory cytokines, and increased circulating
cytokine levels are associated with adverse survival in myelo-
fi brosis ( 12 ). It has been hypothesized that the cytokine-driven
infl ammatory state in MPN contributes to the constitutional
symptoms, bone marrow fi brosis, extramedullary hematopoi-
esis, and disease progression characteristic of these myeloid
malignancies. JAK inhibitor therapy with ruxolitinib is associ-
ated with a reduction in the level of proinfl ammatory cytokines
( 13 ); however, the role of aberrant cytokine production in
on March 31, 2015. © 2015 American Association for Cancer Research. cancerdiscovery.aacrjournals.org Downloaded from
Published OnlineFirst January 8, 2015; DOI: 10.1158/2159-8290.CD-14-0736

318 | CANCER DISCOVERY�MARCH 2015 www.aacrjournals.org
Kleppe et al.RESEARCH ARTICLE
myelofi brosis pathogenesis and in the response to JAK inhibi-
tors remains to be delineated. We therefore sought to elucidate
the role of aberrant cytokine production in MPN pathogen-
esis and in the response to JAK kinase inhibitors. We used a
novel microfl uidic single-cell profi ling technique to examine
the cytokine secretion profi les of myelofi brosis cells on a
single-cell level and show that a signifi cantly greater degree of
multifunctionality and heterogeneity in cytokine production
is a characteristic feature of myelofi brosis cells. Moreover, we
show that JAK–STAT signaling in nonmutant hematopoietic
cells contributes to MPN pathogenesis and that inhibition
of JAK–STAT signaling in both mutant and nonmutant cells
is required to reduce infl ammatory signaling and to achieve
clinical benefi t in MPNs.
RESULTS Proinfl ammatory Cytokines Are Elevated in Myelofi brosis Mice and Reversed with JAK1/2 Inhibitor Treatment
To identify cytokines that are altered in myelofi brosis, we
measured the serum levels of 32 cytokines in the MPL W515L
bone marrow transplant myelofi brosis model ( 14 ) using mul-
tiplex bead-based Luminex technology. We identifi ed a set of
infl ammatory cytokines, including IL6, CXCL9, and CCL2,
which are elevated in the serum of MPL W515L -mutant dis-
eased mice ( Fig. 1A ), similar to the alterations in circulating
cytokines observed in patients with myelofi brosis ( 12, 13 ).
Ruxolitinib treatment (90 mg/kg, twice a day ) normalized
cytokine levels, consistent with the effects seen with chronic
JAK inhibition in patients with MPN ( Fig. 1A and Supplemen-
tary Fig. S1; ref. 13 ). Circulating cytokine levels were also ele-
vated in myelofi brotic (6-month-old) Jak2 V617F ;Vav-Cre knockin
mice ( Fig. 1B ; ref. 15 ), and ruxolitinib treatment (60 mg/kg,
twice a day) normalized cytokine levels in mice transplanted
with Jak2 V617F -mutant cells ( Fig. 1C ). Short-term ruxolitinib
treatment (3 doses, 90 mg/kg, twice a day) reduced cytokine
production to a similar extent to that observed with 14 days of
ruxolitinib treatment (90 mg/kg, twice a day; Fig. 1D ), consist-
ent with the rapid improvements in symptoms and splenom-
egaly seen with JAK inhibitor therapy ( 13 ) and with a direct
effect of JAK kinase inhibition on cytokine secretion. The
majority of cytokines (7 of 8) were also increased in the bone
marrow supernatant ( Fig. 1E ) of MPL W515L -mutant diseased
Figure 1. Proinfl ammatory cytokines are elevated in myelofi brosis mice and normalized with JAK inhibition. A, changes in cytokine levels in vehicle- and ruxolitinib-treated MPL W515L -mutant mice compared with MigR1 mice. n = 6. *, P < 0.05. B, ruxolitinib [90 mg/kg, twice a day (b.i.d.)] reduces cytokines in mice transplanted with Jak2 V617F ;Vav - Cre + cells. n = 4. *, P < 0.05. C, log 2 fold changes in serum cytokine levels in primary JAK2 V617F knockin mice (late-stage disease) compared with age-matched littermate controls are shown. Mean ± SEM, n = 9 in each group. D, short-term treatment (3 doses, 90 mg/kg, twice a day) with ruxolitinib effi ciently reduces serum cytokine levels in MPL W515L -mutant diseased mice. Log 2 fold changes are displayed. n = 4. *, P < 0.05. E, log 2 fold changes in serum and bone marrow (BM) supernatant in MPL W515L mice compared with MigR1 mice. Mean ± SEM.
A
C D E
B
Fold
change in s
eru
m leve
ls
rela
tive
to M
igR
1
Fo
ld c
hange in s
eru
m leve
l
rela
tive
to litte
rmate
contr
ol
Fo
ld c
hange in s
eru
m leve
ls
rela
tive
to v
ehic
le c
ontr
ol
Fo
ld c
ha
ng
e in
cyto
kin
e leve
ls
rela
tive
to M
igR
1 c
ontr
ol
Fold
change in s
eru
m leve
l
rela
tive
to v
ehic
le c
ontr
ol
20
Vehicle
Secondary Jak2V617F;Vav-Cre transplant
Ruxolitinib 60 mg/kg (2 weeks, b.i.d.)
MigR1VehicleRuxolitinib
15
10
53
2
1*
*
* *
*
* *
*
* *
*
*** * * * *
*
*
*
*
*
*
*
*
*
* *
*
*
0
6
410
5
0
CSF3
CXC
L10
CXC
L9 IL6
CCL2
IL10
IL12
TNFα
−5
Vehicle
BM supernatantSerum
Ruxolitinib 90 mg/kg 3 dosesRuxolitinib 90 mg/kg 2 weeks (b.i.d.)
3
2
1
0
CSF3
CXC
L10
CXC
L9 IL6
CCL2
IL10
IL12
(p40
)
TNFα
Primary Jak2V617F;Vav-Cre knockin mice
(late-stage disease)
4
2
0
CXC
L10
CXC
L9 IL6
IL9
CCL3
CCL4
CCL5
CCL1
1
CXC
L2
CXC
L5
CSF3
CXC
L10
CXC
L9 IL6
CCL2
IL10
IL12
(p40
)
TNFα
CCL1
1IL
6IL
9
CXC
L5
CXC
L10
CCL3
CCL4
CXC
L2
CXC
L9
CCL5
∗
∗∗
∗ ∗
2
1
0
on March 31, 2015. © 2015 American Association for Cancer Research. cancerdiscovery.aacrjournals.org Downloaded from
Published OnlineFirst January 8, 2015; DOI: 10.1158/2159-8290.CD-14-0736

MARCH 2015�CANCER DISCOVERY | 319
JAK–STAT Pathway Activation in Malignant and Nonmalignant Cells in MPN RESEARCH ARTICLE
mice, suggesting that aberrant cytokine production in myelo-
fi brosis is, at least in part, derived from bone marrow cells.
Bone Marrow Myelofi brosis Cells Feature Aberrant Cytokine Secretion Profi les
To evaluate whether bone marrow cells are the source of
aberrant cytokine production in myelofi brosis, we optimized
a microchip system that allowed us to perform multiplexed
measurements of up to 15 secretory cytokines from primary
murine and human bone marrow cells at single-cell resolu-
tion ( Fig. 2A ; refs. 16–18 ). Hierarchical cluster analysis of the
single-cell secretomic profi les delineated multiple distinct
populations that displayed heterogeneous secretion signa-
tures and revealed marked differences between myelofi brosis
and control bone marrow cells ( Fig. 2A ). We observed a signif-
icant increase in the fraction of cytokine-secreting cells and in
the extent of cytokine secretion per single myelofi brosis cell
( Fig. 2B ). These data suggest the increased cytokine produc-
tion in myelofi brosis results from increased per-cell cytokine
secretion and from an increase in the fraction of cytokine-
secreting cells ( Fig. 2C ). The proportion of cells secreting at
least one cytokine was signifi cantly higher in myelofi brosis
mice compared with control mice (67.6% vs. 46.6%; P < 0.001;
Fisher exact test). The majority of cytokine-secreting control
bone marrow cells (73%) secreted less than two cytokines,
consistent with physiologic secretion of one cytokine per
cell. In contrast, we found that bone marrow cells from
myelofi brosis mice were composed of a signifi cantly elevated
frequency of multifunctional cells that cosecrete multiple
cytokines: 43.9% of cells from myelofi brosis mice secreted two
or more cytokines and 15.6% of cells secreted four or more
cytokines compared with 1.2% in control mice ( Fig. 2D ).
To determine which cytokines were most frequently cose-
creted by myelofi brosis cells, we calculated a mutual exclusiv-
ity P value for each pair of secreted cytokines ( Fig. 2E ). CCL3,
CCL4, and TNFα were commonly cosecreted in myelofi brosis
cells, and secretion of these cytokines was inversely correlated
with the secretion of other cytokines ( Fig. 2F ). We observed
cosecretion of all other cytokine combinations (IL6, IL12,
IL10, CCL2, CCL5, CXCL9, and CXCL1) in myelofi brosis cells,
consistent with the presence of at least two distinct popula-
tions of cytokine-secreting cells in myelofi brosis. In line with
these observations, principal component analysis (PCA) dem-
onstrated that a large proportion of normal bone marrow cells
did not secrete any protein and other smaller subsets with dis-
tinct secretion patterns produced only one or two cytokines,
most notably, CCL3 and CCL4 ( Fig. 2G and Supplementary
Fig. S2). In contrast, PCA maps of myelofi brosis bone marrow
cells showed multiple, large populations with heterogeneous
secretion signatures. We then used the Simpson diversity
index to quantify the extent of heterogeneity in cytokine
secretion, and found that this index increased signifi cantly
from 0.68 in normal cells to 0.85 in myelofi brosis cells ( P <
0.001), consistent with a marked increase in the heterogeneity
of single-cell cytokine secretion in myelofi brosis.
Mature Myeloid and Progenitor Cells Contribute to Aberrant Cytokine Levels In Vivo
We next sought to defi ne which hematopoietic compart-
ments contribute to aberrant cytokine secretion in myelo-
fi brosis. We used the single-cell platform to profi le mature
myeloid cells (CD11b/Gr1 double-positive) and megakary-
ocyte/erythroid progenitor (MEP) cells from myelofi brosis
and control mice. Similar to unfractionated bone marrow
cells, GFP-positive myelofi brosis myeloid cells and MEP cells
had an increase in the fraction of cytokine-secreting cells
and increased cytokine secretion per cell (Supplementary
Fig. S3). PCA analysis showed that each population had dis-
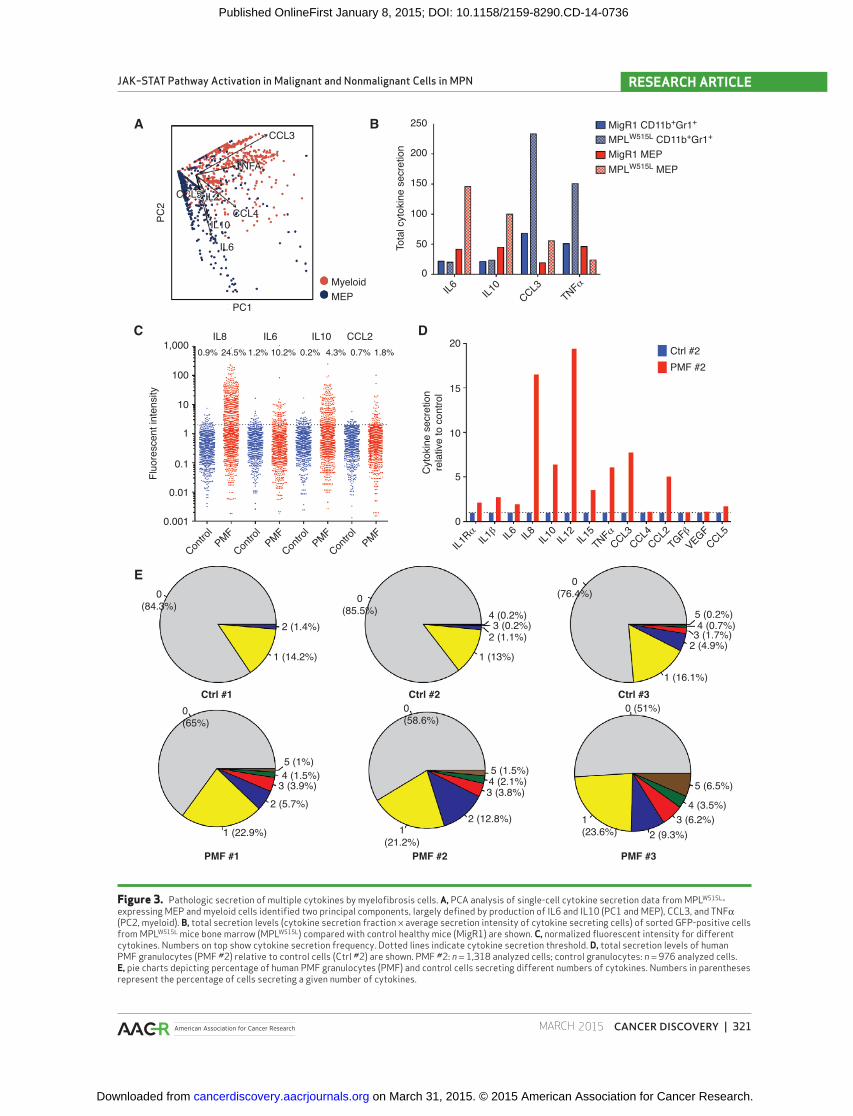
tinct cytokine secretion profi les ( Fig. 3A ). IL6 and IL10 were
mainly secreted by MEPs, and mature myeloid cells were the
main source of TNFα and CCL3 ( Fig. 3B and Supplementary
Fig. S3). These data indicate that different cell types have dis-
tinct cytokine secretion profi les and potentially distinct roles
in myelofi brosis pathogenesis.
Aberrant Single-Cell Cytokine Secretion in PMF Cells
We next performed single-cell profi ling of circulating
granulocytes from patients with myelofi brosis and healthy
individuals (Supplementary Table S1). The average secre-
tion level of different cytokines was signifi cantly elevated in
myelofi brosis cells, resulting from both an increase in the
fraction of cells secreting specifi c cytokines and the secretion
level of individual cytokines per cell ( Fig. 3C and D ). Six out
of eight cytokines (IL6, IL10, IL12, TNFα, CCL2, and CCL5),
which were aberrantly secreted in our murine myelofi brosis
model, were also secreted at a much higher level by PMF
patient cells. We observed that IL8 was most highly secreted
by myelofi brosis granulocytes; previous studies have shown
that increased serum IL8 levels are associated with adverse
outcome in myelofi brosis ( 12 ). Immunohistochemical analy-
sis confi rmed increased IL8 expression in myelofi brosis bone
marrow sections, whereas control bone marrow cells showed
only weak expression of IL8 (Supplementary Fig. S4). The
proportion of cells secreting at least one cytokine was signifi -
cantly increased in human myelofi brosis cells compared with
control cells (41.4% vs. 14.6%; P < 0.001; Fisher exact test;
Fig. 3E ), demonstrating similar patterns of cytokine secre-
tion in patients with myelofi brosis and murine models. Alto-
gether, our single-cell profi ling studies highlight the striking
heterogeneity and multifunctionality in cytokine secretion
profi le in myelofi brosis.
Deletion of Il6 from the Mouse System Shows Only Minor Effects on Mpl W515L -Driven Disease
Previous studies of cytokine signaling in cancer have largely
focused on IL6 as a mediator of infl ammation in leukemia
and other malignancies ( 19 ). Given that we found a signifi cant
increase in IL6 secretion in both MPN models and myelofi bro-
sis patient cells, we fi rst investigated the effects of Il6 deletion
on MPL W515L -induced myelofi brosis in vivo . We assessed the
specifi c role of IL6 in myelofi brosis in vivo by transplanting
IL6-defi cient myelofi brosis cells into IL6-defi cient recipients.
Il6 deletion led to a modest reduction in white blood cell
(WBC) count, but did not reduce spleen weight or the extent
of myeloproliferation in vivo (Supplementary Fig. S5A and
S5B). No signifi cant differences were observed in the propor-
tion of CD11b/Gr1 double-positive cells in the target organs
(Supplementary Fig. S5C and S5D). Consistent with these
data, we found that the serum levels of other proinfl ammatory
on March 31, 2015. © 2015 American Association for Cancer Research. cancerdiscovery.aacrjournals.org Downloaded from
Published OnlineFirst January 8, 2015; DOI: 10.1158/2159-8290.CD-14-0736

320 | CANCER DISCOVERY�MARCH 2015 www.aacrjournals.org
Kleppe et al.RESEARCH ARTICLE
A B
C
D
E F G
MPLW515L-mutant
diseased mouse
Single-cell
suspensionLoading into
single-cell capture
microarray chamber
Antibody barcode array chip
is superimposed onto single-cell
capture microarray chambers
Incubation for 24-h
cytokine capture
CC
L3
CC
L3
CC
L4
CC
L4
IL1
0
IL1
0
CC
L2
CC
L2
IL6
IL6
IL1
2
IL1
2
CC
L5
CC
L5
CX
CL
9
CX
CL
9
CX
CL
1
CX
CL
1
TN
Fα
TN
Fα
Cytokine secretion measurement of
single cells trapped in chambers
MigR1
Mutually exclusiveCCL3 CCL3CCL4
CXCL9CXCL9
IL12
IL12
IL6
CCL5
CCL5
CXCL1 CXCL1IL6
CCL2CCL2
IL10
IL10
PC
2
PC1 MigR1
MPLW515LCC
L2
CC
L2IL6
CX
CL1
CX
CL1
CC
L5
CC
L5
IL12
IL10
IL12
CX
CL9
CX
CL9
CC
L4
CC
L4
CC
L3
CC
L3
TN
Fα
TN
Fα
TNFα
No significant association
Co-occurrance
* **** **** ****** *** **** **** ***** * * *
*** **** **** ****** * **** ****
**** * **** ****
* *
***
**** ****
*
** *
**** *** ***** **** ***
**** **** ********
**** **** **
**** **** ***
* *
**
****
* ***
*** *******
**** ****
******** **
******** ****
******
*
****
**** ****
****
****
MPLW515L
0 15
MigR1
control mouse
Flu
ore
scent in
tensity
Ave
rage c
yto
kin
e s
ecre
tion
rela
tive
to c
ontr
ol
100,000 TNFα6.4% 32.7% 1.0% 7.8% 0.8% 12.4% 0.5% 8.2%
IL6 IL10 CCL2
10,000
1,000
100
10
MigR1
TNFα
IL6
IL10
IL12
CXC
L9
CXC
L1
CCL3
CCL4
CCL5
CCL2
25
15
10
5
0
MigR1
0 (53.4%)
1
(19.6%) 2 (20.6%)
3 (5.2%)4 (1.2%)
1
(23.7%)
2
(13.4%)3
(14.9%)
4 (8.5%)
5 (3.1%)
6+ (4.0%)
0 (32.4%)
MPLW515L
20
MPLW515L
1
Mig
R1
MPL
W51
5L
Mig
R1
MPL
W51
5L
Mig
R1
MPL
W51
5L
Mig
R1
MPW
515L
Figure 2. Bone marrow cells are potent cytokine producers. A, schematic display of single-cell cytokine secretion analysis workfl ow and hierarchical clustering of single-cell data from MPL W515L and MigR1 whole bone marrow. Log 2 -transformed values were used for cluster analysis. B, normalized fl uo-rescent intensity for different cytokines. Numbers on top show cytokine secretion frequency. Dotted lines indicate cytokine secretion threshold. *, P < 0.05. C, total secretion levels (cytokine secretion fraction x average secretion intensity of cytokine secreting cells) of MPL W515L mice bone marrow (MPL W515L ) relative to healthy control mice (MigR1) are shown. D, pie charts depicting proportion of MigR1 and MPL W515L bone marrow cells secreting different numbers of cytokines (0–10). E, mutual exclusivity analysis for myelofi brosis cells. FDR: + < 0.05, ++ < 0.01 +++ < 0.001 and ++++ < 0.0001. Red/white without pluses is FDR < 0.1. F, comparison between cosecretion patterns observed in myelofi brosis and control cells. Colors visualize FDR. G, PCA of MPL W515L and MigR1 cytokine secretion. MPL W515L : n = 2,254 cells; MigR1 cells: n = 608 cells.
on March 31, 2015. © 2015 American Association for Cancer Research. cancerdiscovery.aacrjournals.org Downloaded from
Published OnlineFirst January 8, 2015; DOI: 10.1158/2159-8290.CD-14-0736
MARCH 2015�CANCER DISCOVERY | 321
JAK–STAT Pathway Activation in Malignant and Nonmalignant Cells in MPN RESEARCH ARTICLE
Figure 3. Pathologic secretion of multiple cytokines by myelofi brosis cells. A, PCA analysis of single-cell cytokine secretion data from MPL W515L -expressing MEP and myeloid cells identifi ed two principal components, largely defi ned by production of IL6 and IL10 (PC1 and MEP), CCL3, and TNFα (PC2, myeloid). B, total secretion levels (cytokine secretion fraction × average secretion intensity of cytokine secreting cells) of sorted GFP-positive cells from MPL W515L mice bone marrow (MPL W515L ) compared with control healthy mice (MigR1) are shown. C, normalized fl uorescent intensity for different cytokines. Numbers on top show cytokine secretion frequency. Dotted lines indicate cytokine secretion threshold. D, total secretion levels of human PMF granulocytes (PMF #2) relative to control cells (Ctrl #2) are shown. PMF #2: n = 1,318 analyzed cells; control granulocytes: n = 976 analyzed cells. E, pie charts depicting percentage of human PMF granulocytes (PMF) and control cells secreting different numbers of cytokines. Numbers in parentheses represent the percentage of cells secreting a given number of cytokines.
A
C
E
D
B
PC2
PC1
IL8
Fluo
resc
ent i
nten
sity
Cyt
okin
e se
cret
ion
rela
tive
to c
ontro
l
1,000
100
20Ctrl #2PMF #2
15
10
5
0
10
1
0.1
0.01
0.001
0(84.3%)
0(85.5%) 4 (0.2%)
3 (0.2%)2 (1.1%)
1 (13%)
0(76.4%)
5 (0.2%)4 (0.7%)
3 (1.7%)2 (4.9%)
1 (16.1%)
2 (1.4%)
1 (14.2%)
0(65%)
5 (1%)4 (1.5%)
3 (3.9%)2 (5.7%)
1(21.2%)
0(58.6%)
0 (51%)
5 (1.5%)5 (6.5%)
4 (3.5%)3 (6.2%)
2 (9.3%)1(23.6%)
4 (2.1%)3 (3.8%)
2 (12.8%)1 (22.9%)
Ctrl #1
PMF #1 PMF #2 PMF #3
Ctrl #2 Ctrl #3
Contro
l
PMF
PMFCon
trol
Contro
lPMF
PMF
IL1Rα
TNFα
TGFβIL1β IL6 IL8 IL10
IL12
IL15
CCL3CCL4CCL2
VEGFCCL5
Contro
l0.9% 24.5% 1.2% 10.2% 0.2% 4.3% 0.7% 1.8%
IL6 IL10 CCL2
MyeloidMEP
CCL3
Tota
l cyt
okin
e se
cret
ion
250 MigR1 CD11b+Gr1+
MPLW515L CD11b+Gr1+
MigR1 MEPMPLW515L MEP
200
150
100
50
0IL6 IL1
0CCL3
TNFα
TNFA
L5L5CCL5 IL2CCL4
IL10
IL6
on March 31, 2015. © 2015 American Association for Cancer Research. cancerdiscovery.aacrjournals.org Downloaded from
Published OnlineFirst January 8, 2015; DOI: 10.1158/2159-8290.CD-14-0736
322 | CANCER DISCOVERY�MARCH 2015 www.aacrjournals.org
Kleppe et al.RESEARCH ARTICLE
cytokines remained elevated in IL6-defi cient myelofi brosis
mice, and we observed compensatory increases in IL4 and IL5
serum levels in the absence of IL6 production (Supplemen-
tary Fig. S5E and S5F). Although the specifi c role of other
cytokines in myelofi brosis requires further investigation, these
data suggest that infl ammatory signaling in MPN is driven by
multiple cytokines, and that inhibiting secretion or signaling
of an individual cytokine cannot attenuate the cytokine-
signaling loop contributing to MPN pathogenesis.
Deletion of Stat3 Reduces Cytokine Production and Ameliorates Myelofi brosis In Vivo
We next aimed to investigate whether there are specifi c
signaling pathways driving cytokine production in vivo in
myelofi brosis. First, to better characterize oncogenic sign-
aling pathways activated by JAK2/MPL alleles in vitro and
identify potential signaling effectors, we generated isogenic
cell lines expressing the most common JAK2 and MPL muta-
tions observed in patients with MPN. Notably, Ba/F3 cells
expressing MPL W515L or MPL W515L –JAK2 V617F showed evidence
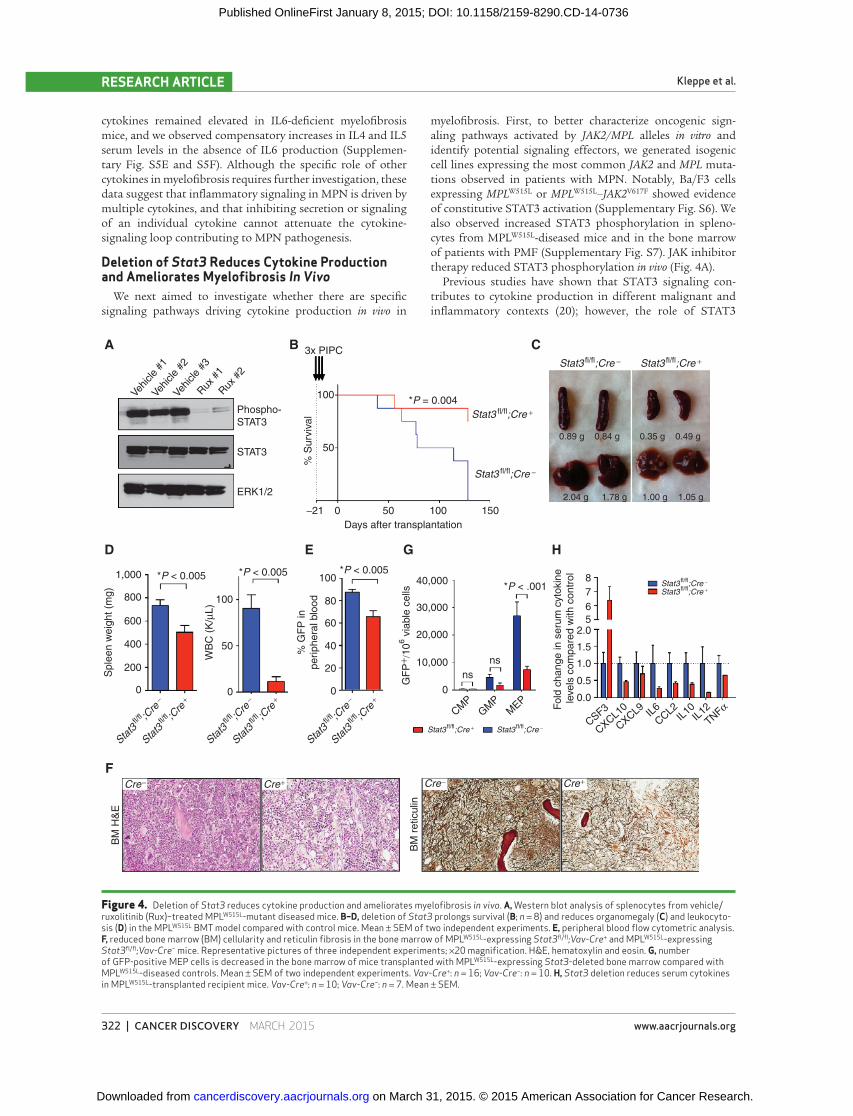
of constitutive STAT3 activation (Supplementary Fig. S6). We
also observed increased STAT3 phosphorylation in spleno-
cytes from MPL W515L -diseased mice and in the bone marrow
of patients with PMF (Supplementary Fig. S7). JAK inhibitor
therapy reduced STAT3 phosphorylation in vivo ( Fig. 4A ).
Previous studies have shown that STAT3 signaling con-
tributes to cytokine production in different malignant and
infl ammatory contexts ( 20 ); however, the role of STAT3
Figure 4. Deletion of Stat3 reduces cytokine production and ameliorates myelofi brosis in vivo . A, Western blot analysis of splenocytes from vehicle/ruxolitinib (Rux)–treated MPL W515L -mutant diseased mice. B–D, deletion of Stat3 prolongs survival (B; n = 8) and reduces organomegaly (C) and leukocyto-sis (D) in the MPL W515L BMT model compared with control mice. Mean ± SEM of two independent experiments. E, peripheral blood fl ow cytometric analysis. F, reduced bone marrow (BM) cellularity and reticulin fi brosis in the bone marrow of MPL W515L -expressing Stat3 fl /fl ;Vav-Cre + and MPL W515L -expressing Stat3 fl /fl ;Vav-Cre − mice. Representative pictures of three independent experiments; ×20 magnifi cation. H&E, hematoxylin and eosin. G, number of GFP-positive MEP cells is decreased in the bone marrow of mice transplanted with MPL W515L -expressing Stat3 -deleted bone marrow compared with MPL W515L -diseased controls. Mean ± SEM of two independent experiments. Vav-Cre + : n = 16; Vav-Cre − : n = 10. H, Stat3 deletion reduces serum cytokines in MPL W515L -transplanted recipient mice. Vav-Cre + : n = 10; Vav-Cre − : n = 7. Mean ± SEM.
A
D
F
E G H
B C
Vehi
cle
#1Ve
hicle
#2Ve
hicle
#3Rux
#1
Rux
#2
Phospho-
STAT3
3x PIPC
100
100
100
GF
P+ /
10
6 v
iable
ce
lls
Fold
ch
an
ge
in
se
rum
cyto
kin
e
leve
ls c
om
pa
red
with
co
ntr
ol
40,000 8
CSF3
CXC
L10
CXC
L9 IL6
CCL2
IL12
IL10
TNFα
7
6
52.0
1.5
1.0
0.5
0.0
30,000
20,000
10,000
0
ns
ns
CM
PG
MP
MEP
80
60
40
20
0
50
0
Sp
lee
n w
eig
ht
(mg
)
WB
C (
K/μ
L)
% G
FP
in
pe
rip
he
ral blo
od
1,000
800
600
400
200
BM
H&
E
BM
re
ticu
lin
0
Cre− Cre+ Cre− Cre+
Stat3 fl/fl;Cre −
Stat3
fl/fl ;C
re−
Stat3
fl/fl ;C
re+
Stat3
fl/fl ;C
re−
Stat3
fl/fl ;C
re+
Stat3
fl/fl ;C
re−
Stat3
fl/fl ;C
re+
Stat3 fl/fl;Cre +
Stat3 fl/fl;Cre −
Stat3 fl/fl;Cre −
Stat3 fl/fl;Cre +
Stat3 fl/fl;Cre +
*P = 0.004
*P < 0.005 *P < 0.005 *P < 0.005
*P < .001
50
Stat3 fl/fl;Cre +
Stat3 fl/fl;Cre −
% S
urv
iva
l
−21 0 50
Days after transplantation
100 150
0.89 g 0.35 g
1.00 g 1.05 g
0.49 g0.84 g
2.04 g 1.78 g
STAT3
ERK1/2
on March 31, 2015. © 2015 American Association for Cancer Research. cancerdiscovery.aacrjournals.org Downloaded from
Published OnlineFirst January 8, 2015; DOI: 10.1158/2159-8290.CD-14-0736
MARCH 2015�CANCER DISCOVERY | 323
JAK–STAT Pathway Activation in Malignant and Nonmalignant Cells in MPN RESEARCH ARTICLE
signaling in MPN infl ammatory signaling and pathogenesis
has not yet been elucidated. We thus performed MPL W515L
bone marrow transplantations using hematopoietic-specifi c
conditional Stat3 -knockout mice or respective littermate
controls as donors (Supplementary Fig. S8). Stat3 deletion
improved survival, reduced disease severity, and reduced
cytokine-mediated infl ammation, similar to the effects
observed with ruxolitinib therapy. Stat3 deletion resulted
in lower white blood counts, lower spleen weights, and a
reduced degree of reticulin fi brosis ( Fig. 4B–F and Sup-
plementary Fig. S6), and decreased the proportion of MEP
cells in spleen and bone marrow ( Fig. 4G ). Similar effects of
Stat3 deletion were seen with Mx-Cre and Vav-Cre , and with
somatic deletion of Stat3 after bone marrow transplantation
(Supplementary Fig. S9). Most importantly, hematopoietic
specifi c Stat3 deletion normalized circulating cytokine levels
( Fig. 4H ), with similar reductions in cytokine levels as with
ruxolitinib therapy. These data demonstrate that STAT3 acti-
vation is required for cytokine production in myelofi brosis,
and Stat3 deletion phenocopies the effects of ruxolitinib on
cytokine production and on disease sequelae in vivo.
Mutant-Specifi c Stat3 Deletion Does Not Reduce Infl ammatory Signaling or Myelofi brosis In Vivo
It is currently not known if JAK inhibitors achieve clini-
cal benefi t solely from target inhibition in MPN cells, or if
JAK–STAT inhibition in nonmalignant cells contributes to
therapeutic effi cacy. We therefore examined whether restrict-
ing Stat3 deletion to mutant hematopoietic cells would result
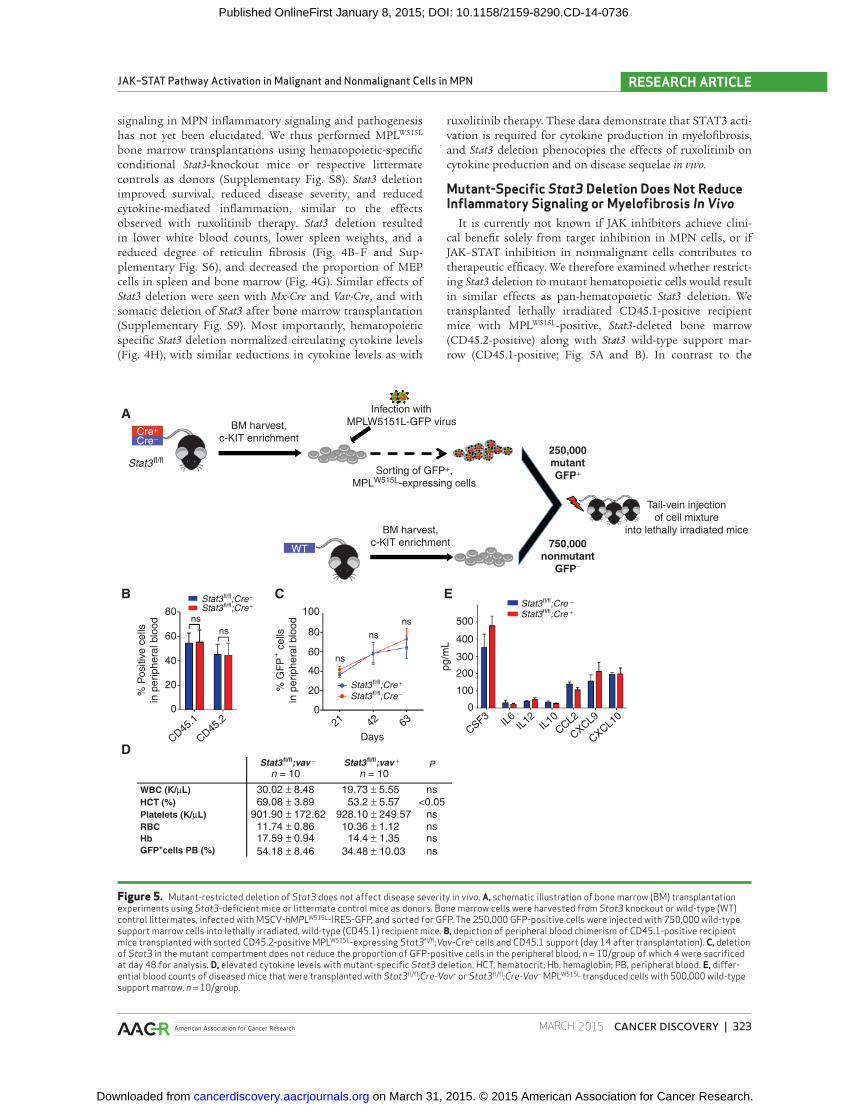
in similar effects as pan-hematopoietic Stat3 deletion. We
transplanted lethally irradiated CD45.1-positive recipient
mice with MPL W515L -positive, Stat3 -deleted bone marrow
(CD45.2-positive) along with Stat3 wild-type support mar-
row (CD45.1-positive; Fig. 5A and B ). In contrast to the
Figure 5. Mutant-restricted deletion of Stat3 does not affect disease severity in vivo . A, schematic illustration of bone marrow (BM) transplantation experiments using Stat3 -defi cient mice or littermate control mice as donors. Bone marrow cells were harvested from Stat3 knockout or wild-type (WT) control littermates, infected with MSCV- hMPL W515L -IRES-GFP, and sorted for GFP. The 250,000 GFP-positive cells were injected with 750,000 wild-type support marrow cells into lethally irradiated, wild-type (CD45.1) recipient mice. B, depiction of peripheral blood chimerism of CD45.1-positive recipient mice transplanted with sorted CD45.2-positive MPL W515L -expressing Stat3 fl /fl ;Vav-Cre ± cells and CD45.1 support (day 14 after transplantation). C, deletion of Stat3 in the mutant compartment does not reduce the proportion of GFP-positive cells in the peripheral blood; n = 10/group of which 4 were sacrifi ced at day 48 for analysis. D, elevated cytokine levels with mutant-specifi c Stat3 deletion. HCT, hematocrit; Hb, hemaglobin; PB, peripheral blood. E, differ-ential blood counts of diseased mice that were transplanted with Stat3 fl /fl ;Cre-Vav + or Stat3 fl /fl ;Cre-Vav − MPL W515L transduced cells with 500,000 wild-type support marrow. n = 10/group.
A
B
D
C E
BM harvest,
c-KIT enrichmentCre+Cre−
WT
Infection with
MPLW5151L-GFP virus
250,000
mutant
GFP+
750,000
nonmutant
GFP−
Tail-vein injection
of cell mixture
into lethally irradiated mice
Sorting of GFP+,
MPLW515L-expressing cells
BM harvest,
c-KIT enrichment
ns
ns
ns
ns
Days
30.02 ± 8.4869.08 ± 3.89
11.74 ± 0.8617.59 ± 0.94
54.18 ± 8.46
901.90 ± 172.62
19.73 ± 5.5553.2 ± 5.57
10.36 ± 1.1214.4 ± 1.35
34.48 ± 10.03
928.10 ± 249.57
ns<0.05
nsns
ns
ns
n = 10 n = 10
ns
% P
ositiv
e c
ells
in p
eri
ph
era
l blo
od
% G
FP
+ ce
lls
in p
eri
ph
era
l blo
od
80 100500
400
300
pg
/mL
200
100
0
80
60
40
20
0
60
40
20
0
CD45
.1
CD45
.2 21 42 63CSF3
IL6
IL12
IL10
CCL2
CXC
L9
CXC
L10
Stat3 fl/fl
Stat3 fl/fl;Cre+Stat3 fl/fl;Cre−
Stat3 fl/fl;vav − Stat3 fl/fl;vav + P
WBC (K/μL)
HCT (%)
Platelets (K/μL)
RBC
Hb
GFP+cells PB (%)
Stat3 fl/fl;Cre +Stat3 fl/fl;Cre −
Stat3 fl/fl;Cre +
Stat3 fl/fl;Cre −
on March 31, 2015. © 2015 American Association for Cancer Research. cancerdiscovery.aacrjournals.org Downloaded from
Published OnlineFirst January 8, 2015; DOI: 10.1158/2159-8290.CD-14-0736

324 | CANCER DISCOVERY�MARCH 2015 www.aacrjournals.org
Kleppe et al.RESEARCH ARTICLE
signifi cant effects seen with complete hematopoietic Stat3
deletion, MPN-specifi c Stat3 deletion did not reduce dis-
ease severity ( Fig. 5C and D and Supplementary Fig. S10).
Consistent with these data, MPN-specifi c Stat3 deletion did
not signifi cantly attenuate cytokine production, in contrast
to the effects observed with pan-hematopoietic Stat3 dele-
tion ( Fig. 5E ). These data are consistent with a requirement
for STAT3 signaling in both malignant and nonmalignant
hematopoietic cells in myelofi brosis.
Cytokine Production in Myelofi brosis Originates in Malignant and Nonmalignant Hematopoietic Cells
The genetic studies described above suggested that aber-
rant cytokine production in myelofi brosis emanates from
malignant and nonmalignant hematopoietic cells. We there-
fore analyzed cytokine mRNA expression in sorted MPL W515L -
mutant (GFP-positive) and wild-type (GFP-negative) bone
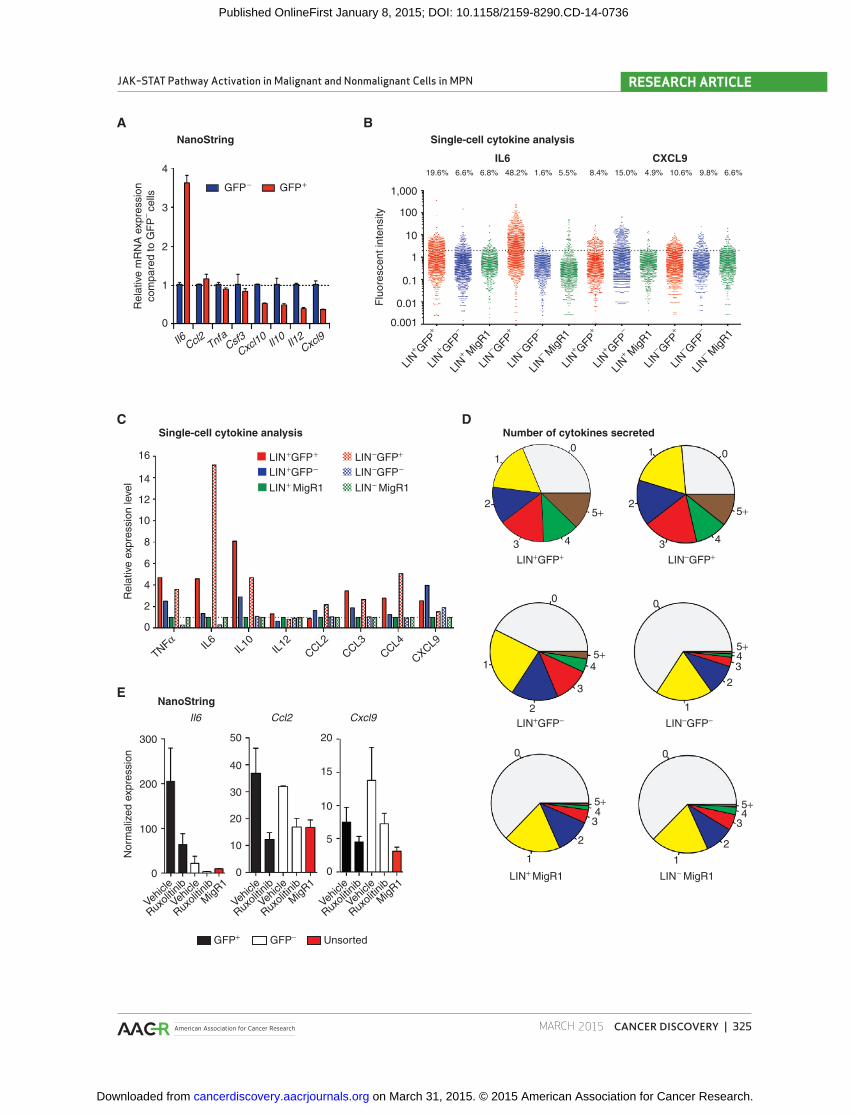
marrow cells using NanoString technology. We found that
MPL W515L -mutant myelofi brosis cells express high mRNA
levels of a subset of infl ammatory cytokines, including
Il6 , consistent with tumor-derived cytokine production
( Fig. 6A ). In contrast, we found that some cytokines, includ-
ing Ccl2 and Tnfa , were derived from both GFP-positive and
GFP-negative populations, and other cytokines, including
Il12 and Cxcl9 , were largely derived from nonmutant cells
( Fig. 6A ).
We then performed single-cell analysis of sorted mutant
and wild-type subpopulations to further delineate the contri-
bution of malignant and nonmalignant cells to cytokine pro-
duction. Single-cell analysis of lineage-positive (mature) and
lineage-negative [hematopoeitic stem/progenitor (HSPC)]
cells revealed that GFP-positive and GFP-negative cells
from mature and HSPC compartments aberrantly secrete
cytokines in myelofi brosis ( Fig. 6B and C ). We observed an
increase in cytokine secretion and in the degree of single-cell
cytokine secretion heterogeneity in both GFP-positive and
GFP-negative cells from stem/progenitor and differentiated
cells compared with control bone marrow cells (Supple-
mentary Fig. S11). MPL W515L -mutant HSPCs were the largest
source of IL6, whereas nonmutant mature cells were the
primary source of CXCL9 ( Fig. 6B ). Mutant and wild-type
cells both secreted TNFα, IL10, and CCL2 consistent with
production by multiple populations ( Fig. 6C ). We observed
an increase in total cytokine production and an increase in
the proportion of cells which secreted multiple cytokines in
GFP-positive/negative mature and GFP-positive HSPC from
myelofi brosis mice ( Fig. 6D and Supplementary Figs. S11 and
S12). Importantly, ruxolitinib treatment normalized cytokine
expression from GFP-positive and GFP-negative cell popula-
tions ( Fig. 6E ), demonstrating that JAK inhibition reduces
cytokine production from both tumor and nontumor popu-
lations in vivo .
We next sought to extend our fi ndings to JAK2 V617F -
mutant MPN. We transplanted whole bone marrow of
Jak2 V617F ;Vav-Cre knockin mice (CD45.2) with CD45.1 wild-
type support marrow into CD45.1-recipient mice (MPN
mice). After all mice were engrafted with JAK2 V617F -positive
disease, we performed single-cell cytokine analysis on sorted
CD45.2 and CD45.1 cells to elucidate cytokine secretion
in mutant and nonmutant cells ( Fig. 7A ). As a control, we
transplanted wild-type CD45.2 bone marrow with CD45.1
support cells into CD45.1-recipient mice (control mice).
Single-cell cytokine profi ling revealed marked differences
in cytokine secretion in bone marrow cells derived from
MPN and control mice (Supplementary Fig. S13). Most
importantly, this included aberrant cytokine production in
CD45.2-mutant and CD45.1-nonmutant cells from MPN
mice. We observed an increase in the fraction of cytokine-
secreting cells and in the extent of cytokine secretion per
single cell in mutant and nonmutant hematopoietic popu-
lations from Jak2 -mutant MPN mice ( Fig. 7B and C and
Supplementary Fig. S14). The proportion of cells secreting
at least one cytokine was signifi cantly higher within the
wild-type population (CD45.1) of myelofi brosis mice com-
pared with the CD45.1 population of control mice (47.1%
vs. 27%; P < 0.001; Fisher exact test; Fig. 7D ). Similarly, 65%
of CD45.2-positive JAK2 V617F -expressing cells from myelofi -
brosis mice secreted at least one cytokine compared with
only 28.5% of control CD45.2 cells ( P < 0.001; Fisher exact
test). Furthermore, Jak2 V617F -negative CD45.1-positive and
Jak2 V617F -positive CD45.2-positive bone marrow cells from
myelofi brosis exhibited a marked increase in the proportion
of multifunctional cells that cosecrete multiple cytokines
( Fig. 7D ). Quantifi cation of the extent of heterogeneity
using the Simpson diversity index showed that nonmu-
tant CD45.1-positive and Jak2 V617F -positive, CD45.2-positive
cells of diseased mice featured a signifi cant increase in the
heterogeneity of single-cell secretion (CD45.1: 0.64 vs. 0.43,
CD45.2: 0.74 vs. 0.44). Consistent with these data and with
our data in the MPL W515L model, ruxolitinib treatment
normalized cytokine expression from CD45.1-negative and
CD45.2-positive cell populations in the Jak2 V617F knockin
transplantation model (Supplementary Fig. S15). We next
sought to investigate whether mutant and nonmutant cells
in PMF could contribute to aberrant cytokine secretion.
We identifi ed a patient with PMF with a JAK2 V617F -mutant
allele burden of 38%, consistent with partial involvement
of the hematopoietic compartment of JAK2 V617F -mutant
Figure 6. Proinfl ammatory cytokines are derived from malignant and nonmalignant hematopoietic cells. A, NanoString mRNA cytokine expression lev-els in GFP-positive (GFP + ) and GFP-negative (GFP − ) cells. Normalized expression values calculated as relative change compared with GFP-negative cells. Results of one of two replicate experiments are displayed. B, single-cell cytokine analysis of sorted populations showing fl uorescent intensity. MigR1-expressing bone marrow was used as control. Percentages of cytokine-secreting cells are shown above. Dashed line indicates normalized cytokine secre-tion threshold. C, cytokine expression of sorted GFP-positive/GFP-negative lineage-positive (LIN + ) and lineage-negative (LIN − ) cells of MPL W515L -diseased mice relative to MigR1 control bone marrow. D, pie charts depicting percentage of sorted GFP-negative/positive lineage-positive/negative myelofi brosis cells and MigR1 control cells secreting different numbers of cytokines. Numbers in brackets represent the percentage of cells secreting a given number of cytokines. E, NanoString expression data (mean ± SEM) for lineage-positive GFP-positive and GFP-negative cells from vehicle/ruxolitinib-treated MPL W515L -diseased mice. Data from MigR1 transplanted mice are shown as control. n = 3/group.
on March 31, 2015. © 2015 American Association for Cancer Research. cancerdiscovery.aacrjournals.org Downloaded from
Published OnlineFirst January 8, 2015; DOI: 10.1158/2159-8290.CD-14-0736
MARCH 2015�CANCER DISCOVERY | 325
JAK–STAT Pathway Activation in Malignant and Nonmalignant Cells in MPN RESEARCH ARTICLE
A
C
E
D
B
NanoString
Single-cell cytokine analysis
NanoString
Single-cell cytokine analysis
GFP−
Rela
tive
expre
ssio
n leve
l
16 1
2
3
0
00
0 0
5+
5+
5+4
3
2
1
5+4
3
1
2
5+
4
443
2
1
3
2
1
Number of cytokines secreted
LIN+GFP+
LIN+GFP−
LIN+ MigR1
LIN−GFP+
LIN+GFP+
1
2
3
0
5+
4
LIN−GFP+
LIN+GFP− LIN−GFP−
LIN+ MigR1 LIN− MigR1
LIN−GFP−
LIN− MigR114
12
10
8
6
4
2
0
300 50 20
15
10
5
0
40
30
20
10
0
Il6 Ccl2 Cxcl9
200
Norm
aliz
ed e
xpre
ssio
n
100
0
Vehicle
Vehicle
Rux
olitini
b
Rux
olitini
b
Mig
R1
Vehicle
Vehicle
Rux
olitini
b
Rux
olitini
b
Mig
R1
Vehicle
Vehicle
Rux
olitini
b
Rux
olitini
b
Mig
R1
TNFα
IL6
IL10
IL12
CCL2
CCL3
CCL4
CXC
L9
Rela
tive
mR
NA
expre
ssio
n
com
pare
d to G
FP
− cells
4
3
2
1
0
Il6 Ccl2 Csf3
Cxcl10
Il10
Il12Cxc
l9Tnfa
GFP+
Flu
ore
scent in
tensity
1,000
19.6% 6.6% 6.8% 48.2% 1.6% 5.5% 8.4% 15.0% 4.9% 10.6% 9.8% 6.6%
100
10
1
0.1
0.01
0.001
LIN
+ GFP
+LI
N+ GFP
−LI
N+ M
igR1
LIN
− GFP
+LI
N− GFP
−
LIN
+ GFP
−
LIN
+ GFP
+
LIN
− GFP
+LI
N− GFP
−LI
N− M
igR1
LIN
− Mig
R1
LIN
+ Mig
R1
IL6 CXCL9
GFP+ GFP− Unsorted
on March 31, 2015. © 2015 American Association for Cancer Research. cancerdiscovery.aacrjournals.org Downloaded from
Published OnlineFirst January 8, 2015; DOI: 10.1158/2159-8290.CD-14-0736

326 | CANCER DISCOVERY�MARCH 2015 www.aacrjournals.org
Kleppe et al.RESEARCH ARTICLE
Figure 7. Aberrant cytokine production in CD45.2-mutant and CD45.1-nonmutant cells from JAK2 V617F -diseased mice. A, schematic illustration of bone marrow transplantation experiments using Jak2 V617F ;Vav-Cre knockin mice (CD45.2) as donors. B, single-cell analysis of sorted mutant (CD45.2) and nonmutant (CD45.1) populations from Jak2 V617F -mutant diseased mice (J2VF) and transplanted healthy controls (Ctrl). Percentages of cytokine secreting cells are shown above. C, cytokine expression levels of sorted CD45.1-positive and CD45.1-negative myelofi brosis and Vav - Cre –negative control cells relative to CD45.1 control cells. D, pie charts displaying the percentage of sorted mutant (CD45.2) and nonmutant (CD45.1) secreting different numbers of cytokines (0, 1, 2, 3, 4, 5+). E, cytokine secretion data showing that 59.3% of human PMF cells (patient PMF#11, allele burden: 38%) secrete at least one cytokine. F, pie charts depicting the percentage of human PMF cells and control cells secreting different numbers of cytokines (0, 1, 2, 3, 4+).
A
C
F
EB
D Number of cytokines secreted
Ctrl CD45.1
J2VF CD45.1 J2VF CD45.2
11
2 23 34 4
0
00
4 43
3
2
2
1
1
0
5+
5+ 5+
5+
Ctrl CD45.2
TNFα CCL4
3.7% 3.4%11.7% 21.1% 4.6% 4.6%14.1% 23%
Single-cell cytokine analysis
Flu
ore
scent
inte
nsity
1,000
100
10
1
0.1
0.01
0.001
Ctrl
CD45
.1
Ctrl
CD45
.2
J2VF C
D45
.1
J2VF C
D45
.2
J2VF C
D45
.1
J2VF C
D45
.2
Ctrl
CD45
.1
Ctrl
CD45
.2 Number of cytokines secreted
Control
0 1 2 3 4+
PMF#11
Allele burden: 38%
10059.3%
≥1 cytokines0 cytokines
50
Cell
fraction (
%)
0
Con
trol
PMF#1
1
Rela
tive
expre
ssio
n leve
l
10
9
8
7
6
5
4
3
2
1
TNFαIL
6IL
10IL
12
CXCL1
CXCL9
CCL2
CCL3
CCL4
CCL5IL
1B
CSF20
Ctrl CD45.1 J2VF CD45.1
J2VF CD45.2Ctrl CD45.2
Cre+ Donor mice
WT
(CD45.1)
60% 40%
Transplantation into CD45.1 mice
Sorted based on congenic marker
Single-cell cytokine profiling and NanoString
CD45.1
WT cells WT/mutant cells
CD45.2
WT recipient mice
(CD45.1)
Jak2vf/wt(CD45.2)
Cre−
on March 31, 2015. © 2015 American Association for Cancer Research. cancerdiscovery.aacrjournals.org Downloaded from
Published OnlineFirst January 8, 2015; DOI: 10.1158/2159-8290.CD-14-0736
MARCH 2015�CANCER DISCOVERY | 327
JAK–STAT Pathway Activation in Malignant and Nonmalignant Cells in MPN RESEARCH ARTICLE
cells (Supplementary Table S2). Notably, in this patient we
found that 59% of the hematopoietic cells secreted one or
more cytokines from our measurement ( Fig. 7E ). Moreover,
the frequency of multifunctional cells secreting two or more
cytokines was signifi cantly elevated in the patient ( Fig. 7F ).
The proportion of cytokine-secreting cells was greater than
expected on the basis of JAK2 V617F -mutant allele burden, sug-
gesting that in this patient, a subset of JAK2 V617F wild-type
has to contribute to cytokine production. Taken together,
these data illustrate the heterogeneity of aberrant cytokine
secretion in MPN models and patients, and that aberrant
infl ammatory signaling from more than one population
contributes to MPN pathogenesis and therapeutic response.
DISCUSSION Although MPNs present as chronic myeloid malignan-
cies, the quality of life and overall survival of patients with
PMF is more similar to advanced malignancies, includ-
ing metastatic epithelial tumors. Patients with PMF have
markedly elevated levels of proinflammatory cytokines,
which are thought to contribute to PMF-associated symp-
toms and sequelae ( 12, 13 ). Clinical data show that JAK
inhibition reduces constitutional symptoms and spleno-
megaly in patients with PMF and post–PV/ET myelofibro-
sis, concurrent with a reduction in circulating cytokine
levels ( 13 ). Although the prognostic value of circulat-
ing cytokine levels in myelofibrosis has been previously
demonstrated ( 12 ), the mechanisms that govern aberrant
cytokine production in myelofibrosis and the source of
aberrant cytokines in myelofibrosis have not previously
been demonstrated. Here, we show that JAK–STAT acti-
vation in malignant and nonmalignant cells contributes
to myelofibrosis pathogenesis, and that cytokine pro-
duction by both populations is an important feature of
myelofibrosis.
In this study, we demonstrate that JAK1/2 inhibition
leads to a rapid, potent reduction in serum cytokine levels,
consistent with the rapid clinical benefits seen with JAK
inhibitor therapy, and demonstrate that this is a direct
effect of JAK kinase inhibition on cytokine production.
Single-cell cytokine analysis showed that hematopoietic
cells from myelofibrosis models and patients with PMF
aberrantly secrete a spectrum of inflammatory cytokines.
We performed multiplex, highly sensitive measurements
of cytokine secretion from over a thousand captured, via-
ble single cells. The results demonstrated that hematopoi-
etic cells in myelofibrosis show significant upregulation
of a spectrum of proinflammatory cytokines, elevation of
cellular heterogeneity in cytokine secretion, and increased
multifunctional cytokine production, which are not
observed in normal hematopoietic cells. Our data on a
specific lineage, myeloid, demonstrated that both mature
and progenitor myeloid cells contribute to increased
cytokine production, and more interestingly that they
show distinct cytokine profiles, suggesting their different
roles in myelofibrosis pathogenesis. Future studies will
delineate the role of additional cytokines in inflammatory
signaling in MPN, and use single-cell profiling to analyze
nonhematopoietic cell types and previously unexplored
hematopoietic lineages, such as lymphoid cells and puri-
fied stem cells, in MPN models/patient samples and in
other malignancies to determine whether multifunctional
cytokine secretion is observed in other malignant con-
texts.
Many studies have identifi ed JAK2 mutations in patients
with MPN and in other malignancies, and several known
JAK2 signaling mediators have been linked to MPN disease
manifestation and progression ( 21–23 ); however, the role of
STAT3 signaling in MPN pathogenesis and in infl ammatory
signaling in myeloid malignancies has not been previously
delineated. STAT3 represents a key link between cancer and
infl ammation, and as such provides an ideal candidate sig-
naling effector driving cytokine production in vivo . In this
study, we demonstrate a critical role for STAT3 in infl am-
matory cytokine production in myelofi brosis. Pan-hemato-
poietic Stat3 deletion improved survival, reduced disease
severity, and reduced cytokine secretion, with similar effi cacy
as observed with ruxolitinib therapy. In contrast, restricting
loss of Stat3 to the malignant clone did not reduce disease
severity or cytokine production, demonstrating that STAT3
signaling must be inhibited in malignant and nonmalig-
nant cells to achieve clinical effi cacy. Consistent with these
fi ndings, we discovered that malignant and nonmalignant
cells aberrantly secrete infl ammatory cytokines and that JAK
inhibition reduces cytokine production from both popula-
tions. Our results demonstrate that JAK–STAT3-mediated
cytokine production from malignant and nonmalignant
cells contributes to MPN pathogenesis and that JAK inhibi-
tion in both populations is required for therapeutic effi cacy.
These data reveal an important, unexpected mechanism of
action of JAK inhibition in MPN, such that the target must
be inhibited in tumor and nontumor cells to achieve clinical
benefi t.
Recent studies in MPN models and in other hematologic
malignancies have shown that additional, nonhematopoi-
etic populations can infl uence malignant transformation,
including nestin-positive stromal cells, osteoblasts, and
other cell types in the hematopoietic niche ( 24–26 ). The role
of cytokine secretion from these additional populations,
particularly at single-cell resolution, has not been explored
to date. We believe that single-cell cytokine profi ling can be
used to elucidate the specifi c role of different niche popula-
tions in normal and malignant hematopoiesis and to assess
the impact of JAK inhibitor therapy on the nonhematopoi-
etic microenvironment in model systems and in primary
patient samples, which should be the subject of subsequent
investigations into cytokine secretion in different malignant
states.
Taken together, our data underscore the critical role of
aberrant cytokine signaling mediated by STAT3 activation
in MPN pathogenesis. Most importantly, our studies sup-
port the notion that JAK kinase inhibition in malignant and
nonmalignant cells is required to achieve clinical effi cacy in
myelofi brosis. Recent data have suggested that ruxolitinib
improves overall survival in patients with pancreatic cancer
with evidence of systemic infl ammation. As such, inhibition
of cytokine signaling in malignant and nonmalignant cells
might offer clinical benefi t in other malignancies character-
ized by aberrant infl ammatory signaling. We hypothesize that
on March 31, 2015. © 2015 American Association for Cancer Research. cancerdiscovery.aacrjournals.org Downloaded from
Published OnlineFirst January 8, 2015; DOI: 10.1158/2159-8290.CD-14-0736

328 | CANCER DISCOVERY�MARCH 2015 www.aacrjournals.org
Kleppe et al.RESEARCH ARTICLE
JAK inhibition may have a broader role in cancer therapy, and
that this therapeutic approach may improve outcomes for
patients with malignancies characterized by systemic infl am-
mation.
METHODS Patient Material
Patient studies were conducted in accordance with the Declaration
of Helsinki. Primary patient samples were collected from patients
with myelofi brosis and control healthy donors under Memorial
Sloan Kettering Cancer Center (MSKCC; New York, NY) Institu-
tional Review Board Protocol 09-141. Ficoll technique was applied
to isolate granulocytes from the peripheral blood of patients with
myelofi brosis and healthy control individuals. JAK2 allele burden for
patients with myelofi brosis was calculated using targeted sequencing
approaches (RainDance, MiSeq).
Reagents and Transgenic Mice Ruxolitinib was provided by Incyte/Novartis and formulated
for administration by oral gavage as previously described ( 27 ).
Conditional Stat3 knockout, Jak2 V617F knockin, and germline Il6
knockout mice have been described previously ( 15 , 28 ). Floxed
mice were crossed to the interferon-responsive Mx-Cre and Vav-
Cre deleter lines. Congenic mice (CD45.1) used as recipients in
transplant studies were purchased from The Jackson Labora-
tory. Antibodies used for Western blotting included phosphor-
ylated and total JAK2, STAT3, STAT5, and MAPK (Cell Signaling
Technology). Mutant (GFP-positive) and wild-type (GFP-negative)
populations were separated by FACS using GFP and/or spe-
cific cell-surface marker: phycoerythrin (PE)-conjugated CD11b,
allophycocyanin (APC)-conjugated Gr1, TER119 (APC-CY7), CD71
(PE-CY7), PE-conjugated CD117, Pacifi c Blue (PacBlue)–conjugated
CD16/CD32, phycoerythrin-Cy7 (PeCy7)–conjugated Sca-1, and
APC-conjugated CD34. All plasmids used in this study have been
previously described ( 29 ). Lineage-positive (LIN + ) and lineage-
negative (LIN − ) subpopulations were separated using a panel
of APC-CY7–conjugated antibodies that recognize all mature
hemato poietic lineages (CD4, CD19, CD11b, Gr1, TER119, CD3,
B220, and NK1.1).
Bone Marrow Transplantation Model All animal experiments were performed in accordance with
our MSKCC Institutional Animal Care and Use Committee–
approved animal protocol. Animal care was in strict compliance
with institutional guidelines established by the MSKCC, the
Guide for the Care and Use of Laboratory Animals (National
Academy of Sciences, 1996), and the Association for Assess-
ment and Accreditation of Laboratory Animal Care Interna-
tional. MPL W515L bone marrow transplantation experiments were
performed as described previously ( 14 ). Briefly, prestimulated
c-KIT enriched bone marrow cells were subjected to two rounds
of cosedimentation with viral supernatant containing MSCV-
hMpl W515L -IRES-GFP or empty MSCV-IRES-GFP control vector.
A total of 1 × 10 6 cells (∼25%–40% GFP-positive, MPL-expressing
cells) were injected into the tail veins of lethally irradiated
syngeneic mice. For secondary Jak2 V617F ; Vav-Cre bone marrow
transplantations, 5 × 10 6 bone marrow cells harvested from sick
Jak2 V617F knockin mice were injected into the tail veins of 8-week-
old syngeneic mice ( 15 ). Engrafted mice were monitored daily for
signs of illness, and nonlethal bleeds were performed biweekly
to follow up disease progression. Mice showing signs of being
moribund, having more than 10% weight loss, or having palpa-
ble splenomegaly extending across the midline were sacrificed.
Spleens were removed and weighed, and single-cell suspensions
were prepared for subsequent cell staining and fractionation,
Western blot analysis, or histopathologic analysis. Peripheral
blood chimerism was routinely determined 14 days after bone
marrow transplantation. Stat3 excision was confirmed by West-
ern blot analysis and quantitative real-time PCR analysis on red
cell lysed peripheral blood samples.
Inhibitor Experiments At fi rst signs of disease, mice were randomized to begin 14
or 21 days of treatment with the JAK1/2 inhibitor ruxolitinib
[90 mg/kg (Balb/c, Mpl W515L ) or 60 mg/kg (C57/BL6, secondary
Jak2 V617F recipient mice), p . o ., twice a day] or vehicle followed by
measurement of plasma cytokine levels. Mice were ranked on the
basis of baseline WBC count and assigned to treatment groups to
achieve congruent WBC profi les. Serum was collected 4 hours after
last drug administration. For kinetic studies, mice assigned for
short-term drug treatment received only three doses, which were
administered simultaneously with the last doses of the long-term
treatment arm.
Luminex Technology Luminex assays were carried out using the FlexMAP 3D multiplex-
ing platform (Luminex xMAP system). Plasma levels of 32 cytokines
were measured simultaneously using the Millipore Mouse Cytokine
32-plex kit. Serum samples were prepared following manufacturer’s
instructions. xPONENT (Luminex) and Milliplex Analyst Software
(Millipore) was applied to convert mean fl uorescent intensity val-
ues into molecular concentrations by the use of a standard curve
(5-parameter logistic fi tting method).
Histopathologic Analysis Femur and spleen samples were fixed in 4% paraformaldehyde
overnight and then embedded in paraffin as previously described
( 30 ). Paraffin sections were cut on a rotary microtome (3-μm;
Mikrom International AG), spread in a 45°C water bath, mounted
on microscope slides (Thermo Scientific), and air-dried in an
oven at 37°C overnight. After drying, tissue section slides were
pro cessed either automatically for hematoxylin and eosin (H&E)
staining (COT20 stainer, Medite) or manually for reticulum stain-
ing with silver impregnation method kit (Bio-Optica). Slides
were scanned with Scanscope XT slide scanner (Aperio). Pictures
were taken at a 20× (H&E and reticulin) magnification by using
Imascope viewer (Aperio). For the expression analysis of IL8 and
phospho-STAT3, 5-μm unstained sections from cases of bone
marrow samples were stained on the Ventana Discovery XT per the
manufacturer’s instructions. The following antibodies were used:
goat anti-IL8 antibody from R&D Systems (1:40 dilution), mono-
clonal rabbit anti–phospho-STAT3 antibody from Cell Signaling
Technology (1:50 dilution). Photomicrographs were taken using
an Olympus BX41 with DP20 software.
Single-Cell Cytokine Secretion Assay A high-density antibody barcode was created using a microchan-
nel-guided fl ow patterning technique as previously described ( 16,
17 ). A polydimethylsiloxane microchip with 20 microfl uidic chan-
nels for fl ow patterning was fabricated using a soft lithography
technique. After the microchip was bonded with a poly- L -lysine
glass slide, the capture antibody for each cytokine was injected into
a microfl uidic channel and fl owed through the chip via air pressure
(1.8 psi, 12 hours). Antibodies were then immobilized on the glass
slide to form the antibody barcode. The subnanoliter microcham-
ber array for single-cell capture is a one-layer polydimethylsiloxane
slab fabricated using a soft-lithography method and contains 7,700
on March 31, 2015. © 2015 American Association for Cancer Research. cancerdiscovery.aacrjournals.org Downloaded from
Published OnlineFirst January 8, 2015; DOI: 10.1158/2159-8290.CD-14-0736

MARCH 2015�CANCER DISCOVERY | 329
JAK–STAT Pathway Activation in Malignant and Nonmalignant Cells in MPN RESEARCH ARTICLE
microchambers ( 16 , 31 ). A single-cell suspension of bone marrow
cells was prepared in RPMI-1640 supplemented with 20% FBS, IL3,
SCF, and IL6 at a density of 4 × 10 5 cells/mL. After blocking with
3% BSA/PBS (2 hours), 200 μL of the single-cell suspension was
pipetted onto the chip and allowed to settle (5 minutes). Normally
approximately 25% of the microchambers contained single cells
based on the Poisson distribution ( 16 ). The antibody barcode glass
slide was then put on top of the microchambers. Assembled micro-
chamber arrays were then imaged (Nikon Eclipse Ti) to determine
the number of cells in each microchamber by using a custom-made
image-processing algorithm. After incubation (24 hours, 37°C in
5% CO 2 ), the cytokine signals from antibody barcode chips were
developed via an immuno-sandwich ELISA assay. The slide was
scanned with GenePix 4200A (Axon) microarray scanner to collect
fl uorescent signals. All fl uorescent scanned images were processed
with GenePix software and Excel macro to acquire average fl uores-
cent signals from each microchamber for all bars in each antibody
barcode set, and the fl uorescent signals were matched with the
number of cells. Single-cell data were gated on the basis of the
background signals to distinguish between cytokine producers and
nonproducers. The data were further transformed and normalized
to perform multidimensional data analysis as previously described
( 17 , 32–34 ).
Data Processing and Analysis of Single-Cell Cytokine Assays
For all single-cell secretomic analysis, our custom-built algorithms
in Excel, MATLAB, and R-packages were used to process, analyze,
and visualize the single-cell cytokine profi les. Briefl y, the prede-
termined cell numbers of the microchambers were matched with
fl uorescence intensity values for each measured protein from corre-
sponding microchambers. The background signals from all zero-cell
(empty) microchambers were used to determine the gate to detect
cytokine-producing cells and nonproducers. The gating threshold
was calculated by (average intensity of all empty microchambers for
a given cytokine) + 2 × (standard deviation of all empty microcham-
bers for a given cytokine) ( 34 ). Any cells with fl uorescence intensity
of a specifi c cytokine below the gating threshold were considered
nonproducers, and their cytokine intensity values were converted to
0. Any cells with fl uorescence intensity above the gating threshold
were considered cytokine-producers and given the cytokine intensity
value of (the measured fl uorescence intensity − the average fl uores-
cence intensity of all zero-cell microchambers for a given cytokine).
The gated and background-subtracted cytokine intensity values were
log-transformed. To eliminate variability in detection sensitivity and
profi le the secretion of all assayed proteins, each protein was normal-
ized by the average intensity and the standard deviation. The number
of all cells above the gates and the sum of fl uorescence intensity of a
given cytokine were measured to calculate the frequency of cytokine
producers and the average cytokine secretion per single cell. For the
single-cell analysis of unsorted, whole bone marrow compartment,
the data were processed without log transformation. By not con-
ducting log transformation, which signifi cantly suppresses the data
range, we could distinguish smaller subsets with unique cytokine
profi les from the more heterogeneous and larger unsorted bone mar-
row cell population. Our statistical analysis and graphical representa-
tions of the single-cell secretomic profi les are based on the methods
routinely used to analyze large-scale high-dimensional datasets from
numerous cell subsets ( 17 , 32–34 ).
Principal Component, Mutual Exclusivity, and Statistical Analysis
All analyses were performed in R. The PCA was performed using
the prcomp R function and visualized with the ggplot2 package.
The fi rst two principal components explained 60.1% of the variance.
PC3 and PC4 (cumulative proportion of variance 78%) were, similar
to PC1 and PC2, mainly defi ned by secretion of TNFα, CCL3, CCL4,
CXCL1, and CCL5 (Supplementary Fig. S1A). Because PC3 to PC4
covered essentially the same cytokines as PC1 and PC2, we focused
on the visualization of the fi rst two PCs. PC5 (83%) was dominated
by IL10 secretion. We next tested whether two cytokines were less
(mutual exclusivity) or more frequently cosecreted than expected
by chance. To this end, we created for each pair of cytokines a 2 ×
2 contingency table (secreted only in cytokine A; only in B; in both
A and B; in neither A nor B) and obtained a P value with the Fisher
exact test. P values were adjusted for multiple testing using the Ben-
jamini–Hochberg correction and a false discovery rate (FDR) < 0.05
was considered signifi cant. FDRs were visualized in a heat map, with
pairs of cytokines displaying signifi cant cosecretion colored in red,
and mutually exclusive pairs in light yellow. Pairs with cosecretion
patterns not signifi cantly different from randomly expected patterns
were shown in gray. We further tested whether pairs of cytokines are
more or less frequently cosecreted in myelofi brosis mice compared
with control mice. We again used a Fisher exact test to obtain P
values for the corresponding 2 × 2 contingency table (number of
cosecreted cells in myelofi brosis, number of non-cosecreted cells in
myelofi brosis, number of cosecreted cells in control mice, number
of non-cosecreted cells in control mice). Only cells with at least two
secreted cytokines were considered in this mutual exclusivity analysis.
Statistical Analysis The Student t test was used to compare the mean of two groups.
Normality tests were used to test the assumption of a normal distri-
bution. Graphs represent mean values ± SEM. Kaplan–Meier survival
analysis and the log-rank test were used to compare survival out-
comes between the two groups.
Disclosure of Potential Confl icts of Interest M. Riester is a full-time employee of Novartis. J. Bromberg
reports receiving a commercial research grant from AstraZeneca. M.
Murakami is an investigator at Novartis and has ownership inter-
est (including patents) in the same. R. Fan has ownership interest
(including patents) in IsoPlexis. R.L. Levine reports receiving a com-
mercial research grant from Incyte. No potential confl icts of interest
were disclosed by the other authors .
Authors’ Contributions Conception and design: M. Kleppe, R.L. Levine
Development of methodology: M. Kleppe, M. Kwak, S. Marubayashi,
V. Romanet, R. Fan
Acquisition of data (provided animals, acquired and managed
patients, provided facilities, etc.): M. Kleppe, M. Kwak, P. Koppikar,
M. Keller, L. Bastian, N. Bhagwat, E. Papalexi, O. Abdel-Wahab,
R. Rampal, S. Marubayashi, J.J. Chen, J. Bromberg, J. Teruya-Feldstein
Analysis and interpretation of data (e.g., statistical analysis,
biostatistics, computational analysis): M. Kleppe, M. Kwak,
P. Koppikar, M. Riester, L. Bastian, T. Hricik, O. Abdel-Wahab,
J.J. Chen, J.S. Fridman, M. Murakami, F. Michor, R. Fan, R.L. Levine
Writing, review, and/or revision of the manuscript: M. Kleppe,
M. Kwak, M. Riester, M. Keller, O. Abdel-Wahab, S. Marubayashi,
J.S. Fridman, J. Teruya-Feldstein, M. Murakami, T. Radimerski,
F. Michor, R. Fan, R.L. Levine
Administrative, technical, or material support (i.e., reporting or
organizing data, constructing databases): M. Kleppe, M. Kwak,
M. Keller, T. Hricik, A.S. McKenney, J.J. Chen, J.S. Fridman
Study supervision: F. Michor, R. Fan, R.L. Levine
Acknowledgments The authors thank the members of the Levine and Fan laborato-
ries, Neal Rosen, and Scott Armstrong for helpful comments and
on March 31, 2015. © 2015 American Association for Cancer Research. cancerdiscovery.aacrjournals.org Downloaded from
Published OnlineFirst January 8, 2015; DOI: 10.1158/2159-8290.CD-14-0736

330 | CANCER DISCOVERY�MARCH 2015 www.aacrjournals.org
Kleppe et al.RESEARCH ARTICLE
discussion. The authors also thank Benjamin L. Ebert (Harvard Med-
ical School, Boston, MA) and Ann Mullally (Harvard Medical School)
for providing Jak2 V617F knockin mice. The authors are grateful to the
MSK Kravis Center for Molecular Oncology/Geoffrey Beene Core
for their assistance with NanoString and targeted sequencing analy-
sis and Irina Linkov (IHC Pathology Core) and Janine Pichardo
for technical assistance with pathologic experiments. The authors
also acknowledge support from the Yale Institute for Nanoscience
and Quantum Engineering (YINQE) and the Yale Nanofabrication
Center for allowing use of their microfabrication facilities.
Grant Support This work was supported by the Dana-Farber Cancer Institute’s
Physical Sciences Oncology Center (U54CA143798-01), to R.L. Lev-
ine, R. Fan, M. Riester, and F. Michor; NCI 1R01CA151949-01 to
R.L. Levine; and NCI 1R01CA138234-01 to F. Michor and R.L. Levine,
and partly by NIDDK 1U01DK104331-01 to R. Fan and R.L. Levine.
M. Kleppe is a fellow of the Leukemia and Lymphoma Society and
was previously supported by an EMBO Long-Term Fellowship. A.S.
McKenney was supported by a Medical Scientist Training Program
grant from the National Institute of General Medical Sciences of the
NIH under award number T32GM007739 to the Weill Cornell/Rock-
efeller/Sloan Kettering Tri-Institutional MD–PhD Program.
The costs of publication of this article were defrayed in part by
the payment of page charges. This article must therefore be hereby
marked advertisement in accordance with 18 U.S.C. Section 1734
solely to indicate this fact.
Received July 11, 2014; revised December 23, 2014; accepted
December 30, 2014; published OnlineFirst January 8, 2015.
REFERENCES 1. Tefferi A , Vardiman JW . Myelodysplastic syndromes . N Engl J Med
2009 ; 361 : 1872 – 85 .
2. Tam CS , Nussenzveig RM , Popat U , Bueso-Ramos CE , Thomas DA ,
Cortes JA , et al. The natural history and treatment outcome of blast
phase BCR-ABL- myeloproliferative neoplasms . Blood 2008 ; 112 :
1628 – 37 .
3. Delhommeau F , Jeziorowska D , Marzac C , Casadevall N . Molecular
aspects of myeloproliferative neoplasms . Int J Hematol 2010 ; 91 :
165 – 73 .
4. Baxter EJ , Scott LM , Campbell PJ , East C , Fourouclas N , Swanton S ,
et al. Acquired mutation of the tyrosine kinase JAK2 in human myelo-
proliferative disorders . Lancet 2005 ; 365 : 1054 – 61 .
5. Kralovics R , Passamonti F , Buser AS , Teo SS , Tiedt R , Passweg JR ,
et al. A gain-of-function mutation of JAK2 in myeloproliferative dis-
orders . N Engl J Med 2005 ; 352 : 1779 – 90 .
6. Levine RL , Wadleigh M , Cools J , Ebert BL , Wernig G , Huntly BJ , et al.
Activating mutation in the tyrosine kinase JAK2 in polycythemia vera,
essential thrombocythemia, and myeloid metaplasia with myelofi bro-
sis . Cancer Cell 2005 ; 7 : 387 – 97 .
7. James C , Ugo V , Le Couedic JP , Staerk J , Delhommeau F , Lacout C ,
et al. A unique clonal JAK2 mutation leading to constitutive signal-
ling causes polycythaemia vera . Nature 2005 ; 434 : 1144 – 8 .
8. Klampfl T , Gisslinger H , Harutyunyan AS , Nivarthi H , Rumi E , Milo-
sevic JD , et al. Somatic mutations of calreticulin in myeloproliferative
neoplasms . N Engl J Med 2013 ; 369 : 2379 – 90 .
9. Nangalia J , Massie CE , Baxter EJ , Nice FL , Gundem G , Wedge DC ,
et al. Somatic CALR mutations in myeloproliferative neoplasms with
nonmutated JAK2 . N Engl J Med 2013 ; 369 : 2391 – 405 .
10. Tefferi A . Molecular drug targets in myeloproliferative neoplasms:
mutant ABL1, JAK2, MPL, KIT, PDGFRA, PDGFRB and FGFR1 . J
Cell Mol Med 2009 ; 13 : 215 – 37 .
11. Quintas-Cardama A , Kantarjian H , Cortes J , Verstovsek S . Janus
kinase inhibitors for the treatment of myeloproliferative neoplasias
and beyond . Nat Rev Drug Discov 2011 ; 10 : 127 – 40 .
12. Tefferi A , Vaidya R , Caramazza D , Finke C , Lasho T , Pardanani A .
Circulating interleukin (IL)-8, IL-2R, IL-12, and IL-15 levels are
independently prognostic in primary myelofi brosis: a comprehensive
cytokine profi ling study . J Clin Oncol 2011 ; 29 : 1356 – 63 .
13. Verstovsek S , Kantarjian H , Mesa RA , Pardanani AD , Cortes-Franco
J , Thomas DA , et al. Safety and effi cacy of INCB018424, a JAK1 and
JAK2 inhibitor, in myelofi brosis . N Engl J Med 2010 ; 363 : 1117 – 27 .
14. Pikman Y , Lee BH , Mercher T , McDowell E , Ebert BL , Gozo M , et al.
MPLW515L is a novel somatic activating mutation in myelofi brosis
with myeloid metaplasia . PLoS Med 2006 ; 3 : e270 .
15. Mullally A , Lane SW , Ball B , Megerdichian C , Okabe R , Al-Shahrour
F , et al. Physiological Jak2V617F expression causes a lethal myelopro-
liferative neoplasm with differential effects on hematopoietic stem
and progenitor cells . Cancer Cell 2010 ; 17 : 584 – 96 .
16. Lu Y , Chen JJ , Mu L , Xue Q , Wu Y , Wu PH , et al. High-throughput
secretomic analysis of single cells to assess functional cellular hetero-
geneity . Anal Chem 2013 ; 85 : 2548 – 56 .
17. Ma C , Fan R , Ahmad H , Shi Q , Comin-Anduix B , Chodon T , et al. A
clinical microchip for evaluation of single immune cells reveals high
functional heterogeneity in phenotypically similar T cells . Nat Med
2011 ; 17 : 738 – 43 .
18. Fan R , Vermesh O , Srivastava A , Yen BK , Qin L , Ahmad H , et al. Inte-
grated barcode chips for rapid, multiplexed analysis of proteins in
microliter quantities of blood . Nat Biotechnol 2008 ; 26 : 1373 – 8 .
19. Schepers K , Pietras EM , Reynaud D , Flach J , Binnewies M , Garg
T , et al. Myeloproliferative neoplasia remodels the endosteal bone
marrow niche into a self-reinforcing leukemic niche . Cell Stem Cell
2013 ; 13 : 285 – 99 .
20. Yu H , Pardoll D , Jove R . STATs in cancer infl ammation and immu-
nity: a leading role for STAT3 . Nat Rev Cancer 2009 ; 9 : 798 – 809 .
21. Walz C , Ahmed W , Lazarides K , Betancur M , Patel N , Hennighausen
L , et al. Essential role for Stat5a/b in myeloproliferative neo-
plasms induced by BCR-ABL1 and JAK2(V617F) in mice . Blood
2012 ; 119 : 3550 – 60 .
22. Yan D , Hutchison RE , Mohi G . Critical requirement for Stat5 in a
mouse model of polycythemia vera . Blood 2012 ; 119 : 3539 – 49 .
23. Kleppe M , Levine RL . New pieces of a puzzle: the current biological
picture of MPN . Biochim Biophys Acta 2012 ; 1826 : 415 – 22 .
24. Arranz L , Sanchez-Aguilera A , Martin-Perez D , Isern J , Langa X ,
Tzankov A , et al. Neuropathy of haematopoietic stem cell niche is
essential for myeloproliferative neoplasms . Nature 2014 ; 512 : 78 – 81 .
25. Reynaud D , Pietras E , Barry-Holson K , Mir A , Binnewies M , Jeanne
M , et al. IL-6 controls leukemic multipotent progenitor cell fate and
contributes to chronic myelogenous leukemia development . Cancer
Cell 2011 ; 20 : 661 – 73 .
26. Hanoun M , Zhang D , Mizoguchi T , Pinho S , Pierce H , Kunisaki Y ,
et al. Acute myelogenous leukemia-induced sympathetic neuropathy
promotes malignancy in an altered hematopoietic stem cell niche .
Cell Stem Cell 2014 ; 15 : 365 – 75 .
27. Quintas-Cardama A , Vaddi K , Liu P , Manshouri T , Li J , Scherle PA ,
et al. Preclinical characterization of the selective JAK1/2 inhibitor
INCB018424: therapeutic implications for the treatment of myelo-
proliferative neoplasms . Blood 2010 ; 115 : 3109 – 17 .
28. Takeda K , Kaisho T , Yoshida N , Takeda J , Kishimoto T , Akira S .
Stat3 activation is responsible for IL-6-dependent T cell proliferation
through preventing apoptosis: generation and characterization of T
cell-specifi c Stat3-defi cient mice . J Immunol 1998 ; 161 : 4652 – 60 .
29. Wernig G , Gonneville JR , Crowley BJ , Rodrigues MS , Reddy MM ,
Hudon HE , et al. The Jak2V617F oncogene associated with myelo-
proliferative diseases requires a functional FERM domain for trans-
formation and for expression of the Myc and Pim proto-oncogenes .
Blood 2008 ; 111 : 3751 – 9 .
30. Koppikar P , Abdel-Wahab O , Hedvat C , Marubayashi S , Patel J , Goel
A , et al. Effi cacy of the JAK2 inhibitor INCB16562 in a murine model
on March 31, 2015. © 2015 American Association for Cancer Research. cancerdiscovery.aacrjournals.org Downloaded from
Published OnlineFirst January 8, 2015; DOI: 10.1158/2159-8290.CD-14-0736

MARCH 2015�CANCER DISCOVERY | 331
JAK–STAT Pathway Activation in Malignant and Nonmalignant Cells in MPN RESEARCH ARTICLE
of MPLW515L-induced thrombocytosis and myelofi brosis . Blood
2010 ; 115 : 2919 – 27 .
31. Unger MA , Chou HP , Thorsen T , Scherer A , Quake SR . Monolithic
microfabricated valves and pumps by multilayer soft lithography .
Science 2000 ; 288 : 113 – 6 .
32. Bodenmiller B , Zunder ER , Finck R , Chen TJ , Savig ES , Bruggner
RV , et al. Multiplexed mass cytometry profi ling of cellular states per-
turbed by small-molecule regulators . Nat Biotechnol 2012 ; 30 : 858 – 67 .
33. Qiu P , Simonds EF , Bendall SC , Gibbs KD Jr , Bruggner RV ,
Linderman MD , et al. Extracting a cellular hierarchy from high-
dimensional cytometry data with SPADE . Nat Biotechnol 2011 ; 29 :
886 – 91 .
34. Zhao JL , Ma C , O’Connell RM , Mehta A , DiLoreto R , Heath JR , et al.
Conversion of danger signals into cytokine signals by hematopoietic
stem and progenitor cells for regulation of stress-induced hematopoi-
esis . Cell Stem Cell 2014 ; 14 : 445 – 59 .
on March 31, 2015. © 2015 American Association for Cancer Research. cancerdiscovery.aacrjournals.org Downloaded from
Published OnlineFirst January 8, 2015; DOI: 10.1158/2159-8290.CD-14-0736

2015;5:316-331. Published OnlineFirst January 8, 2015.Cancer Discovery Maria Kleppe, Minsuk Kwak, Priya Koppikar, et al. Cells Contributes to MPN Pathogenesis and Therapeutic Response
STAT Pathway Activation in Malignant and Nonmalignant−JAK
Updated version
10.1158/2159-8290.CD-14-0736doi:
Access the most recent version of this article at:
Material
Supplementary
http://cancerdiscovery.aacrjournals.org/content/suppl/2015/01/08/2159-8290.CD-14-0736.DC1.html
Access the most recent supplemental material at:
Cited Articles
http://cancerdiscovery.aacrjournals.org/content/5/3/316.full.html#ref-list-1
This article cites by 34 articles, 9 of which you can access for free at:
Citing articles
http://cancerdiscovery.aacrjournals.org/content/5/3/316.full.html#related-urls
This article has been cited by 1 HighWire-hosted articles. Access the articles at:
E-mail alerts related to this article or journal.Sign up to receive free email-alerts
Subscriptions
Reprints and
To order reprints of this article or to subscribe to the journal, contact the AACR Publications Department at
Permissions
To request permission to re-use all or part of this article, contact the AACR Publications Department at
on March 31, 2015. © 2015 American Association for Cancer Research. cancerdiscovery.aacrjournals.org Downloaded from
Published OnlineFirst January 8, 2015; DOI: 10.1158/2159-8290.CD-14-0736