jalilian ahmadkalaei, seyedeh pegah (2018) integrated
TRANSCRIPT

1
Integrated Physical-Fenton Remediation of Petroleum-
Contaminated Soil Using Ethyl Lactate as a Green
Solvent
by
Seyedeh Pegah Jalilian Ahmadkalaei
Department of Chemical and Environmental Engineering
THESIS SUBMITTED TO THE UNIVERSITY OF
NOTTINGHAM FOR THE DEGREE OF DOCTOR OF
PHILOSOPHY
AUGUST 2017

2
ABSTRACT
The huge amount of petroleum hydrocarbons contaminated sites is the
heritage of a long history of fossil fuels usage. Reducing petroleum
hydrocarbons levels in contaminated soils by Fenton reaction and with the aid
of one or two agents such as solvents, surfactants, or vegetable oils has been
studied in recent years, with successful reported results. Nonetheless,
destruction of the aliphatic fraction of total petroleum hydrocarbon (TPH) by
Fenton reaction has been studied to a lesser extent as compared to the aromatic
fraction of TPH. Additionally, studies regarding the effect of humic acid (HA)
on Fenton reaction reported contradictory results, and more research is
necessary to clarify HA effects. Lastly, although achieving the highest
efficiency is the main objective of soil remediation technologies, the
environmental side effects of the applied processes should be considered as
important as the efficiency. In light of these, the main aim of this project was to
increase Fenton treatment efficiency by using an environmental friendly
solvent, ethyl lactate (EL). The project objectives included determining
optimum levels for the reagents of Fenton reaction and desorption process such
as hydrogen peroxide (H2O2) and EL, identifying the kinetic of TPH desorption
and destruction of petroleum hydrocarbons by Fenton reaction in addition to
analysing the effects of EL on these processes. Through desorption tests,
EL/water solution demonstrated great ability to increase the removal efficiency
and desorption of sorbed TPH. Desorption by EL/water solution consisted of a
very fast desorption stage followed by a slow stage. After 30 min of desorption,
the removal efficiency of TPH increased from 63% to 81% for EL=25% and
EL=100%, respectively. The initial desorption rate for 25% and 100% were

3
1.625 mg/min and 3.368 mg/min, respectively. The results of batch experiments
indicated that EL%=10% was the optimum value for the EL-modified Fenton
reaction. After 4 h, an increase in H2O2 concentration from 0.1 M to 2 M at
L/S=2 and EL=25% increased the removal efficiency of TPH from 68.41% to
90.21%. HA addition up to 150 mg/l was also studied. For fraction 1, adding
HA led to an increase in removal efficiency while for fraction 2, only
HA=150mg/l had higher removal efficiency than the HA=0 case and for fraction
3, addition of HA in the studied range could not increase the removal efficiency.
A good compatibility of zero-valent iron nanomaterial with H2O2 was proved.
Laboratory column experiments were finally carried out to remove petroleum
hydrocarbons from diesel-contaminated soil with EL to reproduce the
conditions of in-situ treatment. The remaining diesel in soil decreased by
increasing H2O2 molarity from 0.1 M to 0.5 M whereas a further increase to 2
M led to an increase in remaining diesel in soil. The stability of H2O2 in EL has
been observed which signifies good potential for in-situ applications. Overall,
the project has demonstrated the feasibility of EL-modified Fenton reaction for
the remediation of petroleum-contaminated soil.
Keywords: Ethyl lactate; Fenton treatment; Soil remediation; Total petroleum
hydrocarbons
4
LIST OF PUBLICATIONS
Jalilian Ahmadkalaei S.P., Gan S., Ng H.K., Abdul Talib S. (2016) Investigation
of ethyl lactate as a green solvent for desorption of total petroleum hydrocarbons
(TPH) from contaminated soil. Environ Sci Pollut Res 23:22008–2201
Jalilian A. S. P., Suyin Gan, Hoon Kiat Ng, Suhaimi Abdul Talib (2017)
Evaluation of ethyl lactate as solvent in Fenton oxidation for the remediation of
total petroleum hydrocarbon (TPH)-contaminated soil. Environ Sci Pollut Res,
24(21):17779-17789
Jalilian Ahmadkalaei S.P., Gan S., Ng H.K., Abdul Talib S. (2017) The role of
natural organic matters in water and soil remediation. Proceedings of the 4th
Postgraduate Colloquium for Environmental Research (POCER 2017), Melaka,
Malaysia, 25-26 July 2017

5
ACKNOWLEDGEMENTS
I am deeply grateful to Prof. Gan Suyin, Prof. Ng Hoon Kiat and Prof. Suhaimi
Abdul Talib for providing this funded PhD opportunity to carry out research
within the field of soil treatment. They have supported me through the entire
project. I am very thankful to my beloved parents and siblings, for their support
and sharing and loving care and encouragement that give me the courage to face
all problems. The Ministry of Higher Education (MOHE), Malaysia, is also
gratefully acknowledged for its financial support towards this project under the
Fundamental Research Grant Scheme (FRGS),
FRGS/2/2013/TK05/UNIM/02/1.
6
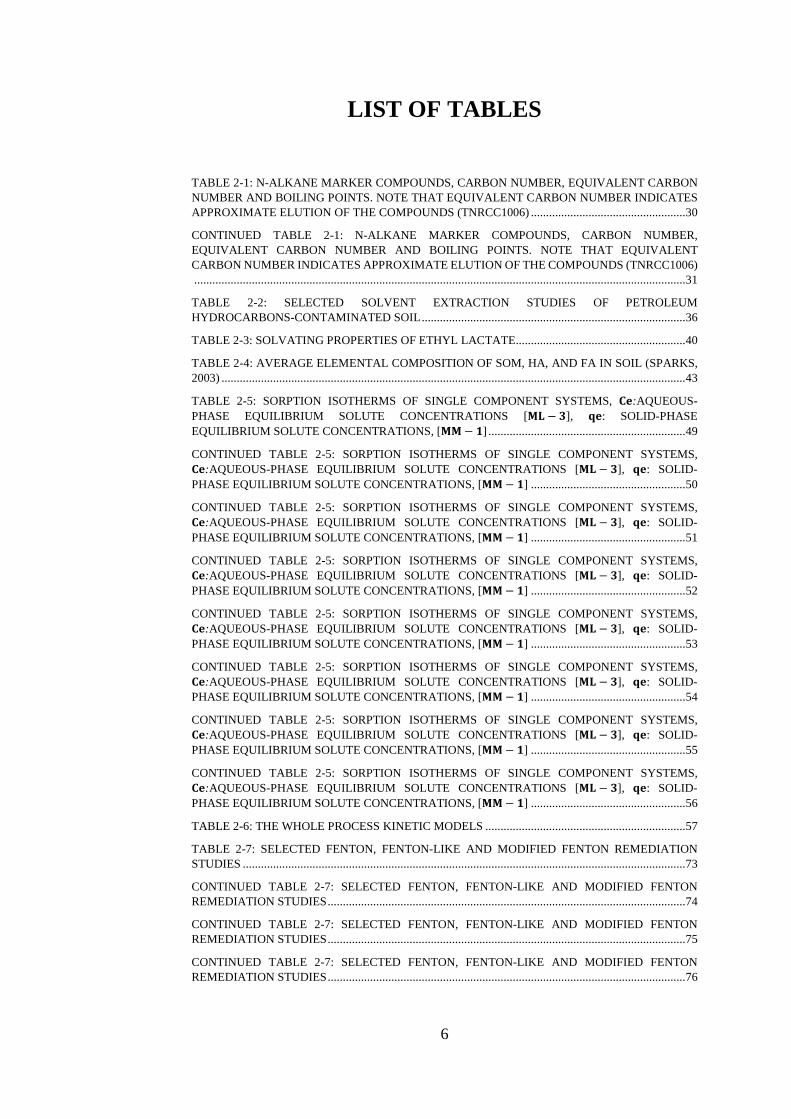
LIST OF TABLES
TABLE 2-1: N-ALKANE MARKER COMPOUNDS, CARBON NUMBER, EQUIVALENT CARBON
NUMBER AND BOILING POINTS. NOTE THAT EQUIVALENT CARBON NUMBER INDICATES
APPROXIMATE ELUTION OF THE COMPOUNDS (TNRCC1006) ................................................... 30
CONTINUED TABLE 2-1: N-ALKANE MARKER COMPOUNDS, CARBON NUMBER,
EQUIVALENT CARBON NUMBER AND BOILING POINTS. NOTE THAT EQUIVALENT
CARBON NUMBER INDICATES APPROXIMATE ELUTION OF THE COMPOUNDS (TNRCC1006)
.................................................................................................................................................................. 31
TABLE 2-2: SELECTED SOLVENT EXTRACTION STUDIES OF PETROLEUM
HYDROCARBONS-CONTAMINATED SOIL ....................................................................................... 36
TABLE 2-3: SOLVATING PROPERTIES OF ETHYL LACTATE........................................................ 40
TABLE 2-4: AVERAGE ELEMENTAL COMPOSITION OF SOM, HA, AND FA IN SOIL (SPARKS,
2003) ......................................................................................................................................................... 43
TABLE 2-5: SORPTION ISOTHERMS OF SINGLE COMPONENT SYSTEMS, 𝐂𝐞:AQUEOUS-
PHASE EQUILIBRIUM SOLUTE CONCENTRATIONS [𝐌𝐋 − 𝟑], 𝐪𝐞: SOLID-PHASE
EQUILIBRIUM SOLUTE CONCENTRATIONS, [𝐌𝐌 − 𝟏] ................................................................. 49
CONTINUED TABLE 2-5: SORPTION ISOTHERMS OF SINGLE COMPONENT SYSTEMS,
𝐂𝐞:AQUEOUS-PHASE EQUILIBRIUM SOLUTE CONCENTRATIONS [𝐌𝐋 − 𝟑], 𝐪𝐞: SOLID-
PHASE EQUILIBRIUM SOLUTE CONCENTRATIONS, [𝐌𝐌 − 𝟏] ................................................... 50
CONTINUED TABLE 2-5: SORPTION ISOTHERMS OF SINGLE COMPONENT SYSTEMS,
𝐂𝐞:AQUEOUS-PHASE EQUILIBRIUM SOLUTE CONCENTRATIONS [𝐌𝐋 − 𝟑], 𝐪𝐞: SOLID-
PHASE EQUILIBRIUM SOLUTE CONCENTRATIONS, [𝐌𝐌 − 𝟏] ................................................... 51
CONTINUED TABLE 2-5: SORPTION ISOTHERMS OF SINGLE COMPONENT SYSTEMS,
𝐂𝐞:AQUEOUS-PHASE EQUILIBRIUM SOLUTE CONCENTRATIONS [𝐌𝐋 − 𝟑], 𝐪𝐞: SOLID-
PHASE EQUILIBRIUM SOLUTE CONCENTRATIONS, [𝐌𝐌 − 𝟏] ................................................... 52
CONTINUED TABLE 2-5: SORPTION ISOTHERMS OF SINGLE COMPONENT SYSTEMS,
𝐂𝐞:AQUEOUS-PHASE EQUILIBRIUM SOLUTE CONCENTRATIONS [𝐌𝐋 − 𝟑], 𝐪𝐞: SOLID-
PHASE EQUILIBRIUM SOLUTE CONCENTRATIONS, [𝐌𝐌 − 𝟏] ................................................... 53
CONTINUED TABLE 2-5: SORPTION ISOTHERMS OF SINGLE COMPONENT SYSTEMS,
𝐂𝐞:AQUEOUS-PHASE EQUILIBRIUM SOLUTE CONCENTRATIONS [𝐌𝐋 − 𝟑], 𝐪𝐞: SOLID-
PHASE EQUILIBRIUM SOLUTE CONCENTRATIONS, [𝐌𝐌 − 𝟏] ................................................... 54
CONTINUED TABLE 2-5: SORPTION ISOTHERMS OF SINGLE COMPONENT SYSTEMS,
𝐂𝐞:AQUEOUS-PHASE EQUILIBRIUM SOLUTE CONCENTRATIONS [𝐌𝐋 − 𝟑], 𝐪𝐞: SOLID-
PHASE EQUILIBRIUM SOLUTE CONCENTRATIONS, [𝐌𝐌 − 𝟏] ................................................... 55
CONTINUED TABLE 2-5: SORPTION ISOTHERMS OF SINGLE COMPONENT SYSTEMS,
𝐂𝐞:AQUEOUS-PHASE EQUILIBRIUM SOLUTE CONCENTRATIONS [𝐌𝐋 − 𝟑], 𝐪𝐞: SOLID-
PHASE EQUILIBRIUM SOLUTE CONCENTRATIONS, [𝐌𝐌 − 𝟏] ................................................... 56
TABLE 2-6: THE WHOLE PROCESS KINETIC MODELS .................................................................. 57
TABLE 2-7: SELECTED FENTON, FENTON-LIKE AND MODIFIED FENTON REMEDIATION
STUDIES .................................................................................................................................................. 73
CONTINUED TABLE 2-7: SELECTED FENTON, FENTON-LIKE AND MODIFIED FENTON
REMEDIATION STUDIES ...................................................................................................................... 74
CONTINUED TABLE 2-7: SELECTED FENTON, FENTON-LIKE AND MODIFIED FENTON
REMEDIATION STUDIES ...................................................................................................................... 75
CONTINUED TABLE 2-7: SELECTED FENTON, FENTON-LIKE AND MODIFIED FENTON
REMEDIATION STUDIES ...................................................................................................................... 76

7
TABLE 3-1: GC-FID (PERKIN-ELMER, MODEL CLARUS 680, BEACONS FIELD, UK)
ANALYTICAL CONDITIONS ................................................................................................................ 94
TABLE 3-2: N-ALKANE MARKERS ..................................................................................................... 95
TABLE 4-1 SOIL SAMPLE PHYSICOCHEMICAL PROPERTIES .................................................... 108
TABLE 4-2: RETENTION TIME WINDOW OF INDIVIDUAL N-ALKANES .................................. 108
TABLE 4-3: 𝐑𝐅 AND 𝐑𝐅𝐚𝐯𝐞 VALUES ............................................................................................... 109
TABLE 4-4: PERCENTAGE OF ALIPHATIC DIESEL FRACTIONS AND TPH EXTRACTION BY
DIFFERENT SOLVENTS ...................................................................................................................... 111
TABLE 4-5: ALIPHATIC DIESEL AND TPH IN SOLVENT EXTRACTABLE AND HUMIN
FRACTIONS OF DCM EXTRACTED SOIL FOR 14-DAYS CONTAMINATED SOIL .................... 111
TABLE 4-6: EFFECT OF SOIL PRE-TREATMENT BY EL ON SOXHLET EXTRACTION
EFFICIENCY USING DCM FOR AGED SOIL .................................................................................... 113
TABLE 4-7: CALCULATED PARAMETERS AND VARIABLES FROM THE PSEUDO-SECOND
ORDER KINETIC MODELLING FOR 5000 MG/KG SOIL AT L/S=2; A) 25%, B) 50, C) 75%, D) 100%
................................................................................................................................................................ 121
TABLE 5-1: COEFFICIENTS OF TWO CONSTANT POWER LAW EQUATION FOR FRACTION 1,
FRACTION 2, FRACTION 3, AND TPH FOR KINETIC OF COMBINED EL-FENTON .................. 133
TABLE 5-2: COEFFICIENTS OF PSEUDO-FIRST ORDER KINETIC MODEL OF FENTON
REACTION FOR FRACTION 1, FRACTION 2, FRACTION 3, AND TPH, FOR KINETIC OF
COMBINED EL-FENTON ..................................................................................................................... 134
TABLE 5-3: COEFFICIENTS OF TWO CONSTANT POWER LAW KINETIC MODEL OF FENTON
REACTION FOR FRACTION 1, FRACTION 2, FRACTION 3, AND TPH, FOR KINETIC OF FENTON
IN DIFFERENT HA DOSAGES ............................................................................................................ 146
TABLE 5-4: COEFFICIENTS OF PSEUDO-FIRST ORDER KINETIC MODEL OF FENTON
REACTION FOR FRACTION 1, FRACTION 2, FRACTION 3, AND TPH, FOR KINETIC OF FENTON
IN DIFFERENT HA DOSAGES ............................................................................................................ 147
TABLE 5-5: VARIABLES AND THEIR CODED AND ACTUAL VALUES ..................................... 148
TABLE A2-1: EXPERIMENTAL DESIGN RESULTS FOR FRACTION 1, FRACTION 2, FRACTION
3, AND TPH REMOVAL EFFICIENCY ............................................................................................... 195
TABLE (A3-1): SECOND ORDER KINETIC RATE CORRELATION COEFFICIENT FOR FENTON
REACTION WITHOUT HA .................................................................................................................. 196
TABLE (A3-2): SECOND ORDER KINETIC RATE CORRELATION COEFFICIENT FOR FENTON
REACTION WITH HA .......................................................................................................................... 196

8
LIST OF FIGURES
FIGURE 1-1: SCOPE OF WORK ............................................................................................................ 25
FIGURE 2-1: CARBON NUMBER RANGES FOR TPH........................................................................ 32
FIGURE 2-3. TOTAL ORGANIC MATTER (TOM), TOTAL ORGANIC CARBON (TOC),
DISSOLVED ORGANIC MATTER (DOM), DISSOLVED ORGANIC CARBON (DOC),
PARTICULATE ORGANIC CARBON (POC), DISSOLVED ORGANIC NITROGEN (DON), AND
DISSOLVED ORGANIC PHOSPHORUS (DOP) ARE REPRESENTED. (PAGANO ET AL., 2014) .. 42
FIGURE 3-1: N-ALKANE MARKERS ON THE MIXTURE CHROMATOGRAM .............................. 95
FIGURE 4-1. COMPARISON OF EXTRACTED AMOUNT OF ALIPHATIC DIESEL FRACTIONS
FROM SOIL USING THREE DIFFERENT SOLVENTS WITH DIESEL (FRACTION 1: C9-C16,
FRACTION 2: C16-C22, FRACTION 3: C22-C284, FRACTION 4: TPH) .......................................... 110
FIGURE 4-2: SOLVENT EXTRACTABLE FRACTION FROM SOIL BY DCM WITH DIFFERENT
CONTAMINATION AGE ...................................................................................................................... 112
FIGURE 4-3: DESORPTION EXPERIMENTAL DATA FOR 5000 MG/KG SOIL AT L/S=2 WITH
DIFFERENT EL% .................................................................................................................................. 115
FIGURE 4-4: PSEUDO-SECOND ORDER KINETIC MODELS FOR DESORPTION EXPERIMENTS
FOR 5000 MG/G AT L/S=2; A) 25% EL, B) 50% EL, C) 75% EL, D) 100% EL ................................. 119
FIGURE 4-5: EFFECT OF L/S ON INITIAL DESORPTION RATE AT EL=25% FOR 5000 MG/KG
SOIL ........................................................................................................................................................ 122
FIGURE 4-6: EFFECT OF INITIAL CONTAMINATION LEVEL ON INITIAL DESORPTION RATE
AT L/S=2 AND EL=25% ....................................................................................................................... 122
FIGURE 5-1: REMOVAL EFFICIENCY AT H2O2= 0.1M, 0.5M, AND 2M AT CONSTANT FE2+=0.05
M, EL=25%, AND L/S=2, FRACTION 1, FRACTION 2, FRACTION 3 AND TPH ........................... 126
FIGURE 5-2 REMOVAL EFFICIENCY AT L/S=1, 2, AND 5, AT CONSTANT H2O2=0.5 M,
FE2+=0.05M, EL=25%, FRACTION 1, FRACTION 2, FRACTION 3 AND TPH ............................... 128
FIGURE 5-3: REMOVAL EFFICIENCY AT EL%= 0%, 25%, AND 50% AT CONSTANT H2O2=4 M,
FE2+=0.2M, AND L/S=2, FRACTION 1, FRACTION 2, FRACTION 3 AND TPH ............................. 129
FIGURE 5-4 EFFECT OF INCREASE IN EL% FROM 0% TO 68% ON REMOVAL EFFICIENCY,
FRACTION 1, FRACTION 2, FRACTION 3 AND TPH ...................................................................... 131
FIGURE 5-5: PERCENTAGES OF THREE FRACTIONS IN A: H2O2=0.1M, FE2+=0.05M, L/S=2,
EL=25%, AND B: H2O2=4M, FE2+=0.2M, L/S=2, EL=25% .................................................................. 132
FIGURE 5-6: FOURIER TRANSFORM INFRARED (FTIR) SPECTRA OF HA ................................ 138
FIGURE 5-7: FTIR SPECTRA OF A: SOIL, B: SOIL AFTER TREATMENT WITH EL, C: HA ....... 139
FIGURE 5-8: REMOVAL EFFICIENCY AT H2O2= 0.5M, AT CONSTANT FE2+=0.05 M, LS=2,
FRACTION 1, FRACTION 2, FRACTION 3 AND TPH ...................................................................... 142
FIGURE 5-9: REMOVAL EFFICIENCY AT PH=5 WITH AND WITHOUT HA, AT H2O2= 0.5M, AT
CONSTANT FE2+=0.05 M, LS=2, FRACTION 1, FRACTION 2, FRACTION 3 AND TPH............... 143
FIGURE 5-10: EFFECT OF EL ON REMOVAL EFFICIENCY WITH HA=50MG/L, AT H2O2= 0.5M,
AT CONSTANT FE2+=0.05 M, LS=2, FRACTION 1, FRACTION 2, FRACTION 3 AND TPH ........ 144
FIGURE 5-11: (A) NORMAL% PROBABILITY AND STUDENTIZED RESIDUAL PLOT. (B) THE
STUDENTIZED RESIDUALS AND PREDICTED RESPONSE PLOT. (C) THE OUTLIER T PLOT (D)
THE ACTUAL AND PREDICTED PLOT ............................................................................................. 151
FIGURE 5-12: A. THE EFFECT OF PH AND EL ON REMOVAL EFFICIENCY OF TPH AT
CONSTANT HA=100MG/L, B. THE EFFECT OF PH AND HA ON REMOVAL EFFICIENCY OF TPH
AT CONSTANT EL=35% ...................................................................................................................... 153
FIGURE 6-1: REMAINING DIESEL IN SOIL AT H2O2= 0.1M, 0.5M, AND 2M AT CONSTANT
FE2+=0.05 M, EL=10%, AND LS=1/2, FRACTION 1, FRACTION 2, FRACTION 3 AND TPH ........ 158

9
FIGURE 6-2: REMAINING DIESEL IN SOIL AT L/S=1/3, 1/2, 1 AT CONSTANT H2O2=0.5 M,
FE2+=0.05M, AND EL=10%, FRACTION 1, FRACTION 2, FRACTION 3 AND TPH....................... 160
FIGURE 6-3: REMAINING DIESEL IN SOIL AT EL%= 0%, 25%, AND 50% AT CONSTANT
H2O2=0.5 M, FE2+=0.05M, AND LS=1/2, FRACTION 1, FRACTION 2, FRACTION 3 AND TPH ... 162
FIGURE 6-4: EFFECT OF EL% ON H2O2 DECOMPOSITION ........................................................... 164

10
LIST OF ABBREVIATIONS
AAS Atomic absorption spectrometry
AOT Advanced oxidation technique
BTEX Benzene, toluene, ethylbenzene, and xylene
BTX Benzene, toluene and mixed xylene
DCM Dichloromethane
DNAPL Dense non-aqueous phase liquid
EL Ethyl lactate
EPA Environmental Protection Agency
ET Ethanol
FA Fulvic acid
FAME Fatty acid methyl esters
S-FAME Synthesized fatty acid methyl esters
Fe2+ Ferrous ion
Fe3+ Ferric ion
FeO2+ Ferry ion [Fe(IV)]
FeOH3+ Perferryl ion
FeSO4•7H2O Ferrous sulphate heptahydrate
GC Gas chromatographic
H2O2 Hydrogen peroxide
H2SO4 Sulphuric acid
HA Humic acid
HCl Hydrochloric acid

11
HgCl2 Mercury chloride
HOC Hydrophobic organic carbons
[HN4]6Mo7O24•4H2O Ammonium molybdate tetrahydrate
HS Humic substances
KMnO4 Potassium permanganate
Koc Soil organic carbon-water partition
coefficient
Kow Octanol-water partition coefficient
L/S ratio Solution to soil ratio
NAPL Non-aqueous phase liquid
(NaPO3)6 Sodium hexametaphosphate
NOM Natural organic matters
O3 Ozone
•OH Hydroxyl radical
PAH Polycyclic aromatic hydrocarbons
PCE Perchloroethylene
PCP Pentachlorophenol
•R Organic radical
R2 Correlation coefficient of fitting
S2O82− Persulfate
SOM soil organic matter
TPH Total hydrocarbon petroleum
U.S. EPA United States environmental protection
agency

12
LIST OF UNITS
% Percentage
ºC Degree Celsius
°C/min Degree Celsius per minute
g Gram
g/l Gram per liter
g/ml Gram per millilitre
h Hour
l Litre
m Meter
mg/kg Millie gram per kilogram
min Minute
mmol Millie mole
ml Millilitre
ml/min Millilitre per minute
M Molar
ppm Part per million
rpm Rotation per minute
sec Second
v/w Volume per weight
wt% Weight percentage
W/W% Weight per weight percentage

13
TABLE OF CONTENTS
CHAPTER 1: INTRODUCTION ................................................................. 18
1.1 RESEARCH BACKGROUND ................................................................................ 18
1.2 PROBLEM STATEMENT ...................................................................................... 20
1.3 RESEARCH OBJECTIVES .................................................................................... 23
1.4 RESEARCH APPROACH AND SCOPE ................................................................ 24
1.5 THESIS STRUCTURE ....................................................................................... 26
CHAPTER 2: LITERATURE REVIEW .................................................... 28
2.1 INTRODUCTION ................................................................................................... 28
2.2 PETROLEUM HYDROCARBONS ........................................................................ 28
2.3 SOLVENT EXTRACTION ..................................................................................... 34
2.3.1 Effective variables in solvent extraction ............................................... 36
2.3.2 Ethyl lactate ................................................................................................... 39
2.4 SORPTION/DESORPTION .................................................................................... 40
2.4.1 SOM and its role in sorption/desorption ............................................... 42
2.4.2 Sorption equilibrium isotherms ............................................................... 45
2.4.3 Sorption/desorption kinetics ..................................................................... 46
2.5 FENTON TREATMENT ......................................................................................... 59
2.5.1 Fenton reaction ............................................................................................ 59
2.5.2 Possible pathways of hydroxyl radical’s reactivity ........................... 60
2.5.3 Fenton-like System....................................................................................... 63
2.5.4 Related variables to Fenton and Fenton-like Reaction .................... 65
2.5.5Combination of Fenton Reaction with Other Remediation Methods 70
2.5.6 Fenton Reaction with NAPL and Sorbed Phase ................................. 77

14
2.5.7 The Effects of Fenton Reaction on Aliphatic and Aromatic
Reduction ..................................................................................................................... 78
2.6 SOIL COLUMN ...................................................................................................... 79
2.7 CONCLUDING REMARKS ................................................................................ 83
CHAPTER 3: MATERIALS AND METHODS ......................................... 84
3.1 INTRODUCTION .................................................................................................... 84
3.2 REAGENTS AND CHEMICALS ............................................................................ 84
3.3 SOIL COLLECTION, CHARACTERIZATION AND SPIKING ............................ 85
3.3.1 Soil collection................................................................................................ 85
3.3.2 Soil characterization ................................................................................... 85
3.3.2.1 Iron Content .................................................................................................... 86
3.3.2.2 Soil Moisture .................................................................................................. 87
3.3.2.3 Soil Texture ..................................................................................................... 87
3.3.2.4 SOM Content .................................................................................................. 88
3.3.3 Extraction of humic acid ............................................................................ 89
3.4 ANALYTICAL METHODS ................................................................................... 90
3.4.1 TPH extraction ............................................................................................. 90
3.4.2 Column chromatography ........................................................................... 91
3.4.3 Preparation of external standards for GC-FID calibration ............ 92
3.4.4 GC Analysis ................................................................................................... 93
3.4.5 H2O2 concentration assay ......................................................................... 96
3.5 FOURIER-TRANSFORM INFRARED SPECTROSCOPY ...................................... 97
3.6 DESORPTION EXPERIMENTS METHODOLOGY ............................................... 98
3.6.1 Extraction solvent tests .............................................................................. 98
3.6.2 Desorption experiments ............................................................................. 98

15
3.6.3 Kinetic modelling ......................................................................................... 99
3.7 FENTON REACTION METHODOLOGY ............................................................. 100
3.7.1 EL-Fenton reaction and reaction with zero-valent iron
nanomaterials ........................................................................................................... 100
3.7.2 Fenton reaction with HA ......................................................................... 101
3.7.3 EL-Fenton reaction kinetic modelling .............................................. 102
3.8 METHODOLOGY OF OPTIMIZATION USING RSM ................................... 103
3.9 COLUMN SET-UP METHODOLOGY .............................................................. 104
3.10 CONCLUDING REMARKS............................................................................... 105
CHAPTER 4: DESORPTION OF TOTAL PETROLEUM
HYDROCARBONS FROM SOIL USING ETHYL LACTATE ............ 106
4.1 INTRODUCTION .................................................................................................. 106
4.2 RESULTS AND DISCUSSION............................................................................. 107
4.2.1 Extraction solvent ...................................................................................... 109
4.2.2 EL and desorption process ...................................................................... 114
4.2.3 Effect of EL%, initial contamination level, and L/S on initial
desorption rate on each fraction ......................................................................... 116
4.3 CONCLUDING REMARKS ................................................................................. 123
CHAPTER 5: ETHYL LACTATE-FENTON BATCH STUDIES FOR
REMEDIATION OF TPH-CONTAMINATED SOIL ............................ 124
5.1 INTRODUCTION .................................................................................................. 124
5.2 RESULTS AND DISCUSSION............................................................................. 125
5.2.1 The removal efficiency of Fenton reaction ......................................... 125
5.2.1.1 Effect of H2O2 concentration on removal efficiency ................... 125
5.2.1.2 Effect of soil slurry volume, L/S, on removal efficiency ............ 126
5.2.1.3 Effect of EL% on removal efficiency ............................................... 128

16
5.2.1.4 Effect of Fenton reaction on distribution of the three fractions 131
5.2.1.5 Kinetic of EL-Fenton reaction.................................................................. 132
5.2.2 Effect of adding zero valent nanomaterial ......................................... 135
5.2.3 Effect of HA on Fenton reaction ............................................................ 136
5.2.3.1Characterization of derived HA, soil, and soil treated with EL 136
5.2.3.2 Effect of HA dosage on removal efficiency .................................. 140
5.2.3.3 Effect of EL% on removal efficiency for Fenton reaction in
HA………………………….…………………………………………143
5.2.3.4 Kinetic of Fenton reaction ...................................................................... 145
5.2.4 Result and discussion of optimization by RSM .................................. 148
5.2.4.1 Design of experiments by RSM.......................................................... 148
5.2.4.2 Regression model and statistical analysis ...................................... 148
5.2.4.3 The effect of pH and EL on TPH removal efficiency ............... 151
5.2.4.4 The effect of HA and EL on TPH removal efficiency .............. 152
5.2.4.5 Process optimization and verification ............................................. 154
5.3 CONCLUDING REMARKS ................................................................................. 154
CHAPTER 6: ETHYL LACTATE-FENTON COLUMN STUDIES FOR
REMEDIATION OF TPH-CONTAMINATED SOIL ............................ 156
6.1. INTRODUCTION .................................................................................................. 156
6.2. RESULTS AND DISCUSSION............................................................................. 157
6.2.1. Effect of H2O2 concentration on remaining diesel in soil .............. 157
6.2.2. Effect of overall soil slurry volume, L/S, on remaining diesel in
soil………………………………………………………………………………………………..158
6.2.3. Effect of EL% on remaining diesel in soil, H2O2, and velocity .... 160
6.3 CONCLUDING REMARKS ................................................................................. 165

17
CHAPTER 7: CONCLUSIONS AND RECOMMENDATIONS FOR
FUTURE WORK ......................................................................................... 166
7.1 CONCLUSIONS ................................................................................................... 166
7.2 RECOMMENDATIONS FOR FUTURE WORK ................................................... 168
REFERENCES ............................................................................................. 170
APPENDIX 1:............................................................................................... 194
APPENDIX 2:............................................................................................... 195
APPENDIX 3:............................................................................................... 196

18
CHAPTER 1: INTRODUCTION
1.1 Research Background
The vast number of contaminated sites with petroleum hydrocarbons is the
heritage of a long history of using fossil fuels. According to the European
Environment Agency in 2006, crude oil (alkanes, alkenes and cycloalkanes) was
one of the main pollutants in European contaminated sites forming 33.7% of
total soil contaminants (Valentin et al., 2013). Around 450000 contaminated
sites have been reported in America (Yap, 2012). Crude petroleum is a complex
mixture constituted mainly of hydrocarbons, organic sulphur compounds,
nitrogen, and oxygen. This mixture contains hundreds of thousands of
hydrocarbons, ranging from light, volatile, short-chained organic compounds to
heavy, long-chained, branched compounds. Compounds in crude oil can be
divided into three general classes consisting of saturated hydrocarbons, aromatic
hydrocarbons and polar organic compounds (Riser-Roberts 1998). Storage
leakage, transport loss, land disposal of petroleum waste, accidental and
intentional spills, refineries, aboveground tanks, terminals, marine oil spills, or
pipelines are among the main sources that pollute soils with petroleum
hydrocarbons (Heath et al., 1993; Zhang et al., 2010; Lim et al., 2016; Besha et
al., 2017).
Oil-contaminated soil poses serious health and environmental risks through soil
contamination itself, through water and groundwater pollution that can be toxic
for aquatic life (Arias-Estevez et al., 2007; Garcia-Falcoan et al., 2004), and

19
through human consumption of contaminated food and water (Rey-Salgueiro et
al., 2008). The presence of petroleum hydrocarbons in soil can change the
physical, chemical and biological properties of soil (Rauckyte et al., 2009).
Petroleum hydrocarbons will decrease the applicability of the soil for plantation
by changing the soil properties from wet-soil to oil-soil (Lee et al., 2002). Thus,
remediation of organic-contaminated soil is of concerns for both government
and public (Cheng et al., 2015).
Remediation of petroleum-contaminated soil is a complicated process. Diesel
and fuel oil are the most difficult fraction of petroleum hydrocarbons for
remediation (Jamialahmadi et al., 2015). In conventional remediation methods
for petroleum hydrocarbons polluted soil, the contaminants are transferred from
one phase to the other, for example via utilizing a solvent without destruction or
degradation. Recently soil washing/soil flushing (SW/SF) processes using
extracting agents (surfactants, biosurfactants, cyclodextrins (CDs), cosolvents)
are proven to be effective methods in removing contaminants (Trellu et al.,
2015). More recent attempts have been carried out to not only remove the
contaminants, but to also degrade them such as bioremediation, oxidation and
thermal process. Among these, Fenton reaction which is classified as an
advanced oxidation treatment has been proven to be a successful approach to
soil remediation (Bogan et al., 2003, Romero et al., 2009, Yap, 2012,). Among
unconventional remediation methods, we can mention the unconventional
sorbents such as humic acid, electrokinetic remediation, non-thermal plasma
treatment, vermiremediation and biocatalyst assisted remediation (Kuppusamy
et al., 2016; Zhang et al., 2016). It is reported that SOM even showed higher

20
removal efficiency than a chelating agent in removing diesel fuel from
contaminated soil (Lim et al., 2016).
1.2 Problem Statement
A wide range of processes for remediating contaminated soils have been applied
including soil vapour extraction, thermal treatment, surfactant flushing, and
chemical oxidation using Fenton reagent, permanganate and ozone as well as
bioremediation including bioaugmentation, biostimulation, and bio-venting
(Lim et al., 2016). Two general views could be recognized in the used methods
for soil treatment. In the first, researchers dissolve the contaminants in a solvent
and remove the solvent from the soil whereas in the second, they focus on
destructing the contaminants by different methods such as oxidation.
Combination of these two general views has also been considered.
Destruction of hydrocarbons by oxidation, and remediation of the high
concentration soil contamination by Fenton reaction have long been proven to a
very effective method with the high efficiencies (Watts et al., 1996; Watts et al.,
2000; Neyens et al., 2003). In Watts et al. (2000)’s work, benzene, toluene, and
mixed xylenes (BTX) were chosen as representative aromatic compounds, and
n-nonane, n-decane, and n-dodecane (NDD) were selected as common aliphatic
components of gasoline. NDD was destructed by 20% after 48 h, and BTX was
destructed completely in 32 h.
Combination of Fenton reaction with solvent extraction is now recognized as a
successful remediation strategy (Lundstedt et al., 2006, Jalilian et al., 2017).
Fenton oxidants are more active in aqueous medium; this means that they can
react with the dissolved form of contaminants more effectively than with the
21
adsorbed form. By applying a solvent, for instance ethanol (ET), the dissolution
rate of contaminants will increase. By dissolving the contaminants, their
destruction by Fenton reaction will be more efficient. The commonly used
agents for dissolving petroleum hydrocarbons and increasing their desorption
rate are organic solvents like n-hexane, low-molecular-weight alcohols (e.g.,
methanol, ethanol, tert-butanol, pentanol, acetone, and hexanol) (Khodadoust et
al., 1999; Khodadoust et al., 2000; Silva et al., 2005; Li et al., 2012), and
vegetable oils such as sunflower oil (Pannu et al., 2004; Gong et al., 2005).The
higher efficiency of a green solvent, i.e. ethyl lactate (EL) for desorbing
polycyclic aromatic hydrocarbons in comparison with ethanol has been reported
by Yap et al. (2012/a). EL is a green solvent, which is 100% biodegradable,
easily recyclable and non-corrosive. Its physicochemical properties make it an
attractive alternative to conventional solvents. Properties such as high degree of
solvency and miscibility in water, and low volatility enables it to be a suitable
coupling solvent with other treatment processes such as Fenton reaction (Yap et
al., 2012/a). The applicability of EL-Fenton treatment for degradation of four
PAHs, i.e. phenanthrene, anthracene, fluoranthene and benzo[a]pyrene in soil
was studied and was compared to ethanol-Fenton and conventional Fenton
treatments. EL-Fenton treatment demonstrated a higher removal efficiency than
the ethanol-Fenton reaction. A combination of pretreatment and treatment with
EL-Fenton for 8-10 h reached to near 97% destruction which was an additional
40% removal by conventional Fenton reaction after 24 h (Yap et al., 2012/a).
To date, the potential of EL with Fenton reaction for remediating diesel-
contaminated soil has not been explored. Hence, this represents a good

22
opportunity to further investigate this novel remediation approach and develop
an effective strategy for diesel-contaminated soils.
Significance of StudyWhilst there are substantial literature related to different
remediation technologies of petroleum hydrocarbons-contaminated soil, lesser
studies exist for the remediation of aliphatic fraction of petroleum hydrocarbons
as compared to aromatic fraction. Comparatively too, very few studies on
modified Fenton reaction with solvents for treatment of TPH-contaminated soil
exist and to the best knowledge of the author, there is no study to date regarding
the application of EL for Fenton remediation of TPH-contaminated soil. It needs
to be mentioned here that the TPH named here is attributed to the aliphatic
fraction of diesel hydrocarbons. Furthermore, the effects of humic acid (HA) on
Fenton reaction have been demonstrated in many studies, but there are
controversial arguments regarding the positive or negative effects of HA.
This thesis develops a modified Fenton reaction with EL for diesel-
contaminated soil. As desorption of contaminants is one of the major limitations
of the Fenton reaction, desorption study of TPH from contaminated soil by EL
is studied. The integrated EL-Fenton reaction was carried out in both batch and
column set-ups. The batch set-up was chosen to study the reaction in small-scale
laboratory conditions. The column set-up was selected to represent field in-situ
remediation. In some studied, HA increased the treatment efficiency while in
other reported results HA was considered responsible of the decrease in
treatment efficiency. Considering the contradictory findings on HA effects, this
thesis also aims to determine how increasing HA dosage influence the removal
efficiency of TPH and clarify its effects in the treatment. The results of this study

23
are crucial for developing an enhanced understanding of the effect of EL in
modified Fenton reaction for diesel-contaminated soil and determining optimum
values of EL and HA for Fenton soil remediation applications. The data obtained
in this thesis would benefit further pilot-scale studies.
1.3 Research Objectives
The aim of the present study is to examine the potential of EL-based Fenton as
an alternative treatment technique to conventional water-based Fenton treatment
for total petroleum hydrocarbon (TPH)-contaminated soil. The objectives of this
project are as follows:
1. Assessing the ability of EL/water system to desorb petroleum
hydrocarbons from contaminated soil.
2. Modelling the desorption kinetics of petroleum hydrocarbons from
contaminated soil using EL/water system.
3. Investigating the effectiveness of integrated EL/water-Fenton treatment
for petroleum-contaminated soil via a batch parametric study and
optimizing the process.
4. Modelling the EL/water-Fenton oxidation kinetics of petroleum
hydrocarbons from contaminated soil.
5. Evaluating the effects of different operating variables on TPH removal
efficiency in column set-up.

24
1.4 Research Approach and Scope
Figure 1-1 illustrates the scope of work carried out in this project. First, the soil
material characteristics which affect the treatment efficiency such as soil
texture, moisture content, soil pH, organic matter and total iron (Fe) available
were determined. The TPH analytical technique was then established; diesel
range of petroleum hydrocarbon, C9-C28, was passed through the gas
chromatography (GC) column to separate the aliphatic fraction of petroleum
hydrocarbons and was divided into three fractions, C9-C16, C16-C22, C22-C28,
and TPH is the summation of three fractions. These variations enabled the study
to gain further insight into the effects of hydrocarbons with different molecular
weights on the treatment performance.
Next, choosing the best solvent for Soxhlet extraction of TPH was carried out
in order to use the solvent with the highest desorption capacity. The initial
concentration of 5000 mg/kg soil was selected for most experiments as it was
the average contamination level value in the field. According to Contaminated
Land Management and Control Guidelines No. 1: Malaysia Recommended Site
Screening Levels for Contaminated Soil Land, the reported values in residential
and industrial soils are 40000mg/kg and 400000mg/kg respectively. The
applicability as well as kinetic of EL in desorption of TPH from contaminated
soil was examined with different EL%.
Subsequently, the applicability of combination of Fenton treatment with EL was
the focus of study. The effect of different variables on the removal efficiency of
EL-Fenton reaction was studied. The extent of degradation was evaluated at
different EL%, L/S ratio, and initial concentration of H2O2. As the studied soil

25
in this project had high organic matters, investigating the effects of humic acid
(HA) was also included.
Finally, the performance of EL-based Fenton reaction in column set-up which
is closer to field conditions was examined. A column with 5 cm diameter was
chosen with 150 g soil in the column. The solution of EL with Fenton reaction
reagents were injected into the column from top. The investigated variables
affecting TPH removal efficiency in different sections included EL%, H2O2
concentration and L/S.
Figure 1-1: Scope of work
TPH-contamination
of soil
EL-based Fenton
reaction
Desorption of TPH
kinetics
TPH degradation
kinetics TPH transport
and degradation
Soil characterization
Desorption
experiments
Batch
experiments
Soil column
experiment

26
1.5 Thesis Structure
This thesis consists of seven chapters as follows:
Chapter 1 presents an introduction to the definition of TPH, the implications of
TPH-contaminated soil, and the need for soil remediation. The problem
statement and knowledge gap in this area is described along with the research
objectives, approach and scope of work.
Chapter 2 is a comprehensive literature review that discusses the definition of
TPH, the chemistry of Fenton reaction, modified Fenton reaction and its
combination with other remediation processes, desorption processes of adsorbed
contaminants with the effective variables in solvent extraction, and soil column
set-up.
Chapter 3 summarises the analytical techniques involved in this research. They
include soil spiking, soil characteristics determination, and TPH in soil and
H2O2 residual concentration quantification. The methodology applied in other
chapters for conducting the experiments were included in this chapter.
Chapter 4 reports the TPH desorption experiments using EL. Determining the
best solvent for desorption experiment was the focus of the first part of this
chapter. The applicability of EL in desorption of TPH-contaminated soil was
examined was the subsequent focus in which the effects of different variables
on removal efficiency was examined and desorption kinetic was determined.
Chapter 5 comprises the feasibility study of EL with Fenton reaction, including
parametric and degradation kinetic studies on TPH removal from polluted soil.
Using response surface methodology (RSM), the effects of involved variables
in the Fenton reaction was studied and optimised.

27
Chapter 6 describes the application of soil column set-up to investigate the
applicability of EL-Fenton reaction under field conditions. The effects of several
variables including EL% on remaining amount of diesel in soil were elucidated.
Chapter 7 reviews the main results from this work. Conclusions are drawn and
several recommendations for future work are suggested.
28
CHAPTER 2: LITERATURE REVIEW
2.1 Introduction
This chapter aims to review relevant literature related to remediation of
petroleum hydrocarbons-contaminated soil. Firstly, petroleum hydrocarbons are
defined as a broad range of hydrocarbons exist ranging from aliphatic to
aromatic fractions. Next, solvent extraction is reviewed along with the
sorption/desorption processes as this is a crucial part of the integrated Fenton
remediation technology studied in this project. The main focus of this chapter
lies in the application of Fenton treatment for soil remediation and coupling
different methods with Fenton reaction. A final section discusses soil column
set-up studies in simulating conditions close to actual field conditions.
2.2 Petroleum Hydrocarbons
Because of the wide variety of compounds in petroleum mixtures, their different
partitioning behaviour, and the lack of physical and chemical data for each
individual compound, the entire range of petroleum hydrocarbons is classified
into different fractions. The fractions are chosen based on the similarity in their
nature (aliphatic or aromatic) and their similarities in other physicochemical
characteristics such as boiling point (TNRCC1006).
Separation of hydrocarbons in a gas chromatographic (GC) column is
accomplished based on their boiling point range. By using this concept and
applying the n-alkanes as the markers, the range of TPH is divided into different
fractions. Each component, branched or aromatic, is identified based on their

29
carbon number and boiling point in comparison with the n-alkane with the same
carbon number (TNRCC1006). The recognized carbon number is named as the
approximate equivalent carbon number (EC) (TNRCC1006; Mackay et al.,
1993). For example, as Mackay et al. (1993) explained, n-hexane with six
carbon and boiling point of 69°C has EC=6. In determining the EC of benzene
with the same number of carbon, i.e. 6, we need to know its boiling point, i.e.
80°C, which determines its retention time in a GC column. Based on this
information, the EC of Benzene has been calculated as 6.5.
The n-alkane markers and the other TPH constituents are listed in Table 2-1. For
example, the hydrocarbons between >nC7 to nC8 indicates that all
hydrocarbons that elute after n-heptane and up to n-octane are included.
Cyclization, or ring structures, can increase the boiling point, so all
hydrocarbons with 8 carbons are not included in this range, including the
aromatics ethylbenzene and the xylenes (TNRCC1006). Averaging the
properties of all compounds in each fraction, and the empirical relationship
represented by EC are among the proposed ways to use one value for each
physicochemical properties of each fraction (Gustafson et al., 1997).

30
Table 2-1: n-Alkane marker compounds, carbon number, equivalent carbon
number and boiling points. Note that Equivalent Carbon Number indicates
approximate elution of the compounds (TNRCC1006)
Name and Approximate Order of
Elution in a Boiling Point Column
Actual Carbon
Number
Boiling Point (°C) Equivalent Carbon
Number (EC)
nC6 6 69 6
Benzene 6 80 6.50
nC7 7 98 7
Toluene 7 111 7.58
nC8 8 126 8
Ethylbenzene 8 136 8.50
m-Xylene 8 139 8.60
p-Xylene 8 138 8.61
o-Xylene 8 144 8.81
1,2,3 Trimethylbenzene 9 169 9.84
nC10 10 174 10
Naphthalene 10 218 11.69
nC12 12 216 12
Acenaphthylene 12 270 15.06
Acenaphthene 12 278 15.50
nC16 16 287 16
Flourene 13 295 16.55
Anthracene 14 340 19.43

31
Continued Table 2-1: n-Alkane marker compounds, carbon number, equivalent
carbon number and boiling points. Note that Equivalent Carbon Number
indicates approximate elution of the compounds (TNRCC1006)
Phenanthrene 14 339 19.36
Pyrene 16 360 20.80
nC21 21 357 21
Fluoranthene 16 375 21.85
Benzo(a)anthracene 18 435 26.37
Chrysene 18 448 27.41
Benzo(b)fluoranthene 20 481 30.14
Benzo(k)fluoranthene 20 481 30.14
Benzo(e)pyrene 20 493 31.17
Benzo(a)pyrene 20 495 31.34
Dibenze[a,h]anthracene 22 524 33.92
Benzo(g,h,i)perylene 21 525 34.01
nC35 35 499 35
Indeno[1,2,3-cd]pyrene 21 536 35.01
The whole range of TPH is usually divided into three ranges of gasoline, diesel
and lube/motor oil/grease. Here, it is noteworthy to point out that these fractions
do not have a clear-cut point. In other words, they have some overlap areas. The
selected range for each of these three fractions differs in different standard
methods. Generally, the commonly used divisions are C6-C12, C10-C28 and
C20-C40 that are considered as the gasoline range, diesel range, and lube oil

32
range, respectively (caslab,2017). A diagram including these fractions is shown
in Figure 2-1.
Figure 2-1: Carbon number ranges for TPH
In determining the concentration of one division, for example the diesel range,
two different methods are mostly used. In the first method, the concentration of
the whole detected area is considered by GC from the beginning marker until
the last marker. The determined concentration in this method includes all the
detected peaks, not only various diesel components such as normal-, iso-, cyclo-
alkanes and aromatics, but also potential degradation products (Yeh et al.,
2008). In the second method, the sum of some selected n-alkanes in the diesel
range (for example C10, C12, C14, C16, C18, C20, C22 and C24), are calculated
as an approximation of all petroleum hydrocarbon concentration (Yeh et al.,
2008). The reported concentration in this way does not show the generated
products through the reactions (Yeh et al., 2008).
Yeh et al. (2008) also detected the difference between the results of these two
methods. After remediating the soil by ozone reaction, they reported that n-
alkane did not show any considerable reduction, while the diesel range changed.
Converting the diesel compounds to other hydrocarbon products led to the result
that the amount of n-alkane remained constant, while diesel compounds were
converted to other products.
33
Information related to the chemistry and the reaction of the contaminants with
the soil particles, and hydrodynamic information related to their movement in
the soil are necessary for predicting their movement. Among the different
fractions of TPH, gasoline consists mostly of volatile components and hence,
the downward movement would not happen for this petroleum fraction whereas
in contrast, dissolving in groundwater is important for diesel range (Lee et al.,
2002). The lack of sufficient information related to the diesel movement and the
possible chemical reactions has resulted in diesel remediation being among the
major environmental issues (Lee et al., 2002).
Different methods for the remediation of contaminated soil with petroleum
hydrocarbons have been proposed. Among them, soil vapour extraction has been
a widely used method for the treatment of gasoline-contaminated soil. This
method requires a post-treatment for eliminating the extracted contaminants in
the gaseous form (Lee et al., 2002). As non-volatile compounds are resistant to
this method, it is not appropriate for diesel range hydrocarbons, or heavier
fractions (Lee et al., 2002). Bioremediation is another used method, either as the
main treatment process or a post-treatment one. Although diesel range
hydrocarbons have shown good remediation efficiency with bio-reduction
methods, but due to the high expenses involved in these methods, and in co-
contaminant cases with heavy metals as they inhibit the degradation of
hydrocarbons, this method is not recommended and it is especially not preferred
for soils with high TPH concentration (Koshlaf et al., 2016; Yoo et al., 2016).
Moreover, it has been reported that high concentration of non-aqueous phase
liquid (NAPL) reduces the efficiency of the bioremediation process. NAPLs are
immiscible in water and consist of refractory compounds, and they have high

34
tendency to adsorb to soil and this property affects the removal efficiency
(Besha et al., 2017). Therefore, cost-effective methods with high efficiency are
the focus of research for the treatment of contaminated soils with petroleum
hydrocarbons. Oxidation of TPH by different oxidants like ozone and hydrogen
peroxide is one of the most successful approaches that have been applied (Lee
et al., 2002; Yu et al., 2007).
2.3 Solvent Extraction
Extraction of contaminants from the soil matrices using a solvent in its total
meaning includes applying water, organic solvents, or vegetable oils and their
derivatives. This total process is named as dissolution, desorption, soil washing,
or in the special case of using water, it is termed as leaching (Guo et al., 2010).
The different forces between contaminants and soil particles could be classified
as chemical reactions, hydrophobic/hydrophilic properties (solubility), and
surface forces (Bayley et al., 2005(a/b)). To successfully overcome the energy
of contaminant/solid, at the point of the impact, a greater energy than the
potential energy between the contaminants and solid surface must be applied
(Bayley et al., 2005(a/b)). Some examples of different solvents in desorption
(extraction) of petroleum hydrocarbons from contaminated soil are summarised
in Table 2-2.
The hydrophobic contaminants’ properties which affect their solubility are
mainly the octanol-water partition coefficient (kow) and the water solubility.
The higher these values are, the lesser the extraction efficiency (Sui et al., 2014).
In this sense, compounds with 𝑘𝑜𝑤 > 6 are defined as the most hydrophobic
with a high affinity toward the soil particles, and compounds with 𝑘𝑜𝑤 < 6 are

35
known as weakly sorbed compounds. Because of the presence of water in soil,
water miscible solvents lead to a better extraction than the partially miscible or
immiscible solvents (Subramanian et al., 2010).
Another determinative characteristic of solvents is their polarity. In extracting
oil pollutants from soils, the solvent with the polarity closest to the oil pollutants
could be more efficient in dissolving them (Li et al., 2012). In addition to
dissolving the pollutants, solvents could enhance the extraction by reducing the
interfacial tension between NAPL-water; as a result, the density and viscosity
of the NAPL change and the NAPL solute can move as an aqueous solute and
NAPL does not exist as a discrete phase any more (Lee et al., 2006).

36
Table 2-2: Selected solvent extraction studies of petroleum hydrocarbons-
contaminated soil
Contaminants
Removal
efficiency/
extracted
pollutants
Solvent/Cosolvent Solvent/Soil
ratio Reference
Polycyclic
aromatic
hydrocarbons
(PAHs)
46% of total
PAH
Fatty acid methyl
esters (FAME)
1
(Gong et al.
2010)
12 PAHs 81–100%
Sunflower oil 1,2
(Gong et al.
2005/b)
12 PAH
field-moist soil
batch extraction
(67.2% and
81.5%)
for the air-dried
90.2% and 97%
Sunflower oil
-
(Gong et al.,
2005/a)
Xylene,
naphthalene and
hexadecane
95%
50% ethyl acetate,
40% of acetone and
10%
8 (Silva et al.
2005)
PCP
Extracting
approximately
720 mg/kg PCP
water-ethanol
mixtures as solvents -
(Khodadoust et
al. 1999)
PAHs
65 to 90% of the
extractable
PAHs
5% 1-pentanol, 10%
water and 85%
ethanol
1 g:4 ml
soil:solvent
extraction
ratio
(Khodadoust et
al. 2000)
Anthracene
Extraction
efficiency was
>90%
Peanut oil
-
(Pannu et al.
2004)
Pentachlorophenol
(PCP)
montmorillonite
(40–80%) and
ignited sediment
(∼90%)
Lactic acid
-
(Subramanian
et al. 2010)
TPH including 25
alkanes (C11–C35)
and 16 US EPA
priority polycyclic
aromatic
hydrocarbons
76–94 % Petroleum ether
-
(Sui et
al.,2014)
2.3.1 Effective variables in solvent extraction
Apart from the solubilization ability of the solvent, variables such as properties
of soil (composition, water content, soil organic matter (SOM), pH, porosity,

37
etc.), NAPL properties (composition, wettability, etc.), and pore water
properties (viscosity, density, etc.) affect the efficiency of the solvent extraction
process (Lee et al., 2006; Sui et al., 2014). Operational variables like soil
temperature are also important in determining the efficiency of soil remediation
(Albergaria et al., 2012).
Li et al. (2012) examined the influence of various extraction variables (cosolvent
(acetone) concentration, extraction time, L/S ratio, and extraction stages) on the
removal of four oil fractions (saturates, naphthene aromatics, polar aromatics
and nC7-asphaltenes) from soils. The highest reported removal of saturates,
naphthene aromatics, polar aromatics and nC7-asphaltenes reached to 91%,
81%, 87% and 60% after 0.5 min, respectively, by applying a solution of 25%
acetone.
Silva et al. (2005) studied the applicability of a mixture of solvents composed
of ethyl acetate–acetone–water in removing contaminants in the diesel range
with different functional groups: xylene, naphthalene and hexadecane. The
studied variable on the effectiveness of the extraction was solid to liquid ratio
S/L, with the values of 1: 1, 1: 2, 1: 3, 1: 4, 1: 8 (g/ml). By decreasing the ratio
from 1: 1 to 1: 2, the removal efficiency of xylene, naphthalene, and hexadecane
increased from 66.83% to 86.24%, 67.94% to 86.33%, and 68.78% to 87.33%,
respectively. Therefore, in 10 min, 85% of removal efficiency was attained.
Decreasing the ratio to 1:8 increased the extraction by just 8% on average.
Khodadoust et.al. (1999) used water-ethanol mixtures as the solvents for
extraction of pentachlorophenol (PCP) from contaminated soils. The reasons for
choosing ethanol were the high solubility of PCP in ET, its complete miscibility

38
with water, and its low cost. The mixture consisting of 50% ET showed the
higher efficiency in comparison with 100% water or 100% ET.
The applicability of FAME, which are the major constituents of biodiesel, non-
toxic and readily biodegradable, on the mobility and degradation of crude oil
within artificial sand columns has been studied by Gong et.al (2005/b). The S-
FAME (synthesized in the lab) demonstrated its ability in polycyclic aromatic
hydrocarbons (PAH) removal from the soil as compared to other eluting agents,
cyclodextrin, hydroxypropyl-b-cyclodextrin, and the synthetic surfactants,
Triton X-100 and Tween 80. As an organic phase, FAME had the ability to bind
PAH, which were dissolved into the FAME, resulting in a positive PAH removal
process from contaminated soils.
Pannu et al. (2004) reported using vegetable oil in the remediation of PAH
contaminated soil. They studied the application of peanut oil for extraction of
PAH from soil. The efficiencies of the total PAHs extraction from weathered
soil and the spiked soil were 83.7% and 91.4%, respectively.
Using more environmentally benign solvents has recently been the focus of
researchers. The United States Environmental Protection Agency (U.S. EPA)
has classified both lactic acid and its ethyl and butyl esters as Class4A inert
compounds (Subramanian et al., 2010). Lactate esters have been found to be
good cleaning agents for the removal of oils, greases, and paints (Subramanian
et al., 2010). Lactic acid in soil has been found to enhance biodegradation of
highly toxic compounds like toxaphene (Subramanian et al., 2010). Lactic acid
used in mixed solvent systems of lactic acid–water was effective for the

39
extraction of PCP from montmorillonite and natural sediment (Subramanian et
al., 2010).
EL (ethyl 2-hydroxypropionate) which is a clear and colourless liquid of low
volatility and complete miscibility with water and most organic solvents is
another studied green solvent (Lee et al., 2006). Extraction of toluene and
perchloroethylene (PCE) as representative aromatic and chlorinated
hydrocarbons were selected by Lee et al. (2006) to examine the applicability of
EL for the solvent extraction process. Solubility of toluene and PCE was
measured with increasing EL volume from 0 to 80% in laboratory batch and
column studies. PCE and toluene solubility increased exponentially with
increasing volume fraction of EL. EL was reported as the strongest cosolvent
among methanol, ethanol, tertiary butyl alcohol and acetone. 50% of EL could
result in a PCE solubility of up to 40000 mg/l, which was nearly a 200-fold
increase over its solubility in water.
2.3.2 Ethyl lactate
Ethyl lactate is formed from ethanol and lactic acid. Ethyl lactate, with other
names of Lactic acid ethyl ester; 2-Hydroxypropanoic acid ethyl ester, actylol,
and acytol, is considered as a green solvent and is not named in Environmental
Protection Agency’s (EPA) Toxic Release Inventory (TRI) or listed in the
Hazardous Air Pollutant (HAP) section (Jones et al., 2003, wikipedia). EL is
100% biodegradable and easy to recycle, without causing any health issues, so
it is recently considered as a proper alternative for the conventional solvents,
such as chlorinated hydrocarbons, especially because it can be obtained from
renewable sources (Aparicio et al., 2008; Aparicio et al., 2009/a; Pighin et al.,
2016). The solvency properties of EL is mentioned in Table 2-3.

40
Table 2-3: Solvating properties of ethyl lactate
Solvating properties EL
Kauri Butanol(KB)
Value
>1000
Solubility Parameters
Hildebrand 21.3
Hansen
Disperse 7.8
Polar 3.7
Hydrogen 6.1
Solubility Miscible in Water and
Hydrocarbons
EL formula is illustrated in Figure 2-2.
Figure 2-2: Illustration of EL formula
Guo et al., (2010) shows that EL can enhance the removal efficiency of copper
from contaminated soil. It is also reported by Yap et al. (2012/a) that EL is able
to increase the efficiency of Fenton reaction, because of its high cosolvency
power. The hydroxyl and carbonyl groups make it possible to develop
intermolecular hydrogen bonding, and EL is also able to disrupt the water-
dominated network and it leads to decreasing the polarity of the fluid, these two
reasons can explain why EL has high efficiency in remediation (Yap et al.
2012/a).
2.4 Sorption/Desorption
When two phases are in contact with each other and the concentration of one
compound changes in those phases due to the accumulation or release from the
interface, the process is named sorption (Dąbrowski, 2001). Sorption on the

41
surface is a general term that is applied for defining the adsorption and
precipitation because of different forces. Through sorption, the solutes distribute
between two phases or at interfaces that can affect the availability and the fate
of contaminants (Huang et al., 2003). Many different types of physical, chemical
and biological processes occur at the interface of two involved phases in a
sorption process (Dąbrowski, 2001).
The whole sorption process can be divided into three general parts: external
mass transfer, reaction on the interface, and internal mass transfer. External
related resistances (external transport) means any resistance types that are out
of the interfacial boundary between two phases. The external resistances involve
transport from the mass bulk resistance and boundary layer (liquid film) near to
the interface (Kannan et al., 2003; Mohan et al., 2004), the interface of the
continuous liquid and a substrate, including the solid and non-continuous liquid.
Phenomena such as poor mixing, high concentration, small particle size and
high affinity of adsorbate for adsorbent (Mohan et al., 2004) lead to high
external resistance. After reaching to the interface, the solutes through different
ways pass this barrier to reach the internal parts of solid. Intraparticle diffusion,
the next step, is that process is attributed to the substrate related diffusion in
direction of net mass transfer after interface (Bogan et al., 2003; Birdwell et al.,
2007; Qiu et al., 2009). For desorption, the same processes would happen in the
reverse order. However, due to processes such as chemisorption and diffusion
in internal pores, in most cases the rate of sorption and desorption is not equal.

42
2.4.1 SOM and its role in sorption/desorption
SOM could be classified into two major fractions, humic substances (HS) and
non-humic substances (Sparks, 2003). Non-humic substances are not
recalcitrant to biological attacks so they have a short lifetime in comparison with
the other parts (Sparks, 2003). One of the main differences between these two
groups is that non-humic substances have some specific characteristics to be
defined, but humic substances cannot be recognized by distinct features (Sparks,
2003). The different fractions of NOM (natural organic matter), which is
typically reported as total organic matter (TOM), are depicted in Figure 2-3
(Pagano et al., 2014).
Figure 2-3. Total Organic Matter (TOM), Total Organic Carbon (TOC), Dissolved Organic Matter
(DOM), Dissolved Organic Carbon (DOC), Particulate Organic Carbon (POC),
Dissolved Organic Nitrogen (DON), and Dissolved Organic Phosphorus (DOP) are
represented. (Pagano et al., 2014)
Humic substance (HS) is the main components of SOM. Three attributed
fractions to this component, i.e. humic acid (HA), fulvic acid (FA), and humin,
are differentiated based on their solubility behaviour in acidic and basic
solutions. FA is soluble in both acidic and basic solutions while humin is
insoluble in these solutions; meanwhile, HA after dissolution in basic acid is

43
insoluble in acidic solution (Song et al., 2002; Xiao et al., 2004; Huang et al.,
2012). The percentages of main elements in HA and FA are listed in Table 2-4.
Table 2-4: Average elemental composition of SOM, HA, and FA in soil (Sparks,
2003)
SOM (%) HA (%) FA (%)
Carbon 52-58 53.8-58.7 40.7-50.6
Hydrogen 3.3-4.8 3.2-6.2 3.8-7.0
Oxygen 34-39 32.8-38.3 39.7-49.8
Nitrogen 3.7-4.1 0.8-4.3 0.9-3.3
Sulfur - 0.1-1.5 0.1-3.6
O/C - 0.5 0.7
There are different ways to evaluate the effects of SOM on sorption/desorption
and oxidation processes. In some studies, the role of SOM is analysed based on
the actions that each fraction, such as HA, FA and humin, plays (Song et al.,
2002; Xiao et al., 2004; Huang et al., 2008; Huang et al., 2012, Wang et al.,
2016). In some others, SOM is studied based on its particulate and non-
particulate features, as an influential variable on the transport and reactivity of
hydrophobic organic carbons (HOC) (Sedlak et al., 1993; Diock et al., 2005).
Although some specific properties for each fraction have been reported, their
characteristics may change over the time. For example, Gunasekara et al. (2003)
reported that young SOM is made mostly from aliphatic carbons; old SOM has
more aromatic fractions. Based on these observations, they have made the
conclusion that both the aromatic and aliphatic fractions can participate in non-
linear sorption that will be discussed later.
44
Among different parts of soils, clays, oxides and SOM are the constituents of
the soil that are known as the main (de)sorption controlling parts. It is reported
that organic matter and clay are the primary fractions that affect the (de)sorption
of carbofuran (Heath et al., 1993). SOM is known as the part with the main role
in adsorption with a high affinity to many non-polar compounds. Clay minerals
after organic matters have the most adsorption ability thus they play a prominent
role in adsorption/desorption in soils with low amount of organic matters 0.1-
0.5% (Heath et al., 1993; Bermudez-couso et al., 2012).
Different findings that may seem contradictory relating to the effect of SOM on
solubility and mobility have been reported. In some studies, SOM is considered
as the adsorbent for the HOC, and hence, it decreases the desorption efficiency.
In contrast, as they compete with HOC for the adsorption sites, they can increase
the desorption efficiency. Their ability to form micelles like biosurfactants is
also reported as a means of increasing the desorption efficiency (Sui et al.,
2014).
SOM is among the most effective soil parts on adsorption/desorption processes.
Other factors, such as mineral parts of the natural sorbents within the sediment
matrix could have significant effects on sorption. However, He et al. (2006)
have mentioned the higher effect of SOM in the adsorption of hydrophobic
organic contaminants than the effect of mineral fractions, except in the absence
of water. They related that the clay or SOM ability for the sorption depended on
the type of organic contaminants. For instance, K-clay is a better adsorbent for
carbaryl and dichlobenil while biphenyl could be better adsorbed to SOM than

45
clay particles. Atrazine, on the other hand, has the same affinity towards clay
and SOM.
2.4.2 Sorption equilibrium isotherms
Adsorption isotherm models, which is an essential part of the adsorption
science, relate the equilibrium concentration or pressure of a given component
in the bulk phase and in the adsorbed phase at constant temperature (Quinones
et al., 1998; Dąbrowski et al., 2001). The isotherm equation for an adsorbent-
adsorbate system is a function of the adsorbate, adsorbent and solution
properties (Parker, 1995). An isotherm equation is predictive in designing the
process and defining the thermodynamic characteristic of the process (Alen et
al., 2004). Table 2-5 summarises the isotherm models for single component
adsorption.
The sorption processes are generally divided into two main groups of physical
sorption and chemical sorption or chemisorption. Physical sorption is related to
the weak Van der Waals’ attraction forces at all time, and is reversible; in some
cases, such as zeolites, electrostatic interactions are also included (Ruthven,
1984). The process which is totally called as partitioning is actually due to the
physical forces. Chemisorption involves chemical forces bound between the
adsorbent and adsorbate, which is irreversible, and can exist with electron
transferring (Ruthven, 1984; Abdolali et al., 2014).
A simple assumption of linear partitioning between the solid and liquid phases
is used widely, and it is reported as Eq.2-1.
𝐾𝑑 =𝑞𝑒
𝐶𝑒 Eq.(2-1)

46
where Kd denotes the constant partition coefficient [M−1L3], Ce defines the
aqueous-phase equilibrium solute concentrations [ML−3], and qe is the solid-
phase equilibrium solute concentrations [MM−1]. The assumption of this
equation is that molecules are isolated from their neighbours, and adsorption
takes place on a uniform surface (Ruthven, 1984). It is the limit of many non-
linear isotherm models. However, it cannot explain all systems.
Other isotherms have been proposed to explain systems with deviation from
linear assumption (Miller et al., 1986). Langmuir was the first one who proposed
an equation for the “monomolecular adsorption on energetically homogeneous
surfaces” and the constants in Langmuir isotherm model has physical meaning
against constants in the Freundlich isotherm model (Dąbrowski, 2001). As is
stated in Table 2-5, one of the assumptions of Langmuir isotherm is that the
adsorbed molecules are not under the effects of their neighbours. This
assumption cannot be true under all situations, and some other proposed
isotherms had been used to correct this assumption (Quinones, 1996/b).
2.4.3 Sorption/desorption kinetics
Through adsorption kinetics, the changes in concentration within the adsorbed
and dissolved phases are expressed versus time. The models that have been
applied to describe the process of adsorption/desorption processes could be
divided into two general categories: those that consider all involved processes
as a whole process, and those that investigate the real underlying physical
processes.
In the whole process group, the adsorption/desorption rate, which is usually
expressed as 𝑑𝑞𝑡
𝑑𝑡, is achieved through empirical equation, and is usually defined

47
as a function of the concentration of adsorption/desorption capacity. (Pseudo)
first-order mass transfer kinetic, which consists of one, two and three
compartment models, (pseudo) second-order mass transfer kinetic, and
Elovich’s equation (Qiu et al., 2009) are classified under this group. This group
is also named as the adsorption reaction models or empirical sorption kinetics,
which do not give definite mechanisms (Qiu et al., 2009; Wu et al. 2001) and
are reported in Table 2-6. Once the adsorption equations are written based on
the adsorption capacity instead of solution concentration, the equation would be
called pseudo of that type of equation (Qiu et al., 2009).
The second group will focus on each step. The transfer of solute in a mobile-
immobile systems involves different mechanisms that can be defined as
different resistances that are mentioned earlier. The first one is the resistance
from the bulk of mobile phase to the boundary layer around the sorbent; the
movement of the solute in the bulk is based on the advective-dispersive
transportation (Brusseau et al., 1990). After that, the diffusion in the boundary
layer which is completed by the diffusion into the pores or surfaces which is
otherwise known as “intra-aggregate diffusion”, with the assumption that the
sorption on the interface is instantaneous and the local equilibrium is assumed
for the most systems (Brusseau et al., 1990).
The first process, bulk diffusion, is mostly considered as a rapid process that
cannot be considered as a controlling factor. The major resistance is contributed
to the remaining steps, film diffusion, sorption and intraparticle diffusion, which
is the major goal of the second adsorption rate category. The processes that are
mostly described by this group are diffusion related processes, the relatively

48
immobile liquid film diffusion (surface diffusion) and intraparticle diffusion that
includes pore diffusion, (McKay et al., 1983), and solid phase diffusion
(Haddadi et al.,2009). Depending on the process conditions, one of them can
be the dominant process over the other. For example, in an agitation involved
process, the film diffusion can be neglected while in a column study with low
flow rate, it can have more significant effects (McKay et al., 1983).

49
Table 2-5: Sorption isotherms of single component systems, 𝑪𝒆:Aqueous-phase equilibrium solute concentrations [𝐌𝐋−𝟑],
𝒒𝒆: Solid-phase equilibrium solute concentrations, [𝐌𝐌−𝟏]
Name Equation Parameters and variables Remarks/Explanations/Assumptions
La
ngm
uir
an
d L
an
gm
uir
-mod
ifie
d i
soth
erm
s
Langmuir isotherm
model (Ruthven, 1984)
𝑞𝑒 =𝐾𝐿𝑞𝑚𝐶𝑒
1 + 𝐾𝐿𝐶𝑒
Linear forms:
𝐶𝑒
𝑞𝑒=
1
𝐾𝐿𝑞𝑚+
𝐶𝑒
𝑞𝑚
1
𝑞𝑒=
1
𝑞𝑚+
1
𝐾𝐿𝑞𝑚
1
𝐶𝑒
𝑞𝑚: Theoretical isotherm saturation capacity
[𝑀𝑀−1]
𝐾𝐿: Langmuir adsorption constant related to the
energy of adsorption [𝑀−1𝐿3]
T: Temperature [K]
σ: Isotherm constants related to the degree of
sorption
𝜈, 𝜂: Exponents
The simplest theoretical model for monolayer adsorption, the
adsorbed layer on the adsorbent is one molecule thickness
(Ruthven, 1984; Batzias et al., 2007; Foo et al., 2010)
All sites are energetically equivalent (Ruthven, 1984)
The molecules are not under the attraction of their neighbour
molecules, it means no lateral interaction and steric hindrance,
which lead to the constant enthalpy and sorption activation (Foo
et al., 2010; Ruthven, 1984)
A general form of isotherm that start from the linear state for the
C=0-0.3𝐶𝐿 , pass through the Freundlich isotherm (Weis 1966/a)
Modified Langmuir – 1
isotherm model
(Subramanyam et al.,
2012)
𝑞𝑒 =𝐾𝐿𝑇−𝑛𝐶𝑒
1 + 𝐾𝐿𝐶𝑒 -
Modified Langmuir – 2
isotherm model
(Subramanyam et al.,
2012)
𝑞𝑒 =𝐾𝐿𝐶𝑒
1+𝐾𝐿𝐶𝑒(
1+𝜎2(1−𝐾𝐿𝐶𝑒
2(1+𝐾𝐿𝐶𝑒)2 ) -
Holl – Kirch , modified
forms of Langmuir
(Khan et al., 1997/b)
𝑞𝑒 =𝑞𝑚𝐾𝐿𝐶𝑒
𝜈
1 + 𝑎𝐶𝑒𝜈 -
Radke and Prausnitz
modified forms of
Langmuir (Khan et al.,
1997/b)
𝑞𝑒 =𝑞𝑚𝐾𝐿𝐶𝑒
1 + 𝐾𝐿𝐶𝑒𝑏
-

50
Continued Table 2-5: Sorption isotherms of single component systems, 𝑪𝒆:Aqueous-phase equilibrium solute
concentrations [𝐌𝐋−𝟑], 𝒒𝒆: Solid-phase equilibrium solute concentrations, [𝐌𝐌−𝟏]
Marczewski and
Jaroniec Isotherm
(Generalized-Langmuir
equation) (Parker et al.,
1995)
𝑞𝑒
= 𝑞𝑚
((𝐾𝐿𝐶𝑒)𝜂
1 + (𝐾𝐿𝐶𝑒)𝜂)
𝜈𝜂⁄
Reduces to the Langmuir isotherm for 𝜈 = 𝜂 = 1
Reduces to Holl-Kirch isotherm for 𝜈 = 𝜂
Reduces to the Toth isotherm for 𝜈 = 1
Toth model
𝑞𝑒 =𝑞𝑚𝑇𝐶𝑒
(𝑏 + 𝐶𝑒𝐷)
1𝐷⁄
𝑞𝑚𝑇: Toth maximum adsorption capacity [MM−1]
b: Constant of the Toth isotherm, an adjustable
parameter, equilibrium constant [ML−3]
A Langmuir-based isotherm, reduces to the Langmuir equation
for D=1
With the assumption of a continuous distribution of site affinities
Appropriate mostly for multilayer adsorption (Subramanyam,
2012)
“Possesses the correct Henry’s law behavior“ (Pikaar et al., 2006)
Freundlich isotherm model 𝑞𝑒 = 𝐾𝑓𝐶𝑒𝑛
𝐾𝐹𝑟: Freundlich capacity parameter
[𝑀𝑀−1(𝑀𝐿−3)−1
𝑛⁄ ]
�́�: Site energy heterogeneity factor or linearity
factor [-]
𝑛: Freundlich exponent [-]
For heterogeneous adsorbent sites (Gong et al., 2007)
Multilayer adsorption with non-uniform distribution of adsorption
heat and affinities over the heterogeneous surface (Batzias et al.,
2007; Shahbeig et al., 2013)
Describing non-ideal and reversible adsorption “An infinite series of discrete Langmuir isotherms“ (Pikaar et al.,
2006)
Modified Freundlich isotherm
(Khan et al., 1997/b) 𝑞𝑒 = 𝐾𝐹𝑟𝐶𝑒
𝑛 = 𝐾𝐹𝑟𝐶𝑒𝑛1+𝑛2𝑙𝑛𝐶𝑒
𝐾𝐹𝑟: Freundlich capacity parameter
𝑛, 𝑛1, and 𝑛2: Model constants
A second-order polynomial function is used for the Freundlich
isotherm equation to compensate for the curvature on the
logarithmic plot

51
Continued Table 2-5: Sorption isotherms of single component systems, 𝑪𝒆:Aqueous-phase equilibrium solute
concentrations [𝐌𝐋−𝟑], 𝒒𝒆: Solid-phase equilibrium solute concentrations, [𝐌𝐌−𝟏]
Dubinin- Radushkevich (DR)
isotherm model
𝑞𝑒 = 𝑞𝑠𝑒(−𝑘𝑎𝑑𝜀2)
𝜀 = 𝑅𝑇𝑙𝑛 [1 +1
𝐶𝑒]
𝐸 =1
√2𝐵𝐷
𝑞𝑠: Theoretical isotherm saturation capacity
[MM−1]
𝐸: Energy of adsorption (kJ/mol)
𝑘𝑎𝑑: Dubinin–Radushkevich isotherm constant
(mol2/kJ2)
𝜀: Dubinin–Radushkevich isotherm constant
For the adsorption of trace constituents before saturation
Used to estimate the characteristic porosity and the apparent free
energy of adsorption. If E is 8 -16 kJ/mol, the ion exchange can
describe the adsorption type (Gunay et al., 2007; Subramanyam et
al., 2012)
An empirical model (Foo et al., 2010)
Does not predict the Henry’s law at low pressure (Foo et al., 2010)
Temkin model 𝜃 =
𝑞𝑒
𝑞𝑠
=𝑅𝑇
∆𝑄ln 𝐾0𝐶𝑒
∆𝑄 = −∆𝐻
𝑅: universal gas constant (kJ mol−1K−1),
𝑇: Temperature [K]
𝜃: Fractional coverage
∆𝑄: Variation of adsorption energy (kJ mol-1)
𝐾0: Temkin equilibrium constant [M−1L3]
𝑞𝑠: Theoretical isotherm saturation capacity
[MM−1]
Considered the effect of adsorbent–adsorbate interactions (Foo et
al., 2010; Subramanyam et al., 2012)
Characterized by a uniform distribution of binding energies. A
good predictor of the gas phase equilibrium, but not suggested for
liquid-phase adsorption isotherms
Redlich-Peterson (R-P) model
𝑞𝑒 =𝐾𝑅𝐶𝑒
1+𝑎𝑅𝐶𝑒𝛽
Linear forms:
ln (𝐾𝑅𝐶𝑒
𝑞𝑒− 1) = 𝑙𝑛𝑎𝑅 + 𝛽 ln 𝐶𝑒
𝐶𝑒
𝑞𝑒=
1
𝐾𝑅+ (
𝑎𝑅
𝐾𝑅) 𝐶𝑒
𝛽
𝐾𝑅: R-P isotherm constant (L/g)
𝑎𝑅: R-P isotherm constant (1/mg)
𝛽: the exponent which lies between 1 and 0
Defines both Langmuir and Freundlich Isotherms. Can be applied
in homogeneous and heterogeneous sites (Shahbeig et al., 2013;
Gunay et al., 2007)
Having three parameters into an empirical isotherm
Approaches the Freundlich model at high concentration (Gunay et
al., 2007)
When 𝛽= 1, it is the Langmuir isotherm equation (Wu et al.,
2010)

52
Continued Table 2-5: Sorption isotherms of single component systems, 𝑪𝒆:Aqueous-phase equilibrium solute
concentrations [𝐌𝐋−𝟑], 𝒒𝒆: Solid-phase equilibrium solute concentrations, [𝐌𝐌−𝟏]
Sips isotherm model, also
known as Langmuir–
Freundlich isotherm model
𝑞𝑒 =𝑞𝑚𝑎𝑠𝐶𝑒
𝑚
1 + 𝑎𝑠𝐶𝑒𝑚
qm: monolayer adsorption capacity, the total
number of binding sites [MM−1]
as: Sips constant related to energy of adsorption,
related to the median binding affinity (K0) via K0 =
a1/m [ML−3]−1/n
𝑚: Sips isotherm model exponent, heterogeneity
index, varies from 0 to 1
A combination of the Langmuir and Freundlich isotherm models
(Gunay et al., 2007), can model both homogeneous and
heterogeneous sites (Umpleby et al., 2001).
Reduces for all systems to the Freundlich isotherm at the low
concentrations (Umpleby et al., 2001)
The coefficients have physical meaning. For a homogeneous
material, m=1. When m<1, the surface is heterogeneous
(Umpleby et al., 2001)
Does not require a measure of the total number of binding sites
(Umpleby et al., 2001)
Khan et al. (Khan et al., 1997/a;
Khan et al., 2000) 𝑞𝑒 =
𝑞𝑚𝐾𝐿𝐶𝑒
(1 + 𝐾𝐿𝐶𝑒)𝑏 𝐾𝐿 and b: Model constants
𝑞𝑚: Amount of q at full surface coverage
Reduces to the Langmuir isotherm for 𝑏 = 1
Reduces to the Freundlich isotherm for high values of 𝐶𝑒
Koble–Corrigan isotherm
model (Kumar et al., 2010) 𝑞𝑒 =𝑎𝐶𝑒
𝑛
1 + 𝑏𝐶𝑒𝑛 𝑎, 𝑏 and 𝑛: Model constants Combination of the Langmuir and Freundlich isotherm
Fritz–Schluender isotherm
model (Kumar et al., 2006) 𝑞𝑒 =
𝑞𝑚𝐾𝐹𝑆𝐶𝑒
1 + 𝑞𝑚𝐶𝑒𝑚
𝑞𝑚: Fritz–Schlunder maximum adsorption
capacity [MM−1]
𝐾𝐹𝑆: Fritz–Schlunder equilibrium constant
[L3M−1]
𝑚: Fritz–Schlunder model exponent
-
Fritz-Schluender isotherm
model (Maurya et al., 2006) 𝑞𝑒 =
𝐴𝐹𝑆𝐶𝑒𝛼𝐹𝑆
1 + 𝐵𝐹𝑆𝐶𝑒𝛽𝐹𝑆
𝐴𝐹𝑆 and 𝐵𝐹𝑆: Fritz–Schlunder equation parameters
𝛼𝐹𝑆 and 𝛽𝐹𝑆: Fritz–Schlunder equation exponents
Combination of the Langmuir and Freundlich isotherm, four
parameters

53
Continued Table 2-5: Sorption isotherms of single component systems, 𝑪𝒆:Aqueous-phase equilibrium solute
concentrations [𝐌𝐋−𝟑], 𝒒𝒆: Solid-phase equilibrium solute concentrations, [𝐌𝐌−𝟏]
Fritz-Schluender isotherm
model (Maurya et al., 2006) 𝑞𝑒 =
𝐾1𝑞𝑚𝐹𝑆𝐶𝑒𝑚1
1 + 𝐾2𝐶𝑒𝑚2
𝑞𝑚𝐹𝑆: Fritz–Schlunder maximum adsorption
capacity [MM−1]
𝐾1, 𝐾2, 𝑚1, and 𝑚2 are the Fritz–Schlunder
parameters
Improvement over Langmuir and Freundlich empirical, five
parameters
Flory–Huggins isotherm model
(Vijayaraghavan el al., 2006)
𝑙𝑜𝑔𝜃
𝐶0= log 𝐾𝐹𝐻 + 𝑛𝐹𝐻log (1 − 𝜃) ∆𝐺0 =
−𝑅𝑇𝑙𝑛(𝐾𝐹𝐻)
𝜃 = 1 −𝐶𝑒
𝐶0: degree of surface coverage
𝐾𝐹𝐻: Flory–Huggins model equilibrium constant
𝑛𝐹𝐻: Flory–Huggins model exponent
-
Radke–Prausnitz isotherm
models (Vijayaraghavan et al.,
2006; Chern et al., 2001)
𝑞𝑒 =𝑎𝑅𝑟𝑅𝐶𝑒
𝛽𝑅
𝑎𝑅 + 𝑟𝑅𝐶𝑒𝛽𝑅−1
𝑎𝑅 and 𝑟𝑅:Radke–Prausnitz model constants
𝛽𝑅: Radke–Prausnitz model exponent -
𝑞𝑒 =𝐾𝑁𝐶
(1 + 𝐾𝐶)𝑚 𝐾, 𝑁, and 𝑚: Model constants
UNILAN isotherm model
(Quinones et al., 1996/a; Chern et
al., 2001)
𝑞𝑒 =𝑁
2𝑠ln (
1 + 𝐾𝐶𝑒𝑒𝑠
1 + 𝐾𝐶𝑒𝑒−𝑠)
𝑞𝑒
𝑞𝑠=
1
2𝜗ln (
𝐶 + 𝐶𝑒𝑒𝜗
𝐶 + 𝐶𝑒𝑒−𝜗)
C: An adjustable parameter, which, in principle
should be equal to 1 /K, where K is the low-
pressure equilibrium constant or Henry constant
𝜗: heterogeneity parameter, is also a parameter of
the adsorption energy distribution
Based on the assumption of a uniform distribution of the
adsorption energies and a local Langmuir isotherm
𝜗 can get negative values
Reduces to the Langmuir equation for values of 𝜗=0, the
homogeneous site
Weber and van Vliet isotherm
model (Maurya et al., 2006/b;
Van Vliet et al., 1980) 𝐶𝑒 = 𝑎1𝑞𝑒
(𝑎2𝑞𝑒𝑎3+𝑎4)
𝐶𝑒: equilibrium solution concentration, [ML−3]
𝑞𝑒: corresponding adsorption capacity, [MM−1]
𝑎𝑖(𝑖 = 1 − 4): coefficients determined by a
multiple non-linear curve-fitting technique
predicated on the minimization of the sum of
squares of residuals
Empirical

54
Continued Table 2-5: Sorption isotherms of single component systems, 𝑪𝒆:Aqueous-phase equilibrium solute
concentrations [𝐌𝐋−𝟑], 𝒒𝒆: Solid-phase equilibrium solute concentrations, [𝐌𝐌−𝟏]
Jovanovic isotherm model
(Quinones et al., 1996/a; Hossain
et al., 2012)
𝑞𝑒 = 𝑞𝑚(1 − 𝑒−𝐾𝐽𝐶𝑒) 𝑞𝑚, 𝐾𝐽: Model constants
Monolayer adsorption, without lateral interactions on an
homogeneous sites (Hossain et al., 2012; Quinones et al., 1996/a) Considers the mechanical contacts between the adsorbing and
desorbing molecules (Shahbeig et al., 2013),
Jovanovic–Freundlich
isotherm model (Quinones et al.,
1998)
𝑞𝑒
𝑞𝑠= 1 − 𝑒−(𝑎𝐶)𝜗
𝜗: Heterogeneity parameter (with 0< 𝜗 ≤ 1)
𝑎: A constant, which characterizes the magnitude
of the adsorbate–adsorbent interaction energy
Semiempirical model for single component adsorption
𝑎: Function of the temperature
Jossens model (Khan, 1997/b) 𝐶𝑒 =𝑞𝑒
𝐻𝑒(𝐹𝑞𝑒
𝑝)
H, F, and p: The parameters of the equation of
Jossens
Described by distribution of energy
Reduces to Henry’s law at low capacities
H and F depend only on temperature
Brouers–Sotolongo model
(Altenor et al., 2009)
𝑞𝑒 = 𝑞𝑚𝑎𝑥[1 − 𝑒−𝐾𝑤𝐶𝑒𝛼
]
𝐾𝑤 =𝐾𝐹
𝑞𝑚𝑎𝑥
𝑞𝑚𝑎𝑥: Saturation value
𝐾𝐹: Freundlich constant, for a given temperature
𝛼: Exponent, a measure of the width of the sorption
energy distribution
𝑞𝑚𝑎𝑥, 𝐾𝑤 and 𝛼 determined by a non-linear curve fitting
procedure
Flory–Huggins model 𝜃
𝐶0= 𝐾𝐹𝐻(1 − 𝜃)𝑛𝐹𝐻, 𝜃 = 1 −
𝐶𝑒
𝐶0 𝐾𝐹𝐻: Flory–Huggins model equilibrium constant
𝑛𝐹𝐻:Flory–Huggins model exponent
-
Hill model (Foo et al., 2010;
Shahbeig et al., 2013) 𝑞𝑒 =
𝑞𝑚𝐶𝑒𝑛
𝐾𝐷 + 𝐶𝑒𝑛
𝑛: Hill cooperativity coefficient of the binding
interaction
𝑞𝑚: Hill isotherm maximum uptake saturation
[ML−3]
𝐾𝐷: Hill constant
-

55
Continued Table 2-5: Sorption isotherms of single component systems, 𝑪𝒆:Aqueous-phase equilibrium solute
concentrations [𝐌𝐋−𝟑], 𝒒𝒆: Solid-phase equilibrium solute concentrations, [𝐌𝐌−𝟏]
Polanyi-Dubinin-Manes (PDM)
model (Kleineidam et al., 2002)
𝑞𝑒 = 𝑉0𝜌0𝑒[−𝑅𝑇(−𝑙𝑛
𝐶𝑒𝑆
)
𝐸]
𝑏
𝐸 = 𝐸0𝛽
Vo: Maximum volume of sorbed chemical per unit
mass of sorbent [𝐿3𝑀−1]
𝜌0: the compounds density [M L-3],
R, the ideal gas constant [𝑀𝐿2𝑇−2𝐾−1𝑚𝑜𝑙−1]
T : the temperature [𝐾]
𝐶𝑒
𝑆: The equilibrium concentration in liquid
normalized to the compounds solubility S
[𝑀𝐿−3], [−]
E: The characteristic free energy of adsorption of
a compound compared to that of a reference
compound (E0) in a specific adsorbent [KJmol-1]
Extended the Dubinin-Astakhov equation by Manes and co-
workers to aqueous systems by defining the Polanyi adsorption
potential 𝜖𝑆𝑊 = 𝑅𝑇𝑙𝑛 (𝑆𝐶𝑊
⁄ ) [J mol-1]
The Brunauer-Emmett-Teller
BET isotherm model (Aksu
2005; Khan et al., 1997/b;Parker
et al., 1995)
𝑞𝑒
=𝐵𝑄0𝐶𝑒
(𝐶𝑠−𝐶𝑒)[1+(𝐵−1)(𝐶𝑒
𝐶𝑠⁄ )]
𝐶𝑠: The saturation concentration of the adsorbed
component
𝐵: A constant indicating the energy of interaction
between the solute and the adsorbent surface
𝑄0: A constant indicating the amount of solute
adsorbed forming a complete monolayer
A special form of Langmuir isotherm which can account for
multilayer adsorption onto a homogeneous surface
All the assumptions relating to the Langmuir isotherm
Considered as a representative of a generalisation of the Langmuir
isotherm (Dąbrowski et al., 2001)
The first universal theory of physical adsorption (Dąbrowski et
al., 2001)
Describe the whole processes of isotherm, monomolecular
adsorption, polymolecular adsorption and capillary condensation,
the last one is not satisfactory always (Dąbrowski et al., 2001)
Myers isotherm model (Parker
et al., 1995) 𝐶 =
𝑞
𝐾𝑒𝛼𝑞𝜂
𝜂: Exponent
𝛼: Heterogeneity or shape of isotherm parameters
𝐾: Strength of adsorption parameter
𝑞: Adsorption capacity (mg g-~)
Gives the concentration as a function of capacity
Reduces to Henry’s law at low concentration
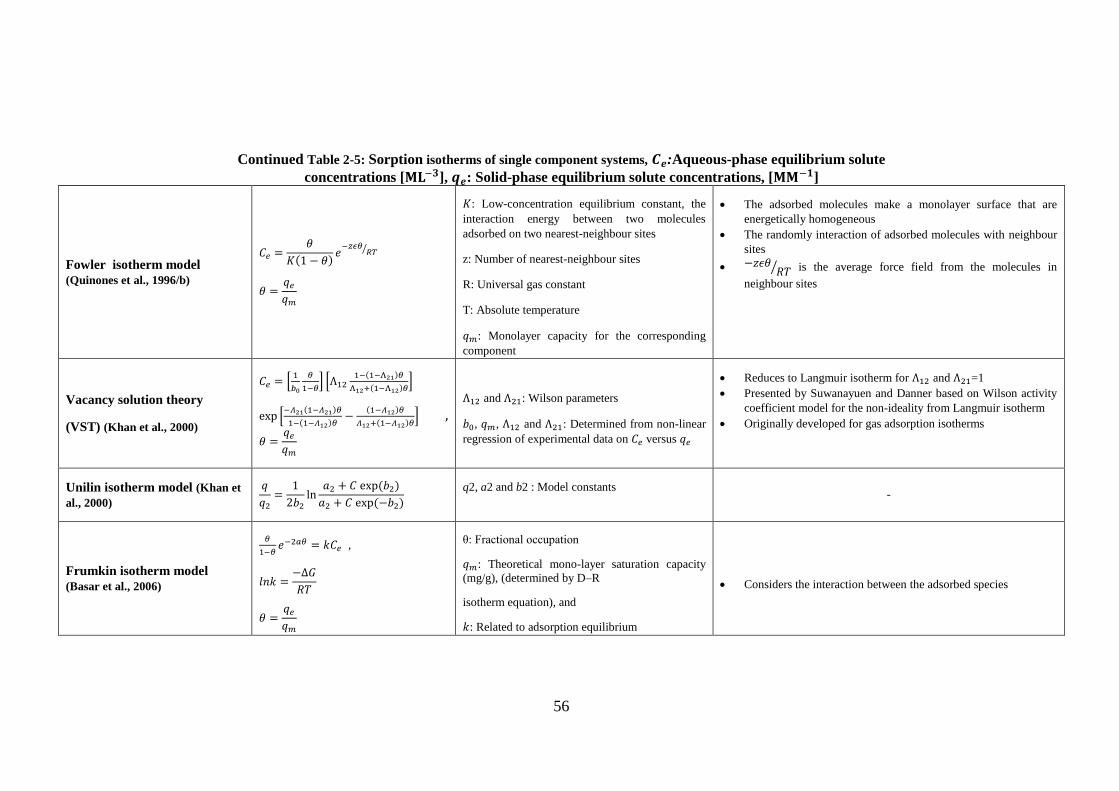
56
Continued Table 2-5: Sorption isotherms of single component systems, 𝑪𝒆:Aqueous-phase equilibrium solute
concentrations [𝐌𝐋−𝟑], 𝒒𝒆: Solid-phase equilibrium solute concentrations, [𝐌𝐌−𝟏]
Fowler isotherm model
(Quinones et al., 1996/b)
𝐶𝑒 =𝜃
𝐾(1 − 𝜃)𝑒
−𝑧𝜖𝜃𝑅𝑇⁄
𝜃 =𝑞𝑒
𝑞𝑚
𝐾: Low-concentration equilibrium constant, the
interaction energy between two molecules
adsorbed on two nearest-neighbour sites
z: Number of nearest-neighbour sites
R: Universal gas constant
T: Absolute temperature
𝑞𝑚: Monolayer capacity for the corresponding
component
The adsorbed molecules make a monolayer surface that are
energetically homogeneous
The randomly interaction of adsorbed molecules with neighbour
sites
−𝑧𝜖𝜃𝑅𝑇⁄ is the average force field from the molecules in
neighbour sites
Vacancy solution theory
(VST) (Khan et al., 2000)
𝐶𝑒 = [1
𝑏0
𝜃
1−𝜃] [Λ12
1−(1−Λ21)𝜃
Λ12+(1−Λ12)𝜃]
exp [−𝛬21(1−𝛬21)𝜃
1−(1−𝛬12)𝜃−
(1−𝛬12)𝜃
𝛬12+(1−𝛬12)𝜃] ,
𝜃 =𝑞𝑒
𝑞𝑚
Λ12 and Λ21: Wilson parameters
𝑏0, 𝑞𝑚, Λ12 and Λ21: Determined from non-linear
regression of experimental data on 𝐶𝑒 versus 𝑞𝑒
Reduces to Langmuir isotherm for Λ12 and Λ21=1
Presented by Suwanayuen and Danner based on Wilson activity
coefficient model for the non-ideality from Langmuir isotherm
Originally developed for gas adsorption isotherms
Unilin isotherm model (Khan et
al., 2000)
𝑞
𝑞2=
1
2𝑏2ln
𝑎2 + 𝐶 exp (𝑏2)
𝑎2 + 𝐶 exp (−𝑏2)
q2, a2 and b2 : Model constants
-
Frumkin isotherm model
(Basar et al., 2006)
𝜃
1−𝜃𝑒−2𝑎𝜃 = 𝑘𝐶𝑒 ,
𝑙𝑛𝑘 =−Δ𝐺
𝑅𝑇
𝜃 =𝑞𝑒
𝑞𝑚
θ: Fractional occupation
𝑞𝑚: Theoretical mono-layer saturation capacity
(mg/g), (determined by D–R
isotherm equation), and
𝑘: Related to adsorption equilibrium
Considers the interaction between the adsorbed species

57
Table 2-6: The whole process kinetic models
Name of model Equation of model Explanation/
Assumption/Remarks
Fir
st-o
rder
ma
ss t
ran
sfer
kin
etic
mo
del
, N
oye
s-W
hit
ney
equ
ati
on
(D
ok
ou
met
zid
is,
200
5)
One compartment kinetic
𝑑𝑞𝑡
𝑑𝑡= 𝑘𝑝1(𝑞𝑒 − 𝑞𝑡)
𝑞𝑡 (0,0)=0
𝑞(𝑡)
𝑞(∞)= 𝑒𝑥𝑝(−𝑘𝑝1𝑡) -
Two-compartment kinetic
𝑞(𝑡)
𝑞(∞)= 𝐹𝑟𝑎𝑝𝑒−𝑘𝑟𝑎𝑝𝑡 + 𝐹𝑠𝑙𝑜𝑤𝑒−𝑘𝑠𝑙𝑜𝑤𝑡
𝐹𝑟𝑎𝑝 + 𝐹𝑠𝑙𝑜𝑤 = 1
-
Three-compartments
𝑞(𝑡)
𝑞(∞)= 𝐹𝑟𝑎𝑝𝑒−𝑘𝑟𝑎𝑝𝑡 + 𝐹𝑠𝑙𝑜𝑤𝑒−𝑘𝑠𝑙𝑜𝑤𝑡 + 𝐹𝑣𝑒𝑟𝑦 𝑠𝑙𝑜𝑤𝑒−𝑘𝑣𝑒𝑟𝑦 𝑠𝑙𝑜𝑤𝑡
𝐹𝑟𝑎𝑝 + 𝐹𝑠𝑙𝑜𝑤 + 𝐹𝑣𝑒𝑟𝑦 𝑠𝑙𝑜𝑤 = 1
-
Sec
on
d-O
rder
Ra
te E
qu
ati
on
or
Hy
per
bo
lic
Pseudo-second-order rate
equation (Ho, 2006)
𝑑𝑞𝑡
𝑑𝑡= 𝑘𝑝2(𝑞𝑒 − 𝑞𝑡)2
𝑞𝑡 (0,0)=0
𝜏1
2⁄ = 1𝑘𝑝2𝑞𝑒
⁄
𝑡
𝑞𝑡=
1
𝑉0+
𝑡
𝑞𝑒, 𝑉0 = 𝑘𝑝2𝑞𝑒
2 The assumption of a
pseudo-second order model
is that chemical sorption is
the rate limiting step (Ho,
2000)
Half-adsorption time, 𝜏1
2⁄ ,
is the time required for the
adsorption to take up half
of the equilibrium amount
adsorbed (Cabal, 2009).
1
𝑞𝑡=
1
𝑡𝑉0+
1
𝑞𝑒
𝑞𝑡 = 𝑞𝑒 − (1
𝑘𝑝2𝑞𝑒)
𝑞𝑡
𝑡
𝑞𝑡
𝑡= 𝑘𝑝2𝑞𝑒
2 − 𝑘𝑞𝑒𝑞𝑡
Typical second-order rate
equation
𝑑𝐶𝑡
𝑑𝑡= −𝑘2𝐶𝑡
2 , Ct (0,0)=0 1
𝐶𝑡= 𝑘2𝑡 +
1
𝐶0 -

58
Continued Table 2-6: The whole process kinetic models
Elovich’s equation, semilogarithmic
𝑑𝑞𝑡
𝑑𝑡= 𝑎𝑒−𝑏𝑞
𝑞𝑡 (0,0)=0
𝑞 =1
𝑏ln(1 + 𝑎𝑏𝑡) 𝑜𝑟 𝑞 =
1
𝑏ln(𝑡 + 𝑡0) −
1
𝑏ln 𝑡0
𝑞 → 0 then 𝑑𝑞
𝑑𝑡→ 𝛼, 𝛼 is the initial leaching rate, 𝑡0 =
1
𝑎𝑏
If 𝑎𝑏𝑡 ≫ 1 → 𝑞 = (1
𝑏) ln(𝑎𝑏) + (
1
𝑏) ln 𝑡
If 𝑎𝑏𝑡 𝑖𝑠 𝑛𝑜𝑡 ≫ 1, then a value of 𝑡0 is chosen which results in a linear plot of 𝑞
vs ln(𝑡 + 𝑡0), with slope 1
𝑏 and intercept determined from 𝑡0 =
1
𝑎𝑏 (Havling,
1985)
-
Weibull’s equation 𝑞 = 1 − exp (−𝑡𝑚
𝐷) , ln(− ln(1 − 𝑞)) = −𝑙𝑛𝐷𝑤 + 𝑚𝑙𝑛𝑡
-
Bangham equation 𝑑𝑞
𝑑𝑡=
𝑞𝑡
𝑚𝑡
𝑞𝑡 = 𝐾𝑟𝑡1
𝑚⁄ , log 𝑞𝑡 = log 𝐾𝑟 + (1
𝑚) log 𝑡
𝐾𝑟: rate constant of adsorption, 𝑞𝑡: amount of metal ions adsorbed at time t
(mg/g), 𝑚: constant in relation to the adsorbent
Bangham usually has a fast
adsorption velocity, and it
is slow in attaining sorption
equilibrium (Yang, 2013)

59
2.5 Fenton Treatment
2.5.1 Fenton reaction
Among the different remediation processes for destroying the biorefractory
organic compounds, advanced oxidation technique (AOT) uses oxidants such as
ozone (O3), hydrogen peroxide (H2O2), persulfate (S2O82−), and potassium
permanganate (KMnO4) (Neyens et al., 2003; Lu et al., 2010/b) to oxidise the
contaminants. Each of them based on their properties is applicable in different
situations. Sulphate free radical SO40−, which is produced as an intermediate
through the activation of persulfate, is stable and can diffuse further from the
source (Usman et al., 2012). Among these oxidants, the radicals produced
through Fenton reaction, hydroxyl, is the most studied oxidant. Fenton reaction
is applicable for destruction of contaminants in aqueous waste, soils, and ground
water (Neyens et al., 2003; Lu et al., 2010/b).
The definition of conventional Fenton reaction is adding dilute H2O2 slowly to
a rapidly stirred, degassed iron II-substrate solution (Watts et al., 2005). Eq. (2-
2) shows the Fenton reaction in a general way:
H2O2 + Fe2+ → OH0 + OH− + Fe3+ k = 76 M−1s−1 Eq. (2 − 2)
The main produced radicals of the Fenton reaction are the hydroxyl radicals,
which are produced by electron transfer of Fe2+ to H2O2, and the hydroxide
anion. Hydroxyl radicals are very powerful, effective and non-specific oxidizing
agents, second after fluorine in oxidizing power, with an estimated oxidation
potential of +2.8V in pH = 0 and +2.0V in pH = 14 (Watts et al., 2005). As

60
hydroxyl radical is very reactive, the rate of the Fenton reaction is controlled by
its diffusion rate in water, which is ≈ 1010M−1s−1; as a result, it becomes a
diffusion-controlled reaction (Goi et al., 2006; Navalon et al., 2010). The
radicals also have a very short life span as their reaction rates are faster than
their generation rate (Chen et al., 2001; Watts et al., 2005).
Parallel reactions along with the original Fenton reaction can also take place
between the reactants, such as those indicated in Eqs. (2-3) to (2-8) (Navalon et
al., 2010). These reactions do not generate hydroxyl radicals thus they are
considered as a wastage of H2O2 (Chen et al., 2001; Navalon et al., 2010).
Fe3+ + H2O2 ↔ Fe − OOH2+ + H+ k2 = 0.001 − 0.01 M−1s−1 Eq. (2 − 3)
Fe − OOH2+ → HO2• + Fe2+ Eq. (2 − 4)
Fe2+ + HO •→ Fe3+ + HO− k3 = 3.2 × 10⁸ M−1s−1 Eq. (2 − 5)
H2O2 + HO •→ H2O + HO2• k4 = 3.3 × 10⁷ M−1s−1 Eq. (2 − 6)
Fe3+ + HO2• → Fe2+ + O2 + H+ k5 = 1.2 × 10⁶ M−1s−1 (at pH = 3) Eq. (2 − 7)
Fe2+ + HO2• → Fe3+ + HO2
− k6 = 1.3 × 10⁶ M−1s−1 (at pH = 3) Eq. (2 − 8)
2.5.2 Possible pathways of hydroxyl radical’s reactivity
It is reported that in the presence of sufficient Fenton reactants and continuous
reaction, the organic matters can be completely converted to inorganic matters,
CO2, water or inorganic salts for substituted organics (Neyens et al., 2003). This
process that is termed as “mineralisation” means that the organic substrate are
converted to inorganic species.

61
Usman et al. (2012) reported the complete mineralisation (and probably
vitalisation) of n-alkanes in a Fenton-like process with magnetite as the catalyst,
at pH = 6.7 ± 0.3. This conclusion was based on the observation that no new
compounds had been detected by the GC analysis. Through this process, the
initial concentration of the soil 4000 mg/kg soil with the sum of 3200 µg/g n-
alkanes reduced to 200 µg/g of the n-alkanes.
The main pathways of hydroxyl radicals with organic compounds can be
classified as follows:
Electrophilic reaction: One possible reaction of hydroxyl radicals with organic
matters is by reacting as an electrophile agent (Watts et al., 2005). The deficit
of electron in the valence orbitals of the hydroxyl radical makes it an electrophile
agent. In one possible route, it abstracts one electron from organic substrate, like
hydrocarbons, or other species to form hydroxide anions, Eq. (2-9) (Chen et al.,
2001; Watts et al., 2005).
OHo + S → HO− + S0+ Eq. (2 − 9)
Another possible way is electrophilic substitution in which hydroxyl radicals
attack multiple bonds, the π clouds of aromatic compounds, alkenes and other
unsaturated organic compounds, and this represents the most common reaction
of hydroxyl radicals (Chen et al., 2001; Watts et al., 2005; Navalon et al., 2010).
Hydrogen abstraction: For abstraction of one hydrogen atom by hydroxyl
radicals, the bond energy of O − H should be more than the energy of the bond
that hydroxyl radicals attacks, that are mostly C − H. As the bond energy of O −
H (109 kcal.mol−1) is higher than most of C − H bond energies, it is expected
that hydroxyl radicals can overcome the required bond energy in most organic

62
compounds. The expected form of the reaction will be as shown in Eq. (2-10)
(Neyens et al., 2003). Therefore, hydroxyl radicals by hydrogen abstraction
from organics (RH) can oxidise them, and produce highly reactive organic
radicals Ro that will be oxidised further (Chen et al., 2001; Neyens et al., 2003;
Navalon et al., 2010).
RH + OHo → H2O + Ro → furthur oxidation Eq. (2 − 10)
Hydroxyl radicals usually react with saturated compounds such as alkanes in
this way. The products of this reaction will be alkyl radicals and water (Watts et
al., 2005; Chen et al., 2001). The generated alkyl, through the further oxidation
processes, can give one electron to hydrogen peroxide and produces hydroxyl
radical (Chen et al., 2001; Watts et al., 2005).
Other possible reactions are also proposed as follows (Chen et al., 2001):
2Ro → product(dimer) Eq. (2 − 11)
𝑅𝑜 + 𝐹𝑒3+ → 𝐹𝑒2+ + 𝑝𝑟𝑜𝑑𝑢𝑐𝑡 Eq. (2 − 12)
𝑅𝑜 + 𝐹𝑒2+ → 𝐹𝑒3+ + 𝑝𝑟𝑜𝑑𝑢𝑐𝑡 Eq. (2 − 13)
Oxygen addition: The other defined way of reaction between hydroxyl radical
and an unsaturated organic compound is the reaction to form a free radical that
eventually transforms into an organic product, Eq. (2-14) (Chen et al., 2001; Xu
et al., 2006):
𝑅𝐻 + 𝑂𝐻0 → 𝑅𝑂𝐻 + 𝐻+ Eq. (2 − 14)

63
2.5.3 Fenton-like System
To enhance radical formation, in the so-called modified Fenton system or
Fenton-like reactions, researchers have used the addition of chemicals, such as
chelating agents, changing the conventional Fenton reaction by applying
peroxide in higher concentration, using iron sources other than Fe2+ like natural
iron oxides such as goethite (Bandala et al., 2008; Ferrarese et al., 2008; Yeh et
al., 2008), or applying chelating agents (Ma et al., 2018). Furthermore,
cosolvents and surfactants have also been used to enhance the efficiency of
Fenton reaction (Bogan et al., 2003/a).
In the modified Fenton reaction which is catalysed by high concentration of
hydrogen peroxide (the different reported values: ≥2%, >0.3 M, or >1,000 mg/l),
other reactive oxygen species and radicals as well as non-hydroxyl radicals will
be produced (Watts et al., 2005). These different radicals and anions cause
reactions apart from the conventional Fenton reaction. Among the produced
species in the modified Fenton reaction with high peroxide concentration are
hydroperoxide radicals (perhydroxyl radical) (HO20), a relatively weak oxidant,
superoxide anions (O20−), a weak reductant and nucleophile in aqueous systems
that cannot react with hydrocarbons, and hydroperoxide anions (HO2−), a strong
nucleophile, but hydroxyl radicals are the strongest in comparison to all these
(Chen et al., 2001; Watts et al., 2005; Goi et al., 2006; Ferrarese et al., 2008;
Yeh et al., 2008). The relevant reactions which produce these species are shown
in Eqs. (2-15) to (2-18):
H2O2 + OH• → H2O + HO20 k = 2.7 × 10⁷ M−1s−1 Eq. (2 − 15)
HO2• ↔ O2
•− + H+ pKa = 4.8 Eq. (2 − 16)

64
HO2• + Fe2+ → HO2
− + Fe3+ k = 1.2 × 10⁶ M−1s−1 Eq. (2 − 17)
R• + H2O2 → ROH + OH• k = 106 − 108 M−1s−1 Eq. (2 − 18)
Tsai et al. (2009) examined the oxidation rate of diesel TPH and fuel oil by high
H2O2 concentration, 15%, and waste basic oxygen furnace slag (100 g/kg) as the
catalyst. The results showed that 76% TPH of fuel oil and 96% of diesel oil had
been removed after 40 h. The larger fuel oil molecules compared to diesel
molecules have been explained as the reason behind their lesser destruction.
Another iron source for Fenton reaction is zero-valent iron. Zero-valent iron has
been used widely for the remediation of water from heavy metals and organic
pollutants such as halogenated methanes, ethanes, and ethenes and other
halogenated compounds at ambient temperatures (Cundy et al., 2008). There
exist some modifications to the zero-valent iron nanomaterials remediation
method. Liao et al. (2007), for example, added H2O2 to the zero-valent iron
nanomaterial to promote Fenton reaction. Meanwhile, Quinn et al. (2005)
showed the applicability of nanoscale zero-valent iron for remediation of non-
aqueous phase liquid (NAPL). Varanasi et al. (2007) applied iron nano-particles
to remediate polychlorinated biphenyls (PCB) contaminated soil. They reported
38% of destruction at room temperature which was lower than the reported value
for destruction of PCB in water, i.e. 90%. They attributed the lower efficiency
to the lower diffusion of PCB from soil to the catalyst surface. It was
demonstrated that adding a solvent to the Fenton reaction could increase the
removal efficiency. The solvent dissolved the adsorbed pollutants into the liquid
phase thus enhancing the efficiency of the reaction.

65
2.5.4 Related variables to Fenton and Fenton-like Reaction
The variables which affect the Fenton reaction efficiency include all site-
specific and contaminant-specific variables. The organic matter content, oxide
content, H2O2 concentration, initial concentration of contaminants, octanol-
water partition coefficient, temperature, specific surface area, and the age of the
contamination all have been shown to impact the degradation of TPH (Watts et
al., 2005; Yeh et al., 2008). The most studied variables are discussed in this
section.
The effect of acidity (pH): The reported effect of pH on hydrogen peroxide
oxidation efficiency mostly depends on the used catalyst, Fe2+ or Fe3+ (Watts
et al., 2005; Yeh et al., 2008). In Fenton reaction, acidic range is favourable
because Fe2+ is soluble in acidic range, pH = 3 − 4 , and will precipitate in
higher pH range (Watts et al., 2005). By using goethite as the catalyst, natural
pH = 7 has been reported to have higher efficiency than acidic pH (Kanel et al.,
2003; Yeh et al., 2008).
In pH above 7, the efficiency is reduced as hydrogen peroxide decomposes into
H2O and O2 and hence there would not be any hydroxyl radicals to react with
the organic matters (Kanel et al., 2003). As a result, Eq. (2-19) would proceed:
H2O2 → 12⁄ O2 + H2O Eq. (2 − 19)
2Fe(OH)2 + 1 2⁄ O2 + H2O → 2Fe(OH)3 Eq. (2 − 20)
Other species such as feryl ion (FeO2+) has also been recognised for its role of
increased efficiency at neutral pH (Ojinnaka et al., 2012) as shown by:

66
Fe2+ + H2O2 → FeO2+ + H2O Eq. (2 − 21)
FeO2+ + H2O2 → Fe2+ + H2O + O2 Eq. (2 − 22)
Ojinnaka et al. (2012) examined the efficiency of Fenton reaction in three
different pH ranges, acidic, neutral and basic, for PAH and aliphatic
hydrocarbons. Based on the reported results of this research, PAH and aliphatic
hydrocarbons showed the most reduction at the acidic pH followed by basic and
neutral conditions. The different pathways in acidic and neural conditions via
hydroxyl radical and non-radical feryl ion, respectively, have been explained as
the reason behind this difference.
Effect of hydrogen peroxide concentration: The effect of hydrogen peroxide
dosage on the Fenton reaction efficiency should be analysed in parallel with the
sorption rate, dissolution rate, the contaminant log Kow, and scavengers of
produced radicals through the Fenton reaction (Watts et al., 2005).
As discussed in the previous sections, the high concentration of hydrogen
peroxide has been applied to increase the Fenton reaction efficiency, and the
process is named as Fenton-like reaction. Kong et al. (1998) reported an increase
in the reaction and TPH removal efficiency with increasing hydrogen peroxide
concentration from 0 to 35 wt% (0,1, 7, 15 and 35 wt%).
There are some results related to the decrease in the removal efficiency due to
the increase in the hydrogen peroxide concentration; in some cases, no changes
have also been reported (Ferrarese et al., 2008; Yeh et al., 2008). For instance,
it is stated by Yeh et al. (2008) that hydrogen peroxide dosage was not an
effective variable in the reaction efficiency of octachlorodibenzo-p-dioxin due

67
to strong sorption of contaminants. Ferrarese et al. (2008) reported a decrease in
Fenton reaction efficiency in removal of PAHs and TPH (aliphatic
hydrocarbons) by increasing the hydrogen peroxide dosage.
The existence of an optimum concentration for hydrogen peroxide has been
suggested to describe the effect of hydrogen peroxide concentration on reaction
efficiency. In this sense, based on Goi et al. (2006)’s work, the degradation
efficiency increased with increasing the hydrogen peroxide dosage before this
optimum concentration. After this optimum value, the reaction efficiency
decreased or did not change with increasing hydrogen peroxide dosage.
Competition between hydrogen peroxide and organic matters for hydroxyl
radicals and the lesser contact between the oxidant and pollutants because of
rapid reactions at high reactant dosage were given as the reasons for this
observation.
SOM: Inorganic matters such as carbonates and natural organic matters (NOM)
are reported as the main hydroxyl radical scavengers (Watts et al., 2005). The
reactions of hydroxyl radicals with NOM are more complex than their reactions
with inorganic anions (Watts et al., 2005). The effects of the organic matter on
Fenton reaction may be a function of the organic material state (e.g. soluble or
sorbed), the hydrophobicity and reactivity of the probe compound or
contaminants, the nature of the used catalyst and many other factors (Watts et
al., 2005).
SOM are considered as a determinative factor in the sorption-desorption
processes (Lindsey et al., 2000). FA and HA are the most effective fractions of
SOM that participate in sorption reactions (Lindsey et al., 2000). Two possible

68
yet contradictory ways for participation of SOM in the Fenton reaction have
been reported. FA and HA can participate in Fenton reaction by binding with
metals and performing the role of metal chelates, and reducing Fe3+ to Fe2+
(Lindsey et al., 2000). Alternatively, they can decrease the Fenton reaction
efficiency by the consumption of hydrogen peroxide thereby playing the role of
competitors for hydroxyl radicals (Lindsey et al., 2000; Goi et al., 2006; Romero
et al., 2009; Fan et al., 2013; Sherwood et al., 2014). The reported data regarding
the final result of this positive effect (reducing of Fe3+to Fe2+ ) and negative
effect (consumption of hydroxyl radicals) are different. Fan et al. (2013)
reported that organic matters could increase the degradation rate of methomyl
in Fenton reaction. Contrarily, Romero et al. (2009) reported a higher
decomposition rate of hydrogen peroxides in the soil with higher SOM percent
in natural pH. The low stability constant of HA–Fe3+, 2.8, at circum-neutral pH
makes SOM a great metal chelate (Sherwood et al., 2014). This is significant
when compared to EDTA-Fe3+ stability constant of 27.7 (Lindsey et al., 2000).
Thus, the effect of the Fenton reaction on SOM and the effect of SOM on the
Fenton reaction need to be considered in the analysis of oxidation of
contaminants. However, insufficient information related to the effect of
oxidation on the physical and chemical properties of soil is available (Sedlak et
al., 1994; Sirguey et al., 2008). Among the reported results in this area, the
research of Leifeld et al. (2001) for the reaction of SOM with hydrogen peroxide
could be mentioned. Based on their experiment, the depletion of aliphatic
carbons in the reaction is less than the aromatic carbons.

69
In another study, Voelker et al. (1996) have studied the effect of different ligands
in the rate of Fenton reaction. They mentioned that carboxylate ligands, which
can be found in abundance in FA, could enhance the Fenton reaction rate.
Carboxylate ligands by making the complexes with Fe2+ that has the higher
reactivity potential in comparison with aqua complexes can increase the
oxidation rate. This effect was reported to be obvious at pH=5 whereas no
considerable changes at pH=3 were observed due to the increase in FA.
In the study by Goi et al. (2006) on determining the effect of peat on destruction
of transformer oil by hydrogen peroxide, they reported that the an optimum
H2O2 to transformer oil weight ratio of 4:1 in peat, which was high in organic
matter. Increasing the ratio from 1.6:1 to 4:1 increased the removal efficiency
from 22% to 47%, and increasing from 4:1 to 8:1 decreased the efficiency from
47% to 0%. Meanwhile, increasing the ratio from 0.04:1 in sand changed the
efficiency marginally from 82% to 87%.
Considering the changes in soil properties solely due to the reaction with
hydrogen peroxide was considered in the experiments carried out by Romero et
al. (2011). They reported the following results after treatment of the soil with
hydrogen peroxide without monitoring the pH in natural pH: reduction in
surface area, more hydrophilic regions created, no considerable changes in
organic carbon and carbon contents, and a small increase in SOM due to the
addition of oxygen. Reduction in desorption ability could be predicted as the
result of hydrophilic regions.
Effect of soil slurry volume, L/S: Watts et al. (1996) studied the effect of soil
slurry volume by keeping the hydrogen peroxide concentration at a constant

70
level in the values from 0.15 to 1.5 M, but applying different liquid volumes
from 1.5 to 5 ml per 5 g soil. The effectiveness of the reaction in view of the
amount of consumed hydrogen peroxide and the diesel removal efficiency has
been argued. The efficiency increased by increasing the liquid volume to a
maximum value at 3.5 ml whereas by increasing to more than 3.5 ml to achieve
the same diesel removal, higher hydrogen peroxide concentration was required
(Watts et al., 1999). The increase in the efficiency has been attributed to the
increase in the soil and liquid contact (Watts et al., 1999). In contrast, the
decrease in the effectivity of the reaction has been explained by the non-
effective contact between liquid and solid which meant that the produced
hydroxyl radicals were not in close contact to the sorbed contaminants (Watts et
al., 1996).
2.5.5 Combination of Fenton Reaction with Other Remediation Methods
As mentioned before, various in-situ remediation technologies such as soil
vapour extraction, thermal treatment, bio-venting, surfactant flushing, and
chemical oxidation using Fenton reagent, permanganate, and ozone have been
considered to remediate soils and aquifers contaminated with petroleum
hydrocarbons (Yu et al., 2007). Fenton reaction and other oxidation reactions
are among the most studied methods. Nonetheless, one or two studies have
reported unsuccessful results with regard to applying Fenton oxidation for
petroleum-contaminated soils. For example, Ferguson et al. (2004) studied the
application of several oxidative treatments (Fenton reagent, hydrogen peroxide,
and sodium hypochlorite) to remediate petroleum-contaminated soil at Old
Casey Station, East Antarctica. The results showed that the methods applied at
this site, where contamination occurred over a decade ago, did not significantly

71
reduce the petroleum hydrocarbon concentrations, and that this process could
hinder biodegradation through the destruction of subsurface microbial
communities.
To achieve complete or almost complete soil remediation, from one point of
view, we need to consider at least two major processes. First, the contaminants
should be desorbed from the soil matrix. This involves all desorption,
dissolution, and diffusion processes. Second, the process of destruction of the
desorbed or dissolved matters including oxidation occurs. The most reported
limiting factors in Fenton oxidation processes are related to the first step; in
other words, the contaminants bound to the soil are more resistant to the
oxidation than the soluble contaminants in the solution (Watts et al., 1996; Watts
et al., 2005; Yeh et al., 2008; Wu et al., 2013b). This problem is more prominent
for systems with low hydrogen peroxide concentration (Bogan et al., 2003/a). It
is also possible that direct oxidation of sorbed contaminants occur.
Combining the Fenton reaction and Fenton-like reactions with other remediation
methods have been studied widely (Bogan et al., 2003/a Ferguson et al., 2004;
Lundstedt et al., 2006; Lu et al., 2010/a). Combing different processes, which
focuses on different parts of the sorption-desorption processes, and the oxidation
process, could effectively improve the efficiency of the remediation process.
The combination of Fenton reaction with surfactants and solvents for increasing
the solubility (Isosaari et al., 2001; Bandala et al., 2008), and with
bioremediation process (Rivas et al., 2006; Lu et al., 2010/a) could be mentioned
as the examples.

72
In some reported studies, ET (Lundstedt et al., 2006) and EL (Yap et al., 2012/a)
are applied as co-solvents to increase the desorption rate. Lundstedt et al. (2006)
used an ET pre-treatment to enhance the depletion of all PAH in the soil by
facilitating their desorption from the soil matrix. However, some PAH,
especially anthracene, benzo[a]pyrene and perylene, were more extensively
depleted than other PAH with fewer or equal numbers of fused rings, indicating
that the hydroxyl radicals reacted faster with these PAH than with other kinds.
The ET present in the slurry also appeared to influence the relative reactivity of
the PAH.
In another study, Yap et al. (2012/a) examined the influence of EL-based Fenton
treatment for soils contaminated with PAH, and the remediation efficiency
achieved by this mixture was compared with ET/water mixture. It was reported
that EL/water system had a greater desorption capacity than ET/water system.
The efficiency of the treatment was mainly attributed to the enhanced solubility
and desorption. The positive laboratory results indicated the potential of this
technique, firstly, to treat soil with high contamination level and, secondly, to
destruct the contaminant mass in-situ, both of which were difficult to achieve
by conventional methods.
Vegetable oil has also been applied to increase the solubility of the contaminants
by Bogan et al. (2003/a). It was explained that vegetable oil could act like
synthetic chemical surfactants, and its effectivity increased by applying it as a
microemulsion of vegetable oils. The results showed an increase in the oxidation
rate of PAH (phenanthrene and pyrene). Whilst Fenton reaction was unable to

73
decrease the contaminant level significantly, especially for higher molecular
weight PAH, adding vegetable oil could remove them almost completely.
Increasing the solubility of HOC in organic solvents is not just because of their
higher dissolution rate in solvents than in water, but the desorption rate also
increases by dissolving SOM, which are the main adsorbents of HOC in solvents
(Gong et al., 2005/b). Table 2-7 compiles reported studies on application of
Fenton, Fenton-like and modified Fenton reactions for soil remediation. The
reported data in this table mostly is related to the organic pollutants and the
reagents used in the Fenton, modified Fenton, and Fenton-like and the removal
efficiency are summarized in the table to compare the efficiency with the
reagents percentages. The data in the table is also important to give a general
view of the studied contaminants in this area.
Table 2-7: Selected Fenton, Fenton-like and modified Fenton remediation studies
Fenton reaction
Pollutants Reagents Removal efficiency Reference
2,4-dimethylphenol H2O2/pollutant
weight ratios used
were 182 and 364
75% and 86% Romero et al., 2009
Trichloroethylene H2O2:Fe2+= 57.1:1,
54.9:1 90–100% Chen et al, 2001
2-methylnaphthalene, n-
hexdecane and diesel fuel
-
2-methylnaphthalene:
36%,
n-hexadecane:
12.5%, and diesel
fuel :14% at pH=7
Chen et al., 1998

74
Continued Table 2-7: Selected Fenton, Fenton-like and modified Fenton
remediation studies
Oil hydrocarbons Equivalent of utilized
H2O2=0.71 98.50% Yousefi et al.,2012
Perchloroethylene (PCE)
6.0 g soil and 6.0 ml
liquid after addition
of 1 ml of H2O2 (50,
150, 300, and 600
mM) and 1 ml of Fe
catalyst (0, 2, 5, and
10 mM)
In Warsaw soil: 44–
49% decrease in PCE
Kang et al. , 2006
Diesel fuel
H2O2/diesel/Fe2+
weight ratio:
0.03:1:0.005 and
0.06:1:0.01.
H2O2/Fe2+ =10:1
70% and 83% Goi et al.,2006
PAHs: naphthalene,
acenaphthylene,
acenaphthene, fluorene,
anthracene, pyrene,
benz[a]anthracene,
benzo[k]fluoanthene,
benzo[g,h,i]perylene,
fluoranthene
soil to liquid (S/L)
ratio of 1:3. 10 ml of
10mM iron sulphate
and 20 ml of 15%
hydrogen peroxide
PAHs with two and
three rings: 89 and
59% and PAHs with
four, five, and six
rings: between zero
and 38%
Jonsson et al., 2007
Benzo[a]pyrene H2O2=15M
iron(II)=6.6mM
BaP mineralization:
85% Watts et al., 2002
Phenanthrene and pyrene
4, 6
or 8mL of H2O2 50%
; 0.9, 1.3, 1.8mL of
FeSO4
Pyrene: 56.4%,
Phenanthrene: 93.8% Silva et al., 2009
Petroleum H2O2:Fe2+=0.5:1 to
50:1
up to 97% Millioli et al.,2003
TPH; BTEX; and
PAH H2O2: 50 ml and
FeSO4·7H2O: 5 ml
PAH: 96%,
BTEX:99%,
and some TPH
complete
disappearance
Ojinnaka et al.,2012
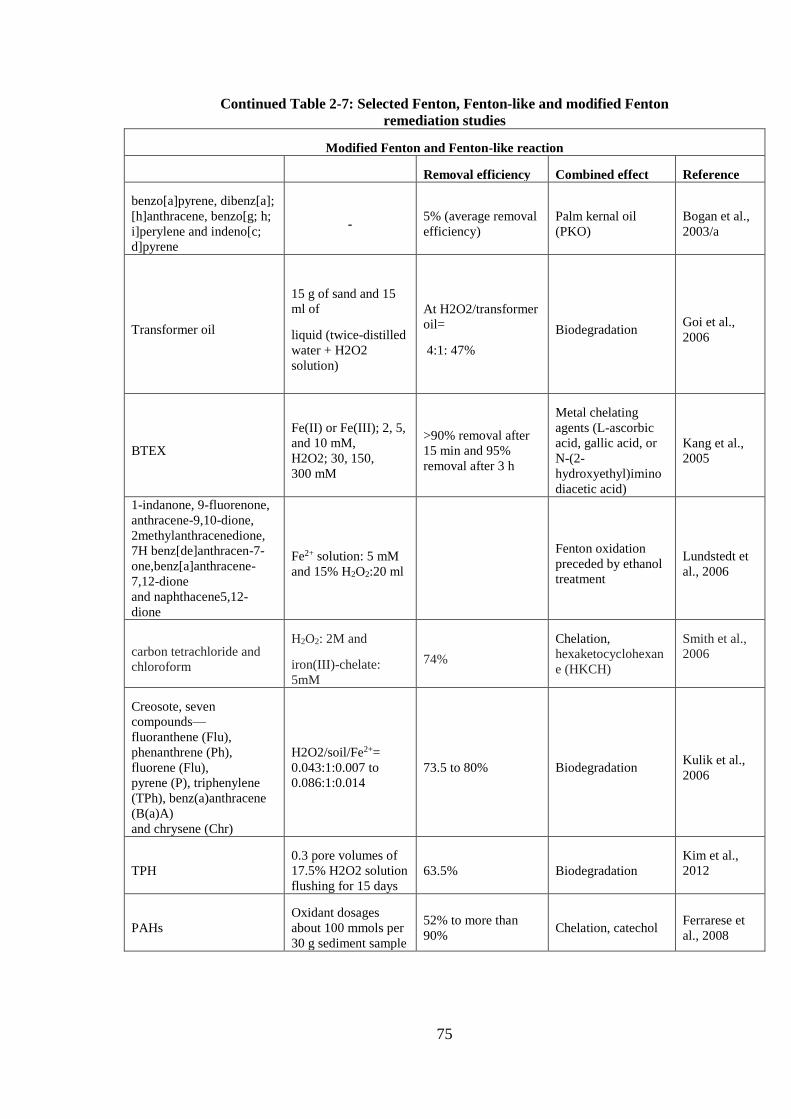
75
Continued Table 2-7: Selected Fenton, Fenton-like and modified Fenton
remediation studies
Modified Fenton and Fenton-like reaction
Removal efficiency Combined effect Reference
benzo[a]pyrene, dibenz[a];
[h]anthracene, benzo[g; h;
i]perylene and indeno[c;
d]pyrene
- 5% (average removal
efficiency)
Palm kernal oil
(PKO)
Bogan et al.,
2003/a
Transformer oil
15 g of sand and 15
ml of
liquid (twice-distilled
water + H2O2
solution)
At H2O2/transformer
oil=
4:1: 47%
Biodegradation Goi et al.,
2006
BTEX
Fe(II) or Fe(III); 2, 5,
and 10 mM,
H2O2; 30, 150,
300 mM
>90% removal after
15 min and 95%
removal after 3 h
Metal chelating
agents (L-ascorbic
acid, gallic acid, or
N-(2-
hydroxyethyl)imino
diacetic acid)
Kang et al.,
2005
1-indanone, 9-fluorenone,
anthracene-9,10-dione,
2methylanthracenedione,
7H benz[de]anthracen-7-
one,benz[a]anthracene-
7,12-dione
and naphthacene5,12-
dione
Fe2+ solution: 5 mM
and 15% H2O2:20 ml
Fenton oxidation
preceded by ethanol
treatment
Lundstedt et
al., 2006
carbon tetrachloride and
chloroform
H2O2: 2M and
iron(III)-chelate:
5mM
74%
Chelation,
hexaketocyclohexan
e (HKCH)
Smith et al.,
2006
Creosote, seven
compounds—
fluoranthene (Flu),
phenanthrene (Ph),
fluorene (Flu),
pyrene (P), triphenylene
(TPh), benz(a)anthracene
(B(a)A)
and chrysene (Chr)
H2O2/soil/Fe2+=
0.043:1:0.007 to
0.086:1:0.014
73.5 to 80% Biodegradation Kulik et al.,
2006
TPH
0.3 pore volumes of
17.5% H2O2 solution
flushing for 15 days
63.5% Biodegradation
Kim et al.,
2012
PAHs
Oxidant dosages
about 100 mmols per
30 g sediment sample
52% to more than
90% Chelation, catechol
Ferrarese et
al., 2008

76
Continued Table 2-7: Selected Fenton, Fenton-like and modified Fenton
remediation studies
Petroleum accumulative H2O2
dosage: 2.45 mol/ kg
Reduce from 14,800
to 2300mgkg−1
Ferric ion chelated
with EDTA
Lu et al.,
2010/b
2,4-dimethylphenol
H2O2/KH2PO4:5:1
and 40:1,
an initial H2O2: 0.29
and 0.58 M
90% of 2,4-DMP for
50 mM of EDTA and
90% for 50 mM of
CITRt
Natural Fe species
present in soil, and
chelating agents
(EDTA,
sodium citrate 2-
hydrate (CITRt)
Vicente et al.,
2011
Petroleum-contaminated
Optimum molar ratio
of H2O2 and Fe3+:
300/1
Decrease from
32,400 to 21,800 mg
kg_1 soil,
Combining Fenton-
like pretreatment
with biodegradation
Lu et al.,
2010/a
Fenton-like reaction
Pollutants Reagents Removal efficiency
Different variables
from Fenton
reaction
Reference
Trichloroethylene 71.6% Natural silica sand Yeh et
al.,2003
Benzo[a]pyrene (BaP)
H2O2:15M and
iron(II)
concentration:6.6mM
Complete within 24 h
and 85%
mineralization
High H2O2
concentration
Watts et al.,
2002
TPH Fe(0): 1 and 2 g and
H2O2:250 mg/l More than 90%
Zero-valent iron
[Fe(0)]
Oh et al.,
2014
Petroleum hydrocarbons
(e.g., fuel oil and diesel)
H2O2:15% and
BOF slag:100 g/ kg
Fuel oil: 76%,
Diesel:96%
Waste basic oxygen
furnace slag (BOF
slag)
Tsai et al.,
2009
Diesel H2O2:1.5 M 99% Iron 3 perchlorate,
and Iron 3 nitrate
Watts et
al.,1996
Diesel and/or kerosene
H202: (0, 1, 7, 15,
and 35wt%) and iron
mineral contents (0,
1, 5 and l0wt%).
10% magnetite:
C/C0=40%
15%
H2o2:C/C0=50%
Naturally-occurring
iron minerals,
goethite and
magnetite,
Kong et al.,
1998
oil hydrocarbons Oxidant:Fe/ H2O2
molar ratio: 10/1
Approximately 70–
80%
Magnetite catalyzed
Fenton-like
oxidation
Usman et al.,
2012
Diesel Fe3+:720 mg/l Injection test: 30%
diesel removal
Ferrous salts
application
Xu et al.,
2006

77
2.5.6 Fenton Reaction with NAPL and Sorbed Phase
The main problem in degradation of contaminants in soil is with the ones
existing in the sorbed and NAPL forms (Watts et al., 1996; Watts et al., 2005).
The water-soluble forms could be effectively decreased by Fenton reaction as
the hydroxyl radicals mainly react with dissolved species much faster than with
the organic matters in NAPL or sorbed forms. The reason is that for reacting
with the sorbed and NAPL forms, the hydroxyl radicals have to cross the two
phase interfaces, liquid-solid and liquid-liquid (aqueous-NAPL), that pose mass
transfer limitations (Sedlak et al., 1994; Watts et al., 1996; Watts et al., 2005).
Yeh et al., (2006) showed that the high hydrogen peroxide concentration could
directly oxidise the sorbed and particulate phases of hexachlorobenzene. This
conclusion was drawn based on the comparison of the dissolution rate of
hexachlorobenzene and Fenton reaction rate. Degradation of NAPL by high
hydroxyl concentartion has also been reported (Watts et al., 1994; Watts, 2005;
Yeh et al., 2008). Yeh et al. (2008) evaluated Fenton-like reaction of five
chlorinated ethylenes and three aromatic hydrocarbons using goethite as the
catalyst. The reaction efficiencies and rate constants of these compounds in
NAPL and dissolved forms were compared. According to the results, the
removal efficiencies of 0.02 mmol NAPL-formed contaminants were 26-70%
less than the dissolved form of these contaminants in water. The measured rate
constants were in the order of 109M−1s−1 for dissolved chlorinated ethylenes
and aromatic hydrocarbons, and the rate constant were 25-60% less for their
NAPL forms. However, the NAPL form of petroleum hydrocarbons could also
be effectively oxidized by Fenton-like process. These results strongly indicated

78
that in addition to the dissolution and reaction mechanisms, direct interaction
between Fenton radicals and NAPL is also possible.
The produced radicals, hydroperoxide radicals (HO20), superoxide anions (O2
0−),
and hydroperoxide anions (HO2−), through the use of high concentration
hydrogen peroxide has been reported to be capable of increasing the oxidation
of sorbed contaminants (Watts et al., 1996; Ferrarese et al., 2008). These
radicals are known as the only radicals that participate in the DNAPL
destruction of carbon tetrachloride (Watts et al., 2005). Watts et al. (1994)
studied the Fenton-like oxidation of hexachlorobenzene in silica sand and
natural soil, and reported that the aggressive Fenton-like reaction conditions in
high hydrogen peroxide concentration by perhydroxyl radicals could alter the
hexachlorobenzene sorption characteristics and increase its desorption rate, as
well as promote the desorption of hydrophilic organic compounds from solid
surfaces.
2.5.7 The Effects of Fenton Reaction on Aliphatic and Aromatic
Reduction
The reaction of hydroxyl radical with alkenes and aromatics with reported
second-order rate constants of 109 − 1010 M−1S−1is considered as a fast
reaction (Lindsey et al., 2000). Some studies have compared the oxidation of
the aliphatic compounds with aromatic compounds or TPH totally. The greater
resistance of alkanes towards oxidation has been mostly reported along with the
greater reduction of aromatic TPH in the treatment of unleaded gasoline as
compared to the aliphatic fraction (Watts et al., 2000; Leifeld et al., 2001; Lee
et al., 2002; Mater et al., 2006,). For example, in Mater et al. (2006)’s work, the

79
lesser consumption of iron and H2O2 for the oxidation of the aromatic
compounds than the oxidation of the aliphatic compounds were reported.
Watts et al. (2000) reported greater than 95% recovery of benzene, toluene and
mixed xylene (BTX) at near-neutral pH using 2.5% H2O2 and 12.5 mM Fe3+,
while only 37% nonane, 7% decane, and 1% dodecane oxidation was achieved
under the same conditions. In another study, Lee et al. (2002) compared the
removal efficiency of normal alkanes with the removal efficiency of diesel by
using ozone oxidation. The efficiency and the rate of alkanes removal were
lower than that of the diesel removal. The low removal efficiency of diesel
(40%) was attributed to the normal alkanes in diesel that were considered as a
major part of diesel. Inconsiderable differences between the aromatic and
aliphatic reduction results have also been reported in another study (Ojinnaka et
al., 2012). Leifeld et al. (2001) studied the effect of H2O2 treatment, hydrogen
peroxide 15% followed by hydrogen peroxide 30%, on soil < 20μm on removal
of organic carbon. The results showed that the alkyl C had a higher resistance
to peroxide oxidation in comparison with O-alkyl C and aromatic C.
2.6 Soil Column
Soil columns have been used for over three centuries in the study of
hydrogeological properties. In the dynamic column procedure, a fixed amount
of soil is eluted by a fluid flowed by gravity (Lewis et al., 2010; Reemtsma et
al., 1997). Column experiments make it possible to study some specific soil
physical, chemical, and hydrodynamic properties that are required for
understanding and determining the time dependent release of contaminants, and
modelling the contaminants transport and fate in the soil whereby most of them

80
cannot be achieved through batch tests. The ability of the column set-ups to
stipulate the field condition by flowing the fluid through the column represents
a good opportunity for modelling the fate and transport of the contaminants in
the real situations. The determinative effects in migration of contaminants,
hydrodynamic effects (such as dispersion, colloidal transport, low liquid to solid
ratio, chemical heterogeneities), which cannot be examined in batch tests, and
chemical phenomena (like multiple species, reversibility, etc.) can be studied in
column set-ups (Weber et al., 1996; Reemtsma et al., 1997; EPA 402-R-99-
004A, 1999; Kalbe et al., 2007; Lewis et al., 2010).
Soil columns may be classified either according to their level of saturation,
saturated or unsaturated, or according to the method of their construction,
packed columns or monolithic columns (Lewis et al., 2010). Packed soil
columns result in a better reproducibility while monolithic columns use
undisturbed samples that would lead to results that can represent the field
conditions better, but with less reproducibility (Lewis et al., 2010). The effects
of variables such as bulk density and scaling effects on dispersivity are required
to be evaluated appropriately for using the experiments results (Lewis et al.,
2010). Achieving reproducible results, between different laboratories and even
different columns, is one of the major advantages of column set-ups. For
comparing the results from different columns with different dimensions, contact
time can be calculated from the flow rate and bulk density (Kalbe et al., 2007).
Comparing the results of batch and column experiments has been the aim of
many researchers. Some contaminants such as anions give the same
81
concentration results, and some such as HOC lead to different results in batch
and column experiments (Kalbe et al., 2007; Grathwohl et al., 2009).
The involved processes in desorption of the contaminants have been given as
the reason behind these discrepancies. Based on the explanation of Kalbe et al.
(2007), when the responsible processes for desorption are solubility and
availability of the contaminants, as for anions such as sulphate and chloride,
column and batch experiments provide the same cumulative concentration.
When adsorption/desorption processes play the dominant role, like leaching of
PAH, differences in batch and column experiments will be observed (Grathwohl
et al, 2009). Kalbe et al. (2007) reported that this difference is decreasing by
increasing the molecular weight of the PAH.
The other sources of differences between column and batch experiments are the
contact of the soil with the same liquid during the batch experiment, and
renewing the liquid through the column experiments (Delay et al., 2007). In
column tests, at the start of the experiment, the effluent concentration is at the
equilibrium condition, for strongly adsorbed contaminants, this state will exist
for a longer time (Grathwohl et al., 2009). By extending the time of the
experiment, the effluent concentration will decrease and the non-equilibrium
condition will be observed (Grathwohl et al., 2009). This change can be
recognised by a sudden drop in the concentration followed by the tailing in the
effluent concentration (Grathwohl et al., 2009).
For comparing the non-equilibrium conditions (the prominent case in column
experiments), which are to be expressed in time, and the equilibrium conditions
(the final conditions in batch experiments), a variable applicable in both

82
conditions is required. The ratio of the liquid to solid, L/S, is used for comparing
the results between these two set-ups (Al-Abed et al., 2008). At fixed flow rate,
the L/S is proportional to the contact time. Grathwohl et al. (2009) who studied
the modelling of aqueous leaching in a column percolating test showed that the
curve of concentration against L/S is a good approach for comparing the batch
and column percolation. In applying this variable (L/S), a caution about the time
when the tailing appears is necessary. After tailing appears, the results in
different columns versus L/S will not be similar (Grathwohl et al., 2009). The
contaminants release kinetic, grain size, and flow velocity will affect the time
when the equilibrium condition will change to the non-equilibrium in column
experiments (Grathwohl et al., 2009).
The problem associated with this variable is that batch experiments in
equilibrium conditions are supposed to have the same results in all L/S, but this
is not usually observed (Reemtsma et al., 1997). Therefore, another way for
comparing the results of these two designs, batch and column experiments, have
been proposed by Delay et al. (2007). They suggested calculating the
concentration by achieving the total percolated amount in the elution agent.
Reemtsma et al. (1997) reported that the short-term column experiments could
be representative of the spontaneously desorbed part of PAH, and not the
diffusing part. The observation of Grathwohl et al. (2009) related to the
comparable results of batch and column tests for strongly adsorbed compounds
or at very early times might be explained by this. Therefore, batch and column
set-ups can each be designed in a way that each of them represents different
transport mechanism, advection, or diffusivity.

83
2.7 Concluding Remarks
Due to the limitation of conventional Fenton reaction, research on modified
Fenton reaction combined with different methods are being developed
considerably for treatment of petroleum hydrocarbons-contaminated soil.
Combination of conventional Fenton reaction with a solvent has shown
promising results in a number of soil remediation studies. One of the major
concerns regarding the application of a solvent in soil remediation is how it
affects the soil. Therefore, the application of an environmentally friendly solvent
will resolve this issue and represents further development in this area. Whilst
there are numerous studies on petroleum hydrocarbons contaminated soil, based
on the author’s best knowledge, research on the aliphatic fraction of petroleum
hydrocarbons with the applied green solvent in this study, EL, has not been
considered. The response of aliphatic fraction of petroleum hydrocarbons to the
combination of a biodegradable solvent, such as EL, with Fenton reaction is
important in making decisions in finding an applicable process for contaminated
soil treatment. Examining the effects of different variables, especially HA, on
Fenton reaction is also equally important in determining optimum conditions for
remediation.

84
CHAPTER 3: MATERIALS AND METHODS
3.1 Introduction
As the analytical methods applied in any research represent an essential
prerequisite to successful data collection and analysis, they need to be adhered
to carefully. This chapter summarizes all the materials, tools and analytical
techniques used in this study. These methods include the ones used for soil
spiking and soil characterization, H2O2 concentration, quantification of the
amount of diesel in soil, GC analysis and quantification. The methods are
adopted from standards established by agencies such as US EPA and other
related published works.
3.2 Reagents and Chemicals
N-hexane (98.0%, for gas chromatography ECD & FID), EL (99.0% for
analysis), and silica gel 60 (0.063-0.200 mm) were supplied from Merck. R&M
chemicals supplied dichloromethane (DCM 99.5%, analytical reagent), iron (II)
sulphate heptahydrate (FeSO4.7H2O), H2O2 (30%), potassium iodide solution
(KI2, 99.0%), ammonium molybdate tetrahydrate ([NH4]6 Mo7O24•4H2O),
sodium thiosulfate solution (Na2S2O3), and starch solution (10.00 g/l) (soluble).
Diesel was supplied form Shell gas station, Semenyih. HCl (37%), mercury (II)
chloride (HgCl2, >99%) and H2SO4 (95%-97%) were supplied by Sigma
Aldrich. Silica gel for column chromatography was pre-heated up to 160°C
before usage and sodium sulphate was activated by heating up in a furnace at
85
420°C. Standards n-nonane (C9, 99.5%), n-docosane (C22, 99.5%), and n-
octacosane (C28, 99.5%) were supplied by Dr Ehrenstofer GmH Germany, and
n-hexadecane (C16, 99.5%) from Merck. To prepare the standards for
calibration, they were dissolved in different concentrations in n-hexane.
3.3 Soil Collection, Characterization and Spiking
3.3.1 Soil collection
Surface soil samples (0-10 cm) were collected in December 2014 from a forest
located in Cameron Highlands, Malaysia. The soil sample was air-dried at
ambient temperature (25-28oC) for 2 days. Fibrous materials were removed.
After drying, the soil was passed through a 2 mm sieve and was stored at
ambient temperature (25-28oC).
For soil spiking, the predetermined amount of diesel and soil were calculated to
give three initial contamination levels of 3500 mg/kg, 5000 mg/kg, and 10000
mg/kg. The determined amount of diesel was dissolved into n-hexane solvent to
enable faster dissolution and penetration into the soil samples. Then, the diesel
dissolved in n-hexane was mixed with the appropriate amount of soil. After
mixing, the solvent was evaporated under the fume hood, and the soil was kept
in closed containers before usage.
3.3.2 Soil characterization
There are a few of characteristics related to soil that are usually reported in
papers and studied attributed to the soil remediation processes as they are
capable of affecting the results and also for the sake of comparison with the
results of different studies.

86
3.3.2.1 Iron Content
The environmental available native Fe is of importance because it can act as a
catalyst in Fenton reaction and also can play as an oxidant scavenger, it also can
be the reason of clay swelling due to the redox reactions (Yap, 2012/b). Iron
content was determined following the US EPA Method 3050B, which is based
on digestion by nitric acid (HNO3, 65%, Merck, Germany) and then
quantification by atomic absorption spectrometry (AAS). The procedure was
as follows: 2.00 g of soil (wet weight) was transferred to a digestion vessel. 10
ml of 1:1 HNO3:water was added to the soil, and the vessel was covered with a
watch glass. The slurry was heated to 95ºC ± 5ºC and refluxed for 10 to 15 min
without boiling. After cooling the sample, 5 mL of concentrated HNO3 was
added. The vessel was covered and heated for 30 min. No generation of brown
fume indicated complete sample oxidation by HNO3.
By heating the solution at 95ºC ± 5ºC without boiling for 2 h and removing the
watch glass, the volume of the solution was reduced to approximately 5 mL.
After cooling the slurry, 2 mL of water and 3 mL of 30% H2O2 (30% R&M)
were added to the solution. The vessel was covered and warmed up to accelerate
the reaction of H2O2 until the effervescence subsided. After cooling the vessel,
30% H2O2 in 1-mL aliquots was added until the effervescence was minimal.
The solution volume was reduced to 5mL by heating at 95ºC ± 5ºC without
boiling for 2 h.
By adding 10 mL HCl to the sample and heating at 95ºC ± 5ºC for 15 min, the
sample was ready for AAS analysis (Perkin-Elmer Analyst 400). The digestate
was passed through a Whatman No. 41 filter paper, the filtrate was collected in

87
a 100-mL volumetric flask, and by adding deionized water until the volume
reached 100 mL. By preparing and using the 5-point calibration curve (1, 2, 5,
10 and 100 ppm), the concentration of the sample solution was determined.
3.3.2.2 Soil Moisture
Soil moisture is also measured because it can affect the Soxhlet extraction. The
moisture of the air-dried soil was measured by the oven method. In summary,
1.000 g of the moist soil was put in the oven at 105°C for 24 h. The weight loss
in this process was measured and the moisture content was calculated by Eq. (3-
1):
Moisture (W
W%) =
Wt2 − Wt3
Wt3 − Wt1
× 100 Eq. (3 − 1)
Where Wt1 is the weigh of the container [M], Wt2denotes the weight of moist
soil and the container [M], Wt3 is the weight of dried soil and the container [M]
3.3.2.3 Soil Texture
The texture of soil can be determinative in the composition and physical
properties of the soil like the porosity, so it can be determinative in the
sorption/desorption processes. As the clay is one of the most important
adsorbents of pollutants in soil, its percentage needs to be calculated. The
percentage of sand, silt and clay in the inorganic fraction of soil was measured
by the hydrometer method. The method uses Stoke’s Law in calculating the rate
of sedimentation of particles. As the soil used in this project had more than 5%
organic matter, the amount of organic matter was firstly reduced by reaction
with H2O2.

88
50 g of fine-textured material with 50 g of water were added to a 1 L beaker. 50
ml of H2O2 was slowly added to the mixture. After stirring the mixture, the
beaker was covered and set aside for 24 h. Then, 10 mL of H2O2 was added to
the suspension and heated up to 80°C until no foams appeared. After cooling,
400 mL water was added to the beaker. By heating up the suspension for 2 h,
the remaining H2O2 was removed.
Once the sample reached ambient temperature, 100 mL of 5% dispersing
solution, sodium hexametaphosphate, was added to the suspension.
Subsequently, the suspension was mixed for 1-2 min, and was transferred to a
1000 mL cylinder. The cylinder was filled up to 1000 mL. After mixing the
suspension thoroughly, a thermometer and a hydrometer were inserted into the
cylinder. The hydrometer was read at 40 s, 52 min and 6 h. The suspension was
transferred to a 0.063 mm sieve, and after drying the sand, its weight was
recorded.
3.3.2.4 SOM Content
Organic matters in soil is the factor that can affect the Fenton reaction efficiency
directly. SOM was determined by two methods, weight loss on ignition (LOI),
and thermogravimetric analysis (TGA).
SOM by LOI
The weight LOI method was conducted as follows: a 50 mL beaker was weighed
and 5 cm3 of air-dried, 2-mm sieved soil was scooped into the beaker. The soil
was dried for 2 h at 150°C ±5°C. The soil and beaker were weighed after the
temperature reduced to 100°C. Then, the soil was heated to 550±5°C for 24 h.

89
The beaker and soil were weighed after the temperature reduced to 105°C. The
reported LOI% as percent organic matter was calculated based on the Eq. (3-2):
Percent weight loss on ignition LOI% =Soild − Soila
Soild× 100 Eq. (3 − 2)
Where:
Dried Soil (Soild) = (weight of the beaker + weight of soil at 150°C) - Weight
of the beaker
Ashed Soil (Soila) = (weight of the beaker + weight of soil at 550°C) - Weight
of the beaker
SOM by TGA
In another method, the SOM content in the soils was determined by TGA using
METTLER thermogravimetric analyser, DSC1, Switzerland. 17.1717 mg of the
sample was heated from 150°C to 550°C at a rate of 20 °C/min under the flow
of oxygen with a flow rate of 20 mL/min. The sample was then heated at 550°C
for 2 h. The mass loss within the interval from 150°C to 550°C from the
thermogravimetric curve was determined based on the applied method by
Romero et al. (2009) which was considered to be the organic carbon content of
soil.
3.3.3 Extraction of humic acid
15.00 g of soil material were stirred in 100 ml of 0.1 M NaOH for 24 h. The
slurry was centrifuged at 5500 rpm for 25 min. The supernatants from this
extraction contained the HA and FA fractions, and the residue contained the
humin. The supernatant was acidified by 6 M HCl to pH ≤ 2. The suspension
was left to stand for 16 h, and then was centrifuged at 5500 rpm for 25 min. The

90
precipitated part contained the HA. The HA fraction was dissolved by adding
0.1 M KOH with periodic shaking for 2 h. The purpose of this step was to
remove fine mineral particles such as clay silicates. The HA was re-precipitated
by adding 6 M HCl and acidifying to pH ≈1 allowing the suspension to settle
for 16 h. HA was separated by centrifuging at 5500 rpm for 25 min. HA was
frieze-dried for 16 h and finely ground prior to Fourier-Transform Infrared
Spectroscopy (FT-IR) (Perkin-Elmer, FTIR/FIR spectrometer, Frontier, USA)
analysis.
3.4 Analytical Methods
3.4.1 TPH extraction
The diesel in the soil was extracted by Soxhlet extractor (Gerhardt,
SOXTHERM®, Germany), one beaker in the extractor is represented in figure
3-1.
Figure 3-1: A beaker of the used Soxhlet extractor

91
Before extraction using an extraction thimble (Advantec, ID (84) 33 mm × 80
mm, Japan), the soil was mixed with activated sodium sulphate at a ratio of 2:1
(w/w) soil:sodium sulphate, (10 g sodium sulphate for 5 g soil) to remove the
remaining water. The extraction solvent used was DCM with Soxhlet extraction
conditions of 2.15 h hot extraction and 1 h extraction with 9 evaporating
intervals in 2 evaporating steps. The solvent of the extract was exchanged to
hexane before purification and separating the aliphatic fraction of the TPH, i.e.
diesel range, by silica gel column chromatography prior to running GC analysis.
3.4.2 Column chromatography
For preparation of the samples before injection into the GC, the soil extract was
fractionated to separate the aliphatic phase, which was the main concern in this
study, by column chromatography. 5 g of silica gel, plus 1 g of sodium sulphate
on top of silica gel comprised the chromatography column. Columns were firstly
conditioned by adding 25 mL of n-hexane. Then, the extract was added and
eluted by 20 mL of n-hexane; this process resulted in the separation of the
aliphatic fraction. The solvent of the separated aliphatic fraction was evaporated
until the volume was less than 2 mL. For analysis, TPH were divided into three
fractions. Figure 3-2 shows the column used for chromatography.
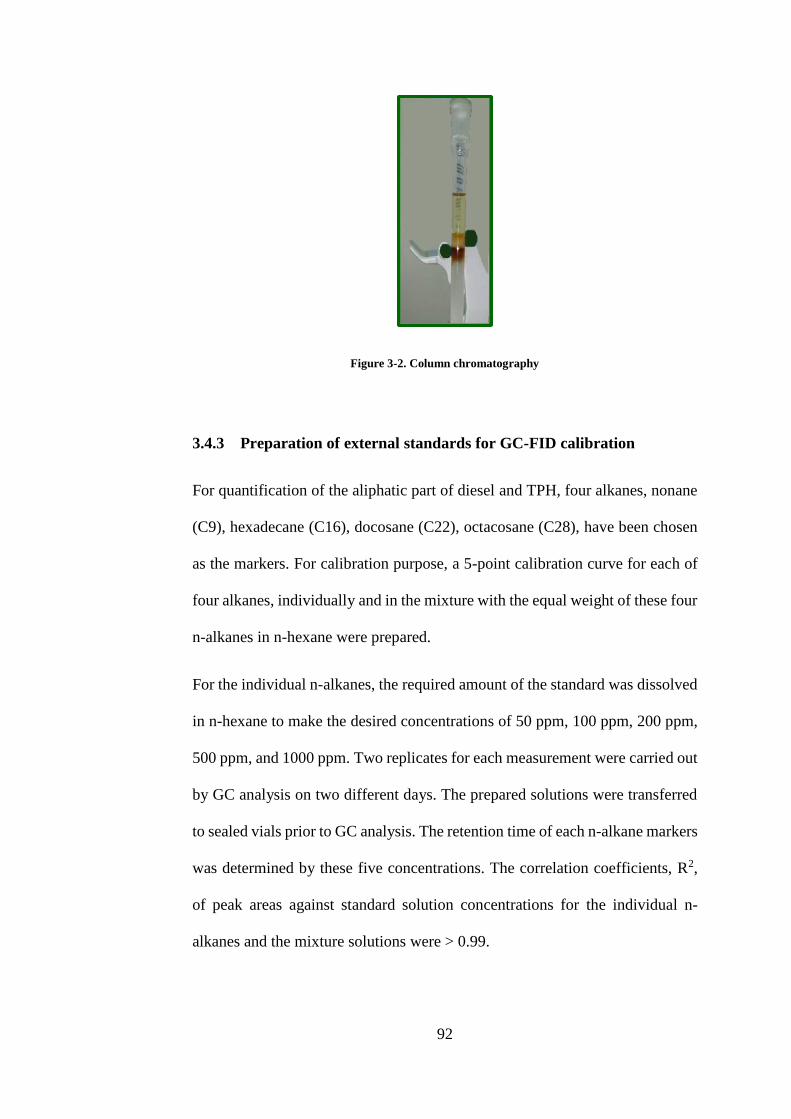
92
Figure 3-2. Column chromatography
3.4.3 Preparation of external standards for GC-FID calibration
For quantification of the aliphatic part of diesel and TPH, four alkanes, nonane
(C9), hexadecane (C16), docosane (C22), octacosane (C28), have been chosen
as the markers. For calibration purpose, a 5-point calibration curve for each of
four alkanes, individually and in the mixture with the equal weight of these four
n-alkanes in n-hexane were prepared.
For the individual n-alkanes, the required amount of the standard was dissolved
in n-hexane to make the desired concentrations of 50 ppm, 100 ppm, 200 ppm,
500 ppm, and 1000 ppm. Two replicates for each measurement were carried out
by GC analysis on two different days. The prepared solutions were transferred
to sealed vials prior to GC analysis. The retention time of each n-alkane markers
was determined by these five concentrations. The correlation coefficients, R2,
of peak areas against standard solution concentrations for the individual n-
alkanes and the mixture solutions were > 0.99.

93
To analyse the results, all peaks between C9-C28 were divided into three
fractions of C9-C16, C16-C22, and C22-C28. Fraction 1 included all peaks
within C9-C16 range plus half of C16 peak and the peak of C9. For fraction 2,
C16-C22, all peaks between C16-C22 range plus half of C16 peak and half of
C22 peak were considered. Finally, fraction 3 comprised all peaks between C22-
C28 plus half of C22 peak and peak of C28. The aliphatic groups included
alkanes, alkenes, and cycloalkanes. The reported peaks could possibly include
Fenton reaction products as reported by Yu et al. (2007). The TPH was the
summation of all peaks settling into the aliphatic part of diesel between C9 to
C28.
3.4.4 GC Analysis
For determining the concentration of TPH, GC has been used. GC is a technique
to separate semi-volatile compounds like TPH. The TPH concentration was
measured by a GC (Perkin-Elmer, model Clarus 680, Beacons Field, UK)
equipped with a flame ionisation detector (GC-FID), using an Agilent DB-TPH
capillary column (30m × 0.25 mm × 0.25 μm). The injected volume into the GC
was 1 μL. The oven temperature program was as follows: the initial temperature
was held at 35°C for 2 min, and then was increased to 300°C with a rate of
15°C/min, and the temperature was held at 300°C for 2 min. The injector
temperature was set at 310°C. Helium was used as a carrier gas with its pressure
set at 14 psi. The detector temperature was set at 315°C. The GC conditions are
summarised in Table 3-1.

94
Table 3-1: GC-FID (Perkin-Elmer, model Clarus 680, Beacons Field, UK)
analytical conditions
Column 30m × 0.25 mm × 0.25 μm , Agilent DB-TPH capillary column
Sampler 1 µL injection, autosamler
Injection port temperature 310°C
Detector temperature 315°C
Oven temperature program 35°C for 2 min 15°C.min-1 to 300°C , holding for 2 min
Carrier gas Helium
Total run time 21 min
TPH concentrations are defined as the sum of all peaks detected on gas
chromatograms in the given retention time. Thus, an estimate of TPH includes
not only various diesel components such as normal-, iso, cyclo-alkanes and
aromatics, but also potential degradation products from oxidation reactions as
long as they are detectable under the GC conditions used (Yu, 2007).
The identity of each marker was determined by comparison with the retention
time of each n-alkane. For each alkane, the retention time window was defined
as the absolute retention times plus or minus three times the standard deviation.
A retention time window was also considered for extractable petroleum
hydrocarbons between the markers. In this project, the aliphatic hydrocarbons
were divided into three parts, between the four markers of C9 (n-nonane), C16
(n-hexadecane), C22 (n-docosane), and C28 (n-octacosane), as listed in Table
3-2.

95
Table 3-2: n-Alkane markers
Hydrocarbon Range Beginning Marker Ending Marker
C9-C16 Aliphatic Hydrocarbons Apex of n-Nonane Apex of n-Hexadecane
C16-C22 Aliphatic Hydrocarbons Apex of n-Hexadecane Apex of n-Docosane
C22-C28 Aliphatic Hydrocarbons Apex of n-Docosane Apex of n-octacosane
The n-alkane markers on the chromatogram of a diesel sample after passing a
silica chromatography column are shown by arrows on Figure 3-1.
Figure 3-1: n-Alkane markers on the mixture chromatogram
For calculation of the concentration in the sample, a response factor (RF) for
each hydrocarbon standard alkanes (nC9, nC16, nC22, nC28) within each of the
5-point calibration curve was calculated by Eq. (3-3). Then RFave would be
achieved by Eq. (3-4).
𝑅𝐹 =𝐴𝑛−𝑎𝑙𝑘𝑎𝑛𝑒
𝐶𝑛−𝑎𝑙𝑘𝑎𝑛𝑒 Eq. (3 − 3)
C16 C22
C28 C9

96
Where:
𝐴𝑛−𝑎𝑙𝑘𝑎𝑛𝑒 is the area under the individual n-alkane peak, and 𝐶𝑛−𝑎𝑙𝑘𝑎𝑛𝑒 denotes the
concentration of the individual n-alkane standard
𝑅𝐹𝑎𝑣𝑒 =𝑠𝑢𝑚 𝑜𝑓 𝑖𝑛𝑑𝑖𝑣𝑖𝑑𝑢𝑎𝑙 𝑅𝐹 𝑣𝑎𝑙𝑢𝑒𝑠
𝑛𝑢𝑚𝑏𝑒𝑟 𝑜𝑓 𝑅𝐹 𝑣𝑎𝑙𝑢𝑒𝑠 𝑢𝑠𝑒𝑑 Eq. (3 − 4)
The concentration of extractable petroleum hydrocarbons in the sample was
calculated based on Eq.s (3-5), (3-6), and (3-7), as described in the reference
method in the Canada wide standard for petroleum hydrocarbons (CCME).
𝐶9 − 𝐶16 ℎ𝑦𝑑𝑟𝑜𝑐𝑎𝑟𝑏𝑜𝑛𝑠 (𝑚𝑔
𝑘𝑔) =
𝐴𝐶9−𝐶16 × 𝑉𝑜𝑙
𝑅𝐹𝑎𝑣𝑒 × 𝑊𝑑
Eq. (3 − 5)
𝐶16 − 𝐶22 ℎ𝑦𝑑𝑟𝑜𝑐𝑎𝑟𝑏𝑜𝑛𝑠 (𝑚𝑔
𝑘𝑔) =
𝐴𝐶16−𝐶22 × 𝑉𝑜𝑙
𝑅𝐹𝑎𝑣𝑒 × 𝑊𝑑
Eq. (3 − 6)
𝐶22 − 𝐶28 ℎ𝑦𝑑𝑟𝑜𝑐𝑎𝑟𝑏𝑜𝑛𝑠 (𝑚𝑔
𝑘𝑔) =
𝐴𝐶22−𝐶28 × 𝑉𝑜𝑙
𝑅𝐹𝑎𝑣𝑒 × 𝑊𝑠
Eq. (3 − 7)
Where 𝐴𝐶9−𝐶16 is the integration of all area counts from the apex of the C9 peak
to the apex of the nC16 peak, 𝐴𝐶16−𝐶22 denotes the integration of all area counts
from the apex of the C16 peak to the apex of the nC22 peak, 𝐴𝐶22−𝐶28 shows
the integration of all area counts from the apex of the C22 peak to the apex of
the nC28 peak, 𝑉𝑜𝑙 is final volume of the sample extract (mL), RFave is the
average response factor, Ws is weight of sample taken (g).
3.4.5 H2O2 concentration assay
The H2O2 concentration was quantified by iodometric titration (Yap, 2012/b).
Briefly, 3.00 g of sample was added to 200 ml of distilled water, and then 20.00
ml of potassium iodide solution and 25.00 ml of the acid mixture, were added
in a 500 mL Erlenmeyer flask. The acid mixture was prepared by adding 0.18 g
of ammonium molybdate tetrahydrate in 750 ml distilled water, then the
addition of 300 ml of H2SO4. The sample in the Erlenmeyer flask was then

97
mixed and left to stand for 5 min. The mixture was titrated with standardized
0.1 N sodium thiosulfate solution until the brown triiodide colour changed to a
light straw colour. A few drops of starch solution were added which changed
the solution colour to blue and the titration was continued until the solution
colour changed from blue to colourless. A blank sample was also passed through
all the described steps above. H2O2 in the sample was calculated by Eq. (3-3).
Hydrogen eroxide % ww⁄ =
(A−B)(0.1N)(1.7007)
sample weight Eq. (3-3)
Where A denotes titration volume for sample [L3], B is titration volume for
blank [L3], and N is normality of Na2S2O3. The results were reported as residue
of H2O2, as shown in Eq. (3-4):
C
C0=
H2O2 concentration at time t (% W/W)
H2O2 concentration at time 0 (% W/W) Eq. (3-4)
3.5 Fourier-transform infrared spectroscopy
Fourier-transform infrared spectroscopy was performed to determine the
functional groups in samples and analyses were performed to compare the
functional groups in the HA extracted, soil, and the separated part of soil treated
with EL. The separated fraction of treated soil is the collected part of EL treated
soil that was on top of the soil sample after contact with EL for 2 h. Infrared
spectra were recorded in frequency ranges in a wave number range of 4000 to
400 cm−1 by a FT-IR. The required amount of the sample was pulverized and
located on the detector part.

98
3.6 Desorption experiments methodology
3.6.1 Extraction solvent tests
Choosing the best solvent is the first step and is considered as a preliminary step
in sorption/desorption and Fenton experiments. Three commonly used solvents,
dichloromethane (DCM), n-hexane, and acetone, were examined to choose the
best solvent for use in an automated Soxhlet extractor (Gerhardt,
SOXTHERM®, Germany) for extraction of TPH. 14-days contaminated soil,
which was prepared at an initial concentration of 5000 mg/kg soil, was extracted
using the Soxhlet extractor with the same method explained in Section 3.4.1
with the three different solvents specified above. To investigate the effects of
aging on desorption and availability of TPH, the contaminated soil was
extracted by DCM on 54, 82 and 262 days of contamination. To evaluate the
effect of pre-treatment of soil by EL, one 82-days contaminated soil sample was
directly extracted by DCM, and another 82-days contaminated soil sample was
pre-treated by EL=10% for 10 min and then extracted by DCM. TPH in HA and
humin parts were extracted following the method of Yang et al. (2010). The
extract was passed through the silica gel column for fractionation and analysed
via GC, as explained previously in Section 3.2.2 and 3.3.4. To compare the
recoveries, the results of the extracted TPH were compared with fractionated
diesel from column chromatography. All experiments were carried out twice
and standard deviations were determined for results presentation in all figures.
3.6.2 Desorption experiments
Batch desorption experiments were carried out by placing 5 g of 14-days
contaminated soil in a 50 mL beaker and adding 10 mL of distilled water

99
(L/S=2). Mixing was carried out by using a magnetic stirrer (Cole-Parmer,
USA) at a speed of 350 rpm. The solutions were prepared by mixing 25%, 50%,
and 75% by volume of EL with water and one solution of EL%=100%. The
experiments were stopped at predetermined times until equilibrium had been
achieved. Separation of soil and liquid was accomplished by centrifuging at
1700 rpm for 15 min. The soil portion was analysed to determine the remaining
amount of diesel as described in Sections 3.2.1, 3.2.2, and 3.2.4 for TPH
extraction, chromatography column fractionation and GC analysis. Batch
desorption experiments for examining the effect of initial contamination level
on desorption kinetic were conducted with three levels of initial contamination
of 3500 mg/kg soil, 5000 mg/kg soil, and 10000 mg/kg soil at L/S=2, EL=25%,
and mixing speed of 350 rpm. To examine the effect of L/S, batch desorption
experiments were carried out at L/S=1, 2 and 4 at EL= 25%, and mixing speed
of 350 rpm and soil with 5000 mg/kg soil initial contamination level. All
experiments were repeated twice and standard deviations were determined for
results presentation in all figures.
3.6.3 Kinetic modelling
Desorption of TPH from soil with different EL% was modelled by pseudo-
second order rate equation. Typical second order rate equation is written based
on the concentration in solution. Analogous to Ho (2006a/b) work, in utilizing
the pseudo-second order rate equation for the desorbed amount in solution, the
underlying assumption for desorption is that desorption rate is proportional with
the driving force and capacity of solvent in desorbed contaminants. The
equations used in modelling the desorption are shown by:

100
d𝑞𝐿𝑡
dt= kp2(qLe − qLt)2 Eq. (4-1)
Initial condition: qLt (0)=0
t
𝑞𝐿𝑡=
1
V0+
1
qLet Eq. (4-2)
V0 = kp2qLe2=lim
t→0
𝑞𝐿𝑡
t Eq. (4-3)
where t is time [T],qLt is the desorbed amount in solution at time t [M], V0 is
the initial desorption rate [MT-1], kp2 is the psoudo-second-order rate constant
[M-1T-1], and qLe is equilibrium desorbed amount in solution [M]. Based on Eq.
(4-2), t
𝑞𝐿𝑡 is linear versus t. It was proven by Azizian (2004) that kp2 is a complex
function of initial concentration of solute, equilibrium molar concentration of
solute, and the coverage fraction.
3.7 Fenton reaction methodology
3.7.1 EL-Fenton reaction and reaction with zero-valent iron nanomaterials
EL-Fenton reaction was carried out batchwise in a 50 ml beaker by placing
H2O2, EL and water solution at the predetermined L/S (V/W) and EL%
conditions, at natural pH=2.7, which was measured. Fe2+ was supplied by
weighing and adding the required amount of FeSO4.7H2O to provide the
predetermined Fe2+ molarity in the solution. Then, 5 g of 5000 mg/kg 1-month
aged contaminated soil was added first followed by 0.1% HgCl2 solution to stop
biological degradation. Then, the slurry was mixed with a magnetic stirrer
(Cole-Parmer, USA) at a speed of 350 rpm. The reaction was stopped at
different times by adding H2SO4 to lower the pH to less than 1 (Lee et al., 2001)
to determine the remaining TPH in soil at a specific time to study the reaction

101
kinetic. Finally, the mixture was separated by centrifuging. The solid phase was
separated to analyse the amount of TPH, as it is explained in sections 3.2.2 and
3.2.4.
To examine the effect of L/S, EL%, and H2O2, experiments were carried out by
keeping two of the variables constant and changing the third variable. For each
set of experiments Fe2+ was kept constant. Experiments for constant H2O2=4 M,
Fe2+=0.05M, and L/S=2 were conducted at different EL%=0%, 25%, and 50%.
Constant EL%=25%, Fe2+=0.05M, and L/S=2 were accompanied by different
H2O2=0.1 M, 0.5 M and 2 M. Changes in L/S=1, 2 and 5 were tested at fixed
H2O2=0.5 M, Fe2+=0.05M, and EL%=25%.
Reactions with zero-valent iron were carried out as described above with the
exception of adding zero-valent iron nanomaterial (with Fe2+=0.28g/gsoil and
0.14g/gsoil) at 0, 0.02, 0.05, 0.1 mg/gsoil, H2O2=0.5 M and L/S=2. All
experiments were conducted twice and standard deviations are presented for
data in all figures.
3.7.2 Fenton reaction with HA
HA solutions were prepared by dissolving the appropriate amount of HA in
distilled water. The pH of the solution was adjusted by adding 0.1 M NaOH.
Afterwards, the solution in each reaction was brought to the predefined pH by
adding 1 M, 0.2 M H2SO4 or 0.1 M NaOH. The Fenton reactions at different HA
dosages and with and without EL were conducted in a batchwise manner. The
Fenton reaction was performed with H2O2=0.5M and Fe2+=0.05M for all
experiments. The pre-calculated amounts of HA with H2O2 and water, with EL
in cases with this solvent, comprised the liquid phase. Fe2+ was added to this

102
liquid phase and subsequently, a 1.5-month aged contaminated soil at 5000
mg/kg soil contamination level was added at L/S=2. To stop biological
degradation, 0.1% HgCl2 solution was added to the reactor. The pH was
adjusted whenever it was required. At predetermined times, the reaction was
terminated by adding H2SO4 solution to bring the pH lower than 1. The amount
of remaining diesel in soil was determined following the method explained in
sections 3.2.2 and 3.2.4.
3.7.3 EL-Fenton reaction kinetic modelling
The power law kinetic and pseudo-first order kinetic equations for Fenton
reaction were used to model the kinetic data obtained from the experiments. The
power law equation is as follows:
qt = Kpt−m Eq.(5-12)
where Kp is rate constant of reaction, qt(mg) is the amount of hydrocarbon in
soil at time t (min), and m is a constant.
The pseudo-first order reaction is defined in Eqs. (5-13) and Eq.(5-14), with the
initial condition of qt = q0 at t=0.
𝑑𝑞𝑡
𝑑𝑡= −𝑘(𝑞𝑡 − 𝑞𝑒) Eq. (5-13)
𝑞𝑡 = 𝑞𝑒 + (𝑞0 − 𝑞𝑒)𝑒−𝑘𝑡 Eq. (5-14)
where k, (min-1) is the pseudo-first order kinetic constant, qe, (mg), is the
amount of hydrocarbon in the solid phase, soil, at equilibrium, and q0, (mg), is
the initial amount of hydrocarbon in the solid phase.

103
3.8 Methodology of optimization using RSM
For RSM design, the results from the parametric batch study described earlier
and information from the literature were used. Based on the studied variables,
L/S=2 was chosen as the fixed value because it had a high removal efficiency.
The value of H2O2 was fixed at 0.5 M as it was shown that an increase in H2O2
of more than 0.5 M had not increased the removal efficiency considerably. EL%
was considered as one of the variables for the RSM analysis, because it is the
main focus of this study and determining its interactions with other variables are
important. The range of pH was chosen based on the reported values in papers
and as discussed before, Fenton reaction with Fe2+ is possible in acidic range,
pH=3-5, and by adding HA, the range of the pH increases. The EL% range was
based on the results within the range of 10%-60%. The chosen HA range
corresponded to the values that were more or less than the case without HA.
The removal efficiency of Fenton reaction was analysed and optimised by RSM.
A central composite design (CCD) with three independent factors was used to
measure the effect of variables on the Fenton reaction removal efficiency. The
three factors were HA (A), EL % (B), and pH (C). The number of experiments
was 20, (2k+2k+ 6) where k is the number of factors and equals 3. The responses
of different fractions were formulated by linear, quadratic, and interaction
terms. The overall equation and the related formula are described in Appendix
1. The Design-Expert 7.1 software was used to analyse and plot response surface
and experimental data.

104
3.9 Column set-up methodology
Column experiments were carried out with 150 g 1.5 month aged soil at 5000
mg/kg contamination level using column with a height of 25 cm and 2.5 cm
inner diameter. The experiments were initiated by adding Fenton reagents
solution in water with EL and 0.05 M iron solution, and 0.1% HgCl2 to the top
of the column. Sufficient time was given such that all mobile liquid phase eluted
from the column. After finishing experiments, the soil inside the column was
divided into 5 equal sections with numbering from the top as the first section,
and HCl was added to each section to bring the pH below 1 to quench the
reaction. From each section, sampling was carried for extraction and GC
analysis of remaining TPH in the soil according to Section of 3.2.1 and 3.2.4.
The studied variables were EL%, overall L/S (instead of the contact time), and
H2O2 at constant Fe2+ concentration. By keeping two of three variables constant,
the remaining variable was changed. At constant L/S, Fe2+=0.05 M, and EL%,
H2O2 values were 0.1 M, 0.5 M, and 2 M. L/S values were 1/3, 1/2, 1 at
Fe2+=0.05 M, H2O2=0.5 M, and EL=10%. Values of Fe2+=0.05 M, H2O2=0.5 M,
and L/S=1/2 accompanied the change in EL% with values of 0%, 10%, 25%,
and 50%. All experiment were conducted two times, in the wet laboratory of
University of Nottingham. The ranges of H2O2 and EL% have been chosen
based on the results in batch experiments. L/S was chosen based on preliminary
experiments, and as will be discussed later, an increase in L/S from 1/2 to 1 had
not changed the results considerably. Hence, L/S=1 was determined as the
maximum value in its range.

105
3.10 Concluding remarks
This chapter has outlined all the analytical methods crucial to the research work.
Soil characteristics have been determined prior to starting the main experiments.
Properties such as soil texture, iron content, SOM %, moisture, and acidity were
determined according to methods from organisations such as US EPA, or other
mentioned scientific papers in each relevant section. The results of GC
calibration with high R2, coefficient of correlation, showed the credibility of the
applied analysis for TPH. The procedures will be used to obtain data for
subsequent desorption, batch and column studies.

106
CHAPTER 4: DESORPTION OF TOTAL
PETROLEUM HYDROCARBONS FROM
SOIL USING ETHYL LACTATE
4.1 Introduction
One approach for soil treatment is dissolving the contaminants in a solvent.
Among different decontamination methods, solvent extraction is considered as
an effective way for remediation of oil-contaminated soil (Gong et al., 2007).
Solvent extraction applies a solvent or mixture of solvents for removing
hazardous and harmful pollutants from soil. Determining desorption rate is
important for predicting the transport of the contaminants in the field and its
bioavailability (Birdwell et al., 2007). Desorption and kinetic rate of aromatic
hydrocarbons like PAH in soils have been widely studied in the last two decades
(Connaughton et al., 1993; Ghosh et al., 2001; Loehr et al., 2003; Shor et al.,
2003; Gong et al., 2005 a/b; Haddadi et al., 2009; Yang et al., 2013; Barnier et
al., 2014). However, the aliphatic part has been lesser studied.
This chapter aims to examine the applicability of EL as a green solvent for
desorption of diesel range of TPH and to determine the associate desorption
kinetics. Most commonly used organic solvents are volatile with known effects
on global warming (Aparicio et al., 2009/b). EL which is a clear and colourless
liquid of low volatility and complete miscibility with water and most organic
solvents is considered as a green solvent. To date, to the authors’ best
knowledge, the potential of EL to desorb aliphatic part of diesel fractions from
contaminated soil has not been reported. In this phase of study, the effect of

107
sequestration on diesel removal from soil as well as a comparison between
different solvents in desorption of diesel from soil were firstly carried out.
Subsequently, batch desorption experiments were conducted as the main focus
of this chapter to evaluate the effect of increase in EL% on TPH desorption. The
effect of EL%, initial soil contamination level, and liquid to solid ratio (L/S
(v/w)) on initial desorption rate as defined by pseudo-second order kinetics
equation was also examined.
4.2 Results and Discussion
4.2.1 Soil characteristics
Table 4-1 lists the properties of the model soils. The texture of soil was
determined as sandy loam. The iron content in soil was more than the typical
range of 0.5-5% (Yap, 2012/b). The amount of iron, 63.1 mg/g soil, was also
more than most reported values between 17.3 mg/g soil (Kawaraha, et al. 1995)
and 45 mg/g soil (Kong et al., 2005). The measured amount of SOM was
considered high. As there are controversial arguments regarding the importance
of SOM in soil remediation process, which will be discussed later in Chapter 5,
the high value of SOM provided the opportunity to study the effect of SOM, or
its fraction. The high percentage of SOM leads to higher diffusion of
contaminants into the soil which affect their accessibility especially with aging.
The high Fe content in this sample can be due to the mining activities which
were done nearby, it was noticed in that area, as it was also reported by
Koranteng – Addo, et al. (2011).

108
Table 4-1 Soil sample physicochemical properties
Properties Valuesa
Sand (%) 68
Silt (%) 13.1
Clay (%) 18.9
Iron content (mg/g soil) 63.1±0.01
Moisture (%) 4.2±0.06
(pHH2O) pH in water at 23±0.1°C 5.1±0.03
(pHCaCl2) pH in 0.01 M CaCl2 at 23±0.1°C 4.3±0.02
SOM, loss on ignition (%) 10.32±0.009
SOM, TGA (%) 11.8
aAverage of two determinations with standard deviation
4.2.2 Calibration results
The retention time windows of four alkanes are shown in Table 4-2.
Table 4-2: Retention time window of individual n-alkanes
Compound (n-
Alkane)
Retention Time Window (min)
Single Calibration
n-Nonane (C9) 5.15±4.26 a %
n-Hexadecane
(C16) 12.58±5.5 a %
n-Docosane (C22) 16.91±5.94 a %
n-Octacosane
(C28) 20.33±0.36 a %
a: absolute retention time±3 times the standard deviation
The calculated RF for each n-alkane and the average value are tabulated in Table
4-3.

109
Table 4-3: 𝐑𝐅 and 𝐑𝐅𝐚𝐯𝐞 values
n-alkane Compound 𝑹𝑭
C9 (n-Nonane) 359.4
C16 (n-Hexadecane) 368.8
C22 (n-Docosane) 290.84
C28 (n-Octacosane) 250.3
Average 𝑹𝑭𝒂𝒗𝒆 318.1
4.2.3 Extraction solvent
A comparison between the most commonly used organic solvents for extraction
of TPH was carried out to choose the most favourable solvent with the highest
recovery of analytes. Figure 4-1 shows the comparison of extracted amount of
aliphatic diesel fractions (C9-C16, C16-C22, C22-C284, TPH) from soil using
three different solvents with diesel. The TPH reported in Figure 4-1 is the
summation of solvent extractable TPH via Soxhlet extraction and TPH in humin
since the TPH in HA and FA were not detectable by GC. As can be deduced
from the data, DCM had the highest desorbed recovery followed by n-hexane,
and finally acetone with the least desorbed values. The difference in recovery
between acetone and n-hexane was mainly because of fraction 2. Similarly, the
same fraction was responsible for the main difference between DCM and n-
hexane. This trend of fraction 2 >fraction 3 >fraction 1 was the same for all three
solvents as well as diesel.

110
Figure 4-1. Comparison of extracted amount of aliphatic diesel fractions from soil using three
different solvents with diesel (Fraction 1: C9-C16, Fraction 2: C16-C22, Fraction 3:
C22-C284, Fraction 4: TPH)
The percentage extraction of aliphatic diesel from soil by these solvents were
compared with the fractionated diesel used. Table 4-4 tabulates the results of the
comparison. With a TPH extraction of 73.03% of initial diesel used for
contamination, DCM had the highest extracted value in comparison with n-
hexane and acetone with 38.39% and 19.79%, respectively. Therefore, DCM
was chosen as the solvent for Soxhlet extraction. The difference between
86.84% and complete recovery was likely caused by analyte losses on the walls
of the container, evaporation, or biodegradation.
0
1
2
3
4
5
6
7
8
9
0 1 2 3 4 5
Des
orb
ed v
alues
fo
r th
ree
solv
ents
and
frac
tio
nat
ed v
alues
fo
r d
iesl
e (m
g)
Fraction
Diesel Extracted by DCM
Extracted by n-hexane Extracted by acetone

111
Table 4-4: Percentage of aliphatic diesel fractions and TPH extraction by
different solvents
(DCM/diesel)% (n-Hexane/diesel)% (Acetone/diesel)%
Fraction 1 29.64 11.15 1.46
Fraction 2 79.42 42.77 23.00
Fraction 3 86.00 45.77 24.19
TPH 73.03 38.39 19.79
The solvent extractable fraction by DCM and the fraction diffused in humin are
reported in Table 4-5. After Soxhlet extraction by DCM, the remaining TPH on
humin fraction was 2.455% of the solvent extractable part for 14-days
contaminated soil. This small value had been neglected in analysing the TPH.
Table 4-5: Aliphatic diesel and TPH in solvent extractable and humin fractions
of DCM extracted soil for 14-days contaminated soil
Solvent
extractable (mg) Humin (mg)
Humin/Solvent
extractable%
Fraction 1 0.675 0.003 0.403
Fraction 2 3.305 0.053 1.602
Fraction 3 1.400 0.076 5.455
TPH 5.380 0.132 2.455
Figure 4-2 illustrates the solvent extractable fraction from soil by DCM with
different contamination age. With passing time, the solvent extractable fractions
decreased. This loss could possibly be attributed to TPH diffusion into organic
matter (FA, HA, and humin) (He et al., 2008; Yanng et al., 2010), or
biodegradation.

112
Figure 4-2: Solvent extractable fraction from soil by DCM with different contamination age
The effect of EL on desorption from 82-days aged soil was also evaluated by
pre-treating the contaminated soil with EL=10% solution for 10 min, and
subsequently extracting with DCM. The results were compared with direct soil
extraction using DCM and are summarized in Table 4-6. As can be seen, the
desorbed value from 10 min pre-treated soil by solution of EL%=10% was 1.993
mg while DCM could desorb 1.104 mg of TPH from soil with the same
contamination age. This indicated that diesel had diffused into the organic part
of soil which reduced the availability of the pollutant (Barnier et al., 2014), and
formed non-extractable fractions by binding with recalcitrant organic matters
such as HA (He et al., 2008). With passing time and aging, the extractability of
TPH had decreased. This agrees with the findings of Ncibi et al. (2007) and
Northcott et al. (2001) who observed that aging had decreased the availability
of PAHs. This observation was probably because contact with EL=10% solution
for 10 min disintegrated a part of the soil, or diffused into that part of soil that
DCM was not able to extract via Soxhlet extraction. The separated black part of
0
1
2
3
4
5
6
7
8
9
0 50 100 150 200 250 300
Extr
acta
ble
die
sel
by D
CM
(m
g)
time (day)
Fraction 1 Fraction 2 Fraction 3 TPH

113
soil accumulated on top of the soil after treatment with EL=10% solution
indicated the separation of humic matter which was a sign of the possibility of
organic matter breakdown which was accessible after treatment with EL. As it
is reported by Kosaka et al. (1961) that some organic solvents can dissolve
humic matter, it is possible that EL can dissolve or separate some part of organic
matter. Therefore, it is likely that EL has the ability to access to parts of soil that
is inaccessible by DCM. This shows the potential of EL as a desorption solvent
for TPH in contaminated soils.
Table 4-6: Effect of soil pre-treatment by EL on Soxhlet extraction efficiency
using DCM for aged soil
Day Fraction 1 Fraction 2 Fraction 3 TPH
Soxhlet extraction of soil using DCM (mg) 82 0.241 0.715 0.148 1.104
Soxhlet extraction of 10 min pre-treated
soil by 10% EL using DCM (mg)
82 0.254 1.327 0.412 1.993
114
4.2.4 EL and desorption process
In examining the effect of increase in EL% from 25% to 100%, batch desorption
experiments were carried out with soil at 5000 mg/kg soil initial contamination
level. Figure 4-3 depicts the removal efficiency of diesel or TPH remaining in
soil. As can be observed, desorption of TPH was characterized by a very fast
initial stage followed by a much slower stage until equilibrium. The slow stage
and equilibrium is usually attributed to organic matter diffusion or diffusion
through the hydrophobic micropores (Cornelissen et al., 1998). The very fast
initial stage of desorption demonstrated the high desorbing ability of EL for TPH
in soil. For solutions of EL%=25% (which was very close to EL=0%) and
EL%=100%, 35.78% and 82.45% of TPH desorption were achieved in 30 min,
respectively. Meanwhile, the TPH equilibrium desorption values for EL%=25%
and EL%=100% were 49.98% and 94.79%, respectively. This meant that
71.60% for EL%=25% and 86.98% for EL%=100% of TPH equilibrium values
were achieved in 30 min. The other point that could be deduced from the
experimental data is that by increasing the EL%, the equilibrium value of
removal efficiency of TPH in soil had increased. This could be linked to the
increasing EL% enabling more available solvent desorption ability.
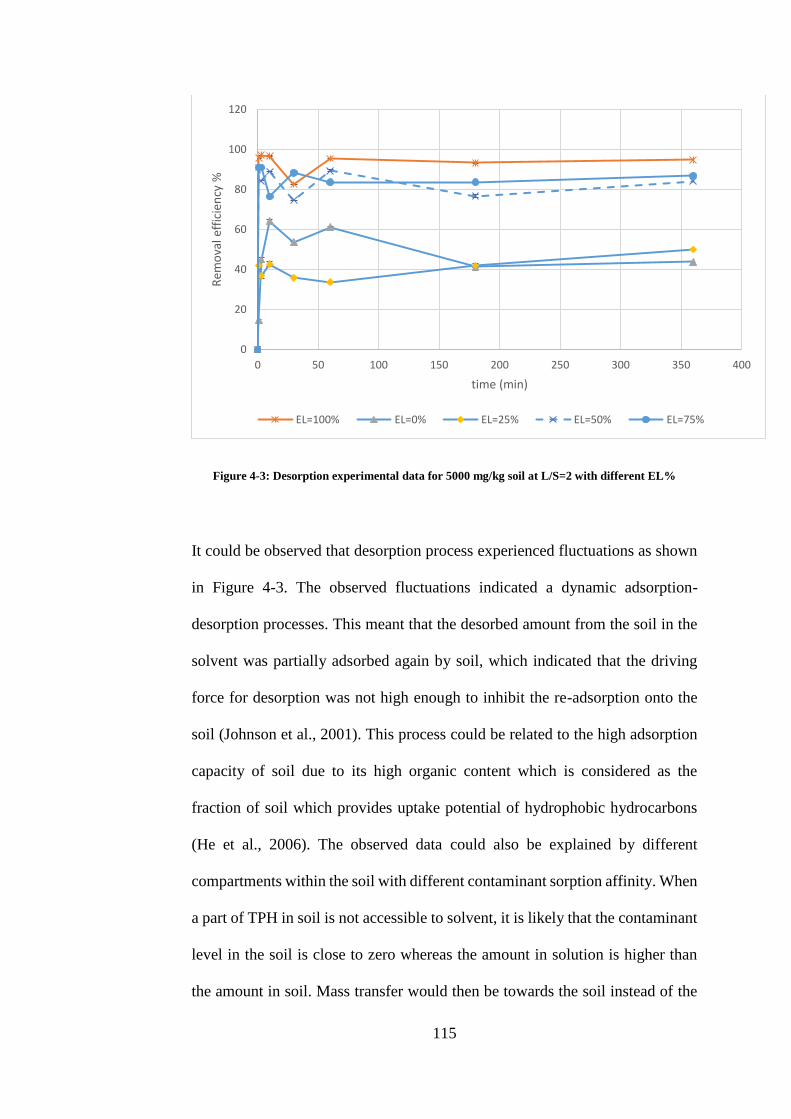
115
Figure 4-3: Desorption experimental data for 5000 mg/kg soil at L/S=2 with different EL%
It could be observed that desorption process experienced fluctuations as shown
in Figure 4-3. The observed fluctuations indicated a dynamic adsorption-
desorption processes. This meant that the desorbed amount from the soil in the
solvent was partially adsorbed again by soil, which indicated that the driving
force for desorption was not high enough to inhibit the re-adsorption onto the
soil (Johnson et al., 2001). This process could be related to the high adsorption
capacity of soil due to its high organic content which is considered as the
fraction of soil which provides uptake potential of hydrophobic hydrocarbons
(He et al., 2006). The observed data could also be explained by different
compartments within the soil with different contaminant sorption affinity. When
a part of TPH in soil is not accessible to solvent, it is likely that the contaminant
level in the soil is close to zero whereas the amount in solution is higher than
the amount in soil. Mass transfer would then be towards the soil instead of the
0
20
40
60
80
100
120
0 50 100 150 200 250 300 350 400
Rem
ova
l eff
icie
ncy
%
time (min)
EL=100% EL=0% EL=25% EL=50% EL=75%

116
solution hence diesel would be adsorbed onto the soil until a point at which the
direction of mass transfer and driving force changes. Each cycle will end when
another compartment becomes accessible. The cycles will continue until
equilibrium is reached. Thus, it can be concluded that EL is recyclable as soil
can re-adsorb the TPH.
The experimental kinetic data were modelled using pseudo-second order rate
equation for three aliphatic diesel fractions and TPH. The obtained results for
the three fractions and TPH for different EL% are presented in Figure 4-4. For
all fractions and all EL%, the pseudo-second order model fitted the experimental
desorption data well with good correlation coefficient values of R2 between
0.8899-0.9999.
4.2.5 Effect of EL%, initial contamination level, and L/S on initial
desorption rate on each fraction
Table 4-7 lists the calculated variables from the pseudo-second order kinetic
modelling by curve fitting with Excel 2013. The results were fitted with Elovich
equation and first-order rate equation as1 well, but correlation coefficients were
not satisfying. By increasing the EL% from 25% to 100%, the initial desorption
rate for TPH increased which could be explained by the increased desorption
ability of the solvent in the solution. qLt had increased from the EL=25% to
EL=100%.
The effect of initial contamination level on the initial desorption rate at L/S=2
and EL=25% can be seen in Figure 4-5. The data obtained showed that 3500
mg/kg soil had the highest initial desorption rate. In contrast, further increase
from 3500 mg/kg to 5000 mg/kg resulted in a decrease in initial desorption rate

117
from 4.75 mg/min to 0.30 mg/min for TPH. However, further increase from
initial contamination level of 5000 mg/kg soil to 10000 mg/kg soil had led to a
slight decrease to 0.12 mg/min. It is plausible that the TPH solution
concentration for 3500 mg/kg soil was less than 5000 mg/kg soil which led to
the higher capacity of the solution for desorbing TPH. Conversely, an increase
from 5000 mg/kg soil to 10000 mg/kg soil did not change the capacity of
solution for desorbing the contaminants. This could be due to the accessible
fraction of contaminates for the solvent. Fraction 3 of all three initial
contamination levels had very close initial desorption rates which was followed
by fraction 1 and finally fraction 2 which had the most difference between the
3500 mg/kg soil and 5000 mg/kg soil. The reason why fraction 1 had a lower
initial desorption rate than fraction 2 despite its lowest molecular weight could
be because of the small number of hydrocarbons that were classified in this
group. Although aliphatic hydrocarbons between C9-C16 had been considered
in this group, after desorption experiment and Soxhlet extraction, only aliphatic
hydrocarbons between C14-C16 were detectable by GC. In addition, as initial
desorption rate was representative of the desorbed amount per unit time, the
amount was significant in addition to how fast it desorbed. Fraction 2 had a
higher initial desorption rate than fraction 3, which could be attributed to its
lower molecular weight.
Figure 4-6 illustrates the effect of L/S on the initial desorption rate of 5000
mg/kg soil using EL=25%. As depicted, the initial desorption rate at L/S=2 was
the lowest in comparison to L/S=1 and L/S=4. It could be expected that with the
increase in L/S, the increase in liquid amount would lead to more solution ability
to desorb and contain the contaminants, as observed by the increase in L/S from

118
2 to 4. However, at L/S=1, fractions 1, 2, 3 and TPH had the highest initial
desorption rate (0.132 mg/min, 2.496 mg/min, 6.930 mg/min and 4.550 mg/min,
respectively). The equilibrium time of batch desorption experiment at L/S=1
was 30 min. For L/S=2 and L/S=4, the equilibrium time was 60 min. The results
here indicated that apart from molecular weight of contaminant and solvent
desorption ability, the initial desorption rate was a function of equilibrium time
as well. The difference between L/S=1 and L/S= 2 and 4 increased with increase
in molecular weight from fraction 1 to 3.

119
Fraction 1 Fraction 2 Fraction 3 TPH
a.
b.
Figure 4-4: Pseudo-second order kinetic models for desorption experiments for 5000 mg/g at L/S=2; a) 25% EL, b) 50% EL, c) 75% EL, d)
100% EL
0
100
200
300
400
500
600
700
800
0 100 200 300 400
t/q
lt (
min
/mg)
time (min)
0
50
100
150
200
250
0 100 200 300 400t/
qL
t (m
in/m
g)
time (min)
0
50
100
150
200
250
300
350
400
450
500
0 100 200 300 400
t/q
Lt
(min
/mg)
time (min)
0
20
40
60
80
100
120
140
0 100 200 300 400
t/q
Lt
(min
/mg)
time (min)
0
100
200
300
400
500
600
0 100 200 300 400
t/q
Lt
(min
/mg)
time (min)
0
20
40
60
80
100
120
0 100 200 300 400
t/q
Lt
(min
/mg)
time (min)
0
50
100
150
200
250
300
350
400
450
0 100 200 300 400
t/q
Lt
(min
/mg)
time (min)
0
10
20
30
40
50
60
70
80
0 100 200 300 400
t/q
Lt
(min
/mg)
time (min)

120
c.
d.
Continued Figure 4-4: Pseudo-second order kinetic models for desorption experiments for 5000 mg/g at L/S=2; a) 25% EL, b) 50% EL, c) 75%
EL, d) 100% EL
0
100
200
300
400
500
600
0 100 200 300 400
t/q
Lt
(min
/mg)
time (min)
0
20
40
60
80
100
120
0 100 200 300 400
t/q
Lt
(min
/mg)
time (min)
0
100
200
300
400
500
0 200 400
t/q
Lt
(min
/mg)
time (min)
0
20
40
60
80
0 100 200 300 400
t/q
Lt
(min
/mg)
time (min)
0
100
200
300
400
500
600
0 100 200 300 400
t/q
Lt
(min
/mg)
time (min)
0
100
200
300
400
500
600
700
800
900
1000
0 100 200 300 400
t/q
Lt
(min
/mg)
time (min)
0
500
1000
1500
2000
2500
3000
3500
0 100 200 300 400
t/q
Lt
(min
/mg)
time (min)
0
100
200
300
400
500
600
700
0 100 200 300 400
t/q
Lt
(min
/mg)
time (min)

121
Table 4-7: Calculated parameters and variables from the pseudo-second order
kinetic modelling for 5000 mg/kg soil at L/S=2; a) 25%, b) 50, c) 75%, d) 100%
EL%
Parameters
and variables
Fraction 1 Fraction 2 Fraction 3 TPH
a) 25% Vo (mg/min) 0.076 0.066 0.052 0.297
𝐪𝐋𝐞 (mg) 0.550 1.671 0.858 3.020
𝐤𝐩𝟐 ((mg.min)-1) 0.250 0.024 0.071 0.033
R2 0.9848 0.8899 0.9724 0.9885
b) 50% Fraction 1 Fraction 2 Fraction 3 TPH
Vo (mg/min) 0.427 2.836 1.021 4.428
𝐪𝐋𝐞 (mg) 0.633 3.533 0.882 5.064
𝐤𝐩𝟐 ((mg.min)-1) 1.064 0.227 1.313 0.173
R2 0.9936 0.9988 0.9925 0.9976
c) 75% Fraction 1 Fraction 2 Fraction 3 TPH
Vo (mg/min) 0.645 2.943 4.475 5.274
𝐪𝐋𝐞 (mg) 0.704 3.635 0.933 5.271
𝐤𝐩𝟐 ((mg.min)-1) 1.300 0.223 5.135 0.190
R2 0.9998 0.9997 0.9986 0.9996
d) 100% Fraction 1 Fraction 2 Fraction 3 TPH
Vo (mg/min) 1.067 0.596 0.047 0.608
𝐪𝐋𝐞 (mg) 0.732 0.386 0.119 0.578
𝐤𝐩𝟐 ((mg.min)-1) 1.990 3.997 3.292 1.818
R2 0.9990 0.9999 0.9985 0.9998

122
Figure 4-5: Effect of L/S on initial desorption rate at EL=25% for 5000 mg/kg soil
Figure 4-6: Effect of initial contamination level on initial desorption rate at L/S=2 and EL=25%
0
0.5
1
1.5
2
2.5
3
3.5
4
4.5
5
0 2000 4000 6000 8000 10000 12000
Init
ial
des
orp
tio
n r
ate,
Pse
ud
o-s
eco
nd
ord
er
(mg/m
in)
Initial contamination level (mg/kg soil)
Fraction 1 Fraction 2 Fraction 3 TPH
0
1
2
3
4
5
6
7
8
0 1 2 3 4 5
Init
ial
des
op
rtio
n r
ate,
pse
ud
o-s
eco
nd
ord
er (
mg/m
in)
L/S
Fraction 1 Fraction 2 Fraction 3 TPH

123
4.3 Concluding Remarks
This chapter has evaluated the effect of EL on desorption of aliphatic diesel
fractions and TPH from contaminated soil. An increase in EL% increased the
desorption of TPH from contaminated soil. Desorption was characterised by a
very fast initial stage followed by the slower stage till equilibrium. In 30 min,
EL=25% desorbed 63% of TPH while EL=100% desorbed 81% of TPH from
soil. The desorption ability of EL shown by the very fast initial desorption
indicated its feasibility for treatment of diesel contaminated soil. Desorption
kinetics were well described by pseudo-second order model. The initial
desorption rate increased from 1.625 mg/min to 3.368 mg/min for TPH with an
increase in EL % from 25% to 100%, respectively. EL also showed the potential
of accessing TPH which has diffused into organic matter in aged soil. In
summary, the potential of EL as a green solvent for desorption of TPH from
contaminated soil has been demonstrated.
124
CHAPTER 5: ETHYL LACTATE-FENTON
BATCH STUDIES FOR REMEDIATION OF
TPH-CONTAMINATED SOIL
5.1 Introduction
Contamination of soil by petroleum hydrocarbons has long been recognised as
a health and environmental problem. Oxidation of TPH by O3 and H2O2 is one
of the most successful soil remediation approaches that have been reported in
the literature (Lee et al., 2002; Yu et al., 2007; Wu et al., 2013; Sui et al., 2014).
In particular, several researchers have highlighted Fenton reaction as a highly
effective and efficient remediation method for destruction of hydrocarbons by
oxidation (Watts et al., 1996; Watts et al., 2000; Neyens et al., 2003).
Combining different processes, which focus on different parts of the sorption-
desorption processes, as well as the oxidation process could effectively improve
the overall efficiency of the remediation process. The combination of Fenton
reaction with surfactants to increase the solubility (Isosaari et al., 2001; Bandala
et al., 2008), and with bioremediation process (Rivas et al., 2009; Lu et al., 2010)
are specific examples of this combined approach. Combining Fenton reaction
with solvent extraction is now recognized as a successful soil remediation
strategy (Lundstedt et al., 2006; Jalilian et al., 2017). This is because destroying
adsorbed contaminants is more difficult than destroying contaminants in
solution (Bogan et al., 2003). By applying a solvent, the dissolution rate of
contaminants will increase. In dissolved form, destruction of contaminants by
Fenton reaction will be more efficient.

125
In light of the developments in combining Fenton reaction and solvent
extraction, EL is the solvent of interest to be used in conjunction with Fenton
reaction in this study. As the aim of soil remediation is to decrease contaminants
levels and their environmental side effects, a green solvent such as EL is
suitable. This chapter describes the batch experiments carried out in order to
determine the effects of H2O2, liquid phase volume to soil weight ratio (L/S),
and EL% on aliphatic fraction of TPH removal efficiency after soil treatment.
The experimental kinetic data obtained were analysed by the ability law and
pseudo-first order equations. Furthermore, tests were carried out to investigate
how HA affects the removal efficiency of Fenton reaction in the absence and
presence of EL. Response surface method (RSM) was finally used to determine
the interactions between the involved variables after fixing L/S and H2O2 based
on the parametric studies.
5.2 Results and Discussion
5.2.1 The removal efficiency of Fenton reaction
5.2.1.1 Effect of 𝑯𝟐𝑶𝟐 concentration on removal efficiency
In Figure 5-1, the effect of H2O2 concentration on removal efficiency results has
been depicted. With increasing H2O2 from 0.1 M to 0.5 M, the removal
efficiency for TPH increased significantly from 68.41% to 85.76% after 4 h. In
contrast, an increase in H2O2 from 0.5 M to 2 M increased the removal efficiency
from 85.70% to 89.23% only from 85.76% to 90.21% for TPH after 4 h. Hence,
increasing H2O2 from 0.5 M to 2 M, a four-fold increase, had not improved the
removal efficiency considerably; Xu et al. (2006) have also reported similar

126
results. This observation could be linked to an excess of H2O2 at concentration
above 0.5M for Fe2+=0.05M which was not practically involved in the reaction.
Fraction 1 Fraction 2
Fraction 3 TPH
Figure 5-1: Removal efficiency at H2O2= 0.1M, 0.5M, and 2M at constant Fe2+=0.05 M, EL=25%,
and L/S=2, fraction 1, fraction 2, fraction 3 and TPH
5.2.1.2 Effect of soil slurry volume, L/S, on removal efficiency
Figure 5-2 shows the effect of L/S on removal efficiency. As can be observed
from the figure, L/S=1 and 2 had higher removal efficiencies than L/S=5. As the
0
20
40
60
80
100
120
0 50 100 150 200 250 300
Rem
oval
eff
icie
ncy
%
Time (min)
H2O2=0.1M H2O2=0.5M H2O2=2M
0
20
40
60
80
100
0 50 100 150 200 250 300
Rem
oval
eff
icie
ncy
%
Time (min)
H2O2=0.1M H2O2=0.5M H2O2=2M
0
20
40
60
80
100
0 50 100 150 200 250 300
Rem
oval
eff
icie
ncy
%
Time (min)
H2O2=0.5M H2O2=2M H2O2=0.1M
0
20
40
60
80
100
120
0 50 100 150 200 250 300
Rem
oval
eff
icie
ncy
%
Time (min)
H2O2=0.1M H2O2=0.5M H2O2=2M

127
reaction progressed, the removal efficiencies of the three L/S values for the most
experiments became closer to that of L/S=1 which had a removal efficiency of
85.77% for TPH after 4 h. For L/S=2 and 5, the removal efficiency for TPH in
soil after 4 h were 85.57% and 85.61%, respectively. For all three fractions too,
L/S=5 had the lowest removal efficiencies. The difference in removal efficiency
between L/S=1 and 2, and L/S=5 at the beginning of most of the experiments
could possibly be attributed to better contact of Fenton reagents with the sorbed
contaminants at smaller L/S values (Watts et al., 1996).

128
Fraction 1 Fraction 2
Fraction 3 TPH
Figure 5-2 Removal efficiency at L/S=1, 2, and 5, at constant H2O2=0.5 M, Fe2+=0.05M, EL=25%,
fraction 1, fraction 2, fraction 3 and TPH
5.2.1.3 Effect of EL% on removal efficiency
Figure 5-3 shows the change in removal efficiency as EL% was varied. From
Figure 5-3, EL=25% and 50% had higher removal efficiencies than EL=0%
until 2 h. The removal efficiencies for EL=25% for fractions 1, 2, and 3, and
TPH were also higher than those of EL=50%. This observation could be due to
0
20
40
60
80
100
120
0 50 100 150 200 250 300
Rem
oval
Eff
icie
ncy
%
Time (min)
L/S=1 L/S=2 L/S=5
0
20
40
60
80
100
0 50 100 150 200 250 300
Rem
oval
eff
icie
ncy
%
Time (min)
L/S=1 L/S=2 L/S=5
0
20
40
60
80
100
0 50 100 150 200 250 300
Rem
oval
eff
icie
ncy
%
Time (min)
L/S=1 L/S=2 L/S=5
0
20
40
60
80
100
0 50 100 150 200 250 300
Rem
oval
eff
icie
ncy
%
Time (min)
L/S=1 L/S=2 L/S=5

129
the ineffective reaction of Fenton in solution with higher EL%, as discussed in
the subsequent paragraph.
Fraction 1 Fraction 2
Fraction 3 TPH
Figure 5-3: Removal efficiency at EL%= 0%, 25%, and 50% at constant H2O2=4 M, Fe2+=0.2M,
and L/S=2, fraction 1, fraction 2, fraction 3 and TPH
To further evaluate the effect of increase in EL% on removal efficiency, the
reactions were conducted for EL%=10%, 25%, 50% and 68% for 4 h. The
results for the alkanes and the three fractions along with TPH are illustrated in
85
87
89
91
93
95
97
99
101
0 50 100 150 200 250 300
Rem
oval
eff
icie
ncy
%
Time (min)
El=0% EL=25% EL=50%
60
65
70
75
80
85
90
95
0 50 100 150 200 250 300
Rem
oval
eff
icie
ncy
%
Time (min)
EL=0% EL=25% EL=50%
60
65
70
75
80
85
90
95
0 50 100 150 200 250 300
Rem
oval
eff
icie
ncy
%
Time (min)
EL=0% EL=25% EL=50%
75
77
79
81
83
85
87
89
91
93
95
0 50 100 150 200 250 300
Rem
oval
eff
icie
ncy
%
Time (min)
EL=0% EL=25% EL=50%

130
Figure 5-4. The results obtained for the three fractions and TPH depicted the
highest removal efficiency for EL=10%, with 96.74% for TPH. Decrease in
removal efficiency for higher EL% was observed with the lowest value of 89.6%
for TPH at EL=68%. The three fractions followed the same pattern as TPH. This
observation could be explained by the possible effects of EL and water on
Fenton reaction. By increasing the EL%, the water% in the solution would
decrease. FeSO4.7H2O is almost insoluble in EL. For EL% lower than 10%, the
effect of increase in solubility of hydrocarbon contaminants in EL was greater
than the insolubility of FeSO4.7H2O. Increasing EL% to above 10% likely
caused the insolubility of FeSO4.7H2O to dominate over other effects leading to
slower Fenton reaction. This study has shown that a low amount of EL (10% in
this case) could increase the removal efficiency by increasing the solubility of
diesel compounds. In addition, as the H2O2 is decomposed and only iron is
present, and the desorbed contaminants are mineralized by Fenton reaction, the
spent EL can be reused.

131
Figure 5-4 Effect of increase in EL% from 0% to 68% on removal efficiency, fraction 1, fraction 2,
fraction 3 and TPH
5.2.1.4 Effect of Fenton reaction on distribution of the three fractions
In this section, the percentages and the changes in percentages of three fractions
in TPH are examined. In diesel, TPH consisted of 42.98% of fraction 1, 40.55%
of fraction 2, and 16.47% of fraction 3. After Fenton reaction, the percentage of
fraction 1 of remaining diesel in soil decreased to 8.46%, while the percentages
of fractions 2 and 3 increased to 68.97% and 23.56%, respectively for
H2O2=0.1M, Fe2+=0.05M, L/S=2, EL=25% after 4 h. The same trend was
observed for all other experiments. Figure 5-5 shows the percentages of the three
fractions at H2O2=0.1M, Fe2+=0.05M, L/S=2, EL=25% and H2O2=4M,
Fe2+=0.2M, L/S=2, EL=25%. As can be seen, fraction 1 had the most significant
changes or decreases in percentage of TPH, followed by fractions 2 and 3 with
less significant changes or increases in percentage of TPH. The lower molecular
weight of fraction 1 caused faster desorption and possibly faster degradation that
led to the biggest changes in TPH percentages.
80
85
90
95
100
105
0 20 40 60 80R
emo
val
eff
icie
ncy
%
EL%
Fraction1 Fraction 2 Fraction 3 TPH

132
a
b
Figure 5-5: Percentages of three fractions in a: H2O2=0.1M, Fe2+=0.05M, L/S=2, EL=25%, and b:
H2O2=4M, Fe2+=0.2M, L/S=2, EL=25%
5.2.1.5 Kinetic of EL-Fenton reaction
The results were fitted to three kinetic models, power law equation, pseudo-first
order equation, and pseudo-second order equation. The results of power law
equation and pseudo-first order equation are reported and the results of
correlation coefficient of pseudo-second order rate equation are reported in
Appendix 3. The coefficients of power law equation are reported in Table 5-1
while the coefficients of the pseudo-first order equation are reported in Table 5-
2. As can be seen from these tables, the coefficient of correlation, R2, values
were all close to 1 which indicated a good fit of data to both models. qe in
pseudo-first order kinetic model had the highest value for fraction 2 followed
by fraction 3 and fraction 1.
-20
0
20
40
60
80
100
0 100 200 300
Per
cen
tage
of
per
cen
tage
of
TP
H
Time(min)
fraction 1 fraction 2 fraction 3
0
20
40
60
80
100
120
-50 50 150 250
Per
cen
tage
of
per
cen
tage
of
TP
H
Time (min)
fraction 1 fraction 2 fraction 3

133
Table 5-1: Coefficients of two constant power law equation for fraction 1, fraction 2, fraction 3, and TPH for kinetic
of combined EL-Fenton
Experimental Conditions Fraction 1 Fraction 2 Fraction 3 Total
𝐇𝟐𝐎𝟐,M EL% L/S Fe2+,M 𝐊𝐩 m R2 𝐊𝐩 m R2 𝐊𝐩 m R2 𝐊𝐩 m R2
0.1 25 2 0.05 12.85 0.65 0.9862 3.91 0.08 0.9434 1.46 0.08 0.9286 10.85 0.20 0.9910
0.5 25 2 0.05 0.42 0.31 0.9651 1.81 0.09 0.9115 0.65 0.08 0.8697 2.81 0.10 0.9360
2 25 2 0.05 6.96 0.85 0.9156 4.12 0.31 0.8850 0.99 0.23 0.8625 7.53 0.35 0.9078
4 0 2 0.2 0.52 0.28 0.9366 2.54 0.22 0.8997 0.73 0.18 0.9142 3.78 0.22 0.9450
4 25 2 0.2 0.23 0.18 0.9287 1.44 0.15 0.9504 0.56 0.19 0.9604 2.23 0.17 0.9736
4 50 2 0.2 0.55 0.35 0.9431 4.00 0.38 0.9417 1.58 0.37 0.9595 6.12 0.38 0.9527
0.5 25 1 0.05 0.06 0.58 0.9647 0.99 0.22 0.9370 0.37 0.10 0.8726 1.37 0.18 0.9340
0.5 25 5 0.05 2.97 1.08 0.8978 1.59 0.27 0.8922 1.08 0.30 0.9504 3.87 0.35 0.9580

134
Table 5-2: Coefficients of pseudo-first order kinetic model of Fenton reaction for fraction 1, fraction 2, fraction 3, and
TPH, for kinetic of combined EL-Fenton
Experimental Conditions Fraction 1 Fraction 2 Fraction 3 Total
𝐇𝟐𝐎𝟐,M EL% L/S Fe2+,M 𝐪𝐞 k R2 𝐪𝐞 k R2 𝐪𝐞 k R2 𝐪𝐞 k R2
0.1 25 2 0.05 0.54 0.05 0.9829 2.77 0.28 0.9585 1.05 0.28 0.9286 4.22 0.07 0.9837
0.5 25 2 0.05 0.12 0.72 0.9992 1.23 0.47 0.9977 0.46 0.46 0.9979 1.82 0.54 0.9985
2 25 2 0.05 0.17 0.13 0.9976 0.96 0.10 0.9969 0.33 0.12 0.9982 1.48 0.11 0.9975
4 0 2 0.2 0.17 0.62 0.9992 1.08 0.41 0.9809 0.36 0.44 0.9906 1.61 0.48 0.9925
4 25 2 0.2 0.11 0.83 0.9998 0.77 0.52 0.9961 0.26 0.49 0.9932 1.14 0.59 0.9979
4 50 2 0.2 0.12 0.25 0.9995 0.71 0.12 0.9858 0.29 0.11 0.9837 1.15 0.15 0.9924
0.5 25 1 0.05 0.00 0.62 0.9998 0.40 0.34 0.9918 0.24 0.37 0.9960 0.63 0.37 0.9948
0.5 25 5 0.05 0.05 0.33 0.9326 0.56 0.32 0.9445 0.33 0.67 0.8569 0.94 0.36 0.9282

135
5.2.2 Effect of adding zero valent nanomaterial
Figure 5- shows the results of removal efficiency versus time at different nano
concentration with comparison with two concentrations of Fe2+. As it can be
seen from the graphs with increasing the concentration of nano the removal
efficiency increased. And in comparison with Fe2+, Fe2+=0.14g/gsoil has the
lowest removal efficiency and with increase to the two times, Fe2+=0.28g/gsoil,
the removal efficiency is almost equal to nano=0.1g/gsoil. It shows that almost
28 times in concentration of Fe2+ needs to reach the same removal efficiency of
the reaction with nano.

136
Fraction 1 Fraction 2
Fraction 3 TPH
Figure 5-6: Fenton reaction with Fe2+ and zero valent nanomaterial, Fe2+=0.14g/gsoil,
Fe2+=0.28g/gsoil, nano=0.02g/gsoil, nano=0.05g/gsoil, nano=0.1 g/gsoil
5.2.3 Effect of HA on Fenton reaction
5.2.3.1 Characterization of derived HA, soil, and soil treated with EL
Figure 5-6 shows the FTIR spectra for HA. H-bonded OH groups of alcohols,
phenols and organic acid as well H-bonded NH groups were represented at
91
92
93
94
95
96
97
98
99
100
101
0 100 200 300
Rem
oval
eff
icie
ncy
%
time (min)
Nano=0.02g/gsoil Nano=0,Fe2+=0.28g/gsoil
Nano=0, Fe2+=0.14g/gsoil Nano=0.05g/gsoil
Nano=0.1g/gsoil
60
65
70
75
80
85
90
95
100
0 100 200 300
Rem
oval
eff
icie
ncy
%
time (min)
Nnao=0.02g/gsoil Nano=0,Fe2+=0.28g/gsoil
Nano=0,Fe2+=0.14g/gsoil Nano=0.05g/gsoil
Nano=0.1g/gsoil
70
75
80
85
90
95
0 100 200 300
Rem
oval
eff
icie
ncy
%
time (min)
Nano=0.02g/gsoil Nano=0,Fe2+=0.28g/gsoil
Nano=0,Fe2+=0.14g/gsoil Nano=0.05g/gsoil
Nano=0.1g/gsoil
70
75
80
85
90
95
100
0 100 200 300
Rem
oval
eff
icie
ncy
%
time (min)
Nano=0.02g/gsoil Nano=0,Fe2+=0.28g/gsoil
Nano=0,Fe2+=0.14g/gsoil Nano=0.05g/gsoil
nano=0.1g/gsoil

137
3400-3330 cm−1, conjugated carbonylic C=O was detected at a small shoulder
at 1726 cm−1, C=O conjugated and C=C in aromatic structure could be detected
at 1630 cm−1; a small shoulder at 1550-1570 cm−1 was attributed to amide and
carboxylate C=O and a peak at 1430 cm−1 showed the C–H deformation of CH2
or CH3 groups (Castaldi et al., 2005). There are contradictory results related to
the role of aromatic and aliphatic fraction in sorption/desorption processes.
Chefetz et al. (2000) reported tha the attraction of nonionic compounds to the
aromatic moieties is higher than the attraction to the aliphatic functional groups.
On the other hand, based on the study done by Eriksson et al. (2004), aliphatic
carbon plays a more significant role in hydrophobic partitioning.
Single C–O bond in carboxylic acids, esters and ethers could be detected at
approximately 1200 cm−1(Castaldi et al., 2005). Carboxylic groups play
important roles in the acidic nature of HA and it will affect the Fenton reaction
and without pH adjustment it can favour the Fenton reaction. But it is reported
that HA structure does not change with Fenton oxidation (Sun et al., 2007).
The peaks at 1006–1122 cm−1 belonged to C–O stretching. The peaks at 1000–
1100 cm−1 were assigned to the characteristics of P–O=R esters and the peak at
1014–1024 cm−1 showed the characteristics of C–O–C/C–O (Liu et al., 2015).
The peak at 740–779cm−1 was interpreted as C–O–C or C–H stretching
vibrations. The strong peak at 484–534 cm−1 was attributed to P–Cl and the
peak at 469–457 cm−1 was associated with C–X (halogen) stretching (Liu et al.,
2015).
HA rearranges itself in this way that its hydrophilic moieties, such as carboxyl,
phenols and hydroxyl groups, are outward which will form micelle formation

138
that have detergency properties, also are the best sequestrating agents (Salati et
al., 2011).
Figure 5-6: Fourier transform infrared (FTIR) spectra of HA
The FTIR spectra of soil, soil after reaction with EL and the spectra of HA are
illustrated in Figure 5-7. It should be noted that the spectra of soil in comparison
with the other two cases had lower intensities and by displaying all of them on
the same axes, not all peaks could be observed in detail. As shown in Figure 5-
7, the separated part had the same peaks as the original soil, but with higher
intensities. It could be deducted that EL could separate the organic matter of the
soil after contact, and among different fractions of organic matters, it seemed
that the HA was the main fraction or at least part of the organic matter with the
same functional groups as the HA. Among the absent functional groups of HA
0
20
40
60
80
100
120
0 500 1000 1500 2000 2500 3000 3500 4000 4500
Tra
nsm
mit
ance
(T
%)
Wavelength (cm-1)

139
in the contacted soil with EL and soil, was the peak at 3100-3650 cm−1 which
belonged to H-bonded OH groups.
a.
b.
c.
Figure 5-7: FTIR spectra of a: soil, b: soil after treatment with EL, c: HA
93
94
95
96
97
98
99
100
101
102
103
0 1000 2000 3000 4000 5000
Tran
smm
itan
ce (
T%)
wavelength (cm-1)
0
20
40
60
80
100
120
140
160
0 1000 2000 3000 4000 5000
Tran
smm
itan
ce (
T%)
wavelength (cm-1)
0
20
40
60
80
100
120
0 1000 2000 3000 4000 5000
Tran
smit
tan
ce (
T)%
wavelength (cm-1)

140
5.2.3.2 Effect of HA dosage on removal efficiency
The effect of HA, which is one of the main fractions of SOM, dosage on removal
efficiency of the three fractions and TPH was monitored at four dosages of 10
mg/l, 50 mg/l, 100 mg/l and 150 mg/l at pH=2.7. Figure 5-8 presents the changes
in removal efficiency versus time at different HA dosages. As explained earlier
in Chapter 2, there are two opposing effects on Fenton reaction in the presence
of HA. First is the consumption of hydroxyl radicals by HA and second is the
reduction of Fe3+ to Fe2+ by HA. For the case of HA=10 mg/l, the removal
efficiency for fractions 2, 3 and TPH was lower than at HA=0. The efficiency
was also lower than all other cases with higher HA values. Meanwhile, for
fraction 1, the efficiency at HA=10 mg/L was higher than at HA=0 and lower
than higher HA dosage.
The observed results implied that for fraction 1, at HA=10mg/l, the effect of
reducing Fe3+ to Fe2+ was the dominant factor. Thus, the removal efficiency
increased from 96.26% for fraction 1 at HA=0% to 97.54% at HA=10% after 4
h. By increasing the dosage of HA to 50 mg/l, 100 mg/l and 150 mg/l for fraction
1, the effect of reducing Fe3+ to Fe2+ played a more significant role than the
consumption of hydroxyl radical. As a result, the removal efficiency increased.
The difference in efficiency between HA=50 mg/l and HA=100 mg/l was larger
than the difference between HA=100 mg/l and HA=150 mg/l.
For fractions 2 and 3, the effect of hydroxyl radical consumption was more
important. For fraction 2, in the case of HA=150 mg/l, its removal efficiency
was higher than at HA=0. For fraction 3, HA=0 had the biggest removal
efficiency although the value of HA=150 was very close to HA=0. It could be

141
deducted that the two effects of consumption of hydroxyl radicals and reduction
of Fe3+ to Fe2+ were offset at HA=0 for fraction 3. With an increase in the
molecular weight of the three fractions, the negative effect of consumption of
H2O2 became more significant than for the lighter fractions. For TPH, the results
reflected the summation of the effects of all three fractions. Here, the case of
HA=150 mg/l had the highest removal efficiency and HA=100 mg/l had values
with insignificant differences to that of HA=0. The results indicated that the
positive effect of HA increased with an increase in its dosage. Based on the
results discussed here, it could be deduced that there is an optimum value for
HA in exerting an overall positive effect on Fenton reaction, which is dependent
on the soil properties, pollutants and possibly the H2O2 and Fe2+ initial
concentration.
Figure 5-9 illustrates the effect of HA on the removal efficiency at pH=5.
Experiments were carried out at pH=5 with and without HA. It could be
observed that by addition of HA=10 mg/l led to an increase in the removal
efficiency for fractions 1, 2 and TPH, but resulted in a decrease in the removal
efficiency for fraction 3. Similar to the cases at pH=2.7, an increase in the
molecular weight led to a decrease in the positive effect of HA.
For evaluating the effect of pH, the results for HA=10mg/l in figure 5-8, 5-9. As
it can be deducted from the graphs the removal efficiency at pH=2.7 is higher
than pH=5, as it was explained before, the Fenton reaction with Fe2+ is more
active at lower pH values because Fe2+ is soluble in acidic range and it is likely
to precipitate in higher pH range (Watts et al., 2005).

142
Fraction 1 Fraction 2
Fraction 3 TPH
Figure 5-8: Removal efficiency at H2O2= 0.5M, at constant Fe2+=0.05 M, LS=2, fraction 1, fraction
2, fraction 3 and TPH
93
94
95
96
97
98
99
100
101
0 50 100 150 200 250 300
Rem
oval
eff
icie
ncy
%
time (min)
HA=0mg/l HA=10mg/l HA=50mg/l
HA=150mg/l HA=100mg/l
65
70
75
80
85
90
95
0 50 100 150 200 250 300
Rem
oval
eff
icie
ncy
%
time (min)
HA=0mg/l HA=10mg/l HA=50mg/l
HA=150mg/l HA=100mg/l
78
80
82
84
86
88
90
92
94
0 50 100 150 200 250 300
Rem
oval
eff
icie
ncy
%
time (min)
HA=0mg/l HA=10mg/l HA=100mg/l
HA=150mg/l HA=50mg/l
70
75
80
85
90
95
0 50 100 150 200 250 300Rem
oval
eff
icie
ncy
%
time (min)
HA=0mg/l HA=10mg/l HA=50mg/l
HA=100mg/l HA=150mg/l
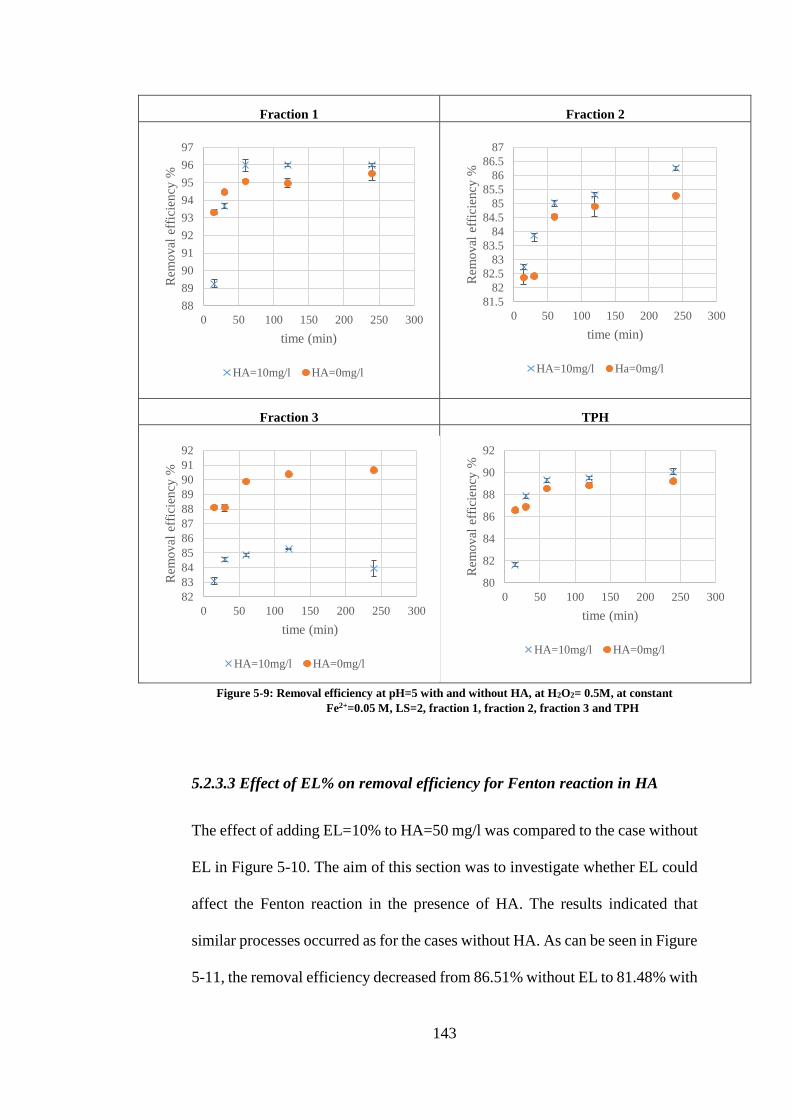
143
Fraction 1 Fraction 2
Fraction 3 TPH
Figure 5-9: Removal efficiency at pH=5 with and without HA, at H2O2= 0.5M, at constant
Fe2+=0.05 M, LS=2, fraction 1, fraction 2, fraction 3 and TPH
5.2.3.3 Effect of EL% on removal efficiency for Fenton reaction in HA
The effect of adding EL=10% to HA=50 mg/l was compared to the case without
EL in Figure 5-10. The aim of this section was to investigate whether EL could
affect the Fenton reaction in the presence of HA. The results indicated that
similar processes occurred as for the cases without HA. As can be seen in Figure
5-11, the removal efficiency decreased from 86.51% without EL to 81.48% with
88
89
90
91
92
93
94
95
96
97
0 50 100 150 200 250 300
Rem
oval
eff
icie
ncy
%
time (min)
HA=10mg/l HA=0mg/l
81.5
82
82.5
83
83.5
84
84.5
85
85.5
86
86.5
87
0 50 100 150 200 250 300
Rem
oval
eff
icie
ncy
%
time (min)
HA=10mg/l Ha=0mg/l
82
83
84
85
86
87
88
89
90
91
92
0 50 100 150 200 250 300
Rem
oval
eff
icie
ncy
%
time (min)
HA=10mg/l HA=0mg/l
80
82
84
86
88
90
92
0 50 100 150 200 250 300
Rem
oval
eff
icie
ncy
%
time (min)
HA=10mg/l HA=0mg/l

144
EL=10% for TPH at 4 h. As previously explained, EL could hinder the Fenton
reaction at high concentrations. However, in the case without HA, the optimum
EL% was 10%. The results showed that HA led to the change in this optimum
value. It has been reported in the literature that adsorption of pollutants by
organic matters could hinder their engagement in Fenton reaction (Lindsey et
al., 2000; Georgi et al., 2007).
Fraction 1 Fraction 2
Fraction 3 TPH
Figure 5-10: Effect of EL on removal efficiency with HA=50mg/l, at H2O2= 0.5M, at constant
Fe2+=0.05 M, LS=2, fraction 1, fraction 2, fraction 3 and TPH
60
65
70
75
80
85
90
95
100
0 50 100 150 200 250 300
Rem
oval
eff
icie
ncy
%
time (min)
EL=10% EL=0%
0
10
20
30
40
50
60
70
80
90
100
0 50 100 150 200 250 300
Rem
oval
eff
icie
ncy
%
time (min)
EL=10% EL=0%
0
20
40
60
80
100
0 50 100 150 200 250 300
Rem
oval
eff
icie
ncy
%
time (min)
EL=10% EL=0%
0
20
40
60
80
100
0 50 100 150 200 250 300
Rem
oval
eff
icie
ncy
%
time (min)
EL=10% EL=0%

145
5.2.3.4 Kinetic of Fenton reaction
Two kinetic models have been used for modelling the kinetic data, the power
law kinetic and pseudo-first order kinetic equations based on Eqs (5-12),(5-13)
and (5-14). Second order kinetic equation was fitted but the correlation
coefficient was low, the results are reported in Appendix 3. Table 5-3 lists the
coefficients of the power law equation while Table 5-4 lists the coefficients of
the pseudo-first order equation which were determined by curve-fitting. The
close values of coefficient of correlation, R2, to 1, indicated a good fit of data to
both models. As can be seen from Table 5-4, by increasing the HA dosage, the
𝑞𝑒 decreased for all three fractions and TPH, as was expected. Meanwhile, the
first order reaction constant, k, for TPH increased from HA=10 mg/l to HA=150
mg/l. Kp values for all sets of experiments had the biggest value for fraction 2,
followed by fraction 3 and were lowest for fraction 1. qe reported from the
pseudo-first order kinetic model had the biggest value for fraction 2, followed
by fraction 3 and finally, fraction 1.

146
Table 5-3: Coefficients of two constant power law kinetic model of Fenton reaction for fraction 1, fraction 2, fraction 3, and TPH, for kinetic
of Fenton in different HA dosages
Experimental
Conditions Fraction 1 Fraction 2 Fraction 3 TPH
𝐇𝐀 𝐦 Kp R2 𝐦 Kp R2 𝐦 Kp R2 𝐦 Kp R2
0 0.184 0.069 0.9131 0.094 0.309 0.9489 0.113 0.130 0.8394 0.109 0.507 0.9809
10 0.107 0.072 0.9965 0.127 0.662 0.9906 0.088 0.222 0.9397 0.115 0.953 0.9967
50 0.116 0.026 0.9703 0.162 0.489 0.9758 0.077 0.152 0.9367 0.134 0.654 0.9613
100 0.282 0.016 0.7895 0.052 0.275 0.9222 0.129 0.150 0.8784 0.075 0.430 0.9588
150 0.521 0.015 0.8846 0.103 0.225 0.8350 0.083 0.120 0.9788 0.100 0.354 0.9062

147
Table 5-4: Coefficients of pseudo-first order kinetic model of Fenton reaction for fraction 1, fraction 2, fraction 3, and TPH, for kinetic of Fenton in
different HA dosages
Experimental
Conditions Fraction 1 Fraction 2 Fraction 3 TPH
𝐇𝐀 𝐪𝐞 k R2 𝐪𝐞 k R2 𝐪𝐞 k R2 𝐪𝐞 k R2
0 0.031 0.70 0.9997 0.205 0.24 0.9991 0.077 0.23 0.9999 0.312 0.22 0.9993
10 0.045 0.29 0.9998 0.374 0.16 0.9952 0.150 0.22 0.9990 0.585 0.18 0.9961
50 0.015 0.34 0.9997 0.236 0.17 0.9981 0.107 0.24 0.9998 0.357 0.19 0.9989
100 0.004 0.34 0.9998 0.218 0.27 0.9998 0.086 0.26 0.9990 0.309 0.25 0.9995
150 0.001 0.36 0.9989 0.140 0.23 0.9999 0.083 0.27 0.9998 0.224 0.26 0.9999

148
5.2.4 Result and discussion of optimization by RSM
5.2.4.1 Design of experiments by RSM
The relationship between the removal efficiency of TPH and the three
independent variables, HA, EL and pH, were studied. The three factors were
coded in 5 levels as reported in Table 5-5. The experimental design and the
values of removal efficiency for each run are summarised in Appendix 2.
Table 5-5: variables and their coded and actual values
Variables Units Coded values
-1.633 -1 0 +1 +1.633
HA mg/l 18.35 50 100 150 181.65
EL % 10.50 20 35 50 59.49
pH - 2.05 3 4.5 6 6.95
5.2.4.2 Regression model and statistical analysis
The correlation of response for the removal efficiency of TPH with the three
independent variables based on a polynomial equation in terms of coded values
is expressed as Eq. (5-18).
TPH=79.53-1.74*A-5.87*B+2.07*C-1.10*B2+1.46*A*C-2.23*B*C Eq. (5-18)
Analysis of variance (ANOVA) evaluation of this model is shown in Table 5-7.
For evaluation of how well this equation could describe the results, the F-value,
R2, p-value and lack of fit were calculated. The significance of each term was
determined by p-value test. When the p-value is smaller than 0.05, it means that
the term is significant. The linear value of A, B, and C, quadratic value of
variables B and interaction of AC and BC were significant. The F-value of

149
quadratic term of B had a smaller F-value than the corresponding linear term of
B. The lack of fit for F-value was 4.23 implying that the lack of fit was not
significant relative to pure error.
Table 5-7: Analysis of variance table [Partial sum of squares]
Source Sum of
Squares
DF Mean
square
F value Prob > F
Block 3.14 1 3.14 Irrelevent
Model 629.10 6 104.85 82.58 < 0.0001 Significant
A 40.39 1 40.39 31.82 0.0001 Irrelevent
B 458.90 1 458.90 361.45 < 0.0001 Irrelevent
C 56.93 1 56.93 44.84 < 0.0001 Irrelevent
B2 16.02 1 16.02 12.62 0.0040 Irrelevent
AC 17.02 1 17.02 13.41 0.0033 Irrelevent
BC 39.83 1 39.83 31.37 0.0001 Irrelevent
Residual 15.24 12 1.27 Irrelevent
Lack of
fit
13.62 8 1.70 4.23 0.0901 Not
significant
Pure
Error
1.61 4 0.40 Irrelevent
Cor Total 647.47 19 Irrelevent
Whether the distribution of residuals, the deviation between predicted and actual
values, followed a normal distribution was analysed to determine the adequacy
of the model. If the distribution of the model followed a normal distribution, this
meant that the experimental error was random. By normalizing the residuals
with respect to their standard deviations, the studentiszed residuals was obtained
and a normal distribution function was fitted to them. This predicted studentized
residuals by the best-fit distribution were plotted against the experimentally

150
obtained studentized residuals in Figure 5-11(a). The straight line formed in
Figure 5-11(a) implies that the studentized residuals follow a normal distribution
(Salahi et al., 2013). The studentized residuals versus predicted removal
efficiency of TPH is plotted in Figure 5-11(b). As expected, this plot was a
random scatter implying that the variation in the original observations and the
value of the response are not related to each other.
In Figure 5-12(c), the outlier t plot that indicates the magnitude of the residuals
for each run for all runs of removal efficiency of TPH is depicted. Typically, a
limit of three standard deviations is defined as a boundary of an outlier. In Figure
5-12(c), all data were located inside this interval that demonstrated the
consistency of the model for all the data. The actual and predicted removal
efficiency of TPH by Eq. (5-18) are plotted in Figure 5-12(d). All of these graphs
were produced by software Design-Expert 7.1.

151
a
b
c
d
Figure 5-11: (a) Normal% probability and studentized residual plot. (b) The studentized residuals
and predicted response plot. (c) The outlier t plot (d) The actual and predicted plot
5.2.4.3 The effect of pH and EL on TPH removal efficiency
The removal efficiency of TPH at different HA and pH is shown in Figure 5-
12(a) at EL=35%. Based on the information on Figure 5-12(a), a decrease in EL

152
and an increase in pH led to the increase in removal efficiency of TPH. By
decreasing EL and increasing pH, the removal efficiency of TPH increased. The
maximum value of removal efficiency with increase in HA had occurred in a
wider range of EL and after about HA=97mg/l, higher values of pH resulted.
5.2.4.4 The effect of HA and EL on TPH removal efficiency
The removal efficiency of TPH at different HA and pH is shown in Figure 5-13
(b) at HA=100mg/l. By increasing EL%, the maximum removal efficiency of
TPH occurred in a wider HA limit and at higher pH values. The maximum value
of the removal efficiency, 80.60%, had disappeared at approximately EL=38%.
After approximately EL=42%, the maximum removal efficiency occurred at
low HA and pH values.

153
a.
b.
Figure 5-12: a. the effect of pH and EL on removal efficiency of TPH at constant HA=100mg/l, b.
the effect of pH and HA on removal efficiency of TPH at constant EL=35%

154
5.2.4.5 Process optimization and verification
The optimum conditions for maximum removal efficiency of TPH based on HA,
EL, and pH were determined from the predictive equation of RSM. The
maximum removal efficiency of TPH was predicted at HA=51.76mg/l,
EL=20.93%, and pH=5.99. The experiment was conducted at these values. The
predicted value by the RSM equation and the value obtained from the
experiment were compared to verify the validity of the model. The predicted
value was 88.48% while the measured value was 84.93%, a difference of 3.55%,
which verified the validity of the model.
5.3 Concluding Remarks
This work studied the effects of EL%, H2O2 concentration and L/S on Fenton
oxidation of TPH in contaminated soil. Increasing H2O2 concentration from 0.1
M to 2 M at L/S=2 and EL=25% increased the removal efficiency of TPH after
4 h from 68.41% to 90.21%. By increasing EL% from 10% to 68%, the removal
efficiency for TPH decreased from 96.74% to 89.6%, respectively. The lowest
L/S, i.e. L/S=1, had the highest TPH removal efficiency of 85.77%. An optimum
EL% of 10% was determined from parametric batch studies to increase the
Fenton reaction efficiency. The EL-based Fenton reaction changed the
distribution of the three fractions in TPH, by decreasing the percentage of
fraction 1 and increasing the percentage of fractions 2 and 3. The data from
kinetic experiments fitted well to the power law kinetic and pseudo-first order
equations. Addition of HA and its effect on removal efficiency of TPH by
Fenton reaction showed increase for fraction 1 from HA=10 mg/l and increase
for fraction 2 for HA=150mg/l and no increase till addition of HA=150mg/l for

155
fraction 3. RSM was carried out to consider the effects and interactions of three
variables s, HA, EL% and H2O2 and to optimize the process. The results showed
that a decrease in EL and an increase in pH at constant EL=35% led to increased
removal efficiencies. The optimum conditions for maximum removal efficiency
of TPH were at HA=51.76mg/l, EL=20.93%, and pH=5.99. The predicted TPH
removal efficiency with the close value with the experimental value verified the
validity of the model.

156
CHAPTER 6: ETHYL LACTATE-FENTON
COLUMN STUDIES FOR REMEDIATION
OF TPH-CONTAMINATED SOIL
6.1. Introduction
Column study is used for simulating the situation in real cases of in-situ field
application. By comparison with batch experiment in terms of weight of studied
soil, 30 times more soil was examined. The prediction of the economic aspect
of Fenton reaction depends on having information regarding to this treatment in
large scale. One of the major costs in this area is providing the reagents thus
determining the optimum values of the related variables to the reagent is crucial.
Besides the economic issues, some practical matters, such as the existence of
H2O2 in the presence of EL, also need consideration. Since column experiments
are a better representative of in-situ soil remediation treatments than batch
experiments, this chapter aims to explore EL-Fenton for remediation of TPH-
contaminated soil via column setup. The effects of different variables, i.e.
overall L/S, EL% and H2O2 concentration on TPH removal have been
investigated. Additionally, the effects of EL on H2O2 stability was also studied.
157
6.2. Results and Discussion
6.2.1. Effect of H2O2 concentration on remaining diesel in soil
Figure 6-1 shows the effect of increasing H2O2 molarity on the remaining diesel
in soil. By increasing the H2O2 molarity from 0.1 M to 0.5 M, the remaining
diesel in soil decreased from 154.66 mg/kg soil to 107.52 mg/kg soil in section
5 for TPH. However, further increase in H2O2 molarity up to 2 M led to an
increase till 122.09 mg/kg of remaining diesel for TPH in soil. It has been
reported that H2O2 can act as a quencher of OH° radicals and there is an optimum
value for H2O2 concentration (Huling et al., 2001; Georgi et al., 2007). There
are reported results related to a decrease in the removal efficiency due to the
increase in H2O2 concentration while in some other cases, no changes were
reported (Ferrarese et al., 2008; Yeh et al., 2008). The observed results in Figure
6-1 suggested that the optimum value for H2O2 molarity was less than 2 M. For
fraction 1, after this optimum value at approximately 0.5 M, the remaining diesel
in soil had not changed with increase in H2O2 concentration while for fractions
2, 3 and TPH, the remaining diesel in soil increased after this optimum value.
By moving from section 1 at the top of the column to section 5 at the bottom of
the column, the remaining diesel in soil had increased as could be expected. The
higher concentration of the Fenton reagents at the entrance at the top of the
column resulted in more destruction of TPH.

158
Fraction 1 Fraction 2
Fraction 3 TPH
Figure 6-1: Remaining diesel in soil at H2O2= 0.1M, 0.5M, and 2M at constant Fe2+=0.05 M,
EL=10%, and LS=1/2, fraction 1, fraction 2, fraction 3 and TPH
6.2.2. Effect of overall soil slurry volume, L/S, on remaining diesel in soil
In Figure 6-2, the effect of overall L/S is depicted. It should be noted here that
each section is representing different L/S ratio. The L/S of the final section is
considered as the overall L/S. As can be observed, the remaining of diesel had
0
5
10
15
20
25
30
35
40
0 2 4 6
Rem
ainin
g d
iesl
e in
so
il (
mg/k
gso
il)
Section
H2O2=0.1M H2O2=0.5M H2O2=2M
0
10
20
30
40
50
60
70
80
0 2 4 6Rem
ainin
g d
iese
l in
so
il (
mg/k
gso
il)
Section
H2O2=0.1M H2O2=0.5M H2O2=2M
0
5
10
15
20
25
30
35
40
45
50
0 2 4 6Rem
ainin
g d
iesl
e in
so
il (
mg/k
gso
il)
Section
H2O2=0.1M H2O2=0.5M H2O2=2M
0
20
40
60
80
100
120
140
160
180
0 2 4 6Rem
ainin
g d
iesl
e in
so
il (
mg/k
gso
il)
Section
H2O2=0.1M H2O2=0.5M H2O2=2M

159
not changed considerably. This showed that increase in L/S did not have a
significant effect on the remaining diesel in soil. This is potentially helpful in
determining the amount of Fenton reagents for field applications. The remaining
diesel in soil had increased from section 1 to section 5, as expected and
previously explained due to the higher concentration of Fenton at the top of the
column.

160
Fraction 1 Fraction 2
Fraction 3 TPH
Figure 6-2: Remaining diesel in soil at L/S=1/3, 1/2, 1 at constant H2O2=0.5 M, Fe2+=0.05M, and
EL=10%, fraction 1, fraction 2, fraction 3 and TPH
6.2.3. Effect of EL% on remaining diesel in soil, H2O2, and velocity
The results of the effect of EL% on remaining diesel in soil are illustrated in
Figure 6-3. The experiment without EL had the lowest remaining TPH in soil.
By increasing the EL%, the remaining TPH increased from 93.41 mg/kg soil for
EL=10% to 565.64 mg/kg soil for EL=50% at section 5 for TPH which was the
highest remaining TPH value in soil. This could possibly be caused by the more
0
1
2
3
4
5
6
7
8
9
0 2 4 6
Rem
ainin
g d
iese
l in
so
il (
mg/k
gso
il)
Section
L/S=1 L/S=1/3 L/S=1/2
0
10
20
30
40
50
60
0 2 4 6
Rem
ainin
g d
iese
l in
so
il (
mg/k
gso
il)
Section
L/S=1 L/S=1/2 L/S=1/3
0
5
10
15
20
25
30
0 2 4 6
Rem
ainin
g d
iese
l in
so
il (
mg/k
gso
il)
Section
L/S=1 L/S=1/3 L/S=1/2
0
20
40
60
80
100
120R
emai
nin
g d
iese
l in
so
il (
mg/k
gso
il)
Section
L/S=1 L/S=1/3 L/S=1/2

161
reactive Fenton reagents in solutions with higher water content. For fraction 1,
both EL=10% and 25% did not have considerable differences as compared to
EL=0%. For fractions 2 and 3, the difference between EL=10% and EL=0% was
not significant, but the remaining diesel in soil for EL=25% had increased.
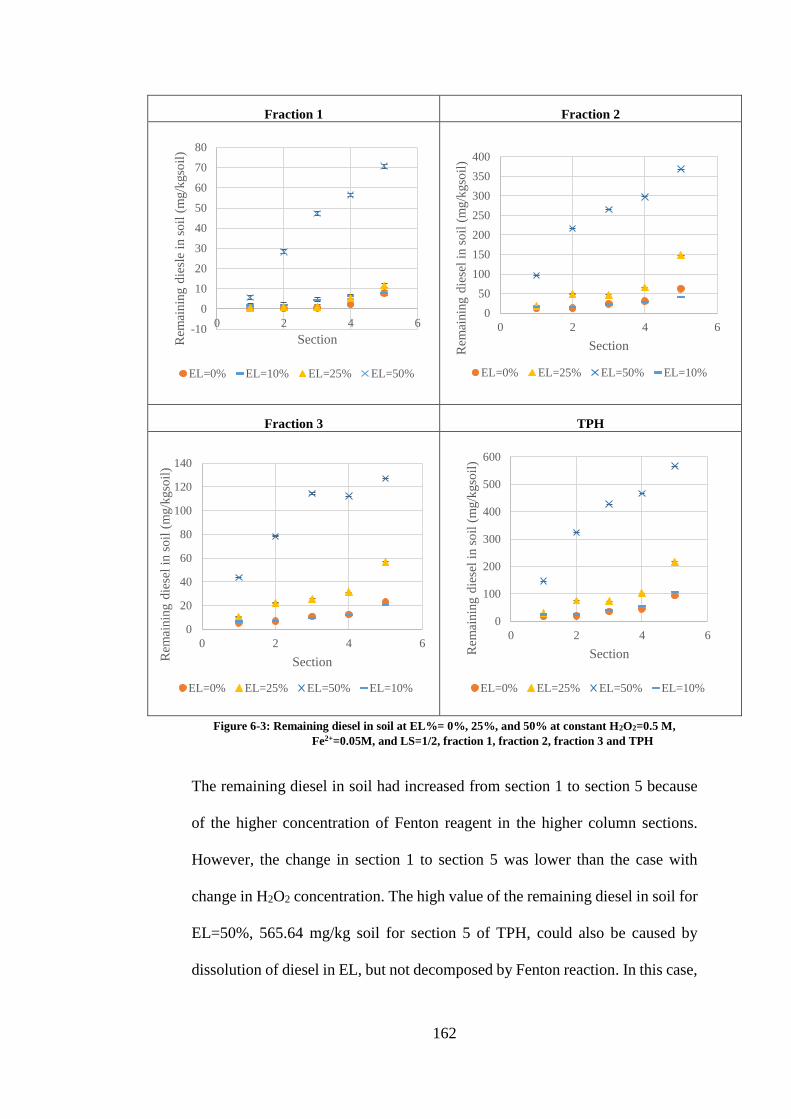
162
Fraction 1 Fraction 2
Fraction 3 TPH
Figure 6-3: Remaining diesel in soil at EL%= 0%, 25%, and 50% at constant H2O2=0.5 M,
Fe2+=0.05M, and LS=1/2, fraction 1, fraction 2, fraction 3 and TPH
The remaining diesel in soil had increased from section 1 to section 5 because
of the higher concentration of Fenton reagent in the higher column sections.
However, the change in section 1 to section 5 was lower than the case with
change in H2O2 concentration. The high value of the remaining diesel in soil for
EL=50%, 565.64 mg/kg soil for section 5 of TPH, could also be caused by
dissolution of diesel in EL, but not decomposed by Fenton reaction. In this case,
-10
0
10
20
30
40
50
60
70
80
0 2 4 6
Rem
ainin
g d
iesl
e in
so
il (
mg/k
gso
il)
Section
EL=0% EL=10% EL=25% EL=50%
0
50
100
150
200
250
300
350
400
0 2 4 6
Rem
ainin
g d
iese
l in
so
il (
mg/k
gso
il)
Section
EL=0% EL=25% EL=50% EL=10%
0
20
40
60
80
100
120
140
0 2 4 6
Rem
ainin
g d
iese
l in
so
il (
mg/k
gso
il)
Section
EL=0% EL=25% EL=50% EL=10%
0
100
200
300
400
500
600
0 2 4 6
Rem
ainin
g d
iese
l in
so
il (
mg/k
gso
il)
Section
EL=0% EL=25% EL=50% EL=10%

163
the dissolved diesel was transported with the liquid phase to the lower sections.
This finding indicated that choosing an appropriate percentage of solvent is
important as it can change the fate of the pollutants and in this case increase the
solubility and ultimately, availability of TPH. For this reason, the ratio of Fenton
reagents and EL should be chosen accordingly.
The H2O2 in the effluent were analysed to see how an increase in EL% could
change the H2O2 decomposition. Figure 6-4 shows the H2O2 in the effluent at
EL=0%, 10%, 25%, and 50%. As shown, by adding EL, the remaining H2O2 in
the effluent increased dramatically from the case without EL, EL=0%, to the
higher EL% values from C/C0=0.03 for EL=0% to C/C0=0.32 for EL=50% after
15 min for TPH. This suggested that EL increased the stability of H2O2. By
increasing EL% from 10% to 50%, the H2O2 in the effluent had increased
slightly. One of the main issues in in-situ application of Fenton reaction is the
instability of H2O2 and its decomposition at 1-2 m of injection point (Vicente et
al., 2011). This research indicated that EL can be an effective stabilizer for H2O2.
This property can be even more helpful for the aged contaminated soil as
desorption of the pollutants requires longer contact time. By choosing an
appropriately small value of EL, the stability of H2O2 can be increased.

164
Figure 6-4: Effect of EL% on H2O2 decomposition
The effect of EL% on velocity is depicted in Figure 6-5. As can be observed,
the flow with EL=10% had the highest velocity. This could be linked to the
increase in EL% which increased the density of the flow slightly leading to the
decrease in velocity. Conversely, in the case of EL=0%, the reaction was very
fast and was accompanied by bubbling on top of the column that resulted in
lower velocity.
Figure 6-5: Effect of EL% on velocity
0
0.1
0.2
0.3
0.4
0.5
0.6
0.7
0 2 4 6 8 10 12 14 16
C/C
0
time (min)
EL=0% EL=10% EL=25% EL=50%
0
0.5
1
1.5
2
2.5
0 10 20 30 40 50 60
Vel
oci
ty (
ml/
min
)
EL%
165
6.3 Concluding Remarks
To study the fate of petroleum hydrocarbons under field conditions, EL-Fenton
reactions were studied using column set-up. The effects of different variables
on remaining diesel in column set-up were examined. An increase in H2O2
molarity from 0.1 M to 0.5 M decreased the remaining diesel in soil while
further increase to 2 M led to an increase in the remaining diesel in soil. The
results showed that the destruction reaction had not changed by increasing the
overall L/S to more than L/S=1/3. An increase in EL increased the stability of
H2O2. C/C0 values for EL=0% and EL=50% after 15 min for TPH increased
from C/C0=0.03 to C/C0=0.32, respectively.

166
CHAPTER 7: CONCLUSIONS AND
RECOMMENDATIONS FOR FUTURE
WORK
7.1 Conclusions
This study reports a novel EL based Fenton treatment for the remediation of
diesel-contaminated soil. The applied solvent in this study, EL, is classified as
a green solvent. A sequential remediation process was studied starting with a
desorption pretreatment followed by Fenton oxidation. The main conclusions
derived from this study are summarised below.
Due to its unique properties, EL serves as an excellent solubilizing and
extracting agent. The removal efficiency via desorption of TPH in different
fractions was enhanced with addition of EL, and this solvent could even desorb
diffused contaminants which showed its potential in treating aged contaminated
soil. In desorption kinetic study, the existence of a very fast initial step followed
by a very slow and equilibrium step was detected. With the fluctuation in
desorption experiments, it was hypothesized that there were different
compartments with different adsorption/desorption affinities. Desorption
kinetics were well described by the pseudo-second order model. The effects of
different variables, EL%, L/S, and initial contamination levels, on the initial
desorption rate are examined. Increase in EL% leads to the increase in initial
desorption rate, increase in initial contamination level results in decrease in
initial desorption rate and L/S=2 had the lowest initial desorption rate.

167
At higher concentration, EL could hinder the Fenton reaction due to the
insolubility of FeSO4.7H2O in EL. On the other hand, it was proved that EL
could increase the stability of H2O2 in Fenton reaction, a property that is highly
desirable in field applications especially for remediation of sites with long
contamination history. The effects of EL%, H2O2 concentration and L/S on
Fenton oxidation of TPH in contaminated soil was investigated through
parametric batch studies. After 4 h, removal efficiency of TPH increased from
68.41% to 90.21% by increasing H2O2 concentration from 0.1 M to 2 M at
L/S=2 and EL=25%. By increasing EL% from 10% to 68%, the removal
efficiency for TPH decreased. The TPH removal efficiency had the highest
value of 85.77% for the lowest L/S=1. Fenton reaction had the highest TPH
removal efficiency for EL=10% . Based on the curve-fitting results of the Fenton
reaction, power law equation and pseudo-first order equation are reported as the
best equations that are able to model the results.
This study further extended previous findings regarding the effect of HA on
Fenton reaction. The results showed how the fractions with different molecular
weights responded to the increase in HA. Furthermore, HA addition for TPH till
100 mg/l was less than the HA=0 case with a value of 87.95%, and an increase
to HA=150 resulted in the increase in removal efficiency to 93.23%. The results
suggested the presence of an optimum value for HA which was mostly
dependent on the molecular weight of the pollutants for petroleum
hydrocarbons. Adding EL contributed towards making accessible the diffused
part of TPH.

168
The effects and interactions of three variables, HA (A), EL % (B), and pH (C),
on removal efficiency of Fenton reaction and finally optimization of the process
were studied by RSM. Based on the obtained results, increase in removal
efficiency was observed at constant EL=35% as a result of decrease in EL and
increase in pH. HA=51.76mg/l, EL=20.93%, and pH=5.99 are calculated as the
optimum values.
To study the fate of petroleum hydrocarbons under field conditions, the effects
of different Fenton variables on remaining diesel in column set-up were
examined. An increase in H2O2 molarity from 0.1 M to 0.5 M decreased the
remaining diesel in soil while further increase to 2 M led to an increase in
remaining diesel in soil. The results showed that the reaction was almost
complete for fraction 1 by passing the overall L/S=1/3 and higher than this value
did not affect the remaining diesel in soil. Meanwhile, for fractions 2 and 3 and
TPH, an increase from 1/3 to 1/2 and 1, respectively led to inconsiderable
decreases in remaining diesel. An increase in EL increased the stability of H2O2.
7.2 Recommendations for future work
The potential of EL in soil remediation requires further study in order to fully
develop its application in the area of soil remediation. Based on the findings of
this study, two main recommendations for future work are suggested as follows:
1. Study of EL-Fenton reaction with different iron catalysts, such as native
iron, Fe3+, or inorganic iron sources might shed light on the reaction of
these catalysts with H2O2.
2. Due to the high potential of EL for desorption of petroleum hydrocarbon
and the stability of H2O2 in EL, exploring the application of EL-based

169
Fenton treatment in actual contaminated sites would be helpful in
expanding the application of this green solvent.
170
References
Aksu Z. (2005) Application of biosorption for the removal of organic pollutants:
a review. Process Biochem 40:997–1026
Al-Abed S. R., Jegadeesan G., Purandare J., Allen D. (2008) Leaching behavior
of mineral processing waste: Comparison of batch and column investigations. J.
Hazard. Mater. 153(3):1088-1092
Albergaria J.T., Conceição M., Alvim-Ferraz M., and Delerue-Matos C. (2012)
Remediation of sandy soils contaminated with hydrocarbons and halogenated
hydrocarbons by soil vapour extraction. Journal of Environmental Management
104:195-201
Allen S.J., Mckay G., Porter J.F. (2004) Adsorption isotherm models for basic
dye adsorption by peat in single and binary component systems. J. Colloid
Interface Sci. 280:322–333
Altenor S., Carene B., Emmanuel E., Lambert J., Ehrhardt J.-J., Gaspard S.
(2009) Adsorption studies of methylene blue and phenol onto vetiver roots
activated carbon prepared by chemical activation. J. Hazard. Mater. 165:1029–
1039
Aparicio S., Alcalde R. (2009/a) The green solvent ethyl lactate: an experimental
and theoretical characterization. Green Chem.11:65-78
Aparicio S., Alcalde R. (2009/b) Insights into the ethyl lactate + water mixed
solvent. J. Phys. Chem. B, 113:14257–14269

171
Aparicio S., Halajian S., Alcalde R., Leal B. G. J. M. (2008) Liquid structure of
ethyl lactate, pure and water mixed, as seen by dielectric spectroscopy,
solvatochromic and thermophysical studies. J. Phys. Chem. Lett 454:49–55
Arias-Estévez M. (2012) Comparison of batch, stirred flow chamber, and
column experiments to study adsorption, desorption and transport of carbofuran
within two acidic soils. Chemosphere 88:106–112
Azizian S. (2004) Kinetic models of sorption: a theoretical analysis. J. Colloid
Interface Sci. 276:47–52
Bandala E.R., Pel´aez A.M., Salgado M.J., and Torres L. (2008) Degradation of
sodium dodecyl sulphate in water using solar driven Fenton-like advanced
oxidation processes J. Hazard. Mater.151:578–584
Barnier C., Ouvrard S., Robin C., and Morel J.L. (2014) Desorption kinetics of
PAHs from aged industrial soils for availability assessment. Sci Total Environ
470–471:639–645
Başar C. A. (2006) Applicability of the various adsorption models of three dyes
adsorption onto activated carbon prepared waste apricot. J. Hazard. Mater.
B135:232–241
Batzias F.A., Sidiras D.K. (2007) Simulation of dye adsorption by beech
sawdust as affected by pH. J. Hazard. Mater. 141:668–679
Bayley R.W., and Biggs C.A. (200/a) Characterisation of an attrition scrubber
for the removal of high molecular weight contaminants in sand. Chem. Eng. J.
111:71–79

172
Bayley R.W., and Biggs C.A. (200/b) Evaluation of the jet pump scrubber as a
novel approach for soil remediation. Process Safety and Environmental
Protection 83 (B4):381–386
Bermúdez-Couso A., Fernández-Calviño D., Rodríguez-Salgado I., Nóvoa
Muñoz J. C., Arias-Estévez M. (2012) Comparison of batch, stirred flow
chamber, and column experiments to study adsorption, desorption and transport
of carbofuran within two acidic soils. 88 (1):106-112
Besha A.T., Bekele D. N., Naidu R., Chadalavada S. (2017) Recent advances in
surfactant-enhanced in-situ chemical oxidation for the remediation of non-
aqueous phase liquid contaminated soils and aquifers. Environmental
Technology & Innovation. http://dx.doi.org/10.1016/j.eti.2017.08.004
Birdwell J., Cook R.L., Thibodeaux L.J. (2007) Desorption kinetics of
hydrophobic organic chemicals from sediment to water: A review of data and
models. Environ. Toxicol. Chem. 26 (3):424–434
Bogan B. W., and Trbovic V. (2003/a) Effect of sequestration on PAH
degradability with Fenton’s reagent: roles of total organic carbon, humin, and
soil porosity. J. Hazard. Mater. B100:285–300
Bogan B.W., Trbovic V., and Paterek J.R. (2003/b) Inclusion of vegetable oils
in Fenton's chemistry for remediation of PAH-contaminated soils. Chemosphere
50:15–21
Brusseau M.L., and Rao P.S.C. (1990) Modelling solute transport in structured
soils: A review. Geoderma 46:169-192

173
Reference method for the Canada-wide standard for petroleum hydrocarbons in
Soil - Tier 1 method, Canadian Council of Ministers of the Environment
(CCME)
Castaldi P., Alberti G. , Merella R., and Pietro Melis (2005) Study of the organic
matter evolution during municipal solid waste composting aimed at identifying
suitable variables for the evaluation of compost maturity. Waste Manage.
25:209–213
Chen C. T., Tafuri A. N., Rahman M., Foerst M. B. (1998) Chemical oxidation
treatment of petroleum contaminated soil using Fenton’s reagent. J. Environ.
Sci. Health. A33(6):987-1008
Chen G., Hoag G. E., Chedda P., Nadim F., Woody B. A., and Dobbs G. M.
(2001) The mechanism and applicability of in situ oxidation of trichloroethylene
with Fenton’s reagent. J. Hazard. Mater. 87:171–186
Cheng M., Zeng G., Huang D., Lai C., Xu P., Zhang C., Liu Y. (2015) Hydroxyl
radicals based advanced oxidation processes (AOPs) for remediation of soils
contaminated with organic compounds: a review. Chem. Eng. J. 284:582-598
Chern J.-M., Wu C.-Y. (2001) Desorption of dye from activated carbon beds:
effect sof temperature, pH, and alcohol. Wat. Res. 35(17)4159–4165
Connaughton D.F., Stedlnger J.R., Llon L.W., and Shuler M.L. (1993)
Description of Time-Varying Desorption Kinetics: Release of Naphthalene
from Contaminated Soils. Environ. Sci. Technol. 27:2397-2403
Contaminated Land Management and Control Guidelines No. 1: Malaysia
Recommended Site Screening Levels for Contaminated Soil Land

174
Cornelissen G., Van Noort P.C.M., Govers H.A.J. (1998) Mechanism of slow
desorption of organic compounds from sediments: A study using model
sorbents. Environ. Sci. Technol. 32:3124-3131
Cundy A. B., Hopkinson L., and Whitby R. L.D. (2008) Use of iron-based
technologies in contaminated land and groundwater remediation: A review. Sci.
Total Environ. 400: 42-51
Dąbrowski A. (2001) Adsorption_ from theory to practice. Adv. Colloid
Interface Sci. 93:135-224
Delay M., Lager T., Schulz H. D., and Frimmel F. H. (2007) Comparison of
leaching tests to determine and quantify the release of inorganic contaminants
in demolition waste. Waste Manage. 27:248–255
Doick K., Burauel P. , Jones K. C., Semple K. (2005) Distribution of aged 14C-
PCB and14C-PAH residues in particle-size and humic fractions of an
agricultural soil. Environ. Sci. Technol. 39:6575-6583
EPA 402-R-99-004B, United States Office of Air and Radiation, Environmental
Protection Agency, 1999
Fan C., Horng C-Y., Li S.-J. (2013) Structural characterization of natural
organic matter and its impact on methomyl removal efficiency in Fenton
process. Chemosphere 93:178–183
Ferguson S.H., Woinarski A.Z., Snape I., Morris C.E., and Revill A.T. (2004)
A field trial of in situ chemical oxidation to remediate long-term diesel
contaminated Antarctic soil. Cold Regions Science and Technology 40:47– 60

175
Ferrarese E., Andreottola G., Oprea I.A. (2008) Remediation of PAH-
contaminated sediments by chemical oxidation. J Hazard Mater 152:128–139
Foo K.Y., Hameed B.H. (2010) Insights into the modelling of adsorption
isotherm systems. Chem. Eng. J. 156:2–10
Georgi A., Schierz A., Trommler U., Horwitz C.P., Collins T.J., Kopinke F.-D.
(2007) Humic acid modified Fenton reagent for enhancement of the working
pH range. Appl. Catal., B: Environmental 72:26–36
Goi A., Kulik N., and Trapido M. (2006) Combined chemical and biological
treatment of oil contaminated soil. Chemosphere 63:1754–1763
Gong Z., Alef K., Wilke B-M., and Li P. (200/b) Dissolution and removal of
PAHs from a contaminated soil using sunflower oil. Chemosphere 58:291–298
Gong Z., Alef K., Wilke B-M., and Li P. (2007) Activated carbon adsorption of
PAHs from vegetable oil used in soil remediation. J. Hazard. Mater. 143:372–
378
Gong Z., Wang X., Tu Y., Wud J., Sun Y., and Li P. (2010) Polycyclic aromatic
hydrocarbon removal from contaminated soils using fatty acid methyl esters.
Chemosphere 79:138–143
Gong Z., Wilke B.-M., Alef K., and Li P. (2005/a) Influence of soil moisture on
sunflower oil extraction of Polycyclic Aromatic Hydrocarbons from a
manufactured gas plant soil. Sci. Total Environ. 343:51– 59
Gong Z., Wilke B.-M., Alef K., Li P., Zhou Q. (2006) Removal of polycyclic
aromatic hydrocarbons from manufactured gas plant-contaminated soils using
sunflower oil: Laboratory column experiments. Chemosphere 62:780–787

176
Grathwohl P., and Susset B. (2009) Comparison of percolation to batch and
sequential leaching tests: Theory and data. Waste Manage. 29:2681–2688
Gunasekara A. S., and Xing B. (2003) Sorption and desorption of Naphthalene
by soil organic matter: Importance of aromatic and aliphatic components. J.
Environ. Qual. 32:240–246
G¨unay A., Arslankaya E., Tosun ˙I. (2007) Lead removal from aqueous
solution by natural and pretreated clinoptilolite: Adsorption equilibrium and
kinetics. J. Hazard. Mater. 146:362–371
Guo H., Wang W., Sun Y., Li H., Ai F., Xie L., and Wang X. (2010) Ethyl
lactate enhances ethylenediaminedisuccinic acid solution removal of copper
from contaminated soils. . J. Hazard. Mater. 174:59–63
Gustafson J.B., Tell J. G., and Orem D. (1997) Selection of Representative TPH
Fractions Based on Fate and Transport Considerations. Total Petroleum
Hydrocarbon Criteria Working Group Series, 3
He L., Song J., Peng P. (2008) Characterization of extractable and non-
extractable polycyclic aromatic hydrocarbons in soils and sediments from the
Pearl River Delta, China. Environ. Pollut. 156:769–774
He Y., Xu J., Wang H., Zhang Q., Muhammad A. (2006) Potential contributions
of clay minerals and organic matter to pentachlorophenol retention in soils.
Chemosphere 65:497–505
Heath J. S., Koblis K., Sager S.L. (1993) Review of chemical, physical, and
toxicologic properties of components of total petroleum hydrocarbons. Journal
of Soil Contamination 2 (1)

177
Ho Y.-S., (2006/a) Second-order kinetic model for the sorption of cadmium onto
tree fern: A comparison of linear and non-linear methods. Water Res. 40:119 –
125
Ho Y.-S. (2006/b) Review of second-order models for adsorption systems. J.
Hazard. Mater. B136:681–689
Hossain M.A., Ngo H.H., Guo W.S., Setiadi T. (2012) Adsorption and
desorption of copper (II) ions onto garden grass. Bioresour. Technol. 121:386–
395
Ghosh U., Talley J. W., Luthy R. G. (2001) Particle-scale investigation of PAH
desorption kinetics and thermodynamics from sediment. Environ. Sci. Technol.
35:3468-3475
Guo H., Wang W., Sun Y., Li H., Ai F., Xie L., Wang X. (2010) Ethyl lactate
enhances ethylenediamine disuccinic acid solution removal of copper from
contaminated soils. J. Hazard. Mater. 174:59–63
Huang S.W., Chiang P.N., Liu J.C., Hung J.T., Kuan W.H., Tzou Y.M., Wang
S.L., Huang J.H., Chen C.C., Wang M.K., Loeppert R.H. (2012) Chromate
reduction on humic acid derived from a peat soil – Exploration of the activated
sites on HAs for chromate removal. Chemosphere l.87:587–594
Huang Y.-Y., Wang S.-L., Liu J.-C., Tzou Y.-M., Chang R.-R., Chen J.-H.,
(2008) Influences of preparative methods of humic acids on the sorption of
2,4,6-trichlorophenol. Chemosphere 70:1218–1227
Huling S. G., Arnold R. G., Siekra R. A., Miller M. R. (2001) Influence of peat
on Fenton oxidation Wat. Res. 35(7):1687–1694

178
Isosaari P., T. Tuhkanen, and T. Vartianen (2001) Use of olive oil for soil
extraction and ultraviolet degradation of polychlorinated dibenzo-p-dioxins and
dibenzofurans. Environ. Sci. Technol. 35(6):1259-1265
Jalilian A. S. P., Suyin Gan, Hoon Kiat Ng, Suhaimi Abdul Talib (2017)
Evaluation of ethyl lactate as solvent in Fenton oxidation for the remediation of
total petroleum hydrocarbon (TPH)-contaminated soil. Environ Sci Pollut Res,
24(21):17779-17789
Jamialahmadi N., Gitipour S., Jamialahmadi O., Baghdadi M. (2015)
Remediation of a Diesel-Contaminated Soil Using a Fenton-Like Advanced
Oxidation Process: Optimization by Response Surface Methodology. Soil
Sediment Contam: An International Journal, 24:609–623
Johnson M. D., Weber W. J. Jr. (2001) Rapid prediction of long-term rates of
contaminant desorption from soils and sediments. Environ. Sci. Technol.
35:427-433
Jones J., Pham T., Smart K., Splinter D., Steele M. (2003) Ethyl Lactate
Production. Capstone Design Project- University of Oklahoma
Jonsson S., Persson Y., Frankki S., van Bavel B., Lundstedt S., Haglund P. , M.
TysklindKanel S.R. (2007) Degradation of polycyclic aromatic hydrocarbons
(PAHs) in contaminated soils by Fenton’s reagent: A multivariate evaluation of
the importance of soil characteristics and PAH properties. J. Hazard. Mater.
149:86–96
Kalbe U., Berger W., Eckardt J., Simon F.-G. (2007) Evaluation of leaching and
extraction procedures for soil and waste. Waste Manag. 28(6):1027-1038

179
Kanel S.R., Neppolian B., Choi H., and Yang J.W. (2003) Heterogeneous
catalytic oxidation of phenanthrene by hydrogen peroxide in soil slurry:
kinetics, mechanism, and implication. Soil Sediment Contam 12(1):101-117
Kang N., Hua I. (2005) Enhanced chemical oxidation of aromatic hydrocarbons
in soil systems. Chemosphere 61:909–922
Kang N., Hua I., Rao P. S. C. (2006) Enhanced Fenton’s destruction of non-
aqueous phase perchloroethylene in soil systems. Chemosphere 63 (2006)
1685–1698
Kannan N., Sundaram M. M. (2001) Kinetics and mechanism of removal of
methylene blue by adsorption on various carbons—a comparative study. Dyes
Pigm 51 (2001) 25–40
Kawahara F. K., Davila B., Al-Abed S. R., Vesper S. J., Ireland J. C., Rock S.
(1995) Polynuclear aromatic hydrocarbon (PAH) release from soil during
treatment with Fenton’s reagent. Chemosphere. 31(9): 4131-4142.
Khan A. R., Al-Bahri T. A., Al-Haddad A. (1997/a) Adsorption of phenol based
organic pollutants on activated carbon from multi-component dilute aqueous
solutions. Wat. Res. Vol. 31(8):2102 2112
Khan A. R., Ataullah R., Al-Haddad A. (1997/b) Equilibrium adsorption studies
of some aromatic pollutants from dilute aqueous solutions on activated carbon
at different temperatures. J. Colloid Interface Sci. 194:154–165
Khan A. R., Riazi M. R., Al-Roomi Y. A. (2000) A thermodynamic model for
liquid adsorption isotherms. Sep. Purif. Technol. 18:237–250

180
Khodadoust A.P., Bagchi R., Suidan M.T., Brenner R.C., and Sellers N.G.
(2000) Removal of PAHs from highly contaminated soils found at prior
manufactured gas operations. J. Hazard. Mater. B80:159–174
Koshlaf E., Shahsavar E., Aburto-Medina A., Taha M., Haleyur N., Makadia T.
H., Morrison P. D., Ball A. S. (2016) Bioremediation potential of diesel-
contaminated Libyan soil. Ecotoxicol Environ Saf. 133:297–305
Kleineidam S., Schuth C., Grathwohl P. (2002) Solubility-Normalized
Combined Adsorption-Partitioning Sorption Isotherms for Organic Pollutants.
Environ. Sci. Technol. 36:4689-4697
Khodadoust A.P., Suidan M.T. Acheson C.M., and Brenner R.C. (1999) Solvent
extraction of Pentachlorohenol from contaminated soils using water-ethanol
mixtures. Chemosphere 38 (11):2681-2693
Kim I., Lee M. (2012) Pilot scale feasibility study for in-situ chemical oxidation
using H2O2 solution conjugated with biodegradation to remediate a diesel
contaminated site. J. Hazard. Mater. 241– 242:173– 181
Kong S.-H, Watts R. J., Choi J-H. (1998) Treatment of Petroleum-Contaminated
Soils Using Iron Mineral Catalyzed Hydrogen Peroxide. Chemosphere, 37
(8):1473-1482
Koranteng – Addo E.J, Owusu – Ansah E, Boamponsem L. K, Bentum J. K,
Arthur S. (2011) Levels of zinc, copper, iron and manganese in soils of
abandoned mine pits around the Tarkwa gold mining area of Ghana. Adv Appl
Sci Res. 2 (1): 280-288
Kosaka J., Honda C., Izeki A. (1961) Fractionation of humic acid by organic
solvents. J. Soil Sci. Plant Nutr. 7(2):48-53

181
Kulik N., Goi A., Trapido M., Tuhkanen T. (2006) Degradation of polycyclic
aromatic hydrocarbons by combined chemical pre-oxidation and bioremediation
in creosote contaminated soil. J. Environ. Manage. 78:382–391
Kumar K. V., Porkodi K. (2006) Relation between some two- and three-
parameter isotherm models for the sorption of methylene blue onto lemon peel.
J. Hazard. Mater. 138:633–635
Kumar P. S., Ramalingam S., Senthamarai C., Niranjanaa M., Vijayalakshmi P.,
Sivanesan S. (2010) Adsorption of dye from aqueous solution by cashew nut
shell: Studies on equilibrium isotherm, kinetics and thermodynamics of
interactions. Desalination 261:52–60
Kuppusamy S., Thavamani P., Venkateswarlu K., Lee Y. B., Naidu R.,
Megharaj M. (2016) Remediation approaches for polycyclic aromatic
hydrocarbons (PAHs) contaminated soils: Technological constraints, emerging
trends and future directions. Chemosphere. 1-25
Lee B-D, Hosomi M. (2001) Fenton oxidation of ethanol-washed distillation-
concentrated bBenzoa(a)pyrene: reaction product identification and
biodegradability. Wat Res 35(9): 2314–2319
Lee B-T., and Kim K-W. (2002) Ozonation of diesel fuel in unsaturated porous
media. Appl Geochem 17:1165–1170
Lee L.S., Zhai X., and Lee J. (2006) Lab testing and field implementation of soil
flushing. Joint Transportation Research Program Purdue Libraries
182
Leifeld J., and Kogel-Knabner I. (2001) Organic carbon and nitrogen in fine soil
fractions after treatment with hydrogen peroxide. Soil Biol Biochem 33:2155-
2158
Lewis J., and Sjöstrom J. (2010) Optimizing the experimental design of soil
columns in saturated and unsaturated transport experiments. J. Contam. Hydrol.
115:1–13
Li X., Dua Y., Wua G., Li Z., Li H., and Sui H. (2012) Solvent extraction for
heavy crude oil removal from contaminated soils. Chemosphere 88:245–249
Liao C., Chung T., Chen W., and Kuo S. (2007) Treatment of
pentachlorophenol-contaminated soil using nano-scale zero-valent iron with
hydrogen peroxide. J. Mol. Catal. A: Chemical 265:189–194
Lim M. W., Lau E. V., Poh P. E. (2016) A comprehensive guide of remediation
technologies for oil contaminated soil—Present works and future directions.
Marine Pollution Bulletin.
Lindsey M., Tarr M.A. (2000) Inhibition of hydroxyl radical reaction with
aromatics by dissolved natural organic matter. Environ. Sci. Technol. 34:444-
449
Liu Y., Li Q., Li Y., Bao J., Hu Z., Hao D., Song D., Wang Y., Yang M. (2015)
Detection of nanoscale soil organic matter by middle infrared spectrum for
forensic science. Hindawi Publishing Corporation Journal of Chemistry Volume
2015

183
Loehr R.C., Lamar M.R., and Poppendieck D.G. (2003) A protocol to estimate
of anthropogenic hydrocarbons from contaminated soils. Environ. Toxicol.
Chem. 22(9):2202–2208
Lu M., Zhang Z., Qiao W., Guan Y., Xiao M., and Chong Peng (2010/a)
Removal of residual contaminants in petroleum-contaminated soil by Fenton-
like oxidation. J. Hazard. Mater.179:604–611
Lu M., Zhang Z., Qiao W. ,Wei X., Guan Y., Maa Q., and Guan Y. (2010/b)
Remediation of petroleum-contaminated soil after composting by sequential
treatment with Fenton-like oxidation and biodegradation. Bioresour. Technol.
101:2106–2113
Lundstedt S., Persson Y., and Lars Oberg (2006) Transformation of PAHs
during ethanol-Fenton treatment of an aged gasworks’ soil. Chemosphere
65:1288–1294
Ma X.-H., Zhao L., Dong Y.-H., Chen H., Zhong M. (2018) Enhanced Fenton
degradation of polychlorinated biphenyls in capacitor-oil contaminated soil by
chelating agents. Chem. Eng. J. 333:370–379
Maurya N. S., Mittal A. K., Cornel P., Rother E. (2006/a) Biosorption of dyes
using dead macro fungi: Effect of dye structure, ionic strength and pH.
Bioresour. Technol. 97:512–521
Maurya N. S., Mittal A. K. (2006/b) Applicability of Equilibrium Isotherm
Models for the Biosorptive Uptakes in Comparison to Activated Carbon-Based
Adsorption. J. Environ. Eng. 1589-1599

184
McKay G. (1983) The Adsorption of dyestuffs from aqueous solutions using
activated carbon. III. Intraparticle diffusion processes. J. Chem. Tech.
Biotechnol. 33A:196-204
Mackay D., Shui W.Y., and Ma K.C. (1999) Illustrated Handbook of physical-
chemical properties and environmental fate for organic chemicals. vol.1-4.
Lewis Publishers, Chelsea, MI.
Mann M.J. (1999) Full-scale and pilot-scale soil washing. J. Hazard.
Mater.66:119–136
Mater L., Sperb R.M., Madureira L.A.S., Rosin A.P., Correa A.X.R., and
Radetski C.M. (2006) Proposal of a sequential treatment methodology for the
safe reuse of oil sludge-contaminated soil. J. Hazard. Mater.B136:967–971
Miller C. T., Weber Jr. W. J. (1986) Sorption of hydrophobic organic pollutants
in saturated soil systems. J. Contam. Hydrol. 1:243-261
Millioli V. S., Freire D. D.C., Cammarota M. C. (2003) Petroleum oxidation
using Fenton’s reagent over beach sand following a spill. J. Hazard.
Mater.B103:79–91
Mohan D., Singh K. P., Sinha S., Gosh D. (2004) Removal of pyridine from
aqueous solution using low cost activated carbons derived from agricultural
waste materials. Carbon 42:2409–2421
Navalon S., Alvaro M., and Garcia H. (2010) Heterogeneous Fenton catalysts
based on clays, silicas and zeolites. Appl. Catal. B 99:1–26

185
Ncibi M.C., Mahjoub B., Gourdon R. (2007) Effects of aging on the
extractability of naphthalene and phenanthrene from Mediterranean soils. J.
Hazard. Mater. 146:378–384
Neyens E., and Baeyens J. (2003) A review of classic Fenton’s peroxidation as
an advanced oxidation technique. J. Hazard. Mater. B98:33–50
Northcott G., Jones K. C. (2001) Partitioning, extractability, and formation of
nonextractable PAH residues in Soil. 1. Compound differences in aging and
sequestration. Environ. Sci. Technol. 35:1103-1110
Ojinnaka C., Osuji L., and Achugasim O. (2012) Remediation of hydrocarbons
in crude oil-contaminated soils using Fenton’s reagent. Environ. Monit. Assess.
184:6527–6540
Oh S.-Y., Shin D.-S. (2014) Treatment of diesel-contaminated soil by Fenton
and persulfate oxidation with zero-valent iron. Soil Sediment Contam. 23:180–
193
Pannu J.K., Singh A., and Ward O.P. (2004) Vegetable oil as a contaminated
soil remediation amendment: application of peanut oil for extraction of
polycyclic aromatic hydrocarbons from soil. Process Biochem. 39:1211–1216
Parker JR G. R. (1995) Optimum Isotherm Equation and Thermodynamic
Interpretation for Aqueous 1,1,2-Trichloroethene Adsorption Isotherms on
Three Adsorbents. Adsorption 1:113-132
Pérez-Gregorio M.R., M.S. García-Falcón., J. Simal-Gándara (2010) Removal
of polycyclic aromatic hydrocarbons from organic solvents by ashes wastes. J.
Hazard. Mater. 178(1–3) 2010:273-281

186
Pighin E., Díez V.K., Cosimo J. I. D. (2016) Synthesis of ethyl lactate from
triose sugars on Sn/Al2O3 catalysts. Appl. Catal. A General. 517:151-160
Pikaar I., Koelmans A. A., van Noort P. C.M. (2006) Sorption of organic
compounds to activated carbons. Evaluation of isotherm models. Chemosphere
65:2343–2351
Qiu H., LV L., PAN B.-c., Zhang Q.-j, Zhang W.-m., Zhang Q.-x. (2009)
Critical review in adsorption kinetic models. J Zhejiang Univ Sci A. 10(5):716-
724
Quinn J., Geiger C., Clausen C., Brooks K ., Coon C., O’hara S., Krug T., Major
D., Yoon W., A. Gavaskar, and T. Sholdsworth (2005) Field Demonstration of
DNAPL Dehalogenation Using Emulsified Zero-Valent Iron. Environ. Sci.
Technol. 39:1309-1318
Quin˜ones I., Guiochon G. (1996/a) Derivation and Application of a Jovanovic–
Freundlich Isotherm Modelfor Single-Component Adsorption on
Heterogeneous Surfaces. J. Colloid Interface Sci. 183:57–67
Quin˜ ones I., Guiochon G. (1996/b) Isotherm models for localized monolayers
with lateral interactions. Application to single-component and competitive
adsorption data obtained in RP-HPLC. Langmuir 12:5433-5443
Quin˜ones I., Guiochon G. (1998) Extension of a Jovanovic–Freundlich
isotherm model to multicomponent adsorption on heterogeneous surfaces. J.
Chromatogr. A, 796:15–40

187
Reemtsma T., Mehrtens J. (1997) Determination of Polycyclic Aromatic
Hydrocarbon (PAH) leaching from contaminated soil by a column test with on-
line phase extraction. Chemosphere 35(11):2491-2501
Reference Method for the Canada-Wide Standard for Petroleum Hydrocarbons
in Soil - Tier 1 Method
Rivas J., Gimeno O., de la Calle R.G., Portela J.R., de la Ossa E.M. (2009)
Remediation of PAH spiked soils: Concentrated H2O2 treatment/continuous hot
water extraction–oxidation. J. Hazard. Mater. 168:1359–1365
Romero A., Santos A., Cordero T., R-Mirasol J., Maria Rosasa J., Vicente F.
(2011) Soil remediation by Fenton-like process: Phenol removal and soil
organic matter modification. Chem. Eng. J. 170:36–43
Romero A., Santos A., Vicente F., Rodriguez S., Lafuente A. L. ( 2009) In situ
oxidation remediation technologies: Kinetic of hydrogen peroxide
decomposition on soil organic matter. J. Hazard. Mater. 170:627–632
Ruthven D.M. (1984) principles of adsorption and adsorption processes
Salahi A., Noshadi I., Badrnezhad R., Kanjilal B., Mohammadi T. (2013) Nano-
porous membrane process for oily wastewater treatment: Optimization using
response surface methodology. J Environ Chem Eng 1:218–225
Sedlak D. L., Andren A. W. (1994) The effect of sorption on the oxidation of
polychlorinated biphenyls (PCBs) by hydroxyl radicals. Water Resource. 28
(5):1207-1215

188
Silva A., Delerue-Matos C., Fiuza A. (2005) Use of solvent extraction to
remediate soils contaminated with hydrocarbons. J. Hazard. Mater. B124:224–
229
Silva P. T. d S., Silva V. L. da, Neto B. de B., Simonnot M-O. (2009)
Phenanthrene and pyrene oxidation in contaminated soils using Fenton’s
reagent. J. Hazard. Mater. 161:967–973
Sirguey C., Silva P. T. S., Schwartz C., and Simonnot M.-O. (2008) Impact of
chemical oxidation on soil quality. Chemosphere 72:282–289
Shahbeig H., Bagheri N., Ghorbanian S. A., Hallajisani A., Poorkarimi S. (2013)
A new adsorption isotherm model of aqueous solutions on granular activated
carbon. World Journal of Modelling and Simulation 9(4):243-254
Sherwood M. K., and Daniel P. Cassidy (2014) Modified Fenton oxidation of
diesel fuel in arctic soils rich in organic matter and iron. Chemosphere 113:56–
61
Shor L.M., Rockne K.J., Taghon G.L., Young L.Y., and Kosson D.S. (2003)
Desorption kinetics for field-aged Polycyclic Aromatic Hydrocarbons from
sediments. Environ. Sci. Technol. 37:1535-1544
Smith B. A., Teel A. L., Watts R. J. (2006) Mechanism for the destruction of
carbon tetrachloride and chloroform DNAPLs by modified Fenton's reagent. J.
Contam. Hydrol. 85:229–246
Song J., Peng P., Huang W. (2002) Black carbon and kerogen in soils and
sediments. 1. Quantification and characterization. Environ. Sci. Technol.
36:3960-3967

189
Sparks D. L. (2003) Environmental soil chemistry. Amsterdam; Boston:
Academic Press, 2nd ed
Subramanian B., Namboodiri V., Khodadoust A.P., and Dionysiou D.D. (2010)
Extraction of pentachlorophenol from soils using environmentally benign lactic
acid solutions. J. Hazard. Mater. 174:263–269
Sui H., Hua Z., Li X., Li H., Wu G. (2014) Influence of soil and hydrocarbon
properties on the solvent extraction of high-concentration weathered petroleum
from contaminated soils. Environ. Sci. Pollut. Res. 21:5774-5784
Sun H.-W., Yan Q.-S. (2007) Influence of Fenton oxidation on soil organic
matter and its sorption and desorption of pyrene. J. Hazard. Mater. 144:164–170
Teel A. L., Warberg C. R., Atkinson D. A., Watts R. J. (2000) Comparison of
mineral and soluble iron Fenton’s catalysts for the treatment of
trichloroethylene. Wat. Res. 35(4):977-984
Texas natural resource conservation commission, 1006, Revision 03, 2001
TNRCC METHOD 1006, Characterization of NC6 to NC35 Petroleum
Hydrocarbons in Environmental Samples
Trellu C., Mousset E., Pechaud Y., Huguenot D., van Hullebusch E. D., Esposito
G., Oturan M. A. (2015) Removal of hydrophobic organic pollutants from soil
washing/flushing solutions: A critical review. J. Hazard. Mater. 306(5):149-174
Tsai T.T., and Kao C.M. (2009) Treatment of petroleum-hydrocarbon
contaminated soils using hydrogen peroxide oxidation catalyzed by waste basic
oxygen furnace slag. J. Hazard. Mater. 170:466–472

190
Umpleby R. J., Baxter S. C., Chen Y., Shah R. N., Shimizu K. D. (2001)
Characterization of molecularly imprinted polymers with the Langmuir-
Freundlich isotherm. Anal. Chem. 73:4584-4591
Usman M., Faure P., Hanna K., Abdelmoula M., Ruby C. (2012) Application of
magnetite catalyzed chemical oxidation (Fenton-like and persulfate) for the
remediation of oil hydrocarbon contamination. Fuel 96:270–276
US EPA, United States Environmental Protection Agency. Method 3050B
(Revision 2): Acid digestion of Sediments, Sludges and Soils. 1996
Van Vliet B. M., Weber Jr W. J., Hozumi H. (1980) Modeling and prediction of
specific compound adsorption by activated carbon and synthetic adsorbents
Water Res. Vol. 14, pp. 1719 to 1728
Varanasi P., Fullana A., Sidhu S. (2007) Remediation of PCB contaminated
soils using iron nano-particles. Chemosphere 66:1031–1038
Vicente F., Rosas J.M., Santos A., Romero A. (2011) Improvement soil
remediation by using stabilizers and chelating agents in a Fenton-like process.
Chem. Eng. J. 172:689– 697
Vijayaraghavan K., Padmesh T.V.N., Palanivelu K., Velan M. (2006)
Biosorption of nickel(II) ions onto Sargassum wightii: Application of two-
parameter and three-parameter isotherm models. J. Hazard. Mater. B133 (2006)
304–308
Voelker B., Sulzberger B. (1996) Effects of fulvic acid on Fe(II) oxidation by
hydrogen peroxide. Environ. Sci. Technol. 30:1106-1114

191
Wang F. F., Wu Y., Gao Y., Li H., Chen Z. (2016) Effect of humic acid,
oxalate and phosphate on Fenton-like oxidation of microcystin-LR by nanoscale
zero-valent iron. Sep. Purif. Technol. 170:337-343
Watts R. J., ASCE M., Teel A. L. (2005) Chemistry of modified Fenton’s
reagent Catalyzed H2O2 Propagations–CHP, for In situ soil and groundwater
remediation. Journal of Environmental Engineering 131:612-622
Watts R.J., Dilly S.E. (1996) Evaluation of iron catalysts for the Fenton –like
remediation of diesel contaminated soils. Hazardous Material 51:209-224
Watts R. J., Stanton P. C. (1999) Mineralization of sorbed and NAPL-phase
hexadecane by catalysed hydrogen peroxide. Water Resource 33 (6):1405-1414
Watts R. J., Stanton P. C., Howsawkeng J., Teel A. L.(2002) Mineralization of
a sorbed polycyclic aromatic hydrocarbon in two soils using catalyzed hydrogen
peroxide. Water Research 36:4283–4292
Weber W. J., Huang W. (1996) A distributed reactivity model for sorption by
soils and sediments. 4. Intraparticle heterogeneity and phase-distribution
relationships under nonequilibrium conditions. Environ. Sci. Technol. 30:881-
888
Weisz P.B. (1967/a) Sorption-Diffusion in Heterogeneous Systems Part 1.-
General Sorption Behaviour and Criteria. Journal of Transaction of Faraday
society 63:1801-1806
Weisz P. B., Hicks J. S. (1967/b) Sorption-Diffusion in Heterogeneous Systems
Part 2.-Quantitative Solutions for Uptake Rates. Journal of Transaction of
Faraday society 63:1807-1814

192
Wu G-Z., Coulon F., Y-W. Y., Hong L., Hong S. (2013) Combining solvent
extraction and Bioremediation for Removing Weathered Petroleum from
Contaminated Soil. Pedosphere 23 (4):455–463
Wu F.-C., Tseng R.-L., R.-S. Juang (2001) Kinetic modelling of liquid-phase
adsorption of reactive and metal ions on chitosan. Wat. Res. 35( 3):613-618
Xiao B., Yu Z., Huang W., Song J., Peng P. (2004) Black carbon and kerogen
in soils and sediments. 2. Their roles in equilibrium sorption of less-polar
organic pollutants. Environ. Sci. Technol. 38:5842-5852
Xu P., Achari G., Mahmoud M., Joshi R. C. (2006) Application of Fenton’s
reagent to remediate diesel contaminated soils. Practice Periodical of
Hazardous, Toxic, and Radioactive Waste Management 10:19-27
Yang L., Jin M., Tong C., Xie S. (2013) Study of dynamic sorption and
desorption of polycyclic aromatic hydrocarbons in silty-clay soil. J. Hazard.
Mater. 244– 245:77– 85
Yang Y., Zhang N., Xue M., Tao S. (2010) Impact of soil organic matter on the
distribution of polycyclic aromatic hydrocarbons (PAHs) in soils. Environ.
Pollut. 158:2170-2174
Yap C.L., Gan S., Ng H.K. (2012/a) Evaluation of solubility of polycyclic
aromatic hydrocarbons in ethyl lactate/water versus ethanol/water mixtures for
contaminated soil remediation applications. J Environ Sci. (China) 24 (6):1064–
1075

193
Yap C.L. (2012/b) Ethyl lactate based Fenton treatment for the remediation of
polycyclic aromatic hydrocarbon-contaminated soils. PhD thesis of faculty of
chemical and environmental engineering, University of Nottingham, Malaysia
Yeh C. K., Hsu C.Y., Chiu C.H., Huang K.L. (2008) Reaction efficiencies and
rate constants for the goethite-catalyzed Fenton-like reaction of NAPL-form
aromatic hydrocarbons and chloroethylenes. J. Hazard. Mater. 151:562–569
Yeh C. K.-J., Wu H.-M., Chen T.-C. (2003) Chemical oxidation of chlorinated
non-aqueous phase liquid by hydrogen peroxide in natural sand systems. J.
Hazard. Mater. B96:29–51
Yoo J.-C., Lee C., Lee J.-S., Baek K. (2016) Simultaneous application of
chemical oxidation and extraction processes is effective at remediating soil Co-
contaminated with petroleum and heavy metals. J. Environ. Manage. 1-6
Yu D-Y., Kang N., Bae W., Banks M. K. (2007) Characteristics in oxidative
degradation by ozone for saturated hydrocarbons in soil contaminated with
diesel fuel. Chemosphere 66:799–807
Yousefi A. S., Bostani A. (2012) Effect of hydrogen peroxide concentration in
remediation of oil-contaminated soils with use of Fenton reaction. Journal of
Chemical Health Risks 2(4):9-12
Zhang H., Ma D., Qiu R., Tang Y., Du C. (2016) Non-thermal plasma
technology for organic contaminated soil remediation: a review. Chem. Eng. J.
313(1):157-170
http://www.caslab.com/Petroleum-Hydrocarbon-Ranges/
https://en.wikipedia.org/wiki/Ethyl_lactate

194
Appendix 1:
The overall equation is explained in Eq.(A1-1):
𝜂 = 𝛽0 + ∑ 𝛽𝑗𝑥𝑗𝑘𝑗=1 + ∑ 𝛽𝑗𝑗𝑥𝑗
2𝑘𝑗=1 + ∑ ∑ 𝛽𝑖𝑗𝑥𝑖𝑥𝑗
𝑘<𝑗=2𝑖 + 𝑒𝑖 Eq.( A1-1)
where 𝜂 is response, xiiand xj are the independent factors, β0 the constant
coefficient, βj, βjj and βij denote the coefficient for linear, quadratic and
interaction effect and ei is the error (Salahi et al., 2013).
Suitability of the proposed polynomial was examined by the 𝑅2 and 𝑅𝑎𝑑𝑗2 as
defined by Eqs.( A1-2) and (A1-3) (Salahi, 2013), respectively:
𝑅2 = 1 −𝑆𝑆𝑟𝑒𝑠𝑖𝑑𝑢𝑎𝑙
𝑆𝑆𝑚𝑜𝑑𝑒𝑙+𝑆𝑆𝑟𝑒𝑠𝑖𝑑𝑢𝑎𝑙 Eq.( A1-2)
𝑅𝑎𝑑𝑗2 = 1 −
𝑆𝑆𝑟𝑒𝑠𝑖𝑑𝑢𝑎𝑙𝐷𝐹𝑟𝑒𝑠𝑖𝑑𝑢𝑎𝑙
⁄
(𝑆𝑆𝑚𝑜𝑑𝑒𝑙+𝑆𝑆𝑟𝑒𝑠𝑖𝑑𝑢𝑎𝑙)(𝐷𝐹𝑚𝑜𝑑𝑒𝑙+𝐷𝐹𝑟𝑒𝑠𝑖𝑑𝑢𝑎𝑙)⁄
Eq.( A1-3)
In these equations, DF is the degree of freedom, P is the number of model
variable, SS is the sum of squares, and n indicates the number of experiment.

195
Appendix 2:
Table A2-1: Experimental design results for fraction 1, fraction 2, fraction 3, and TPH
removal efficiency
Run Block HA EL pH
Removal
efficiency of
TPH, actual
value
Removal
efficiency of
TPH, predicted
value
1 1 -1 -1 -1 82.65 82.80
2 1 -1 -1 1 88.48 88.47
3 1 0 0 0 78.25 79.13
4 1 0 0 0 79.01 79.13
5 1 0 0 0 79.50 79.13
6 1 1 1 1 71.00 71.72
7 1 1 -1 1 87.22 87.91
8 1 1 1 -1 68.26 69.13
9 1 1 -1 -1 77.69 76.40
10 1 -1 1 1 71.81 72.28
11 1 -1 1 -1 77.04 75.53
12 1 0 0 0 79.82 79.13
13 -1 0 0 0 79.59 79.93
14 -1 0 0 1.633 83.89 83.31
15 -1 0 0 -1.633 74.90 76.56
16 -1 0 0 0 78.94 79.93
17 -1 0 1.633 0 67.75 67.43
18 -1 0 -1.633 0 86.30 86.59
19 -1 1.633 0 0 78.86 77.09
20 -1 -1.633 0 0 83.39 82.78

196
Appendix 3:
The correlation coefficient results for the second order kinetic rate.
Table (A3-1): Second order kinetic rate correlation coefficient for Fenton reaction
without HA
Experimental Conditions Fraction 1 Fraction 2 Fraction 3 TPH
𝐇𝟐𝐎𝟐,M EL% L/S Fe2+,M R2
0.1 25 2 0.05 0.6577 0.7645 0.5567 0.6689
0.5 25 2 0.05 0.6399 0.6849 0.6487 0.6847
2 25 2 0.05 0.5899 0.6933 0.8036 0.6322
4 0 2 0.2 0.5836 0.7321 0.7466 0.7029
4 25 2 0.2 0.6123 0.7569 0.7123 0.6987
4 50 2 0.2 0.6099 0.6842 0.6984 0.6128
0.5 25 1 0.05 0.6822 0.5769 0.5987 0.5974
0.5 25 5 0.05 0.4989 0.7364 0.6328 0.7163
Table (A3-2): Second order kinetic rate correlation coefficient for Fenton reaction with
HA
Experimental
Conditions
Fraction 1 Fraction 2 Fraction 3 TPH
HA R2
0 0.6789 0.5578 0.6488 0.6213
10 0.5978 0.6987 0.5876 0.6098
50 0.4966 0.4876 0.5498 0.7436
100 0.7032 0.7843 0.4489 0.5789
150 0.6947 0.6698 0.6912 0.6622