james de clerck · david s. epp editors rotating machinery ... · james de clerck · david s. epp...
TRANSCRIPT

James De Clerck · David S. Epp Editors
Rotating Machinery, Hybrid Test Methods, Vibro-Acoustics & Laser Vibrometry, Volume 8Proceedings of the 34th IMAC, A Conference and Exposition on Structural Dynamics 2016
Conference Proceedings of the Society for Experimental Mechanics Series

Conference Proceedings of the Society for Experimental Mechanics Series
Series EditorKristin B. Zimmerman, Ph.D.Society for Experimental Mechanics, Inc.,Bethel, CT, USA
More information about this series at http://www.springer.com/series/8922

James De Clerck • David S. EppEditors
Rotating Machinery, Hybrid Test Methods,Vibro-Acoustics & Laser Vibrometry,Volume 8Proceedings of the 34th IMAC, A Conference and Expositionon Structural Dynamics 2016
123

EditorsJames De ClerckMechanical EngineeringMichigan Technological UniversityHoughton, MI, USA
David S. EppSandia National LaboratoryAlbuquerque, NM, USA
ISSN 2191-5644 ISSN 2191-5652 (electronic)Conference Proceedings of the Society for Experimental Mechanics SeriesISBN 978-3-319-30083-2 ISBN 978-3-319-30084-9 (eBook)DOI 10.1007/978-3-319-30084-9
Library of Congress Control Number: 2016941278
© The Society for Experimental Mechanics, Inc. 2016This work is subject to copyright. All rights are reserved by the Publisher, whether the whole or part of the material is concerned, specifically the rightsof translation, reprinting, reuse of illustrations, recitation, broadcasting, reproduction on microfilms or in any other physical way, and transmission orinformation storage and retrieval, electronic adaptation, computer software, or by similar or dissimilar methodology now known or hereafter developed.The use of general descriptive names, registered names, trademarks, service marks, etc. in this publication does not imply, even in the absence of a specificstatement, that such names are exempt from the relevant protective laws and regulations and therefore free for general use.The publisher, the authors and the editors are safe to assume that the advice and information in this book are believed to be true and accurate at the date ofpublication. Neither the publisher nor the authors or the editors give a warranty, express or implied, with respect to the material contained herein or for anyerrors or omissions that may have been made.
Printed on acid-free paper
This Springer imprint is published by Springer NatureThe registered company is Springer International Publishing AG Switzerland

Preface
Rotating Machinery, Hybrid Test Methods, Vibro-Acoustics, and Laser Vibrometry represent one of ten volumes of technicalpapers presented at the 34th IMAC, A Conference and Exposition on Structural Dynamics, organized by the Society forExperimental Mechanics and held in Orlando, Florida, on January 25–28, 2016. The full proceedings also include volumes onNonlinear Dynamics; Dynamics of Civil Structures; Model Validation and Uncertainty Quantification; Dynamics of CoupledStructures; Sensors and Instrumentation; Special Topics in Structural Dynamics; Structural Health Monitoring, DamageDetection, and Mechatronics; and Shock and Vibration, Aircraft/Aerospace, Energy Harvesting, Acoustics and Optics, andTopics in Modal Analysis and Testing.
Each collection presents early findings from experimental and computational investigations on an important area withinStructural Dynamics. Topics represent papers on enabling technologies for Modal Analysis measurements and applicationsof Modal Analysis in specific application areas.
The organizers would like to thank the authors, presenters, session organizers, and session chairs for their participation inthis track.
Houghton, MI, USA James De ClerckAlbuquerque, NM, USA David S. Epp
v

Contents
1 Practical Techniques for Scaling of Optically Measured Operating Deflection Shapes . . . . . . . . . . . . . . . . . . . . . . . . . 1Peyman Poozesh, Danilo Damasceno Sabino, Javad Baqersad, Peter Avitabile,and Christopher Niezrecki
2 Prediction of the Coupled Impedance from Frequency Response Data . . . . . . . . . . . . . . . . . . . . . . . . . . . . . . . . . . . . . . . . . . . 19Ramona Fagiani, Elisabetta Manconi, and Marcello Vanali
3 Real-Time State Detection in Highly Dynamic Systems . . . . . . . . . . . . . . . . . . . . . . . . . . . . . . . . . . . . . . . . . . . . . . . . . . . . . . . . . . . . . 27Ryan A. Kettle, Andrew J. Dick, Jacob C. Dodson, Jason R. Foley, and Steven R. Anton
4 Stereo-DIC Measurements of Thermal Gradient Effects on the Vibratory Response of Metals . . . . . . . . . . . . . . . 35Ryan Berke, Ravinder Chona, Arthur Ding, John Lambros, Eann Patterson, and Christopher Sebastian
5 Modal Testing of a Nose Cone Using Three-Dimensional Scanning Laser Doppler Vibrometry . . . . . . . . . . . . . . . 43Daniel P. Rohe
6 A Mathematical Model for Determining the Pose of a SLDV . . . . . . . . . . . . . . . . . . . . . . . . . . . . . . . . . . . . . . . . . . . . . . . . . . . . . . 57Da-Ming Chen and W.D. Zhu
7 Operational Modal Analysis with a 3D Laser Vibrometer Without External Reference . . . . . . . . . . . . . . . . . . . . . . . . 75Simon Marwitz and Volkmar Zabel
8 Scanning LDV Measurement Technology for Vibration Fatigue Testing . . . . . . . . . . . . . . . . . . . . . . . . . . . . . . . . . . . . . . . . . 87Fabrizio Magi, Dario Di Maio, and Ibrahim Sever
9 Optically Detecting Wavefronts and Wave Speeds in Water Using Refracto-Vibrometry . . . . . . . . . . . . . . . . . . . . . . 95Matthew T. Huber, Brent K. Hoffmeister, and Thomas M. Huber
10 Stochastic Wavenumber Estimation: Damage Detection Through Simulated Guided Lamb Waves . . . . . . . . . . 105Garrison N. Stevens, Kendra L. Van Buren, Eric B. Flynn, Sez Atamturktur, and Jung-Ryul Lee
11 Use of Continuous Scanning LDV for Diagnostics . . . . . . . . . . . . . . . . . . . . . . . . . . . . . . . . . . . . . . . . . . . . . . . . . . . . . . . . . . . . . . . . . . . 127Dario Di Maio
12 A Cost Effective DIC System for Measuring Structural Vibrations . . . . . . . . . . . . . . . . . . . . . . . . . . . . . . . . . . . . . . . . . . . . . . . 139Markus J. Hochrainer
13 Teaching DSP and Dynamic Measurements at the Graduate Level at Michigan Technological University . . . 147Jason R. Blough
14 Flipping the Classroom for a Class on Experimental Vibration Analysis . . . . . . . . . . . . . . . . . . . . . . . . . . . . . . . . . . . . . . . . . 155Anders Brandt and Christopher Kjær
15 Lessons Learned from Operational Modal Analysis Courses at the University of Molise . . . . . . . . . . . . . . . . . . . . . . 161Carlo Rainieri and Giovanni Fabbrocino
16 Authentic Engineering Assignments for an Undergraduate Vibration Laboratory Class. . . . . . . . . . . . . . . . . . . . . . . 169James P. De Clerck and Jean S. De Clerck
vii
viii Contents
17 Vibration and Acoustic Analysis of Acoustic Guitar in Consideration of Transient Sound . . . . . . . . . . . . . . . . . . . . . 177Nobuyuki Okubo, Naoaki Iwanaga, and Takeshi Toi
18 Demarcation for the Coupling Strength in the MODENA Approach . . . . . . . . . . . . . . . . . . . . . . . . . . . . . . . . . . . . . . . . . . . . . 187Peng Zhang, Shaoqing Wu, Yanbin Li, and Qingguo Fei
19 Vibro-Acoustic Modal Model of a Traction Motor for Railway Applications . . . . . . . . . . . . . . . . . . . . . . . . . . . . . . . . . . . . 197Fredrik Botling, Hanna Amlinger, Ines Lopez Arteaga, and Siv Leth
20 Operational Deflection Shapes of a PWM-Fed Traction Motor . . . . . . . . . . . . . . . . . . . . . . . . . . . . . . . . . . . . . . . . . . . . . . . . . . . . 209Hanna Amlinger, Fredrik Botling, Ines Lopez Arteaga, and Siv Leth
21 Acoustic Fatigue and Dynamic Behavior of Composite Panels Under Acoustic Excitation . . . . . . . . . . . . . . . . . . . . . 219Canan Uz and Tamer T. Ata
22 Evaluation of Microphone Density for Finite Element Source Inversion Simulationof a Laboratory Acoustic Test . . . . . . . . . . . . . . . . . . . . . . . . . . . . . . . . . . . . . . . . . . . . . . . . . . . . . . . . . . . . . . . . . . . . . . . . . . . . . . . . . . . . . . . . . . 231Ryan Schultz and Tim Walsh
23 Experimental Mapping of the Acoustic Field Generated by Ultrasonic Transducers . . . . . . . . . . . . . . . . . . . . . . . . . . . 243Songmao Chen, Christopher Niezrecki, and Peter Avitabile
24 Enhanced Spin-Down Diagnostics for Nondestructive Evaluation of High-Value Systems . . . . . . . . . . . . . . . . . . . . . 255David Sehloff, Clark Shurtleff, Josh Pribe, Colin Haynes, and John Heit
25 Performing Direct-Field Acoustic Test Environments on a Sandia Flight System to Provide Datafor Finite Element Simulation . . . . . . . . . . . . . . . . . . . . . . . . . . . . . . . . . . . . . . . . . . . . . . . . . . . . . . . . . . . . . . . . . . . . . . . . . . . . . . . . . . . . . . . . . . 267Eric C. Stasiunas, Ryan A. Schultz, and Mike R. Ross
26 Smooth Complex Orthogonal Decomposition Applied to Traveling Waves in Elastic Media . . . . . . . . . . . . . . . . . . . 281Rickey A. Caldwell Jr. and Brain F. Feeny
27 Subspace Algorithms in Modal Parameter Estimation for Operational Modal Analysis:Perspectives and Practices . . . . . . . . . . . . . . . . . . . . . . . . . . . . . . . . . . . . . . . . . . . . . . . . . . . . . . . . . . . . . . . . . . . . . . . . . . . . . . . . . . . . . . . . . . . . . . 295S. Chauhan
28 An Application of Multivariate Empirical Mode Decomposition Towards StructuralModal Identification . . . . . . . . . . . . . . . . . . . . . . . . . . . . . . . . . . . . . . . . . . . . . . . . . . . . . . . . . . . . . . . . . . . . . . . . . . . . . . . . . . . . . . . . . . . . . . . . . . . . . 303Ayan Sadhu
29 Dynamic Characterization of Milling Plant Columns . . . . . . . . . . . . . . . . . . . . . . . . . . . . . . . . . . . . . . . . . . . . . . . . . . . . . . . . . . . . . . . 311Filippo Cangioli, Steven Chatterton, Paolo Pennacchi, and Edoardo Sabbioni
30 Mixed Force and Displacement Control for Base-Isolation Bearings in RTHS . . . . . . . . . . . . . . . . . . . . . . . . . . . . . . . . . . 323Richard Erb, Matthew Stehman, and Narutoshi Nakata
31 Leveraging Hybrid Simulation for Vibration-Based Damage Detection Studies . . . . . . . . . . . . . . . . . . . . . . . . . . . . . . . . . 333Timothy P. Kernicky, Michael Tedeschi, and Matthew J. Whelan
32 Real Time Hybrid Simulation with Online Model Updating on Highly Nonlinear Device . . . . . . . . . . . . . . . . . . . . . . 343Ge Ou and Shirley J. Dyke
33 Discrete-Time Compensation Technique for Real-Time Hybrid Simulation . . . . . . . . . . . . . . . . . . . . . . . . . . . . . . . . . . . . . 351Saeid Hayati and Wei Song
34 Evaluating the Effectiveness of a Lodengraf Damping Approach for String Trimmers . . . . . . . . . . . . . . . . . . . . . . . . . 359Nicholas Swanson and Jack Leifer
35 Using Operating Data to Locate and Quantify Unbalance in Rotating Machinery . . . . . . . . . . . . . . . . . . . . . . . . . . . . . . 375Shawn Richardson, Mark Richardson, Jason Tyler, and Patrick McHargue
Contents ix
36 Gear Dynamics Characterization by Using Order-BasedModal Analysis . . . . . . . . . . . . . . . . . . . . . . . . . . . . . . . . . . . . . . . . . . . . . . . . . . . . . . . . . . . . . . . . . . . . . . . . . . . . . . . . . . . . . . . . . . . . . . . . . . . . . . . . . . . 387Emilio Di Lorenzo, Antonio Palermo, Simone Manzato, Andrea Dabizzi, Bart Peeters, Wim Desmet,and Francesco Marulo
37 A Design Framework to Improve the Dynamic Characteristics of Double Planet Planetary Gearsets . . . . . . . . 405Dylan C. Fyler, Murat Inalpolat, Sang Hwa Lee, and Hyun Ku Lee
38 Dynamics and Pareto Optimization of a Generic Synchronizer Mechanism . . . . . . . . . . . . . . . . . . . . . . . . . . . . . . . . . . . . . 417Muhammad Irfan, Viktor Berbyuk, and Håkan Johansson
39 Modeling and Characterization of a Flexible Rotor Supported by AMB . . . . . . . . . . . . . . . . . . . . . . . . . . . . . . . . . . . . . . . . . 427Marcus Vinicius Fernandes de Oliveira, Adriano Borges Silva, Adailton Borges Silva,Edson Hideki Koroish, and Valder Steffen Jr.
40 Nonlinear Reduced Order Modeling of a Curved Axi-Symmetric Perforated Plate: Comparisonwith Experiments . . . . . . . . . . . . . . . . . . . . . . . . . . . . . . . . . . . . . . . . . . . . . . . . . . . . . . . . . . . . . . . . . . . . . . . . . . . . . . . . . . . . . . . . . . . . . . . . . . . . . . . . 437David A. Ehrhardt and Matthew S. Allen
41 Reduced Order Models for Systems with Disparate Spatial and Temporal Scales. . . . . . . . . . . . . . . . . . . . . . . . . . . . . . . 447Shahab Ilbeigi and David Chelidze
42 Using NNMs to Evaluate Reduced Order Models of Curved Beam . . . . . . . . . . . . . . . . . . . . . . . . . . . . . . . . . . . . . . . . . . . . . . . 457Christopher I. VanDamme and Matthew S. Allen
43 Simulation of Rotor Damping Assembled by Disc Shrink Fits . . . . . . . . . . . . . . . . . . . . . . . . . . . . . . . . . . . . . . . . . . . . . . . . . . . . . 471Lothar Gaul and André Schmidt
44 Developments in the Prediction of Full Field Dynamics in the Nonlinear Forced Responseof Reduced Order System Models . . . . . . . . . . . . . . . . . . . . . . . . . . . . . . . . . . . . . . . . . . . . . . . . . . . . . . . . . . . . . . . . . . . . . . . . . . . . . . . . . . . . . 481Sergio E. Obando and Peter Avitabile
45 On the Behaviour of Structures with Many Nonlinear Elements . . . . . . . . . . . . . . . . . . . . . . . . . . . . . . . . . . . . . . . . . . . . . . . . . . 509T. Rogers, G. Manson, and K. Worden
46 Estimation of Instantaneous Speed for Rotating Systems: New Processing Techniques . . . . . . . . . . . . . . . . . . . . . . . . 521Achyut Vemuri, Randall J. Allemang, and Allyn W. Phillips
47 Identification of Breathing Cracked Shaft Models from Measurements . . . . . . . . . . . . . . . . . . . . . . . . . . . . . . . . . . . . . . . . . . 537Michael I. Friswell, Ralston Fernandes, Nidhal Jamia, and Sami El-Borgi

Chapter 1Practical Techniques for Scaling of Optically Measured OperatingDeflection Shapes
Peyman Poozesh, Danilo Damasceno Sabino, Javad Baqersad, Peter Avitabile, and Christopher Niezrecki
Abstract Operational Modal Analysis (OMA) is used to identify vibration patterns of large structures under unknownoperating conditions. However, operating data extracted from output-only measurements is not scaled and cannot be usedfor Structural Dynamic Modification (SDM), frequency response function (FRF) synthesis, force estimation and structuralresponse simulation. Therefore, developing an algorithm that is able to extract scaled mode shapes using measured operatingdata is desirable. In the current paper, two different scaling techniques including drive point scaling as well as mass sensitivityscaling are employed to scale optically measured operating deflection shapes (ODS). To evaluate the capability of eachscaling technique, the scaled optically measured operating shapes are compared to mode shapes extracted using input–output measurements (reference mode shapes). Additionally, the scaled operating shapes are used in structural dynamicmodification to demonstrate the benefits and drawbacks associated with the mass sensitivity technique. The results revealthat both mass sensitivity and drive point scaling techniques are capable of effectively scaling optically measured operatingdeflection shapes of the structure.
Keywords Operating deflection shapes • Scaling techniques • Operational modal analysis • Digital image correlation •Structural dynamics • Mass sensitivity
Nomenclature
f�gk1 ODS of the unmodified structure[M1] Mass matrix of the unmodified structuref�gk2 ODS of the modified structure[K1] Stiffness matrix of the unmodified structure[E1] Scaled ODS of the unmodified structure[M2] Mass matrix of the modified structure[E2] Scaled ODS of the modified structure[K2] Stiffness matrix of the modified structure[Eun
12] Unscaled mode contribution matrix[A(s)] Residue matrix[E2] Estimated mode shapes of the modified structure˛k Initial scaling factor for unmodified structure[E12] Scaled mode contribution matrixˇk Initial scaling factor for modified structure[Eref] Reference shapes extracted using input–output measurement!k1 Natural frequencies of unmodified structurepk Pole location!k2 Natural frequencies of modified structure[�M12] Mass modification matrix
P. Poozesh (�) • J. Baqersad • P. Avitabile • C. NiezreckiStructural Dynamics and Acoustic Systems Laboratory, University of Massachusetts Lowell, One University Avenue, Lowell,MA 01854, USAe-mail: Peyman_Poozeshstudent.uml.edu
D.D. SabinoUnive Estadual Paulista, Ilha Solteira, SP, Brazil
© The Society for Experimental Mechanics, Inc. 2016J. De Clerck, D.S. Epp (eds.), Rotating Machinery, Hybrid Test Methods, Vibro-Acoustics & Laser Vibrometry, Volume 8,Conference Proceedings of the Society for Experimental Mechanics Series, DOI 10.1007/978-3-319-30084-9_1
1
2 P. Poozesh et al.
1.1 Introduction
Experimental Modal Analysis (EMA), based on input–output system identification technique, is extensively employed toidentify dynamic characteristics of structures. In this approach, modal parameters of a structure can be identified usingknown applied forces and the measured responses [1]. However, there are some cases that measuring input forces is anarduous task and requires expensive tools [2, 3]. Unlike EMA, Operational Modal Analysis (OMA) is a technique thatestimates modal parameters of the structure using the vibration response measurements [4, 5]. Because the input forces arenot measured in OMA, the extracted shapes that are called unscaled operating mode shape are not mass normalized [6, 7].These unscaled operating deflections shapes cannot be used for further structural dynamic studies such as damage detection,model updating, structural modification and force estimation. Several approaches based on updating finite element modeland structural dynamic modification have been proposed to scale operating deflection shapes [8, 9]. Researchers have alsoused the single drive point measurement and mass sensitivity techniques to scale operating deflection shapes measured usingconventional sensors [10, 11].
Using a single drive point measurement, the scale of each mode shape at the drive point location can be computed. Thevalue of mode shapes at the drive point is then used to scale the operating deflection shapes. With this method, it is possibleto only scale a single mode without the knowledge of any other modes. It is worth mentioning that this technique requires atleast one force measurement [10]. After extracting the scaled mode shapes and poles (frequency and damping values), a FRFsynthesis can be performed using operating data. The newly synthesized set of FRFs can accurately describe the system’sdynamic behavior for the specified frequency range.
Mass sensitivity technique uses the structure’s sensitivity to a change in mass to calculate the scaling factor. Adding asmall mass to the structure will result in a shift in resonant frequencies. This frequency shift can be related to the derivativeof the eigenvalue. Using this fact, the scaling factor can be extracted from operating data with no force measurement [12,13]. The ideal mass modification in this technique depends on the mass and the flexibility of the structure. However, the massmodification must be small enough to prevent significant change in the mode shapes of the structure [14]. Aenlle et al. [11]proposed two mass sensitivity techniques based on structural dynamic modification and the accuracy of each method wasevaluated by using simulated models. Furthermore, Parloo et al. [15] used mass sensitivity technique to scale the operatingdeflection shapes of a bridge. In another effort, Brincker et al. [14] utilized the mass change technique to estimate the scalingfactors associated with operating deflections shapes of a four story building. In addition, the uncertainties on the estimatedscaling factors using different mass sensitivity techniques were evaluated. In another work by Aenlle et al. [9], a techniquewas proposed to optimize the mass change strategy including the number, locations and the weight of the masses. Khatibiet al. [16] showed that mass-stiffness change can be effective in scaling operating deflection shapes. The numerical andexperimental results revealed that the stiffness change method shows the same higher effect on the accuracy of the lowerorder modes than mass change method. Therefore, it was suggested that mass sensitivity technique in conjunction with thestiffness change technique is more effective than only the mass sensitivity technique in scaling operating deflection shapesextracted from output-only measurements.
Three-dimensional (3D) digital image correlation (DIC) and three-dimensional point tracking (3DPT) are non-contactingmeasurement approaches that provide alternatives to traditional measurement sensors and LDVs [17–19]. Both 3D DIC and3DPT are based on stereophotogrammetry principles and rely on a pair of digital cameras to capture images of the structureover a period of time. For the DIC approach, speckled patterns are applied to a structure and can be used to obtain full-fielddisplacement and strain over the entire area of interest. Likewise, 3DPT can be used to measure displacement at discretepoints by mounting optical targets to the structure. DIC and 3DPT have matured over the last two decades and have beenprimarily applied to the field of experimental solid mechanics [20, 21]. However, more recently researchers have begunto exploit optically based approaches for measuring vibration and transient phenomena in turbine blades and rotors. Therehave been several published papers that use photogrammetry in conjunction with Operational Modal Analysis to measurevibration in non-rotating and rotating turbine blades [20, 22].
The current paper is built on a foundation of research to understand how to use a non-contact stereophotogrammetrytechnique with output-only system identification methods to accurately estimate modal parameters in a structure duringoperation. Within this paper, the single drive point measurement techniques as well as the mass sensitivity technique areemployed to evaluate the effectiveness of each technique in scaling operating deflections shapes. Furthermore, the traditionalmass sensitivity technique is improved by introducing SDM process and using the mode contribution matrix. The modalassurance criteria (MAC) [23], orthogonally check, and structural dynamic modification (SDM) [25] are the tools that willbe used to evaluate the effectiveness of each of the scaling techniques.
1 Practical Techniques for Scaling of Optically Measured Operating Deflection Shapes 3
1.2 Theoretical Background
Within the current paper, two significant techniques are utilized, drive point scaling and mass sensitivity scaling. Bothtechniques are described in the following sections.
1.2.1 Drive Point Scaling Technique
The operating deflections shapes tend to be highly correlated with the corresponding mode shape of the system. Thiscorrelation can be expressed as
fugk D ’kf‰gk (1.1)
where ’0k is the scale factor between the operating deflection shapes (f‰gk) and the scaled mode shapes (fugk) at the kth
mode of the structure. The scaled mode shapes and operating deflection shapes can be expressed as8<ˆ:
u1k
u2k
u3k:::
9>>>=>>>; D fugk;
8<ˆ:
ods1k
ods2k
ods3k:::
9>>>=>>>; D f‰gk (1.2)
The drive point scaling technique relies on the use of a single drive point measurement to properly scale operating deflectionshapes. The FRF obtained from the single drive point measurement can be shown as
ŒH .s/�sDj¨ D ŒH .j¨/� DmX
kD1
ŒAk�
.j¨ � pk/C
�A�
k
��j¨ � p�
k
� (1.3)
For a particular mode k, Eq. (1.3) can be expressed as
ŒH .s/�sDpkD fukg qk
s � pkfukgT (1.4)
with the residue matrix calculated using
ŒA .s/�k D qk fukg fukgT (1.5)
Equation (1.5) can be further simplified for a single reference point as8<ˆ:
a1k
a2k
a3k:::
9>>>=>>>; D qkurk
8<ˆ:
u1k
u2k
u3k:::
9>>>=>>>; ! aijk D qkuikujk ; qk D 12j¨k
(1.6)
where uik and ujk are the kth mode of the structure at point i and j respectively. The residues are directly related to the systemmode shapes and are scaled by qk, the scaling constant for the kth mode. From Eq. (1.6), it becomes evident that by takinga measurement at the drive point location, urk, a value for modal scaling can be determined. The drive point measurementprovides a scaled mode shape for the drive point DOF as
arrk D qkurkurk (1.7)
With this drive point scaling, the scaled mode shapes, for the corresponding drive point measurement location, can be usedto scale the operating mode shapes
4 P. Poozesh et al.
Scaled Operating Mode Shape !
8ˆ<ˆ:
ods1k
ods2k:::
odsik:::
odsnk
9>>>>>>>>>=>>>>>>>>>;urk
odsrk(1.8)
It is important to note that the reference location selected for the operating deflection shape extraction does not need to bethe same as the drive point selected for the scaling of the operating deflection shapes [10].
1.2.2 Mass Sensitivity Scaling Technique
Unlike the drive point scaling, the mass sensitivity scaling technique requires no FRF measurements. This technique relies onthe sensitivity of the eigensolution of the system to an adequate change in the mass [15]. By adding masses to the structure,a shift in its natural frequency occurs. The frequency shift coupled with the value of the mass modification can be measuredand used to determine the effective scaling constant. The eigensolution for a system without damping is�
ŒK1� � ¨2k1 ŒM1��’kf‰gk1 D 0 (1.9)
where f�gk1 is the unscaled mode shape of the original structure, !k1 the natural frequency, [M1] mass matrix and [K1] thestiffness matrix. After mass modification (ŒM C�M�), the new eigenvalues and eigenvectors can be found using�
ŒK1� � ¨2k2 ŒM1 C�M12��’kf‰gk2 D 0 (1.10)
where f�gk2 and !k2 are the operating deflection shape and natural frequencies of the modified structures. Subtracting Eq.(1.10) from Eq. (1.9) gives a relation between these two equations. This relation will be used further in determining thescaling factors
ŒK1� .’kf‰gk1 � ’kf‰gk2/ � ŒM1��’kf‰gk1¨
2k1 � ’kf‰gk2¨
2k2
� � Œ�M12� ’kf‰gk2¨2k2 D 0 (1.11)
Equation (1.11) can be greatly simplified by assuming that change in the mode shape due to the small mass modification isunnoticeable.
f‰gk1 D
8ˆ<ˆ:
ods11k
ods12k:::
ods1ik:::
ods1nk
9>>>>>>>>>=>>>>>>>>>;; f‰gk2 D
8ˆ<ˆ:
ods21k
ods22k:::
ods2ik:::
ods2nk
9>>>>>>>>>=>>>>>>>>>;! f‰gk1 Š f‰gk2 Š f‰gk (1.12)
By assuming that mode shapes do not change after mass modification, Eq. (1.11) will be simplified as
’kf‰gTk ŒM1� ’kf‰gk
�¨2k1 � ¨2k2
� � ’kf‰gTk Œ�M12� ’kf‰gk¨
2k2 D 0 (1.13)
Scaled mode shapes ([M1]) possesses the orthogonality properties given as
ŒE1�T ŒM1� ŒE1� D ŒI� ! ’2kf‰gT
k ŒM1� f‰gk D 1 (1.14)
1 Practical Techniques for Scaling of Optically Measured Operating Deflection Shapes 5
Taking into account the orthogonality of mode shapes with respect to mass, Eq. (1.13) can be simplified as�¨2k1 � ¨2k2
� � ’2kf‰gTk Œ�M12� f‰gk¨
2k2 D 0 (1.15)
Equation (1.15) can now be solved for the scale factor, and the resultant equation is
’k Ds �
¨2k1 � ¨2k2�
!2k2f‰gTk Œ�M12� f‰gk
(1.16)
Equation (1.16) is similar to the equation developed by Parloo et al. [24]. As can be seen from Eq. (1.16), only the operatingdeflection shapes and the resonant frequencies are needed to find the scaling factor associated to each mode. To determinescaling factors using Eq. (1.16), both modified and unmodified operating shapes can be used.
1.2.3 Structural Dynamic Modification
Because of several assumptions made to develop the mass sensitivity scaling technique, some sources of errors are present[10]. The structural dynamic modification concepts in conjunction with the mass sensitivity technique are used to evaluate themerits associated with the mass sensitivity technique. The basis for the theory of structural dynamic modification is directlyrelated to the equation of motion [11]. The equation of motion for the modified structure in modal space is represented as2664
2664: : :
I: : :
3775C ��M12
�3775 fP2g C
2664: : :
¨22: : :
3775 fP2g D Œ0� (1.17)
Modal mass modification matrix (�M12), can be calculated using��M12
� D ŒE1�T Œ�M12� ŒE1� (1.18)
It is important to note that while part of Eq. (1.17) contains a diagonal representation of the modal mass of the originalsystem, the modal mass modification part (
��M12
�) is not diagonal, and therefore Eq. (1.17) is coupled.
The eigenvector ([E12]) is obtained from the eigensolution for Eq. (1.17) and can be used to transform from original modalspace (unmodified system) to second modal space (modified structure).
fP1g D ŒE12� fP2g (1.19)
Equation (1.19) uncouples the set of equations that were coupled from modification from the original unmodified state to thesecond modified state. The original modal transformation is given by
fXg D ŒE1� fPg (1.20)
Substituting Eq. (1.19) into Eq. (1.20) will give
fXg D ŒE1� ŒE12� fP2g (1.21)
Estimated scaled mode shapes of the modified structure are obtained from linear combination of the unmodified scaled modesshapes with the normalizing matrix given as � QE2
� D ŒE1� ŒE12� (1.22)
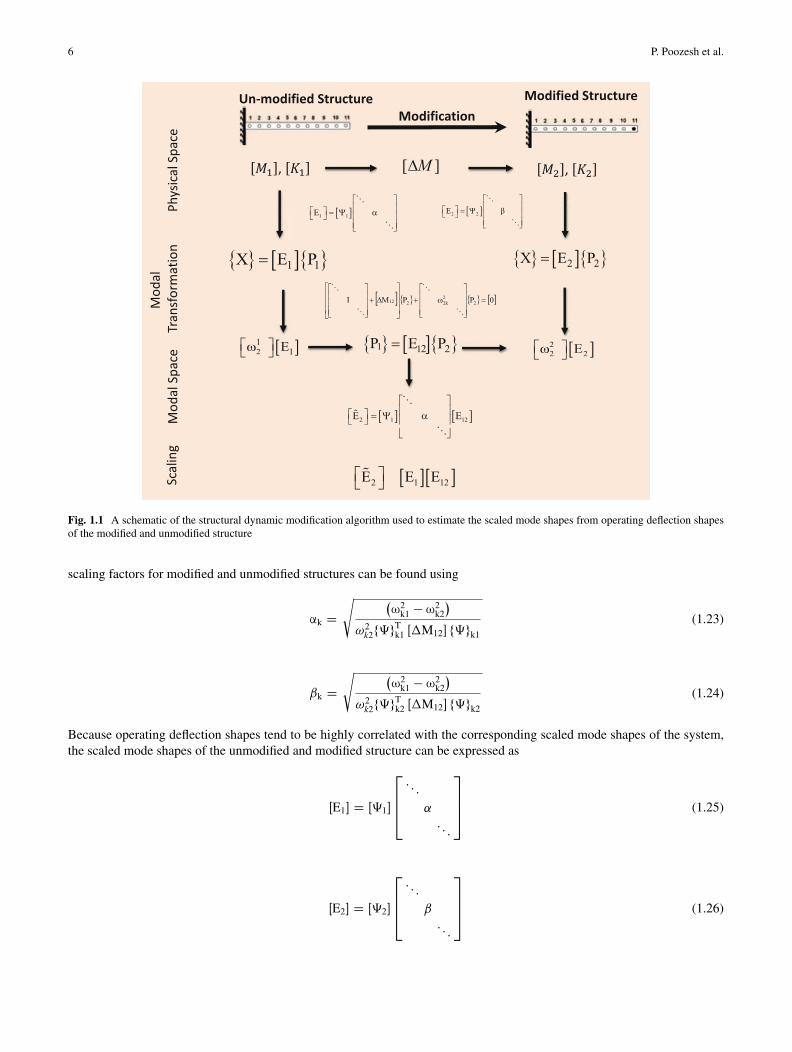
Equation (1.22), can be used to approximate the modified modal parameters due to structural changes using only the originalmodal parameters of the structure [25]. Figure 1.1 shows the mass modification process of a structure using SDM. The
6 P. Poozesh et al.
Fig. 1.1 A schematic of the structural dynamic modification algorithm used to estimate the scaled mode shapes from operating deflection shapesof the modified and unmodified structure
scaling factors for modified and unmodified structures can be found using
’k Ds �
¨2k1 � ¨2k2�
!2k2f‰gTk1 Œ�M12� f‰gk1
(1.23)
ˇk Ds �
¨2k1 � ¨2k2�
!2k2f‰gTk2 Œ�M12� f‰gk2
(1.24)
Because operating deflection shapes tend to be highly correlated with the corresponding scaled mode shapes of the system,the scaled mode shapes of the unmodified and modified structure can be expressed as
ŒE1� D Œ‰1�
2664: : :
˛: : :
3775 (1.25)
ŒE2� D Œ‰2�
2664: : :
ˇ: : :
3775 (1.26)
1 Practical Techniques for Scaling of Optically Measured Operating Deflection Shapes 7
Modal parameters - Unmodified21 1k kω ψ
Es�mated Modified Mode Shape
[ ] [ ]2 1 12
⎡ ⎤⎢ ⎥⎡ ⎤ =⎣ ⎦ ⎢ ⎥⎢ ⎥⎣ ⎦
��
�E Eψ α
( )[ ]
2 21 2
22 1 1.{ } { }
−=
⋅ Δ ⋅k k
k Tk k kM
ω ωα
ω ψ ψ
Ini�al Scaling Factor
Scaled Unmodified Mode Shape
[ ]1 1
⎡ ⎤⎢ ⎥⎡ ⎤ =⎣ ⎦ ⎢ ⎥⎢ ⎥⎣ ⎦
�
�E ψ α
Structural Dynamic Modifica�on - SDM
[ ] [ ]
( )
2 1 12
12 1 12 1
2 1
22 12 2 2,
= + Δ
Δ = Δ
=
⎡ ⎤ =⎣ ⎦
T
M M M
M E M E
K K
E eigen K Mω
Scaled Modified Mode Shape
[ ]2 2
⎡ ⎤⎢ ⎥⎡ ⎤ =⎣ ⎦ ⎢ ⎥⎢ ⎥⎣ ⎦
�
�E ψ β
Compare
Modal parameters - Modified 22 2 12Δk k Mω ψ
System Iden�fica�on
Op�cal Measurement
( )[ ]
2 21 2
22 2 2.{ } { }
−=
⋅ Δ ⋅k k
k Tk k kM
ω ωβ
ω ψ ψ
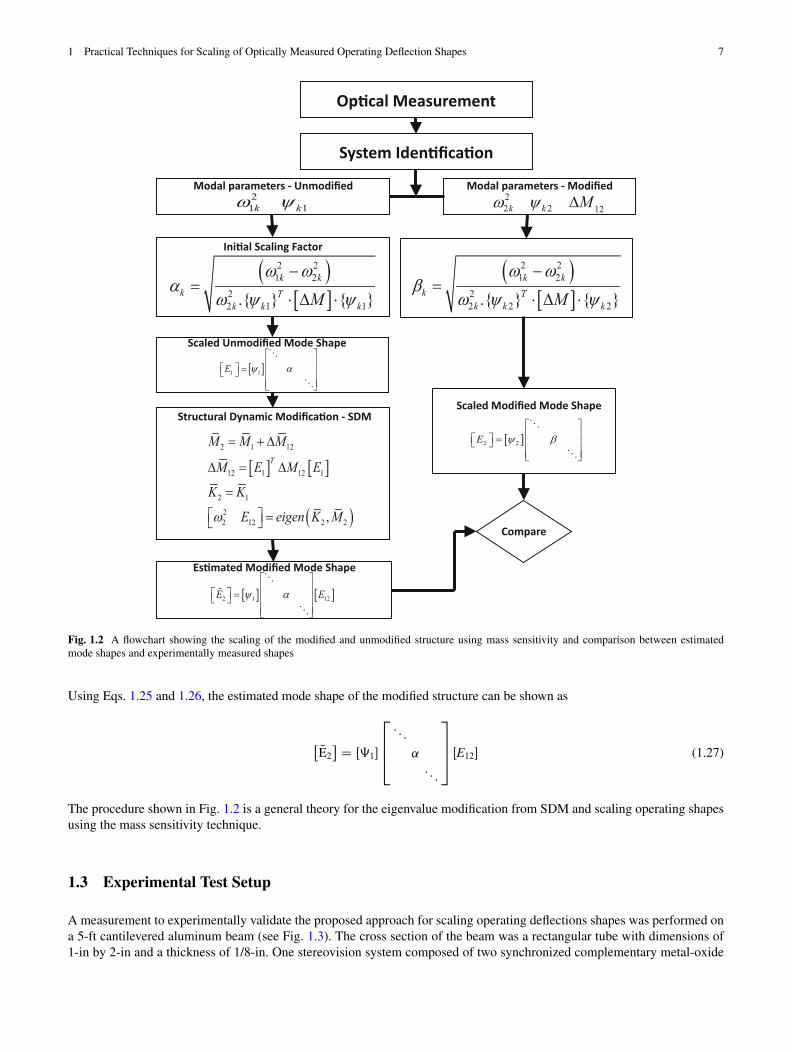
Fig. 1.2 A flowchart showing the scaling of the modified and unmodified structure using mass sensitivity and comparison between estimatedmode shapes and experimentally measured shapes
Using Eqs. 1.25 and 1.26, the estimated mode shape of the modified structure can be shown as
� QE2� D Œ‰1�
2664: : :
˛: : :
3775 ŒE12� (1.27)
The procedure shown in Fig. 1.2 is a general theory for the eigenvalue modification from SDM and scaling operating shapesusing the mass sensitivity technique.
1.3 Experimental Test Setup
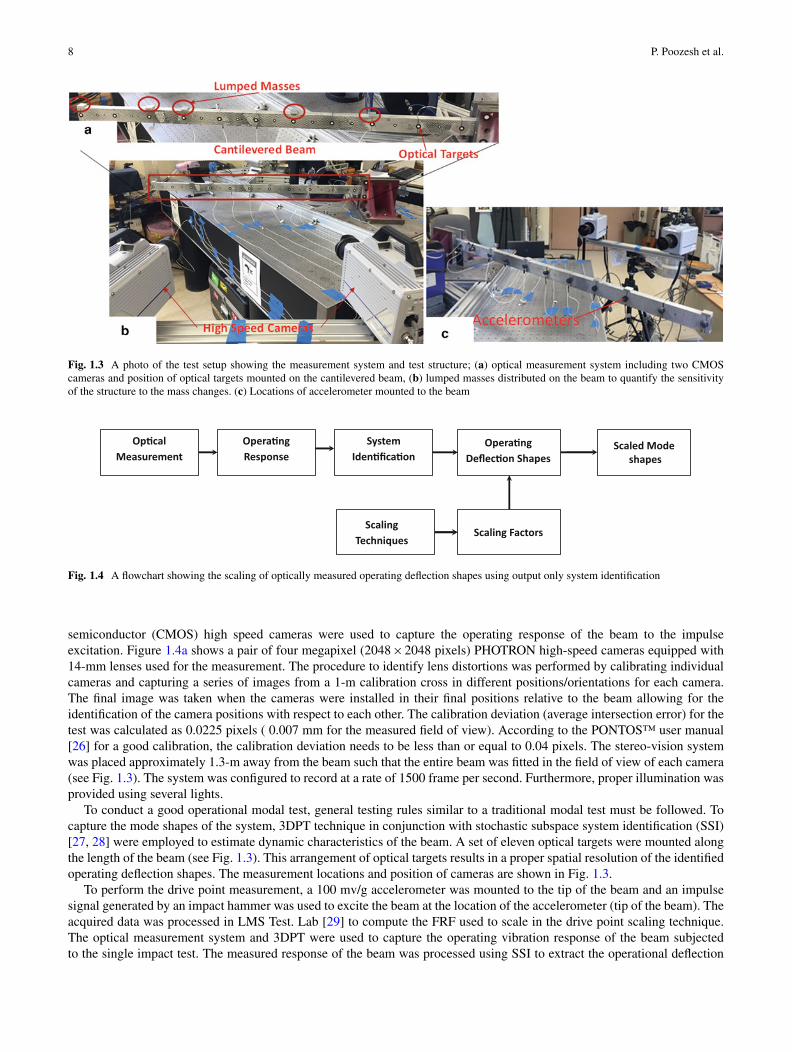
A measurement to experimentally validate the proposed approach for scaling operating deflections shapes was performed ona 5-ft cantilevered aluminum beam (see Fig. 1.3). The cross section of the beam was a rectangular tube with dimensions of1-in by 2-in and a thickness of 1/8-in. One stereovision system composed of two synchronized complementary metal-oxide
8 P. Poozesh et al.
Fig. 1.3 A photo of the test setup showing the measurement system and test structure; (a) optical measurement system including two CMOScameras and position of optical targets mounted on the cantilevered beam, (b) lumped masses distributed on the beam to quantify the sensitivityof the structure to the mass changes. (c) Locations of accelerometer mounted to the beam
Opera�ng Deflec�on Shapes
System Iden�fica�on
Opera�ng Response
Op�cal Measurement
Scaling Techniques
Scaling Factors
Scaled Modeshapes
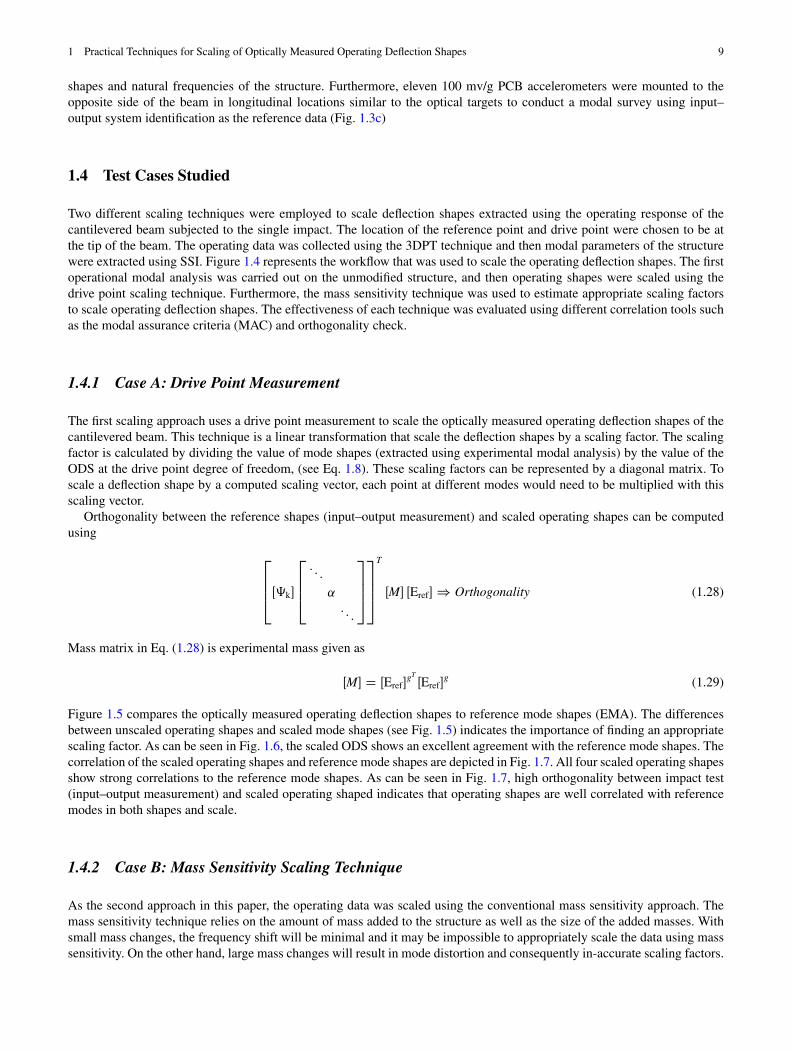
Fig. 1.4 A flowchart showing the scaling of optically measured operating deflection shapes using output only system identification
semiconductor (CMOS) high speed cameras were used to capture the operating response of the beam to the impulseexcitation. Figure 1.4a shows a pair of four megapixel (2048 � 2048 pixels) PHOTRON high-speed cameras equipped with14-mm lenses used for the measurement. The procedure to identify lens distortions was performed by calibrating individualcameras and capturing a series of images from a 1-m calibration cross in different positions/orientations for each camera.The final image was taken when the cameras were installed in their final positions relative to the beam allowing for theidentification of the camera positions with respect to each other. The calibration deviation (average intersection error) for thetest was calculated as 0.0225 pixels ( 0.007 mm for the measured field of view). According to the PONTOS™ user manual[26] for a good calibration, the calibration deviation needs to be less than or equal to 0.04 pixels. The stereo-vision systemwas placed approximately 1.3-m away from the beam such that the entire beam was fitted in the field of view of each camera(see Fig. 1.3). The system was configured to record at a rate of 1500 frame per second. Furthermore, proper illumination wasprovided using several lights.
To conduct a good operational modal test, general testing rules similar to a traditional modal test must be followed. Tocapture the mode shapes of the system, 3DPT technique in conjunction with stochastic subspace system identification (SSI)[27, 28] were employed to estimate dynamic characteristics of the beam. A set of eleven optical targets were mounted alongthe length of the beam (see Fig. 1.3). This arrangement of optical targets results in a proper spatial resolution of the identifiedoperating deflection shapes. The measurement locations and position of cameras are shown in Fig. 1.3.
To perform the drive point measurement, a 100 mv/g accelerometer was mounted to the tip of the beam and an impulsesignal generated by an impact hammer was used to excite the beam at the location of the accelerometer (tip of the beam). Theacquired data was processed in LMS Test. Lab [29] to compute the FRF used to scale in the drive point scaling technique.The optical measurement system and 3DPT were used to capture the operating vibration response of the beam subjectedto the single impact test. The measured response of the beam was processed using SSI to extract the operational deflection
1 Practical Techniques for Scaling of Optically Measured Operating Deflection Shapes 9
shapes and natural frequencies of the structure. Furthermore, eleven 100 mv/g PCB accelerometers were mounted to theopposite side of the beam in longitudinal locations similar to the optical targets to conduct a modal survey using input–output system identification as the reference data (Fig. 1.3c)
1.4 Test Cases Studied
Two different scaling techniques were employed to scale deflection shapes extracted using the operating response of thecantilevered beam subjected to the single impact. The location of the reference point and drive point were chosen to be atthe tip of the beam. The operating data was collected using the 3DPT technique and then modal parameters of the structurewere extracted using SSI. Figure 1.4 represents the workflow that was used to scale the operating deflection shapes. The firstoperational modal analysis was carried out on the unmodified structure, and then operating shapes were scaled using thedrive point scaling technique. Furthermore, the mass sensitivity technique was used to estimate appropriate scaling factorsto scale operating deflection shapes. The effectiveness of each technique was evaluated using different correlation tools suchas the modal assurance criteria (MAC) and orthogonality check.
1.4.1 Case A: Drive Point Measurement
The first scaling approach uses a drive point measurement to scale the optically measured operating deflection shapes of thecantilevered beam. This technique is a linear transformation that scale the deflection shapes by a scaling factor. The scalingfactor is calculated by dividing the value of mode shapes (extracted using experimental modal analysis) by the value of theODS at the drive point degree of freedom, (see Eq. 1.8). These scaling factors can be represented by a diagonal matrix. Toscale a deflection shape by a computed scaling vector, each point at different modes would need to be multiplied with thisscaling vector.
Orthogonality between the reference shapes (input–output measurement) and scaled operating shapes can be computedusing
2664Œ‰k�
2664: : :
˛: : :
37753775
T
ŒM� ŒEref� ) Orthogonality (1.28)
Mass matrix in Eq. (1.28) is experimental mass given as
ŒM� D ŒEref�gTŒEref�
g (1.29)
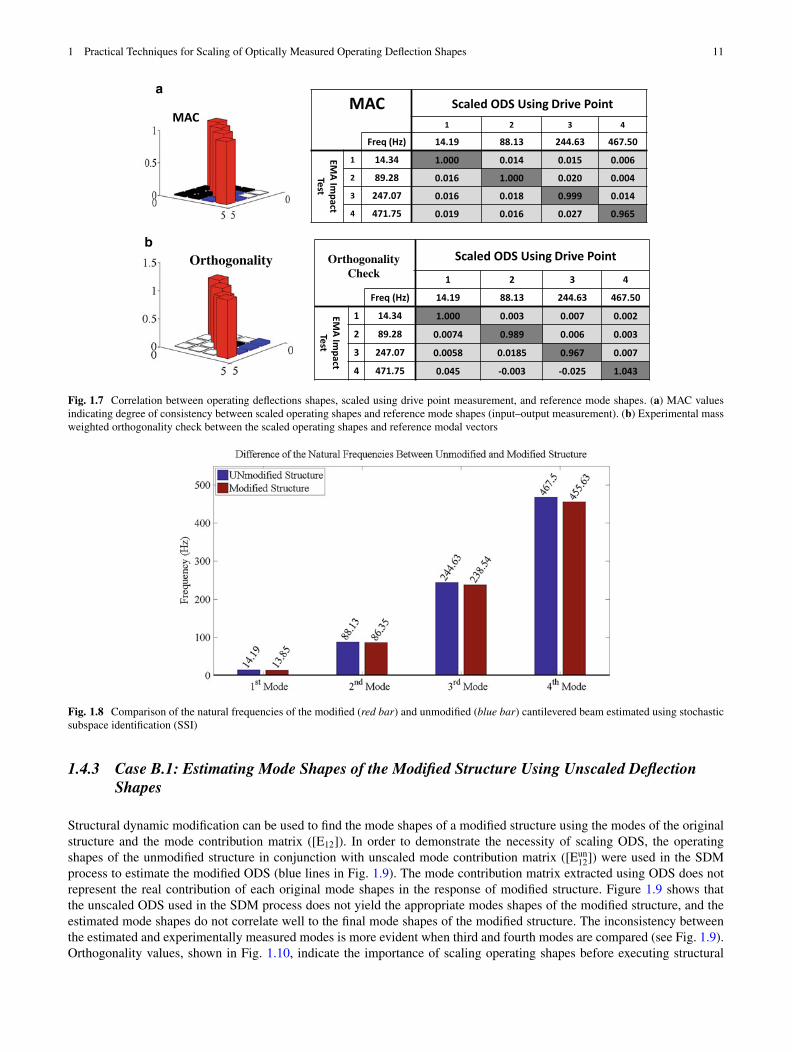
Figure 1.5 compares the optically measured operating deflection shapes to reference mode shapes (EMA). The differencesbetween unscaled operating shapes and scaled mode shapes (see Fig. 1.5) indicates the importance of finding an appropriatescaling factor. As can be seen in Fig. 1.6, the scaled ODS shows an excellent agreement with the reference mode shapes. Thecorrelation of the scaled operating shapes and reference mode shapes are depicted in Fig. 1.7. All four scaled operating shapesshow strong correlations to the reference mode shapes. As can be seen in Fig. 1.7, high orthogonality between impact test(input–output measurement) and scaled operating shaped indicates that operating shapes are well correlated with referencemodes in both shapes and scale.
1.4.2 Case B: Mass Sensitivity Scaling Technique
As the second approach in this paper, the operating data was scaled using the conventional mass sensitivity approach. Themass sensitivity technique relies on the amount of mass added to the structure as well as the size of the added masses. Withsmall mass changes, the frequency shift will be minimal and it may be impossible to appropriately scale the data using masssensitivity. On the other hand, large mass changes will result in mode distortion and consequently in-accurate scaling factors.

10 P. Poozesh et al.
Fig. 1.5 Comparison of the operating deflection shapes (OMA test) and reference mode shapes (input–output measurement) for the first fourbending modes
Fig. 1.6 Comparison of the scaled operating deflection shapes (OMA test) using the drive point technique and reference mode shapes (input–output measurement) for the first four bending modes
Therefore, selecting appropriate mass to evaluate the sensitivity of the structure to mass changes is critical. Within this work,five lumped mass modifications (6 % of the beam’s weight) are used to examine the sensitivity of the beam to the masschanges. The estimated natural frequencies of the unmodified and modified structure using SSI for the first four bendingmodes are shown in Fig. 1.8.
1 Practical Techniques for Scaling of Optically Measured Operating Deflection Shapes 11
MAC Scaled ODS Using Drive Point 1 2 3 4
Freq (Hz) 14.19 88.13 244.63 467.50
EMA Im
pact Test
1 14.34 1.000 0.014 0.015 0.006
2 89.28 0.016 1.000 0.020 0.004
3 247.07 0.016 0.018 0.999 0.014
4 471.75 0.019 0.016 0.027 0.965
Scaled ODS Using Drive Point
1 2 3 4
Freq (Hz) 14.19 88.13 244.63 467.50
EMA Im
pact Test
1 14.34 1.000 0.003 0.007 0.002
2 89.28 0.0074 0.989 0.006 0.003
3 247.07 0.0058 0.0185 0.967 0.007
4 471.75 0.045 -0.003 -0.025 1.043
MAC
Orthogonality OrthogonalityCheck
a
b
Fig. 1.7 Correlation between operating deflections shapes, scaled using drive point measurement, and reference mode shapes. (a) MAC valuesindicating degree of consistency between scaled operating shapes and reference mode shapes (input–output measurement). (b) Experimental massweighted orthogonality check between the scaled operating shapes and reference modal vectors
Fig. 1.8 Comparison of the natural frequencies of the modified (red bar) and unmodified (blue bar) cantilevered beam estimated using stochasticsubspace identification (SSI)
1.4.3 Case B.1: Estimating Mode Shapes of the Modified Structure Using Unscaled DeflectionShapes
Structural dynamic modification can be used to find the mode shapes of a modified structure using the modes of the originalstructure and the mode contribution matrix ([E12]). In order to demonstrate the necessity of scaling ODS, the operatingshapes of the unmodified structure in conjunction with unscaled mode contribution matrix ([Eun
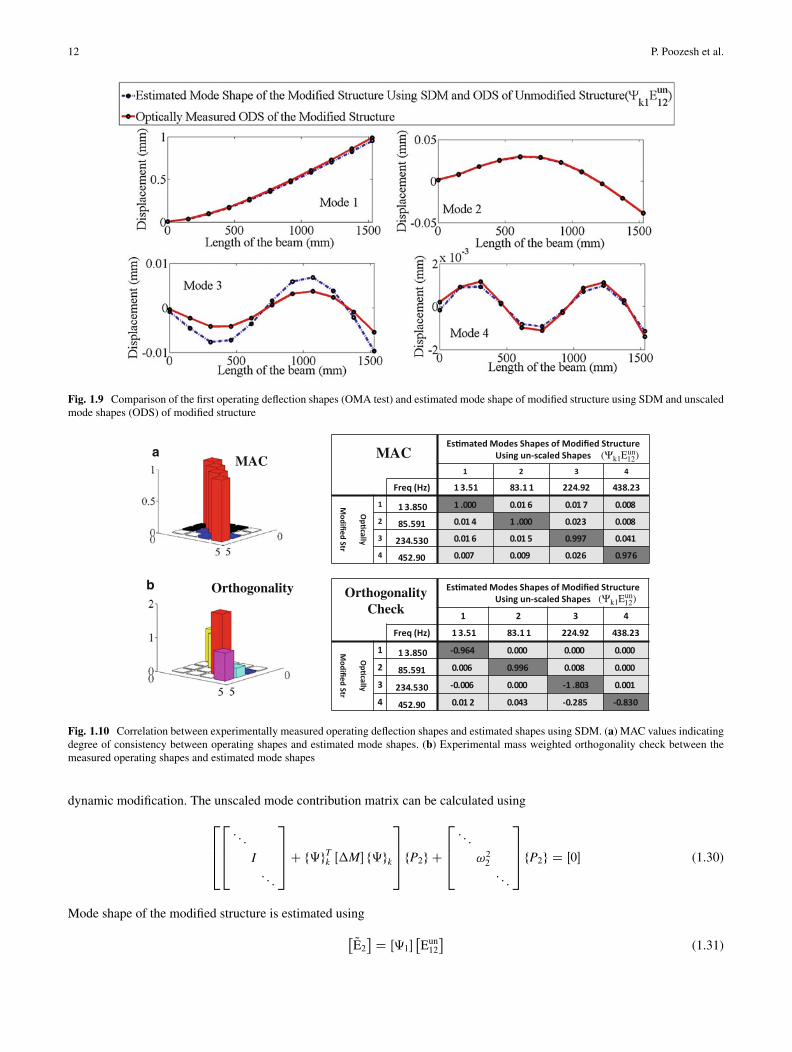
12]) were used in the SDMprocess to estimate the modified ODS (blue lines in Fig. 1.9). The mode contribution matrix extracted using ODS does notrepresent the real contribution of each original mode shapes in the response of modified structure. Figure 1.9 shows thatthe unscaled ODS used in the SDM process does not yield the appropriate modes shapes of the modified structure, and theestimated mode shapes do not correlate well to the final mode shapes of the modified structure. The inconsistency betweenthe estimated and experimentally measured modes is more evident when third and fourth modes are compared (see Fig. 1.9).Orthogonality values, shown in Fig. 1.10, indicate the importance of scaling operating shapes before executing structural
12 P. Poozesh et al.
Fig. 1.9 Comparison of the first operating deflection shapes (OMA test) and estimated mode shape of modified structure using SDM and unscaledmode shapes (ODS) of modified structure
Es�mated Modes Shapes of Modified Structure Using un-scaled Shapes
1 2 3 4
Freq (Hz) 1 3.51 83.1 1 224.92 438.23
Op�cally
Modified Str
1 1 3.850 1 .000 0.01 6 0.01 7 0.008
2 85.591 0.01 4 1 .000 0.023 0.008
3 234.530 0.01 6 0.01 5 0.997 0.041
4 452.90 0.007 0.009 0.026 0.976
Es�mated Modes Shapes of Modified Structure Using un-scaled Shapes
1 2 3 4
Freq (Hz) 1 3.51 83.1 1 224.92 438.23
Op�cally
Modified Str
1 1 3.850 -0.964 0.000 0.000 0.000
2 85.591 0.006 0.996 0.008 0.000
3 234.530 -0.006 0.000 -1 .803 0.001
4 452.90 0.01 2 0.043 -0.285 -0.830
MACa
b OrthogonalityCheck
Orthogonality
MAC (Ψk1Eun)12
(Ψk1Eun)12
Fig. 1.10 Correlation between experimentally measured operating deflection shapes and estimated shapes using SDM. (a) MAC values indicatingdegree of consistency between operating shapes and estimated mode shapes. (b) Experimental mass weighted orthogonality check between themeasured operating shapes and estimated mode shapes
dynamic modification. The unscaled mode contribution matrix can be calculated using26642664: : :
I: : :
3775C f‰gTk Œ�M� f‰gk
3775 fP2g C
2664: : :
!22: : :
3775 fP2g D Œ0� (1.30)
Mode shape of the modified structure is estimated using� QE2� D Œ‰1�
�Eun12
�(1.31)
1 Practical Techniques for Scaling of Optically Measured Operating Deflection Shapes 13
Fig. 1.11 Comparison between the first four reference mode shapes (EMA) and the scaled operating deflection shapes (OMA test) using masssensitivity
1.4.4 Case B.2: Mass Sensitivity Scaling Technique
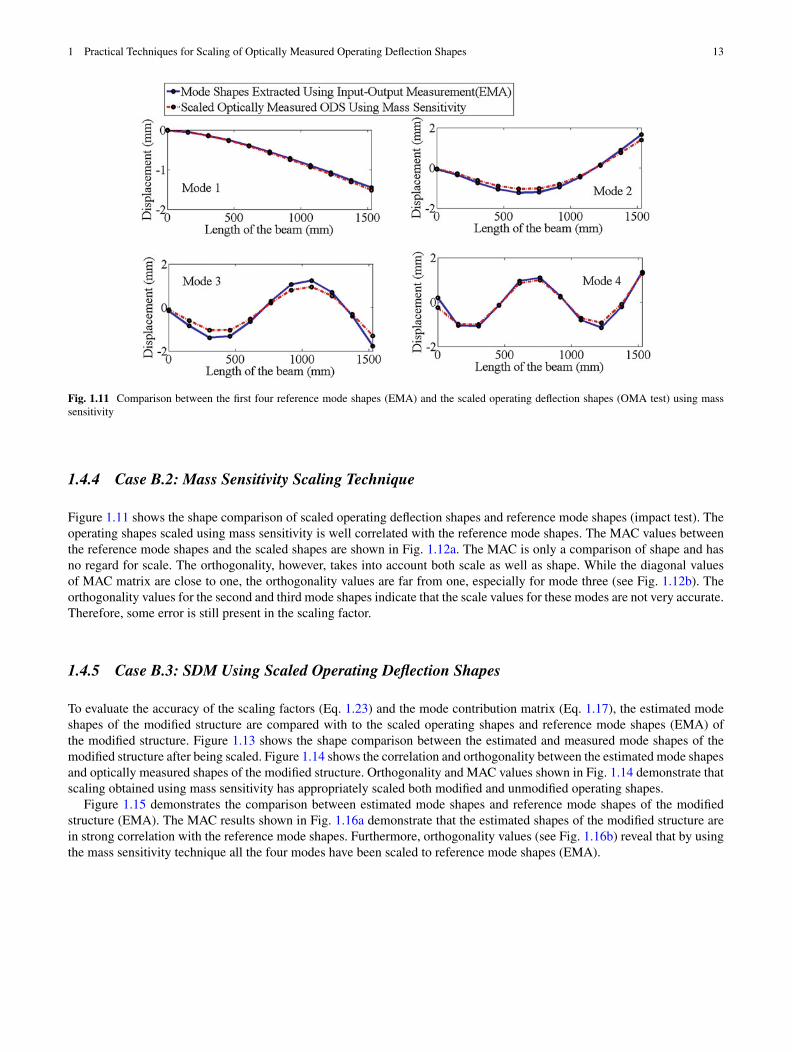
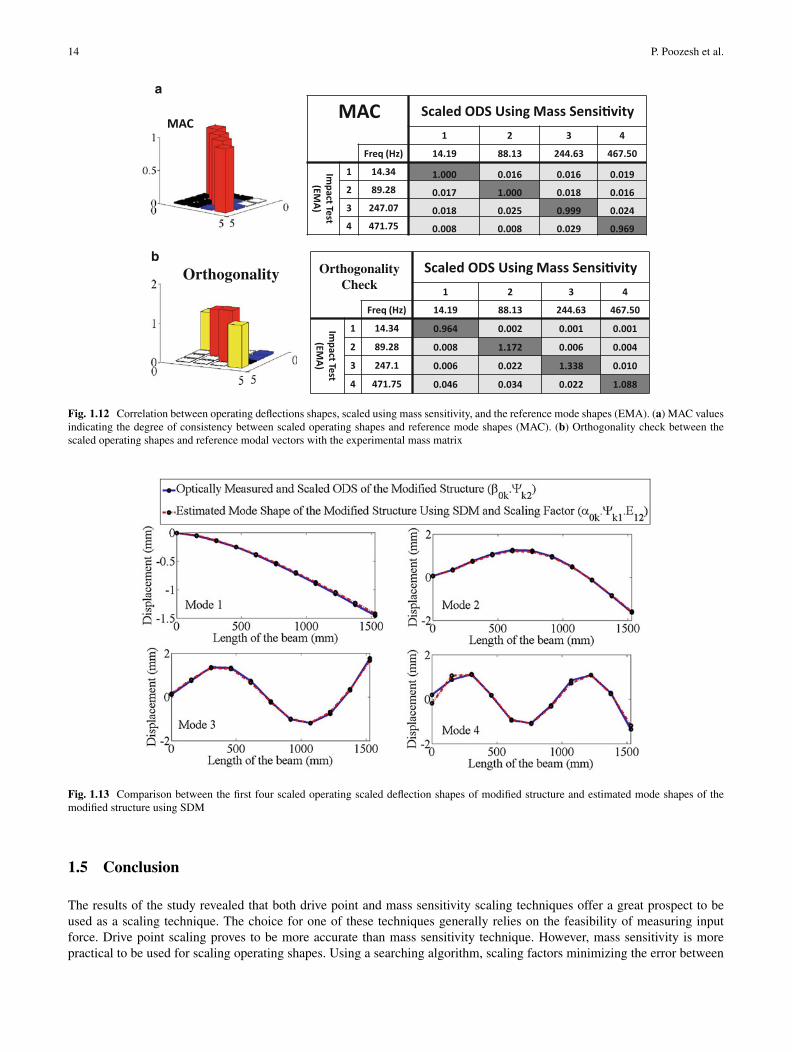
Figure 1.11 shows the shape comparison of scaled operating deflection shapes and reference mode shapes (impact test). Theoperating shapes scaled using mass sensitivity is well correlated with the reference mode shapes. The MAC values betweenthe reference mode shapes and the scaled shapes are shown in Fig. 1.12a. The MAC is only a comparison of shape and hasno regard for scale. The orthogonality, however, takes into account both scale as well as shape. While the diagonal valuesof MAC matrix are close to one, the orthogonality values are far from one, especially for mode three (see Fig. 1.12b). Theorthogonality values for the second and third mode shapes indicate that the scale values for these modes are not very accurate.Therefore, some error is still present in the scaling factor.
1.4.5 Case B.3: SDM Using Scaled Operating Deflection Shapes
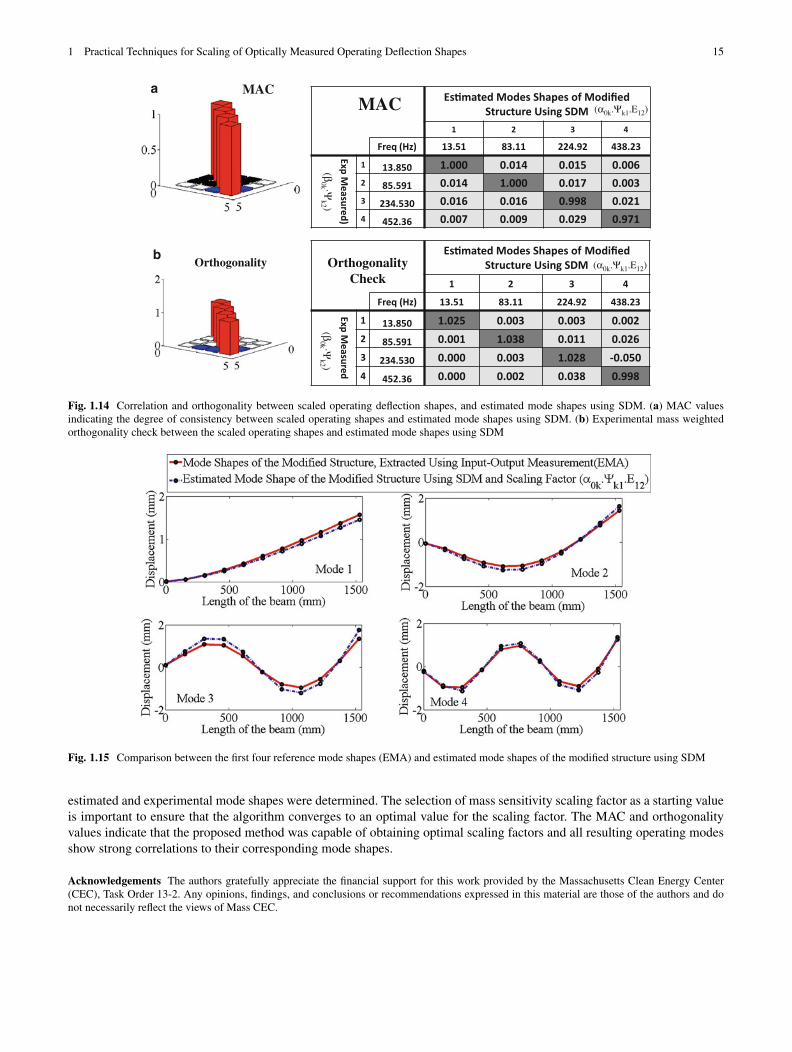
To evaluate the accuracy of the scaling factors (Eq. 1.23) and the mode contribution matrix (Eq. 1.17), the estimated modeshapes of the modified structure are compared with to the scaled operating shapes and reference mode shapes (EMA) ofthe modified structure. Figure 1.13 shows the shape comparison between the estimated and measured mode shapes of themodified structure after being scaled. Figure 1.14 shows the correlation and orthogonality between the estimated mode shapesand optically measured shapes of the modified structure. Orthogonality and MAC values shown in Fig. 1.14 demonstrate thatscaling obtained using mass sensitivity has appropriately scaled both modified and unmodified operating shapes.
Figure 1.15 demonstrates the comparison between estimated mode shapes and reference mode shapes of the modifiedstructure (EMA). The MAC results shown in Fig. 1.16a demonstrate that the estimated shapes of the modified structure arein strong correlation with the reference mode shapes. Furthermore, orthogonality values (see Fig. 1.16b) reveal that by usingthe mass sensitivity technique all the four modes have been scaled to reference mode shapes (EMA).
14 P. Poozesh et al.
MACa
b
Scaled ODS Using Mass Sensi�vity1 2 3 4
Freq (Hz) 14.19 88.13 244.63 467.50
ImpactTest (EM
A)
1 14.34 1.000 0.016 0.016 0.0192 89.28 0.017 1.000 0.018 0.0163 247.07 0.018 0.025 0.999 0.0244 471.75 0.008 0.008 0.029 0.969
Scaled ODS Using Mass Sensi�vity1 2 3 4
Freq (Hz) 14.19 88.13 244.63 467.50
ImpactTest (EM
A)
1 14.34 0.964 0.002 0.001 0.001
2 89.28 0.008 1.172 0.006 0.004
3 247.1 0.006 0.022 1.338 0.010
4 471.75 0.046 0.034 0.022 1.088
MAC
Orthogonality OrthogonalityCheck
Fig. 1.12 Correlation between operating deflections shapes, scaled using mass sensitivity, and the reference mode shapes (EMA). (a) MAC valuesindicating the degree of consistency between scaled operating shapes and reference mode shapes (MAC). (b) Orthogonality check between thescaled operating shapes and reference modal vectors with the experimental mass matrix
Fig. 1.13 Comparison between the first four scaled operating scaled deflection shapes of modified structure and estimated mode shapes of themodified structure using SDM
1.5 Conclusion
The results of the study revealed that both drive point and mass sensitivity scaling techniques offer a great prospect to beused as a scaling technique. The choice for one of these techniques generally relies on the feasibility of measuring inputforce. Drive point scaling proves to be more accurate than mass sensitivity technique. However, mass sensitivity is morepractical to be used for scaling operating shapes. Using a searching algorithm, scaling factors minimizing the error between
1 Practical Techniques for Scaling of Optically Measured Operating Deflection Shapes 15
MAC Es�mated Modes Shapes of ModifiedStructure Using SDM
1 2 3 4
Freq (Hz) 13.51 83.11 224.92 438.23
ExpM
easured)
1 13.850 1.000 0.014 0.015 0.0062 85.591 0.014 1.000 0.017 0.0033 234.530 0.016 0.016 0.998 0.0214 452.36 0.007 0.009 0.029 0.971
Es�mated Modes Shapes of Modified Structure Using SDM
1 2 3 4
Freq (Hz) 13.51 83.11 224.92 438.23
ExpM
easured
1 13.850 1.025 0.003 0.003 0.0022 85.591 0.001 1.038 0.011 0.0263 234.530 0.000 0.003 1.028 -0.0504 452.36 0.000 0.002 0.038 0.998
OrthogonalityCheck
a
bOrthogonality
MAC(α0k.Ψk1.E12)
(α0k.Ψk1.E12)
(β0k ·Ψ
k2 )(β
0k ·Ψk2 )
Fig. 1.14 Correlation and orthogonality between scaled operating deflection shapes, and estimated mode shapes using SDM. (a) MAC valuesindicating the degree of consistency between scaled operating shapes and estimated mode shapes using SDM. (b) Experimental mass weightedorthogonality check between the scaled operating shapes and estimated mode shapes using SDM
Fig. 1.15 Comparison between the first four reference mode shapes (EMA) and estimated mode shapes of the modified structure using SDM
estimated and experimental mode shapes were determined. The selection of mass sensitivity scaling factor as a starting valueis important to ensure that the algorithm converges to an optimal value for the scaling factor. The MAC and orthogonalityvalues indicate that the proposed method was capable of obtaining optimal scaling factors and all resulting operating modesshow strong correlations to their corresponding mode shapes.
Acknowledgements The authors gratefully appreciate the financial support for this work provided by the Massachusetts Clean Energy Center(CEC), Task Order 13-2. Any opinions, findings, and conclusions or recommendations expressed in this material are those of the authors and donot necessarily reflect the views of Mass CEC.

16 P. Poozesh et al.
Estimated Modes Shapes of ModifiedStructure Using SDM
1 2 3 4
Freq (Hz) 13.51 83.11 224.92 438.23
Impact Test (EM
A)
1 14.01 1.000 0.013 0.015 0.007
2 87.32 0.016 1.000 0.016 0.008
3 242.49 0.017 0.018 0.998 0.028
4 463.49 0.020 0.016 0.038 0.990
Estimated Modes Shapes of ModifiedStructure Using SDM
1 2 3 4
Freq (Hz) 13.51 83.11 224.92 438.23
Impact Test (EM
A)
1 14.01 0.924 0.012 -0.009 0.055
2 87.32 0.002 -1.152 -0.019 0.034
3 242.49 0.001 0.006 1.266 -0.018
4 463.49 0.000 -0.002 0.049 -1.126
MACa
b
Orthogonality Orthogonality
Check
MAC (α0k.Ψk1.E12)
(α0k.Ψk1.E12)
Fig. 1.16 Correlation and orthogonality between estimated scaled operating deflections shapes, and the reference mode shapes (EMA). (a) MACvalues indicating degree of consistency between estimated scaled operating deflections shapes, and the reference mode shapes. (b) Experimentalmass weighted orthogonality check between estimated scaled operating deflections shapes, and the reference mode shapes
References
1. Baqersad, J., Poozesh, P., Niezrecki, C., Avitabile, P.: Comparison of modal parameters extracted using MIMO, SIMO, and impact hammertests on a three-bladed wind turbine. In: Proceeding of the 32nd IMAC, A Conference and Exposition on Structural Dynamics, Orlando, FL,pp. 185–197, February 3–6, 2014
2. Devriendt, C., Guillaume, P., Brussel, V.U., Reynders, E., Roeck, G.D.: Operational modal analysis of a bridge using transmissibilitymeasurements. In: Proceeding of the 25th IMAC, Conference & Exposition on Structural Dynamics, Orlando, Florida, February 19–22, 2007
3. Rainieri, C., Fabbrocino, G.: Operational Modal Analysis of Civil Engineering Structures. Springer, New York (2014)4. Peeters, B., Van der Auweraer, H., Vanhollebeke, F., Guillaume, P.: Operational modal analysis for estimating the dynamic properties of a
stadium structure during a football game. Shock Vib. 14(4), 283–303 (2007)5. Poozesh, P., Baqersad, J., Niezrecki, C., Avitabile, P.: A multi-camera stereo DIC system for extracting operating mode shapes of large scale
structures. In: Proceeding of the SEM Annual Conference on Experimental and Applied Mechanics, Costa Mesa, CA, June 8–11, 20156. Tcherniak, D., Chauhan, S., Hansen, M.H.: Applicability limits of operational modal analysis to operational wind turbines. In: Proceeding of
the 28th IMAC, A Conference and Exposition on Structural Dynamics, Springer New York, pp. 317–327, February 1–4, 20107. López-Aenlle, M., Brincker, R., Pelayo, F., Canteli, A.F.: On exact and approximated formulations for scaling-mode shapes in operational
modal analysis by mass and stiffness change. J. Sound Vib. 331(3), 622–637 (2012)8. Ventura, C.E., Lord, J.F., Turk, M., Brincker, R., Andersen, P., Dascotte, E.: FEM updating of tall buildings using ambient vibration data. In:
Proceeding of the Sixth International Conference on Structural Dynamics (EURODYN), Paris, France, 20059. López-Aenlle, M., Fernández, P., Brincker, R., Fernández-Canteli, A.: Scaling-factor estimation using an optimized mass-change strategy.
Mech. Syst. Signal Process. 24(5), 1260–1273 (2010)10. Hout, B., Avitabile, P.: Application of operating data scaling techniques. In: Proceeding of the 22nd IMAC, A Conference on Structural
Dynamics, Dearborn, MI, pp. 52–58, January 26–29, 200411. López-Aenlle, M., Brincker, R., Fernández-Canteli, A.: Some methods to determine scaled mode shapes in natural input modal analysis. In:
Proceeding of the 23rd IMAC, Conference & Exposition on Structural Dynamics, Orlando, Florida, pp. 165–176, January 31–February 3 200512. Aenlle, M.L., Fernández, P.F., Brincker, R., Canteli, A.F.: Scaling factor estimation using an optimized mass change strategy, part 1: theory.
In: Proceeding of the, International Operational Modal Analysis Conference (IOMAC), pp. 421–428, 200713. Fernández, P., Reynolds, P., López-Aenlle, M.: Scaling mode shapes in output-only systems by a consecutive mass change method. Exp. Mech.
51(6), 995–1005 (2011)14. Brincker, R., Rodrigues, P., Andersen, P.: Scaling the mode shapes of a building model by mass changes. In: Proceeding of the 22nd IMAC,
International Modal Analysis Conference, Dearborn, MI, pp. 119–126, January 26–29, 200415. Parloo, E., Verboven, P., Guillaume, P., Van Overmeire, M.: Sensitivity-based operational mode shape normalisation. Mech. Syst. Signal
Process. 16(5), 757–767 (2002)16. Khatibi, M.M., Ashory, M.R., Malekjafarian, A., Brincker, R.: Mass-stiffness change method for scaling of operational mode shapes. Mech.
Syst. Signal Process. 26, 34–59 (2012)

1 Practical Techniques for Scaling of Optically Measured Operating Deflection Shapes 17
17. Baqersad, J., Carr, J., Lundstrom, T., Niezrecki, C., Avitabile, P., Slattery, M.: Dynamic characteristics of a wind turbine blade using 3D digitalimage correlation. In: Proceeding of the SPIE Symposium on Smart Structures & Materials/NDE and Health Monitoring, pp. 21–29, April 20,2012
18. Helfrick, M.N., Niezrecki, C., Avitabile, P., Schmidt, T.: 3D digital image correlation methods for full-field vibration measurement. Mech.Syst. Signal Process. 25(3), 917–927 (2011)
19. Poozesh, P., Baqersad, J., Niezrecki, C., Harvey, E., Yarala, R.: Full field inspection of a utility scale wind turbine blade using digital imagecorrelation. In: Proceeding of the Composites and Advanced Materials, CAMX, Orlando, FL, October, 2014
20. Baqersad, J., Poozesh, P., Niezrecki, C., Avitabile, P.: Predicting full-field strain on a wind turbine for arbitrary excitation using displacementsof optical targets measured with photogrammetry. In: Proceeding of the 33rd IMAC, A Conference on Structural Dynamics, pp. 99–114, 2015
21. Carr, J., Baqersad, J., Niezrecki, C., Avitabile, P., Slattery, M.: Dynamic stress–strain on turbine blade using digital image correlation techniquesPart 1: static load and calibration. In: Proceeding of the 30th IMAC, Jacksonville, FL, pp. 215–220, February 2–5, 2012
22. Lundstrom, T., Baqersad, J., Niezrecki, C., Avitabile, P.: Using high-speed stereophotogrammetry techniques to extract shape information fromwind turbine/rotor operating data. In: Proceeding of the 30th IMAC, Conference & Exposition on Structural Dynamics, Jacksonville, FL, pp.269–275, February 2–5, 2012
23. Allemang, R.J., Brown, D.L.: Correlation coefficient for modal vector analysis. In: Proceeding of the 1st IMAC, International Modal AnalysisConference & Exhibit, Orlando, FL, USA, pp. 110–116, 1982
24. Parloo, E., Cauberghe, B., Benedettini, F., Alaggio, R., Guillaume, P.: Sensitivity-based operational mode shape normalisation: application toa bridge. Mech. Syst. Signal Process. 19(1), 43–55 (2005)
25. Avitabile, P.: Twenty years of structural dynamic modification-a review. Sound Vib. 37(1), 14–27 (2003)26. PONTOS v6.3, GOM mbH, Braunschweig, Germany27. Peeters, B., De Roeck, G.: Reference-based stochastic subspace identification for output-only modal analysis. Mech. Syst. Signal Process.
13(6), 855–878 (1999)28. Ljung, L.: System Identification, Signal Analysis and Prediction. Birkhäuser, Boston, ISBN 978-1-4612-7273-1, pp. 163–173, 199829. LMS Test.Lab 14A, LMS International, Leuven, Belgium
Chapter 2Prediction of the Coupled Impedance from Frequency Response Data
Ramona Fagiani, Elisabetta Manconi, and Marcello Vanali
Abstract This work deals with the common case of large mechanical systems which can be modelled considering two mainsub-structures: a source structure, corresponding for example to the engine, and a receiving structure, as the accommodationarea/cabin in these machines. Numerical models are highly desired for predicting the vibroacoustic behaviour of the receiverat a design stage and for design optimisation. In many cases the mechanical systems must be studied using sub-structuringtechniques
Here a standard frequency response coupling technique (or impedance coupling technique) is applied for the predictionof the complex power transmitted between a source structure and a receiving structure in a multi-point-connection case. Thedata required in this case are the frequency response functions (FRFs) of both the source and the receiver and the velocityat the connecting points under operating conditions. Experimental aspects and issues associated with this technique areinvestigated considering a simplified mechanical model. This consists of a driven beam connected in two or more points to asource. Results are discussed and compared with those obtained from a numerical model.
Keywords Coupled impedance • Coupled structures • Modal analysis
2.1 Introduction
Determining the vibro-acoustic behaviour of complex mechanical structures can be very challenging, since severalcomponents be simultaneously involved [1, 2]. In order to quantify the force transmitted through substructures for structure-born noise estimation, the knowledge of mechanical mobility and impedance at the connecting points is necessary [3]. In thisregard, Dynamic Substructuring (DS) [4] plays a significant role for investigating a structural system by the analysis of thesingle sub-structure dynamic features and the way in which they combine. The substructuring approach has some significantadvantages over the consideration of the full structure, in particular it allows evaluation of the dynamic behaviour of largeand complex structures when the analysis of the all structure is unrealistic. Moreover, combining analytically, numericallyor experimentally single modelled parts of the whole structure, local dynamic behaviour can be recognized more easily andneglected when it has no significant impact on the assembled system. In many cases this results in a simplified and clearerrepresentation of the structure overall dynamics and in a significant reduction of the analysis time.
Despite all the attention received in the last years, DS still requires additional research, especially concerning a numberof challenges associated with the coupling of experimentally obtained substructures. Just to cite a few works, a review of thedifficulties encountered in experimental DS are summarised in [4], errors related to truncation of modal degrees of freedomin [5] and the estimation of rotational degrees of freedom in [6], inclusion of rigid body modes in [7], non-linear mechanicalcoupling in [8], random measurement noise which may result in low signal-to-noise ratio, especially in the case of lightlydamped structures in [9], inexact determination of the antiresonance modes in [10].
In this paper a frequency response coupling technique (or impedance coupling technique) is revised for the predictionof the complex impedance. Data required are the frequency response functions (FRFs) of the source and the receiver andthe velocity/accelerations at the connecting points under operating conditions. These can be either experimental data ornumerical data obtained from finite element analysis or modal analysis. The FRF coupling technique is first applied to asimple case study concerning two beams for validating the method numerically and experimentally and for investigating itsaccuracy according to the frequency range of interest.
R. Fagiani • E. Manconi • M. Vanali (�)Industrial Engineering Department, Università degli Studi di Parma, Parco Area delle Scienze 181/A, 43124 Parma, Italye-mail: [email protected]
© The Society for Experimental Mechanics, Inc. 2016J. De Clerck, D.S. Epp (eds.), Rotating Machinery, Hybrid Test Methods, Vibro-Acoustics & Laser Vibrometry, Volume 8,Conference Proceedings of the Society for Experimental Mechanics Series, DOI 10.1007/978-3-319-30084-9_2
19
20 R. Fagiani et al.
2.2 FRF Coupling
This section is dedicated to revise a methodology for coupling a flexible structure to another structure (e.g. a sourcemachine) using the FRF matrices, e.g. [4]. The objective is to describe an approach for evaluating the power input froma large machine to a flexible structure when forces and responses data of the separated structures can be measured and onlyacceleration/velocity responses data of the whole coupled structure in operation are available.
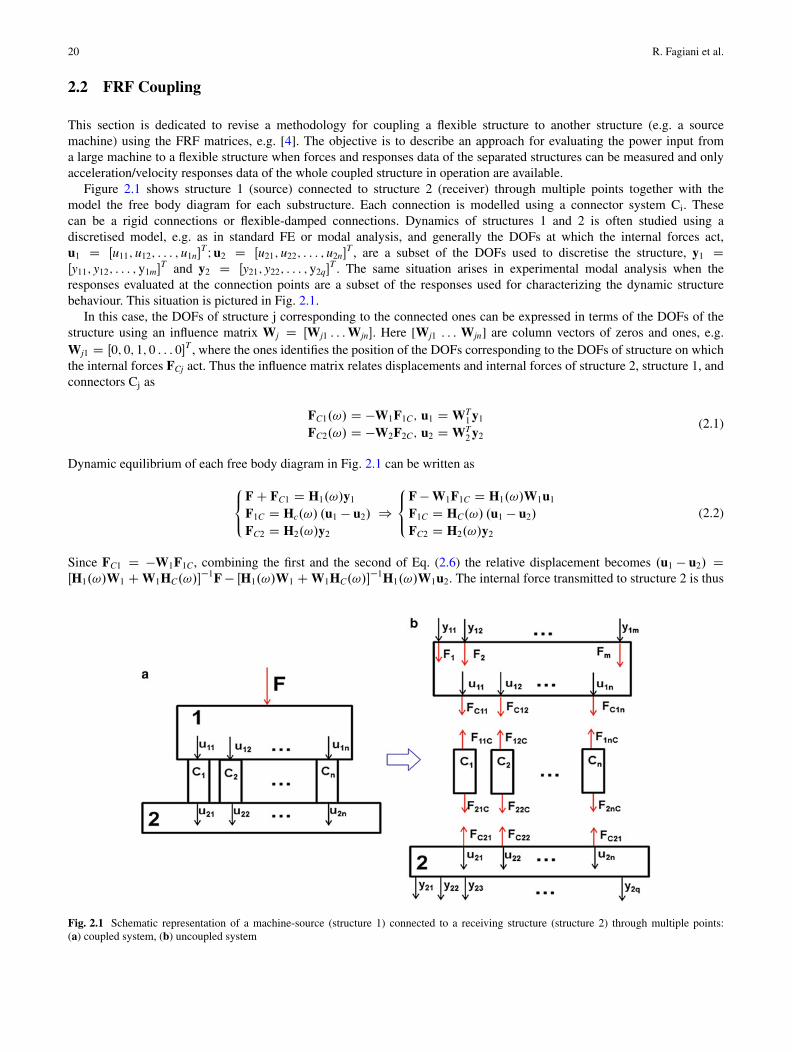
Figure 2.1 shows structure 1 (source) connected to structure 2 (receiver) through multiple points together with themodel the free body diagram for each substructure. Each connection is modelled using a connector system Ci. Thesecan be a rigid connections or flexible-damped connections. Dynamics of structures 1 and 2 is often studied using adiscretised model, e.g. as in standard FE or modal analysis, and generally the DOFs at which the internal forces act,u1 D Œu11; u12; : : : ; u1n�
T I u2 D Œu21; u22; : : : ; u2n�T , are a subset of the DOFs used to discretise the structure, y1 D
Œy11; y12; : : : ; y1m�T and y2 D Œy21; y22; : : : ; y2q�
T . The same situation arises in experimental modal analysis when theresponses evaluated at the connection points are a subset of the responses used for characterizing the dynamic structurebehaviour. This situation is pictured in Fig. 2.1.
In this case, the DOFs of structure j corresponding to the connected ones can be expressed in terms of the DOFs of thestructure using an influence matrix Wj D ŒWj1 : : :Wjn�. Here [Wj1 : : : Wjn] are column vectors of zeros and ones, e.g.Wj1 D Œ0; 0; 1; 0 : : : 0�T , where the ones identifies the position of the DOFs corresponding to the DOFs of structure on whichthe internal forces FCj act. Thus the influence matrix relates displacements and internal forces of structure 2, structure 1, andconnectors Cj as
FC1.!/ D �W1F1C; u1 D WT1y1
FC2.!/ D �W2F2C; u2 D WT2y2
(2.1)
Dynamic equilibrium of each free body diagram in Fig. 2.1 can be written as8<:F C FC1 D H1.!/y1F1C D Hc.!/ .u1 � u2/FC2 D H2.!/y2
)8<:
F � W1F1C D H1.!/W1u1F1C D HC.!/ .u1 � u2/FC2 D H2.!/y2
(2.2)
Since FC1 D �W1F1C, combining the first and the second of Eq. (2.6) the relative displacement becomes .u1 � u2/ DŒH1.!/W1 C W1HC.!/�
�1F � ŒH1.!/W1 C W1HC.!/��1H1.!/W1u2. The internal force transmitted to structure 2 is thus
Fig. 2.1 Schematic representation of a machine-source (structure 1) connected to a receiving structure (structure 2) through multiple points:(a) coupled system, (b) uncoupled system
2 Prediction of the Coupled Impedance from Frequency Response Data 21
F2C D �F1C D �HC.!/U1.!/�1F C HC.!/U1.!/
�1H1.!/W1u2 (2.3)
where U1.!/ D H1.!/W1 C W1HC.!/. Using Eq. (2.5)
FC2 D W2HC.!/U1.!/�1F � W2HC.!/U1.!/
�1H1.!/W1WT2y2 (2.4)
Given FC2 D H2.!/y2, Eq. (2.8) becomes
F DhU1.!/HC.!/
�1WT2H2 C H1.!/W1WT
2
iy2 (2.5)
Hence the frequency response matrix of the coupled structure evaluated at the receiver is
H.!/ D U1.!/HC.!/�1WT
2H2 C H1.!/W1WT2 (2.6)
If structure 2 is excited by the external force F while structure 1 is free to vibrate, the transfer matrix modifies as
H.!/ D H2 C W2HC.!/U1.!/�1H1.!/W1WT
2 (2.7)
Once the transfer matrix of the coupled structure is known, the impedance and inertance matrices are Z.!/ D H.!/=i! andI.!/ D �H.!/=!2.
The above formulation has been applied to a simple experimental case and results are discussed in the next section.
2.3 Experimental Setup
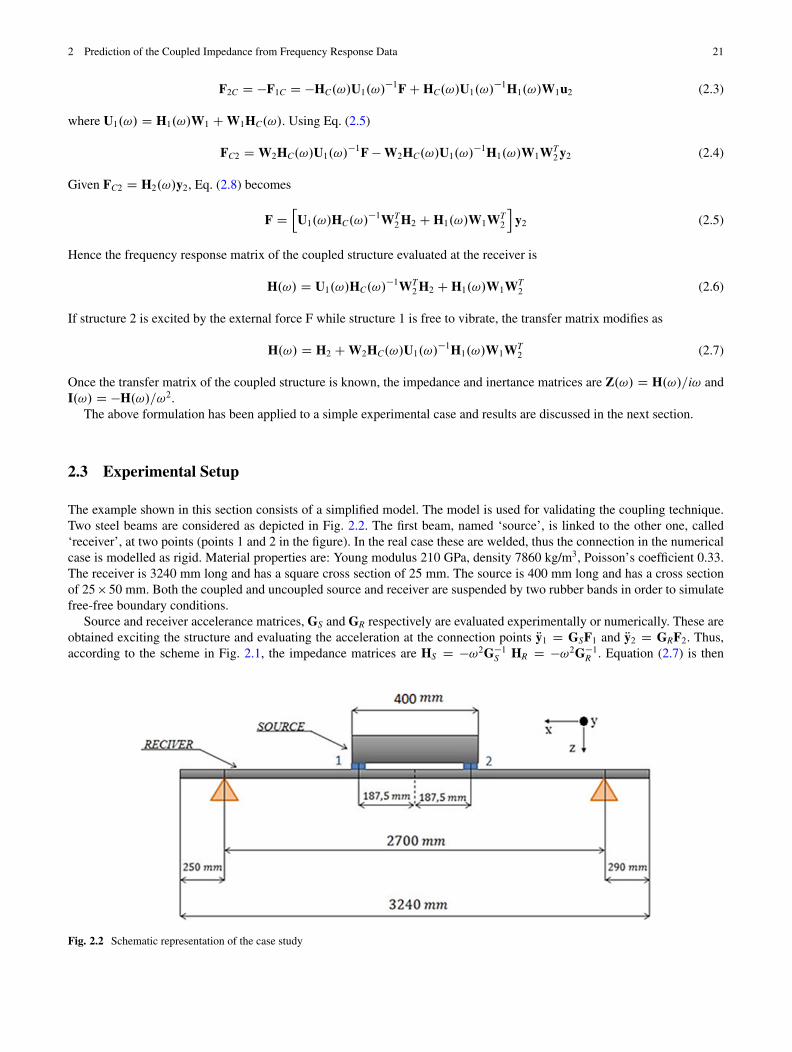
The example shown in this section consists of a simplified model. The model is used for validating the coupling technique.Two steel beams are considered as depicted in Fig. 2.2. The first beam, named ‘source’, is linked to the other one, called‘receiver’, at two points (points 1 and 2 in the figure). In the real case these are welded, thus the connection in the numericalcase is modelled as rigid. Material properties are: Young modulus 210 GPa, density 7860 kg/m3, Poisson’s coefficient 0.33.The receiver is 3240 mm long and has a square cross section of 25 mm. The source is 400 mm long and has a cross sectionof 25 � 50 mm. Both the coupled and uncoupled source and receiver are suspended by two rubber bands in order to simulatefree-free boundary conditions.
Source and receiver accelerance matrices, GS and GR respectively are evaluated experimentally or numerically. These areobtained exciting the structure and evaluating the acceleration at the connection points Ry1 D GSF1 and Ry2 D GRF2. Thus,according to the scheme in Fig. 2.1, the impedance matrices are HS D �!2G�1
S HR D �!2G�1R . Equation (2.7) is then
Fig. 2.2 Schematic representation of the case study