james e. kirkley virginia institute of marine science gloucester pt., va 23062 chris reid dale e....
Post on 22-Dec-2015
217 views
TRANSCRIPT

James E. KirkleyVirginia Institute of Marine Science
Gloucester Pt., Va 23062
Chris Reid
Dale E. SquiresNational Marine Fisheries Service
Southwest Fisheries Science CenterLa Jolla, Ca
Productivity Growth with Undesirable Outputs In The Western and Central Pacific Tuna Fishery
Danhostel Helsingr VandrerhjemJune 18-21, 2008

Items to Be Discussed
A productivity metric adjusted for undesirable outputs
Use of a non-stochastic, parametric multiple output specification of the technology—output distance functions
The Malmquist index revisited
Empirical illustration and analysis of productivity in the Western and Central Pacific tuna fishery
Source: NOAA Photo Library; Jose Cort

Productivity and Undesirable Outputs
For past 15 or so years, the majority of the economic research on fisheries has emphasized bioeconomic modeling, quasi-private property right regimes, spatial management, technical efficiency, and capacity assessment
Declines in productivity, however, have likely occurred, but there has been very little attention given by researchers to measuring and assessing productivity in fisheries (some exceptions include Squires (1992), Di Jin et al. (2002), Felthoven and Paul (2004), and R. Hannesson (2007)).
Besides there being given little effort to assessing productivity in fisheries (particularly on a regular basis), there has been little to no attention given to assessing productivity when there are undesirable outputs
Undesirable outputs (marketable and non-marketable discards characterize many fisheries of the world)

Measuring Productivity with Undesirable Outputs
There is a growing literature on estimating measures of productivity adjusted for undesirable outputs—that is, productivity measures penalize high levels of undesirable outputs
A large array of possible methods for estimating capacity are available—see Coelli et al. (2005) “An Introduction to Efficiency and Productivity Analysis” for a detailed discussion of various standard methods, and Chung et al. (1997), “Productivity and Undesirable Outputs: A Directional Distance function Approach” and Fare and Grosskopf (2004), New Directions: Efficiency and Productivity for comprehensive discussions relative to undesirable outputs

The Latest Rage in ProductivityFollowing Luenberger (1992, 1995), Chambers et al. (1998) and Fare and Grosskopf (2000, 2004) offer a non-stochastic, parametric, unit directional distance vector approach for assessing productivity with undesirable outputs. Fare and Grosskopf (2004) also offered a data envelopment analysis (DEA) approach for assessing productivity when there are undesirable outputs.
Fare and Grosskopf (2004) propose a generalized quadratic flexible functional form for the unit distance function and demonstrate how to estimate productivity
Major problem with this approach is the frontier defined by the unit distance function and the measure of productivity—it is additive and an indicator rather than a measure of the rate of change in productivity
This Luenberger metric tells us the quantity we gain or lose in each form subject to a frontier determined by expanding each good output and contracting each bad output by the same level (e.g., add five units of output to all good outputs and subtract five units of bad output to all bad outputs)
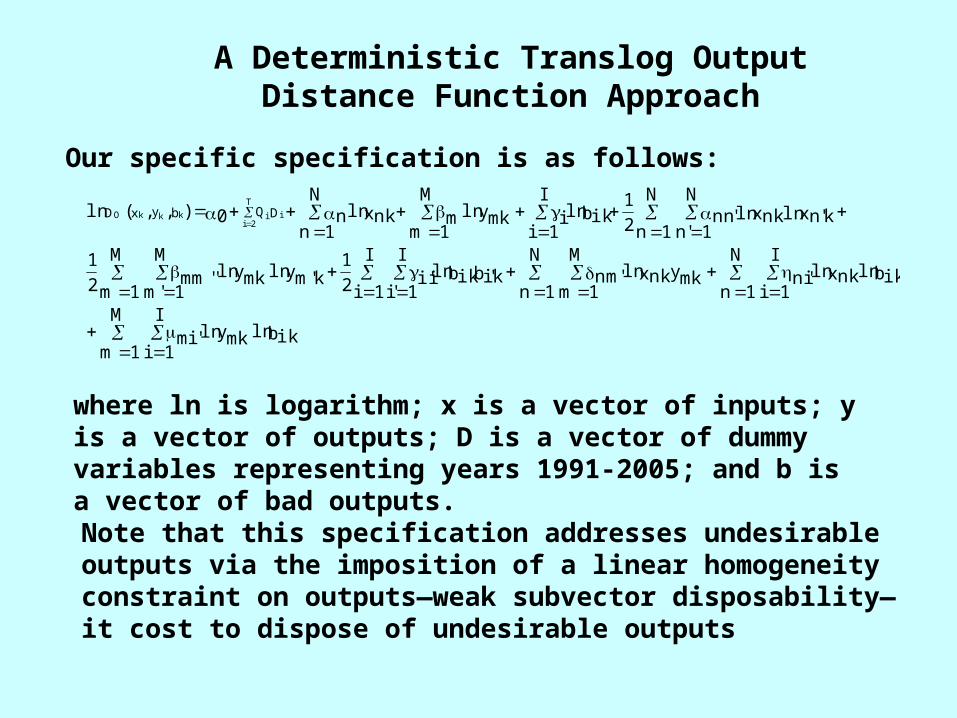
A Deterministic Translog Output Distance Function Approach
Our specific specification is as follows:
Note that this specification addresses undesirable outputs via the imposition of a linear homogeneity constraint on outputs—weak subvector disposability—it cost to dispose of undesirable outputs
where ln is logarithm; x is a vector of inputs; y is a vector of outputs; D is a vector of dummy variables representing years 1991-2005; and b is a vector of bad outputs.
biklnyln mkM
1m
I
1i'mi
biklnxnklnN
1n
I
1i'niymkxnkln
N
1n
M
1m'nmb k'ibikln
I
1i
I
1'i'ii2
1y k'mlnymkln
M
1m
M
1'm''mm2
1
xln k'nxln nkN
1n
N
1'n'nn2
1bikln
I
1iiymkln
M
1mmxnkln
N
1nn0),,(ln DQbyxD i
T
2iikkkO

The directional vector approach of Fare and others allows good outputs to increase by some metric (unit or scalar radial) and bad outputs to contract by the same metric (unit or scalar). It is relatively easy to estimate with DEA but somewhat cumbersome using flexible functional form specifications.
An alternative, which we consider in a manuscript under preparation, is a hyperbolic function with the translog specification—this allows us to expand good outputs by some radial scalar and contract bad outputs by the inverse of the radial scalar.
Depending upon how the objective function is specified (ln 1 – ln (D(x,y,b)) or ln D(x,y,b) – ln 1), different constraints are imposed on the distance function and its derivatives with respect to inputs, good outputs, and bad outputs.
For the case of both good and bad outputs, we impose the constraints that the derivative of the distance function with respect to good outputs is positive, and the derivative of the distance function with respect to bad outputs is negative. In the case of all good outputs, we omit the restriction on the derivative of the distance function with respect to bad outputs.

Estimation
We follow Fare and Grosskopf (2004) and Vardanyan and Noh (2006) and estimate using the non-stochastic Aigner and Chu (1968) linear programming approach
One can apply corrected ordinary least squares or estimate using the conventional stochastic multiple output distance function frontier approach
The objective is to minimize the value of ln 1 – ln D (our translog distance function) over all observations subject to a variety of constraints (see Vardanyan and Noh (2006), “Approximating pollution abatement costs via alternative specifications of a multi-output production technology: A case of the U.S. electric utility industry,” J. Env. Manage., 80, 177-190.

The Malmquist Productivity Measure
The Malmquist index is an index of ease of construction with wide applicability, particularly when data on input and output prices are not available—as is typically the case for fisheries
)qs,xs(dtO
)qt,xt(dtOx
)qs,xs(dsO
)qt,xt(dsO
),,,( xxqqM tstsO
The right hand side is raised to the power of 0.5; q is the output vector; x is the input vector; and s and t are consecutive time periods with t-s = 1.0.

A Modified Malmquist
The conventional Malmquist assumes that production is efficient, when in fact, it may not be.
We follow the alternative measure discussed in Coelli et al. (2005) for measuring productivity when production is not efficient
)qs,xs(dtO
)qs,xs(dsOx
)qt,xt(dtO
)qt,xt(dsO
),(
),(),,,(
qxd
qxdxxqqM
sssO
tttO
tstsO
A little bit of formatting problem here!
The unbracketed ratio term represents change in efficiency, and the bracketed term represents technical change

The Data and Fishery: Western and Central Pacific Tuna Fishery
Basically, three identifiable species are caught along with a mix of other species—yellowfin, bigeye, skipjack, and other—since other is relatively small, we group it with skipjack
The notion is that bigeye is undersirable
We want to estimate productivity adjusting the measure of productivity to reflect the notion that bigeye tuna is an undesirable output
While we have a large data set, we have only 551 usable observations—because we are using the translog, we require all positive and non-zero outputs
In contrast, the generalized quadratic directional distance function
approach requires only null jointness—must have a least one good and one bad output for every observation
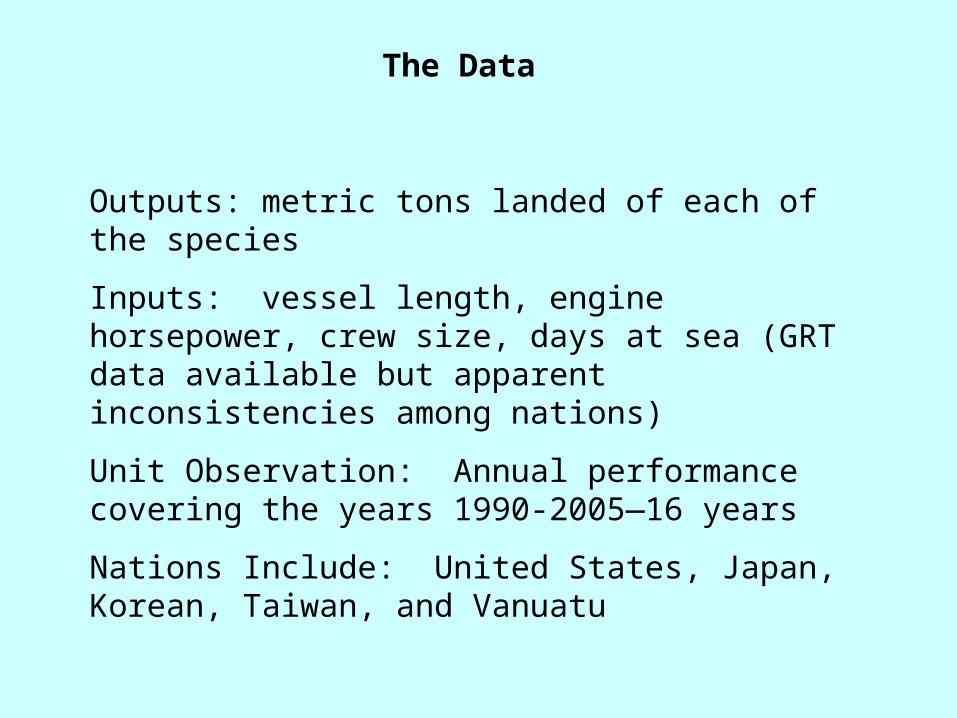
The Data
Outputs: metric tons landed of each of the species
Inputs: vessel length, engine horsepower, crew size, days at sea (GRT data available but apparent inconsistencies among nations)
Unit Observation: Annual performance covering the years 1990-2005—16 years
Nations Include: United States, Japan, Korean, Taiwan, and Vanuatu

Parameter Estimates of Translog—60 parameters
0.0 values of parameter estimates are not mathematically 0.0, except for all variables including GRT (data problems for GRT)
Parameter Value Variable Parameter Value Variable Parameter Value Variable Parameter Value VariableA0 -2.10 T90 Q15 0.06 T05 A13 0.00 LNGRTCREW D4 0.86 LNLENYFTQ1 -0.09 T91 A1 0.00 LNGRT A14 0.00 LNGRTHP D5 -0.85 LNLENSKJQ2 -0.01 T92 A2 4.23 LNLEN A15 0.00 LNGRTDAY D7 -0.19 LNCREWYFTQ3 0.09 T93 A3 -3.20 LNCREW A23 1.59 LNLENCREW D8 0.19 LNCREWSKJQ4 0.11 T94 A4 -2.06 LNHP A24 -1.60 LNLENHP D10 0.16 LNHPYFTQ5 0.12 T95 A5 -0.02 LNDAY A25 0.40 LNLENDAY D11 -0.16 LNHPSKJQ6 0.09 T96 B1 -6.13 LNYFT A34 -0.49 LNCREWHP D13 -0.50 LNDAYYFTQ7 0.18 T97 B2 7.07 LNSKJ A35 -0.35 LNCREWDAY D14 0.50 L NDAYSKJQ8 0.02 T98 GAM1 0.07 LNBET A45 -0.40 LNHPDAY E1 0.00 LNGRTBETQ9 0.06 T99 A11 0.00 LNGRT2 B11 -0.15 LNYFT2 E2 -0.01 LNLENBETQ10 0.07 T00 A22 0.28 LNLEN2 B22 -0.66 LNSKJ2 E3 -0.01 LNCREWBETQ11 -0.02 T01 A33 0.31 LNCREW2 B12 0.81 LNYFTSKJ E4 0.00 LNHPBETQ12 0.09 T02 A44 0.76 LNHP2 GAM11 0.00 LNBET2 E5 0.00 LNDAYBETQ13 0.08 T03 A55 0.17 LNDAY2 D1 0.00 LNGRTYFT MU1 0.00 LNYFTBETQ14 0.14 T04 A12 0.00 LNGRTLEN D2 0.00 LNGRTSKJ MU2 0.00 LNSKJBET

Period Japan Korea Taiwan United States Vanuatu Total Change-YFT Change-SKJ Change-BET1991-1990 0.92 N/A N/A 1.17 N/A 1.03 3,634 17,127 981992-1991 1.04 N/A N/A 0.84 N/A 0.93 3,696 18,103 2771993-1992 0.59 N/A N/A 0.87 N/A 0.75 -2,178 -29,966 -5751994-1993 1.48 N/A N/A 0.70 N/A 1.17 -18,507 -41,488 -3761995-1994 0.99 N/A N/A 1.50 N/A 1.03 9,187 -20,051 1291996-1995 1.18 N/A N/A 0.99 N/A 1.06 1,005 92,327 1,7191997-1996 0.58 N/A N/A 0.70 N/A 0.69 45,870 13,892 3,0921998-1997 1.71 N/A 1.41 1.68 N/A 1.62 -13,838 49,765 -3,2801999-1998 0.87 0.92 0.78 0.97 N/A 0.92 -16,913 -40,760 8152000-1999 1.11 0.95 1.24 0.90 N/A 1.00 -2,729 12,175 -7642001-2000 1.00 1.16 1.09 1.06 N/A 1.04 -3,150 -34,532 -1342002-2001 0.82 0.69 0.81 0.91 N/A 0.85 -3,224 68,702 -1472003-2002 0.98 1.25 1.03 1.01 N/A 1.00 9,684 -2,307 1,9252004-2003 1.12 0.90 1.06 0.98 N/A 1.05 -8,278 -14,292 -1,6802005-2004 1.07 1.16 1.07 1.08 N/A 1.10 8,331 5,247 516Mean 1.03 0.98 1.06 1.02 N/A 1.02
Malmquist-based Productivity Measures—Bigeye As Bad Output—Chain Index
General increase in productivity value for total when production of bad output declines
Note Level of Taiwan vs. Other nations

Malmquist Index (Mean) of Productivity (Bigeye as Undesirable Output)
0.970.980.991.001.011.021.031.041.051.061.07
Japan Korea Taiwan UnitedStates
Total

Period Japan Korea Taiwan United States Vanuatu Total Change-YFT Change-SKJ Change-BET1991-1990 0.98 #DIV/0! #DIV/0! 0.94 #DIV/0! 0.96 3,634 17,127 981992-1991 1.03 #DIV/0! #DIV/0! 1.04 #DIV/0! 1.03 3,696 18,103 2771993-1992 0.92 #DIV/0! #DIV/0! 1.03 #DIV/0! 0.98 -2,178 -29,966 -5751994-1993 1.05 #DIV/0! #DIV/0! 0.82 #DIV/0! 0.99 -18,507 -41,488 -3761995-1994 1.05 #DIV/0! #DIV/0! 1.06 #DIV/0! 1.02 9,187 -20,051 1291996-1995 1.00 #DIV/0! #DIV/0! 1.01 #DIV/0! 1.01 1,005 92,327 1,7191997-1996 0.81 #DIV/0! #DIV/0! 0.90 #DIV/0! 0.87 45,870 13,892 3,0921998-1997 1.25 #DIV/0! 1.07 1.19 #DIV/0! 1.19 -13,838 49,765 -3,2801999-1998 1.05 0.97 1.09 1.06 #DIV/0! 1.06 -16,913 -40,760 8152000-1999 0.96 1.05 0.98 0.97 #DIV/0! 0.97 -2,729 12,175 -7642001-2000 0.96 1.05 0.98 0.97 #DIV/0! 0.97 -3,150 -34,532 -1342002-2001 0.97 0.87 1.03 1.01 #DIV/0! 1.00 -3,224 68,702 -1472003-2002 1.08 1.03 1.02 1.00 #DIV/0! 1.03 9,684 -2,307 1,9252004-2003 0.94 1.00 0.89 0.98 #DIV/0! 0.96 -8,278 -14,292 -1,6802005-2004 1.05 0.88 1.13 1.05 #DIV/0! 1.03 8,331 5,247 516Mean 1.01 0.99 1.01 1.00 1.00
Estimates of Productivity—All Outputs Assumed GoodChain Index
Note general pattern of high productivity when all outputs are assumed good

One BadPeriod Japan Korea TaiwanUnited StatesVanuatu Total1999 0.87 0.92 0.78 0.97 N/A 0.922000 0.97 0.87 0.97 0.88 N/A 0.922001 0.96 1.01 1.05 0.93 N/A 0.962002 0.79 0.70 0.85 0.84 N/A 0.822003 0.78 0.88 0.87 0.85 N/A 0.822004 0.87 0.79 0.92 0.83 N/A 0.86
All GoodPeriod Japan Korea TaiwanUnited StatesVanuatu Total1999 1.05 0.97 1.09 1.06 N/A 1.062000 1.01 1.01 1.06 1.03 N/A 1.032001 0.97 1.06 1.04 1.00 N/A 1.002002 0.95 0.93 1.07 1.00 N/A 1.002003 1.02 0.96 1.09 1.01 N/A 1.032004 0.96 0.96 0.96 0.99 N/A 0.98
Base Period or Reference Index (1998 = 100)Bigeye Considered as Bad Output
Note difference in productivity gains relative to 1998 = 100 and all outputs treated as good outputs
Note level of Taiwan vs. other nationsU.S. and Japan have highest levels of good and bad outputs;
Korea and Taiwan have lowest levels of Bigeye

Malmquist Index (Base-1998=100) (Bigeye as Undesirable Output)
0.00
0.20
0.40
0.60
0.80
1.00
1.20
1999 2000 2001 2002 2003 2004
Japan Korea Taiwan United States Total

Malmquist Index (Base-1998=100), All Good Outputs
0.80
0.85
0.90
0.95
1.00
1.05
1.10
1999 2000 2001 2002 2003 2004
Japan Korea Taiwan United States Total

Summary and Conclusions
Although we did not present the decomposition of technical efficiency and technical change, it is an easy matter to do so; they are already calculated as part of the Malmquist index—we are thus able to estimate efficiency, technical change, and productivity while recognizing production of undesirable outputs
Productivity is an important performance metric for fisheries, but it should be adjusted to reflect the production of undesirable outputs
We presented one approach for assessing productivity in a fishery with undesirable outputs; a manuscript in progress provides a comparison of alternative methods, including the directional distance function and hyperbolic approach
We find results to be relatively consistent with knowledge of the Western and Central Pacific tuna fishery—productivity increases when undesirable products decline; Taiwan generally had the highest overall level of productivity (also has a low level of undesirable outputs); and last, the framework adequately incorporates good and bad output production into the measure of productivity