james fingleton phd thesis amended final version 14th november
TRANSCRIPT

P H E N O T Y P I N G O F O B S T R U C T I V E A I RWAY S D I S E A S E
by
dr james fingleton
A thesis
submitted to the Victoria University of Wellington
in fulfilment of the requirements for the degree of
Doctor of Philosophy
victoria university of wellington
2013

Dr James Fingleton: Phenotyping of Obstructive Airways DiseaseCopyright c© 2013
supervisors:Professor Richard BeasleyProfessor John MillerWellington

To Hannah, the best thing that has ever happened to me, thank youfor your love and unswerving support.
To Alex and Chloe, for giving me a sense of perspective and so muchjoy in my life.
In MemoriamPaul John Fingleton
1964 – 2012


A B S T R A C T
background
Asthma and Chronic Obstructive Pulmonary Disease (COPD) are het-erogeneous disorders which may be made up of different sub-types, orphenotypes, of airflow obstruction with distinct clinical characteristics.To facilitate personalised treatment the different phenotypes and theirresponse to treatment must be clearly defined and sound diagnosticrules developed.
In this thesis I explore the evidence supporting candidate phenotypesand report the results of my research, known as the New ZealandRespiratory Health Survey (NZRHS). The NZRHS was designed todetermine candidate phenotypes, compare these phenotypes to thosepreviously described, characterize their response to inhaled medication,and develop a method for allocating patients to the most appropriatephenotype.
research aims
To explore clinical phenotypes of chronic airways disease bycluster analysis.To examine if phenotypes identified by a previous cluster analysisexist in the independent NZRHS sample.To compare the response to a short-acting beta-agonist inhalerbetween phenotype groups.To compare the response to a short-acting muscarinic antagonistinhaler between phenotype groups.To compare the response to an inhaled corticosteroid betweenphenotype groups.To generate allocation rules and determine their predictive valuefor the different disorders of airways disease.
v
methods
This cross-sectional research was performed in three phases.
Phase 1
1,264 participants aged 18-75 with self-reported current wheeze andbreathlessness were identified from a random population sample of16,459 people.
Phase 2
451 symptomatic participants attended for detailed phenotyping,including responsiveness to inhaled salbutamol and ipratropium bro-mide.
Phase 3
168 steroid naive participants were enrolled in a prospective 12-weektrial of budesonide, in which both investigator and participants wereblind to cluster allocation.
Statistical analysis
Cluster analysis was performed using data from the 389 subjects whocompleted Phase 2 with full data. Phenotypes were determined by 13
variables based on medical history, lung function, clinical measures,and serum and exhaled breath biomarkers. The treatment respon-siveness of the phenotypes was determined and an allocation rulegenerated to allow prospective identification of cluster membership.
findings
Cluster analysis identified five distinct phenotypic groups: ’asthma/COPD overlap’, ’moderate to severe atopic childhood onset asthma’,’mild atopic childhood onset asthma’, ’adult onset obese/ co-morbid’,and ’mild/ intermittent’. These phenotypes differ in key pathophysio-logical and clinical characteristics including responses to inhaled betaagonist, anti-muscarinic and corticosteroid treatments. It was possible
vi

to allocate around 75% of participants to their designated cluster withthe use of three readily available clinical features; Forced ExpiratoryVolume in 1 second (FEV1), age of onset, and Body Mass Index (BMI).
conclusions
This research has identified phenotypes of airways disease thatdiffer significantly in their clinical and pathophysiological charac-teristics. Evidence is presented to support the existence of theasthma/COPD overlap and obesity/co-morbid phenotypes and providedata of their responsiveness to inhaled corticosteroid, beta agonist andanti-muscarinic treatments, which may guide future management ofpatients with these phenotypes of obstructive airways disease.
vii

P U B L I C AT I O N S
To date, the following manuscripts and abstracts have arisen from orare linked to the research work presented in this thesis.
Fingleton J, Travers J, Williams M, Charles T, Bowles D, Strik R,Shirtcliffe P, Weatherall M, and Beasley R. Inhaled corticosteroidand bronchodilator responsiveness of different phenotypes ofairways obstruction in adults. Submitted for publication, 2013b
Fingleton J, Travers J, Weatherall M, and Beasley R. Inhaled corti-costeroid and treatment responsiveness of different phenotypes of airways obstruction in adults. Submitted as an abstract to the American Thoracic Society, San Diego, 2014
Fingleton J, Travers J, Weatherall M, and Beasley R. The New Zealandrespiratory health survey: Rationale, methodology and responserate. European Respiratory Society Symposium, Barcelona 2013, 2013a
Fingleton J and Beasley R. Asthma monitoring (in press). In GlobalAtlas of Asthma. World Health Organisation
Beasley R, Fingleton J, and Weatherall M. Restriction of LABA use tocombination ICS/LABA inhaler therapy in asthma. Thorax, 68(2):119–120, 2012
Fingleton J, Weatherall M, and Beasley R. Bronchodilator responsive-ness: interpret with caution. Thorax, 67(8):667–668, 2012
Fingleton J and Beasley R. Individualized treatment for asthma. InAdvances in Asthma Management, pages 156–166. Future MedicineLtd, Jan. 2012
Fingleton J, Weatherall M, and Beasley R. Towards individualisedtreatment in COPD. Thorax, 66(5):363–4, 2011
ix


A C K N O W L E D G E M E N T S
Research by its very nature builds on the work of forerunners andcolleagues at the Medical Research Institute of New Zealand (MRINZ)and elsewhere. Without their hard work and insight this researchwould not exist. I am therefore grateful to many people, more thanI can reasonably list here.
I wish to thank the team at the MRINZ for their direct and indirectcontributions to both my research and to our lives in New Zealandover the last three years. Alex, Alexander, Alison, Anna, Claire, Darren,Denise, Diane, Fares, Irene, Janine, Judith, Justin, Kyle, Laird, Maureen,Mark H, Mark W, Mathew, Natalie, Nicola, Pip, Rianne, Richard, Rob,Sarah, Sally, Sharon, Thom and Tanya- it has been a pleasure and aprivilege working with you all, and one I hope to enjoy again in thefuture.
Particular thanks must go to Mathew and Thom for all their helpwith the NZRHS over the last three years, to Professor Mark Weatherallfor his skill and forbearance as I came to terms with cluster analysis, toProfessor John Miller for his support and advice as second supervisor,and to Janine for keeping me sane and feeding me coffee.
My supervisor Professor Richard Beasley has, since the day I first methim in Berlin, been a source of enthusiasm, ideas, inspiration, support,sound advice and friendship.
My research owes a huge debt to all the people listed here. Anyerrors which remain are my own.
Thank you
xi


T H E S I S O U T L I N E
This thesis is laid out in three parts, plus references and appendices.
Part I
In Part I the background to the research is outlined. Asthmaand COPD are defined and the pathology and epidemiology brieflydescribed. The concept of the phenotype is explained, together with anexplanation of the potential benefits of phenotyping, before discussionof different approaches to phenotyping to date, including clusteranalysis.
The concept and methodology of cluster analysis are discussedtogether with a systematic review of cluster analyses in obstructiveairways disease. Finally, methodological issues in performing clusteranalysis are discussed to highlight choices made during this research.
Part II
In Part II the rationale for the research is outlined and the aims andhypotheses specified. The design and methods of the research are thenlaid out in detail, including the statistical methodology.
Part III
In Part III each phase of the NZRHS is reported in sequence. Theresults of each phase are reported and discussed separately. Finally inchapter 12 the key findings are summarised and conclusions drawn,together with discussion of required future research.
xiii


C O N T E N T S
I literature review 1
1 background 3
2 description of asthma and copd 7
3 phenotyping of obstructive airways disease 29
4 cluster analysis 45
II the nzrhs : design and methods 85
5 rationale and research aims 87
6 design 89
7 study methodology 91
8 statistical methodology 109
III the nzrhs : results and discussion 123
9 phase 1 125
10 phase 2 143
11 phase 3 191
12 summary, potential future work and conclusions 203
IV references 209
V appendix 247
a criteria for test postponement 249
b participant information sheet 251
c main questionnaire 261
d standard operating procedures 277
xv


L I S T O F F I G U R E S
Figure 2.1 Stepwise treatment of asthma in adults 12
Figure 2.2 Stepwise treatment of COPD in adults 13
Figure 3.1 Endotypes in asthma 30
Figure 3.2 Venn Diagram of COPD 36
Figure 3.3 Proportional Venn diagrams in obstructive air-ways disease (OAD) 37
Figure 3.4 Candidate Phenotypes of Asthma 38
Figure 4.1 Bimodal distribution 46
Figure 4.2 Two variable plot of data 47
Figure 4.3 Agglomerative hierarchical cluster analysis 48
Figure 4.4 Euclidean distance metric 48
Figure 4.5 Progression of a cluster analysis 50
Figure 4.6 Progression of a cluster analysis (2) 50
Figure 4.7 Progression of a cluster analysis (3) 51
Figure 4.8 Dendrogram from a cluster analysis 52
Figure 4.9 Dendrogram from a cluster analysis (2) 53
Figure 4.10 prisma diagram 55
Figure 4.11 Allocation rule from Moore et al. [2010] 64
Figure 7.1 Electorate Boundaries 93
Figure 7.2 NZRHS Invitation Letter 95
Figure 7.3 NZRHS Screening Questionnaire 96
Figure 7.4 Guidance for Study Participants 100
Figure 8.1 Estimates for mail-out 119
Figure 9.1 NZRHS Flow Diagram 126
Figure 9.2 Age and sex distributions of NZRHS respondents 129
Figure 9.3 Estimated eligible and enrolled voters 132
Figure 9.4 Eligibility of respondents by age band 135
Figure 9.5 Characteristics of respondents by age band 137
Figure 10.1 Graphical correlation matrix 146
xvii

xviii List of Figures
Figure 10.2 Dendrogram and cluster selection statistics forAgnes–Gower–Ward solution 149
Figure 10.3 Dendrogram and cluster selection statistics forDiana–Euclidean solution 154
Figure 10.4 Dendrogram and cluster selection statistics forDiana–Gower solution 157
Figure 10.5 Dendrogram and cluster selection statistics forAgnes–Euclidean solution 160
Figure 10.6 Dendrogram and cluster selection statistics forAgnes–Gower solution 161
Figure 10.7 Dendrogram and cluster selection statistics forAgnes–Euclidean–Ward solution 164
Figure 10.8 Allocation rule for predicting cluster membership 173
Figure 10.9 Snapshot of 3D model 188
Figure 11.1 Box and whisker plots for ics trial 195
L I S T O F TA B L E S
Table 2.1 Features of Asthma, Overlap group and COPD 28
Table 4.1 Dissimilarity distance matrix 49
Table 4.2 Summary of papers included in systematic review. 57
Table 7.1 Schedule for Clinical Testing 99
Table 8.1 Primary cluster analysis variables 111
Table 9.1 NZRHS response rates by wave 127
Table 9.2 Estimated eligible and enrolled voters 132
Table 9.3 NZRHS screening questionnaire responses 133
Table 9.4 Screening questionnaire responses by eligibilityand enrolment 134
Table 10.1 Characteristics of cluster analysis sample 144
Table 10.2 Self-reported ethnicity of Phase 2 participants 144
Table 10.3 Correlation matrix for cluster analysis variables 147
Table 10.4 Number of participants per cluster for Agnes–Gower–Ward solution 150
Table 10.5 Agnes–Gower–Ward 4 cluster comparison by anal-ysis variables 151
Table 10.6 Agnes–Gower–Ward 5 cluster comparison by anal-ysis variables 151
Table 10.7 Number of participants per cluster for Diana–Euclideansolution 153
Table 10.8 Characteristics of Diana–Euclidean solution 153
Table 10.9 Number of participants per cluster for Diana–Gowersolution 156
Table 10.10 Characteristics of Diana–Gower solution 158
Table 10.11 Number of participants per cluster for Agnes–Euclideansolution 159
Table 10.12 Number of participants per cluster for Agnes–Gowersolution 162
xix

xx List of Tables
Table 10.13 Agnes–Gower 2 cluster comparison by analysisvariables 162
Table 10.14 Number of participants per cluster for Agnes–Euclidean–Ward 163
Table 10.15 Agnes–Euclidean–Ward 5 cluster characteristics 165
Table 10.16 Agnes–Gower–Ward 5 cluster comparison by anal-ysis variables 167
Table 10.17 Description of phenotype characteristics basedon for Agnes–Gower–Ward 5 (AGW5) classification 168
Table 10.18 Bronchodilator reversibility by phenotype 172
Table 10.19 Diana–Gower 4 cluster comparison using Welling-ton Respiratory Survey (WRS) variables 175
Table 10.20 Agnes–Gower–Ward 5 cluster comparison usingWRS variables 176
Table 10.21 Proposed diagnostic criteria for the overlap group 184
Table 11.1 Eligibility and enrolment for inhaled corticos-teroid (ICS) trial by AGW5 cluster 191
Table 11.2 Description of ICS trial participants by AGW5 cluster192
Table 11.3 Outcome variables for ICS trial participants byAGW5 cluster 194
Table 11.4 Net improvement in outcome variable relative toreference cluster 197
Table 11.5 Net improvement in Saint George’s RespiratoryQuestionnaire (SGRQ) sub-domains relative toreference cluster 197

A C R O N Y M S
acq-7 Asthma Control Questionnaire
agnes AGglomerative NESting
aew5 Agnes–Euclidean–Ward 5
agw4 Agnes–Gower–Ward 4
agw Agnes–Gower–Ward
agw5 Agnes–Gower–Ward 5
anova Analysis of Variance
asw Average Silhouette Width
ats American Thoracic Society
bhr bronchial hyperresponsiveness
bmi Body Mass Index
pca Principle Component Analysis
bts British Thoracic Society
cnsld Chronic Non-specific Lung Disease
copd Chronic Obstructive Pulmonary Disease
copd-x Australian and New Zealand guidelines for the management ofChronic Obstructive Pulmonary Disease
ct Computed Tomography
diana DIvisive ANAlysis
dg5 Diana–Gower 5
fa Factor Analysis
feno Fraction of Exhaled Nitric Oxide
xxi

xxii acronyms
fev1 Forced Expiratory Volume in 1 second
frc Functional Residual Capacity
fvc Forced Vital Capacity
gina the Global Initiative for Asthma
gold the Global Initiative for Chronic Obstructive Lung Disease
gord gastro-oesophageal reflux disease
hrct High Resolution Computed Tomography
hscrp high sensitivity C-Reactive Protein
ics inhaled corticosteroid
ige Immunoglobulin E
il-4 Interleukin 4
il-5 Interleukin 5
il-13 Interleukin 13
kcocorr transfer factor adjusted for lung volumes and corrected forhaemoglobin
laba long-acting beta-agonist
lama long-acting anti-muscarinic
lca Latent Class Analysis
ltra Leukotriene Receptor Antagonist
mcid minimum clinically important difference
mdi Metered Dose Inhaler
mrinz Medical Research Institute of New Zealand
nett National Emphysema Treatment Trial
nz New Zealand
nzrhs New Zealand Respiratory Health Survey
oad obstructive airways disease

acronyms xxiii
pefr Peak Expiratory Flow Rate
pca Principle Components Analysis
pft Pulmonary Function Test
prisma Preferred Reporting Items for Systematic Reviews and Meta-Analyses
qol Quality of Life
rct randomised controlled trial
saba short-acting beta-agonist
sae Serious Adverse Event
sama short-acting muscarinic antagonist
sarp Severe Asthma Research Programme
sd Standard Deviation
sgrq Saint George’s Respiratory Questionnaire
sq screening questionnaire
th2 T-cell helper 2
urti Upper Respiratory Tract Infection
wrs Wellington Respiratory Survey


Part I
L I T E R AT U R E R E V I E W


1B A C K G R O U N D
Asthma and Chronic Obstructive Pulmonary Disease (COPD) are two
very important diseases, both in New Zealand (NZ) and internationally.
Together they are part of a group of conditions which cause narrowing
of the airways and can be referred to as obstructive airways diseases
(OADs). Asthma affects 15% of the NZ population [Holt and Beasley,
2001] and 300 million people worldwide [GINA, 2011]. COPD affects
around 220,000 people in NZ [Town et al., 2003] and may affect 1 in 10
worldwide [GOLD, 2010].
The economic burden of these two diseases is substantial, with
estimated overall costs of asthma to NZ of over $125 million and direct
costs for COPD of up to $192 million per annum, at late 1990’s prices
[Holt and Beasley, 2001; Town et al., 2003].
The burden of disease for an individual is very variable for both
conditions. Most people with OAD will have some symptoms of
shortness of breath, wheeze and/or cough, but the severity and
response to treatment of these symptoms is highly individual [British
Thoracic Society; Scottish Intercollegiate Guidelines Network, 2012;
GINA, 2011; GOLD, 2010]. Many people with OAD have minimal or
easily controlled disease, however both asthma and COPD can give rise
to severe and potentially fatal exacerbations; with the consequence that
3
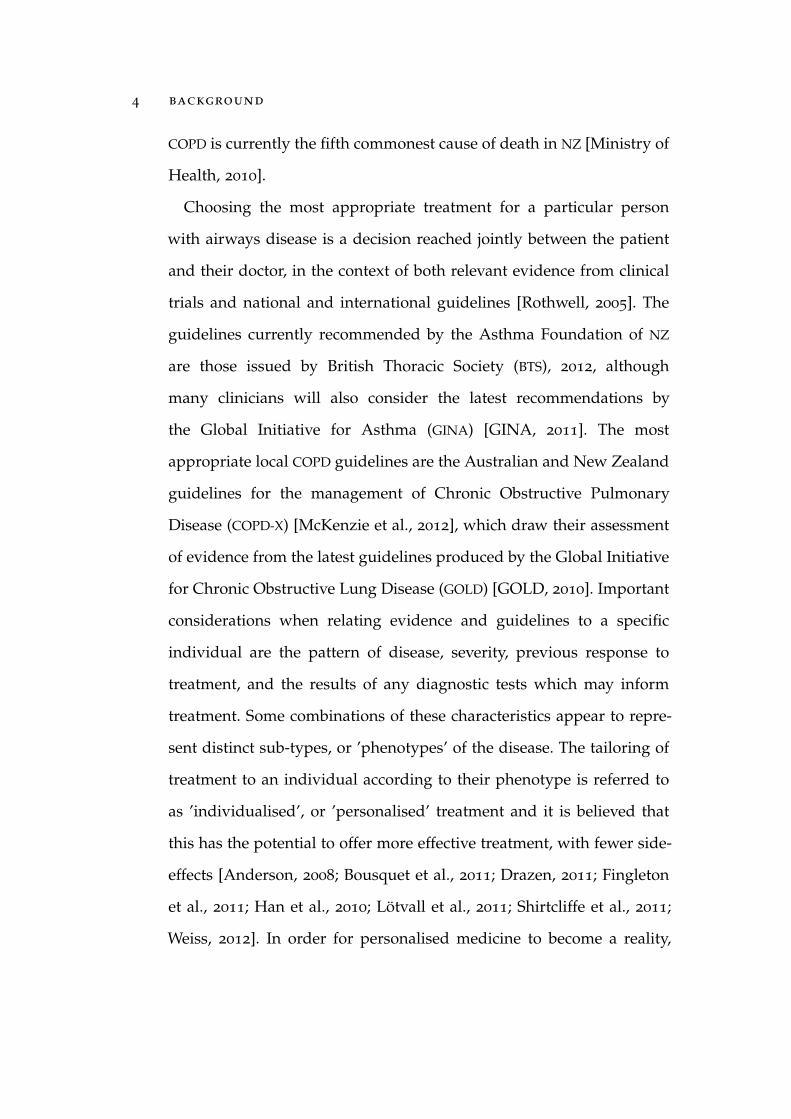
4 background
COPD is currently the fifth commonest cause of death in NZ [Ministry of
Health, 2010].
Choosing the most appropriate treatment for a particular person
with airways disease is a decision reached jointly between the patient
and their doctor, in the context of both relevant evidence from clinical
trials and national and international guidelines [Rothwell, 2005]. The
guidelines currently recommended by the Asthma Foundation of NZ
are those issued by British Thoracic Society (BTS), 2012, although
many clinicians will also consider the latest recommendations by
the Global Initiative for Asthma (GINA) [GINA, 2011]. The most
appropriate local COPD guidelines are the Australian and New Zealand
guidelines for the management of Chronic Obstructive Pulmonary
Disease (COPD-X) [McKenzie et al., 2012], which draw their assessment
of evidence from the latest guidelines produced by the Global Initiative
for Chronic Obstructive Lung Disease (GOLD) [GOLD, 2010]. Important
considerations when relating evidence and guidelines to a specific
individual are the pattern of disease, severity, previous response to
treatment, and the results of any diagnostic tests which may inform
treatment. Some combinations of these characteristics appear to repre-
sent distinct sub-types, or ’phenotypes’ of the disease. The tailoring of
treatment to an individual according to their phenotype is referred to
as ’individualised’, or ’personalised’ treatment and it is believed that
this has the potential to offer more effective treatment, with fewer side-
effects [Anderson, 2008; Bousquet et al., 2011; Drazen, 2011; Fingleton
et al., 2011; Han et al., 2010; Lötvall et al., 2011; Shirtcliffe et al., 2011;
Weiss, 2012]. In order for personalised medicine to become a reality,
background 5
the different disease phenotypes must be adequately characterised and
their patterns of response to treatment described [Han et al., 2010].
This literature review will explore the range of clinical patterns
expressed by people with OAD and discuss the evidence relating to
candidate phenotypes which have been described.
The following chapters of the literature review will briefly review
the definitions of asthma and COPD, current models relating to their
pathophysiology and the concept of the clinical phenotype. Different
techniques used to explore phenotypes to date will then be discussed
along with a systematic review of the existing literature on cluster
analysis within COPD and asthma. The rationale, methodology and
results of the research which forms the basis of this thesis will then
be presented and discussed in Parts II and III.

2D E S C R I P T I O N A N D PAT H O P H Y S I O L O G Y O F
A S T H M A A N D C O P D
The focus of this literature review is on different methods for de-
scribing potential phenotypes in OAD rather than the pathophysiology
of individual phenotypes per se. In order to adequately describe the
pathophysiology of a condition, people with the disease must be able
to be distinguished from others with similar conditions. Attempts to
define sub-types of disease tend to apply one of the guiding principles
of taxonomy to diseases, in that individuals with similar clinical
patterns of disease are thought more likely to have closely related
pathophysiological mechanisms underlying their presentation [Snider,
2003].
The pathophysiology of both asthma and COPD are complex and
rapidly changing fields and a full review of that literature is outside
the scope of this review. This section summarises some of the key
concepts and important points of difference in the two diseases as
currently understood. Individual aspects will be discussed further
where relevant to specific phenotypes.
When establishing a diagnosis, doctors obtain information by taking
a medical history to elicit symptoms, risk factors and relevant past
history, and by performing an examination. They then attempt to
7

8 description of asthma and copd
synthesise this information and match it against known patterns of
disease to formulate a list of possible diagnoses. Once this differential
diagnosis has been constructed, the clinician can use various diagnostic
tests to confirm or refute the putative diagnosis. This process relies
on the existence of clear, well described, patterns of disease. However,
although the commonly used definitions of asthma and COPD are
quite distinct, and sometimes mutually exclusive, it has long been the
experience of doctors that in an individual patient the reality can be far
more complex.
One example of the gap between classical descriptions of asthma
and COPD and the reality is that of bronchodilator reversibility. When
assessing patients in clinic, and particularly in recruiting for clinical
trials, the degree of improvement in airflow provided by inhalers
which relax airway muscle (known as reversibility) is often used as
an objective measure to help confirm a diagnosis [British Thoracic
Society; Scottish Intercollegiate Guidelines Network, 2012; GINA, 2011].
Definitions of asthma and COPD usually include statements that in
asthma the airway obstruction is partially or fully reversible and
that COPD causes irreversible or only partially reversible airways
obstruction. Accordingly, randomised controlled trials (RCTs) will often
require a certain level of reversibility for a patient with asthma to be
included and exclude patients who do not have significant reversibility
(commonly defined as a 12% improvement in Forced Expiratory
Volume in 1 second (FEV1) from baseline) [Travers et al., 2007a,b].
This means that one of the cardinal features of asthma is significant
bronchodilator reversibility, and yet it is well recognised that some

description of asthma and copd 9
patients with asthma, especially those who have had the condition
for many years, develop a degree of fixed airways obstruction [Bel
et al., 2011; Contoli et al., 2010; Lee et al., 2011; Vonk et al., 2003].
Conversely, limited reversibility is one of the core characteristics in
many definitions of COPD. However, it has been demonstrated that
in well characterised populations of patients with COPD around 40%
will have significant bronchodilator reversibility [Calverley et al., 2003].
These characteristics can fluctuate over a relatively short time-scale,
meaning that the same patient could be classified as having asthma
on one day and COPD the next [Calverley et al., 2003]. Other examples
of characteristics which are classically associated with asthma but can
co-exist in people who otherwise fit the pattern of COPD are atopy and
bronchial hyperresponsiveness (BHR) to environmental stimuli [Postma
and Boezen, 2004b].
There is therefore a significant degree of overlap in the clinical
expression (phenotype) of these two conditions in patients. It is not
known whether patients expressing an overlap phenotype are suffering
from a different disease from those with apparently discrete asthma or
COPD, or whether all phenotypes are part of a continuous spectrum
of the same disease. The hypothesis that asthma and COPD are not
distinct diseases was first proposed by Orie and colleagues in 1961
[University of Groningen, 1961]. They espoused the term Chronic Non-
specific Lung Disease [CIBA Symposium, 1959] to cover the spectrum
encompassed by asthma, chronic bronchitis and emphysema. This
phrase has not been widely adopted, but the underlying concept
that asthma and COPD are different expressions of a unifying disease

10 description of asthma and copd
process with shared risk factors has come to be known as the ’Dutch
hypothesis’ and remains disputed [Barnes, 2006; Bleecker, 2004; Kraft,
2006; Postma and Boezen, 2004a; Vestbo and Prescott, 1998].
This is important because currently asthma and COPD are treated
differently, particularly with reference to inhaled corticosteroid (ICS)
therapy and use of long-acting beta-agonist (LABA) and long-acting
anti-muscarinic (LAMA) inhaled therapies (Figures 2.1 and 2.2). Several
classes of medication may be used in both asthma and COPD but the rec-
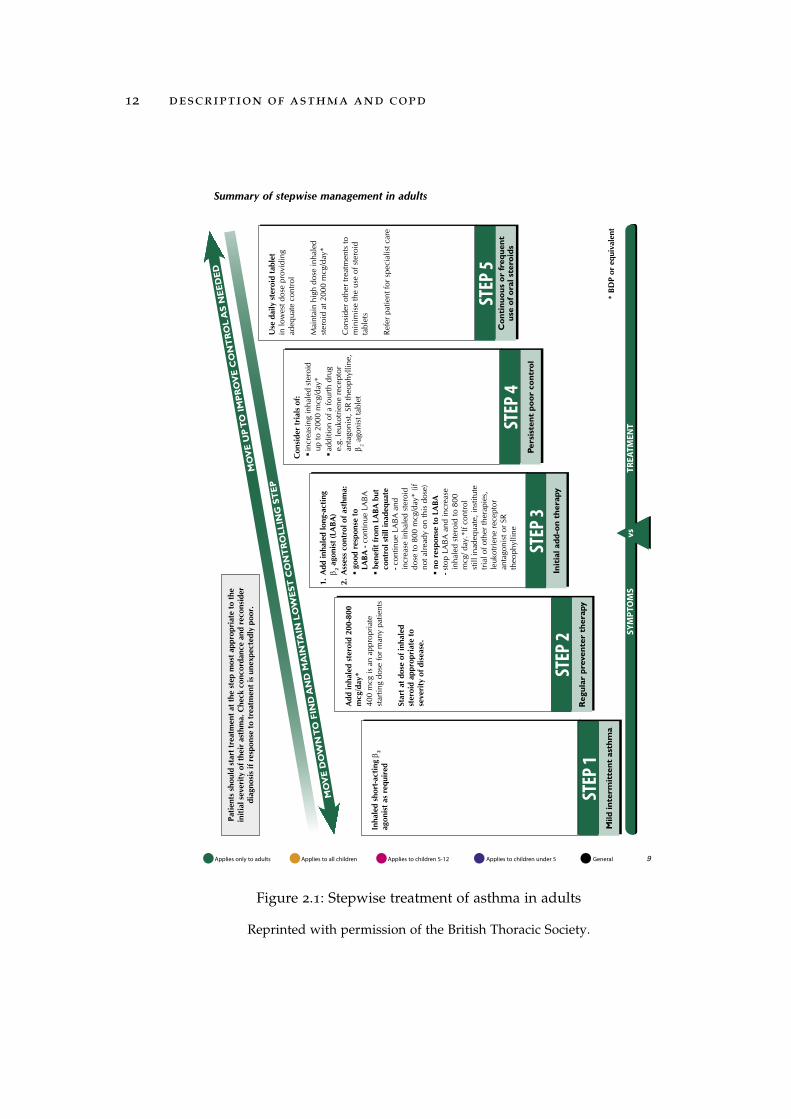
ommended thresholds and order of treatment differ. For example, ICS
therapy is recommended for all but the mildest disease in patients with
asthma. The British Thoracic Society (BTS), 2012 guidelines recommend
that patients move from Step One to Step Two, and therefore start ICS,
if they have symptoms or require their reliever 3 times a week, wake
due to asthma symptoms once a week, or have had an exacerbation in
the last year (Figure 2.1). However, a patient with a diagnosis of COPD
would not start ICS treatment until they had severe obstruction, their
symptoms worsened, or they had frequent exacerbations [GOLD, 2013;
McKenzie et al., 2012] (Figure 2.2). Recommendations on LABA therapy
also differ markedly, as can be seen in Figure 2.2. LABA monotherapy is
currently recommended in people with moderately-severe COPD but
it is contra-indicated in patients with asthma [Beasley et al., 2012;
Chowdhury and Dal Pan, 2010; McKenzie et al., 2012; Medicines &
Healthcare Products Regulatory Agency, 2010, Accessed 13th March
2013]. LAMA therapy is not currently routinely recommended in asthma,
although there is some evidence of benefit in severe asthma and in

2.1 definition and epidemiology of asthma 11
patients with features of both asthma and COPD [Bateman et al., 2010;
Magnussen et al., 2008].
There may therefore be a disconnect between the relatively precise
definitions and treatment recommendations in guidelines, and the
complex, less well demarcated, patterns of disease expression seen
clinically. Because the major RCTs are usually designed to provide
evidence in those patients with classical asthma and COPD, we have
very little evidence on which to base our treatment decisions for those
patients with non-classical phenotypes. A study in NZ demonstrated
that only 10% of patients with COPD and 4% of those with a diagnosis
of asthma would meet the criteria for inclusion in the major clinical
trials on which their management is based [Travers et al., 2007a,b].
We therefore do not have high quality evidence setting out the most
appropriate treatment for the remaining 90-95%. This has led some
commentators to recommend moving away from the diagnostic labels
’asthma’ and ’COPD’ towards specific phenotypes, which may show
differing responses to treatment [Editorial, 2006; Shirtcliffe et al.,
2011]. Possible phenotypes which have been described to date will be
discussed further in chapters 3 and 4.
2.1 definition and epidemiology of asthma
The word asthma has its origins in the Greek word Áσθµα, meaning
’to pant’ or ’short of breath’. The earliest known description of asthma is
that by Aretaeus the Cappadocian, who provided what would still be
considered a recognisable description of common asthma symptoms
[Holgate, 2010; Karamanou and Androutsos, 2011]. Whilst asthma
12 description of asthma and copd
Inha
led
shor
t-act
ing β 2
ag
onis
t as
requ
ired
STEP
1M
ild in
term
itte
nt a
sthm
a
Add
inha
led
ster
oid
200-
800
mcg
/day
*40
0 m
cg is
an
appr
opria
te
star
ting
dose
for m
any
patie
nts
Star
t at d
ose
of in
hale
d st
eroi
d ap
prop
riat
e to
se
veri
ty o
f dis
ease
.
STEP
2R
egul
ar p
reve
nter
the
rapy
1. A
dd in
hale
d lo
ng-a
ctin
g
β
1. A
dd in
hale
d lo
ng-a
ctin
g
β 2
ago
nist
(LA
BA)
2. A
sses
s co
ntro
l of a
sthm
a:
good
res
pons
e to
L
ABA
- co
ntin
ue L
ABA
bene
fit fr
om L
ABA
but
con
trol
stil
l ina
dequ
ate
- c
ontin
ue L
ABA
and
in
crea
se in
hale
d st
eroi
d
do
se to
800
mcg
/day
* (if
not a
lread
y on
this
dos
e)
no r
espo
nse
to L
ABA
- sto
p LA
BA
and
incr
ease
inha
led
ster
oid
to 8
00
m
cg/ d
ay.*
If co
ntro
l
st
ill in
adeq
uate
, ins
titut
e
tri
al o
f oth
er th
erap
ies,
leuk
otrie
ne re
cept
or
anta
goni
st o
r SR
th
eoph
yllin
e
1. A
dd in
hale
d lo
ng-a
ctin
g
β
STEP
3In
itia
l add
-on
ther
apy
Con
side
r tr
ials
of:
in
crea
sing
inha
led
ster
oid
up to
200
0 m
cg/d
ay*
a
dditi
on o
f a fo
urth
dru
g
e.
g. le
ukot
riene
rece
ptor
anta
goni
st, S
R th
eoph
yllin
e,
β 2
ago
nist
tabl
et
STEP
4Pe
rsis
tent
poo
r co
ntro
l
Use
dai
ly s
tero
id ta
blet
in
low
est d
ose
prov
idin
g ad
equa
te c
ontro
l
Mai
ntai
n hi
gh d
ose
inha
led
ster
oid
at 2
000
mcg
/day
*
Con
side
r oth
er tr
eatm
ents
to
min
imis
e th
e us
e of
ste
roid
ta
blet
s
Refe
r pat
ient
for s
peci
alis
t car
e
STEP
5C
onti
nuou
s or
freq
uent
us
e of
ora
l ste
roid
s
MO
VE
DO
WN
TO
FIN
D A
ND
MA
INTA
IN L
OW
EST
CO
NT
RO
LLIN
G S
TEP
* BD
P or
equ
ival
ent
Patie
nts
shou
ld s
tart
trea
tmen
t at t
he s
tep
mos
t app
ropr
iate
to th
e in
itial
sev
erity
of t
heir
ast
hma.
Che
ck c
onco
rdan
ce a
nd r
econ
side
r di
agno
sis
if re
spon
se to
trea
tmen
t is
unex
pect
edly
poo
r.M
OV
E U
P T
O IM
PR
OV
E C
ON
TR
OL
AS
NEE
DED
SYM
PTO
MS
vs
TR
EATM
ENT
Summary of stepwise management in adults
9 Applies to all children Applies to children 5-12 Applies to children under 5 General Applies only to adults
Figure 2.1: Stepwise treatment of asthma in adults
Reprinted with permission of the British Thoracic Society.

2.1 definition and epidemiology of asthma 13
Typ
ical
Sym
pto
ms
few
sym
pto
ms
bre
athle
ss o
n m
oder
ate
exer
tion
rec
urr
ent
ches
t in
fect
ions
litt
le o
r no
effe
ct o
n d
aily
act
ivitie
s
incr
easi
ng d
yspnoea
b
reat
hle
ss w
alki
ng o
n lev
el g
round
incr
easi
ng lim
itat
ion o
f dai
ly a
ctiv
itie
s c
ough a
nd s
putu
m p
roduct
ion
infe
ctio
ns
requirin
g s
tero
ids
dys
pnoea
on m
inim
al e
xert
ion
dai
ly a
ctiv
itie
s se
vere
ly c
urt
aile
d e
xper
ienci
ng r
egula
r sp
utu
m p
roduct
ion
chro
nic
cough
Lu
ng
Fu
nct
ion
FEV
1 ≈
60
-80
% p
red
icte
dFEV
1 ≈
40
-5
9%
pre
dic
ted
FEV
1 <
40
% p
red
icte
d
MiL
dM
od
Er
aTE
SEV
Er
E
Ste
pw
ise M
an
ag
em
en
t o
f S
tab
le C
oP
d
# I
ndac
ater
ol sh
ould
not
be
use
d in a
sthm
a or
mix
ed a
irw
ays
dis
ease
. A d
iffe
rential
dia
gnosi
s sh
ould
be
mad
e to
exc
lude
asth
ma
or
mix
ed a
irw
ays
dis
ease
bef
ore
initia
ting indac
ater
ol.
+ R
oflum
ilast
is
not
yet
avai
lable
for
use
in A
ust
ralia
.
Ju
ne
2012
Aw
aren
ess
Educa
tion
Suppor
t
Res
earc
h
The
Aust
ralia
n L
ung F
oundat
ion
PO B
ox 8
47
Lutw
yche
Qld
4030
Fre
e c
all:
1800 6
54 3
01
Web
site
: w
ww
.lungfo
undat
ion.c
om
.au
Bas
ed o
n C
OPD
-X P
lan:
Aust
ralia
n a
nd N
ew Z
eala
nd G
uid
elin
es f
or
the
Man
agem
ent
of CO
PD 2
006;
Aust
ralia
n T
her
apeu
tic
Guid
elin
es
No
n-P
harm
aco
log
ical
inte
rven
tio
ns
Man
agem
ent
of st
able
CO
PD s
hould
cen
tre
around
support
ing s
moki
ng p
atie
nts
to
quit.
Enco
ura
gin
g p
hys
ical
ac
tivi
ty a
nd m
ainte
nan
ce o
f a n
orm
al w
eig
ht
range a
re
als
o im
port
ant.
Pulm
onary
re
hab
ilita
tion
is r
ecom
men
ded
in s
ympto
mat
ic p
atie
nts
.
Ph
arm
aco
logic
al
inte
rven
tion
sThe
aim
of phar
mac
olo
gic
al
treatm
ent
may b
e t
o t
reat
sym
pto
ms,
(ie
bre
athle
ssnes
s)
or
to p
reve
nt
dete
riora
tion
(either
by
dec
reas
ing
exac
erbat
ions
or b
y re
duci
ng
decl
ine in q
ualit
y o
f lif
e)
or
both
. A s
tepw
ise a
ppro
ach
is
reco
mm
ended
, irre
spec
tive
of
dise
ase
seve
rity
, until a
dequ
ate
contr
ol has
bee
n a
chie
ved.
Sy
MP
To
M r
ELiE
F:
Long
acting
antich
olin
ergi
c (t
iotr
opiu
m)
and/
or lo
ng
acting
beta
2ag
onis
ts (
salm
eter
ol, ef
orm
oter
ol o
r in
daca
tero
l#).
This
may
als
o h
elp t
o p
reve
nt
exac
erbat
ions.
Once
tio
tropiu
m is
com
men
ced,
ipra
tropiu
m b
rom
ide
should
be
dis
continued
.
Ex
aC
Er
ba
Tio
N P
rEV
EN
Tio
N:
(When
FEV
1 <
50%
pre
dic
ted A
ND
pat
ient
has
had
2 o
r m
ore
exa
cerb
atio
ns
in t
he
pre
vious
12 m
onth
s) inhal
ed g
luco
cort
icoid
s co
mbin
ed w
ith long-a
ctin
g b
eta 2
agonis
t (fl
utica
sone/
salm
eter
ol or
budes
onid
e/ef
orm
ote
rol)
. LA
BA m
onoth
erap
y (e
form
ote
rol, s
alm
eter
ol or
indac
ater
ol)
should
be
ceas
ed o
nce
com
bin
atio
n t
her
apy
(ICS/L
ABA)
is initia
ted.
Sh
or
T-a
CTiN
g r
ELiE
VEr
MEd
iCa
Tio
N:
salb
uta
mol or
terb
uta
line
or
ipra
tropiu
m b
rom
ide
Con
side
r ro
flum
ilast
+ o
r lo
w d
ose
theo
phyl
line
Ch
EC
k d
EV
iCE u
Sa
gE T
EC
hN
iqu
E a
Nd
ad
hEr
EN
CE a
T E
aC
h V
iSiT
- U
p to
90%
of pa
tien
ts d
on’t u
se d
evic
es c
orre
ctly
Consi
der
oxy
gen
ther
apy,
surg
ery,
pal
liative
ca
re a
nd a
dva
nce
d c
are
direc
tive
s
rEFEr
To
Pu
LM
oN
ar
y r
Eh
ab
iLiT
aTio
N a
nd c
onsi
der
psy
choso
cial
nee
ds,
agre
e w
ritt
en a
ctio
n p
lan
oP
TiM
iSE F
uN
CTio
N E
nco
ura
ge
phys
ical
act
ivity,
rev
iew
nutr
itio
n,
pro
vide
educa
tion,
dev
elop G
P m
anag
emen
t pla
n a
nd initia
te r
egula
r re
view
Co
NS
idEr
Co
-Mo
rb
idiT
iES
esp
ecia
lly o
steo
poro
sis,
coro
nar
y dis
ease
, lu
ng c
ance
r, a
nxi
ety
and d
epre
ssio
n
riS
k r
Ed
uC
Tio
N C
hec
k sm
oki
ng s
tatu
s, s
upport
sm
oki
ng c
essa
tion,
reco
mm
end a
nnual
influen
za a
nd p
neu
moco
ccal
vac
cine
acco
rdin
g t
o
imm
unis
atio
n h
andbook
Figure 2.2: Stepwise treatment of COPD in adults
c©2012 Stepwise Management of Stable COPD. Reproduced with permission from thepublisher, Lung Foundation Australia.
14 description of asthma and copd
appears to have been recognised for at least 2000 years, its prevalence
has increased significantly in the last 50 years [Braman, 2006], with
marked variation in prevalence across the world. The highest asthma
prevalences are seen in English speaking Western countries, and NZ
has amongst the highest rates in the world [Asher et al., 2006; Beasley,
1998; Beasley et al., 2000; Holt and Beasley, 2001]. Childhood wheeze is
reported in around 30%, with overall prevalence of asthma of around
15%. Rates vary significantly within different populations in NZ. Maori
and Pacific populations have reported prevalences of 21.9% and 20%
respectively, compared with a rate in the non-Polynesian population of
14.9% [Holt and Beasley, 2001].
GINA, a multi-national group attempting to improve the recognition,
diagnosis and treatment of asthma, have defined asthma as:
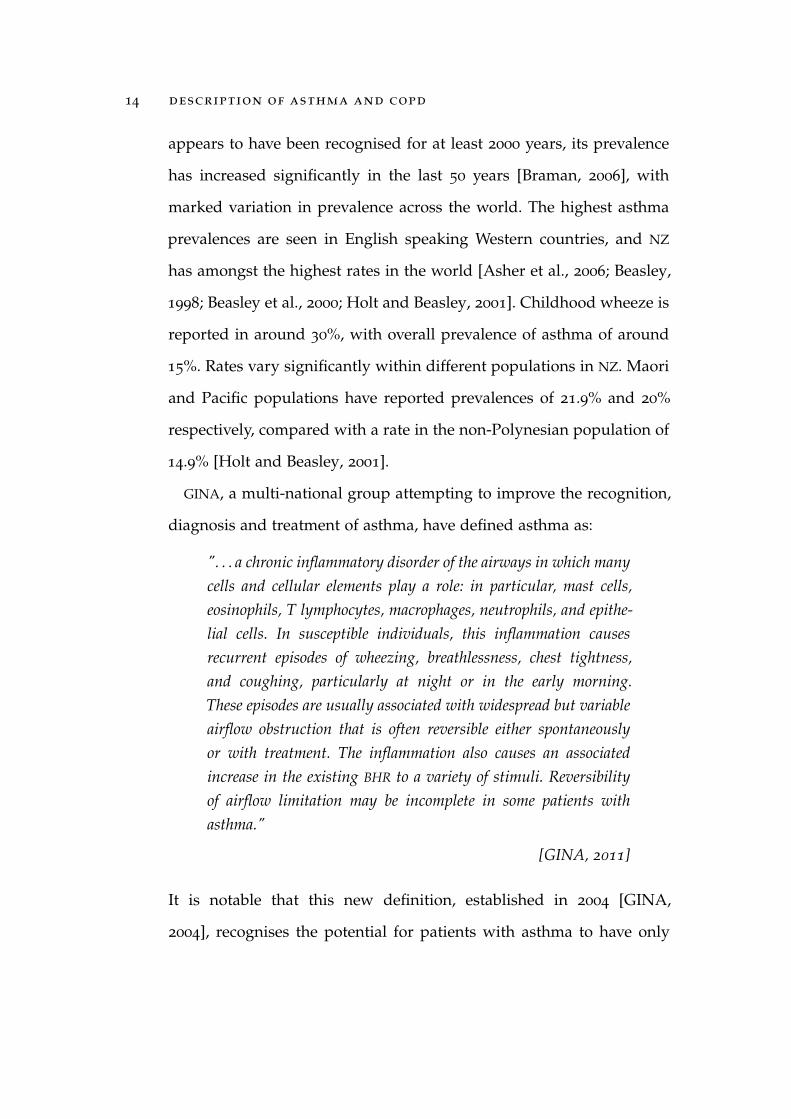
". . . a chronic inflammatory disorder of the airways in which manycells and cellular elements play a role: in particular, mast cells,eosinophils, T lymphocytes, macrophages, neutrophils, and epithe-lial cells. In susceptible individuals, this inflammation causesrecurrent episodes of wheezing, breathlessness, chest tightness,and coughing, particularly at night or in the early morning.These episodes are usually associated with widespread but variableairflow obstruction that is often reversible either spontaneouslyor with treatment. The inflammation also causes an associatedincrease in the existing BHR to a variety of stimuli. Reversibilityof airflow limitation may be incomplete in some patients withasthma."
[GINA, 2011]
It is notable that this new definition, established in 2004 [GINA,
2004], recognises the potential for patients with asthma to have only

2.2 pathophysiology of asthma 15
partially reversible obstruction; although it stops short of explicitly
acknowledging the existence of asthmatic patients with entirely fixed
airways obstruction.
2.2 pathophysiology of asthma
Asthma is an inflammatory condition of the airways characterised by
BHR, sensitivity to external stimuli, airway remodelling, and variable
airflow obstruction [British Thoracic Society; Scottish Intercollegiate
Guidelines Network, 2012; Busse, 2010; GINA, 2011]. The airway
inflammation and remodelling leads to a reduced diameter of the
airways, increasing resistance to airflow and thereby the work of
breathing, causing symptoms of shortness of breath. In addition to
dyspnoea, many people with asthma will have other symptoms such
as chronic cough or chest tightness. Commonly symptoms begin in
childhood, although some people develop asthma for the first time
in later life. The pattern of symptoms is highly variable between
individuals and within an individual over time [British Thoracic
Society; Scottish Intercollegiate Guidelines Network, 2012; GINA, 2011].
The different patterns of disease described for asthma will be discussed
in the following chapter on the phenotyping of OAD (chapter 3).
Inflammation
Asthma is generally understood to result from an allergic type
inflammatory response to environmental stimuli, whether allergens or
respiratory infections. The response is characterised by a pattern of

16 description of asthma and copd
inflammation governed in part by the T-cell helper 2 cell type [Holgate,
2011; Robinson, 2010]. It is increasingly recognised that epithelial
damage and impaired barrier function are important in establishing
airway inflammation in asthma [Davies, 2009; Dekkers et al., 2009;
Fahy, 2001; Holgate et al., 2009]. This inflammation leads to multiple
structural changes in the airways of patients with asthma, including:
Basement membrane thickening
Sub-epithelial fibrosis
Smooth muscle hypertrophy and hyperplasia
Blood vessel proliferation
Mucus hyper-secretion
Epithelial changes
These structural changes lead to airway obstruction through airway
thickening, with a consequent reduction in airway diameter, smooth
muscle contraction and luminal obstruction by mucus. In addition the
work of breathing increases as a result of reduced lung compliance,
particularly in the setting of chronic inflammation. Over time these
changes, collectively referred to as airway remodelling, may lead to
irreversible or incompletely reversible airway narrowing [Dunnill, 1960;
GINA, 2011; Hamid, 2012; James et al., 1989; Jeffery, 2001; Murphy and
Byrne, 2010]
Inflammation is detectable in all patients with asthma although
different patterns of inflammatory cells exist, and changes in the pro-
portions of different inflammatory cells are not always well correlated
with clinical outcome [GINA, 2011; Holgate, 1999].

2.2 pathophysiology of asthma 17
Cell types which appear to be important in the establishment
and maintenance of inflammation in asthma include T lymphocytes,
activated mast cells, natural killer T cells, dendritic cells, basophils and
eosinophils [Akbari et al., 2006; Brightling et al., 2000a, 2002; GINA,
2011; Holgate, 1999; Murphy and Byrne, 2010; Robinson, 2010]. The
relative contribution of different cell types is still unclear, for example
the interaction of T-cell helper 2 (Th2) and CD1 invariant natural killer
T cells and the extent to which the balance between the cell types may
affect the clinical presentation of asthma [Meyer et al., 2008; Murphy
and Byrne, 2010; Robinson, 2010; Thomas et al., 2010; Umetsu and
DeKruyff, 2010]. In addition, high levels of neutrophils are seen in some
people with asthma, particularly patients with more severe disease
and those on high levels of ICS [Douwes et al., 2002; Murphy and
Byrne, 2010; Wenzel, 2006; Wenzel et al., 1997]. Inflammometry based
phenotyping will be discussed further in chapter 3.
Bronchial hyperresponsiveness and atopy
BHR is a key component of asthma. Because the degree of BHR can
be objectively characterised with bronchial challenge testing, this is a
useful tool for exploring epidemiological association and inheritance
patterns to try and understand the underlying processes contributing
to the development of asthma [Busse, 2010; Weatherall et al., 2013]. For
instance, BHR has been shown to be strongly associated with atopy
[Boezen et al., 1996; Clifford et al., 1987; Holgate, 1999]. Atopy is
defined as "The propensity to generate Immunoglobulin E (IgE) against
18 description of asthma and copd
common environmental allergens" [Holgate, 1999], and often presents as
eczema or allergic rhinitis.
The association between asthma and atopy suggests a degree of
overlap in the aetiology, inheritance and pathophysiology of the two
conditions [Clifford et al., 1987, 1989; Holgate, 1999; Postma et al.,
1995]. However, within family groups a high IgE does not predict the
development of asthma [Holgate, 1999], and not all people with asthma
have elevated specific IgE to environmental allergens [Murphy and
Byrne, 2010; Vijverberg et al., 2011].
Genetic contribution
Asthma arises from a complex interaction between an individual’s
genetic predispositions and environmental exposures. That there is a
significant genetic component to asthma has been confirmed through
multiple inheritance studies. A child who has one parent with asthma
has approximately double the general population risk of developing
asthma [Clifford et al., 1987; Sibbald et al., 1980]. Evidence that
this is not purely due to a shared home environment comes from
twin studies which show that identical twins are far more likely to
share asthma than non-identical twins [Sarafino and Goldfedder, 1995].
Inheritance is not due to any single gene but rather the interaction of
multiple genes which affect the predisposition of an individual to a
maladaptive response to stimuli. The overall heritability in asthma has
been estimated at 40-60% [Adcock and Barnes, 2011] and a number of
chromosomal regions have been highlighted as playing an important
role. Perhaps the most widely reported of these is a chromosome region

2.3 definition and epidemiology of copd 19
on 5q which contains the genes for Interleukin 4 (IL-4), Interleukin 5
(IL-5) and Interleukin 13 (IL-13), and is associated with the development
of asthma and atopy [Cookson and Moffatt, 2000; Postma et al.,
1995; Sandford and Pare, 2000]. However, the contribution of specific
polymorphisms to an individual’s risk of developing asthma is small
and this has so far confined the role of genetic analysis to assisting
with an understanding of the underlying pathophysiology rather than
predicting outcome or treatment response. In time physicians may
use knowledge of an individual’s genome to tailor their treatment,
but trials stratifying participants according to β2-adrenergic receptor
polymorphisms have not yet shown clinically important differences in
response [Bleecker et al., 2007; Tse et al., 2011; Wechsler et al., 2009].
Accordingly this thesis will concentrate on those aspects of disease that
may currently be measured in a respiratory clinic setting.
2.3 definition and epidemiology of copd
The term ’Chronic Obstructive Pulmonary Disease’ was popularised
by Briscoe and Nash [1965] but the underlying manifestations of
chronic bronchitis and emphysema were described many years before.
The first pathological description may have been that by Bonet [1679]
and the terms themselves were formalised at the Ciba Symposium
[1959] [Petty, 2006]. In NZ, COPD is predominantly due to tobacco
smoke inhalation [Broad and Jackson, 2003], however other inhaled
toxins such as biomass smoke from cooking fires may be responsible
for a significant proportion of COPD worldwide [Decramer et al., 2012;
GOLD, 2010; Town et al., 2003].

20 description of asthma and copd
COPD is estimated to affect around 15% of the population over the
age of 45 in NZ. Rates in Maori populations are estimated to be more
than twice as high, due at least in part to far higher rates of smoking.
In the most recent report, [Ministry of Health, 2012] 18% of adult New
Zealanders reported smoking in the last month, compared with 41% of
Maori adults. The prevalence of COPD is increasing due to high rates of
smoking over the last 50 years.
The consumption of tobacco has reduced markedly in NZ over the
last 30 years [Broad and Jackson, 2003; Ministry of Health, 2012], but
it will take many years before this change is reflected in changing
incidence and prevalence rates of COPD. Men once made up the vast
majority of COPD sufferers, but with changes in smoking patterns the
prevalence of COPD in women has almost reached that of men [GOLD,
2010].
GOLD, an equivalent body to GINA, has defined COPD as follows:
“Chronic Obstructive Pulmonary Disease, a common preventableand treatable disease, is characterised by persistent airflow limita-tion that is usually progressive and associated with an enhancedchronic inflammatory response in the airways and the lungsto noxious particles or gases. Exacerbations and comorbiditiescontribute to the overall severity in individual patients."
[GOLD, 2013]
The persistence of the airflow limitation, and hence the limited re-
versibility, is here a defining characteristic of COPD.

2.4 pathophysiology of copd and comparison with asthma 21
2.4 pathophysiology of copd and comparison with asthma
Like asthma, COPD is an inflammatory condition of the airways
which can lead to airway narrowing, but there are some differences
in the inflammation seen when patients with asthma and COPD are
compared [Fabbri et al., 2003]. As with asthma, patients with COPD
exhibit day to day variation in symptoms and airflow obstruction but
this is typically less marked, and the disease process is by definition not
fully reversible with treatment [GOLD, 2010; McKenzie et al., 2012].
Diagnosis
Typical symptoms include dyspnoea, chronic cough and sputum
production in the context of a history of significant tobacco smoke-,
biomass smoke-, or occupational- exposure. The majority of patients
will develop symptoms in later life, and COPD is rare in people under
the age of 40.
The diagnosis is suspected clinically on the basis of a consistent
history and clinical examination findings, but spirometry is required to
confirm a diagnosis of COPD [GOLD, 2013; McKenzie et al., 2012]. The
most commonly used criterion to diagnose significant airflow limitation
is a post-bronchodilator FEV1 to Forced Vital Capacity (FVC) ratio of less
than 0.7 [GOLD, 2010]. This cut-off has the advantage of simplicity
but it is known to miss significant disease in younger patients and
may over-diagnose obstruction in elderly patients when compared with
alternative cut-off’s such as the lower-limit of normal [GOLD, 2013].
This means that prevalence estimates may vary, depending on the cut-

22 description of asthma and copd
off chosen [Celli et al., 2003; Mohamed Hoesein et al., 2011; Shirtcliffe
et al., 2007; Swanney et al., 2008; Viegi et al., 2000].
Symptoms suggestive of asthma are similar to those above, but
sputum production and cough are typically more prominent in COPD.
Variability may be more prominent in asthma and the relative prob-
ability of asthma and COPD depends on a combination of factors,
including age of onset, variability of symptoms, history of atopy and
tobacco smoke exposure. No single feature of history or examination
can reliably distinguish between asthma and COPD in older adults.
Inflammation
COPD is characterised by chronic inflammation in the airways in
response to tobacco smoke and environmental exposures. The predom-
inant cell types in COPD are CD8+ T lymphocytes, macrophages and
neutrophils [Decramer et al., 2012; GOLD, 2013; Hogg, 2004; MacNee,
2005]. However, eosinophils are increasingly recognised as playing a
significant role in some patients with COPD [D’Armiento et al., 2009;
Perng et al., 2004], and sputum and blood eosinophil levels may predict
response to steroid treatment and the risk of exacerbation on ICS
withdrawal [Bafadhel et al., 2012; Brightling et al., 2000a, 2005; Liesker
et al., 2011].
The structural changes seen in COPD include:
Goblet cell metaplasia and mucus hyper-secretion
Small airway fibrosis
Parenchymal destruction
2.4 pathophysiology of copd and comparison with asthma 23
Different patients with COPD will show different patterns of inflam-
mation. Classically the main patterns described are those of chronic
bronchitis and emphysema. In chronic bronchitis there is inflammation
in the walls of the bronchi and bronchioles. This causes stiffening
of the small airways, reduced lung compliance, increased bronchial
wall thickness and narrowing of the lumen, as well as mucus hyper-
secretion. This leads to shortness of breath by increasing the work
of breathing both through increased airway resistance and reduced
lung compliance. In emphysema there is expansion of distal airspaces
through parenchymal destruction, which leads to dyspnoea through
a combination of impaired gas exchange, air trapping and airflow
obstruction, due to loss of the interstitial connections which prevent
small airways collapse during expiration [Decramer et al., 2012; GOLD,
2010; Hogg, 2004; MacNee, 2005; Snider, 1989a,b].
The parenchymal changes seen in COPD can not be reversed with
treatment and are progressive in nature, although the rate of progres-
sion is variable and can be altered by smoking cessation [Fletcher et al.,
1976; Kohansal et al., 2009].
Bronchial hyperresponsiveness
BHR, although classically a key feature in asthma, can also be present
in patients with COPD independently of whether they have a history of
asthma [GOLD, 2010; Postma and Boezen, 2004a; van den Berge et al.,
2012]. A study by Tashkin et al. [1996] reported significant BHR in over
two thirds of subjects with mild-moderate COPD, and other groups have
reported BHR prevalences of between 46 and 70% [Bahous et al., 1984;

24 description of asthma and copd
Ramsdale et al., 1984; Yan et al., 1985]. BHR is also a risk factor for the
future development of COPD, and for accelerated lung function decline
in patients who already have COPD [GOLD, 2010; Tashkin et al., 1996].
The mechanism underlying the development of BHR may be different
in COPD [van den Berge et al., 2012] but the overlap in results on
methacholine challenge testing suggest that BHR, like the response to
bronchodilators at a single visit, is of limited usefulness in distinguish-
ing asthma from COPD in an individual patient [Calverley et al., 2003;
Fingleton et al., 2012; Tashkin et al., 2008].
Co-morbidities and systemic inflammation
A key feature of COPD in some patients is its systemic effect.
Populations of people with COPD have high rates of cardiovascular
disease, stroke, diabetes and other co-morbidities [Agustí et al., 2012;
Anthonisen et al., 2002; Barnes and Celli, 2009; Garcia-Aymerich et al.,
2011; Hansell et al., 2003]. It is not clear whether the increased
systemic inflammation seen in some COPD patients is due to "spill-
over" from the lungs, or if both the co-morbidities and COPD are
different expressions of an underlying process [Barnes and Celli, 2009;
Fingleton et al., 2011; Garcia-Aymerich et al., 2011; Wouters et al., 2009].
The systemic inflammation leads to a cachectic state in some patients
with COPD, resulting in loss of muscle bulk and potentially worsening
comorbidities [GOLD, 2010].

2.5 asthma / copd overlap 25
Genetic contribution
As with asthma, COPD arises from an interaction between an individ-
ual’s genetic predispositions and environmental exposures. Sensitivity
to the effects of tobacco smoke varies markedly between individuals,
with some people developing little evidence of airways disease despite
a lifetime of smoking. Approximately 10-15% of smokers develop COPD
[Postma and Boezen, 2004a]. Family members of people with severe
COPD have an increased chance of developing COPD if they smoke
[McCloskey et al., 2001] and this may in part be due to differences
in the protease/anti-protease balance in the lung [Barnes, 2000, 2004;
Churg et al., 2012; Hunninghake et al., 2009].
There is one distinct subset of COPD with a predominant genetic
component. People with α1-antitrypsin deficiency are at much higher
risk of developing emphysema with even modest exposures to envi-
ronmental toxins such as cigarette smoke. A variety of mutations can
reduce the plasma level of α1-antitrypsin, and those which reduce
the level of this enzyme below 11µmol/l are liable to cause clinically
significant disease [GOLD, 2010; Stoller and Aboussouan, 2005].
2.5 asthma / copd overlap
The underlying pathophysiology of asthma and COPD are generally
referred to as distinct [GINA, 2011; GOLD, 2013], and indeed when
clinically clearly discrete groups are studied there are significant differ-
ences in the patterns of disease seen. Fabbri et al. [2003] studied two
groups with chronic airflow limitation: a young onset group with atopic

26 description of asthma and copd
asthma who had never smoked and a late onset group of smokers with
clinical patterns matching classical COPD. Patients with a diagnosis
of asthma had higher lung eosinophils, fewer neutrophils, higher
Fraction of Exhaled Nitric Oxide (FeNO) and greater epithelial basement
membrane thickening. The authors conclude that patients with asthma
and COPD have distinct characteristics and should be clearly identified
as having one or the other condition. However, Bourdin et al. [2004]
report that endobronchial biopsy cannot discriminate between asthma
and COPD in routine practice. It appears probable that the patients in
whom the clinical diagnosis is unclear are also the most likely to have
indeterminate results on pathological examination.
While the patterns of inflammation may differ in well characterised
groups with different clinical phenotypes, it is not clear that the same
is true in those patients in whom the clinical diagnosis is uncertain. In
recent years it has been increasingly recognised that there is a group
of patients with significant tobacco smoke exposure and incompletely
reversible airways disease, but other characteristics more commonly
seen in people with asthma [Gibson and Simpson, 2009; Kim and
Rhee, 2010; Miravitlles et al., 2013; Piras and Miravitlles, 2012; Soler-
Cataluña et al., 2012; Soriano, 2003; Wardlaw et al., 2005; Weatherall
et al., 2009; Zeki et al., 2011]. This group is commonly referred to as
the ’overlap’ group due to the overlapping nature of their presentation
between asthma and COPD. The phrase stems from the overlapping
circles of a Venn diagram such as Figure 3.2 (page 36) and there can be
overlaps between many disease patterns. Unless otherwise qualified, in
this thesis ’overlap’ refers to the asthma-COPD overlap group. Patients
2.5 asthma / copd overlap 27
in this group appear to have relatively severe airflow obstruction with
marked variability, evidence of emphysema and atopy, and may have
an accelerated decline in lung function [Gibson and Simpson, 2009].
The existence of an overlap group, whilst widely recognised, is
not universally accepted. Some commentators perceive this group as
simply representing a population who have co-existent asthma and
COPD as separate processes, in whom it is challenging to make a
definite diagnosis of asthma or COPD, but do not feel that this makes
the overlap group a separate diagnostic category [Barnes, 2000, 2004;
GOLD, 2013].
Table 2.1 summarises some of the reported patterns of disease
for asthma, COPD and the overlap group. Our knowledge of the
overlap group is currently limited. This is in part because there is
no universally accepted definition, and therefore different studies
may be characterising different populations under the same broad
label. One group has produced a consensus document recognising the
existence of the overlap group and making diagnostic and treatment
recommendations [Soler-Cataluña et al., 2012], however the GINA and
GOLD guidelines do not currently acknowledge the overlap group as a
distinct clinical phenotype.
The concept and potential utility of clinical phenotypes will be
summarised in chapter 3, with a description of candidate phenotypes
described to date.

28 description of asthma and copd
Tabl
e2.1
:Typ
ical
Feat
ures
ofA
sthm
a,O
verl
apgr
oup
and
CO
PD
as
th
ma
ov
er
la
pc
op
d
de
mo
gr
ap
hic
s/
ris
kf
ac
to
rs
Age
ofon
set
Earl
yor
Late
onse
t,cl
assi
cally
earl
y-on
set
Typi
cally
child
hood
onse
tw
ith
recu
rren
ceof
sym
ptom
sin
late
rlif
eLa
teon
set
Smok
ing
/po
lluta
ntex
posu
reSi
mila
rto
popu
lati
onle
vels
Maj
orit
yM
ajor
ity
Ato
pyM
ajor
ity
&a
risk
fact
orC
omm
onLe
ssco
mm
on,n
ota
risk
fact
or
sy
mp
to
ms
Cou
ghC
omm
onTy
pica
lTy
pica
l
Whe
eze
Typi
cal
Com
mon
Com
mon
Sput
umpr
oduc
tion
Com
mon
Typi
cal
Typi
cal
BHR
Dir
ect
BHR
Typi
cal
Typi
cal
Com
mon
Indi
rect
BHR
Typi
cal
Typi
cal
Lim
ited
/A
bsen
t
lu
ng
fu
nc
tio
nt
es
ts
Peak
flow
vari
abili
tyTy
pica
lTy
pica
lC
omm
on
Obs
truc
tion
Com
mon
Typi
cal,
ofte
nm
oder
ate/
seve
rePr
esen
tby
defin
itio
n
Rev
ersi
bilit
yPr
esen
tby
defin
itio
n,ty
pica
llyco
mpl
ete
Typi
cal
Inco
mpl
ete
orab
sent
byde
finit
ion
Tran
sfer
fact
orN
orm
al†
Red
uced
Red
uced
in
fl
am
mo
me
tr
y
FeN
OV
aria
ble
$V
aria
ble
$V
aria
ble
$
Rai
sed
Sput
umEo
sino
phils
Com
mon
Com
mon
Com
mon
Rai
sed
Sput
umN
eutr
ophi
lsC
omm
onTy
pica
lTy
pica
l
tr
ea
tm
en
tg
uid
el
in
es‡
ICS
Inm
ajor
ity
-In
mor
ese
vere
pati
ents
LABA
Com
mon
,nev
eras
mon
othe
rapy
§-
Mon
othe
rapy
com
mon
§
LAM
AR
arel
y,ex
cept
inac
ute
sett
ing
-C
omm
on
pa
th
ol
og
y
Base
men
tm
embr
ane
thic
keni
ngPr
omin
ent
-Li
mit
edor
abse
nt
Smoo
thm
uscl
ehy
pert
roph
yPr
omin
ent
-Li
mit
ed
Muc
ushy
per-
secr
etio
nC
omm
on-
Prom
inen
t
Epit
helia
lcha
nges
Des
quam
atio
n-
Met
apla
sia
Emph
ysem
aA
bsen
t-
Typi
cal
Fibr
osis
Lim
ited
-Pr
omin
ent
Com
pari
son
ofch
arac
teri
stic
sof
asth
ma,
CO
PDan
dth
eov
erla
pgr
oup
asge
nera
llyde
scri
bed.
The
seve
rity
ofin
divi
dual
com
pone
nts
ishi
ghly
vari
able
,not
alli
ndiv
idua
lsw
illfit
thes
epa
tter
ns,a
ndso
me
indi
vidu
als
pres
ent
wit
hfe
atur
esof
mor
eth
anon
eco
ndit
ion.†M
aybe
redu
ced
due
toai
rtr
appi
ngin
seve
reor
chro
nic
asth
ma.‡B
ased
oncu
rren
tC
OPD
-Xan
dBT
Sgu
idel
ines
,oth
ergr
oups
have
reco
mm
ende
dth
eea
rly
use
ofIC
Sin
the
over
lap
grou
p[S
oler
-Cat
aluñ
aet
al.,
20
12]
§Mon
othe
rapy
refe
rsto
the
use
ofLA
BAw
itho
utre
gula
rIC
S.$
Oft
enel
evat
edin
cort
icos
tero
idre
spon
sive
dise
ase.
-Th
etr
eatm
ent
and
path
olog
yof
the
over
lap
grou
pha
veno
tbe
enfir
mly
esta
blis
hed
atth
isti
me.
3P H E N O T Y P I N G O F O B S T R U C T I V E A I RWAY S
D I S E A S E
3.1 what is a phenotype?
The phenotype of an organism is classically defined as:
The observable properties of an organism that are produced by theinteraction of the genotype and the environment.
Merriam-Webster [2013]
This idea has been adapted for use in clinical medicine, where a disease
process can affect individuals in more than one fashion. Doctors are
used to seeing patients with the same disease affected in very different
ways. These may be idiosyncratic differences, but if a particular pattern
is seen recurrently it may be perceived as a distinct sub-type of disease.
The concept of a clinical phenotype has emerged which (with reference
to COPD) has been suggested by one group as being reserved for
patterns of disease attributes that:
". . . describe differences between individuals with COPD as theyrelate to clinically meaningful outcomes (symptoms, exacerbations,response to therapy, rate of disease progression, or death)."
Han et al. [2010]
The authors suggest that a pattern of disease should not be referred to
as a phenotype until these criteria have been proven to be fulfilled.
29
30 phenotyping of obstructive airways disease
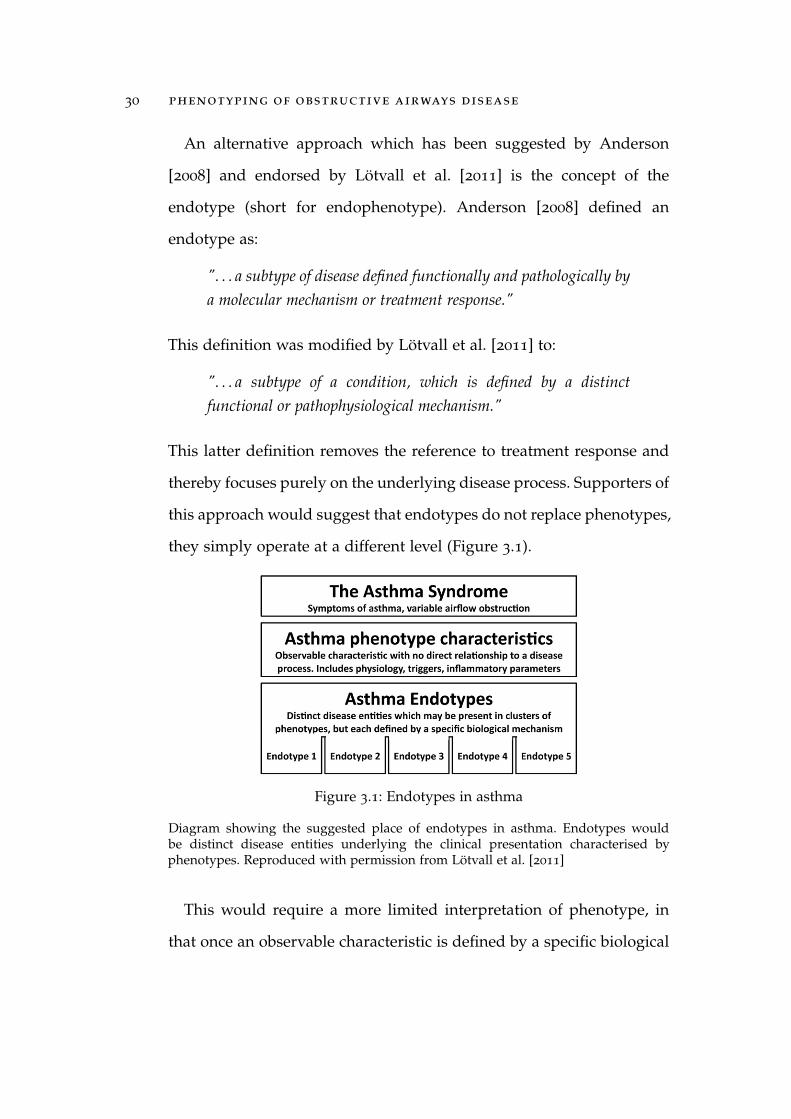
An alternative approach which has been suggested by Anderson
[2008] and endorsed by Lötvall et al. [2011] is the concept of the
endotype (short for endophenotype). Anderson [2008] defined an
endotype as:
". . . a subtype of disease defined functionally and pathologically bya molecular mechanism or treatment response."
This definition was modified by Lötvall et al. [2011] to:
". . . a subtype of a condition, which is defined by a distinctfunctional or pathophysiological mechanism."
This latter definition removes the reference to treatment response and
thereby focuses purely on the underlying disease process. Supporters of
this approach would suggest that endotypes do not replace phenotypes,
they simply operate at a different level (Figure 3.1).
Figure 3.1: Endotypes in asthma
Diagram showing the suggested place of endotypes in asthma. Endotypes wouldbe distinct disease entities underlying the clinical presentation characterised byphenotypes. Reproduced with permission from Lötvall et al. [2011]
This would require a more limited interpretation of phenotype, in
that once an observable characteristic is defined by a specific biological
3.2 potential benefits of phenotyping 31
mechanism it would cease to be a phenotype and become an endotype.
For example, aspirin-sensitive asthma is generally accepted to be a
phenotype of asthma [British Thoracic Society; Scottish Intercollegiate
Guidelines Network, 2012; GINA, 2011; Wenzel, 2006] but according to
the consensus statement by Lötvall et al. [2011] it should be regarded
as an endotype. Another example of a characteristic that has been
described both as a phenotype and endotype is neutrophilic asthma
[Anderson, 2008; Wenzel, 2006].
Within this thesis the word ’phenotype’ refers to any sub-type of
disease that can be determined according to the observable character-
istics of the individual. Whether these phenotypes should be seen as
aspects of disease, disease variants, different disease entities, or simply
descriptors of parts of a spectrum will be discussed in Part III.
3.2 potential benefits of phenotyping
Phenotyping of different types of airways disease is not a matter of
purely academic interest, as it may have important ramifications for
our understanding of the different sub-types. Disease phenotypes may
differ in:
risk factors
natural history
aetiology
pathophysiology
treatment responsiveness
and may be best monitored with different techniques [Fingleton and
Beasley, 2012; Fingleton et al., 2011; Han et al., 2010; Weiss, 2012].

32 phenotyping of obstructive airways disease
One example of these differences is the suggested frequent exacer-
bator phenotype in patients with COPD [Donaldson et al., 2002; GOLD,
2013; Hurst et al., 2010; Makris et al., 2007]. Some individuals with
COPD have relatively frequent exacerbations, and this is associated with
a more rapid decline in FEV1 [Donaldson et al., 2002; Makris et al., 2007]
and an increased mortality and morbidity [Hurst and Wedzicha, 2009;
Soler-Cataluña et al., 2005]. Although there is a positive association
between severity of obstruction and exacerbation frequency, the best
predictor of future exacerbations is the patient’s personal history [Don-
aldson and Wedzicha, 2006; Hurst et al., 2010]. These results strongly
suggest that frequent exacerbations of COPD identify a distinct clinical
phenotype which has a different natural history. Studying clinical
phenotypes may allow us to identify differences in the underlying
pathogenesis, which in turn will allow a greater understanding of the
disease process and may allow targeted phenotype specific treatment
[Anderson, 2008; Bousquet et al., 2011; Drazen, 2011; Fingleton and
Beasley, 2012; Fingleton et al., 2011; Han et al., 2010; Lötvall et al., 2011;
Shirtcliffe et al., 2011; Weiss, 2012].
The current use of personalised treatment according to phenotypes
in OAD is relatively limited, due to the incomplete evidence base.
However, there are examples within both asthma and COPD. Within
COPD, the frequent exacerbator group may preferentially benefit from
combination ICS and LABA due to their higher rate of future exacer-
bations and lung function decline [Calverley et al., 2007; Hurst and
Wedzicha, 2009; Hurst et al., 2010]; the National Emphysema Treatment
Trial (NETT) analysis demonstrated that lung volume reduction surgery

3.2 potential benefits of phenotyping 33
was likely to be beneficial in individuals with upper lobe predominant
emphysema and poor exercise tolerance, but inappropriate in other
groups [National Emphysema Treatment Trial Group, 2003]; and the
phosphodiesterase type 4 inhibitor roflumilast may have a limited
role in patients with multiple exacerbations and a chronic bronchitic
phenotype [Calverley et al., 2009; Chong et al., Accessed 23rd April
2013; Fabbri et al., 2009; Rennard et al., 2011].
Within asthma, potential examples of personalised medicine include
the biological agents, where monoclonal antibodies to specific targets
are used to try and reduce lung inflammation. This group of medica-
tions includes the anti-IgE therapy omalizumab [Bousquet et al., 2004],
anti-IL-5 agents such as mepolizumab [Pavord et al., 2012], and the
newer IL-13 agents lebrikizumab [Corren et al., 2011; Drazen, 2011]
and tralokinumab [Piper et al., 2012]. These high cost medications
have so far not been demonstrated to be appropriate for use in the
wider population with asthma. However, within subgroups of patients
with frequent exacerbations and moderate to severe disease there is
evidence that they may be of greater benefit. One example of this is
with early studies of the anti IL-5 agent mepolizumab. The expectation
prior to clinical trials was that blockade of IL-5 would lead to a
substantial reduction of eosinophils in the airways and an improvement
in asthma symptoms. The expected reduction in eosinophils was
demonstrated but this was not accompanied by an improvement in
BHR or clinical characteristics [Flood-Page et al., 2007, 2003; Leckie et al.,
2000]. Mepolizumab may however reduce exacerbation rates in a sub-

34 phenotyping of obstructive airways disease
group of patients with severe refractory eosinophilic asthma [Haldar
et al., 2009; Pavord et al., 2012].
Differences in treatment responsiveness between phenotypes may
be due to differences in the underlying pathophysiology, for in-
stance aspirin-sensitive asthma may show an enhanced response to
Leukotriene Receptor Antagonists (LTRAs) because of the up-regulation
of cysteinyl leukotriene production and receptor expression in these
pathways [Israel, 2000; Park et al., 2010; Schafer and Maune, 2012;
Sousa et al., 2002; Teran et al., 2012]. However in other situations, such
as the restriction of omalizumab use to patients with severe asthma
and frequent exacerbations, the benefits of targeted treatment may stem
from the fact that those patients at highest risk of exacerbation have the
greatest chance of demonstrating benefit from a therapy of marginal
efficacy. The description of clinical phenotypes with different risk
factors, natural histories or treatment responses may therefore suggest
differences in the underlying pathophysiology, but not all phenotypes
will be shown to have distinct pathophysiological mechanisms.
3.3 phenotyping of airways disease pre cluster analysis
COPD was first defined in 1964 and the terminology was progressively
adopted thereafter [Mitchell and Filley, 1964]. Prior to this patients with
OAD who had smoked were classified as having chronic bronchitis or
emphysema depending on their level of cough, airway narrowing and
lung destruction. The heterogeneous nature of COPD was recognised
long before the term was popularised by Briscoe and Nash [Briscoe
and Nash, 1965; Nash et al., 1965] and the original classifications of

3.3 phenotyping of airways disease pre cluster analysis 35
chronic bronchitis and emphysema remain more recognisable to the
general public than the term COPD. In order to better understand the
different clinical pictures seen by doctors, a variety of methods have
been used to explore the different phenotypes of COPD. Early studies
constructed groups based on recognised clinical patterns, informed by
those variables which were significantly associated with outcome. For
example Burrows et al. [1987] described three groups within sufferers
of chronic airways obstruction, Group 1 "considered to have features
most characteristic of chronic asthma", Group 3 "non-atopic smokers
without known asthma" and Group 2 "an intermediate group".
Following on from studies such as these came the construction of
the original non-proportional diagram for COPD [Snider, 1989a] and its
incorporation into the 1995 American Thoracic Society (ATS) guidelines
[American Thoracic Society, 1995] (Figure 3.2).
Subsequent refinements of the Venn diagram approach have de-
scribed at least 15 phenotypes, with more recent population samples
allowing the construction of proportional Venn diagrams [Marsh et al.,
2008; Soriano, 2003; Viegi et al., 2004] (Figure 3.3). However the
response to treatment and pathogenesis of these sub-groups are not
well understood [Marsh et al., 2008].
Phenotypes in asthma have been explored with similar methods to
those used to characterise COPD, and a variety of possible phenotypes
have been described [Bel, 2004; Wenzel, 2006]. Venn diagrams have
also been constructed for asthma, with the most recent [Wenzel, 2006]
describing 13 possible phenotypes (Figure 3.4).
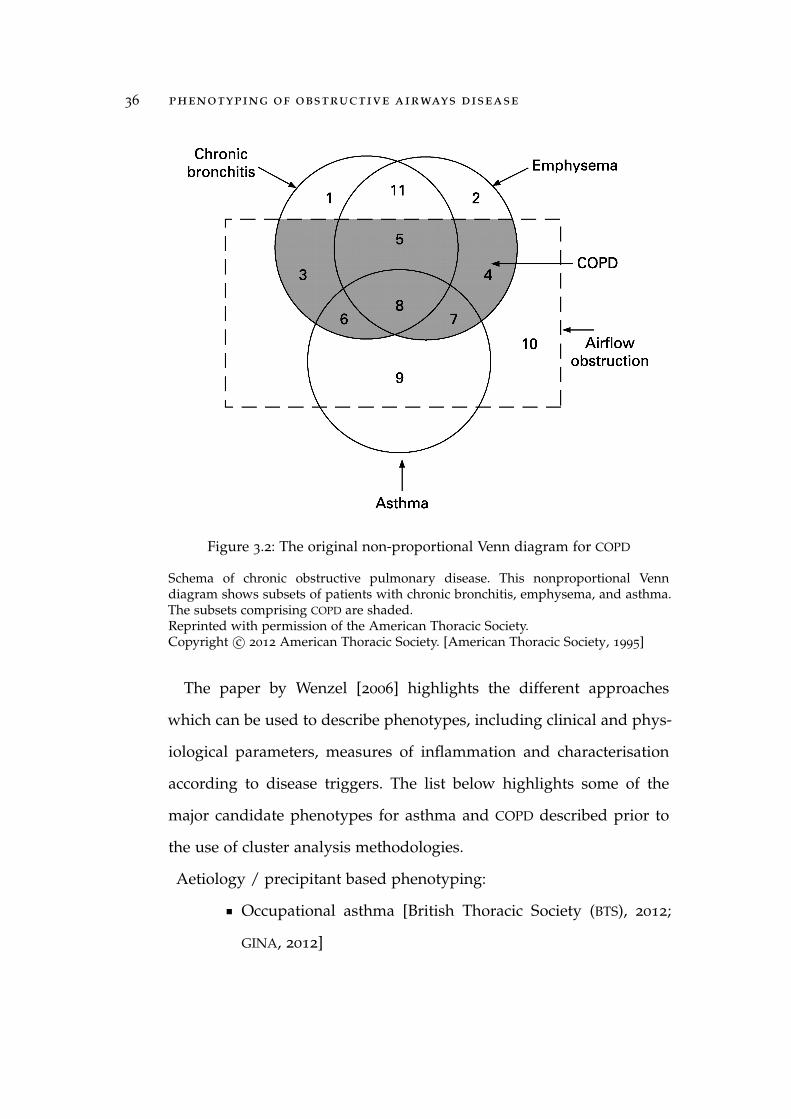
36 phenotyping of obstructive airways disease
Figure 3.2: The original non-proportional Venn diagram for COPD
Schema of chronic obstructive pulmonary disease. This nonproportional Venndiagram shows subsets of patients with chronic bronchitis, emphysema, and asthma.The subsets comprising COPD are shaded.Reprinted with permission of the American Thoracic Society.Copyright c© 2012 American Thoracic Society. [American Thoracic Society, 1995]
The paper by Wenzel [2006] highlights the different approaches
which can be used to describe phenotypes, including clinical and phys-
iological parameters, measures of inflammation and characterisation
according to disease triggers. The list below highlights some of the
major candidate phenotypes for asthma and COPD described prior to
the use of cluster analysis methodologies.
Aetiology / precipitant based phenotyping:
Occupational asthma [British Thoracic Society (BTS), 2012;
GINA, 2012]

3.3 phenotyping of airways disease pre cluster analysis 37
(a) Reproduced from Soriano [2003] with permission from theAmerican College of Chest Physicians
(b) Reproduced from Viegi et al. [2004] with permission from theAmerican College of Chest Physicians
(c) Reproduced from Marsh et al. [2008] with permission from BMJPublishing Group Ltd.
Figure 3.3: Proportional Venn diagrams in Obstructive Airways Disease

38 phenotyping of obstructive airways disease
Figure 3.4: Candidate Phenotypes of Asthma. Reproduced from Wenzel [2006]
PMA= Peri Menstrual Asthma
Aspirin sensitive asthma [British Thoracic Society (BTS), 2012;
GINA, 2012]
Exercise associated asthma [British Thoracic Society (BTS),
2012; GINA, 2012]
Non-smoking-related COPD [Birring et al., 2002; Zeng et al.,
2012]
Early/Late-onset asthma [Wenzel, 2006]

3.3 phenotyping of airways disease pre cluster analysis 39
Atopic / non-atopic asthma [Wenzel, 2006]
Inflammation based phenotyping: [Fahy, 2009; Saha and Brightling,
2006]
Eosinophilic asthma/COPD
Non-eosinophilic asthma/COPD
Symptom based phenotyping:
Cough-variant asthma [GINA, 2012]
Healthcare usage based phenotyping:
Frequent exacerbator- applies to both COPD and asthma
[GINA, 2011; GOLD, 2013]
Other phenotypes:
Asthma/COPD overlap [GINA, 2012]
As can be seen by the wide variety of potential phenotypes, the
clinical presentation of both asthma and COPD is highly variable. This
may result either from differences in severity or differences in the
underlying pattern of disease. For example, exercise induced/associ-
ated asthma is a well-recognised sub-type of asthma [British Thoracic
Society; Scottish Intercollegiate Guidelines Network, 2012; GINA, 2011;
Wenzel, 2006] but symptoms of asthma with exercise may either reflect
underlying airway narrowing due to partially controlled asthma, or
may be due to bronchoconstriction in response to exercise. These two
different aetiologies can present with the same symptoms, and high-
light the difficulties which can be encountered when linking symptom
profiles to the underlying physiological state. As a result, there is
interest in the potential for measures of inflammation (inflammometry)
40 phenotyping of obstructive airways disease
and other biomarkers to act as indicators of treatment responsiveness
and disease activity.
Inflammometry may be performed by obtaining cellular samples
from the lung, usually by induced sputum, and performing a differen-
tial cell count to assess the proportions of eosinophils and neutrophils
in the airway, or can be assessed through measurement of exhaled
nitric oxide levels. The observation that high eosinophil levels in the
sputum was associated with a good response to oral steroids was
first reported by Brown [1958] but safe and reproducible methods
for sputum induction were not described in the literature until the
1990’s [Fahy et al., 1993; Hargreave and Leigh, 1999; Kips et al.,
1998; Pavord et al., 1997; Pin et al., 1992]. Over the last 20 years
studies have described three main patterns seen with sputum induction,
’eosinophilic’– defined as a differential cell count of >3% eosinophils,
’neutrophilic’ – raised neutrophils but <3% eosinophils, and ’pauci-
granulocytic’ – no excess of inflammatory cells [Green et al., 2002]. It is
important to note that eosinophilic samples will often also have raised
neutrophils, with some groups distinguishing between ’eosinophilic’
and ’mixed-granulocytic’ forms, where the latter has both raised
neutrophils and a high proportion of eosinophils. Sputum eosinophilia
has been shown to predict response to steroids in both asthma and
COPD [Berry et al., 2007; Brightling et al., 2000b, 2005; Gonem et al.,
2012] and there is evidence of improved clinical outcomes or reduced
steroid burden in the majority of trials using induced sputum to guide
treatment [Pavord and Gibson, 2012]. However the technical challenges
associated with sputum induction have precluded widespread clinical

3.3 phenotyping of airways disease pre cluster analysis 41
use [Petsky et al., 2012] and there has been interest in using FeNO
as a more easily measurable marker of eosinophilia and predictor of
steroid response [Shaw et al., 2007; Silkoff et al., 2000; Smith et al., 2005;
Taylor et al., 2006]. FeNO is highly associated with sputum eosinophilia
but is also a predictor of steroid responsiveness in its own right.
However, trials using FeNO to guide therapy have not yet shown a clear
benefit [Pavord and Gibson, 2012; Petsky et al., 2012]. Inflammometry
therefore highlights the heterogeneous nature of asthma and COPD but
the current evidence base does not support the widespread use of
inflammometry to determine management.
The emerging field of systems biology, which includes the disciplines
of metabolomics, proteomics and genomics amongst others, is greatly
increasing the complexity and variety of descriptors which are available
to characterise phenotypes of disease [Agustí et al., 2010; Bousquet
et al., 2011]. In light of the many different variables by which patterns of
obstructive airways disease can now be described, the focus has turned
to multivariate statistical techniques to help interpret this wealth of
data.
Multivariate Techniques
Group definition based on the subjective interpretation of data col-
lected from a population tends to describe groups which match existing
beliefs about the patterns of disease. These hypotheses can then be
tested but the original hypothesis remains vulnerable to individual bias.
More recently there have been attempts to explore phenotypes with
methods which are less reliant on a priori assumptions. In view of the
42 phenotyping of obstructive airways disease
large number of potentially important but overlapping variables, the
focus has turned to multivariate statistical approaches such as Factor
Analysis (FA) and, more recently, cluster analysis.
FA, and particularly Principle Components Analysis (PCA), are sta-
tistical methods which can be applied to large data-sets containing
multiple variables. Factors are generated which are a combination of
scaled original variables and which each describe a proportion of the
variability within the study population. The combination of particular
variables within the same factor may indicate a relationship due to the
underlying pathophysiology and hence may support the description
of particular phenotypes based on the different factors. The allocation
of variables to factors is determined by the statistical procedure used
rather than according to existing hypotheses and so is less susceptible
to bias. The choice of variables can however greatly affect the outcome
and so it is not immune to a priori assumptions.
Use of FA has provided evidence for measures of obstruction [Lap-
perre et al., 2004; Mahler and Harver, 1992; Wegner et al., 1994],
hyperinflation [Wegner et al., 1994], exercise tolerance [Ries et al.,
1991; Wegner et al., 1994], airway hyper-responsiveness / reversibility
[Lapperre et al., 2004] measures of inflammation [Lapperre et al.,
2004; Roy et al., 2009], and dyspnoea/health related quality of life
[Fuchs-Climent et al., 2001; Mahler and Harver, 1992; Wegner et al.,
1994] as independent components of COPD phenotypes. Within asthma,
FA has been used to explore the relationship between quality of
life and asthma severity [Juniper et al., 2004], to describe groups of
characteristics which may be useful in disease phenotyping [Holberg

3.3 phenotyping of airways disease pre cluster analysis 43
et al., 2001; Pillai et al., 2008], to suggest that markers of atopy and
measures of airway inflammation are separate dimensions of asthma
[Leung, 2005], and to guide assessment of the patient with acute severe
asthma [Rodrigo and Rodrigo, 1993].
Whilst FA and PCA are useful in determining which variables are
responsible for the majority of variability within a group; they cannot
be used to allocate individuals to sub-groups determined by these
differences [Weatherall et al., 2010]. There is now a burgeoning interest
in techniques which can allocate individuals to particular sub-groups
in a relatively unbiased way. One such group of methods used to
explore data and generate possible phenotypes is cluster analysis. The
principles behind cluster analysis and the relevant literature will be
summarised in chapter 4.


4C L U S T E R A N A LY S I S
4.1 background
Cluster analysis techniques aim to find groups within a set of data.
They do this by using variables (clinical measurements, blood tests,
medical history, etc. . . ) to assess the degree of difference between
individuals and then create two or more clusters where people within
the cluster are as similar to one another as possible, and as different
from the other cluster as possible. The major strength of cluster analysis
methodology is that it minimises a priori assumptions about the groups
contained within the data and it may therefore be less susceptible to
bias [Weatherall et al., 2010].
The concept behind cluster analysis can be illustrated with the
following hypothetical example. A researcher has information about
the characteristics (variables A, B, C, . . . ) of a population and wishes to
know if there are distinct groups within the population. The ease with
which groups can be described depends on the number of variables
required to describe differences between the groups. If there were
two groups within the population and one variable (A) adequately
described all the variation in the population, then by simply plotting
the distribution of A the researcher would see the bimodal distribution
45
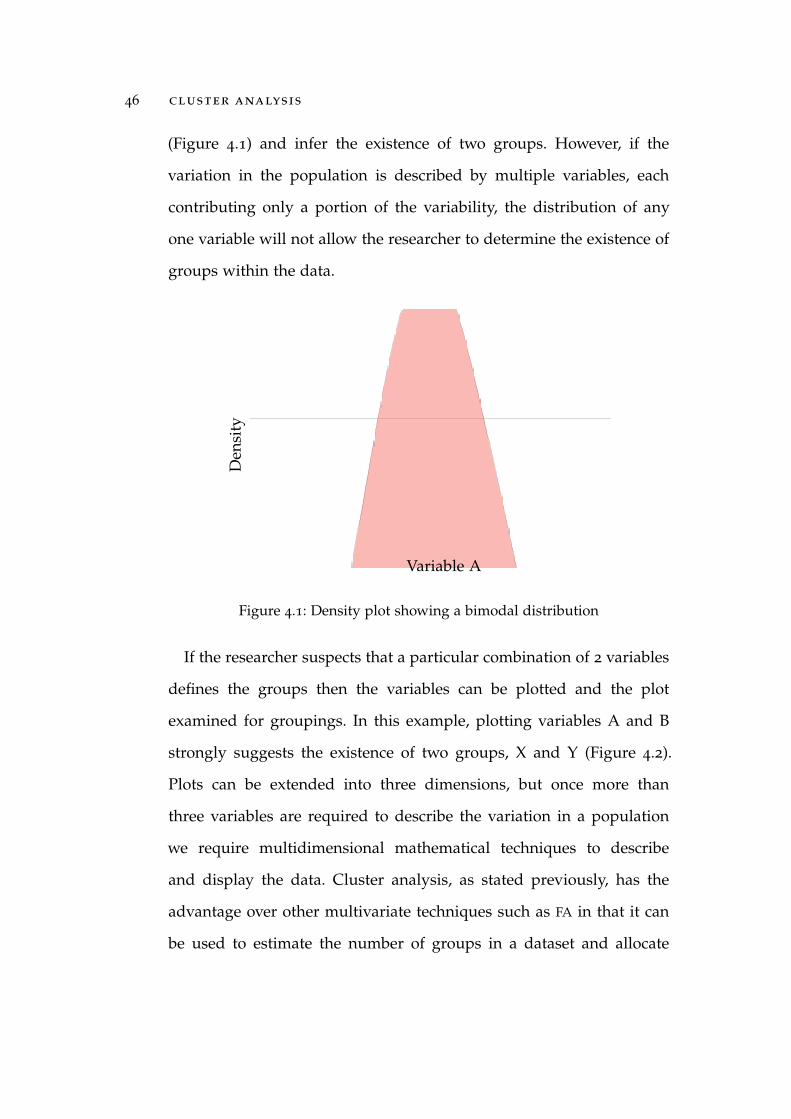
46 cluster analysis
(Figure 4.1) and infer the existence of two groups. However, if the
variation in the population is described by multiple variables, each
contributing only a portion of the variability, the distribution of any
one variable will not allow the researcher to determine the existence of
groups within the data.
Den
sity
Variable A
Figure 4.1: Density plot showing a bimodal distribution
If the researcher suspects that a particular combination of 2 variables
defines the groups then the variables can be plotted and the plot
examined for groupings. In this example, plotting variables A and B
strongly suggests the existence of two groups, X and Y (Figure 4.2).
Plots can be extended into three dimensions, but once more than
three variables are required to describe the variation in a population
we require multidimensional mathematical techniques to describe
and display the data. Cluster analysis, as stated previously, has the
advantage over other multivariate techniques such as FA in that it can
be used to estimate the number of groups in a dataset and allocate
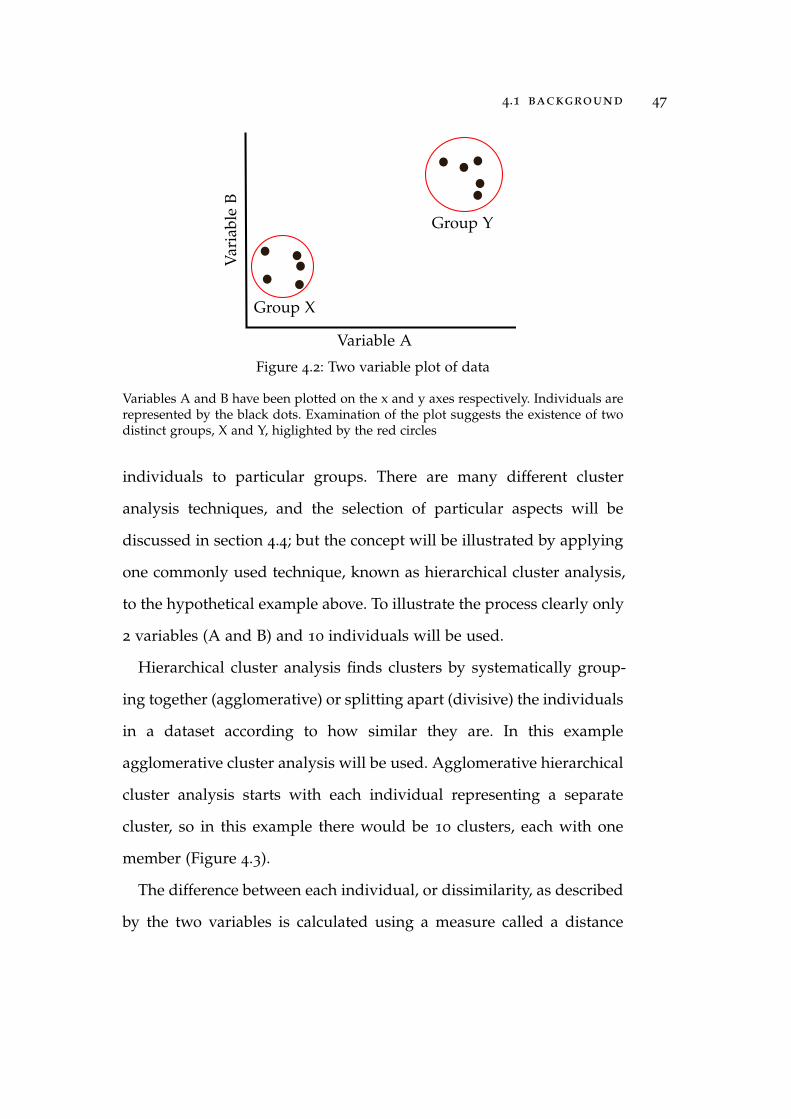
4.1 background 47
Var
iabl
eB
Variable A
Group X
Group Y
Figure 4.2: Two variable plot of data
Variables A and B have been plotted on the x and y axes respectively. Individuals arerepresented by the black dots. Examination of the plot suggests the existence of twodistinct groups, X and Y, higlighted by the red circles
individuals to particular groups. There are many different cluster
analysis techniques, and the selection of particular aspects will be
discussed in section 4.4; but the concept will be illustrated by applying
one commonly used technique, known as hierarchical cluster analysis,
to the hypothetical example above. To illustrate the process clearly only
2 variables (A and B) and 10 individuals will be used.
Hierarchical cluster analysis finds clusters by systematically group-
ing together (agglomerative) or splitting apart (divisive) the individuals
in a dataset according to how similar they are. In this example
agglomerative cluster analysis will be used. Agglomerative hierarchical
cluster analysis starts with each individual representing a separate
cluster, so in this example there would be 10 clusters, each with one
member (Figure 4.3).
The difference between each individual, or dissimilarity, as described
by the two variables is calculated using a measure called a distance
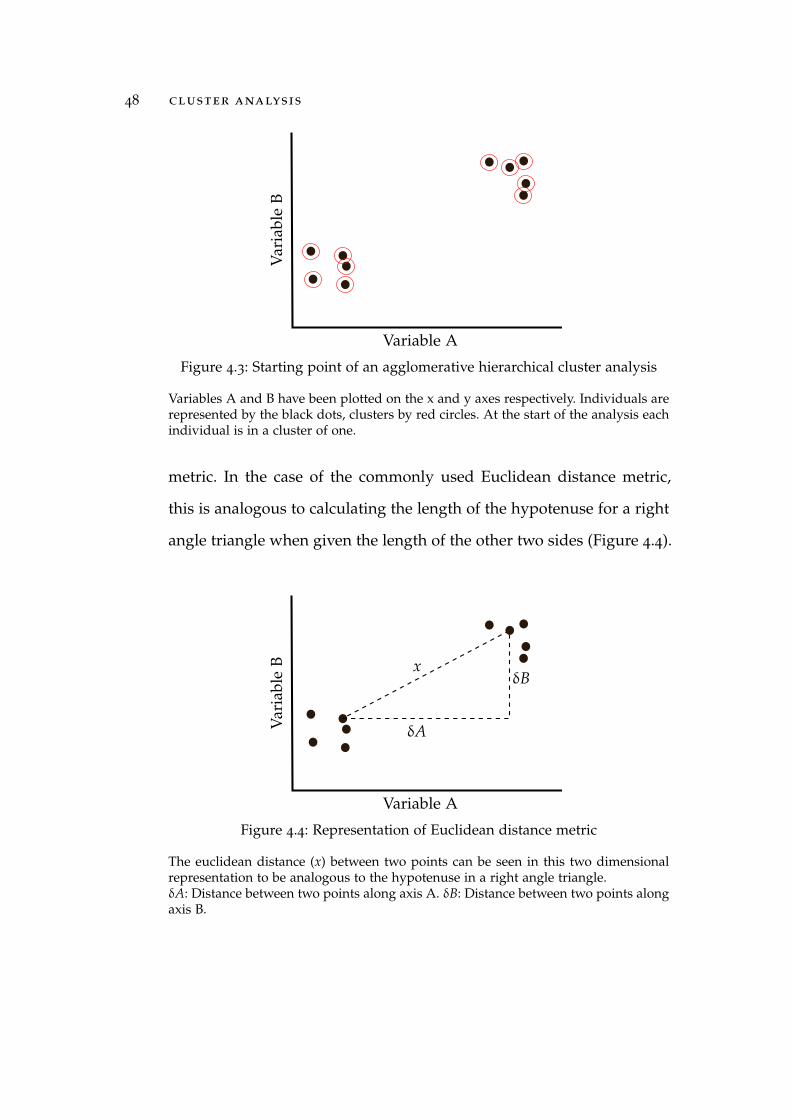
48 cluster analysis
Var
iabl
eB
Variable A
Figure 4.3: Starting point of an agglomerative hierarchical cluster analysis
Variables A and B have been plotted on the x and y axes respectively. Individuals arerepresented by the black dots, clusters by red circles. At the start of the analysis eachindividual is in a cluster of one.
metric. In the case of the commonly used Euclidean distance metric,
this is analogous to calculating the length of the hypotenuse for a right
angle triangle when given the length of the other two sides (Figure 4.4).
Var
iabl
eB
Variable A
x
δA
δB
Figure 4.4: Representation of Euclidean distance metric
The euclidean distance (x) between two points can be seen in this two dimensionalrepresentation to be analogous to the hypotenuse in a right angle triangle.δA: Distance between two points along axis A. δB: Distance between two points alongaxis B.
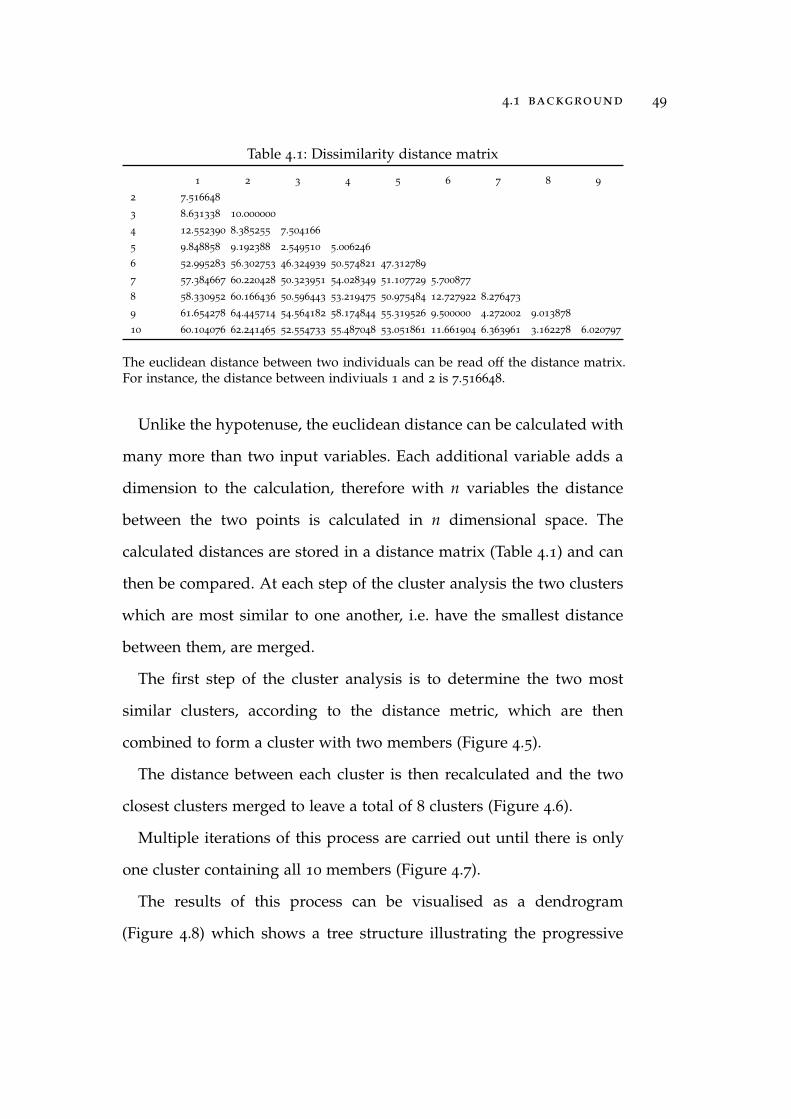
4.1 background 49
Table 4.1: Dissimilarity distance matrix
1 2 3 4 5 6 7 8 9
2 7.516648
3 8.631338 10.000000
4 12.552390 8.385255 7.504166
5 9.848858 9.192388 2.549510 5.006246
6 52.995283 56.302753 46.324939 50.574821 47.312789
7 57.384667 60.220428 50.323951 54.028349 51.107729 5.700877
8 58.330952 60.166436 50.596443 53.219475 50.975484 12.727922 8.276473
9 61.654278 64.445714 54.564182 58.174844 55.319526 9.500000 4.272002 9.013878
10 60.104076 62.241465 52.554733 55.487048 53.051861 11.661904 6.363961 3.162278 6.020797
The euclidean distance between two individuals can be read off the distance matrix.For instance, the distance between indiviuals 1 and 2 is 7.516648.
Unlike the hypotenuse, the euclidean distance can be calculated with
many more than two input variables. Each additional variable adds a
dimension to the calculation, therefore with n variables the distance
between the two points is calculated in n dimensional space. The
calculated distances are stored in a distance matrix (Table 4.1) and can
then be compared. At each step of the cluster analysis the two clusters
which are most similar to one another, i.e. have the smallest distance
between them, are merged.
The first step of the cluster analysis is to determine the two most
similar clusters, according to the distance metric, which are then
combined to form a cluster with two members (Figure 4.5).
The distance between each cluster is then recalculated and the two
closest clusters merged to leave a total of 8 clusters (Figure 4.6).
Multiple iterations of this process are carried out until there is only
one cluster containing all 10 members (Figure 4.7).
The results of this process can be visualised as a dendrogram
(Figure 4.8) which shows a tree structure illustrating the progressive

50 cluster analysis
Var
iabl
eB
Variable A
Figure 4.5: Progression of an agglomerative hierarchical cluster analysis
The two closest clusters have merged to form a cluster containing two individuals.Layout as per Figure 4.3.
Var
iabl
eB
Variable A
Figure 4.6: Progression of an agglomerative hierarchical cluster analysis (2)
Two more clusters have merged leaving eight clusters, two of which contain twoindividuals. Layout as per Figure 4.3.

4.1 background 51
Var
iabl
eB
Variable A
Var
iabl
eB
Variable A
Var
iabl
eB
Variable A
Var
iabl
eB
Variable A
Var
iabl
eB
Variable A
Var
iabl
eB
Variable A
Var
iabl
eB
Variable A
Figure 4.7: Progression of an agglomerative hierarchical cluster analysis (3)
With each iteration the two closest clusters merge, until there is only one clustercontaining all individuals. Layout as per Figure 4.3.

52 cluster analysis
joining of different clusters. This dendrogram represents all possible
solutions from 1 to 10 clusters.
1 2
3 5
4
6
7 9
8 10
010
20
30
40
50
Hei
ght
Figure 4.8: Dendrogram of an agglomerative hierarchical cluster analysis
The height of different parts of the denrogram relate to the amount of dissimilaritythey describe. If two clusters are similar the branch joining them will be closly relatedalong the y axis.
In order to determine which cluster an individual belongs to, the
appropriate number of clusters must be decided and the dendrogram
’cut’ at that level. This may be done by inspection, according to a prior
hypothesis, or with the aid of mathematical descriptors such as Average
Silhouette Width (ASW) and the gap statistic, which are discussed in
section 4.4. In this example a visual inspection suggests a two cluster
solution, as the majority of the height of the dendrogram is taken
up by the two cluster portion of the tree. The distance between the
groups, or dissimilarity, is represented on the y axis. It can be seen in
Figure 4.9 that the two cluster solution describes a large proportion
of the dissimilarity but that separating into more clusters does not
significantly change the dissimilarity. By inspection of the dendrogram

4.1 background 53
we can therefore infer the existence of two groups, X and Y, as were
identified by plotting A and B. Where subsequent divisions of the
dendrogram are very close together, as in this example, it is often not
appropriate to divide the dataset into more groups.
In this simplified example, cluster analysis does not provide addi-
tional information when compared to plotting the data; however, unlike
simple plots, cluster analysis can describe groups according to the
simultaneous contribution of multiple variables and can also partition
the data into clusters even when group separation is much less obvious.
This allows for the identification of groupings that may not otherwise
be recognised due to the complexity of their interactions.
1 2
3 5
4
6
7 9
8 10
010
20
30
40
50
Hei
ght
Cluster X Cluster Y
Figure 4.9: Dendrogram of an agglomerative hierarchical cluster analysis (2)
The portion of the dissimilarity described by the two clusters, X and Y, is markedby the red rectangles. The green rectangle highlights the additional dissimilaritydescribed by subdividing into smaller clusters.
Key elements in the design of any cluster analysis are the method
of recruitment, choice and number of variables. If study participants
are too similar then clusters described may not reflect true phenotypes.

54 cluster analysis
Conversely, very heterogeneous groups can lead to multiple very small
clusters of doubtful significance. The selection and number of variables
involves compromises. Selecting a smaller number of variables felt to
be clinically important risks bias towards pre-conceived phenotypes.
Whereas, uncritical inclusion of a large number of variables risks re-
ducing the ability to detect clinically meaningful phenotypes amongst
the noise [Fingleton et al., 2011; Weatherall et al., 2010]. Cluster analysis
methodology is discussed further in section 4.4, the following section
summarises groups described to date by cluster analysis.
4.2 systematic review of cluster analyses
A systematic review was performed of all papers relating to cluster
analysis in the phenotyping of asthma or COPD in adults. The intent of
this review was a descriptive summary of the literature rather than to
address a specific clinical question. Accordingly the search strategy but
not discussion will be reported according to the Preferred Reporting
Items for Systematic Reviews and Meta-Analyses (PRISMA) [Moher
et al., 2009].
Ovid was used to search Medline (1948-present) and Embase (1947-
present) databases. The search terms used were:
("cluster analysis" and (asthma or COPD or (Chronic and Obstruc-tive and Pulmonary and Disease) or Emphysema)).mp. [mp=ti, ab,sh, hw, tn, ot, dm, mf, dv, kw, ps, rs, nm, an, ui]
Results were limited to: Human. Titles and abstracts were screened
for relevance and the full text of selected articles assessed. The search
was last updated on 28th January 2013 and the results are shown in
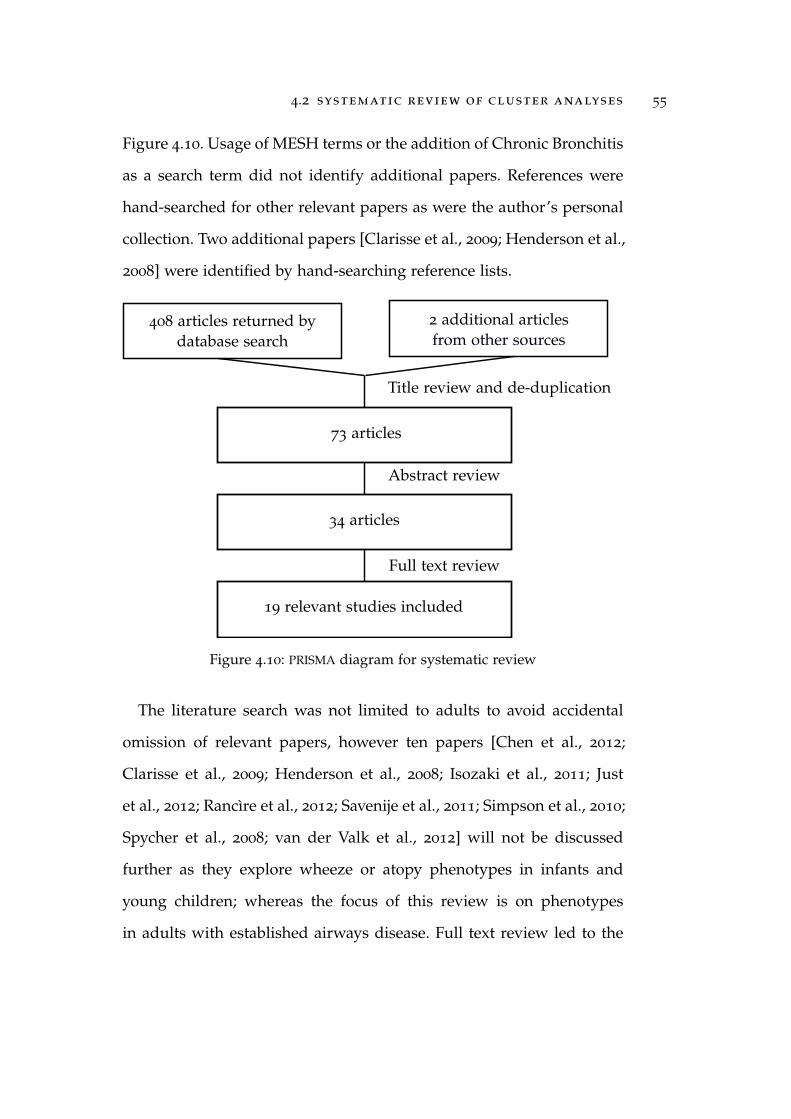
4.2 systematic review of cluster analyses 55
Figure 4.10. Usage of MESH terms or the addition of Chronic Bronchitis
as a search term did not identify additional papers. References were
hand-searched for other relevant papers as were the author’s personal
collection. Two additional papers [Clarisse et al., 2009; Henderson et al.,
2008] were identified by hand-searching reference lists.
73 articles
Title review and de-duplication
408 articles returned by
34 articles
Abstract review
Full text review
19 relevant studies included
2 additional articlesdatabase search from other sources
Figure 4.10: PRISMA diagram for systematic review
The literature search was not limited to adults to avoid accidental
omission of relevant papers, however ten papers [Chen et al., 2012;
Clarisse et al., 2009; Henderson et al., 2008; Isozaki et al., 2011; Just
et al., 2012; Rancìre et al., 2012; Savenije et al., 2011; Simpson et al., 2010;
Spycher et al., 2008; van der Valk et al., 2012] will not be discussed
further as they explore wheeze or atopy phenotypes in infants and
young children; whereas the focus of this review is on phenotypes
in adults with established airways disease. Full text review led to the

56 cluster analysis
exclusion of one paper [Weatherall et al., 2010] as it was an editorial
which did not present new data. The cluster analyses identified during
the systematic review are outlined in Table 4.2.
This is a rapidly expanding field, only 10 of the 19 included cluster
analyses had been published when recruitment commenced for the
New Zealand Respiratory Health Survey (NZRHS). As the number
of publications is relatively small, and the methodology and study
population used quite varied, this literature is best understood with
a clear description of the different approaches utilised. Accordingly,
the following section (4.3) contains outlines of individual papers
with commentary. Emergent themes and candidate phenotypes are
summarised in section 4.4.
4.3 summary of published cluster analyses
The first English language report of cluster analysis being applied
to airways disease occurs in a review article by Wardlaw et al. [2005].
The first report in any language appears to be an article by Richter et al.
[1985] published in German; however this focuses on the psychology of
asthma rather than the pathophysiology or clinical picture and as such
will not be discussed further.
Articles are summarised in the order of publication:
Wardlaw et al. [2005]
The authors report their cluster analysis within a review article
discussing the concept of multi-dimensional phenotyping of airways

4.3 summary of cluster analyses 57
Tabl
e4.2
:Sum
mar
yof
pape
rsin
clud
edin
syst
emat
icre
view
.
pa
pe
rc
on
dit
io
ns
et
tin
gr
ol
eo
fc
lu
st
er
an
al
ys
is
no
.o
fv
ar
ia
bl
es
su
bje
ct
st
ec
hn
iq
ue
us
ed
War
dlaw
etal
,C
linEx
pA
llerg
y2005
Ast
hma
and
CO
PDH
ospi
talo
utpa
tien
tsEx
plor
eph
enot
ypes
ofas
thm
aan
dC
OPD
849
War
d’s
hier
arch
ical
clus
ter
anal
ysis
Pist
oles
iet
al.,
Res
pM
ed2008
CO
PDH
ospi
talo
utpa
tien
tsEx
plor
eph
enot
ypes
ofC
OPD
34
322
Uns
peci
fied
Hal
dar
etal
.,A
JRC
CM
2008
Ast
hma
Prim
ary
care
,H
ospi
tal
Out
pati
ents
and
Tria
lsub
ject
s
Expl
ore
phen
otyp
esof
asth
ma
7184
,187
and
68
PCA
follo
wed
byW
ard’
sm
etho
d&
K-m
eans
clus
ter
anal
ysis
Wea
ther
alle
tal
.,ER
J2009
OA
DPo
pula
tion
sam
ple
Expl
ore
phen
otyp
esof
OA
D9
175
Agn
esan
dD
iana
algo
rith
mcl
uste
ran
alys
is
Moo
reet
al.,
AJR
CC
M2010
Ast
hma
Seve
reA
sthm
aR
esea
rch
Prog
ram
Coh
ort
Expl
ore
phen
otyp
esof
asth
ma
34
726
War
d’s
hier
arch
ical
clus
ter
anal
ysis
Gup
taet
al.,
Thor
ax2010
Ast
hma
’Diffi
cult
asth
ma’
clin
icEx
plor
eC
Tap
pear
ance
ofse
vere
asth
ma
phen
otyp
es7
99
PCA
follo
wed
byW
ard’
sm
etho
d&
K-m
eans
clus
ter
anal
ysis
Burg
elet
al.,
ERJ
2010
CO
PDH
ospi
tal
Out
pati
ents
Expl
ore
phen
otyp
esof
CO
PD3
262
PCA
follo
wed
byW
ard’
shi
erac
hica
lclu
ster
anal
ysis
Joet
al.,
Int
JTu
bLu
ngD
is.2
010
OA
DH
ospi
tal
Out
pati
ents
>6o
yrs
Expl
ore
phen
otyp
esof
OA
Din
anol
der
age
grou
p4
191
Fact
oran
alys
isfo
llow
edby
k-m
eans
clus
ter
anal
ysis
Cho
etal
.,R
esp
Res
2010
Emph
ysem
aN
atio
nal
Emph
ysem
aTr
eatm
ent
Tria
lsu
bjec
ts
Expl
ore
sub-
type
sof
emph
ysem
a4
191
Fact
oran
alys
isfo
llow
edby
k-m
eans
clus
ter
anal
ysis
Bent
onet
al.,
JA
sthm
a2010
Ast
hma
Ast
hMaP
proj
ect
part
icip
ants
Expl
ore
phen
otyp
esof
asth
ma
11
154
PCA
follo
wed
byW
ard’
sm
etho
d&
K-m
eans
clus
ter
anal
ysis
Gar
cia-
Aym
eric
het
al.,
Thor
ax2011
CO
PDA
dmis
sion
sto
Uni
vers
ity
hosp
ital
sEx
plor
eph
enot
ypes
ofC
OPD
224
342
K-m
eans
clus
ter
anal
ysis
Fitz
patr
ick
etal
.,JA
CI
2011
Ast
hma
Seve
reA
sthm
aR
esea
rch
Prog
ram
coho
rt
Expl
ore
phen
otyp
esof
asth
ma
inch
ildre
n12
161
War
d’s
hier
arch
ical
clus
ter
anal
ysis
Siro
uxet
al.,
ERJ
2011
Ast
hma
Popu
lati
onba
sed
case
-con
trol
&fa
mily
coho
rts
Expl
ore
phen
otyp
esof
asth
ma
13
1895
and
641
Late
ntC
lass
Ana
lysi
s
Mah
utet
al.,
Res
pR
es2011
Ast
hma
Hos
pita
lO
utpa
tien
tsEx
amin
eus
eful
lnes
sof
FeN
Oin
defin
ing
phen
otyp
es11
169
PCA
follo
wed
byk-
mea
nscl
user
anal
ysis
Mus
ket
al.,
ERJ
2011
OA
DG
ener
alpo
pula
tion
Des
crib
epa
tter
nsof
airw
ays
dise
ase
inth
ege
nera
lpop
ulat
ion
10
1,9
69
K-m
eans
clus
eran
alys
is
Bafa
dhel
,Mck
enna
etal
.,A
JRC
CM
2011
CO
PDH
ospi
tal
Out
pati
ents
"Bio
mar
kers
inC
OPD
"C
ohor
t
Des
crib
esu
b-ty
pes
acco
rdin
gto
exac
erba
tion
etio
logy
382
Fact
oran
alys
isfo
llow
edby
k-m
eans
clus
ter
anal
ysis
Bafa
dhel
,Um
aret
al.,
Che
st2011
CO
PDH
ospi
tal
Out
pati
ents
"Bio
mar
kers
inC
OPD
"C
ohor
t
Des
crib
esu
b-ty
pes
ofra
diol
ogic
alap
pear
ance
ofC
OPD
382
Fact
orA
naly
sis
follo
wed
byk-
mea
nscl
uste
ran
alys
is
Just
etal
.ER
J2012
Ast
hma
Hos
pita
lout
pati
ents
Expl
ore
phen
otyp
esof
asth
ma
inch
ildre
n19
315
Fact
orA
naly
sis
follo
wed
byk-
mea
nscl
uste
ran
alys
is
Suth
erla
ndet
al.,
PLoS
One
2012
Ast
hma
Ast
hma
Clin
ical
Res
earc
hN
etw
ork
Expl
ore
phen
otyp
esof
asth
ma
21
250
War
d’s
hier
arch
ical
clus
ter
anal
ysis
All
stud
ies
invo
lved
adul
tsun
less
othe
rwis
est
ated
.For
deta
ilsof
sele
ctio
nm
etho
dsse
edi
scus
sion
ofin
divi
dual
pape
rs.
OA
D=
Obs
truc
tive
airw
ays
dise
ase,
LCA
=La
tent
Cla
ssA
naly
sis,
PCA
=Pr
inci
palC
ompo
nent
anal
ysis
,FA
=Fa
ctor
Ana
lysi
s

58 cluster analysis
disease. They discuss the difficulties associated with using symptoms
as defining characteristics of disease and re-iterate the overlapping na-
ture of potential sub-types. Cluster analysis was suggested as a possible
technique allowing multiple aspects of the disease to be represented in
one analysis, with the hope that this may generate useful sub-types.
An example cluster analysis was presented involving 49 subjects, 27
with diagnosed asthma and 22 with diagnosed COPD. The authors
used eight variables considered to represent important dimensions of
asthma and COPD. These are age, gender, tobacco exposure (as pack
years), FEV1 percent predicted, FEV1/FVC ratio, percentage reversibility,
total IgE (log transformed to prevent outliers skewing the data) and
percentage of eosinophils in induced sputum. The cluster analysis was
reported with two cluster and four cluster solutions. The first described
two groups with good separation, these groups roughly equated to
patients with COPD and asthma respectively. The separation was not
exactly according to previous diagnosis, however when the clusters
were examined it was found that the three patients with a diagnosis
of asthma who were clustered with COPD subjects had relatively fixed
airways obstruction and would meet standard criteria for COPD. Of the
two patients with a diagnosis of asthma who were clustered with COPD
patients, one was found to have minimal obstruction and should not
have been diagnosed with COPD; the other had a high IgE and a raised
sputum eosinophil count, consistent with an asthma-like phenotype.
The two cluster solution demonstrates the ability of cluster analysis
to separate well characterised groups but adds no new information.
The authors therefore explored a four cluster solution in which both of

4.3 summary of cluster analyses 59
the original clusters are split into two sub-clusters each. The resultant
clusters were described according to the characteristics of the subjects
within them. Cluster 1a contained predominantly older patients with
fixed airways obstruction, corresponding to the classic description of
COPD. Cluster 1b also contained patients who would meet the definition
of COPD but had more variable airway obstruction. This cluster was felt
to show characteristics of an overlap phenotype between asthma and
COPD. Cluster 2a consisted of asthmatic patients with an eosinophilic
pattern of inflammation in their sputum. Cluster 2b contained patients
with minimal tobacco exposure and mild asthma.
Given the small sample size and the lack of detailed methodology
presented in this paper, the clusters themselves are less important than
the principle that cluster analysis methods may help identify potential
clinical phenotypes. As such this was a landmark paper.
Pistolesi et al. [2008] and Paoletti et al. [2009]
The next reported cluster analysis was that by Pistolesi et al. [2008].
The paper by Paoletti et al. [2009] is included here as a cluster analysis
of the same subjects is reported in this paper. The focus of the two
papers is different but both report cluster analysis of the same patient
group with the same two cluster structure. Accordingly the later paper
is not discussed further.
Pistolesi et al. [2008] report a prospectively collected series of 415
patients presenting to secondary care outpatients over a one year
period. All patients had a diagnosis of COPD. Variables collected
included features from the history such as cough and sputum charac-
60 cluster analysis
teristics, examination findings and chest x-ray appearance. Data from
322 subjects were used to perform the cluster analysis and derive a
multivariate prediction model for group allocation. The remaining 93
subjects had all undergone High Resolution Computed Tomography
(HRCT) of the chest and were used as a validation group for the model.
Cluster analysis was performed using 19 categorical and 15 con-
tinuous variables. Two groups were described, which the authors
felt corresponded to classical descriptions of emphysematous and
chronic bronchitis phenotypes. The authors were able to construct a
multivariate regression model using only 9 variables which described
91% of the variance. When this model was applied to the validation
dataset two groups were constructed which again were felt to represent
chronic bronchitis and emphysema phenotypes and could not have
been identified by using standard GOLD severity classification.
This study was interesting in that it was the first to report a
reasonable sample size of prospectively collected data and the unsuper-
vised cluster analysis generated two groups which correspond to long
recognised sub-types of COPD. However there are significant limitations
in the paper which highlight problems inherent in cluster analysis.
Although cluster analysis is designed to minimise a priori assumptions
and therefore not be swayed by the bias of the investigators it is
vulnerable to bias through the number and choice of variables used.
If variables are highly correlated or describe the same aspect of a
disease, this aspect becomes disproportionately important in defining
cluster structure [Weatherall et al., 2010]. A considerable number of
4.3 summary of cluster analyses 61
the variables used in this cluster analysis are those classically used to
describe chronic bronchitis and emphysema, for instance:
History variables: presence of cough and sputum production
Physical examination variables: Presence / absence of barrel chest
and chest hyper-resonance
Radiographic variables: Presence / absence of increased lung
volume and reduced lung density
The presence of multiple variables which may be correlated and are
used to describe the emphysema and chronic bronchitis subtypes may
have predisposed the cluster analysis to produce groups which fit
this model. In addition the reliability of some of the variables may
be questioned. The reported inter-observer agreement for radiographic
findings such as interstitial changes was only moderate and the inter-
observer agreement for examination findings was not reported.
Haldar et al. [2008]
This paper reported the first cluster analysis of a population of
patients with asthma. The post-hoc analysis was performed on three
datasets. A cohort of 184 primary care patients (Sample One), one of 187
refractory secondary care patients (Sample Two) and the third a group
of 68 patients at the start of a study investigating steroid responsiveness
relative to the pattern of sputum inflammation (Sample Three). The
three samples generated three, four and three clusters respectively.
Samples One and Two were reported as both containing an early
onset atopic group and an obese non-eosinophilic group. Samples Two
and Three both contained clusters described as symptom predominant

62 cluster analysis
and inflammation predominant, although the patterns of disease were
not identical in the different samples. The authors highlighted the
concept of concordant and discordant disease and then analysed the
response to ICS in Sample Three. They found that all those who derived
significant benefit from ICS treatment were within the inflammation
predominant cluster. Although a post-hoc analysis, this is strongly
suggestive that cluster analysis can identify sub-types which show
important differences in their clinical pattern of disease and response
to treatment, thereby potentially representing true phenotypes.
Weatherall et al. [2009]
The authors report a hierarchical cluster analysis of a sample of
175 subjects drawn from a random population sample. A total of 749
subjects underwent questionnaires, detailed lung-function testing with
reversibility as well as FeNO measurement, bloods including IgE and
Computed Tomography (CT) scanning. All included subjects had one
or both of wheeze in the last 12 months or an FEV1/FVC ratio <0.7. Five
clusters were described, which the authors describe as:
Cluster 1: Severe and markedly variable airflow obstruction with
features of atopic asthma, chronic bronchitis and emphysema
Cluster 2: Features of emphysema alone
Cluster 3: Atopic asthma with eosinophilic airways inflammation
Cluster 4: Mild airflow obstruction without other dominant
phenotypic features
Cluster 5: Chronic bronchitis in non-smokers

4.3 summary of cluster analyses 63
A notable feature of this study is the population sampling approach,
which may have allowed a more complete representation of the patterns
of disease than had been captured by previous studies looking at
patients who already had a diagnostic label of asthma or COPD. The
authors were relatively unusual in not including the subject age or
duration of disease in the analysis. The intention behind this was to
avoid variables which may tend to create groups based on duration
or stage of disease as against true phenotypes. Cluster 1 represents
an overlap group with features of asthma, bronchitis and emphysema.
This group is not specifically studied in any interventional trials done
to date for asthma or COPD, and there is therefore no evidence base on
which to treat patients with this pattern of disease. This is particularly
important as these patients were some of the most symptomatic, with
significant degrees of airway obstruction. The authors draw the parallel
with the overlap group described in the analysis by Wardlaw et al.
[2005] and suggest this as an important potential phenotype requiring
further validation.
Moore et al. [2010]
The cohort for this post-hoc analysis is drawn from the Severe
Asthma Research Programme (SARP) in the United States. SARP pro-
vided the largest data-set to date with a total of 726 subjects and
628 variables, which were reduced to 38 for the cluster analysis. Five
clusters were described, two characterised by atopy and early onset
milder disease, differing mainly in subject age; two clusters with severe
asthma differing in age of onset and degree of atopy; one cluster

64 cluster analysis
consisting of older women with increased body mass index who had
more health care use, more steroids and inhaled medication and a
greater discordance between symptoms and degree of obstruction. This
latter group is one with face validity as it is a pattern seen in clinic
but which had not been well characterised. The most novel aspect of
this paper is a discriminant analysis and tree diagram performed after
the cluster analysis. The authors were able to correctly allocate 80% of
subjects to the appropriate cluster based on 3 variables: pre and post
bronchodilator FEV1 and age of onset of disease (Figure 4.11).
Figure 4.11: Allocation rule from Moore et al. [2010]
Reprinted with permission of the American Thoracic Society. Copyright c©2013
American Thoracic Society.
4.3 summary of cluster analyses 65
This was the first description of discriminant analysis to allow the
generation of an allocation rule for cluster membership. This step
will be crucial if candidate phenotypes are to be tested in prospective
interventional trials, as it will not be feasible to perform cluster analysis
on all subjects at the point of enrolment. An allocation rule is therefore
required to allow cluster assignment at study entry. As a post-hoc
database study the authors do not claim that the allocation rule
generated should be used clinically, but it is a useful proof of concept.
Gupta et al. [2010]
This paper reports a cluster analysis in 99 individuals with severe
asthma who had undergone HRCT scans and calculation of ’bronchial
wall area’ and ’lumen area / body surface area’. The cluster analysis
was performed as part of a wider analysis looking at patterns of airway
remodelling. The authors used the methodology of Haldar et al. [2008]
with the same variables and describe four clusters.
There were three clusters with evidence of eosinophilic inflammation,
one of which was felt to have an asthma control score concordant with
the degree of obstruction. The two discordant groups were separated
by severity of obstruction and degree of eosinophilia. The fourth cluster
was made up predominantly of obese women with non-eosinophilic
severe asthma and high asthma control scores. Despite differences in
type of inflammation and symptom scores, the groups had similar
patterns of airway remodelling.
66 cluster analysis
Burgel et al. [2010]
This paper reports a cluster analysis of 322 subjects with COPD re-
cruited from French University hospitals. Four clusters were described
which roughly equate to:
Young, severe obstruction with a low Body Mass Index (BMI) and
poor quality of life
Older with mild disease
Younger with moderate to severe disease
Older with moderate to severe disease, a higher BMI, more co-
morbidities and more dyspnoea
Two important issues in this paper were the extent of missing data,
262 subjects were excluded due to missing data, and the PCA method
applied prior to cluster analysis. As stated earlier PCA generates
components made up of a combination of scaled original variables and
which each describe a proportion of the variability within the study
population. Eight components were generated from the eight variables
and the three which described the greatest proportion of the variability
within the dataset were used in the cluster analysis. The rationale
for this is that this approach leads to a greater separation between
clusters and can help with noisy datasets. However, although the
authors state that the other components did not describe a significant
amount of variability, the included components described only 61%
of the variability within the dataset. This potentially means that a
lot of the information within the data has been discarded and the
clean separation between clusters comes at the cost of a less complete

4.3 summary of cluster analyses 67
description of the data. Other papers in this systematic review apply
PCA or other forms of FA prior to cluster analysis but most include a
larger proportion of the variability in the cluster analysis.
Jo et al. [2010]
191 subjects 60 years or over with chronic respiratory symptoms,
obstruction, or bronchial hyperresponsiveness were included in this
analysis from Korea. All subjects were recruited in hospital outpatient
clinics. FA was used to select four variables from a potential 17 prior to
cluster analysis. Three clusters were described which differed accord-
ing to the severity of airflow obstruction and reversibility. One cluster
was characterised as having moderate to severe airflow obstruction
and substantial bronchodilator reversibility. This cluster bore some
resemblance to the overlap groups described by Wardlaw et al. [2005]
and Weatherall et al. [2009].
A novel aspect of this study was the selection of an exclusively
older population, who are relatively under-represented in other trials.
However there are questions over the generalisability of the results as
all subjects were from referral hospitals and none had symptoms of
chronic bronchitis, suggesting a skewed sample.
Cho et al. [2010]
Subject data drawn from the National Emphysema Treatment Trial
was used for this cluster analysis of 308 subjects [Cho et al., 2010].
FA was used to reduce 31 variables to four for cluster analysis,

68 cluster analysis
which generated four clusters with only modest separation. The major
limitation of this study is that NETT had a highly selected and therefore
relatively homogeneous population leaving little room for description
of different sub-types and meaning that generalisability is minimal.
Benton et al. [2010]
This study used a combined hierarchical/k-means approach to
explore phenotypes of asthma in African American people between
the ages of 6 and 20.
Three clusters were reported, males with neutrophilic asthma, fe-
males with ’later-onset asthma’ and elevated BMI normalised for age,
and a group with eosinophilic features. In addition a small fourth
cluster of subjects with minimal evidence of disease was excluded. It
is worth noting that in this context ’later-onset asthma’ means a mean
age of 7.5 years and would therefore still be considered young-onset
asthma in most studies.
Garcia-Aymerich et al. [2011]
Garcia-Aymerich et al. [2011] reported a cluster analysis on behalf of
the PAC-COPD Study Group. They collected detailed data on patients
presenting to hospital with a first exacerbation of COPD, including
measures of lung function, inflammation, exercise tolerance, atopy,
symptoms/quality of life and arterial blood gases. In addition a subset
underwent CT evaluation of lung density and bronchial wall thickness.
They propose phenotypes of "Severe respiratory COPD","Moderate
4.3 summary of cluster analyses 69
respiratory COPD" and "Systemic COPD". The authors suggest that their
proposed phenotype of systemic COPD may be consistent with the
hypothesis of the "chronic systemic inflammatory syndrome" [Fabbri
et al., 2009]. However, as the authors acknowledge, although this
group showed evidence of greater systemic inflammation they did not
demonstrate higher markers of bronchial inflammation. The greater
systemic inflammation may therefore be due to co-morbidities rather
than spill-over. Among the strengths of this study were its size
and the four year follow-up period, which allowed a description of
significant differences in patterns of hospital admission and mortality
between the groups. This prospective collection of admission and
mortality data helps in the determination of the clinical significance
of the groups described. The ’Severe respiratory COPD’ group had
more frequent hospitalisations due to COPD and a trend to increased
mortality, although this was not significant once disease severity was
adjusted for using the U-BODE index [Puhan et al., 2009]. What still
remains to be elucidated is whether differences between these groups
represent separate pathophysiological processes or merely describe
patients at different stages of disease with varying co-morbidities. A
notable feature in this analysis was the large number of variables used.
The authors used a total of 224 variables including measures of lung
function, blood gas results, CT appearance, quality of life and exercise
tolerance. The strength of this approach is that it minimises the effect
that a priori assumptions can have on variable selection. However,
many highly correlated variables will have been included, particularly

70 cluster analysis
within lung function, and this may serve to over-represent this aspect
of the disease in cluster separation [Weatherall et al., 2010].
Fitzpatrick et al. [2011]
This analysis draws from the SARP cohort previously reported by
Moore et al. [2010]. The original analysis was in adults whereas this
explores patterns of disease in children, who the authors report are
widely believed to show different patterns of disease. Data from 161
children were analysed with an agglomerative hierarchical approach.
Four clusters were described, differing mainly by age of onset, atopic
status and degree of obstruction. The identification of a sub-group with
early-onset asthma and atopy is a recurring theme in asthma cluster
analyses and provides some of the strongest evidence that this may
represent a true phenotype.
Siroux et al. [2011]
This paper reports by far the largest multi-variable cluster analyses
performed to date in respiratory medicine. Data from subjects with
asthma in the French Epidemiological Study on the Genetics and
Environment of Asthma (EGEA2, 641 subjects) and the pan-European
European Community Respiratory Health Survey (ECRHSII, 1,895
subjects) was used for Latent Class Analysis (LCA). The authors state
that among the strengths of LCA are the ability to handle missing data
and better performance in handling categorical variables. Each dataset
generated four classes, with early onset atopic and late onset non-atopic

4.3 summary of cluster analyses 71
groups present in both datasets. The remaining two classes in each
dataset were subjects with either no active disease or mild disease not
requiring treatment.
Mahut et al. [2011]
This single centre French study reports a retrospective post-hoc
analysis of 169 subjects from a secondary care cohort of 592 children
with asthma. The remainder were excluded due to a lack of bron-
chodilator response or missing data. The stated intention was to explore
the evidence for a particular phenotype associated with raised FeNO.
PCA followed by cluster analysis was performed as per Haldar et al.
Four clusters were described, two with milder disease, separated by
gender, and two with more severe disease, distinguished by parental
smoking and airway tone. The clusters did not differ significantly in
terms of FeNO, although raised FeNO was noted to be associated with
ICS dependant inflammation and increased airway tone. The complete
separation of clusters according to sex is surprising. Although there
are differences in incidence and severity of asthma between the sexes
[Postma et al., 2009] these are not marked enough to expect unisex
phenotypes. Indeed the clusters were virtually identical apart from sex.
Sex is a categorical variable and, because this separates individuals
more completely than a continuous variable, there is the potential for it
to dominate the cluster analysis. This highlights the degree to which
variable selection influences cluster assignment and that a distinct
cluster does not necessarily represent a meaningful phenotype.
72 cluster analysis
Musk et al. [2011]
In this paper Musk et al. [2011] report only the second cluster
analysis in a general population sample, based on data from the Bus-
selton cohort. This cluster analysis included a large number of adults
without signs and symptoms of respiratory disease, and reported seven
clusters, that differed by age, sex, BMI, atopic status, FeNO, BHR and
FEV1. The focus of the paper was comparing clusters to prior doctor’s
diagnosis of asthma or bronchitis. Prior diagnoses did not predict
cluster membership. The analysis described two ’normal’ clusters,
one of each sex. There were four ’atopic’ clusters characterised by
younger age, high FeNO, lower FEV1 and greater BHR respectively. The
other cluster was predominantly ’obese females’ and had the lowest
prevalence of doctor diagnosed asthma of the non ’normal’ clusters.
Interpretation of these clusters is hampered by the limited variety of
descriptor variables not included in the cluster analysis.
Bafadhel et al. [2011b]
One of several cluster analyses by the Leicester group, this paper
focuses on patterns of acute exacerbation and potential biomarkers
in a cohort of secondary care patients with COPD. 145 patients were
enrolled and a combined total of 182 exacerbations were recorded
from 82 patients. A wide panel of biomarkers was measured and FA
used to select the three variables which best represented bacterial-,
viral- and eosinophil- associated exacerbations respectively. Cluster
analysis of these three variables produced four groups, referred to as
4.3 summary of cluster analyses 73
bacterial-, viral- and eosinophil- associated respectively plus a fourth
cluster referred to as pauci-inflammatory. Subjects with bacterial and
eosinophil associated exacerbations were more likely to have bacterial
colonisation or raised eosinophils respectively at baseline. Whilst a
well-constructed paper which presented interesting data about the
performance of different biomarkers, the cluster analysis component
added little information. Only one aspect of disease, namely type
of inflammation, was examined and the 3 variables selected had
been shown by FA to be independent of one another. It could be
suggested that this is similar to performing a cluster analysis with
one categorical variable of inflammation type and categories of viral,
bacterial, eosinophilic or "none of the above". The risk is one of ’begging
the question’ in that the outcome is determined by the premise. The
main use of cluster analysis in this circumstance is that by determining
cluster allocation it allows the description of group characteristics.
Bafadhel et al. [2011a]
This paper reports a sub-analysis of subjects from the previous study
who had undergone a CT scan of the thorax as part of their standard
care. 64 patients were included in the cluster analysis, with variables
representing lung capacity, air trapping and gas transfer chosen by
PCA. Clusters were described which were deemed to represent two
groups of emphysema predominant disease and one with a mixture
of emphysema and bronchiectasis. The significance of these groups is
not clear.

74 cluster analysis
Sutherland et al. [2012]
The final paper in this systematic review is a retrospective cluster
analysis of 250 asthmatics with full data, from 826 asthmatics recruited
into two studies run through the Asthma Clinical Research Network.
The authors report four clusters, differentiated by BMI and asthma
symptoms. The two groups characterised by obesity differed in their
level of asthma control but were both predominantly female and had
higher biomarkers of systemic inflammation. The remaining clusters
were characterised as ’non-obese female asthmatics’ and ’non-obese
male asthmatics’ respectively.
4.4 emergent themes and candidate phenotypes
Cluster analysis methodology
It is clear from the above literature that there are several different
approaches which can be used in performing a cluster analysis and
no consensus as to the optimum methodology. Key decisions in a
cluster analysis include the choice of algorithm and distance metric,
as well as the type and number of different variables. Differences in
variable selection, dependence between variables, and other factors
have the potential to greatly affect the outcome of a cluster analysis
[Everitt et al., 2011; Fingleton et al., 2011; Weatherall et al., 2010]. As
cluster analysis is to an extent best viewed as a hypothesis generating
exercise [Everitt et al., 2011; Wardlaw et al., 2005; Weatherall et al.,
2010], the most appropriate approach may be to employ more than

4.4 emergent themes and candidate phenotypes 75
one methodology and compare the results obtained [Kaufman and
Rousseau, 1990] before selecting the solution which appears most
biologically and clinically coherent. The cluster analysis methodologies
employed in the NZRHS are detailed in section 8.3.
As highlighted in the systematic review, there are many different
cluster analysis methodologies. All seek to identify groups in the data
but they have differing strengths and weaknesses. Unless a dataset
was very highly structured, it is unlikely that identical clusters would
be described by different methodologies. Indeed some methods, such
as the k-means approach, start the clustering process from randomly
generated seed positions which means that running the k-means
algorithm on the same dataset twice may give two different cluster
structures unless the seed positions are determined non-randomly.
The key methodological decisions when undertaking a cluster anal-
ysis are the choice of algorithm, choice of distance measure, variable
selection, and determination of the number of clusters
choice of algorithm
The most commonly employed approaches in cluster analysis are
hierarchical cluster analysis, as described earlier, and k-means cluster
analysis.
Hierarchical cluster analysis creates a tree of connections between
all individuals in the dataset, in a similar way to phylogenetic trees
of different plant or animal species. This tree, which can be cut at any
level, is constructed such that members of a small cluster would also be
members of a larger cluster made up of several sub-clusters. This has

76 cluster analysis
the advantage that the number of clusters in a dataset does not need to
be determined a priori, but can be determined by examination of the
tree and comparison of the cluster characteristics. Hierarchical cluster
analysis can be generated by agglomerative or divisive methods, i. e.
the algorithm may start with n clusters each containing one individual
and then merge them progressively until only one cluster remains
(agglomerative), or the process can start with one cluster containing
all individuals and progressively divide the clusters until there are n
clusters each containing one individual (divisive) [Everitt et al., 2011;
Kaufman and Rousseau, 1990]. One potential weakness of hierarchical
cluster analysis relates to its structure. Later iterations of the procedure
are constrained by previous cluster assignments so if a point was
inappropriately assigned to a cluster early in the procedure, it cannot be
reassigned later on [Everitt et al., 2011; Kaufman and Rousseau, 1990].
K-means analysis requires the number of clusters to be set at the start
of the process. Centre points (centroids) are generated for each cluster,
either randomly or using the results of a previous cluster analysis.
The algorithm then assigns each individual to a cluster based on their
proximity to each centroid. The centroid is then recalculated using
the new points and the process repeated over multiple iterations to
estimate the optimal arrangement of clusters. K-means is an efficient
algorithm, which has made it popular for use on large datasets, and it
is not constrained by clustering decisions made in a previous iteration.
However, it is relatively sensitive to outliers and clustering results are
highly dependant on the starting position of cluster centroids and the
order of objects in the dataset [Kaufman and Rousseau, 1990].
4.4 emergent themes and candidate phenotypes 77
There are many other methods available for cluster analysis but
there is no consensus on which is optimal as each have their strengths
and weaknesses [Kaufman and Rousseau, 1990]. The majority of
cluster analyses in respiratory medicine have used one of the two
methods above, however there has been some interest in model-based
clustering methods such as latent class analysis, which use Bayesian
information criteria to assign individuals to the cluster for which
they have the highest probability of membership and can determine
the most appropriate number of clusters utilising pre-determined
criteria [Everitt, 2007; Therneau et al., 2012]. These methods can
accommodate missing data and have therefore been particularly widely
used in epidemiological studies examining patterns of disease in early
childhood [Chen et al., 2012; Henderson et al., 2008; Savenije et al., 2011;
Simpson et al., 2010; Spycher et al., 2008; van der Valk et al., 2012].
In the research discussed in this thesis the choice of methodology was
influenced by the previously published work of Weatherall et al. [2009].
One of the aims of this research was to investigate whether the same
candidate phenotypes as previously described would be identified in a
second random population sample. Accordingly it was felt appropriate
to use similar methodology to that used in the Wellington Respiratory
Survey (WRS) and hierarchical cluster analysis is used in this thesis.
choice of distance measure
The most widely used distance measure is the euclidean distance
measure [Everitt et al., 2011], which has been previously discussed.
However in some circumstances other distance metrics are required.
78 cluster analysis
The most common situation in which the euclidean distance measure
is inappropriate is when the variables to be used for cluster analysis
are a mixture of continuous and categorical variables. In this situation
the Gower distance measure is an appropriate choice as it remains
meaningful with mixed variable types [Everitt, 2007; Gower, 1971].
Once a distance measure has been chosen the method of application
must be decided. When the distance between clusters is calculated
in a hierarchical analysis the distance measured can be between
the two nearest individuals in the different clusters (single-linkage),
the two furthest apart individuals (complete-linkage), or an average
of all the possible distances between individuals in the different
clusters (un-weighted average pair group method) [Everitt et al., 2011;
Kaufman and Rousseau, 1990]. The latter option is widely used as
it performs relatively well in datasets with a significant amount of
random variation, ’or noise’, as does an alternative approach, Ward’s
method [Ward, 1963]. Ward’s method aims to minimise ’information
loss’ at each cluster fusion and hence maximise the similarity of
individuals in a cluster [Everitt et al., 2011]. Both average group and
Ward’s methods are utilised in this research.
variable selection
Variable selection is of key importance in cluster analysis as it can
greatly affect the outcome. Ideally all variables should be informative
and contribute to the separation between clusters. This is because the
inclusion of variables which are not related to the underlying structure
of the data will appear as ’noise’ in the analysis, making it harder to

4.4 emergent themes and candidate phenotypes 79
determine the true sub-types. Conversely it is important not to include
too many highly related variables in the data, as this multicollinearity
will mean that this aspect of disease dominates the analysis, separating
clusters predominantly or only on these measures [Everitt et al., 2011;
Weatherall et al., 2010].
The literature reviewed here covers a wide variety of approaches,
with cluster analyses using between 4 and 224 variables, or as few as
3 composite variables generated by PCA. This last approach, although
widespread, has been challenged on the grounds that if clusters are
separated using a composite variable generated through PCA or FA
it is more difficult to interpret the clinical meaning of the resultant
groups [Weatherall et al., 2010]. In addition the composite variables
will only represent a portion of the original variability in the data
so a considerable amount of information is lost with this approach.
For example, Burgel et al. [2010] generated 8 components from 8
variables and selected 3 components for the cluster analysis. As a result
the data used for cluster analysis only described 61% of the original
variability in the dataset. Other than as part of a PCA, variables used
in a cluster analysis would not normally be weighted according to
perceived importance, as this would introduce bias according to a priori
assumptions.
The approach used in this thesis was to select a modest number of
variables for which there is evidence that they represent important
components of airways disease. Multi-collinearity was minimised by
not selecting a large number of variables representing a particular
80 cluster analysis
aspect of disease. Correlations between the selected variables were
assessed as part of the analysis (chapter 10).
Choosing the number of clusters
With any form of cluster analysis a decision must be made as to the
number of clusters to be created. With hierarchical cluster analysis it
is possible to output a solution of all possibilities and then examine
the dendrogram to determine a sensible point at which to cut the tree,
whereas with non-hierarchical methods the number of clusters must
be specified at the start of the analysis. Some investigators will use
a hierarchical cluster analysis to suggest an appropriate number of
clusters for a non-hierarchical methodology.
Within hierarchical cluster analysis, the decision on the number of
clusters (k) may be based on a priori expectations or on examination of
the size and characteristics of the clusters described for different values
of k. In order to increase the objectivity of this decision, a number of
metrics have been suggested to assess the most appropriate value for k.
Two of the most widely accepted are used in this research- the Average
Silhouette Width (ASW) and the gap statistic.
The ASW was proposed by Kaufman and Rousseau [1990] and is a
measure the amount of inherent structure in a dataset. The range is
from -1 to +1, where values greater than zero imply that individuals
are more likely than not to be in the correct clusters. The higher the
ASW, the more natural structure is likely to be present in the dataset.
However, if groups are closely related or overlapping a high ASW is
unlikely. The ASW for different values of k can be compared, and
4.4 emergent themes and candidate phenotypes 81
when an increase in k causes the ASW to drop rapidly it may not be
appropriate to increase the number of clusters further [Everitt et al.,
2011; Kaufman and Rousseau, 1990].
The gap statistic was described by Tibshirani et al. [2001] as a means
of formalising the widely used method of choosing the number of
clusters by examining a graph of within cluster dispersion, i.e. how
tightly clustered the individuals are, against number of clusters (k).
Tibshirani et al. [2001] argue that the gap statistic outperforms other
measures such as ASW in many cases, although it is best to use more
than one method to determine the number of clusters [Everitt et al.,
2011]. Unlike ASW, the gap statistic is meaningful for data with one
cluster. If the gap statistic is maximal for k=1 there may not be any
clustering within the dataset.
Candidate Phenotypes and outstanding research questions
The cluster analyses outlined in this literature review provide sup-
port for several candidate phenotypes of OAD and suggest some new
possibilities. Of particular interest in both asthma and COPD is the
increasing appreciation of the existence and importance of the overlap
group discussed in section 2.5 [Jo et al., 2010; Wardlaw et al., 2005;
Weatherall et al., 2009].
Within asthma one novel phenotype which has emerged from the
cluster analyses is that of the obese, symptom predominant, individual
[Benton et al., 2010; Haldar et al., 2009; Moore et al., 2010; Musk
et al., 2011; Sutherland et al., 2012]. Within COPD the majority of
phenotypes described fit with previously suggested patterns, splitting

82 cluster analysis
patients according to the relative extent of chronic bronchitis and
emphysema or the severity of airways obstruction. However two
interesting candidate phenotypes have been described. Burgel et al.
[2010] reported a symptom predominant group with obesity and
multiple comorbidities that may be the COPD equivalent of the obese
asthmatic group. Garcia-Aymerich et al. [2011] also described a group
with multiple comorbidities, which they characterised as "Systemic
COPD", and which was associated with worse outcomes. This group
differed from other co-morbidity associated groups in having a low
BMI, possibly due to the severity of their COPD. It is not yet clear
whether individuals in this group have worse outcomes because the
COPD related inflammation is driving systemic inflammation, systemic
inflammation is driving the COPD, both are driven by other factors such
as cigarette smoke exposure, or if these are simply individuals with two
common but unrelated pathologies [Fingleton et al., 2011]. Irrespective
of whether the pulmonary and systemic inflammation is closely related,
these individuals appear to suffer much higher morbidity and, if
reproduced in other studies with longitudinal follow-up, this would
fulfil the definition of a clinical phenotype proposed by Han et al.
[2010].
In order for these candidate phenotypes to become accepted and
clinically useful they need to be fully validated. The requirements for
validation of a phenotype would include:
1. Replication in more than one study.
2. Demonstration of a differential response to treatment.

4.4 emergent themes and candidate phenotypes 83
3. Description and validation of allocation rules that allow patients
to be reliably matched to the most appropriate phenotype.
4. Longitudinal follow-up with assessment of phenotype stability,
natural history and demonstration of differential outcome be-
tween phenotypes.
The New Zealand Respiratory Health Survey was designed to
address the first three points. The rationale, design and methods of
the NZRHS are described in Part II.

Part II
T H E N E W Z E A L A N D R E S P I R AT O RY
H E A LT H S U RV E Y: R AT I O N A L E , D E S I G N
A N D M E T H O D S

5R AT I O N A L E A N D R E S E A R C H A I M S
The literature on which this PhD aims to build has been summarised
in Part I. In particular I wish to develop the work of Weatherall et al.
[2009] and assess whether the candidate phenotypes described in the
Wellington Respiratory Survey are reproducible in a new population
sample. A new study, known as the New Zealand Respiratory Health
Survey, was designed to address the following aims.
5.1 main aims
To explore clinical phenotypes of chronic airways disease by
cluster analysis.
To examine if phenotypes identified by the previous cluster
analysis exist in the independent NZRHS sample
To compare the response to short-acting beta-agonist (SABA)
between phenotype groups.
To compare the response to short-acting muscarinic antagonist
(SAMA) between phenotype groups.
To compare the response to ICS between phenotype groups.
To generate allocation rules and determine their predictive value
for the different disorders of airways disease.
87

88 rationale and research aims
5.2 hypotheses
1. That cluster analysis will identify distinct clinical phenotypes
within the population tested, which will differ significantly in the
characteristics they express.
2. That the clusters identified in the NZRHS will approximate to
clusters described by the WRS.
3. That the response to salbutamol, as measured by change in FEV1,
will differ between clusters.
4. That the response to ipratropium, as measured by change in FEV1,
will differ between clusters.
5. That it will be possible to generate an allocation rule which can
accurately predict cluster membership, using only a subset of the
variables.
6. That the response to the ICS budesonide will differ between
clusters.
6D E S I G N
The NZRHS was made up of three phases:
Phase One: Sample recruitment
Phase Two: Data collection for phenotyping
Phase Three: Trial of ICS
Precise details of the methodology is given in chapter 7, the phases are
outlined below.
6.1 phase one- sample recruitment
The aim of the NZRHS was to describe potential phenotypes in a
population of subjects with obstructive airways disease. In order for
the results to be widely generalisable, the subjects were taken from
a general population sample. The most complete list of the general
adult population available in NZ comes from the electoral roll and a
random sample drawn from this was therefore used to generate a list
of potential subjects.
Subjects were sent a one page letter inviting them to complete a brief
questionnaire, which was printed on the reverse. Subjects with self-
reported wheeze and breathlessness in the past year were eligible to
take part in phase two. Eligible subjects were contacted by telephone
and recruited to the study.
89

90 design
6.2 phase two- clinical phenotyping
In phase two, eligible subjects who agreed to take part in the study
attended for two visits and data were collected to allow detailed
description of their clinical phenotype. In order to represent multiple
aspects of airways disease, information was collected on medical
history, symptoms, lung function and bronchodilator responsiveness
as well as markers of inflammation and atopy.
Once clinical testing was complete, a cluster analysis was performed
to describe potential phenotypes within the population.
6.3 phase three- corticosteroid responsiveness
In order for phenotypes described by cluster analysis to be clinically
relevant there should be differences in the underlying pathophysiology
or response to treatment [Han et al., 2010]. Therefore, in order to try
and validate phenotypes described by the cluster analysis, all steroid
naïve subjects were invited to take ICS for 12 weeks followed by
repeat testing to assess response to treatment and allow comparisons
of treatment response between candidate phenotypes.
In order to minimise bias in this open label study, the cluster analysis
was not performed until phase three was complete. This ensured both
subjects and investigators were blind to cluster allocation at the time of
testing.
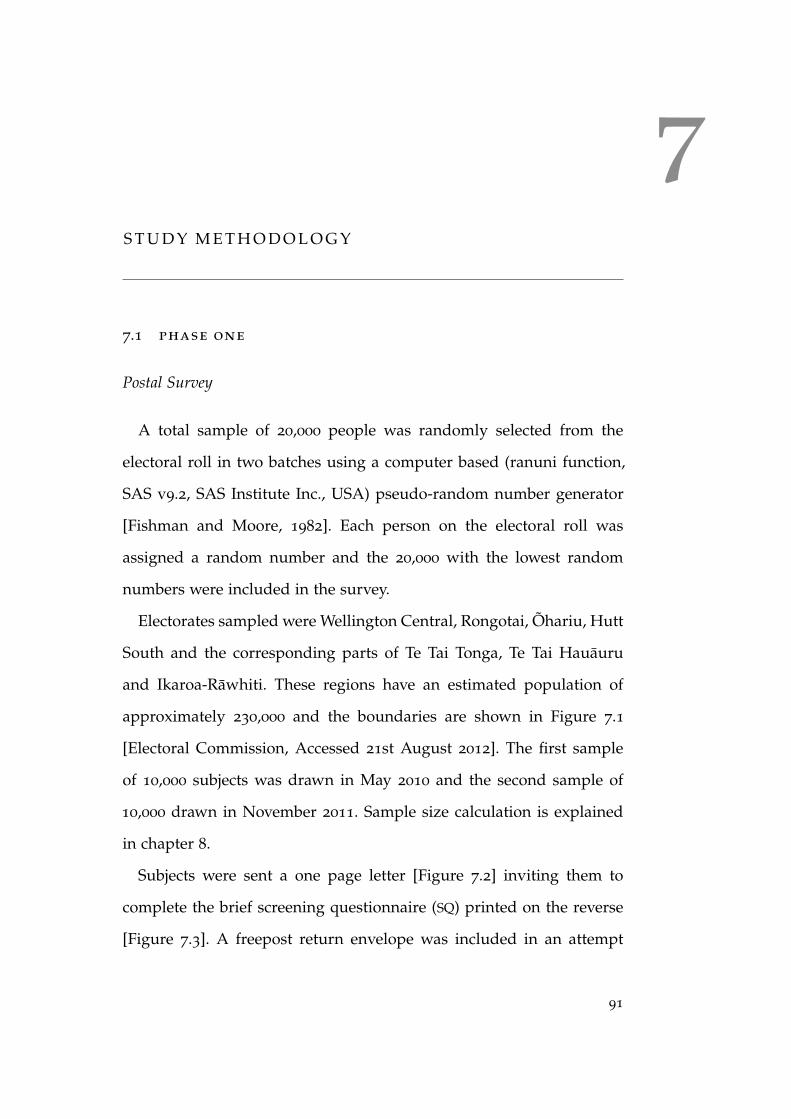
7S T U D Y M E T H O D O L O G Y
7.1 phase one
Postal Survey
A total sample of 20,000 people was randomly selected from the
electoral roll in two batches using a computer based (ranuni function,
SAS v9.2, SAS Institute Inc., USA) pseudo-random number generator
[Fishman and Moore, 1982]. Each person on the electoral roll was
assigned a random number and the 20,000 with the lowest random
numbers were included in the survey.
Electorates sampled were Wellington Central, Rongotai, Õhariu, Hutt
South and the corresponding parts of Te Tai Tonga, Te Tai Hauauru
and Ikaroa-Rawhiti. These regions have an estimated population of
approximately 230,000 and the boundaries are shown in Figure 7.1
[Electoral Commission, Accessed 21st August 2012]. The first sample
of 10,000 subjects was drawn in May 2010 and the second sample of
10,000 drawn in November 2011. Sample size calculation is explained
in chapter 8.
Subjects were sent a one page letter [Figure 7.2] inviting them to
complete the brief screening questionnaire (SQ) printed on the reverse
[Figure 7.3]. A freepost return envelope was included in an attempt
91

92 study methodology
to increase questionnaire return rate. Subjects could alternatively
complete the questionnaire by going to http://www.mrinz.ac.nz/
survey and entering the personal number given in the invitation letter.
Subjects who answered yes to questions 1 and 1b were eligible
to take part in phase two. Eligible subjects who supplied contact
details (predominantly telephone numbers) were contacted and offered
information on the study. Interested subjects were booked to attend
and sent a ’Participant Information Sheet’ [Appendix B] as well as
’Important Information for Study Participants’ [Figure 7.4] which they
had the opportunity to read and discuss with family and whanau prior
to attending. If no response was received, repeat letters were sent on
two occasions at approximately 2 monthly intervals. If no response
was received after two reminders a telephone call was made, provided
the subject had a publicly listed number associated with the registered
address. Subjects were able to opt out of further contact at any point.
Construction of Study Number
In order to allow online survey returns each potential subject was
allocated a unique identifer, referred to as their ’Personal Number’.
This was an alpha-numeric code in the form A1111. In order to reduce
the risk of hoax online returns being treated as genuine returns, only
every seventh possible code was used, e.g. A1001, A1008,. . . , B1001,
B1008,. . . and the structure of personal numbers was not described on
the website. The letters I and O can be confused with the numbers 1
and 0 and were omitted from the sequence.

7.1 phase one 93
(a)
Wel
lingt
onC
entr
al(b
)R
ongo
tai
(c)
Õha
riu
(d)
Hut
tSo
uth
Figu
re7.1
:Map
ofEl
ecto
rate
Boun
dari
es

94 study methodology
The second sample was unlikely to be entirely utilised. Therefore, in
order to ensure that certain surnames were not preferentially sampled,
which might constitute a bias, the code numbers for the second sample
were allocated in the order Q1002, R1002,. . . T1002, Q1009, R1009,. . .
This ensured an even alphabetical spread within each wave.
Electoral Roll sample processing
The electoral roll sample was reviewed and entries with non-Wellington
postal addresses were removed. Entries were then allocated a unique
code number as above. Finally, Foreign Office postal addresses were
also removed as these represented workers on overseas postings who
were not currently resident in Wellington.
To control the rate of postal returns and minimise delays between
SQ return and recruitment, mail-outs were done in waves. Waves were
defined by the letter at the beginning of their code (wave A, wave B etc.).
As removal of foreign office addresses was done after allocation of code
numbers, each wave varied slightly in size, although each contained
approximately 1,200 subjects.
Mail-outs continued until sufficient responses had been received to
be confident of reaching the recruitment target. The full sample of
20,000 was not used as this would lead to more returns from eligible
participants than required, and hence the proportion of eligible subjects
tested in Phase 2 would be lower, reducing the generalisability of Phase
2 results.

7.2 phase two 95
Figure 7.2: NZRHS Invitation Letter

96 study methodology
Protocol No. NZRHS01 Letter of Invitation Version 4.6, 28th September 2010 (side 2 of 2)
NZRHS Screening Questionnaire
[Personal Number]
TO ANSWER THE QUESTIONS PLEASE CHOOSE THE APPROPRIATE BOX.
IF YOU ARE UNSURE OF THE ANSWER, PLEASE CHOOSE "NO".
No
Yes
1. Have you had any wheezing or whistling in your chest at any time in the last 12 months?
If “Yes”, go to Question 1B, if “No”, go to Question 2:
No
Yes
1B. Have you been at all breathless when the wheezing noise was present?
No
Yes
2. Do you usually cough when you don't have a cold?
If "Yes", go to Question 2B; if "No", go to Question 3: No
Yes
2B. Do you cough on most days for as much as 3 months each year?
No
Yes
3. Do you usually bring up phlegm from your chest first thing in the morning?
If "Yes", go to Question 3B; if "No", go to Question 4: No Yes
3B. Do you bring up phlegm like this on most days for as much as 3 months each year?
No
Yes
4. Do you ever have trouble with your breathing?
No
Yes
5. Has a doctor ever told you that you had chronic bronchitis?
No
Yes
6. Has a doctor ever told you that you had emphysema?
No
Yes
7. Has a doctor ever told you that you had asthma?
No
Yes
8. Do you now smoke cigarettes, or a pipe or cigars?
If "Yes", go to Question 9; if "No", go to Question 8B:
No
Yes
8B. If not, have you ever smoked?
If "Yes", go to Question 9; if "No", go to Question 10:
Years
9. How many years have you smoked on a regular basis?
Day
Month
Year
10. What is your date of birth?
M
F
11 Are you male or female?
We may wish to contact some respondents with information about the second phase of the study. If you would
be prepared for us to contact you, please provide your telephone number below. If you do not wish to be
contacted please write “no contact”:
Day..................................................... Evening......................................................
THANK YOU FOR YOUR HELP
Figure 7.3: NZRHS Screening Questionnaire
7.2 phase two 97
7.2 phase two
Eligibility and Consent
Subjects were consented at visit 1 and their eligibility confirmed
according to the inclusion and exclusion criteria. Inclusion criteria were
assessed using the subject’s SQ and were not checked as part of the
consent process. The exception was in the event of a subject stating
they did not think they should be eligible for the trial, or the SQ having
been completed more than 6 months previously, in which case the
investigator checked whether their answer to the two questions was
still yes. If not the subject would be excluded from further testing at
that point. Exclusion criteria were sought at visit 1.
inclusion criteria :
Randomly selected from electoral register
Aged 18-75 years at the time of visit 1
Indicated an affirmative answer to the following question on the
screening questionnaire: “Have you had wheezing or whistling
in your chest at any time in the last 12 months?” and if yes “have
you been at all breathless when the wheezing noise was present?”
exclusion criteria :
Unable to provide informed consent
Unable or unwilling to comply with study procedures including
withholding of medication prior to pulmonary function testing
Known hypersensitivity to salbutamol, ipratropium or inhaled
corticosteroid medication

98 study methodology
A respiratory diagnosis other than asthma or COPD which may
influence the validity of study measurements, e.g: pulmonary
fibrosis
A non-respiratory diagnosis which is likely to render pulmonary
function test results inaccurate, e. g. severe heart failure.
Visit Schedule
If the subject did not meet any criteria for deferral (see Pulmonary
Function Tests), visits 1 and 1b were combined. The testing carried out
at each visit is summarised in Table 7.1
7.3 details of testing
Pulmonary Function Tests
Subjects involved in phase two attended for lung function testing on
two occasions, visit 1b and visit 2. All subjects were asked to follow the
’Important Information for Study Participants’ [Figure 7.4]. Deviations
from this guidance were noted at the time of testing.
Testing was deferred if the subject had suffered a chest infection
or upper respiratory tract infection in the last 3 weeks. Infections
were self-reported by the subject but to help standardise interpretation
definitions of chest infection and Upper Respiratory Tract Infection
(URTI) were constructed [Appendix A]. Testing was also deferred if
the subject had taken a SABA or SAMA in the last 4 hours, or a LABA
or LAMA in the last 12 hours. Other deviations from the ’Important

7.3 details of testing 99
Table 7.1: Schedule for Clinical Testing
phase 1 phase 2 phase 3‡
visit
1
visit
1b†visit 2 visit 3
Screening Questionnaire XInformed consent XConfirm eligibility XMain questionnaire XPre-ipratropium PFTs X XPost-ipratropium PFTs X XPeak flow diary issued X XPeak flow diary collected X XQoL Questionnaires X XFeNO measurement X XPre-salbutamol PFTs X XBloods X XPost-salbutamol PFTs X XTransfer factor XICS dispensed XExacerbation history X XAdherence check XAdverse Events check X
†If subject had not had bronchodilators pre-visit, visits 1 & 1B are combined.‡For steroid-naïve participants onlyPulmonary Function Test include resistance, lung volumes and spirometry.
Information for Study Participants’ were recorded by the investigator
without deferral of testing.
Participants performed pulmonary function tests pre- and post-
bronchodilator at visits 1 and 2 and, if continuing in the study, at visit 3.
Lung function testing was performed using three whole body constant-
volume plethysmographs with heated pneumotachograph and gas
analysers (Masterlab 4.66 and 5.31, Erich-Jaeger, Würzburg, Germany)
in accordance with the guidelines outlined by the American Thoracic
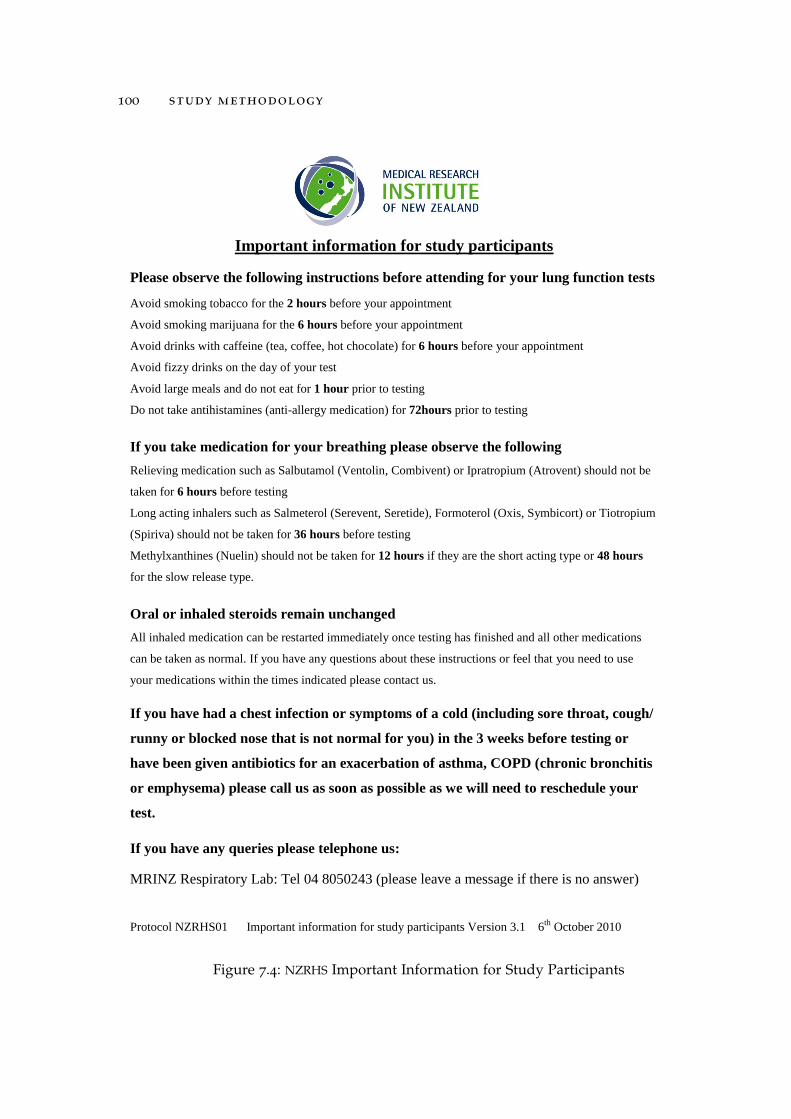
100 study methodology
Protocol NZRHS01 Important information for study participants Version 3.1 6th
October 2010
Important information for study participants
Please observe the following instructions before attending for your lung function tests
Avoid smoking tobacco for the 2 hours before your appointment
Avoid smoking marijuana for the 6 hours before your appointment
Avoid drinks with caffeine (tea, coffee, hot chocolate) for 6 hours before your appointment
Avoid fizzy drinks on the day of your test
Avoid large meals and do not eat for 1 hour prior to testing
Do not take antihistamines (anti-allergy medication) for 72hours prior to testing
If you take medication for your breathing please observe the following
Relieving medication such as Salbutamol (Ventolin, Combivent) or Ipratropium (Atrovent) should not be
taken for 6 hours before testing
Long acting inhalers such as Salmeterol (Serevent, Seretide), Formoterol (Oxis, Symbicort) or Tiotropium
(Spiriva) should not be taken for 36 hours before testing
Methylxanthines (Nuelin) should not be taken for 12 hours if they are the short acting type or 48 hours
for the slow release type.
Oral or inhaled steroids remain unchanged
All inhaled medication can be restarted immediately once testing has finished and all other medications
can be taken as normal. If you have any questions about these instructions or feel that you need to use
your medications within the times indicated please contact us.
If you have had a chest infection or symptoms of a cold (including sore throat, cough/
runny or blocked nose that is not normal for you) in the 3 weeks before testing or
have been given antibiotics for an exacerbation of asthma, COPD (chronic bronchitis
or emphysema) please call us as soon as possible as we will need to reschedule your
test.
If you have any queries please telephone us:
MRINZ Respiratory Lab: Tel 04 8050243 (please leave a message if there is no answer)
Figure 7.4: NZRHS Important Information for Study Participants

7.3 details of testing 101
Society. Local NZ reference ranges derived by Marsh et al. [2006] were
used. These reference ranges include predicted values for transfer
factor and are a more accurate description of the local population than
more widely used reference ranges [Fingleton et al., 2013c]. Subjects
were tested using the same equipment, and in the majority of cases the
same operator, at each visit to minimise variation. Height and weight
were recorded, with shoes and outdoor clothing removed, to allow
calculation of predicted values. Two identical scales were used in the
study, both of which gave the same weight for a biological control when
measured on each scale within one hour. Scale consistency was checked
periodically throughout the study.
Test Sequence
For all visits the test sequence for PFTs was to measure airway conduc-
tance and resistance, followed by lung volumes by body plethysmogra-
phy and finally spirometry with flow volume loops. Transfer factor was
measured post- salbutamol at visit two, and expressed as transfer factor
adjusted for lung volumes and corrected for haemoglobin (kCOcorr).
Visit specific testing was as follows.
Visit 1b:
Height and weight
Pre-bronchodilator PFTs
Administration of ipratropium followed by 30 minute wait
Main questionnaire administered during wait, assuming visit 1
and 1b were combined

102 study methodology
Peak Expiratory Flow Rate (PEFR) diary and meter given and use
explained
Post-bronchodilator PFTs
Visit 2:
Asthma Control Questionnaire (ACQ-7)
PEFR diary and meter collected and checked
FeNO measurement
Pre-bronchodilator PFTs
Administration of salbutamol followed by 30 minute wait
Saint George’s Respiratory Questionnaire (SGRQ)
Blood Samples taken
Post-bronchodilator PFTs
Transfer Factor
Dispense ICS and check technique
Collect exacerbation history
Visit 3:
ACQ-7
PEFR diary and meter collected and checked
Collect ICS and check compliance
Collect adverse event and exacerbation history
FeNO measurement
Pre-bronchodilator PFTs
Administration of salbutamol, followed by 30 minute wait
SGRQ
Post-bronchodilator PFTs

7.3 details of testing 103
Shaded items performed as part of Phase 3 only.
General guidelines
All tests were performed with subjects sitting, with nose clips on and
using a rubber mouthpiece without teeth grips. The tests were clearly
explained to the subject before starting and positive encouragement
was given at all stages of the test.
Equipment was calibrated daily prior to testing and biological
controls were performed periodically on each machine. Same day lung
function testing of a biological control in all three machines in sequence
gave comparable results.
Quality of life Questionnaires
The questionnaires selected for use in the study were the Saint
George’s Respiratory Questionnaire (SGRQ) and the Asthma Control
Questionnaire (ACQ-7).
The SGRQ is a well validated health status questionnaire focusing on
the impact of respiratory symptoms, and is available in NZ English
[Jones, 2009, 2005; Jones et al., 1991, 1992]. The SGRQ was primarily
included for use as a cluster analysis variable but was also used as a
secondary outcome measure for the ICS responsiveness trial.
The ACQ-7 questionnaire is a well validated measure of control in
asthma [Juniper et al., 1999, 2005]. It is sensitive to change and widely
used as an outcome measure in asthma trials, accordingly this was
selected as the primary outcome measure for Phase 3.

104 study methodology
Bronchodilator Reversibility
Bronchodilator reversibility was performed in all subjects in accor-
dance with British Thoracic Society guidelines. Each subject received
80mcg of ipratropium via a spacer at visit 1B and 400mcg of salbutamol
via a spacer at visits 2 and 3.
The procedure for bronchodilator administration was as follows. The
subject exhaled to Functional Residual Capacity (FRC) and placed their
lips around the spacer (Volumatic, GSK, Brentford, UK). The Metered
Dose Inhaler (MDI) was then shaken, placed into the end of the spacer
and fired once. The subjects then inhaled slowly and deeply and
held their breath for 10–15 seconds. This procedure was followed a
total of four times. Post-bronchodilator pulmonary function tests were
performed 30 minutes after the administration of the bronchodilator to
allow for the slower onset of action of ipratropium [Gross, 1975].
Acceptability and reproducibility criteria
Criteria for technically unsatisfactory tests:
Coughing during procedure
Glottis closure during procedure
Obstructed mouthpiece e.g. tongue in front of the mouthpiece
A leak in the system or around the mouthpiece
Excessive hesitation at the start of expiration
Early termination of test by subject
Criteria for poor compliance:
Greater than 5% variation in FEV1 between attempts

7.3 details of testing 105
Expiratory time of less than 6 seconds
Peak expiratory flow of less than 85% of the best recorded
Testing was continued until 3 acceptable manoeuvres were com-
pleted or the subject had performed 9 manoeuvres.
In line with ATS guidelines, subjects who were unable to produce
reproducible flow volume loops (<200mls difference or 5% variation
in FEV1 and FVC) were not excluded from analysis. In subjects who
were not able to produce 3 acceptable flow volume loops comments
regarding the technical acceptability of their testing were made. Prior
to analysis all lung function data were reviewed to ensure technically
inadequate data were excluded. Details of plethysmography settings
are given in Appendix D
Main Questionnaire
The main respiratory questionnaire (Appendix C) was administered
at the first study visit only. Questions in the main respiratory question-
naire were taken from the WRS and European Community Respiratory
Survey. Interview guidelines for the questionnaire were provided to
interviewers to ensure consistency in the method of administration, and
are included in the appendix.
Exhaled Nitric Oxide
FeNO was measured by chemoluminescence using an online nitric
oxide monitor (NIOX; Aerocrine AB, Solna, Sweden), according to the
guidelines from the American Thoracic Society [2005].

106 study methodology
Seated subjects exhaled fully, inhaled ambient air through a nitric
oxide scrubber to total lung capacity, and then exhaled against an
automatically adjusting resistance to achieve a constant exhalation
flow rate of 50ml/s. Resistance was adjusted so that an upper airway
pressure of at least 5cm H2O was maintained throughout exhalation,
sufficient to close the velum and exclude nasal air. FeNO measurements
were taken from a stable plateau exhaled nitric oxide concentration of
at least 3 seconds duration. Exhalations where flow rate and plateau
criteria were not met were deemed not acceptable for measurement.
Repeated exhalations were performed a maximum of six times to
obtain three acceptable measurements that agreed within 10%. The
average of these three measurements was used.
The nitric oxide monitor was calibrated every 14 days or if the room
temperature changed by more than 5◦C. Measurements were made
before other pulmonary function testing.
Blood Tests
Blood samples were drawn at visit two. The serum total IgE and high
sensitivity C-Reactive Protein (hsCRP) were measured using a Roche
Modular analyser (Roche, Basle, Switzerland). Blood haemoglobin and
eosinophil levels were measured using the SYSMEX XE2100 automated
CBC analyser (Mundelein, Illinois, USA). Serum Phadiatop R©, a com-
posite test for a panel of specific IgEs with a positive result signifying
atopy, was measured using the Thermo Fisher Scientific, ImmunoCAP
platform (Phadia, Uppsala, Sweden).

7.4 phase three 107
7.4 phase three
All subjects who were steroid naïve at the time of testing were eligible
to take part in Phase 3. Those who agreed to take part commenced a 12
week trial of ICS after visit two.
Subjects were given budesonide turbuhaler 400mcg twice daily and
were taught correct inhaler technique at the end of visit two. During
the final week of the ICS trial subjects completed a second peak flow
diary, which they brought with them to visit three.
Subjects received a phone call at six and 11 weeks into the ICS trial, to
encourage adherence to study medication and to remind them to start
their peak flow diaries respectively.
In the original protocol and ethics application, ’steroid naïve’ was
defined as no inhaled or oral steroid in the previous 12 months. During
the study it became apparent that there was a significant minority of
subjects who had used ICS occasionally in the last 12 months but who
had not used it in the last 3 months. As the purpose of phase three was
to examine ICS responsiveness it was not felt appropriate to exclude
these subjects from phase 3. Accordingly, an amendment was made
to define eligibility for Phase 3 as “No oral or inhaled steroids in the
last 90 days”. The amendment was approved by the ethics committee
on the 30thAugust 2011. 145 subjects completed visit two prior to this
amendment, of whom 81 were deemed not eligible for Phase 3. It is
likely that a small proportion of those deemed not eligible for Phase 3
would have been eligible under the new definition.

108 study methodology
When subjects attended for visit 3, peak flow diary sheets were
collected and checked for completeness. ICS study medication inhalers
were returned and checked. Information was sought regarding ex-
acerbations, adverse events and subjective adherence to medication.
Thereafter, testing was identical to visit 2 with the exception that
transfer factor and bloods were not repeated.
7.5 study data management
Study data for individual subjects was stored in a subject file and
later entered into a custom made Access database, used to store
data generated during testing. All test data was double-entered into
duplicate databases, which were reconciled prior to statistical analysis.

8S TAT I S T I C A L M E T H O D O L O G Y
8.1 main nzrhs analysis objectives
Phase One
To describe the demographics and symptom burden of the
population from which the participants in the NZRHS were
recruited.
Phase Two
To explore clinical phenotypes of chronic airways disease by
cluster analysis.
To examine if phenotypes identified by the previous cluster
analysis exist in the independent NZRHS sample.
To compare the response to salbutamol between phenotype
groups.
To compare the response to ipratropium bromide between
phenotype groups.
To generate allocation rules and determine their predictive
value for the different disorders of airways disease.
Phase Three
To compare the response to ICS between phenotype groups.
109

110 statistical methodology
8.2 phase one
The response rate to the mailout was reported with a breakdown by
wave. Completed questionnaire data was summarised to characterise
the population from which the sample was drawn, and compare
eligible respondents who did not take part in Phase 2 with those who
did .
8.3 phase two
Summary data
Research participants were described by summary statistics and plots
of personal, pulmonary function, and clinical disease characteristics.
Primary Cluster Analysis
variable selection
The 13 variables selected for cluster analysis are shown in Table 8.1.
Selected variables differ slightly from those used in the previous WRS.
In order to reduce the risk of one variable dominating the analysis, the
categorical cough variable was removed. Five additional variables were
added to try and describe more of the complexity of disease:
1. Peak flow variability
2. Quality of life
3. Age at onset of respiratory symptoms
4. BMI
5. hsCRP

8.3 phase two 111
Table 8.1: Primary cluster analysis variables
variable
Pre-bronchodilator FEV1/FVC ratio (%)Pre-bronchodilator FEV1 (% predicted)Change in FEV1 post-salbutamol from baseline (%)kCOcorr (% predicted)FRC(% predicted)Natural logarithm of the serum IgE concentrationMean FeNO
Pack years of tobacco consumptionPeak flow variability (amp. % mean)Quality of life (as measured by SGRQ score)Age at onset of respiratory symptomsBMI
hsCRP
(%) Expressed as a percentage(% predicted) Expressed as percentage of predicted normal(amp. % mean) Expressed as amplitude as a percentage of the mean
A second measure of disease variability, peak flow variability (calcu-
lated as amplitude as a percentage of the mean over one week), was
added in recognition of the limited value of a single measurement
of bronchodilator reversibility [Fingleton et al., 2012]. SGRQ score was
added as a measure of health status / Quality of Life (QoL). QoL
is a very important component of the patient experience of disease,
and therefore phenotypes which differed in QoL may be clinically
important.
Age of onset of respiratory disease has been suggested to define
important phenotypes [Wenzel, 2006] and was therefore added. As age
of onset is potentially vunerable to recall bias the youngest age given
in response to the following three questions was used:

112 statistical methodology
How old were you when you first experienced shortness of breath
with wheezing? (If participant had answered yes to ’Have you
ever had wheezing or whistling in your chest when breathing?’)
How old were you when you first noticed this trouble? (If
participant had answered yes to ’Do you ever have trouble with
your breathing?’)
How old were you when you had your first attack of asthma? (If
participant had answered yes to ’Did a doctor ever tell you that
you that you had asthma?’)
BMI is a potentially important descriptor in relation to the obese,
symptom predominant, candidate phenotype [Haldar et al., 2008].
hsCRP was added as a measure of systemic inflammation.
algorithm
Cluster analysis was performed using all subjects with complete
data for the 13 selected variables. As this study builds on the WRS,
the methodology used was similar to that reported by Weatherall
et al. [2009]. Hierarchical cluster analysis was applied, with both
agglomerative (‘Agnes’) and divisive (‘Diana’) algorithms contained
within the open-source R statistical software package ‘Cluster’ (R
version 2.15.2, R statistical software, Auckland, NZ).
distance measure
The previous analysis by Weatherall et al. [2009] utilised the Gower
distance measure as this is meaningful in the context of categorical and
continuous measures. This was replicated in the current analysis but,
as the variables in the NZRHS are all continuous, the cluster analyses

8.3 phase two 113
were repeated using the more commonly applied Euclidean distance
metric to allow comparison of the results and investigation of the extent
to which the methodology used affects the clusters described. Both
distance measures are available through the R function ‘Daisy’.
Many studies identified in the literature review utilise Ward’s
minimum variance methodology [Ward, 1963], which aims to minimise
the variation within a cluster [Everitt et al., 2011; Kaufman and
Rousseau, 1990]. This method may have the advantage of being less
affected by random variation, or ’noise’, in the dataset [Everitt, 2007]
and was therefore utilised. These choices meant that a total of 6 cluster
analysis variants were explored:
Diana–Euclidean
Diana–Gower
Agnes–Euclidean
Agnes–Gower
Agnes–Euclidean–Ward
Agnes–Gower–Ward
In the previous analysis the number of clusters was chosen such
that each cluster had a minimum of five to ten participants. This
criterion was repeated. However in order to compare response to ICS, an
estimated minimum cluster size of 30 was required in the sample size
calculation (chapter 8). Therefore cluster solutions with a minimum
size of 30 or more were selected where two methods gave otherwise
comparable results.
Each solution was examined for group size and clinical coherence
before the optimal solution was selected for phenotype description.
114 statistical methodology
Clusters were described by summary statistics (mean and standard
deviation) for the 13 cluster analysis variables. The chosen solution
was then used for phenotype description with appropriate summary
statistics for characteristics not included in the cluster analysis. These
variables describe aspects of:
Personal characteristics:
Symptom history
Age of onset
Comorbidities
Respiratory related healthcare utilisation
Treatment in the last 12 months
Laboratory values
Lung function variables
Exploratory Cluster Analyses
A pre-specified exploratory cluster analysis was conducted to investi-
gate the consistency of cluster identification if variables were changed.
To explore the extent to which results may differ from those of
Weatherall et al. [2009] because of changes in analysis variables, the
previous cluster analysis variables were applied to the new data set us-
ing the Agnes–and DIvisive ANAlysis (DIANA) algorithms. The results
were then compared with those from the WRS and the Agnes–Gower–Ward
5 (AGW5) solution in this study.
The nine variables used for this analysis were:
1. Pre-bronchodilator FEV1/FVC ratio (%)
2. Pre-bronchodilator FEV1 (% predicted)
8.3 phase two 115
3. Change in FEV1 post-salbutamol from baseline (%)
4. kCOcorr (% predicted)
5. FRC (% predicted)
6. Natural logarithm of the serum IgE concentration
7. Mean FeNO
8. Pack years of tobacco consumption
9. Sputum production
For the purpose of this analysis the NZRHS cough question "Do you
usually bring up phlegm from your chest first thing in the morning"
was deemed equivalent to the WRS question "Do you usually bring up
sputum from your chest or have sputum in your chest that is difficult
to bring up when you don’t have a cold?".
Bronchodilator Responsiveness
The primary response variables for ipratropium and salbutamol
responsiveness were change from baseline expressed as a percentage.
Bronchodilator responsiveness was calculated for all participants in-
cluded in the cluster analysis and differences between groups com-
pared using Analysis of Variance (ANOVA)
Generation of Allocation Rule
Diagnostic criteria or allocation rules for the identified phenotypes
were developed using regression trees. Multiple possible allocation
rules were generated and the performance of different allocation rules
compared.

116 statistical methodology
The classification approach used the R function ‘rpart’ [Therneau
et al., 2012] and tree-pruning using ten-fold cross-validation using
the ‘one minus standard error’ approach to define the complexity
parameter for the trimmed tree.
The 13 cluster analysis variables were included in the analysis
along with sputum production, FeNO and serum Phadiatop (as a
dichotomous variable). In addition, after the cluster analysis was
completed, the descriptive data were reviewed and additional variables
which appeared differentially distributed between groups were added
to the analysis.
If different combinations of variables gave a similar accuracy of
allocation, priority was given to variables with less between test
variability, and which could feasibly be used in routine clinical practice
as well as future research studies.
8.4 phase three
ICS Responsiveness
ICS responsiveness definition:
Within this document the phrase "ICS responsiveness" refers
to the change in clinical characteristics from baseline in
steroid naive subjects receiving 12 weeks of open label
inhaled corticosteroid.
The primary outcome variable for ICS Responsiveness was symptom
control as measured by ACQ-7 score. Although the intervention was
open label, both subjects and investigators were blind to cluster
8.4 phase three 117
allocation at the time of testing as the cluster analysis had not yet been
conducted. For the purposes of the analyses, changes in the specified
outcome variables are deemed to be due to the ICS treatment.
All participants who took part in the ICS trial and attended for visit
3 were included in the analysis, as long as they had taken at least 6
weeks and not more than 6 months of ICS.
For the participants who were given ICS a mixed linear model was
used to compare the mean differences between visit 3 and visit 2
between clusters using a ’visit by cluster’ interaction term. If this was
not statistically significant then the model without the interaction term
was used to estimate the difference between visit 3 and visit 2, averaged
over clusters, and the difference between clusters averaged over visits,
the latter used cluster 3 as the comparator level. For the mixed linear
model the participants were treated as random effects, to take account
of the repeated measurements on the same participants. FeNO also had
a skew distribution and was analysed on the logarithm transformed
scale.
secondary outcome variables for ics responsiveness
The secondary outcome variables for ICS responsiveness were:
Mean FeNO
Total SGRQ
FEV1 (% predicted)
Peak flow variability (amplitude as a percentage of the mean)
Difference in the rate of serious adverse events between clusters.
118 statistical methodology
Secondary outcome measures were analysed as above for the contin-
uous variables. Serious Adverse Event (SAE) rates were compared by
exact Chi-squared test.
8.5 sample size and power calculation
The sample size for the NZRHS was determined with the aim of
ensuring that there would be a sufficient number of subjects in Phase
3 to detect a difference in ICS responsiveness. The major challenge in
determining the appropriate sample size for the study was that cluster
allocation would not be known at the time of testing and a change in
the relative size of different groups would substantially alter the power
to detect differences between groups.
The primary outcome for Phase 3 was the change in ACQ-7. The
minimum clinically important difference (MCID) for ACQ-7 is a 0.5 point
change [Juniper et al., 2005] and this was used for the power calculation.
As discussed in the literature review, the Medical Research Institute
of New Zealand (MRINZ) previously conducted the WRS in a similar
population sample with similar methodology [Weatherall et al., 2009].
The following assumptions were made for the sample size calculation:
The NZRHS would describe the same number of clusters as the
WRS, with similar proportions in each cluster.
The Standard Deviation (SD) for the ACQ-7 would be similar to
that seen in a previous study [Martin et al., 2007]
At least 50% of the subjects would be eligible for Phase 3.
It was planned to survey 9,700 individuals from the general population.
Assuming a similar response rate to the earlier Wellington Respiratory
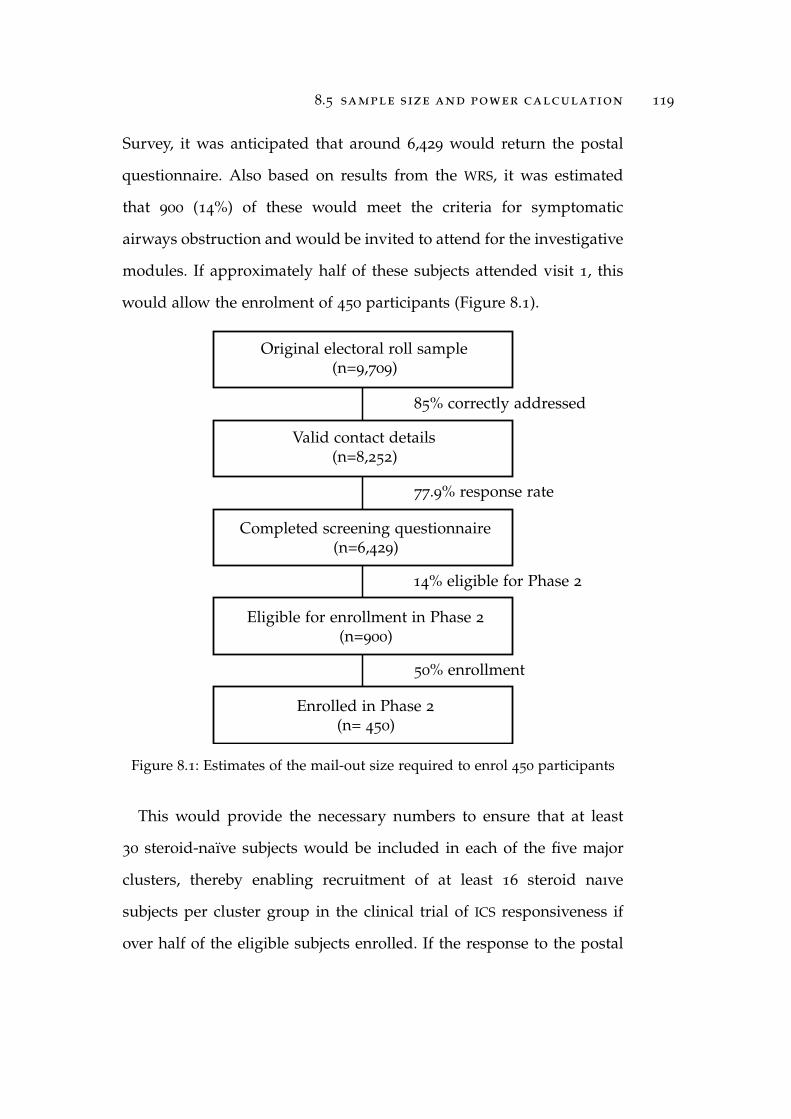
8.5 sample size and power calculation 119
Survey, it was anticipated that around 6,429 would return the postal
questionnaire. Also based on results from the WRS, it was estimated
that 900 (14%) of these would meet the criteria for symptomatic
airways obstruction and would be invited to attend for the investigative
modules. If approximately half of these subjects attended visit 1, this
would allow the enrolment of 450 participants (Figure 8.1).
Original electoral roll sample(n=9,709)
Valid contact details(n=8,252)
Completed screening questionnaire(n=6,429)
Eligible for enrollment in Phase 2
(n=900)
Enrolled in Phase 2
(n= 450)
85% correctly addressed
77.9% response rate
14% eligible for Phase 2
50% enrollment
Figure 8.1: Estimates of the mail-out size required to enrol 450 participants
This would provide the necessary numbers to ensure that at least
30 steroid-naïve subjects would be included in each of the five major
clusters, thereby enabling recruitment of at least 16 steroid naıve
subjects per cluster group in the clinical trial of ICS responsiveness if
over half of the eligible subjects enrolled. If the response to the postal
120 statistical methodology
survey was smaller than anticipated then additional mail-outs would
be undertaken to allow 450 subjects to be recruited for testing.
The utility of this sample size for the ICS trial is supported by
previously published work examining the 16 week efficacy of ICS in
asthma patients defined by degree of eosinophilic airways inflamma-
tion [Martin et al., 2007]. In this study, ICS efficacy was measured using
the ACQ-7. There was a difference between the eosinophilic and non-
eosinophilic groups of 0.49 units on this score with standard deviations
of 0.57 and 0.54 in each group. A sample size of 16 for each of the
comparator groups provides, at 5% significance, 80% power to detect a
difference of 0.5 units between groups, which is equal to the MCID.
8.6 safety monitoring
General Health Care
Participants received usual general practitioner care throughout the
study. At the end of their final visit participants were offered a copy of
their lung function and spirometry data with a covering letter, which
could be modified with additional information where felt appropriate.
Adverse Events
For the purposes of this study an adverse event was any untoward
medical occurrence in a study subject temporally associated with
participation in the trial and the administration of study medication,
whether or not considered related to the medicine. An adverse event
can therefore be any unfavourable and unintended sign, symptom

8.6 safety monitoring 121
or disease temporally associated with the use of the study treatment.
Adverse event data was collected and analysed with efficacy data at
the end of the study. Serious adverse events were notified to the Central
Regional Ethics Committee according to standard guidelines.
Serious Adverse Events (SAEs)
For the purposes of this study the following events were considered
to be SAEs and required expedited reporting:
Death
Life-threatening event
Permanently disabling or incapacitating event
Hospitalisation or prolongation of hospitalisation
Any event considered serious by the study investigator
Hospitalisation for the purposes of SAE reporting was defined as
an admission to hospital and did not include a presentation to the
Emergency Department followed by discharge without admission, or
an admission for elective reasons.
Should a female subject on the trial have become pregnant during
the course of the trial, the pregnancy itself would not be regarded as
an SAE although it would have been reported to the Ethics Committee
in an expedited manner. The subject would have been asked to contact
the researchers after the birth of the baby and any congenital anomaly
or birth defect would have been considered to be an SAE.

122 statistical methodology
Asthma or COPD Exacerbations
In the event of an exacerbation of a subject’s airways disease during
the study period they received standard care for their exacerbation
from their usual medical practitioner and were advised to continue
their study medication. They were asked to notify the study investiga-
tor of any such events and were followed-up as appropriate.
Designated Safety Data Reviewers
The designated safety data reviewer for the study was Dr Philippa
Shirtcliffe. The investigators met regularly to review the progress of the
study including the monitoring of adverse events.
8.7 ethics approval
The study was approved by the Central Regional Ethics Committee,
approval number CEN\09\12\095. All subjects completed written
informed consent prior to lung-function testing.

Part III
T H E N E W Z E A L A N D R E S P I R AT O RY
H E A LT H S U RV E Y: R E S U LT S A N D
D I S C U S S I O N

9P H A S E 1
9.1 results
Ethics committee final approval for the NZRHS was gained on the 2nd
November 2010. There was a rapid response to the initial mail-out and
the first participant attended for testing on the 15th November 2010.
Enrolment was completed on 25th July 2012 and the last subject’s last
visit was on the 3rd December 2012. The flow diagram for the NZRHS is
shown in Figure 9.1
Response Rates
Questionnaires were sent out to a total of 16,459 individuals. Mail-
outs were sent in 13 similarly sized waves to stagger responses, with
the aim of minimising the time between questionnaire response and
the invitation to attend for testing.
There were 11,397 responses (69.2%), of which 2,658 were “Not
known at this address”. 35 individuals were deceased and there were 76
spoiled/blank questionnaires, leaving 8,628 completed questionnaires
(62.5% of correctly addressed mail). Response rates varied between
waves and are shown in Table 9.1.
125

126 phase 1
16,459Screening Questionnaires
11,397Responses received
8,628Completed questionnaires
1,264Eligible for Phase 2
451 Recruited into Phase 2
2,658 “Not known at this address”35 Deceased76 Spoiled/blank questionnaire
5,062 Did not respond
7,364 Not symptomatic therefore ineligible for Phase 1
10 Excluded post consent23 Withdrew during phase 2 (participant choice)
9 Excluded by telephone2 Excluded at V1 prior to enrolment802 Chose not to participate/recruitment complete
prior to attendance
418Completed Phase 2
168 Enrolled in Phase 3
194 Not eligible for Phase 3 as on steroids56 Eligible but chose not to participate
148 Attended final visit
20 Withdrew before final visit (participant choice)
Ph
ase
3: I
CS
Res
pon
sive
nes
sP
has
e 2:
Ph
enot
ypin
gP
has
e 1:
Pop
ula
tion
sam
ple
127Included in ICS analysis
13 Not in cluster analysis due to missing data5 Took less than 6 weeks ICS3 Final visit >6 months after Phase 2
389 Complete data for cluster analysis†
Figure 9.1: Flow of participants through the 3 phases of the NZRHS
† 29 participants were not included in the cluster analysis because they hadmissing data for one or more of the 13 cluster analysis variables.

9.1 results 127
Table 9.1: NZRHS response rates by wave
wave n responded did not respond response rate
1 1,272 944 328 74.2%2 1,271 935 336 73.6%3 1,273 959 314 75.3%4 1,278 943 335 73.8%5 1,273 918 355 72.1%6 1,280 932 348 72.8%7 1,274 896 378 70.3%8 1,265 946 419 74.8%9 1,235 797 438 64.5%
10 1,235 783 452 63.4%11 1,234 776 458 62.9%12 1,235 807 428 65.3%13 1,235 761 474 61.6%
total 16,460 11,397 5,063 69.2%
The response rate by stage of mail-out was not formally collected
and therefore cannot be reported for each wave. However, for wave 1
approximately 35% of the 1,272 individuals selected responded to the
initial mail-out, approximately 15-20% responded to the first reminder,
around 8% responded to the second reminder, and a further 10-
15% responded to telephone contact. This pattern appeared consistent
across all waves.
Whilst the majority of responses were received by post, a total of
1,038 responses were received online, of which 1,024 had matching
personal numbers. All online respondents answered at least one
of the screening questions, therefore 1,024 of the 8,627 completed
questionnaires (11.9%) were returned online. The mean (SD) age of
online respondents was 40.4 (12.9), with a range of 18-75 years.

128 phase 1
Examination of the data suggested that, although all age groups were
represented in online responses, participants above the age of 60 were
less likely to respond online (Figure 9.2a) but were well represented in
postal responses (Figure 9.2b). The difference in respondent age pattern
with online responses was most marked for participants who identified
as female, with a high proportion of online responses identifying as
female coming from individuals below the age of 40.
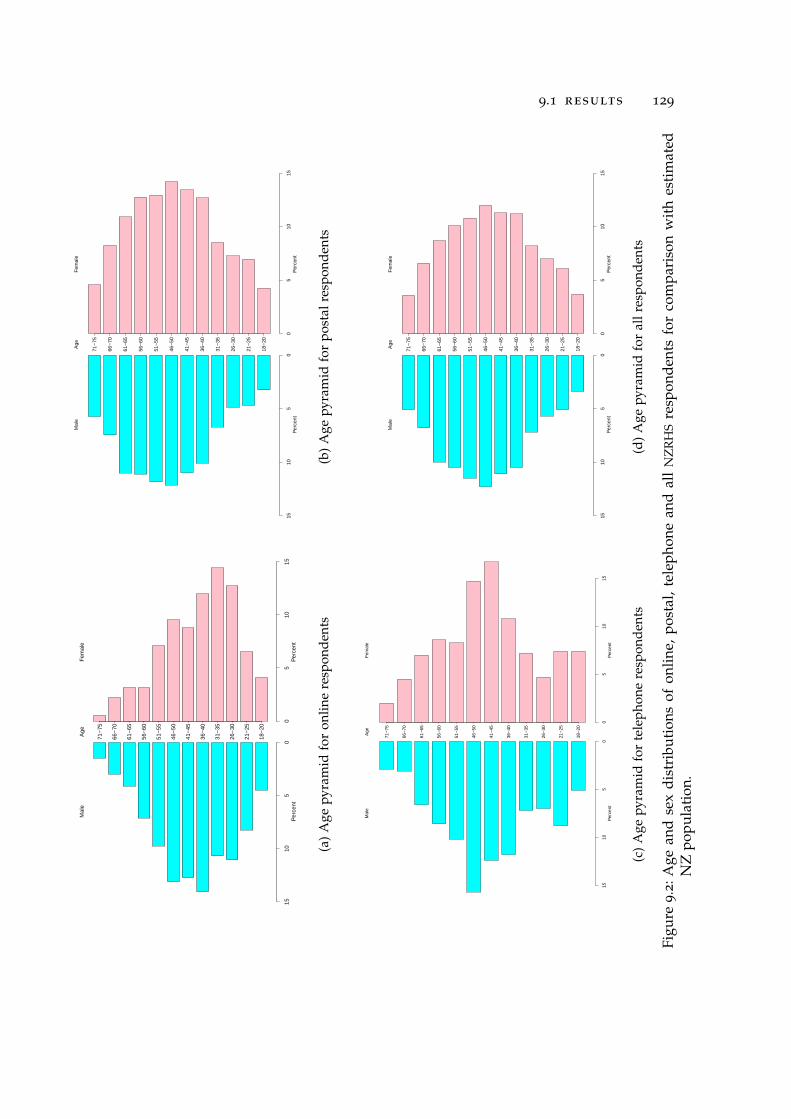
9.1 results 129
1510
50
05
1015
18−
20
21−
25
26−
30
31−
35
36−
40
41−
45
46−
50
51−
55
56−
60
61−
65
66−
70
71−
75
Mal
eA
geF
emal
e
Per
cent
Per
cent
(a)
Age
pyra
mid
for
onlin
ere
spon
dent
s
1510
50
05
1015
18−
20
21−
25
26−
30
31−
35
36−
40
41−
45
46−
50
51−
55
56−
60
61−
65
66−
70
71−
75
Mal
eA
geF
emal
e
Per
cent
Per
cent
(b)
Age
pyra
mid
for
post
alre
spon
dent
s
1510
50
05
1015
18−
20
21−
25
26−
30
31−
35
36−
40
41−
45
46−
50
51−
55
56−
60
61−
65
66−
70
71−
75
Mal
eA
geF
emal
e
Per
cent
Per
cent
(c)
Age
pyra
mid
for
tele
phon
ere
spon
dent
s
1510
50
05
1015
18−
20
21−
25
26−
30
31−
35
36−
40
41−
45
46−
50
51−
55
56−
60
61−
65
66−
70
71−
75
Mal
eA
geF
emal
e
Per
cent
Per
cent
(d)
Age
pyra
mid
for
allr
espo
nden
ts
Figu
re9.2
:Age
and
sex
dist
ribu
tion
sof
onlin
e,po
stal
,te
leph
one
and
all
NZ
RH
Sre
spon
dent
sfo
rco
mpa
riso
nw
ith
esti
mat
edN
Zpo
pula
tion
.

130 phase 1
1510
50
05
1015
18−
20
21−
25
26−
30
31−
35
36−
40
41−
45
46−
50
51−
55
56−
60
61−
65
66−
70
71−
75
Mal
eA
geF
emal
e
Per
cent
Per
cent
(e)
Age
pyra
mid
for
elig
ible
resp
onde
nts
1510
50
05
1015
18−
20
21−
25
26−
30
31−
35
36−
40
41−
45
46−
50
51−
55
56−
60
61−
65
66−
70
71−
75
Mal
eA
geF
emal
e
Per
cent
Per
cent
(f)
Age
pyra
mid
for
enro
lled
resp
onde
nts
1510
50
05
1015
18−
20
21−
25
26−
30
31−
35
36−
40
41−
45
46−
50
51−
55
56−
60
61−
65
66−
70
71−
75
Mal
eA
geF
emal
e
Per
cent
Per
cent
(g)
Age
pyra
mid
for
allr
espo
nden
ts
1510
50
05
1015
18−
20
21−
25
26−
30
31−
35
36−
40
41−
45
46−
50
51−
55
56−
60
61−
65
66−
70
71−
75
Mal
eA
geF
emal
e
Per
cent
Per
cent
(h)
Age
pyra
mid
for
esti
mat
edN
Zpo
pula
tion
in2
01
2
Figu
re9.2
:A
gean
dse
xdi
stri
buti
ons
ofN
ZR
HS
resp
onde
nts
cont
inue
d.Fi
gure
(d)
isre
peat
edas
Figu
re(g
)fo
rea
seof
com
pari
son

9.1 results 131
1,036/8,627 (12.0%) questionnaires were completed by telephone in
response to a reminder call. Examination of the age and sex distribution
(Figure 9.2c) suggests that middle-aged people were most likely to
complete the questionnaire when receiving a reminder call, with no
clear difference between the sexes. It is possible that this is in part due
to this age group being more likely to have a publicly listed telephone
number.
As the majority of completed questionnaires, 6,527/8,627 (76.1%),
were received by post, the age pyramid for postal responses (Fig-
ure 9.2b) is similar to that of all respondents (Figure 9.2d). Comparison
of the age pyramid for all respondents with one constructed using
estimated NZ population data obtained from Statistics New Zealand
[Accessed 15th May 2013] (Figure 9.2h) suggests that the younger
age groups may be under-represented. In order to examine whether
this was due to poor response rates in this age group or under-
representation on the electoral roll, electoral roll statistics for the four
sampled electorates were obtained [Electoral Commission, Accessed
15th May 2013]. A combined plot of all four electorates (Figure 9.3)
clearly shows that enrolment rates are substantially lower in younger
age groups. Over all age groups it is estimated that 89.2% of eligible
voters are enrolled, however the proportion varies from around 100%
in older age groups to 63.4% among 18-24yr olds (Table 9.2).

132 phase 1
32 30 28 26 24 22 20 18 16 14 12 10 8 6 4 2 0 0 2.5 5 7.5 10 12.5 15
18 − 24
25 − 29
30 − 34
35 − 39
40 − 44
45 − 49
50 − 54
55 − 59
60 − 64
65 − 69
70+
Eligible (blue) and Enrolled (green) voters, in thousands Age Eligible (blue) and Enrolled (green) voters, expressed as percentage
Figure 9.3: Estimated eligible and enrolled voters in the Wellington region
Population pyramid with absolute numbers in thousands on the left and percentageson the right. The estimated population eligible to vote is shown in blue and theenrolled population in green, therefore visible blue bars represented eligible but notenrolled voters. Figure drawn using data from Table 9.2.
Table 9.2: Estimated eligible and enrolled voters for the Wellington region
age eligible general roll maori roll total enrolled % enrolled
18 - 24 33,260 19,681 1,412 21,093 63.4
25 - 29 26,340 18,752 1,152 19,904 75.6
30 - 34 23,520 19,135 1,142 20,277 86.2
35 - 39 19,880 18,727 1,086 19,813 99.7
40 - 44 20,280 19,067 1,128 20,195 99.6
45 - 49 19,150 18,182 1,040 19,222 100.4
50 - 54 17,860 17,104 976 18,080 101.2
55 - 59 14,510 13,579 679 14,258 98.3
60 - 64 12,020 11,551 517 12,068 100.4
65 - 69 9,420 8,673 294 8,967 95.2
70+ 18,960 17,757 369 18,126 95.6
Total 215,200 182,208 9,795 192,003 89.2
Number of voters, estimated and enrolled, for Wellington Central, Rongotai, Õhariu,Hutt South and the corresponding parts of Te Tai Tonga, Te Tai Hauauru and Ikaroa-Rawhiti. Data obtained from Electoral Commission [Accessed 15th May 2013].

9.1 results 133
Eligibility and Enrolment
1,264 respondents (14.8% of those answering Q1) had experienced
wheeze with breathlessness in the previous 12 months and were eligible
to be enrolled in phase 2 (Table 9.3).
Table 9.3: NZRHS screening questionnaire responses
question answered by positive response†
demographics
Age (years) 8,366 46.9 (14.6)‡Sex (Male) 8,509 3,999 (47.0)
symptoms
Wheeze in last 12 months 8,540 2,136 (25.0)Breathless when wheezing 8,523 1,264 (14.8)
Usually cough 8,509 1,856 (21.8)Cough >3 months per year 8,497 1,008 (11.9)
Usually bring up phlegm 8,501 1,027 (12.1)Phlegm >3 months per year 8,502 726 (8.5)
Trouble with breathing 8,516 1,940 (22.88)doctors diagnosis
Chronic bronchitis 8,500 574 (6.8)Emphysema 8,509 78 (0.9)
Asthma 8,519 1,969 (23.1)smoking status 8,399
Current 785 (9.3)Ex 2,638 (31.4)
Never 4,976 (59.2)Years of smoking 3,312 15.0 (13.2)‡
Table shows the number of people who answered "Yes" to each question. †Valuesreported as N (%) except where otherwise stated. ‡Continuous variables expressed asMean (SD)
When contacted, approximately half of respondents with eligible
questionnaires agreed to attend for phenotyping. Mail-outs were there-
fore discontinued once over 900 eligible questionnaires had been

134 phase 1
received. Reminders were sent out in similar fashion for all waves
to avoid bias from only sampling early responders in later waves.
Responses were returned up to a year after the initial mail-out, so some
returns were received after completion of enrolment.
Questionnaire responses for all, eligible and enrolled respondents are
shown in Table 9.4.
Table 9.4: Screening questionnaire responses by eligibility and enrolment
question all responses phase 2 eligible phase 2 enrolled
n=8 ,627 n=1 ,264 n=451
demographics
Age (years) † 46.9 (14.6)§ 45.4 (14.6)‡ 47.5 (14.0)#
Sex (Male) 3,999/8,509 (47.0) 496/1,256 (60.5) 210/449 (46.8)
symptoms
Wheeze in last 12 months 2,136/8,540 (25.0) 1,264/1,264 (100) 451/451 (100)
Breathless when wheezing 1,264/8,523 (14.8) 1,264/1,264 (100) 451/451 (100)
Usually cough 1,856/8,509 (21.8) 617/1,251 (49.3) 234/446 (52.5)
Cough >3 months per year 1,008/8,497 (11.9) 423/1,252 (33.8) 164/445 (36.9)
Usually bring up phlegm 1,027/8,501 (12.1) 342/1,249 (29.8) 141/446 (31.6)
Phlegm >3 months per year 726/8,502 (8.5) 298/1,257 (23.7) 107/446 (24.0)
Trouble with breathing 1,940/8,516 (22.8) 983/1,252 (78.5) 381/449 (84.9)
doctors diagnosis
Chronic bronchitis 574/8,500 (6.8) 243/1,244 (19.5) 82/443 (18.5)
Emphysema 78/8,509 (0.9) 47/1,244 (3.8) 18/442 (4.1)
Asthma 1,969/8,519 (23.1) 860/1,254 (68.6) 323/446 (72.4)
smoking status
Current 785/8,399 (9.4) 203/1,240 (16.4) 60/441 (13.6)
Ex 2,638/8,399 (31.4) 424/1,240 (35.0) 157/441 (35.6)
Never 4,976/8,399 (59.3) 603/1,240 (48.6) 224/441 (50.8)
Years of smoking † 15.0 (13.2)∗ 17.1 (13.9)$ 18.2 (13.9)††
Values reported as N/N (%) unless otherwise stated. † Mean (SD)§ N=8,366; ‡ N=1,240; # N=445; ∗ N=3,312; $ N=610; †† N=210
Individuals did not always answer all questions on the screening questionnaire,therefore the number of respondents is given for each question.
When contacted, approximately half of respondents with eligible
questionnaires agreed to attend for phenotyping. Mail-outs were there-
fore discontinued once over 900 eligible questionnaires had been

9.1 results 135
received. Reminders were sent out in similar fashion for all waves
to avoid bias from only sampling early responders in later waves.
Responses were returned up to a year after the initial mail-out, so some
returns were received after completion of enrolment.
Questionnaire responses for all, eligible and enrolled respondents are
shown in Table 9.4.
Eligible respondents were similar in age but were more likely to be
male (60.5% versus 46.8%), more likely to have a respiratory diagnosis
(68.6% v 23.1% for asthma), more likely to be current smokers (16.4% v
9.4%), and by definition had more symptoms than the overall sample.
Enrolled respondents were similar to eligible respondents but with a
smaller proportion of participants identifying as male (46.8% v 60.5%).
The proportion of participants eligible to take part in Phase 2 was
similar across age bands (Figure 9.4).
18−20 21−25 26−30 31−35 36−40 41−45 46−50 51−55 56−60 61−65 66−70 71−75
Age Band
Pro
port
ion
Elig
ible
0.0
0.2
0.4
0.6
0.8
1.0
NoYesNoYes
Figure 9.4: Eligibility of NZRHS respondents by age bands
136 phase 1
Questionnaire Results
A summary of questionnaire responses is shown in Table 9.3. Mean
respondent age at the start of the study was 46.9 (14.6) years, range
18-99.
Wheeze and wheeze plus breathlessness in the last 12 months were
both common, being reported by 25.0% and 14.8% of respondents
respectively. Rates of cough (21.8%) and sputum production (12.1%)
were also high, consistent with a substantial burden of disease in the
population. Current smoking was reported by 16.4%, with 59.3% of
respondents identifying as never smokers.
Examination of responses for all and eligible participants by age
bands showed clear differences in smoking patterns and symptom
burden (Figure 9.5). Smoking rates were higher for eligible participants
in all age bands but eligible and enrolled participants had similar
distributions by age band. A higher proportion of young people
were never smokers, which is consistent with the reported decline in
smoking in NZ [Broad and Jackson, 2003]. All symptoms and diagnoses
were more common in eligible participants.
Prevalence of reported asthma declined with age whereas emphy-
sema and chronic bronchitis were more common in older age bands.
There was no clear age pattern for cough amongst all respondents,
however within eligible participants there was a trend to increased
prevalence with increasing age.

9.2 discussion 137
18−
2021
−25
26−
3031
−35
36−
4041
−45
46−
5051
−55
56−
6061
−65
66−
7071
−75
Age
Ban
d
Smoking status
0.00.20.40.60.81.0
Not
ans
wer
edN
ever
Ex
Cur
rent
(a)
Smok
ing
stat
usby
age
band
(all
resp
onde
nts)
18−
2021
−25
26−
3031
−35
36−
4041
−45
46−
5051
−55
56−
6061
−65
66−
7071
−75
Age
Ban
d
Smoking status
0.00.20.40.60.81.0
Not
ans
wer
edN
ever
Ex
Cur
rent
(b)
Smok
ing
stat
usby
age
band
(elig
ible
resp
onde
nts)
18−
2021
−25
26−
3031
−35
36−
4041
−45
46−
5051
−55
56−
6061
−65
66−
7071
−75
Age
Ban
d
Proportion with a doctors diagnosis of athma
0.00.20.40.60.81.0
Not
ans
wer
edN
oYe
s
(c)
Ast
hma
diag
nosi
sby
age
band
(all
resp
onde
nts)
18−
2021
−25
26−
3031
−35
36−
4041
−45
46−
5051
−55
56−
6061
−65
66−
7071
−75
Age
Ban
d
Proportion with a doctors diagnosis of asthma
0.00.20.40.60.81.0
Not
ans
wer
edN
oYe
s
(d)
Ast
hma
diag
nosi
sby
age
band
(elig
ible
resp
onde
nts)
Figu
re9.5
:Cha
ract
eris
tics
ofN
ZR
HS
resp
onde
nts
byag
eba
nds

138 phase 1
18−
2021
−25
26−
3031
−35
36−
4041
−45
46−
5051
−55
56−
6061
−65
66−
7071
−75
Age
Ban
d
Proportion with a doctors diagnosis of chronic bronchitis
0.00.20.40.60.81.0
Not
ans
wer
edN
oYe
s
(e)
Chr
onic
bron
chit
isdi
agno
sis
byag
eba
nd(a
llre
spon
dent
s)
18−
2021
−25
26−
3031
−35
36−
4041
−45
46−
5051
−55
56−
6061
−65
66−
7071
−75
Age
Ban
d
Proportion with a doctors diagnosis of chronic bronchitis
0.00.20.40.60.81.0
Not
ans
wer
edN
oYe
s
(f)
Chr
onic
bron
chit
isdi
agno
sis
byag
eba
nd(e
ligib
lere
spon
dent
s)
18−
2021
−25
26−
3031
−35
36−
4041
−45
46−
5051
−55
56−
6061
−65
66−
7071
−75
Age
Ban
d
Proportion with a doctors diagnosis of emphysema
0.00.20.40.60.81.0
Not
ans
wer
edN
oYe
s
(g)
Emph
ysem
adi
agno
sis
byag
eba
nd(a
llre
spon
dent
s)
18−
2021
−25
26−
3031
−35
36−
4041
−45
46−
5051
−55
56−
6061
−65
66−
7071
−75
Age
Ban
d
Proportion with a doctors diagnosis of emphysema
0.00.20.40.60.81.0
Not
ans
wer
edN
oYe
s
(h)
Emph
ysem
adi
agno
sis
byag
eba
nd(e
ligib
lere
spon
dent
s)
Figu
re9.5
:Cha
ract
eris
tics
ofN
ZR
HS
resp
onde
nts
byag
eba
nds
cont
inue
d.

9.2 discussion 139
18−
2021
−25
26−
3031
−35
36−
4041
−45
46−
5051
−55
56−
6061
−65
66−
7071
−75
Age
Ban
d
Proportion with a chronic cough
0.00.20.40.60.81.0
Not
ans
wer
edN
oYe
s
(i)
Chr
onic
coug
hby
age
band
(all
resp
onde
nts)
18−
2021
−25
26−
3031
−35
36−
4041
−45
46−
5051
−55
56−
6061
−65
66−
7071
−75
Age
Ban
d
Proportion with a chronic cough
0.00.20.40.60.81.0
Not
ans
wer
edN
oYe
s
(j)C
hron
icco
ugh
byag
eba
nd(e
ligib
lere
spon
dent
s)
18−
2021
−25
26−
3031
−35
36−
4041
−45
46−
5051
−55
56−
6061
−65
66−
7071
−75
Age
Ban
d
Proportion with chronic sputum production
0.00.20.40.60.81.0
Not
ans
wer
edN
oYe
s
(k)
Chr
onic
sput
umby
age
band
(all
resp
onde
nts)
18−
2021
−25
26−
3031
−35
36−
4041
−45
46−
5051
−55
56−
6061
−65
66−
7071
−75
Age
Ban
d
Proportion with chronic sputum production
0.00.20.40.60.81.0
Not
ans
wer
edN
oYe
s
(l)
Chr
onic
sput
umby
age
band
(elig
ible
resp
onde
nts)
Figu
re9.5
:Cha
ract
eris
tics
ofN
ZR
HS
resp
onde
nts
byag
eba
nds
cont
inue
d.

140 phase 1
9.2 discussion
The response rate to the screening questionnaire was high and
the responses are therefore likely to be representative of the wider
population. The response rate is not as high as that achieved in the
previous WRS (69% versus 77.9%) [Shirtcliffe et al., 2007] but is still
good by international standards. Response rates to postal surveys may
be dropping in NZ [Fink et al., 2011] and the rate achieved in the NZRHS
compares favourably with recent response rates reported by Fink et al.
[2011] (48.1% in 2008 to 70.9% in 1990).
The extent to which the design of the questionnaire determines
response is unclear, but a Cochrane Review has reported that different
designs can lead to substantially different response rates in the same
population [Edwards et al., 2009]. Factors in the NZRHS which have
previously been associated with higher response rates are ’short ques-
tionnaire’, ’personalised letter’, ’assurance of confidentiality’, ’follow-
up contact’ and provision of a second copy of the questionnaire with
reminder contacts [Edwards et al., 2009]. Although an incentive deliv-
ered with the questionnaire has been reported to improve response
rates, excellent response rates were achieved in this study without the
use of incentives.
The increased rate of all respiratory conditions amongst the eligible
groups supports the usefulness of the selected questions in identifying
individuals with possible respiratory disease.
One interesting pattern in this study is the decline in response rate
in the later waves. This is unlikely to be due to early waves having

9.2 discussion 141
had longer to respond, as even the later waves were sent out almost
a year before these figures were compiled and responses had stopped
prior to response rates being calculated. However, due to timing of post-
outs varying around holiday periods, the early waves had two months
between the initial letter and the first reminder whereas later waves
only had a one month gap. It is possible that earlier reminders are
perceived as inappropriate and lead to a lower overall response rate.
The option to respond online was offered with the aim of improving
response rates in the younger age-range, but it is not possible to know
if these participants would have returned paper questionnaires had
the online option had not been available. The younger age profile
of online respondents (Figure 9.2a) suggests that this age group are
comfortable with online surveys and that including this option may
have improved response rates in this group. Younger adults are less
likely to have a long-term fixed address and this contributes to their
under-representation and a higher proportion of incorrect addresses
on the electoral roll.
The high response rate and take-up of Phase 2 places means that
the Phase 2 sample is likely to be representative of the population
sampled, although the under 25 age groups will be slightly under-
represented. The reported prevalence of wheeze in this study (25.7%)
is similar to that previously reported in NZ adults taking part in the
European Community Respiratory Health Survey [1996] (25.0%) and
the rate of wheeze with breathlessness in the last year is identical at
14.8% [Crane et al., 1994; D’Souza et al., 1999; European Community
Respiratory Health Survey, 1996]. The higher prevalence of reported

142 phase 1
asthma in younger age groups would be consistent with an increasing
prevalence of asthma, as has been previously reported [British Thoracic
Society; Scottish Intercollegiate Guidelines Network, 2012; GINA, 2011].
However, there may be an element of recall bias, in that older age
groups may not recall a childhood diagnosis of asthma.

10P H A S E 2
10.1 results
Data description
Of the 451 participants who enrolled in phase 2, 10 were excluded
and 23 withdrew during phenotyping. Of the 10 excluded subjects,
four were unable to complete PFTs, and three had co-morbidities which
affected the interpretation of their lung function tests (two subjects had
severe heart failure, one had renal failure with fluid overload). The
remaining three subjects were found not to meet the inclusion criteria
after the consent form had been signed. 418 subjects completed both
phenotyping visits, of whom 389 had complete data for the 13 cluster
analysis variables. Of the 29 with missing data, 16 did not have an
age of symptom onset recorded, 10 had incomplete peak flow diaries
and the remainder were missing hsCRP or IgE values. the majority were
missing peak flow variability due to incomplete peak flow diaries.
Characteristics of participants with complete data are shown in
Table 10.1, with self-reported ethnicity shown in Table 10.2. All char-
acteristics showed a wide range of values, reflecting the heterogeneity
of the participants. The majority of participants were of NZ European
origin, precluding further analysis by ethnicity.
143

144 phase 2
Table 10.1: Characteristics of cluster analysis sample
characteristic mean (sd) range
Age at first visit, years 48.9 (13.9) 19 to 76
Age of Onset 23.8 (19.1) 0 to 70
Pack Years 8.20 (15.1) 0 to 87.6BMI 28.6 (6.6) 15.7 to 57.1FEV1 (% predicted) 81.7 (19.0) 18.8 to 123.0FEV1/FVC ratio (%) 70.3 (12.5) 25.5 to 94.6FRC (% predicted) 93.5 (26.2) 46.5 to 216.2kCOcorr (% predicted) 99.1 (17.4) 34.5 to 143.5PEFR variability (%) 20.7 (12.6) 1.8 to 84.7Reversibility (%) 10.0 (11.8) -10.7 to 121.9FeNO 33.7 (35.2) 2.7 to 262.8IgE 343 (1162) 0.1 to 18,083
hsCRP 2.88 (4.43) 0.3 to 43
SGRQ 23.7 (16.8) 0 to 84
N = 389
Table 10.2: Self-reported ethnicity of Phase 2 participants
ethnicity n %
maori 23 5.9%
nz european 337 86.6%
pacific islander 9 2.3%
chinese 4 1.0%
indian 5 1.3%
other / not stated 11 2.8%
N = 389
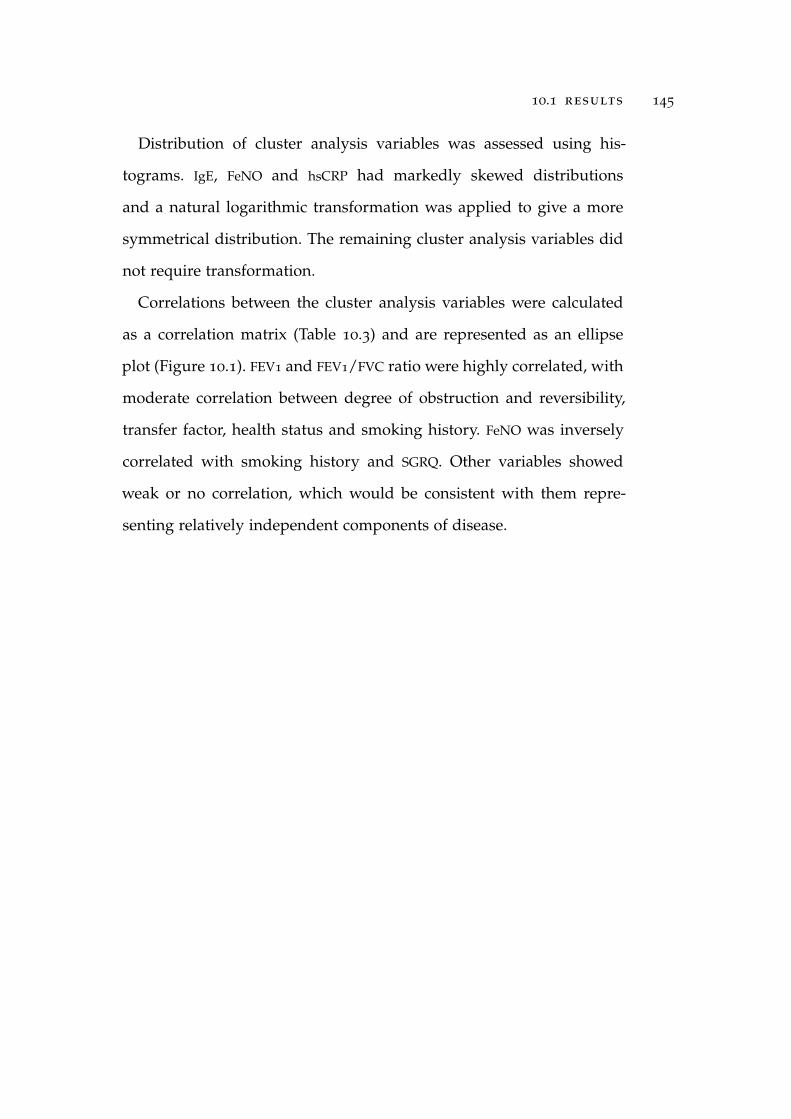
10.1 results 145
Distribution of cluster analysis variables was assessed using his-
tograms. IgE, FeNO and hsCRP had markedly skewed distributions
and a natural logarithmic transformation was applied to give a more
symmetrical distribution. The remaining cluster analysis variables did
not require transformation.
Correlations between the cluster analysis variables were calculated
as a correlation matrix (Table 10.3) and are represented as an ellipse
plot (Figure 10.1). FEV1 and FEV1/FVC ratio were highly correlated, with
moderate correlation between degree of obstruction and reversibility,
transfer factor, health status and smoking history. FeNO was inversely
correlated with smoking history and SGRQ. Other variables showed
weak or no correlation, which would be consistent with them repre-
senting relatively independent components of disease.
146 phase 2
age of onset
bmi
frc†
kcocorr†
hscrp§
ige§
feno§
pack years
pefr var .
reversibility‡
sgrq
ag
eo
fo
ns
et
bm
i
fe
v1
:fv
c
fe
v1
fr
c
kc
oc
or
r
hs
cr
p
ig
e
fe
no
pa
ck
ye
ar
s
pe
fr
va
r.
re
ve
rs
ib
il
it
y
sg
rq
–1 0 1
fev1†
fev1 :fvc
Figure 10.1: Graphical correlation matrix for cluster analysis variables
The strength of correlation between variables is represented by the colour of theellipse, as indicated by the legend. Dark red represents a strongly negative correlationand dark blue a strongly positive correlation. The narrower the ellipse the morestatistically significant the correlation. Correlation values and level of significance aregiven in Table 10.3. †Expressed as percent predicted; ‡Percent change from baselineafter 400mcg salbutamol; §Log transformed.

10.1 results 147
Tabl
e10.3
:Cor
rela
tion
mat
rix
for
clus
ter
anal
ysis
vari
able
s
ao
o$
BMI
FEV
1:F
VC
FEV
1FR
CkC
Oco
rrhs
CR
PIg
EFe
NO
pa
ck
yr
s
PEFR
va
r.
re
ve
rs
ib
il
it
y
BMI
0.1
8**
*
FEV
1:F
VC
-0.1
4**
0.1
4**
FEV
1†
-0.0
30.0
00.7
7**
*
FRC†
0.0
5-0
.39**
*-0
.73
***
-0.4
6**
*
kCO
corr†
-0.1
9**
*0
.21**
*0.3
3**
*0.1
9**
*-0
.45**
*
hsC
RP§
0.0
80.4
5**
*-0
.06
-0.1
5**
-0.0
7-0
.10*
IgE§
-0.1
9**
*-0
.12*
-0.0
7-0
.06
0.1
1*
0.1
2*
-0.0
2
FeN
O§
-0.1
4**
-0.1
7**
*0.0
30.0
40.0
00.1
8**
*-0
.16
**0.2
3**
*
Pack
year
s0.2
7**
*0.0
7-0
.38**
*-0
.27**
*0.2
8**
*-0
.33**
*0.1
4**
-0.0
5-0
.31**
*
PEFR
vari
abili
ty0.0
3-0
.01
-0.4
5**
*-0
.49
***
0.3
3**
*-0
.17**
*0.0
90.1
2*
-0.0
20.1
6**
Rev
ersi
bilit
y‡-0
.08
-0.1
7**
*-0
.60**
*-0
.57**
*0.4
9**
*-0
.07
-0.0
60.2
1**
*0.1
7**
*0
.05
0.4
1**
*
SGR
Q0.2
4**
*0.2
6**
*-0
.33**
*-0
.38**
*0.2
0**
*-0
.25**
*0
.24**
*-0
.10*
-0.2
5**
*0.3
2**
*0.3
6**
*0.1
6**
***
p<
0.0
01;*
*p
<0.0
1;*
p<
.05
$AO
O:A
geof
onse
t†Pe
rcen
tpre
dict
ed;§
Log
tran
sfor
med
;‡Pe
rcen
tcha
nge
from
base
line
30
min
utes
post
400m
cgsa
lbut
amol
148 phase 2
Cluster Analysis
Cluster analysis was performed as described in chapter 8. The use
of Agnes and Diana algorithms, Gower and Euclidean metrics, and
the addition of Ward’s method gave a total of 6 possible solutions for
examination:
Diana–Euclidean
Diana–Gower
Agnes–Euclidean
Agnes–Gower
Agnes–Euclidean–Ward
Agnes–Gower–Ward
Each solution was examined for group size and clinical coherence
before the optimal solution was selected for phenotype description,
using variables not included in the cluster analysis. The chosen
solution, and reasons for selection will be described and solutions
which were not selected will be discussed briefly, prior to detailed
examination of the selected candidate phenotypes.
agnes–gower–ward solution
The dendrogram generated by the AGglomerative NESting (AGNES)
algorithm using Ward’s method and the Gower distance metric is
shown in Figure 10.2a.
A plot of ASW did not provide strong evidence in favour of a
particular number of clusters, although ASW decreased with increasing
number of clusters (Figure 10.2b). However, the gap statistic, although
not clearly separating groups (Figure 10.2c), was maximal for four and

10.1 results 149
0.00.51.01.5Height
(a)
Den
drog
ram
for
Agn
es–G
ower
–War
dso
luti
on
●
●●
●●
●●
●●
0.00.20.40.60.81.0
Num
ber
of c
lust
ers
Average silhouette width
23
45
67
89
10
(b)
Ave
rage
silh
ouet
tew
idth
●●
●●
●●
●●
●●
0.00.20.40.60.81.0
Num
ber
of c
lust
ers
Gap statistic
12
34
56
78
910
(c)
Gap
stat
isti
c
●
●
●
●
●
●
●
●
●
●
1.1251.1351.145
Num
ber
of c
lust
ers
Gap statistic
12
34
56
78
910
(d)
Gap
stat
isti
c(l
imit
edy
axis
)
Figu
re10
.2:D
endr
ogra
man
dcl
uste
rse
lect
ion
stat
isti
csfo
rA
gnes
–Gow
er–W
ard
solu
tion

150 phase 2
five cluster solutions (Figure 10.2d), suggesting these may be most
appropriate numbers of groups. Cluster solutions with up to 5 clusters
had more than 30 participants in the smallest group, whereas moving
to a 6 cluster solution led to one cluster containing only 9 participants
(Table 10.4).
Table 10.4: Number of participants per cluster for Agnes–Gower –Wardsolution
number of clusters cluster
in solution 1 2 3 4 5 6
Two cluster 296 93 – – – –Three cluster 155 141 93 – – –Four cluster 155 141 59 34 – –Five cluster 155 80 61 59 34 –Six cluster 155 80 61 59 25 9
In light of the gap statistic results and group sizes, the four and five
cluster solutions were used for examination of cluster characteristics
(Tables 10.5 and 10.6).
Clusters containing 155, 59 and 34 participants were present in
both Agnes–Gower–Ward 4 (AGW4) and Agnes–Gower–Ward 5 (AGW5)
solutions. The cluster of 34 participants was characterised by late onset
disease with moderate to severe obstruction, hyperinflation, marked
bronchodilator reversibility and peak flow variability, raised IgE but
low FeNO and reduced transfer factor in smokers. This group had
the worst health status and the pattern would be consistent with an
asthma/COPD overlap group.
The clusters with 155 and 59 participants have early-onset disease
with evidence of atopy and raised FeNO, separated by severity of

10.1 results 151
Table 10.5: Agnes–Gower–Ward 4 cluster comparison by analysis variables
variable cluster
1 2 3 4
(n=34) (n=59) (n=141) (n=155)
FEV1/FVC ratio (%)† 51.5 (15.2) 56.0 (9.3) 73.9 (6.8) 76.6 (7.8)FEV1 (% predicted)† 62.02(4.8) 59.9 (15.0) 87.2 (14.2) 89.4 (12.2)FRC (% predicted)† 133.5 (35.9) 113.9 (25.2) 83.6 (17.9) 86.0 (16.2)Reversibility 16.4 (12.4) 24.1 (18.7) 6.0 (7.0) 6.9 (5.8)PEFR variability 34.1 (15.2) 33.3 (15.3) 17.6 (9.0) 15.9 (7.5)kCOcorr (% predicted)‡ 73.5 (21.3) 99.4 (18.7) 102.0 (14.8) 102.0 (13.3)FeNO 12.3 (8.3) 42.1 (41.2) 25.6 (23.1) 42.7 (41.3)IgE 397 (72) 452 (1103) 190 (635) 428 (1543)hsCRP 2.7 (2.7) 3.3 (6.4) 2.7 (2.4) 2.9 (5.2)Age of Onset 35.5 (19.8) 11.5 (10.5) 40.1 (15.1) 11.1 (9.8)BMI 26.2 (4.3) 26.5 (5.4) 31.4 (6.7) 27.3 (6.4)SGRQ 43.6 (16.8) 26.2 (15.0) 27.0 (17.6) 15.3 (10.6)Pack years 35.55 (17.8) 4.4 (9.0) 10.8 (16.1) 1.3 (3.8)
Table 10.6: Agnes–Gower–Ward 5 cluster comparison by analysis variables
variable cluster
1 2 3 4 5
(n=34) (n=59) (n=80) (n=61) (n=155)
FEV1/FVC ratio (%)† 51.5 (15.2) 56.0 (9.3) 73.8 (7.1) 74.0 (6.5) 76.6 (7.8)FEV1 (% predicted)† 62.02(4.8) 59.9 (15.0) 92.0 (13.0) 80.9 (13.4) 89.4 (12.2)FRC (% predicted)† 133.5 (35.9) 113.9 (25.2) 89.5 (18.0) 75.9 (14.5) 86.0 (16.2)Reversibility 16.4 (12.4) 24.1 (18.7) 6.2 (8.1) 5.7 (5.3) 6.9 (5.8)PEFR variability 34.1 (15.2) 33.3 (15.3) 16.7 (9.6) 18.8 (8.1) 15.9 (7.5)kCOcorr (% predicted)‡ 73.5 (21.3) 99.4 (18.7) 98.4 (14.5) 106.8 (13.9) 102.0 (13.3)FeNO 12.3 (8.3) 42.1 (41.2) 28.9 (24.6) 21.2 (20.4) 42.7 (41.3)IgE 397 (72) 452 (1103) 181 (617) 203 (663) 428 (1543)hsCRP 2.7 (2.7) 3.3 (6.4) 1.7 (1.2) 4.0 (2.9) 2.9 (5.2)Age of Onset 35.5 (19.8) 11.5 (10.5) 45.8 (11.7) 32.6 (15.9) 11.1 (9.8)BMI 26.2 (4.3) 26.5 (5.4) 27.6 (4.5) 36.3 (6.0) 27.3 (6.4)SGRQ 43.6 (16.8) 26.2 (15.0) 20.8 (16.8) 35.3 (15.1) 15.3 (10.6)Pack years 35.55 (17.8) 4.4 (9.0) 7.9 (13.0) 14.7 (18.8) 1.3 (3.8)
Values reported as mean (SD); †pre-bronchodilator; ‡post-bronchodilator;§Log transformed

152 phase 2
obstruction. These may represent mild (155 subjects) and moderate to
severe (59 subjects) atopic asthma respectively.
Examining the AGW4 solution, the cluster of 141 subjects did not
have a clearly recognisable clinical pattern. Age of onset was relatively
late, but the majority of other variables had intermediate values of
unclear significance. However in the AGW5 solution the cluster of
141 separates into two groups; a group of 80 participants with mild,
adult-onset disease and normal lung function, and a group of 61
people characterized by obesity and late onset disease with relatively
preserved lung function but poor health status and an elevated hsCRP
suggestive of systemic inflammation. The two groups show clear
separation on the majority of cluster variables.
In light of the clear, clinically coherent, differences between the
groups identified by the AGW5 solution and because it fulfilled the
preferred size criteria, this was chosen as the solution to be used for
phenotype description and ICS responsiveness analyses. The minimal
disease group (cluster 3) was used as a reference group for ICS
responsiveness.
diana–euclidean
The dendrogram generated by the DIANA algorithm with Euclidean
distance metric is shown in Figure 10.3a. ASW was highest for the two
cluster solution and dropped markedly above four clusters, suggesting
separation was not distinct with more than four clusters. However the
gap statistic, although not clearly separating groups (Figure 10.3c), was
maximal for three and five cluster solutions (Figure 10.3d), suggesting

10.1 results 153
these may be the most appropriate choices. Only two and three cluster
solutions had more than 10 participants in each cluster (Table 10.7),
therefore the three cluster solution had the best balance between
cluster size and gap statistic and was used for examination of cluster
characteristics (Table 10.8).
Table 10.7: Number of participants per cluster for Diana–Euclidean solution
number of clusters participants in cluster
in solution 1 2 3 4
Two cluster 359 30 – –Three cluster 359 18 12 –Four cluster 359 18 11 1
Table 10.8: Characteristics of Diana–Euclidean solution
characteristic cluster 1 cluster 2 cluster 3
N=16 N=10 N=363
FEV1/FVC ratio (%)† 41.5 (13.3) 45.5 (6.8) 72.5 (9.6)FEV1 (% predicted)† 44.3 (22.6) 45.4 (13.9) 84.8 (15.3)FRC (% predicted)† 160.4 (30.2) 143.7 (16.5) 88.5 (18.9)Reversibility 20.5 (13.6) 38.1 (31.8) 8.6 (8.8)PEFR variability 30.9 (16.5) 39.9 (17.5) 19.6 (11.4)kCOcorr (% predicted)‡ 60.1 (18.3) 91.7 (23.0) 101.3 (14.6)FeNO 16.0 (15.1) 44.5 (41.4) 34.3 (35.4)IgE 399 (1083) 860 (2263) 323 (1114)hsCRP 5.4 (9.7) 5.3 (6.9) 2.7 (3.8)Age of Onset 42.1 (15.5) 16.7 (17.1) 23.1 (18.9)BMI 25.5 (5.2) 24.7 (4.3) 28.8 (6.6)SGRQ 47.5 (16.7) 43.2 (15.1) 21.8 (15.5)Pack years 38.9 (21.2) 7.9 (12.8) 6.7 (13.0)
N = 389, †Not used in cluster analysis, logarithm used.

154 phase 2
050100150200
Height
(a)
Den
drog
ram
for
Dia
na–E
uclid
ean
solu
tion
●
●
●
●●
●
●●
●
0.100.200.30
Num
ber
of c
lust
ers
Average silhouette width
23
45
67
89
10
(b)
Ave
rage
silh
ouet
tew
idth
●●
●●
●●
●●
●●
0.00.20.40.60.81.0
Num
ber
of c
lust
ers
Gap statistic
12
34
56
78
910
(c)
Gap
stat
isti
c
●
●
●
●
●
●●
●
●
●
1.1301.1351.1401.1451.150
Num
ber
of c
lust
ers
Gap statistic
12
34
56
78
910
(d)
Gap
stat
isti
c(l
imit
edy
axis
)
Figu
re10.3
:Den
drog
ram
and
clus
ter
sele
ctio
nst
atis
tics
for
Dia
na–E
uclid
ean
solu
tion
10.1 results 155
Examination of the three cluster solution showed clinically recognis-
able patterns, with a clear separation by age of onset and severity of
obstruction.
Cluster one may be characterised as severe obstruction with late
onset disease and reduced transfer factor. Participants have a low
FeNO and a significant smoking history but elevated IgE and marked
reversibility. This is the same pattern of disease seen in cluster one for
the AGW5 solution and would therefore be consistent with the overlap
group.
Cluster two also has severe obstruction with marked reversibility, but
with an earlier onset, less than 10 pack year smoking history, elevated
FeNO and an extremely high IgE. This group may be characterised as
severe asthma with evidence of atopy and probable eosinophilia, based
on FeNO and is therefore a similar pattern to cluster two in AGW5. Both
clusters one and two have a high symptom burden as measured by
SGRQ.
The final cluster contains the majority of participants and therefore
has characteristics very similar to the mean for all participants, with
the exception of lower reversibility and less cigarette exposure. It is not
clear that this represents a distinct phenotypic group and is probably
an aggregation of more than one pattern of airways disease.
As this three cluster solution contained two groups with less than 30
participants it did not meet the pre-specified size criteria and was not
used for further analysis

156 phase 2
diana–gower
The dendrogram generated by the DIANA algorithm with Gower
distance metric is shown in Figure 10.4a.
ASW was highest for the two cluster solution and dropped rapidly
above three clusters, suggesting modest separation with more than
three clusters. The gap statistic again did not show strong evidence but
was maximal for the 6 cluster solution (Figure 10.4d). Division into two
or more clusters meant that there were less than 30 participants in one
or more clusters (Table 10.9) and this was therefore not the preferred
solution for phenotype description.
Table 10.9: Number of participants per cluster for Diana–Gower solution
number of clusters participants in cluster
in solution 1 2 3 4 5
Two cluster 363 26 – – –Three cluster 363 16 10 – –Four cluster 342 21 16 10 –Five cluster 247 95 21 16 10
As an exploratory analysis, the characteristics of the five cluster
solution (Table 10.10) were explored and compared with the AGW5
solution.
The Diana–Gower 5 (DG5) solution showed comparable patterns to
those seen with the Agnes–Gower–Ward (AGW) approach (Table 10.10).
The 16 participant cluster had characteristics similar to the AGW5
overlap group; severe obstruction with reduced transfer factor and
significant smoking history, but marked variability and raised IgE.
Similarly the 247 and 10 participant clusters showed evidence of mild
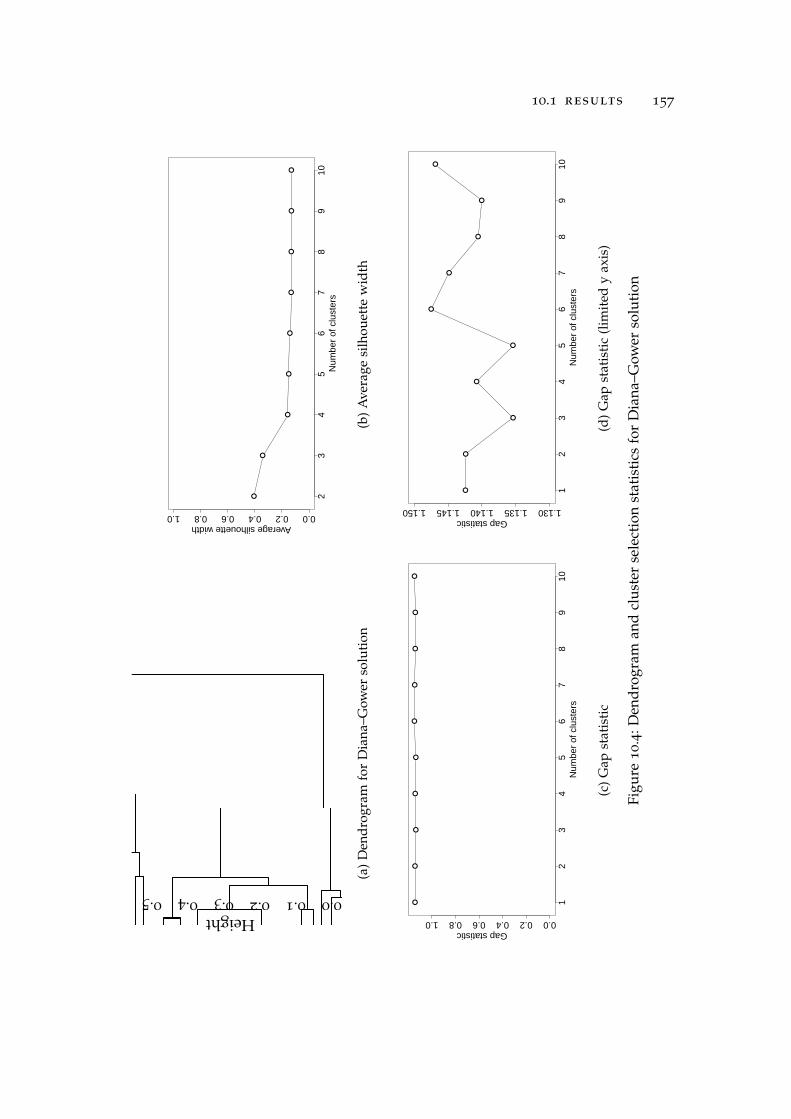
10.1 results 157
0.00.10.20.30.40.5Height
(a)
Den
drog
ram
for
Dia
na–G
ower
solu
tion
●
●
●●
●●
●●
●
0.00.20.40.60.81.0
Num
ber
of c
lust
ers
Average silhouette width
23
45
67
89
10
(b)
Ave
rage
silh
ouet
tew
idth
●●
●●
●●
●●
●●
0.00.20.40.60.81.0
Num
ber
of c
lust
ers
Gap statistic
12
34
56
78
910
(c)
Gap
stat
isti
c
●●
●
●
●
●
●
●●
●
1.1301.1351.1401.1451.150
Num
ber
of c
lust
ers
Gap statistic
12
34
56
78
910
(d)
Gap
stat
isti
c(l
imit
edy
axis
)
Figu
re10.4
:Den
drog
ram
and
clus
ter
sele
ctio
nst
atis
tics
for
Dia
na–G
ower
solu
tion

158 phase 2
Table 10.10: Characteristics of Diana–Gower solution
variable cluster
1 2 3 4 5
(n=16) (n=10) (n=21) (n=247) (n=95)
FEV1/FVC ratio (%)† 38.4 (10.4) 42.4 (5.3) 77.4 (7.0) 72.5 (10.1) 71.2 (8.0)FEV1 (% predicted)† 37.9 (14.7) 40.4 (12.6) 79.2 (14.1) 85.1 (15.6) 85.3 (14.3)FRC (% predicted)† 158.7 (31.4) 148.0 (21.8) 72.3 (18.2) 91.8 (19.7) 85.9 (18.3)Reversibility 22.7 (14.8) 36.1 (35.1) 7.8 (7.7) 9.9 (9.7) 5.9 (6.7)PEFR variability 35.9 (19.7) 36.6 (14.1) 22.5 (11.4) 19.5 (12.0) 19.4 (9.7)kCOcorr (% predicted)‡ 62.8 (20.3) 90.4 (29.2) 102.2 (16.3) 102.3 (14.0) 97.1 (16.5)FeNO 13.2 (9.7) 46.0 (43.2) 18.3 (17.3) 41.1 (40.2) 20.1 (12.1)IgE 413 (1146) 1170 (2466) 328 (863) 370 (1264) 177 (581)hsCRP 3.6 (2.9) 10.2 (13.5) 11.2 (11.1) 1.8 (1.7) 2.9 (2.1)light-grayAge of Onset 46.5 (10.6) 12.2 (12.8) 20.9 (18.2) 15.2 (14.0) 44.2 (13.2)BMI 26.7 (5.5) 23.8 (3.8) 42.7 (7.6) 26.6 (4.8) 31.5 (5.7)SGRQ 49.8 (16.2) 37.7 (17.1) 39.3 (14.9) 16.9 (11.9) 32.0 (17.2)Pack years 39.0 (22.9) 9.2 (11.1) 5.5 (12.7) 3.8 (9.7) 15.0 (17.3)
N = 389, †Not used in cluster analysis, logarithm used. Values reported as mean (SD)†pre-bronchodilator ‡post-bronchodilator
10.1 results 159
and severe atopic asthma respectively, the 21 subject cluster appeared
to represent an obesity cluster similar to AGW5 cluster 4, and the 95
participant cluster appeared to be a mild/minimal disease group with
relatively recent onset symptoms.
agnes–euclidean
The dendrogram generated by the AGNES algorithm with Euclidean
distance metric is shown in Figure 10.5a.
Without the use of Ward’s method this approach did not produce
any significant separation of the participants (Table 10.11). Even the
two cluster solution contained a group with less than 10 participants
and the Agnes–Euclidean approach was therefore not pursued further
Table 10.11: Number of participants per cluster for Agnes–Euclidean solution
number of clusters participants in cluster
in solution 1 2 3
Two cluster 380 9 –Three cluster 380 8 1
agnes–gower
The dendrogram generated by the AGNES algorithm with Gower
distance metric is shown in Figure 10.6a.
As with Agnes–Euclidean, without the use of Ward’s method this
approach led to minimal separation of the participants (Table 10.12).
Both groups in the two cluster solution contain more than 10
participants so the characteristics of the two cluster solution were
explored (Table 10.13).

160 phase 2
050100150
Height
(a)
Den
drog
ram
for
Agn
es–E
uclid
ean
solu
tion
●
●●
●●
●●
●●
0.00.20.40.60.81.0
Num
ber
of c
lust
ers
Average silhouette width
23
45
67
89
10
(b)
Ave
rage
silh
ouet
tew
idth
●●
●●
●●
●●
●●
0.00.20.40.60.81.0
Num
ber
of c
lust
ers
Gap statistic
12
34
56
78
910
(c)
Gap
stat
isti
c
●
●
●
●
●
●
●
●
●
●
1.1301.1351.1401.1451.150
Num
ber
of c
lust
ers
Gap statistic
12
34
56
78
910
(d)
Gap
stat
isti
c(l
imit
edy
axis
)
Figu
re10.5
:Den
drog
ram
and
clus
ter
sele
ctio
nst
atis
tics
for
Agn
es–E
uclid
ean
solu
tion

10.1 results 161
0.000.050.100.150.200.250.300.35
Height
(a)
Den
drog
ram
for
Agn
es–G
ower
solu
tion
●
●
●●
●●
●●
●
0.00.20.40.60.81.0
Num
ber
of c
lust
ers
Average silhouette width
23
45
67
89
10
(b)
Ave
rage
silh
ouet
tew
idth
●●
●●
●●
●●
●●
0.00.20.40.60.81.0
Num
ber
of c
lust
ers
Gap statistic
12
34
56
78
910
(c)
Gap
stat
isti
c
●
●
●●
●
●
●
●
●
●
1.1301.1351.1401.1451.150
Num
ber
of c
lust
ers
Gap statistic
12
34
56
78
910
(d)
Gap
stat
isti
c(l
imit
edy
axis
)
Figu
re10.6
:Den
drog
ram
and
clus
ter
sele
ctio
nst
atis
tics
for
Agn
es–G
ower
solu
tion

162 phase 2
Table 10.12: Number of participants per cluster for Agnes–Gower solution
number of clusters participants in cluster
in solution 1 2 3
Two cluster 376 13 –Three cluster 376 12 1
Table 10.13: Agnes–Gower 2 cluster comparison by analysis variables
variable cluster
1 2
(n=376) (n=13)
FEV1/FVC ratio (%)† 71.5 (10.6) 33.8 (6.2)FEV1 (% predicted)† 83.5 (16.5) 29.6 (6.6)FRC (% predicted)† 90.7 (21.4) 173.2 (26.5)Reversibility 9.1 (9.6) 35.9 (29.3)PEFR variability 20.1 (12.0) 39.1 (15.6)kCOcorr (% predicted)‡ 100.5 (15.6) 60.7 (24.3)FeNO 34.0 (35.1) 25.1 (38.3)IgE 328.2 (1112.4) 762.1 (2191.2)hsCRP 2.7 (3.8) 8.2 (12.2)Age of Onset 23.4 (18.9) 36.7 (21.4)BMI 28.7 (6.5) 24.2 (5.7)SGRQ 22.8 (16.0) 50.5 (16.8)Pack years 7.4 (13.9) 31.4 (26.5)
Values reported as mean (SD); †pre-bronchodilator; ‡post-bronchodilator.
The larger group does not appear to describe a potential phenotype
as it contains almost all participants. The second cluster again has
the characteristics of an overlap group. This particular group includes
particularly severely obstructed individuals, with a mean FEV1 of 29.6
(6.6) percent predicted. The reversibility and raised IgE are greater than
in the AGW5, as is the hsCRP, suggesting that this pattern is driven by
a severe subset of the individuals who make up the overlap cluster in
other solutions.
10.1 results 163
agnes–euclidean–ward
The dendrogram generated by the AGNES algorithm using Ward’s
method and Euclidean distance metric is shown in Figure 10.7a.
Cluster separation was modest based on the ASW (Figure 10.7b). The
gap statistic was maximal for a six cluster solution (Figure 10.7c) but
the solutions with 3 or more clusters did not fulfil the size criteria
and so could not be used for cluster description (Table 10.14). The five
cluster solution was therefore characterised to assess consistency with
the AGW5 clusters (Table 10.15).
Table 10.14: Number of participants per cluster for Agnes–Euclidean–Wardsolution
number of clusters cluster
in solution 1 2 3 4 5 6
Two cluster 286 103 – – – –Three cluster 286 89 14 – – –Four cluster 142 144 89 14 – –Five cluster 99 43 144 89 14 –Six cluster 99 43 144 73 16 14
The overall pattern of the five clusters was the same as for the AGW5
solution, and the same five phenotypes were identified: Asthma / COPD
overlap, moderate-severe young onset atopic asthma, mild reference
group, obese with co-morbidities, and mild young onset atopic asthma.
There were some differences due to the different proportions in
each cluster. The overlap group had more severe airflow obstruction,
suggesting this was a severe subgroup of the overlap group. Mean
hsCRP was relatively high, 7.6 (11.9), but on examination this was due
to two outlier readings affecting the mean due to the relative small

164 phase 2
0100200300400500600700
Height (a)
Den
drog
ram
for
Agn
es–E
uclid
ean
–War
dso
luti
on
●●
●●
●
●●
●●
0.00.20.40.60.81.0
Num
ber
of c
lust
ers
Average silhouette width
23
45
67
89
10
(b)
Ave
rage
silh
ouet
tew
idth
●●
●●
●●
●●
●●
0.00.20.40.60.81.0
Num
ber
of c
lust
ers
Gap statistic
12
34
56
78
910
(c)
Gap
stat
isti
c
●
●●
●
●
●
●
●
●
●
1.1301.1351.1401.1451.150
Num
ber
of c
lust
ers
Gap statistic
12
34
56
78
910
(d)
Gap
stat
isti
c(l
imit
edy
axis
)
Figu
re10.7
:Den
drog
ram
and
clus
ter
sele
ctio
nst
atis
tics
for
Agn
es–E
uclid
ean–
War
dso
luti
on

10.1 results 165
cluster size. The median hsCRP in this group was 2.8. Separation of
clusters by FeNO was less marked than in the AGW5 solution but overall
the Agnes–Euclidean–Ward 5 (AEW5) and AGW5 solutions were very
similar.
Table 10.15: Agnes–Euclidean–Ward 5 cluster characteristics
variable cluster
1 2 3 4 5
(n=14) (n=89) (n=99) (n=43) (n=144)
FEV1/FVC ratio (%)† 34.3 (6.4) 59.4 (9.5) 73.3 (7.4) 74.5 (6.3) 77.2 (7.4)FEV1 (% predicted)† 30.9 (8.2) 67.6 (14.8) 91.8 (14.2) 81.5 (11.3) 88.6 (12.8)FRC (% predicted)† 173.6 (24.1) 112.1 (20.0) 89.1 (16.3) 73.5 (11.6) 83.3 (16.0)Reversibility 37.3 (27.7) 17.1 (12.3) 6.5 (8.3) 5.2 (4.9) 6.9 (5.7)PEFR variability 38.1 (15.5) 31.6 (15.1) 15.8 (7.4) 21.5 (9.2) 15.5 (7.8)kCOcorr (% predicted)‡ 63.5 (25.7) 93.3 (17.9) 98.8 (14.4) 110.4 (12.1) 103.0 (13.6)FeNO 33.2 (39.9) 36.0 (39.6) 31.0 (30.2) 22.9 (22.1) 37.5 (37.6)IgE 727 (2109) 402 (718) 243 (796) 170 (424) 389 (1556)hsCRP 7.6 (11.9) 2.9 (4.6) 2.0 (1.6) 3.4 (2.7) 2.8 (4.6)Age of Onset 38.2 (19.1) 19.2 (17.1) 41.7 (11.9) 37.3 (18.4) 8.9 (7.1)BMI 24.1 (5.5) 27.7 (6.8) 28.9 (5.2) 35.3 (7.2) 27.3 (5.8)SGRQ 45.6 (20.3) 30.5 (16.0) 19.1 (14.5) 43.0 (13.1) 14.8 (9.7)Pack years 27.6 (27.9) 13.8 (17.4) 6.7 (10.4) 16.0 (22.1) 1.5 (4.4)
Values reported as mean (SD); †pre-bronchodilator; ‡post-bronchodilator; §Logtransformed

166 phase 2
Phenotype Description
Having reviewed the results of all six clustering approaches, the
Agnes–Gower–Ward 5 solution was selected for phenotype description
as the clusters showed clinically coherent patterns of disease and met
the preferred size criteria. Table 10.16 shows the AGW5 clusters with
the 13 analysis variables as previously shown in Table 10.6 but with
the addition of log transformed FeNO, IgE and hsCRP to reduce the
effect of outlier values, and with differences from the mean of all
451 participants expressed qualitatively to aid recognition of disease
patterns.
Examination of Table 10.16 reveals that the ’asthma/COPD overlap’
(cluster 1) and ’moderate-severe atopic asthma’ (cluster 2) phenotypes
share characteristics of moderate-severe airflow obstruction, hyperin-
flation, significant bronchodilator reversibility, PEFR variability, raised
total IgE and poor respiratory health status; but that the overlap group
has greater cigarette exposure, later age of onset, lower FeNO, lower
transfer factor and raised hsCRP. The difference in hsCRP can only
be reliably assessed with the log transformed values, as the mean
hsCRP for cluster 2 is increased by a small number of very high hsCRP
values. The ’mild/reference’ group (cluster 3) is distinguished by a very
late age of onset and the highest mean FEV1 of any phenotype. The
’obesity’ group is characterised by a markedly raised hsCRP, later onset
disease, raised BMI, clinically significant cigarette exposure and worse
respiratory health status. The ’mild asthma’ group (cluster 5) has raised

10.1 results 167
Table 10.16: Agnes–Gower–Ward 5 cluster comparison by analysis variables
variable cluster
1 2 3 4 5
(n=34) (n=59) (n=80) (n=61) (n=155)
phenotype Overlap Mod-severe Mild/ Obese/ Mild
atopic asthma reference co-morbid atopic asthma
FEV1/FVC ratio (%)† 51.5 (15.2) 56.0 (9.3) 73.8 (7.1) 74.0 (6.5) 76.6 (7.8)FEV1 (% predicted)† 62.02(4.8) 59.9 (15.0) 92.0 (13.0) 80.9 (13.4) 89.4 (12.2)FRC (% predicted)† 133.5 (35.9) 113.9 (25.2) 89.5 (18.0) 75.9 (14.5) 86.0 (16.2)Reversibility 16.4 (12.4) 24.1 (18.7) 6.2 (8.1) 5.7 (5.3) 6.9 (5.8)PEFR variability 34.1 (15.2) 33.3 (15.3) 16.7 (9.6) 18.8 (8.1) 15.9 (7.5)kCOcorr (% predicted)‡ 73.5 (21.3) 99.4 (18.7) 98.4 (14.5) 106.8 (13.9) 102.0 (13.3)FeNO 12.3 (8.3) 42.1 (41.2) 28.9 (24.6) 21.2 (20.4) 42.7 (41.3)Log FeNO 2.3 (0.6) 3.4 (0.8) 3.1 (0.7) 2.8 (0.7) 3.4 (0.8)IgE 397 (72) 452 (1103) 181 (617) 203 (663) 428 (1543)Log IgE 4.5 (1.8) 5.0 (1.7) 3.8 (1.6) 3.6 (1.8) 4.6 (1.7)hsCRP 2.7 (2.7) 3.3 (6.4) 1.7 (1.2) 4.0 (2.9) 2.9 (5.2)Log hsCRP 0.7 (0.7) 0.5 (1.0) 0.3 (0.7) 1.1 (0.8) 0.5 (0.9)Age of Onset 35.5 (19.8) 11.5 (10.5) 45.8 (11.7) 32.6 (15.9) 11.1 (9.8)BMI 26.2 (4.3) 26.5 (5.4) 27.6 (4.5) 36.3 (6.0) 27.3 (6.4)SGRQ 43.6 (16.8) 26.2 (15.0) 20.8 (16.8) 35.3 (15.1) 15.3 (10.6)Pack years 35.55 (17.8) 4.4 (9.0) 7.9 (13.0) 14.7 (18.8) 1.3 (3.8)
qualitative comparison of cluster variables
1 2 3 4 5
FEV1/FVC ratio (%)† – – – – • • •FEV1 (% predicted)† – – – – • • •FRC (% predicted)† + + + + • • •Reversibility + + + + – + – –PEFR variability + + + + – + – –kCOcorr (% predicted)‡ – – • • • •FeNO§ – – • • – +IgE§ • + – – +hsCRP§ + – • + + –Age of Onset + + – – + + + + – –BMI • • • + + •SGRQ + + + + • + + – –Pack years ++ + – + + – –
Values reported as mean (SD); †pre-bronchodilator; §Log transformed ‡post-bronchodilator+ + Greater than 20% above the overall mean value+ Greater than 10% and less than or equal to 20% above the overall mean value•Within 10% of the overall mean value– Less than 20% and more than 10% below the overall mean value– – More than 20% below the overall mean value

Table 10.17: Description of phenotype characteristics based on for AGW5 classification
characteristic agnes-gower-ward-five cluster
1 2 3 4 5
Overlap Mod-severe Mild/ Obese/ Mild
atopic asthma reference co-morbid atopic asthma
demographics
Age 56.1 (8.5) 53.4 (13.5) 55.8 (11.3) 53.8 (11.3) 40.1 (12.6)
Height 169.4 (9.0) 169.0 (9.5) 170.4 (8.0) 168.7 (9.3) 170.4 (8.8)
Sex (Male) 22/34 (64.7) 24/59 (40.7) 40/80 (50.0) 27/61 (44.3) 67/155 (43.2)
risk factors
Smoking status: Current 22/34 (64.7) 6/59 (10.2) 8/80 (10.0) 11/61 (18.0) 11/155 (7.1)
Ex 12/34 (35.3) 22/59 (37.3) 33/80 (41.3) 26/61 (42.6) 39/155 (25.2)
Never 0/34 (0) 31/59 (52.5) 39/80 (48.8) 24/61 (39.3) 105/155 (67.7)
Biomass exposure 2/34 (5.9) 14/59 (23.7) 11/80 (13.8) 10/61 (16.4) 35/155 (22.6)
Occupational exposure 23/34 (67.7) 27/59 (45.8) 43/80 (53.8) 35/61 (57.4) 73/155 (47.1)
previous respiratory diagnoses
Asthma 20/34 (58.8) 55/59 (93.2) 35/80 (43.8) 42/61 (68.9) 135/155 (87.1)
Chronic bronchitis 12/34 (35.3) 9/59 (15.3) 6/80 (7.5) 7/61 (11.5) 21/155 (13.6)
COPD 7/34 (20.6) 6/59 (10.2) 2/80 (2.5) 2/61 (3.3) 0/155 (0)
Emphysema 5/34 (14.7) 4/59 (6.8) 1/80 (1.3) 3/61 (4.9) 0/155 (0)
No prior diagnosis 8/34 (23.5) 3/59 (5.1) 43/80 (53.8) 17/61 (27.9) 17/155 (11.0)
symptoms
Cough 24/34 (70.6) 34/59 (57.6) 41/80 (51.3) 43/61 (70.5) 62/155 (40.0)
Sputum 23/34 (67.7) 22/59 (37.3) 23/80 (28.8) 24/61 (39.3) 29/155 (18.7)
Rhinitis 19/34 (55.9) 43/59 (72.9) 50/80 (62.5) 39/61 (63.9) 137/155 (88.4)
gord 17/34 (50.0) 24/59 (40.7) 46/80 (57.5) 35/61 (57.4) 56/155 (36.1)
ACQ-7 score 1.9 (1.0) 1.5 (0.8) 0.5 (0.5) 1.0 (0.7) 0.6 (0.5)
atopy
Phadiatop (Positive) 15/34 (44.1) 50/59 (84.8) 33/80 (41.3) 24/61 (39.3) 121/155 (78.1)
Eczema diagnosis 13/34 (38.2) 36/59 (61.0) 39/80 (48.8) 28/61 (45.9) 97/155 (62.6)
co-morbidities
Cardiovascular disease 8/34 (23.5) 8/59 (15.2) 14/80 (17.5) 15/61 (24.6) 13/155 (8.4)
gord 17/33 (51.5) 16/59 (27.1) 23/80 (28.8) 27/61 (44.3) 35/155 (22.6)
gord on treatment 10/34 (29.4) 13/59 (22.0) 28/80 (35.0) 25/61 (41.0) 32/155 (20.7)
Diabetes 3/33 (9.1) 6/59 (10.2) 5/80 (6.3) 8/61 (13.1) 5/155 (3.2)
Depression or anxiety 8/33 (24.2) 7/59 (11.9) 22/80 (27.5) 22/61 (36.1) 49/154 (31.8)
Hypertension 9/33 (27.3) 14/58 (24.1) 22/80 (27.5) 32/61 (52.5) 25/130 (16.1)
medication use in last 12 months
Any inhaler 24/34 (70.6) 57/59 (96.6) 43/80 (53.8) 38/61 (62.3) 118/155 (76.1)
ICS 11/34 (32.4) 31/59 (52.5) 25/80 (31.3) 18/61 (29.5) 56/155 (36.1)
SABA use in 12 months 20/34 (58.8) 52/59 (88.1) 38/80 (47.5) 37/61 (60.7) 114/155 (73.6)
Combination SABA/LABA 7/33 (21.2) 15/58 (25.9) 8/80 (10.0) 8/61 (13.1) 21/155 (13.6)
LABA use in 12 months 5/34 (14.7) 10/58 (17.2) 5/80 (6.3) 5/61 (8.2) 9/155 (5.8)
LAMA use in 12 months 2/34 (5.9) 5/58 (8.6) 0/80 (0) 0/61 (0) 0/155 (0)
healthcare use in last 12 months
Oral Steroid 5/34 (14.7) 11/58 (19.0) 9/80 (11.3) 9/61 (14.8) 15/154 (9.7)
Urgent ED/Hospital visit 2/34 (5.9) 1/59 (1.7) 2/80 (2.5) 3/61 (4.9) 2/155 (1.3)
Courses of antibiotic 0.4 (0.7) 0.6 (0.8) 0.7 (1.0) 0.8 (1.3) 0.5 (0.8)
Chest infections 0.6 (0.7) 0.9 (1.0) 0.8 (1.1) 1.1 (1.5) 0.8 (1.0)
lung function
MMEF 25-75% 31.6 (20.1) 32.2 (13.8) 84.8 (28.7) 74.1 (28.5) 81.5 (24.9)
TLC/RV 2.4 (0.7) 2.5 (0.6) 3.1 (0.7) 2.9 (0.6) 3.6 (0.8)
Conductance (sGaw) 56.5 (51.6) 41.8 (19.1) 87.0 (51.3) 66.3 (19.9) 86.9 (43.7)
biomarkers
Eosinophils 0.2 (0.1) 0.3 (0.3) 0.2 (0.1) 0.2 (0.2) 0.2 (0.1)
Neutrophils 4.6 (1.3) 4.0 (2.0) 3.8 (1.3) 4.1 (1.3) 3.8 (1.3)
White cell count 7.8 (2.0) 7.4 (4.0) 6.9 (1.8) 7.4 (1.7) 6.9 (1.7)
Categorical variables expressed as N/N (%), continuous variables expressed as mean (SD)

10.1 results 169
IgE and FeNO with early onset disease, good respiratory health status
and minimal cigarette smoke exposure.
Due to the nature of cluster analysis, clusters will usually show
differences when compared using the cluster analysis variables, as seen
in the previous section. In order to determine if the groups are clinically
meaningful, clusters must be compared using descriptor variables not
included in the cluster analysis. Table 10.17 describes the candidate
phenotypes using variables which were not included in the cluster
analysis, including demographics, risk factors, previous respiratory
diagnoses, symptoms, atopy, co-morbidities, medication and healthcare
utilisation, lung function and biomarkers.
cluster 1 : asthma/copd overlap
All members of the overlap group were current (64.7%) or ex (35.5%)
smokers. Over half had a diagnosis of asthma (58.8%) but doctor
diagnosed chronic bronchitis, COPD and emphysema were also preva-
lent (35.3%, 20.6% and 14.7% respectively). Rate of productive cough
(67.7%) were markedly higher than for other groups. Individuals with
the overlap phenotype had the worst symptom control, as measured
by ACQ-7, and high rates of co-morbidities including cardiovascular
disease and gastro-oesophageal reflux disease (GORD). There was some
evidence of systemic inflammation, with the highest mean neutrophil
and total white cell counts, together with a mean log hsCRP of greater
than 10% higher than the sample mean. This group also had the highest
reported level of occupational exposure to dust and fumes.

170 phase 2
cluster 2 : moderate-severe young-onset atopic asthma
Cluster 2 showed characteristics consistent with moderate to severe
young-onset atopic asthma. As well as elevated FeNO this group had
high rates of eczema, rhinitis and atopy, as measured by serum
Phadiatop. Almost all individuals in this cluster had a doctor’s
diagnosis of asthma, although seven individuals in the moderate
to severe group also had a diagnosis of COPD or emphysema. The
moderate to severe asthma phenotype had the highest rates of oral
steroid use in the last year (19%) and almost all members (96.6%) had
used an inhaler in the last 12 months. The mean ACQ-7 score of 1.5 (0.8)
is consistent with poorly controlled asthma.
cluster 3 : mild/intermittent
The mild disease cluster (cluster 3) had preserved lung function with
the highest FEV1 percent predicted, normal FeNO, low rates of atopy,
and the lowest ACQ-7 scores. This group had no dominant phenotypic
features, despite having been symptomatic in the last 12 months, and
may represent people with intermittent disease that was quiescent at
the time of testing. This cluster was used as a reference group for the
ICS responsiveness analysis.
cluster 4 : obese with co-morbidities
The obesity phenotype (cluster 4) was characterised by relatively
prevalent GORD and high rates of all co-morbidities. Participants with
this phenotype reported the most chest infections, courses of antibiotics
for respiratory indications, and courses of oral corticosteroids, despite
relatively preserved lung function.
10.1 results 171
Neutrophils and total white cell count were relatively high, with only
the overlap group having higher values. The obese group also had
the highest hsCRP and this cluster appears to represent a phenotype
of obesity with co-morbidities and systemic inflammation.
cluster 5 : mild young-onset atopic asthma
The mild young-onset atopic asthma phenotype shows similar pat-
terns to the moderate-severe asthma phenotype, including prominent
rhinitis and eczema, but with relatively preserved lung function and
much better asthma control, as measured by ACQ-7. Rates of cough
and sputum production were lowest in this phenotype but biomass
exposure was relatively high, 35/155 (22.6%), with a similar rate to the
moderate-severe asthma phenotype.
Bronchodilator responsiveness
Change in FEV1 in response to salbutamol and ipratropium on
different days is shown for each phenotype in Table 10.18
All phenotypes showed mean salbutamol reversibility equivalent to
or greater than ipratropium. No phenotype demonstrated a preferential
response to ipratropium on average. The overlap groups showed a
marked response to bronchodilators, with an average change which
would be considered significant by ATS criteria (>12% and >200ml).
The moderate to severe atopic asthma phenotype showed even greater
reversibility, with a mean change of 480ml in response to 400µcg
salbutamol.

172 phase 2
Table 10.18: FEV1 change with bronchodilator by phenotype
agw5 cluster p value
1 2 3 4 5
Overlap Mod - severeatopic asthma
Mild /reference
Obese/co-morbid
Mild atopicasthma
N=34 N=59 N=80 N=61 N=155
salbutamol
FEV1 (%)† 16.4 (12.4) 24.1 (18.7) 6.2 (8.1) 5.7 (5.3) 6.9 (5.8) <0.001
FEV1 (l)‡ 0.30 (0.20) 0.48 (0.36) 0.17 (0.22) 0.15 (0.14) 0.23 (0.19) <0.001
ipratropium
FEV1 (%)† 13.6 (10.5) 18.4 (15.3) 5.8 (6.2) 5.3 (6.2) 6.1 (5.4) <0.001
FEV1 (l)‡ 0.26 (0.18) 0.35 (0.27) 0.16 (0.80) 0.15 (0.15) 0.20 (0.17) <0.001
Values given as mean (SD). †Change in FEV1 expressed as percentage changerelative to baseline; ‡Absolute change in FEV1, expressed in litres.
The obese/co-morbid, mild atopic asthma, and reference groups
had more modest responses to both salbutamol and ipratropium. All
groups had a mean increase in FEV1 post-bronchodilator of at least
150ml, which is greater than the suggested minimally detectable change
in FEV1 of 100ml [Donohue, 2005]. Although these changes are of a size
which individuals may notice symptomatically, the percentage change
from baseline did not meet the ATS criteria for significance due to their
relatively preserved lung function at baseline.
Generation of Allocation Rule
Using the Rpart function, a classification tree was constructed which
could allocate participants to their assigned cluster with 75% accuracy,
using only age of onset, BMI and FEV1 percent predicted (Figure 10.8).
Using FEV1/FVC ratio in place of FEV1 percent predicted gave
similar classification accuracy. Use of other variable combinations or

10.1 results 173
Age of Onset
< 27.5 yrs
Cluster 4Obese/co-morbid
≥ 27.5 yrs
FEV1% predicted
≥ 73.1
Cluster 5Mild atopic asthma
< 73.1
Cluster 2Mod-severe
atopic asthma
BMI
≥ 31.98< 31.98
FEV1% predicted
≥ 77.4
Cluster 3Mild/reference
< 77.4
Cluster 1Overlap
Figure 10.8: Allocation rule for predicting cluster membership
Cluster membership could be correctly predicted for 75% of participants using theabove allocation rule generated from this dataset.

174 phase 2
addition of non-cluster analysis variables did not significantly improve
classification accuracy.
Exploratory Cluster Analysis using WRS variables
Cluster analysis was performed using the DIANA and AGNES al-
gorithms and Gower distance metric, with nine cluster variables as
described by Weatherall et al. [2009]. To aid meaningful comparison
the number of clusters was set at that described in the original paper.
Therefore the four cluster solution was selected for the DIANA analysis
and five cluster for the AGNES approach. Ward’s method was used with
the AGNES algorithm.
The Diana-Gower 4 cluster solution had group sizes of 13, 57, 113
and 206 participants, and the characteristics are shown in Table 10.19
The Diana-Gower clusters can be characterised as ’asthma / COPD
overlap’, ’moderate-severe atopic asthma’, ’chronic bronchitis in smok-
ers’ and ’mild disease, no specific features’. These groups represent
four of the five clusters described by Weatherall et al. [2009], however
the pure emphysema group they described is not seen in this analysis.
The AGW5 solution with WRS variables also described similar groups.
Cluster 1 had severe airflow obstruction with marked reversibility and
bore some similarity to the overlap group, although the transfer factor
was less markedly reduced and the FeNO higher. Cluster 2 showed the
same pattern with less severe obstruction. The most marked difference
between clusters 1 and 2 was that no subjects in cluster 1 had a
productive cough and all subjects in cluster 2 did, strongly suggesting
that the dichotomous cough question dominated the analysis. Cluster 3

10.1 results 175
Table 10.19: Diana–Gower 4 cluster comparison using WRS variables
variable cluster
1 2 3 4
(n=13) (n=57) (n=113) (n=206)
FEV1/FVC ratio (%)† 34.0 (6.4) 57.2 (7.6) 69.0 (10.3) 76.9 (6.5)FEV1 (% predicted)† 31.3 (8.8) 66.2 (13.5) 79.9 (16.8) 90.3 (12.9)FRC (% predicted)† 170.9 (27.7) 112.7 (20.4) 94.1 (22.9) 83.0 (16.1)Reversibility 29.1 (13.6) 21.3 (17.9) 10.6 (10.3) 5.4 (5.3)kCOcorr (% predicted)‡ 57.2 (19.0) 98.9 (15.5) 99.1 (16.3) 101.8 (15.0)FeNO 15.2 (11.5) 43.5 (37.9) 30.5 (31.6) 34.0 (36.6)Log IgE 4.5 (2.7) 4.6 (1.5) 4.4 (1.9) 4.2 (1.7)Pack years 36.4 (24.7) 6.0 (12.2) 11.8 (17.0) 5.1 (11.0)Productive cough 8 (61.5) 0 (0) 113 (100) 0 (0)
qualitative comparison of continuous cluster variables
1 2 3 4
FEV1/FVC ratio (%)† – – – – • •FEV1 (% predicted)† – – – • +FRC (% predicted)† + + ++ • –Reversibility ++ ++ • – –kCOcorr (% predicted)‡ – – • • •FeNO – – + + • •Log IgE • • • •Pack years + + – – + + – –
Values reported as mean (SD); †pre-bronchodilator; ‡post-bronchodilator; §Logtransformed+ + Greater than 20% above the overall mean value+ Greater than 10% and less than or equal to 20% above the overall mean value•Within 10% of the overall mean value– Less than 20% and more than 10% below the overall mean value– – More than 20% below the overall mean value

176 phase 2
Table 10.20: Agnes–Gower–Ward 5 cluster comparison using WRS variables
variable cluster
1 2 3 4 5
(n=9) (n=49) (n=79) (n=72) (n=180)
FEV1/FVC ratio (%)† 33.6 (6.3) 55.3 (11.3) 64.6 (9.0) 74.8 (6.2) 76.9 (7.4)FEV1 (% predicted)† 30.0 (8.5) 63.7 (22.3) 74.9 (11.6) 85.8 (11.7) 90.6 (14.1)FRC (% predicted)† 162.5 (31.1) 122.4 (30.8) 101.3 (19.2) 83.2 (14.2) 82.9 (17.2)Reversibility 43.9 (30.7) 16.8 (14.0) 15.9 (10.3) 8.0 (6.9) 4.7 (5.3)kCOcorr (% predicted)‡ 84.9 (29.9) 84.9 (23.4) 103.4 (11.9) 103.6 (13.0) 100.0 (16.2)FeNO 37.0 (47.0) 32.3 (34.0) 60.2 (46.7) 27.6 (26.6) 24.88 (24.2)Log IgE 4.8 (2.1) 4.6 (2.0) 5.0 (1.4) 4.2 (1.9) 4.0 (1.7)Pack years 25.4 (28.1) 25.6 (22.0) 2.0 (4.8) 4.8 (8.6) 6.7 (12.9)Productive cough 0 (0) 49 (100) 0 (0) 72 (100) 0 (180)
qualitative comparison of continuous cluster variables
1 2 3 4 5
FEV1/FVC ratio (%)† – – – – • • •FEV1 (% predicted)† – – – – • • +FRC (% predicted)† + + + + • + +Reversibility + + + + + + – – – –kCOcorr (% predicted)‡ – – • • •FeNO • • + + – – –Log IgE + • + • •Pack years + + + + – – – – –
Values reported as mean (SD); †pre-bronchodilator; ‡post-bronchodilator; §Logtransformed+ + Greater than 20% above the overall mean value+ Greater than 10% and less than or equal to 20% above the overall mean value•Within 10% of the overall mean value– Less than 20% and more than 10% below the overall mean value– – More than 20% below the overall mean value

10.2 discussion 177
had features of atopic asthma. Clusters 4 and 5 were groups with mild
disease and no specific phenotypic features, separated by the presence
of cough in all individuals in cluster 4 and none in cluster 5.
10.2 discussion
The hypotheses tested in Phase 2 were:
1. That cluster analysis will identify distinct clinical phenotypes
within the population tested, which will differ significantly in the
characteristics they express.
2. That the clusters identified in the NZRHS will approximate to
clusters described by the WRS.
3. That the response to salbutamol, as measured by change in FEV1,
will differ between clusters.
4. That the response to ipratropium, as measured by change in FEV1,
will differ between clusters.
5. That it will be possible to generate an allocation rule which can
accurately predict cluster membership, using only a subset of the
variables.
These hypotheses will be discussed in turn, followed by further
discussion of findings.
Hypothesis 1
Cluster analysis identified 5 candidate phenotypes using the selected
Agnes–Gower–Ward 5 solution:
Asthma/COPD overlap group (cluster 1)
178 phase 2
Moderate to severe, young-onset atopic asthma (cluster 2)
Mild, young-onset atopic asthma (cluster 5)
Obese with comorbidities (cluster 4)
A mild group with recent onset disease used as a reference group
(cluster 3)
Cluster analysis is predominantly an exploratory technique which
will find groups in any dataset. An unbiased assessment of pheno-
types must consider the possibility that the individuals cannot be
meaningfully subdivided and that a single cluster of all individuals
could be the best solution. It may be that, rather than describing
true phenotypes, these clusters describe patterns within the data that
do not translate to clinically distinct groups. The silhouette width
cannot be used to determine if one cluster is the ideal solution, as
it is only meaningful for solutions of two or more clusters [Everitt
et al., 2011]. The gap statistic can provide some support for deciding
between one or more clusters and it is notable that the gap statistic
was never maximal for k=1, suggesting that there is some natural
clustering within the data. The extent to which these clusters represent
meaningful phenotypes must be judged from their clinical coherence,
difference in treatment outcome, and the consistency with which
they are reproduced in different studies [Weatherall et al., 2010]. All
five phenotypes have supporting evidence, to different degrees, from
previous studies (Part I), increasing the probability that these represent
clinically important entities. The similar mean age in all but the
mild atopic asthma phenotype suggests that these are more likely to
10.2 discussion 179
represent distinct phenotypes than the same phenotype at different
stages of disease.
The consistency of cluster description varied according to phenotype.
As the Agnes-Euclidean solution did not separate into phenotypes
there are a maximum of five approaches which could support each
phenotype. The overlap phenotype was demonstrated in all five
solutions and this provides strong evidence that this pattern represents
a distinct phenotype. The severe young-onset atopic asthma phenotype
was demonstrated in four of the five solutions, with the mild, young-
onset, atopic asthma and mild/intermittent phenotypes separating out
in three of the five solutions. The most novel phenotype, the obese/co-
morbid cluster, was demonstrated in three of the five solutions. Perhaps
most importantly, the three solutions which described five clusters
all identified the same five phenotypes of disease, although with
differences in severity and the proportions in each group. This consis-
tency across the different methodologies suggests that the phenotypes
described are relatively distinct entities; as if the cluster algorithms
were simply partitioning datasets with no underlying structure one
would not expect to see the same patterns with each methodology.
These groups are clinically coherent, described with multiple dif-
ferent approaches, and show different patterns of response to in-
haled bronchodilators and inhaled corticosteroids, as well as having
markedly different patterns using the phenotype descriptor variables
(Table 10.17). Accordingly hypothesis 1 is accepted.

180 phase 2
Hypothesis 2
Comparison of this research with results previously reported from
the WRS has not completely replicated the candidate phenotypes
reported by Weatherall et al. [2009], although some phenotypes are
described by both analyses. The overlap group is reported in both
analyses, which supports the case for this as a valid phenotype. Like-
wise, the atopic asthma (clusters 2 and 5) and mild/reference (cluster
3) phenotypes described here appear similar to the "atopic asthma"
and "mild airflow obstruction without other dominant phenotypic
features" phenotypes identified in the WRS. The pure emphysema and
chronic bronchitis clusters described by Weatherall et al. [2009] were
not reproduced in this study.
Hypothesis 2 is accordingly rejected as not all clusters matched
those described previously, which may in part reflect improvements
in methodology and differences in the population studied. However,
where similar groups are described in both analyses this provides
strong evidence supporting the validity of these candidate phenotypes.
There are two key aspects of the NZRHS methodology which may
have caused differences from the WRS findings. Firstly, although in both
studies participants were drawn from a random population sample,
in the WRS individuals with either symptoms or a reduced FEV1/FVC
ratio were included in the cluster analysis, whereas in the NZRHS all
subjects had current symptoms of wheeze and breathlessness. The
change in selection criteria was essential, as to include asymptomatic
individuals in phase 2 testing would have required a far larger sample
10.2 discussion 181
size. To have 250 subjects eligible for cluster analysis in the WRS
(of whom 175 had complete data), they had to test 750 individuals,
therefore to recruit 450 using the WRS design would have required
up to 2,000 individuals. More importantly, phenotyping symptomatic
participants is more likely to be clinically relevant as the benefit of
treating asymptomatic people who have abnormal lung function has
not been established. One possibility is that this difference in criteria
led to some individuals with COPD who do not perceive themselves as
having either wheeze or breathlessness being omitted from the NZRHS
population, and may explain why the pure emphysema group in the
WRS was not reproduced. The pure emphysema phenotype was not
demonstrated even in the exploratory analysis and this is likely to be
because participants with this pattern of disease were not present in
significant numbers in the NZRHS sample. However, it is relevant to
note that wheeze is a recognised symptom of COPD [GOLD, 2013] and
that, using the same question as in the NZRHS, wheeze is reported by
three-quarters of patients with COPD [Oh et al., 2013]. The screening
questionnaire was therefore expected to identify a substantial number
of people with COPD. Only 78/8,509 (0.9%) individuals responding to
the screening questionnaire stated that they had a doctors diagnosis of
emphysema (Table 9.4) and this proportion is similar to that reported
from the WRS [Shirtcliffe et al., 2007]. Of the 78 people with a diagnosis
of emphysema 60 (77%) reported wheeze. The screening questionnaire
questions do not therefore appear to have excluded a significant
number of individuals with emphysema. Given the low prevalence
of diagnosed emphysema in the population, further exploration of

182 phase 2
the pure emphysema candidate phenotype would require purposive
sampling of people with confirmed COPD and emphysema.
The second key change in methodology was the alteration of
cluster analysis variables, in particular the removal of the dichotomous
question asking about cough with sputum production. Clusters in the
WRS showed complete separation by reported cough and this may have
driven the description of the chronic bronchitis phenotype (cluster
five in Weatherall et al. [2009]). Once the dichotomous question was
removed then other variables became more important in determining
the outcome of the analysis. This interpretation is supported by the
findings of the exploratory cluster analysis using the variables from
Weatherall et al. [2009]. Four of the five phenotypes described in the
previous analysis are reproduced when the same cluster variables are
used on the NZRHS dataset. In particular, the exploratory analysis
demonstrates a chronic bronchitis phenotype not seen in the main
analysis, and the cluster separation by cough is complete for the
AGNES based solution and almost complete for the DIANA solution.
This strongly suggests that when the dichotomous cough question is
included in the variables it dominates the analysis. It was not possible
to apply the methods from the NZRHS to the WRS dataset as not all 13
variables were collected in the previous study.
Hypotheses 3 and 4
The response to salbutamol and ipratropium varied significantly
between phenotypes and hypotheses 3 and 4 are therefore accepted.
The pattern was similar in both bronchodilators, with the ’overlap’

10.2 discussion 183
and ’moderate - severe atopic asthma’ phenotypes having markedly
greater response to bronchodilators than the reference group, both
as a percentage of baseline value and absolute change in litres. The
extent of bronchodilation after salbutamol was equal to or greater than
that achieved with ipratropium for all phenotypes, suggesting that
salbutamol is an appropriate first choice of bronchodilator in all of
the phenotypes described in the study. No phenotype had an average
response to ipratropium greater than that for salbutamol.
Hypothesis 5
The allocation rule constructed using the ’rpart’ function was able
to allocate 75% of participants to the correct cluster using only 3
variables. This is similar to the performance of a previously reported
allocation rule in severe asthma [Moore et al., 2010], and indeed
two of the variables (FEV1 percent predicted and age of onset) are
used in both algorithms. The hypothesis is therefore accepted with
regard to accurately allocating participants from the NZRHS. However,
allocation rules will tend to over-fit the dataset used to generate
them and allocation accuracy is therefore likely to be lower if this
rule was applied in an independent sample [Crawley, 2013; Travers
et al., 2012]. The unexpectedly high proportion of participants with
asthma allows detailed examination of phenotypes within asthma and
permits investigation of the asthma/COPD overlap group, but will
have limited the power of this study to explore phenotypes within
COPD and may explain why the pure emphysema phenotype seen in
other studies was not reproduced. The allocation rule described here

184 phase 2
is likely to perform relatively well in a new sample selected using
the same methodology but, as there were no clusters identified as
representing classical COPD or pure emphysema, the allocation rule
would be unable to distinguish between the overlap group and other
forms of COPD when applied to a sample in which these conditions
are present. To facilitate future studies investigating the overlap group
separately from other forms of COPD, a new allocation rule would need
to be constructed using criteria based on our understanding of the
characteristics of the overlap group. One approach to establishing these
criteria is the consensus methodology reported by Soler-Cataluña et al.
[2012], who have suggested major and minor criteria which can be used
to define the overlap group (Table 10.21).
Table 10.21: Proposed diagnostic criteria for the overlap group
criteria
major
Very positive bronchodilator test(FEV1 increase of > 15% and > 400ml)Eosinophilia in sputumPersonal history of asthma
minor
High total IgE
Personal history of atopyPositive bronchodilator test on 2 or more occasions(FEV1 increase of > 12% and > 200ml)
Criteria taken from Soler-Cataluña et al. [2012] who proposed that 2 major criteriaor 1 major and 2 minor criteria were sufficient to establish the diagnosis of asthmaCOPD/overlap syndrome.
The consensus criteria suggested by this group are consistent with
the overlap phenotype characteristics in this research, however they
10.2 discussion 185
could unfortunately not be accurately tested against NZRHS data as
salbutamol reversibility was only measured on one occasion and
sputum samples were not taken.
One aspect of the overlap phenotype which is not included as a
criterion in the consensus report is smoking history. All members of
the overlap phenotype in this study were current or ex-smokers and
had cigarette exposure of >10 pack years, and a significant smoking
history was also a characteristic of the overlap group in other cluster
analyses [Wardlaw et al., 2005; Weatherall et al., 2009]. For the purposes
of allocating research participants it may therefore be appropriate to
include a minimum level of cigarette smoke exposure, e. g. 10 pack
years, in future allocation rules. Any such cut-off will be arbitrarily
precise and will exclude some individuals who have a history of
biomass smoke or other environmental exposures and would otherwise
fall within the asthma/COPD overlap group. However, in the context of
research, the additional precision may outweigh the effects on external
validity.
Further discussion
medication use
One notable difference between the overlap and moderate-severe
asthma phenotypes was the variation in use of inhalers. Despite
a similar severity of airflow obstruction and clinically important
bronchodilator reversibility in both groups, use of SABA and ICS was
much higher in the moderate-severe asthma phenotype. This may
reflect the much higher rates of undiagnosed disease, with almost a
186 phase 2
quarter of participants in the asthma/COPD overlap phenotype having
no prior respiratory diagnosis. The majority of people with COPD do
not have a doctors diagnosis [Soriano et al., 2009] and the high rates of
clinically important undiagnosed disease in the overlap group in this
research suggest that people with the overlap phenotype may benefit
from some of the screening and case-finding approaches which have
been recommended in COPD as a whole [Castillo et al., 2009; Haroon
et al., 2013; Jithoo et al., 2013; Løkke et al., 2012; Sansores et al., 2013;
Soriano et al., 2009].
biomarkers
The moderate-severe asthma phenotype (cluster 2) had a raised FeNO
and the highest blood eosinophil count, this would be consistent
with a Th2 pattern of inflammation. High sensitivity CRP, total white
cell count and blood neutrophil counts were highest in the overlap
and obese/co-morbid phenotypes (clusters 1 and 4), consistent with
systemic inflammation. Despite the high hsCRP the obese/co-morbid
phenotype had the lowest FeNO and IgE. It is possible that in this
situation systemic inflammation may be driving the airways disease,
rather than representing spill-over inflammation from the lung. This
may also be the case in the ’systemic COPD’ group described by Garcia-
Aymerich et al. [2011] .
phenotype separation
Although individuals in each phenotype predominantly group to-
gether, the clusters are closely apposed, and in some cases overlapping,

10.2 discussion 187
as can be appreciated in a three-dimensional model constructed using
allocation rule variables as axes (Figure 10.9).
Examination of the model in different planes highlights that the
obese/co-morbid group separates out on BMI, whereas the remaining
four clusters are differentiated based on age of onset and disease
severity. The overlap between clusters means that some individuals
could easily have been assigned to either of two clusters and suggests
that alteration of classification of individuals may occur if phenotyping
was repeated, although the underlying phenotype patterns are likely
to still be present. Given the closely related nature of these phenotypes,
the longitudinal stability of these phenotypes is important as a can-
didate phenotype is only useful if an individual can be confidently
assigned to the phenotype on more than one occasion over time. If
phenotypes are not stable it would be impractical to use them as the
basis of future therapeutic trials, and therefore personalised treatment
by phenotype would not be evidence based. The longitudinal stability
of the phenotypes described in this research is not known and requires
further study.
As repeat cluster analysis over time is not feasible, the most appro-
priate approach would be to apply an allocation rule to individuals
on multiple occasions over time, allowing assessment of the variability
of cluster assignment. Longitudinal studies should also be performed
to compare the natural history of different phenotypes and assess
phenotype stability. In order to perform these trials a clear allocation
rule must be constructed to allow phenotype assignment at study
entry. As the allocation rule described in this thesis would not be able

188 phase 2
Figure 10.9: Snapshot of 3D model using variables from allocation rule
Yellow: Asthma / COPD overlap groupBlue: Moderate / severe, young onset, atopic asthmaGreen: Mild, young onset, atopic asthmaRed: Obese with co-morbiditiesWhite: Mild, reference group
The figure shows a snapshot of a 3D model in which each of the 389
individuals in the cluster analysis is represented by a sphere. The colour ofthe sphere indicates their assigned phenotype. Axes are those used in theallocation rule: FEV1 percent predicted, age of onset and BMI. Examination ofthe model in different planes highlights that the ’obese with co-morbidities’group separates out on BMI, whereas the remaining four clusters aredifferentiated based on age of onset and disease severity.

10.2 discussion 189
to discriminate between the asthma/COPD overlap group and other
individuals with COPD, it will be necessary to construct alternative
allocation rules to allow all potential patients access to future trials.
These rules, once constructed, may be validated against existing
datasets to determine the proportion of patients likely to be allocated
to the overlap phenotype. The criteria reported by Soler-Cataluña et al.
[2012] may form a good starting point for construction of a future
allocation rule.
Linked to the question of cluster stability is the core question of
whether the phenotypes described constitute distinct disease entities
or simply different expressions of the same disease. Phenotype descrip-
tion is simply a logical extension of disease taxonomy, or nosology
[Snider, 2003]. As clinical phenotypes are emergent properties arising
from the complex interaction of genetic, environmental and therapeutic
inputs it is perhaps simplistic to expect a heterogeneous group of
individuals to express a discrete phenotype, cleanly separated from
other possible phenotypes. Clinical phenotypes may be linked to one
or more endotypes (chapter 3), and the processes which define different
endotypes may be able to occur in the same individual simultaneously.
As with the taxonomy of species, when differences are large it is easy
to separate disparate groups. However, once we are attempting to
separate two highly related groupings it is less clear how to draw the
division, different methods may describe different groupings, and we
may be imposing discrete groups on a continuum.
As the boundaries between phenotypes may be somewhat arbitrary
at times, it is important to focus on clinical utility above other

190 phase 2
considerations. The ability of a phenotype to predict pathogenesis,
future outcome, or treatment response is key to it’s worth. The
candidate phenotypes described in this research differ in response
to inhaled bronchodilators, suggesting the phenotypes may form
clinically useful groupings. In chapter 11 the response of the different
phenotypes to inhaled steroids is described.

11P H A S E 3
11.1 results
Eligibility and Enrolment
Progress through the study is shown in the flow diagram (Figure 9.1)
and eligibility and enrolment for the ICS trial by cluster is shown in
Table 11.1. Of the 418 participants who completed Phase 2, 194 were
not eligible for the ICS trial as they had received treatment with steroids
within the last 3 months. 56 subjects were eligible but elected not to
participate, and the remaining 168 people (75% of those eligible) were
both eligible and chose to participate in the ICS trial.
Table 11.1: Eligibility and enrolment for ICS trial by AGW5 cluster
participants by agw5 cluster , n (%)1 2 3 4 5
n = 34 n = 59 n = 80 n = 61 n=155
Not eligible 17 (50%) 44 (75%) 30 (38%) 26 (43%) 71 (46%)Eligible: 17 (50%) 15 (25%) 50 (63%) 35 (57%) 84 (54%)
Not enrolled 1 (3%) 6 (10%) 14 (18%) 9 (15%) 18 (12%)Enrolled 16 (47 %) 9 (15%) 36 (45%) 26 (43%) 66 (43%)
Percentages may exceed 100% due to rounding
Eligibility rates were similar in clusters one, three and five. Subjects
in cluster two, the moderate-severe atopic asthma phenotype, were far
191

192 phase 3
more likely to be receiving ICS at baseline, and if not taking ICS were
less likely to agree to enrol in the ICS trial. Some of these participants
had consciously chosen not to take ICS despite prescription by their
regular doctor, and were therefore less inclined to participate in the ICS
trial.
Subjects in the obese, co-morbid, phenotype were more likely to be
eligible for the ICS trial as they had lowest rates of baseline ICS use.
Description of ICS trial participants
Brief characteristics of ICS trial participants are shown in Table 11.2.
Table 11.2: Description of ICS trial participants by AGW5 cluster
variable mean (sd) values by agw5 cluster
All 1 2 3 4 5
n = 127 n = 14 n = 8 n = 30 n = 21 n=54
Age 49.0 (14.0) 57.3 (8.8) 46 (14.3) 58.4 (11.1) 52.7 (11.8) 40.6 (12.3)FEV1/FVC† 71.1 (12.8) 48.7 (16.1) 56.6 (7.1) 73.3 (7.4) 73.6 (8.0) 76.9 (7.8)FEV1† 83.5 (17.9) 57.5 (25.0) 62.6 (5.6) 94.1 (13.6) 79.8 (11.1) 88.9 (10.5)kCOcorr‡ 97.8 (18.2) 69.6 (21.9) 104.9 (9.5) 98.3 (16.4) 107.1 (13.5) 100.2 (13.6)Pack years 11.4 (17.7) 41.6 (19.2) 6.1 (7.8) 12.2 (15.8) 16.8 (19.4) 1.8 (4.4)Male sex‡ 75 (59%) 9 (64%) 5 (63%) 21 (70%) 13 (62%) 27 (50%)ICS in last year§ 7 (6%) 0 (0%) 2 (25%) 1 (3%) 0 (0%) 4 (7%)
†Pre-bronchodilator, expressed as percent predicted; ‡Post-bronchodilator, expressedas percent predicted; §Values reported as N (%)
Participants enrolling in the ICS trial had similar screening question-
naire characteristics to those of the overall sample (Table 9.4). The
main difference was a higher percentage of males among the ICS trial
participants.
11.1 results 193
ICS Responsiveness
Change in outcome measures with 12 weeks of ICS is shown in
Table 11.3, Table 11.5 and Figure 11.1.
There was no evidence of a significantly different change in ACQ-7
between the clusters (p=0.38). However, there was strong evidence of a
difference between clusters for change in SGRQ (p=0.005) and peak flow
variability (p<0.001). SGRQ change showed a statistically significant and
clinically important improvement that was greater than the reference
group for the overlap and obese/co-morbid phenotypes (p=0.008 and
p<0.001 respectively, Table 11.3) . Mild and moderate-severe atopic
asthma phenotypes showed a trend to greater improvement than
the reference group but this did not reach significance (p=0.054 and
p=0.057, respectively). Peak flow variability was significantly improved
relative to the reference group for the overlap (p=0.028) and moderate-
severe atopic asthma (p<0.001) phenotypes; but there was no significant
difference from the reference group for the mild asthma phenotype
(p=0.91). Peak flow variability worsened slightly in the obese/co-
morbid group (p=0.044).
Change with ICS was not significantly different between the groups
for FEV1 (p=0.88) and FeNO (p=0.19). There was no difference between
groups in the proportion of participants who had a severe adverse event
(p=0.32).
The SGRQ score is made up of 3 sub-domains and change in sub-
domains was compared as an exploratory analysis, using the same
methods as for total SGRQ (Table 11.5). Change in the Symptoms
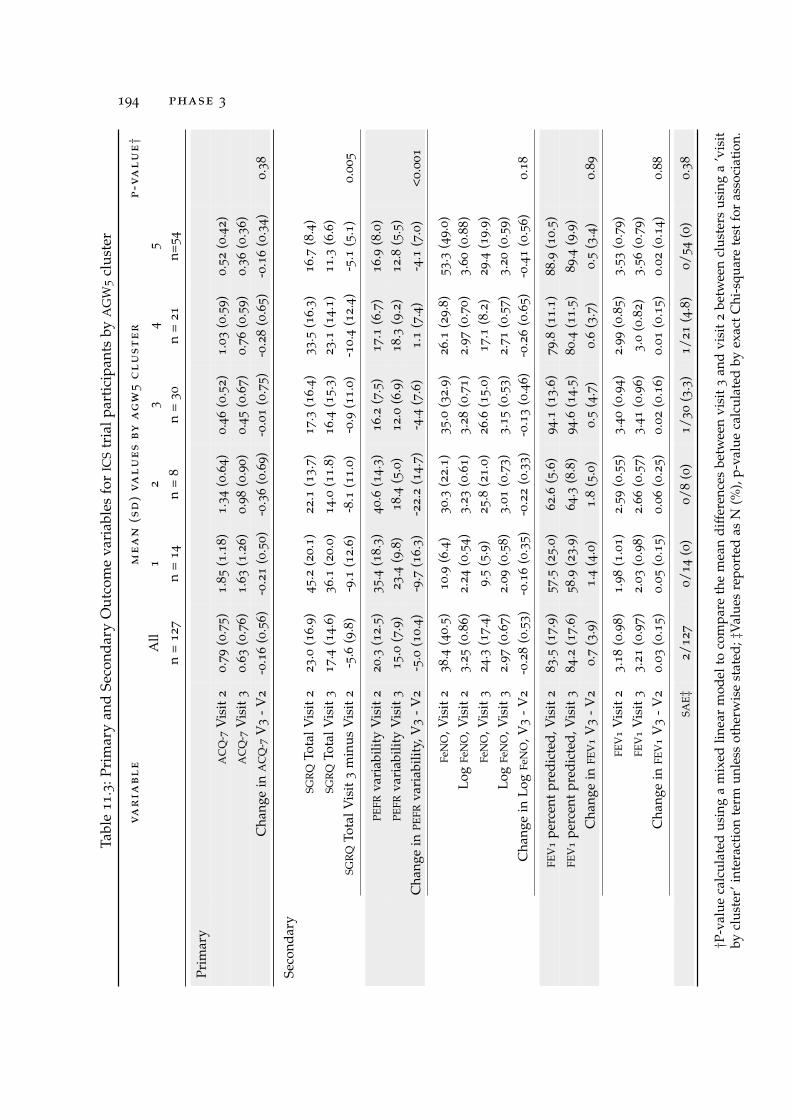
194 phase 3Ta
ble
11.3
:Pri
mar
yan
dSe
cond
ary
Out
com
eva
riab
les
for
ICS
tria
lpar
tici
pant
sby
AG
W5
clus
ter
va
ria
bl
em
ea
n(s
d)
va
lu
es
by
ag
w5
cl
us
te
rp
-va
lu
e†
All
12
34
5
n=
12
7n
=1
4n
=8
n=
30
n=
21
n=5
4
Prim
ary
AC
Q-7
Vis
it2
0.7
9(0
.75)
1.8
5(1
.18
)1
.34
(0.6
4)
0.4
6(0
.52
)1
.03
(0.5
9)
0.5
2(0
.42)
AC
Q-7
Vis
it3
0.6
3(0
.76)
1.6
3(1
.26
)0
.98
(0.9
0)
0.4
5(0
.67
)0
.76
(0.5
9)
0.3
6(0
.36)
Cha
nge
inA
CQ
-7V
3-
V2
-0.1
6(0
.56
)-0
.21
(0.5
0)
-0.3
6(0
.69
)-0
.01
(0.7
5)
-0.2
8(0
.65
)-0
.16
(0.3
4)
0.3
8
Seco
ndar
ySG
RQ
Tota
lVis
it2
23.0
(16.9
)4
5.2
(20
.1)
22.1
(13
.7)
17
.3(1
6.4
)3
3.5
(16.3
)1
6.7
(8.4
)SG
RQ
Tota
lVis
it3
17.4
(14.6
)3
6.1
(20
.0)
14
.0(1
1.8
)1
6.4
(15
.3)
23
.1(1
4.1
)1
1.3
(6.6
)SG
RQ
Tota
lVis
it3
min
usV
isit
2-5
.6(9
.8)
-9.1
(12
.6)
-8.1
(11
.0)
-0.9
(11.0
)-1
0.4
(12.4
)-5
.1(5
.1)
0.0
05
PEFR
vari
abili
tyV
isit
22
0.3
(12.5
)3
5.4
(18
.3)
40.6
(14
.3)
16.2
(7.5
)1
7.1
(6.7
)1
6.9
(8.0
)PE
FRva
riab
ility
Vis
it3
15
.0(7
.9)
23
.4(9
.8)
18
.4(5
.0)
12.0
(6.9
)1
8.3
(9.2
)1
2.8
(5.5
)C
hang
ein
PEFR
vari
abili
ty,V
3-
V2
-5.0
(10.4
)-9
.7(1
6.3
)-2
2.2
(14
.7)
-4.4
(7.6
)1
.1(7
.4)
-4.1
(7.0
)<0
.00
1
FeN
O,V
isit
23
8.4
(40.5
)1
0.9
(6.4
)3
0.3
(22
.1)
35
.0(3
2.9
)2
6.1
(29.8
)5
3.3
(49
.0)
Log
FeN
O,V
isit
23.2
5(0
.86)
2.2
4(0
.54
)3
.23
(0.6
1)
3.2
8(0
.71)
2.9
7(0
.70)
3.6
0(0
.88
)Fe
NO
,Vis
it3
24.3
(17
.4)
9.5
(5.9
)2
5.8
(21
.0)
26
.6(1
5.0
)1
7.1
(8.2
)2
9.4
(19
.9)
Log
FeN
O,V
isit
32.9
7(0
.67
)2
.09
(0.5
8)
3.0
1(0
.73
)3
.15
(0.5
3)
2.7
1(0
.57
)3
.20
(0.5
9)
Cha
nge
inLo
gFe
NO
,V3
-V
2-0
.28
(0.5
3)
-0.1
6(0
.35
)-0
.22
(0.3
3)
-0.1
3(0
.46)
-0.2
6(0
.65)
-0.4
1(0
.56
)0
.18
FEV
1pe
rcen
tpr
edic
ted,
Vis
it2
83
.5(1
7.9
)5
7.5
(25
.0)
62
.6(5
.6)
94
.1(1
3.6
)7
9.8
(11.1
)8
8.9
(10.5
)FE
V1
perc
ent
pred
icte
d,V
isit
38
4.2
(17.6
)5
8.9
(23
.9)
64
.3(8
.8)
94
.6(1
4.5
)8
0.4
(11.5
)8
9.4
(9.9
)C
hang
ein
FEV
1V
3-
V2
0.7
(3.9
)1
.4(4
.0)
1.8
(5.0
)0
.5(4
.7)
0.6
(3.7
)0
.5(3
.4)
0.8
9
FEV
1V
isit
23.1
8(0
.98)
1.9
8(1
.01
)2
.59
(0.5
5)
3.4
0(0
.94
)2
.99
(0.8
5)
3.5
3(0
.79
)FE
V1
Vis
it3
3.2
1(0
.97)
2.0
3(0
.98
)2
.66
(0.5
7)
3.4
1(0
.96)
3.0
(0.8
2)
3.5
6(0
.79
)C
hang
ein
FEV
1V
3-
V2
0.0
3(0
.15
)0
.05
(0.1
5)
0.0
6(0
.25
)0
.02
(0.1
6)
0.0
1(0
.15
)0
.02
(0.1
4)
0.8
8
SAE‡
2/1
27
0/1
4(0
)0
/8(0
)1
/30
(3.3
)1
/21
(4.8
)0
/54
(0)
0.3
8
†P-v
alue
calc
ulat
edus
ing
am
ixed
linea
rm
odel
toco
mpa
reth
em
ean
diff
eren
ces
betw
een
visi
t3
and
visi
t2
betw
een
clus
ters
usin
ga
’vis
itby
clus
ter’
inte
ract
ion
term
unle
ssot
herw
ise
stat
ed;‡
Val
ues
repo
rted
asN
(%),
p-va
lue
calc
ulat
edby
exac
tC
hi-s
quar
ete
stfo
ras
soci
atio
n.

11.1 results 195
●●
●● ●● ●●
● ● ● ●
●
−2
−10123
12
34
5
Clu
ster
Change in ACQ−7
(a)
Cha
nge
inA
CQ
!
●● ● ●●
●
●
−25025
12
34
5
Clu
ster
Change in SGRQ
(b)
Cha
nge
inSG
RQ
● ● ●●
●●
●
−2
−101
12
34
5
Clu
ster
Change in Log FeNO
(c)
Cha
nge
inFe
NO
●
● ●
●
● ●
−50
−25025
12
34
5
Clu
ster
Change in PEFRVariability
(d)
Cha
nge
inPE
FR
Figu
re11.1
:Box
and
whi
sker
plot
ssh
owin
gch
ange
inou
tcom
eva
riab
les
duri
ngIC
Str
ial
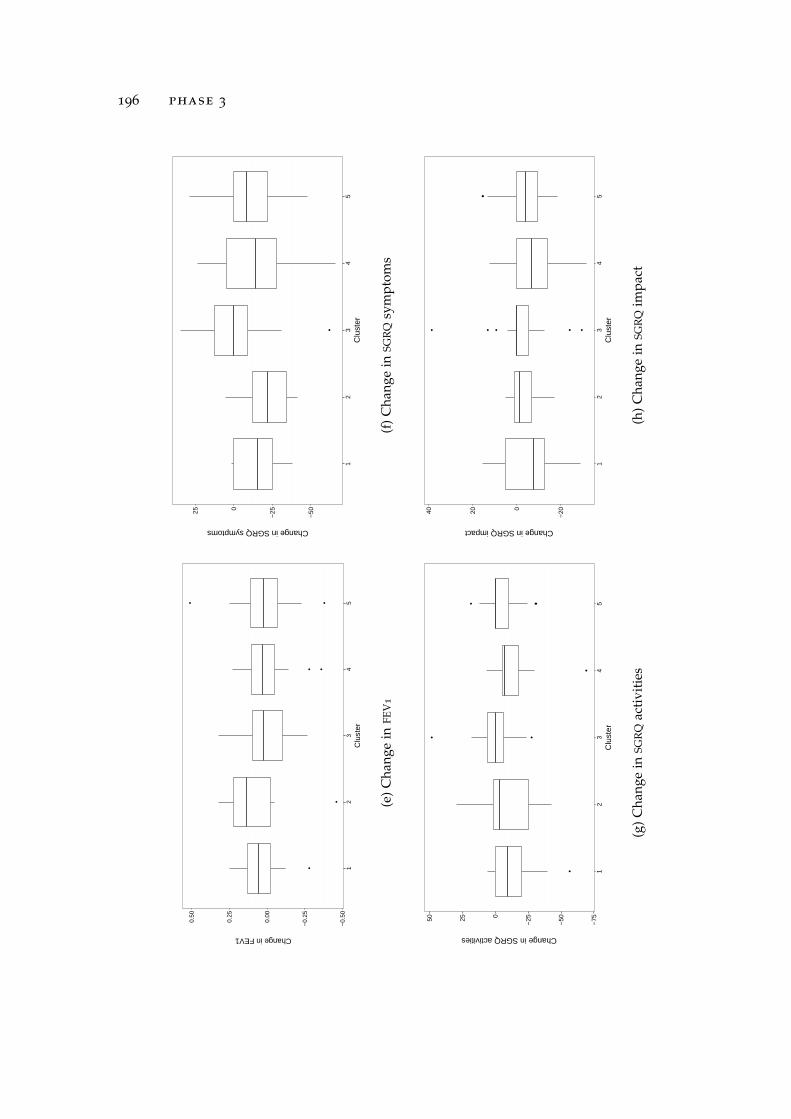
196 phase 3
●
●
● ●
● ●
−0.
50
−0.
25
0.00
0.25
0.50
12
34
5
Clu
ster
Change in FEV1
(e)
Cha
nge
inFE
V1
●
−50
−25025
12
34
5
Clu
ster
Change in SGRQ symptoms
(f)
Cha
nge
inSG
RQ
sym
ptom
s
●
● ●
●
● ●●
−75
−50
−2502550
12
34
5
Clu
ster
Change in SGRQ activities
(g)
Cha
nge
inSG
RQ
acti
viti
es
● ●● ●●
● ●
−2002040
12
34
5
Clu
ster
Change in SGRQ impact
(h)
Cha
nge
inSG
RQ
impa
ct
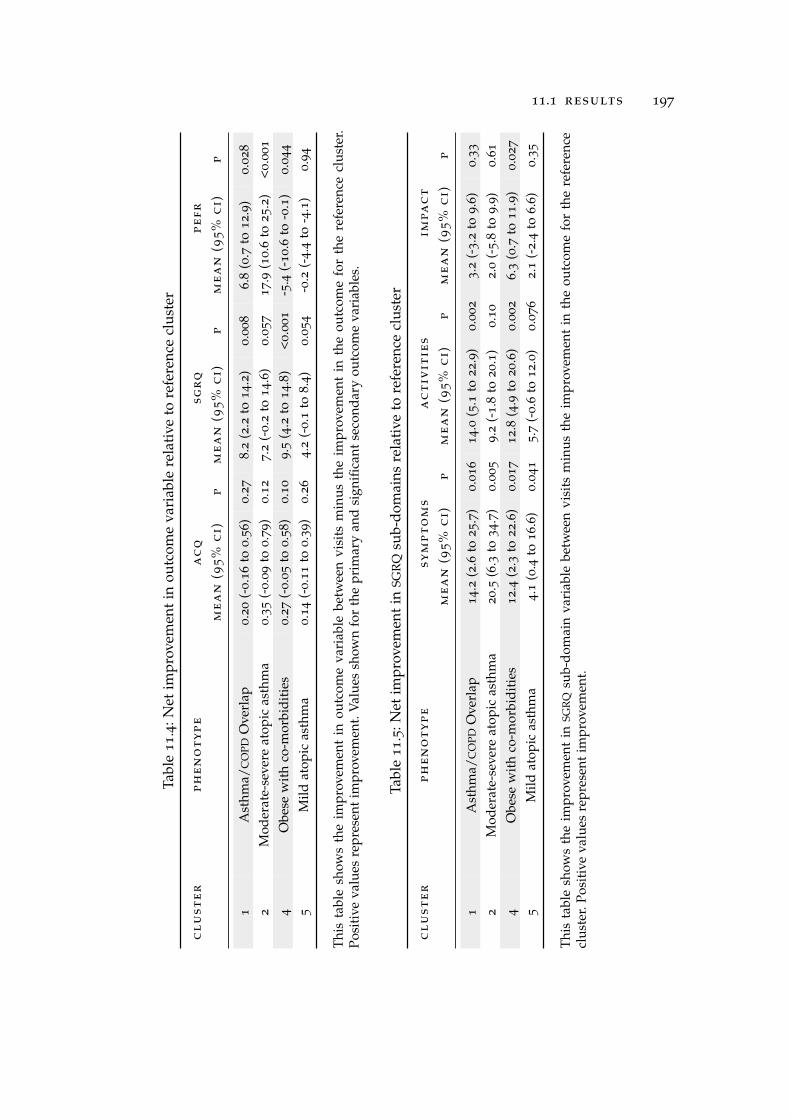
11.1 results 197
Tabl
e11.4
:Net
impr
ovem
ent
inou
tcom
eva
riab
lere
lati
veto
refe
renc
ecl
uste
r
cl
us
te
rp
he
no
ty
pe
ac
qs
gr
qp
ef
r
me
an
(95
%c
i)
pm
ea
n(9
5%
ci)
pm
ea
n(9
5%
ci)
p
1A
sthm
a/C
OPD
Ove
rlap
0.2
0(-
0.1
6to
0.5
6)
0.2
78
.2(2
.2to
14.2
)0
.00
86.8
(0.7
to1
2.9
)0
.02
8
2M
oder
ate-
seve
reat
opic
asth
ma
0.3
5(-
0.0
9to
0.7
9)
0.1
27.2
(-0.2
to1
4.6
)0
.05
71
7.9
(10.6
to2
5.2
)<0
.00
1
4O
bese
wit
hco
-mor
bidi
ties
0.2
7(-
0.0
5to
0.5
8)
0.1
09
.5(4
.2to
14.8
)<0
.00
1-5
.4(-
10.6
to-0
.1)
0.0
44
5M
ildat
opic
asth
ma
0.1
4(-
0.1
1to
0.3
9)
0.2
64.2
(-0
.1to
8.4
)0
.05
4-0
.2(-
4.4
to-4
.1)
0.9
4
Thi
sta
ble
show
sth
eim
prov
emen
tin
outc
ome
vari
able
betw
een
visi
tsm
inus
the
impr
ovem
ent
inth
eou
tcom
efo
rth
ere
fere
nce
clus
ter.
Posi
tive
valu
esre
pres
ent
impr
ovem
ent.
Val
ues
show
nfo
rth
epr
imar
yan
dsi
gnifi
cant
seco
ndar
you
tcom
eva
riab
les.
Tabl
e11.5
:Net
impr
ovem
ent
inSG
RQ
sub-
dom
ains
rela
tive
tore
fere
nce
clus
ter
cl
us
te
rp
he
no
ty
pe
sy
mp
to
ms
ac
tiv
it
ie
sim
pa
ct
me
an
(95
%c
i)
pm
ea
n(9
5%
ci)
pm
ea
n(9
5%
ci)
p
1A
sthm
a/C
OPD
Ove
rlap
14
.2(2
.6to
25.7
)0
.01
61
4.0
(5.1
to2
2.9
)0
.00
23
.2(-
3.2
to9
.6)
0.3
3
2M
oder
ate-
seve
reat
opic
asth
ma
20
.5(6
.3to
34.7
)0
.00
59.2
(-1
.8to
20
.1)
0.1
02.0
(-5
.8to
9.9
)0
.61
4O
bese
wit
hco
-mor
bidi
ties
12
.4(2
.3to
22.6
)0
.01
71
2.8
(4.9
to2
0.6
)0
.00
26
.3(0
.7to
11.9
)0.0
27
5M
ildat
opic
asth
ma
4.1
(0.4
to1
6.6
)0
.04
15.7
(-0.6
to1
2.0
)0
.07
62.1
(-2
.4to
6.6
)0
.35
Thi
sta
ble
show
sth
eim
prov
emen
tin
SGR
Qsu
b-do
mai
nva
riab
lebe
twee
nvi
sits
min
usth
eim
prov
emen
tin
the
outc
ome
for
the
refe
renc
ecl
uste
r.Po
siti
veva
lues
repr
esen
tim
prov
emen
t.
198 phase 3
sub-domain was significantly different between groups, p=0.017. The
greatest improvement relative to the mild/reference cluster was for
the moderate-severe asthma phenotype, followed by the overlap and
obese/co-morbid phenotypes respectively.
Change in the activities sub-domain also differed between groups,
p=0.006. The greatest improvement was seen in the overlap pheno-
type, followed by the obese/co-morbid phenotype. Change in mild
and moderate-severe atopic asthma phenotypes was not significantly
different from the reference cluster.
Change in the Impact sub-domain was not significantly different
when compared across all clusters by the mixed linear model, p=0.28,
although the improvement in the obese/co-morbid group was signifi-
cantly greater than that in the reference group, p=0.027.
11.2 discussion
Participants enrolling in the ICS trial had similar characteristics by
cluster to those of the overall sample and are therefore likely to be
representative of their phenotypes. The higher percentage of males
among the ICS trial participants is a potential source of bias, however
both sexes were still well represented and the sex balance is close to
that seen among all eligible respondents in Phase 1.
The hypothesis tested in Phase 3 was
That the response to the ICS budesonide will differ between
clusters.
This research is the first to use cluster analysis to allocate patients
to phenotypes and prospectively describe their response to ICS. The

11.2 discussion 199
primary variable of ACQ-7 was not significantly different between
groups. However, ICS treatment for 12 weeks was associated with strong
evidence of clinically important changes in health status and peak flow
variability, which differed between the groups.
There are some limitations to this study that should be noted. As
the ICS phase of the trial was an open label study without placebo
control, the changes seen during ICS treatment cannot be assumed to
be caused purely by ICS. However, investigators and participants were
blind to cluster allocation throughout the study, which means that any
placebo effect or regression to the mean should be present to a similar
degree in the reference group that serves as an active control. The size
of the effects and the fact that changes with steroids were seen in the
atopic asthma phenotypes, which are known to be steroid responsive,
but not in the reference group is also suggestive that these represent
real differences in treatment responsiveness.
The primary outcome measure for ICS responsiveness was the
ACQ-7. This is a very sensitive and well validated measure of asthma
control but has not been validated in unselected airways disease. It is
therefore possible it will exhibit different measurement properties in
this group, although 70% of participants had a doctor’s diagnosis of
asthma. The SGRQ has been extensively validated in both asthma and
COPD. The modest, and therefore not statistically significant, changes
in ACQ-7 with ICS contrast with the sizeable changes in SGRQ. The
improvement in SGRQ was around twice the MCID (4 units) in the
overlap, moderate-severe atopic asthma and obesity groups, whereas
no phenotype had an improvement in ACQ-7 equal to the MCID (0.5

200 phase 3
units). Interestingly the moderate-severe atopic asthma phenotype had
the greatest improvement in ACQ-7 despite only having the third largest
improvement in SGRQ. The ACQ-7 is known to be sensitive to change
in patients with asthma but these results suggest that it may be less
sensitive to change in a population with unselected airways disease.
It may be that the elements that contribute to improved respiratory
health status in the overlap and obese/co-morbid phenotypes are not
captured as part of the ACQ-7, which is designed to measure asthma
control.
Examining the sub-domains of the SGRQ, the moderate-severe atopic
asthma phenotype had the biggest change in the symptoms sub-
domain. This is consistent with the fact that symptoms are an accurate
guide to disease activity in the majority of people with asthma
[Fingleton and Beasley; GINA, 2011]. By comparison, the moderate-
severe asthma phenotype had relatively modest changes in the Impact
and Activities sub-domains.
The overlap and obese/co-morbid phenotypes had slightly smaller
changes in the Symptoms domain, but then had similarly large changes
in the Activities sub-domain, leading to a cumulatively much larger
total SGRQ change. The change in the Impact sub-domain was greatest
for the obese/co-morbid phenotype and was significantly greater for
the obese/co-morbid group than for the reference group, possibly
reflecting the psychological burden faced by the group. However,
although the comparison between the obese/co-morbid and reference
groups was significant (p=0.027), the mixed linear model did not show
a significant difference across all groups (p=0.28); therefore the finding

11.2 discussion 201
of greater improvement in Impact score for the obese/co-morbid group
must be treated with caution, as it may be an artefact of multiple
testing.
The overall response to ICS of the moderate-severe asthma phenotype
was smaller than might be expected. It is possible that those subjects
with moderate-severe asthma not taking ICS at study entry were more
likely to be steroid insensitive, and had previously discontinued ICS for
this reason, however this information is not available.
The findings of the ICS trial support the hypothesis that the described
phenotypes differ in their response to budesonide. The magnitude of
the treatment effect is unclear given the contrast between effect as
measured by ACQ-7 and as measured by SGRQ.
Currently patients in the overlap group may be treated either as
having COPD or asthma, which will result in marked differences in
the recommended inhaled therapy [British Thoracic Society; Scottish
Intercollegiate Guidelines Network, 2012; GINA, 2011]. Those treated
as COPD in view of their smoking history and reduced transfer factor
would be liable to receive initial treatment with short and long-acting
bronchodilators, including LABA monotherapy. Whereas, those treated
according to asthma guidelines, in view of the variability of their
airflow obstruction and increased IgE, would receive maintenance ICS.
The apparent benefit to the overlap group from ICS therapy shown
in this study requires confirmation in future RCTs. However, given
the known risks of LABA monotherapy in asthma [Beasley et al.,
2012] and the potential opportunity cost of denying effective ICS
therapy to ICS responsive individuals, it may be appropriate to treat
202 phase 3
patients in the overlap group with ICS along asthma guidelines on
a precautionary basis pending further studies. The increased use of
steroids in the overlap group relative to other phenotypes of COPD
has been recommended in Spanish [Miravitlles et al., 2012b; Soler-
Cataluña et al., 2012] and Canadian COPD guidelines [O’Donnell et al.,
2007], either on the basis that this is an asthma-like group [O’Donnell
et al., 2007] or because of the evidence of ICS response in COPD with
eosinophilia [Brightling et al., 2005; Leigh, 2006; Miravitlles et al., 2012a;
Papi et al., 2000; Siva et al., 2007]. Whilst sputum eosinophilia has been
reported to be a feature of the overlap group [Kitaguchi et al., 2012],
this research and the previous WRS has reported low FeNO levels in
the overlap group, and Miravitlles et al. [2013] reported low serum
nitrate levels. These findings do not suggest that eosinophilia is a
universal feature of the asthma/COPD overlap phenotype, therefore it
is important that the expected benefit of ICS in the overlap group is
confirmed with appropriately designed trials.
12S U M M A RY, P O T E N T I A L F U T U R E W O R K A N D
C O N C L U S I O N S
12.1 summary of findings and potential future work
The aims of this research were:
To explore clinical phenotypes of chronic airways disease by
cluster analysis.
To examine if phenotypes identified by a previous cluster analysis
exist in the independent NZRHS sample
To compare the response to short-acting beta-agonist between
phenotype groups.
To compare the response to short-acting muscarinic antagonist
bromide between phenotype groups.
To compare the response to inhaled corticosteroid between phe-
notype groups.
To generate allocation rules and determine their predictive value
for the different disorders of airways disease.
It was possible to recruit 451 individuals with symptoms of obstruc-
tive airways disease from a large random population sample. Following
detailed assessment, cluster analysis was used to identify and describe
five candidate phenotypes of obstructive airways disease.
203
204 summary, potential future work and conclusions
All five phenotypes identified in this research are supported, to
different degrees, by evidence presented in the literature review. The
bronchodilator and ICS response of these phenotypes is described and
an allocation rule reported, which was able to assign three-quarters of
participants to the correct cluster.
Before candidate phenotypes can be incorporated into clinical prac-
tice they must be fully validated. In the literature review I suggested
the following minimal criteria in order for a candidate phenotype to
gain acceptance and be clinically useful:
1. Replication in more than one study.
2. Demonstration of differential response to treatment.
3. Description and validation of allocation rules that allow patients
to be reliably matched to the most appropriate phenotype.
4. Longitudinal follow-up with assessment of phenotype stability,
natural history and demonstration of differential outcome be-
tween phenotypes.
The research in this thesis has been directed towards the first three
aspects of validation but, as a cross-sectional study, cannot address the
fourth. The five phenotypes described in this research are at different
stages in this process.
mild / intermittent This group was used as a reference group for
the ICS analyses and had little evidence of active disease. Whilst other
authors have also described minimal disease clusters it is not clear
that these represent a coherent phenotype. Although one possibility
would be that post infective wheeze is the dominant phenotype in
12.1 summary of findings and potential future work 205
this cluster, individuals may well have diverse aetiologies for their
symptoms, including mild asthma, post viral wheeze, and undiagnosed
co-morbidities. If future longitudinal studies showed evidence of
progression to overt disease over time then this would increase the
clinical importance of the mild/intermittent phenotype, but on current
evidence it may simply be a label for individuals who do not fit into
the more clinically coherent categories.
young-onset atopic asthma The most robust phenotypes de-
scribed in the NZRHS are mild and moderate to severe young-onset
atopic asthma. This phenotype was well recognised prior to the use of
cluster analysis [Wenzel, 2006] and, given the restrictive criteria used
in the majority of major asthma trials to date [Travers et al., 2007b], is
well represented in observational and interventional studies. Both mild
and moderate to severe young-onset atopic asthma can therefore be
accepted as validated phenotypes.
asthma/copd overlap The asthma/COPD overlap group described
in this study is a phenotype for which there is now considerable
evidence (see Part I). This study provides further validation of the phe-
notype and extends the evidence by demonstrating the bronchodilator
and ICS responsiveness of this group. The medication responsiveness
findings from this research require replication in future controlled trials
and the natural history and longitudinal stability of the overlap group
remain to be determined.
obese / co-morbid This study identified a cluster characterised
by obesity, poor symptom control and worse health status despite

206 summary, potential future work and conclusions
limited airflow obstruction, which is consistent with clusters described
previously [Benton et al., 2010; Haldar et al., 2009; Moore et al., 2010;
Musk et al., 2011; Sutherland et al., 2012]. The group described in this
research is notable for the high prevalence of co-morbidities in this
group and for the marked response to ICS. This latter finding contrasts
with previous reports that obesity is associated with a reduced response
to ICS [Peters-Golden et al., 2006], however Sutherland et al. [2012]
described two different patterns of ICS response with obesity in their
retrospective study. Of the two obesity clusters they identified, one
was characterised by early onset, severe, disease and a poor ICS
response, whereas the later onset group showed greater improvement
in symptoms with ICS. The obesity cluster described in the NZRHS was
characterised by later onset symptoms and may correspond with the
steroid responsive obese asthma cluster reported by Sutherland et al.
[2012]. Given this divergence in reported steroid responsiveness within
obesity phenotypes, the precise inclusion criteria of future studies will
be key to their interpretation. The longitudinal characteristics of obesity
phenotypes are currently unknown and require further study.
This programme of research has several strengths. The large random
population sample and cluster analysis methodology serve to minimize
the extent to which bias and a priori assumptions affect outcome,
whilst also allowing the extent to which methodological changes alter
cluster assignment to be explored. Disease phenotyping was extensive
and focused on variables which have the potential to be measured in
clinical practice. No articles were identified in the systematic review
that incorporated prospective assessment of ICS and bronchodilator

12.1 summary of findings and potential future work 207
responsiveness by phenotype, and this is therefore a key novel aspect
of the research.
Potential future studies
There are a number of possible avenues that future research may
take, but the following programme would begin to provide a firm
evidence base for treatment recommendations in the overlap and obese-
co-morbid phenotypes:
1. Validation of a modified allocation rule in independent datasets.
2. Longitudinal study of phenotype stability and natural history,
using allocation rule to assign phenotypes.
3. Double-blind randomised controlled trials comparing response to
common respiratory therapies in specific phenotypes, as deter-
mined by the allocation rule. Likely interventions would include:
Inhaled corticosteroid- including long term response
Inhaled corticosteroid/long-acting beta-agonist combination
therapy
Tiotropium (overlap and mod-severe asthma phenotypes)
Roflumilast (overlap and obese/co-morbid phenotypes)
Leukotriene receptor antagonists
Targeted treatment of co-morbidities (overlap and obese/co-
morbid phenotypes)
One key clinical question which the above studies would help to
answer is the role of ICS in patients with the overlap phenotype. This
study provides evidence which is suggestive that use of ICS may
be beneficial in patients with an asthma-COPD overlap phenotype.
208 summary, potential future work and conclusions
Given the changes in health status seen with ICS in this research
and the known dangers of LABA monotherapy in asthma, it would
be reasonable to treat patients with the overlap phenotype according
to asthma guidelines, and hence have a relatively low threshold for
ICS use, pending further research. This approach is not without risk
given the potential increase in pneumonia with ICS seen in the TORCH
study [Crim et al., 2009], and definitive trials in these phenotypes are
therefore required.
12.2 conclusions
Cluster analysis of patients with symptoms of airflow obstruction has
identified disease phenotypes that differ significantly in their clinical,
and pathophysiological characteristics. This research has confirmed the
existence of the late-onset asthma/COPD overlap, young-onset atopic
asthma, and obese/co-morbid phenotypes and provides data on their
responsiveness to inhaled corticosteroid, short-acting beta-agonist and
short-acting muscarinic antagonist therapies, which may guide future
management of patients with these phenotypes of obstructive airways
disease.

Part IV
R E F E R E N C E S


references
Adcock I. M and Barnes P. J. Con: Genome-wide association studieshave not been useful in understanding asthma. American Journal ofRespiratory and Critical Care Medicine, 184(6):633–636, Sept. 2011.
Agustí A, Sobradillo P, and Celli B. Addressing the complexityof chronic obstructive pulmonary disease: From phenotypes andbiomarkers to scale-free networks, systems biology, and P4 medicine.American Journal of Respiratory and Critical Care Medicine, 183(9):1129–1137, Dec. 2010.
Agustí A, Edwards L. D, Rennard S. I, MacNee W, Tal-Singer R, MillerB. E, Vestbo J, Lomas D. A, Calverley P. M. A, Wouters E, Crim C, Yates J. C, Silverman E. K, Coxson H. O, Bakke P, Mayer R. J, Celli B, and for the Evaluation of COPD Longitudinally to Identify Predictive Surrogate Endpoints (ECLIPSE) Investigators. Persistent systemic inflammation i s associated with poor clinical outcomes in COPD: A novel phenotype. PLoS ONE, 7(5), 2012.
Akbari O, Faul J. L, Hoyte E. G, Berry G. J, Wahlstrom J, KronenbergM, DeKruyff R. H, and Umetsu D. T. Cd4+ invariant t-cell-receptor+natural killer T cells in bronchial asthma. New England Journal ofMedicine, 354(11):1117–1129, 2006.
American Thoracic Society. Standards for the diagnosis and care ofpatients with chronic obstructive pulmonary disease, 1995.
American Thoracic Society. ATS/ERS recommendations for standard-ized procedures for the online and offline measurement of exhaledlower respiratory nitric oxide and nasal nitric oxide, 2005. AmericanJournal of Respiratory and Critical Care Medicine, 171(8):912–930, Apr.2005.
211
212 references
Anderson G. P. Endotyping asthma: new insights into key pathogenicmechanisms in a complex, heterogeneous disease. Lancet, 372(9643):1107–1119, Sept. 2008.
Anthonisen N. R, Connett J. E, Enright P. L, and Manfreda J.Hospitalizations and mortality in the lung health study. AmericanJournal of Respiratory and Critical Care Medicine, 166(3):333–9, 2002.
Asher M. I, Montefort S, Bjorksten B, Lai C. K. W, Strachan D. P,Weiland S. K, and Williams H. Worldwide time trends in theprevalence of symptoms of asthma, allergic rhinoconjunctivitis,and eczema in childhood: ISAAC phases one and three repeatmulticountry cross-sectional surveys. Lancet, 368(9537):733–743, 2006.
Bafadhel M, McKenna S, Terry S, Mistry V, Reid C, Haldar P,McCormick M, Haldar K, Kebadze T, Duvoix A, Lindblad K, PatelH, Rugman P, Dodson P, Jenkins M, Saunders M, Newbold P,Green R. H, Venge P, Lomas D. A, Barer M. R, Johnston S. L,Pavord I. D, and Brightling C. E. Acute exacerbations of chronicobstructive pulmonary disease: Identification of biologic clusters andtheir biomarkers. American Journal of Respiratory and Critical CareMedicine, 184(6):662–671, 2011a.
Bafadhel M, Umar I, Gupta S, Raj J. V, Vara D. D, Entwisle J. J, PavordI. D, Brightling C. E, and Siddiqui S. The role of ct scanningin multidimensional phenotyping of COPD. Chest, 140(3):634–642,2011b.
Bafadhel M, McKenna S, Terry S, Mistry V, Pancholi M, Venge P, LomasD. A, Barer M. R, Johnston S. L, Pavord I. D, and Brightling C. E.Blood eosinophils to direct corticosteroid treatment of exacerbationsof chronic obstructive pulmonary disease. American Journal ofRespiratory and Critical Care Medicine, 186(1):48–55, July 2012.
Bahous J, Cartier A, Ouimet G, Pineau L, and Malo J. L. Nonallergicbronchial hyperexcitability in chronic bronchitis. The American Reviewof Respiratory Disease, 129(2):216–220, 1984.
references 213
Barnes P. J. Mechanisms in COPD differences from asthma. Chest, 117
(2 suppl):10S14S, 2000.
Barnes P. J. Mediators of chronic obstructive pulmonary disease.Pharmacological Reviews, 56(4):515–548, 2004.
Barnes P. J. Reduced histone deacetylase in COPD*. Chest, 129(1):151–155, 2006.
Barnes P. J and Celli B. R. Systemic manifestations and comorbiditiesof COPD. European Respiratory Journal, 33(5):1165–1185, May 2009.
Bateman E, Singh D, Smith D, Disse B, Towse L, Massey D, BlatchfordJ, Pavia D, and Hodder R. Efficacy and safety of tiotropium respimatsmi in COPD in two 1-year randomized studies. International Journalof Chronic Obstructive Pulmonary Disease, 5:197–208, 2010.
Beasley R. Worldwide variation in prevalence of symptoms of asthma,allergic rhinoconjunctivitis, and atopic eczema: ISAAC. Lancet, 351
(9111):1225–1232, Apr. 1998.
Beasley R, Crane J, Lai C. K. W, and Pearce N. Prevalence and etiologyof asthma. Journal of Allergy and Clinical Immunology, 105(2):S466–S472, 2000.
Beasley R, Fingleton J, and Weatherall M. Restriction of LABA useto combination ICS/LABA inhaler therapy in asthma. Thorax, 68(2):119–120, 2012.
Bel E, ten Brinke A, and Sorkness R. Fixed airway obstruction in severeasthma. European Respiratory Monograph, 51:147–159, Mar. 2011.
Bel E. H. Clinical phenotypes of asthma. Current Opinion in PulmonaryMedicine, 10(1), 2004.
Benton A. S, Wang Z, Lerner J, Foerster M, Teach S. J, and FreishtatR. J. Overcoming heterogeneity in pediatric asthma: Tobacco smokeand asthma characteristics within phenotypic clusters in an AfricanAmerican cohort. The Journal of Asthma, 47(7):728–734, Sept. 2010.

214 references
Berry M, Morgan A, Shaw D. E, Parker D, Green R, Brightling C,Bradding P, Wardlaw A. J, and Pavord I. D. Pathological features andinhaled corticosteroid response of eosinophilic and non-eosinophilicasthma. Thorax, 62(12):1043–9, 2007.
Birring S. S, Brightling C. E, Bradding P, Entwisle J. J, Vara D. D,Grigg J, Wardlaw A. J, and Pavord I. D. Clinical, radiologic, andinduced sputum features of chronic obstructive pulmonary diseasein nonsmokers: a descriptive study. American Journal of Respiratoryand Critical Care Medicine, 166(8):1078–1083, Oct. 2002.
Bleecker E. R. Roundtable discussion. Chest, 126(2_suppl_1):159S–161S,2004.
Bleecker E. R, Postma D. S, Lawrance R. M, Meyers D. A, AmbroseH. J, and Goldman M. Effect of ADRB2 polymorphisms on responseto longacting β2-agonist therapy: a pharmacogenetic analysis of tworandomised studies. Lancet, 370(9605):2118–2125, Dec. 2007.
Boezen H. M, Postma D. S, Schouten J. P, Kerstjens H. A, and RijckenB. PEF variability, bronchial responsiveness and their relation toallergy markers in a random population (20-70 yr). American Journalof Respiratory and Critical Care Medicine, 154(1):30–35, 1996.
Bonet T. Sepulchretum sive anatonia pructica ex cadaveribus morbodenatis, proponens histoa’s observations omnium humani corporisaffectuum, ipsarcomoue causas recorditas revelans. Geneva, 1679.
Bourdin A, Serre I, Flamme H, Vic P, Neveu D, Aubas P, Godard P, andChanez P. Can endobronchial biopsy analysis be recommended todiscriminate between asthma and COPD in routine practice? Thorax,59(6):488–493, June 2004.
Bousquet J, Wenzel S, Holgate S, Lumry W, Freeman P, and Fox H.Predicting response to omalizumab, an anti-IgE antibody, in patientswith allergic asthma*. Chest, 125(4):1378–1386, 2004.

references 215
Bousquet J, Anto J, Sterk P, Adcock I, Chung K, Roca J, AgustíA, Brightling C, Cambon-Thomsen A, Cesario A, Abdelhak S,Antonarakis S, Avignon A, Ballabio A, Baraldi E, Baranov A, Bieber T,Bockaert J, Brahmachari S, Brambilla C, Bringer J, Dauzat M, ErnbergI, Fabbri L, Froguel P, Galas D, Gojobori T, Hunter P, Jorgensen C,and Kauffmann F. Systems medicine and integrated care to combatchronic noncommunicable diseases. Genome Medicine, 3(7):43–, 2011.
Braman S. The global burden of asthma. Chest, 130(1 suppl):4S–12S,2006.
Brightling C. E, Monteiro W, Ward R, Parker D, Morgan M. D,Wardlaw A. J, and Pavord I. D. Sputum eosinophilia and short-termresponse to prednisolone in chronic obstructive pulmonary disease:a randomised controlled trial. Lancet, 356(9240):1480–5, 2000a.
Brightling C. E, Ward R, Woltmann G, Bradding P, Sheller J. R,Dworski R, and Pavord I. D. Induced sputum inflammatory mediatorconcentrations in eosinophilic bronchitis and asthma. AmericanJournal of Respiratory and Critical Care Medicine, 162(3 Pt 1):878–82,2000b.
Brightling C. E, Bradding P, Symon F. A, Holgate S. T, Wardlaw A. J,and Pavord I. D. Mast-cell infiltration of airway smooth muscle inasthma. New England Journal of Medicine, 346(22):1699–1705, 2002.
Brightling C. E, McKenna S, Hargadon B, Birring S, Green R, Siva R,Berry M, Parker D, Monteiro W, Pavord I. D, and Bradding P. Sputumeosinophilia and the short term response to inhaled mometasone inchronic obstructive pulmonary disease. Thorax, 60(3):193–8, 2005.
Briscoe W. A and Nash E. S. The slow space in chronic obstructivepulmonary diseases. Annals of the New York Academy of Sciences, 121:706–22, 1965.
British Thoracic Society; Scottish Intercollegiate Guidelines Network .British guideline on the management of asthma., 2012.

216 references
Broad J and Jackson R. Chronic obstructive pulmonary diseaseand lung cancer in New Zealand. Technical report, University ofAuckland, 2003.
Brown R. H. M. Treatment of chronic asthma with prednisolone;significance of eosinophils in the sputum. Lancet, 2(7059):1245–1247,Dec. 1958.
Burgel P.-R, Paillasseur J.-L, Caillaud D, Tillie-Leblond I, Chanez P,Escamilla R, Court-Fortune I, Perez T, Carre P, Roche N, and I. B.S. C. Clinical COPD phenotypes: a novel approach using principalcomponent and cluster analyses. European Respiratory Journal, 36(3):531–539, Sept 2010.
Burrows B, Bloom J. W, Traver G. A, and Cline M. G. The courseand prognosis of different forms of chronic airways obstruction in asample from the general population. New England Journal of Medicine,317(21):1309–14, 1987.
Busse W. W. The relationship of airway hyperresponsiveness andairway inflammation: Airway hyperresponsiveness in asthma: itsmeasurement and clinical significance. Chest, 138(2 Suppl):4S–10S,2010.
Calverley P. M, Burge P. S, Spencer S, Anderson J. A, and Jones P. W.Bronchodilator reversibility testing in chronic obstructive pulmonarydisease. Thorax, 58(8):659–64, 2003.
Calverley P. M, Anderson J. A, Celli B, Ferguson G. T, Jenkins C, JonesP. W, Yates J. C, and Vestbo J. Salmeterol and fluticasone propionateand survival in chronic obstructive pulmonary disease. New EnglandJournal of Medicine, 356(8):775–789, 2007.
Calverley P. M, Rabe K. F, Goehring U. M, Kristiansen S, Fabbri L. M,and Martinez F. J. Roflumilast in symptomatic chronic obstructivepulmonary disease: two randomised clinical trials. Lancet, 374(9691):685–94, 2009.
references 217
Castillo D, Guayta R, Giner J, Burgos F, Capdevila C, Soriano J. B,Barau M, Casan P, and FARMAEPOC group . COPD case finding byspirometry in high-risk customers of urban community pharmacies:a pilot study. Respiratory Medicine, 103(6):839–845, June 2009.
Celli B, Halbert R, Isonaka S, and Schau B. Population impact ofdifferent definitions of airway obstruction. European RespiratoryJournal, 22(2):268–273, Aug. 2003.
Chen Q, Just A. C, Miller R. L, Perzanowski M. S, Goldstein I. F, PereraF. P, and Whyatt R. M. Using latent class growth analysis to identifychildhood wheeze phenotypes in an urban birth cohort. Annals ofAllergy, Asthma & Immunology, 108(5):311–315.e1, May 2012.
Cho M. H, Washko G. R, Hoffmann T. J, Criner G. J, Hoffman E. A,Martinez F. J, Laird N, Reilly J. J, and Silverman E. K. Cluster analysisin severe emphysema subjects using phenotype and genotype data:an exploratory investigation. Respiratory Research, 11(1):30, 2010.
Chong J, Poole P, Leung B, and Black P. N. Phosphodiesterase 4
inhibitors for chronic obstructive pulmonary disease, Accessed 23rdApril 2013. URL http://onlinelibrary.wiley.com/doi/10.1002/
14651858.CD002309.pub3/abstract.
Chowdhury B. A and Dal Pan G. The FDA and safe use of long-actingbeta-agonists in the treatment of asthma. New England Journal ofMedicine, 362(13):1169–1171, Apr. 2010.
Churg A, Zhou S, and Wright J. Matrix metalloproteinases in COPD.European Respiratory Journal, 39(1):197–209, Jan. 2012.
Ciba Symposium. Terminology, definitions, and classification of chronic pulmonary emphysema and related conditions: A report of
the conclusions of a Ciba guest symposium. Thorax, 14(4):286–299,
1959.
Clarisse B, Demattei C, Nikasinovic L, Just J, Daures J.-P, and Momas I.Bronchial obstructive phenotypes in the first year of life among Paris
218 references
birth cohort infants. Pediatric Allergy and Immunology, 20(2):126–133,Mar. 2009.
Clifford R. D, Pugsley A, Radford M, and Holgate S. T. Symptoms,atopy, and bronchial response to methacholine in parents withasthma and their children. Archives of Disease in Childhood, 62(1):66–73,1987.
Clifford R. D, Radford M, Howell J. B, and Holgate S. T. Prevalence ofatopy and range of bronchial response to methacholine in 7 and 11
year old schoolchildren. Archives of Disease in Childhood, 64(8):1126–1132, 1989.
Contoli M, Baraldo S, Marku B, Casolari P, Marwick J. A, Turato G,Romagnoli M, Caramori G, Saetta M, Fabbri L. M, and Papi A. Fixedairflow obstruction due to asthma or chronic obstructive pulmonarydisease: 5-year follow-up. Journal of Allergy and Clinical Immunology,125(4):830–837, Apr. 2010.
Cookson W. O and Moffatt M. F. Genetics of asthma and allergicdisease. Human Molecular Genetics, 9(16):2359–2364, Oct. 2000.
Corren J, Lemanske R. F, Hanania N. A, Korenblat P. E, Parsey M. V,Arron J. R, Harris J. M, Scheerens H, Wu L. C, Su Z, Mosesova S,Eisner M. D, Bohen S. P, and Matthews J. G. Lebrikizumab treatmentin adults with asthma. New England Journal of Medicine, 365(12):1088–1098, 2011.
Crane J, Lewis S, Slater T, Crossland L, Robson B, D’Souza W, Pearce N,Town G. I, Garrett J, and Armstrong R. The self reported prevalenceof asthma symptoms amongst adult New Zealanders. The NewZealand Medical Journal, 107(988):417–421, Oct. 1994.
Crawley M. J. The R book. Wiley, 2013. ISBN 9780470973929 0470973927.
Crim C, Calverley P. M. A, Anderson J. A, Celli B, Ferguson G. T,Jenkins C, Jones P. W, Willits L. R, Yates J. C, and Vestbo J. Pneumoniarisk in COPD patients receiving inhaled corticosteroids alone or in
references 219
combination: TORCH study results. European Respiratory Journal, 34
(3):641–647, Jan. 2009.
D’Armiento J. M, Scharf S. M, Roth M. D, Connett J. E, Ghio A,Sternberg D, Goldin J. G, Louis T. A, Mao J. T, O’Connor G. T,Ramsdell J. W, Ries A. L, Schluger N. W, Sciurba F. C, Skeans M. A,Voelker H, Walter R. E, Wendt C. H, Weinmann G. G, Wise R. A, andForonjy R. F. Eosinophil and T cell markers predict functional declinein COPD patients. Respiratory Research, 10(1):113, 2009.
Davies D. E. The role of the epithelium in airway remodeling in asthma.Proceedings of the American Thoracic Society, 6(8):678–682, Dec. 2009.
Decramer M, Janssens W, and Miravitlles M. Chronic obstructivepulmonary disease. Lancet, 379(9823):1341–1351, Apr. 2012.
Dekkers B. G. J, Maarsingh H, Meurs H, and Gosens R. Airwaystructural components drive airway smooth muscle remodeling inasthma. Proceedings of the American Thoracic Society, 6(8):683–692, Dec.2009.
Donaldson G. C and Wedzicha J. A. COPD exacerbations 1:Epidemiology. Thorax, 61(2):164–168, Feb. 2006.
Donaldson G. C, Seemungal T. A, Bhowmik A, and Wedzicha J. A.Relationship between exacerbation frequency and lung functiondecline in chronic obstructive pulmonary disease. Thorax, 57(10):847–52, 2002.
Donohue J. F. Minimal clinically important differences in COPD lungfunction. COPD, 2(1):111–24, 2005.
Douwes J, Gibson P, Pekkanen J, and Pearce N. Non-eosinophilicasthma: importance and possible mechanisms. Thorax, 57(7):643–648,2002.
Drazen J. M. A step toward personalized asthma treatment. NewEngland Journal of Medicine, 365(13):1245–1246, Sept. 2011.

220 references
D’Souza W, Lewis S, Cheng S, McMillan D, Pearce N, Town I, RigbyS, Skidmore C, Armstrong R, and Rutherford R. The prevalence ofasthma symptoms, bronchial hyperresponsiveness and atopy in NewZealand adults. The New Zealand Medical Journal, 112(1089):198–202,June 1999.
Dunnill M. S. The pathology of asthma, with special reference tochanges in the bronchial mucosa. Journal of Clinical Pathology, 13(1):27–33, Jan. 1960.
Editorial. A plea to abandon asthma as a disease concept. Lancet, 368,2006.
Edwards P. J, Roberts I, Clarke M. J, DiGuiseppi C, Wentz R, Kwan I,Cooper R, Felix L. M, and Pratap S. Methods to increase response topostal and electronic questionnaires. Cochrane Database of SystematicReviews, July 2009.
Electoral Commission, Accessed 15th May 2013. URL http://www.elections.org.nz/.
Electoral Commission, Accessed 21st August 2012. URL http://www.elections.org.nz/mapping.
European Community Respiratory Health Survey . Variationsin the prevalence of respiratory symptoms, self-reported asthmaattacks, and use of asthma medication in the european communityrespiratory health survey (ECRHS). European Respiratory Journal, 9(4):687–695, Apr. 1996.
Everitt B. S. An R and S-Plus R© Companion to Multivariate Analysis.Springer, 1st ed. 2005. corr. 2nd printing 2007 edition, Sept. 2007.ISBN 1852338822.
Everitt B. S, Landau S, Leese M, and Stahl D. Cluster Analysis. Wiley, 5
edition, Feb. 2011. ISBN 0470749911.
Fabbri L. M, Romagnoli M, Corbetta L, Casoni G, Busljetic K, TuratoG, Ligabue G, Ciaccia A, Saetta M, and Papi A. Differences in

references 221
airway inflammation in patients with fixed airflow obstruction due toasthma or chronic obstructive pulmonary disease. American Journalof Respiratory and Critical Care Medicine, 167(3):418–424, Feb. 2003.
Fabbri L. M, Calverley P. M, Izquierdo-Alonso J. L, Bundschuh D. S,Brose M, Martinez F. J, and Rabe K. F. Roflumilast in moderate-to-severe chronic obstructive pulmonary disease treated with longactingbronchodilators: two randomised clinical trials. Lancet, 374(9691):695–703, 2009.
Fahy J. V. Remodeling of the airway epithelium in asthma. AmericanJournal of Respiratory and Critical Care Medicine, 164(Supplement 2):S46–S51, Nov. 2001.
Fahy J. V. Eosinophilic and neutrophilic inflammation in asthma:Insights from clinical studies. Proceedings of the American ThoracicSociety, 6(3):256–259, 2009.
Fahy J. V, Liu J, Wong H, and Boushey H. A. Cellular and biochemicalanalysis of induced sputum from asthmatic and from healthysubjects. The American Review of Respiratory Disease, 147(5):1126–1131,May 1993.
Fingleton J and Beasley R. Asthma monitoring (in press). In GlobalAtlas of Asthma. World Health Organisation.
Fingleton J and Beasley R. Individualized treatment for asthma. InAdvances in Asthma Management, pages 156–166. Future Medicine Ltd,Jan. 2012.
Fingleton J, Weatherall M, and Beasley R. Towards individualisedtreatment in COPD. Thorax, 66(5):363–4, 2011.
Fingleton J, Weatherall M, and Beasley R. Bronchodilator responsive-ness: interpret with caution. Thorax, 67(8):667–668, 2012.
Fingleton J, Travers J, Weatherall M, and Beasley R. The New Zealandrespiratory health survey: Rationale, methodology and response rate.European Respiratory Society Symposium, Barcelona 2013, 2013a.

222 references
Fingleton J, Travers J, Williams M, Charles T, Bowles D, Strik R,Shirtcliffe P, Weatherall M, and Beasley R. Inhaled corticosteroid andbronchodilator responsiveness of different phenotypes of airwaysobstruction in adults. Submitted for publication, 2013b.
Fingleton J, Williams M, Charles T, and Beasley R. O010: Choice ofreference range markedly changes estimates of population diseaseprevalence and severity, in TSANZ oral abstracts. Respirology, 18:10–37, Apr. 2013c.
Fingleton J, Travers J, Weatherall M, and Beasley R. Inhaledcorticosteroid and treatment responsiveness of different phenotypes of airways obstruction in adults. Submitted as an abstract to the American Thoracic Society, San Diego, 2014.
Fink J. W, Paine S.-J, Gander P. H, Harris R. B, and Purdie G. Changingresponse rates from maori and non-maori in national sleep healthsurveys. Journal of the New Zealand Medical Association, 124(1328):52–63, 2011.
Fishman G. S and Moore L. R. A statistical evaluation of multiplicativecongruential random number generators with modulus 2 31 - 1.Journal of the American Statistical Association, 77(377):129, Mar. 1982.
Fitzpatrick A. M, Teague W. G, Meyers D. A, Peters S. P, Li X, Li H,Wenzel S. E, Aujla S, Castro M, Bacharier L. B, Gaston B. M, BleeckerE. R, and Moore W. C. Heterogeneity of severe asthma in childhood:confirmation by cluster analysis of children in the national institutesof health/national heart, lung, and blood institute severe asthmaresearch program. Journal of Allergy and Clinical Immunology, 127(2):382–389 e1–13, 2011.
Fletcher C, Peto R, Tinker C, and Speizer F. The natural history of chronicbronchitis and emphysema. An eight-year study of early chronic obstructivelung disease. Oxford University Press, 1976.
Flood-Page P, Swenson C, Faiferman I, Matthews J, Williams M,Brannick L, Robinson D, Wenzel S, Busse W, Hansel T. T, Barnes

references 223
N. C, and on behalf of the International Mepolizumab Study Group. A study to evaluate safety and efficacy of mepolizumab in patients with moderate persistent asthma. American Journal of Respiratory and Critical Care Medicine, 176(11):1062–1071, 2007.
Flood-Page P. T, Menzies-Gow A. N, Kay A. B, and RobinsonD. S. Eosinophil’s role remains uncertain as anti-interleukin-5 onlypartially depletes numbers in asthmatic airway. American Journal ofRespiratory and Critical Care Medicine, 167(2):199–204, 2003.
Fuchs-Climent D, Le Gallais D, Varray A, Desplan J, Cadopi M, andPrefaut C. G. Factor analysis of quality of life, dyspnea, andphysiologic variables in patients with chronic obstructive pulmonarydisease before and after rehabilitation. American Journal of PhysicalMedicine and Rehabilitation, 80(2):113–20, 2001.
Garcia-Aymerich J, Gómez F. P, Benet M, Farrero E, Basagaña X, GayeteA, Paré C, Freixa X, Ferrer J, Ferrer A, Roca J, Gáldiz J. B, Sauleda J,Monsó E, Gea J, Barberá J. A, Agustí A, Antó J. M, and P.-C. S. G.Identification and prospective validation of clinically relevant chronicobstructive pulmonary disease (COPD) subtypes. Thorax, 66(5):430–437, May 2011.
Gibson P. G and Simpson J. L. The overlap syndrome of asthma andCOPD: what are its features and how important is it? Thorax, 64(8):728–735, 2009.
GINA. Global strategy for asthma management and prevention.Technical report, Global Initiative for Asthma, 2004.
GINA. Global strategy for asthma management and prevention.Technical report, Global Initiative for Asthma, 2011.
GOLD. Global strategy for the diagnosis, management and preventionof COPD. Technical report, Global Initiative for Obstructive LungDisease (GOLD), 2010.
224 references
GOLD. Global strategy for the diagnosis, management and preventionof COPD. Technical report, Global Initiative for Obstructive LungDisease (GOLD), 2013.
Gonem S, Raj V, Wardlaw A. J, Pavord I. D, Green R, and SiddiquiS. Phenotyping airways disease: an a to e approach. Clinical &Experimental Allergy, 42(12):1664–1683, Dec. 2012.
Gower J. C. A general coefficient of similarity and some of its properties.Biometrics, page 857–871, 1971.
Green R. H, Brightling C. E, Woltmann G, Parker D, Wardlaw A. J, andPavord I. D. Analysis of induced sputum in adults with asthma:identification of subgroup with isolated sputum neutrophilia andpoor response to inhaled corticosteroids. Thorax, 57(10):875–879, Jan.2002.
Gross M. J. Sch 1000: a new anticholinergic bronchodilator. TheAmerican Review of Respiratory Disease, 112(6):823–828, Dec. 1975.
Gupta S, Siddiqui S, Haldar P, Entwisle J. J, Mawby D, WardlawA. J, Bradding P, Pavord I. D, Green R. H, and Brightling C. E.Quantitative analysis of high-resolution computed tomography scansin severe asthma subphenotypes. Thorax, 65(9):775–781, Jan. 2010.
Haldar P, Pavord I. D, Shaw D. E, Berry M. A, Thomas M, BrightlingC. E, Wardlaw A. J, and Green R. H. Cluster analysis and clinicalasthma phenotypes. American Journal of Respiratory and Critical CareMedicine, 178(3):218–24, 2008.
Haldar P, Brightling C. E, Hargadon B, Gupta S, Monteiro W, Sousa A,Marshall R. P, Bradding P, Green R. H, Wardlaw A. J, and Pavord I. D.Mepolizumab and exacerbations of refractory eosinophilic asthma.New England Journal of Medicine, 360(10):973–984, 2009.
Hamid Q. Pathogenesis of small airways in asthma. Respiration, 84(1):4–11, 2012.

references 225
Han M. K, Agustí A, Calverley P. M, Celli B. R, Criner G, Curtis J. L,Fabbri L. M, Goldin J. G, Jones P. W, MacNee W, Make B. J, RabeK. F, Rennard S. I, Sciurba F. C, Silverman E. K, Vestbo J, WashkoG. R, Wouters E. F. M, and Martinez F. J. Chronic obstructivepulmonary disease phenotypes: The future of COPD. AmericanJournal of Respiratory and Critical Care Medicine, 182(5):598–604, 2010.
Hansell A, Walk J, and Soriano J. What do chronic obstructivepulmonary disease patients die from? A multiple cause codinganalysis. European Respiratory Journal, 22(5):809–814, Nov. 2003.
Hargreave F. E and Leigh R. Induced sputum, eosinophilic bronchitis,and chronic obstructive pulmonary disease. American Journal ofRespiratory and Critical Care Medicine, 160(5 Pt 2):S53–57, Nov. 1999.
Haroon S, Adab P, Griffin C, and Jordan R. Case finding for chronicobstructive pulmonary disease in primary care: a pilot randomisedcontrolled trial. The British Journal of General Practice: The Journal of theRoyal College of General Practitioners, 63(606):e55–62, Jan. 2013.
Henderson J, Granell R, Heron J, Sherriff A, Simpson A, WoodcockA, Strachan D. P, Shaheen S. O, and Sterne J. A. C. Associationsof wheezing phenotypes in the first 6 years of life with atopy, lungfunction and airway responsiveness in mid-childhood. Thorax, 63(11):974–980, 2008.
Hogg J. C. Pathophysiology of airflow limitation in chronic obstructivepulmonary disease. Lancet, 364(9435):709–721, Aug. 2004.
Holberg C. J, Halonen M, Solomon S, Graves P. E, Baldini M, EricksonR. P, and Martinez F. D. Factor analysis of asthma and atopy traitsshows 2 major components, one of which is linked to markers onchromosome 5q. Journal of Allergy and Clinical Immunology, 108(5):772–780, Nov. 2001.
Holgate S. T. Genetic and environmental interaction in allergy andasthma. Journal of Allergy and Clinical Immunology, 104(6):1139–1146,Dec. 1999.

226 references
Holgate S. T. A brief history of asthma and its mechanisms to modernconcepts of disease pathogenesis. Allergy, Asthma & ImmunologyResearch, 2(3):165–171, July 2010.
Holgate S. T. Pathophysiology of asthma: What has our currentunderstanding taught us about new therapeutic approaches? Journalof Allergy and Clinical Immunology, 128(3):495–505, Sept. 2011.
Holgate S. T, Roberts G, Arshad H. S, Howarth P. H, and DaviesD. E. The role of the airway epithelium and its interaction withenvironmental factors in asthma pathogenesis. Proceedings of theAmerican Thoracic Society, 6(8):655–659, Dec. 2009.
Holt S and Beasley R. The Burden of Asthma in New Zealand. Asthmaand Respiratory Foundation of New Zealand (Inc.), Dec. 2001.
Hunninghake G. M, Cho M. H, Tesfaigzi Y, Soto-Quiros M. E, AvilaL, Lasky-Su J, Stidley C, Melen E, Saderhall C, Hallberg J, Kull I,Kere J, Svartengren M, Pershagen G, Wickman M, Lange C, DemeoD. L, Hersh C. P, Klanderman B. J, Raby B. A, Sparrow D, ShapiroS. D, Silverman E. K, Litonjua A. A, Weiss S. T, and Celedan J. C.Mmp12, lung function, and COPD in high-risk populations. NewEngland Journal of Medicine, 361(27):2599–2608, Dec. 2009.
Hurst J. R and Wedzicha J. A. Management and prevention of chronicobstructive pulmonary disease exacerbations: a state of the art review.BMC Medicine, 7:40, Aug. 2009.
Hurst J. R, Vestbo J, Anzueto A, Locantore N, Müllerova H, Tal-SingerR, Miller B, Lomas D. A, Agusti A, MacNee W, Calverley P, RennardS, Wouters E. F, and Wedzicha J. A. Susceptibility to exacerbationin chronic obstructive pulmonary disease. New England Journal ofMedicine, 363(12):1128–1138, 2010.
Isozaki A, Shoda T, Mimura S, Ogawa N, Noma T, Kawano T,Nakamura Y, and Kawano Y. [A trial of hierarchical cluster analysisof hospitalized wheezy infants and young children based on clinicalfactors]. Japenese Journal of Allergology, 60(5):586–592, May 2011.
references 227
Israel E. The protective effects of leukotriene modifiers in aspirin-induced asthma. Postgraduate Medicine, 108(4 Suppl):40–44, Sept.2000.
James A. L, Pare P. D, and Hogg J. C. The mechanics of airwaynarrowing in asthma. American Journal of Respiratory and Critical CareMedicine, 139(1):242–246, Jan. 1989.
Jeffery P. K. Remodeling in asthma and chronic obstructive lungdisease. American Journal of Respiratory and Critical Care Medicine, 164
(Supplement 2):S28–S38, Nov. 2001.
Jithoo A, Enright P. L, Burney P, Buist A. S, Bateman E. D, TanW. C, Studnicka M, Mejza F, Gillespie S, and Vollmer W. M. Case-finding options for COPD: results from the burden of obstructivelung disease study. European Respiratory Journal, 41(3):548–555, Mar.2013.
Jo K. W, Ra S. W, Chae E. J, Seo J. B, Kim N. K, Lee J. H, Kim E. K, LeeY. K, Kim T. H, Huh J. W, Kim W. J, Lee S. M, Lim S. Y, Shin T. R, YoonH. I, Sheen S. S, Lee J. S, Lee S. D, and Oh Y. M. Three phenotypesof obstructive lung disease in the elderly. The International Journal ofTuberculosis and Lung Disease, 14(11):1481–1488, 2010.
Jones P. St George’s Respiratory Questionnaire Manual. St George’s,University of London, 2009.
Jones P. W. St. george’s respiratory questionnaire: MCID. COPD, 2(1):75–79, Mar. 2005.
Jones P. W, Quirk F. H, and Baveystock C. M. The st george’s respiratoryquestionnaire. Respiratory Medicine, 85 Suppl B:25–31; discussion 33–37, Sept. 1991.
Jones P. W, Quirk F. H, Baveystock C. M, and Littlejohns P. A self-complete measure of health status for chronic airflow limitation.the st. george’s respiratory questionnaire. The American Review ofRespiratory Disease, 145(6):1321–1327, June 1992.

228 references
Juniper E. F, O’Byrne P. M, Guyatt G. H, Ferrie P. J, and King D. R.Development and validation of a questionnaire to measure asthmacontrol. European Respiratory Journal, 14(4):902–907, Jan. 1999.
Juniper E. F, Wisniewski M. E, Cox F. M, Emmett A. H, Nielsen K. E,and O’Byrne P. M. Relationship between quality of life and clinicalstatus in asthma: a factor analysis. European Respiratory Journal, 23(2):287–291, Jan. 2004.
Juniper E. F, Svensson K, Mörk A.-C, and Ståhl E. Measurementproperties and interpretation of three shortened versions of theasthma control questionnaire. Respiratory Medicine, 99(5):553–558,May 2005.
Just J, Gouvis-Echraghi R, Couderc R, Guillemot-Lambert N, and Saint-Pierre P. Novel severe wheezy young children phenotypes: boysatopic multiple-trigger and girls nonatopic uncontrolled wheeze.Journal of Allergy and Clinical Immunology, 130(1):103–110.e8, July 2012.
Karamanou M and Androutsos G. Aretaeus of cappadocia and thefirst clinical description of asthma. American Journal of Respiratory andCritical Care Medicine, 184(12):1420–1421, Dec. 2011.
Kaufman L and Rousseau P. J. Finding Groups in Data: An Introductionto Cluster Analysis. Wiley-Interscience, 99 edition, Mar. 1990. ISBN0471878766.
Kim S. R and Rhee Y. K. Overlap between asthma and COPD: Wherethe two diseases converge. Allergy, Asthma & Immunology Research, 2
(4), 2010.
Kips J. C, Fahy J. V, Hargreave F. E, Ind P. W, and in’t Veen J. C. Methodsfor sputum induction and analysis of induced sputum: a methodfor assessing airway inflammation in asthma. European RespiratoryJournal. Supplement, 26:9S–12S, Mar. 1998.
Kitaguchi Y, Komatsu Y, Fujimoto K, Hanaoka M, and Kubo K. Sputumeosinophilia can predict responsiveness to inhaled corticosteroid
references 229
treatment in patients with overlap syndrome of COPD and asthma.International Journal of Chronic Obstructive Pulmonary Disease, 7:283–289, 2012.
Kohansal R, Martinez-Camblor P, Agusti A, Buist A. S, Mannino D. M,and Soriano J. B. The natural history of chronic airflow obstructionrevisited: An analysis of the framingham offspring cohort. AmericanJournal of Respiratory and Critical Care Medicine, 180(1):3–10, July 2009.
Kraft M. Asthma and chronic obstructive pulmonary disease exhibitcommon origins in any country. American Journal of Respiratory andCritical Care Medicine, 174(3):238–240, Aug. 2006.
Lapperre T. S, Snoeck-Stroband J. B, Gosman M. M, Stolk J, Sont J. K,Jansen D. F, Kerstjens H. A, Postma D. S, and Sterk P. J. Dissociationof lung function and airway inflammation in chronic obstructivepulmonary disease. American Journal of Respiratory and Critical CareMedicine, 170(5):499–504, 2004.
Leckie M. J, ten Brinke A, Khan J, Diamant Z, O’Connor B. J, WallsC. M, Mathur A. K, Cowley H. C, Chung K. F, Djukanovic R,Hansel T. T, Holgate S. T, Sterk P. J, and Barnes P. J. Effects of aninterleukin-5 blocking monoclonal antibody on eosinophils, airwayhyper-responsiveness, and the late asthmatic response. Lancet, 356
(9248):2144–8, 2000.
Lee T, Lee Y. S, Bae Y.-J, Kim T.-B, Kim S. O, Cho S.-H, Moon H.-B,COhort for Reality and Evolution of adult Asthma in Korea studygroup (COREA study group) , and Cho Y. S. Smoking, longer diseaseduration and absence of rhinosinusitis are related to fixed airwayobstruction in koreans with severe asthma: findings from the COREAstudy. Respiratory Research, 12:1, 2011.
Leigh R. Stable COPD: predicting benefit from high dose inhaledcorticosteroid treatment. European Respiratory Journal, Jan. 2006.

230 references
Leung T. F. Clinical and atopic parameters and airway inflammatorymarkers in childhood asthma: a factor analysis. Thorax, 60(10):822–826, Oct. 2005.
Liesker J. J. W, Bathoorn E, Postma D. S, Vonk J. M, Timens W, andKerstjens H. A. M. Sputum inflammation predicts exacerbations aftercessation of inhaled corticosteroids in COPD. Respiratory Medicine,105(12):1853–1860, Dec. 2011.
Løkke A, Ulrik C. S, Dahl R, Plauborg L, Dollerup J, KristiansenL. C, Cording P. H, Dehlendorff C, and TOP GOLD study-group .Detection of previously undiagnosed cases of COPD in a high-riskpopulation identified in general practice. COPD, 9(5):458–465, Aug.2012.
Lötvall J, Akdis C. A, Bacharier L. B, Bjermer L, Casale T. B, CustovicA, Lemanske R. F, Wardlaw A. J, Wenzel S. E, and GreenbergerP. A. Asthma endotypes: A new approach to classification of diseaseentities within the asthma syndrome. Journal of Allergy and ClinicalImmunology, 127(2):355–360, Feb. 2011.
MacNee W. Pathogenesis of chronic obstructive pulmonary disease.Proceedings of the American Thoracic Society, 2(4):258–266, Nov. 2005.
Magnussen H, Bugnas B, van Noord J, Schmidt P, Gerken F, andKesten S. Improvements with tiotropium in COPD patients withconcomitant asthma. Respiratory Medicine, 102(1):50–56, Jan. 2008.
Mahler D. A and Harver A. A factor analysis of dyspnearatings, respiratory muscle strength, and lung function in patientswith chronic obstructive pulmonary disease. American Review ofRespiratory Disease, 145(2 Pt 1):467–70, 1992.
Mahut B, Peyrard S, and Delclaux C. Exhaled nitric oxide and clinicalphenotypes of childhood asthma. Respiratory Research, 12:65, 2011.
Makris D, Moschandreas J, Damianaki A, Ntaoukakis E, SiafakasN. M, Milic Emili J, and Tzanakis N. Exacerbations and lung

references 231
function decline in COPD: New insights in current and ex-smokers.Respiratory Medicine, 101(6):1305–1312, 2007.
Marsh S, Aldington S, Williams M, Weatherall M, Shirtcliffe P,McNaughton A, Pritchard A, and Beasley R. Complete referenceranges for pulmonary function tests from a single New Zealandpopulation. The New Zealand Medical Journal, 119(1244):U2281, 2006.
Marsh S. E, Travers J, Weatherall M, Williams M. V, Aldington S,Shirtcliffe P. M, Hansell A. L, Nowitz M. R, McNaughton A. A,Soriano J. B, and Beasley R. W. Proportional classifications of COPDphenotypes. Thorax, 63(9):761–7, 2008.
Martin R. J, Szefler S. J, King T. S, Kraft M, Boushey H. A, ChinchilliV. M, Craig T. J, DiMango E. A, Deykin A, Fahy J. V, Israel E, LazarusS. C, Lemanske R. F, Leone F. T, Pesola G. R, Peters S. P, SorknessC. A, Szwejbka L. A, and Wechsler M. E. The predicting responseto inhaled corticosteroid efficacy (PRICE) trial. Journal of Allergy andClinical Immunology, 119(1):73–80, 2007.
McCloskey S. C, Patel B. D, Hinchcliffe S. J, Reid E. D, Wareham N. J,and Lomas D. A. Siblings of patients with severe chronic obstructivepulmonary disease have a significant risk of airflow obstruction.American Journal of Respiratory and Critical Care Medicine, 164(8):1419–1424, Oct. 2001.
McKenzie D. K, Abramson M, Crockett A. J, Dabscheck E, GlasgowN, Jenkins S, McDonald C, Wood-Baker R, Yang I, and on behalf ofThe Australian Lung Foundation. P. A. F. The COPD-X plan:Australian and New Zealand guidelines for the management ofchronic obstructive pulmonary disease. Technical report, TheAustralian Lung Foundation, 2012.
Medicines & Healthcare Products Regulatory Agency . Long actingbeta agonists: update in children and adults, Sept 2010, Accessed13th March 2013. URL http://www.mhra.gov.uk/Publications/
Safetyguidance/DrugSafetyUpdate/CON093878.
232 references
Merriam-Webster. Phenotype. Merriam-Webster.com, Accessed13th March 2013. URL http://www.merriam-webster.com/dictionary/phenotype.
Meyer E. H, DeKruyff R. H, and Umetsu D. T. T cells and NKT cells inthe pathogenesis of asthma. Annual Review of Medicine, 59(1):281–292,2008.
Ministry of Health. Mortality and demographic data 2007. Technicalreport, Ministry of Health, 2010.
Ministry of Health. The health of New Zealand adults 2011/12: Keyfindings of the New Zealand health survey. Technical report, Ministryof Health, 2012.
Miravitlles M, Jose Soler-Cataluna J, Calle M, and Soriano J. B.Treatment of COPD by clinical phenotypes. putting old evidence intoclinical practice. European Respiratory Journal, Oct. 2012a.
Miravitlles M, Soler-Cataluña J. J, Calle M, Molina J, Almagro P,Quintano J. A, Riesco J. A, Trigueros J. A, Piñera P, Simón A, López-Campos J. L, Soriano J. B, and Ancochea J. [Spanish COPD guidelines(GesEPOC): pharmacological treatment of stable COPD]. Atencionprimaria / Sociedad Española de Medicina de Familia y Comunitaria, 44(7):425–437, July 2012b.
Miravitlles M, Soriano J. B, Ancochea J, Muñoz L, Duran-Tauleria E,Sánchez G, Sobradillo V, and García-Río F. Characterisation of theoverlap COPD–asthma phenotype. focus on physical activity andhealth status. Respiratory Medicine, 107(7):1053–1060, July 2013.
Mitchell R. S and Filley G. F. Chronic obstructive bronchopulmonarydisease. i. clinical features. The American Review of Respiratory Disease,89:360–371, Mar. 1964.
Mohamed Hoesein F. A, Zanen P, and Lammers J.-W. J. Lower limit ofnormal or FEV1/FVC <0.70 in diagnosing COPD: An evidence-basedreview. Respiratory Medicine, 105(6):907–915, June 2011.

references 233
Moher D, Liberati A, Tetzlaff J, Altman D. G, and The Prisma Group .Preferred reporting items for systematic reviews and meta-analyses:The prisma statement. PLoS Medicine, 6(7):e1000097, 2009.
Moore W. C, Meyers D. A, Wenzel S. E, Teague W. G, Li H, Li X,R.D’Agostino J, Castro M, Curran-Everett D, Fitzpatrick A. M, GastonB, Jarjour N. N, Sorkness R, Calhoun W. J, Chung K. F, ComhairS. A, Dweik R. A, Israel E, Peters S. P, Busse W. W, Erzurum S. C,and Bleecker E. R. Identification of asthma phenotypes using clusteranalysis in the severe asthma research program. American Journal ofRespiratory and Critical Care Medicine, 181(4):315–23, 2010.
Murphy D. M and Byrne P. M. Recent advances in the pathophysiologyof asthma. Chest, 137(6):1417–1426, 2010.
Musk A. W, Knuiman M, Hunter M, Hui J, Palmer L. J, Beilby J, DivitiniM, Mulrennan S, and James A. Patterns of airway disease and theclinical diagnosis of asthma in the busselton population. EuropeanRespiratory Journal, 38(5):1053–1059, Jan. 2011.
Nash E. S, Briscoe W. A, and Cournand A. The relationship betweenclinical and physiological findings in chronic obstructive disease ofthe lungs. Medicina Thoracalis, 22:305–27, 1965.
National Emphysema Treatment Trial Group. A randomized trialcomparing lung-Volume–Reduction surgery with medical therapyfor severe emphysema. New England Journal of Medicine, 348(21):2059–2073, 2003.
O’Donnell D. E, Aaron S, Bourbeau J, Hernandez P, Marciniuk D. D,Balter M, Ford G, Gervais A, Goldstein R, Hodder R, Kaplan A,Keenan S, Lacasse Y, Maltais F, Road J, Rocker G, Sin D, SinuffT, and Voduc N. Canadian thoracic society recommendations formanagement of chronic obstructive pulmonary disease - 2007 update.Canadian Respiratory Journal : Journal of the Canadian Thoracic Society, 14
(Suppl B):5B–32B, Sept. 2007.

234 references
Oh Y.-M, Bhome A. B, Boonsawat W, Gunasekera K. D, Madegedara D,Idolor L, Roa C, Kim W. J, Kuo H.-P, Wang C.-H, Lan L. T. T, LohL.-C, Ong C.-K, Ng A, Nishimura M, Makita H, Silverman E. K, LeeJ. S, Yang T, Lin Y, Wang C, and Lee S.-D. Characteristics of stablechronic obstructive pulmonary disease patients in the pulmonologyclinics of seven asian cities. International Journal of Chronic ObstructivePulmonary Disease, 8:31–39, 2013.
Paoletti M, Camiciottoli G, Meoni E, Bigazzi F, Cestelli L, PistolesiM, and Marchesi C. Explorative data analysis techniques andunsupervised clustering methods to support clinical assessment ofchronic obstructive pulmonary disease (COPD) phenotypes. Journalof Biomedical Informatics, 42(6):1013–1021, 2009.
Papi A, Romagnoli M, Baraldo S, Braccioni F, Guzzinati I, Saetta M,Ciaccia A, and Fabbri L. M. Partial reversibility of airflow limitationand increased exhaled NO and sputum eosinophilia in chronicobstructive pulmonary disease. American Journal of Respiratory andCritical Care Medicine, 162(5):1773–1777, Nov. 2000.
Park J. S, Jang A. S, Park S. W, Lee Y. M, Uh S. T, Kim Y. H, Cha J. Y, ParkS. M, and Park C.-S. Protection of leukotriene receptor antagonistagainst aspirin-induced bronchospasm in asthmatics. Allergy, Asthma& Immunology Research, 2(1):48–54, Jan. 2010.
Pavord I. D and Gibson P. G. Inflammometry: the current state of play.Thorax, 67(3):191–192, Jan. 2012.
Pavord I. D, Pizzichini M. M, Pizzichini E, and Hargreave F. E. The useof induced sputum to investigate airway inflammation. Thorax, 52(6):498–501, 1997.
Pavord I. D, Korn S, Howarth P, Bleecker E. R, Buhl R, Keene O. N,Ortega H, and Chanez P. Mepolizumab for severe eosinophilicasthma (DREAM): a multicentre, double-blind, placebo-controlledtrial. Lancet, 380(9842):651–659, Aug. 2012.

references 235
Perng D.-W, Huang H.-Y, Chen H.-M, Lee Y.-C, and Perng R.-P. Characteristics of airway inflammation and bronchodilatorreversibility in COPD*: A potential guide to treatment. Chest, 126
(2):375–381, Aug. 2004.
Peters-Golden M, Swern A, Bird S. S, Hustad C. M, Grant E, andEdelman J. M. Influence of body mass index on the response toasthma controller agents. European Respiratory Journal, 27(3):495–503,Mar. 2006.
Petsky H. L, Cates C. J, Lasserson T. J, Li A. M, Turner C, Kynaston J. A,and Chang A. B. A systematic review and meta-analysis: tailoringasthma treatment on eosinophilic markers (exhaled nitric oxide orsputum eosinophils). Thorax, 67(3):199–208, Jan. 2012.
Petty T. The history of COPD. International Journal of Chronic ObstructivePulmonary Disease, 1:3–14, 2006.
Pillai S. G, Tang Y, van den Oord E, Klotsman M, Barnes K, CarlsenK, Gerritsen J, Lenney W, Silverman M, Sly P, Sundy J, Tsanakas J,von Berg A, Whyte M, Ortega H. G, Anderson W. H, and Helms P. J.Factor analysis in the genetics of asthma international network familystudy identifies five major quantitative asthma phenotypes. Clinical& Experimental Allergy, 38(3):421–429, Mar. 2008.
Pin I, Gibson P. G, Kolendowicz R, Girgis-Gabardo A, Denburg J. A,Hargreave F. E, and Dolovich J. Use of induced sputum cell countsto investigate airway inflammation in asthma. Thorax, 47(1):25–29,Jan. 1992.
Piper E, Brightling C, Niven R, Oh C, Faggioni R, Poon K, She D, Kell C,May R. D, Geba G. P, and Molfino N. A. A phase II placebo-controlledstudy of tralokinumab in moderate-to-severe asthma. EuropeanRespiratory Journal, 41(2):330–338, June 2012.
Piras B and Miravitlles M. The overlap phenotype: the (missing) linkbetween asthma and COPD. Multidisciplinary Respiratory Medicine, 7
(1):1–4, 2012.

236 references
Pistolesi M, Camiciottoli G, Paoletti M, Marmai C, Lavorini F, Meoni E,Marchesi C, and Giuntini C. Identification of a predominant COPDphenotype in clinical practice. Respiratory Medicine, 102(3):367–376,2008.
Postma D. S and Boezen H. M. Rationale for the Dutch hypothesis:Allergy and airway hyperresponsiveness as genetic factors and theirinteraction with environment in the development of asthma andCOPD. Chest, 126(2_suppl_1):96S–104S, 2004a.
Postma D. S and Boezen H. M. Rationale for the dutch hypothesis.allergy and airway hyperresponsiveness as genetic factors and theirinteraction with environment in the development of asthma andCOPD. Chest, 126(2 Suppl):96S–104S; discussion 159S–161S, 2004b.
Postma D. S, Bleecker E. R, Amelung P. J, Holroyd K. J, Xu J, PanhuysenC. I, Meyers D. A, and Levitt R. C. Genetic susceptibility to asthma:Bronchial hyperresponsiveness coinherited with a major gene foratopy. New England Journal of Medicine, 333(14):894–900, Oct. 1995.
Postma D. S, Kerstjens H. A. M, and Timens W. Introduction:Obstructive lung diseases from conception to old age. Proceedingsof the American Thoracic Society, 6(8):637–637, Dec. 2009.
Puhan M. A, Garcia-Aymerich J, Frey M, ter Riet G, Antó J. M, AgustíA. G, Gómez F. P, Rodríguez-Roisín R, Moons K. G. M, Kessels A. G,and Held U. Expansion of the prognostic assessment of patients withchronic obstructive pulmonary disease: the updated BODE index andthe ADO index. Lancet, 374(9691):704–711, Aug. 2009.
Ramsdale E. H, Morris M. M, Roberts R. S, and Hargreave F. E.Bronchial responsiveness to methacholine in chronic bronchitis:relationship to airflow obstruction and cold air responsiveness.Thorax, 39(12):912–918, 1984.
Rancìre F, Clarisse B, Nikasinovic L, Just J, and Momas I. Coughand dyspnoea may discriminate allergic and infectious respiratory
references 237
phenotypes in infancy. Pediatric allergy and immunology, 23(4):367–375,June 2012.
Rennard S. I, Calverley P. M, Goehring U. M, Bredenbroker D, andMartinez F. J. Reduction of exacerbations by the PDE4 inhibitorroflumilast–the importance of defining different subsets of patientswith COPD. Respiratory Research, 12:18, 2011.
Richter R, Dahme B, and Kohlhaas A. [efforts toward a cluster analysistaxonomy of bronchial asthma]. Psychotherapie, Psychosomatik,Medizinische Psychologie, 35(12):320–8, 1985.
Ries A. L, Kaplan R. M, and Blumberg E. Use of factor analysisto consolidate multiple outcome measures in chronic obstructivepulmonary disease. Journal of Clinical Epidemiology, 44(6):497–503,1991.
Robinson D. S. The role of the T cell in asthma. Journal of Allergy andClinical Immunology, 126(6):1081–1091, Dec. 2010.
Rodrigo G and Rodrigo C. ASsessment of the patient with acute asthmain the emergency department. a factor analytic study. Chest, 104(5):1325–1328, Nov. 1993.
Rothwell P. M. Treating individuals 1: External validity of randomisedcontrolled trials: "To whom do the results of this trial apply?". Lancet,365(9453):82–93, 2005.
Roy K, Smith J, Kolsum U, Borrill Z, Vestbo J, and Singh D.COPD phenotype description using principal components analysis.Respiratory Research, 10:41, 2009.
Saha S and Brightling C. E. Eosinophilic airway inflammation in COPD.International Journal of Chronic Obstructive Pulmonary Disease, 1(1):39–47, Mar. 2006.
Sandford A. J and Pare P. D. The genetics of asthma the importantquestions. American Journal of Respiratory and Critical Care Medicine,161(Supplement 2):S202–S206, 2000.
238 references
Sansores R. H, Ramírez-Venegas A, Hernández-Zenteno R, Mayar-Maya M. E, Pérez-Bautista O. G, and Velázquez Uncal M. Prevalenceand diagnosis of chronic obstructive pulmonary disease amongsmokers at risk. a comparative study of case-finding vs. screeningstrategies. Respiratory Medicine, 107(4):580–586, Apr. 2013.
Sarafino E. P and Goldfedder J. Genetic factors in the presence, severity,and triggers of asthma. Archives of Disease in Childhood, 73(2):112–116,Aug. 1995.
Savenije O. E, Granell R, Caudri D, Koppelman G. H, Smit H. A, WijgaA, de Jongste J. C, Brunekreef B, Sterne J. A, Postma D. S, HendersonJ, and Kerkhof M. Comparison of childhood wheezing phenotypesin 2 birth cohorts: ALSPAC and PIAMA. Journal of Allergy and ClinicalImmunology, 127(6):1505–1512.e14, June 2011.
Schafer D and Maune S. Pathogenic mechanisms and in vitro diagnosisof AERD. Journal of Allergy, 2012:18, 2012.
Shaw D. E, Berry M. A, Thomas M, Green R. H, Brightling C. E,Wardlaw A. J, and Pavord I. D. The use of exhaled nitric oxide toguide asthma management: A randomized controlled trial. AmericanJournal of Respiratory and Critical Care Medicine, 176(3):231–237, 2007.
Shirtcliffe P, Weatherall M, Marsh S, Travers J, Hansell A, McNaughtonA, Aldington S, Muellerova H, and Beasley R. COPD prevalencein a random population survey: a matter of definition. EuropeanRespiratory Journal, 30(2):232–9, 2007.
Shirtcliffe P, Weatherall M, Travers J, and Beasley R. The multipledimensions of airways disease: targeting treatment to clinicalphenotypes. Current Opinion in Pulmonary Medicine, 17(2):–, 2011.
Sibbald B, Horn M. E, Brain E. A, and Gregg I. Genetic factors inchildhood asthma. Thorax, 35(9):671–674, Sept. 1980.

references 239
Silkoff P. E, Martin D, Pak J, and Martin R. J. Exhaled nitric oxideand induced sputum analysis as markers of airway inflammation insubjects with COPD. Chest, 117(5 suppl 1):281S–281S, May 2000.
Simpson A, Tan V. Y. F, Winn J, Svensén M, Bishop C. M, HeckermanD. E, Buchan I, and Custovic A. Beyond atopy: Multiple patterns ofsensitization in relation to asthma in a birth cohort study. AmericanJournal of Respiratory and Critical Care Medicine, 181(11):1200–1206, Jan.2010.
Siroux V, Basagana X, Boudier A, Pin I, Garcia-Aymerich J, Vesin A,Slama R, Jarvis D, Anto J. M, Kauffmann F, and Sunyer J. Identifyingadult asthma phenotypes using a clustering approach. EuropeanRespiratory Journal, 38(2):310–317, 2011.
Siva R, Green R. H, Brightling C. E, Shelley M, Hargadon B, McKennaS, Monteiro W, Berry M, Parker D, Wardlaw A. J, and Pavord I. D.Eosinophilic airway inflammation and exacerbations of COPD: arandomised controlled trial. European Respiratory Journal, 29(5):906–913, May 2007.
Smith A. D, Cowan J. O, Brassett K. P, Filsell S, McLachlan C, Monti-Sheehan G, Herbison G. P, and Taylor D. R. Exhaled nitric oxide:A predictor of steroid response. American Journal of Respiratory andCritical Care Medicine, 172(4):453–459, 2005.
Snider G. L. Chronic obstructive pulmonary disease: risk factors,pathophysiology and pathogenesis. Annual Review of Medicine, 40:411–29, 1989a.
Snider G. L. Chronic obstructive pulmonary disease: a definition andimplications of structural determinants of airflow obstruction forepidemiology. American Review of Respiratory Disease, 140(3 Pt 2):S3–8,1989b.
Snider G. L. Nosology for our day: its application to chronic obstructivepulmonary disease. American Journal of Respiratory and Critical CareMedicine, 167(5):678–83, 2003.

240 references
Soler-Cataluña J. J, Cosío B, Izquierdo J. L, López-Campos J. L, MarínJ. M, Agüero R, Baloira A, Carrizo S, Esteban C, Galdiz J. B, GonzálezM. C, Miravitlles M, Monsó E, Montemayor T, Morera J, OrtegaF, Peces-Barba G, Puente L, Rodríguez J. M, Sala E, Sauleda J,Soriano J. B, and Viejo J. L. Consensus document on the overlapphenotype COPD-asthma in COPD. Archivos de Bronconeumologia(English Edition), 48(9):331–337, Sept. 2012.
Soler-Cataluña J. J, Martínez-García M. A, Román Sánchez P, SalcedoE, Navarro M, and Ochando R. Severe acute exacerbations andmortality in patients with chronic obstructive pulmonary disease.Thorax, 60(11):925–931, Nov. 2005.
Soriano J. B. The proportional Venn diagram of obstructive lungdisease: Two approximations from the United States and the UnitedKingdom. Chest, 124(2):474–481, 2003.
Soriano J. B, Zielinski J, and Price D. Screening for and early detectionof chronic obstructive pulmonary disease. Lancet, 374(9691):721–732,2009.
Sousa A. R, Parikh A, Scadding G, Corrigan C. J, and Lee T. H.Leukotriene-receptor expression on nasal mucosal inflammatorycells in aspirin-sensitive rhinosinusitis. New England Journal ofMedicine, 347(19):1493–1499, Nov. 2002.
Spycher B. D, Silverman M, Brooke A. M, Minder C. E, and KuehniC. E. Distinguishing phenotypes of childhood wheeze and coughusing latent class analysis. European Respiratory Journal, 31(5):974–81,2008.
Statistics New Zealand, Accessed 15th May 2013. URL www.stats.govt.nz/infoshare/.
Stoller J. K and Aboussouan L. S. Alpha 1-antitrypsin deficiency. Lancet,365(9478):2225–2236, June 2005.

references 241
Sutherland E. R, Goleva E, King T. S, Lehman E, Stevens A. D, JacksonL. P, Stream A. R, Fahy J. V, and Donald Y. M. Leung for the Asthma Clinical Research Network. Cluster analysis of obesity and asthma phenotypes. PLoS ONE, 7(5):–, 2012.
Swanney M. P, Ruppel G, Enright P. L, Pedersen O. F, Crapo R. O,Miller M. R, Jensen R. L, Falaschetti E, Schouten J. P, Hankinson J. L,Stocks J, and Quanjer P. H. Using the lower limit of normal for theFEV1/FVC ratio reduces the misclassification of airway obstruction.Thorax, 63(12):1046–1051, Dec. 2008.
Tashkin D. P, Altose M. D, Connett J. E, Kanner R. E, Lee W. W, andWise R. A. Methacholine reactivity predicts changes in lung functionover time in smokers with early chronic obstructive pulmonarydisease. the lung health study research group. American Journal ofRespiratory and Critical Care Medicine, 153(6):1802–1811, June 1996.
Tashkin D. P, Celli B, Decramer M, Liu D, Burkhart D, Cassino C,and Kesten S. Bronchodilator responsiveness in patients with COPD.European Respiratory Journal, 31(4):742–50, 2008.
Taylor D. R, Pijnenburg M. W, Smith A. D, and Jongste J. C. D. Exhalednitric oxide measurements: clinical application and interpretation.Thorax, 61(9):817–827, 2006.
Teran L. M, Holgate S. T, Park H.-S, and Sampson A. P. Aspirinexacerbated respiratory disease. Journal of Allergy, 2012:2, 2012.
Therneau T, Atkinson B, Ripley B, and Ripley M. B. Pack-age ‘rpart’, 2012. URL http://essrc.hyogo-u.ac.jp/cran/web/
packages/rpart/rpart.pdf.
Thomas S. Y, Chyung Y. H, and Luster A. D. Natural killer T cellsare not the predominant T cell in asthma and likely modulate, notcause, asthma. Journal of Allergy and Clinical Immunology, 125(5):980–984, May 2010.
242 references
Tibshirani R, Walther G, and Hastie T. Estimating the number ofclusters in a data set via the gap statistic. Journal of the Royal StatisticalSociety: Series B (Statistical Methodology), 63(2):411–423, 2001.
Town I, Taylor R, Garrett J, and Patterson J. The Burden of COPD in NewZealand. Asthma and Respiratory Foundation of New Zealand (Inc.),December 2003.
Travers J, Marsh S, Caldwell B, Williams M, Aldington S, WeatherallM, Shirtcliffe P, and Beasley R. External validity of randomizedcontrolled trials in COPD. Respiratory Medicine, 101(6):1313–20, 2007a.
Travers J, Marsh S, Williams M, Weatherall M, Caldwell B, ShirtcliffeP, Aldington S, and Beasley R. External validity of randomisedcontrolled trials in asthma: to whom do the results of the trials apply?Thorax, 62(3):219–23, 2007b.
Travers J, Weatherall M, Fingleton J, and Beasley R. Towardsindividualised medicine for airways disease: Identifying clinicalphenotype groups. European Respiratory Journal, 39(4):1033–4, 2012.
Tse S. M, Tantisira K, and Weiss S. T. The pharmacogenetics andpharmacogenomics of asthma therapy. Pharmacogenomics J, 11(6):383–392, Dec. 2011.
Umetsu D. T and DeKruyff R. H. Natural killer T cells are important inthe pathogenesis of asthma: The many pathways to asthma. Journalof Allergy and Clinical Immunology, 125(5):975–979, May 2010.
University of Groningen, Royal Van Gorcum . Bronchitis: an internationalsymposium. April 27-29, 1960. Assen, 1961.
van den Berge M, Vonk J. M, Gosman M, Lapperre T. S, Snoeck-Stroband J. B, Sterk P. J, Kunz L. I, Hiemstra P. S, Timens W,ten Hacken N. H, Kerstjens H. A, and Postma D. S. Clinicaland inflammatory determinants of bronchial hyperresponsiveness inCOPD. European Respiratory Journal, 40(5):1098–1105, Nov. 2012.

references 243
van der Valk R. J. P, Caudri D, Savenije O, Koppelman G. H, Smit H. A,Wijga A. H, Postma D. S, Kerkhof M, Brunekreef B, and de JongsteJ. C. Childhood wheezing phenotypes and FeNO in atopic childrenat age 8. Clinical & Experimental Allergy, 42(9):1329–1336, 2012.
Vestbo J and Prescott E. Update on the "Dutch hypothesis" for chronicrespiratory disease. Thorax, 53 Suppl 2:S15–9, 1998.
Viegi G, Pedreschi M, Pistelli F, Di Pede F, Baldacci S, Carrozzi L,and Giuntini C. Prevalence of airways obstruction in a generalpopulation: European Respiratory Society vs American ThoracicSociety definition. Chest, 117(5 Suppl 2)::339S–45S, May 2000.
Viegi G, Matteelli G, Angino A, Scognamiglio A, Baldacci S, SorianoJ. B, and Carrozzi L. The proportional Venn diagram of obstructivelung disease in the Italian general population. Chest, 126(4):1093–101,2004.
Vijverberg S. J. H, Koenderman L, Koster E. S, van der Ent C. K,Raaijmakers J. A. M, and Maitland-van der Zee A.-H. Biomarkersof therapy responsiveness in asthma: pitfalls and promises. Clinical& Experimental Allergy, 41(5):615–629, 2011.
Vonk J. M, Jongepier H, Panhuysen C. I. M, Schouten J. P, BleeckerE. R, and Postma D. S. Risk factors associated with the presenceof irreversible airflow limitation and reduced transfer coefficient inpatients with asthma after 26 years of follow up. Thorax, 58(4):322–327, Apr. 2003.
Ward J. H. Hierarchical grouping to optimize an objective function.Journal of the American Statistical Association, 58:236–244, 1963.
Wardlaw A. J, Silverman M, Siva R, Pavord I. D, and Green R.Multi-dimensional phenotyping: towards a new taxonomy for airwaydisease. Clinical & Experimental Allergy, 35(10):1254–62, 2005.
Weatherall M, Travers J, Shirtcliffe P. M, Marsh S. E, Williams M. V,Nowitz M. R, Aldington S, and Beasley R. Distinct clinical

244 references
phenotypes of airways disease defined by cluster analysis. EuropeanRespiratory Journal, 34(4):812–8, 2009.
Weatherall M, Shirtcliffe P, Travers J, and Beasley R. Use of clusteranalysis to define COPD phenotypes. European Respiratory Journal, 36
(3):472–474, 2010.
Weatherall M, Fingleton J, Eyers S, and Beasley R. A half doubling dosechange in bronchial hyperresponsiveness in a population representsan important difference. Translational Respiratory Medicine, 1(1):4,2013.
Wechsler M. E, Kunselman S. J, Chinchilli V. M, Bleecker E, BousheyH. A, Calhoun W. J, Ameredes B. T, Castro M, Craig T. J, DenlingerL, Fahy J. V, Jarjour N, Kazani S, Kim S, Kraft M, Lazarus S. C,Lemanske R. F, Markezich A, Martin R. J, Permaul P, Peters S. P,Ramsdell J, Sorkness C. A, Sutherland E. R, Szefler S. J, WalterM. J, Wasserman S. I, and Israel E. Effect of β2-adrenergic receptorpolymorphism on response to longacting β2 agonist in asthma(large trial): a genotype-stratified, randomised, placebo-controlled,crossover trial. Lancet, 374(9703):1754–1764, Nov. 2009.
Wegner R. E, Jorres R. A, Kirsten D. K, and Magnussen H. Factoranalysis of exercise capacity, dyspnoea ratings and lung function inpatients with severe COPD. European Respiratory Journal, 7(4):725–9,1994.
Weiss S. T. New approaches to personalized medicine for asthma:Where are we? Journal of Allergy and Clinical Immunology, 129(2):327–334, Feb. 2012.
Wenzel S. E. Asthma: defining of the persistent adult phenotypes.Lancet, 368(9537):804–813, 2006.
Wenzel S. E, Szefler S. J, Leung D. Y, Sloan S. I, Rex M. D, andMartin R. Bronchoscopic evaluation of severe asthma: Persistentinflammation associated with high dose glucocorticoids. American
references 245
Journal of Respiratory and Critical Care Medicine, 156(3):737–743, Sept.1997.
Wouters E. F. M, Reynaert N. L, Dentener M. A, and Vernooy J. H. J.Systemic and local inflammation in asthma and chronic obstructivepulmonary disease: Is there a connection? Proceedings of the AmericanThoracic Society, 6(8):638–647, Dec. 2009.
Yan K, Salome C. M, and Woolcock A. J. Prevalence and nature ofbronchial hyperresponsiveness in subjects with chronic obstructivepulmonary disease. The American Review of Respiratory Disease, 132(1):25–29, 1985.
Zeki A. A, Schivo M, Chan A, Albertson T. E, and Louie S. The asthma-COPD overlap syndrome: A common clinical problem in the elderly.Journal of Allergy, 2011:1–10, 2011.
Zeng G, Sun B, and Zhong N. Non-smoking-related chronic obstructivepulmonary disease: A neglected entity? Respirology, 17(6):908–912,2012.


Part V
A P P E N D I X


AC R I T E R I A F O R T E S T P O S T P O N E M E N T D U E T O
C H E S T I N F E C T I O N / U RT I
It is unlikely that subjects who are feeling unwell would want to
participate or produce their best results. The following are a guide and
represent exclusion criteria only when the symptoms are different to
normal for them for this time of year.
1. Upper respiratory tract infection
a) Cough with sputum OR
b) Change in colour of normal sputum (e.g. clear to yellow/-
green) or increased quantity
c) Rhinorrhea (runny nose)
d) Sneezing
e) Congestion or blocked nose +/- muscle aches or gener-
alised/frontal headache
2. Chest Infection (lower respiratory tract infection)
a) Cough with sputum OR
b) Change in colour of normal sputum (e.g. clear to yellow/-
green) or increased quantity
c) Chest pain worsening with coughing
249

250 references
Any of these symptoms lasting for more than two days should lead to
test postponement until at least three weeks from first symptom or full
recovery.
If subjects have been given an antibiotic for a cough or cold, tests
should also be postponed for 3 weeks from the start of symptoms for
which treatment was started.

BPA RT I C I PA N T I N F O R M AT I O N S H E E T
The participant information sheet is included in unmodified form on
the following pages. The version included here is the final version.
Modifications were made during the study as new aspects were added.
Periostin measurement and the taking of genetic samples was added to
the study, as sub-studies not discussed in this thesis, and the relevant
sections inserted at that time. No significant modifications were made
to the remainder of the text once the study commenced.
251

Medical Research Institute of New Zealand, Private Bag 7902, Wellington 6242 Tel: 04 805 0147
Participant Information Sheet NZRHS01 Version 4.2 11th April 2012 page 1 of 7
PARTICIPANT INFORMATION SHEET The Medical Research Institute of New Zealand is currently undertaking a study of airways disease in the greater Wellington region:
New Zealand Respiratory Health Survey
INVESTIGATORS
Professor Richard Beasley Dr Justin Travers Dr Pip Shirtcliffe Dr James Fingleton Mr Mathew Williams Level 7, CSB Building Wellington Hospital Riddiford St, Newtown Wellington 6021 Ph: 04 4 805 0147
You are invited to take part in this study. Do not feel obliged to make your decision now but feel free to think about it at home and contact us when you have made your decision. The information given in this leaflet should help to explain the study and tell you what is going to happen. It is your right to decide not to take part in the study.
Medical Research Institute of New Zealand, Private Bag 7902, Wellington 6242 Tel: 04 805 0147
Participant Information Sheet NZRHS01 Version 4.2 11th April 2012 page 2 of 7
What are the aims of the study?
Asthma and COPD (including emphysema and chronic bronchitis) are two of the most import and common medical conditions affecting adults worldwide. Despite the substantial burden of these diseases there is an inadequate understanding of their causation, particularly, how they should be classified and which types of patient with these diseases respond to the different medications. This study aims to confirm the presence of distinct disease types and compare their response to common medications currently used in the treatment of asthma and COPD. How many participants will be involved?
We expect 500 participants to visit us for this study. Where will the study be held?
The study will be held both at Wellington Hospital, Riddiford Street, Newtown in Wellington and Bowen Hospital, Churchill Drive, Crofton Downs, in Wellington. You can attend whichever hospital is more convenient for you What will I have to do?
Visit 1
You will be invited to Wellington or Bowen Hospital to assess the health and function of your lungs. We’ll ask you to sit in a plastic box like a shower stall. You will be asked to sit inside it for a few minutes and undertake some breathing exercises. You will be able to hear the operator’s voice at all times giving you instructions. Measurements will be taken at least 3 times to allow us to record the best reading. We will take a small blood sample before we measure how well your lungs transfer gas. If you do not normally take inhalers you will be given some medication through an inhaler - this produces a fine mist of medication for you to breathe. At this visit, this medication will be either salbutamol (Ventolin) or ipratropium (Atrovent). Both medications are commonly given to people with airways disease to open up the passages in the lungs and improve breathing. While you wait 30 minutes for the medication to work, we will ask you to complete a questionnaire. Then we will repeat the breathing exercises in the box to see if the medication has helped your breathing. We estimate that this visit will take up to 2
hours
of your time, not including travel time. If you do normally take inhalers we may ask you to complete the questionnaires and then come back on a different day to be given the medication. We may ask you not to take your normal inhalers on that day until after we have seen you. After Visit 1
We will give you a peak flow meter to take home when you leave the clinic. We will ask you to measure your breathing twice daily at home for one week. Visit 2
You will be invited back to Wellington / Bowen Hospital. We will be asking you to breathe into different machines. First you breathe into a tube so that we can measure a gas (Nitric oxide) that you naturally exhale. Then you will again breathe into a machine to measure the work of your breathing, and to repeat the breathing test where you sit in a plastic box

Medical Research Institute of New Zealand, Private Bag 7902, Wellington 6242 Tel: 04 805 0147
Participant Information Sheet NZRHS01 Version 4.2 11th April 2012 page 3 of 7
like a shower stall. Then you will be given some medication through an inhaler. You will receive the other medication that you did not get at the first visit, either ipratropium or salbutamol. Whilst waiting for the medication to work we will ask you to fill in 3 questionnaires about your breathing. After waiting 30 minutes for the medication to work, we will repeat the breathing exercises in the box to see if the medication has helped your breathing. Selected study participants will be provided with an inhaled corticosteroid medication to be taken for 12 weeks. This is the most common medication used on a regular basis to reduce the severity of asthma or COPD. It controls the disease process by reducing inflammation in the airways. We estimate that this visit will take up to 2
hours of
your time, not including travel time. Participants who will be taking the inhaled corticosteroid will also have a nasal swab taken at visit 2 and 3. This swab will be used for looking at the different patterns of cell activity to see if some patterns are associated with a better response to the inhaler. After Visit 2
If you were not provided with the inhaled corticosteroid medication, you have finished the study. If you were provided with this medication, you will keep taking it twice a day for 12 weeks. We will ask you to measure your breathing twice daily at home for one week. Visit 3
You will be invited back to Wellington / Bowen Hospital. We will collect any remaining inhaled corticosteroid medication. You will breathe into a tube so that we can again measure the nitric oxide that you naturally exhale. You will then again breathe into a machine to measure the work of your breathing, and repeat the breathing test where you sit in a plastic box like a shower stall. Then you will be given salbutamol through an inhaler. While waiting 30 minutes for the medication to work, you will repeat some of the questionnaires. We will repeat the breathing exercises in the box to see if the salbutamol has helped your breathing. We estimate that this visit will take up to 2
hours of your time,
not including travel time. Some subjects may be asked to have a second blood test at visit 3.
QUESTIONS THAT YOU MAY HAVE
What are the benefits of the study?
The benefits of taking part in this study are that you will learn more about how your lungs work. The breathing tests might detect a problem with your lungs that you could then get treated, which may improve your health. You will also be contributing to important medical research. Do I continue to smoke during the study?
You should continue to smoke in your usual pattern throughout the study, although you will need to withhold for a short period prior to the lung function tests. This is explained in the leaflet “Important information for study participants” What are the side effects of the drugs used in the study?
Salbutamol (Ventolin) is the most common medication used to relieve symptoms in airways disease in New Zealand. Generally it is very well tolerated and causes no problems. Side effects when they do occur are usually mild and transient and include
Medical Research Institute of New Zealand, Private Bag 7902, Wellington 6242 Tel: 04 805 0147
Participant Information Sheet NZRHS01 Version 4.2 11th April 2012 page 4 of 7
tremor, palpitations, cramps and headaches. A single dose such as you will receive is unlikely to cause you any problems. However, should you experience any problems when you get home you are welcome to ring one of the doctors listed on the front of this leaflet for advice. Ipratropium is a medication used by thousands of people with airways disease in New Zealand. Generally it is very well tolerated with no problems. Side effects when they do occur are usually mild and transient and include dry mouth and constipation. A single dose such as you will receive is unlikely to cause you any problems. However, should you experience any problems when you get home you are welcome to ring the number on the front of this leaflet and ask to speak to one of the doctors listed. Inhaled corticosteroids are the most common preventative medication used by people with airways disease in New Zealand. Generally they are very well tolerated and cause no problems. Side effects with prolonged use, when they do occur, are usually mild and transient and include thrush of the mouth and throat and an increase in skin bruising. A short course such as you will receive is unlikely to cause you any problems. Cushing's syndrome, adrenal suppression, growth retardation, decreased bone mineral density and cataract occur very rarely when used at high doses for years. What is my blood being tested for?
Your blood is being tested for the following things:
Anaemia: This affects the results of your lung function tests. C reactive protein: This is a measure of inflammation in the body Carboxyhaemoglobin: This is raised in tobacco smokers and affects the results of your lung function tests. Immunoglobulin E: this kind of antibody can be raised in people with asthma or allergies. Evidence of allergic response to things such as pollen. Periostin: This is a protein in the blood which may be raised in people with airway inflammation
With your consent we will also store a sample of blood for some participants which can be used to look at links between types of airways disease and certain genes. Will the blood test hurt?
There is always the risk of momentary discomfort, bleeding, swelling and bruising at the site of the needle during sampling. How do you do the nasal swabs? If you are having a nasal swab taken we will spray a small amount of local anaesthetic into one nostril and then place the swab in the nose and roll it to pick up a few cells from the surface. The local anaesthetic can sting and some people find the swab slightly uncomfortable. What will happen to the stored blood and nasal swabs?
There are many links between our genes (part of our DNA) and the pattern of diseases we get. It can be very helpful to look at how common certain genes are in people with different types of airways disease. This will not tell us anything about your risk of experiencing a disease but may help us to better understand the different types of asthma and COPD.
Medical Research Institute of New Zealand, Private Bag 7902, Wellington 6242 Tel: 04 805 0147
Participant Information Sheet NZRHS01 Version 4.2 11th April 2012 page 5 of 7
Each person has a DNA make-up (their genes) that is different from that of everybody else (except in the case of identical twins). This genetic make-up is a mixture of the genes of our parents. The precise way genes are mixed varies from child to child within the same family, so having the same parents does not mean that two children will have exactly the same genes. We already know that some health conditions and disorders are definitely inherited through the genes (hereditary conditions), but we do not know how many conditions are explained by genetic inheritance. Inherited genes may explain why some people are more resistant and some people more prone to disorders that have not yet been identified as hereditary. The research in which you are invited to participate will investigate genetic makeup to look for any link between an occurrence of a disorder and inherited genes. Because the research investigates genetic make-up, this identifies you as a participant as well as your particular genetic characteristics. This information is confidential and will not be disclosed, stored or used in any way without your informed consent. In particular the researcher/sponsor of the research will not claim any right, ownership or property in your individual genetic information or that of your kinship group, hapū or iwi, without having first sought and obtained your informed consent to the transfer of any such right, ownership or property. Your consenting to participate in DNA sampling for the proposed study will not be construed as creating any right or claim on the part of the researcher/sponsor to your genetic information. For some people and their family/whanau, there may be concerns in sending genetic samples overseas. This should be discussed with them where possible/appropriate. The stored samples will be kept in a secure freezer until analysed. The samples may be sent for analysis in an expert research centre in another country. Stored samples will only be used to help us understand these conditions better. To preserve confidentiality, any samples sent overseas will have personal information such as name and date of birth replaced by a code (de-identified). In the future there may be other genes / genetic markers that we wish to investigate. With your consent we may use your stored blood sample in future studies looking at the relationship between our DNA and airways diseases. Will taking part cost me anything?
There are no costs incurred by you to take part in the study for the tests, other than travel, and your time. You will receive some reimbursement in recognition of your participation in the trial and for travel costs you may incur for the visits to Wellington / Bowen hospital. Do I have to take part?
Your participation is entirely voluntary (your choice). You do not have to take part in this study, and if you choose not to take part it will in no way affect your future health care. If you do agree to take part you are free to withdraw from the study at any time, without having to give a reason. Will I be able to bring somebody with me?
Yes, you are welcome to bring a family member or friend with you if you wish. Will I be able to have an interpreter?

Medical Research Institute of New Zealand, Private Bag 7902, Wellington 6242 Tel: 04 805 0147
Participant Information Sheet NZRHS01 Version 4.2 11th April 2012 page 6 of 7
Yes, interpreters are available on request. Will my GP be told I am in the study?
Yes, with your permission, the researcher will write to your GP, once the study is completed, with the results of your tests. It is not a requirement that your GP be informed. Will the answers I give on the questionnaire be kept confidential?
Absolutely everything you tell us will be protected by doctor - patient privilege and will not be disclosed to anyone. The questionnaire will be used only for the purposes of this study. No information that could personally identify you will be used in any reports on this study. For the duration of the study, any documentation will be kept in a locked office, and on completion of the study it will be stored in a locked cupboard for 10 years to comply with Good Clinical Practice guidelines and then destroyed. If requested, auditors and regulatory authorities such as the Wellington Ethics Committee, may access documentation including participant’s notes for verification of study procedures. This process will in no way violate the confidentiality of the participants. Will I be able to find out the results of the study?
Yes, your individual results can be posted to you on request and you will be able to find out the results of the study when it is completed. Where can I get more information about the study?
You can call the researchers whose details are on the front page of this information sheet. An interpreter can be provided. If you have any queries or concerns regarding your rights as a participant in this study, you may wish to contact a Health and Disability Services Consumer Advocate at telephone number 0800 423 638. What do I do now?
If you have decided you would like to participate in the study and do not already have an appointment, please call Matthew on 04 8050243. We will then make your appointment for Wellington / Bowen Hospital.
STATEMENT OF APPROVAL
This study has received ethical approval from the Central Ethics Committee.
Compensation: In the most unlikely event of a physical injury as a result of your participation in this study, you may be covered by ACC under the Injury Prevention, Rehabilitation and Compensation Act. ACC cover is not automatic and your case will need to be assessed by ACC according to the provisions of the 2002 Injury Prevention Rehabilitation and Compensation Act. If your claim is accepted by ACC, you still might not get any compensation. This depends on a number of factors such as whether you are an earner or non-earner. ACC usually provides only partial reimbursement of costs and expenses and there may be no lump

Medical Research Institute of New Zealand, Private Bag 7902, Wellington 6242 Tel: 04 805 0147
Participant Information Sheet NZRHS01 Version 4.2 11th April 2012 page 7 of 7
sum compensation payable. There is no cover for mental injury unless it is a result of physical injury. If you have ACC cover, generally this will affect your right to sue the investigators. If you have any questions about ACC, contact your nearest ACC office or the investigator.


CM A I N Q U E S T I O N N A I R E
The following pages contain the NZRHS main questionnaire and the
guidance document provided to investigators.
261


Version 2.8 18th
April 2011 Page 1 of 9
New Zealand Respiratory Questionnaire – NZ English Version
Name:
Code:
Day Month Year
Date:
A. General Questions Day Month Year
1. When were you born?
2. Which ethnic group do you belong to? Mark the space or spaces which apply to you.
Maori 1
New Zealand European 2
Samoan 3
Cook Island Maori 4
Tongan 5
Niuean 6
Chinese 7
Indian 8
Other ( such as DUTCH, JAPANESE, TOKELAUAN). Please state: 9
M F
3. Are you male or female? 1 2
B. Respiratory Symptoms
Cough
Yes No
4. Do you usually cough when you don't have a cold? 1 0
If NO, go to question 5, if YES, proceed with this section:
Yes No N/A
4a. Do you cough on most days for as much as 3 months each year? 1 0
<2 yrs 2-5 yrs >5 yrs N/A
4b. For how many years have you had this cough? 1 2 3
Yes No N/A
4c. Have you been woken at night by an attack of coughing at any
time in the last 12 months?
1
0

Version 2.8 18th
April 2011 Page 2 of 9
Sputum
Yes No
5. Do you usually bring up phlegm from your chest first thing in the morning? 1 0
If NO, go to question 6, if YES, proceed with this section:
Yes No N/A
5a. Do you bring up phlegm like this on most days for as much as 3
months each year?
1
0
Years N/A
5b. For how many years have you had phlegm like this?
Months N/A
5c. How many months of an average year would you have phlegm like this?
Days N/A
5d. How many days of an average month (with phlegm) would you have phlegm like
this?
< a tablespoon >a tablespoon N/A
5e. During the whole day, how much sputum is there usually? 1 2
Breathlessness
Yes No
6. Do you ever have trouble with your breathing? 1 0
If NO, go to question 7, if YES, proceed with this section:
Always, so that
your breathing is
never quite right
Comes and goes,
but it always gets
completely better
Rarely N/A
6a. When do you have this trouble? 3 2 1
Years N/A
6b. How old were you when you first noticed this trouble?
Wheeze
Yes No
7. Have you ever had wheezing or whistling in your chest when breathing? 1 0
If NO, go to question 8, if YES, proceed with this section:
Yes No N/A
7a. Have you had wheezing or whistling in your chest at any time in
the last 12 months?
1 0
Yes No N/A
7b. Have you been at all breathless when the wheezing noise was
present?
1 0
If NO, go to question 8, if YES, proceed with this section:

Version 2.8 18th
April 2011 Page 3 of 9
Age N/A
7c. How old were you when you first experienced shortness of breath with wheezing?
Age N/A
7d. How old were you when you last experienced shortness of breath with wheezing?
Yes No N/A
7e. Have you experienced shortness of breath with wheeze in the last
12 months?
1 0
If NO go to question 8, if YES proceed with this section:
Yes No N/A
7f. Have you had an attack of shortness of breath at any time in the
last 12 months that has woken you from sleep?
1 0
Yes No N/A
7g. Have you had an attack of shortness of breath at any time in the
last 12 months where you have found it difficult to speak?
1 0
Yes No N/A
7h. Have you had an attack of shortness of breath at any time in the
last12 months that required you to see a doctor?
1 0
C. Past respiratory history and diagnoses
Emphysema Yes No
8. Did a doctor ever tell you that you had emphysema? 1 0
Chronic bronchitis Yes No
9. Did a doctor ever tell you that you had chronic bronchitis? 1 0
COPD Yes No
10. Did a doctor ever tell you that you had chronic obstructive pulmonary disease
(COPD)?
1 0
Bronchiectasis Yes No
11. Did a doctor ever tell you that you had bronchiectasis? 1 0
Tuberculosis
Yes No
11a. Did a doctor ever tell you that you had tuberculosis? 1 0
If NO, go to question 8, if YES, proceed with this section:
Yes If yes, what treatment? No
11b. Have you ever received treatment for tuberculosis? 1 0
If NO, go to question 8, if YES, proceed with this section:
Yes No
11c: Have you received at least 6 months of antibiotic treatment for tuberculosis? 1 0

Version 2.8 18th
April 2011 Page 4 of 9
Asthma
Yes No
12. Did a doctor ever tell you that you that you had asthma? 1 0
If NO, go to question 13a, if YES, proceed with this section:
Age N/A
12a. How old were you when you had your first attack of asthma?
Age N/A
12b. How old were you when you had your most recent attack of asthma?
Atopy
Yes No
13a. Have you ever had eczema or any kind of skin allergy? 1 0
Yes No
13b. Have you ever had a problem with sneezing, or a runny or blocked nose when
you DID NOT have a cold or the flu?
1 0
Chest infections
Infections
14. How many chest infections have you had in the last 12 months?
D. Smoking
Current Smoking
Yes No
15. Do you now smoke cigarettes? 1 0
If NO go to question 16, if YES proceed with this section:
Age N/A
15a. How old were you when you began to smoke cigarettes?
Cigarettes N/A
15b. How many cigarettes do you smoke each day, on average:
Pack Years
Interviewer calculate pack years

Version 2.8 18th
April 2011 Page 5 of 9
Previous Smoking
Yes No N/A
16. Did you smoke cigarettes previously? 1 0
If NO go to question 17, if YES proceed with this section:
Age N/A
16a. How old were you when you began to smoke cigarettes?
Age N/A
16b. How old were you when you stopped cigarette smoking?
Cigarettes N/A
16c. How many cigarettes did you smoke each day, on average?
Pack Years
Interviewer calculate pack years
E. Occupation
Age
17. Age when completed full time education?
17a. What is your current or most recent job? (be as precise as possible)
17b. Are you or were you:
a manager working for an employer 1
a foreman or supervisor working for an employer 2
working for an employer but neither a manager, supervisor or foreman 3
self-employed 4
Yes No
17c. Does being at work ever make your chest tight or wheezy? 1 0
Yes No
17d. Have you ever had to change or leave your job because it affected your
breathing
1 0
If NO go to question 18; if YES, proceed with this section:
17e. What was this job? (Be as precise as possible)
Occupational Exposures
Yes No
18. Have you ever worked in a job which exposed you to vapours, gas, dust or
fumes?
1 0
If NO go to question 19; if YES, proceed with this section:
18a. What was this job? (Be as precise as possible)
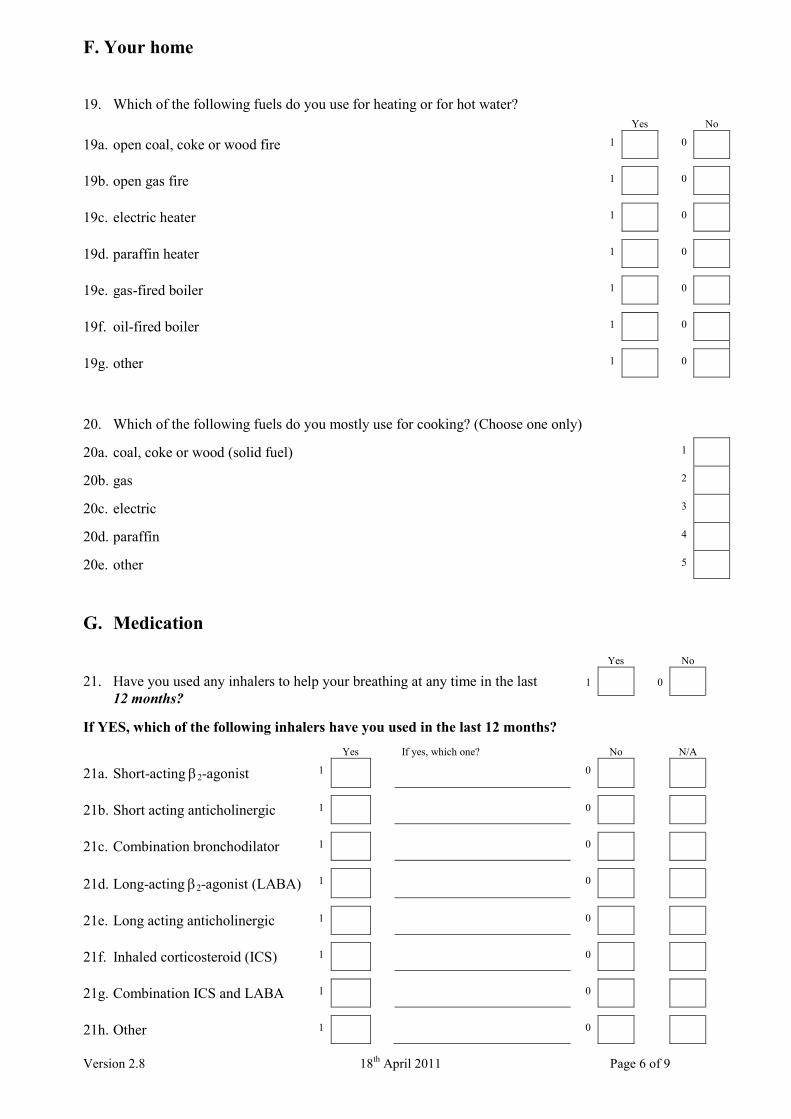
Version 2.8 18th
April 2011 Page 6 of 9
F. Your home
19. Which of the following fuels do you use for heating or for hot water? Yes No
19a. open coal, coke or wood fire 1 0
19b. open gas fire 1 0
19c. electric heater 1 0
19d. paraffin heater 1 0
19e. gas-fired boiler 1 0
19f. oil-fired boiler 1 0
19g. other 1 0
20. Which of the following fuels do you mostly use for cooking? (Choose one only)
20a. coal, coke or wood (solid fuel) 1
20b. gas 2
20c. electric 3
20d. paraffin 4
20e. other 5
G. Medication
Yes No
21. Have you used any inhalers to help your breathing at any time in the last
12 months?
1
0
If YES, which of the following inhalers have you used in the last 12 months?
Yes If yes, which one? No N/A
21a. Short-acting 2-agonist 1 0
21b. Short acting anticholinergic 1 0
21c. Combination bronchodilator 1 0
21d. Long-acting 2-agonist (LABA) 1 0
21e. Long acting anticholinergic 1 0
21f. Inhaled corticosteroid (ICS) 1 0
21g. Combination ICS and LABA 1 0
21h. Other 1 0

Version 2.8 18th
April 2011 Page 7 of 9
Yes No
22. Have you used any pills, capsules, tablets or medicines, other than inhaled
medicines, to help your breathing at any time in the last 12 months?
1
0
If YES, which of the following have you used in the last 12 months?
Yes If yes, which one? No N/A
22a. Oral specific 2-agonists 1 0
22b. Oral methylxanthines 1 0
22c. Oral steroids 1 0
22d. Oral antihistamines 1 0
22e. Other oral medications 1 0
Antibiotics
courses
23. How many courses of antibiotics have you taken to treat a chest infection in the last 12
months?
H. Use of health services
Yes No
24. Have you ever had to make an unplanned visit to your family doctor
because of breathing problems?
1
0
Times N/A
24a. If yes, how many times in the last 12 months?
Yes No
25. Have you ever visited a hospital casualty department or emergency room
because of breathing problems?
1
0
Times N/A
25a. If yes, how many times in the last 12 months?
Yes No
26. Have you ever spent a night in hospital because of breathing problems? 1
0
Times N/A
26a. If yes, how many times in the last 12 months?
Yes No
27. Have you ever been admitted to a hospital intensive care unit because of
breathing problems?
1
0
Times N/A
27a. If yes, how many times in the last 12 months?

Version 2.8 18th
April 2011 Page 8 of 9
I. Gastroesophageal reflux
Yes
No
28. Do you have heartburn, waterbrash, or indigestion?
28a. If yes, do you take any pills, capsules, tablets or medicines to help with
this?
1
0
If NO go to question 30; if YES, proceed with this section:
28a. Which of the following best represents your symptoms:
Occasional heartburn / reflux 1
Heartburn / reflux requiring antacids or medical advice
(but not interfering with activities)
2
Heartburn / reflux constantly interfering with activities 3
Yes No
29. Do you take any pills, capsules, tablets or medicines to help with this? 1
0
If YES, which of the following have you used in the last 12 months?
Yes If yes, which one? No N/A
29a. Proton pump inhibitors 1 0
29b. Histamine receptor antagonists 1 0
29c. Other antacid 1 0
Yes No
30. Is your breathing worse lying down? 1
0
Yes No
31. Is your breathing worse after stooping? 1
0
Yes No
32. Is your breathing worse after eating? 1
0
J. Co-morbidities
33. Has a doctor ever told you that you had one of the following diseases?
Yes No Don’t Know
33A. Heart trouble? 1 0
If NO to 33A, SKIP to 33B.
If YES to 33A, ANSWER the following:
Yes No Don’t Know
33A.1 Have you ever had treatment for heart trouble in the past 10
years?
1 0
Yes No Don’t Know
33B. High Blood Pressure (hypertension)? 1 0
If NO to 33B, SKIP to 33C.
If YES to 33B, ANSWER the following:
Yes No Don’t Know
33B.1 Have you had any treatment for high blood pressure
(hypertension) in the past 10 years? 1 0

Version 2.8 18th
April 2011 Page 9 of 9
33continued. Has a doctor ever told you that you had one of the following diseases?
Yes No Don’t Know
33C. Angina? 1 0
33D. Heart attack/Myocardial Infarction? 1 0
33E. Stroke? 1 0
33F. Heart Failure? 1 0
33G. Arrhythmia? 1 0
33H. Osteoporosis or ’thin’ bones? 1 0
33I. Osteoarthritis? 1 0
33J. Rheumatoid Arthritis? 1 0
33K. Inflammatory Bowel Disorders (i.e., Crohn’s Disease, Colitis)? 1 0
33L. Diabetes? 1 0
If NO to 33L, SKIP to 33M.
If YES to 33L ANSWER the following:
Yes No Don’t Know
33L.1 Is your disease called "Type 1" or "early onset" diabetes? 1 0
33L.2 Is your disease called "Type 2" or "late onset" diabetes? 1 0
Yes No Don’t Know
33M. Peptic Ulcer? Angina? 1 0
33N. Gastroesophageal Reflux/Heartburn? 1 0
33O. Depression that needs treatment? 1 0
33P. Anxiety or Panic Attacks? 1 0

NZRHS Coding and Instructions for the Respiratory Questionnaire V1.3 Page 1 of 5
Coding and Instructions for the Respiratory Questionnaire
Introduction
The use of a questionnaire to collect information makes it possible to obtain answers to
important questions in a standardised way. The reliability of the questionnaire depends on the
behaviour of the interviewer, and therefore it is important that the questions are read exactly
as they are printed and that no non-verbal clues are given.
The respiratory questionnaire contains many questions which have been taken from the
European Community Respiratory Health Survey II main questionnaire. The appropriate
explanatory notes below have therefore been taken from the instructions which accompany
that survey. Original documents can be found at http://www.ecrhs.org/ .
Instructions for administering the questionnaire
Basic rules
1. Interviews should take place where there is minimal disturbance, where both interviewer
and subject can be comfortable, and where eye contact and hence the attention of the subject
is maintained.
2. The interview is started when the interviewer has the subject’s full attention, with the
introductory sentence used in the questionnaire.
3. Occasionally, the interview may be complicated by one of the following difficulties:
a) The subject will not understand the question.
b) The subject or interviewer will find an ambiguity in the question.
c) The subject’s answer may be inappropriate to the question.
4. It is very important that all interviewers in all the centres follow the same procedure for
solving problems, so that it is possible to compare the answers given in one centre with the
answers given in another.
5. The following general rules should be obeyed when there is a problem:
a) The question is repeated exactly as written, emphasising the wording
where there is ambiguity,
b) The subject is reminded that he/she should try to answer ‘YES’ or
‘NO’ to each of the questions.
c) If an answer of ‘YES’ or ‘NO’ is required and the subject does not
understand the question even when repeated, the answer is coded as
‘NO’, (unless a ‘DON’T KNOW’ option is specifically provided).
d) Where an answer is required to a quantitative or semi-quantitative
question, the subject’s ‘best guess’ may be accepted.
e) A tablespoon holds 15 millilitres (ml). It is acceptable to have a container as a
prompt with a line marking the 15ml line. The interviewer may select the appropriate
answer based on the subjects response.
If, during the interview, a subject requests further information or clarification of a question
that is not possible according to the questionnaire rules, the interviewer should explain to the
subject that these points can be discussed at the end of the questionnaire.

NZRHS Coding and Instructions for the Respiratory Questionnaire V1.3 Page 2 of 5
Training
Before starting the survey, the questionnaire and instructions should be studied
and any difficulties discussed. Trainee interviewers must become familiar with
the flow of questions.
Recording the replies to the questions
Most of the questions are of the ‘YES’ or ‘NO’ types. If the subject is uncertain of the answer
it is recorded as ‘NO’. If the answer to the question is a number, this should be recorded
directly in the boxes provided. Where the answer is a date, this should be written out in full.
The interviewer should follow instructions given in the questionnaire regarding which
questions to ask according to the subject’s response. In cases when further questions are
irrelevant (and this can follow a ‘YES’ or a ‘NO’ answer) a ‘skip’ (‘GO TO’) will direct
interviewers to the next question. Occasionally, there are ‘skips’ within sub-divisions of
questions. For questions where there is a choice of answers there are two formats. If there is
only one possible or likely answer the format is ‘TICK ONE BOX ONLY’. If the subject
cannot decide between two options, then the choice which applies most of the time and most
recently should be recorded. The second format is a ‘YES’ or ‘NO’ box to each of a number
of possibilities or choices in cases where they could all apply. Some of these questions have
as a final option ‘OTHER’. If the subject chooses this option and, therefore, gives an unusual
or unexpected answer, the box next to this option is ticked and the answer written in
freehand. If the subject is asked to list items and there is insufficient space, the most often
used or the item the subject considered most important should be recorded.
Additional clarification of questions
Question 4 A cough with their first smoke or on going out of doors is included. Clearing the throat or a
single cough is excluded. The word ‘usually’ should be emphasised. An
occasional cough may be considered as normal and the answer should be recorded as ‘NO’.
As a rough guide single coughs at a frequency of less than six a day are ‘occasional’. ‘Three
months’ refers to three consecutive months, and ‘each year’ to the last two years.
Questions 5-5a
When night shift workers are interviewed the words ‘on getting up’ should be used instead of
‘first thing in the morning’. As with cough, phlegm with the first smoke or on going out of
doors is included, but not mucoid discharge from the nose. Contrary to cough, however,
‘occasional’ phlegm production from the chest is considered abnormal if it occurs twice or
more per day. The interviewer may use any suitable word that accords with local usage
provided that it distinguishes phlegm from the chest or throat from pure nasal discharge.
Some subjects admit to bringing up phlegm without admitting to coughing. This should be
accepted without changing the replies to the questions about cough. A claim that phlegm is
coughed from the chest but swallowed counts as a positive reply. ‘Three months’ refers to
three consecutive months, and ‘each year’ to the last two years.
Question 6
The phrase ‘trouble with your breathing’ should not be elaborated upon. If the
subjects feel that there is something wrong with their breathing, whatever the reason, the
answer is recorded as ‘YES’.
Questions 7 – 7b These questions are intended to identify persons who have occasional and/or frequent
wheezing. Subjects may confuse wheezing with snoring or bubbling sounds in the chest.

NZRHS Coding and Instructions for the Respiratory Questionnaire V1.3 Page 3 of 5
‘Wheeze’ can be described as ‘A whistling sound, whether high or low pitched and however
faint’. If the question is not understood, a vocal demonstration of wheezing by the interviewer
can be helpful. No distinction is made between those who only wheeze during the day and
those who only wheeze at night.
Questions 7c-d
If the subject does not remember their age at time of their first of most recent attack of
asthma, the interviewer should ask an estimate of the age. This is more likely with the first,
rather than the most recent, but an estimate may also be given for most ‘recent attack’.
Question 12
Further explanation of the definition of ‘asthma’ should not be given. If the term is not
understood, the answer should be recorded as ‘NO’.
Question 13a If the term eczema is not understood the answer should be recorded as ‘NO’.
Questions 15 & 16
['YES' means at least 20 packs of cigarettes or 12 oz (360 grams) of tobacco
in a lifetime, or at least one cigarette per day or one cigar a week for one year]
If the subject is in doubt about their smoking status the interviewer should read the definition
of ‘smoking’ above. If the subject answers ‘YES’ but does not remember when they started
smoking, the interviewer should ask for an approximate age. The question on ‘present’
smoking statues relates to the last month. For example, if the subject smoked their last
cigarette two weeks ago the answer is ‘YES’. If the subject’s smoking habits have changed,
they will be asked how old they were when they cut down or stopped smoking. The tendency
will be to remember ‘how long ago’ rather than ‘at what age’, so the interviewer will need to
work out with the subject the age at cutting down. The subject will then be asked how much
he/she smoked on average the entire time that he/she smoked before cutting down. The
questions are designed so that a consistent smoker answers only about what he/she smokes
now and ex-smoker answers about what he/she now smokes and what he/she smoked before.
‘Home’ or ‘self-rolled’ cigarettes are included in ‘number of cigarettes’ smoked. If the subject
has smoked cigars or pipe tobacco the interviewer should convert this to pack years. The
following conversions may be used1 2
:
One pack year is equivalent to 20 cigarettes smoked per day for 1 year.
1 cigar is considered equivalent to 4 cigarettes
1 cigarillo is considered equivalent to 2 cigarettes. Cigarillos are a small, thin type of
cigar.
12.5 grams (0.5oz) of loose tobacco is approximately equivalent to 20 cigarettes.
One Pipe is equivalent to two and a half cigarettes.
Pack years = ounces per week x 2/7 x number of years smoked
Question 17 Response is recorded in years. When subjects give an answer in years and months, only the
number of years should be recorded and should be rounded down. A full-time student is
defined as one currently attending an educational establishment and not having full-time
employment. If the subject is a student, but works part-time this counts as full-time education.
If a full time student enter 888.
Question 17b Refers to current or most recent job. This question is trying to capture whether the subject has
staff members working for them. A supervisor or foreman typically refers to a senior

NZRHS Coding and Instructions for the Respiratory Questionnaire V1.3 Page 4 of 5
employee in a factory or manual labour environment who has responsibility for other
employees. A manager typically refers to an office based employee who has junior staff at the
office reporting to them. Subjects should select the option that most closely represents their
situation.
Questions 19 & 20 These questions refer to heating and cooking fuels and give some idea of
indoor air pollution. Information on the type of heating will provide information on
temperature differentials and humidity changes throughout the house, which can occur when
there is no central heating. ‘Open fires’ as a form of heating refers to a ‘fireplace’ a ‘stove’ or
a ‘woodstove’ used for heating or hot water in a room which is inhabited rather than in an
unused basement, whether or not it is part of a ducted heating system. Biomass fuels such as
animal dung used for heating would be included under question 19a “open coal, coke or wood
fire”. For cooking biomass fuels would come under option 20a.
If the subject has additional forms of heating (for example, electric storage heaters) and they
have been used at least once in the last 12 months, the answer is recorded as ‘YES’. If other
heaters are present but have never been used in the previous 12 months, the answer to the
question is ‘NO’.
Questions 21 & 22 The subject should be asked to bring along any medication that he/she is
currently taking. The question refers to the last 12 months so it is possible that the subject no
longer has the medicine or that it is not in its original container, so therefore, the interviewer
can show the subject photographs of inhalers/medicines at the time of questioning. Of two or
more inhalers or medicines from the same group are simultaneously used, the one that is most
often or most recently used should be recorded. Menthol rubs and similar ‘inhaled’ medicine
are not counted as inhalers.
Question 24 & 25
In China few subjects will have a family doctor. Attendance at the Day Clinic in the hospital
should be recorded as a yes to question 24. Attendance in the emergency department in the
hospital should be recorded as a yes to question 25. These questions are designed to capture
information about the need for unplanned medical care. No distinction will be drawn between
Day clinic and the emergency department in terms of likely severity.
Question 26
If the subject was kept in overnight for observation either in the emergency department or in
hospital this counts as an admission. If the subject waited many hours to be seen but was
allowed home once assessed this would not count as an admission.
Question 27
If the subject was ventilated on a general ward or received non-invasive ventilation the
answer should be recorded as yes.
Instructions for coding the questionnaire
Standard coding
For all questions;
0 NO
1 YES
555 NOT ANSWERED

NZRHS Coding and Instructions for the Respiratory Questionnaire V1.3 Page 5 of 5
999 DON’T KNOW This option should rarely be used. If the subject is not sure if the
answer to a question is ‘Yes’ or ‘No’ it should be coded as ‘No’.
However, don’t know may be appropriate in some circumstances- e.g.
If a subject knew they were taking an inhaled steroid but did not know
which one, the answer to Question 21f would be ‘Yes’ and under ‘If
yes which one’ the interviewer should enter ‘999’. Don’t know is also
considered appropriate for co-morbidity questions- Q33.
Question specific coding
Question 2 Maori 1, NZ European 2, Samoan 3, Cook Island Maori 4, Tongan 5, Niuean 6, Chinese 7,
Indian 8, Other 9. Additional codes will need to be generated for the Chinese arm of the study
Question 7c First attack of asthma
000 First attack of asthma as early as they can remember
999 Don’t know
Question 17a
888 Currently a full-time student
References
1. Wood DM, Mould MG, Ong SBY, Baker EH. Pack year smoking histories: what about patients who
use loose tobacco? Tobacco Control 2005;14(2):141-142. 2. Nigel Masters CT. Smoking pack years calculator, 2007; http://smokingpackyears.com.

DS TA N D A R D O P E R AT I N G P R O C E D U R E S F O R L U N G
F U N C T I O N T E S T I N G
277


MasterScreen Body SOP for MRINZ
Last updated 6 Sept 2011 Page 1 of 8
MasterScreen Body Plethysmography – MRINZ SOP Software update CD 4.66.0.6
Author – Mathew Williams
Testing Procedures
1. Subject Data (called Patient Data (V5.04b) in Jaegar LabManager V4.65g).
1.1. If this is the first visit for the study then all of the following data will have to be entered:
- Last Name
- First Name - Identification Study identifier code - subject number, for example SCO104960-S002001
- Date of Birth Day/Month/Year
- Sex Male or Female
- Standing Height The median of 3 measurements is to be recorded to the nearest 0.5
centimetres.
- Weight To be recorded to the nearest 0.5 kilograms
- Pred. Module (predicted normal value) – this should be the ECCS1 unless otherwise stated by
the Sponsor.
- Operator Initials of the technician or doctor conducting the plethysmography measurements.
- Visit (Visit number of the study) 2
- Study (The study identifier code, for example SCO104960)3
1.2. If the subject is here for a subsequent visit within the same study then load the patient details that
have been saved previously, AND
- Update only the subject’s weight and visit number, and the operator if different.
2. Ambient Calibration should be updated (V4.65.0.1) in Jaeger LabManager V4.65g) immediately
prior to opening the Body Plethysmography programme (V4.66.7.0)4.
2.1. Two independent ambient sensors should be present to verify the integrity of the Jaeger sensor.
2.2. Readings from the Jaeger sensor which interfaces with the computer should be used to update
ambient conditions within the ambient calibration.5
1 By default this is called Standard in Jaegar LabManager V4.65g, Patient Data V5.04b.
2 By default this field is called Ward rather than Visit in Jaegar LabManager V4.65g, Patient Data V5.04b.
3 By default this field is called Physician rather than Study in Jaegar LabManager V4.65g, Patient Data V5.04b.
4 If not, a comment should be made in the subjects report.
5 The units should vary no more than 1°C, 10hPa, and 10%rel.Hum, otherwise refer to Calibration SOP for MRINZ – Bowen.

MasterScreen Body SOP for MRINZ
Last updated 6 Sept 2011 Page 2 of 8
3. Immediately following the opening of the Body Plethysmography programme (V4.66.7.0) the correct
settings should be loaded. The settings should be set to MRINZsop6, unless otherwise stated by the
sponsor (these settings will then be named after the study identifier code – for example ABC104960).
4. Body Plethysmography testing should begin as soon as the temperature in the body box has stabilised
due to the subjects exhaled breath and body temperature increasing the internal box temperature.7
4.1. Should the subject become uncomfortable and require the body box be opened before
reproducibility has been met the internal box temperature must re-stabilise before testing is re-
commenced.
5. Resistance and conductance measurements should be carried out before lung volume and spirometry
measurements8.
5.1. After establishing tidal breathing the subject should be encouraged to increase their frequency of
breathing to 1.5 breaths per second9 and correspondingly reduce tidal volume
10, keeping even
breaths at this frequency the shutter is then closed while the subject keeps breathing through the
closure.
5.2. Body Plethysmography V4.66.7.0 (in LabManager V4.65g) calculates Resistance and
Conductance is recorded as the breaths immediately prior to the shutter closure11
.
5.3. Between 3 and 8 measurements should be carried out, stopping once the reproducibility criteria
have been met. Each measurement should be inspected for acceptability. The subject should
rest off the mouthpiece between measurements. Each measurement is saved in a separate file,
Using F1 to capture resistance loops, F2 to close shutter for TGV then F7 to display results.
Removing loops with a breathing frequency less than 90 or greater than150. F9 to save test then
F1 to start next measurement.
5.4. The test is complete when 3 acceptable attempts meeting reproducibility have been recorded.
Reproducibility criteria is
- 3 Resistance measurements are within 10% of their mean, AND
- 3 Conductance measurements are within 10% of their mean12
.
5.5. If reporting single values13
then the mean of the three reproducible values is reported and printed
by RepOutput 5.00b (in LabManager V4.65g). The loading of the files to be reported should be
done in Patient Data V5.04b14
6 These setting are defined in Appendix A – MRINZsop settings for Whole Body Plethysmography.
7 The major determinant of stability in the Bodybox is temperature change due to body heat, which effects both humidity and
pressure. 8 If not, a comment should be made in the subjects report.
9 While resistance is best measured at 1.5-2.5 breaths per second (AARC Guideline: Body Plethysmography) the ITGV is best
measured at 1 breath per second (AARC Guideline: Static Lung Volumes), so we aim for the lower end of breath frequency. 10
If the required frequency is not achieved within 15sec on starting the end of tidal breathing then the subject should be rested,
returned to tidal breathing, and another attempt made prior to measurement. 11
This programme calculates arithmetic mean value of tests selected. 12
AARC Guideline: Body Plethysmography: 2001 Revision and Update (from Respiratory Care Journal 2001: 46(5) pp506-
513). 13
If more than one value is reported then all 3 reproducible values are reported.

MasterScreen Body SOP for MRINZ
Last updated 6 Sept 2011 Page 3 of 8
5.6. The door to the Body box can be opened for patient comfort (section 4) prior to further testing.
6. Lung volumes should be measured after the resistance and conductance measurements and before
beginning spirometry measurements15
.
6.1. The subject is to establish normal tidal breathing16
prior to TGV measurement, is then informed
of the shutter closure and encouraged to keep breathing through it, and then asked to exhale fully
to RV, inhale fully to TLC then relax back to FRC17
. F7 to save measurement.
6.2. Between 3 and 8 measurements should be carried out, stopping when reproducibility criteria have
been met. These must all be completed in the same file18
. The subject should rest off the
mouthpiece between measurements.
6.3. The test is complete when 3 acceptable attempts meeting reproducibility have been recorded.
Reproducibility criteria is
- 3 ITGVs are within 5% of their mean, AND
- the 2 largest ICs (from the same manoeuvres) are within the larger of 5% or 60ml19
- The 2 largest VCs are within the smaller of 5% or 150ml20
6.4. All manoeuvres which do not fit into the acceptability criteria must be deselected in Body
Plethysmography V4.66.7.0 so that they do not affect the values calculated and reported. Values
calculated and reported are as follows21
:
- ITGV, IC, and VCIn are measured directly
- TLC is calculated as mean ITGV and mean IC
- ERV is calculated as maximum VCIn minus mean IC
- RV is calculated as mean ITGV minus ERV
6.5. If reporting single values22
then the mean ITGV, and maximum VC of the three reproducible
values, mean IC two largest repeatable vales. The TLC, ERV, and RV as calculated.
6.6. The door to the Body box will usually be opened for patient comfort (section 4) prior to further
testing.
7. Spirometry measurements should be carried out after resistance and conductance, and lung volume
measurements23
. These measurements should be carried out with the Body box door open.
14
RepOutput 5.00b (in LabManager V4.65g) will report subjects current age rather than the age at testing if the files are loaded
from within RepOutput rather than Patient Data). 15
If not, a comment should be made in the subjects report. 16
In Body Plethysmography V4.66.7.0 use F2 rather than F1 (to avoid resistance/conductance measurement), to start
measurement, F2 to close shutter, and F7 to add measurement to the file. F9 will save the file once reproducibility is met. 17
The time limit post shutter to complete IC has been increased form 20 seconds to 45 seconds (See Appendix B). 18
RepOutput 5.00b (in LabManager V4.65g) cannot report TLC as Mean ITGV and Mean IC unless it received those values
directly from Body Plethysmography V4.66.7.0, which cannot be done if manoeuvres are carried out in different files. 19
ICs under 1.2L should be within 60mls of each other, others can vary more (e.g. 5% of 3L = 150mls) 20
VCs over 4L should be within 150mls of each other, others must vary less (e.g. 5% of 2L = 100mls) 21
These setting are defined in Appendix A – MRINZsop settings for Whole Body Plethysmography. 22
If more than one value is reported then all 3 reproducible values are reported. 23
If not, a comment should be made in the subjects report.

MasterScreen Body SOP for MRINZ
Last updated 6 Sept 2011 Page 4 of 8
7.1. After two tidal breaths the subject is instructed to breathe in slowly to reach TLC, then
immediately exhale quickly to RV. Subjects are encouraged to continue to breathing out until
empty or until they can no longer keep blowing. If the operator can see time volume graph shows
no airflow for 2 seconds the operator will instruct the subject to inhale, or if the subject has
exhaled for greater than 15 seconds the subject is then instructed to breath in when they can no
longer keep blowing.24
7.2. Between 3 and 8 measurements should be carried out, stopping when 3 acceptable and
reproducible tests are achieved. These should all be completed in the same file25
. The subject
should rest off the mouthpiece thoroughly between measurements (the time is dependant on
subjects ability to recover form the manoeuvre).
7.3. Reproducibility is achieved when:
- the 3 selected manoeuvres meet ATS acceptability criteria26
, AND
- the 2 largest FEV1 measurements are within 150mls of each other, AND
- the 2 largest FVC measurements are within 150mls of each other 27
(NOTE: The operator makes the final judgement based on subject observation, graphical data,
and experience as to the acceptability of a manoeuvre.)
7.4. All manoeuvres which do not fit into the acceptability criteria must be deselected in Body
Plethysmography V4.66.7.0 so that they do not affect the values calculated and reported. Values
calculated and reported are as follows28
:
- Maximum FEV1 measured - FEV6 and mid expiratory flows are measured from the best single manoeuvre (the
manoeuvre with the highest Sum of FEV1 and FVC).
- Maximum FVC measured
- FEV1/FVC ratio calculated by Maximum FEV1/Maxmum FVC of all three measuremets.
7.5. If reporting single values29
then the FEV1, FEV6, FVC, and FEV1/FVC Ratio as measured is
reported and printed. This is done in RepOutput 5.00b (in LabManager V4.65g). The loading of
the files to be reported should be done in Patient Data V5.04b
24
Pressing F3 will begin capturing Spirometry data and F7 will save captured data to file (allowing the use of F3 to capture
subsequent data). F9 will save the file once reproducibility is met. 25
Body Plethysmography V4.66.7.0, can assess ATS reproducibility criteria for Spirometry manoeuvres saved within the same
file. 26
Reproducibility is achieved by meeting ATS criteria alone but testing will continue and manoeuvres will be selected to meet. 27
Standardisation of Spirometry – ATS/ERS task force standardisation of spirometry. Eur Respir J 2005; 26: 319-338 28
These setting are defined in Appendix A – MRINZsop settings for Whole Body Plethysmography. 29
If more than one value is reported then all 3 reproducible values are reported.

MasterScreen Body SOP for MRINZ
Last updated 6 Sept 2011 Page 5 of 8
Appendixes
A. MRINZsop settings for Whole Body Plethysmography
Body Plethysmography V4.66.7.0 (in LabManager V4.65g) screen dumps for various setting are
as follows:
i. Settings →Modify→Axis scaling…Settings →Modify→Resistance/ITGV…
Note that parameter list (right) will vary dependent on values required by the study.
Note also that “Display tangent for…” parameter does not change the values recorded – it is
only used by the operator to assess the quality of the measurements – this parameter is
changed to match the values required by the study.
ii.

MasterScreen Body SOP for MRINZ
Last updated 6 Sept 2011 Page 6 of 8
Settings →Modify→Spiro./F-V…
Note that parameter list (right) will vary dependent on values required by the study.
iii. Settings →Modify→Save as…
Note that parameter list (right) will vary dependent on values required by the study.

MasterScreen Body SOP for MRINZ
Last updated 6 Sept 2011 Page 7 of 8
Settings →Modify→Parameter list…
Actual parameter list will vary dependent on the values required by the study but
- All resistance and conductance, and lung volume parameters (for example, the first
two sections of the parameter list on right of previous pictures).will be
calculated/measured with values in the bodyplethysmography rather than
spirometry formulas.
- All spirometry or forced volumes will be calculated/measured with values in the
spirometry rather than bodyplethysmography formulas.

MasterScreen Body SOP for MRINZ
Last updated 6 Sept 2011 Page 8 of 8
B. Changing the default ‘time-out’ for a SVC manoeuvre following an ITGV measurement
i. You must edit the “JAEGER.INI” file which is found in the windows directory (in our case
“C:\WINDOWS”)
ii. On opening the file scroll through the parameters until you find the line “[BODY]” under
which you will find the line “ERV_TIME=20”
iii. Change “ERV_TIME=20” to ERV_TIME=45”
iv. Save the changes to the file and then restart LabManager and Body Plethysmography.