james quincey cagny - coca-cola · james quincey president and chief ... the coca-cola company...
TRANSCRIPT
CAGNYFeb 23, 2017 Kathy Waller
EVP and Chief Financial Officer
James Quincey
President and Chief Operating Officer
The following presentation may include certain "non-GAAP financial measures" as defined in Regulation G under the Securities Exchange Act of 1934. A schedule is posted on the Company's website
at www.coca-colacompany.com (in the “Investors” section) which reconciles our results as reported under Generally Accepted Accounting Principles and the non-GAAP financial measures included in
the following presentation.
This presentation may contain statements, estimates or projections that constitute “forward-looking statements” as defined under U.S. federal securities laws. Generally, the words “believe,” “expect,” “intend,”
“estimate,” “anticipate,” “project,” “will” and similar expressions identify forward-looking statements, which generally are not historical in nature. Forward-looking statements are subject to certain risks and
uncertainties that could cause actual results to differ materially from The Coca-Cola Company’s historical experience and our present expectations or projections. These risks include, but are not limited to, obesity
concerns; water scarcity and poor quality; evolving consumer preferences; increased competition and capabilities in the marketplace; product safety and quality concerns; perceived negative health consequences
of certain ingredients, such as non-nutritive sweeteners and biotechnology-derived substances, and of other substances present in our beverage products or packaging materials; an inability to be successful in our
innovation activities; increased demand for food products and decreased agricultural productivity; changes in the retail landscape or the loss of key retail or foodservice customers; an inability to expand operations
in emerging and developing markets; fluctuations in foreign currency exchange rates; interest rate increases; an inability to maintain good relationships with our bottling partners; a deterioration in our bottling
partners' financial condition; increases in income tax rates, changes in income tax laws or unfavorable resolution of tax matters; increased or new indirect taxes in the United States or in one or more other major
markets; increased cost, disruption of supply or shortage of energy or fuels; increased cost, disruption of supply or shortage of ingredients, other raw materials or packaging materials; changes in laws and
regulations relating to beverage containers and packaging; significant additional labeling or warning requirements or limitations on the marketing or sale of our products; an inability to protect our information
systems against service interruption, misappropriation of data or breaches of security; unfavorable general economic conditions in the United States; unfavorable economic and political conditions in international
markets; litigation or legal proceedings; failure to adequately protect, or disputes relating to, trademarks, formulae and other intellectual property rights; adverse weather conditions; climate change; damage to our
brand image and corporate reputation from negative publicity, even if unwarranted, related to product safety or quality, human and workplace rights, obesity or other issues; changes in, or failure to comply with, the
laws and regulations applicable to our products or our business operations; changes in accounting standards; an inability to achieve our overall long-term growth objectives; deterioration of global credit market
conditions; default by or failure of one or more of our counterparty financial institutions; an inability to timely implement our previously announced actions to reinvigorate growth, or to realize the economic benefits
we anticipate from these actions; failure to realize a significant portion of the anticipated benefits of our strategic relationship with Monster Beverage Corporation; an inability to renew collective bargaining
agreements on satisfactory terms, or we or our bottling partners experience strikes, work stoppages or labor unrest; future impairment charges; multi-employer plan withdrawal liabilities in the future; an inability to
successfully integrate and manage our Company-owned or -controlled bottling operations; an inability to successfully manage our refranchising activities; an inability to successfully manage the possible negative
consequences of our productivity initiatives; an inability to attract or retain a highly skilled workforce; global or regional catastrophic events; and other risks discussed in our Company’s filings with the Securities and
Exchange Commission (SEC), including our Annual Report on Form 10-K for the year ended December 31, 2015, and our subsequently filed Quarterly Reports on Form 10-Q, which filings are available from the
SEC. You should not place undue reliance on forward-looking statements, which speak only as of the date they are made. The Coca-Cola Company undertakes no obligation to publicly update or revise any
forward-looking statements.
2
Reconciliation to U.S. GAAP Financial Information
Forward-Looking Statements
3
Topics for Discussion
Laying the Foundation
Looking Forward
Financial Performance
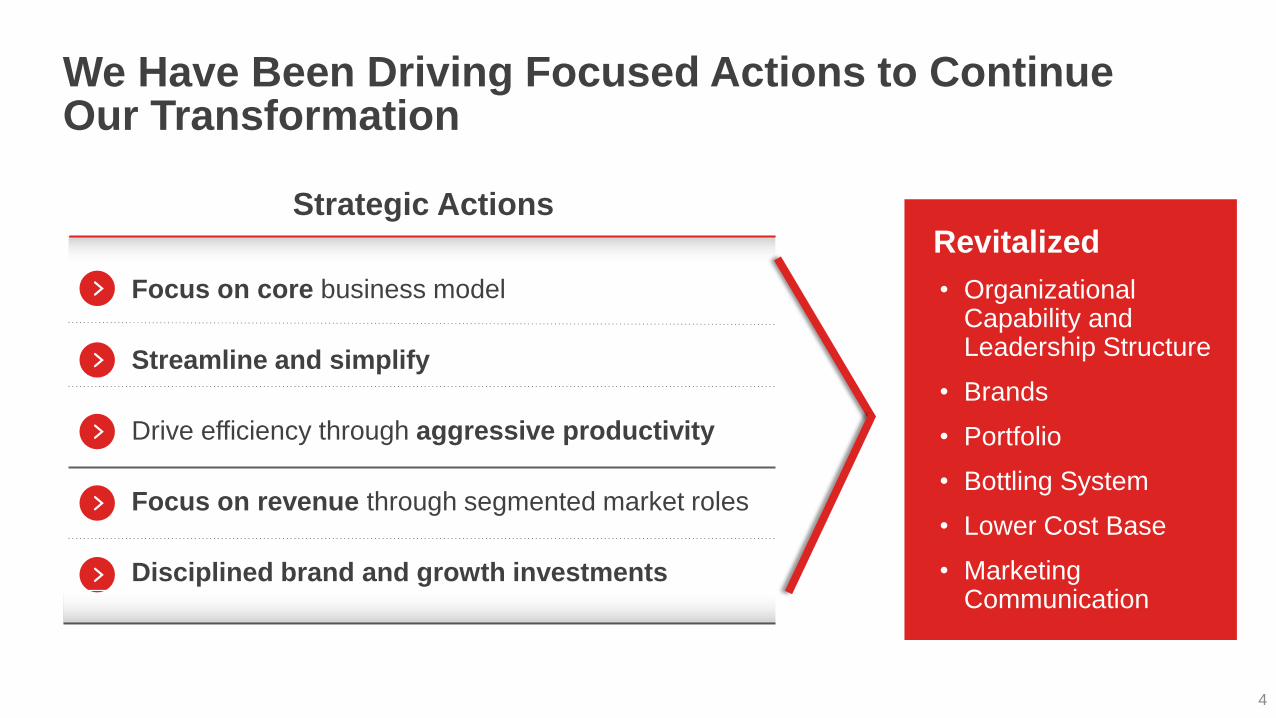
We Have Been Driving Focused Actions to Continue Our Transformation
4
Streamline and simplify
Drive efficiency through aggressive productivity
Focus on revenue through segmented market roles
Disciplined brand and growth investments
Focus on core business model
Revitalized
• Organizational Capability and Leadership Structure
• Brands
• Portfolio
• Bottling System
• Lower Cost Base
• Marketing Communication
Strategic Actions
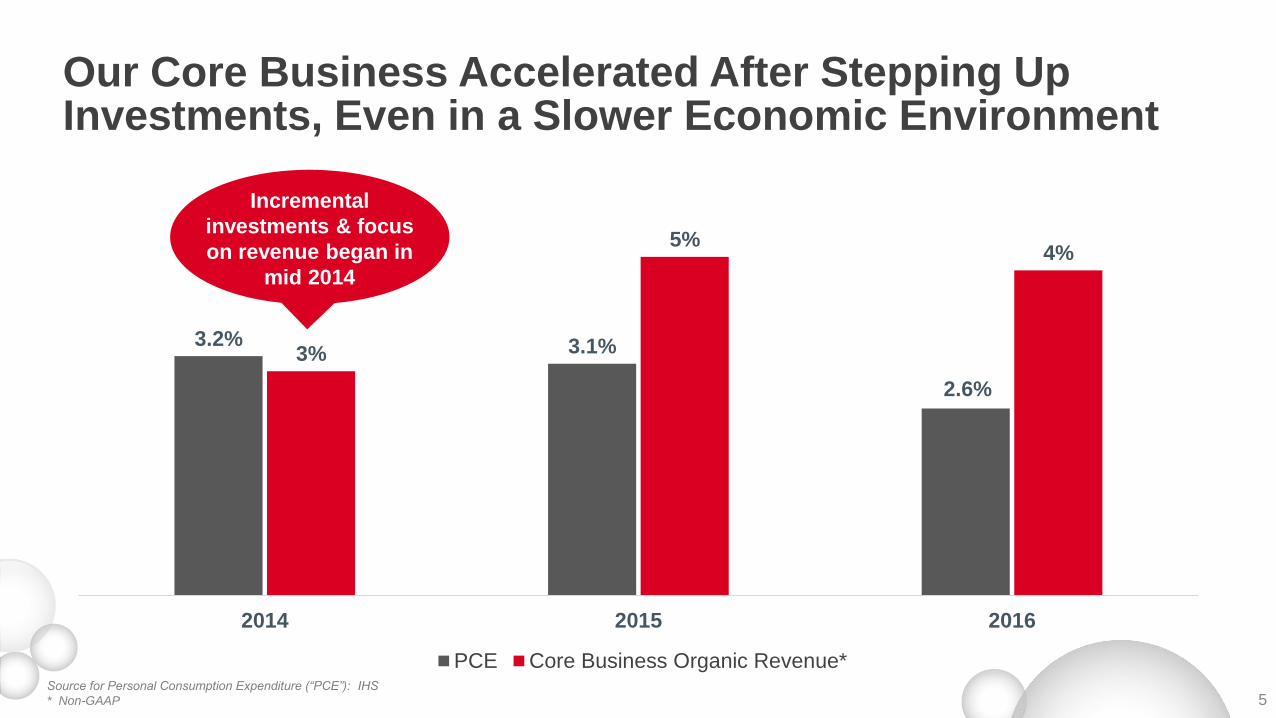
Our Core Business Accelerated After Stepping Up Investments, Even in a Slower Economic Environment
5
3.2% 3.1%
2.6%
3%
5%4%
2014 2015 2016
PCE Core Business Organic Revenue*
Incremental
investments & focus
on revenue began in
mid 2014
Source for Personal Consumption Expenditure (“PCE”): IHS
* Non-GAAP
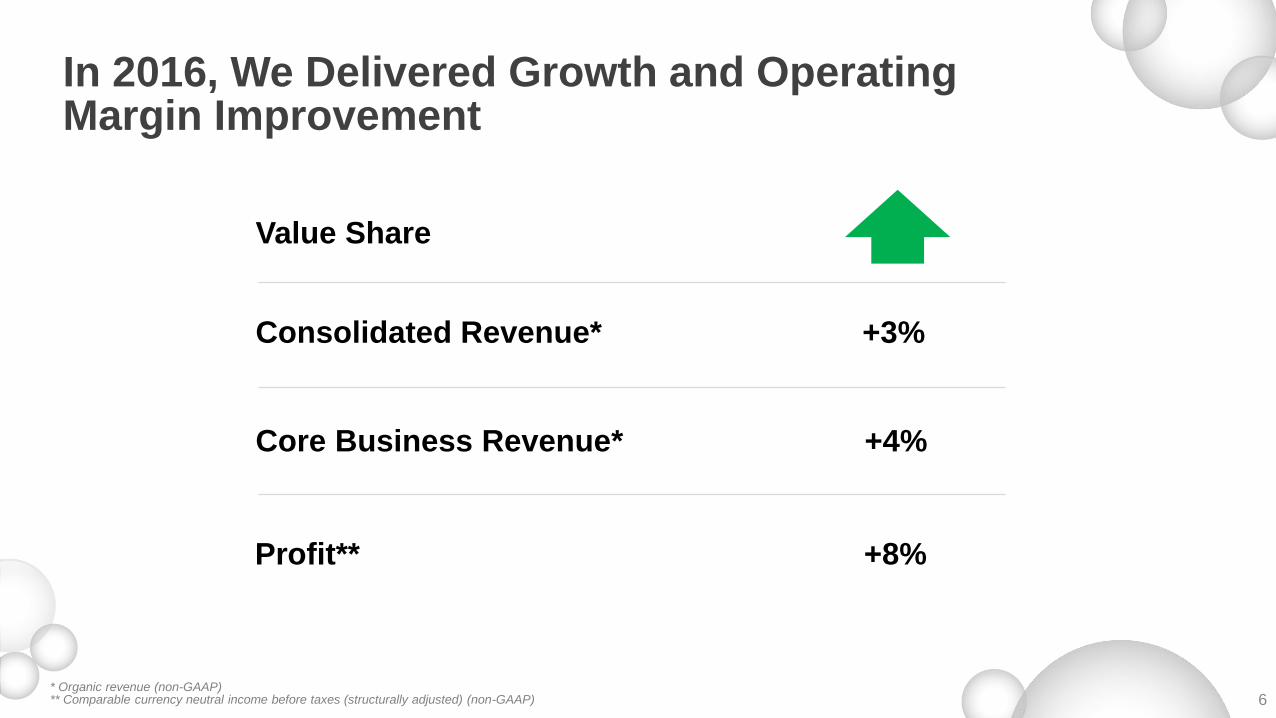
* Organic revenue (non-GAAP)** Comparable currency neutral income before taxes (structurally adjusted) (non-GAAP)
In 2016, We Delivered Growth and Operating Margin Improvement
6
Value Share
Core Business Revenue*
Consolidated Revenue* +3%
+4%
Profit** +8%
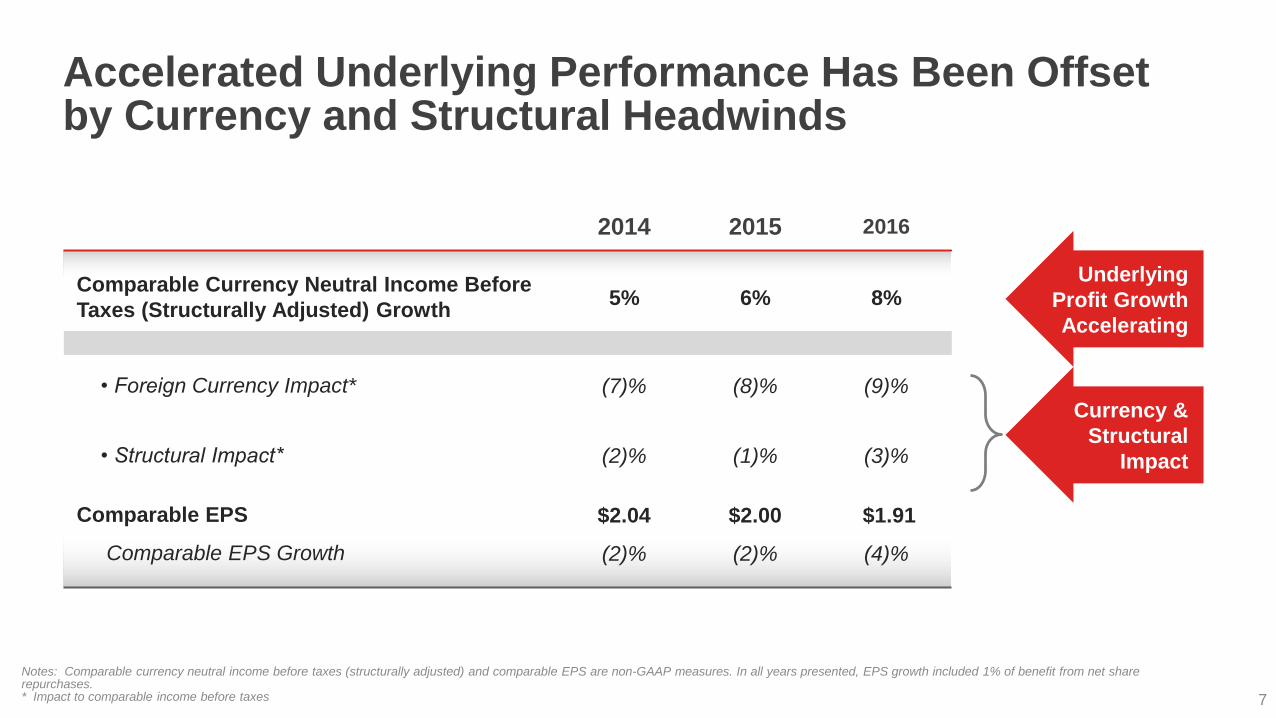
Accelerated Underlying Performance Has Been Offset by Currency and Structural Headwinds
7
2014 2015 2016
Comparable Currency Neutral Income Before
Taxes (Structurally Adjusted) Growth5% 6% 8%
• Foreign Currency Impact* (7)% (8)% (9)%
• Structural Impact* (2)% (1)% (3)%
Comparable EPS $2.04 $2.00 $1.91
Comparable EPS Growth (2)% (2)% (4)%
Underlying
Profit Growth
Accelerating
Notes: Comparable currency neutral income before taxes (structurally adjusted) and comparable EPS are non-GAAP measures. In all years presented, EPS growth included 1% of benefit from net share repurchases.* Impact to comparable income before taxes
Currency &
Structural
Impact
8
Topics for Discussion
Laying the Foundation
Looking Forward
Financial Performance
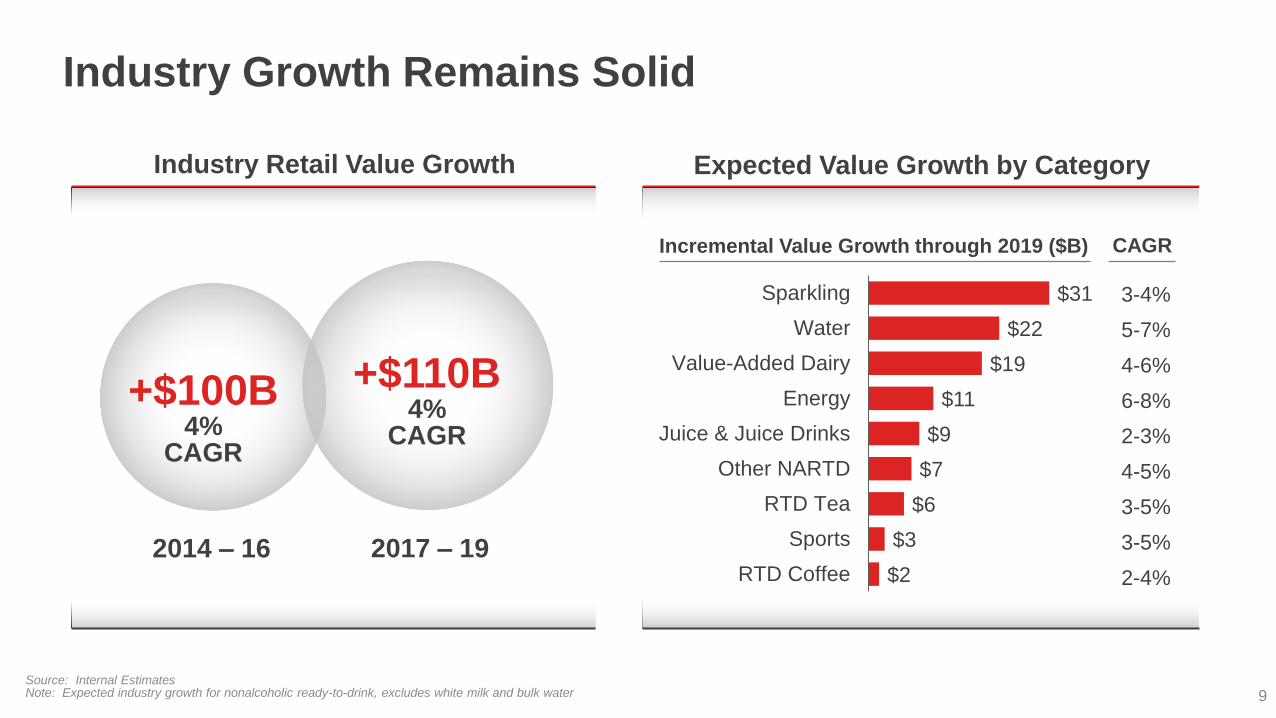
Industry Growth Remains Solid
9
Industry Retail Value Growth
+$100B4%
CAGR
+$110B4%
CAGR
Expected Value Growth by Category
+0.1
2014 – 16 2017 – 19
$31
$22
$19
$11
$9
$7
$6
$3
$2
Sparkling
Water
Value-Added Dairy
Energy
Juice & Juice Drinks
Other NARTD
RTD Tea
Sports
RTD Coffee
CAGRIncremental Value Growth through 2019 ($B)
3-4%
5-7%
4-6%
6-8%
2-3%
4-5%
3-5%
3-5%
2-4%
Source: Internal EstimatesNote: Expected industry growth for nonalcoholic ready-to-drink, excludes white milk and bulk water
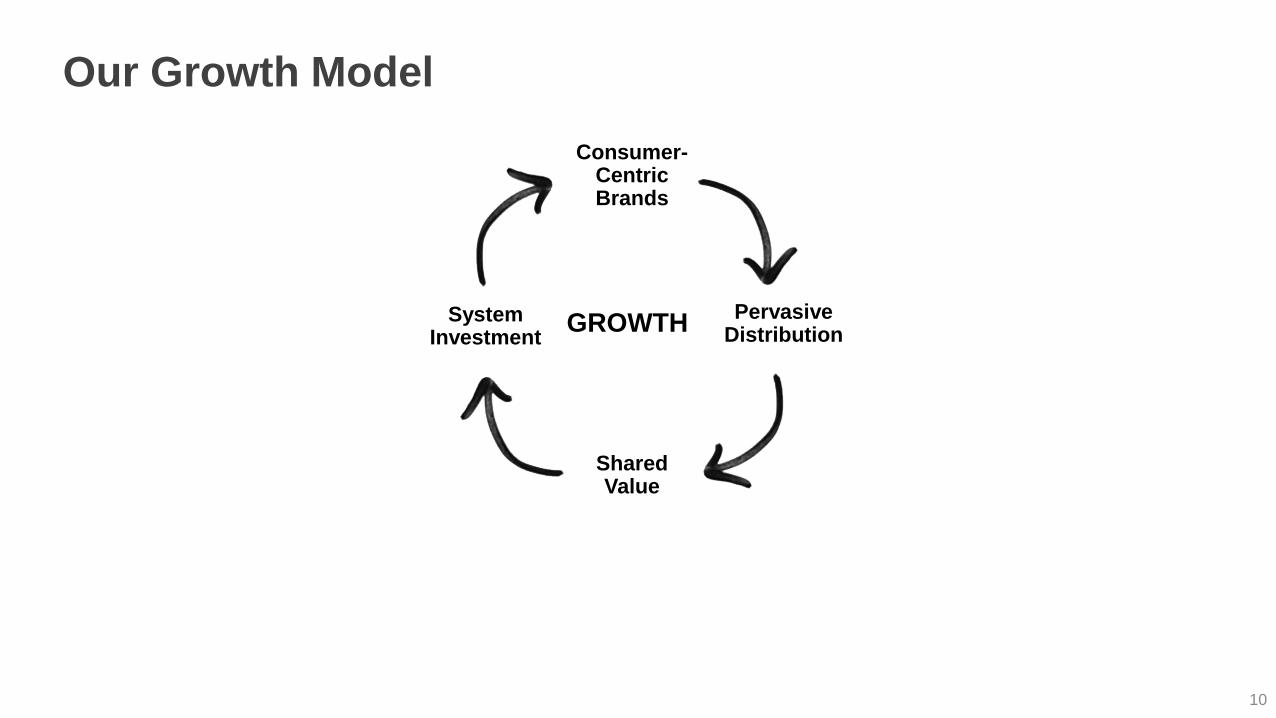
Our Growth Model
10
GROWTH
Shared Value
Pervasive Distribution
System Investment
Consumer-CentricBrands
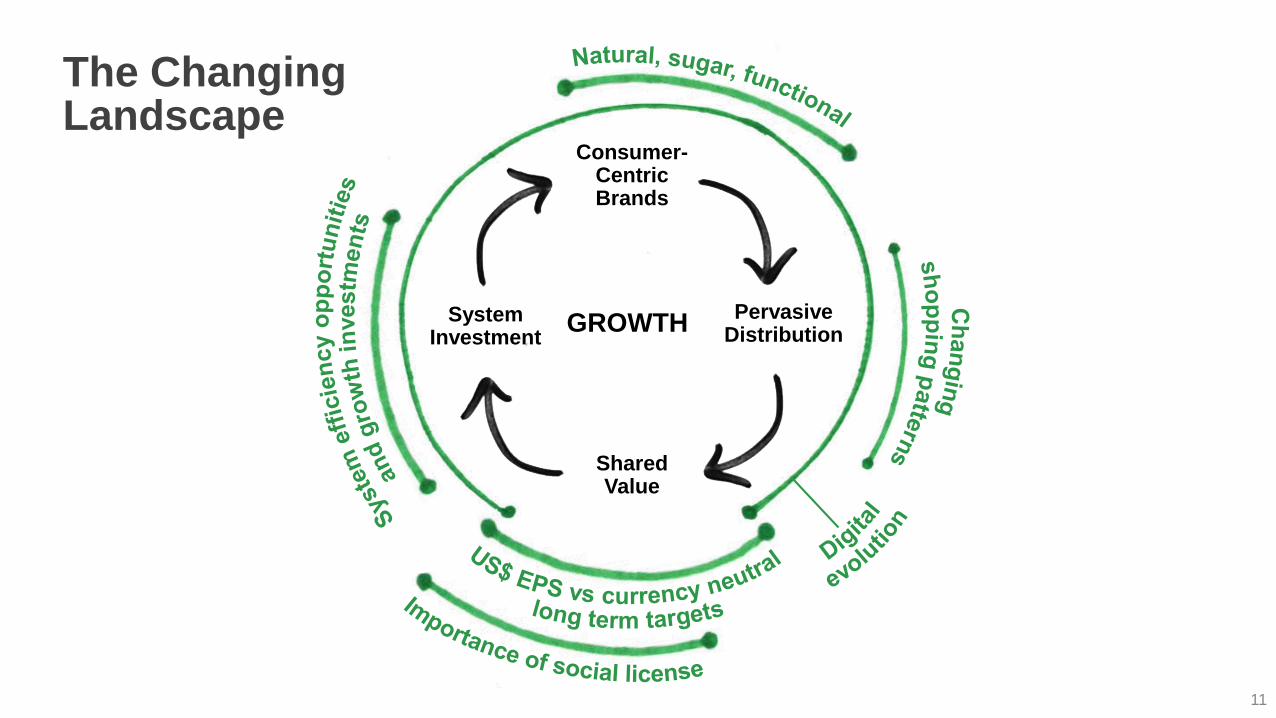
The Changing Landscape
11
Shared Value
Pervasive Distribution
System Investment
Consumer-CentricBrands
GROWTH
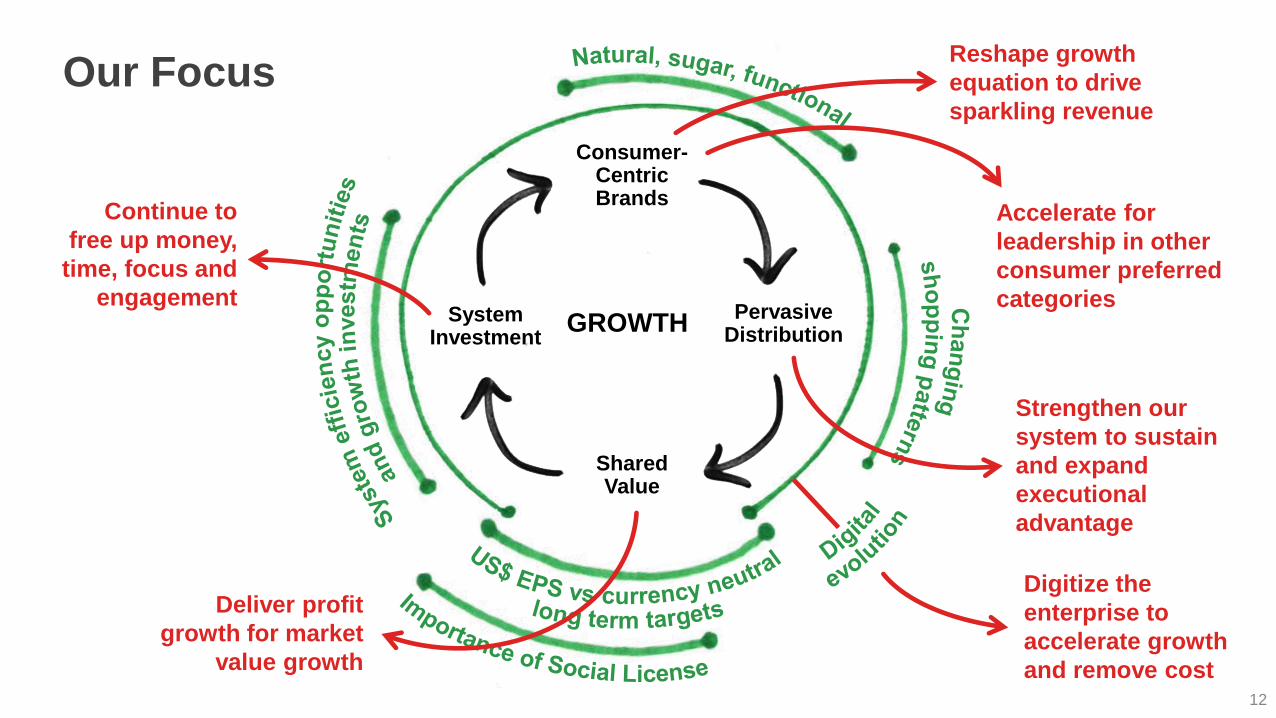
Our Focus
12
Shared Value
Pervasive Distribution
System Investment
Consumer-CentricBrands
Continue to
free up money,
time, focus and
engagement
Reshape growth
equation to drive
sparkling revenue
Deliver profit
growth for market
value growth
Strengthen our
system to sustain
and expand
executional
advantage
Digitize the
enterprise to
accelerate growth
and remove cost
Accelerate for
leadership in other
consumer preferred
categoriesGROWTH
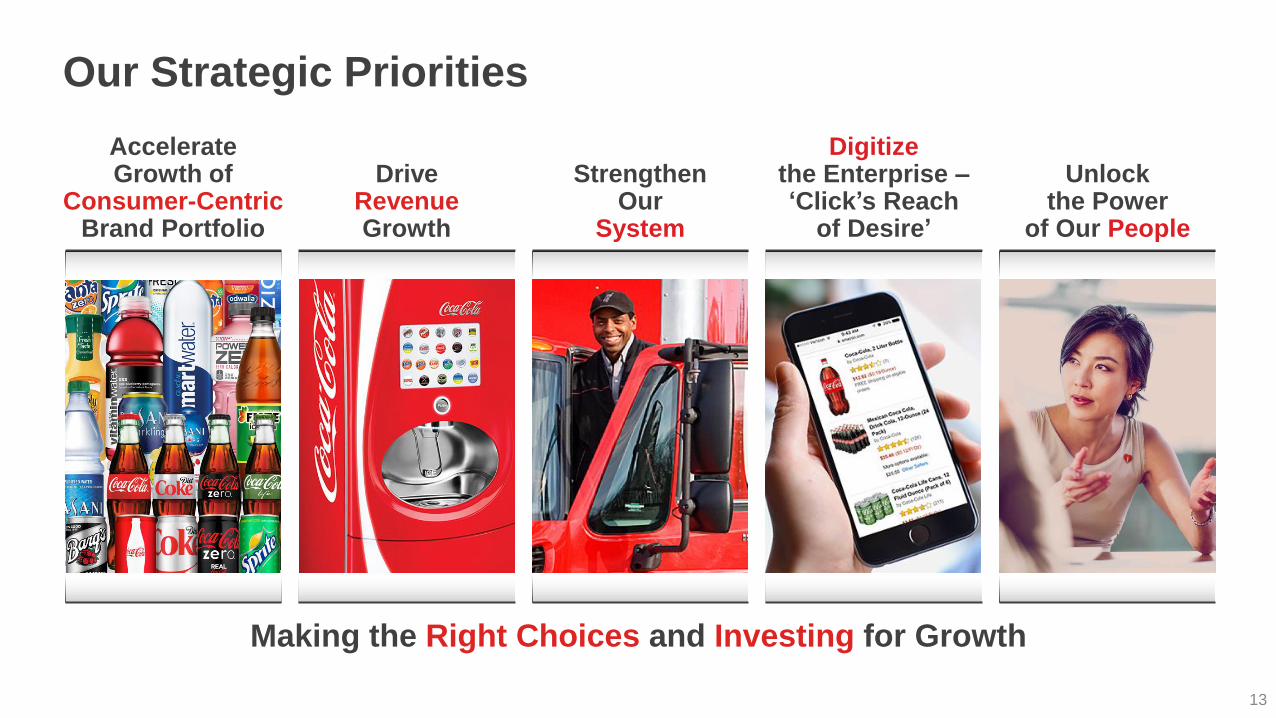
Our Strategic Priorities
13
Making the Right Choices and Investing for Growth
Digitize the Enterprise –‘Click’s Reach
of Desire’
AccelerateGrowth of
Consumer-CentricBrand Portfolio
DriveRevenueGrowth
Strengthen Our
System
Unlock the Power
of Our People
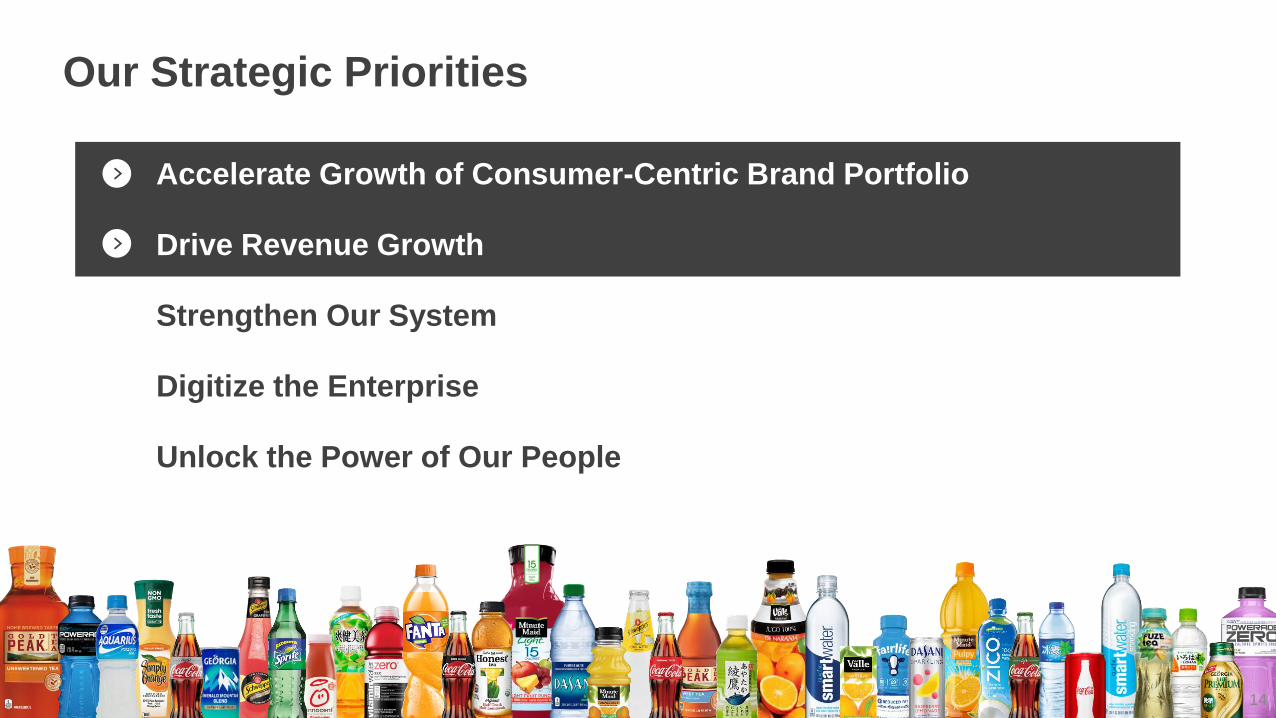
Our Strategic Priorities
14
Accelerate Growth of Consumer-Centric Brand Portfolio
Drive Revenue Growth
Strengthen Our System
Digitize the Enterprise
Unlock the Power of Our People
RTDCoffee
RTDTea
~15%
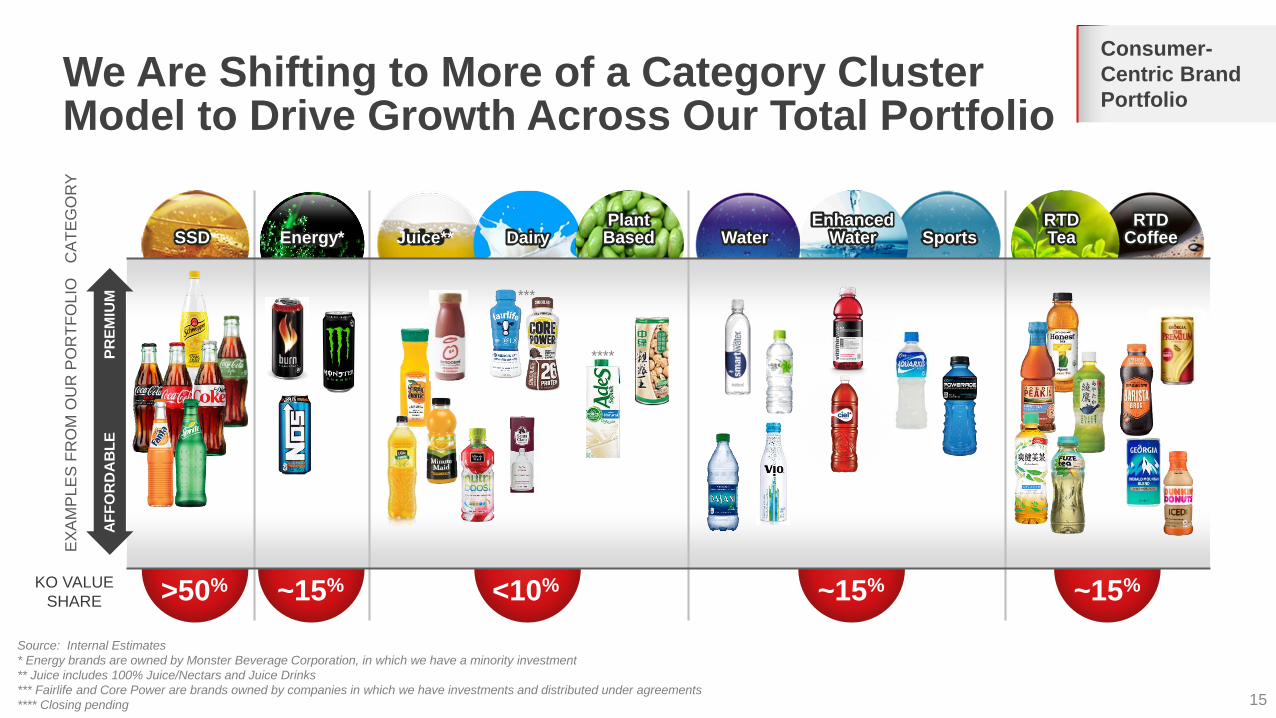
We Are Shifting to More of a Category Cluster Model to Drive Growth Across Our Total Portfolio
15
Source: Internal Estimates
* Energy brands are owned by Monster Beverage Corporation, in which we have a minority investment
** Juice includes 100% Juice/Nectars and Juice Drinks
*** Fairlife and Core Power are brands owned by companies in which we have investments and distributed under agreements
**** Closing pending
CA
TE
GO
RY
<10% ~15% ~15%>50%
AF
FO
RD
AB
LE
PR
EM
IUM
EX
AM
PL
ES
FR
OM
OU
R P
OR
TF
OL
IO
Consumer-
Centric Brand
Portfolio
DairyPlant Based SportsWater
Enhanced WaterSSD Energy* Juice**
KO VALUE
SHARE
***
****
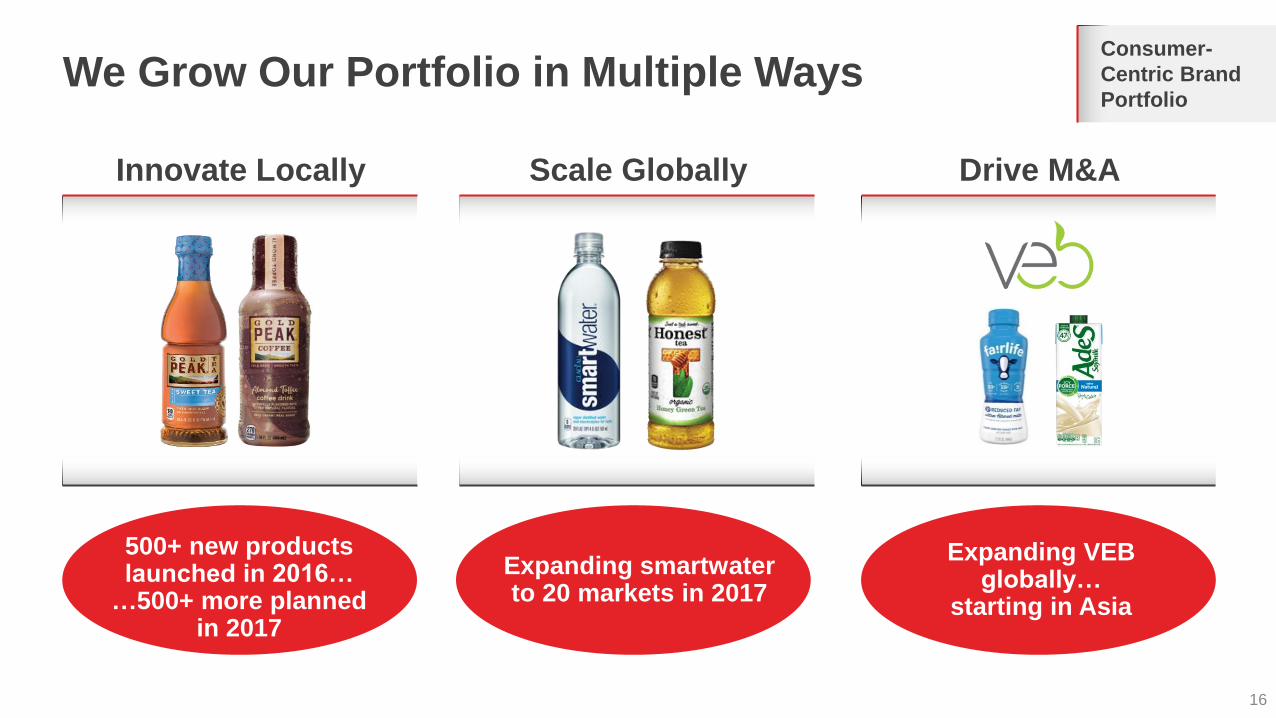
We Grow Our Portfolio in Multiple Ways
16
Consumer-
Centric Brand
Portfolio
Innovate Locally
Expanding smartwater to 20 markets in 2017
Scale Globally Drive M&A
500+ new products launched in 2016…
…500+ more plannedin 2017
Expanding VEB globally…
starting in Asia
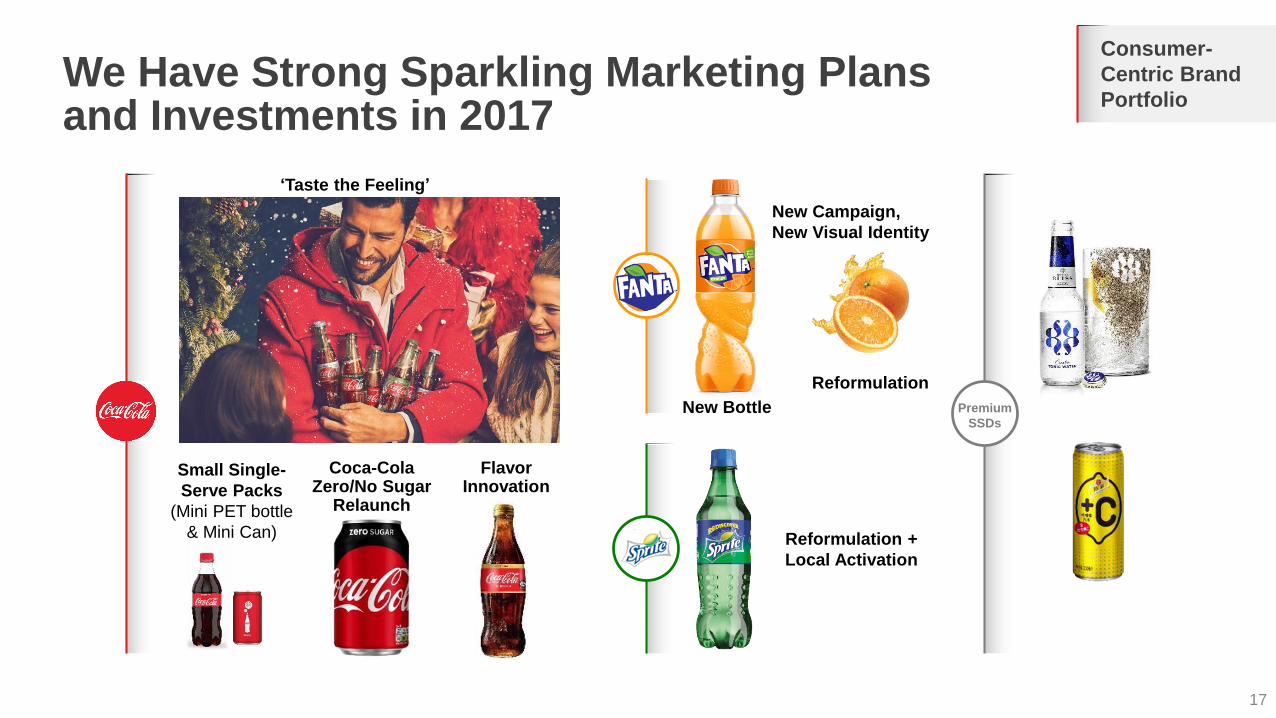
We Have Strong Sparkling Marketing Plans and Investments in 2017
17
FlavorInnovation
‘Taste the Feeling’
Coca-ColaZero/No Sugar
Relaunch
Small Single-
Serve Packs
(Mini PET bottle
& Mini Can)
Reformulation
New Bottle
New Campaign,
New Visual Identity
Reformulation +
Local Activation
Premium
SSDs
Consumer-
Centric Brand
Portfolio
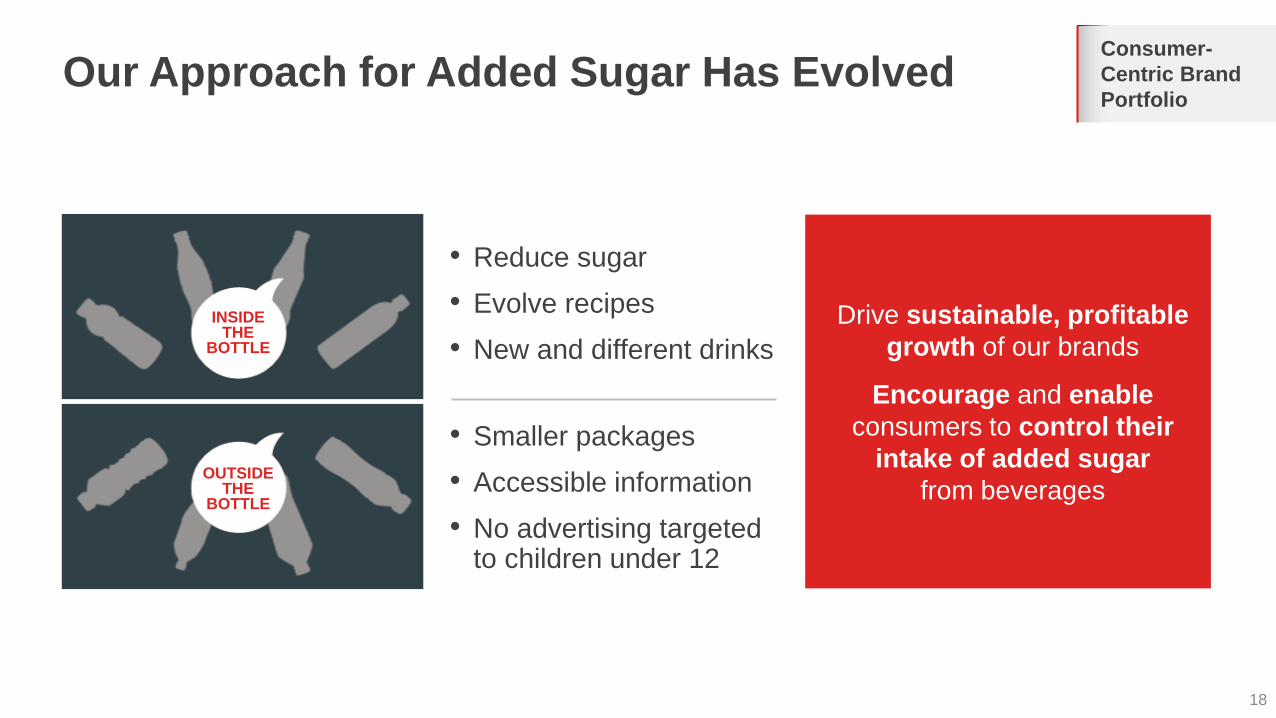
Our Approach for Added Sugar Has Evolved
18
Consumer-
Centric Brand
Portfolio
Drive sustainable, profitable
growth of our brands
Encourage and enable
consumers to control their
intake of added sugar
from beverages
• Reduce sugar
• Evolve recipes
• New and different drinks
• Smaller packages
• Accessible information
• No advertising targeted to children under 12
INSIDETHE
BOTTLE
OUTSIDETHE
BOTTLE
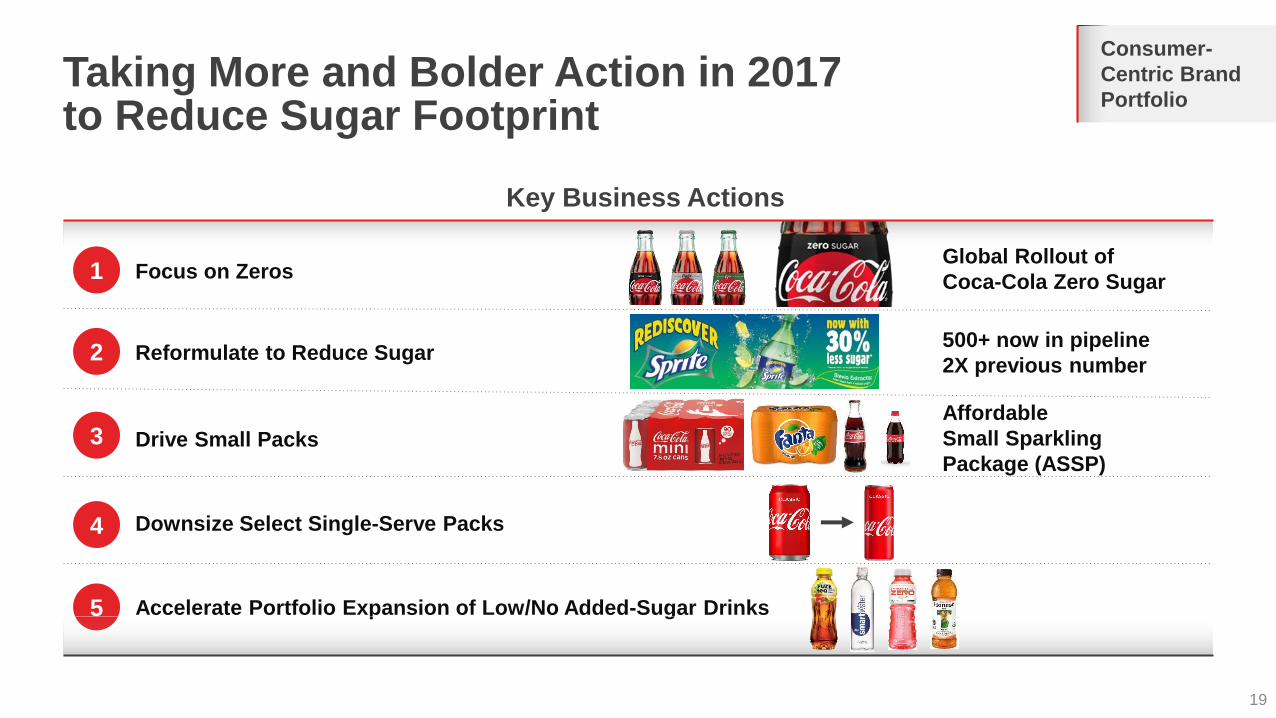
Taking More and Bolder Action in 2017 to Reduce Sugar Footprint
19
Focus on Zeros
Reformulate to Reduce Sugar
Drive Small Packs
Downsize Select Single-Serve Packs
Accelerate Portfolio Expansion of Low/No Added-Sugar Drinks
1
2
3
4
5
Global Rollout of
Coca-Cola Zero Sugar
Affordable
Small Sparkling
Package (ASSP)
500+ now in pipeline
2X previous number
Drive
Revenue
Growth
Consumer-
Centric Brand
Portfolio
Key Business Actions
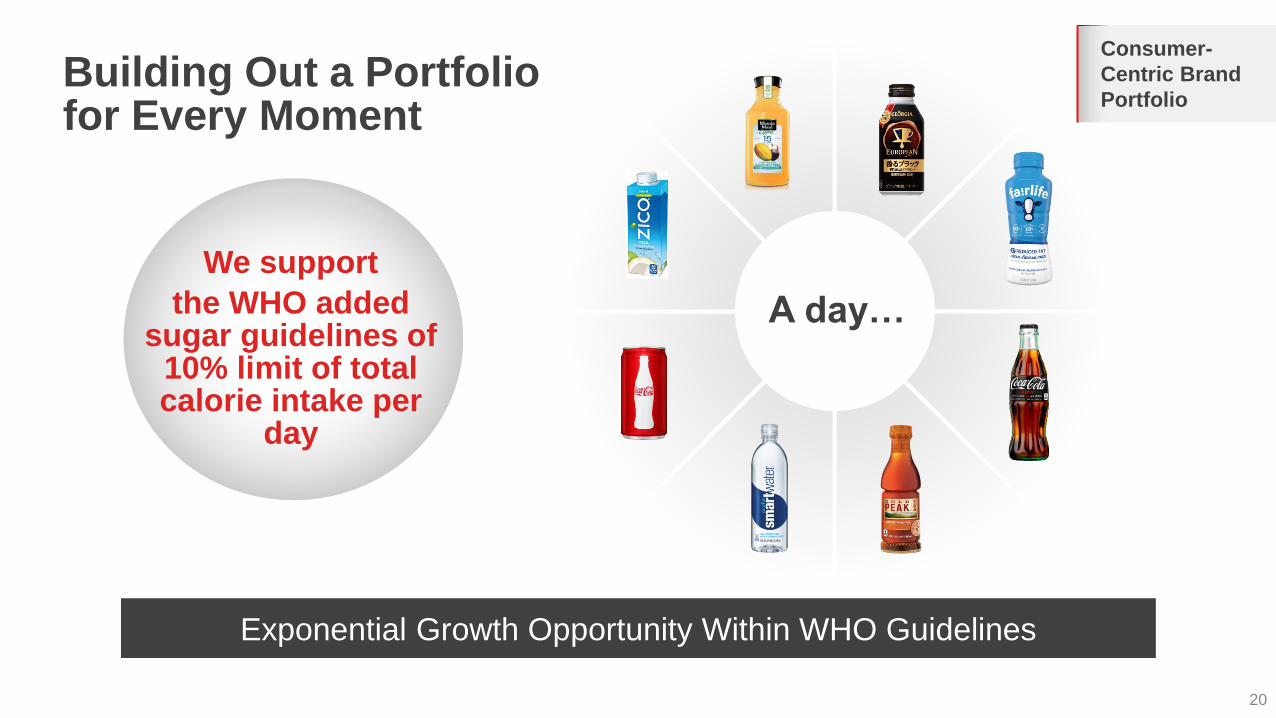
Building Out a Portfolio for Every Moment
20
Exponential Growth Opportunity Within WHO Guidelines
A day…
Drive
Revenue
Growth
Consumer-
Centric Brand
Portfolio
We support
the WHO added sugar guidelines of
10% limit of total calorie intake per
day
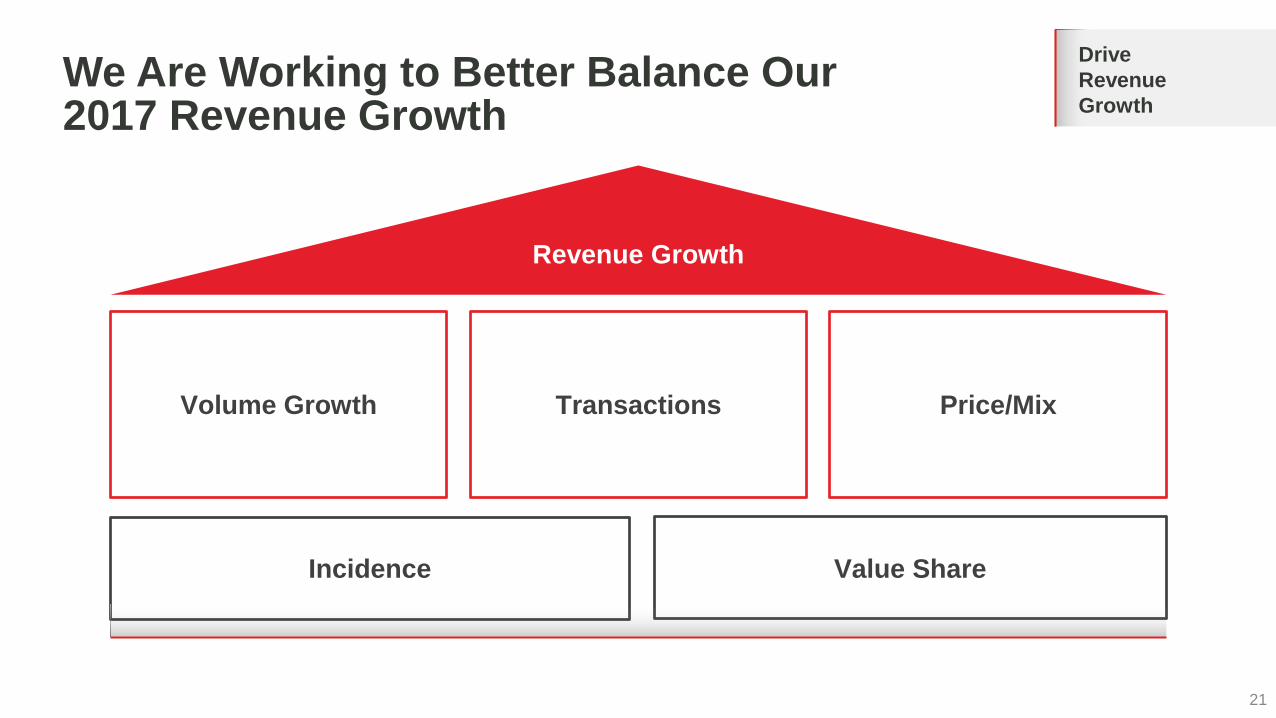
We Are Working to Better Balance Our 2017 Revenue Growth
21
Drive
Revenue
Growth
Volume Growth Transactions
Incidence
Revenue Growth
Price/Mix
Value Share
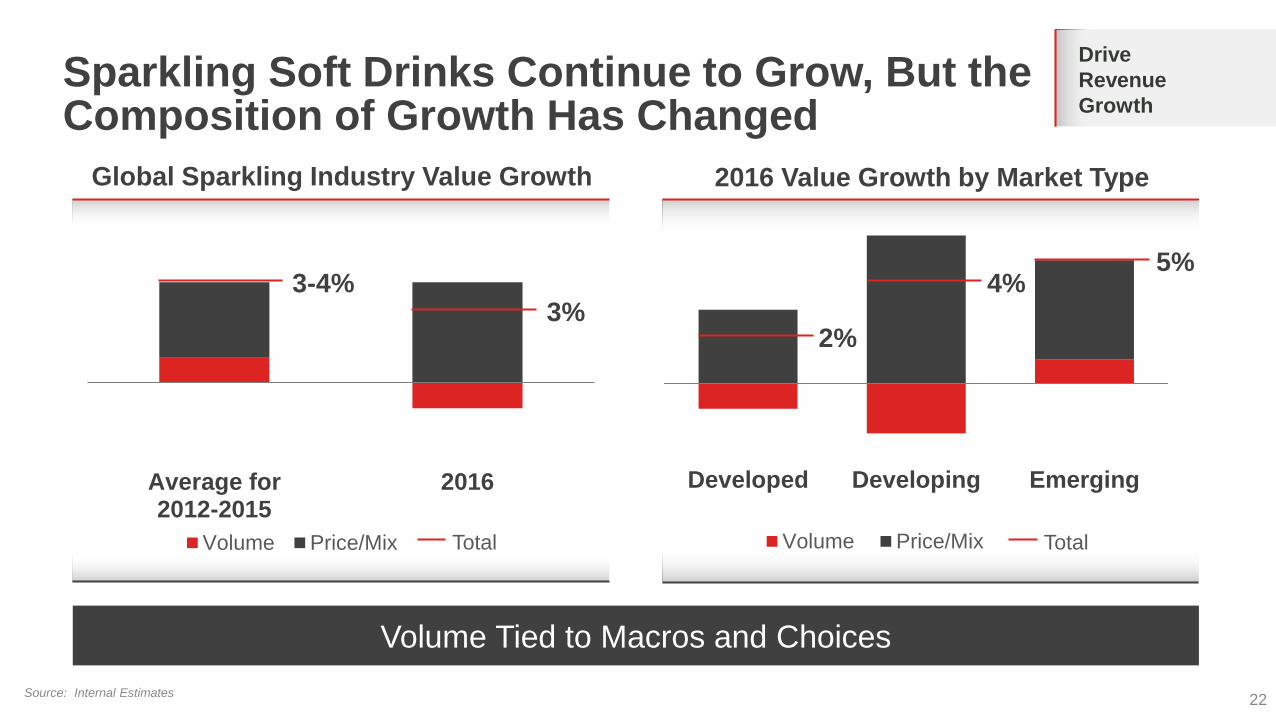
Sparkling Soft Drinks Continue to Grow, But the Composition of Growth Has Changed
22
Developed Developing Emerging
Volume Price/Mix
Average for2012-2015
2016
Volume Price/Mix
Source: Internal Estimates
Global Sparkling Industry Value Growth 2016 Value Growth by Market Type
3%
Volume Tied to Macros and Choices
3-4%
2%
4%5%
Total Total
Drive
Revenue
Growth
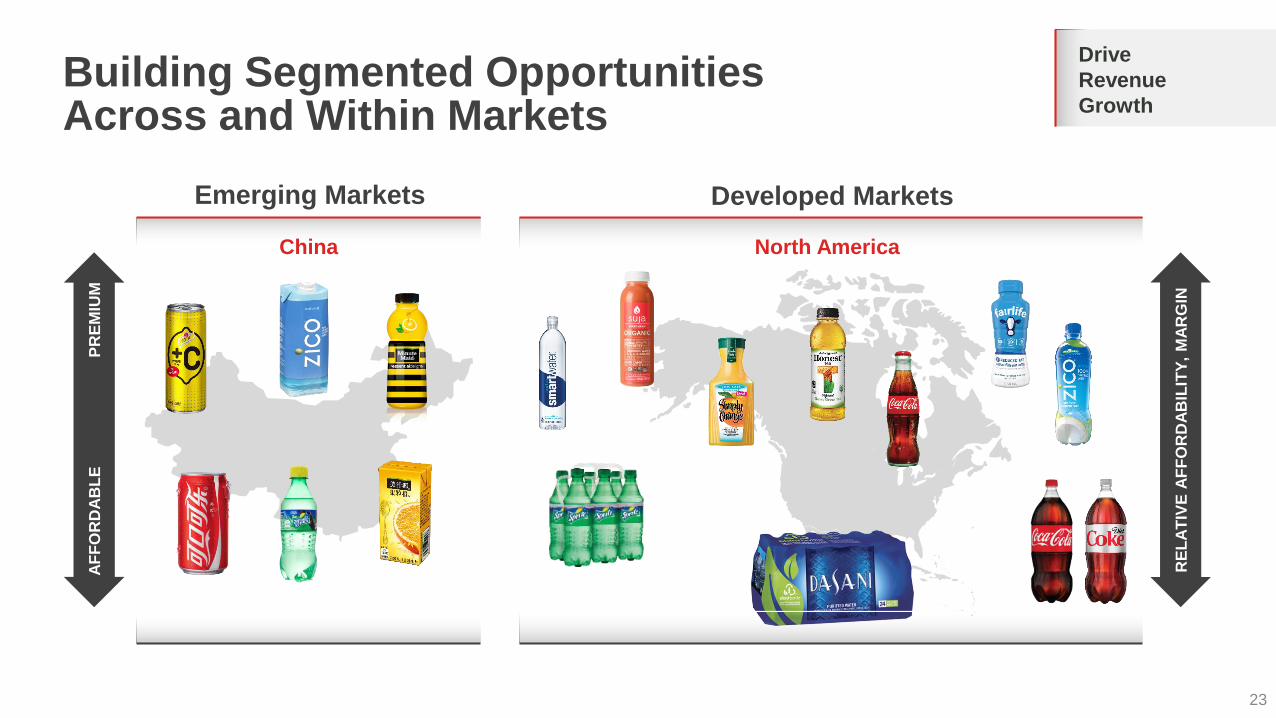
Building Segmented Opportunities Across and Within Markets
23
Drive
Revenue
GrowthA
FF
OR
DA
BL
EP
RE
MIU
M
North America
Emerging Markets Developed Markets
China
RE
LA
TIV
E A
FF
OR
DA
BIL
ITY
, M
AR
GIN
24

Our Strategic Priorities
25
Accelerate Growth of Consumer-Centric Brand Portfolio
Drive Revenue Growth
Strengthen Our System
Digitize the Enterprise
Unlock the Power of Our People
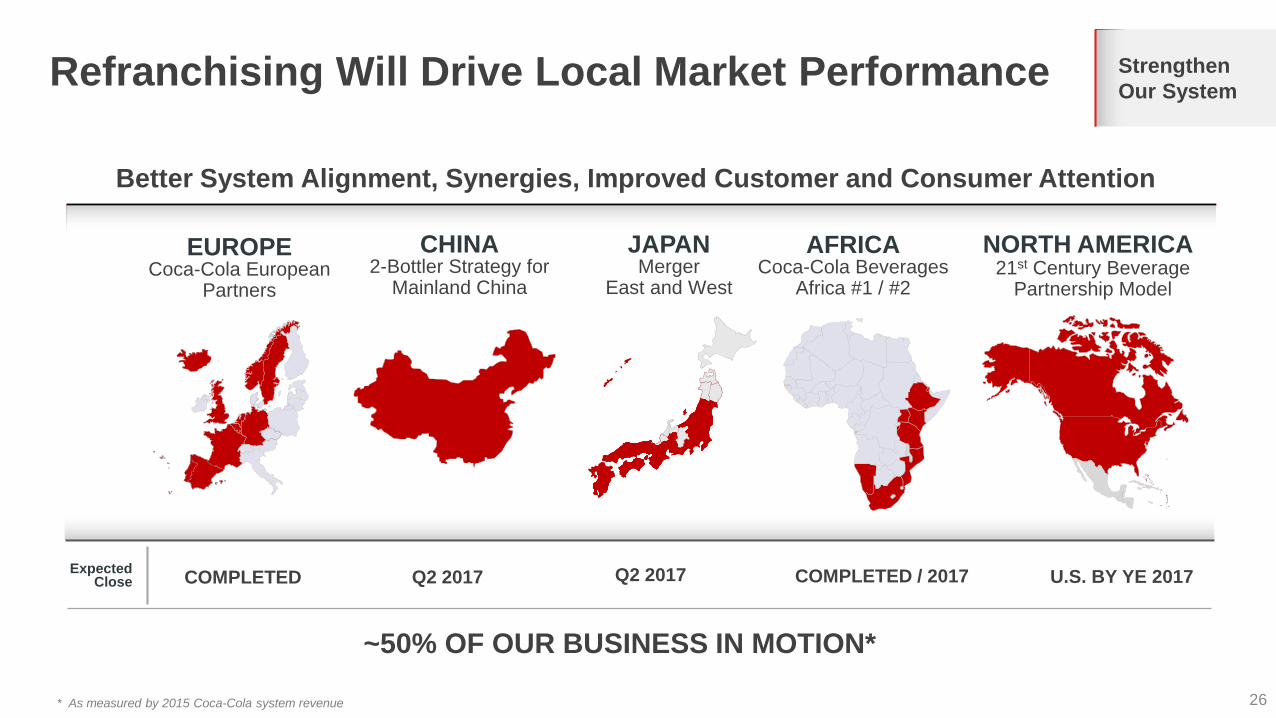
Refranchising Will Drive Local Market Performance
26
~50% OF OUR BUSINESS IN MOTION*
* As measured by 2015 Coca-Cola system revenue
Better System Alignment, Synergies, Improved Customer and Consumer Attention
COMPLETED Q2 2017Expected Close Q2 2017
21st Century Beverage Partnership Model
Coca-Cola European Partners
Coca-Cola Beverages Africa #1 / #2
2-Bottler Strategy for Mainland China
MergerEast and West
NORTH AMERICAEUROPE AFRICACHINA JAPAN
COMPLETED / 2017 U.S. BY YE 2017
Strengthen
Our System
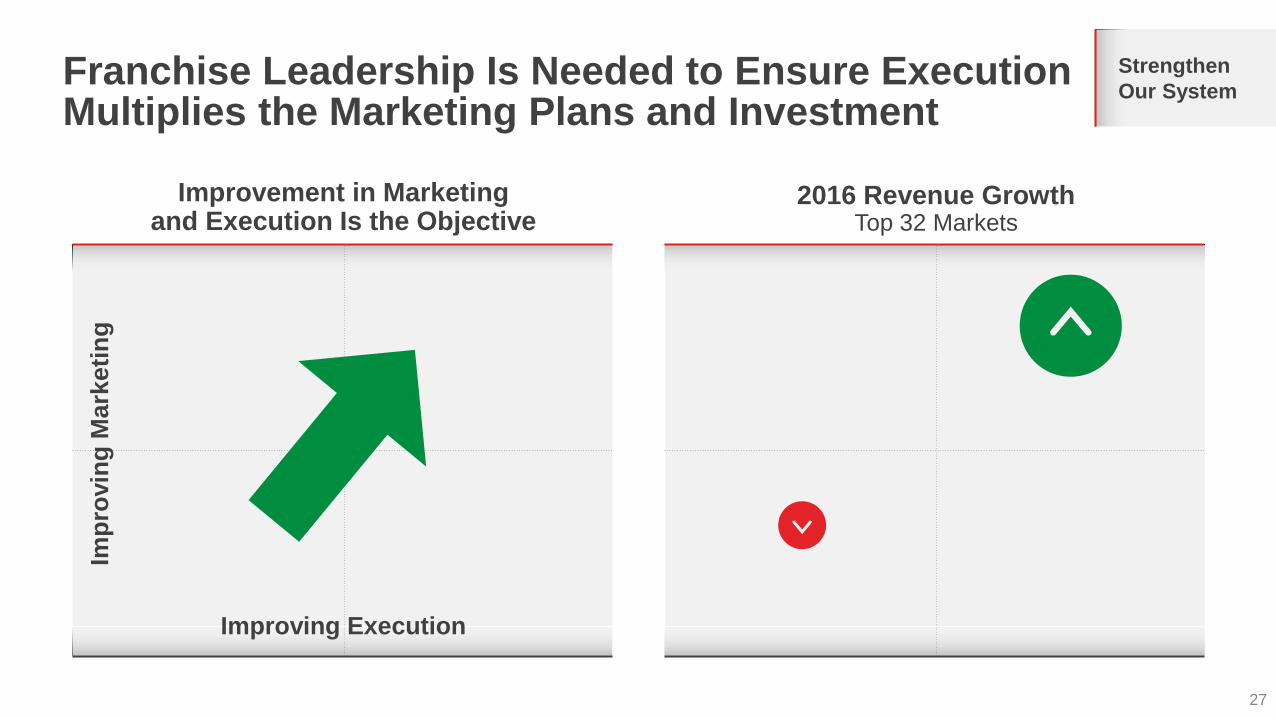
Franchise Leadership Is Needed to Ensure Execution Multiplies the Marketing Plans and Investment
27
Imp
rovin
g M
ark
eti
ng
Improving Execution
Strengthen
Our System
Improvement in Marketing and Execution Is the Objective
2016 Revenue GrowthTop 32 Markets
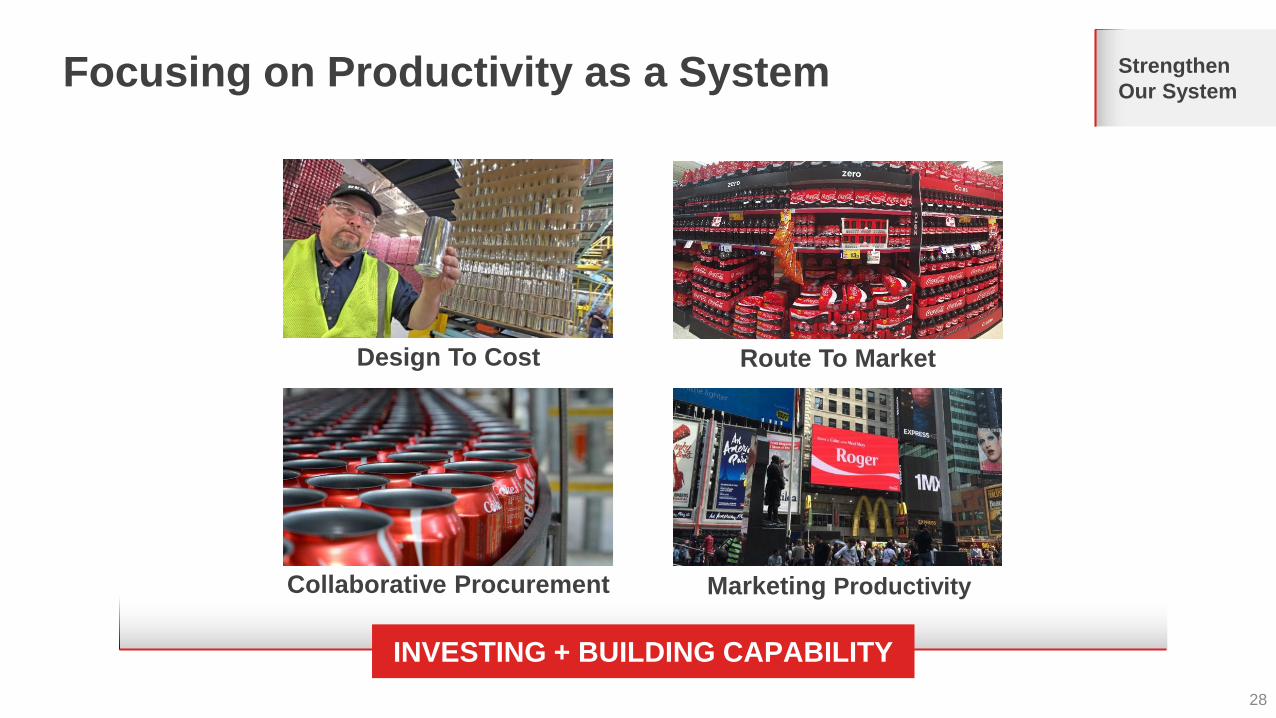
Focusing on Productivity as a System
28
INVESTING + BUILDING CAPABILITY
Strengthen
Our System
Design To Cost
Collaborative Procurement
Route To Market
Marketing Productivity
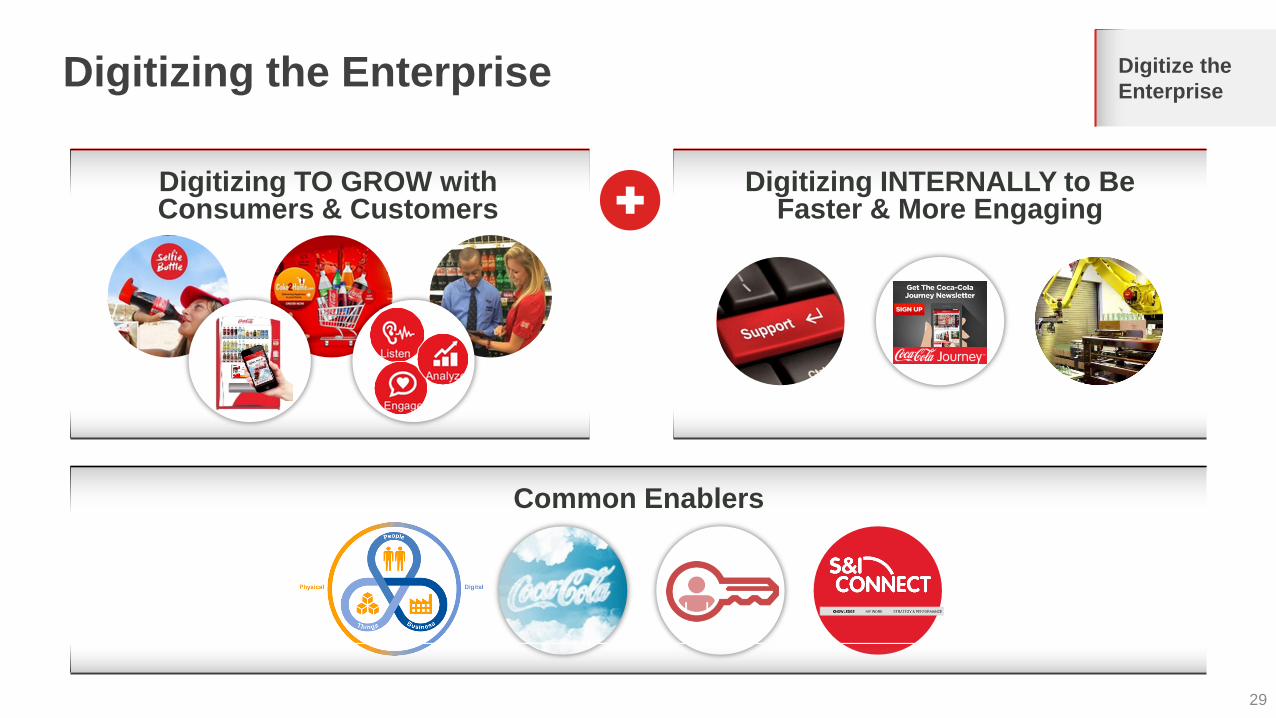
Digitizing the Enterprise
29
Digitize the
Enterprise
Digitizing TO GROW with Consumers & Customers
Common Enablers
Digitizing INTERNALLY to Be Faster & More Engaging
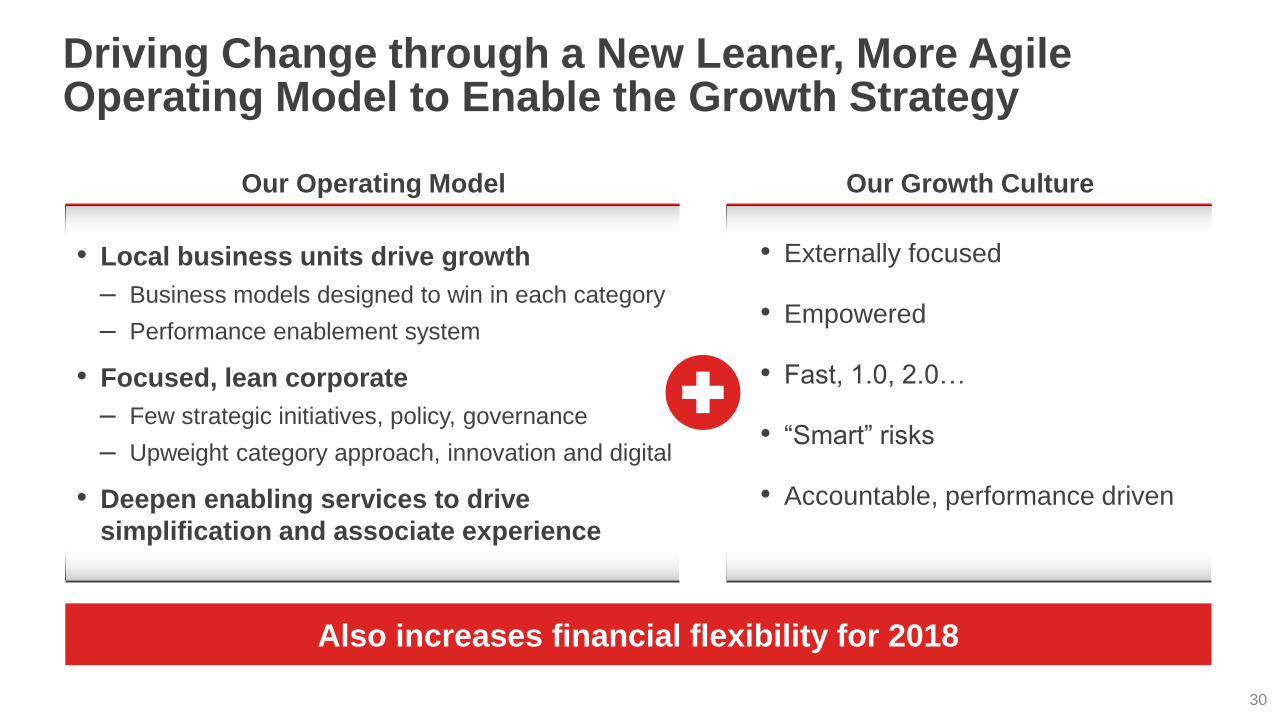
Driving Change through a New Leaner, More Agile Operating Model to Enable the Growth Strategy
30
• Externally focused
• Empowered
• Fast, 1.0, 2.0…
• “Smart” risks
• Accountable, performance driven
Our Growth Culture
• Local business units drive growth
‒ Business models designed to win in each category
‒ Performance enablement system
• Focused, lean corporate
‒ Few strategic initiatives, policy, governance
‒ Upweight category approach, innovation and digital
• Deepen enabling services to drive
simplification and associate experience
Our Operating Model
Also increases financial flexibility for 2018
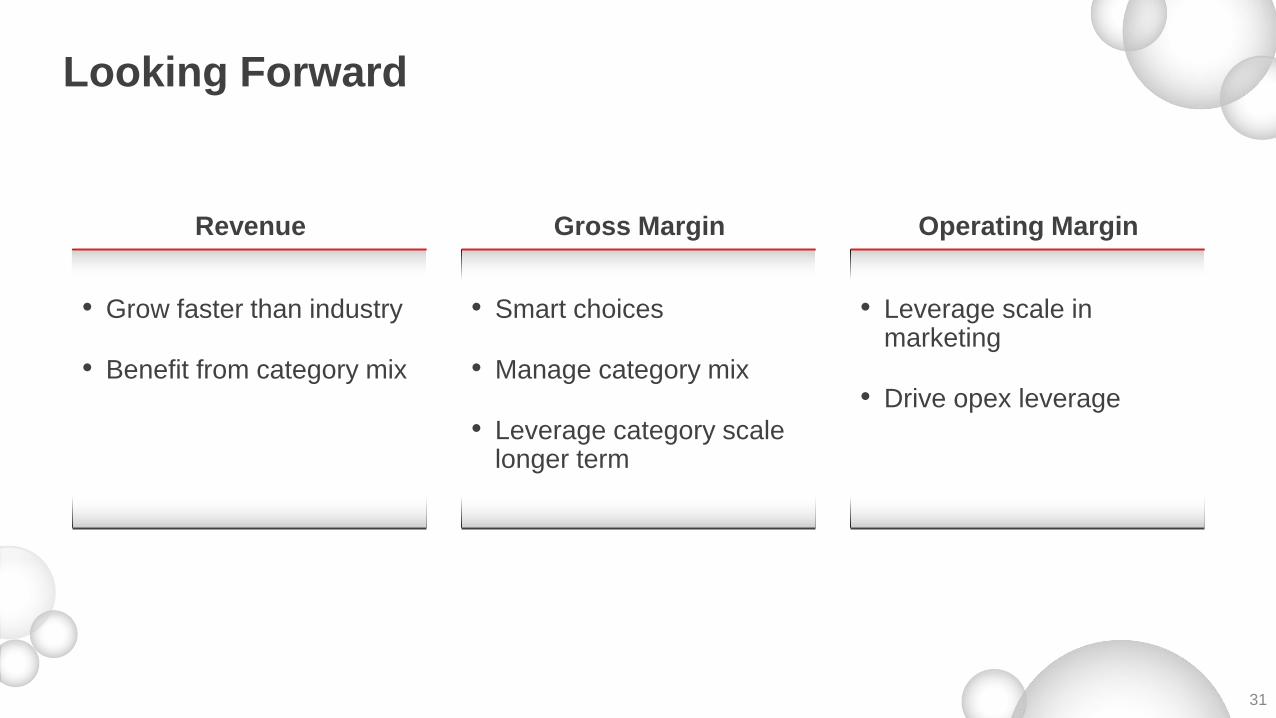
Looking Forward
31
• Grow faster than industry
• Benefit from category mix
• Smart choices
• Manage category mix
• Leverage category scale longer term
Revenue Gross Margin
• Leverage scale in marketing
• Drive opex leverage
Operating Margin
32
Topics for Discussion
Laying the Foundation
Looking Forward
Financial Performance
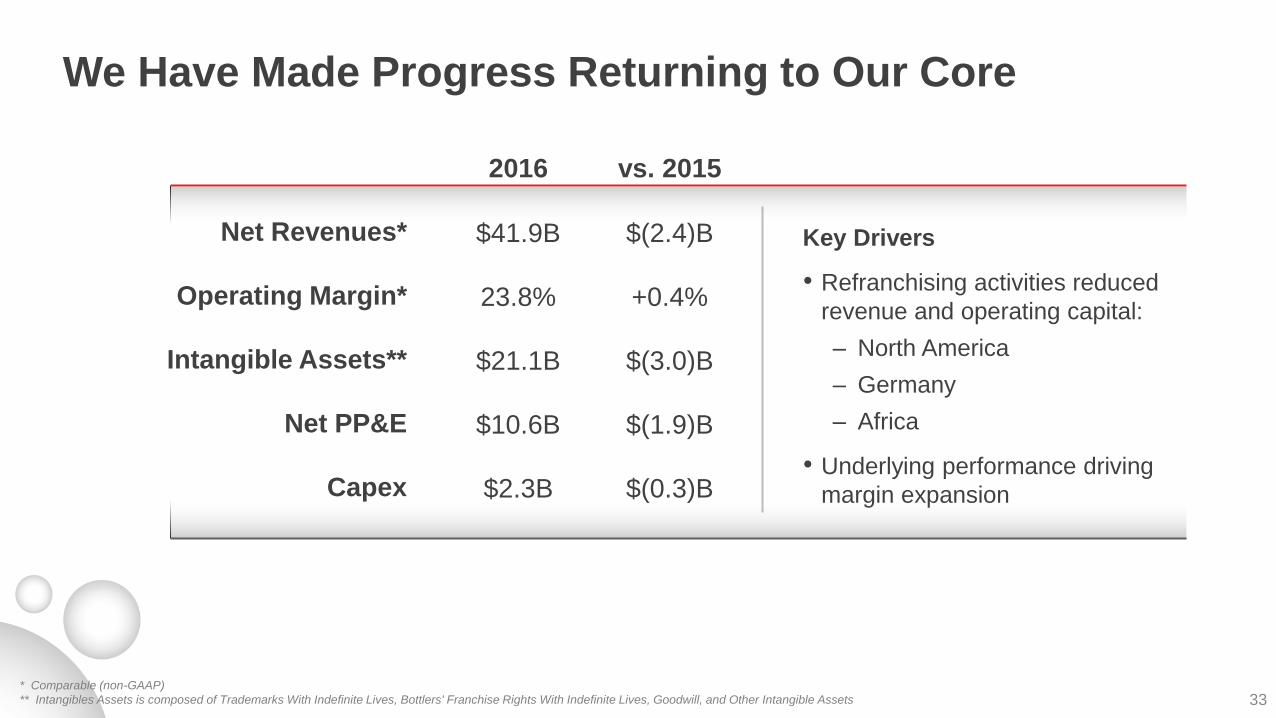
We Have Made Progress Returning to Our Core
33
2016 vs. 2015
Net Revenues*
Operating Margin*
Intangible Assets**
Net PP&E
Capex
$41.9B
23.8%
$21.1B
$10.6B
$2.3B
$(2.4)B
+0.4%
$(3.0)B
$(1.9)B
$(0.3)B
Key Drivers
• Refranchising activities reduced
revenue and operating capital:
– North America
– Germany
– Africa
• Underlying performance driving
margin expansion
* Comparable (non-GAAP)
** Intangibles Assets is composed of Trademarks With Indefinite Lives, Bottlers' Franchise Rights With Indefinite Lives, Goodwill, and Other Intangible Assets
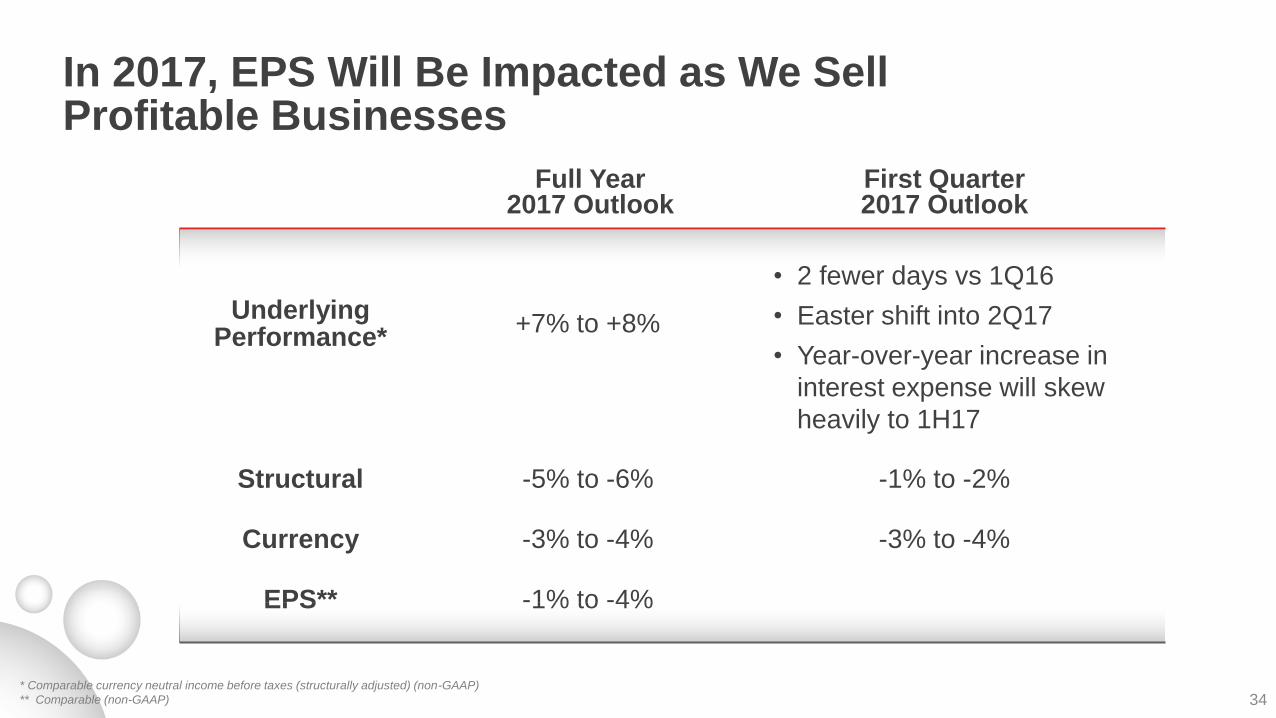
In 2017, EPS Will Be Impacted as We Sell Profitable Businesses
34* Comparable currency neutral income before taxes (structurally adjusted) (non-GAAP)
** Comparable (non-GAAP)
First Quarter 2017 Outlook
-1% to -2%
-3% to -4%
• 2 fewer days vs 1Q16
• Easter shift into 2Q17
• Year-over-year increase in
interest expense will skew
heavily to 1H17
Structural
Currency
Underlying Performance*
EPS**
Full Year 2017 Outlook
-5% to -6%
-3% to -4%
+7% to +8%
-1% to -4%
* Includes transactions to refranchise certain Company-owned bottling operations in North America, Germany, China and South Africa.
** Comparable (non-GAAP)
*** Depreciation and amortization would be adjusted by approximately the same percentage as capex
**** non-GAAP
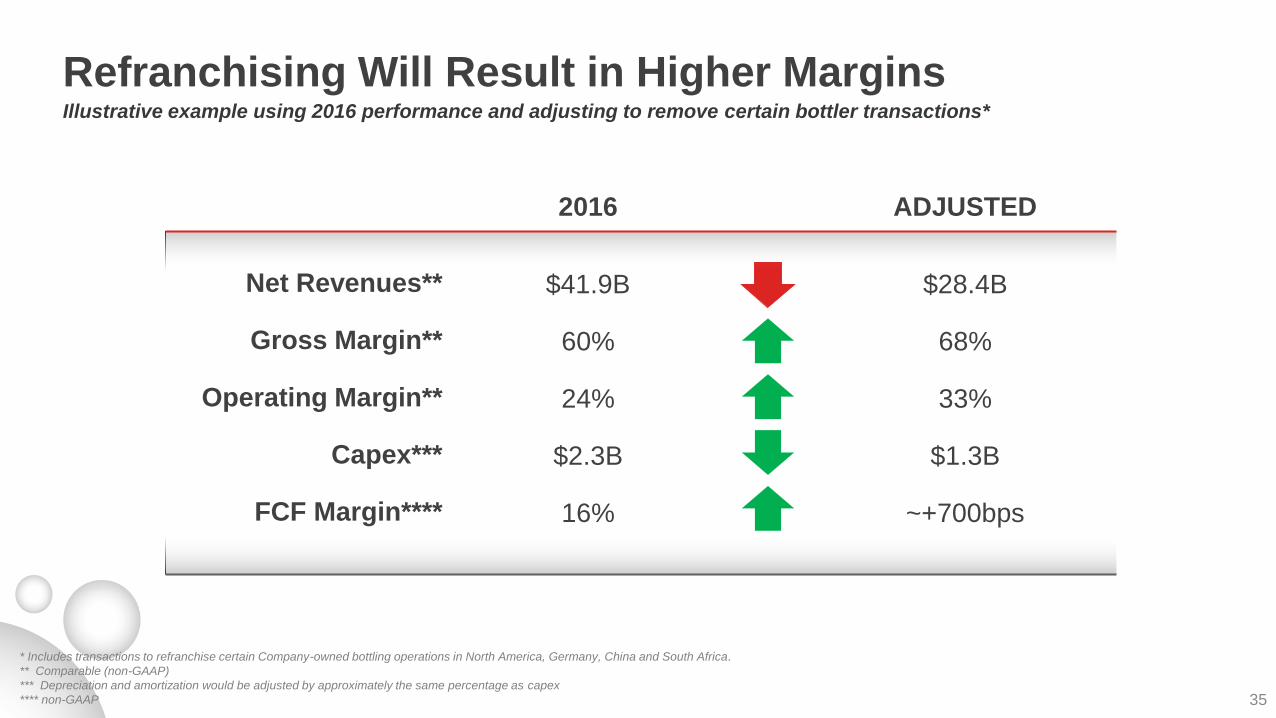
Refranchising Will Result in Higher Margins
35
2016 ADJUSTED
Net Revenues**
Gross Margin**
Operating Margin**
Capex***
FCF Margin****
$41.9B
60%
24%
$2.3B
16%
$28.4B
68%
33%
$1.3B
~+700bps
Illustrative example using 2016 performance and adjusting to remove certain bottler transactions*
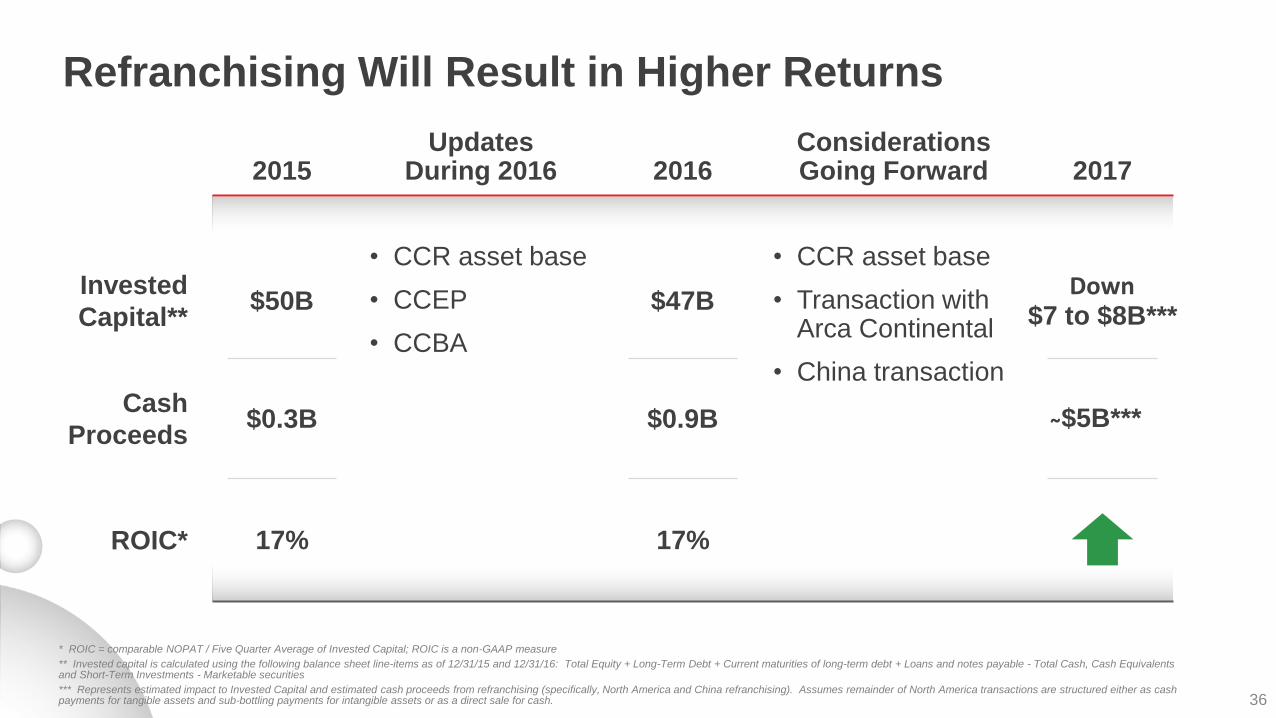
Refranchising Will Result in Higher Returns
36
* ROIC = comparable NOPAT / Five Quarter Average of Invested Capital; ROIC is a non-GAAP measure
** Invested capital is calculated using the following balance sheet line-items as of 12/31/15 and 12/31/16: Total Equity + Long-Term Debt + Current maturities of long-term debt + Loans and notes payable - Total Cash, Cash Equivalents and Short-Term Investments - Marketable securities
*** Represents estimated impact to Invested Capital and estimated cash proceeds from refranchising (specifically, North America and China refranchising). Assumes remainder of North America transactions are structured either as cash payments for tangible assets and sub-bottling payments for intangible assets or as a direct sale for cash.
Considerations Going Forward
• CCR asset base
• Transaction with Arca Continental
• China transaction
Updates During 2016
• CCR asset base
• CCEP
• CCBA
ROIC*
Cash
Proceeds
Invested
Capital**
2015
17%
$0.3B
$50B
2016
17%
$0.9B
$47B
2017
$5B***
$7 to $8B***Down
Post Refranchising, We Expect Accelerated Financial Performance
37
• Greater confidence to deliver our long term growth objectives
• Scaled bottlers in Western Europe, China and Africa
• North America - taken the necessary steps to support the system for long-term growth
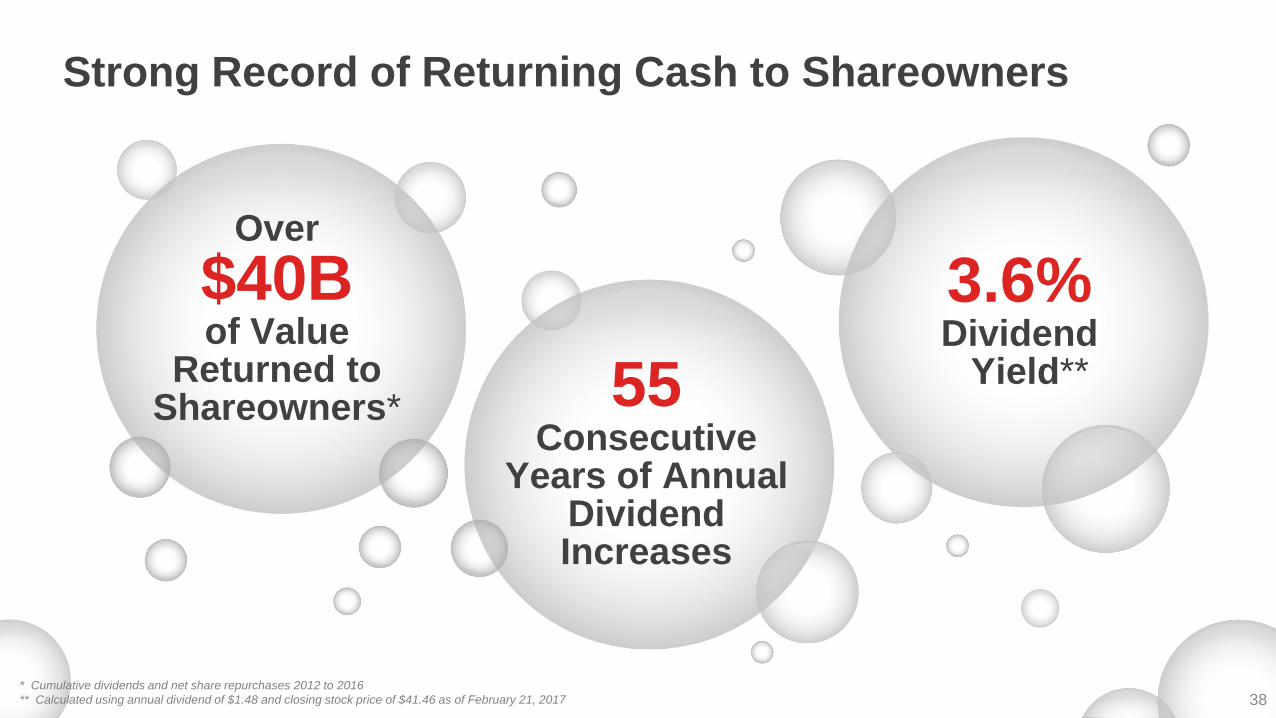
Strong Record of Returning Cash to Shareowners
38* Cumulative dividends and net share repurchases 2012 to 2016
** Calculated using annual dividend of $1.48 and closing stock price of $41.46 as of February 21, 2017
3.6%Dividend
Yield**55Consecutive
Years of Annual Dividend Increases
Over
$40Bof Value
Returned to Shareowners*
• Accelerating consumer-centric brand portfolio
• Reducing sugar footprint
• Driving segmented revenue growth strategies
• Top-line growth and operating margin expansion
• Implementing new operating model
• Leading system of strong aligned partners
Transforming Our Company
39
40
Q&A