janitor fish
DESCRIPTION
janitor fish ;)TRANSCRIPT
26
INTRODUCTION
News of a certain variety of fish caught in Laguna de Bay spread alarmingly in 2002. Reports revealed that the “sucker mouthed armored catfish” was the main reason why fishermen suffered less catch resulting in lower income. This incident caught not only the attention of the local government but also the private sectors. The Laguna Lake Development Authority (LLDA), the agency in-charge of the Laguna Lake, stated that the janitor fish make up about 10% to 38% of the total baklad catch in the waters of Siniloan, Laguna in 2002. Since janitor fish can lay up to a thousand eggs every month, the growth imposes a great challenge for us on how to control their population. Reports also indicated the existence of janitor fish in Marikina River and some parts of the Pasig River. Hypostomus plecostomus was the former identification of Janitor fish, because of the lack of taxonomic records and locally available materials.
Chavez et. al. (2006) indicated that Janitor fishes belong to the genus Ptrerygloplichtys based on the key to the genus Pterygoplichtys
sensulato of Weber and by the other descriptions of Armbruster and Weber (in: Chavez 2006). In addition, there are two species found in Laguna de Bay, namely Pterygoplichtys disjunctivus and Pterygoplichtys pardalis.
Some literature show that they grow up to 60 cm long and could weigh up to 3 kg. Janitor fish is one of the favorites among aquarium hobbyists not because of its extraordinary looks but because of its ability to clean the tanks and keeping the aquariums clean. In addition, this fish loves to thrive in the murkiest parts of the aquarium. The natural habitat of the fish is the murky dark bottoms of the water system, but they could easily adapt to active life in the daylight. Janitor fish or more commonly known internationally as vermiculated sail fin catfish is a
Journal of Environmental Science and Management 13(2): 27–43 (December 2010)
ISSN 0119-1144
Drying Janitor Fish for Feeds in Laguna Lake to Mitigate Pollution Potentials
Isabel D. Aranda1, Edgardo V. Casas2, Engelbert K. Peralta3 and Jesse C. Elauria4
ABSTRACT
The determination and optimization of drying characteristics of the janitor fish was studied
using the regression surface methodology. Fish samples were subjected to drying air temperature of
50 ºC, 60 ºC, and 70 ºC; 0.21, 0.24, and 0.27 ms-1 air velocity, and cuts 1, 2 and 3. The responses
observed were average drying rate, final moisture content, rehydration rate, rehydration
ratio, and moisture ratio. The drying rate of the sample was significant to air temperature at
95% level. All the other dependent parameters were insignificant due to the restriction of the
surface exposed on each cut and the thick scales of the samples. Response surface regression yielded
the optimum condition for drying janitor fish of 70 ºC, 0.27 ms-1 and 3 cuts. Optimum values
observed were compared with the predicted values after verification trials and found acceptable
due to lower percent errors. Harvesting, drying, and milling janitor fish for feeds can eliminate
the pollution potentials of janitor fish. The polynomial equation that follows describes the drying
model in terms of moisture ratio (MR) as a function of drying time (x):
MR=0.99 - 0.0006x + 9.018x2—1.88e-009x3 + 8.28e-013 x4
Key words: janitor fish, Laguna Lake, feeds, optimization, drying rate, rehydration rate,
rehydration ratio, and moisture ratio
1 Undergraduate Student. Agricultural and BioProcess Division, Institute of Agricultural Engineering (IAE), College of Engineering and Agro-Industrial Technology (CEAT), University of the Philippines Los Baños (UPLB), College, Laguna. Email address: [email protected]
2 Affiliate Professor, Agricultural and BioProcess Division, IAE, CEAT, UPLB, College, Laguna. 3 Associate Professor, Agricultural and BioProcess Division, IAE, CEAT, UPLB, College, Laguna. 4 Professor, Agricultural and BioProcess Division, IAE, CEAT, UPLB, College, Laguna.
27 Journal of Environmental Science and Management Vol. 13. No. 2 (December 2010)
genus Pterygoplichtys from family Loricariidae. Pterygoplichtys came from the Greek pteryg; meaning “wing”; hoplon, meaning “weapon”, and ichtys, meaning” fish”. Weber (1991) then subdivided the genus to three subgenera:
Pterygoplichtys, Liposarcus, and Glyptoperichtys. Armbruster (1997) placed Liposarchus in synonymy of Pterygoplichtys. Chavez, et. al. (2006) conducted an examination of the fish collected from the Marikina, Pasig, and Laguna and concluded that the Janitor fish in the Philippine waters consisted of two species: Pterygoplichtys disjunctivus and Pterygoplichtys pardalis. Director Teresa Mundita Lim of the Protected Wildlife Bureau of DENR stated, “It may already be too expensive to launch eradication measures against this South American fish at this point” (in: Contreras 2004). In August 2002, the Department of Science and Technology’s Philippine Council for Aquatic and Marine Research and Development (DOST-PCAMRD) declared that janitor fish, then identified as Hypostomus
plecostomus, was harmless to man and other fishes. In line with this, the agency also announced that the fish fins were not poisonous and their flesh was edible. Laguna Lake Development Authority (LLDA) supported the notion, saying that Janitor fishes caught from Laguna Lake was safe for human consumption since it do not contain toxic levels of heavy metals. Even Armbruster
(http://www.auburn.edu) testified that South Americans eat the Janitor fish by gutting and grilling them or boiling them as soup stock. In view of this, Lacanilao (2004) suggested drastic moves towards the situation to national broadsheet through e-mails. In Maryland, USA, the authorities used poison, electrocution, and drainage to eliminate the voracious snakeheads that invaded an inland river and a lake. In addition, the LLDA also planned a way to eliminate this pest by converting the fish into animal and fish feed. This approach can result in solving the high cost of commercial feed and the widespread proliferation of the Janitor fish at the same time. With this, the fishermen would not have to worry of being penniless when they caught nothing but Janitor fish on their nets. Marginalized fish and hog farmers may have additional income by manufacturing the feeds
with janitor fish as one of the ingredients. Amurao 2005 (as cited by Zambarrano
2006), of Marikina Science High School conducted studies in the Janitor fish and discovered that janitor fish oil had potential for conversion to biodiesel. Accordingly, 23 pieces of janitor fish, each weighing 500 g could yield 500 ml of fish oil. One hundred milliliters of fish oil could produce 72 ml of biodiesel. Amurao (2005), together with the support of LLDA and other government and individual agencies are undergoing more tests to convert Janitor fish oil to biodiesel or as blend with coco diesel. Amurao 2005 (as cited by Zambarrano
2006), extended the study to the Janitor fish bones as carbon filters with the assistance of LLDA. The research involved the extraction of calcium and the production of activated carbon from the fish’s bone, with potentials for the manufacture of water purifiers. In view of the uncontrolled proliferation of janitor fish in Laguna Lake and bodies of water in the Philippines that affect the livelihood fresh water fishermen, there is an urgent need to develop technologies for the utilization of janitor fish as feed ingredients or for other purposes. Studying the drying characteristics and milling properties will result in the development of technologies for alternative uses of Janitor fish as feed ingredients, thereby mitigating its pollution potential. In general, the study explored the feasibility of drying janitor fish for feeds and other uses. Specifically, the study attempted to determine the effects of drying temperature, air velocity, and number of cuts of the fish on drying rate, moisture ratio, rehydration rate, and rehydration ratio and milling ratio; optimize the drying conditions to attain the optimum responses; develop drying models to predict the responses in future studies; and establish recommendations for future applications and studies.
METHODOLOGY
Materials and Equipment
The materials and equipment used in the
experiment consisted of 25 kg janitor fish supplied by CDD, LLDA, Adventurer™ electronic balance, triple beam balance OHAUS®, laboratory cabinet dryer, Eurotherm Carbolite™ oven, wide screen baskets, small wire mesh baskets, drying trays, polyethylene plastic bags, electrical sealer, marker and paper, knife, sling psychrometer, temperature controller, and manual coffee grinder.
Experimental Design
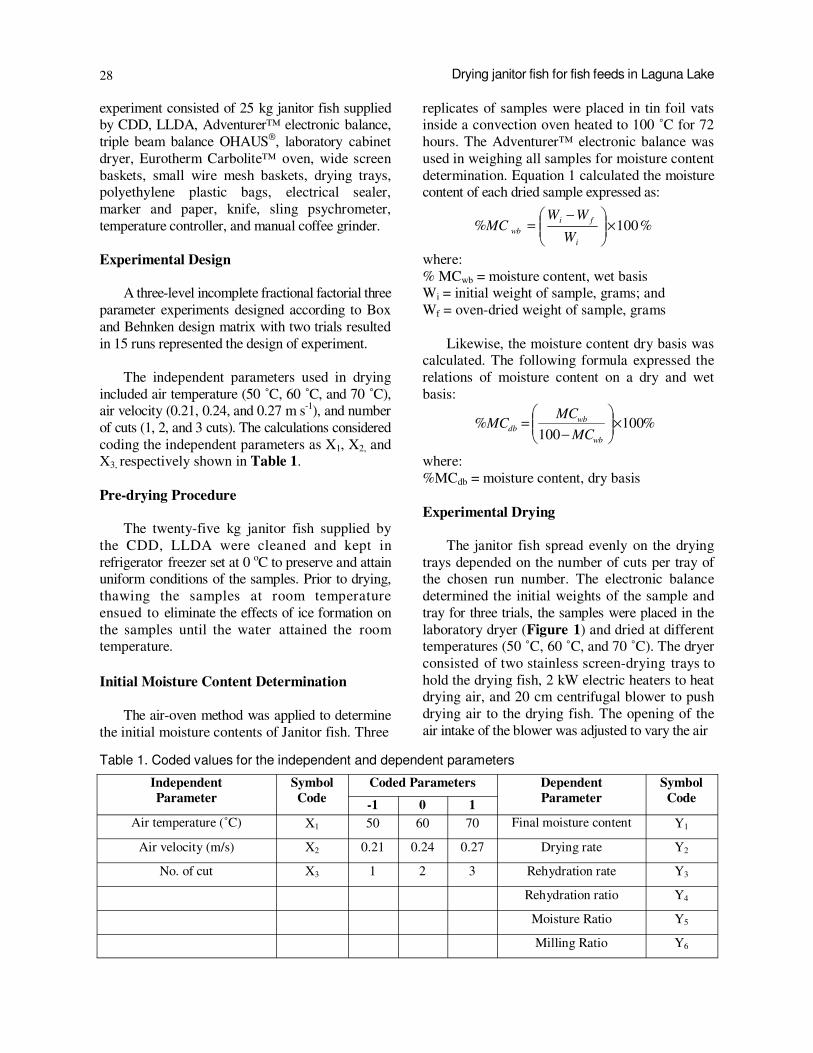
A three-level incomplete fractional factorial three parameter experiments designed according to Box and Behnken design matrix with two trials resulted in 15 runs represented the design of experiment. The independent parameters used in drying included air temperature (50 ˚C, 60 ˚C, and 70 ˚C), air velocity (0.21, 0.24, and 0.27 m s-1), and number of cuts (1, 2, and 3 cuts). The calculations considered coding the independent parameters as X1, X2, and X3, respectively shown in Table 1.
Pre-drying Procedure
The twenty-five kg janitor fish supplied by the CDD, LLDA were cleaned and kept in refrigerator freezer set at 0 oC to preserve and attain uniform conditions of the samples. Prior to drying, thawing the samples at room temperature ensued to eliminate the effects of ice formation on the samples until the water attained the room temperature. Initial Moisture Content Determination
The air-oven method was applied to determine the initial moisture contents of Janitor fish. Three
replicates of samples were placed in tin foil vats inside a convection oven heated to 100 ˚C for 72 hours. The Adventurer™ electronic balance was used in weighing all samples for moisture content determination. Equation 1 calculated the moisture content of each dried sample expressed as: where: % MCwb = moisture content, wet basis Wi = initial weight of sample, grams; and Wf = oven-dried weight of sample, grams Likewise, the moisture content dry basis was calculated. The following formula expressed the relations of moisture content on a dry and wet basis: where: %MCdb = moisture content, dry basis
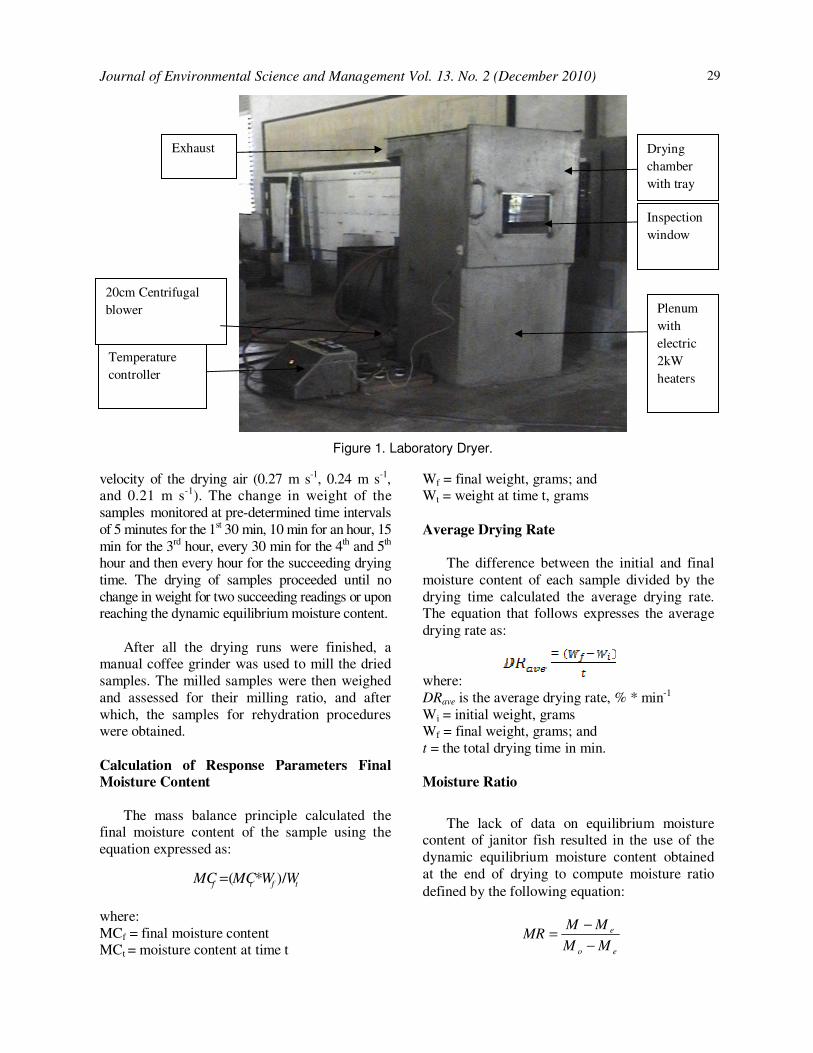
Experimental Drying The janitor fish spread evenly on the drying trays depended on the number of cuts per tray of the chosen run number. The electronic balance determined the initial weights of the sample and tray for three trials, the samples were placed in the laboratory dryer (Figure 1) and dried at different temperatures (50 ˚C, 60 ˚C, and 70 ˚C). The dryer consisted of two stainless screen-drying trays to hold the drying fish, 2 kW electric heaters to heat drying air, and 20 cm centrifugal blower to push drying air to the drying fish. The opening of the air intake of the blower was adjusted to vary the air
28 Drying janitor fish for fish feeds in Laguna Lake
Independent
Parameter
Symbol
Code
Coded Parameters Dependent
Parameter
Symbol
Code -1 0 1
Air temperature (˚C) X1 50 60 70 Final moisture content Y1
Air velocity (m/s) X2 0.21 0.24 0.27 Drying rate Y2
No. of cut X3 1 2 3 Rehydration rate Y3
Rehydration ratio Y4
Moisture Ratio Y5
Milling Ratio Y6
Table 1. Coded values for the independent and dependent parameters
%100×
−
=
i
fi
wbW
WW%MC
%100100
% ×
−
=
wb
wbdb
MC
MCMC
29
velocity of the drying air (0.27 m s-1, 0.24 m s-1, and 0.21 m s-1). The change in weight of the samples monitored at pre-determined time intervals of 5 minutes for the 1st 30 min, 10 min for an hour, 15 min for the 3rd hour, every 30 min for the 4th and 5th hour and then every hour for the succeeding drying time. The drying of samples proceeded until no change in weight for two succeeding readings or upon reaching the dynamic equilibrium moisture content. After all the drying runs were finished, a manual coffee grinder was used to mill the dried samples. The milled samples were then weighed and assessed for their milling ratio, and after which, the samples for rehydration procedures were obtained.
Calculation of Response Parameters Final
Moisture Content
The mass balance principle calculated the final moisture content of the sample using the equation expressed as: where: MCf = final moisture content MCt = moisture content at time t
Wf = final weight, grams; and Wt = weight at time t, grams
Average Drying Rate
The difference between the initial and final moisture content of each sample divided by the drying time calculated the average drying rate. The equation that follows expresses the average drying rate as: where: DRave is the average drying rate, % * min-1 Wi = initial weight, grams Wf = final weight, grams; and t = the total drying time in min. Moisture Ratio
The lack of data on equilibrium moisture content of janitor fish resulted in the use of the dynamic equilibrium moisture content obtained at the end of drying to compute moisture ratio
defined by the following equation:
Figure 1. Laboratory Dryer.
Journal of Environmental Science and Management Vol. 13. No. 2 (December 2010)
Drying
chamber
with tray
Plenum
with
electric
2kW
heaters
Temperature
controller
20cm Centrifugal
blower
Exhaust
Inspection
window
tftf WWMCMC /)*(=
eo
e
MM
MMMR
−
−=
30
where: MR= modified moisture ratio M= moisture content (dry basis) at a given time in % Mo= initial moisture content (dry basis) in %; and Me = dynamic equilibrium moisture content, % Equation (5) above determined the proportion of the moisture being removed at a given time interval during drying.
Rehydration Rate/Ratio
After every drying run, rehydration tests of the dried samples followed at a pre-determined time interval. Each test used 1 gram of dried sample immersed in 150ml distilled water for 5 minutes and consequently drained for two minutes. The amount of water absorbed was determined by weighing the sample immediately after draining. Rehydration continued until no change in weight of the rehydrated sample for two consecutive readings. The following equations were used to calculate the rehydration rate and rehydration ratio expressed: where: Rave rate = rehydration, average rate (g-min-1) Ww = weight of water absorbed, grams; and t = time, minutes Similarly, rehydration ratio expressed the ratio of the weight of rehydrated sample to the initial weight of the samples, represented as: Rratio = Ww + Wp Wp where: Rratio = rehydration ratio Ww = weight of water absorbed, grams; and Wp = initial weight of the sample, grams. Milling Ratio
The milling ratio computes for recovered milled samples over the initial weight of the dried samples milled and represented by the expression:
Statistical Analysis
Response Surface regression (PROCRSREG) of statistical analysis (SAS version 8 software,
1999) was used to conduct the analysis of variance; regression analysis; regression coefficient calculations, and to determine the optimum conditions, generated the contour and surface plots of the drying parameters and responses. A model fitted to the response surface is a function of the parameters expressed as: Yk= fk (drying temperature, air velocity, and number of cuts) The second order polynomial model below evaluated the statistical significance of the independent parameters on the responses expressed as: Yk = βk0+ βk1x1+ βk2x2+ βk3x3+ βk11X1
2 + βk21X2X1+ βk22X2
2+ βk31X3X1+ βk32X3X2+ βk33X3
2 ………………………………………….. Where: β kn= constant regression coefficient; Y= response variable; X1, X2, X3= dependent variables (drying temperature, air velocity, and number of cuts) The effects of the independent parameters considered significant on certain response when the probability > F value are less than 0.05. Analysis of Variance (ANOVA) determined if the drying temperature, air velocity, and number of cuts had significant effects on the response parameters considered. Analyses used 90 and 95 % levels of confidence in considering the independent and response variables as significant. Response surface regression methodology of the Statistica 7 performed analysis and determined the optimum conditions for drying and milling Janitor fish. Curve expert 1.3 analyzed and produced best-fit equation for the Moisture Ratio (MR) among experimental runs. It generated the best fit of the input MR data and the corresponding best equation with the lowest standard error and highest regression coefficient.
tWrateRwave
/=
Drying janitor fish for fish feeds in Laguna Lake
31
RESULTS AND DISCUSSION
Analysis of the Response Variables
Using analysis of variance (ANOVA), the significance of the independent parameters (drying temperature, air velocity and number of cuts) on the dependent variables (final moisture content, drying rate, rehydration rate, rehydration ratio, moisture content and milling ratio) were determined. Table 2 shows the average values of the response variables used in the regression analysis. Initial moisture contents of samples ranged from 60 to 71 % wet basis. Runs 2 and 11 had the lowest initial moisture contents (65.0 and 60.0%, respectively) probably due to longer thawing time of the samples as drying experiments were interrupted by power outage. Figure 2 depicts the appearance of fresh and dried Janitor fish.
Final Moisture Content (FMC)
Run 15 showed the highest final moisture content (FMC) while run 2 showed the lowest at 20.31 and 18.95, respectively. High FMC occurred in run 15 conducted at 60 °C temperature drying temperature and air velocity of 0.24 m s-1. It also had the highest initial moisture content (IMC) at 71% while initial moisture content of Run 2 is
Run Drying
Temperature
(ºC)
Air
Velocity
(m/s)
Number
of cut
IMC,
%
FMC,
%
DR,
%/min
Rrate,
g/min
Rratio MR Milling
ratio
1 50 0.21 2 70.0 19.29 0.02 0.15 1.78 0.47 95.72
2 50 0.27 2 65.0 18.95 0.03 0.11 1.72 0.61 95.98
3 70 0.21 2 70.0 19.65 0.07 0.07 2.35 0.43 96.15
4 70 0.27 2 71.0 19.43 0.06 0.09 1.49 0.42 97.63
5 60 0.21 1 71.0 19.56 0.03 0.13 1.86 0.46 95.26
6 60 0.21 3 70.0 19.12 0.04 0.05 1.89 0.49 96.99
7 60 0.27 1 71.0 19.75 0.04 0.09 1.78 0.46 94.98
8 60 0.27 3 70.0 19.46 0.06 0.11 1.81 0.45 98.13
9 50 0.24 1 70.0 19.82 0.02 0.09 1.83 0.46 94.05
10 70 0.24 1 70.0 19.65 0.07 0.12 1.66 0.50 94.80
11 50 0.24 3 60.0 19.78 0.03 0.07 2.02 0.46 96.63
12 70 0.24 3 70.0 19.22 0.07 0.11 1.81 0.46 96.28
13 60 0.24 2 70.0 19.44 0.05 0.08 1.85 0.45 95.64
14 60 0.24 2 71.0 19.31 0.04 0.19 2.01 0.43 95.53
15 60 0.24 2 70.0 20.31 0.05 0.09 1.96 0.45 95.58
Table 2. Summary of the response variables as affected by the independent variables
Figure 2. Physical appearance of fresh and dried Janitor fish
Fresh Janitor fish
Dried Janitor fish
Journal of Environmental Science and Management Vol. 13. No. 2 (December 2010)
to the drying air thus enhancing rate of moisture evaporation and removal. Similarly, increasing the velocity of the drying air will increase the moisture removal by increasing the rate of moisture pick up by the drying air, but, to certain extent only as too fast a velocity of the drying air will decrease the time of contact of the drying air to the moisture, thereby reducing the drying rate. The rehydration rate (Rrate) of the samples ranged from 0.5 g min-1 to 0.1912 g min-1 with run 3 as the lowest and run 10 as the highest, contradicting with the estimates of drying rates. Run 3 also showed the highest rehydration ratio (Rratio) at 2.35 while run 4 has the lowest at 1.49 g min-1. In addition, Run 4 exhibited the lowest MR of 0.419, while Run 2 showed the highest. The temperature significantly affects drying rate at 95% level of confidence (Table 3). This proves that the capacity of air to absorb moisture increased by rising the temperature as Madamba et al (1996) observed. Linear terms of regression analysis (Table 4) also contributed to the average drying rate of the model at 99% level of confidence. Coefficient of determination also showed that 95% of the drying rate variation is explainable by the model. The effects of drying temperature, air velocity, and number of cuts on average drying rates and
32
only at 65%. On the other hand, run 11 showed third to the highest FMC despite the low initial moisture content (60%) and low drying temperature (50 °C). Variations in FMC occurred among trials due to the variations in relative humidities of the drying air because of varying humidities of the ambient air at the end of drying experiments.
Drying Rate (DR)
Drying of perishable product involves exposing the product to heated air, which will lead to evaporation of the moisture in the product and then the moisture’s removal away from the product (Shaffer 1999). The average drying rate (DR) ranged from 0.02% per minute to 0.07% per minute with Run 1 as the lowest and Run 3 as the highest (Table
2). Run 3 dried the fastest at 70 °C, 0.21 m s-1 air velocity and 2 cuts. Drying rates increased with increasing temperature, air velocity, and number of cuts (Figure 3) as exhibited by runs 3, 10 and 12, respectively. As expected, increasing the drying temperatures and number of cuts of Janitor flesh will increase the rate of moisture movement from within the flesh due to increase rate of moisture evaporation. Increasing the number of cuts in the flesh will increase the areas exposed
Figure 3. Drying rates at different drying runs.
Drying janitor fish for fish feeds in Laguna Lake
33
Parameters
Sum of squares
Final
moisture
content
Average
drying
rate
Rehydration
rate
Rehydration
ratio
Moisture
ratio
Milling Ratio
Temperature 0.084n.s. 0.003805* 0.001190 n.s. 0.044577n.s. 0.012911n.s 1.463404 n.s.
Air velocity 0.241648n.s. 0.000204n.s. 0.003409 n.s. 0.080151 n.s. 0.008786n.s 4.374643**
Number of slices 0.228614n.s. 0.000459n.s. 0.004506 n.s. 0.007842 n.s. 0.000843n.s 10.824752**
Table 3. The ANOVA for the effect of the drying parameters on the response variables.
* Significant at 95% confidence level ** Significant at 99% confidence level n.s. Not significant
Journal of Environmental Science and Management Vol. 13. No. 2 (December 2010)
Source
Degrees
of
freedom
Sum of squares
Final
moisture
content
(%)
Drying rate (%/min)
Rehydration
rate (g/min) Rehydration
ratio (g/
min)
Moisture
ratio Milling
Ratio
Linear 3 0.181625n.s. 0.004171** 0.001230 n.s. 0.164794n.s. 0.0059 n.s. 11.592810**
Quadratic 3 0.27454 n.s. 0.00007105n.s. 0.001404 n.s. 0.027534n.s. 0.0025 n.s. 2.785753*
Cross product
3 0.04725 n.s. 0.000112 n.s. 0.003154 n.s. 0.166864n.s. 0.0069 n.s. 1.187923 n.s.
Model 9 0.50341 n.s. 0.004354** 0.005788 n.s. 0.359192n.s. 0.0153 n.s. 15.566486**
R2 0.3228 0.9531 0.3371 0.6887 0.5418 0.9663
CV (%) 2.3552 14.7682 45.8301 9.7172 10.9171 0.3434
Table 4. The ANOVA showing the independent parameters as linear, quadratic, cross product and model terms on each of the responses.
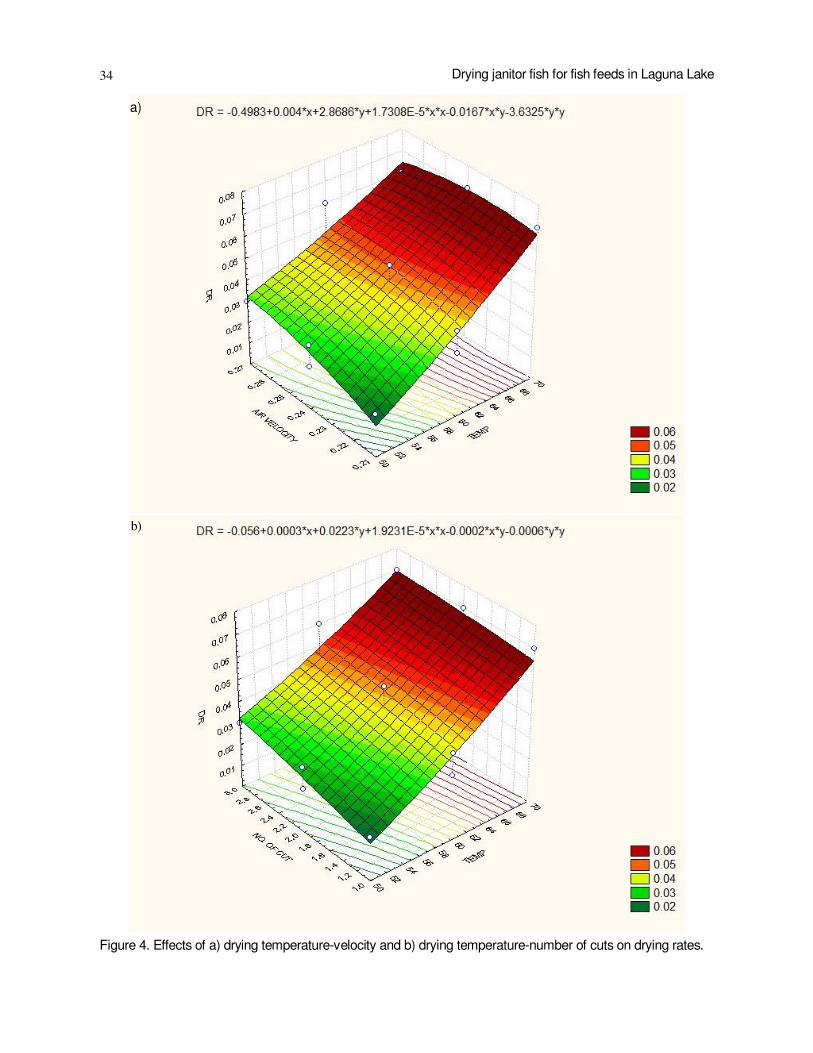
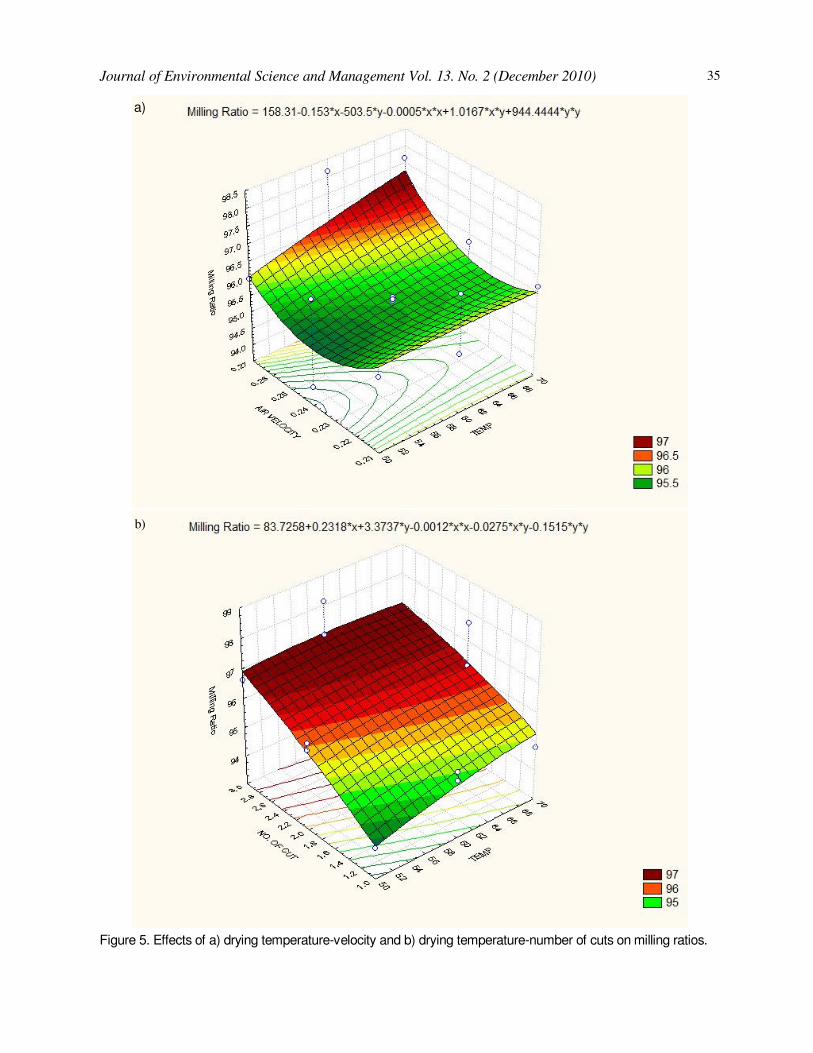
milling ratios are depicted in Figures 4 and 5, respectively. Higher response values are observed when using high values of independent variables tested, at 70 oC, 0.27 m s-1 air velocity, and 3 cuts of Janitor flesh. Increasing the drying air temperature, air velocity, and number of cuts resulted in increased drying rates and milling ratios as similarly discussed by Surigao 2006. However, air velocity and number of cuts did not significantly affect drying rate (DR) probably due to the small increment of the air velocities and minimal surface area exposed in each cut. Response surface regression model equations adequately described the drying rates and milling ratios but not the final moisture contents, rehydration rates, rehydration ratios, and moisture ratios (Table 4). Noticeable is the fact that the sample has very thick scales hindering the moisture travel once it reached the surface and penetration of drying air into the fleshy to evaporate moisture resulting in variations in the final moisture contents (FMC), similarly exhibited by the data on rehydration ratio, rehydration rate, and moisture ratio. Figures
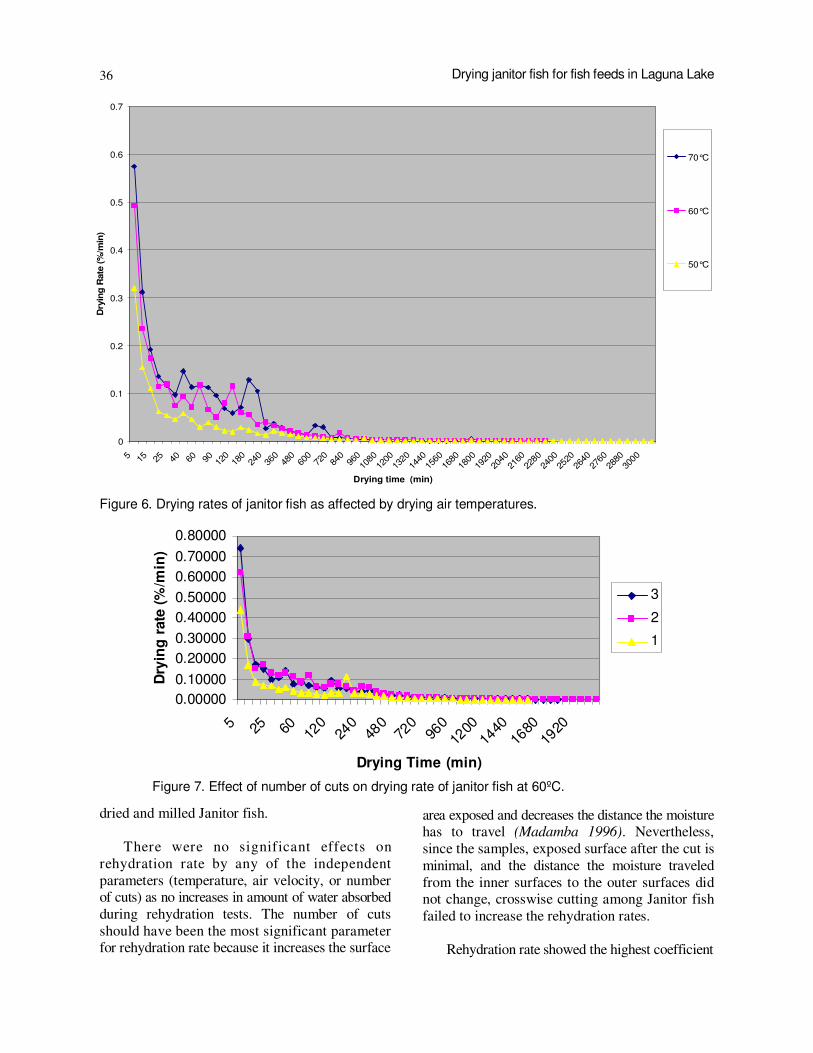
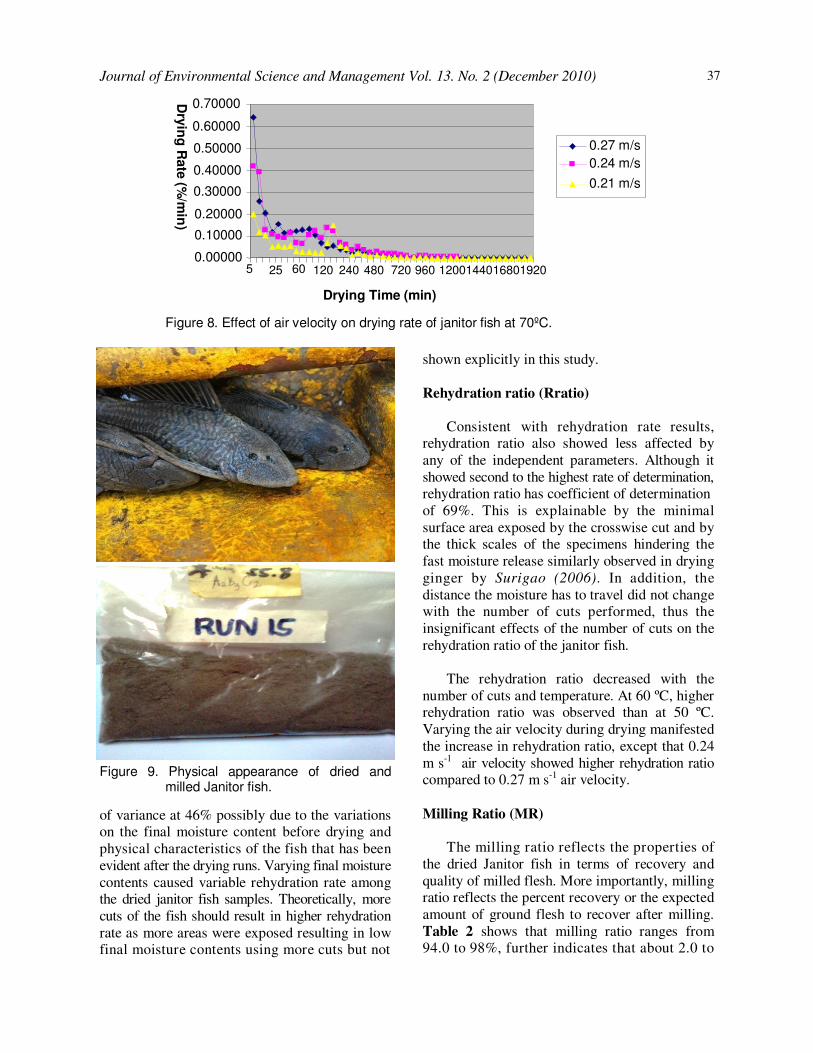
6 to 8 show the effects of independent parameters
in the entire experiments on the drying rates of janitor fish. Clearly, higher drying temperatures, higher air velocities, and more cuts of flesh shortened the drying time due to increased moisture evaporation among samples.
Rehydration Rate (Rrate)
Rehydration rate is the ability of any dried product to absorb water. It signifies the critical moisture level required to promote microbial growth leading to deterioration (Otara 2000 as
cited by Ramos 2000). In order for a product to rehydrate efficiently, there should be very small air spaces left by water molecules. Additional spaces must exist to serve as venue for the water absorbed during rehydration (Candelaria 1991
as cited by Otara 2000). If the drying conditions were carefully controlled, the rehydrated product yields a fair texture. However, rehydrated product usually does not fully regain their initial size in compare to its original size. It is due to shrinkage, distortion of cells and capillaries chemical or physico-chemical at the colloidal level (Liboon
1999). Figure 9 illustrates the appearance of
34 Drying janitor fish for fish feeds in Laguna Lake
Figure 4. Effects of a) drying temperature-velocity and b) drying temperature-number of cuts on drying rates.
a)
b)
Journal of Environmental Science and Management Vol. 13. No. 2 (December 2010)
Figure 5. Effects of a) drying temperature-velocity and b) drying temperature-number of cuts on milling ratios.
35
a)
b)
36 Drying janitor fish for fish feeds in Laguna Lake
dried and milled Janitor fish. There were no significant effects on rehydration rate by any of the independent parameters (temperature, air velocity, or number of cuts) as no increases in amount of water absorbed during rehydration tests. The number of cuts should have been the most significant parameter for rehydration rate because it increases the surface
area exposed and decreases the distance the moisture has to travel (Madamba 1996). Nevertheless, since the samples, exposed surface after the cut is minimal, and the distance the moisture traveled from the inner surfaces to the outer surfaces did not change, crosswise cutting among Janitor fish failed to increase the rehydration rates. Rehydration rate showed the highest coefficient
0
0.1
0.2
0.3
0.4
0.5
0.6
0.7
5 15 25 40 60 90 120
180
240
360
480
600
720
840
960
1080
1200
1320
1440
1560
1680
1800
1920
2040
2160
2280
2400
2520
2640
2760
2880
3000
Drying time (min)
Dry
ing
Rate
(%
/min
)
70°C
60°C
50°C
Figure 6. Drying rates of janitor fish as affected by drying air temperatures.
0.00000
0.10000
0.20000
0.30000
0.40000
0.50000
0.60000
0.70000
0.80000
5 25 60 120
240
480
720
960
1200
1440
1680
1920
Drying Time (min)
Dry
ing
rate
(%
/min
)
3
2
1
Figure 7. Effect of number of cuts on drying rate of janitor fish at 60ºC.
shown explicitly in this study.
Rehydration ratio (Rratio)
Consistent with rehydration rate results, rehydration ratio also showed less affected by any of the independent parameters. Although it showed second to the highest rate of determination, rehydration ratio has coefficient of determination of 69%. This is explainable by the minimal surface area exposed by the crosswise cut and by the thick scales of the specimens hindering the fast moisture release similarly observed in drying ginger by Surigao (2006). In addition, the distance the moisture has to travel did not change with the number of cuts performed, thus the insignificant effects of the number of cuts on the rehydration ratio of the janitor fish. The rehydration ratio decreased with the number of cuts and temperature. At 60 ºC, higher rehydration ratio was observed than at 50 ºC. Varying the air velocity during drying manifested the increase in rehydration ratio, except that 0.24 m s-1 air velocity showed higher rehydration ratio compared to 0.27 m s-1 air velocity.
Milling Ratio (MR) The milling ratio reflects the properties of the dried Janitor fish in terms of recovery and quality of milled flesh. More importantly, milling ratio reflects the percent recovery or the expected amount of ground flesh to recover after milling. Table 2 shows that milling ratio ranges from 94.0 to 98%, further indicates that about 2.0 to
37
of variance at 46% possibly due to the variations on the final moisture content before drying and physical characteristics of the fish that has been evident after the drying runs. Varying final moisture contents caused variable rehydration rate among the dried janitor fish samples. Theoretically, more cuts of the fish should result in higher rehydration rate as more areas were exposed resulting in low final moisture contents using more cuts but not
Journal of Environmental Science and Management Vol. 13. No. 2 (December 2010)
0.00000
0.10000
0.20000
0.30000
0.40000
Dry
ing
Rate
(%/m
in)
0.50000
0.60000
0.70000
0.27 m/s
0.24 m/s
0.21 m/s
Drying Time (min)
1920 1680 1440 1200 960 720 480 240 120 60 25 5
Figure 8. Effect of air velocity on drying rate of janitor fish at 70ºC.
Figure 9. Physical appearance of dried and milled Janitor fish.
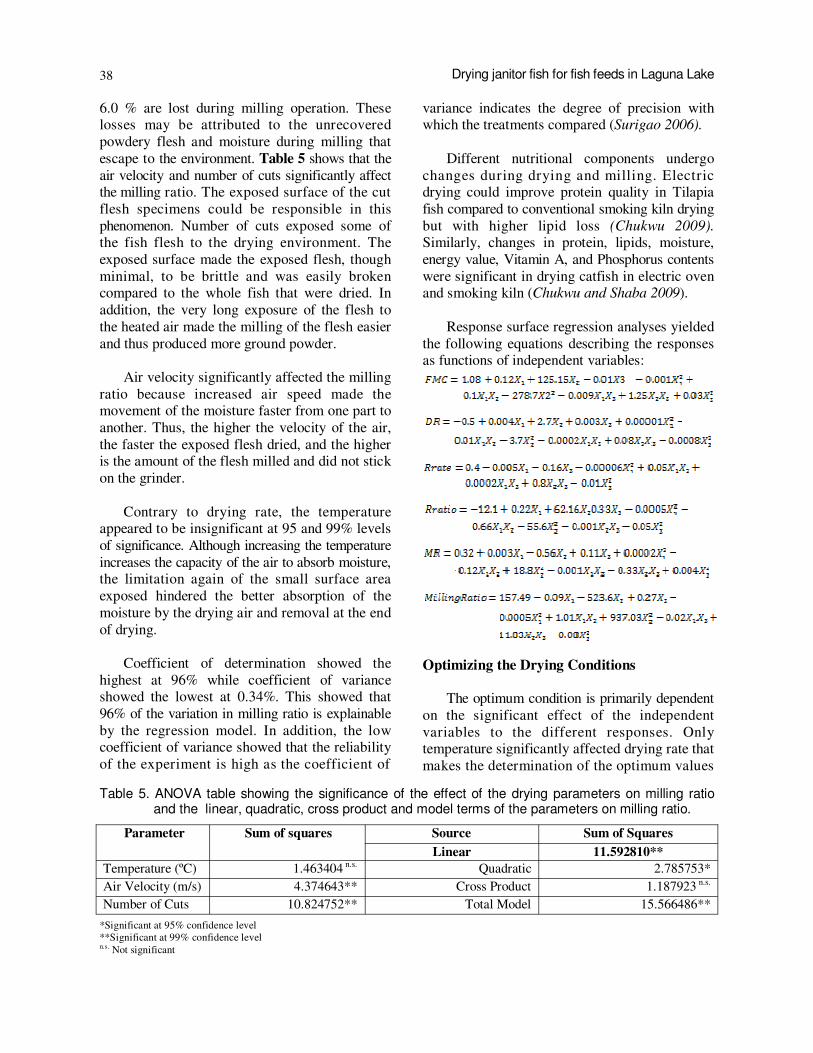
38
6.0 % are lost during milling operation. These losses may be attributed to the unrecovered powdery flesh and moisture during milling that escape to the environment. Table 5 shows that the air velocity and number of cuts significantly affect the milling ratio. The exposed surface of the cut flesh specimens could be responsible in this phenomenon. Number of cuts exposed some of the fish flesh to the drying environment. The exposed surface made the exposed flesh, though minimal, to be brittle and was easily broken compared to the whole fish that were dried. In addition, the very long exposure of the flesh to the heated air made the milling of the flesh easier and thus produced more ground powder. Air velocity significantly affected the milling ratio because increased air speed made the movement of the moisture faster from one part to another. Thus, the higher the velocity of the air, the faster the exposed flesh dried, and the higher is the amount of the flesh milled and did not stick on the grinder. Contrary to drying rate, the temperature appeared to be insignificant at 95 and 99% levels of significance. Although increasing the temperature increases the capacity of the air to absorb moisture, the limitation again of the small surface area exposed hindered the better absorption of the moisture by the drying air and removal at the end of drying. Coefficient of determination showed the highest at 96% while coefficient of variance showed the lowest at 0.34%. This showed that 96% of the variation in milling ratio is explainable by the regression model. In addition, the low coefficient of variance showed that the reliability of the experiment is high as the coefficient of
variance indicates the degree of precision with which the treatments compared (Surigao 2006).
Different nutritional components undergo changes during drying and milling. Electric drying could improve protein quality in Tilapia fish compared to conventional smoking kiln drying but with higher lipid loss (Chukwu 2009). Similarly, changes in protein, lipids, moisture, energy value, Vitamin A, and Phosphorus contents were significant in drying catfish in electric oven and smoking kiln (Chukwu and Shaba 2009). Response surface regression analyses yielded the following equations describing the responses as functions of independent variables:
Optimizing the Drying Conditions
The optimum condition is primarily dependent on the significant effect of the independent variables to the different responses. Only temperature significantly affected drying rate that makes the determination of the optimum values
Drying janitor fish for fish feeds in Laguna Lake
Parameter Sum of squares Source Sum of Squares
Linear 11.592810**
Temperature (ºC) 1.463404 n.s. Quadratic 2.785753*
Air Velocity (m/s) 4.374643** Cross Product 1.187923 n.s.
Number of Cuts 10.824752** Total Model 15.566486**
Table 5. ANOVA table showing the significance of the effect of the drying parameters on milling ratio and the linear, quadratic, cross product and model terms of the parameters on milling ratio.
*Significant at 95% confidence level **Significant at 99% confidence level n.s. Not significant
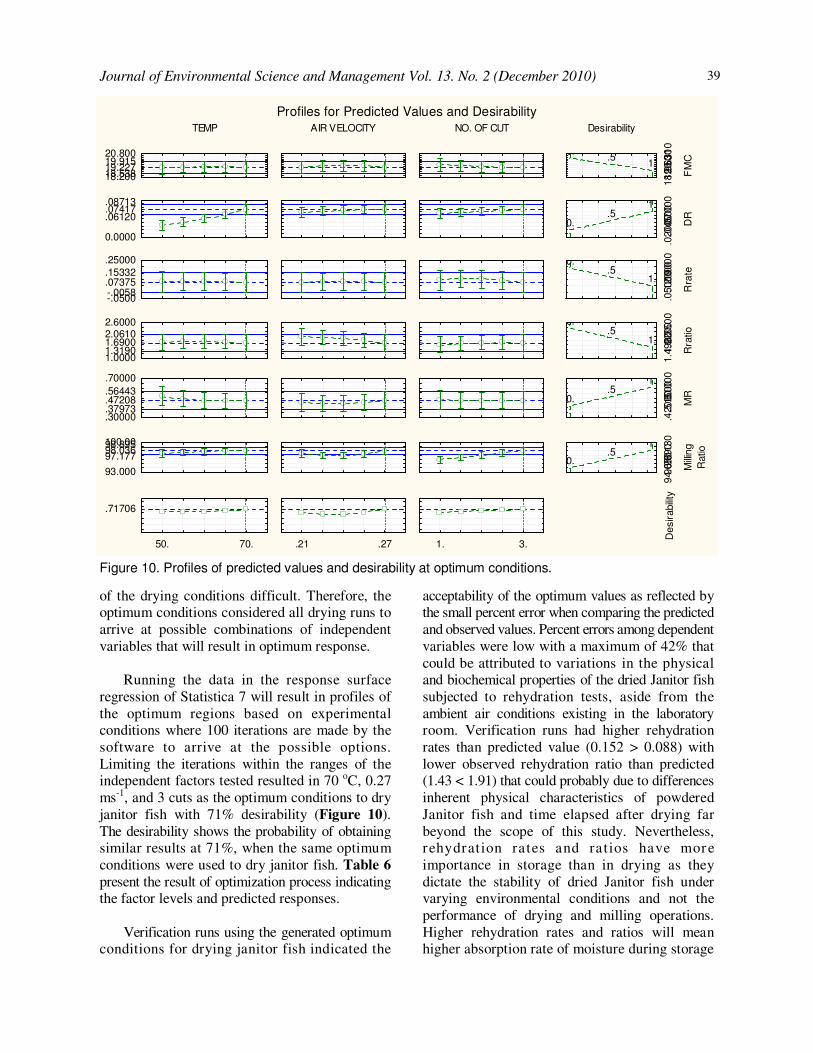
of the drying conditions difficult. Therefore, the optimum conditions considered all drying runs to arrive at possible combinations of independent variables that will result in optimum response. Running the data in the response surface regression of Statistica 7 will result in profiles of the optimum regions based on experimental conditions where 100 iterations are made by the software to arrive at the possible options. Limiting the iterations within the ranges of the independent factors tested resulted in 70 oC, 0.27 ms-1, and 3 cuts as the optimum conditions to dry janitor fish with 71% desirability (Figure 10). The desirability shows the probability of obtaining similar results at 71%, when the same optimum conditions were used to dry janitor fish. Table 6
present the result of optimization process indicating the factor levels and predicted responses. Verification runs using the generated optimum conditions for drying janitor fish indicated the
acceptability of the optimum values as reflected by the small percent error when comparing the predicted and observed values. Percent errors among dependent variables were low with a maximum of 42% that could be attributed to variations in the physical and biochemical properties of the dried Janitor fish subjected to rehydration tests, aside from the ambient air conditions existing in the laboratory room. Verification runs had higher rehydration rates than predicted value (0.152 > 0.088) with lower observed rehydration ratio than predicted (1.43 < 1.91) that could probably due to differences inherent physical characteristics of powdered Janitor fish and time elapsed after drying far beyond the scope of this study. Nevertheless, rehydration rates and ratios have more importance in storage than in drying as they dictate the stability of dried Janitor fish under varying environmental conditions and not the performance of drying and milling operations. Higher rehydration rates and ratios will mean higher absorption rate of moisture during storage
39 Journal of Environmental Science and Management Vol. 13. No. 2 (December 2010)
Profiles for Predicted Values and Desirability
TEMP
18.20018.53819.22719.91520.800
AIR VELOCITY NO. OF CUT Desirability
1..5
0.
18
.950
19
.630
20
.31
0
FM
C
0.0000
.06120
.07417
.08713
0..5
1.
.02
00
0.0
450
0.0
70
00
DR
-.0500-.0058.07375.15332
.25000
1..5
0.
.050
00
.120
00
.1900
0
Rra
te
1.00001.31901.69002.06102.6000
1..5
0.
1.4
900
1.9
200
2.3
50
0
Rra
tio
.30000
.37973
.47208
.56443
.70000
0..5
1.
.420
00
.515
00
.610
00
MR
93.000
97.17798.03698.895100.00
0..5
1.
94.0
50
96.0
90
98.1
30
Millin
g
Ratio
50. 70.
.71706
.21 .27 1. 3.
De
sir
abili
ty
Figure 10. Profiles of predicted values and desirability at optimum conditions.
40
that will easily result in microbial deterioration. Table 7 expresses the observed responses during the verification runs and predicted response values at optimum conditions. Hence, the results of the verification runs validate the established optimum drying conditions of 70 oC drying temperature, 0.27 m s-1 drying air velocity, and 3 cuts of Janitor flesh.
Moisture Ratio (MR) Modeling
Moisture Ratio corresponds to the proportion
of the moisture being removed at a given time interval in drying. Thus, using moisture ratio to determine which of the 15 runs exhibited the least error and highest regression coefficient will most likely show the best fitting curve to describe the drying model of Janitor fish. Table 8 shows the summary of the models generated by Curve Expert 1.4 that conducts iterative regression on the data to arrive at appropriate model equation, the standard error, and the regression coefficients. Run 11 showed the highest determination of 99.98% and the lowest
Drying janitor fish for fish feeds in Laguna Lake
Factor Factor
level
Predicted
FMC
Predicted
DR
Predicted
Rrate
Predicted
Rratio
Predicted MR
Predicted Milling
ratio
Desirability
Temp, oC 50.0 19.19917 0.031667 0.081250 1.700000 0.519583 97.41583 0.603640
Temp, oC 55.0 19.28542 0.041042 0.084062 1.738750 0.491146 97.61333 0.618100
Temp, oC 60.0 19.31875 0.051250 0.083750 1.750000 0.473750 97.78250 0.629831
Temp, oC 65.0 19.29917 0.062292 0.080312 1.733750 0.467396 97.92333 0.661232
Temp, oC 70.0 19.22667 0.074167 0.073750 1.690000 0.472083 98.03583 0.717061
Air velocity, m s-1
0.21 19.23417 0.066667 0.073750 1.960000 0.449583 97.38583 0.572996
Air velocity, m s-1
0.225 19.42042 0.071042 0.080312 1.930000 0.442396 96.91583 0.524089
Air velocity, m s-1
0.24 19.48125 0.073750 0.082500 1.875000 0.443750 96.86750 0.530574
Air velocity, m s-1
0.255 19.41667 0.074792 0.080313 1.795000 0.453646 97.24083 0.598577
Air velocity, m s-1
0.27 19.22667 0.074167 0.073750 1.690000 0.472083 98.03583 0.717061
No. of cuts 1.0 19.52667 0.064167 0.096250 1.590000 0.477083 95.80083 0.581887
No. of cuts 1.5 19.42417 0.067292 0.102812 1.656250 0.472396 96.42458 0.606301
No. of cuts 2.0 19.34000 0.070000 0.101250 1.695000 0.470000 97.00500 0.635119
No. of cuts 2.5 19.27417 0.072292 0.091562 1.706250 0.469896 97.54208 0.669560
No. of cuts 3.0 19.22667 0.074167 0.073750 1.690000 0.472083 98.03583 0.717061
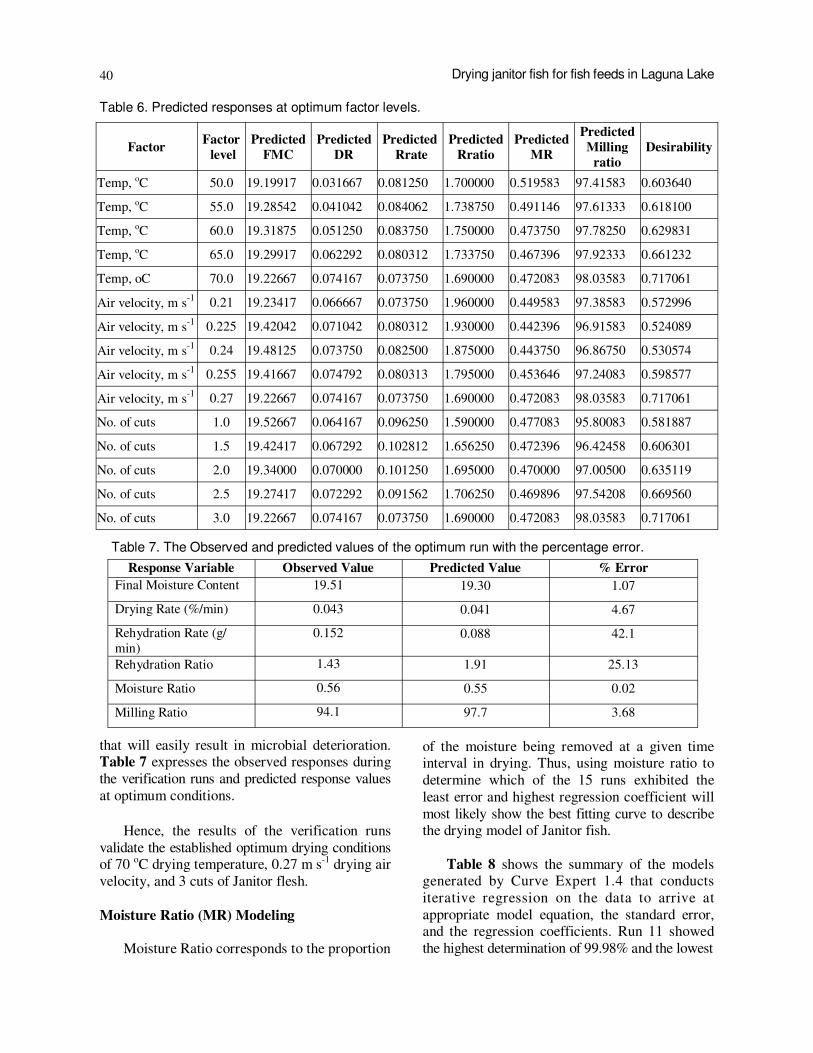
Table 6. Predicted responses at optimum factor levels.
Response Variable Observed Value Predicted Value % Error
Final Moisture Content 19.51 19.30 1.07
Drying Rate (%/min) 0.043 0.041 4.67
Rehydration Rate (g/min)
0.152 0.088 42.1
Rehydration Ratio 1.43 1.91 25.13
Moisture Ratio 0.56 0.55 0.02
Milling Ratio 94.1 97.7 3.68
Table 7. The Observed and predicted values of the optimum run with the percentage error.
41
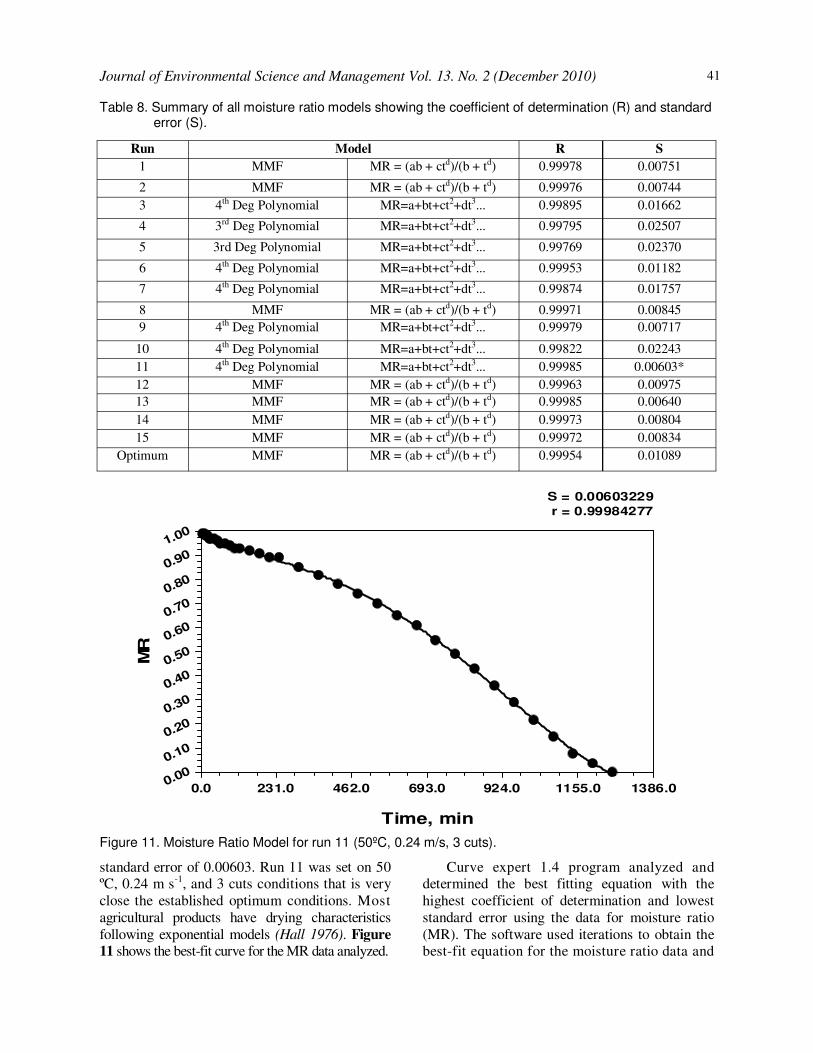
standard error of 0.00603. Run 11 was set on 50 ºC, 0.24 m s-1, and 3 cuts conditions that is very close the established optimum conditions. Most agricultural products have drying characteristics following exponential models (Hall 1976). Figure
11 shows the best-fit curve for the MR data analyzed.
Curve expert 1.4 program analyzed and determined the best fitting equation with the highest coefficient of determination and lowest standard error using the data for moisture ratio (MR). The software used iterations to obtain the best-fit equation for the moisture ratio data and
Journal of Environmental Science and Management Vol. 13. No. 2 (December 2010)
Run Model R S
1 MMF MR = (ab + ctd)/(b + td) 0.99978 0.00751
2 MMF MR = (ab + ctd)/(b + td) 0.99976 0.00744
3 4th Deg Polynomial MR=a+bt+ct2+dt3... 0.99895 0.01662
4 3rd Deg Polynomial MR=a+bt+ct2+dt3... 0.99795 0.02507
5 3rd Deg Polynomial MR=a+bt+ct2+dt3... 0.99769 0.02370
6 4th Deg Polynomial MR=a+bt+ct2+dt3... 0.99953 0.01182
7 4th Deg Polynomial MR=a+bt+ct2+dt3... 0.99874 0.01757
8 MMF MR = (ab + ctd)/(b + td) 0.99971 0.00845
9 4th Deg Polynomial MR=a+bt+ct2+dt3... 0.99979 0.00717
10 4th Deg Polynomial MR=a+bt+ct2+dt3... 0.99822 0.02243
11 4th Deg Polynomial MR=a+bt+ct2+dt3... 0.99985 0.00603*
12 MMF MR = (ab + ctd)/(b + td) 0.99963 0.00975
13 MMF MR = (ab + ctd)/(b + td) 0.99985 0.00640
14 MMF MR = (ab + ctd)/(b + td) 0.99973 0.00804
15 MMF MR = (ab + ctd)/(b + td) 0.99972 0.00834
Optimum MMF MR = (ab + ctd)/(b + td) 0.99954 0.01089
Table 8. Summary of all moisture ratio models showing the coefficient of determination (R) and standard error (S).
S = 0.00603229
r = 0.99984277
Time, min
MR
0.0 231.0 462.0 693.0 924.0 1155.0 1386.00.00
0.10
0.20
0.30
0.40
0.50
0.60
0.70
0.80
0.90
1.00
Figure 11. Moisture Ratio Model for run 11 (50ºC, 0.24 m/s, 3 cuts).
42 Drying janitor fish for fish feeds in Laguna Lake
displayed the top ten equations. Run 11 shows the highest coefficient of determination and the lowest standard error. Thus, Moisture Ratio 4th degree polynomial expression can describe the drying characteristic of Janitor fish in the form: MR=0.99-0.0006x + 9.018x2—1.88e –099 x3 +8.28e-013 x4
where: MR = moisture Ratio, dimensionless; and t = drying time, minutes An expression that describes the relationship of moisture content at any time, t.
SUMMARY AND CONCLUSION
Response surface regression methodology (RSM) aided by Box and Behnken design matrix determined the optimum conditions in drying of the Janitor fish (Pterygoplichthys disjunctivus). The independent parameters tested consisted of temperatures (50, 60, 70 0C), air velocity (0.21, 0.24, 0.27 m s-1) and number of cuts (1, 2, 3). The dependent parameters comprised of drying rate, final moisture content wet basis, rehydration rate, rehydration ratio, and moisture ratio. Response Surface Methodology (PROC RSReg) of Statistical Analysis System (SAS version 8.1) performed the Analysis of Variance (ANOVA). Statistical analysis and superimposition of contour plots resulted in plots showing the common areas of interests, considered as optimum conditions within the bounds of independent variables tested in the experiments. The results showed that temperature significantly increased the drying rate at 95% confidence level. Linear term of regression analysis also contributed to the average drying rate model at 99% confidence level. Analysis using response surface regression methodology of Statistica 7 resulted in optimum conditions of 70 oC drying air temperature, 0.27 ms-1 drying air velocity, and 3 cuts of janitor fish. Comparing the generated optimum values with the actual values gathered from the optimum condition verification runs resulted in comparable values with low percentage error. Moisture ratio showed as the best-drying model
for janitor fish as observed in run 11, MR=0.99-0.0006x + 9.018x2—1.88e –099 x3 +8.28e-013 x4
indicated a coefficient of determination at 99.98% and a standard error of 0.61%. This is highly acceptable as most agricultural research studies have errors more than 10% due to variations in physical, chemical, and other basic properties of material samples. Air velocity increased milling ratio at 99% confidence level with drying air temperature affecting the results of experiments at 90% level of significance. The latter is mainly due to the minimal increase in air velocity, minimal exposed surface area and the prolonged exposure of this area make them more brittle than those, which were not. Temperature significantly affected drying rates because the of hard scales of the specimen lessening the amount of moisture absorbed by the air regardless of the increase in the capacity of the air to hold moisture. High recovery after milling can result ranging from 90% and up that offers potential for making the fish as feed ingredients. Thus, harvesting, drying, and milling for feeds can eliminate the pollution potentials of the janitor fish.
RECOMMENDATIONS
The experiment showed that the number of cuts has been insignificant on all the independent parameters set, must consider using lengthwise cut instead of crosswise to expose more surface area and have faster drying time. Janitor fish also contains a significant amount of oil removed during drying run and considered in assessing the loss of moisture during the experiment. Boiling the janitor fish prior to drying might produce good results due to the removal of some fats and oils that hinder moisture transfer from the meat flesh to the drying air. Furthermore, the drying time, takes almost two days to complete one dry run, hence, higher temperatures and higher air velocities are worth examining in future studies. Finally, future studies must consider proximate analysis of janitor fish to determine the nutritional
43
values and feasibility of the dried materials for animal feeds.
REFERENCES
Armbruster, J.W. Ancistrus (Kner, 1854). http://
www.auburn.edu/academic/science_math/r es_a r ea / l or i car i i d / f i sh _ke y/ An ci s t r us /ancistrus.html. 4 November 2009
Brooker, D. B., F.W., Bakker-Arkema and C.W. Hall.
1974. Drying Cereal Grains. AV1 Publishing Co., Westport, Connecticut.
Chavez, Joel M.; de la Paz, R. M.; Manohar, S. K.;
Pagulayan, R. C.; and J. R. V. Carandang. 2006. “New Philippine record of South American sail fin catfishes (Pisces: Loricariidae” Zootaxa I
109:57-68 Chukwu, O. 2009. “Influences of Drying Methods on
Nutritional Properties of Tilapia Fish (Oreochromis nilotieus)”. World Journal of
Agricultural Sciences 5 (2): 256-258, 2009
Chukwu, O. and I. M. Shaba. 2009. “Effects of Drying
Methods on Proximate Compositions of Catfish (Clarias gariepinus)”. World Journal of
Agricultural Sciences 5 (1): 114-116, 2009
Hall, C. W. 1976. Drying Farm Crops. AV1 Publishing Co., Westport, Connecticut.
Liboon, F.A. 1999. Optimization of the Vacuum
Dehydration of Celery (Apium Gravolens) Using
the Response Surface Methodology. BS Thesis, UP Los Baños.
Madamba, P. S, Driscoll, RH, & K. A. Buckle. 1996.
“The Thin-Layer Drying Characteristics of Garlic Slices”. Journal of Food Engineering
Manila Bulletin. “Marikina ‘Clears’ River of Janitor
Fish”. Jefferson Antiporda. February 22, 2005 Manila Bulletin. “New Use for Janitor Fish: bones as
Water Purifier”. July 20, 2005. Manila Bulletin. “Pesky Janitors Offers Hope”.
Elizabeth C. Zambarrano. March 26, 2006 Otara, L.O. 2000. Moisture Desorption Isotherms and
Optimization of the Drying of Ginger (Zingiber officinale, Roscoe). Unpublished BS Thesis, UP Los Baños
Philippine Daily Enquirer. “Janitor fish Disaster is Failure of DENR”. Editorial Opinion. Rene Lacanilao. June 8, 2004
Philippine Daily Enquirer. “Janitor Fish proving to be
too clean for Laguna de Bay”. Volt Contreras. July 20, 2004.
Philippine Star. “Fish Infestation Threatens Largest
Marshland in Asia”. Josephine Roque. June 5, 2005
Ramos, C.I.S. 2000. Optimization of the Heated Air
Drying of “Saba” Banana (Musa Sepientum L.
var. Compressa Blanco). BS Thesis, UP Los Baños. Sabaj, M.H., J.W. Armbruster, and L.M. Page. 1999.
“Spawning in Ancistrus with comments on the evolution of snout tentacles as a novel reproductive strategy: larval mimicry. Ichthyological Exploration of Freshwaters”. http://www.auburn.edu/academic/science_math/res_area/loricariid/fish_key/Ancistrus/ancistrus.html. 4 November 2009
Shaffer, M. 1999. “Food Drying”. Backwoods Home
Magazine. Surigao, R. P. 2006. Milling and Quality Evaluation of
the Thin-Layer Dried Ginger Slices. Unpublished undergraduate thesis, CEAT, UP Los Baños, Col-lege, Laguna
http://web.worldbank.org/wBSITE/EXTERNAL/
O P P O T U N I T I E S / G R A N T S /DEVMARKETPLACE. Accessed November 2009
www.abs-cbnnews.com/images/new/microsite/
kpower/kp01172004janitor fish.htm. Accessed June 2009
www.answers.com/topic/pterygoplichtys. Accessed
June 2009 www.aquariacentral.com/fishinfo/fresh/pleco.html.
Accessed June 2009 www.auburn.edu/academic/science_math/res_area/
liricariidae/fish_key. Accessed June 2009 w w w . e n . w i k i p e d i a . o r g / w i k i /
hypostomus_plecostomus. Accessed June 2009 www.nas.er .usgs.gov/quer ies/ Factsheet .asp?
speciesID. Accessed June 2009
Journal of Environmental Science and Management Vol. 13. No. 2 (December 2010)