janney weekly bank & thrift newsletter library/bank and thrift newsletter... · janney weekly...
TRANSCRIPT

JANUARY 30, 2017
JANNEY MONTGOMERY SCOTT INVESTMENT BANKING
Janney Weekly Bank & Thrift Newsletter

2
Table of Contents
1. Janney Daily Fix
2. Janney Muni Monthly
3. Bank, Thrift & MHC Summary Valuation
4. Recent Bank M&A Transactions
5. Relevant Janney Capital Markets Professionals

1.) Janney Daily Fix


2.) Janney Muni Monthly
MUNICIPAL MONTHLY • PAGE 1
JANNEY MONTGOMERY SCOTT
www.janney.com
© 2017 Janney Montgomery Scott LLC
Member: NYSE, FINRA, SIPC
See page 14 for important information regarding certifications, our ratings system as well as other disclaimers.
CONTENTS PAGE
MARKET COMMENT 1
HEALTHCARE SECTOR 2
STATE & LOCAL GOVT SECTOR 4
TOLL ROAD SECTOR 6
AIRPORT SECTOR 8
PUBLIC POWER SECTOR 9
HIGHER EDUCATION SECTOR 10
WATER & SEWER SECTOR 11
RATING CHANGES 12
DATA 13
AlAn SchAnkel
Managing DirectorMunicipal Strategist [email protected] 215.665.6088
eric kAzAtSky
DirectorMunicipal Credit Analyst [email protected] 215.665.4422
JA n n e y Mu n i Mo n t h ly
Se c t o r re v i e w
Fi x e d in c o M e St r At e g y
JA n u A ry 24, 2017
One recent and encouraging change in municipal market fundamentals is the reversal
of fund flows after a sharp ten week burst of selling.
Source: Janney Fixed Income Strategy, Investment Company Institute
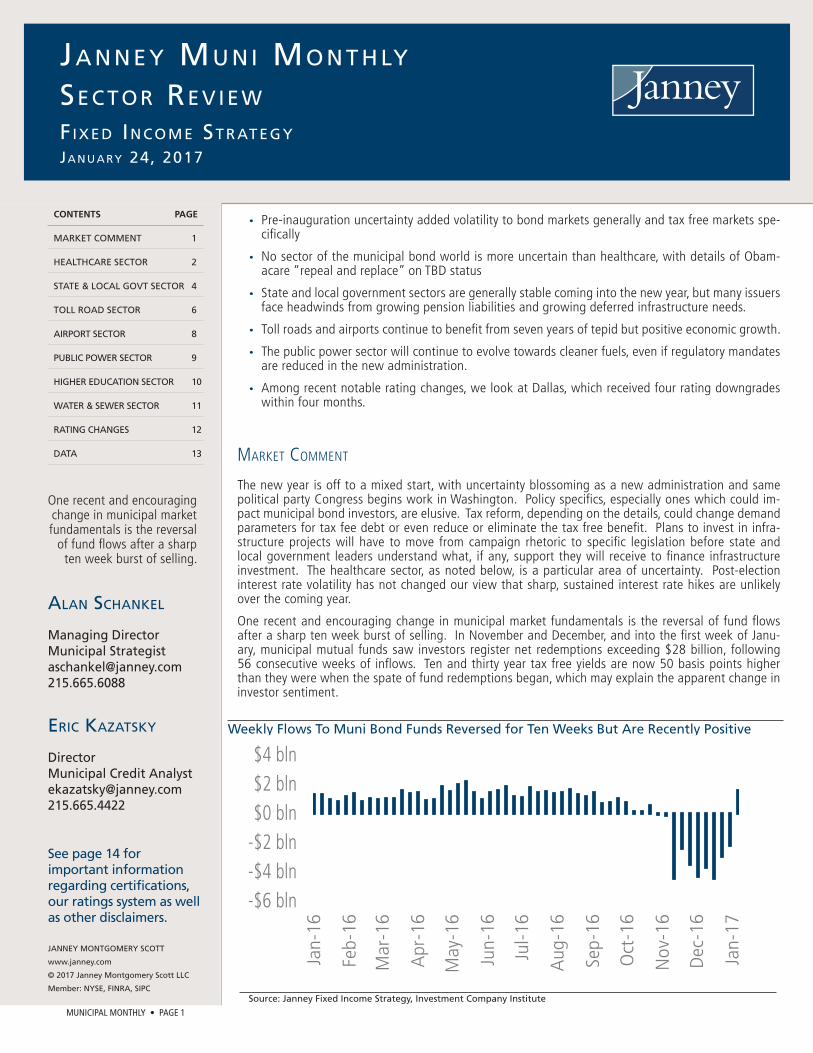
Weekly Flows To Muni Bond Funds Reversed for Ten Weeks But Are Recently Positive
• Pre-inauguration uncertainty added volatility to bond markets generally and tax free markets spe-cifically
• No sector of the municipal bond world is more uncertain than healthcare, with details of Obam-acare “repeal and replace” on TBD status
• State and local government sectors are generally stable coming into the new year, but many issuers face headwinds from growing pension liabilities and growing deferred infrastructure needs.
• Toll roads and airports continue to benefit from seven years of tepid but positive economic growth.
• The public power sector will continue to evolve towards cleaner fuels, even if regulatory mandates are reduced in the new administration.
• Among recent notable rating changes, we look at Dallas, which received four rating downgrades within four months.
Market CoMMent
The new year is off to a mixed start, with uncertainty blossoming as a new administration and same political party Congress begins work in Washington. Policy specifics, especially ones which could im-pact municipal bond investors, are elusive. Tax reform, depending on the details, could change demand parameters for tax fee debt or even reduce or eliminate the tax free benefit. Plans to invest in infra-structure projects will have to move from campaign rhetoric to specific legislation before state and local government leaders understand what, if any, support they will receive to finance infrastructure investment. The healthcare sector, as noted below, is a particular area of uncertainty. Post-election interest rate volatility has not changed our view that sharp, sustained interest rate hikes are unlikely over the coming year.
One recent and encouraging change in municipal market fundamentals is the reversal of fund flows after a sharp ten week burst of selling. In November and December, and into the first week of Janu-ary, municipal mutual funds saw investors register net redemptions exceeding $28 billion, following 56 consecutive weeks of inflows. Ten and thirty year tax free yields are now 50 basis points higher than they were when the spate of fund redemptions began, which may explain the apparent change in investor sentiment.
-$6 bln-$4 bln-$2 bln$0 bln$2 bln$4 bln
Jan-
16
Feb-
16
Mar
-16
Apr
-16
May
-16
Jun-
16
Jul-1
6
Aug
-16
Sep-
16
Oct
-16
Nov
-16
Dec
-16
Jan-
17

MUNICIPAL MONTHLY • PAGE 2
JANNEY MONTGOMERY SCOTT
www.janney.com
© 2017 Janney Montgomery Scott LLC
Member: NYSE, FINRA, SIPC
Mu n i c i pA l Bo n d MA r k e t Mo n t h lyJA n u A ry 24, 2017
It would be politically dif-ficult to return to a pre-2009 system and 20 million fewer people covered by insurance.
The process ahead is much more complicated than simple “repeal and
replace” wording indicates and so is likely to generate
heightened uncertainty
Since the Election, Healthcare Spreads Have Widened Reflecting Increased Uncertainty
Source: Janney Fixed Income Strategy, Thomson Reuters Municipal Market Data
HealtHCare SeCtor
With the inauguration of President Trump, perhaps no sector in the world of public finance carries more uncertainty than nonprofit healthcare. The Patient Protection and Affordable Care Act (aka Obamacare or ACA), which was enacted in March 2010, brought with it an initial cloud of uncertainty for healthcare providers, insurers, and consumers. Now, nearly seven years later, nonprofit healthcare systems have largely adapted to the multitude of changes, with most benefitting significantly from the 20 million additional people now covered through insurance from Medicaid expansion, use of health insurance exchanges (HIE), and broader coverage through conventional insurance (kids can stay on parents’ policy up to 26 years old, pre-existing conditions are covered etc.) With single party control of legislative and executive levers in DC, the repeal and replace mantra moves front and center as the proposed path for healthcare reform in the United States.
The process ahead is much more complicated than simple “repeal and replace” wording indicates and so is likely to generate heightened uncertainty. Recent debate in Congress focuses on whether to repeal as much of the Affordable Act as possible and develop alternatives later, or repeal and replace at the same time. There are multiple pieces to this puzzle. For example repeal of mandates for employers and individuals would undermine the wider risk sharing basis of ACA, important to insurers. Eliminating or reducing subsidies used on health exchanges would make insurance unaffordable for many currently enrolled. Ending the Medicare Investment tax would increase the federal deficit. There does not yet ap-pear to be broad agreement in the Senate and House of Representatives on what Obamacare replace-ment measures might look like. Since Medicaid expansion and health exchanges have been operating for three years, it would be politically difficult to return to a pre-2009 system and 20 million (some reports suggest as many as 30 million) fewer people covered by insurance.
Healthcare Share of the US Economy Has Grown Steadily Accounting for 18% in 2015
Source: Janney FIS, Center for Medicare and Medicaid Services
0 bps25 bps50 bps75 bps
100 bps125 bps150 bps AA Rated A Rated Baa Rated
0%
4%
8%
12%
16%
20%
1960
1963
1967
1971
1975
1979
1983
1987
1991
1995
1999
2003
2007
2011
2015

MUNICIPAL MONTHLY • PAGE 3
Healthcare has been one of the fastest growing sectors of the economy in recent years. According to the Center for Medicare and Medicaid Services, healthcare spending accounted for 18% of US GDP in 2015, up from 13% in 1995, making the industry an important economic driver for the country. Lopping 20 million or more customers from the insurance rolls would certainly reduce healthcare revenues and their significant contribution to economic growth, a consideration for legislators.
Nonprofit healthcare organizations have been actively involved with a spate of mergers and acquisi-tion transactions (including a relentless drive to purchase physician practices), creating larger, more diverse and in many cases fiscally stronger entities. A decline in customers due to an increase in uninsured under an Obamacare repeal scenario, would certainly be a challenge for healthcare sys-tems, depending on the magnitude of change, but larger organizations, with management depth and strong financial resources, are positioned to navigate the changes best.
Credit spreads of healthcare bonds have widened post-election reflecting the immediate uncertainty created by Republican control of both Congress and the presidency coupled with the common prom-ise to repeal Obamacare. If repeal legislation is passed and signed with no replacement identified, we believe spreads will widen further. Best case is quick resolution on an Obamacare replacement, but we believe a solution sufficient to attract necessary Congressional support may be a while in materializing. The healthcare sector offers a yield pickup made more attractive by recently wider spreads. Future uncertainty and political discourse may serve to widen spreads further. As spreads widen we advise investors to consider higher rated (Aa3/AA-/AA- and higher), larger ($5 billion or more annual revenue) systems which we believe are best positioned to navigate the changing envi-ronment faced by healthcare providers.
Mu n i c i pA l Bo n d MA r k e t Mo n t h lyJA n u A ry 24, 2017
JANNEY MONTGOMERY SCOTT
www.janney.com
© 2017 Janney Montgomery Scott LLC
Member: NYSE, FINRA, SIPC
According to the Center for Medicare and Medicaid Ser-
vices, healthcare spending accounted for 18% of US
GDP in 2015, up from 13% in 1995
Larger Nonprofit Healthcare Continue to Grow Through Mergers and Acquisitions
Future uncertainty and politi-cal discourse may serve to
widen spreads further.
Healthcare Issuer State RatingAnnual
Revenue $millions
Misc
Ascension Health Alliance MO Aa2/AA+/AA+ 21,898 105 hospitals in 24 states + DC. Providence St Joseph Health WA Aa3/AA-/AA- 20,913 50 hospitals in 7 statesTrinity Health MI Aa3/AA-/AA 16,339 88 hospitals in 21 statesCatholic Health Initiatives CO A3/A-/BBB+ 15,942 103 hospitals in 18 states. University of Pittsburgh Med Ctr PA Aa3/A+/AA- 12,848 21 hospitals in SW PA Dignity Health CA A3/A/A 12,636 39 hospitals in 3 states Partners Healthcare System MA Aa3/AA-/AA 12,460 9 hospitals in eastern MassSutter Health CA Aa3/AA-/AA- 10,998 28 hospitals in northern CAMayo Clinic MN Aa2/AA/NR 10,315 22 hospitals in 5 states Adventist Health System FL Aa2/AA/AA 9,116 43 hospitals in 10 statesState is headquarters state. Revenues ($1,000) are as of latest fiscal year - either 2015 or 2016. Providence St Joseph is est. pro forma post merger (June 2016). Cath Health Int and Dignity merger not final so listed separately.

MUNICIPAL MONTHLY • PAGE 4
Mu n i c i pA l Bo n d MA r k e t Mo n t h lyJA n u A ry 24, 2017
JANNEY MONTGOMERY SCOTT
www.janney.com
© 2017 Janney Montgomery Scott LLC
Member: NYSE, FINRA, SIPC
Analysts can point to mul-tiple causes for the current fiscal morass, but a decade of nearly steady economic
contraction and perhaps more notably, a sharp
decrease in population, un-derlie Puerto Rico’s financial
distress.
Not All States Have Growing Populations
Source: Janney FIS, US Census Bureau, Bureau of Economic Analysis
Four states, including Illinois, the lowest rated state (Baa2/BBB/BBB+), are losing popu-
lation.
State and loCal GovernMent
State and local government sectors are generally stable as we enter the new year, reflecting seven years of positive (although often tepid) economic growth. Rating agency methodologies place significant focus on the economies of issuers they rate, with Moody’s and S&P giving a 30% weighting to economic factors in their local government rating framework and a 20% weighting in state methodologies. Re-lated to economic growth as a credit factor is the rate of population growth or occasionally contraction.
Puerto Rico does not fit precisely into either the state or local government category, given its status as a territory, the island’s immense fiscal crisis, large unsupportable debt load, and near zero funding levels for its $50 billion plus pension liabilities will cast what is likely the darkest cloud over public finance in 2017. Significant restructuring of debt and other liabilities is very likely in Puerto Rico’s future. Ana-lysts can point to multiple causes for the current fiscal morass, but a decade of nearly steady economic contraction and perhaps more notably, a sharp decrease in population, underlie Puerto Rico’s financial distress. States such as Illinois and Connecticut enjoy strong wealth metrics, yet are among the most fiscally challenged states, with modest recent GDP expansion and in both cases stagnant population growth in a period when the county’s population expanded by 4.5%.
City population changes reflect demographic flows of their respective states. The graph of city popula-tions shows that five of the fastest growing cities in the country are in one of the fastest growing states, Texas, while population growth in Chicago was slowest among the 20 most populous US cities.
St PopPopΔ
GDPΔ St Pop
PopΔ
GDPΔ Pop Pop
PopΔ
GDPΔ
PR 3,411,307 -8.3% -0.6% KY 4,436,974 2.0% 0.3% GA 10,310,371 6.1% 3.1%
WV 1,831,102 -1.2% -2.1% IN 6,633,053 2.2% 1.2% NC 10,146,788 6.1% 2.0%
IL 12,801,539 -0.3% 1.4% AR 2,988,248 2.3% 1.1% OR 4,093,465 6.7% 5.1%
VT 624,594 -0.2% 0.4% IA 3,134,693 2.8% -1.5% SC 4,961,119 7.0% 2.7%
CT 3,576,452 -0.1% 0.2% LA 4,681,666 3.0% -1.2% ID 1,683,140 7.1% 2.0%
ME 1,331,479 0.3% 0.8% WY 585,501 3.7% -5.6% WA 7,288,000 8.1% 4.0%
RI 1,056,426 0.3% 0.4% MA 6,811,779 3.8% 2.2% AZ 6,931,071 8.2% 1.7%
MI 9,928,300 0.5% 1.7% AK 741,894 3.9% -2.7% NV 2,940,058 8.8% 1.3%
PA 12,784,227 0.6% 0.6% MN 5,519,952 3.9% -0.7% FL 20,612,439 9.4% 3.3%
MS 2,988,726 0.6% 2.2% MD 6,016,447 3.9% 1.1% CO 5,540,545 9.7% 1.0%
OH 11,614,373 0.6% 0.5% NE 1,907,116 4.2% 0.9% UT 3,051,217 9.9% 3.4%
NM 2,081,015 0.8% -1.7% OK 3,923,561 4.4% -1.8% TX 27,862,596 10.4% 1.3%
NH 1,334,795 1.4% 2.1% TN 6,651,194 4.6% 2.3% ND 757,952 12.4% -9.7%
WI 5,778,708 1.6% 0.6% HI 1,428,557 4.7% 2.5% DC 681,170 12.6% NA
NJ 8,944,469 1.6% 1.9% VA 8,411,808 4.8% 1.2% US 323,127,513 4.5% 1.5%
MO 6,093,000 1.6% 1.4% CA 39,250,017 5.1% 3.0% NE Reg 56,209,510 1.5% NA
AL 4,863,300 1.6% 0.9% MT 1,042,520 5.2% 1.7% MW Reg 67,941,429 1.4% NA
KS 2,907,289 1.7% -0.3% DE 952,065 5.8% 1.7% S Reg 122,319,574 6.5% NA
NY 19,745,289 1.8% 0.9% SD 865,454 6.0% 1.7% W Reg 76,657,000 6.3% NA

MUNICIPAL MONTHLY • PAGE 5
Mu n i c i pA l Bo n d MA r k e t Mo n t h lyJA n u A ry 24, 2017
Source: Janney Fixed Income Strategy; US Census Bureau
State and Local Tax Revenue Growth Continues, But Pace is Slowing
Revenue streams supporting state and local government budgets continue to grow steadily. State level revenues, comprised largely of sales and income taxes, have surpassed pre-recession levels and continue to expand, although the pace of growth may be slowing. Property taxes, which account for about 75% of local government tax revenue, slowed and then fell after the recession, as underlying property values fell in many localities, but values have stabilized in most communities and the revenue growth trend has reappeared.
It’s difficult to discuss state and local government credit without mentioning the pension funding challenge. In too many cases growing revenue streams are insufficient to keep pace with the rising expense of adequate pension funding, but revised GASB accounting standards for reporting pension funding information, and heightened rating agency focus (Moody’s adjusted net pension liability and tread water metrics) have improved scrutiny and supported more accurate comparative analytics. With no easy solutions and the timing mismatch between political leaders operating within 2, 4 and 8 year timeframes and retirement plans which will need sufficient assets to finance retirement payments to workers who may just recently have begun 30 or 40 year careers, the pension funding problem will be with us for years and decades to come. We hope to see continued initiatives to address pension funding, but acknowledge there no easy solutions.
JANNEY MONTGOMERY SCOTT
www.janney.com
© 2017 Janney Montgomery Scott LLC
Member: NYSE, FINRA, SIPC
$300 bln
$400 bln
$500 bln
$600 bln
$700 bln
$800 bln
2006
2007
2008
2009
2010
2011
2012
2013
2014
2015
2016
State Tax Revenue Local Tax Revenue
Source: Janney FIS, US Census Bureau
0%
5%
10%
15%
20%
0 mln
2 mln
4 mln
6 mln
8 mln
10 mln
New
Yor
k
Los
Ange
les
Chica
go
Hous
ton
Phila
delp
hia
Phoe
nix
San
Anto
nio
San
Dieg
o
Dalla
s
San
Jose
Aust
in
Jack
sonv
ille
San
Fran
cisco
Indi
anap
olis
Colu
mbu
s
Fort
Wor
th
Char
lotte
Seat
tle
Denv
er
El P
aso
2015 Population Change 2010-2015
Six of 20 Most Populous Cities Are in Texas, And Most Are Growing Quickly
In too many cases growing revenue streams are insuf-
ficient to keep pace with the rising expense of adequate
pension funding
MUNICIPAL MONTHLY • PAGE 6
Mu n i c i pA l Bo n d MA r k e t Mo n t h lyJA n u A ry 24, 2017
JANNEY MONTGOMERY SCOTT
www.janney.com
© 2017 Janney Montgomery Scott LLC
Member: NYSE, FINRA, SIPC
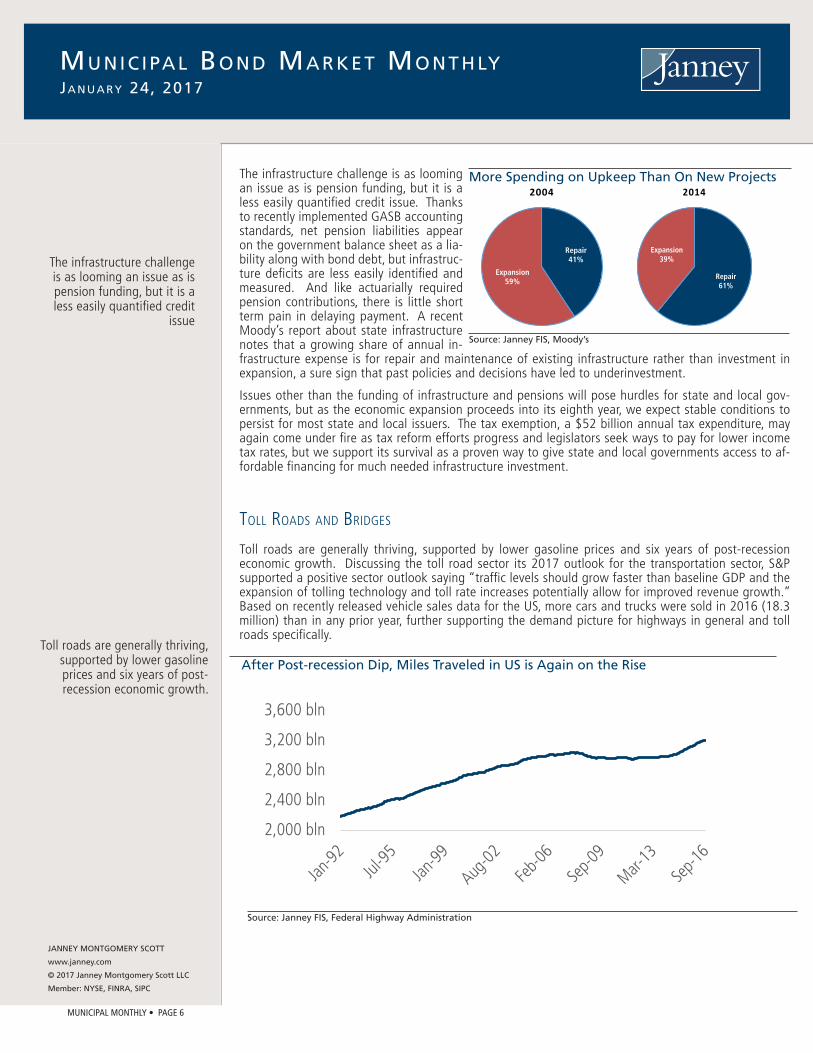
The infrastructure challenge is as looming an issue as is pension funding, but it is a less easily quantified credit issue. Thanks to recently implemented GASB accounting standards, net pension liabilities appear on the government balance sheet as a lia-bility along with bond debt, but infrastruc-ture deficits are less easily identified and measured. And like actuarially required pension contributions, there is little short term pain in delaying payment. A recent Moody’s report about state infrastructure notes that a growing share of annual in-frastructure expense is for repair and maintenance of existing infrastructure rather than investment in expansion, a sure sign that past policies and decisions have led to underinvestment.
Issues other than the funding of infrastructure and pensions will pose hurdles for state and local gov-ernments, but as the economic expansion proceeds into its eighth year, we expect stable conditions to persist for most state and local issuers. The tax exemption, a $52 billion annual tax expenditure, may again come under fire as tax reform efforts progress and legislators seek ways to pay for lower income tax rates, but we support its survival as a proven way to give state and local governments access to af-fordable financing for much needed infrastructure investment.
toll roadS and BridGeS
Toll roads are generally thriving, supported by lower gasoline prices and six years of post-recession economic growth. Discussing the toll road sector its 2017 outlook for the transportation sector, S&P supported a positive sector outlook saying “traffic levels should grow faster than baseline GDP and the expansion of tolling technology and toll rate increases potentially allow for improved revenue growth.” Based on recently released vehicle sales data for the US, more cars and trucks were sold in 2016 (18.3 million) than in any prior year, further supporting the demand picture for highways in general and toll roads specifically.
After Post-recession Dip, Miles Traveled in US is Again on the Rise
Source: Janney FIS, Moody’s
More Spending on Upkeep Than On New Projects
Source: Janney FIS, Federal Highway Administration
The infrastructure challenge is as looming an issue as is pension funding, but it is a less easily quantified credit
issue
Toll roads are generally thriving, supported by lower gasoline prices and six years of post-recession economic growth.
Repair41%
Expansion59%
2004
Repair61%
Expansion39%
2014
2,000 bln
2,400 bln
2,800 bln
3,200 bln
3,600 bln

MUNICIPAL MONTHLY • PAGE 7
JANNEY MONTGOMERY SCOTT
www.janney.com
© 2017 Janney Montgomery Scott LLC
Member: NYSE, FINRA, SIPC
Mu n i c i pA l Bo n d MA r k e t Mo n t h lyJA n u A ry 24, 2017
A key to economic success for the sector is the ability to increase toll rates without losing customers, which is embodied in the economic concept of elasticity, a measure of the sensitivity of demand when prices change. As example, demand for new cars is generally elastic – if Ford raises prices, customers will buy a Chevy (or other brand). Demand for use of the New Jersey Turnpike is relatively inelastic. If New Jersey Turnpike raises toll rates, some drivers may choose to take local roads instead of the turnpike (or Garden State Parkway), but most, especially those travelling longer distances through New Jersey, will use the turnpike despite the higher cost. In 2012, New Jersey Turnpike raised tolls by 53%, but traffic (adjusted for normal growth) fell by only 5.9%. That is real pricing power. Turnpike systems in Pennsylvania, New Jersey, Florida and Ohio are statewide systems with strong demand characteris-tics. Illinois’ system is Chicago/Northern Illinois focused (hub and spoke configuration), also exhibiting strong demand. Miami-Dade County Expressway is more of a commuter system, comprised of five different roads adding up to 33 miles, with less favorable elasticity metrics, given the shorter distances covered, and availability of slower, non-toll alternative roads.
Selected Toll Road Statistics Illustrate Favorable Revenue and Mileage Trends
Source: Janney FIS, Moody’s, S&P, Fitch, Toll Road System financials
A key to economic success for the sector is the ability
to increase toll rates without losing customers,
Our largest concern is the increasing use of toll road
revenues to support non-toll road purposes.
SystemSenior Lien
RatingTransaction
IncreasesRevenue Increases
Outstanding Debt
(millions)
Debt Service
Coverage
Florida DOT - Turnpike Aa2/NR/AA 7.0% 7.5% $2,894 2.56xIllinois State Toll Highway Aa3/AA-/AA- 5.1% 6.0% $5,784 3.75xMiami-Dade Co Expressway Auth A2/A/A 8.3% 11.2% $1,501 1.79xNew Jersey Turnpike Auth A2/A+/A 3.6% 3.7% $10,787 1.48xOhio Turnpike and Infra Comm Aa3/AA-/AA 3.1% 3.1% $1,593 1.78xPennsylvania Turnpike Comm A1/NR/A+ 3.0% 12.7% $8,925 1.35x
Technology improvements are a positive driver for turnpike economics with expanded use of au-tomatic tolling systems improving efficiencies, reducing labor costs, and supporting enhancements such as congestion pricing. Transponder tolling through systems such as E-Z Pass improves connec-tivity among toll road and bridge systems and supports stronger data analytics to prevent revenue leakage. The use of open road tolling is growing. Traffic does not slow as it passes under gantries, which can capture revenues through either transponders or video image capture (generating an invoice to vehicle owners).
Our largest concern is the increasing use of toll road revenues to support non-toll road purposes. Tolls collected by the Port Authority of NY-NJ and by the Delaware River Port Authority subsidize money losing operations such as light rail commuter systems (PATH and PATCO). Toll payers using the Pennsylvania Turnpike may not know that their tolls are paying debt service on subordinate lien bond issues that finance annual $450 million payments to the state, used to subsidize mass transit in Philadelphia and Pittsburgh as well as other non-turnpike projects. This will require $2.7 billion of additional borrowing in the next six years, with debt service paid by turnpike users. Ohio Turnpike subordinate debt, which accounts for about two thirds of system debt, is also being used to finance non-turnpike projects.
We expect the toll road sector to remain strong in 2017, but given the fiscal pressure in many states, we will be watching for further use of toll revenue to support non-tolled projects, which increases leverage and typically requires ever escalating toll rates. We favor systems which implement regular, typically annual, inflation based toll increases as opposed to occasional but large hikes, which are most likely to meet political resistance.

MUNICIPAL MONTHLY • PAGE 8
JANNEY MONTGOMERY SCOTT
www.janney.com
© 2017 Janney Montgomery Scott LLC
Member: NYSE, FINRA, SIPC
Mu n i c i pA l Bo n d MA r k e t Mo n t h lyJA n u A ry 24, 2017
airportS
The airport sector continues to enjoy tailwinds from the extended economic recovery. Growth in enplane-ments (the number of passengers using an airport to depart on a flight) continues. Enplanements of 799 million passengers (544 airports) in 2015 exceeded 2014 totals by 5%, and the pace was even stronger at the 50 busiest airports, which registered a 6% increase. Full information for 2016 is not yet available, but based on FAA data for the 12 months through September 2016, passenger enplanements grew by 4%. A closer look at data shows that among the twenty busiest airports, those with the strongest percentage of passengers on international flights are exhibiting the strongest passenger growth trends, including JFK (53% intl), MIA (48%), LAX (28%) and SFO (23%). Exceptions are EWR (Newark), which is 31% inter-national with only 3% CAGR and SEA, which is experiencing the strongest growth rate among the top 20 (7%), but with international passengers comprising only 10% of enplanements.
Source: Janney Fixed Income Strategy, Federal Aviation Administration
Enplanement Growth is Positive But Mixed at Twenty Largest Airports
The airport sector continues to enjoy tailwinds from the
extended economic recovery.
We see fair skies ahead for airports in the coming year,
although larger airports will see stronger enplanement
growth than smaller opera-tions.
0%
2%
4%
6%
8%
0 mln
15 mln
30 mln
45 mln
60 mln
ATL
LAX
ORD
DFW JFK
DEN
SFO
CLT
LAS
PHX
MIA IAH
SEA
MCO
EWR
MSP
BOS
DTW
PHL
LGA
Enplanements 2015 5 Year CAGR
Unlike most sectors of the municipal market, the airport sector is strongly dependent on investor owned companies – airlines. The trail of financial disasters, bankruptcies, and distressed mergers on the part of airlines in past years painted a picture of uncertainty for airports, but with the American Air/US Air merger (finalized in 2015), consolidation among the major carriers paused, and airline financial stability has improved, with the recent drop in fuel prices a contributing factor. The four biggest airlines are responsible for almost 70% of passengers. Further consolidation will take the form primarily of trimming hub operations within airlines. For example, post-merger, American Air-lines has 10 hub airports, but as time goes by, the airline will likely consolidate hub activities at these airports, perhaps eliminating hub activities at one or more locations.
We see fair skies ahead for airports in the coming year, although larger airports will see stronger enplanement growth than smaller operations. Smaller airports are often served by regional airlines using smaller, regional jets. Moody’s notes that “as the airline industry is fac-ing a worsening pilot shortage caused by increases in costly training requirements and forced retirement of pilots at age 65, the regional airlines face increased constraints posed by that shortage”, which will trans-late into slower passenger growth or perhaps contrac-tion at smaller airports.
American19%
Southwest18%
Delta17%
United15%
Jet Blue5%
Other26%
Top 4 Airlines Have 70% Market Share
Source: Janney Fixed Income Strategy, FAA

MUNICIPAL MONTHLY • PAGE 9
Mu n i c i pA l Bo n d MA r k e t Mo n t h lyJA n u A ry 24, 2017
JANNEY MONTGOMERY SCOTT
www.janney.com
© 2017 Janney Montgomery Scott LLC
Member: NYSE, FINRA, SIPC
puBliC power SeCtor
Though historically stable, the public power industry in 2017 may be heading into a more transitional period where renewable/efficient means of energy production take the forefront versus regulatory man-dates that look less likely by the day. Over the past several years, the power sector has become more reliant on natural gas as an alternative to dirtier fuel choices. While low natural gas prices remain a credit positive to the sector, a decline in demand or spike in prices could test margins for some utilities.
Along with a new administration come changes to various federal agencies and programs. Once such area that has a degree of uncertainty surrounding it is the regulatory environment, and more specifically the Clean Power Plan (“CPP”). The Clean Power Plan, first discussed in our January 2016 Muni Monthly, is an environmental policy, dating back to June of 2014, aimed at combatting global warming. It is also a policy that incoming President Trump vowed to dismantle when he takes office. In August of 2015, President Obama unveiled the final version of the CPP and its detailed goals to reduce carbon emissions from power plants as well as establish state specific CO2 emission levels. The plan, which featured initial compliance goals set to begin in 2022 and final goals to be met by 2030, was put on hold as the Supreme Court moved to stay the implementation of the plan following challenges from several states.
Even with the future of the CPP in flux, what is undeniable is the shift in public power generation away from coal. According to the Energy Information Administration, 1.48GW, or 5% of US coal-generating capacity was retired in 2015, with another 6.5GW being retired in 2016. To make up the gap in genera-tion, renewable power production, led by solar and wind, has seen a sharp uptick.
Use of Renewable Energy Sources is Growing in the Public Power Sector
Regardless of whether the CPP ever takes hold, many issuers and states have independently set their own internal mandates to reduce carbon emissions. Two examples of issuers reducing coal exposure are the Los Angeles Department of Water & Power (Aa2/AA-/AA-) and the South Carolina Public Service Authority (“Santee Cooper” A1/AA-/A+). Los Angeles Department of Water & Power, which has 40% of its fuel provided by coal, has a policy in place to exit coal by 2025, and generate almost 33% of its production load using renewable energy sources by 2020. Santee Cooper, which generates almost 50% of its power from coal, is proposing to reduce carbon by almost half as a result of shutting down its Grainger coal units and focusing on the construction of nuclear units which will be carbon-neutral.
Whether it is investing in new renewable infrastructure or retrofitting old coal-fired units, we view the costs associated with these changes as something to keep an eye on. In the unlikely event that the CPP is implemented, compliance with the new EPA plan is estimated to push 25% of coal generation capac-ity off the grid. The additional new replacement capacity is projected to cost suppliers an additional $17 billion in 2020 and grow to $53 billion by 2030, the bulk of which will be passed through to con-sumers as rate increases. However, not all states would be equally affected by the CPP implementation, with several states such as California, Pennsylvania, and Washington pursuing carbon reduction plans on their own, while other states such as North Dakota, Indiana, Missouri, and Kentucky are behind all carbon reduction timelines as they wait for the court decision on the matter.
Though historically stable, the public power industry in
2017 may be heading into a more transitional period where renewable/efficient
means of energy production take the forefront versus reg-
ulatory mandates that look less likely by the day.
Whether it is investing in new renewable infrastructure
or retrofitting old coal-fired units, we view the costs as-
sociated with these changes as something to keep an eye
on.

MUNICIPAL MONTHLY • PAGE 10
JANNEY MONTGOMERY SCOTT
www.janney.com
© 2017 Janney Montgomery Scott LLC
Member: NYSE, FINRA, SIPC
HiGHer eduCation SeCtor
Demand continues to be strong for college degrees in the US for both bachelors and graduate catego-ries. A recent report from the National Center for Education Statistics states that total undergraduate enrollment for postsecondary institutions increased 31% from 13.2mm in 2000 to 17.3mm in 2014. That number is expected to increase to 19.8mm by 2025. On the graduate level, enrollment is projected to grow by 21% over the same time. Well diversified schools will tend to perform better than narrowly focused colleges as we have seen from enrollment pressures in parts of the sector. Further, schools that have ancillary revenue streams will tend to weather a downturn in the economy better than schools which are more reliant on state aid and tuition. One example of a school with diverse revenue streams is the University of Kentucky (Aa2/AA/NR). The University is the Commonwealth of Kentucky’s flagship university which has experienced growth of 24% in applications and 7% in enrollment over the past five years. Further, the University of Kentucky HealthCare system is a major piece of university opera-tions, contributing almost 52% of revenues. This alternative revenue stream helps buffer the university from cuts in state aid, which has decreased from $283mm in 2013 to $267mm in 2017.
One of the biggest challenges faced by issuers in the public higher education sector is the ongoing pres-sure in state funding levels. Historically, state funding for higher education has generally followed the trend of the strength of states’ economy. As states came out of the recession and adjusted to a new normal of revenues and higher fixed costs associated with pensions and debt service, cuts were broadly made. For instance, between 2008-2016, the US median decline in state higher education spending was -17.5%. According to Moody’s, aggregate state funding is expected to continue to be somewhat volatile with growth of 3-4% in 2017, versus the 1.7% growth in 2016. Looking out to 2018, state funding is expected to have slower growth with increases of just 1.5-2.5%. State funding weakness will continue to come from energy states such as Alaska, Louisiana, and West Virginia, and states that are facing increased pressures from pension costs, such as Illinois, Pennsylvania, and New Jersey.
At the same time as the higher education sector has been grappling with lower funding, students have been dealing with increased educational costs. Higher education issuers have recorded median increases in tuition levels of 34.5% between 2008-2016. It should be noted that the increase in school tuition is not solely driven by a decrease in state funding, but also influenced by factors such as increased pension and labor costs, and the need to fend off increased competition from other schools. In a race to diversify themselves, many schools have moved to boost their degree offerings, add profes-sional degree programs and commit large dollars to capital programs that involve new and revamped housing and campus buildings.
Mu n i c i pA l Bo n d MA r k e t Mo n t h lyJA n u A ry 24, 2017
State General Fund Expenditures For Higher Education Fell in Past Fiscal Year
-10 -5 0 5 10 15 20
Total General FundE&S Education
Higher EducationPublic Assistance
MedicaidCorrections
TransportationAll Other
2015-16 2014-15
Source: Janney Fixed Income Strategy, National Association of State Budget Officers
Whether it is investing in new renewable infrastructure
or retrofitting old coal-fired units, we view the costs as-
sociated with these changes as something to keep an eye
on.
One of the biggest chal-lenges faced by issuers in the public higher education sec-
tor is the ongoing pressure in state funding levels.

MUNICIPAL MONTHLY • PAGE 11
JANNEY MONTGOMERY SCOTT
www.janney.com
© 2017 Janney Montgomery Scott LLC
Member: NYSE, FINRA, SIPC
water and Sewer
The water and sewer sector is the “Steady Eddie” of the municipal bond world with positive inherent credit considerations such as essentiality, a monopolistic business nature, and autonomous rate setting authority in most cases. The sector is characterized by generally steady financial metrics, with debt ser-vice coverage running above 1.8x in recent years. Both Moody’s and Fitch medians indicate a positive growth trend in liquidity. Given the sector’s partial insulation from the extremes of economic cycles (most utilities are not dependent on tax revenues) we expect stability to continue in months and years ahead.
This is not to say that challenges are nonexistent. Aging infrastructure remains an issue for some utilities. Fitch notes that the “slight increase in capital investment from the prior year” (based on 2017 medians) is “not enough to keep the age of facility assets from increasing to their highest observed” level in at least 15 years. Bond Buyer data indicates utilities issued $51.1 billion of debt in 2016, easily surpassing the previous record of $45.5 billion set in 2012, although, in line with overall volume totals, much of last year’s borrowing may have been for refunding purposes rather than capital investment. Given the growth in deferred infrastructure investment, illustrated by rising age of assets, and the potential for bor-rowing costs to rise in coming years, we would expect the brisk pace of issuance to continue into 2017.
Mu n i c i pA l Bo n d MA r k e t Mo n t h lyJA n u A ry 24, 2017
1.4X
1.6X
1.8X
2.0X
2.2X
2012 2013 2014 2015 2016 est
2017proj
Water Sewer Combined W&S
Debt Service Coverage Levels Remain Stable in the Municipal Utility Sector
Source: Janney Fixed Income Strategy, Moody’s
The water and sewer sec-tor is the “Steady Eddie” of
the municipal bond world with positive inherent credit
considerations such as es-sentiality, a monopolistic
business nature, and autono-mous rate setting authority in
most cases.

MUNICIPAL MONTHLY • PAGE 12
JANNEY MONTGOMERY SCOTT
www.janney.com
© 2017 Janney Montgomery Scott LLC
Member: NYSE, FINRA, SIPC
Mu n i c i pA l Bo n d MA r k e t Mo n t h lyJA n u A ry 24, 2017
Select Rating Actions
We continue to see more up-grades than downgrades in
the healthy airport sector.
anotHer downGrade for dallaS
Two downgrades from Moody’s, and rating cuts from both S&P and Fitch within the past four months have taken a toll on Dallas, TX bond trading levels, with noticeable credit spread widening beginning with the first Moody’s rating downgrade in October 2016. Deterioration in pension funding is the cul-prit behind recent downgrades, but as we noted in our December Monthly, Dallas compares very favor-ably in most respects with other large cities. The local economy is strong, population is growing, prop-erty values are recovering and, with exception of pension liabilities, most credit metrics show strength. The city has proposed pension reforms that would partially address the funding challenge over time for police and fire pension funds, but approval of the city’s proposal by the state legislature is not certain.
Date Issuer ActionCurrent Ratings
Comments
12/16Pittsburgh International Airport
S&P raises rating to A from A-
A3/A/AImprovement in traffic levels and overall financial situation
12/21 Georgetown UniversityMoody's raises rating to
A2 from A3A2/A/NR
improved operating performance, reduction in debt structure risks
12/29 Montgomery County, PAFitch lowers rating to AA
from AA+Aa1/NR/AA
Revised criteria, weak prospects for revenue growth due to slow economic recovery
1/5 Oakland, CAS&P raises rating to AA
from AA-Aa2/AA/NR
Strong budgetary performance, local economic growth supports revenue growth
1/9 Rochester, NYFitch raises rating to AA-
from A+Aa3/AA-/NR
Revised criteria, unlimited independent ability to raise revenue, moderate liabilities
1/10 Widener University, PAS&P lowers rating to
BBB from BBB+NR/BBB/A-
Operating deficit, revised criteria, 2016 MADS coverage < 1.0x
1/10 Kansas City, MO AirportMoody's raises rating to
A1 from A2A1/A+/NR
Improved debt service coverage, liquidity. Airline and airport consensus on CIP
1/11 KentuckyS&P revises outlook to negative from stable
Aa2/A+/AA-Pension funding pressures could lead to budget pressures and structural imbalance
1/11 Dallas, TXS&P lowers rating to AA-
from AAA1/AA-/AA
Deterioration of funded status of pension funds, growing fixed costs
1/13 Birmingham, ALFitch lowers rating to
AA- from AAAa2/AA/AA-
Increase in pension liability, criteria changes
1/17Virgin Islands Sr Lien Matching Fund Revs
Fitch lowers rating to BB- from BB
B1/BB/BB-Concerns about liquidity, difficulty in securing market access
1/20 Reading, PAMoody's lowers rating to
Baa2 from Baa1Baa2/NR/NR
Weak financial operations, high fixed costs, continued socioeconomic stress
0 bps
20 bps
40 bps
60 bps
80 bps
Jan-
16
Feb-
16
Mar
-16
Apr-1
6
May
-16
Jun-
16
Jul-1
6
Aug-
16
Sep-
16
Oct-1
6
Nov-
16
Dec-
16
Jan-
17
Credit Spreads of Dallas Debt Have Been Rising Since October Downgrades
Source: Janney Fixed Income Strategy, MMA, Bloomberg, 10-year debt

MUNICIPAL MONTHLY • PAGE 13
JANNEY MONTGOMERY SCOTT
www.janney.com
© 2017 Janney Montgomery Scott LLC
Member: NYSE, FINRA, SIPC
A lower acceptable rating on state debt, compared to many other sectors, reflects states’ sovereign powers to adjust to fiscal challenges.
Mu n i c i pA l Bo n d MA r k e t Mo n t h lyJA n u A ry 24, 2017
Slope of Yield Curve is Little Changed From a Year Ago
Sector Diversification is Important Strategy Component
Municipal portfolio Strategy and data
Source: Janney Fixed Income Strategy; Municipal Market Analytics, Thomson MMD, Credit Spreads 10 year maturity
Benchmark AAA Yields
Credit Spreads Have Inched Higher Post-election
SectorMinimum
RatingComments and Considerations Target
State Government Baa1/BBB+ Sovereign power to raise revenue or reduce expense, pension challenges 15%
Special Tax A1/A+ State and local. Sensitive to economic swings. Understand appropriation risk? 10%
Local Government A2/A Stable and often growing property values, fixed cost challenges 10%
School District A2/A Essential function, state support and bond enhancement programs, charter risk 8%
Water and Sewer Baa2/BBB Essential function, consumers prioritize utility bills, future debt to finance mandated improvements 8%
Transportation A2/A Enplanements and toll revenues continue to grow 16%
Healthcare Aa3/AA- Post-election uncertainty with “repeal and replace” heading to uncharted territory 8%
Higher Education A1/A+ Enrollment challenges NE states, cautious re small, less selective schools, revenue diversity a plus 8%
Public Power A2/A Revenue stability, low energy prices, uncertain post-election regulatory environment 6%
Escrowed Aa1/AA+ Treasury escrow best 5%
Janney’s Interest Rate (U S Treasuries) Forecast as of 12-6-16
Our outlook for interest rates projects that rates will move
moderately higher in next two years.
Recent publications, Rates of a Different Color and Preparing
for Changes in Interest Rates offer insight into changing
rate environment post-elec-tion
Rate Current 4Q 2016 4Q 2017 4Q 2018Fed Funds 0.25-0.50% 0.50-0.75% 1.25-1.50% 1.25%-1.50%3m Bill 0.48% 0.74% 1.29% 1.30%2yr Note 1.12% 1.07% 1.36% 1.86%5yr Note 1.84% 1.76% 1.97% 2.35%10yr Note 2.39% 2.24% 2.33% 2.63%30yr Bond 3.06% 2.96% 2.89% 3.14%
0 bps
100 bps
200 bps
300 bps
400 bps
Jan-
05
Feb-
06
Mar
-07
Apr-0
8
May
-09
Jun-
10
Jul-1
1
Aug-
12
Sep-
13
Oct-1
4
Nov-
15
Dec-
16
AA Spread A Spread Baa Spread
0%
1%
2%
3%
4%
5%
1 3 5 7 9 11 13 15 17 19 21 23 25 27 29
Years to Maturity
1/23/2017 1/24/20161/23/2012
Maturity5%
Coupon1Y 0.93
2Y 1.12
3Y 1.30
4Y 1.52
5Y 1.70
6Y 1.83
7Y 1.94
8Y 2.12
9Y 2.24
10Y 2.35
11Y 2.47
12Y 2.54
13Y 2.62
14Y 2.68
15Y 2.73
16Y 2.78
17Y 2.81
18Y 2.85
19Y 2.91
20Y 2.96
21Y 3.00
22Y 3.04
23Y 3.06
24Y 3.08
25Y 3.10
26Y 3.12
27Y 3.13
28Y 3.14
29Y 3.14
30Y 3.15
As of January 23, 2017

MUNICIPAL MONTHLY • PAGE 14
Analyst Certification
We, Alan Schankel and Eric Kazatsky, the Primarily Responsible Analysts for this report, hereby certify that all of the views expressed in this report accurately reflect our personal views about any and all of the subject sectors, industries, securities, and issuers. No part of our compensation was, is, or will be, directly or indirectly, related to the specific recommendations or views expressed in this research report.
Definition of Outlooks
Positive: Janney FIS believes there are apparent factors which point towards improving issuer or sector credit quality which may result in potential credit ratings upgrades
Stable: Janney FIS believes there are factors which point towards stable issuer or sector credit quality which are unlikely to result in either potential credit ratings upgrades or downgrades.
Cautious: Janney FIS believes there are factors which introduce the potential for declines in issuer or sector credit quality that may result in potential credit ratings downgrades.
Negative: Janney FIS believes there are factors which point towards weakening in issuer credit quality that will likely result in credit ratings downgrades.
Definition of Ratings
Overweight: Janney FIS expects the target asset class or sector to outperform the comparable benchmark (below) in its asset class in terms of total return
Marketweight: Janney FIS expects the target asset class or sector to perform in line with the comparable benchmark (below) in its asset class in terms of total return
Underweight: Janney FIS expects the target asset class or sector to underperform the comparable benchmark (below) in its asset class in terms of total return
Benchmarks
Asset Classes: Janney FIS ratings for domestic fixed income asset classes including Treasuries, Agencies, Mortgages, Investment Grade Credit, High Yield Credit, and Municipals employ the “Barclay’s U.S. Aggregate Bond Market Index” as a benchmark.
Treasuries: Janney FIS ratings employ the “Barclay’s U.S. Treasury Index” as a benchmark.
Agencies: Janney FIS ratings employ the “Barclay’s U.S. Agency Index” as a benchmark.
Mortgages: Janney FIS ratings employ the “Barclay’s U.S. MBS Index” as a benchmark.
Investment Grade Credit: Janney FIS ratings employ the “Barclay’s U.S. Credit Index” as a benchmark.
High Yield Credit: Janney FIS ratings for employ “Barclay’s U.S. Corporate High Yield Index” as a benchmark.
Municipals: Janney FIS ratings employ the “Barclay’s Municipal Bond Index” as a benchmark.
Disclaimer
Janney or its affiliates may from time to time have a proprietary position in the various debt obligations of the issuers mentioned in this publication.
Unless otherwise noted, market data is from Bloomberg, Barclays, and Janney Fixed Income Strategy & Research (Janney FIS).
This report is the intellectual property of Janney Montgomery Scott LLC (Janney) and may not be reproduced, distributed, or published by any person for any purpose without Janney’s express prior written consent.
This report has been prepared by Janney and is to be used for informational purposes only. In no event should it be construed as a solicitation or offer to purchase or sell a security. The information presented herein is taken from sources believed to be reliable, but is not guaranteed by Janney as to accuracy or completeness. Any issue named or rates mentioned are used for illustrative purposes only, and may not represent the specific features or securities available at a given time. Preliminary Official Statements, Final Official Statements, or Prospectuses for any new issues mentioned herein are available upon request. The value of and income from investments may vary because of changes in interest rates, foreign exchange rates, securities prices, market indexes, as well as operational or financial conditions of issuers or other factors. Past performance is not necessarily a guide to future performance. Estimates of future performance are based on assumptions that may not be realized. We have no obligation to tell you when opinions or information contained in Janney FIS publications change.
Janney Fixed Income Strategy does not provide individually tailored investment advice and this document has been prepared without regard to the circumstances and objectives of those who receive it. The appropriateness of an investment or strategy will depend on an investor’s circumstances and objectives. For investment advice specific to your individual situation, or for additional information on this or other topics, please contact your Janney Financial Consultant and/or your tax or legal advisor.
JANNEY MONTGOMERY SCOTT
www.janney.com
© 2017 Janney Montgomery Scott LLC
Member: NYSE, FINRA, SIPC
Mu n i c i pA l Bo n d MA r k e t Mo n t h lyJA n u A ry 24, 2017

3.) Bank, Thrift & MHC Summary Valuation

BANK AND THRIFT COMPARABLE COMPANY ANALYSIS - JANNEY UNIVERSE
As of 1/27/2017
BS Market Data Capital Ratio Asset Quality Profitability Price Perf.
Tang.
Price / Equity/ NPAs + Rsrvs/
Total Market One Year LTM 2017E Tang. Div. Tang. 90 Day/ NPAs + LTM Eff.
Assets Value Stock High Low EPS EPS Book Yield Assets Assets 90 Day ROAA ROAE Ratio YTD 1 Week
Ticker Institution ($M) ($M) Price ($) ($) (x) (x) (%) (%) (%) (%) (%) (%) (%) (%) (%) (%)
PBCT People's United Financial Inc. 40,610 6,015 19.04 20.13 13.70 20.70 20.04 218.3 3.57 7.80 NA NA 0.71 5.78 62.50 (1.65) 1.87
WBS Webster Financial Corp. 26,065 4,971 54.11 55.80 30.64 25.05 22.55 271.3 1.85 7.67 NA NA 0.82 8.35 62.36 (0.31) 3.38
UBNK United Financial Bancorp 6,600 936 18.43 18.66 10.79 18.62 17.72 175.1 2.60 8.25 NA NA 0.78 7.77 61.61 1.49 7.90
FBNK First Connecticut Bancorp, Inc 2,838 361 22.70 25.00 14.42 22.70 20.00 138.7 1.59 9.17 NA NA 0.55 5.98 70.30 0.22 7.08
BWFG Bankwell Financial Group Inc. 1,629 224 29.42 34.80 18.48 18.16 15.24 157.0 0.95 8.78 NA NA 0.85 8.94 55.88 (9.48) 0.79
SIFI SI Financial Group Inc. 1,538 180 14.75 16.23 12.30 27.83 - 126.7 1.36 9.35 1.13 66.19 0.42 3.98 75.02 (4.22) (0.34)
SAL Salisbury Bancorp Inc. 928 104 37.74 38.80 29.50 14.30 - 131.6 2.97 8.66 2.35 27.06 0.80 7.83 65.47 0.65 (0.68)
PNBK Patriot National Bancorp Inc. 683 56 14.25 16.50 12.57 39.58 - 90.2 - 9.16 NA NA 0.22 2.28 80.06 1.42 (0.70)
DRWB Darien Rowayton Bank 599 NA 2.00 2.00 0.45 - - - NA 9.30 0.01 NM (0.53) (6.23) 118.23 344.44 -
SBTB SBT Bancorp Inc. 510 34 25.00 25.90 19.05 22.73 - 113.2 2.24 5.94 NA NA 0.31 4.88 84.46 4.69 (1.96)
PBBI PB Bancorp Inc. 506 80 10.15 10.40 8.20 NM - 101.8 1.18 15.72 NA NA 0.18 1.23 83.67 2.56 -
FSFF First Suffield Financial Inc. 251 36 7,232.00 7,410.00 7,190.00 - - - 2.49 NA NA NA NA NA NA 0.44 -
WSFS WSFS Financial Corp. 6,765 1,417 45.15 47.65 26.40 21.92 17.85 - 0.62 NA 0.61 96.39 1.06 10.03 60.41 (2.59) 0.44
TBBK Bancorp Inc 4,218 405 7.32 8.20 3.88 NM 18.30 121.5 NA 7.92 NA NA (1.15) (15.69) 97.97 (6.87) 3.54
NACB National Capital Bank 412 51 178.75 188.88 135.00 10.41 - 125.9 1.12 9.93 NA NA 1.21 11.84 69.70 1.56 0.14
IBWC IBW Financial Corp. 389 10 17.50 18.90 17.15 - - - 0.57 10.29 3.44 31.04 0.33 3.31 88.14 (2.89) -
BKU BankUnited Inc. 27,880 4,091 39.27 39.37 27.85 18.79 16.47 174.8 2.14 8.42 NA NA 0.87 9.64 59.24 4.19 9.82
EVER EverBank Financial* 27,838 2,473 19.47 19.49 12.32 18.37 13.02 136.0 1.23 7.08 0.75 49.57 0.53 7.66 69.30 0.10 0.31
FCB FCB Financial Holdings Inc. 9,090 1,935 47.25 49.40 28.64 20.45 17.50 216.9 NA 9.96 NA NA 1.23 10.80 43.68 (0.94) 3.39
CSFL CenterState Banks 5,079 1,264 24.91 26.30 13.04 28.31 18.45 278.8 0.64 8.68 0.73 72.62 0.87 7.96 56.71 (1.03) 0.32
SBCF Seacoast Banking Corp. of FL 4,514 834 21.93 23.00 13.80 32.73 17.83 234.5 - 8.02 1.12 44.97 0.62 6.23 67.50 (0.59) 3.88
USAB USAmeriBancorp Inc. 4,040 473 47.00 47.00 39.00 11.96 - 163.9 1.49 7.41 1.26 75.13 1.12 14.10 51.48 20.51 -
SGBK Stonegate Bank 2,902 612 42.90 43.50 28.21 20.14 17.65 - 0.75 NA 0.72 90.52 1.13 9.31 50.49 2.80 3.30
CCBG Capital City Bank Group Inc. 2,845 350 20.75 23.15 13.16 30.07 25.00 183.6 0.96 6.90 2.02 23.40 0.43 4.22 86.97 1.32 4.53
TGRF TGR Financial Inc. 1,227 138 8.00 15.00 5.75 25.81 - 142.1 NA 8.34 0.24 317.11 0.48 5.47 71.75 2.56 (0.37)
SBCP Sunshine Bancorp Inc 931 145 18.14 18.25 13.84 NM 22.97 161.4 NA 9.88 NA NA (0.01) (0.06) 87.48 5.86 0.80
ACFC Atlantic Coast Financial Corp. 907 112 7.24 7.64 5.16 17.24 15.08 129.1 - 9.59 NA NA 0.72 7.54 72.14 6.47 (1.36)
FMIA First Miami Bancorp Inc. 654 52 600.00 600.00 462.10 - - - 0.67 NA NA NA NA NA NA 0.00 -
BCBF Beach Community Bancshares Inc 536 1 0.50 0.50 0.25 - - - NA NA NA NA NA NA NA 100.00 -
FFHD FirstAtlantic Finl Hldgs Inc 436 68 11.40 11.50 9.50 18.39 - - 1.05 NA NA NA 0.86 6.19 NA 1.79 -
PFHD Professional Holding Corp. 391 NA NA NA NA - - - NA NA NA NA NA NA NA NA NA
FCIT First Citrus Bancorp. Inc. 306 21 13.75 14.00 10.72 21.05 - - NA 7.50 NA NA 0.38 4.78 NA 4.17 1.85
PMHG Prime Meridian Holding Co. 304 37 18.50 18.50 13.25 16.67 - 136.9 0.38 8.91 NA NA 0.81 8.49 67.23 21.31 15.34
CONNECTICUT BANKS AND THRIFTS
DELAWARE BANKS AND THRIFTS
FLORIDA BANKS AND THRIFTS
DISTRICT OF COLUMBIA BANKS AND THRIFTS
Source: SNL
Note: Universe includes publicly traded institutions with > $150 million in assets
* Indicates under agreement to be acquiredPage 1

BANK AND THRIFT COMPARABLE COMPANY ANALYSIS - JANNEY UNIVERSE
As of 1/27/2017
BS Market Data Capital Ratio Asset Quality Profitability Price Perf.
Tang.
Price / Equity/ NPAs + Rsrvs/
Total Market One Year LTM 2017E Tang. Div. Tang. 90 Day/ NPAs + LTM Eff.
Assets Value Stock High Low EPS EPS Book Yield Assets Assets 90 Day ROAA ROAE Ratio YTD 1 Week
Ticker Institution ($M) ($M) Price ($) ($) (x) (x) (%) (%) (%) (%) (%) (%) (%) (%) (%) (%)
JFBF Jefferson Bankshares Inc.* 296 41 15.20 15.75 8.68 23.38 - 168.9 NA 8.21 NA NA 0.65 7.25 69.28 31.03 29.91
PLBN Pilot Bancshares Inc. 238 28 2.85 2.85 2.00 - - 103.3 - 11.22 2.47 28.11 NA NA NA 7.55 2.52
FLBD First NB of Mount Dora 225 NA 41.50 NA NA - - - 2.17 13.72 2.82 51.80 1.26 8.97 70.27 0.00 -
SSNF Sunshine Financial Inc. 167 20 19.65 20.20 18.45 NM - 94.9 NA 12.78 2.90 18.38 (0.04) (0.27) 97.83 (1.26) 0.51
STI SunTrust Banks Inc. 204,875 28,366 57.75 58.72 31.07 16.04 15.12 178.0 1.80 8.70 NA NA 0.95 7.84 62.76 5.29 5.31
SNV Synovus Financial Corp. 30,104 5,174 42.32 42.94 25.48 22.39 18.81 189.6 1.13 9.51 1.24 67.21 0.84 8.40 61.67 3.02 2.47
UCBI United Community Banks Inc. 10,709 2,028 28.61 30.47 15.74 20.44 18.05 220.6 1.12 8.71 NA NA 1.00 9.50 56.75 (3.41) 2.54
ABCB Ameris Bancorp 6,892 1,575 45.10 47.70 24.96 21.68 16.80 312.8 0.89 7.46 NA NA 1.17 11.76 60.53 3.44 4.40
LION Fidelity Southern Corp. 4,390 617 23.43 24.95 14.01 15.62 15.78 - 2.05 NA NA NA 0.92 11.61 73.68 (1.01) (1.18)
STBZ State Bank Finl Corp. 4,225 1,067 27.46 28.00 17.34 21.45 19.90 203.6 2.04 12.67 NA NA 1.34 8.63 58.90 2.23 5.74
ACBI Atlantic Capital Bcshs Inc. 2,727 494 19.70 20.20 11.55 35.82 25.10 - NA NA NA NA 0.51 4.60 70.58 3.68 0.51
HMBH Hamilton State Bancshares 1,826 311 7.75 8.25 7.25 18.42 - 143.2 NA 12.04 0.77 98.19 0.94 7.08 60.99 6.90 -
CHFN Charter Financial Corp. 1,462 258 17.16 17.50 12.34 20.93 14.79 148.9 1.40 12.12 NA NA 0.93 6.12 66.06 2.94 3.94
CBAN Colony Bankcorp Inc. 1,210 116 13.70 14.20 8.11 16.31 - 137.7 - 7.71 NA NA 0.75 8.66 72.00 3.79 0.37
MCBS MetroCity Bankshares Inc. 960 138 12.00 12.00 12.00 - - - 3.33 10.70 0.41 140.51 2.59 20.60 44.75 NA -
THVB Thomasville Bancshares Inc. 753 216 36.40 37.00 28.05 - - 345.6 1.92 8.38 0.62 296.16 1.50 17.62 48.21 4.00 4.00
SCSG SouthCrest Financial Group Inc 563 45 8.75 8.90 6.35 5.50 17.50 - - NA NA NA 2.41 21.77 82.52 6.06 -
SGB Southwest Georgia Financial 448 49 19.33 21.38 13.27 12.23 - 128.0 2.28 8.58 NA NA 0.94 10.51 74.15 (3.30) 0.99
CCFH CCF Holding Co. 415 9 1.69 1.75 0.70 - - - - NA NA NA NA NA NA 6.29 2.42
SEBC Southeastern Banking Corp. 407 44 13.93 13.93 10.50 12.44 - 88.4 2.87 12.11 2.34 36.29 0.87 7.65 73.76 5.13 -
CZBS Citizens Bancshares Corp. 407 20 9.00 9.50 6.45 9.78 - 47.8 0.89 12.91 2.50 18.52 0.57 4.43 82.85 0.00 (5.26)
FIEB First Intercontinental Bank 331 44 7.50 8.20 6.50 - - 83.2 NA 16.11 1.14 121.07 2.22 13.86 48.97 3.31 2.74
EXCH Exchange Bankshares Inc. 237 22 34.20 38.50 30.05 7.42 - 72.7 2.11 12.90 1.83 61.21 1.31 10.47 65.19 (0.87) -
TMAK Touchmark Bancshares Inc. 236 28 8.00 8.39 5.80 11.94 - 81.2 NA 14.45 NA NA 1.09 7.16 61.85 1.01 -
UNBK United National Bank 194 17 24.50 24.50 19.55 - - - NA 13.82 2.36 65.25 1.08 8.10 59.49 0.00 -
FMBE FMB Equibanc Inc. 177 12 5.00 5.10 4.05 - - - NA NA NA NA NA NA NA 0.00 -
EGBN Eagle Bancorp Inc 6,890 2,086 61.30 64.95 43.75 21.43 19.77 283.4 - 10.85 NA NA 1.52 12.27 40.04 0.57 2.42
SASR Sandy Spring Bancorp Inc. 5,091 984 41.17 41.53 24.17 20.59 17.90 220.1 2.53 8.93 0.66 130.21 1.02 9.15 59.85 2.95 4.68
OLBK Old Line Bancshares Inc 1,717 301 27.57 28.81 16.75 22.98 17.45 219.0 0.87 8.06 NA NA 0.83 8.83 60.10 14.97 0.77
FUNC First United Corp. 1,338 91 14.45 16.95 8.82 9.03 - 108.1 - 7.82 2.76 32.60 0.92 10.66 73.96 (9.40) 0.35
TCFC Community Finl Corp. 1,334 138 29.71 30.40 19.19 18.69 15.97 131.8 1.35 7.83 NA NA 0.60 7.09 64.80 2.45 (0.54)
REVB Revere Bank 1,327 117 17.90 19.00 14.95 14.79 - 119.2 NA 7.40 0.11 759.69 0.75 8.81 54.88 1.99 (0.56)
SHBI Shore Bancshares Inc. 1,160 202 15.97 16.90 10.23 21.01 17.36 143.2 1.25 12.32 2.11 35.66 0.84 6.32 67.47 4.72 2.70
HBMD Howard Bancorp Inc. 1,027 156 16.65 16.95 11.65 23.13 18.50 140.3 NA 8.10 NA NA 0.55 6.15 77.51 10.26 8.37
SVBI Severn Bancorp Inc. 787 86 7.06 8.08 4.99 5.93 - 101.5 - 11.13 NA NA 2.00 17.33 81.87 (10.70) (0.63)
BYBK Bay Bancorp Inc. 606 73 7.05 7.20 4.70 50.36 - 118.2 - 10.27 2.60 15.55 0.33 2.49 79.93 6.82 (0.70)
MARYLAND BANKS AND THRIFTS
GEORGIA BANKS AND THRIFTS
Source: SNL
Note: Universe includes publicly traded institutions with > $150 million in assets
* Indicates under agreement to be acquiredPage 2

BANK AND THRIFT COMPARABLE COMPANY ANALYSIS - JANNEY UNIVERSE
As of 1/27/2017
BS Market Data Capital Ratio Asset Quality Profitability Price Perf.
Tang.
Price / Equity/ NPAs + Rsrvs/
Total Market One Year LTM 2017E Tang. Div. Tang. 90 Day/ NPAs + LTM Eff.
Assets Value Stock High Low EPS EPS Book Yield Assets Assets 90 Day ROAA ROAE Ratio YTD 1 Week
Ticker Institution ($M) ($M) Price ($) ($) (x) (x) (%) (%) (%) (%) (%) (%) (%) (%) (%) (%)
HBK Hamilton Bancorp Inc 517 50 14.65 14.75 13.19 NM - 95.5 NA 10.32 1.23 30.61 (0.01) (0.04) 87.28 2.81 1.03
TYCB Calvin B. Taylor Bankshares 513 81 28.00 28.51 26.25 16.54 - 97.1 3.46 16.23 1.47 13.55 1.02 6.23 53.76 0.90 -
DBCP Delmar Bancorp 509 49 6.00 7.79 5.25 - - - 1.33 9.44 3.52 36.59 0.78 8.41 66.24 4.35 2.56
GLBZ Glen Burnie Bancorp 392 33 11.70 12.48 9.86 28.54 - 93.1 3.42 8.92 0.73 81.34 0.29 3.33 87.55 1.74 2.35
FCBI Frederick County Bancorp 383 34 22.75 26.50 18.95 17.64 - 109.5 1.23 8.08 1.94 42.17 0.55 6.62 77.96 3.41 1.11
FMFG Farmers & Merchants Bcshs Inc. 380 43 25.85 27.25 24.11 9.94 - 108.7 2.79 10.36 NA NA 1.19 11.27 61.78 0.39 2.38
PSBP PSB Holding Corp. 362 20 44.00 44.00 36.08 24.37 - 62.0 0.45 8.83 2.23 33.80 0.24 2.93 75.49 7.98 7.06
HFBK Harford Bank 329 34 25.79 29.13 24.33 19.68 - 98.5 2.48 10.59 2.90 22.43 0.56 5.18 73.20 5.87 5.27
NWID New Windsor Bancorp Inc.* 311 31 31.00 34.00 15.75 19.50 - 136.1 0.77 7.35 NA NA 0.52 7.12 81.73 (1.27) 1.27
DCBB DCB Bancshares Inc. 310 20 12.50 12.60 9.78 18.45 - 79.7 0.64 8.16 1.25 74.39 0.37 4.44 93.36 2.88 3.99
DLMV Delmarva Bancshares Inc. 305 NA 6.40 6.40 4.56 - - - NA NA NA NA NA NA NA 11.30 -
PEBC Peoples Bancorp Inc 253 15 19.20 23.00 18.00 11.11 - 60.9 2.40 9.75 4.83 36.59 0.56 5.53 86.04 0.00 -
HRBK Harbor Bankshares Corporation 252 3 3.50 4.71 2.00 - - - - NA NA NA NA NA NA 40.00 -
CECB Cecil Bancorp Inc. 238 1 0.20 0.65 0.07 - - - - NA NA NA NA NA NA 15.29 -
CUMD County First Bank 227 19 20.55 21.75 16.30 21.19 - - 1.46 NA 3.70 30.52 0.41 3.74 82.84 0.24 0.24
IFSB Colombo Bank 203 133 0.39 0.45 0.31 NM - 654.8 - 10.05 1.44 109.82 0.07 0.68 106.14 20.98 (5.00)
CROL Carroll Bancorp Inc. 165 15 15.90 17.00 15.50 49.69 - - NA 9.94 NA NA 0.19 1.83 89.73 (0.63) (2.45)
STT State Street Corp. 242,698 29,027 76.00 83.49 50.60 15.29 13.21 277.5 2.00 5.81 NA NA 0.93 9.78 75.89 (2.21) (3.81)
BPFH Boston Private Financial 7,970 1,403 16.75 17.18 9.37 20.68 18.61 256.3 2.63 7.68 NA NA 1.00 9.85 67.50 1.21 0.60
BHLB Berkshire Hills Bancorp Inc. 7,931 1,285 36.10 37.45 24.71 17.27 15.33 192.3 2.22 7.71 0.49 111.13 0.82 7.24 61.04 (2.04) 3.29
INDB Independent Bank Corp. 7,709 1,714 63.45 71.95 41.23 21.88 18.97 270.6 1.83 8.47 NA NA 1.04 9.43 59.86 (9.94) 0.40
BRKL Brookline Bancorp Inc. 6,438 1,151 16.20 17.45 10.11 21.89 19.76 209.4 2.22 8.85 0.97 85.95 0.88 7.94 56.22 (1.22) 3.18
CNBKA Century Bancorp Inc. 4,463 335 60.25 62.60 38.26 13.66 - 141.4 0.80 5.32 NA NA 0.57 10.80 62.78 0.42 0.75
EBSB Meridian Bancorp Inc. 4,436 1,024 19.10 20.55 13.14 29.38 25.99 172.5 0.63 13.42 NA NA 0.87 5.77 55.73 1.06 4.37
EBTC Enterprise Bancorp Inc. 2,471 415 36.26 39.25 20.44 21.08 - 197.3 1.49 8.53 1.17 109.66 0.80 9.65 67.43 (3.46) 3.60
BHBK Blue Hills Bancorp Inc 2,470 516 19.30 19.35 13.22 55.14 48.25 137.2 1.04 15.30 NA NA 0.39 2.20 74.72 2.93 10.60
BLMT BSB Bancorp Inc. 2,074 257 28.20 30.05 20.72 23.70 - 163.7 NA 7.56 0.41 152.15 0.57 7.15 58.82 (2.59) 2.36
HIFS Hingham Instit. for Savings 2,015 407 190.86 203.01 115.80 17.53 - 252.8 0.67 7.99 NA NA 1.22 15.59 32.09 (3.01) 0.20
CATC Cambridge Bancorp 1,849 257 63.75 64.25 45.50 15.36 - 191.7 2.89 7.26 NA NA 0.95 12.79 69.30 2.34 2.00
WNEB Western New England Bancorp 1,378 295 9.75 9.95 7.35 39.00 22.41 123.1 1.23 10.54 0.59 122.46 0.33 3.11 76.30 4.28 6.56
WEBK Wellesley Bancorp 695 66 26.75 27.75 18.22 21.57 - 120.4 0.60 7.94 NA NA 0.46 5.38 75.89 (3.60) (2.19)
RNDB Randolph Bancorp Inc 490 88 14.97 16.50 12.06 - - 102.5 NA 17.52 1.41 44.87 NA 2.73 90.89 (7.13) 2.53
GABK Grand Bank Corp. 324 65 5,750.00 5,750.00 5,300.00 - - - - NA NA NA NA NA NA 1.77 2.31
GTWN Georgetown Bancorp Inc.* 318 47 25.70 26.00 18.55 NM - 147.3 0.78 10.09 NA NA 0.06 0.62 88.19 (0.58) 0.19
MELR Melrose Bancorp Inc 267 44 17.05 18.10 14.60 41.59 - 102.7 NA 16.23 - NM 0.42 2.26 76.40 (5.01) (2.57)
PLRM Pilgrim Bancshares Inc 251 34 14.90 15.00 12.69 36.34 - 103.9 NA 12.88 1.63 24.71 0.38 2.60 78.28 (0.67) (0.67)
IDBP Island Bancorp Inc* 194 12 243.00 243.00 243.00 - - 83.2 - 8.32 - NM 0.48 5.09 75.28 0.00 -
MASSACHUSETTS BANKS AND THRIFTS
Source: SNL
Note: Universe includes publicly traded institutions with > $150 million in assets
* Indicates under agreement to be acquiredPage 3

BANK AND THRIFT COMPARABLE COMPANY ANALYSIS - JANNEY UNIVERSE
As of 1/27/2017
BS Market Data Capital Ratio Asset Quality Profitability Price Perf.
Tang.
Price / Equity/ NPAs + Rsrvs/
Total Market One Year LTM 2017E Tang. Div. Tang. 90 Day/ NPAs + LTM Eff.
Assets Value Stock High Low EPS EPS Book Yield Assets Assets 90 Day ROAA ROAE Ratio YTD 1 Week
Ticker Institution ($M) ($M) Price ($) ($) (x) (x) (%) (%) (%) (%) (%) (%) (%) (%) (%) (%)
ISBC Investors Bancorp Inc 23,175 4,475 14.46 14.93 10.67 22.59 21.91 - 2.21 NA NA NA 0.88 6.06 53.06 3.66 4.63
VLY Valley National Bancorp 22,864 3,240 12.29 12.32 8.39 19.51 17.81 - 3.58 NA 0.60 82.87 0.76 7.46 65.22 5.58 8.76
PFS Provident Financial Services 9,500 1,766 26.73 28.92 17.71 19.37 18.25 - 2.69 NA NA NA 0.95 7.12 58.61 (5.55) 0.07
OCFC OceanFirst Financial Corp. 5,167 956 29.74 30.70 15.98 30.35 17.76 229.7 2.02 8.30 0.98 30.12 0.62 6.08 61.05 (0.97) 1.05
LBAI Lakeland Bancorp 5,093 890 18.85 20.05 9.72 19.84 17.95 216.9 2.02 8.28 0.59 103.16 0.90 8.75 56.74 (3.33) 3.29
KRNY Kearny Financial Corp. 4,523 1,306 14.75 16.10 11.36 NM NM 130.0 0.54 22.89 0.57 96.81 0.39 1.51 67.37 (5.14) 2.43
CNOB ConnectOne Bancorp, Inc. 4,426 826 25.85 26.65 14.86 25.59 15.96 216.1 1.16 8.93 NA NA 0.73 6.30 41.60 (0.39) 5.73
ORIT Oritani Financial Corp. 4,012 798 17.40 19.00 15.18 17.23 17.85 148.2 4.02 13.42 NA NA 1.20 8.32 40.30 (7.20) 0.87
PGC Peapack-Gladstone Financial 3,879 542 31.40 31.98 16.17 19.63 17.54 168.8 0.64 8.28 0.76 108.88 0.72 8.92 59.44 1.68 4.15
NFBK Northfield Bancorp Inc. 3,850 886 18.25 20.59 14.31 32.02 28.74 152.4 1.75 15.25 0.75 85.22 0.70 4.26 60.58 (8.61) (1.08)
SNBC Sun Bancorp Inc. 2,189 487 25.75 26.80 20.16 69.59 56.59 213.6 0.16 10.58 0.32 224.40 0.31 2.63 92.20 (0.96) 3.41
BCBP BCB Bancorp Inc. 1,679 151 13.45 13.81 9.75 26.90 - 129.6 4.16 7.88 2.69 38.88 0.39 5.05 80.22 3.46 (1.82)
CSBK Clifton Bancorp Inc 1,312 369 16.01 17.49 13.38 NM NM 122.0 1.50 23.08 0.38 105.14 0.36 1.40 71.45 (5.38) 0.88
UNTY Unity Bancorp Inc. 1,190 174 16.60 17.10 8.75 12.03 - 166.0 1.20 8.82 0.69 152.90 1.17 15.37 59.13 5.73 1.84
FCCY 1st Constitution Bancorp 1,055 135 16.85 20.85 11.27 15.60 15.32 147.9 1.19 8.73 0.62 113.73 0.90 8.99 63.37 (9.89) 3.06
PKBK Parke Bancorp Inc. 1,016 135 19.80 20.30 10.43 9.61 - - 2.02 NA NA NA 2.01 NA 43.62 (1.74) 3.39
BPRN Bank of Princeton 1,009 149 31.80 34.00 28.00 13.71 - 147.1 NA 10.07 0.87 123.32 1.14 12.16 58.99 6.00 6.00
FRBA First Bank 1,008 141 12.35 12.95 6.35 23.75 16.25 161.3 0.65 8.66 0.53 175.53 0.58 7.12 62.10 6.47 (1.59)
TRCB Two River Bncp 940 126 15.81 16.05 8.75 14.92 16.82 152.5 1.01 8.96 NA NA 0.96 8.94 63.91 5.97 6.75
MRLN Marlin Bus. Services Corp. 892 273 21.75 22.92 13.46 15.76 13.14 168.5 2.57 18.19 NA NA 2.08 11.14 55.86 4.07 5.07
SBBX Sussex Bancorp 847 100 21.05 21.95 11.43 17.69 15.04 - 0.76 6.78 1.10 71.64 0.72 9.60 68.72 0.72 2.68
BKJ Bancorp of New Jersey Inc. 835 88 13.90 14.00 9.75 21.38 - 115.1 - 9.11 1.24 80.65 0.50 5.43 67.02 2.96 2.17
SSFN Stewardship Financial Corp. 758 59 9.60 10.20 5.51 13.33 - 113.9 1.25 6.80 1.21 88.94 0.60 9.05 76.83 (2.04) -
FCOB 1st Colonial Bancorp 482 38 9.71 10.50 6.90 - - 111.0 NA 7.04 0.70 141.71 0.75 11.83 61.78 2.21 (3.38)
CANJ Capital Bank of New Jersey 448 42 16.70 17.00 16.60 - - - 0.90 9.06 0.22 435.98 1.03 10.37 58.67 0.00 -
MSBF MSB Financial Corp. 434 82 14.40 14.95 12.25 NM - 113.3 - 16.74 3.60 25.94 0.18 0.90 83.06 (2.04) (0.35)
HSBK Highlands Bancorp Inc. 395 28 10.19 10.24 6.85 11.58 - 108.4 0.79 NA 0.86 105.16 0.51 NA 77.70 1.90 0.59
CMTB Community Bk of Bergen County 342 27 14.00 14.00 0.00 16.09 - 93.6 - 8.38 NA NA 0.50 5.96 77.10 3.70 3.70
NMNB New Millennium Bank 274 13 3.50 3.65 3.12 - - - NA 7.59 1.40 89.18 0.73 9.63 77.99 0.00 -
SHRC Shore Community Bank 265 25 9.00 9.20 6.41 14.52 - - NA NA NA NA 0.68 NA NA 1.24 1.12
CFIC Cornerstone Financial Corp. 246 6 0.77 1.66 0.74 - - 76.1 NA 4.46 NA NA NA NA NA (12.50) (9.41)
ELMA Elmer Bancorp Inc. 240 19 17.00 17.50 15.80 20.01 - 83.8 3.53 9.70 1.44 68.77 0.41 4.12 78.26 0.00 -
ENBN Enterprise Bank N.J. 207 29 9.10 10.00 6.41 - - 107.9 NA 13.01 0.72 154.27 0.91 7.23 57.80 1.11 -
PEBA Penn Bancshares 205 16 43.51 43.51 42.20 - - - - NA NA NA NA NA NA 0.00 -
BRBW Brunswick Bancorp 178 22 7.30 8.09 5.25 31.53 - 60.4 - 20.56 NA NA 0.38 1.85 85.95 (5.19) -
ASCN Absecon Bancorp 153 10 84.00 84.00 66.45 23.20 - 60.5 3.57 10.77 0.41 92.73 0.29 2.94 84.40 9.09 3.70
JPM JPMorgan Chase & Co. 2,490,972 309,575 86.93 88.17 52.50 14.04 13.27 - 2.21 NA NA NA 1.00 9.87 57.94 0.74 3.90
NEW JERSEY BANKS AND THRIFTS
NEW YORK BANKS AND THRIFTS
Source: SNL
Note: Universe includes publicly traded institutions with > $150 million in assets
* Indicates under agreement to be acquiredPage 4
BANK AND THRIFT COMPARABLE COMPANY ANALYSIS - JANNEY UNIVERSE
As of 1/27/2017
BS Market Data Capital Ratio Asset Quality Profitability Price Perf.
Tang.
Price / Equity/ NPAs + Rsrvs/
Total Market One Year LTM 2017E Tang. Div. Tang. 90 Day/ NPAs + LTM Eff.
Assets Value Stock High Low EPS EPS Book Yield Assets Assets 90 Day ROAA ROAE Ratio YTD 1 Week
Ticker Institution ($M) ($M) Price ($) ($) (x) (x) (%) (%) (%) (%) (%) (%) (%) (%) (%) (%)
C Citigroup Inc. 1,792,077 158,332 57.11 61.63 34.52 12.10 11.00 - 1.12 NA NA NA 0.83 6.52 60.50 (3.90) 1.78
BK Bank of New York Mellon Corp. 333,469 46,907 44.78 49.54 32.20 14.22 12.96 326.8 1.70 5.92 NA NA 0.99 9.04 67.51 (5.49) 0.49
MTB M&T Bank Corp. 123,449 25,625 164.04 164.53 100.08 21.08 18.87 242.6 1.71 9.93 NA NA 1.06 8.01 56.10 4.86 4.46
NYCB New York Community Bancorp 48,927 7,398 15.19 17.68 13.74 15.04 16.33 200.6 4.48 7.93 NA NA 1.00 8.19 44.64 (4.53) (3.92)
SBNY Signature Bank 39,048 8,761 160.42 164.23 113.53 21.77 17.55 243.8 NA 9.21 NA NA 1.09 11.59 31.82 6.80 3.87
AF Astoria Financial Corp. 14,559 1,928 19.05 19.26 14.11 30.73 34.64 137.8 0.84 10.64 NA NA 0.48 4.23 72.36 2.14 1.71
STL Sterling Bancorp 14,178 3,287 24.30 24.85 13.44 22.71 18.55 300.9 1.15 8.14 NA NA 1.09 8.05 45.79 3.85 4.52
NBTB NBT Bancorp Inc. 8,867 1,784 41.24 42.56 24.56 22.91 22.17 282.3 2.23 7.36 NA NA 0.92 8.74 60.57 (1.53) (0.27)
CBU Community Bank System Inc. 8,668 2,688 60.48 63.04 34.70 26.07 24.49 374.7 2.12 8.76 NA NA 1.20 8.57 59.24 (2.12) 4.44
TMP Tompkins Financial Corporation 6,237 1,395 92.15 96.70 51.88 23.57 21.73 313.6 1.95 7.27 0.40 142.24 1.01 10.87 61.82 (2.53) 3.00
DCOM Dime Community Bancshares Inc. 6,005 822 21.95 22.48 16.10 11.14 16.63 161.1 2.55 8.58 0.29 118.94 1.31 13.40 47.96 9.20 7.60
FFIC Flushing Financial Corp. 5,999 822 28.73 31.96 18.95 13.36 18.54 165.7 2.37 8.30 0.57 64.06 1.07 12.80 60.50 (2.25) 2.97
TRST TrustCo Bank Corp NY 4,869 824 8.60 9.00 5.32 19.33 19.11 190.6 3.05 8.88 NA NA 0.89 9.94 55.66 (1.71) 2.99
BDGE Bridge Bancorp Inc. 4,055 719 36.65 38.95 26.90 18.33 17.88 235.5 2.51 7.54 NA NA 0.92 9.82 54.69 (3.30) 1.24
FISI Financial Institutions Inc. 3,710 495 34.05 34.55 24.56 16.21 15.84 218.0 2.47 6.72 NA NA 0.90 10.01 60.44 (0.44) 4.29
FLIC First of Long Island Corp. 3,434 661 27.90 29.67 17.43 21.14 18.10 211.7 2.01 9.03 0.09 942.92 0.92 10.72 50.23 (2.28) 2.01
AROW Arrow Financial Corp. 2,605 495 36.65 41.70 25.00 18.60 17.37 236.9 2.73 8.09 0.28 236.74 1.06 11.80 57.10 (9.51) (0.95)
CNND Canandaigua National Corp. 2,430 272 145.00 175.00 129.00 12.22 - 156.9 2.76 7.19 0.64 137.99 0.98 12.17 65.65 3.57 (6.45)
SCNB Suffolk Bancorp* 2,196 497 41.72 44.70 22.88 25.13 22.80 232.3 0.96 9.74 0.68 137.02 0.91 9.64 62.30 (2.57) 1.91
CHMG Chemung Financial Corp. 1,657 167 34.92 37.26 26.05 16.55 13.69 140.3 2.98 7.29 NA NA 0.60 7.02 75.85 (3.93) 6.46
ADKT Adirondack Trust Company 1,156 124 1,618.00 1,650.00 1,456.00 - - - 3.15 8.29 0.39 224.75 0.56 5.64 78.04 0.00 -
EVBN Evans Bancorp Inc. 1,085 175 36.90 37.67 22.87 20.73 17.00 181.6 2.06 8.09 1.77 71.54 0.78 8.25 75.80 16.96 2.64
BKUT Bank of Utica 1,036 129 514.90 552.00 438.00 12.03 - 66.0 2.66 18.82 0.12 182.42 1.09 6.37 33.13 0.00 -
OCBI Orange County Bancorp Inc. 962 90 46.20 51.00 45.50 38.48 - 102.7 3.55 9.23 NA NA 0.27 2.46 82.39 (0.69) 0.43
LYBC Lyons Bancorp Inc 927 101 33.50 33.50 28.00 - - - 2.99 7.85 NA NA NA NA NA 6.82 1.52
SOBS Solvay Bank Corp. 866 75 36.30 38.00 32.00 11.21 - 99.9 3.42 8.71 0.58 112.87 0.82 9.22 64.80 (1.89) (0.82)
FAIT First American Intl Corp 793 42 19.25 19.35 14.65 22.13 - 77.5 NA 8.93 NA NA 0.39 3.94 85.11 6.35 (0.52)
EMPK Empire Bancorp Inc 781 89 12.80 13.18 8.76 32.00 - 141.1 NA 8.06 NA NA 0.39 4.21 79.60 0.47 1.99
BERK Berkshire Bancorp Inc. 767 137 9.50 12.00 7.68 - - - 1.05 NA NA NA NA NA NA 2.70 (0.52)
PBHC Pathfinder Bancorp Inc. 717 58 13.68 14.46 10.76 18.74 - 106.9 1.46 7.66 0.89 95.91 0.48 4.88 79.72 1.41 (1.86)
CARV Carver Bancorp Inc. 702 13 3.40 5.99 1.92 NM - 135.2 - 7.75 2.45 27.64 (0.06) (0.80) 104.49 5.44 12.58
CYHC Country Bank Holding Co. 596 39 20,000.00 20,000.00 15,500.00 - - - 5.00 NA NA NA NA NA NA 0.00 -
ESBK Elmira Savings Bank 567 56 20.54 22.25 16.83 16.30 - 167.1 4.48 7.83 NA NA 0.77 7.81 69.63 0.45 0.20
SBHO Steuben Trust Corporation 528 57 33.75 38.00 31.50 10.26 - 104.6 3.56 10.39 0.38 177.12 1.08 10.50 62.37 0.00 -
GHDS Greater Hudson Bank 506 55 4.50 7.00 3.90 16.67 - 100.9 NA 10.87 NA NA 0.66 5.72 67.37 8.43 1.12
JFBC Jeffersonville Bancorp 488 67 15.75 16.50 12.94 12.60 - 108.3 3.56 12.61 NA NA 1.10 8.78 67.49 (4.49) (2.48)
GLNV Glenville Bank Holding Co. 467 16 77.25 78.00 77.25 - - - 2.33 7.32 0.43 199.25 0.48 5.93 78.74 0.00 -
CSKL Catskill Hudson Bancorp Inc. 452 12 17.25 18.50 16.75 - - - 1.86 NA NA NA NA NA NA 1.47 -
NUBK Kinderhook Bank Corp. 448 26 35.00 35.55 29.50 13.73 - 100.3 2.63 8.28 NA NA 0.63 7.30 72.68 1.45 1.45
BSPA Ballston Spa Bancorp Inc. 440 28 37.95 37.95 33.39 - - 94.8 3.27 6.79 NA NA 0.49 6.90 78.52 0.00 -
Source: SNL
Note: Universe includes publicly traded institutions with > $150 million in assets
* Indicates under agreement to be acquiredPage 5
BANK AND THRIFT COMPARABLE COMPANY ANALYSIS - JANNEY UNIVERSE
As of 1/27/2017
BS Market Data Capital Ratio Asset Quality Profitability Price Perf.
Tang.
Price / Equity/ NPAs + Rsrvs/
Total Market One Year LTM 2017E Tang. Div. Tang. 90 Day/ NPAs + LTM Eff.
Assets Value Stock High Low EPS EPS Book Yield Assets Assets 90 Day ROAA ROAE Ratio YTD 1 Week
Ticker Institution ($M) ($M) Price ($) ($) (x) (x) (%) (%) (%) (%) (%) (%) (%) (%) (%) (%)
GLDT Gold Coast Bank 400 48 12.10 14.00 10.50 19.94 - 116.7 NA 10.18 0.15 535.50 0.54 6.15 71.25 0.83 -
VSBN VSB Bancorp Inc. 333 28 15.20 15.99 12.11 11.88 - 90.9 2.11 9.18 NA NA 0.69 7.61 70.19 (3.49) (2.25)
DWNX Delhi Bank Corp. 308 43 27.85 35.35 26.50 31.65 - 163.7 2.34 8.47 0.71 25.00 0.45 4.82 77.44 0.18 (0.54)
NCXS National Bank of Coxsackie 298 29 61.00 73.25 60.56 18.94 - 111.2 1.64 8.70 1.73 21.97 0.51 6.40 79.99 0.00 -
BARK Bank of Akron 293 21 70.00 NA NA 12.41 - 74.8 4.00 9.59 2.93 53.30 0.61 6.39 71.92 0.00 -
FSBC FSB Bancorp Inc. 260 27 14.14 14.90 9.19 47.87 - 87.3 NA 12.11 0.01 NM 0.22 2.52 91.23 (0.42) 0.35
ESBS ES Bancshares Inc. 247 13 4.00 4.00 2.62 NM - 87.8 NA 6.12 NA NA 0.04 0.49 85.72 20.48 1.52
FIGR First National Bank of Groton 173 27 450.00 450.00 430.00 14.29 - 116.0 3.82 13.45 1.27 57.53 1.13 8.66 57.77 0.00 -
PUNB Putnam County NB of Carmel 170 NA 105.00 NA NA - - - NA 21.32 5.22 14.18 0.06 0.32 113.76 0.00 -
BAC Bank of America Corp. 2,187,702 234,829 23.36 23.55 10.99 15.57 13.39 - 1.28 NA NA NA 0.82 6.72 64.80 5.70 3.18
BBT BB&T Corp. 219,276 38,021 46.97 47.85 29.95 16.96 15.66 232.7 2.55 9.31 0.79 86.12 1.12 8.32 58.35 (0.11) 3.41
FCNCA First Citizens BancShares Inc. 32,991 4,416 371.86 384.12 217.41 19.81 - - 0.32 NA NA NA 0.70 7.51 74.59 4.75 3.44
CBF Capital Bank Finl Corp 9,931 2,094 40.45 40.75 27.71 31.60 21.18 - 1.19 NA NA NA 0.73 5.46 59.55 3.06 2.93
BNCN BNC Bancorp* 7,402 1,894 36.30 36.93 19.45 26.12 20.17 295.4 0.55 8.98 NA NA 1.00 8.81 53.95 13.79 9.34
YDKN Yadkin Financial Corporation* 7,351 1,674 32.35 35.18 20.42 26.30 16.94 259.4 1.24 9.24 1.16 14.19 0.86 6.51 53.37 (5.58) (0.31)
FBNC First Bancorp 3,615 619 29.72 30.00 17.15 22.35 16.74 - 1.08 NA 1.64 40.21 0.80 7.63 69.34 9.51 5.99
PSTB Park Sterling Corporation 3,255 645 12.15 12.18 5.90 31.97 20.95 229.6 1.32 8.84 0.47 78.84 0.63 5.62 64.40 12.60 11.88
HTBI HomeTrust Bancshares Inc. 2,774 473 25.20 27.05 16.97 33.16 26.81 130.0 NA 12.66 NA NA 0.48 3.66 73.51 (2.70) 0.20
SBNC Southern BancShares (NC) 2,491 172 2,100.00 2,100.00 1,600.00 14.12 - 95.0 0.08 9.16 0.40 135.94 0.60 5.93 76.03 0.00 -
LOB Live Oak Bancshares Inc. 1,755 697 20.35 20.40 12.55 52.18 22.61 312.8 0.39 12.70 NA NA 0.96 6.55 74.77 10.00 5.71
PBNC Paragon Commercial Corp. 1,504 248 45.57 45.87 26.40 17.00 16.07 182.5 NA 9.05 NA NA 0.95 11.35 56.35 4.23 2.94
ENFC Entegra Financial 1,293 142 22.00 22.16 16.11 22.45 14.10 109.4 NA 10.08 NA NA 0.55 4.72 70.82 6.80 4.51
PEBK Peoples Bancorp of NC Inc. 1,088 144 26.50 26.90 18.41 16.06 - 133.6 1.51 9.87 NA NA 0.85 8.11 77.85 5.70 1.92
FSBK First South Bancorp Inc. 991 117 12.28 12.41 7.86 16.82 - 143.3 0.98 8.26 NA NA 0.72 8.02 75.56 2.77 2.34
SLCT Select Bancorp Inc. 847 121 10.37 10.86 7.78 17.88 16.20 125.1 NA 11.51 NA NA 0.81 6.61 63.89 5.28 3.70
ASBB ASB Bncp Inc 797 120 31.80 31.80 24.07 21.63 - 131.8 NA 11.46 1.31 61.95 0.70 5.91 74.83 6.87 3.97
FOFN Four Oaks Fincorp Inc. 723 102 3.02 3.25 1.75 27.41 - 156.9 - 8.98 0.95 141.36 0.49 5.53 84.52 13.79 (2.41)
CLBH Carolina Bank Holdings Inc.* 709 139 27.49 27.62 13.04 27.77 - 211.5 NA 9.25 2.49 32.60 0.70 7.89 76.46 6.43 3.42
UWHR Uwharrie Capital Corp 552 38 5.35 6.00 3.87 28.54 - 110.6 NA 8.11 1.76 29.31 0.36 4.32 89.82 (1.82) (0.93)
BKOR Oak Ridge Financial Services 381 30 12.50 13.60 9.30 12.89 - 108.1 NA 7.24 NA NA 0.71 8.94 78.68 0.81 1.21
CART Carolina Trust BancShares Inc. 372 34 7.24 7.48 5.60 40.24 - 116.2 NA 8.49 2.42 40.93 0.29 3.36 82.82 13.18 4.37
LTLB Little Bank Inc 362 44 13.10 13.52 11.43 14.24 - 120.1 1.30 10.11 NA NA 0.85 8.56 65.58 0.00 -
KSBI KS Bancorp Inc. 360 25 18.95 19.91 11.75 11.77 - 101.7 0.63 6.78 NA NA 0.60 8.70 77.10 2.43 2.43
AQFH Aquesta Financial Holdings 349 30 9.25 10.50 7.50 14.02 - 122.0 1.14 7.18 0.56 135.62 0.66 8.71 76.49 1.65 1.65
MFBP M&F Bancorp Inc. 310 10 5.01 5.31 2.75 - - 50.0 - 10.35 7.19 11.19 (1.26) (10.33) 101.81 17.88 (5.29)
SRYB Surrey Bancorp 268 42 11.75 12.50 9.50 13.99 - 112.2 NA 15.26 1.58 89.66 1.33 8.82 58.58 3.98 4.44
PARA Premara Financial Inc. 244 29 9.27 9.95 6.70 NM - 120.8 NA 9.97 0.84 100.34 0.05 0.46 90.11 (1.90) -
SNBN Sound Banking Co. 191 14 8.40 8.45 7.42 - - 87.5 NA 8.56 1.10 95.93 0.61 6.86 73.63 4.74 4.61
NORTH CAROLINA BANKS AND THRIFTS
Source: SNL
Note: Universe includes publicly traded institutions with > $150 million in assets
* Indicates under agreement to be acquiredPage 6

BANK AND THRIFT COMPARABLE COMPANY ANALYSIS - JANNEY UNIVERSE
As of 1/27/2017
BS Market Data Capital Ratio Asset Quality Profitability Price Perf.
Tang.
Price / Equity/ NPAs + Rsrvs/
Total Market One Year LTM 2017E Tang. Div. Tang. 90 Day/ NPAs + LTM Eff.
Assets Value Stock High Low EPS EPS Book Yield Assets Assets 90 Day ROAA ROAE Ratio YTD 1 Week
Ticker Institution ($M) ($M) Price ($) ($) (x) (x) (%) (%) (%) (%) (%) (%) (%) (%) (%) (%)
BLHK BlueHarbor Bank 174 22 8.25 10.75 7.16 20.12 - - NA 13.58 NA NA 0.75 5.29 68.40 1.48 1.23
FITB Fifth Third Bancorp 142,177 20,083 26.76 27.88 13.84 13.87 15.20 161.3 2.09 9.88 NA NA 1.10 9.38 61.65 (0.78) 1.79
KEY KeyCorp 136,453 19,751 18.30 18.77 9.88 22.88 14.08 183.1 1.86 9.32 0.66 95.12 0.69 6.24 65.17 0.16 2.46
HBAN Huntington Bancshares Inc. 99,729 14,961 13.78 14.17 7.95 20.57 14.51 219.5 2.32 8.10 NA NA 0.82 8.16 60.65 4.24 5.03
FFBC First Financial Bancorp. 8,438 1,745 28.15 29.80 15.04 19.69 18.40 265.9 2.42 7.97 NA NA 1.07 10.48 58.31 (1.05) 1.44
PRK Park National Corp. 7,468 1,737 113.20 122.88 79.01 20.25 19.82 259.2 3.32 9.06 1.63 41.49 1.16 11.68 60.52 (5.40) 0.57
PEBO Peoples Bancorp Inc. 3,432 586 32.22 32.99 16.72 18.84 17.32 201.1 2.11 8.87 NA NA 0.94 7.20 64.77 (0.74) 2.51
FDEF First Defiance Financial 2,476 446 49.68 52.31 34.80 15.57 15.29 194.1 2.01 9.53 NA NA 1.20 10.10 61.00 (2.09) 4.00
UCFC United Community Finl Corp. 2,191 403 8.65 9.50 5.47 21.68 16.63 162.5 1.39 11.32 NA NA 0.91 7.58 60.62 (3.24) 6.79
FMNB Farmers National Banc Corp. 1,966 352 13.00 15.50 8.06 17.11 14.94 209.2 1.23 8.75 NA NA 1.07 9.72 61.33 (8.45) (1.89)
CIVB Civista Bancshares Inc. 1,377 171 20.48 20.97 9.75 13.04 14.52 189.0 1.17 8.11 NA NA 1.19 12.90 65.02 5.40 1.79
LCNB LCNB Corp. 1,307 224 22.45 25.00 15.51 17.96 18.71 206.7 2.85 8.54 NA NA 0.96 8.60 61.21 (3.44) 6.15
FMAO Farmers & Merchants Bancorp 1,044 164 35.50 50.00 26.61 14.55 14.67 134.2 2.59 11.75 0.29 221.29 1.12 9.16 60.94 1.43 (3.01)
OVBC Ohio Valley Banc Corp. 970 132 28.25 29.34 21.40 17.23 - 133.5 2.97 10.25 2.68 28.98 0.80 7.21 70.78 3.86 3.67
CNUN Community Bancshares Inc. 894 NA NA NA NA - - - NA 10.47 0.83 74.31 0.81 7.16 68.41 NA NA
SBFG SB Financial Group Inc 816 85 17.55 18.44 9.74 12.72 - 151.4 1.48 8.77 NA NA 1.11 10.39 68.63 9.35 6.43
CHBH Croghan Bancshares Inc. 809 101 44.50 45.95 35.32 11.47 - 129.4 3.24 10.00 1.08 53.41 1.12 8.78 63.68 (3.16) 4.09
HLAN Heartland BancCorp 781 114 72.03 73.50 44.55 14.49 - 160.7 2.39 9.09 0.83 87.46 1.05 11.43 62.78 12.53 (2.00)
MBCN Middlefield Banc Corp. 762 111 39.50 39.89 31.19 12.15 11.03 120.8 2.73 9.71 1.31 63.23 0.87 9.66 66.98 2.07 1.28
CSBB CSB Bancorp Inc. 670 88 32.00 33.51 21.35 13.01 - 145.5 2.50 9.07 NA NA 1.03 10.44 60.14 3.23 0.03
CLDB Cortland Bancorp 655 79 17.84 19.00 14.15 16.07 - 136.7 1.79 8.80 NA NA 0.80 8.27 75.35 1.94 (0.06)
UBOH United Bancshares Inc. 633 75 23.00 23.00 16.00 13.69 - - 2.09 NA NA NA 0.89 7.45 73.19 7.40 6.98
DCBF DCB Financial Corp* 565 140 19.14 19.14 6.72 NM - 236.5 - 10.50 1.74 46.54 0.05 0.50 95.62 3.18 7.59
KLIB Killbuck Bancshares Inc. 494 74 125.00 126.00 107.00 14.55 - 143.4 2.64 10.52 0.03 NM 1.05 9.84 58.24 16.82 -
WAYN Wayne Savings Bancshares 446 50 17.86 17.90 11.90 19.41 - 125.2 2.02 8.94 0.96 68.11 0.57 6.20 76.07 8.24 3.18
CBKM Consumers Bancorp Inc. 441 45 16.62 18.45 15.30 18.67 - 107.3 2.89 9.56 NA NA 0.56 5.51 74.10 3.81 3.42
UBCP United Bancorp Inc. 438 69 12.70 15.25 8.72 17.89 - 161.4 3.46 9.73 NA NA 0.86 8.40 70.21 (5.93) 0.40
MTFC Minster Financial Corp. 435 54 51.50 51.50 50.00 - - - 4.08 NA NA NA NA NA NA 0.00 -
CFBK Central Federal Corp. 408 33 2.05 2.18 1.10 9.75 - 118.1 - 9.58 1.03 164.20 1.31 12.37 79.60 17.02 18.56
ANDC Andover Bancorp Inc. 401 62 24.75 25.00 22.50 17.91 - 155.6 2.87 9.94 0.68 49.96 0.86 8.25 72.00 3.13 1.02
PFOH Perpetual Federal Savings Bank 391 62 24.95 25.94 19.40 12.19 - 90.7 3.53 17.38 NA NA 1.33 7.58 32.68 3.31 2.93
CMOH Commercial Bancshares Inc.* 347 69 56.92 58.59 29.15 17.57 - 178.1 1.76 11.12 1.26 88.98 1.15 10.48 65.48 (1.71) 4.84
OLCB Ohio Legacy Corp* 346 39 20.00 22.03 10.30 33.33 - 150.2 NA 8.44 0.92 90.87 0.43 4.72 77.08 (3.85) (1.14)
FFDF FFD Financial Corp. 319 36 36.50 36.50 28.85 9.24 - 127.5 3.12 8.91 NA NA 1.36 14.52 56.63 8.95 7.35
CBCZ Comunibanc Corp. 283 20 24.00 24.00 20.17 16.35 - 68.9 3.25 10.16 3.72 15.81 0.43 4.48 80.02 7.53 0.42
ASBN ASB Financial Corp. 272 29 14.44 14.44 11.35 12.67 - 114.1 4.99 9.30 NA NA 0.84 8.22 75.87 6.96 8.16
HCKG Hocking Valley Bcshs Inc. 245 29 635.02 635.02 590.00 - - - 0.19 NA NA NA NA NA NA 0.80 0.00
FSDK First Citizens National Bank 241 27 85.48 90.00 80.25 19.23 - 66.7 2.53 17.06 0.03 NM 0.59 3.51 77.60 1.15 (0.01)
OHIO BANKS AND THRIFTS
Source: SNL
Note: Universe includes publicly traded institutions with > $150 million in assets
* Indicates under agreement to be acquiredPage 7

BANK AND THRIFT COMPARABLE COMPANY ANALYSIS - JANNEY UNIVERSE
As of 1/27/2017
BS Market Data Capital Ratio Asset Quality Profitability Price Perf.
Tang.
Price / Equity/ NPAs + Rsrvs/
Total Market One Year LTM 2017E Tang. Div. Tang. 90 Day/ NPAs + LTM Eff.
Assets Value Stock High Low EPS EPS Book Yield Assets Assets 90 Day ROAA ROAE Ratio YTD 1 Week
Ticker Institution ($M) ($M) Price ($) ($) (x) (x) (%) (%) (%) (%) (%) (%) (%) (%) (%) (%)
FIDS FNB Inc. 224 24 35.00 38.00 33.00 - - - 2.86 NA NA NA NA NA NA 0.00 -
FIBH First Bancshares Inc. 214 19 32.50 34.00 31.55 14.13 - 112.3 2.46 7.71 NA NA 0.67 8.27 79.26 0.00 1.05
HLFN Home Loan Financial Corp. 205 38 27.01 32.00 20.78 12.11 - 147.5 3.70 12.51 NA NA 1.55 12.39 51.53 (6.38) 3.76
CZID Ctzns Independent Bncp Inc. 181 15 22.00 26.50 18.30 14.38 - 80.4 - 10.45 2.54 42.50 0.57 5.79 86.77 (16.98) -
FBOO First Bank of Ohio 175 33 575.00 575.00 531.10 16.07 - 50.2 NA 36.99 0.32 419.46 1.18 3.18 46.12 6.53 -
PDRB Pandora Bancshares Inc. 158 11 88.30 88.30 85.50 13.73 - 79.9 2.49 8.85 1.65 56.95 0.54 6.20 81.22 0.00 -
HCFL Home City Financial Corp. 156 18 22.76 23.57 17.50 11.73 - 102.1 2.11 11.41 NA NA 1.03 9.48 60.25 8.12 5.86
PNC PNC Financial Services Group 366,380 58,995 121.64 121.98 77.40 16.66 15.39 182.0 1.81 10.52 NA NA 1.10 8.59 61.01 4.00 3.66
FNB F.N.B. Corp. 21,845 3,189 15.11 16.43 11.44 19.37 14.67 231.3 3.18 7.16 NA NA 0.83 6.84 55.20 (5.74) (0.26)
FULT Fulton Financial Corp. 18,944 3,211 18.45 19.45 11.78 19.84 18.45 202.0 2.17 8.63 NA NA 0.88 7.69 66.91 (1.86) 1.93
NWBI Northwest Bancshares, Inc. 9,624 1,752 17.23 19.10 11.78 35.16 18.04 210.9 3.71 8.95 1.16 54.58 0.55 4.28 62.72 (4.44) (1.54)
CUBI Customers Bancorp Inc 9,383 1,056 34.86 36.93 21.66 15.09 13.81 - NA NA NA NA 0.86 11.29 43.86 (2.68) 1.51
STBA S&T Bancorp Inc. 6,943 1,324 37.93 39.84 23.06 18.50 17.32 - 2.11 NA NA NA 1.08 8.67 54.70 (2.84) 1.88
FCF First Commonwealth Financial 6,684 1,285 14.45 14.61 7.89 21.57 19.27 233.2 2.21 8.50 0.76 98.42 0.89 8.02 58.53 1.90 5.94
BNCL Beneficial Bancorp Inc 5,580 1,363 17.95 19.00 12.30 57.90 37.40 161.3 1.34 15.70 0.30 261.73 0.44 2.13 73.26 (2.45) 3.16
UVSP Univest Corp. of Pennsylvania 4,231 778 29.25 31.50 18.43 34.82 16.96 - 2.74 NA 0.64 64.51 0.56 4.46 71.17 (5.34) 2.45
TSC TriState Capital Holdings Inc. 3,930 644 22.65 23.10 10.77 22.43 19.70 226.1 NA 7.37 NA NA 0.81 8.48 66.15 2.49 6.09
BMTC Bryn Mawr Bank Corp. 3,422 702 41.45 42.60 23.92 19.55 17.94 274.3 2.03 7.76 0.44 115.05 1.16 9.75 61.00 (1.66) 3.24
CCNE CNB Financial Corp. 2,574 374 25.84 28.43 17.02 18.20 15.66 219.7 2.55 6.72 0.98 65.04 0.85 9.69 63.60 (3.37) 2.83
PFIS Peoples Financial Services 1,971 340 45.94 50.54 33.76 18.16 - 180.1 2.70 9.91 0.72 110.48 1.00 7.42 58.69 (5.67) 1.14
FRBK Republic First Bancorp Inc. 1,925 426 7.50 9.15 3.70 62.50 51.72 - NA NA NA NA 0.30 3.97 85.07 (10.18) (3.23)
ESSA ESSA Bancorp Inc. 1,779 183 16.00 16.84 12.69 22.22 22.22 118.1 2.25 8.81 NA NA 0.44 4.37 77.72 1.78 1.65
CVLY Codorus Valley Bancorp Inc. 1,612 226 26.88 29.34 18.72 17.34 - - 2.01 NA NA NA 0.88 8.48 65.63 (6.01) 5.99
ORRF Orrstown Financial Services 1,415 188 22.75 23.75 16.60 28.09 22.30 - 1.76 NA 0.59 153.56 0.50 4.80 84.79 1.56 1.79
PWOD Penns Woods Bancorp Inc. 1,349 217 45.91 52.65 37.26 17.39 - 182.1 4.09 8.98 NA NA 0.93 8.96 65.33 (9.09) (0.26)
CZNC Citizens & Northern Corp. 1,242 302 24.90 26.57 19.26 19.15 19.01 173.3 4.18 14.15 1.90 35.97 1.28 8.37 62.12 (4.96) (2.31)
ACNB ACNB Corp. 1,209 181 29.85 32.85 21.03 16.22 - 159.2 2.68 9.46 1.03 115.91 0.96 9.52 68.05 (4.48) -
CZFS Citizens Financial Services 1,198 171 51.00 53.50 46.53 14.12 - 165.7 3.29 8.76 1.19 57.32 1.03 9.94 57.38 (3.77) -
FNCB FNCB Bancorp Inc. 1,195 107 6.42 6.90 4.75 16.89 - 118.5 1.87 7.54 0.71 99.54 0.57 6.82 74.02 6.12 1.10
ASRV AmeriServ Financial Inc. 1,154 75 3.95 4.00 2.90 32.92 - 89.5 1.52 7.31 NA NA 0.20 2.30 85.03 6.76 (1.25)
FRAF Franklin Financial Services 1,127 127 29.50 29.50 20.11 15.69 - 118.5 2.85 9.61 NA NA 0.74 7.04 71.59 3.15 0.34
NWFL Norwood Financial Corp. 1,111 148 35.66 36.50 26.25 20.61 - 150.2 3.59 8.99 NA NA 0.74 6.18 58.23 7.60 4.61
DNBF DNB Financial Corp. 1,071 130 30.75 30.80 23.05 19.84 12.15 164.6 0.91 7.51 NA NA 0.59 7.38 70.96 8.27 8.85
QNBC QNB Corp. 1,063 125 36.75 37.70 29.20 13.97 - 134.0 3.27 8.80 1.34 52.00 0.87 9.45 66.16 2.65 (1.34)
SOME Somerset Trust Holding Company 1,039 114 46.50 48.99 36.55 11.05 - 119.8 2.75 9.16 1.32 74.75 1.00 11.37 77.83 3.33 2.20
MPB Mid Penn Bancorp Inc. 1,033 105 24.80 25.95 14.65 13.41 - 158.7 2.10 6.43 NA NA 0.78 10.73 72.39 4.09 (3.69)
FSMK 1st Summit Bncp Johnstown Inc. 991 113 103.00 103.00 95.00 11.34 - 125.2 2.33 9.13 0.54 117.24 1.05 11.59 57.09 0.00 -
ENBP ENB Financial Corp 984 100 35.01 35.40 31.50 13.21 - - 3.20 9.65 NA NA 0.80 7.74 79.86 1.77 0.03
PENNSYLVANIA BANKS AND THRIFTS
Source: SNL
Note: Universe includes publicly traded institutions with > $150 million in assets
* Indicates under agreement to be acquiredPage 8
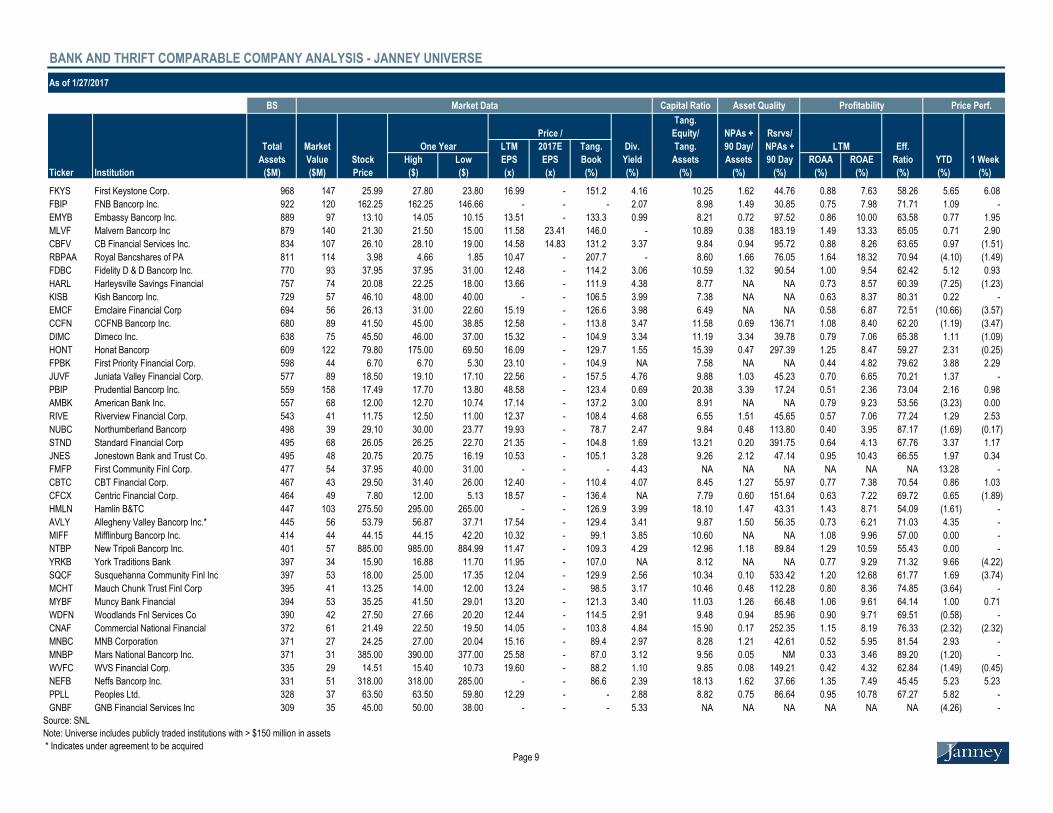
BANK AND THRIFT COMPARABLE COMPANY ANALYSIS - JANNEY UNIVERSE
As of 1/27/2017
BS Market Data Capital Ratio Asset Quality Profitability Price Perf.
Tang.
Price / Equity/ NPAs + Rsrvs/
Total Market One Year LTM 2017E Tang. Div. Tang. 90 Day/ NPAs + LTM Eff.
Assets Value Stock High Low EPS EPS Book Yield Assets Assets 90 Day ROAA ROAE Ratio YTD 1 Week
Ticker Institution ($M) ($M) Price ($) ($) (x) (x) (%) (%) (%) (%) (%) (%) (%) (%) (%) (%)
FKYS First Keystone Corp. 968 147 25.99 27.80 23.80 16.99 - 151.2 4.16 10.25 1.62 44.76 0.88 7.63 58.26 5.65 6.08
FBIP FNB Bancorp Inc. 922 120 162.25 162.25 146.66 - - - 2.07 8.98 1.49 30.85 0.75 7.98 71.71 1.09 -
EMYB Embassy Bancorp Inc. 889 97 13.10 14.05 10.15 13.51 - 133.3 0.99 8.21 0.72 97.52 0.86 10.00 63.58 0.77 1.95
MLVF Malvern Bancorp Inc 879 140 21.30 21.50 15.00 11.58 23.41 146.0 - 10.89 0.38 183.19 1.49 13.33 65.05 0.71 2.90
CBFV CB Financial Services Inc. 834 107 26.10 28.10 19.00 14.58 14.83 131.2 3.37 9.84 0.94 95.72 0.88 8.26 63.65 0.97 (1.51)
RBPAA Royal Bancshares of PA 811 114 3.98 4.66 1.85 10.47 - 207.7 - 8.60 1.66 76.05 1.64 18.32 70.94 (4.10) (1.49)
FDBC Fidelity D & D Bancorp Inc. 770 93 37.95 37.95 31.00 12.48 - 114.2 3.06 10.59 1.32 90.54 1.00 9.54 62.42 5.12 0.93
HARL Harleysville Savings Financial 757 74 20.08 22.25 18.00 13.66 - 111.9 4.38 8.77 NA NA 0.73 8.57 60.39 (7.25) (1.23)
KISB Kish Bancorp Inc. 729 57 46.10 48.00 40.00 - - 106.5 3.99 7.38 NA NA 0.63 8.37 80.31 0.22 -
EMCF Emclaire Financial Corp 694 56 26.13 31.00 22.60 15.19 - 126.6 3.98 6.49 NA NA 0.58 6.87 72.51 (10.66) (3.57)
CCFN CCFNB Bancorp Inc. 680 89 41.50 45.00 38.85 12.58 - 113.8 3.47 11.58 0.69 136.71 1.08 8.40 62.20 (1.19) (3.47)
DIMC Dimeco Inc. 638 75 45.50 46.00 37.00 15.32 - 104.9 3.34 11.19 3.34 39.78 0.79 7.06 65.38 1.11 (1.09)
HONT Honat Bancorp 609 122 79.80 175.00 69.50 16.09 - 129.7 1.55 15.39 0.47 297.39 1.25 8.47 59.27 2.31 (0.25)
FPBK First Priority Financial Corp. 598 44 6.70 6.70 5.30 23.10 - 104.9 NA 7.58 NA NA 0.44 4.82 79.62 3.88 2.29
JUVF Juniata Valley Financial Corp. 577 89 18.50 19.10 17.10 22.56 - 157.5 4.76 9.88 1.03 45.23 0.70 6.65 70.21 1.37 -
PBIP Prudential Bancorp Inc. 559 158 17.49 17.70 13.80 48.58 - 123.4 0.69 20.38 3.39 17.24 0.51 2.36 73.04 2.16 0.98
AMBK American Bank Inc. 557 68 12.00 12.70 10.74 17.14 - 137.2 3.00 8.91 NA NA 0.79 9.23 53.56 (3.23) 0.00
RIVE Riverview Financial Corp. 543 41 11.75 12.50 11.00 12.37 - 108.4 4.68 6.55 1.51 45.65 0.57 7.06 77.24 1.29 2.53
NUBC Northumberland Bancorp 498 39 29.10 30.00 23.77 19.93 - 78.7 2.47 9.84 0.48 113.80 0.40 3.95 87.17 (1.69) (0.17)
STND Standard Financial Corp 495 68 26.05 26.25 22.70 21.35 - 104.8 1.69 13.21 0.20 391.75 0.64 4.13 67.76 3.37 1.17
JNES Jonestown Bank and Trust Co. 495 48 20.75 20.75 16.19 10.53 - 105.1 3.28 9.26 2.12 47.14 0.95 10.43 66.55 1.97 0.34
FMFP First Community Finl Corp. 477 54 37.95 40.00 31.00 - - - 4.43 NA NA NA NA NA NA 13.28 -
CBTC CBT Financial Corp. 467 43 29.50 31.40 26.00 12.40 - 110.4 4.07 8.45 1.27 55.97 0.77 7.38 70.54 0.86 1.03
CFCX Centric Financial Corp. 464 49 7.80 12.00 5.13 18.57 - 136.4 NA 7.79 0.60 151.64 0.63 7.22 69.72 0.65 (1.89)
HMLN Hamlin B&TC 447 103 275.50 295.00 265.00 - - 126.9 3.99 18.10 1.47 43.31 1.43 8.71 54.09 (1.61) -
AVLY Allegheny Valley Bancorp Inc.* 445 56 53.79 56.87 37.71 17.54 - 129.4 3.41 9.87 1.50 56.35 0.73 6.21 71.03 4.35 -
MIFF Mifflinburg Bancorp Inc. 414 44 44.15 44.15 42.20 10.32 - 99.1 3.85 10.60 NA NA 1.08 9.96 57.00 0.00 -
NTBP New Tripoli Bancorp Inc. 401 57 885.00 985.00 884.99 11.47 - 109.3 4.29 12.96 1.18 89.84 1.29 10.59 55.43 0.00 -
YRKB York Traditions Bank 397 34 15.90 16.88 11.70 11.95 - 107.0 NA 8.12 NA NA 0.77 9.29 71.32 9.66 (4.22)
SQCF Susquehanna Community Finl Inc 397 53 18.00 25.00 17.35 12.04 - 129.9 2.56 10.34 0.10 533.42 1.20 12.68 61.77 1.69 (3.74)
MCHT Mauch Chunk Trust Finl Corp 395 41 13.25 14.00 12.00 13.24 - 98.5 3.17 10.46 0.48 112.28 0.80 8.36 74.85 (3.64) -
MYBF Muncy Bank Financial 394 53 35.25 41.50 29.01 13.20 - 121.3 3.40 11.03 1.26 66.48 1.06 9.61 64.14 1.00 0.71
WDFN Woodlands Fnl Services Co 390 42 27.50 27.66 20.20 12.44 - 114.5 2.91 9.48 0.94 85.96 0.90 9.71 69.51 (0.58) -
CNAF Commercial National Financial 372 61 21.49 22.50 19.50 14.05 - 103.8 4.84 15.90 0.17 252.35 1.15 8.19 76.33 (2.32) (2.32)
MNBC MNB Corporation 371 27 24.25 27.00 20.04 15.16 - 89.4 2.97 8.28 1.21 42.61 0.52 5.95 81.54 2.93 -
MNBP Mars National Bancorp Inc. 371 31 385.00 390.00 377.00 25.58 - 87.0 3.12 9.56 0.05 NM 0.33 3.46 89.20 (1.20) -
WVFC WVS Financial Corp. 335 29 14.51 15.40 10.73 19.60 - 88.2 1.10 9.85 0.08 149.21 0.42 4.32 62.84 (1.49) (0.45)
NEFB Neffs Bancorp Inc. 331 51 318.00 318.00 285.00 - - 86.6 2.39 18.13 1.62 37.66 1.35 7.49 45.45 5.23 5.23
PPLL Peoples Ltd. 328 37 63.50 63.50 59.80 12.29 - - 2.88 8.82 0.75 86.64 0.95 10.78 67.27 5.82 -
GNBF GNB Financial Services Inc 309 35 45.00 50.00 38.00 - - - 5.33 NA NA NA NA NA NA (4.26) -
Source: SNL
Note: Universe includes publicly traded institutions with > $150 million in assets
* Indicates under agreement to be acquiredPage 9

BANK AND THRIFT COMPARABLE COMPANY ANALYSIS - JANNEY UNIVERSE
As of 1/27/2017
BS Market Data Capital Ratio Asset Quality Profitability Price Perf.
Tang.
Price / Equity/ NPAs + Rsrvs/
Total Market One Year LTM 2017E Tang. Div. Tang. 90 Day/ NPAs + LTM Eff.
Assets Value Stock High Low EPS EPS Book Yield Assets Assets 90 Day ROAA ROAE Ratio YTD 1 Week
Ticker Institution ($M) ($M) Price ($) ($) (x) (x) (%) (%) (%) (%) (%) (%) (%) (%) (%) (%)
LDKB Landmark Bancorp Inc. 307 26 13.95 13.95 11.40 23.25 - 95.5 2.29 9.48 3.40 29.96 0.41 4.47 75.32 4.11 3.33
CTYP Community Bankers' Corporation 273 16 7.00 8.50 6.60 - - - 4.97 NA NA NA NA NA NA 0.00 -
SDLJ Scottdale Bank & Trust Company 267 23 460.00 499.00 441.00 NM - 50.3 - 17.41 0.89 32.01 0.07 0.40 83.41 1.55 (0.22)
EFSG Enterprise Financial Services 262 8 8.70 9.50 6.50 - - - - NA NA NA NA NA NA 8.48 -
FLEW Fleetwood Bank Corp. 242 19 64.50 65.00 58.30 17.21 - 84.4 3.10 9.23 0.69 83.64 0.47 4.96 81.95 (0.77) -
FRSB First Resource Bk 241 17 8.25 8.50 6.02 13.10 - 98.3 NA 7.31 NA NA 0.60 7.48 73.15 0.61 (1.20)
QNTO Quaint Oak Bancorp Inc. 209 23 12.20 12.25 11.50 16.49 - 118.7 1.31 9.26 1.43 49.72 0.74 7.33 70.75 1.67 0.58
BKCS Bucks County Bank 203 20 8.15 10.05 5.55 - - 92.0 NA 10.70 2.05 45.69 0.31 2.86 82.57 16.43 -
JTNB JTNB Bancorp Inc. 192 14 15.05 16.00 13.00 14.49 - 77.5 4.25 9.57 0.39 114.89 0.51 5.39 82.34 0.33 1.01
MCBG Mercersburg Financial Corp. 176 19 24.00 33.00 22.00 20.18 - 97.1 2.33 11.36 0.52 168.71 0.57 4.87 77.90 4.35 -
APLO Apollo Bancorp Inc. 164 22 42.75 46.00 39.00 15.16 - - 4.58 NA NA NA 0.89 NA 75.83 (1.72) (1.72)
CFG Citizens Financial Group Inc. 149,520 18,937 36.99 37.95 18.04 18.78 16.33 150.0 1.51 9.02 NA NA 0.73 5.24 64.37 3.82 3.27
WASH Washington Trust Bancorp Inc. 4,381 970 56.50 58.30 34.59 20.93 19.45 306.5 2.62 7.35 NA NA 1.16 11.96 56.03 0.80 7.93
CWAY Coastway Bncp, Inc. 633 74 16.65 16.65 12.10 21.08 - 107.3 NA 10.95 2.20 17.65 0.59 4.83 75.85 6.39 2.43
SSB South State Corporation 8,901 2,677 91.65 92.05 59.19 21.93 19.90 293.6 1.40 8.88 NA NA 1.16 9.17 60.73 4.86 5.65
CARO Carolina Financial Corp. 1,684 432 30.07 31.44 15.26 21.18 16.71 243.0 0.53 9.26 NA NA 1.14 11.61 64.90 (2.34) 2.80
SFST Southern First Bancshares Inc 1,340 237 36.65 38.55 21.83 18.89 17.71 217.5 NA 8.13 NA NA 1.04 12.73 56.09 1.81 5.16
CNBW CNB Corp. 1,111 107 66.00 66.00 54.75 12.75 - 99.7 2.65 9.69 0.94 73.27 0.79 8.08 66.62 0.00 -
FCCO First Community Corp. 915 131 19.60 21.00 12.66 20.00 18.49 173.7 1.84 8.33 0.77 74.29 0.75 8.08 71.38 8.59 1.82
SFDL Security Federal Corp. 824 74 25.00 35.00 20.00 12.95 - 99.1 1.28 11.70 1.64 60.11 0.79 6.82 75.15 (28.57) -
CRLN Carolina Alliance Bank 626 78 11.99 12.35 8.83 20.50 - 119.6 NA 10.55 0.92 83.07 0.62 5.62 74.13 (1.72) 1.01
CBCO Coastal Banking Co. 613 56 15.40 15.60 11.25 8.02 - 114.9 NA 7.90 NA NA 1.19 15.56 86.86 2.59 0.66
OFED Oconee Federal Financial Corp. 484 133 22.84 24.25 18.21 26.25 - 161.6 1.75 17.03 1.15 17.39 1.05 6.21 60.23 (2.81) 3.16
GRRB GrandSouth Bancorporation 482 65 14.25 15.30 12.51 - - - 2.81 10.67 NA NA NA NA NA 6.18 7.55
SABK South Atlantic Bancshares Inc. 437 69 18.00 18.00 9.96 24.63 - 179.8 NA 8.77 NA NA 0.61 7.00 76.41 12.50 20.00
BKSC Bank of South Carolina Corp. 414 107 21.60 23.97 14.89 20.77 - - 2.59 NA NA NA 1.28 NA NA 3.35 (0.23)
FSRL First Reliance Bcshs 409 28 6.15 6.15 3.75 12.06 - 108.9 NA 6.35 NA NA 0.83 8.49 76.78 3.54 0.33
HCFB HCSB Financial Corp. 381 164 0.33 0.59 0.11 NM - 447.2 NA 9.60 6.76 18.14 1.18 37.72 129.57 118.03 13.83
CFOK Community First Bancorporation 324 27 6.45 8.50 5.38 NM - 89.5 NA 10.21 2.09 45.50 0.09 0.94 99.14 (2.26) 0.02
FSBS First South Bancorp Inc. 236 10 1.00 1.35 0.78 - - - - NA NA NA NA NA NA 23.46 -
FHN First Horizon National Corp. 28,555 4,761 20.38 20.84 11.51 21.68 18.12 226.5 1.77 8.79 NA NA 0.87 8.86 68.55 1.85 5.00
PNFP Pinnacle Financial Partners 11,195 3,380 68.00 71.85 43.32 23.37 20.96 339.0 0.82 8.75 0.44 118.41 1.27 9.47 53.08 (1.88) 7.42
FBK FB Financial Corp 3,187 616 25.69 28.04 19.81 10.79 15.11 222.2 NA 8.84 0.78 93.99 1.40 16.03 73.56 (1.00) (3.06)
FSB Franklin Financial Network Inc 2,943 513 39.35 42.80 22.83 16.26 15.87 197.6 NA 8.86 NA NA 1.10 13.50 52.04 (5.97) (2.24)
RHODE ISLAND BANKS AND THRIFTS
SOUTH CAROLINA BANKS AND THRIFTS
TENNESSEE BANKS AND THRIFTS
Source: SNL
Note: Universe includes publicly traded institutions with > $150 million in assets
* Indicates under agreement to be acquiredPage 10

BANK AND THRIFT COMPARABLE COMPANY ANALYSIS - JANNEY UNIVERSE
As of 1/27/2017
BS Market Data Capital Ratio Asset Quality Profitability Price Perf.
Tang.
Price / Equity/ NPAs + Rsrvs/
Total Market One Year LTM 2017E Tang. Div. Tang. 90 Day/ NPAs + LTM Eff.
Assets Value Stock High Low EPS EPS Book Yield Assets Assets 90 Day ROAA ROAE Ratio YTD 1 Week
Ticker Institution ($M) ($M) Price ($) ($) (x) (x) (%) (%) (%) (%) (%) (%) (%) (%) (%) (%)
WBHC Wilson Bank Holding Co. 2,197 NA NA NA NA - - - NA 10.91 NA NA 1.21 10.87 NA NA NA
FIZN First Citizens Bancshares Inc. 1,624 214 52.00 52.00 45.75 13.16 - 145.2 1.92 9.03 0.57 99.01 1.02 9.87 61.27 1.96 1.96
FFMH First Farmers Merchants Corp. 1,338 134 29.50 29.60 25.21 13.29 - 123.4 2.58 8.18 NA NA 0.79 8.48 70.76 2.97 2.97
CSTR CapStar Financial Hlgs Inc. 1,318 223 19.94 22.35 15.50 25.56 21.91 181.2 NA 10.07 0.41 212.71 0.68 7.35 67.70 (9.20) 4.95
SMBK SmartFinancial Inc. 1,062 169 21.74 21.99 14.21 27.87 19.41 148.0 - 9.34 NA NA 0.57 5.60 75.24 17.13 14.42
CUBN Commerce Union Bancshares Inc. 912 172 22.15 22.99 13.50 19.09 - 183.4 0.99 10.45 NA NA 0.89 7.58 72.66 2.98 2.55
FABK First Advantage Bancorp 526 72 19.00 19.00 15.41 23.75 - 109.3 2.11 12.49 2.05 59.71 0.64 4.77 76.00 5.56 8.57
AFCB Athens Bancshares Corporation 426 58 32.76 34.75 24.25 19.05 - 132.6 0.61 10.42 1.16 83.84 0.86 6.63 73.84 (5.73) -
TRUX Truxton Corporation 407 78 29.50 29.50 24.00 14.32 - 169.4 2.71 11.33 NA NA 1.35 12.27 61.38 5.36 1.72
IBTN InsCorp Inc. 362 29 16.24 19.00 13.01 - - 78.0 1.11 10.42 0.25 412.74 NA NA NA 1.31 0.43
PGNN Paragon Finl Solutions Inc. 330 34 8.15 8.20 6.16 18.71 - 96.2 NA 10.77 0.64 184.17 0.59 5.71 76.01 5.84 0.62
SVRH Sevier County Bancshares Inc. 322 22 15.00 15.00 15.00 NM - 116.2 NA 5.89 10.09 8.90 (0.05) (0.79) 101.74 0.00 -
TNCB Tennessee Cmnty Bk Hldgs Inc. 211 NA NA NA NA - - - NA 10.39 1.70 73.07 0.55 5.37 86.12 NA NA
UNTN United Tennessee Bankshares 201 17 19.90 19.90 18.00 11.18 - - 2.61 10.49 NA NA 0.75 7.20 66.00 4.74 2.05
SCYT Security Bancorp Inc. 186 16 42.00 42.00 36.51 14.06 - 84.5 2.38 10.32 0.43 187.88 0.61 6.19 72.37 0.00 -
FCCT First Community Corp. 177 8 4.75 4.93 3.90 - - - - NA NA NA NA NA NA 0.00 -
SBKT Sumner Bank & Trust 154 24 16.70 20.00 12.00 - - - NA 9.23 1.19 67.60 0.40 4.51 78.89 0.00 -
MBVT Merchants Bancshares Inc.* 2,067 359 52.15 54.80 27.00 24.14 20.74 241.7 2.15 7.22 NA NA 0.76 9.61 62.67 (3.78) 2.15
UNB Union Bankshares Inc. 692 186 41.60 50.15 27.11 21.78 - 349.5 2.79 7.72 NA NA 1.30 15.29 69.02 (8.47) 1.09
CMTV Community Bancorp. 638 78 15.50 16.00 13.30 14.49 - 195.5 - 6.81 NA NA 0.91 10.33 NA 0.00 -
MDVT Middlebury National Corp. 338 30 34.00 34.00 28.75 - - - 2.59 NA NA NA NA NA NA 9.15 3.50
PPAL Peoples Tr Co St Albns 259 23 37.50 37.50 28.00 18.14 - 71.6 1.33 12.52 2.02 42.41 0.50 4.17 85.25 1.35 1.35
COF Capital One Financial Corp. 357,033 42,810 89.15 91.64 58.03 12.94 11.30 150.7 1.79 9.57 NA NA 1.10 7.69 51.82 2.19 2.07
UBSH Union Bkshs Corp 8,427 1,629 37.36 38.06 20.57 21.11 19.16 238.8 2.14 8.41 0.44 100.44 0.96 7.79 61.99 4.53 10.21
TOWN TowneBank 7,974 2,053 32.85 34.55 16.50 27.84 19.91 265.8 1.58 10.22 0.87 60.84 1.00 7.49 64.41 (1.20) 3.30
CARE Carter Bank & Trust 4,744 408 15.55 15.55 11.70 12.64 - 107.8 - 8.09 4.26 15.33 0.66 7.45 55.95 17.01 0.97
CFNL Cardinal Financial Corp.* 4,211 1,037 31.50 34.75 17.51 21.00 18.98 249.1 1.65 9.97 NA NA 1.23 11.40 57.56 (3.93) 2.14
XBKS Xenith Bankshares Inc. 3,325 626 27.12 30.13 15.50 3.48 24.77 144.3 - 13.19 2.32 43.69 6.38 47.00 82.47 (3.83) 1.88
BHRB Burke & Herbert Bank & Trust 2,959 405 2,118.00 2,118.00 1,876.00 - - - 3.40 NA NA NA 1.03 NA NA 5.37 0.86
FCBC First Community Bancshares Inc 2,386 512 30.14 31.94 17.01 20.79 19.32 217.0 2.12 10.34 1.42 52.92 1.02 7.42 60.78 - 3.90
WFBI WashingtonFirst Bankshares Inc 2,003 363 28.13 30.58 18.57 20.53 18.96 202.0 0.95 9.03 0.43 159.10 1.00 9.50 63.05 (2.97) 1.30
AMNB American National Bankshares 1,679 308 35.75 36.25 23.20 18.92 18.33 197.8 2.69 9.54 NA NA 1.02 8.07 59.81 2.73 2.29
FBLV First Bancorp Inc. 1,566 253 61.15 61.15 61.15 13.07 - 151.4 1.64 10.68 1.28 79.91 1.29 11.91 56.05 - -
CFFI C&F Financial Corp. 1,452 160 46.20 53.40 37.02 11.88 - - 2.86 NA 0.61 NA 0.96 9.90 65.37 (7.32) 2.21
ANCX Access National Corp. 1,431 291 27.32 29.28 16.26 17.74 17.08 - 2.20 NA NA NA 1.27 14.11 62.14 (1.59) (0.69)
MBRG Middleburg Financial Corp.* 1,335 255 35.36 37.17 18.60 32.44 24.56 200.3 1.47 9.42 1.78 47.12 0.59 6.14 71.10 1.76 (0.31)
VERMONT BANKS AND THRIFT
VIRGINIA BANKS AND THRIFT
Source: SNL
Note: Universe includes publicly traded institutions with > $150 million in assets
* Indicates under agreement to be acquiredPage 11

BANK AND THRIFT COMPARABLE COMPANY ANALYSIS - JANNEY UNIVERSE
As of 1/27/2017
BS Market Data Capital Ratio Asset Quality Profitability Price Perf.
Tang.
Price / Equity/ NPAs + Rsrvs/
Total Market One Year LTM 2017E Tang. Div. Tang. 90 Day/ NPAs + LTM Eff.
Assets Value Stock High Low EPS EPS Book Yield Assets Assets 90 Day ROAA ROAE Ratio YTD 1 Week
Ticker Institution ($M) ($M) Price ($) ($) (x) (x) (%) (%) (%) (%) (%) (%) (%) (%) (%) (%)
EVBS Eastern Virginia Bankshares* 1,315 132 10.04 10.54 6.60 22.31 20.92 138.0 1.20 9.02 1.78 44.64 0.65 6.37 76.72 (3.92) 0.70
ESXB Community Bankers Trust Corp 1,250 163 7.40 7.65 4.45 16.44 15.74 143.2 - 9.09 NA NA 0.83 8.92 65.00 2.07 -
NKSH National Bankshares Inc. 1,203 301 43.30 45.35 31.75 19.95 20.62 169.1 2.82 14.88 1.13 61.32 1.26 8.45 49.77 (0.35) 1.76
SONA Southern National Bncp of VA 1,142 199 16.26 16.78 11.60 19.59 NM 173.5 1.97 10.16 NA NA 0.95 8.38 52.38 (0.49) 0.99
JMSB John Marshall Bank 1,075 213 21.00 24.00 16.00 26.58 - 179.2 NA 11.05 0.05 NM 0.85 7.27 56.50 1.20 0.72
FVCB FVCBankcorp Inc. 909 140 17.22 19.75 13.60 21.80 17.05 176.0 NA 8.77 NA NA 0.88 8.96 57.94 2.50 0.70
OPOF Old Point Financial Corp. 903 137 27.70 27.90 17.55 37.43 - 146.4 1.44 10.40 NA NA 0.41 3.85 86.98 10.80 (0.68)
FMBM F & M Bank Corp. 745 90 27.50 27.60 21.30 - - - 3.20 11.39 NA NA 1.37 11.41 60.01 5.57 2.42
CPKF Chesapeake Financial Shares 721 84 20.95 22.75 17.35 12.26 - 108.3 2.39 10.81 NA NA 1.01 9.22 80.31 (3.01) (0.24)
FXNC First National Corp. 717 67 13.61 13.75 8.70 11.34 - 136.4 0.88 6.88 0.26 282.13 0.84 12.01 71.08 5.91 4.29
EFSI Eagle Financial Services Inc. 668 91 26.25 29.00 22.25 15.72 - 113.4 3.35 12.07 2.22 31.33 0.90 7.45 72.59 1.94 (1.87)
NWPP New Peoples Bankshares Inc 634 38 1.64 1.75 1.36 32.80 - 78.5 NA 7.70 NA NA 0.19 2.56 94.09 (6.29) -
FBSS Fauquier Bankshares Inc. 624 63 16.87 16.93 14.13 NM - 116.7 2.84 8.70 1.59 44.51 (0.15) (1.64) 79.24 1.35 1.66
HLND Highlands Bankshares Inc. 612 56 6.80 7.75 4.55 NM - 115.1 - 9.05 3.26 25.05 (0.15) (1.73) 86.15 14.29 (2.86)
VABK Virginia National Bkshs Corp. 605 70 29.50 29.77 22.95 12.24 - 120.5 1.76 9.60 NA NA 1.02 9.89 64.04 3.51 1.03
MNSB MainStreet Bcshs 576 90 16.70 24.00 11.02 18.35 - 153.9 NA 10.21 NA NA 0.75 8.46 69.48 17.61 2.14
BOTJ Bank of the James Finl Grp Inc 574 68 15.48 16.23 11.55 20.65 - 137.2 1.55 8.61 NA NA 0.60 6.60 74.50 2.07 (0.48)
BSSC Bk of Southside Virginia Corp. 566 134 250.00 250.00 200.00 - - - - NA NA NA NA NA NA 21.95 -
PKKW Parkway Acquisition Corp 559 45 8.89 8.90 7.96 - - 82.8 1.35 9.69 NA NA NA NA NA 2.77 1.20
BMBN Benchmark Bankshares Inc. 543 80 15.55 18.00 11.56 12.24 - 125.1 2.70 11.83 1.34 63.47 1.22 10.67 66.86 (2.81) (2.20)
HMTA HomeTown Bankshares Corp. 508 56 9.71 11.00 8.70 20.34 - 116.9 NA 9.51 2.30 30.37 0.62 6.44 70.46 4.97 (4.80)
FDVA Freedom Bank of Virginia 494 66 10.65 11.44 7.75 24.77 16.14 128.5 NA 10.34 0.25 331.98 0.55 5.37 77.32 (3.18) (3.62)
BAYK Bay Banks of Virginia Inc. 487 38 8.00 8.22 5.61 15.09 - 98.2 - 8.04 NA NA 0.55 6.17 82.75 5.26 2.83
VBFC Village Bank & Trust Finl Corp 445 41 28.61 30.00 18.01 3.18 - - NA NA NA NA 3.15 39.00 91.20 7.14 1.98
PPBN Pinnacle Bankshares Corp. 422 44 28.90 29.66 18.33 13.57 - 122.0 1.38 8.56 0.56 121.79 0.86 9.26 74.51 0.07 (2.56)
FBVA Farmers Bankshares Inc. 408 58 19.10 19.50 10.90 14.15 - 133.3 2.09 10.75 NA NA 1.00 9.79 69.07 3.24 (1.24)
SOVA Southwest VA Bkshs Inc. 362 42 44.50 NA NA - - 97.2 - 11.93 1.49 57.17 0.76 6.59 72.17 - -
CZBT Citizens Bancorp of Virginia 356 53 24.35 25.00 18.75 15.51 - 109.6 3.29 13.63 NA NA 0.98 7.23 66.84 (1.62) (0.61)
BORT Bank of Botetourt 353 28 19.40 20.25 17.55 11.55 - 82.1 2.47 9.52 2.65 29.32 0.71 7.16 72.70 (0.51) -
BRBS Blue Ridge Bankshares Inc. 285 30 21.50 24.00 16.25 13.78 - 122.4 2.19 8.64 NA NA 0.83 8.56 60.62 (5.49) -
FBPA Farmers Bank of Appomattox 235 28 26.00 26.00 19.00 9.65 - 94.7 2.69 12.68 0.75 36.82 1.28 10.25 67.47 9.24 7.44
VCBS Virginia Community Bankshares 225 20 27.00 27.50 14.50 - - 87.1 - 10.33 NA NA NA NA NA - -
BFTL Bank of Fincastle 223 NA 6.50 12.00 5.00 - - - - 8.56 8.16 18.28 (1.98) (20.85) 89.90 9.24 -
BOMK Bank of McKenney 222 20 10.58 10.90 9.50 12.54 - 77.1 2.65 11.76 3.13 37.16 0.74 6.42 77.33 0.76 -
CZYB CCB Bankshares Inc. 207 14 9.23 9.50 8.95 19.23 - 73.6 0.98 9.16 NA NA 0.39 3.88 78.54 0.33 -
PNBI Pioneer Bankshares Inc. 196 23 24.00 24.20 21.75 12.18 - 91.7 3.17 12.93 NA NA 1.01 7.60 NA - -
OAKV Oak View National Bank 196 17 6.00 6.25 5.25 16.72 - 90.0 NA 9.78 0.03 NM 0.56 5.50 76.12 - 0.17
VABB Virginia Bank Bankshares Inc. 188 28 15.28 15.50 13.81 15.67 - 115.9 5.76 12.89 1.01 68.51 0.97 7.50 72.10 (1.42) -
PBVA Peoples Bankshares Inc. 170 9 23.85 25.00 18.90 8.38 - 62.0 1.68 8.84 2.57 57.74 0.67 7.65 75.79 (0.63) -
Source: SNL
Note: Universe includes publicly traded institutions with > $150 million in assets
* Indicates under agreement to be acquiredPage 12
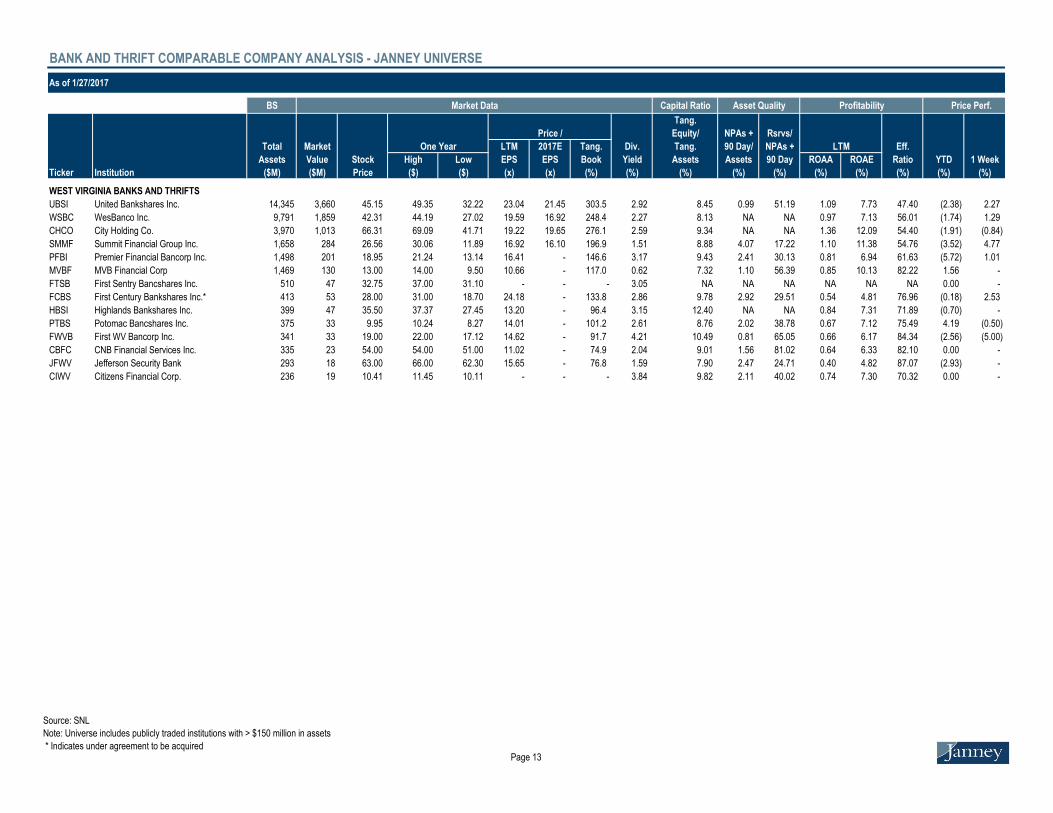
BANK AND THRIFT COMPARABLE COMPANY ANALYSIS - JANNEY UNIVERSE
As of 1/27/2017
BS Market Data Capital Ratio Asset Quality Profitability Price Perf.
Tang.
Price / Equity/ NPAs + Rsrvs/
Total Market One Year LTM 2017E Tang. Div. Tang. 90 Day/ NPAs + LTM Eff.
Assets Value Stock High Low EPS EPS Book Yield Assets Assets 90 Day ROAA ROAE Ratio YTD 1 Week
Ticker Institution ($M) ($M) Price ($) ($) (x) (x) (%) (%) (%) (%) (%) (%) (%) (%) (%) (%)
UBSI United Bankshares Inc. 14,345 3,660 45.15 49.35 32.22 23.04 21.45 303.5 2.92 8.45 0.99 51.19 1.09 7.73 47.40 (2.38) 2.27
WSBC WesBanco Inc. 9,791 1,859 42.31 44.19 27.02 19.59 16.92 248.4 2.27 8.13 NA NA 0.97 7.13 56.01 (1.74) 1.29
CHCO City Holding Co. 3,970 1,013 66.31 69.09 41.71 19.22 19.65 276.1 2.59 9.34 NA NA 1.36 12.09 54.40 (1.91) (0.84)
SMMF Summit Financial Group Inc. 1,658 284 26.56 30.06 11.89 16.92 16.10 196.9 1.51 8.88 4.07 17.22 1.10 11.38 54.76 (3.52) 4.77
PFBI Premier Financial Bancorp Inc. 1,498 201 18.95 21.24 13.14 16.41 - 146.6 3.17 9.43 2.41 30.13 0.81 6.94 61.63 (5.72) 1.01
MVBF MVB Financial Corp 1,469 130 13.00 14.00 9.50 10.66 - 117.0 0.62 7.32 1.10 56.39 0.85 10.13 82.22 1.56 -
FTSB First Sentry Bancshares Inc. 510 47 32.75 37.00 31.10 - - - 3.05 NA NA NA NA NA NA 0.00 -
FCBS First Century Bankshares Inc.* 413 53 28.00 31.00 18.70 24.18 - 133.8 2.86 9.78 2.92 29.51 0.54 4.81 76.96 (0.18) 2.53
HBSI Highlands Bankshares Inc. 399 47 35.50 37.37 27.45 13.20 - 96.4 3.15 12.40 NA NA 0.84 7.31 71.89 (0.70) -
PTBS Potomac Bancshares Inc. 375 33 9.95 10.24 8.27 14.01 - 101.2 2.61 8.76 2.02 38.78 0.67 7.12 75.49 4.19 (0.50)
FWVB First WV Bancorp Inc. 341 33 19.00 22.00 17.12 14.62 - 91.7 4.21 10.49 0.81 65.05 0.66 6.17 84.34 (2.56) (5.00)
CBFC CNB Financial Services Inc. 335 23 54.00 54.00 51.00 11.02 - 74.9 2.04 9.01 1.56 81.02 0.64 6.33 82.10 0.00 -
JFWV Jefferson Security Bank 293 18 63.00 66.00 62.30 15.65 - 76.8 1.59 7.90 2.47 24.71 0.40 4.82 87.07 (2.93) -
CIWV Citizens Financial Corp. 236 19 10.41 11.45 10.11 - - - 3.84 9.82 2.11 40.02 0.74 7.30 70.32 0.00 -
WEST VIRGINIA BANKS AND THRIFTS
Source: SNL
Note: Universe includes publicly traded institutions with > $150 million in assets
* Indicates under agreement to be acquiredPage 13
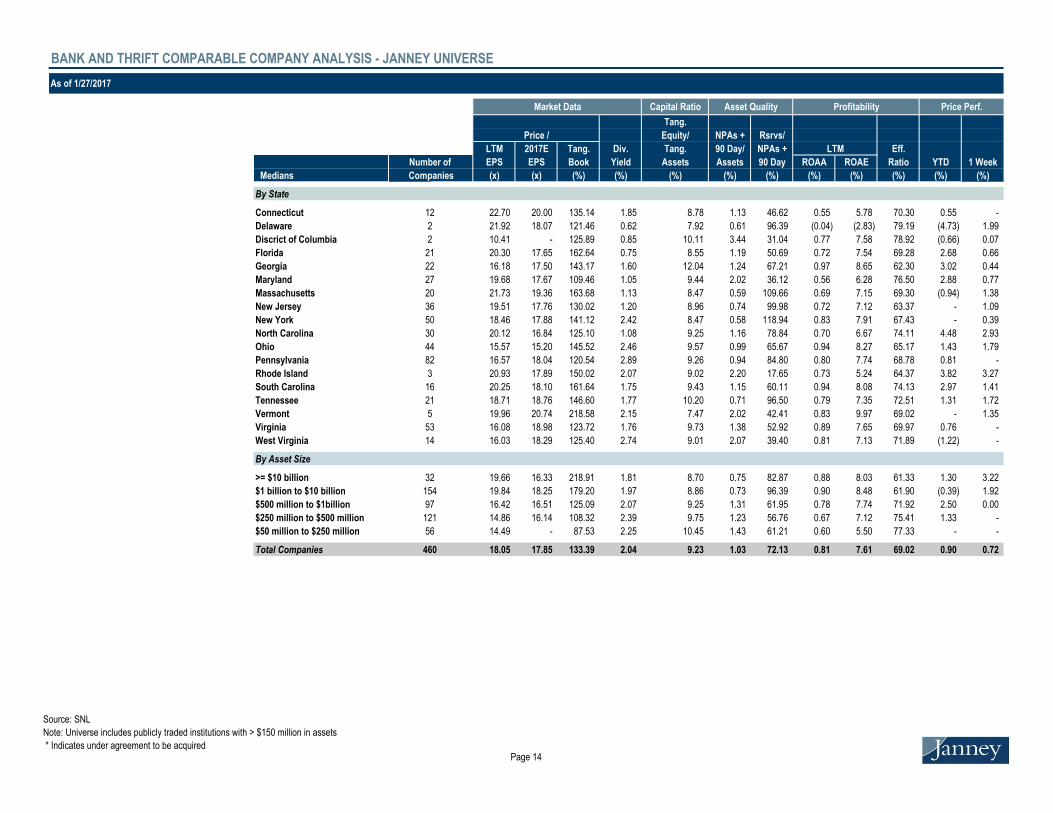
BANK AND THRIFT COMPARABLE COMPANY ANALYSIS - JANNEY UNIVERSE
As of 1/27/2017
Market Data Capital Ratio Asset Quality Profitability Price Perf.
Tang.
Price / Equity/ NPAs + Rsrvs/
LTM 2017E Tang. Div. Tang. 90 Day/ NPAs + LTM Eff.
Number of EPS EPS Book Yield Assets Assets 90 Day ROAA ROAE Ratio YTD 1 Week
Medians Companies (x) (x) (%) (%) (%) (%) (%) (%) (%) (%) (%) (%)
By State
CT Connecticut 12 22.70 20.00 135.14 1.85 8.78 1.13 46.62 0.55 5.78 70.30 0.55 -
FL Delaware 2 21.92 18.07 121.46 0.62 7.92 0.61 96.39 (0.04) (2.83) 79.19 (4.73) 1.99
Discrict of Columbia 2 10.41 - 125.89 0.85 10.11 3.44 31.04 0.77 7.58 78.92 (0.66) 0.07
GA Florida 21 20.30 17.65 162.64 0.75 8.55 1.19 50.69 0.72 7.54 69.28 2.68 0.66
MD Georgia 22 16.18 17.50 143.17 1.60 12.04 1.24 67.21 0.97 8.65 62.30 3.02 0.44
MA Maryland 27 19.68 17.67 109.46 1.05 9.44 2.02 36.12 0.56 6.28 76.50 2.88 0.77
NJ Massachusetts 20 21.73 19.36 163.68 1.13 8.47 0.59 109.66 0.69 7.15 69.30 (0.94) 1.38
NY New Jersey 36 19.51 17.76 130.02 1.20 8.96 0.74 99.98 0.72 7.12 63.37 - 1.09
NC New York 50 18.46 17.88 141.12 2.42 8.47 0.58 118.94 0.83 7.91 67.43 - 0.39
OH North Carolina 30 20.12 16.84 125.10 1.08 9.25 1.16 78.84 0.70 6.67 74.11 4.48 2.93
PA Ohio 44 15.57 15.20 145.52 2.46 9.57 0.99 65.67 0.94 8.27 65.17 1.43 1.79
RI Pennsylvania 82 16.57 18.04 120.54 2.89 9.26 0.94 84.80 0.80 7.74 68.78 0.81 -
SC Rhode Island 3 20.93 17.89 150.02 2.07 9.02 2.20 17.65 0.73 5.24 64.37 3.82 3.27
TN South Carolina 16 20.25 18.10 161.64 1.75 9.43 1.15 60.11 0.94 8.08 74.13 2.97 1.41
VT Tennessee 21 18.71 18.76 146.60 1.77 10.20 0.71 96.50 0.79 7.35 72.51 1.31 1.72
VA Vermont 5 19.96 20.74 218.58 2.15 7.47 2.02 42.41 0.83 9.97 69.02 - 1.35
WV Virginia 53 16.08 18.98 123.72 1.76 9.73 1.38 52.92 0.89 7.65 69.97 0.76 -
West Virginia 14 16.03 18.29 125.40 2.74 9.01 2.07 39.40 0.81 7.13 71.89 (1.22) -
By Asset Size
10,000 >= $10 billion 32 19.66 16.33 218.91 1.81 8.70 0.75 82.87 0.88 8.03 61.33 1.30 3.22
1,000 $1 billion to $10 billion 154 19.84 18.25 179.20 1.97 8.86 0.73 96.39 0.90 8.48 61.90 (0.39) 1.92
500 $500 million to $1billion 97 16.42 16.51 125.09 2.07 9.25 1.31 61.95 0.78 7.74 71.92 2.50 0.00
250 $250 million to $500 million 121 14.86 16.14 108.32 2.39 9.75 1.23 56.76 0.67 7.12 75.41 1.33 -
100 $50 million to $250 million 56 14.49 - 87.53 2.25 10.45 1.43 61.21 0.60 5.50 77.33 - -
Total Companies 460 18.05 17.85 133.39 2.04 9.23 1.03 72.13 0.81 7.61 69.02 0.90 0.72
Source: SNL
Note: Universe includes publicly traded institutions with > $150 million in assets
* Indicates under agreement to be acquiredPage 14
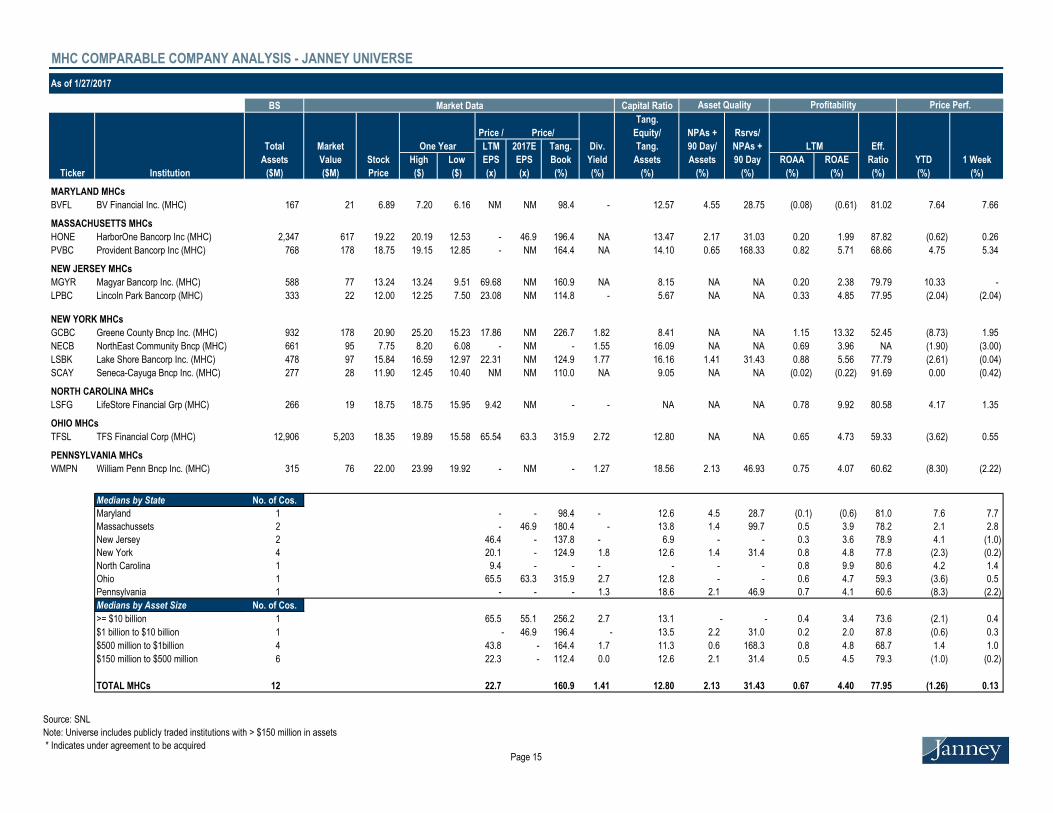
MHC COMPARABLE COMPANY ANALYSIS - JANNEY UNIVERSE
As of 1/27/2017
BS Market Data Capital Ratio Asset Quality Profitability Price Perf.
Tang.
Price / Price/ Equity/ NPAs + Rsrvs/
Total Market LTM 2017E Tang. Div. Tang. 90 Day/ NPAs + LTM Eff.
Assets Value Stock High Low EPS EPS Book Yield Assets Assets 90 Day ROAA ROAE Ratio YTD 1 Week
Ticker Institution ($M) ($M) Price ($) ($) (x) (x) (%) (%) (%) (%) (%) (%) (%) (%) (%) (%)
BVFL BV Financial Inc. (MHC) 167 21 6.89 7.20 6.16 NM NM 98.4 - 12.57 4.55 28.75 (0.08) (0.61) 81.02 7.64 7.66
HONE HarborOne Bancorp Inc (MHC) 2,347 617 19.22 20.19 12.53 - 46.9 196.4 NA 13.47 2.17 31.03 0.20 1.99 87.82 (0.62) 0.26
PVBC Provident Bancorp Inc (MHC) 768 178 18.75 19.15 12.85 - NM 164.4 NA 14.10 0.65 168.33 0.82 5.71 68.66 4.75 5.34
MGYR Magyar Bancorp Inc. (MHC) 588 77 13.24 13.24 9.51 69.68 NM 160.9 NA 8.15 NA NA 0.20 2.38 79.79 10.33 -
LPBC Lincoln Park Bancorp (MHC) 333 22 12.00 12.25 7.50 23.08 NM 114.8 - 5.67 NA NA 0.33 4.85 77.95 (2.04) (2.04)
GCBC Greene County Bncp Inc. (MHC) 932 178 20.90 25.20 15.23 17.86 NM 226.7 1.82 8.41 NA NA 1.15 13.32 52.45 (8.73) 1.95
NECB NorthEast Community Bncp (MHC) 661 95 7.75 8.20 6.08 - NM - 1.55 16.09 NA NA 0.69 3.96 NA (1.90) (3.00)
LSBK Lake Shore Bancorp Inc. (MHC) 478 97 15.84 16.59 12.97 22.31 NM 124.9 1.77 16.16 1.41 31.43 0.88 5.56 77.79 (2.61) (0.04)
SCAY Seneca-Cayuga Bncp Inc. (MHC) 277 28 11.90 12.45 10.40 NM NM 110.0 NA 9.05 NA NA (0.02) (0.22) 91.69 0.00 (0.42)
LSFG LifeStore Financial Grp (MHC) 266 19 18.75 18.75 15.95 9.42 NM - - NA NA NA 0.78 9.92 80.58 4.17 1.35
TFSL TFS Financial Corp (MHC) 12,906 5,203 18.35 19.89 15.58 65.54 63.3 315.9 2.72 12.80 NA NA 0.65 4.73 59.33 (3.62) 0.55
WMPN William Penn Bncp Inc. (MHC) 315 76 22.00 23.99 19.92 - NM - 1.27 18.56 2.13 46.93 0.75 4.07 60.62 (8.30) (2.22)
Medians by State No. of Cos.
MD Maryland 1 - - 98.4 - 12.6 4.5 28.7 (0.1) (0.6) 81.0 7.6 7.7
MA Massachussets 2 - 46.9 180.4 - 13.8 1.4 99.7 0.5 3.9 78.2 2.1 2.8
NJ New Jersey 2 46.4 - 137.8 - 6.9 - - 0.3 3.6 78.9 4.1 (1.0)
NY New York 4 20.1 - 124.9 1.8 12.6 1.4 31.4 0.8 4.8 77.8 (2.3) (0.2)
NC North Carolina 1 9.4 - - - - - - 0.8 9.9 80.6 4.2 1.4
OH Ohio 1 65.5 63.3 315.9 2.7 12.8 - - 0.6 4.7 59.3 (3.6) 0.5
PA Pennsylvania 1 - - - 1.3 18.6 2.1 46.9 0.7 4.1 60.6 (8.3) (2.2)
Medians by Asset Size No. of Cos.
10000 >= $10 billion 1 65.5 55.1 256.2 2.7 13.1 - - 0.4 3.4 73.6 (2.1) 0.4
1000 $1 billion to $10 billion 1 - 46.9 196.4 - 13.5 2.2 31.0 0.2 2.0 87.8 (0.6) 0.3
500 $500 million to $1billion 4 43.8 - 164.4 1.7 11.3 0.6 168.3 0.8 4.8 68.7 1.4 1.0
150 $150 million to $500 million 6 22.3 - 112.4 0.0 12.6 2.1 31.4 0.5 4.5 79.3 (1.0) (0.2)
TOTAL MHCs 12 22.7 160.9 1.41 12.80 2.13 31.43 0.67 4.40 77.95 (1.26) 0.13
MARYLAND MHCs
MASSACHUSETTS MHCs
NEW JERSEY MHCs
NEW YORK MHCs
NORTH CAROLINA MHCs
OHIO MHCs
PENNSYLVANIA MHCs
One Year
Source: SNL
Note: Universe includes publicly traded institutions with > $150 million in assets
* Indicates under agreement to be acquiredPage 15

BANK & THRIFT TOTAL RETURN YTD
As of 1/27/2017
1/23/2017
1/20/2017
1/19/2017
1/18/2017
1/17/2017
1/13/2017
1/12/2017
1/11/2017
1/10/2017
1/9/2017
1/6/2017
1/5/2017
1/4/2017
1/3/2017
12/30/2016
1.7%
2.0%
(0.7%)
(0.6%)
2.6%
(5.0%)
(4.0%)
(3.0%)
(2.0%)
(1.0%)
0.0%
1.0%
2.0%
3.0%
4.0%
12/30/2016
SNL Large Cap U.S. Bank & Thrift SNL Micro Cap U.S. Bank & Thrift SNL Mid Cap U.S. Bank & Thrift SNL Small Cap U.S. Bank & Thrift S&P 500
Source: SNL
Note: Universe includes publicly traded institutions with > $150 million in assets
* Indicates under agreement to be acquiredPage 16

4.) Recent Bank M&A Transactions
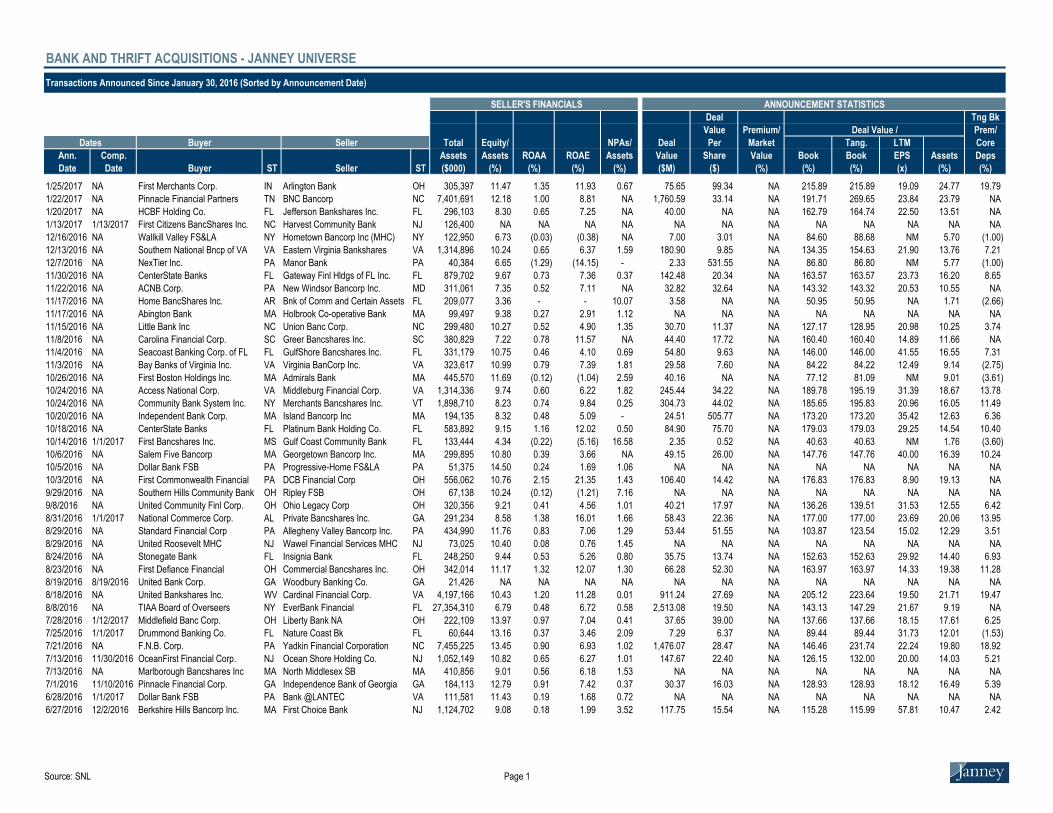
BANK AND THRIFT ACQUISITIONS - JANNEY UNIVERSE
Transactions Announced Since January 30, 2016 (Sorted by Announcement Date)
SELLER'S FINANCIALS ANNOUNCEMENT STATISTICS
Deal Tng Bk
Value Premium/ Deal Value / Prem/
Dates Buyer Seller Total Equity/ NPAs/ Deal Per Market Tang. LTM Core
Ann. Comp. Assets Assets ROAA ROAE Assets Value Share Value Book Book EPS Assets Deps
Date Date Buyer ST Seller ST ($000) (%) (%) (%) (%) ($M) ($) (%) (%) (%) (x) (%) (%)
1/25/2017 NA First Merchants Corp. IN Arlington Bank OH 305,397 11.47 1.35 11.93 0.67 75.65 99.34 NA 215.89 215.89 19.09 24.77 19.79
1/22/2017 NA Pinnacle Financial Partners TN BNC Bancorp NC 7,401,691 12.18 1.00 8.81 NA 1,760.59 33.14 NA 191.71 269.65 23.84 23.79 NA
1/20/2017 NA HCBF Holding Co. FL Jefferson Bankshares Inc. FL 296,103 8.30 0.65 7.25 NA 40.00 NA NA 162.79 164.74 22.50 13.51 NA
1/13/2017 1/13/2017 First Citizens BancShares Inc. NC Harvest Community Bank NJ 126,400 NA NA NA NA NA NA NA NA NA NA NA NA
12/16/2016 NA Wallkill Valley FS&LA NY Hometown Bancorp Inc (MHC) NY 122,950 6.73 (0.03) (0.38) NA 7.00 3.01 NA 84.60 88.68 NM 5.70 (1.00)
12/13/2016 NA Southern National Bncp of VA VA Eastern Virginia Bankshares VA 1,314,896 10.24 0.65 6.37 1.59 180.90 9.85 NA 134.35 154.63 21.90 13.76 7.21
12/7/2016 NA NexTier Inc. PA Manor Bank PA 40,384 6.65 (1.29) (14.15) - 2.33 531.55 NA 86.80 86.80 NM 5.77 (1.00)
11/30/2016 NA CenterState Banks FL Gateway Finl Hldgs of FL Inc. FL 879,702 9.67 0.73 7.36 0.37 142.48 20.34 NA 163.57 163.57 23.73 16.20 8.65
11/22/2016 NA ACNB Corp. PA New Windsor Bancorp Inc. MD 311,061 7.35 0.52 7.11 NA 32.82 32.64 NA 143.32 143.32 20.53 10.55 NA
11/17/2016 NA Home BancShares Inc. AR Bnk of Comm and Certain Assets FL 209,077 3.36 - - 10.07 3.58 NA NA 50.95 50.95 NA 1.71 (2.66)
11/17/2016 NA Abington Bank MA Holbrook Co-operative Bank MA 99,497 9.38 0.27 2.91 1.12 NA NA NA NA NA NA NA NA
11/15/2016 NA Little Bank Inc NC Union Banc Corp. NC 299,480 10.27 0.52 4.90 1.35 30.70 11.37 NA 127.17 128.95 20.98 10.25 3.74
11/8/2016 NA Carolina Financial Corp. SC Greer Bancshares Inc. SC 380,829 7.22 0.78 11.57 NA 44.40 17.72 NA 160.40 160.40 14.89 11.66 NA
11/4/2016 NA Seacoast Banking Corp. of FL FL GulfShore Bancshares Inc. FL 331,179 10.75 0.46 4.10 0.69 54.80 9.63 NA 146.00 146.00 41.55 16.55 7.31
11/3/2016 NA Bay Banks of Virginia Inc. VA Virginia BanCorp Inc. VA 323,617 10.99 0.79 7.39 1.81 29.58 7.60 NA 84.22 84.22 12.49 9.14 (2.75)
10/26/2016 NA First Boston Holdings Inc. MA Admirals Bank MA 445,570 11.69 (0.12) (1.04) 2.59 40.16 NA NA 77.12 81.09 NM 9.01 (3.61)
10/24/2016 NA Access National Corp. VA Middleburg Financial Corp. VA 1,314,336 9.74 0.60 6.22 1.82 245.44 34.22 NA 189.78 195.19 31.39 18.67 13.78
10/24/2016 NA Community Bank System Inc. NY Merchants Bancshares Inc. VT 1,898,710 8.23 0.74 9.84 0.25 304.73 44.02 NA 185.65 195.83 20.96 16.05 11.49
10/20/2016 NA Independent Bank Corp. MA Island Bancorp Inc MA 194,135 8.32 0.48 5.09 - 24.51 505.77 NA 173.20 173.20 35.42 12.63 6.36
10/18/2016 NA CenterState Banks FL Platinum Bank Holding Co. FL 583,892 9.15 1.16 12.02 0.50 84.90 75.70 NA 179.03 179.03 29.25 14.54 10.40
10/14/2016 1/1/2017 First Bancshares Inc. MS Gulf Coast Community Bank FL 133,444 4.34 (0.22) (5.16) 16.58 2.35 0.52 NA 40.63 40.63 NM 1.76 (3.60)
10/6/2016 NA Salem Five Bancorp MA Georgetown Bancorp Inc. MA 299,895 10.80 0.39 3.66 NA 49.15 26.00 NA 147.76 147.76 40.00 16.39 10.24
10/5/2016 NA Dollar Bank FSB PA Progressive-Home FS&LA PA 51,375 14.50 0.24 1.69 1.06 NA NA NA NA NA NA NA NA
10/3/2016 NA First Commonwealth Financial PA DCB Financial Corp OH 556,062 10.76 2.15 21.35 1.43 106.40 14.42 NA 176.83 176.83 8.90 19.13 NA
9/29/2016 NA Southern Hills Community Bank OH Ripley FSB OH 67,138 10.24 (0.12) (1.21) 7.16 NA NA NA NA NA NA NA NA
9/8/2016 NA United Community Finl Corp. OH Ohio Legacy Corp OH 320,356 9.21 0.41 4.56 1.01 40.21 17.97 NA 136.26 139.51 31.53 12.55 6.42
8/31/2016 1/1/2017 National Commerce Corp. AL Private Bancshares Inc. GA 291,234 8.58 1.38 16.01 1.66 58.43 22.36 NA 177.00 177.00 23.69 20.06 13.95
8/29/2016 NA Standard Financial Corp PA Allegheny Valley Bancorp Inc. PA 434,990 11.76 0.83 7.06 1.29 53.44 51.55 NA 103.87 123.54 15.02 12.29 3.51
8/29/2016 NA United Roosevelt MHC NJ Wawel Financial Services MHC NJ 73,025 10.40 0.08 0.76 1.45 NA NA NA NA NA NA NA NA
8/24/2016 NA Stonegate Bank FL Insignia Bank FL 248,250 9.44 0.53 5.26 0.80 35.75 13.74 NA 152.63 152.63 29.92 14.40 6.93
8/23/2016 NA First Defiance Financial OH Commercial Bancshares Inc. OH 342,014 11.17 1.32 12.07 1.30 66.28 52.30 NA 163.97 163.97 14.33 19.38 11.28
8/19/2016 8/19/2016 United Bank Corp. GA Woodbury Banking Co. GA 21,426 NA NA NA NA NA NA NA NA NA NA NA NA
8/18/2016 NA United Bankshares Inc. WV Cardinal Financial Corp. VA 4,197,166 10.43 1.20 11.28 0.01 911.24 27.69 NA 205.12 223.64 19.50 21.71 19.47
8/8/2016 NA TIAA Board of Overseers NY EverBank Financial FL 27,354,310 6.79 0.48 6.72 0.58 2,513.08 19.50 NA 143.13 147.29 21.67 9.19 NA
7/28/2016 1/12/2017 Middlefield Banc Corp. OH Liberty Bank NA OH 222,109 13.97 0.97 7.04 0.41 37.65 39.00 NA 137.66 137.66 18.15 17.61 6.25
7/25/2016 1/1/2017 Drummond Banking Co. FL Nature Coast Bk FL 60,644 13.16 0.37 3.46 2.09 7.29 6.37 NA 89.44 89.44 31.73 12.01 (1.53)
7/21/2016 NA F.N.B. Corp. PA Yadkin Financial Corporation NC 7,455,225 13.45 0.90 6.93 1.02 1,476.07 28.47 NA 146.46 231.74 22.24 19.80 18.92
7/13/2016 11/30/2016 OceanFirst Financial Corp. NJ Ocean Shore Holding Co. NJ 1,052,149 10.82 0.65 6.27 1.01 147.67 22.40 NA 126.15 132.00 20.00 14.03 5.21
7/13/2016 NA Marlborough Bancshares Inc MA North Middlesex SB MA 410,856 9.01 0.56 6.18 1.53 NA NA NA NA NA NA NA NA
7/1/2016 11/10/2016 Pinnacle Financial Corp. GA Independence Bank of Georgia GA 184,113 12.79 0.91 7.42 0.37 30.37 16.03 NA 128.93 128.93 18.12 16.49 5.39
6/28/2016 1/1/2017 Dollar Bank FSB PA Bank @LANTEC VA 111,581 11.43 0.19 1.68 0.72 NA NA NA NA NA NA NA NA
6/27/2016 12/2/2016 Berkshire Hills Bancorp Inc. MA First Choice Bank NJ 1,124,702 9.08 0.18 1.99 3.52 117.75 15.54 NA 115.28 115.99 57.81 10.47 2.42
Source: SNL Page 1
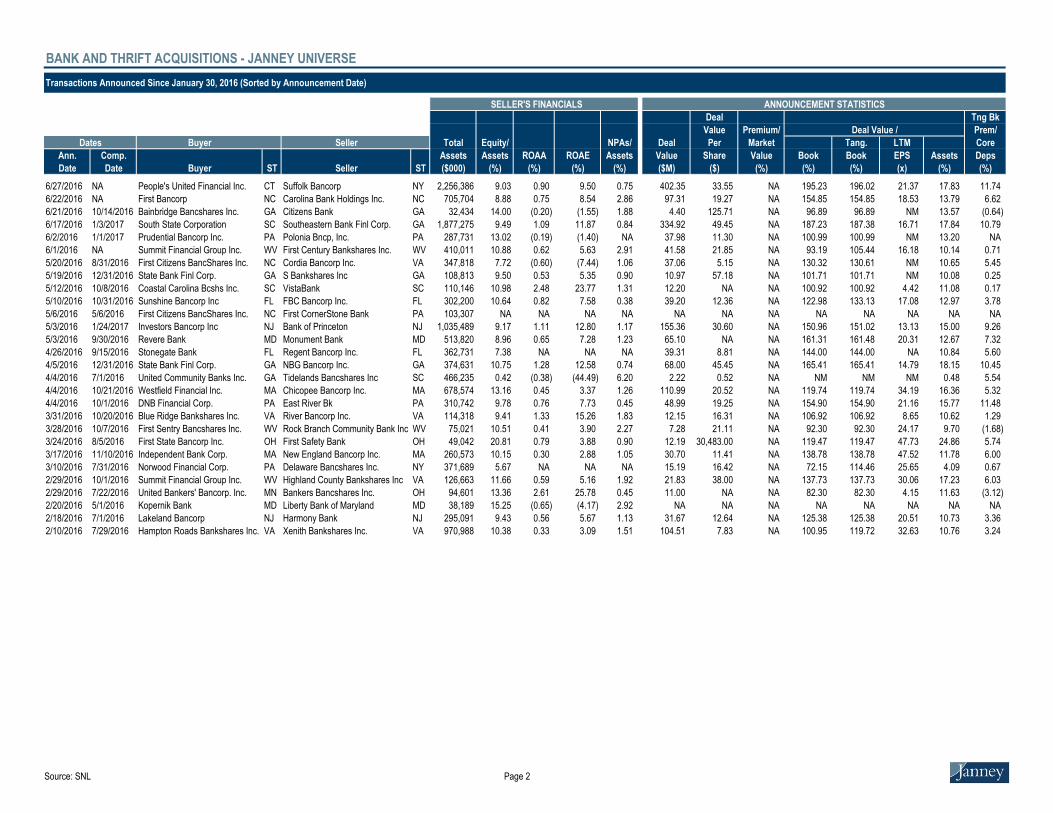
BANK AND THRIFT ACQUISITIONS - JANNEY UNIVERSE
Transactions Announced Since January 30, 2016 (Sorted by Announcement Date)
SELLER'S FINANCIALS ANNOUNCEMENT STATISTICS
Deal Tng Bk
Value Premium/ Deal Value / Prem/
Dates Buyer Seller Total Equity/ NPAs/ Deal Per Market Tang. LTM Core
Ann. Comp. Assets Assets ROAA ROAE Assets Value Share Value Book Book EPS Assets Deps
Date Date Buyer ST Seller ST ($000) (%) (%) (%) (%) ($M) ($) (%) (%) (%) (x) (%) (%)
6/27/2016 NA People's United Financial Inc. CT Suffolk Bancorp NY 2,256,386 9.03 0.90 9.50 0.75 402.35 33.55 NA 195.23 196.02 21.37 17.83 11.74
6/22/2016 NA First Bancorp NC Carolina Bank Holdings Inc. NC 705,704 8.88 0.75 8.54 2.86 97.31 19.27 NA 154.85 154.85 18.53 13.79 6.62
6/21/2016 10/14/2016 Bainbridge Bancshares Inc. GA Citizens Bank GA 32,434 14.00 (0.20) (1.55) 1.88 4.40 125.71 NA 96.89 96.89 NM 13.57 (0.64)
6/17/2016 1/3/2017 South State Corporation SC Southeastern Bank Finl Corp. GA 1,877,275 9.49 1.09 11.87 0.84 334.92 49.45 NA 187.23 187.38 16.71 17.84 10.79
6/2/2016 1/1/2017 Prudential Bancorp Inc. PA Polonia Bncp, Inc. PA 287,731 13.02 (0.19) (1.40) NA 37.98 11.30 NA 100.99 100.99 NM 13.20 NA
6/1/2016 NA Summit Financial Group Inc. WV First Century Bankshares Inc. WV 410,011 10.88 0.62 5.63 2.91 41.58 21.85 NA 93.19 105.44 16.18 10.14 0.71
5/20/2016 8/31/2016 First Citizens BancShares Inc. NC Cordia Bancorp Inc. VA 347,818 7.72 (0.60) (7.44) 1.06 37.06 5.15 NA 130.32 130.61 NM 10.65 5.45
5/19/2016 12/31/2016 State Bank Finl Corp. GA S Bankshares Inc GA 108,813 9.50 0.53 5.35 0.90 10.97 57.18 NA 101.71 101.71 NM 10.08 0.25
5/12/2016 10/8/2016 Coastal Carolina Bcshs Inc. SC VistaBank SC 110,146 10.98 2.48 23.77 1.31 12.20 NA NA 100.92 100.92 4.42 11.08 0.17
5/10/2016 10/31/2016 Sunshine Bancorp Inc FL FBC Bancorp Inc. FL 302,200 10.64 0.82 7.58 0.38 39.20 12.36 NA 122.98 133.13 17.08 12.97 3.78
5/6/2016 5/6/2016 First Citizens BancShares Inc. NC First CornerStone Bank PA 103,307 NA NA NA NA NA NA NA NA NA NA NA NA
5/3/2016 1/24/2017 Investors Bancorp Inc NJ Bank of Princeton NJ 1,035,489 9.17 1.11 12.80 1.17 155.36 30.60 NA 150.96 151.02 13.13 15.00 9.26
5/3/2016 9/30/2016 Revere Bank MD Monument Bank MD 513,820 8.96 0.65 7.28 1.23 65.10 NA NA 161.31 161.48 20.31 12.67 7.32
4/26/2016 9/15/2016 Stonegate Bank FL Regent Bancorp Inc. FL 362,731 7.38 NA NA NA 39.31 8.81 NA 144.00 144.00 NA 10.84 5.60
4/5/2016 12/31/2016 State Bank Finl Corp. GA NBG Bancorp Inc. GA 374,631 10.75 1.28 12.58 0.74 68.00 45.45 NA 165.41 165.41 14.79 18.15 10.45
4/4/2016 7/1/2016 United Community Banks Inc. GA Tidelands Bancshares Inc SC 466,235 0.42 (0.38) (44.49) 6.20 2.22 0.52 NA NM NM NM 0.48 5.54
4/4/2016 10/21/2016 Westfield Financial Inc. MA Chicopee Bancorp Inc. MA 678,574 13.16 0.45 3.37 1.26 110.99 20.52 NA 119.74 119.74 34.19 16.36 5.32
4/4/2016 10/1/2016 DNB Financial Corp. PA East River Bk PA 310,742 9.78 0.76 7.73 0.45 48.99 19.25 NA 154.90 154.90 21.16 15.77 11.48
3/31/2016 10/20/2016 Blue Ridge Bankshares Inc. VA River Bancorp Inc. VA 114,318 9.41 1.33 15.26 1.83 12.15 16.31 NA 106.92 106.92 8.65 10.62 1.29
3/28/2016 10/7/2016 First Sentry Bancshares Inc. WV Rock Branch Community Bank Inc WV 75,021 10.51 0.41 3.90 2.27 7.28 21.11 NA 92.30 92.30 24.17 9.70 (1.68)
3/24/2016 8/5/2016 First State Bancorp Inc. OH First Safety Bank OH 49,042 20.81 0.79 3.88 0.90 12.19 30,483.00 NA 119.47 119.47 47.73 24.86 5.74
3/17/2016 11/10/2016 Independent Bank Corp. MA New England Bancorp Inc. MA 260,573 10.15 0.30 2.88 1.05 30.70 11.41 NA 138.78 138.78 47.52 11.78 6.00
3/10/2016 7/31/2016 Norwood Financial Corp. PA Delaware Bancshares Inc. NY 371,689 5.67 NA NA NA 15.19 16.42 NA 72.15 114.46 25.65 4.09 0.67
2/29/2016 10/1/2016 Summit Financial Group Inc. WV Highland County Bankshares Inc VA 126,663 11.66 0.59 5.16 1.92 21.83 38.00 NA 137.73 137.73 30.06 17.23 6.03
2/29/2016 7/22/2016 United Bankers' Bancorp. Inc. MN Bankers Bancshares Inc. OH 94,601 13.36 2.61 25.78 0.45 11.00 NA NA 82.30 82.30 4.15 11.63 (3.12)
2/20/2016 5/1/2016 Kopernik Bank MD Liberty Bank of Maryland MD 38,189 15.25 (0.65) (4.17) 2.92 NA NA NA NA NA NA NA NA
2/18/2016 7/1/2016 Lakeland Bancorp NJ Harmony Bank NJ 295,091 9.43 0.56 5.67 1.13 31.67 12.64 NA 125.38 125.38 20.51 10.73 3.36
2/10/2016 7/29/2016 Hampton Roads Bankshares Inc. VA Xenith Bankshares Inc. VA 970,988 10.38 0.33 3.09 1.51 104.51 7.83 NA 100.95 119.72 32.63 10.76 3.24
Source: SNL Page 2
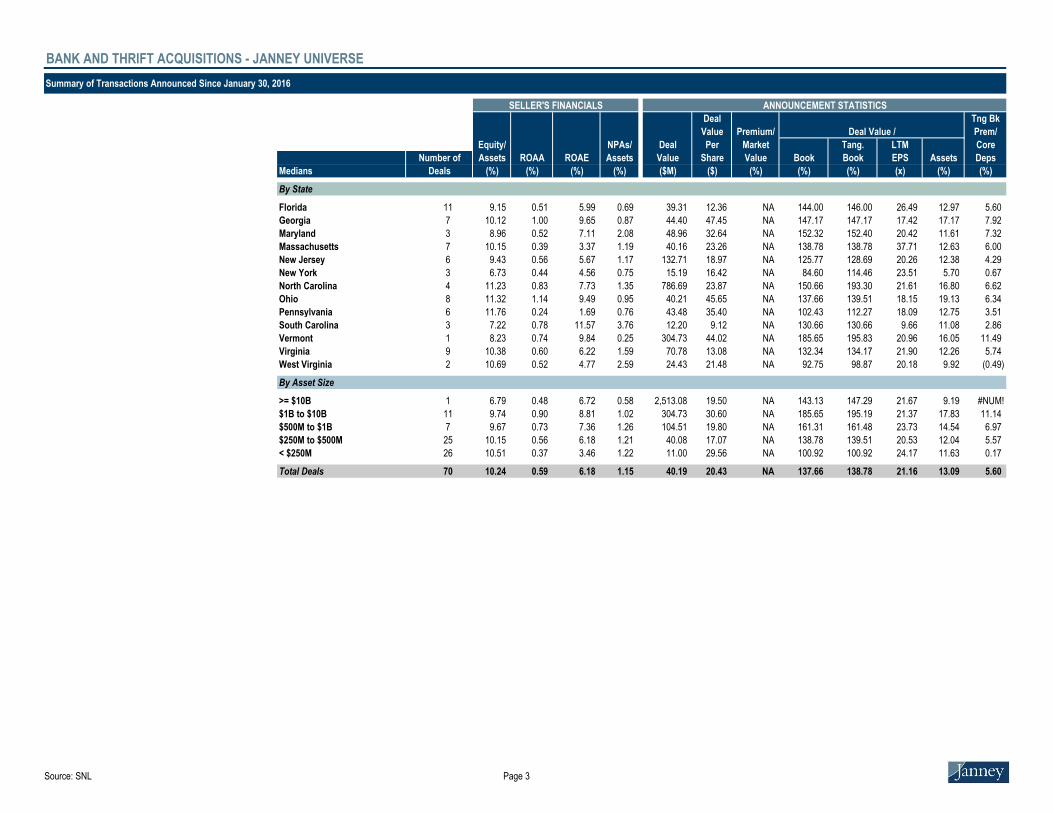
BANK AND THRIFT ACQUISITIONS - JANNEY UNIVERSE
Summary of Transactions Announced Since January 30, 2016
SELLER'S FINANCIALS ANNOUNCEMENT STATISTICS
Deal Tng Bk
Value Premium/ Deal Value / Prem/
Equity/ NPAs/ Deal Per Market Tang. LTM Core
Number of Assets ROAA ROAE Assets Value Share Value Book Book EPS Assets Deps
Medians Deals (%) (%) (%) (%) ($M) ($) (%) (%) (%) (x) (%) (%)
By State
GA Florida 11 11 9.15 0.51 5.99 0.69 39.31 12.36 NA 144.00 146.00 26.49 12.97 5.60
MD Georgia 7 7 10.12 1.00 9.65 0.87 44.40 47.45 NA 147.17 147.17 17.42 17.17 7.92
MA Maryland 3 3 8.96 0.52 7.11 2.08 48.96 32.64 NA 152.32 152.40 20.42 11.61 7.32
NJ Massachusetts 7 7 10.15 0.39 3.37 1.19 40.16 23.26 NA 138.78 138.78 37.71 12.63 6.00
NY New Jersey 6 6 9.43 0.56 5.67 1.17 132.71 18.97 NA 125.77 128.69 20.26 12.38 4.29
NC New York 3 3 6.73 0.44 4.56 0.75 15.19 16.42 NA 84.60 114.46 23.51 5.70 0.67
OH North Carolina 4 4 11.23 0.83 7.73 1.35 786.69 23.87 NA 150.66 193.30 21.61 16.80 6.62
PA Ohio 8 8 11.32 1.14 9.49 0.95 40.21 45.65 NA 137.66 139.51 18.15 19.13 6.34
RI Pennsylvania 6 6 11.76 0.24 1.69 0.76 43.48 35.40 NA 102.43 112.27 18.09 12.75 3.51
SD South Carolina 3 3 7.22 0.78 11.57 3.76 12.20 9.12 NA 130.66 130.66 9.66 11.08 2.86
VA Vermont 1 1 8.23 0.74 9.84 0.25 304.73 44.02 NA 185.65 195.83 20.96 16.05 11.49
WV Virginia 9 9 10.38 0.60 6.22 1.59 70.78 13.08 NA 132.34 134.17 21.90 12.26 5.74
West Virginia 2 2 10.69 0.52 4.77 2.59 24.43 21.48 NA 92.75 98.87 20.18 9.92 (0.49)
By Asset Size
1,000,000 10,000,000 >= $10B 1 6.79 0.48 6.72 0.58 - 2,513.08 19.50 NA 143.13 147.29 21.67 9.19 #NUM!
1,000,000 10,000,000 $1B to $10B 11 9.74 0.90 8.81 1.02 - 304.73 30.60 NA 185.65 195.19 21.37 17.83 11.14
500,000 1,000,000 $500M to $1B 7 9.67 0.73 7.36 1.26 - 104.51 19.80 NA 161.31 161.48 23.73 14.54 6.97
250,000 500,000 $250M to $500M 25 10.15 0.56 6.18 1.21 - 40.08 17.07 NA 138.78 139.51 20.53 12.04 5.57
0 250,000 < $250M 26 10.51 0.37 3.46 1.22 - 11.00 29.56 NA 100.92 100.92 24.17 11.63 0.17
Total Deals 70 10.24 0.59 6.18 1.15 - 40.19 20.43 NA 137.66 138.78 21.16 13.09 5.60
Source: SNL Page 3

5.) Relevant Janney Capital Markets Professionals

8
Financial Institutions Group Professionals
JD NELSON
Director, Financial Institutions Investment Banking
Tel: 410-583-5994 E-Mail: [email protected]
Mr. Nelson joined Janney Montgomery Scott in 2008 as a member of the Financial Institutions Group. He has over 10 years of Investment Banking experience in providing strategic and analytical support for
clients and has completed a vast array of transactions across multiple products including public equity offerings, debt offerings, mergers, acquisitions, and other corporate finance assignments. Prior to
joining Janney, Mr. Nelson was with Ferris, Baker Watts, Inc. for three years in their Financial Institutions Group where he assisted in the execution of numerous private and public capital transactions.
B.S., Applied Economics and Management, Cornell University
CLIFF BOOTH
Managing Director, Head of Investment Banking
Tel: 410-583-5992, E-Mail: [email protected]
Mr. Booth joined Janney Montgomery Scott in 2008. As the Head of Investment Banking, Mr. Booth is responsible for leading the strategic direction, business development and corporate finance activities of
Janney’s Investment Banking Division within the Capital Markets Group. As Head of the Financial Institutions Group, he oversees transactions in the areas of BDCs, Specialty Finance, REITs, Banks and
Insurance. Mr. Booth has executed over 100 capital markets and mergers and acquisition transactions in the financial services and real estate areas over his career. He has executed a variety of
transactions for his clients including Initial Public Offerings, Follow-on Equity Offerings, Public to Public M&A, Private to Private M&A, Asset Backed Securitizations, Private Equity and Debt Placements, J.V.
Structures, Recapitalizations and Distressed Asset Sales. Prior to Janney Montgomery Scott, Mr. Booth was Head of the Financial Institutions Investment Banking Group at Ferris, Baker Watts, Inc., where
he built a Specialty Finance Practice and managed over $11 billion of capital transactions for his clients. Prior to Ferris, Baker Watts, Inc., Mr. Booth worked in the Real Estate Investment Banking Group of
First Union Securities (now Wells Fargo Securities)
M.S., Finance, The George Washington University B.S., Finance, Syracuse University
JONATHAN KETZNER
Vice President, Financial Institutions Investment Banking
Tel: 215-665-6619 E-Mail: [email protected]
Mr. Ketzner joined Janney Montgomery Scott in 2010. His responsibilities include marketing the firm’s services and execution of mergers and acquisitions, branch purchases and divestitures, equity and
debt offerings and selective asset sales. Mr. Ketzner previously worked in the Corporate Strategy and Mergers & Acquisitions group at Citigroup, where he worked with senior management to implement
strategic initiatives through the execution of mergers and acquisitions, capital raisings and structural reorganizations. Mr. Ketzner also serves on the board of New York Professional Advisors for Community
Entrepreneurs
M.A., International Relations, Johns Hopkins University; B.A., History, Johns Hopkins University

9
TYLER CANDEE
Analyst, Financial Institutions Investment Banking
Tel: 215-665-6461 E-Mail: [email protected]
Mr. Candee joined Janney Montgomery Scott in 2015. His responsibilities include financial analysis for mergers & acquisitions, capital offerings, and other financial advisory assignments.
B.B.A., Finance, Villanova University
Financial Institutions Group Professionals (continued)
DEAN SALDSMAN
Analyst, Financial Institutions Investment Banking
Tel: 215-665-4479; E-Mail: [email protected]
Mr. Saldsman joined Janney Montgomery Scott in 2015. His responsibilities include financial analysis for mergers & acquisitions, capital offerings, and asset sales and divestitures.
M.S., Finance, Villanova University, B.S., Finance & Economics, Florida Gulf Coast University
BLAINE WILLENBORG
Analyst, Financial Institutions Investment Banking
Tel: 215-665-6021 E-Mail: [email protected]
Mr. Willenborg joined Janney Montgomery Scott in 2016. His responsibilities include financial analysis for mergers & acquisitions, capital offerings, and financial advisory assignments.
B. S., Economics, University of Pennsylvania: The Wharton School
TYLER ZON
Analyst, Financial Institutions Investment Banking
Tel: 215-665-6188; E-Mail: [email protected]
Mr. Zon joined Janney Montgomery Scott in 2016. His responsibilities include financial analysis for mergers & acquisitions, capital offerings, and asset sales and divestitures.
B.A., Economics and Computer Science, Swarthmore College
JUSTIN WINKLER
Analyst, Financial Institutions Investment Banking
Tel: 215-665-4586; E-Mail: [email protected]
Mr. Winkler joined Janney Montgomery Scott in 2016. His responsibilities include financial analysis for mergers & acquisitions, capital offerings, and asset sales and divestitures.
B.A., Economics, Haverford College
10
Capital Markets Professionals
STEVE GENYK
Managing Director, Head of Fixed Income Capital Markets
Tel: 215-665-6240, E-Mail: [email protected]
Mr. Genyk joined Janney Montgomery Scott in 2008 and is responsible for leading the strategic direction, business development and financing activities of Janney’s Fixed Income Capital Markets Division.
Mr. Genyk serves on the Management Committee of the firm. Mr. Genyk began his career as a banker in corporate finance and transitioned to public finance in 1991. He joined Janney after serving the
Philadelphia Industrial Development Corporation (PIDC), the City of Philadelphia’s primary economic development agency, as Senior Vice President of the Financing Services Group. Prior to joining PIDC,
Mr. Genyk was a Managing Director with Bear Stearns and prior to that spent over eight years with Legg Mason in a variety of capacities including co-head of Public Finance. Mr. Genyk is a graduate of
Wesleyan University and holds a Masters in Government Administration from the Fels Institute of Government, University of Pennsylvania. He taught a graduate finance course at the University of
Pennsylvania for eight years and is a Board Member of the Philadelphia Zoo.
WILL CORKHILL
Managing Director, Head of Equity Capital Markets
Tel: 617-557-2970, E-Mail: [email protected]
Mr. Corkhill joined Janney Montgomery Scott in 2002 as Head of Equity Capital Markets in the firm’s Boston office. He is responsible for coordinating all public offerings for which the firm serves as an
underwriter. Prior to joining Janney, Mr. Corkhill spent five years with Boston-based Tucker Anthony Sutro. As Managing Director and Head of Equity Syndicate, he coordinated over 100 public offerings of
equity and debt securities for firms across a range of industries. From 1991 to 1996, he was a senior professional in the Equity Capital Markets group of Smith Barney in New York City. Mr. Corkhill is a past
board member of the Investment Association of New York and has been a member of the Securities Industry Association's Syndicate Committee. He holds Series 7, 9, 10, 24, 55 and 63 licenses. Mr.
Corkhill graduated from Hobart College and attended the Graduate School of Business at Fordham University.
ANDREW MADDALONI
Managing Director, Director of Research & Head of Institutional Equity Sales
Tel: 215-665-6234; E-Mail: [email protected]
Mr. Maddaloni joined Janney in the fall of 2012 as Managing Director and Head of Product Management; he assumed the role of Director of Research in April 2013. Prior to joining Janney, he served as a
Portfolio Manager and Analyst at Friess Associates, where he helped to manage a $7 billion portfolio of growth equities. Prior to joining Friess, he held equity research sales positions at Banc of America
Securities, William Blair, Credit Suisse and Donaldson Lufkin and Jenrette. Mr. Maddaloni is a 1991 graduate of Pennsylvania State University.
JOSEPH CULLEY
Managing Director, Head of Equities & Investment Banking
Tel: 215-665-6256 E-Mail: [email protected]
Mr. Culley joined Janney in 2000 and serves as Head of Equities and Investment Banking, which includes the firm's investment banking, equity research, institutional equity sales and trading, equity capital
markets and syndicate operations. He also serves as Chairperson for Janney's Equity Commitment, Private Placement and Fairness Opinion Committees. Prior to being Head of Equities and Investment
Banking, he was Co-Head of Investment Banking. Mr. Culley is currently serving on the Board of Directors of the Equity Dealers of America, the Board of Trustees of the Pennsylvania Academy of Fine Arts
and on the Board of Directors of the Mann Center for the Performing Arts. Mr. Culley previously served on the Board of Governors of the Philadelphia Securities Association. Mr. Culley received a B.A. in
Economics from Swarthmore College.