jános szentágothai memorial conference, pécs, oct 30, 2012 9:55 turning neural networks into...
TRANSCRIPT

János Szentágothai Memorial Conference, Pécs, Oct 30, 2012 9:55Turning Neural Networks into
money?(Building Forex Trading Robots with Artificial Neural Networks)
Dr. Gábor Pauler, Associate Professor,
University of Pécs, Faculty of Natural Sciences, Department of
Information Technology, 7624 Pécs, Ifjúság u. 6.
E-mail: [email protected]
Balázs KovácsAssistant Professor,
University of Pécs, Faculty of Economics, Department of Business Methodologies, 7622 Pécs, Rákóczi u. 80.
E-mail: [email protected]

Content of the Presentation1.Introduction
1.1.Basic terms of Forex1.2.Risks of Forex: Leverage1.3.Need for Forex trading bots: Traps of human psychology judging very low and high probabilities
2.Artificial Neural Network-based Forex trading bots2.1.Basics of neural topologies2.2.Transferring forecasting problem into image recognition2.3.Graphic example of activation of 4-layer Perceptron Network2.4.Graphic example of learning of 4-layer Perceptron Network
3. Our research directions3.1.Kohonen Feature Maps3.2.Kohonen Grid distances by semantic distances produced by text mining
References

€
1.Introduction: 1.1.Basic terms of ForexThe global Foreign Exchange market (FOREX) is the most liquid market of the world: $4 trillion (4*1012 ) daily turnover.
FOREX is open 24 hours a day due to its global nature. (GMT 22:00 Sunday – GMT 22:00 Friday)
Instruments traded on FOREX are called currency pairs, which are composed of two currencies, one of them being sold, the other being bought. (EUR\USD, EUR\JPY, GBP\USD …)
FOREX is an OTC market (Over-The-Counter) and is not operated by facilities of stock trading.
Accessing to FOREX trading is possible through banks or FOREX brokers. They are compensated for their services through commission fees and the bid-ask spread. $

1.Introduction: 1.2.Risks of ForexFOREX trading has certain capital requirements:
A FOREX-contract has a standard trade volume, called 1 lot, which means 100,000 units of base currency. (e.g. €100,000)
Small investors could not afford such contracts, if FOREX-brokers would not offer them leverage.
1:100 leverage means that investing e.g. €1,000 in EUR\USD pair results a €100,000 contract value, which is exactly 1 lot
The investor can possess of the whole profit of the contract, but he must fulfill the margin requirements. The margin covers the eventual losses of the investor, so brokers can forcefully close loss-making contracts without risking their own money. (margin call)
$$$ $$$$$$$$$ $$$ $$$
$$$ $$$ $$$
$$$
100 000 $
1000 $
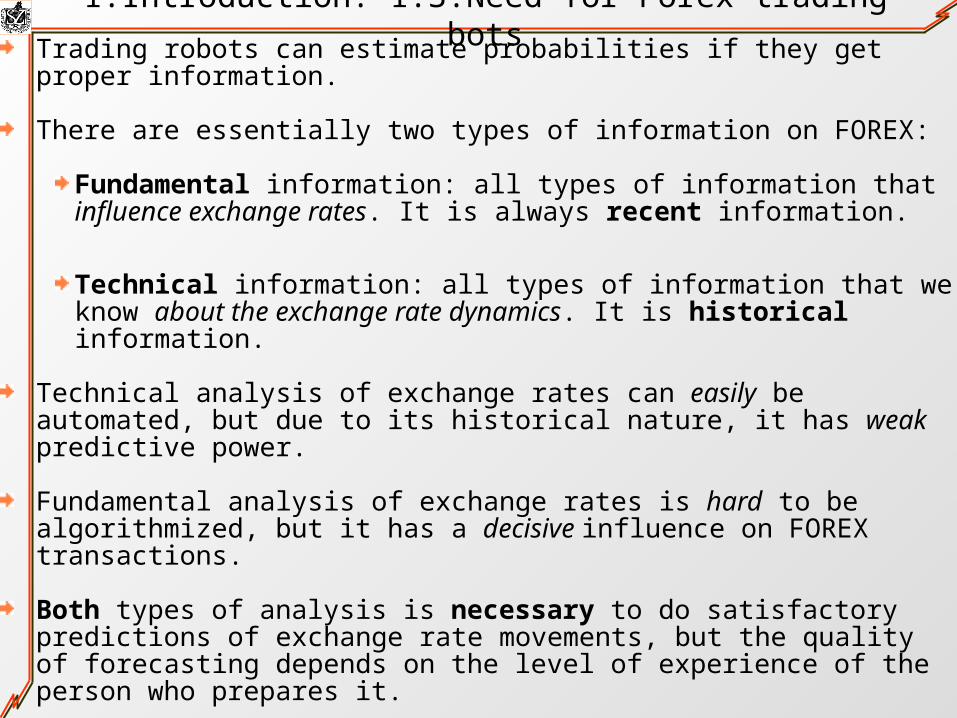
1.Introduction: 1.3.Need for Forex trading botsTrading robots can estimate probabilities if they get proper information.
There are essentially two types of information on FOREX:
Fundamental information: all types of information that influence exchange rates. It is always recent information.
Technical information: all types of information that we know about the exchange rate dynamics. It is historical information.
Technical analysis of exchange rates can easily be automated, but due to its historical nature, it has weak predictive power.
Fundamental analysis of exchange rates is hard to be algorithmized, but it has a decisive influence on FOREX transactions.
Both types of analysis is necessary to do satisfactory predictions of exchange rate movements, but the quality of forecasting depends on the level of experience of the person who prepares it.
Every person has certain psychological biases.
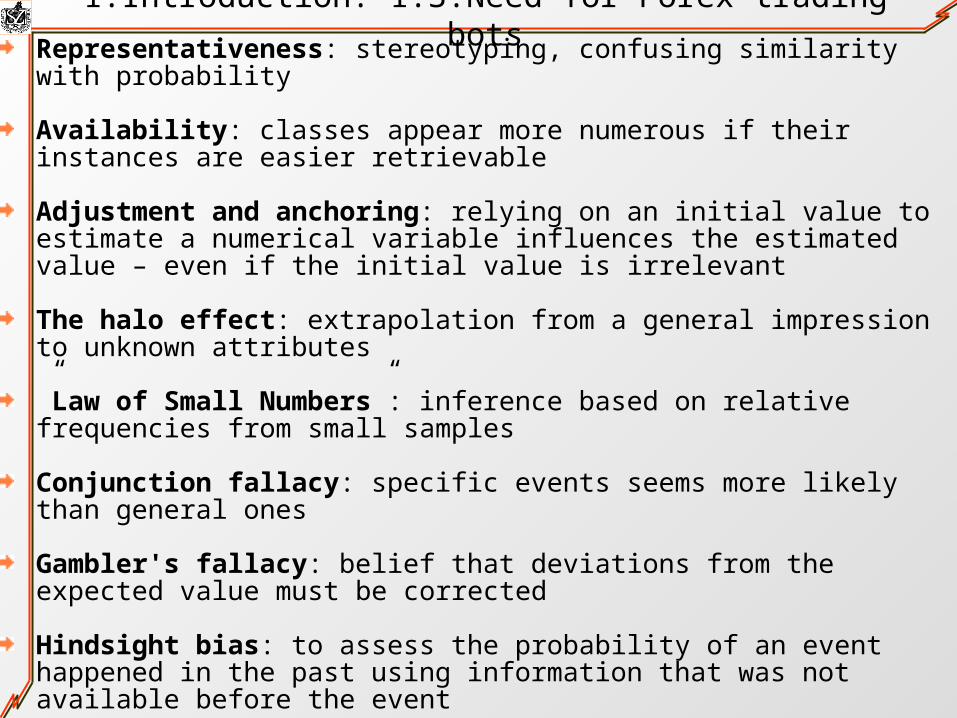
1.Introduction: 1.3.Need for Forex trading botsRepresentativeness: stereotyping, confusing similarity with probability
Availability: classes appear more numerous if their instances are easier retrievable
Adjustment and anchoring: relying on an initial value to estimate a numerical variable influences the estimated value – even if the initial value is irrelevant
The halo effect: extrapolation from a general impression to unknown attributes
”Law of Small Numbers”: inference based on relative frequencies from small samples
Conjunction fallacy: specific events seems more likely than general ones
Gambler's fallacy: belief that deviations from the expected value must be corrected
Hindsight bias: to assess the probability of an event happened in the past using information that was not available before the event
Content of the Presentation1.Introduction
1.1.Basic terms of Forex1.2.Risks of Forex: Leverage1.3.Need for Forex trading bots: Traps of human psychology judging very low and high probabilities
2.Artificial Neural Network-based Forex trading bots2.1.Basics of neural topologies2.2.Transferring forecasting problem into image recognition2.3.Graphic example of activation of 4-layer Perceptron Network2.4.Graphic example of learning of 4-layer Perceptron Network
3. Our research directions3.1.Kohonen Feature Maps3.2.Kohonen Grid distances by semantic distances produced by text mining
References
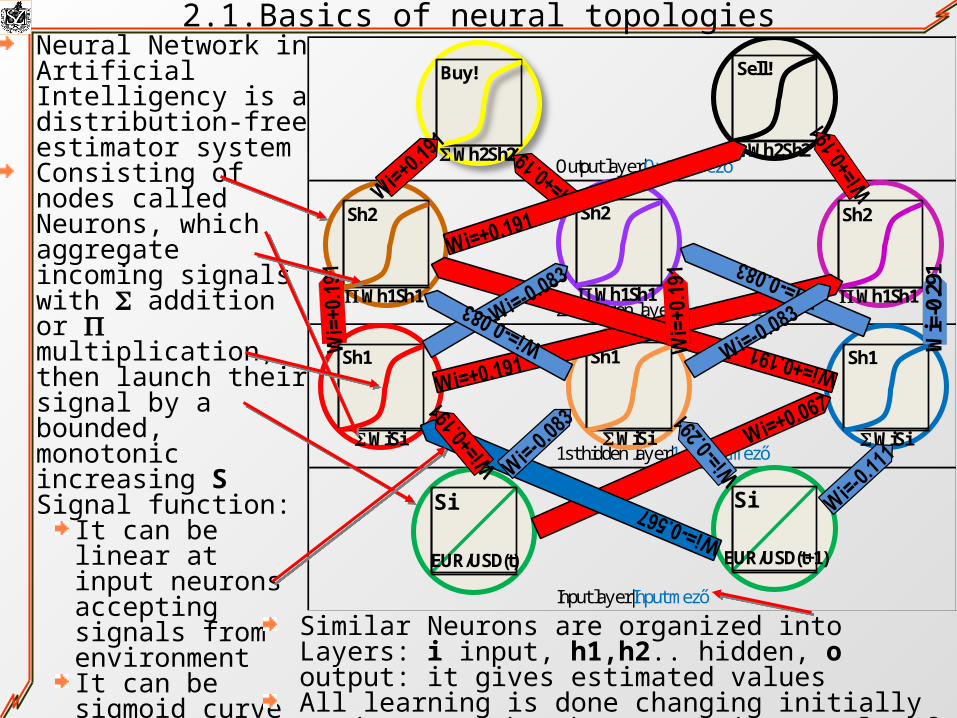
2.1.Basics of neural topologiesNeural Network in Artificial Intelligency is a distribution-free estimator systemConsisting of nodes called Neurons, which aggregate incoming signals with S addition or P multiplication, then launch their signal by a bounded, monotonic increasing S Signal function:
It can be linear at input neurons accepting signals from environmentIt can be sigmoid curve for others
Nodes of Neurons are connected by directed edges of Synapses transmitting signals weighted with W positive/negative weights
Output lay er|Output mező
2nd hidden lay er|2. rejtett mező
1st hidden lay er|1. rejtett mező
Input lay er|Input mező
Si
EUR/USD(t)
Si
EUR/USD(t+1)
Sh1
SWiSi
Sh1
SWiSi
Sh1
SWiSi
Sh2
PWh1Sh1
Sh2
PWh1Sh1
Sh2
PWh1Sh1
Wi=
-0.2
91
Buy!
SWh2Sh2
Sell!
SWh2Sh2
Similar Neurons are organized into Layers: i input, h1,h2.. hidden, o output: it gives estimated valuesAll learning is done changing initially random W weights by a Learning sample of observations of I/O variables
2.2.Transferring forecasting problem into image recognition 1
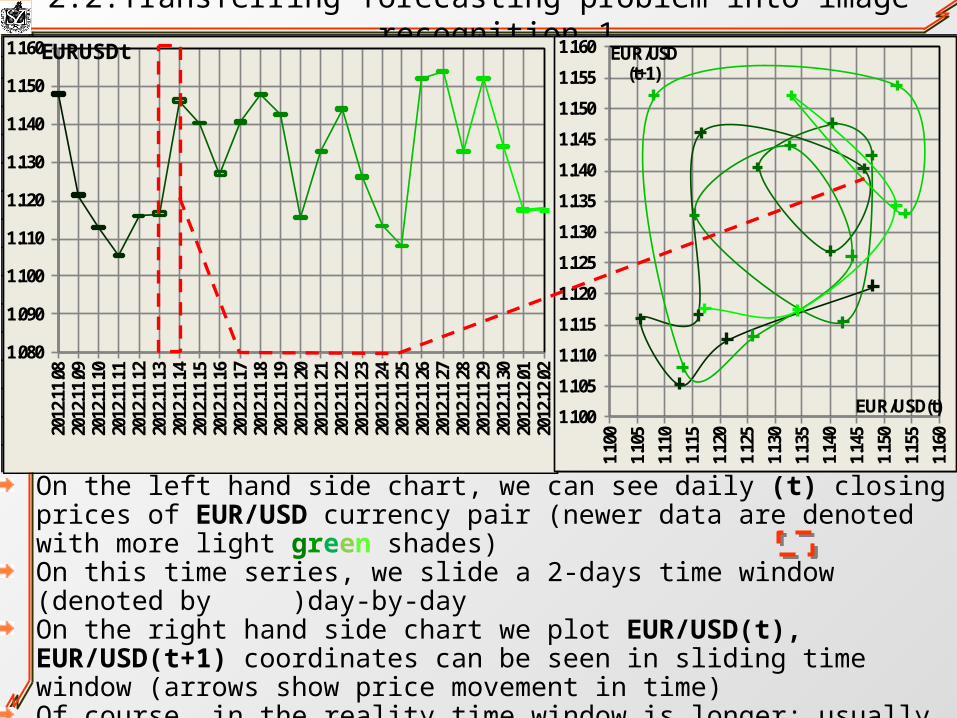
On the left hand side chart, we can see daily (t) closing prices of EUR/USD currency pair (newer data are denoted with more light green shades)On this time series, we slide a 2-days time window (denoted by )day-by-dayOn the right hand side chart we plot EUR/USD(t), EUR/USD(t+1) coordinates can be seen in sliding time window (arrows show price movement in time)Of course, in the reality time window is longer: usually 14 days. Moreover, we collect data of more currency pairs/interest rates/stock prices/indicators in thatBut that would result in a 30-40 dimensional plot we cannot draw as example
1.080
1.090
1.100
1.110
1.120
1.130
1.140
1.150
1.16020
12.1
1.08
2012
.11.
0920
12.1
1.10
2012
.11.
1120
12.1
1.12
2012
.11.
1320
12.1
1.14
2012
.11.
1520
12.1
1.16
2012
.11.
1720
12.1
1.18
2012
.11.
1920
12.1
1.20
2012
.11.
2120
12.1
1.22
2012
.11.
2320
12.1
1.24
2012
.11.
2520
12.1
1.26
2012
.11.
2720
12.1
1.28
2012
.11.
2920
12.1
1.30
2012
.12.
0120
12.1
2.02
EURUSDt
1.100
1.105
1.110
1.115
1.120
1.125
1.130
1.135
1.140
1.145
1.150
1.155
1.160
1.10
0
1.10
5
1.11
0
1.11
5
1.12
0
1.12
5
1.13
0
1.13
5
1.14
0
1.14
5
1.15
0
1.15
5
1.16
0
EUR/USD(t+1)
EUR/USD(t)

2.2.Transferring forecasting problem into image recognition 2One can notice that trends in time series form shapes in time window plot:
Eg.: Totally random movement will form tangled mess laying around the 45 degree trace line of the chart:
Eg.: Almost regular sine-like wawes will form circles symmetric to trace:
Eg.: Stepped trend movement with local wawes form clustered zig-zag patterns on trace:
1.080
1.090
1.100
1.110
1.120
1.130
1.140
1.150
1.160
2012
.10.
3120
12.1
1.01
2012
.11.
0220
12.1
1.03
2012
.11.
0420
12.1
1.05
2012
.11.
0620
12.1
1.07
2012
.11.
0820
12.1
1.09
2012
.11.
1020
12.1
1.11
2012
.11.
1220
12.1
1.13
2012
.11.
1420
12.1
1.15
2012
.11.
1620
12.1
1.17
2012
.11.
1820
12.1
1.19
2012
.11.
2020
12.1
1.21
2012
.11.
2220
12.1
1.23
2012
.11.
24
EURUSDt
1.100
1.105
1.110
1.115
1.120
1.125
1.130
1.135
1.140
1.145
1.150
1.155
1.160
1.10
0
1.10
5
1.11
0
1.11
5
1.12
0
1.12
5
1.13
0
1.13
5
1.14
0
1.14
5
1.15
0
1.15
5
1.16
0
EUR/USD(t+1)
EUR/USD(t)
1.080
1.090
1.100
1.110
1.120
1.130
1.140
1.150
1.160
2012
.11.
1120
12.1
1.12
2012
.11.
1320
12.1
1.14
2012
.11.
1520
12.1
1.16
2012
.11.
1720
12.1
1.18
2012
.11.
1920
12.1
1.20
2012
.11.
2120
12.1
1.22
2012
.11.
2320
12.1
1.24
2012
.11.
2520
12.1
1.26
2012
.11.
2720
12.1
1.28
2012
.11.
2920
12.1
1.30
2012
.12.
0120
12.1
2.02
2012
.12.
0320
12.1
2.04
2012
.12.
05
EURUSDt
1.100
1.105
1.110
1.115
1.120
1.125
1.130
1.135
1.140
1.145
1.150
1.155
1.160
1.10
0
1.10
5
1.11
0
1.11
5
1.12
0
1.12
5
1.13
0
1.13
5
1.14
0
1.14
5
1.15
0
1.15
5
1.16
0
EUR/USD(t+1)
EUR/USD(t)
1.090
1.100
1.110
1.120
1.130
1.140
1.150
1.16020
12.1
1.07
2012
.11.
0820
12.1
1.09
2012
.11.
1020
12.1
1.11
2012
.11.
1220
12.1
1.13
2012
.11.
1420
12.1
1.15
2012
.11.
1620
12.1
1.17
2012
.11.
1820
12.1
1.19
2012
.11.
2020
12.1
1.21
2012
.11.
2220
12.1
1.23
2012
.11.
2420
12.1
1.25
2012
.11.
2620
12.1
1.27
2012
.11.
2820
12.1
1.29
2012
.11.
3020
12.1
2.01
EURUSDt
1.100
1.105
1.110
1.115
1.120
1.125
1.130
1.135
1.140
1.145
1.150
1.155
1.160
1.10
0
1.10
5
1.11
0
1.11
5
1.12
0
1.12
5
1.13
0
1.13
5
1.14
0
1.14
5
1.15
0
1.15
5
1.16
0
EUR/USD(t+1)
EUR/USD(t)

2.3.Graphic example of activation of 4-layer Perceptron Network 1
How Multi-layer Perceptron Neural Networks can recognize images?Linear neurons in the input layer do nothing just accept (EUR/USD(t), EUR/USD(t+1)) coordinates and transmit them unchangedEach additive, sigmoid neuron in first hidden layer is similar to a separate logistic regression, sensitive to different directions (see red---, orange---, blue---) in Decision space of EUR/USD(t)×EUR/USD(t+1): each of them are separating it into two half-spaces (signal/ non-signal)
Output lay er|Output mező
2nd hidden lay er|2. rejtett mező
1st hidden lay er|1. rejtett mező
Input lay er|Input mező
1.100
1.105
1.110
1.115
1.120
1.125
1.130
1.135
1.140
1.145
1.150
1.155
1.1601.
100
1.10
5
1.11
0
1.11
5
1.12
0
1.12
5
1.13
0
1.13
5
1.14
0
1.14
5
1.15
0
1.15
5
1.16
0
EUR/USD(t+1)
EUR/USD(t)
Si
EUR/USD(t)
Si
EUR/USD(t+1)
Sh1
SWiSi
Sh1
SWiSi
Sh1
SWiSi
2.3.Graphic example of working of 4-layer Perceptron Network 2
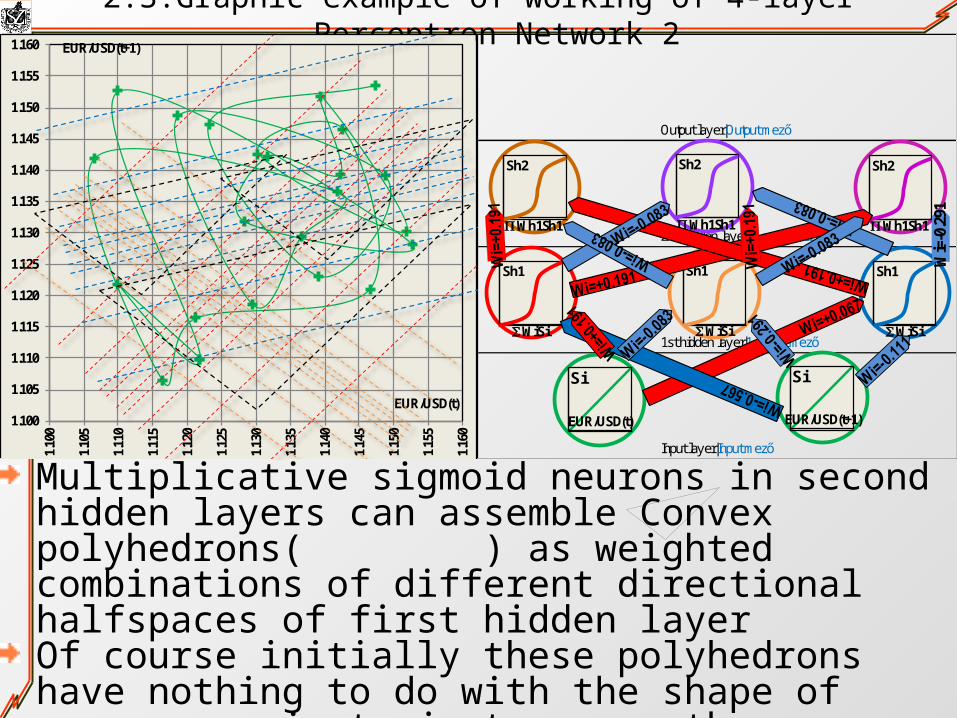
Multiplicative sigmoid neurons in second hidden layers can assemble Convex polyhedrons( ) as weighted combinations of different directional halfspaces of first hidden layerOf course initially these polyhedrons have nothing to do with the shape of currency pair trajectory, as they are assembled by totally random initial W weights
Output lay er|Output mező
2nd hidden lay er|2. rejtett mező
1st hidden lay er|1. rejtett mező
Input lay er|Input mező
1.100
1.105
1.110
1.115
1.120
1.125
1.130
1.135
1.140
1.145
1.150
1.155
1.1601.
100
1.10
5
1.11
0
1.11
5
1.12
0
1.12
5
1.13
0
1.13
5
1.14
0
1.14
5
1.15
0
1.15
5
1.16
0
EUR/USD(t+1)
EUR/USD(t)
Si
EUR/USD(t)
Si
EUR/USD(t+1)
Sh1
SWiSi
Sh1
SWiSi
Sh1
SWiSi
Sh2
PWh1Sh1
Sh2
PWh1Sh1
Sh2
PWh1Sh1
Wi=
-0.2
91

2.3.Graphic example of working of 4-layer Perceptron Network 3
Additive sigmoid neurons in the output layer can assemble difficult shaped Concave polyhedrons( ) as weighted combination of Convex polyhedrons of previous hidden layer. They are to model shape of price trajectory(─╬─╬→)Of course initially these Concave polyhedrons has nothing to do with the shape of the trajectory, as they are assembled from totally random W weights
Output lay er|Output mező
2nd hidden lay er|2. rejtett mező
1st hidden lay er|1. rejtett mező
Input lay er|Input mező
1.100
1.105
1.110
1.115
1.120
1.125
1.130
1.135
1.140
1.145
1.150
1.155
1.1601.
100
1.10
5
1.11
0
1.11
5
1.12
0
1.12
5
1.13
0
1.13
5
1.14
0
1.14
5
1.15
0
1.15
5
1.16
0
EUR/USD(t+1)
EUR/USD(t)
Si
EUR/USD(t)
Si
EUR/USD(t+1)
Sh1
SWiSi
Sh1
SWiSi
Sh1
SWiSi
Sh2
PWh1Sh1
Sh2
PWh1Sh1
Sh2
PWh1Sh1
Wi=
-0.2
91
Buy!
SWh2Sh2
Sell!
SWh2Sh2

2.4.Graphic example of learning of 4-layer Perceptron Network 1
Before learning – using initial random W weights – the network will estimate totally bad outputs from incoming inputs (e.g.: Buy! output neuron signals when the price will go down and you should sell, etc.)We call Do the positive/negative errors in output neurons signal from desired correct outputBackpropagation learning starts with trying to correct bad output signal by DWo changing incoming weights of o output layer in the desired directionGraphically, it means strenghtening/weakening some convex polyhedron parts in the concave polyhedron( ) represented by output neuron Buy!
Output lay er|Output mező
2nd hidden lay er|2. rejtett mező
1st hidden lay er|1. rejtett mező
Input lay er|Input mező
1.100
1.105
1.110
1.115
1.120
1.125
1.130
1.135
1.140
1.145
1.150
1.155
1.1601.
100
1.10
5
1.11
0
1.11
5
1.12
0
1.12
5
1.13
0
1.13
5
1.14
0
1.14
5
1.15
0
1.15
5
1.16
0
EUR/USD(t+1)
EUR/USD(t)
Si
EUR/USD(t)
Si
EUR/USD(t+1)
Sh1
SWiSi
Sh1
SWiSi
Sh1
SWiSi
Sh2
PWh1Sh1
Sh2
PWh1Sh1
Sh2
PWh1Sh1
Wi=
-0.2
91
Buy!
SWh2Sh2
Sell!
SWh2Sh2
Do
DWoDWo
Output lay er|Output mező
2nd hidden lay er|2. rejtett mező
1st hidden lay er|1. rejtett mező
Input lay er|Input mező
1.100
1.105
1.110
1.115
1.120
1.125
1.130
1.135
1.140
1.145
1.150
1.155
1.1601.
100
1.10
5
1.11
0
1.11
5
1.12
0
1.12
5
1.13
0
1.13
5
1.14
0
1.14
5
1.15
0
1.15
5
1.16
0
EUR/USD(t+1)
EUR/USD(t)
Si
EUR/USD(t)
Si
EUR/USD(t+1)
Sh1
SWiSi
Sh1
SWiSi
Sh1
SWiSi
Sh2
PWh1Sh1
Sh2
PWh1Sh1
Sh2
PWh1Sh1
Wi=
-0.2
91
Buy!
SWh2Sh2
Sell!
SWh2Sh2
2.4.Graphic example of learning of 4-layer Perceptron Network 2
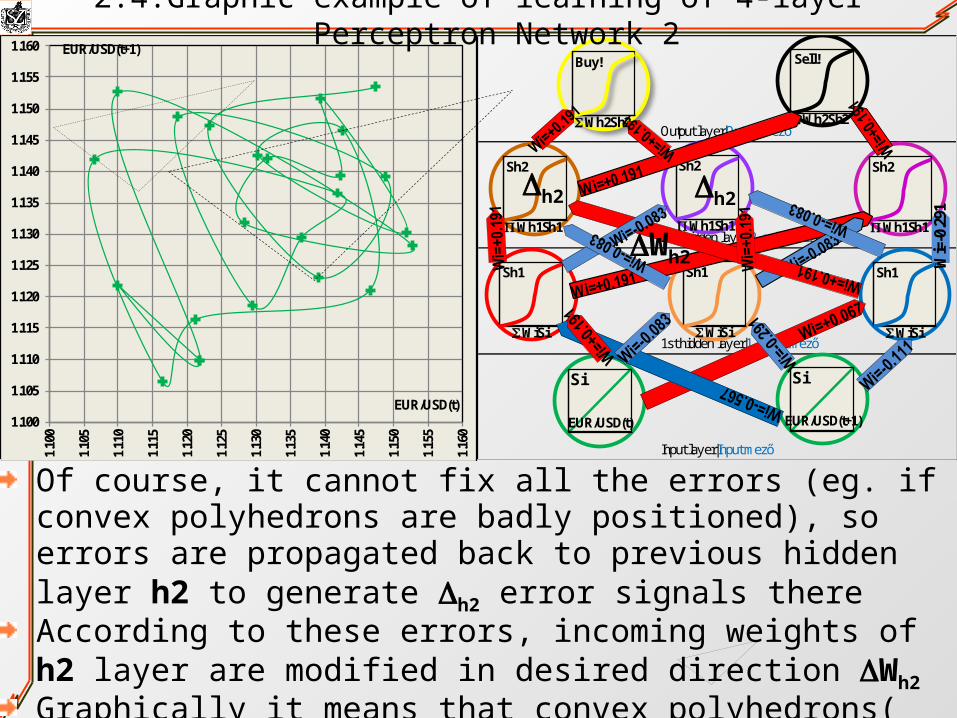
Of course, it cannot fix all the errors (eg. if convex polyhedrons are badly positioned), so errors are propagated back to previous hidden layer h2 to generate Dh2 error signals thereAccording to these errors, incoming weights of h2 layer are modified in desired direction DWh2
Graphically it means that convex polyhedrons( ) are moved to better match shape of currency pair price trajectory
Dh2 Dh2
DWh2

2.4.Graphic example of learning of 4-layer Perceptron Network 3
Of course it cannot fix edges of convex polyhedrons, which aren’t rotated in the correct direction, so errors are propagated back again to previous layer h1 to generate Dh1
error signals, and incoming weights of h1 layer are modified in desired direction DWh1
Graphically: edges of convex polyhedrons( ) are rotated for better matching shapeBackpropagating process is repeated for all observations cyclicly called EpochsSuch a complicated learning may easily stuck in suboptimal solutions, resulting ineffective estimation. So weights are modified by only a 0.1-0.5% Learning rate during several 10000s of epochs resulting tremendous computational requirement
Output lay er|Output mező
2nd hidden lay er|2. rejtett mező
1st hidden lay er|1. rejtett mező
Input lay er|Input mező
1.100
1.105
1.110
1.115
1.120
1.125
1.130
1.135
1.140
1.145
1.150
1.155
1.1601.
100
1.10
5
1.11
0
1.11
5
1.12
0
1.12
5
1.13
0
1.13
5
1.14
0
1.14
5
1.15
0
1.15
5
1.16
0
EUR/USD(t+1)
EUR/USD(t)
Si
EUR/USD(t)
Si
EUR/USD(t+1)
Sh1
SWiSi
Sh1
SWiSi
Sh1
SWiSi
Sh2
PWh1Sh1
Sh2
PWh1Sh1
Sh2
PWh1Sh1
Wi=
-0.2
91
Buy!
SWh2Sh2
Sell!
SWh2Sh2
Dh1Dh1 Dh1
DWh1
Content of the Presentation1.Introduction
1.1.Basic terms of Forex1.2.Risks of Forex: Leverage1.3.Need for Forex trading bots: Traps of human psychology judging very low and high probabilities
2.Artificial Neural Network-based Forex trading bots2.1.Basics of neural topologies2.2.Transferring forecasting problem into image recognition2.3.Graphic example of activation of 4-layer Perceptron Network2.4.Graphic example of learning of 4-layer Perceptron Network
3. Our research directions3.1.Kohonen Feature Maps3.2.Kohonen Grid distances by semantic distances produced by text mining
References

3. Our research directions: 3.1.Kohonen Feature Maps
1.100
1.105
1.110
1.115
1.120
1.125
1.130
1.135
1.140
1.145
1.150
1.155
1.160
1.10
0
1.10
5
1.11
0
1.11
5
1.12
0
1.12
5
1.13
0
1.13
5
1.14
0
1.14
5
1.15
0
1.15
5
1.16
0
EUR/USD(t+1)
EUR/USD(t)
Si
EUR/USD(t+1)
Si
EUR/USD(t)
Buy!
SWh2Sh2
Sell!
SWh2Sh2
-0.20-0.100.000.100.200.300.400.500.600.700.800.901.00
-3.00 -2.50 -2.00 -1.50 -1.00 -0.50 0.00 0.50 1.00 1.50 2.00 2.50 3.00
d
m Mexican hutcharacteristics
de
Sh1
SWiSi
Sh1
SWiSi
Sh1
SWiSi
Sh1
SWiSi
Gri
dca
libra
tion
Its disadvantage is that 20..40 dimensional grids we need require tremendous number of neuronsMaking learning slow and uncertain again
The same quality of image recognition can be achieved by less computation require-ment with a tricky network where there is only one hidden layer, Its neurons are cluster centers in decision space, and they are connected into an elastically distorting 2D grid by their intra-layer connections:Close neighbors attract each otherIntermediate neighbors distract each otherFar neurons do nothing
Sh1
SWiSi
Sh1
SWiSi
Sh1
SWiSi
Sh1
SWiSi
Sh1
SWiSi
Sh1
SWiSi
Sh1
SWiSiSh1
SWiSi
Sh1
SWiSi

3.2.Grid distances by semantic distances produced by text miningBut instead of using regular grid...
1.100
1.105
1.110
1.115
1.120
1.125
1.130
1.135
1.140
1.145
1.150
1.155
1.160
1.10
0
1.10
5
1.11
0
1.11
5
1.12
0
1.12
5
1.13
0
1.13
5
1.14
0
1.14
5
1.15
0
1.15
5
1.16
0
EUR/USD(t+1)
EUR/USD(t)
Si
EUR/USD(t+1)
Si
EUR/USD(t)
Buy!
SWh2Sh2
Sell!
SWh2Sh2
-0.20-0.100.000.100.200.300.400.500.600.700.800.901.00
-3.00 -2.50 -2.00 -1.50 -1.00 -0.50 0.00 0.50 1.00 1.50 2.00 2.50 3.00
d
m Mexican hutcharacteristics
de
Grid calibration
We will use a semantic network to judge neighbor-hood of cluster centers, based on the linguistic similarity of set of economic news they representSo it unifies technicist and fundamentalist analysis
SiStatement:
Had sex
SiSubject:
President
SiObject:
Porn actress
Sh1
SWiSi
SiStatement:
Cheated
SiSubject:
Cancellor
SiObject:
Wife
Sh1
SWiSi
Sh1
SWiSi
Sh1
SWiSi
Sh1
SWiSi
Sh1
SWiSi
Sh1
SWiSi
Sh1
SWiSi
Sh1
SWiSiSh1
SWiSi
Sh1
SWiSi

ReferencesNeural biologic modelling software:
Neuron: http://www.neuron.yale.edu/neuron/ (free, GUI, Win XP install, Tutorial in HTML, developed by Yale)Genesis: http://www.genesis-sim.org/GENESIS/ (GNU, GUI, Win XP install, Tutorial in HTML, developed by Caltech)PDP++: http://www.cnbc.cmu.edu/Resources/PDP++//PDP++.html (C++ source code, GUI, Win XP install, Tutorial in HTML)
Backpropagation on time series:Intro: http://www.dlsi.ua.es/~mlf/nnafmc/pbook/node28.html Theory: http://axon.cs.byu.edu/~martinez/classes/678/Papers/Werbos_BPTT.pdf BPTT nets in SNNS: http://www.lix.polytechnique.fr/~liberti/public/computing/neural/snns/UserManual/node163.html
Radial Base Function Networks:Intro: http://www.anc.ed.ac.uk/rbf/intro/intro.html Usage in Neural Network Toolbox: http://www.uweb.ucsb.edu/~weibin/nnet/radial72.html
Kohonen-type Self Organizing Maps:Theory: http://www.gc.ssr.upm.es/inves/neural/ann1/unsupmod/CompetLe/kohonen.htm Demo in Java Appletben: http://fbim.fh-regensburg.de/~saj39122/jfroehl/diplom/e-index.html
Counterpropagation-networks:Theory and usage in SNNS: http://www.lix.polytechnique.fr/~liberti/public/computing/neural/snns/UserManual/node155.html

ReferencesFOREX:
BIS (2010): Triennial Central Bank Survey – Report on global foreign exchange market activity in 2010: http://www.bis.org/publ/rpfxf10t.pdf
Psychological distortion:Kahneman, D.; Tversky, A. (1974): Judgment under uncertainty – heuristics and biases, Science 185, 1124–1131. o.Móra, László Xavér (2008): A valószínűségi ítéletalkotás modelljei, Doktori Értekezés, Eötvös Lóránd Tudományegyetem, Pedagógiai és Pszichológiai Kar, Pszichológiai Doktori Iskola: http://5mp.eu/fajlok/szervezetfejlesztes/mora_laszlo_xaver_phd_tezisek_9.99_www.5mp.eu_.pdf