january 20, 2021 mtgage sategy my
TRANSCRIPT
FHNFINANCIAL.COM800.456.5460
Disclaimer is on the last page of this report.
MORTGAGE STRATEGY MONTHLY
FHNFINANCIAL.COM800.456.5460
MORTGAGE STRATEGIESWalt Schmidt, CFA
Alexis Vilimas312.258.5066
Brandon Messing312.258.5057
JANUARY 20, 2021
Pockets of Value in ACMBS p. 2The footprint of the Fed on the MBS market is undeniable, but there are still pockets of relative value in the market based on perceptions of prior cycles. The main challenge for investors is not necessarily a lack of value, but rather a lack of investible assets. In this article, we propose some ideas in the Agency CMBS market. – Walt Schmidt
15yr MBS Speed Profile p. 8 In the prepayment section of the FHN Financial Mortgage Strategy Annual Outlook published last month we presented the key prepayment themes to monitor in 2021, focusing on 30yr conventional and 30yr Ginnie Mae MBS. This analysis expands on that work to include more detail about conventional 15yr MBS and highlight call protection stories that provide prepayment protection at lower prices within the sector. – Alexis Vilimas
Market Update p. 15 Month-to-date, current production 30yr coupons mostly underperformed, while 15yr coupons have shown mixed performance. CMO spreads are unchanged to 4bps tighter. Payups for loan balance spec pools are higher this month. Overall prepayment speeds increased by 7.3% in December. Faster speeds were common throughout the coupon stack due to an exceptionally low rate environment and the additional 3 business days in December. Speeds for the Ginnie Mae sector increased by 10.5%. – Brandon Messing
January 20, 2021 Page 2 of 18
MORTGAGE STRATEGY MONTHLY | POCKETS OF VALUE IN ACMBS
Executive Summary: The footprint of the Fed on the MBS market is undeniable, but there are still pockets of relative value in the market based on perceptions of prior cycles. The main challenge for investors is not necessarily a lack of value, but rather a lack of investible assets. In this article, we propose some ideas in the Agency CMBS market.
A quick review of the Agency CMBS market reveals a few items of note:
�� There is very little Fannie DUS or Freddie Mac K-certificate paper in the secondary market near par. New issues are invested and “put away” rapidly.
�� There are numerous bonds in these sectors available at very high dollar price premiums, mostly above $110, that also carry slightly wider offered spreads than where new issue is pricing.
�� The Fed has purchased $7.3 billion of Fannie DUS, just shy of $2.0 billion of GNR Project Loan and just over $1.0 billion of Freddie K-Certificate paper since the inception of QE4. Even though the amount of K-cert paper purchased is much less than that of the other two sectors, the “take-up” rate of bonds offered in that sector is ~30%, vs. a take-up rate of ~20% in the other two sectors. In fact, 90% of the K-certificate bond purchases during QE4 have occurred in just three operations on March 31, April 9 and May 12, 2020.
The patterns of Fed purchases in the Fannie DUS market and GNR Project Loan markets have also seen a decline since the early weeks of QE4, but the Fed has been more consistent in those markets. Much of that is due to the fact that the Fannie and Ginnie versions of ACMBS have less natural sponsorship across non-Fed investor mandates due to the single-loan nature of Fannie DUS and the relative lack of convexity benefits in the Ginnie Project Loan space. Furthermore, only structured ACMBS – Freddie K-Certificates and Fannie Mae ACES (structures comprised of DUS pools) – are eligible for Bloomberg ACMBS index inclusion.
Given the relative lack of “benchmark” status for the DUS pool and GNR Project Loan sectors, there are some opportunities there for investors who think that the Fed will be on hold with current policy choices for a longer period of time. A good view of this is displayed in Figure 1 below.
January 20, 2021 Page 3 of 18
MORTGAGE STRATEGY MONTHLY | POCKETS OF VALUE IN ACMBS
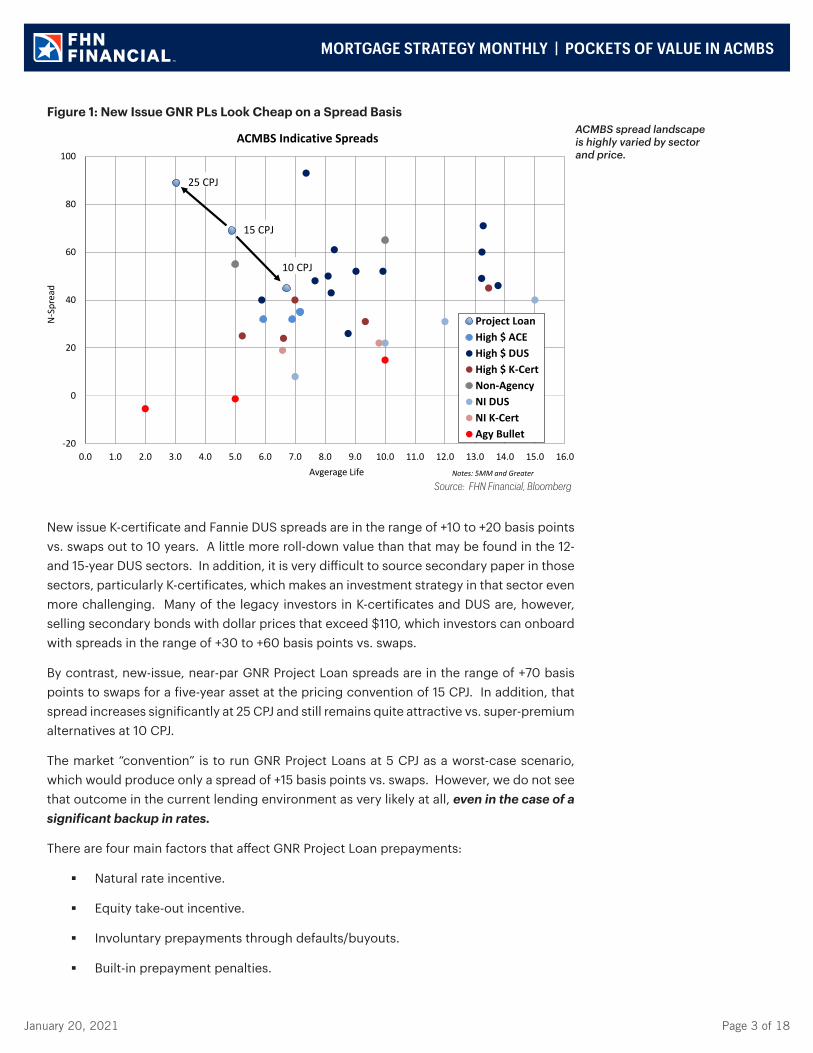
Figure 1: New Issue GNR PLs Look Cheap on a Spread Basis
-20
0
20
40
60
80
100
0.0 1.0 2.0 3.0 4.0 5.0 6.0 7.0 8.0 9.0 10.0 11.0 12.0 13.0 14.0 15.0 16.0
N-S
prea
d
Avgerage Life
ACMBS Indicative Spreads
Project LoanHigh $ ACEHigh $ DUSHigh $ K-CertNon-AgencyNI DUSNI K-CertAgy Bullet
Notes: 5MM and Greater
15 CPJ
25 CPJ
10 CPJ
Source: FHN Financial, Bloomberg
New issue K-certificate and Fannie DUS spreads are in the range of +10 to +20 basis points vs. swaps out to 10 years. A little more roll-down value than that may be found in the 12- and 15-year DUS sectors. In addition, it is very difficult to source secondary paper in those sectors, particularly K-certificates, which makes an investment strategy in that sector even more challenging. Many of the legacy investors in K-certificates and DUS are, however, selling secondary bonds with dollar prices that exceed $110, which investors can onboard with spreads in the range of +30 to +60 basis points vs. swaps.
By contrast, new-issue, near-par GNR Project Loan spreads are in the range of +70 basis points to swaps for a five-year asset at the pricing convention of 15 CPJ. In addition, that spread increases significantly at 25 CPJ and still remains quite attractive vs. super-premium alternatives at 10 CPJ.
The market “convention” is to run GNR Project Loans at 5 CPJ as a worst-case scenario, which would produce only a spread of +15 basis points vs. swaps. However, we do not see that outcome in the current lending environment as very likely at all, even in the case of a significant backup in rates.
There are four main factors that affect GNR Project Loan prepayments:
�� Natural rate incentive.
�� Equity take-out incentive.
�� Involuntary prepayments through defaults/buyouts.
�� Built-in prepayment penalties.
ACMBS spread landscape is highly varied by sector and price.

January 20, 2021 Page 4 of 18
MORTGAGE STRATEGY MONTHLY | POCKETS OF VALUE IN ACMBS
The first three of these factors are, of course, offset by the last. The market uses a simple 5 CPJ assumption for out-of-the-money prepayments, because it stresses a typical front-sequential bond to a 10-year average life and produces a very tight spread. But there is no basis in fact for this assumption. Unfortunately, the data available to produce reliable prepayment projections for the GNR Project Loan sector is not as reliable as that for the residential market, but the overall results point to much faster prepayments than the worst-case market assumption of 5 CPJ in a backup.
A quick review of actual prepayment rates by vintage bears this out. We review 12-month and 3-month historical CPRs in the charts below. (For the purposes of comparing the CPJ assumption to the CPR output below, it is important to note that for a typical front sequential or shorter passthru, a 5 CPJ produces a very similar average life outcome to 6.2 CPR. )
Figure 2: Prepays Do Not Indicate 5 CPJ, Even for Lower GWACs
2019
20182017
2016
20152014
2013
2012
2011 2010
R² = 0.387
10
12
14
16
18
20
22
24
26
28
30
32
34
36
2.50 2.75 3.00 3.25 3.50 3.75 4.00 4.25 4.50 4.75 5.00
CPR
GWAC
GNR PL Sector Prepays12mo CPR vs. GWAC by Vintage
2020
Source: FHN Financial, CPRCDR
The chart in Figure 2 above plots the historical 12-month CPR of all GNR Project Loans by vintage vs. GWAC for years 2010 through 2020. Even though it is admittedly a small sample, the data for the years 2010 through 2019 demonstrate a clear pattern of prepayments vs. GWAC. The 2020 vintage, for which significant prepay penalties are still in force, is still in the process of ramping higher and is therefore not included in the regression results. But even that vintage is showing a 12-month historical 10 CPR already.
Prepays by GWAC and vintage show GNR Project Loan speeds to be brisk.

January 20, 2021 Page 5 of 18
MORTGAGE STRATEGY MONTHLY | POCKETS OF VALUE IN ACMBS
We pulled the x-axis on the left side down to a GWAC of 2.50%, because that is approximately the GWAC of most new deals – priced near par – that are being created currently. If recent patterns hold, the regression analysis suggests that the 2020 vintage will have a 12-month CPR in the low- to mid-20s within a year or two and that, once fully seasoned, the most recently-issued paper should prepay close to 20 CPR. A view of the 3-month historical CPR by GWAC and vintage in Figure 3 below demonstrates that the current lending environment may produce even faster speeds.
Figure 3: Speeds Have Become Faster Recently, Demonstrated by 3-Month Historical CPR
2019
2018
2017
2016
2015 2014
2013
2012
2011
2010
R² = 0.469
10
15
20
25
30
35
40
45
50
2.50 2.75 3.00 3.25 3.50 3.75 4.00 4.25 4.50 4.75 5.00
CPR
GWAC
GNR PL Sector Prepays3mo CPR vs. GWAC by Vintage
2020
Source: FHN Financial, CPRCDR
Following the regression line to the left based on the ramped 2010-2019 vintages, the most recent 3mo CPR results suggest an even faster eventual prepayment outcome of 25 CPR for newly-minted bonds with GWAC in the 2.50% area in the current rate and lending environment.
So, that is the important question: what characteristics about a future lending environment would possibly lead to a long-term prepay assumption of 5 CPJ for this sector? Obviously, any bond with a GWAC profile that is in-the-money will very likely prepay faster than 10 CPJ, but that is not all.
Even though the data available for GNR Project Loans is not as robust as for residential, we do know that there is a significant equity take-out feature to GNR Project Loans because they are, after all, commercial properties. That means that some borrowers have the incentive to refi and pay the remaining prepayment penalty to take equity out of an appreciated property. One can certainly envision a scenario in which rates rise. But an extreme slowing of long-horizon prepayment expectations for the GNR Project Loan sector would require both materially higher rates AND a slowing of the economy to reduce the equity take-out option for borrowers. In other words, a major stagflation.
Prepays have only become faster lately and suggest lower GWAC speeds will remain elevated.

January 20, 2021 Page 6 of 18
MORTGAGE STRATEGY MONTHLY | POCKETS OF VALUE IN ACMBS
By contrast, we see the main risk to the GNR PL sector being faster-than-expected, not slower-than-expected, prepays.
This view ties back to the data in Figure 1 above about prepay outcomes and spread/yield results. Fortunately for yield-sensitive investors such as banks, credit unions and insurance companies, the yield profile of near-par GNR Project Loans is not materially different in a very wide variety of prepay profiles. But some investors are concerned about mark-to-market and general extension risk that was experienced in the sector the last time rates were very low in late-2012. (By the way, look at the actual speed results from the 2012 and 2013 vintages in Figures 2 and 3: nowhere near 5 CPR/CPJ. Longer-term, those concerns were misplaced.)
The difference between 5 CPJ and 10 CPJ is significant for most bonds in the GNR Project Loan sector. The results for a typical new issue bond (this is a passthru, but tighter window front-sequentials look similar) is displayed in Figure 4 below.
Figure 4: Yield Table for Typical New-Issue GNR PL at Various LT CPJ/CPR Projections
Source: Bloomberg
In both the 5 CPJ and 10 CPJ scenarios, the yield is essentially 1.21% (better than just about any residential collateral CMO with a GNR label), but the average life and spread profiles are quite different given the now-steeper yield curve. As we demonstrated in Figures 2 and 3 above, we do not subscribe to the 5 CPJ for life outcome, even in a backup. Rather, our cursory review of the GNR PL space suggests that bonds with a GWAC of 2.50% (this one is 2.455%) should prepay around 20-25 CPR as a longer-term trend. Therefore, a spread to swaps in the range of 80-90 basis points is highly probably and we would consider 10 CPJ and 43/N to be a worst-case outcome. Judging by the alternatives presented in Figure 1 above, 43/N to a 7-year average life looks quite attractive.
Although we currently find the best value in the GNR Project Loan space, there is another way to use the ACMBS sector to improve performance: 10yr, new-issue DUS paper, where available. There is likely not much additional spread performance available in the 10/9.5 sector, but there IS convexity and rolldown. And these two factors can produce an advantageous return profile, particularly one that protects the portfolio from too much call risk.
GNR PL yield is not in question, and likely spread quite generous.
January 20, 2021 Page 7 of 18
MORTGAGE STRATEGY MONTHLY | POCKETS OF VALUE IN ACMBS
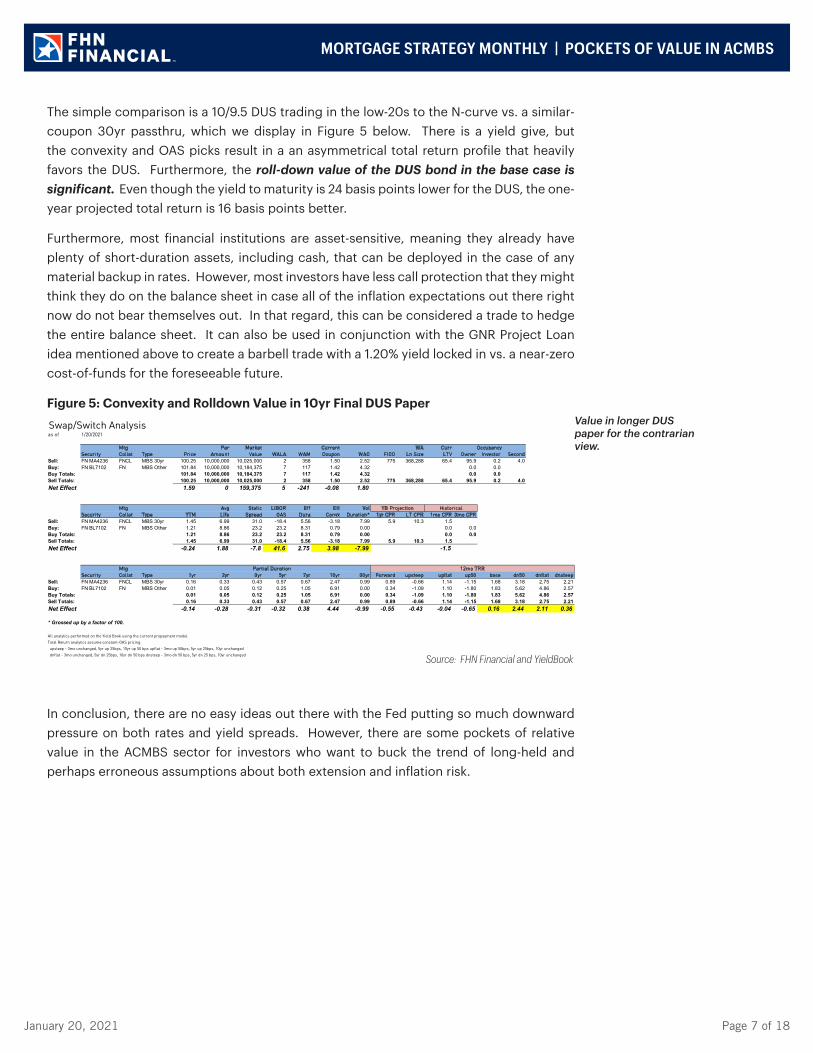
The simple comparison is a 10/9.5 DUS trading in the low-20s to the N-curve vs. a similar-coupon 30yr passthru, which we display in Figure 5 below. There is a yield give, but the convexity and OAS picks result in a an asymmetrical total return profile that heavily favors the DUS. Furthermore, the roll-down value of the DUS bond in the base case is significant. Even though the yield to maturity is 24 basis points lower for the DUS, the one-year projected total return is 16 basis points better.
Furthermore, most financial institutions are asset-sensitive, meaning they already have plenty of short-duration assets, including cash, that can be deployed in the case of any material backup in rates. However, most investors have less call protection that they might think they do on the balance sheet in case all of the inflation expectations out there right now do not bear themselves out. In that regard, this can be considered a trade to hedge the entire balance sheet. It can also be used in conjunction with the GNR Project Loan idea mentioned above to create a barbell trade with a 1.20% yield locked in vs. a near-zero cost-of-funds for the foreseeable future.
Figure 5: Convexity and Rolldown Value in 10yr Final DUS Paper
Source: FHN Financial and YieldBook
In conclusion, there are no easy ideas out there with the Fed putting so much downward pressure on both rates and yield spreads. However, there are some pockets of relative value in the ACMBS sector for investors who want to buck the trend of long-held and perhaps erroneous assumptions about both extension and inflation risk.
Value in longer DUS paper for the contrarian view.
Swap/Switch Analysisas of 1/20/2021
Mtg Par Market Current WA CurrSecurity Collat Type Price Amount Value WALA WAM Coupon WAC FICO Ln Size LTV Owner Investor Second
Sell: FN MA4236 FNCL MBS 30yr 100.25 10,000,000 10,025,000 2 358 1.50 2.52 775 368,288 65.4 95.9 0.2 4.0Buy: FN BL7102 FN MBS Other 101.84 10,000,000 10,184,375 7 117 1.42 4.32 0.0 0.0Buy Totals: 101.84 10,000,000 10,184,375 7 117 1.42 4.32 0.0 0.0Sell Totals: 100.25 10,000,000 10,025,000 2 358 1.50 2.52 775 368,288 65.4 95.9 0.2 4.0Net Effect 1.59 0 159,375 5 -241 -0.08 1.80
Mtg Avg Static LIBOR Eff Eff VolSecurity Collat Type YTM Life Spread OAS Dura Convx Duration* 1yr CPR LT CPR 1mo CPR 3mo CPR
Sell: FN MA4236 FNCL MBS 30yr 1.45 6.99 31.0 -18.4 5.56 -3.18 7.99 5.9 10.3 1.5Buy: FN BL7102 FN MBS Other 1.21 8.86 23.2 23.2 8.31 0.79 0.00 0.0 0.0Buy Totals: 1.21 8.86 23.2 23.2 8.31 0.79 0.00 0.0 0.0Sell Totals: 1.45 6.99 31.0 -18.4 5.56 -3.18 7.99 5.9 10.3 1.5Net Effect -0.24 1.88 -7.8 41.6 2.75 3.98 -7.99 -1.5
Mtg Security Collat Type 1yr 2yr 3yr 5yr 7yr 10yr 30yr Forward upsteep upflat up50 base dn50 dnflat dnsteep
Sell: FN MA4236 FNCL MBS 30yr 0.16 0.33 0.43 0.57 0.67 2.47 0.99 0.89 -0.66 1.14 -1.15 1.68 3.18 2.75 2.21Buy: FN BL7102 FN MBS Other 0.01 0.05 0.12 0.25 1.05 6.91 0.00 0.34 -1.09 1.10 -1.80 1.83 5.62 4.86 2.57Buy Totals: 0.01 0.05 0.12 0.25 1.05 6.91 0.00 0.34 -1.09 1.10 -1.80 1.83 5.62 4.86 2.57Sell Totals: 0.16 0.33 0.43 0.57 0.67 2.47 0.99 0.89 -0.66 1.14 -1.15 1.68 3.18 2.75 2.21Net Effect -0.14 -0.28 -0.31 -0.32 0.38 4.44 -0.99 -0.55 -0.43 -0.04 -0.65 0.16 2.44 2.11 0.36
* Grossed up by a factor of 100.
All analytics performed on the Yield Book using the current prepayment model.
Total Return analytics assume constant-OAS pricing.
upsteep - 3mo unchanged, 5yr up 25bps, 10yr up 50 bps upflat - 3mo up 50bps, 5yr up 25bps, 10yr unchanged
dnflat - 3mo unchanged, 5yr dn 25bps, 10yr dn 50 bps dnsteep - 3mo dn 50 bps, 5yr dn 25 bps, 10yr unchanged
Historical
Partial Duration
Occupancy
12mo TRR
YB Projection
January 20, 2021 Page 8 of 18
MORTGAGE STRATEGY MONTHLY | 15YR MBS SPEED PROFILE
Executive Summary: In the prepayment section of the FHN Financial Mortgage Strategy Annual Outlook published last month we presented the key prepayment themes to monitor in 2021, focusing on 30yr conventional and 30yr Ginnie Mae MBS. This analysis expands on that work to include more detail about conventional 15yr MBS and highlight call protection stories that provide prepayment protection at lower prices within the sector.
Last week, average primary mortgage rates increased for the first time in almost two months according to the Freddie Mac Primary Mortgage Market Survey. The 30yr rate increased from its previous record low of 2.65% to 2.79% and the 15yr rate increased from 2.16% to 2.23%. Despite this uptick, overall rates remain very low and we expect prepayment risks to remain elevated in the near term for all agency MBS products.
Treasury yields increased over the past two weeks as the economy is starting to have a more positive outlook on the post-COVID recovery. Mortgage rates, however, increased by less than treasury yields during the same time due to the excess room in the primary-secondary spread, as we discussed in the FHN Financial Mortgage Strategy Annual Outlook. Going forward, the FHN Financial Economic team projects the 10-yr Treasury to peak in 2Q21 at 1.25% but then fall to 0.85% in 3Q21 and finish the year at 0.75%. Additionally, they project the path of the 30yr primary mortgage rate to increase modestly through the 2Q21 to 3.18% before quickly falling to 2.78% in 3Q21 and then to 2.68% in 4Q21.
At current primary mortgage rates, 79% of the 30yr market and 66% of the 15yr market have at least 50bps of incentive to refinance. If rates do continue to increase over the next two quarters as the FHN Financial Economic team predicts over 60% of the 30yr market and 50% of the 15yr market will still have over 50bps of incentive.
Elevated prepayments will keep payups high for call protection in 30yr and 15yr collateral. We have written extensively about alternative forms of convexity and collateral selection strategies in 30yr MBS. Within the 15yr MBS sector, which loan characteristics improve convexity? Do the same bond selection strategies we have written about in 30yr MBS apply to 15yr MBS?
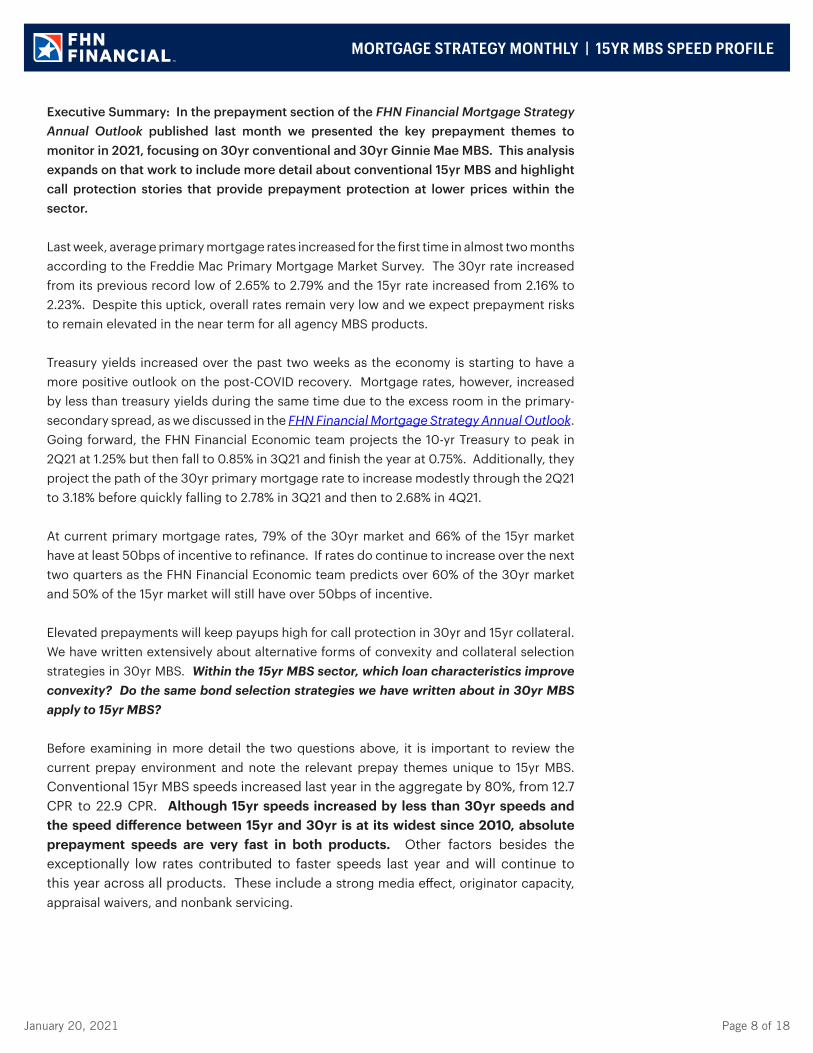
Before examining in more detail the two questions above, it is important to review the current prepay environment and note the relevant prepay themes unique to 15yr MBS. Conventional 15yr MBS speeds increased last year in the aggregate by 80%, from 12.7 CPR to 22.9 CPR. Although 15yr speeds increased by less than 30yr speeds and the speed difference between 15yr and 30yr is at its widest since 2010, absolute prepayment speeds are very fast in both products. Other factors besides the exceptionally low rates contributed to faster speeds last year and will continue to this year across all products. These include a strong media effect, originator capacity, appraisal waivers, and nonbank servicing.
January 20, 2021 Page 9 of 18
0.0
1.0
2.0
3.0
4.0
5.0
6.0
5
10
15
20
25
30
35
40
Jan-18 Apr-18 Jul-18 Oct-18 Jan-19 Apr-19 Jul-19 Oct-19 Jan-20 Apr-20 Jul-20 Oct-20
Prim
ary M
ortga
ge R
ate
1 Mon
th CP
R
Prepayment Speeds and Mortgage Rates
Conventional 30yr Conventional 15yr
30yr Freddie Mac Commitment Rate 15yr Freddie Mac Commitment Rate
Figure 1- 15yr Speeds Increased by Less than 30yr Speeds
Source: FHN Financial, CPRCDR, and Bloomberg
Both 30yr and 15yr primary mortgage rates have dropped significantly since March 2020 but the spread between them has remained relatively unchanged, near 50bps. The share of conventional issuance in 15yr increased from 10% in 2019 to over 15% in 2020, which indicates 30yr-into-15yr refi behavior. Gross issuance of 15yr paper reached $334 billion in 2020, up $238 billion since 2019. We expect 15yr issuance to remain elevated in a low rate environment as borrowers refinance out of longer-term products into 15yr loans. Curve steepening would also stimulate 30yr to 15yr refinancing because borrowers would be able to obtain a lower rate mortgage in a 15yr product.
15yr MBS speeds increased by 80% since March 2020.
MORTGAGE STRATEGY MONTHLY | 15YR MBS SPEED PROFILE

January 20, 2021 Page 10 of 18
0
50
100
150
200
250
300
350
2010 2011 2012 2013 2014 2015 2016 2017 2018 2019 2020
New
Issua
nce
Billio
ns
New Issuance by Year | 15yr Conventional MBS
Purchase Refinance
Figure 2- 15yr Issuance Soared
Source: FHN Financial and CPRCDR
Issuance Year 2014 2015 2016 2017 2018 2019 2020Issued ($bn) 93 126 149 108 65 96 344
WAC 3.61 3.32 3.09 3.42 3.99 3.58 2.74
Loan Size 163 179 192 184 181 208 232
FICO 749 755 758 750 744 753 766
LTV 67 65 64 76 77 79 79
% Broker 8 9 7 8 11 9 13
% Purchase 24 18 17 25 32 25 8
% Owner 85 88 90 88 87 89 94
% Appraisal Waiver 0 0 0 6 8 21 52
Collateral trends in 15yr MBS new issuance mirrored those of new issuance in 30yr MBS. Both 15yr and 30yr average loan sizes increased by 11% between 2019 and 2020. Average FICO scores in both sectors increased by ten points. Overall appraisal waiver share in 15yr collateral is very similar to the appraisal waiver share in 30yr refi loans, 52% compared to 47%. The speed differences between 15yr loans with appraisal waivers and those with traditional appraisals is comparable to the differences in 30yrs, 6-10 CPR faster. Higher loan sizes, higher credit scores, higher refi share, and higher appraisal waiver share all drive faster prepayment speeds going forward.
Figure 3- 15yr Conventional Issuance Trends
Source: FHN Financial and CPRCDR
15yr MBS issuance surged as borrowers refinanced out of 30yr products into 15yr mortgages.
15yr issuance trends mirrored 30yr issuance trends.
MORTGAGE STRATEGY MONTHLY | 15YR MBS SPEED PROFILE
January 20, 2021 Page 11 of 18
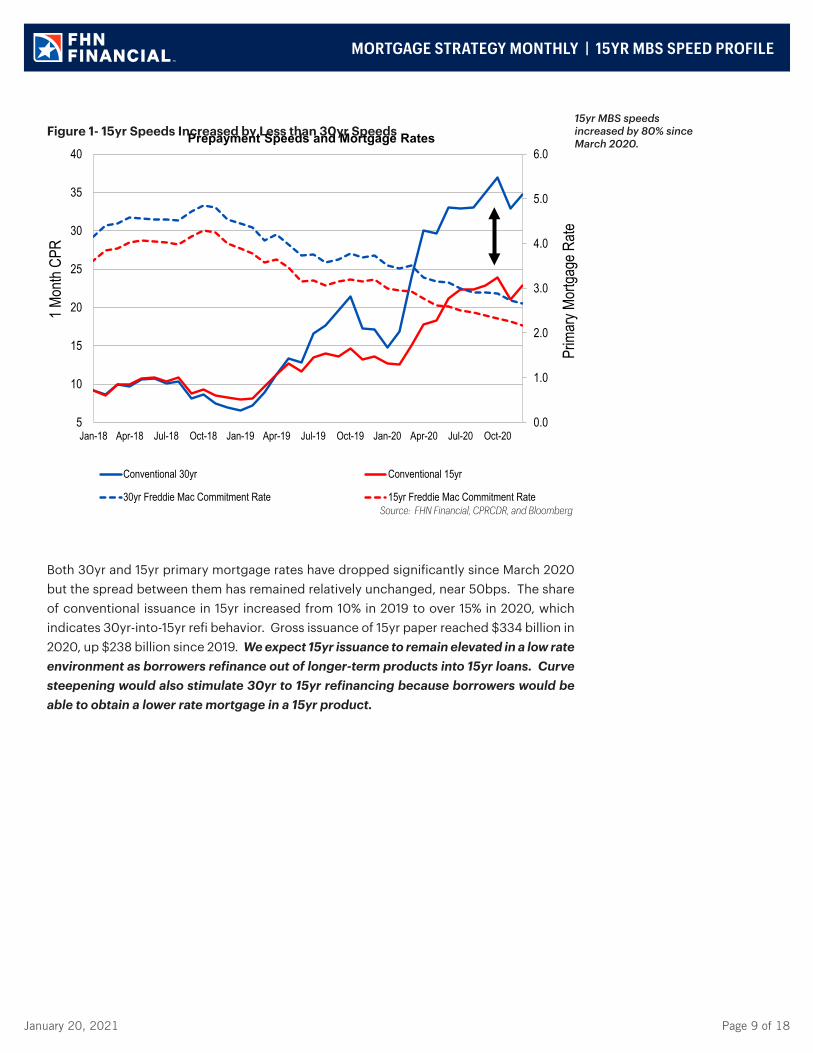
Within the 15yr sector, which loan characteristics improve convexity? Figures 4 and 5 show the average 1mo CPR for each specialty loan characteristic by incentive bucket. There is considerable call protection in every characteristic listed. NY loans offer the best call protection in 2.0s and 2.5s, but their speeds are similar to 150k Max in 3.0s and 3.5s. Investor loans provide solid call protection across coupons but the issuance is considerably lighter. Texas, Florida, bank serviced, and low FICO make up the second tier of call protection stories for loans with 6-36 months of seasoning.
Figure 4- Speed Comparison during Prime Refinancing Age
0102030405060
CTD
Unive
rseBa
nk S
ervic
edLo
w Fic
o TX20
0k M
ax17
5k M
axHL
BML
BLL
B FLInv
estor NY CTD
Unive
rseLo
w Fic
o20
0k M
ax TX FLBa
nk S
ervic
ed17
5k M
axHL
BML
BLL
BInv
estor NY CTD
Unive
rse20
0k M
axBa
nk S
ervic
ed TX17
5k M
ax FLLo
w Fic
oHL
B NY MLB
LLB
Inves
tor
CTD
200k
Max
Unive
rse17
5k M
ax FL TXBa
nk S
ervic
edLo
w Fic
oHL
B NY MLB
Inves
tor LLB
0-50bps 51-100bps 101-150bps 151-200bps
1mo C
PR
15yr Conventional MBS, 6-36 WALA
Source: FHN Financial and CPRCDR
The speed rankings adjust as collateral ages. Investor, NY, and LLB remain the slowest stories. The convexity advantage in higher, low loan balance categories, 175k and 200k Max pools, diminishes significantly as loans 15yr loans age in higher incentive buckets. Texas, Florida, and bank serviced remain close to their previous ranking in 6-36 WALA, while low FICO loses some of its advantage. In seasoned collateral, the call protection is most valuable for loans with 50-150bps incentive.
Figure 5- Call Protection in More Seasoned Collateral
05
101520253035
CTD
Unive
rse TX20
0k M
axBa
nk S
ervic
edLo
w Fic
o17
5k M
ax FL HLB
MLB
LLB
Inves
tor NY CTD
Unive
rse20
0k M
ax TX17
5k M
ax FLLo
w Fic
oHL
BML
BBa
nk S
ervic
ed LLB
Inves
tor NY CTD
200k
Max
Unive
rse FL TX17
5k M
axHL
BLo
w Fic
oBa
nk S
ervic
ed LLB
MLB
Inves
tor NY CTD
200k
Max
175k
Max
HLB FL
Unive
rseInv
estor TX
Low
Fico
MLB
Bank
Ser
viced LLB NY
0-50bps 51-100bps 101-150bps 151-200bps
1mo C
PR
15yr Conventional MBS, 36+ WALA
Source: FHN Financial and CPRCDR
How much does call protection “cost” in 15yr MBS? Overall, payups for the same call protection stories are lower in 15yr pools than in 30yr pools. Because of the shorter amortization term, much of the principal payments are “hard wired” regardless of prepayment speeds. So changes in prepayment speeds have a smaller impact on 15yr pools versus longer amortization terms. It follows then that if the speed changes are less meaningful that the payups are less. However, we still advocate onboarding less than full-payup forms of call protection in 15yr MBS when available because payups for traditional forms are very high for the sector. Many non-“pure play” characteristics have payups that are LESS THAN HALF of standard convexity story payups and yet only print speeds 5-10 CPR faster for loans in-the-money.
NY, LLB, and Investor pools provide the most call protection.
Convexity advantage diminishes in higher loan balance categories as loans age.
MORTGAGE STRATEGY MONTHLY | 15YR MBS SPEED PROFILE
January 20, 2021 Page 12 of 18
For example, there has been more interest in 15yr 100% Texas pools because they provide call protection but do not demand the high payups of NY pools. In general, Texas pools have lower loan sizes, lower FICOs, and less appraisal waiver usage than other states, all factors that dampen prepayments. Texas also has restrictive laws for refinancing which prevent certain borrowers from refinancing completely during the early months of a loan. According to the Texas Constitution under Section 50(a)(6), borrowers who take out a cash out loan must wait 12 months from the date of the original cash out loan before they can refinance.
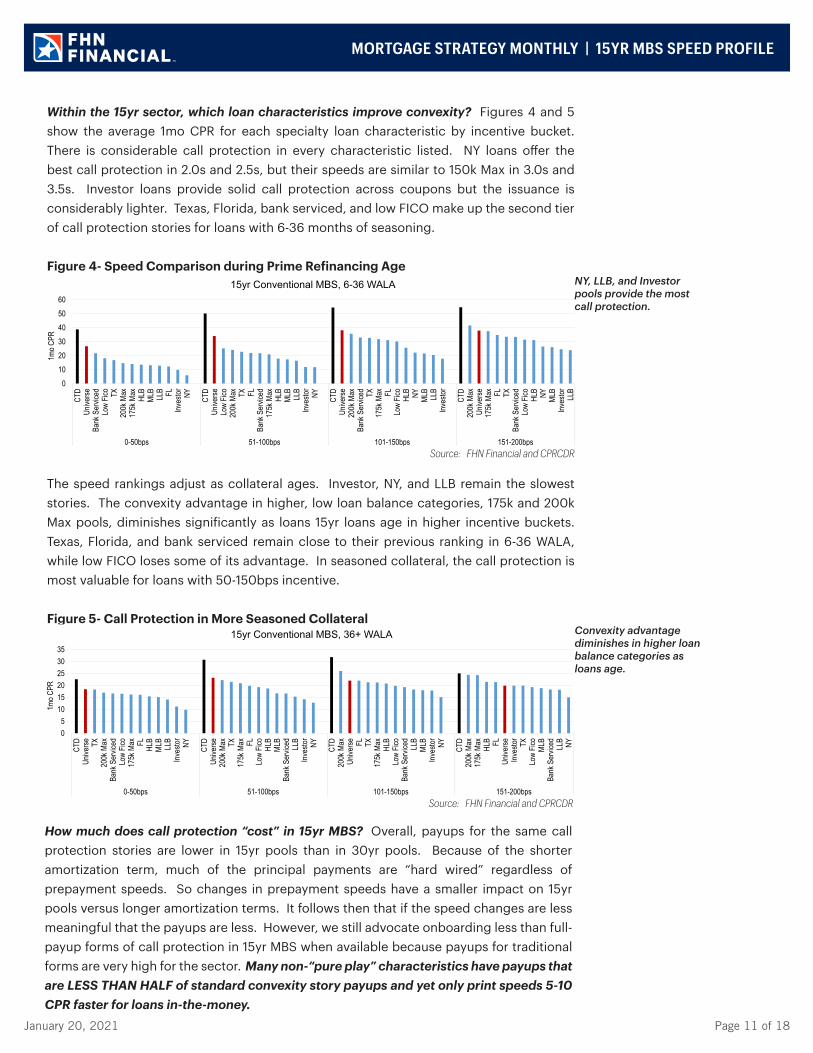
The analysis below looks at a 100% Texas pool versus the December 2020 2.0% major pool, FN MA4229. With a 2.73 WAC, the borrowers in the Texas pool have nearly 40bps of rate incentive. Figure 4 shows that Texas loans with 0-50bps incentive print speeds just 10 CPR faster than 100% NY loans. The payup for 100% TX FNCI 2.0s is only 6/32 compared to 26/32 for 100% NY FNCI 2.0s. Essentially, an investor can get half of the call protection, in terms of CPR relative to the universe, for one quarter of the payup. The trade picks yield, spread, OAS, base case TRR, and convexity. The return profile and additional convexity overcomes the modest payup and duration extension.
Figure 6- 100% Texas vs. December Major PoolSwap/Switch Analysisas of 1/19/2021
Mtg Par Market Current WA CurrSecurity Collateral Type Price Amount Value WALA WAM Coupon WAC FICO Ln Size LTV
Sell: FN MA4229 FNCI Major 2.0 104.38 20,000,000 20,875,000 2 178 2.00 2.62 774 307,345 57.7Buy: FR RC1688 FNCI 100% Texas, 2.0 104.55 20,000,000 20,909,375 3 178 2.00 2.73 770 296,429 64.4Buy Totals: 104.55 20,000,000 20,909,375 3 178 2.00 2.73 770 296,429 64.4Sell Totals: 104.38 20,000,000 20,875,000 2 178 2.00 2.62 774 307,345 57.7Net Effect 0.17 0 34,375 1 0 0.00 0.10 -4 -10,915 6.7
Mtg Avg Static LIBOR Eff Eff VolSecurity Collateral Type YTM Life Spread OAS Dura Convx Duration* 1yr CPR LT CPR 1mo CPR 3mo CPR
Sell: FN MA4229 FNCI Major 2.0 0.38 2.82 2.2 -29.0 1.46 -2.34 -0.09 28.4 25.0 1.9Buy: FR RC1688 FNCI 100% Texas, 2.0 0.59 3.37 6.7 -18.9 2.11 -2.19 0.43 21.8 19.9Buy Totals: 0.59 3.37 6.7 -18.9 2.11 -2.19 0.43 21.8 19.9Sell Totals: 0.38 2.82 2.2 -29.0 1.46 -2.34 -0.09 28.4 25.0 1.9Net Effect 0.20 0.55 4.5 10.1 0.66 0.14 0.52 -6.6 -5.1
Mtg Security Collateral Type Forward upsteep upflat up100 base dn100 dnflat dnsteep
Sell: FN MA4229 FNCI Major 2.0 0.31 -0.04 -0.26 -1.05 0.27 -0.33 -0.50 0.65Buy: FR RC1688 FNCI 100% Texas, 2.0 0.41 -0.39 -0.19 -1.45 0.56 0.52 0.20 1.19Buy Totals: 0.41 -0.39 -0.19 -1.45 0.56 0.52 0.20 1.19Sell Totals: 0.31 -0.04 -0.26 -1.05 0.27 -0.33 -0.50 0.65Net Effect 0.10 -0.34 0.07 -0.40 0.29 0.85 0.70 0.54
* Grossed up by a factor of 100.
All analytics performed on the Yield Book using the current prepayment model.
Total Return analytics assume constant-OAS pricing.
upsteep - 3mo unchanged, 5yr up 50bps, 10yr up 100 bps upflat - 3mo up 100bps, 5yr up 50bps, 10yr unchanged
dnflat - 3mo unchanged, 5yr dn 50bps, 10yr dn 100 bps dnsteep - 3mo dn 100 bps, 5yr dn 50 bps, 10yr unchanged
YB Projection Historical
12mo TRR
Source: FHN Financial, Bloomberg and YieldBook
Adding call protection through offsetting collateral characteristics has also been a popular and effective strategy to add convexity at lower prices. The strategy holds up well in both 30yr and 15yr MBS. Figure 7 displays the s-curve for 150k Max loans serviced by Quicken, a slow loan balance story offset by a fast servicer. The combination of the two provides solid call protection for loans less than 100bps ITM relative to both the 15yr universe and the cheapest-to-deliver proxy. Quicken is the second largest servicer of 15yr mortgages so this is an opportunity to use what the market is offering instead of trying to avoid the name completely.
Benefits of lower payup, 100% Texas collateral.
MORTGAGE STRATEGY MONTHLY | 15YR MBS SPEED PROFILE

January 20, 2021 Page 13 of 18
Figure 7- Value in Offsetting Loan Characteristics
0
5
10
15
20
25
30
35
40
45
50
55
60
-25 0 25 50 75 100 125 150 175 200
1 M
onth
CPR
Refinance Incentive
S-Curve Analysis | Loan Level DataLast 3 Months | 15yr Conventional MBS, 6-36 WALA
CTDUniverse150k Max, Quicken150k Max, Complement
Cheapest to Deliver: Nonbank Servicer, LnSz>200k, LTV<75, and FICO>740Source: FHN Financial and CPRCDR
Below is an example of a trade that takes advantage of this combination. Payups for non-Quicken 15yr 150k Max 1.5-2.0s are 16-24 ticks and 2.5-3 points for 2.5-3.5s. Quicken-serviced 150k Max 2.0s are currently available in the market at a payup of 6/32, which is the same payup as the 100% Texas pool in Figure 6. The trade results are very similar as well, again picking yield, spread, base-case returns, and most importantly, convexity. Also, keep in mind that the Fed currently holds more than 40% of all 15yr 2.0s available to trade. The payup is low enough to rely on the Fed for an exit strategy should the Quicken effect begin to outweigh the loan balance effect.
Offsetting loan characteristics still provide convexity.
MORTGAGE STRATEGY MONTHLY | 15YR MBS SPEED PROFILE

January 20, 2021 Page 14 of 18
Figure 8- 150k Max, Quicken vs. December Major PoolSwap/Switch Analysisas of 1/19/2021
Mtg Par Market Current WA CurrSecurity Collateral Type Price Amount Value WALA WAM Coupon WAC FICO Ln Size LTV
Sell: FN MA4229 FNCI Major 2.0 104.38 20,000,000 20,875,000 2 178 2.00 2.62 774 307,345 57.7Buy: FN FM5037 FNCI 150k Max Quicken, 2.0 104.55 20,000,000 20,909,375 2 174 2.00 2.73 755 137,800 55.6Buy Totals: 104.55 20,000,000 20,909,375 2 174 2.00 2.73 755 137,800 55.6Sell Totals: 104.38 20,000,000 20,875,000 2 178 2.00 2.62 774 307,345 57.7Net Effect 0.17 0 34,375 0 -4 0.00 0.10 -19 -169,545 -2.1
Mtg Avg Static LIBOR Eff Eff VolSecurity Collateral Type YTM Life Spread OAS Dura Convx Duration* 1yr CPR LT CPR 1mo CPR 3mo CPR
Sell: FN MA4229 FNCI Major 2.0 0.38 2.82 2.2 -29.0 1.46 -2.34 -0.09 28.4 25.0 1.9Buy: FN FM5037 FNCI 150k Max Quicken, 2.0 0.47 3.09 5.2 -18.7 2.38 -1.78 0.51 17.5 22.1 1.3Buy Totals: 0.47 3.09 5.2 -18.7 2.38 -1.78 0.51 17.5 22.1 1.3Sell Totals: 0.38 2.82 2.2 -29.0 1.46 -2.34 -0.09 28.4 25.0 1.9Net Effect 0.08 0.27 3.1 10.3 0.92 0.55 0.60 -10.9 -2.9 -0.6
Mtg Security Collateral Type Forward upsteep upflat up100 base dn100 dnflat dnsteep
Sell: FN MA4229 FNCI Major 2.0 0.31 -0.04 -0.26 -1.05 0.27 -0.33 -0.50 0.65Buy: FN FM5037 FNCI 150k Max Quicken, 2.0 0.33 -0.43 -0.27 -1.48 0.49 0.85 0.33 1.17Buy Totals: 0.33 -0.43 -0.27 -1.48 0.49 0.85 0.33 1.17Sell Totals: 0.31 -0.04 -0.26 -1.05 0.27 -0.33 -0.50 0.65Net Effect 0.02 -0.38 -0.01 -0.43 0.23 1.18 0.83 0.52
YB Projection Historical
12mo TRR
Source: FHN Financial, Bloomberg and YieldBook
To conclude, 15yr speeds increased steadily throughout 2020 and issuance soared due to 30yr to 15yr refinancing. Trends in 15yr MBS new issuance mirrored that of new issuance in 30yr MBS including larger loan sizes, higher FICO scores, and increasing appraisal waiver share. Despite the recent uptick in primary mortgage rates, payups for “pure-play” convexity pools are still near historic highs in both 30yr and 15yr spec pools. For investors wishing to maintain a conservative portfolio posture, 15yr MBS with moderate call protection offers a balanced approach. Specifically there is value in alternative convexity stories such as 100% Texas pools and layering offsetting characteristics.
Good value in offsetting loan stories.
MORTGAGE STRATEGY MONTHLY | 15YR MBS SPEED PROFILE

January 20, 2021 Page 15 of 18
MORTGAGE STRATEGY MONTHLY | MARKET UPDATE
Z-Score* Week MTD YTD High Low Avg
Prices
30 Year 1.5 100.05 -2.2 (0.17) (0.80) (1.02) 101.33 99.72 100.732.0 102.97 -0.8 (0.20) (0.64) (0.92) 103.92 102.28 103.232.5 105.13 0.8 0.09 (0.03) (0.31) 105.44 98.84 103.833.0 105.09 0.5 0.27 0.38 0.31 106.06 101.00 104.553.5 106.08 1.1 0.39 0.41 0.38 106.11 101.50 105.104.0 107.06 1.1 0.20 0.28 0.23 107.09 103.19 106.21
15 Year 1.5 102.38 0.3 (0.16) (0.36) (0.55) 102.94 101.73 102.302.0 104.30 0.9 (0.06) (0.05) (0.28) 104.61 99.00 103.072.5 104.95 0.9 0.42 0.70 0.64 105.25 100.47 104.023.0 105.31 0.8 0.27 0.34 0.30 105.64 101.66 104.693.5 106.25 1.5 0.02 0.16 0.00 106.31 103.38 105.384.0 106.17 0.6 0.06 (0.17) (0.06) 107.00 104.34 105.814.5 104.94 0.3 0.03 0.05 0.05 106.50 102.80 104.69
20 Year 1.5 101.69 -0.4 (0.06) (0.09) (0.47) 102.16 101.41 101.772.0 103.70 0.6 (0.28) 0.02 (0.44) 104.14 103.08 103.532.5 105.53 1.2 0.00 (0.06) (0.41) 105.94 100.06 103.883.0 105.48 0.8 0.28 0.64 0.33 106.31 102.14 104.703.5 106.19 1.4 0.38 0.42 0.36 106.42 103.53 105.334.0 107.22 1.4 0.23 0.31 0.27 107.22 104.25 106.384.5 108.75 1.3 0.17 0.23 0.23 108.75 105.09 107.74
I-Spreads (UST)30 Year
2.0 84.3 1.6 6.4 14.8 23.3 84.2 4.9 58.62.5 58.4 0.1 4.3 16.8 29.4 149.0 (46.1) 54.13.0 68.4 -0.2 (3.1) 2.3 11.6 158.0 18.8 72.33.5 66.1 -0.7 (2.0) 8.9 13.7 195.4 47.7 82.44.0 54.3 -0.9 1.4 11.1 16.8 200.5 36.0 78.84.5 46.8 -0.9 2.3 7.7 13.4 212.1 33.1 73.1
15 Year 1.5 48.1 0.8 8.0 15.6 23.6 55.7 34.3 42.82.0 17.3 -0.5 8.7 12.8 25.4 159.2 (25.2) 30.72.5 13.6 -1.1 (7.1) (8.0) -5.9 151.9 (4.1) 35.53.0 27.7 -1.2 (3.1) (0.2) -0.8 178.6 31.8 47.03.5 18.9 -1.7 (5.7) (0.7) -4.0 175.3 24.1 54.94.0 28.2 -0.9 6.0 15.8 7.3 148.1 13.1 46.4
Mortgage Rates
Conforming 30 Year 2.89 -1.2 0.02 0.01 0.02 4.12 2.85 3.2915 Year 2.37 -1.4 0.02 0.00 0.02 3.44 2.30 2.785x1 Hybrid 2.99 -1.3 0.04 (0.04) (0.02) 3.67 2.89 3.23
Borrower Activity
MBA Refinance Index 4,484 1.1 (222) 681 567 6,419 2,402 3,753MBA Purchase Index 348 1.4 9 29 34 348 186 292
Z-Score (12mo):Green 1.0 standard deviation low price or high yield/spreadYellow MeanRed 1.0 standard deviation high price or low yield/spread
52 Week
52 Week
Primary Market
MBS Snapshot
Change 52 Week
January 20, 2021

January 20, 2021 Page 16 of 18
MORTGAGE STRATEGY MONTHLY | MARKET UPDATE
Z-Score Week MTD YTD High Low Avg
PACs
30 Year 2 yr 46 -1.1 0 (4) (4) 108 39 653 yr 48 -1.1 0 (4) (4) 114 45 694 yr 53 -1.2 0 (4) (4) 126 53 775 yr 61 -1.1 0 (4) (4) 133 61 837 yr 71 -0.9 0 (4) (4) 136 67 8910 yr 96 -0.7 0 (4) (4) 153 84 108
15 Year 2 yr 41 -1.0 0 (4) (4) 108 39 613 yr 46 -1.2 0 (4) (4) 114 45 694 yr 46 -1.4 0 (4) (4) 126 46 765 yr 61 -1.1 0 (4) (4) 131 61 827 yr 71 -0.9 0 (4) (4) 131 62 8610 yr 96 -0.6 0 (4) (4) 151 82 106
Sequentials
30 Year 2 yr 46 -1.1 0 (4) (4) 108 39 653 yr 48 -1.1 0 (4) (4) 114 45 694 yr 53 -1.2 0 (4) (4) 126 53 775 yr 61 -1.1 0 (4) (4) 133 61 837 yr 71 -0.9 0 (4) (4) 136 67 8910 yr 96 -0.7 0 (4) (4) 153 84 108
15 Year 2 yr 41 -1.0 0 (4) (4) 108 39 613 yr 46 -1.2 0 (4) (4) 114 45 694 yr 46 -1.4 0 (4) (4) 126 46 765 yr 61 -1.1 0 (4) (4) 131 61 827 yr 71 -0.9 0 (4) (4) 131 62 8610 yr 96 -0.6 0 (4) (4) 151 82 107
ARM (Z-spreads)
5x1 2/2/5 2.00 17 -1.5 0 (4) (4) 124 17 632.50 23 -1.5 0 (4) (4) 130 23 693.00 27 -1.5 0 (4) (4) 134 27 733.50 32 -1.5 0 (4) (4) 138 32 78
7x1 5/2/5 2.00 25 -1.5 0 (4) (4) 132 25 712.50 31 -1.5 0 (4) (4) 138 31 773.00 41 -1.5 0 (4) (4) 148 41 873.50 49 -1.5 0 (4) (4) 156 49 95
10x1 5/2/5 2.00 35 -1.5 0 (4) (4) 150 35 852.50 49 -1.5 0 (4) (4) 156 49 953.00 54 -1.5 0 (4) (4) 161 54 1003.50 60 -1.5 0 (4) (4) 163 60 104
* YTM** Spreads calculated to 15 CPB.
CMO Floater (Discount Margins)
Passthru 6.5 Cap 25 -1.1 0 (2) 0 70 23 377.0 Cap 25 -1.1 0 (2) 0 70 23 36
Support 5.0 Cap 75 -0.8 0 0 0 125 75 855.5 Cap 70 -0.8 0 0 0 120 70 806.0 Cap 65 -0.8 0 0 0 115 65 75
CMO Spreads
January 20, 2021
Change 52 Week

January 20, 2021 Page 17 of 18
MORTGAGE STRATEGY MONTHLY | MARKET UPDATE
Z-Score Week MTD YTD High Low AvgCMBS Spreads
New Issue 3y 24 -1.1 (1) (1) 0 175 24 805y 64 -0.9 (1) (6) (4) 190 62 1037y 64 -1.2 (1) (4) (1) 200 64 11010y 66 -1.1 (2) (6) (4) 225 66 115
ACMBS
Fixed (N-Spread) 7y 20 -1.5 (2) (5) (5) 100 20 4310y 24 -1.3 (2) (5) (5) 115 24 47
Floating (DM) 7y 22 -1.5 (2) (3) (3) 70 22 3910y 24 -1.4 (2) (2) (2) 80 24 44
RMBS 2.0
AAA CC Price Drop 15yr (1.25) 0.73 0.00 0.25 0.25 (0.50) (2.25) (1.63)30yr (1.75) 0.66 0.00 0.25 0.25 (0.94) (2.75) (2.10)
Sprd to Swaps Front SEQ 85 n/a n/a n/a n/a n/a n/a n/a
Agencies
Bullets 2y 1.2 -0.9 0.3 (0.7) (0.5) 19.1 0.9 4.63y 4.8 -0.5 3.3 2.4 2.4 25.9 1.5 7.55y 5.9 -1.4 0.8 (2.2) (1.3) 31.3 5.1 15.310y 16.2 -1.5 (1.3) (3.7) (2.6) 63.8 16.2 32.1
Callables 5NC1 10.0 -1.5 (0.9) (4.9) (4.0) 95.8 10.0 35.97NC1 12.8 -1.6 (1.2) (4.5) (4.6) 111.7 12.8 46.410NC1 26.5 -1.6 (0.4) (6.2) (6.5) 134.1 26.5 67.515NC1 43.4 -1.7 (7.6) (16.4) (19.8) 159.2 43.4 85.8
Week MTD YTD High Low Avg
Static
Price 106.77 0.2 0.07 (0.03) (0.11) 107.43 103.30 106.63Coupon 3.11 -2.1 0.00 (0.06) (0.06) 3.56 3.11 3.40Yield 0.84 -0.5 (0.02) 0.15 0.23 2.84 0.53 1.10WAL 3.35 0.1 0.03 0.36 0.44 6.25 2.65 3.27
Option-Adjusted
Effective Duration 1.56 -0.1 (0.03) 0.32 0.42 3.86 1.13 1.59Effective Convexity -1.59 -1.7 (0.09) (0.49) (0.70) -0.02 -1.82 -0.79LOAS (bps) 3 -1.5 (0.82) (3.48) 0.63 153 2 34
Mix
30YR 88.8% -1.8 0.0% 0.0% 0.0% 90.0% 88.8% 89.6%15YR 11.2% 1.8 0.0% 0.0% 0.0% 11.2% 10.0% 10.4%
5 Day 0.15%10 Day -0.04%MTD -0.11%QTD -0.11%YTD -0.11%12 Month 3.42%
Source: MTGINDEX data from the Yield Book.
Alternative Markets
Change 52 Week
January 20, 2021
Nominal Return
MBS Index
Change 52 Week
January 20, 2021 Page 18 of 18
This material was produced by an FHN Financial Strategist and is not considered research and is not a product of any research department. Strategists may provide information to investors as well as to FHN Financial’s trading desk. The trading desk may trade as principal in the products discussed in this material. Strategists may have consulted with the trading desk while preparing this material, and the trading desk may have accumulated positions in the securities or related derivatives products that are the subject of this material. Strategists receive compensation which may be based in part on the quality of their analysis, FHN Financial revenues, trading revenues, and competitive factors.
Some data in this report may be derived from information provided by CPR & CDR Technologies, Inc. Neither CPR & CDR Technologies, Inc. nor any of its directors, employees, or agents accept any liability for any loss or damage arising out of the use of all or any part of this report.
Although this information has been obtained from sources which we believe to be reliable, we do not guarantee its accuracy, and it may be incomplete or condensed. This is for informational purposes only and is not intended as an offer or solicitation with respect to the purchase or sale of any security. All herein listed securities are subject to availability and change in price. Past performance is not indicative of future results, and changes in any assumptions may have a material effect on projected results. Ratings on all securities are subject to change.
FHN Financial Capital Markets, FHN Financial Portfolio Advisors, and FHN Financial Municipal Advisors are divisions of First Horizon Bank. FHN Financial Securities Corp., FHN Financial Main Street Advisors, LLC, and FHN Financial Capital Assets Corp. are wholly owned subsidiaries of First Horizon Bank. FHN Financial Securities Corp. is a member of FINRA and SIPC — http://www.sipc.org.
FHN Financial Municipal Advisors is a registered municipal advisor. FHN Financial Portfolio Advisors is a portfolio manager operating under the trust powers of First Horizon Bank. FHN Financial Main Street Advisors, LLC is a registered investment advisor. None of the other FHN entities, including FHN Financial Capital Markets, FHN Financial Securities Corp., or FHN Financial Capital Assets Corp. are acting as your advisor, and none owe a fiduciary duty under the securities laws to you, any municipal entity, or any obligated person with respect to, among other things, the information and material contained in this communication. Instead, these FHN entities are acting for their own interests. You should discuss any information or material contained in this communication with any and all internal or external advisors and experts that you deem appropriate before acting on this information or material.
FHN Financial, through First Horizon Bank or its affiliates, offers investment products and services. Investment products are not FDIC insured, have no bank guarantee, and may lose value.
MORTGAGE STRATEGY MONTHLY
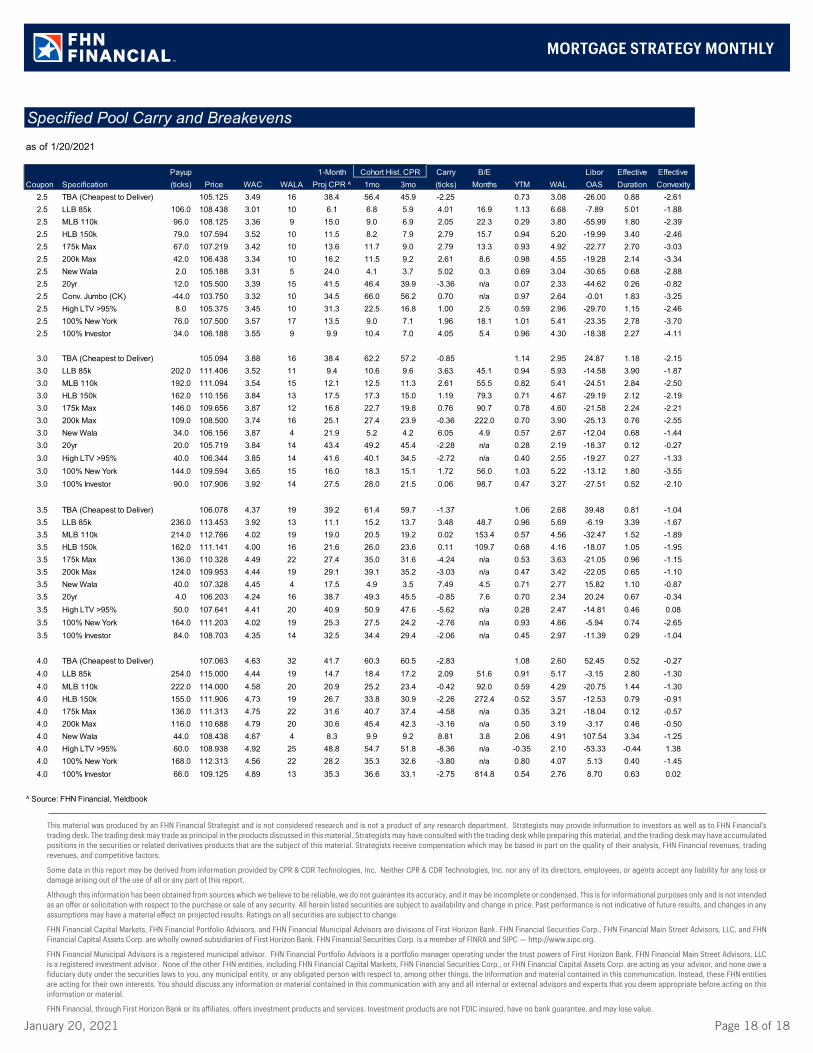
as of 1/20/2021
Payup 1-Month Carry B/E Libor Effective EffectiveCoupon Specification (ticks) Price WAC WALA Proj CPR ^ 1mo 3mo (ticks) Months YTM WAL OAS Duration Convexity
2.5 TBA (Cheapest to Deliver) 105.125 3.49 16 38.4 56.4 45.9 -2.25 0.73 3.08 -26.00 0.88 -2.612.5 LLB 85k 106.0 108.438 3.01 10 6.1 6.8 5.9 4.01 16.9 1.13 6.68 -7.89 5.01 -1.882.5 MLB 110k 96.0 108.125 3.36 9 15.0 9.0 6.9 2.05 22.3 0.29 3.80 -55.99 1.80 -2.392.5 HLB 150k 79.0 107.594 3.52 10 11.5 8.2 7.9 2.79 15.7 0.94 5.20 -19.99 3.40 -2.462.5 175k Max 67.0 107.219 3.42 10 13.6 11.7 9.0 2.79 13.3 0.93 4.92 -22.77 2.70 -3.032.5 200k Max 42.0 106.438 3.34 10 16.2 11.5 9.2 2.61 8.6 0.98 4.55 -19.28 2.14 -3.342.5 New Wala 2.0 105.188 3.31 5 24.0 4.1 3.7 5.02 0.3 0.69 3.04 -30.65 0.68 -2.882.5 20yr 12.0 105.500 3.39 15 41.5 46.4 39.9 -3.36 n/a 0.07 2.33 -44.62 0.26 -0.822.5 Conv. Jumbo (CK) -44.0 103.750 3.32 10 34.5 66.0 56.2 0.70 n/a 0.97 2.64 -0.01 1.83 -3.252.5 High LTV >95% 8.0 105.375 3.45 10 31.3 22.5 16.8 1.00 2.5 0.59 2.96 -29.70 1.15 -2.462.5 100% New York 76.0 107.500 3.57 17 13.5 9.0 7.1 1.96 18.1 1.01 5.41 -23.35 2.78 -3.702.5 100% Investor 34.0 106.188 3.55 9 9.9 10.4 7.0 4.05 5.4 0.96 4.30 -18.38 2.27 -4.11
3.0 TBA (Cheapest to Deliver) 105.094 3.88 16 38.4 62.2 57.2 -0.85 1.14 2.95 24.87 1.18 -2.153.0 LLB 85k 202.0 111.406 3.52 11 9.4 10.6 9.6 3.63 45.1 0.94 5.93 -14.58 3.90 -1.873.0 MLB 110k 192.0 111.094 3.54 15 12.1 12.5 11.3 2.61 55.5 0.82 5.41 -24.51 2.84 -2.503.0 HLB 150k 162.0 110.156 3.84 13 17.5 17.3 15.0 1.19 79.3 0.71 4.67 -29.19 2.12 -2.193.0 175k Max 146.0 109.656 3.87 12 16.8 22.7 19.8 0.76 90.7 0.78 4.60 -21.58 2.24 -2.213.0 200k Max 109.0 108.500 3.74 16 25.1 27.4 23.9 -0.36 222.0 0.70 3.90 -25.13 0.76 -2.553.0 New Wala 34.0 106.156 3.87 4 21.9 5.2 4.2 6.05 4.9 0.57 2.67 -12.04 0.68 -1.443.0 20yr 20.0 105.719 3.84 14 43.4 49.2 45.4 -2.28 n/a 0.28 2.19 -18.37 0.12 -0.273.0 High LTV >95% 40.0 106.344 3.85 14 41.6 40.1 34.5 -2.72 n/a 0.40 2.55 -19.27 0.27 -1.333.0 100% New York 144.0 109.594 3.65 15 16.0 18.3 15.1 1.72 56.0 1.03 5.22 -13.12 1.80 -3.553.0 100% Investor 90.0 107.906 3.92 14 27.5 28.0 21.5 0.06 98.7 0.47 3.27 -27.51 0.52 -2.10
3.5 TBA (Cheapest to Deliver) 106.078 4.37 19 39.2 61.4 59.7 -1.37 1.06 2.68 39.48 0.81 -1.043.5 LLB 85k 236.0 113.453 3.92 13 11.1 15.2 13.7 3.48 48.7 0.96 5.69 -6.19 3.39 -1.673.5 MLB 110k 214.0 112.766 4.02 19 19.0 20.5 19.2 0.02 153.4 0.57 4.56 -32.47 1.52 -1.893.5 HLB 150k 162.0 111.141 4.00 16 21.6 26.0 23.6 0.11 109.7 0.68 4.16 -18.07 1.05 -1.953.5 175k Max 136.0 110.328 4.49 22 27.4 35.0 31.6 -4.24 n/a 0.53 3.63 -21.05 0.96 -1.153.5 200k Max 124.0 109.953 4.44 19 29.1 39.1 35.2 -3.03 n/a 0.47 3.42 -22.05 0.65 -1.103.5 New Wala 40.0 107.328 4.45 4 17.5 4.9 3.5 7.49 4.5 0.71 2.77 15.82 1.10 -0.873.5 20yr 4.0 106.203 4.24 16 38.7 49.3 45.5 -0.85 7.6 0.70 2.34 20.24 0.67 -0.343.5 High LTV >95% 50.0 107.641 4.41 20 40.9 50.9 47.6 -5.62 n/a 0.28 2.47 -14.81 0.46 0.083.5 100% New York 164.0 111.203 4.02 19 25.3 27.5 24.2 -2.76 n/a 0.93 4.66 -5.94 0.74 -2.653.5 100% Investor 84.0 108.703 4.35 14 32.5 34.4 29.4 -2.06 n/a 0.45 2.97 -11.39 0.29 -1.04
4.0 TBA (Cheapest to Deliver) 107.063 4.63 32 41.7 60.3 60.5 -2.83 1.08 2.60 52.45 0.52 -0.274.0 LLB 85k 254.0 115.000 4.44 19 14.7 18.4 17.2 2.09 51.6 0.91 5.17 -3.15 2.80 -1.304.0 MLB 110k 222.0 114.000 4.58 20 20.9 25.2 23.4 -0.42 92.0 0.59 4.29 -20.75 1.44 -1.304.0 HLB 150k 155.0 111.906 4.73 19 26.7 33.8 30.9 -2.26 272.4 0.52 3.57 -12.53 0.79 -0.914.0 175k Max 136.0 111.313 4.75 22 31.6 40.7 37.4 -4.58 n/a 0.35 3.21 -18.04 0.12 -0.574.0 200k Max 116.0 110.688 4.79 20 30.6 45.4 42.3 -3.16 n/a 0.50 3.19 -3.17 0.46 -0.504.0 New Wala 44.0 108.438 4.67 4 8.3 9.9 9.2 8.81 3.8 2.06 4.91 107.54 3.34 -1.254.0 High LTV >95% 60.0 108.938 4.92 25 48.8 54.7 51.8 -8.36 n/a -0.35 2.10 -53.33 -0.44 1.384.0 100% New York 168.0 112.313 4.56 22 28.2 35.3 32.6 -3.80 n/a 0.80 4.07 5.13 0.40 -1.454.0 100% Investor 66.0 109.125 4.89 13 35.3 36.6 33.1 -2.75 814.8 0.54 2.76 8.70 0.63 0.02
^ Source: FHN Financial, Yieldbook
Cohort Hist. CPR
Specified Pool Carry and Breakevens