january 2014 one gas overview - s1.q4cdn.com gas... · overland park, topeka, wichita . oklahoma...
TRANSCRIPT

ONE Gas Overview January 2014
Page 2
Forward-Looking Statements Statements contained in this presentation that include company expectations or predictions should be considered forward-looking statements that are covered by the safe harbor provisions of the Securities Act of 1933 and the Securities and Exchange Act of 1934. It is important to note that the actual results could differ materially from those projected in such forward-looking statements. For additional information that could cause actual results to differ materially from such forward-looking statements, refer to ONE Gas’ Securities and Exchange Commission filings. All future cash dividends (declared or paid) discussed in this presentation are subject to the approval of the ONE Gas board of directors. All references in this presentation to guidance are based on news releases issued on Nov. 5 and Dec. 2, 2013, and are not being updated or affirmed by this presentation.
Page 3
ONE Gas Overview
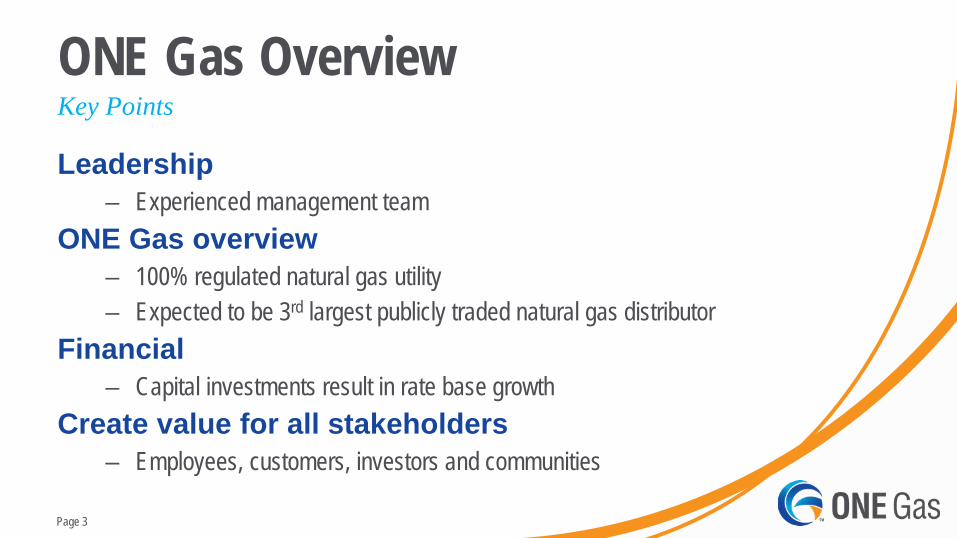
Leadership – Experienced management team
ONE Gas overview – 100% regulated natural gas utility – Expected to be 3rd largest publicly traded natural gas distributor
Financial – Capital investments result in rate base growth
Create value for all stakeholders – Employees, customers, investors and communities
Key Points
Page 4
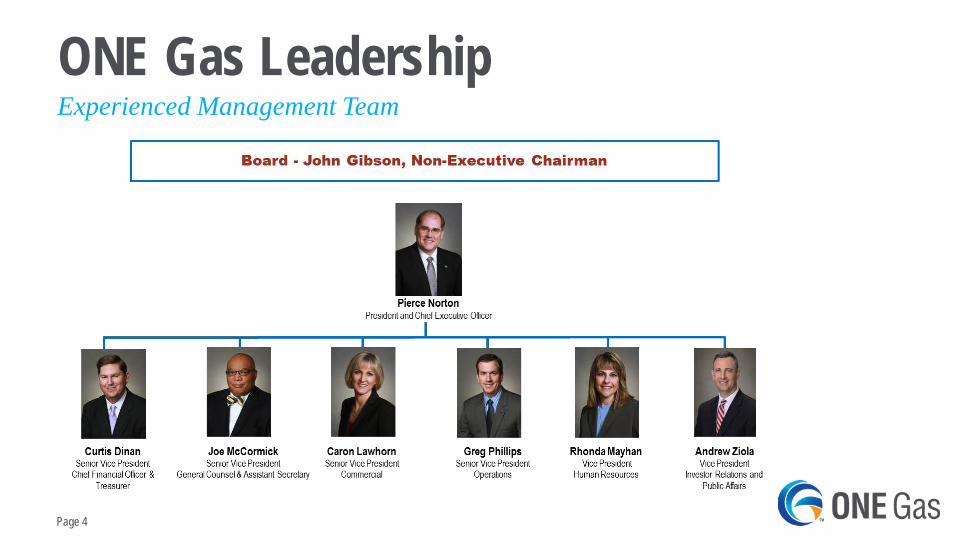
ONE Gas Leadership Experienced Management Team

Page 5
Overview

Page 6
Reasons for the Separation
• Enhance strategic, financial and operating flexibility, and the growth potential of both entities
• Increase transparency of each company • Better align the businesses with each company’s relevant peer
groups • Attract more focused investors to each company • Sharpen each company’s focus on its distinct strategic goals • Resolve internal competition for capital among the businesses
that is inherent in the existing structure
Strategic Rationale
Page 7
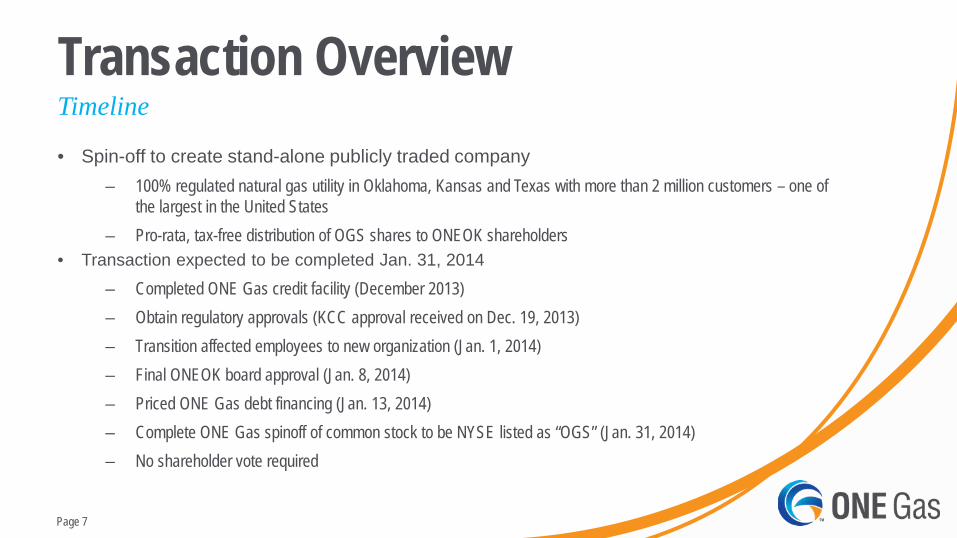
Transaction Overview • Spin-off to create stand-alone publicly traded company
– 100% regulated natural gas utility in Oklahoma, Kansas and Texas with more than 2 million customers – one of the largest in the United States
– Pro-rata, tax-free distribution of OGS shares to ONEOK shareholders • Transaction expected to be completed Jan. 31, 2014
– Completed ONE Gas credit facility (December 2013) – Obtain regulatory approvals (KCC approval received on Dec. 19, 2013) – Transition affected employees to new organization (Jan. 1, 2014) – Final ONEOK board approval (Jan. 8, 2014) – Priced ONE Gas debt financing (Jan. 13, 2014) – Complete ONE Gas spinoff of common stock to be NYSE listed as “OGS” (Jan. 31, 2014) – No shareholder vote required
Timeline
Page 8
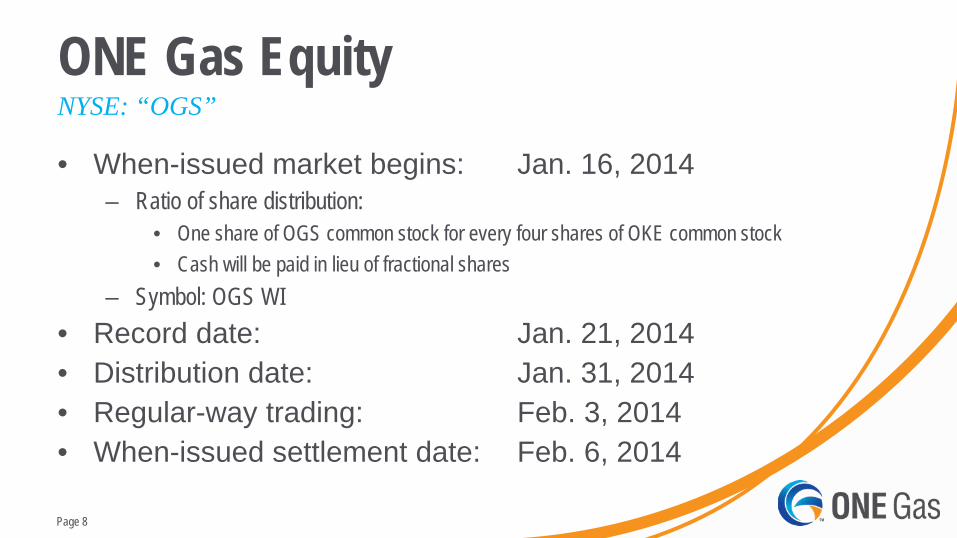
ONE Gas Equity
• When-issued market begins: Jan. 16, 2014 – Ratio of share distribution:
• One share of OGS common stock for every four shares of OKE common stock • Cash will be paid in lieu of fractional shares
– Symbol: OGS WI • Record date: Jan. 21, 2014 • Distribution date: Jan. 31, 2014 • Regular-way trading: Feb. 3, 2014 • When-issued settlement date: Feb. 6, 2014
NYSE: “OGS”
Page 9
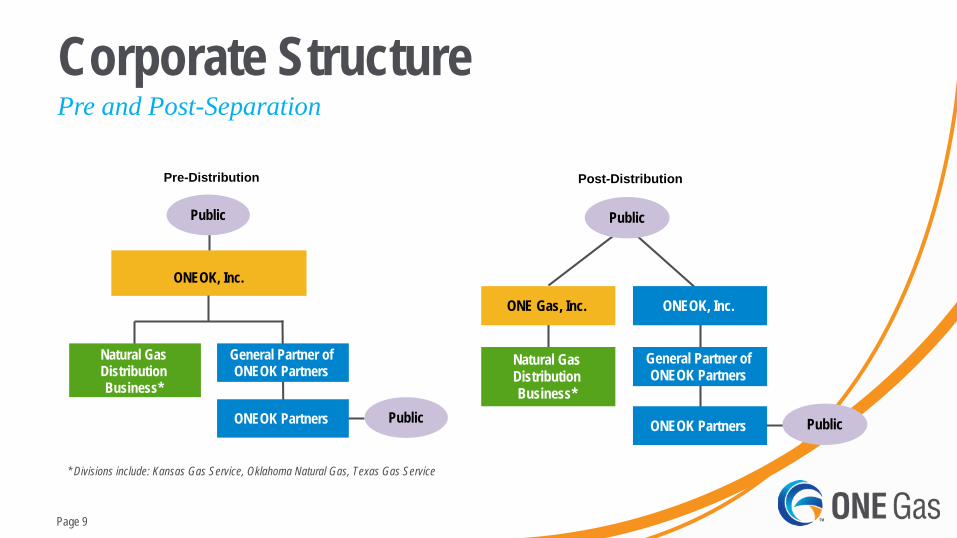
Corporate Structure Pre and Post-Separation
* Divisions include: Kansas Gas Service, Oklahoma Natural Gas, Texas Gas Service
Pre-Distribution
ONEOK, Inc.
Natural Gas Distribution Business*
General Partner of ONEOK Partners
ONEOK Partners
Public
Public
Post-Distribution
ONE Gas, Inc.
Natural Gas Distribution Business*
ONEOK, Inc.
General Partner of ONEOK Partners
ONEOK Partners
Public
Public
Page 10
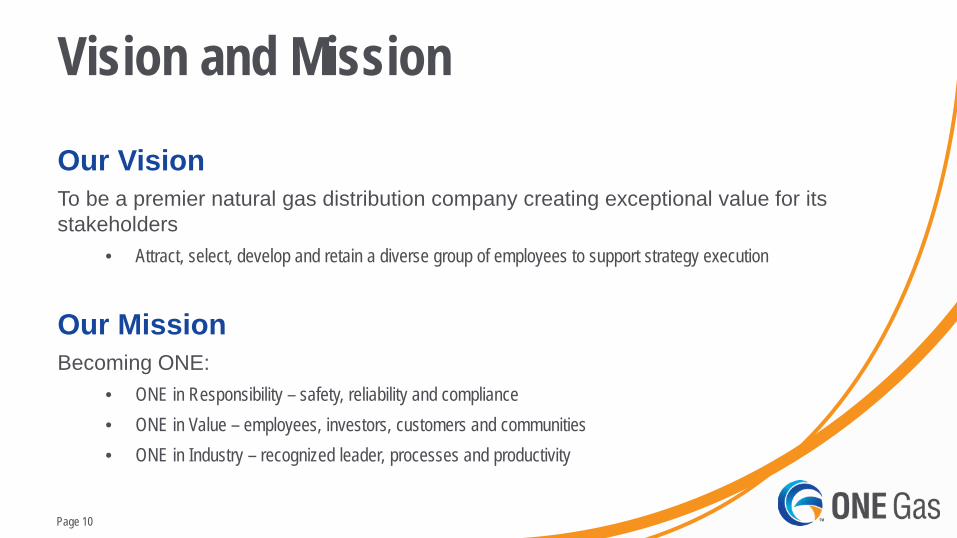
Vision and Mission
Our Vision To be a premier natural gas distribution company creating exceptional value for its stakeholders
• Attract, select, develop and retain a diverse group of employees to support strategy execution
Our Mission Becoming ONE:
• ONE in Responsibility – safety, reliability and compliance • ONE in Value – employees, investors, customers and communities • ONE in Industry – recognized leader, processes and productivity

Page 11
ONE Gas • Focused business strategy
– 100% regulated natural gas distribution utility – Expected to be third largest publicly traded pure-play natural gas distributor
• Constructive regulatory environment – Allowed ROE of approximately 10% – Multiple risk- and lag-mitigation mechanisms and riders – 70% fixed residential charges
• Significant scale – 2.1 million customers – 92% residential – Largest in Kansas and Oklahoma; 3rd largest in Texas – Rate base of approximately $2.2 billion
• Conservative financial profile – Capital investments result in rate base growth – Stable earnings and cash flow – Commitment to “A” investment-grade credit ratings – Targeted 45% debt-to-capitalization ratio
Key Investment Considerations Kansas City
Wichita
Tulsa
Oklahoma City
Austin
El Paso
70% market share
87% market share
14% market share

Page 12
ONE Gas Margin Profile
Kansas Oklahoma Texas Total
Fixed Charges- Residential 55% 85% 81% 73%
Average Heating Degree Days – Normal 4,800 3,334 1,799 -
Weather Normalization 100% 100% 62% 87%
Residential Margin 67% 71% 68% 69%
Risk and Lag Mechanisms
Gas System Reliability Surcharge (GSRS), Weather Normalization,
Bad Debt, Pension and Other Post-Employment Benefits (OPEB), Ad
Valorem
Performance-based rates (PBR), Energy Efficiency Program, CNG Rebate Program,
Weather Normalization, Bad Debt
Cost of Service Adjustments (COSA), Gas Reliability Infrastructure Program (GRIP),
Energy Efficiency (Austin), Bad Debt (98%), Weather Normalization, Safety-related Plant
Replacements
Governance Kansas Corporation Commission
(three commissioners appointed by the governor to four-year staggered
terms)
Oklahoma Corporation Commission (three commissioners elected to six-year staggered
terms)
“Home Rule” with 10 jurisdictions (Texas Railroad Commission has appellate
authority)
Page 13
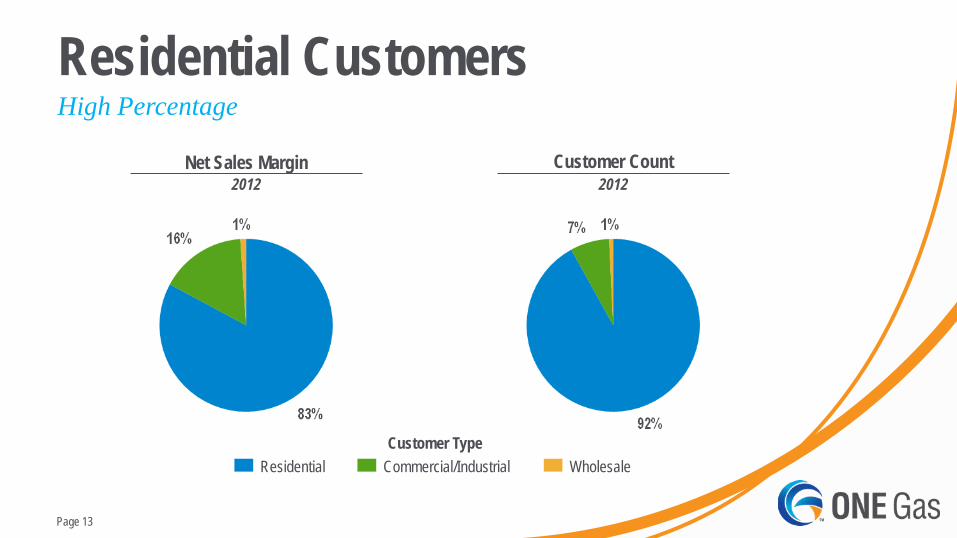
Residential Customers High Percentage
2012 Customer Count
Residential Commercial/Industrial Wholesale
Net Sales Margin 2012
Customer Type
Page 14
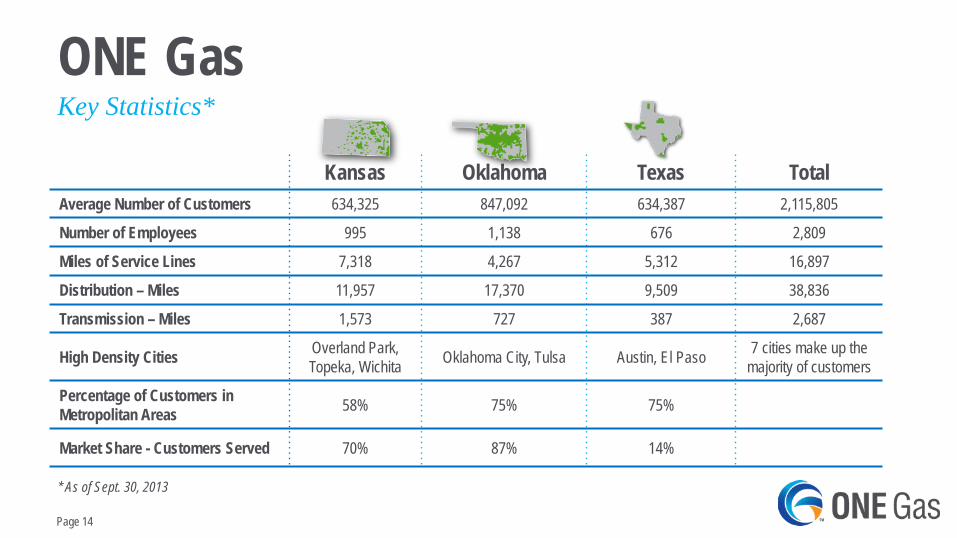
ONE Gas Key Statistics*
Kansas Oklahoma Texas Total Average Number of Customers 634,325 847,092 634,387 2,115,805
Number of Employees 995 1,138 676 2,809
Miles of Service Lines 7,318 4,267 5,312 16,897
Distribution – Miles 11,957 17,370 9,509 38,836
Transmission – Miles 1,573 727 387 2,687
High Density Cities Overland Park, Topeka, Wichita Oklahoma City, Tulsa Austin, El Paso 7 cities make up the
majority of customers
Percentage of Customers in Metropolitan Areas 58% 75% 75%
Market Share - Customers Served 70% 87% 14%
* As of Sept. 30, 2013

Page 15
Proximity to Natural Gas Supply
• Close proximity to significant natural gas reserves • Delivered natural gas costs are comprised primarily of:
– Cost of the commodity – Transportation costs – Storage fees
Location Supports Sustainability Kansas
City Wichita
Tulsa Oklahoma
City
Austin
El Paso
ONE Gas Natural Gas Distribution Areas Natural Gas Basins Natural Gas Shale Plays
Eagle Ford
Permian Basin
Mississippian Lime
Cana-Woodford
Granite Wash
Woodford Shale
Barnett Shale

Page 16
Growth Strategies
• Capital investments targeted toward safety, reliability and efficiency – Results in steady rate base growth – Efficiency projects reduce expenses to sustainable levels
• Minimize gap between actual and allowed returns – Continued filings for interim rate adjustments – File rate cases as warranted
• Develop incremental sources of regulated revenue – Transportation revenues to new compressed natural gas (CNG) stations – Transportation revenues to distributed generation
Identify and Pursue Growth Opportunities

Page 17
Regulatory Constructs Mechanism Kansas Oklahoma Texas* Performance-based rates X
Capital investments; safety-related riders X X1 X
Weather normalization X X X
Purchase Gas Adjustment/Cost of Gas riders X X X
Energy efficiency/conservation programs X X
Pension and Other Post-Retirement Benefits (OPEB) Trackers X X1 X
Cost of Service Adjustment (COSA) X1 X
By State
*10 jurisdictions in Texas; not all mechanisms apply to each jurisdiction 1 Incorporated in performance-based rates

Page 18
Regulatory Mechanisms
• Oklahoma Natural Gas – Performance-based rate structure provides annual rate reviews between rate cases to ensure achieved
ROE is within the established band of 10-11 percent
• Kansas Gas Service – Gas Systems Reliability Surcharge (GSRS) – for incremental safety-related and government-mandated
capital investments made between rate cases
• Texas Gas Service – Cost-of-service adjustments (COSA) for certain capital investments and changes in operating expenses – Gas Reliability Infrastructure Program (GRIP) for capital investments made between rate cases
Highlights

Page 19
Comparative Highlights Peer Group Analysis
Peer Group* ONE Gas Average Range Target
Regulated Business 80% 62% - 92% 100% Allowed ROE 10.3% 9.5% - 11.05% ~10% Debt/Capitalization Ratio 48% 43 - 54% 45%
Dividend Payout Ratio (as a percent of earnings) 63% 44% - 81% 55% - 65%
Age of Company 120 years 63-165 years 107 years
Customers 1.5 million 0.35 million – 4.5 million 2.1 million
Key credit-
rating factors
Shareholder factor
*AGL, ATMOS, Laclede, New Jersey, Northwest, Piedmont, South Jersey, Southwest and WGL Source Various company filings
Other factors

Page 20
Financial Overview

Page 21
Financial Highlights • Post separation, ONE Gas will continue to maintain a conservative financial posture
– Prudent capital investment results in steady rate base growth – Financial metrics necessary to maintain strong investment-grade credit ratings – Prudent dividend policy, in line with peers – Utilize capital markets to maintain capital ratios
• Financings will be executed in conjunction with the legal separation – $700 million revolving credit facility – Issue $1.2 billion of long-term debt – Distribute $1.13 billion to ONEOK at separation; retain $60 million
• Utilize operating cash flows and short-term borrowings for working capital and capital expenditures
Maintain Conservative Posture
Page 22
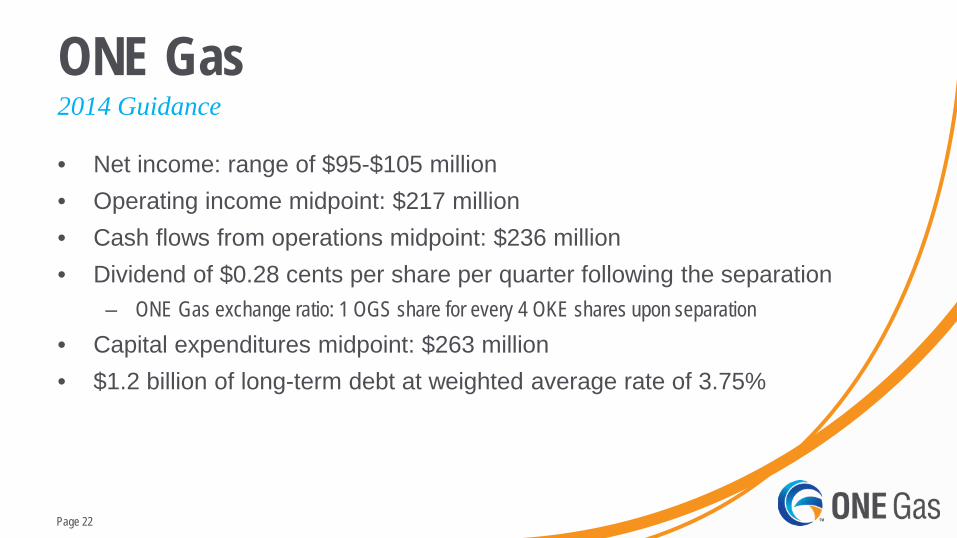
ONE Gas
• Net income: range of $95-$105 million • Operating income midpoint: $217 million • Cash flows from operations midpoint: $236 million • Dividend of $0.28 cents per share per quarter following the separation
– ONE Gas exchange ratio: 1 OGS share for every 4 OKE shares upon separation • Capital expenditures midpoint: $263 million • $1.2 billion of long-term debt at weighted average rate of 3.75%
2014 Guidance
Page 23
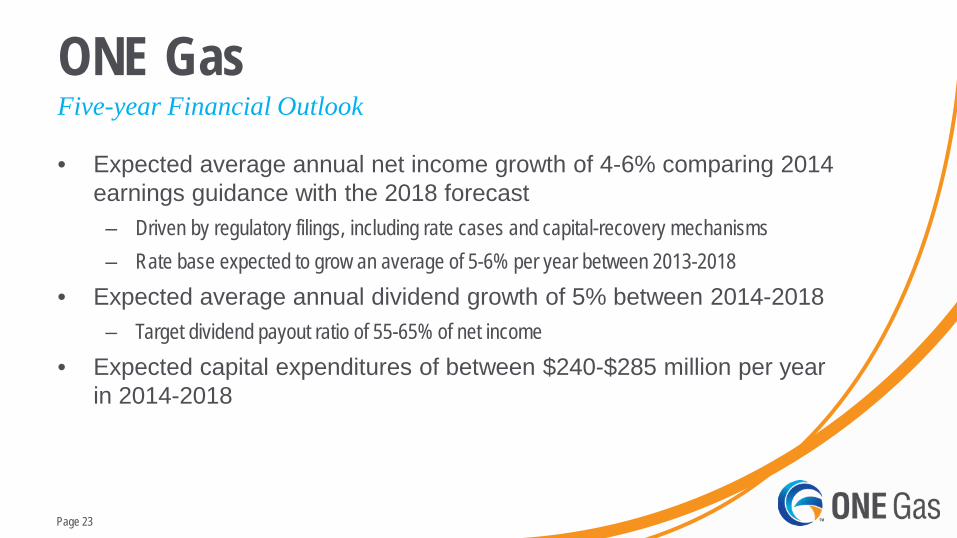
ONE Gas
• Expected average annual net income growth of 4-6% comparing 2014 earnings guidance with the 2018 forecast
– Driven by regulatory filings, including rate cases and capital-recovery mechanisms – Rate base expected to grow an average of 5-6% per year between 2013-2018
• Expected average annual dividend growth of 5% between 2014-2018 – Target dividend payout ratio of 55-65% of net income
• Expected capital expenditures of between $240-$285 million per year in 2014-2018
Five-year Financial Outlook
Page 24
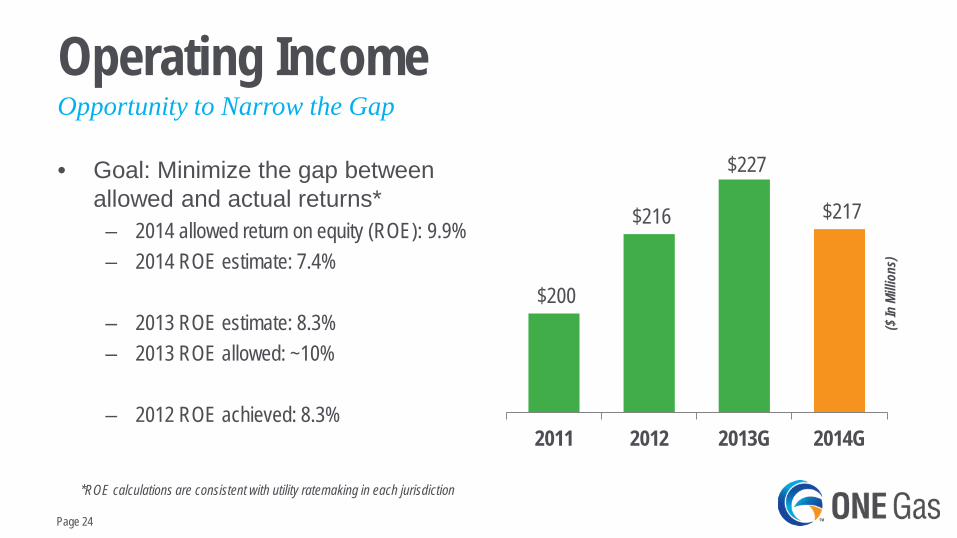
• Goal: Minimize the gap between allowed and actual returns*
– 2014 allowed return on equity (ROE): 9.9% – 2014 ROE estimate: 7.4%
– 2013 ROE estimate: 8.3% – 2013 ROE allowed: ~10%
– 2012 ROE achieved: 8.3%
Operating Income
$200
$216
$227
$217
2011 2012 2013G 2014G
Opportunity to Narrow the Gap
($ In
Milli
ons)
*ROE calculations are consistent with utility ratemaking in each jurisdiction
Page 25
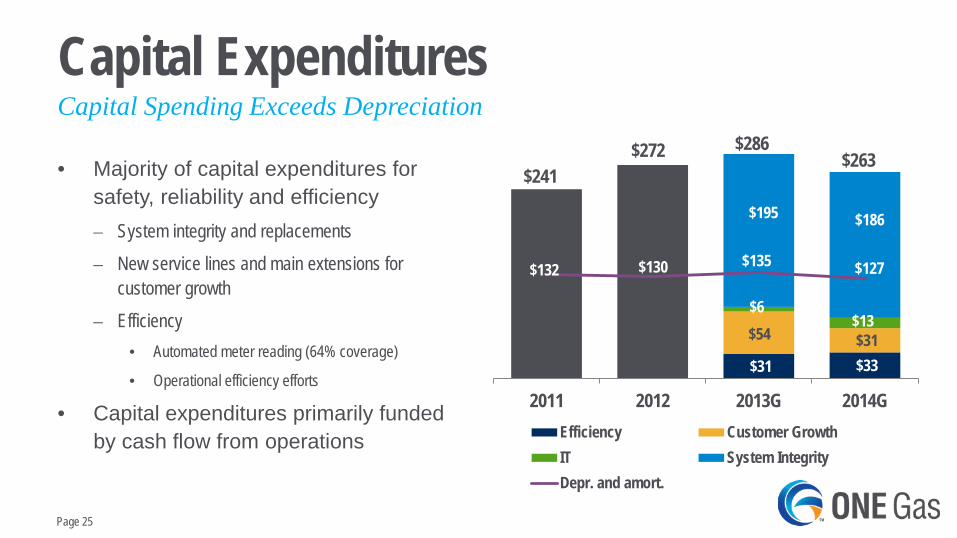
• Majority of capital expenditures for safety, reliability and efficiency – System integrity and replacements
– New service lines and main extensions for customer growth
– Efficiency • Automated meter reading (64% coverage)
• Operational efficiency efforts
• Capital expenditures primarily funded by cash flow from operations
Capital Expenditures Capital Spending Exceeds Depreciation
$31 $33
$54 $31
$6 $13
$195 $186
$132 $130 $135 $127
2011 2012 2013G 2014GEfficiency Customer GrowthIT System IntegrityDepr. and amort.
$241 $272 $286
$263

Page 26
• Target dividend payout ratio of 55-65% of net income
• Capital expenditures primarily funded by cash flow from operations
ONE Gas
Sources Uses
($ In
Milli
ons)
Cash $60
Dividends $58
Capital Expenditures
$263 Cash flow from operations
$236
$321 $321
2014 Sources and Uses of Cash Flow
Short-term debt: $25
Page 27
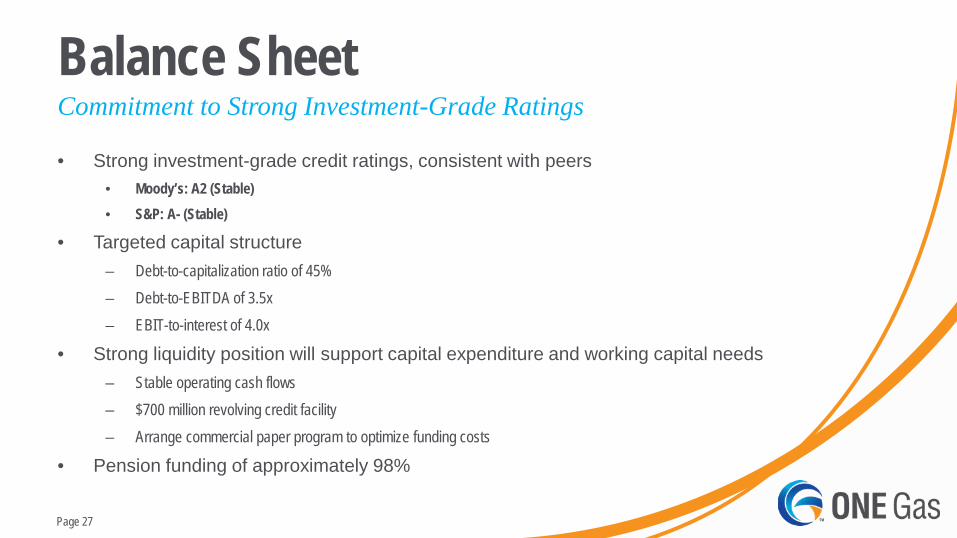
Balance Sheet • Strong investment-grade credit ratings, consistent with peers
• Moody’s: A2 (Stable) • S&P: A- (Stable)
• Targeted capital structure – Debt-to-capitalization ratio of 45% – Debt-to-EBITDA of 3.5x – EBIT-to-interest of 4.0x
• Strong liquidity position will support capital expenditure and working capital needs – Stable operating cash flows – $700 million revolving credit facility – Arrange commercial paper program to optimize funding costs
• Pension funding of approximately 98%
Commitment to Strong Investment-Grade Ratings
Page 28
Appendix

Page 29
Stable Economic Environment High-Quality Service Territories
• Unemployment rate below national average – 2013: 29% below national average
• Population growth above national average – 2013: 32% above national average
Unemployment Rate (%) Population Growth (%)
Average of KS, OK and TX U.S. Average Source: IHS Global Insight
7.4 6.8 5.9 5.5 5.1 4.8 4.6 4.5 4.4 4.3 4.2
0.0
4.0
8.0
12.0
2010
2011
2012
2013
E
2014
E
2015
E
2016
E
2017
E
2018
E
2019
E
2020
E
1.2
0.9 1.0 1.0 1.0 1.0 1.0 1.0 1.0 0.9 0.9
0.0
0.5
1.0
1.5
2010
2011
2012
2013
E
2014
E
2015
E
2016
E
2017
E
2018
E
2019
E
2020
E
Page 30
ONE Gas
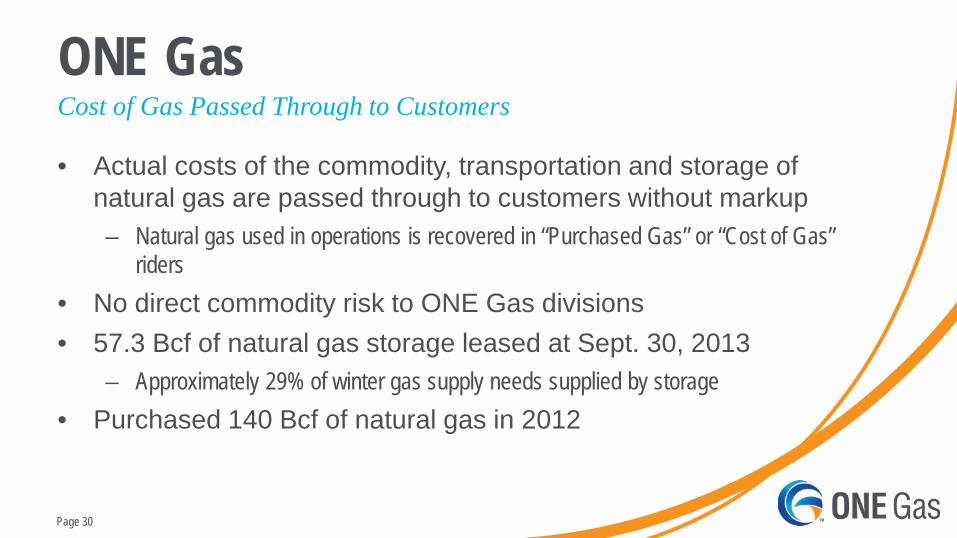
• Actual costs of the commodity, transportation and storage of natural gas are passed through to customers without markup – Natural gas used in operations is recovered in “Purchased Gas” or “Cost of Gas”
riders • No direct commodity risk to ONE Gas divisions • 57.3 Bcf of natural gas storage leased at Sept. 30, 2013
– Approximately 29% of winter gas supply needs supplied by storage • Purchased 140 Bcf of natural gas in 2012
Cost of Gas Passed Through to Customers
Page 31
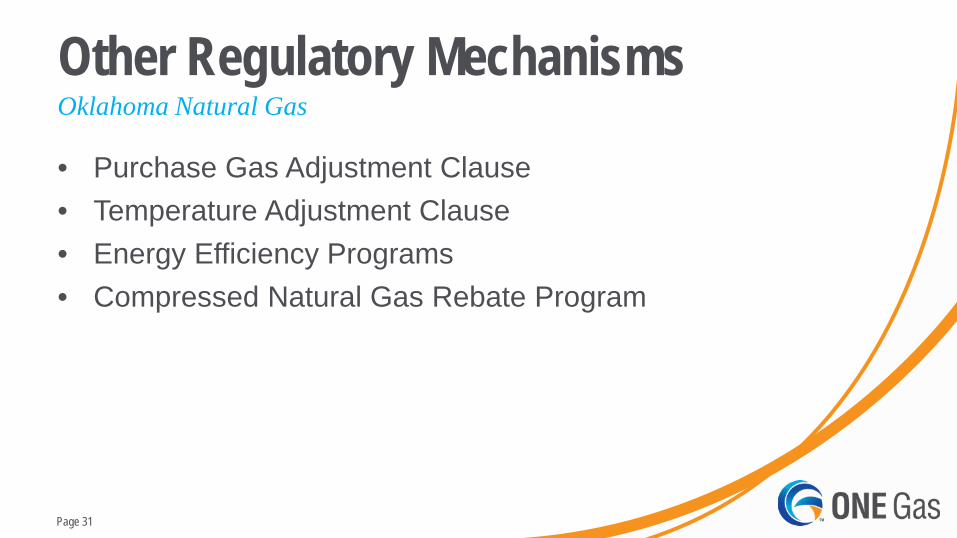
Other Regulatory Mechanisms
• Purchase Gas Adjustment Clause • Temperature Adjustment Clause • Energy Efficiency Programs • Compressed Natural Gas Rebate Program
Oklahoma Natural Gas
Page 32
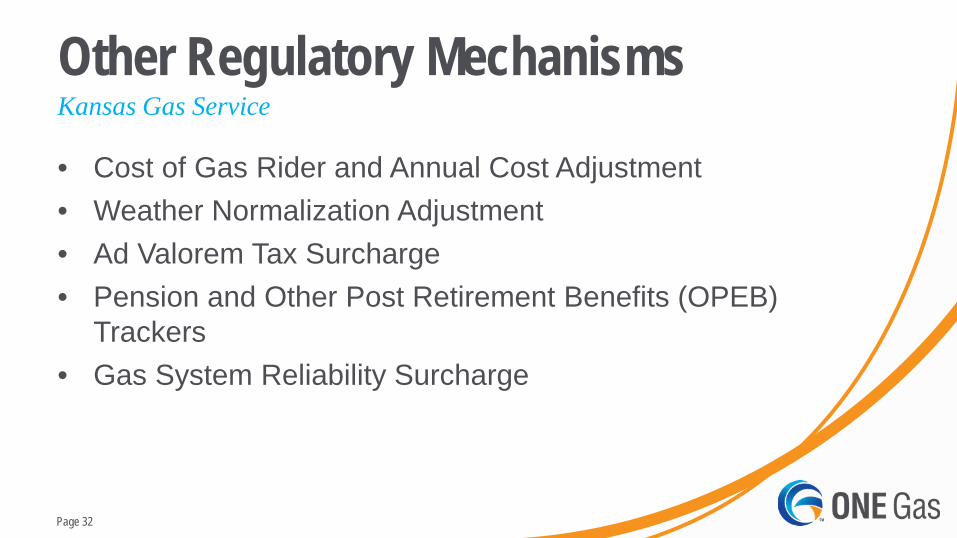
Other Regulatory Mechanisms
• Cost of Gas Rider and Annual Cost Adjustment • Weather Normalization Adjustment • Ad Valorem Tax Surcharge • Pension and Other Post Retirement Benefits (OPEB)
Trackers • Gas System Reliability Surcharge
Kansas Gas Service

Page 33
Other Regulatory Mechanisms
• Gas Reliability Infrastructure Programs (GRIP) • Cost of Service Adjustment (COSA) filings • Weather Normalization Adjustment (WNA) • Cost of Gas (COG) clause • Pension and OPEB Trackers • Pipeline-Integrity Testing Riders • Safety-Related Plant Replacements • Energy Conservation Program
Texas Gas Service – 10 Service Areas*
* Not every regulatory mechanism is present in each jurisdiction/service area
Page 34
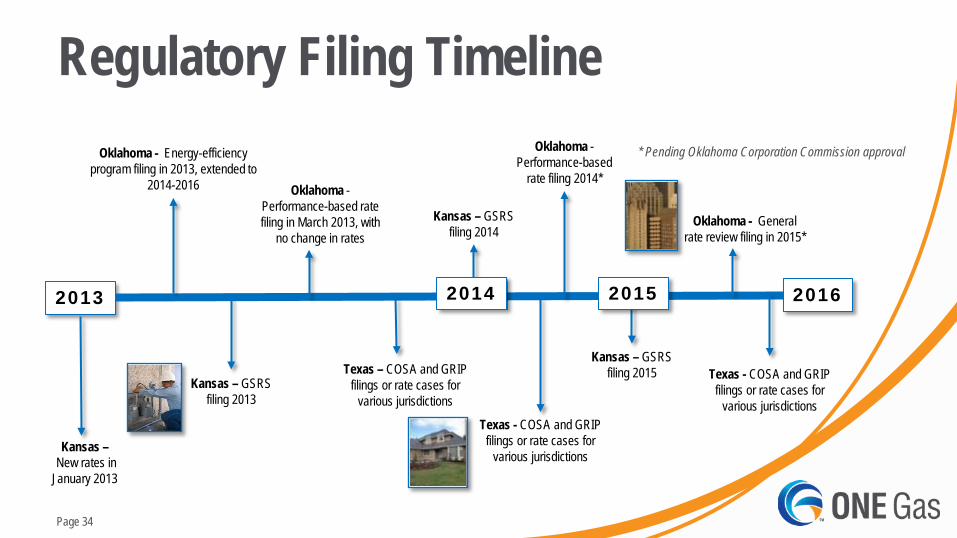
Regulatory Filing Timeline
2013 2016
Texas – COSA and GRIP filings or rate cases for
various jurisdictions
Texas - COSA and GRIP filings or rate cases for
various jurisdictions
Oklahoma - Performance-based rate filing in March 2013, with
no change in rates
Oklahoma - Performance-based
rate filing 2014*
Oklahoma - Energy-efficiency program filing in 2013, extended to
2014-2016
Kansas – GSRS filing 2014
Kansas – GSRS filing 2013
Kansas – GSRS filing 2015 Texas - COSA and GRIP
filings or rate cases for various jurisdictions
Oklahoma - General rate review filing in 2015*
2014 2015
Kansas – New rates in January 2013
* Pending Oklahoma Corporation Commission approval
Page 35
Compressed Natural Gas (CNG)
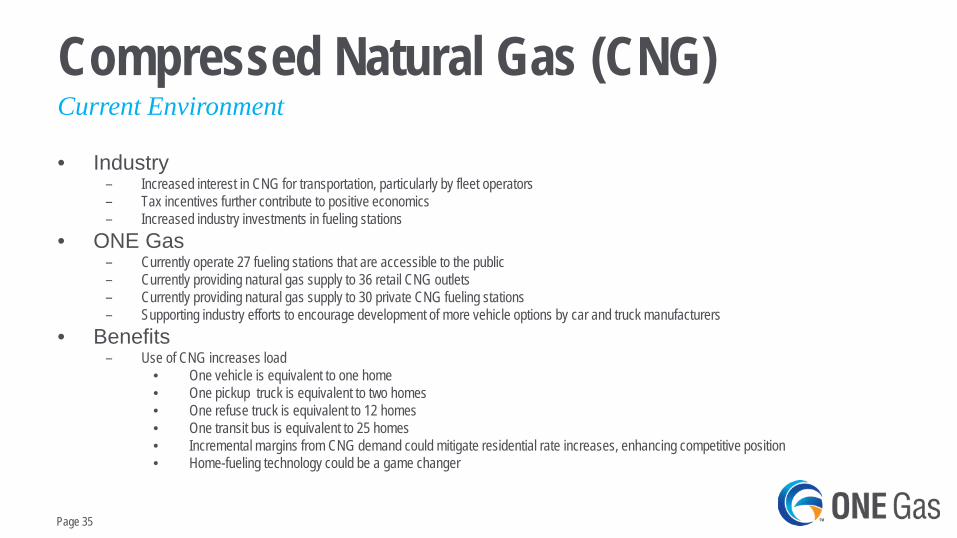
• Industry – Increased interest in CNG for transportation, particularly by fleet operators – Tax incentives further contribute to positive economics – Increased industry investments in fueling stations
• ONE Gas – Currently operate 27 fueling stations that are accessible to the public – Currently providing natural gas supply to 36 retail CNG outlets – Currently providing natural gas supply to 30 private CNG fueling stations – Supporting industry efforts to encourage development of more vehicle options by car and truck manufacturers
• Benefits – Use of CNG increases load
• One vehicle is equivalent to one home • One pickup truck is equivalent to two homes • One refuse truck is equivalent to 12 homes • One transit bus is equivalent to 25 homes • Incremental margins from CNG demand could mitigate residential rate increases, enhancing competitive position • Home-fueling technology could be a game changer
Current Environment

Page 36
ONE Gas Board of Directors Board Member* John W. Gibson Non-executive Chairman Retired, ONEOK Inc. ONEOK, Inc. Board
Member
Pierce H. Norton II ONE Gas, Inc. President and CEO Employee
Robert B. Evans Independent Retired, Duke Energy Americas
Michael G. Hutchinson Independent Retired, Deloitte & Touche
Pattye L. Moore Independent Non-executive chairman, Red Robin Gourmet Burgers
ONEOK, Inc. Board Member
Eduardo A. Rodriquez Independent
President, Strategic Communications Consulting Group
ONEOK, Inc. Board Member
Douglas H. Yaeger Independent Retired, Laclede Group, Inc.
Experienced Leadership
* Effective at separation
