janus henderson vit overseas portfoliofile/ag0052.pdf · janus henderson vit overseas portfolio...
TRANSCRIPT

ANNUAL REPORT December 31, 2019
Janus Henderson VIT Overseas Portfolio
Janus Aspen Series
Beginning on January 1, 2021, as permitted by regulations adopted by the Securities and Exchange Commission, the insurance company that offers your variable life insurance contract or variable annuity contract, may determine that it will no longer send you paper copies of the Portfolio’s shareholder reports, unless you specifically request paper copies of the reports. Beginning on January 1, 2021, for shareholders who are not insurance contract holders, paper copies of the Portfolio’s shareholder reports will no longer be sent by mail unless you specifically request paper copies of the reports. Instead, the reports will be made available on a website, and your insurance company or plan sponsor, broker-dealer, or financial intermediary will notify you by mail each time a report is posted and provide you with a website link to access the report. Instructions for requesting paper copies will be provided by your insurance company or plan sponsor, broker-dealer, or financial intermediary. If you already elected to receive shareholder reports electronically, you will not be affected by this change and you need not take any action. You may elect to receive shareholder reports and other communications from the Portfolio electronically by contacting your insurance company or plan sponsor, broker-dealer, or other financial intermediary. You may elect to receive all future reports in paper free of charge by contacting your insurance company or plan sponsor, broker dealer or other financial intermediary. Your election to receive reports in paper will apply to all funds held in your account with your insurance company or plan sponsor, broker dealer or other financial intermediary.
HIGHLIGHTS
• Portfolio management perspective • Investment strategy behind your portfolio • Portfolio performance, characteristics
and holdings

Table of Contents
Janus Henderson VIT Overseas Portfolio Management Commentary and Schedule of Investments ............................1 Notes to Schedule of Investments and Other Information........................ 11 Statement of Assets and Liabilities ............................................................................. 12 Statement of Operations ...................................................................................................... 13 Statements of Changes in Net Assets...................................................................... 14 Financial Highlights .................................................................................................................. 15 Notes to Financial Statements ........................................................................................ 16 Report of Independent Registered Public Accounting Firm.................... 28 Additional Information............................................................................................................. 29 Useful Information About Your Portfolio Report ............................................... 35 Designation Requirements.................................................................................................. 38 Trustees and Officers.............................................................................................................. 39
Janus Henderson VIT Overseas Portfolio (unaudited)
Janus Aspen Series 1
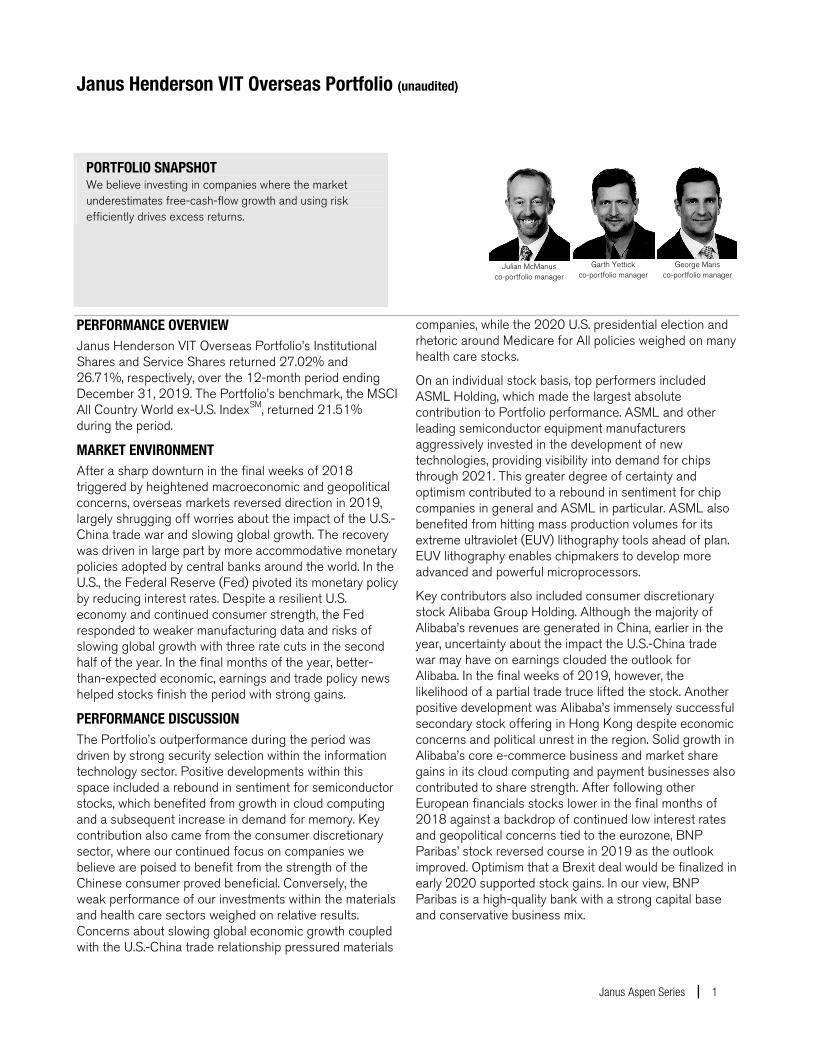
PORTFOLIO SNAPSHOT We believe investing in companies where the market underestimates free-cash-flow growth and using risk efficiently drives excess returns.
Julian McManus co-portfolio manager
Garth Yettick
co-portfolio manager
George Maris co-portfolio manager
PERFORMANCE OVERVIEW Janus Henderson VIT Overseas Portfolio’s Institutional Shares and Service Shares returned 27.02% and 26.71%, respectively, over the 12-month period ending December 31, 2019. The Portfolio’s benchmark, the MSCI All Country World ex-U.S. IndexSM, returned 21.51% during the period.
MARKET ENVIRONMENT After a sharp downturn in the final weeks of 2018 triggered by heightened macroeconomic and geopolitical concerns, overseas markets reversed direction in 2019, largely shrugging off worries about the impact of the U.S.-China trade war and slowing global growth. The recovery was driven in large part by more accommodative monetary policies adopted by central banks around the world. In the U.S., the Federal Reserve (Fed) pivoted its monetary policy by reducing interest rates. Despite a resilient U.S. economy and continued consumer strength, the Fed responded to weaker manufacturing data and risks of slowing global growth with three rate cuts in the second half of the year. In the final months of the year, better-than-expected economic, earnings and trade policy news helped stocks finish the period with strong gains.
PERFORMANCE DISCUSSION The Portfolio’s outperformance during the period was driven by strong security selection within the information technology sector. Positive developments within this space included a rebound in sentiment for semiconductor stocks, which benefited from growth in cloud computing and a subsequent increase in demand for memory. Key contribution also came from the consumer discretionary sector, where our continued focus on companies we believe are poised to benefit from the strength of the Chinese consumer proved beneficial. Conversely, the weak performance of our investments within the materials and health care sectors weighed on relative results. Concerns about slowing global economic growth coupled with the U.S.-China trade relationship pressured materials
companies, while the 2020 U.S. presidential election and rhetoric around Medicare for All policies weighed on many health care stocks.
On an individual stock basis, top performers included ASML Holding, which made the largest absolute contribution to Portfolio performance. ASML and other leading semiconductor equipment manufacturers aggressively invested in the development of new technologies, providing visibility into demand for chips through 2021. This greater degree of certainty and optimism contributed to a rebound in sentiment for chip companies in general and ASML in particular. ASML also benefited from hitting mass production volumes for its extreme ultraviolet (EUV) lithography tools ahead of plan. EUV lithography enables chipmakers to develop more advanced and powerful microprocessors.
Key contributors also included consumer discretionary stock Alibaba Group Holding. Although the majority of Alibaba’s revenues are generated in China, earlier in the year, uncertainty about the impact the U.S.-China trade war may have on earnings clouded the outlook for Alibaba. In the final weeks of 2019, however, the likelihood of a partial trade truce lifted the stock. Another positive development was Alibaba’s immensely successful secondary stock offering in Hong Kong despite economic concerns and political unrest in the region. Solid growth in Alibaba’s core e-commerce business and market share gains in its cloud computing and payment businesses also contributed to share strength. After following other European financials stocks lower in the final months of 2018 against a backdrop of continued low interest rates and geopolitical concerns tied to the eurozone, BNP Paribas’ stock reversed course in 2019 as the outlook improved. Optimism that a Brexit deal would be finalized in early 2020 supported stock gains. In our view, BNP Paribas is a high-quality bank with a strong capital base and conservative business mix.

Janus Henderson VIT Overseas Portfolio (unaudited)
2 DECEMBER 31, 2019
While pleased with the strong results of these stocks, we were disappointed by the performance of other Portfolio holdings. Metals and mining companies Hindustan Zinc and Teck Resources declined with the broader materials sector and were among the Portfolio’s largest detractors. However, our research indicates the underlying fundamentals of both companies remain strong. As the second-largest zinc producer in the world, Hindustan Zinc has high market share and also benefits from a low-cost structure and a strong balance sheet. Teck Resources generates stable cash flow, enjoys strong earnings, is disciplined in its capital expenditures and has good shareholder practices.
Irish mortgage lender Permanent TSB Group also detracted from Portfolio results. The company’s share price declined in response to negative political rhetoric about mortgage pricing and concerns about regulatory changes that increase the capital the lender must hold. We continue to hold the stock, however, and believe Permanent TSB will recover as some of these pressures abate.
Please see the Derivative Instruments section in the “Notes to Financial Statements” for a discussion of derivatives used by the Portfolio.
OUTLOOK Given that a partial resolution to U.S.-China trade issues seems imminent, we believe the fundamental backdrop for the global economy and markets is improving. Nonetheless, the high risk premiums that punished companies impacted by the trade war have only started to reverse and, in our view, still have further to go. We are confident the Portfolio is positioned to benefit as the tide turns and stocks re-rate.
Despite lingering weakness in Europe and Japan, signs point to stable, if unremarkable, expansion in those economies over the next several years. The weaker U.S. dollar provides additional support to markets outside the U.S. While a weaker dollar helps U.S.-based exporters relative to global competitors, the decline fosters a more favorable environment for non-U.S. and emerging markets by attracting assets searching for higher returns into these countries.
Going forward, we will closely monitor developments to assess what, if any, impact they may have on our holdings. However, our investment decisions will continue to be driven by company-specific dynamics. We believe that by building high-conviction positions at times of uncertainty
and then holding these positions as the market comes to appreciate their long-term growth potential, we will deliver strong results to our investors over time.
Thank you for your continued investment in Janus Henderson VIT Overseas Portfolio.
Janus Henderson VIT Overseas Portfolio (unaudited) Portfolio At A Glance December 31, 2019
Janus Aspen Series 3
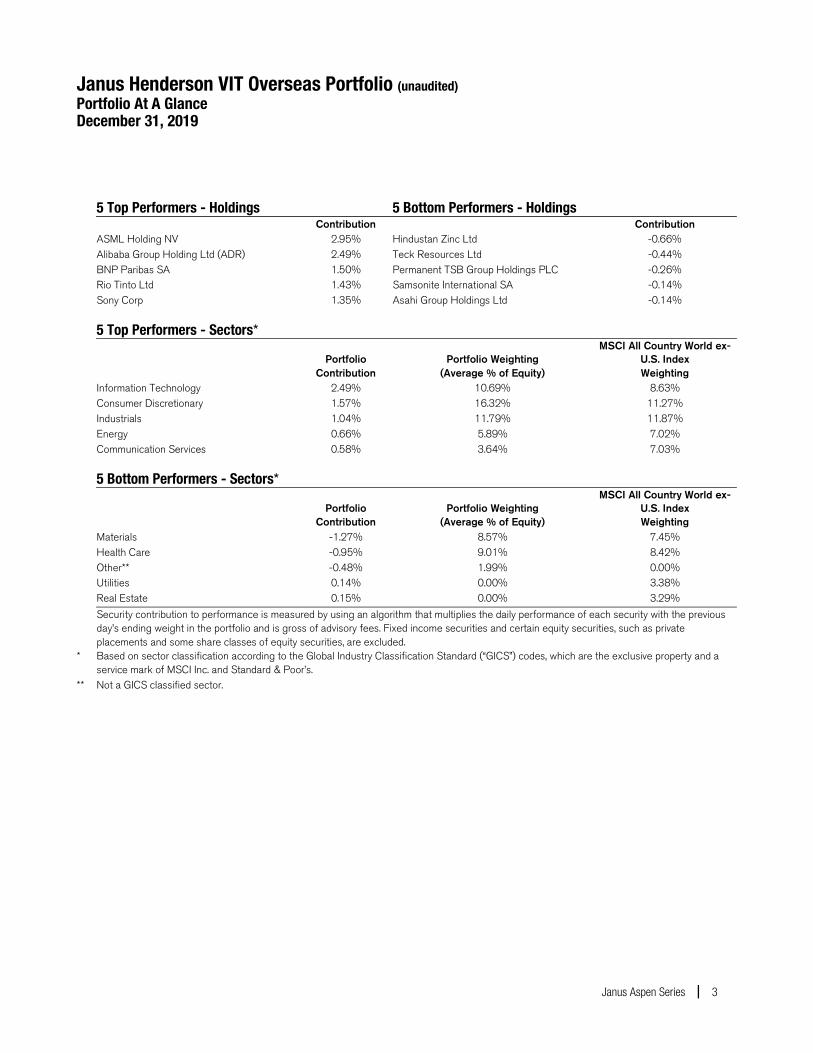
5 Top Performers - Holdings 5 Bottom Performers - Holdings Contribution Contribution ASML Holding NV 2.95% Hindustan Zinc Ltd -0.66% Alibaba Group Holding Ltd (ADR) 2.49% Teck Resources Ltd -0.44% BNP Paribas SA 1.50% Permanent TSB Group Holdings PLC -0.26% Rio Tinto Ltd 1.43% Samsonite International SA -0.14% Sony Corp 1.35% Asahi Group Holdings Ltd -0.14%
5 Top Performers - Sectors*
Portfolio Portfolio Weighting MSCI All Country World ex-
U.S. Index Contribution (Average % of Equity) Weighting Information Technology 2.49% 10.69% 8.63% Consumer Discretionary 1.57% 16.32% 11.27% Industrials 1.04% 11.79% 11.87% Energy 0.66% 5.89% 7.02% Communication Services 0.58% 3.64% 7.03% 5 Bottom Performers - Sectors*
Portfolio Portfolio Weighting MSCI All Country World ex-
U.S. Index Contribution (Average % of Equity) Weighting Materials -1.27% 8.57% 7.45% Health Care -0.95% 9.01% 8.42% Other** -0.48% 1.99% 0.00% Utilities 0.14% 0.00% 3.38% Real Estate 0.15% 0.00% 3.29%
Security contribution to performance is measured by using an algorithm that multiplies the daily performance of each security with the previous day’s ending weight in the portfolio and is gross of advisory fees. Fixed income securities and certain equity securities, such as private placements and some share classes of equity securities, are excluded.
* Based on sector classification according to the Global Industry Classification Standard (“GICS”) codes, which are the exclusive property and a service mark of MSCI Inc. and Standard & Poor’s.
** Not a GICS classified sector.

Janus Henderson VIT Overseas Portfolio (unaudited) Portfolio At A Glance December 31, 2019
4 DECEMBER 31, 2019
5 Largest Equity Holdings - (% of Net Assets) Alibaba Group Holding Ltd (ADR)
Internet & Direct Marketing Retail 4.7% AIA Group Ltd
Insurance 4.1% BNP Paribas SA
Banks 4.0% Diageo PLC
Beverages 4.0% ASML Holding NV
Semiconductor & Semiconductor Equipment 3.8% 20.6%
Asset Allocation - (% of Net Assets) Common Stocks 98.5% Investment Companies 2.0% Other (0.5)% 100.0% Emerging markets comprised 20.6% of total net assets.
Top Country Allocations - Long Positions - (% of Investment Securities) As of December 31, 2019
11.8%
11.2%
10.5%
10.1%
15.8%
0% 10% 20% 30% 40%
Japan
United Kingdom
China
Netherlands
France
As of December 31, 2018
14.8%
12.0%
11.3%
11.3%
15.3%
0% 10% 20% 30% 40%
United Kingdom
France
Japan
Netherlands
China
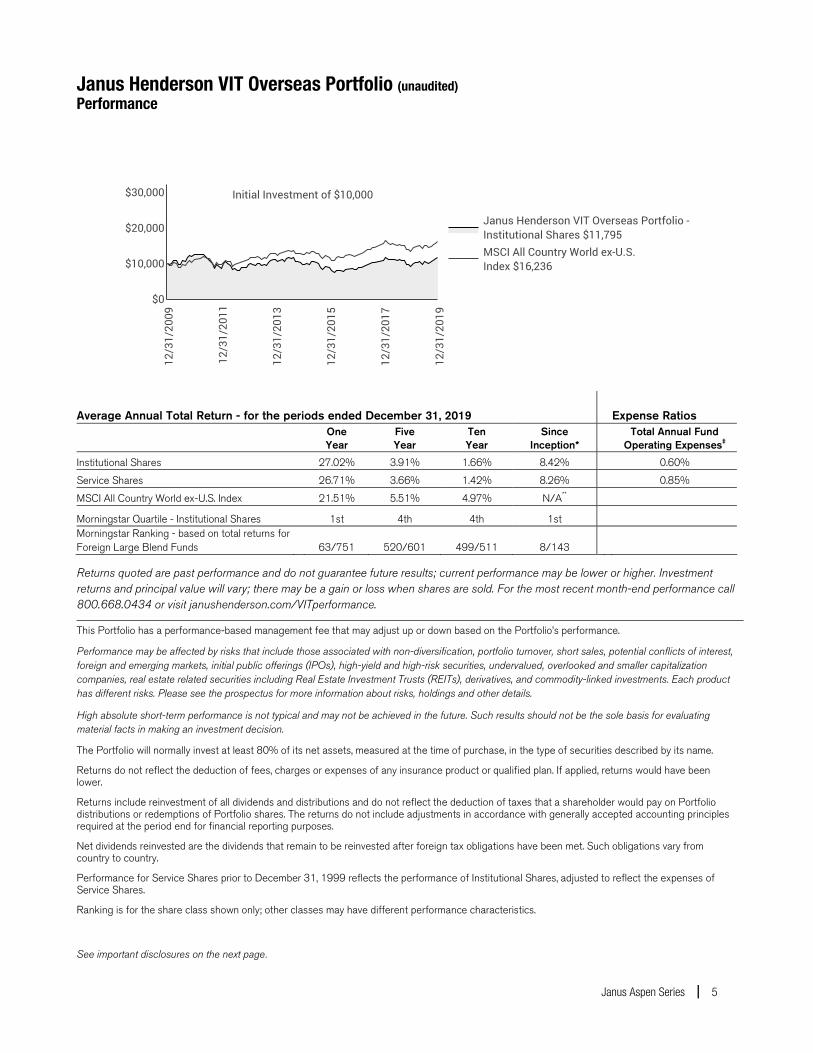
Janus Henderson VIT Overseas Portfolio (unaudited) Performance
Janus Aspen Series 5
Average Annual Total Return - for the periods ended December 31, 2019 Expense Ratios
One Year
Five Year
Ten Year
Since Inception*
Total Annual Fund Operating Expenses‡
Institutional Shares 27.02% 3.91% 1.66% 8.42% 0.60%
Service Shares 26.71% 3.66% 1.42% 8.26% 0.85%
MSCI All Country World ex-U.S. Index 21.51% 5.51% 4.97% N/A**
Morningstar Quartile - Institutional Shares 1st 4th 4th 1st Morningstar Ranking - based on total returns for Foreign Large Blend Funds 63/751 520/601 499/511 8/143
Returns quoted are past performance and do not guarantee future results; current performance may be lower or higher. Investment returns and principal value will vary; there may be a gain or loss when shares are sold. For the most recent month-end performance call 800.668.0434 or visit janushenderson.com/VITperformance.
This Portfolio has a performance-based management fee that may adjust up or down based on the Portfolio’s performance.
Performance may be affected by risks that include those associated with non-diversification, portfolio turnover, short sales, potential conflicts of interest, foreign and emerging markets, initial public offerings (IPOs), high-yield and high-risk securities, undervalued, overlooked and smaller capitalization companies, real estate related securities including Real Estate Investment Trusts (REITs), derivatives, and commodity-linked investments. Each product has different risks. Please see the prospectus for more information about risks, holdings and other details.
High absolute short-term performance is not typical and may not be achieved in the future. Such results should not be the sole basis for evaluating material facts in making an investment decision.
The Portfolio will normally invest at least 80% of its net assets, measured at the time of purchase, in the type of securities described by its name.
Returns do not reflect the deduction of fees, charges or expenses of any insurance product or qualified plan. If applied, returns would have been lower.
Returns include reinvestment of all dividends and distributions and do not reflect the deduction of taxes that a shareholder would pay on Portfolio distributions or redemptions of Portfolio shares. The returns do not include adjustments in accordance with generally accepted accounting principles required at the period end for financial reporting purposes.
Net dividends reinvested are the dividends that remain to be reinvested after foreign tax obligations have been met. Such obligations vary from country to country.
Performance for Service Shares prior to December 31, 1999 reflects the performance of Institutional Shares, adjusted to reflect the expenses of Service Shares.
Ranking is for the share class shown only; other classes may have different performance characteristics.
See important disclosures on the next page.

Janus Henderson VIT Overseas Portfolio (unaudited) Performance
6 DECEMBER 31, 2019
© 2019 Morningstar, Inc. All Rights Reserved. There is no assurance that the investment process will consistently lead to successful investing.
See Notes to Schedule of Investments and Other Information for index definitionsfor index definitions.
Index performance does not reflect the expenses of managing a portfolio as an index is unmanaged and not available for direct investment.
See “Useful Information About Your Portfolio Report.”
*The Portfolio’s inception date – May 2, 1994
‡ As stated in the prospectus. See Financial Highlights for actual expense ratios during the reporting period.
**Since inception return is not shown for the index because the index’s inception date differs significantly from the Portfolio’s inception date.

Janus Henderson VIT Overseas Portfolio (unaudited) Expense Examples
Janus Aspen Series 7
As a shareholder of the Portfolio, you incur two types of costs: (1) transaction costs and (2) ongoing costs, including management fees; 12b-1 distribution and shareholder servicing fees (applicable to Service Shares only); transfer agent fees and expenses payable pursuant to the Transfer Agency Agreement; and other Portfolio expenses. This example is intended to help you understand your ongoing costs (in dollars) of investing in the Portfolio and to compare these costs with the ongoing costs of investing in other mutual funds. To do so, compare this 5% hypothetical example with the 5% hypothetical examples that appear in the shareholder reports of the other funds. The example is based upon an investment of $1,000 invested at the beginning of the period and held for the six-months indicated, unless noted otherwise in the table and footnotes below.
Actual Expenses The information in the table under the heading “Actual” provides information about actual account values and actual expenses. You may use the information in these columns, together with the amount you invested, to estimate the expenses that you paid over the period. Simply divide your account value by $1,000 (for example, an $8,600 account value divided by $1,000 = 8.6), then multiply the result by the number in the appropriate column for your share class under the heading entitled “Expenses Paid During Period” to estimate the expenses you paid on your account during the period.
Hypothetical Example for Comparison Purposes The information in the table under the heading “Hypothetical (5% return before expenses)” provides information about hypothetical account values and hypothetical expenses based upon the Portfolio’s actual expense ratio and an assumed rate of return of 5% per year before expenses, which is not the Portfolio’s actual return. The hypothetical account values and expenses may not be used to estimate the actual ending account balance or expenses you paid for the period. You may use this information to compare the ongoing costs of investing in the Portfolio and other funds. To do so, compare this 5% hypothetical example with the 5% hypothetical examples that appear in the shareholder reports of the other funds. Additionally, for an analysis of the fees associated with an investment in either share class or other similar funds, please visit www.finra.org/fundanalyzer. Please note that the expenses shown in the table are meant to highlight your ongoing costs only and do not reflect any transaction costs, such as any charges at the separate account level or contract level. These fees are fully described in the Portfolio’s prospectuses. Therefore, the hypothetical examples are useful in comparing ongoing costs only, and will not help you determine the relative total costs of owning different funds. In addition, if these transaction costs were included, your costs would have been higher.
Actual Hypothetical
(5% return before expenses)
Beginning Account
Value (7/1/19)
Ending Account
Value (12/31/19)
Expenses Paid During
Period (7/1/19 - 12/31/19)†
BeginningAccount
Value (7/1/19)
Ending Account
Value (12/31/19)
Expenses Paid During
Period (7/1/19 - 12/31/19)†
Net Annualized Expense Ratio
(7/1/19 - 12/31/19)
Institutional Shares $1,000.00 $1,110.70 $4.20 $1,000.00 $1,021.22 $4.02 0.79%
Service Shares $1,000.00 $1,109.50 $5.53 $1,000.00 $1,019.96 $5.30 1.04% † Expenses Paid During Period are equal to the Net Annualized Expense Ratio multiplied by the average account value over the period, multiplied
by 184/365 (to reflect the one-half year period). Expenses in the examples include the effect of applicable fee waivers and/or expense reimbursements, if any. Had such waivers and/or reimbursements not been in effect, your expenses would have been higher. Please refer to the Notes to Financial Statements or the Portfolio’s prospectuses for more information regarding waivers and/or reimbursements.

Janus Henderson VIT Overseas Portfolio Schedule of Investments December 31, 2019
See Notes to Schedule of Investments and Other Information and Notes to Financial Statements.
8 DECEMBER 31, 2019
Shares
Value Common Stocks – 98.5% Aerospace & Defense – 5.0% CAE Inc 368,520 $9,757,946 Safran SA 163,702 25,273,762 35,031,708Banks – 11.4% BNP Paribas SA 477,220 28,277,364 China Construction Bank Corp 23,160,000 20,003,953 HDFC Bank Ltd 387,626 6,908,994 ING Groep NV 314,978 3,775,864 Mitsubishi UFJ Financial Group Inc 3,025,700 16,521,035 Permanent TSB Group Holdings PLC* 3,507,426 4,492,564 79,979,774Beverages – 8.6% Asahi Group Holdings Ltd 189,100 8,673,466 Diageo PLC 659,434 27,951,666 Heineken NV 225,291 23,985,085 60,610,217Biotechnology – 0.4% BeiGene Ltd (ADR)* 16,103 2,669,233Building Products – 2.9% Daikin Industries Ltd 141,300 20,094,671Consumer Finance – 1.2% Nexi SpA (144A)* 588,431 8,170,636Electronic Equipment, Instruments & Components – 1.4% Hexagon AB 173,145 9,708,132Entertainment – 1.0% Nexon Co Ltd* 519,000 6,927,007Hotels, Restaurants & Leisure – 2.9% GVC Holdings PLC 1,712,839 20,057,906Household Durables – 2.7% Sony Corp 275,600 18,774,996Insurance – 11.3% AIA Group Ltd 2,763,400 29,010,770 Beazley PLC 947,334 6,975,839 Intact Financial Corp 83,247 9,003,037 NN Group NV 518,772 19,678,401 Sony Financial Holdings Inc 599,300 14,497,058 79,165,105Interactive Media & Services – 3.7% Tencent Holdings Ltd 541,300 26,093,108Internet & Direct Marketing Retail – 5.2% Alibaba Group Holding Ltd (ADR)* 155,342 32,948,038 MakeMyTrip Ltd* 160,979 3,686,419 36,634,457Metals & Mining – 7.1% Antofagasta PLC 767,232 9,315,793 Hindustan Zinc Ltd* 3,692,019 10,845,247 Rio Tinto Ltd 266,702 18,786,707 Teck Resources Ltd 637,853 11,063,193 50,010,940Oil, Gas & Consumable Fuels – 6.2% Canadian Natural Resources Ltd 805,910 26,071,189 TOTAL SA 318,284 17,563,845 43,635,034Pharmaceuticals – 9.0% AstraZeneca PLC 189,016 19,042,788 Novartis AG 189,063 17,956,686 Takeda Pharmaceutical Co Ltd 652,674 26,025,256 63,024,730
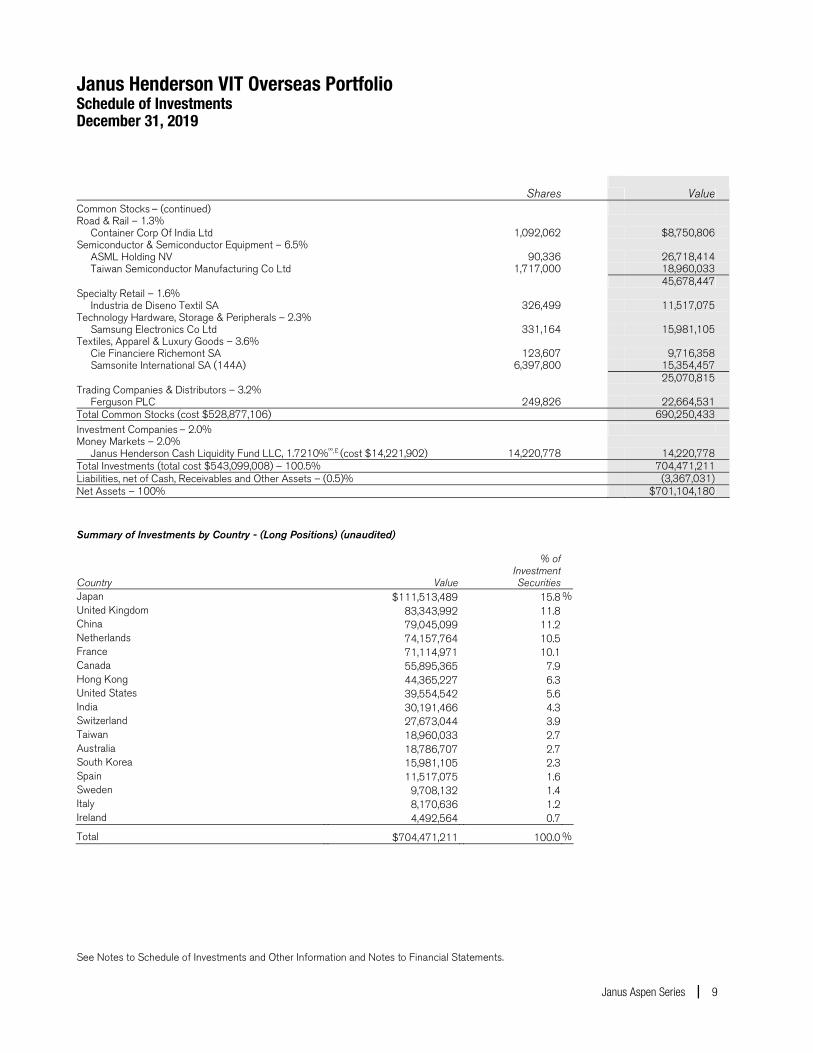
Janus Henderson VIT Overseas Portfolio Schedule of Investments December 31, 2019
See Notes to Schedule of Investments and Other Information and Notes to Financial Statements.
Janus Aspen Series 9
Shares
Value Common Stocks – (continued) Road & Rail – 1.3% Container Corp Of India Ltd 1,092,062 $8,750,806Semiconductor & Semiconductor Equipment – 6.5% ASML Holding NV 90,336 26,718,414 Taiwan Semiconductor Manufacturing Co Ltd 1,717,000 18,960,033 45,678,447Specialty Retail – 1.6% Industria de Diseno Textil SA 326,499 11,517,075Technology Hardware, Storage & Peripherals – 2.3% Samsung Electronics Co Ltd 331,164 15,981,105Textiles, Apparel & Luxury Goods – 3.6% Cie Financiere Richemont SA 123,607 9,716,358 Samsonite International SA (144A) 6,397,800 15,354,457 25,070,815Trading Companies & Distributors – 3.2% Ferguson PLC 249,826 22,664,531Total Common Stocks (cost $528,877,106) 690,250,433Investment Companies – 2.0% Money Markets – 2.0% Janus Henderson Cash Liquidity Fund LLC, 1.7210%ºº,£ (cost $14,221,902) 14,220,778 14,220,778Total Investments (total cost $543,099,008) – 100.5% 704,471,211Liabilities, net of Cash, Receivables and Other Assets – (0.5)% (3,367,031)Net Assets – 100% $701,104,180 Summary of Investments by Country - (Long Positions) (unaudited) % of Investment Country Value Securities Japan $111,513,489 15.8 % United Kingdom 83,343,992 11.8 China 79,045,099 11.2 Netherlands 74,157,764 10.5 France 71,114,971 10.1 Canada 55,895,365 7.9 Hong Kong 44,365,227 6.3 United States 39,554,542 5.6 India 30,191,466 4.3 Switzerland 27,673,044 3.9 Taiwan 18,960,033 2.7 Australia 18,786,707 2.7 South Korea 15,981,105 2.3 Spain 11,517,075 1.6 Sweden 9,708,132 1.4 Italy 8,170,636 1.2 Ireland 4,492,564 0.7
Total $704,471,211 100.0 %
Janus Henderson VIT Overseas Portfolio Schedule of Investments December 31, 2019
See Notes to Schedule of Investments and Other Information and Notes to Financial Statements.
10 DECEMBER 31, 2019
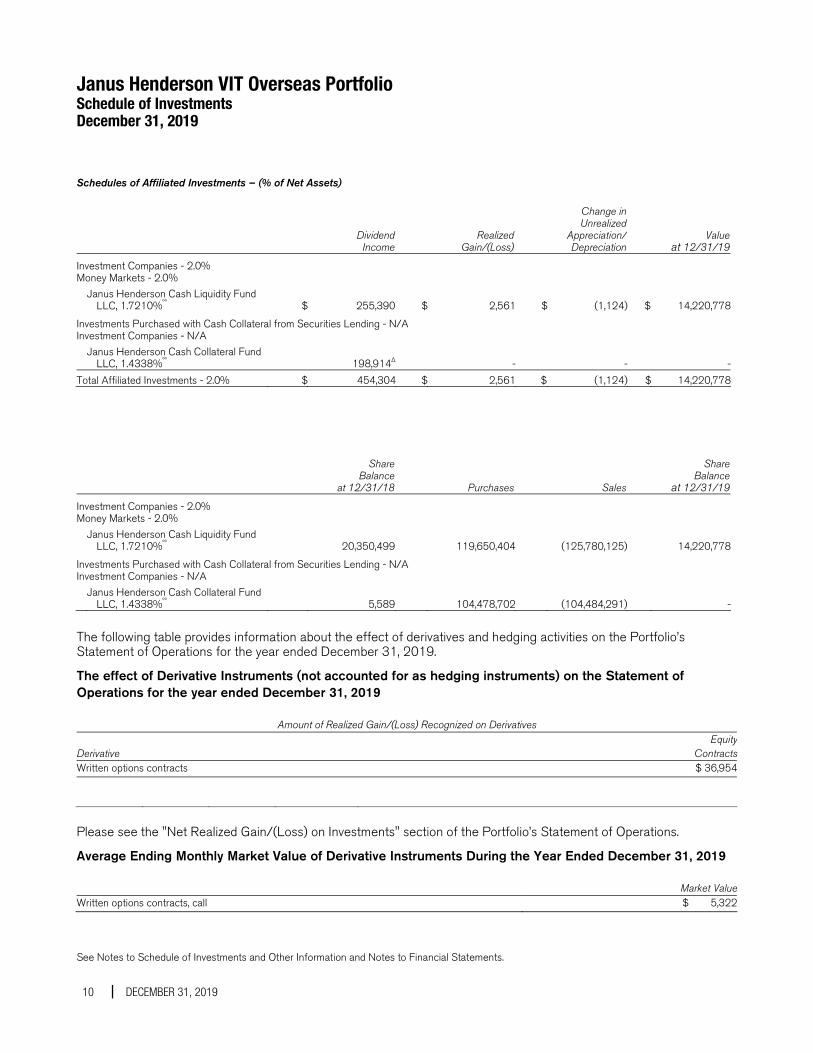
Schedules of Affiliated Investments – (% of Net Assets)
DividendIncome
RealizedGain/(Loss)
Change in Unrealized
Appreciation/ Depreciation
Valueat 12/31/19
Investment Companies - 2.0% Money Markets - 2.0% Janus Henderson Cash Liquidity Fund
LLC, 1.7210%ºº $ 255,390 $ 2,561 $ (1,124) $ 14,220,778
Investments Purchased with Cash Collateral from Securities Lending - N/A Investment Companies - N/A Janus Henderson Cash Collateral Fund
LLC, 1.4338%ºº 198,914Δ - - -Total Affiliated Investments - 2.0% $ 454,304 $ 2,561 $ (1,124) $ 14,220,778
ShareBalance
at 12/31/18 Purchases Sales
ShareBalance
at 12/31/19
Investment Companies - 2.0% Money Markets - 2.0% Janus Henderson Cash Liquidity Fund
LLC, 1.7210%ºº 20,350,499 119,650,404 (125,780,125) 14,220,778
Investments Purchased with Cash Collateral from Securities Lending - N/A Investment Companies - N/A Janus Henderson Cash Collateral Fund
LLC, 1.4338%ºº 5,589 104,478,702 (104,484,291) -
The following table provides information about the effect of derivatives and hedging activities on the Portfolio’s Statement of Operations for the year ended December 31, 2019.
The effect of Derivative Instruments (not accounted for as hedging instruments) on the Statement of Operations for the year ended December 31, 2019
Amount of Realized Gain/(Loss) Recognized on Derivatives
Derivative Equity
ContractsWritten options contracts $ 36,954
Please see the "Net Realized Gain/(Loss) on Investments" section of the Portfolio’s Statement of Operations.
Average Ending Monthly Market Value of Derivative Instruments During the Year Ended December 31, 2019 Market ValueWritten options contracts, call $ 5,322

Janus Henderson VIT Overseas Portfolio Notes to Schedule of Investments and Other Information
Janus Aspen Series 11
MSCI All Country World ex- U.S. IndexSM
MSCI All Country World ex U.S. IndexSM reflects the equity market performance of global developed and emerging markets, excluding the U.S.
ADR American Depositary Receipt
LLC Limited Liability Company
PLC Public Limited Company
144A Securities sold under Rule 144A of the Securities Act of 1933, as amended, are subject to legal and/or contractual restrictions on resale
and may not be publicly sold without registration under the 1933 Act. Unless otherwise noted, these securities have been determined to be liquid under guidelines established by the Board of Trustees. The total value of 144A securities as of the year ended December 31, 2019 is $23,525,093, which represents 3.4% of net assets.
* Non-income producing security.
ºº Rate shown is the 7-day yield as of December 31, 2019.
£ The Portfolio may invest in certain securities that are considered affiliated companies. As defined by the Investment Company Act of 1940, as amended, an affiliated company is one in which the Portfolio owns 5% or more of the outstanding voting securities, or a company which is under common ownership or control.
Δ Net of income paid to the securities lending agent and rebates paid to the borrowing counterparties.
The following is a summary of the inputs that were used to value the Portfolio’s investments in securities and other financial instruments as of December 31, 2019. See Notes to Financial Statements for more information.
Valuation Inputs Summary Level 2 - Level 3 - Level 1 - Other Significant Significant Quoted Prices Observable Inputs Unobservable Inputs
Assets
Investments In Securities: Common Stocks $ 690,250,433 $ - $ -Investment Companies - 14,220,778 -Total Assets $ 690,250,433 $ 14,220,778 $ -
Janus Henderson VIT Overseas Portfolio Statement of Assets and Liabilities December 31, 2019
See Notes to Financial Statements.
12 DECEMBER 31, 2019
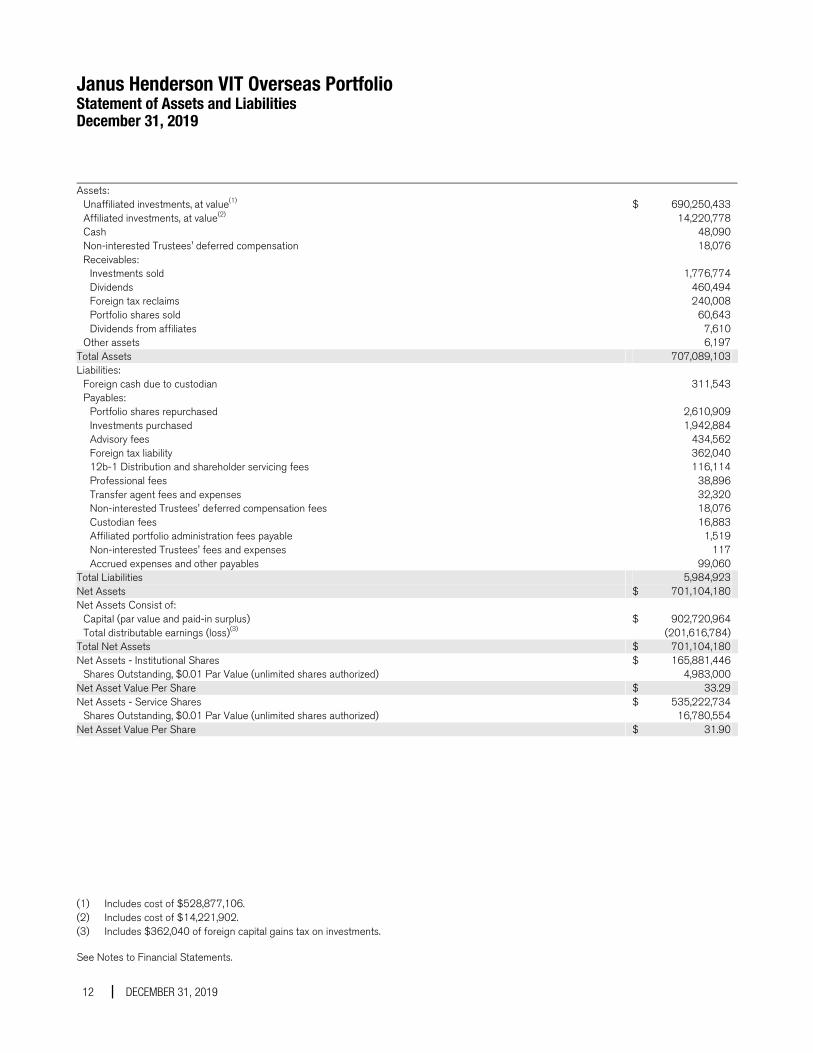
Assets: Unaffiliated investments, at value(1) $ 690,250,433 Affiliated investments, at value(2) 14,220,778 Cash 48,090 Non-interested Trustees' deferred compensation 18,076 Receivables: Investments sold 1,776,774 Dividends 460,494 Foreign tax reclaims 240,008 Portfolio shares sold 60,643 Dividends from affiliates 7,610 Other assets 6,197Total Assets 707,089,103 Liabilities: Foreign cash due to custodian 311,543 Payables: — Portfolio shares repurchased 2,610,909 Investments purchased 1,942,884 Advisory fees 434,562 Foreign tax liability 362,040 12b-1 Distribution and shareholder servicing fees 116,114 Professional fees 38,896 Transfer agent fees and expenses 32,320 Non-interested Trustees' deferred compensation fees 18,076 Custodian fees 16,883 Affiliated portfolio administration fees payable 1,519 Non-interested Trustees' fees and expenses 117 Accrued expenses and other payables 99,060Total Liabilities 5,984,923 Net Assets $ 701,104,180 Net Assets Consist of: Capital (par value and paid-in surplus) $ 902,720,964 Total distributable earnings (loss)(3) (201,616,784)Total Net Assets $ 701,104,180 Net Assets - Institutional Shares $ 165,881,446 Shares Outstanding, $0.01 Par Value (unlimited shares authorized) 4,983,000Net Asset Value Per Share $ 33.29 Net Assets - Service Shares $ 535,222,734 Shares Outstanding, $0.01 Par Value (unlimited shares authorized) 16,780,554Net Asset Value Per Share $ 31.90
(1) Includes cost of $528,877,106. (2) Includes cost of $14,221,902. (3) Includes $362,040 of foreign capital gains tax on investments.
Janus Henderson VIT Overseas Portfolio Statement of Operations For the year ended December 31, 2019
See Notes to Financial Statements.
Janus Aspen Series 13
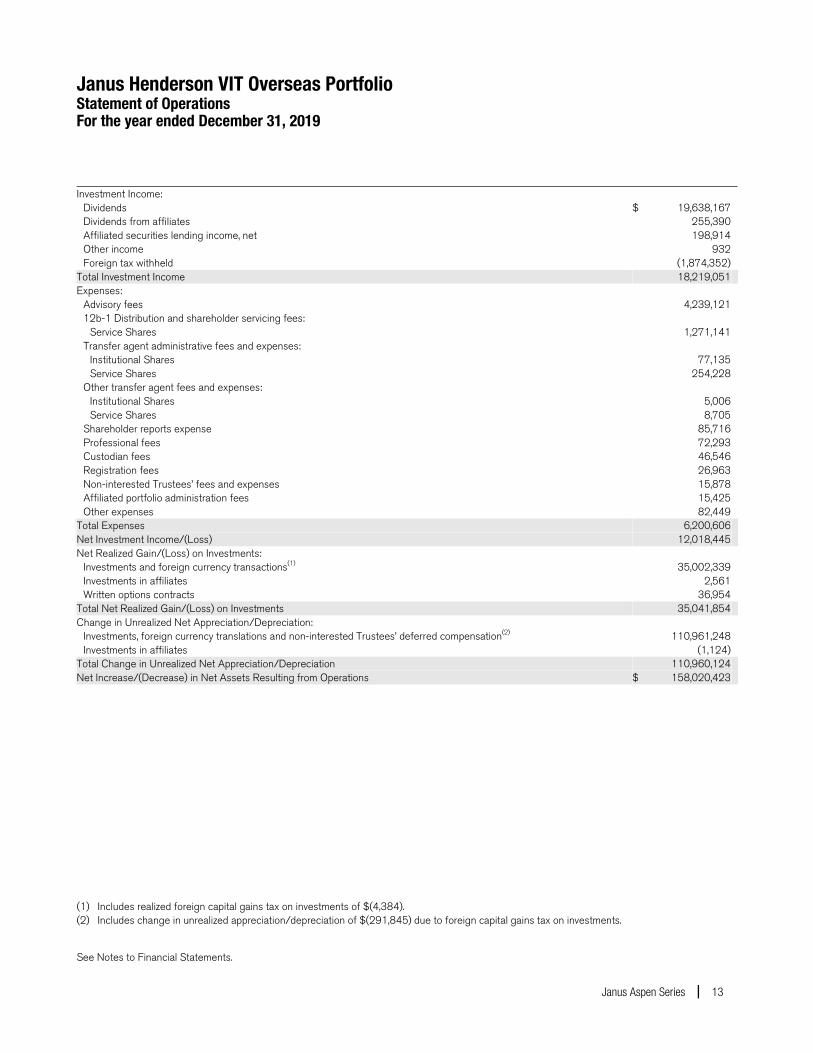
Investment Income: Dividends $ 19,638,167 Dividends from affiliates 255,390 Affiliated securities lending income, net 198,914 Other income 932 Foreign tax withheld (1,874,352)Total Investment Income 18,219,051 Expenses: Advisory fees 4,239,121 12b-1 Distribution and shareholder servicing fees: Service Shares 1,271,141 Transfer agent administrative fees and expenses: Institutional Shares 77,135 Service Shares 254,228 Other transfer agent fees and expenses: Institutional Shares 5,006 Service Shares 8,705 Shareholder reports expense 85,716 Professional fees 72,293 Custodian fees 46,546 Registration fees 26,963 Non-interested Trustees’ fees and expenses 15,878 Affiliated portfolio administration fees 15,425 Other expenses 82,449Total Expenses 6,200,606 Net Investment Income/(Loss) 12,018,445 Net Realized Gain/(Loss) on Investments: Investments and foreign currency transactions(1) 35,002,339 Investments in affiliates 2,561 Written options contracts 36,954Total Net Realized Gain/(Loss) on Investments 35,041,854 Change in Unrealized Net Appreciation/Depreciation: Investments, foreign currency translations and non-interested Trustees’ deferred compensation(2) 110,961,248 Investments in affiliates (1,124)Total Change in Unrealized Net Appreciation/Depreciation 110,960,124 Net Increase/(Decrease) in Net Assets Resulting from Operations $ 158,020,423
(1) Includes realized foreign capital gains tax on investments of $(4,384).(2) Includes change in unrealized appreciation/depreciation of $(291,845) due to foreign capital gains tax on investments.

Janus Henderson VIT Overseas Portfolio Statements of Changes in Net Assets
See Notes to Financial Statements.
14 DECEMBER 31, 2019
Year ended
December 31, 2019 Year ended
December 31, 2018
Operations: Net investment income/(loss) $ 12,018,445 $ 11,506,844 Net realized gain/(loss) on investments 35,041,854 29,856,071 Change in unrealized net appreciation/depreciation 110,960,124 (153,687,150)Net Increase/(Decrease) in Net Assets Resulting from Operations 158,020,423 (112,324,235)Dividends and Distributions to Shareholders Institutional Shares (2,932,994) (3,006,958) Service Shares (9,253,831) (9,659,879)Net Decrease from Dividends and Distributions to Shareholders (12,186,825) (12,666,837)Capital Share Transactions: Institutional Shares (12,250,556) (12,202,481) Service Shares (59,823,438) (56,678,825)Net Increase/(Decrease) from Capital Share Transactions (72,073,994) (68,881,306)Net Increase/(Decrease) in Net Assets 73,759,604 (193,872,378)Net Assets: Beginning of period 627,344,576 821,216,954 End of period $ 701,104,180 $ 627,344,576

Janus Henderson VIT Overseas Portfolio Financial Highlights
See Notes to Financial Statements.
Janus Aspen Series 15
Institutional Shares For a share outstanding during the year ended December 31 2019 2018 2017 2016 2015 Net Asset Value, Beginning of Period $26.71 $31.98 $24.79 $28.80 $32.56 Income/(Loss) from Investment Operations: Net investment income/(loss)(1) 0.60 0.53 0.48 0.38 0.29 Net realized and unrealized gain/(loss) 6.56 (5.25) 7.20 (2.35) (2.92) Total from Investment Operations 7.16 (4.72) 7.68 (1.97) (2.63) Less Dividends and Distributions: Dividends (from net investment income) (0.58) (0.55) (0.49) (1.22) (0.19) Distributions (from capital gains) — — — (0.82) (0.94) Total Dividends and Distributions (0.58) (0.55) (0.49) (2.04) (1.13) Net Asset Value, End of Period $33.29 $26.71 $31.98 $24.79 $28.80 Total Return* 27.02% (14.94)% 31.12% (6.45)% (8.59)% Net Assets, End of Period (in thousands) $165,881 $143,912 $184,546 $158,362 $186,647 Average Net Assets for the Period (in thousands) $154,209 $172,398 $176,815 $163,322 $306,322 Ratios to Average Net Assets**: Ratio of Gross Expenses 0.75% 0.60% 0.57% 0.50% 0.51% Ratio of Net Expenses (After Waivers and Expense Offsets) 0.75% 0.60% 0.57% 0.50% 0.51% Ratio of Net Investment Income/(Loss) 2.00% 1.71% 1.65% 1.50% 0.90% Portfolio Turnover Rate 23% 25% 33% 103% 31%
Service Shares For a share outstanding during the year ended December 31 2019 2018 2017 2016 2015 Net Asset Value, Beginning of Period $25.63 $30.74 $23.87 $27.84 $31.55 Income/(Loss) from Investment Operations: Net investment income/(loss)(1) 0.50 0.44 0.39 0.30 0.19 Net realized and unrealized gain/(loss) 6.30 (5.05) 6.93 (2.27) (2.80) Total from Investment Operations 6.80 (4.61) 7.32 (1.97) (2.61) Less Dividends and Distributions: Dividends (from net investment income) (0.53) (0.50) (0.45) (1.18) (0.16) Distributions (from capital gains) — — — (0.82) (0.94) Total Dividends and Distributions (0.53) (0.50) (0.45) (2.00) (1.10) Net Asset Value, End of Period $31.90 $25.63 $30.74 $23.87 $27.84 Total Return* 26.76% (15.17)% 30.80% (6.71)% (8.80)% Net Assets, End of Period (in thousands) $535,223 $483,432 $636,671 $529,492 $631,202 Average Net Assets for the Period (in thousands) $508,303 $587,476 $598,500 $554,215 $722,654 Ratios to Average Net Assets**: Ratio of Gross Expenses 0.99% 0.85% 0.82% 0.75% 0.77% Ratio of Net Expenses (After Waivers and Expense Offsets) 0.99% 0.85% 0.82% 0.75% 0.77% Ratio of Net Investment Income/(Loss) 1.76% 1.46% 1.40% 1.25% 0.62% Portfolio Turnover Rate 23% 25% 33% 103% 31%
* Total return includes adjustments in accordance with generally accepted accounting principles required at the year or period end and are not annualized for periods of less than one full year. Total return does not include fees, charges, or expenses imposed by the variable annuity and life insurance contracts for which Janus Aspen Series serves as an underlying investment vehicle. ** Annualized for periods of less than one full year. (1) Per share amounts are calculated based on average shares outstanding during the year or period.

Janus Henderson VIT Overseas Portfolio Notes to Financial Statements
16 DECEMBER 31, 2019
1. Organization and Significant Accounting Policies Janus Henderson VIT Overseas Portfolio (the “Portfolio”) is a series of Janus Aspen Series (the “Trust”), which is organized as a Delaware statutory trust and is registered under the Investment Company Act of 1940, as amended (the “1940 Act”), as an open-end management investment company, and therefore has applied the specialized accounting and reporting guidance in Financial Accounting Standards Board (“FASB”) Accounting Standards Codification (“ASC”) Topic 946. The Trust offers 11 portfolios, each of which offers multiple share classes, with differing investment objectives and policies. The Portfolio seeks long-term growth of capital. The Portfolio is classified as diversified, as defined in the 1940 Act.
The Portfolio currently offers two classes of shares: Institutional Shares and Service Shares. Each class represents an interest in the same portfolio of investments. Institutional Shares are offered only in connection with investment in and payments under variable insurance contracts as well as certain qualified retirement plans. Service Shares are offered only in connection with investment in and payments under variable insurance contracts as well as certain qualified retirement plans that require a fee from Portfolio assets to procure distribution and administrative services to contract owners and plan participants.
Shareholders, including other portfolios, participating insurance companies, as well as accounts, may from time to time own (beneficially or of record) a significant percentage of the Portfolio’s Shares and can be considered to “control” the Portfolio when that ownership exceeds 25% of the Portfolio’s assets (and which may differ from control as determined in accordance with accounting principles generally accepted in the United States of America).
The following accounting policies have been followed by the Portfolio and are in conformity with accounting principles generally accepted in the United States of America.
Investment Valuation Securities held by the Portfolio are valued in accordance with policies and procedures established by and under the supervision of the Trustees (the “Valuation Procedures”). Equity securities traded on a domestic securities exchange are generally valued at the closing prices on the primary market or exchange on which they trade. If such price is lacking for the trading period immediately preceding the time of determination, such securities are valued at their current bid price. Equity securities that are traded on a foreign exchange are generally valued at the closing prices on such markets. In the event that there is no current trading volume on a particular security in such foreign exchange, the bid price from the primary exchange is generally used to value the security. Securities that are traded on the over-the-counter (“OTC”) markets are generally valued at their closing or latest bid prices as available. Foreign securities and currencies are converted to U.S. dollars using the applicable exchange rate in effect at the close of the New York Stock Exchange (“NYSE”). The Portfolio will determine the market value of individual securities held by it by using prices provided by one or more approved professional pricing services or, as needed, by obtaining market quotations from independent broker-dealers. Most debt securities are valued in accordance with the evaluated bid price supplied by the pricing service that is intended to reflect market value. The evaluated bid price supplied by the pricing service is an evaluation that may consider factors such as security prices, yields, maturities and ratings. Certain short-term securities maturing within 60 days or less may be evaluated and valued on an amortized cost basis provided that the amortized cost determined approximates market value. Securities for which market quotations or evaluated prices are not readily available or deemed unreliable are valued at fair value determined in good faith under the Valuation Procedures. Circumstances in which fair value pricing may be utilized include, but are not limited to: (i) a significant event that may affect the securities of a single issuer, such as a merger, bankruptcy, or significant issuer-specific development; (ii) an event that may affect an entire market, such as a natural disaster or significant governmental action; (iii) a nonsignificant event such as a market closing early or not opening, or a security trading halt; and (iv) pricing of a nonvalued security and a restricted or nonpublic security. Special valuation considerations may apply with respect to “odd-lot” fixed-income transactions which, due to their small size, may receive evaluated prices by pricing services which reflect a large block trade and not what actually could be obtained for the odd-lot position. The Portfolio uses systematic fair valuation models provided by independent third parties to value international equity securities in order to adjust for stale pricing, which may occur between the close of certain foreign exchanges and the close of the NYSE.
Valuation Inputs Summary FASB ASC 820, Fair Value Measurements and Disclosures (“ASC 820”), defines fair value, establishes a framework for measuring fair value, and expands disclosure requirements regarding fair value measurements. This standard emphasizes that fair value is a market-based measurement that should be determined based on the assumptions that

Janus Henderson VIT Overseas Portfolio Notes to Financial Statements
Janus Aspen Series 17
market participants would use in pricing an asset or liability and establishes a hierarchy that prioritizes inputs to valuation techniques used to measure fair value. These inputs are summarized into three broad levels:
Level 1 – Unadjusted quoted prices in active markets the Portfolio has the ability to access for identical assets or liabilities.
Level 2 – Observable inputs other than unadjusted quoted prices included in Level 1 that are observable for the asset or liability either directly or indirectly. These inputs may include quoted prices for the identical instrument on an inactive market, prices for similar instruments, interest rates, prepayment speeds, credit risk, yield curves, default rates and similar data.
Assets or liabilities categorized as Level 2 in the hierarchy generally include: debt securities fair valued in accordance with the evaluated bid or ask prices supplied by a pricing service; securities traded on OTC markets and listed securities for which no sales are reported that are fair valued at the latest bid price (or yield equivalent thereof) obtained from one or more dealers transacting in a market for such securities or by a pricing service approved by the Portfolio’s Trustees; certain short-term debt securities with maturities of 60 days or less that are fair valued at amortized cost; and equity securities of foreign issuers whose fair value is determined by using systematic fair valuation models provided by independent third parties in order to adjust for stale pricing which may occur between the close of certain foreign exchanges and the close of the NYSE. Other securities that may be categorized as Level 2 in the hierarchy include, but are not limited to, preferred stocks, bank loans, swaps, investments in unregistered investment companies, options, and forward contracts.
Level 3 – Unobservable inputs for the asset or liability to the extent that relevant observable inputs are not available, representing the Portfolio’s own assumptions about the assumptions that a market participant would use in valuing the asset or liability, and that would be based on the best information available.
There have been no significant changes in valuation techniques used in valuing any such positions held by the Portfolio since the beginning of the fiscal year.
The inputs or methodology used for fair valuing securities are not necessarily an indication of the risk associated with investing in those securities. The summary of inputs used as of December 31, 2019 to fair value the Portfolio’s investments in securities and other financial instruments is included in the “Valuation Inputs Summary” in the Notes to Schedule of Investments and Other Information.
Investment Transactions and Investment Income Investment transactions are accounted for as of the date purchased or sold (trade date). Dividend income is recorded on the ex-dividend date. Certain dividends from foreign securities will be recorded as soon as the Portfolio is informed of the dividend, if such information is obtained subsequent to the ex-dividend date. Dividends from foreign securities may be subject to withholding taxes in foreign jurisdictions. Interest income is recorded daily on the accrual basis and includes amortization of premiums and accretion of discounts. The Portfolio classifies gains and losses on prepayments received as an adjustment to interest income. Debt securities may be placed in non-accrual status and related interest income may be reduced by stopping current accruals and writing off interest receivables when collection of all or a portion of interest has become doubtful. Gains and losses are determined on the identified cost basis, which is the same basis used for federal income tax purposes. Income, as well as gains and losses, both realized and unrealized, are allocated daily to each class of shares based upon the ratio of net assets represented by each class as a percentage of total net assets.
Expenses The Portfolio bears expenses incurred specifically on its behalf. Each class of shares bears a portion of general expenses, which are allocated daily to each class of shares based upon the ratio of net assets represented by each class as a percentage of total net assets. Expenses directly attributable to a specific class of shares are charged against the operations of such class.
Estimates The preparation of financial statements in conformity with accounting principles generally accepted in the United States of America requires management to make estimates and assumptions that affect the reported amount of assets and liabilities and disclosure of contingent assets and liabilities at the date of the financial statements, and the reported amounts of income and expenses during the reporting period. Actual results could differ from those estimates.

Janus Henderson VIT Overseas Portfolio Notes to Financial Statements
18 DECEMBER 31, 2019
Indemnifications In the normal course of business, the Portfolio may enter into contracts that contain provisions for indemnification of other parties against certain potential liabilities. The Portfolio’s maximum exposure under these arrangements is unknown, and would involve future claims that may be made against the Portfolio that have not yet occurred. Currently, the risk of material loss from such claims is considered remote.
Foreign Currency Translations The Portfolio does not isolate that portion of the results of operations resulting from the effect of changes in foreign exchange rates on investments from the fluctuations arising from changes in market prices of securities held at the date of the financial statements. Net unrealized appreciation or depreciation of investments and foreign currency translations arise from changes in the value of assets and liabilities, including investments in securities held at the date of the financial statements, resulting from changes in the exchange rates and changes in market prices of securities held.
Currency gains and losses are also calculated on payables and receivables that are denominated in foreign currencies. The payables and receivables are generally related to foreign security transactions and income translations.
Foreign currency-denominated assets and forward currency contracts may involve more risks than domestic transactions, including currency risk, counterparty risk, political and economic risk, regulatory risk and equity risk. Risks may arise from unanticipated movements in the value of foreign currencies relative to the U.S. dollar.
Dividends and Distributions The Portfolio may make semiannual distributions of substantially all of its investment income and an annual distribution of its net realized capital gains (if any).
The Portfolio may make certain investments in real estate investment trusts (“REITs”) which pay dividends to their shareholders based upon funds available from operations. It is quite common for these dividends to exceed the REITs’ taxable earnings and profits, resulting in the excess portion of such dividends being designated as a return of capital. If the Portfolio distributes such amounts, such distributions could constitute a return of capital to shareholders for federal income tax purposes.
Federal Income Taxes The Portfolio intends to continue to qualify as a regulated investment company and distribute all of its taxable income in accordance with the requirements of Subchapter M of the Internal Revenue Code. Management has analyzed the Portfolio’s tax positions taken for all open federal income tax years, generally a three-year period, and has concluded that no provision for federal income tax is required in the Portfolio’s financial statements. The Portfolio is not aware of any tax positions for which it is reasonably possible that the total amounts of unrecognized tax benefits will significantly change in the next twelve months.
2. Derivative Instruments The Portfolio may invest in various types of derivatives, which may at times result in significant derivative exposure. A derivative is a financial instrument whose performance is derived from the performance of another asset. The Portfolio may invest in derivative instruments including, but not limited to: futures contracts, put options, call options, options on future contracts, options on foreign currencies, options on recovery locks, options on security and commodity indices, swaps, forward contracts, structured investments, and other equity-linked derivatives. Each derivative instrument that was held by the Portfolio during the year ended December 31, 2019 is discussed in further detail below. A summary of derivative activity by the Portfolio is reflected in the tables at the end of the Schedule of Investments.
The Portfolio may use derivative instruments for hedging purposes (to offset risks associated with an investment, currency exposure, or market conditions), to adjust currency exposure relative to a benchmark index, or for speculative purposes (to earn income and seek to enhance returns). When the Portfolio invests in a derivative for speculative purposes, the Portfolio will be fully exposed to the risks of loss of that derivative, which may sometimes be greater than the derivative’s cost. The Portfolio may not use any derivative to gain exposure to an asset or class of assets that it would be prohibited by its investment restrictions from purchasing directly. The Portfolio’s ability to use derivative instruments may also be limited by tax considerations.
Investments in derivatives in general are subject to market risks that may cause their prices to fluctuate over time. Investments in derivatives may not directly correlate with the price movements of the underlying instrument. As a result,

Janus Henderson VIT Overseas Portfolio Notes to Financial Statements
Janus Aspen Series 19
the use of derivatives may expose the Portfolio to additional risks that it would not be subject to if it invested directly in the securities underlying those derivatives. The use of derivatives may result in larger losses or smaller gains than otherwise would be the case. Derivatives can be volatile and may involve significant risks.
In pursuit of its investment objective, the Portfolio may seek to use derivatives to increase or decrease exposure to the following market risk factors:
• Commodity Risk – the risk related to the change in value of commodities or commodity-linked investments due to changes in the overall market movements, volatility of the underlying benchmark, changes in interest rates, or other factors affecting a particular industry or commodity such as drought, floods, weather, livestock disease, embargoes, tariffs, and international economic, political, and regulatory developments.
• Counterparty Risk – the risk that the counterparty (the party on the other side of the transaction) on a derivative transaction will be unable to honor its financial obligation to the Portfolio.
• Credit Risk – the risk an issuer will be unable to make principal and interest payments when due, or will default on its obligations.
• Currency Risk – the risk that changes in the exchange rate between currencies will adversely affect the value (in U.S. dollar terms) of an investment.
• Equity Risk – the risk related to the change in value of equity securities as they relate to increases or decreases in the general market.
• Index Risk – if the derivative is linked to the performance of an index, it will be subject to the risks associated with changes in that index. If the index changes, the Portfolio could receive lower interest payments or experience a reduction in the value of the derivative to below what the Portfolio paid. Certain indexed securities, including inverse securities (which move in an opposite direction to the index), may create leverage, to the extent that they increase or decrease in value at a rate that is a multiple of the changes in the applicable index.
• Interest Rate Risk – the risk that the value of fixed-income securities will generally decline as prevailing interest rates rise, which may cause the Portfolio’s NAV to likewise decrease.
• Leverage Risk – the risk associated with certain types of leveraged investments or trading strategies pursuant to which relatively small market movements may result in large changes in the value of an investment. The Portfolio creates leverage by investing in instruments, including derivatives, where the investment loss can exceed the original amount invested. Certain investments or trading strategies, such as short sales, that involve leverage can result in losses that greatly exceed the amount originally invested.
• Liquidity Risk – the risk that certain securities may be difficult or impossible to sell at the time that the seller would like or at the price that the seller believes the security is currently worth.
Derivatives may generally be traded OTC or on an exchange. Derivatives traded OTC are agreements that are individually negotiated between parties and can be tailored to meet a purchaser’s needs. OTC derivatives are not guaranteed by a clearing agency and may be subject to increased credit risk.
In an effort to mitigate credit risk associated with derivatives traded OTC, the Portfolio may enter into collateral agreements with certain counterparties whereby, subject to certain minimum exposure requirements, the Portfolio may require the counterparty to post collateral if the Portfolio has a net aggregate unrealized gain on all OTC derivative contracts with a particular counterparty. Additionally, the Portfolio may deposit cash and/or treasuries as collateral with the counterparty and/or custodian daily (based on the daily valuation of the financial asset) if the Portfolio has a net aggregate unrealized loss on OTC derivative contracts with a particular counterparty. All liquid securities and restricted cash are considered to cover in an amount at all times equal to or greater than the Portfolio’s commitment with respect to certain exchange-traded derivatives, centrally cleared derivatives, forward foreign currency exchange contracts, short sales, and/or securities with extended settlement dates. There is no guarantee that counterparty exposure is reduced and these arrangements are dependent on Janus Capital Management LLC's (“Janus Capital”) ability to establish and maintain appropriate systems and trading.

Janus Henderson VIT Overseas Portfolio Notes to Financial Statements
20 DECEMBER 31, 2019
Options Contracts An options contract provides the purchaser with the right, but not the obligation, to buy (call option) or sell (put option) a financial instrument at an agreed upon price on or before a specified date. The purchaser pays a premium to the seller for this right. The seller has the corresponding obligation to sell or buy a financial instrument if the purchaser (owner) "exercises" the option. When an option is exercised, the proceeds on sales for a written call option, the purchase cost for a written put option, or the cost of the security for a purchased put or call option are adjusted by the amount of premium received or paid. Upon expiration, or closing of the option transaction, a realized gain or loss is reported on the Statement of Operations (if applicable). The difference between the premium paid/received and the market value of the option is recorded as unrealized appreciation or depreciation. The net change in unrealized appreciation or depreciation is reported on the Statement of Operations (if applicable). Option contracts are typically valued using an approved vendor’s option valuation model. To the extent reliable market quotations are available, option contracts are valued using market quotations. In cases when an approved vendor cannot provide coverage for an option and there is no reliable market quotation, a broker quotation or an internal valuation using the Black-Scholes model, the Cox-Rubinstein Binomial Option Pricing Model, or other appropriate option pricing model is used. Certain options contracts are marked-to-market daily, and the daily variation margin is recorded as a receivable or payable on the Statement of Assets and Liabilities as “Variation margin receivable” or “Variation margin payable” (if applicable).
The Portfolio may use options contracts to hedge against changes in interest rates, the values of equities, or foreign currencies. The Portfolio generally invests in options to hedge against adverse movements in the value of portfolio holdings. The use of such instruments may involve certain additional risks as a result of unanticipated movements in the market. A lack of correlation between the value of an instrument underlying an option and the asset being hedged, or unexpected adverse price movements, could render the Portfolio’s hedging strategy unsuccessful. In addition, there can be no assurance that a liquid secondary market will exist for any option purchased or sold. The Portfolio may be subject to counterparty risk, interest rate risk, liquidity risk, equity risk, commodity risk, and currency risk in the normal course of pursuing its investment objective through its investments in options contracts.
Options traded on an exchange are regulated and the terms of the options are standardized. Options traded OTC expose the Portfolio to counterparty risk in the event that the counterparty does not perform. This risk is mitigated by having a netting arrangement between the Portfolio and the counterparty and by having the counterparty post collateral to cover the Portfolio’s exposure to the counterparty.
In writing an option, the Portfolio bears the risk of an unfavorable change in the price of the security underlying the written option. When an option is written, the Portfolio receives a premium and becomes obligated to sell or purchase the underlying security at a fixed price, upon exercise of the option. Options written are reported as a liability on the Statement of Assets and Liabilities as “Options written, at value” (if applicable). The risk in writing call options is that the Portfolio gives up the opportunity for profit if the market price of the security increases and the options are exercised. The risk in writing put options is that the Portfolio may incur a loss if the market price of the security decreases and the options are exercised. The risk in buying options is that the Portfolio pays a premium whether or not the options are exercised. Exercise of an option written by the Portfolio could result in the Portfolio buying or selling a security at a price different from the current market value.
During the year, the Portfolio wrote call options on various equity securities for the purpose of decreasing exposure to individual equity risk and/or generating income.
There were no written options held at December 31, 2019.
3. Other Investments and Strategies
Additional Investment Risk In the aftermath of the 2007-2008 financial crisis, the financial sector experienced reduced liquidity in credit and other fixed-income markets, and an unusually high degree of volatility, both domestically and internationally. In response to the crisis, the United States and certain foreign governments, along with the U.S. Federal Reserve and certain foreign central banks, took steps to support the financial markets. For example, the enactment of the Dodd-Frank Act in 2010 provided for widespread regulation of financial institutions, consumer financial products and services, broker-dealers, over-the-counter derivatives, investment advisers, credit rating agencies, and mortgage lending, which expanded federal oversight in the financial sector, including the investment management industry. The withdrawal of this support, a failure of measures put in place to respond to the crisis, or investor perception that such efforts were not sufficient could each

Janus Henderson VIT Overseas Portfolio Notes to Financial Statements
Janus Aspen Series 21
negatively affect financial markets generally, and the value and liquidity of specific securities. In addition, policy and legislative changes in the United States and in other countries continue to impact many aspects of financial regulation.
A number of countries in the European Union (“EU”) have experienced, and may continue to experience, severe economic and financial difficulties. In particular, many EU nations are susceptible to economic risks associated with high levels of debt. Many non-governmental issuers, and even certain governments, have defaulted on, or been forced to restructure, their debts. Many other issuers have faced difficulties obtaining credit or refinancing existing obligations. Financial institutions have in many cases required government or central bank support, have needed to raise capital, and/or have been impaired in their ability to extend credit. As a result, financial markets in the EU experienced extreme volatility and declines in asset values and liquidity. Responses to these financial problems by European governments, central banks, and others, including austerity measures and reforms, may not work, may result in social unrest, and may limit future growth and economic recovery or have other unintended consequences. The risk of investing in securities in the European markets may also be heightened due to the referendum in which the United Kingdom voted to exit the EU (commonly known as “Brexit”). There is considerable uncertainty about how Brexit will be conducted, how negotiations of necessary treaties and trade agreements will conclude, or how financial markets will react.
Certain areas of the world have historically been prone to and economically sensitive to environmental events such as, but not limited to, hurricanes, earthquakes, typhoons, flooding, tidal waves, tsunamis, erupting volcanoes, wildfires or droughts, tornadoes, mudslides, or other weather-related phenomena. Such disasters, and the resulting physical or economic damage, could have a severe and negative impact on the Portfolio’s investment portfolio and, in the longer term, could impair the ability of issuers in which the Portfolio invests to conduct their businesses as they would under normal conditions. Adverse weather conditions may also have a particularly significant negative effect on issuers in the agricultural sector and on insurance companies that insure against the impact of natural disasters.
Counterparties Portfolio transactions involving a counterparty are subject to the risk that the counterparty or a third party will not fulfill its obligation to the Portfolio (“counterparty risk”). Counterparty risk may arise because of the counterparty’s financial condition (i.e., financial difficulties, bankruptcy, or insolvency), market activities and developments, or other reasons, whether foreseen or not. A counterparty’s inability to fulfill its obligation may result in significant financial loss to the Portfolio. The Portfolio may be unable to recover its investment from the counterparty or may obtain a limited recovery, and/or recovery may be delayed. The extent of the Portfolio’s exposure to counterparty risk with respect to financial assets and liabilities approximates its carrying value.
The Portfolio may be exposed to counterparty risk through participation in various programs, including, but not limited to, lending its securities to third parties, cash sweep arrangements whereby the Portfolio’s cash balance is invested in one or more types of cash management vehicles, as well as investments in, but not limited to, repurchase agreements, debt securities, and derivatives, including various types of swaps, futures and options. The Portfolio intends to enter into financial transactions with counterparties that Janus Capital believes to be creditworthy at the time of the transaction. There is always the risk that Janus Capital’s analysis of a counterparty’s creditworthiness is incorrect or may change due to market conditions. To the extent that the Portfolio focuses its transactions with a limited number of counterparties, it will have greater exposure to the risks associated with one or more counterparties.
Emerging Market Investing Within the parameters of its specific investment policies, the Portfolio may invest in securities of issuers or companies from or with exposure to one or more “developing countries” or “emerging market countries.” To the extent that the Portfolio invests a significant amount of its assets in one or more of these countries, its returns and net asset value may be affected to a large degree by events and economic conditions in such countries. The risks of foreign investing are heightened when investing in emerging markets, which may result in the price of investments in emerging markets experiencing sudden and sharp price swings. In many developing markets, there is less government supervision and regulation of business and industry practices (including the potential lack of strict finance and accounting controls and standards), stock exchanges, brokers, and listed companies, making these investments potentially more volatile in price and less liquid than investments in developed securities markets, resulting in greater risk to investors. There is a risk in developing countries that a future economic or political crisis could lead to price controls, forced mergers of companies, expropriation or confiscatory taxation, imposition or enforcement of foreign ownership limits, seizure, nationalization, sanctions or imposition of restrictions by various governmental entities on investment and trading, or creation of government monopolies, any of which may have a detrimental effect on the Portfolio’s investments. In addition, the Portfolio’s investments may be denominated in foreign currencies and therefore, changes in the value of a country’s

Janus Henderson VIT Overseas Portfolio Notes to Financial Statements
22 DECEMBER 31, 2019
currency compared to the U.S. dollar may affect the value of the Portfolio’s investments. To the extent that the Portfolio invests a significant portion of its assets in the securities of issuers in or companies of a single country or region, it is more likely to be impacted by events or conditions affecting that country or region, which could have a negative impact on the Portfolio’s performance.
Securities Lending Under procedures adopted by the Trustees, the Portfolio may seek to earn additional income by lending securities to certain qualified broker-dealers and institutions. Effective December 16, 2019, JPMorgan Chase Bank, National Association replaced Deutsche Bank AG as securities lending agent for the Portfolio. JPMorgan Chase Bank, National Association acts as securities lending agent and a limited purpose custodian or subcustodian to receive and disburse cash balances and cash collateral, hold short-term investments, hold collateral, and perform other custodian functions in accordance with the Non-Custodial Securities Lending Agreement. The Portfolio may lend portfolio securities in an amount equal to up to 1/3 of its total assets as determined at the time of the loan origination. There is the risk of delay in recovering a loaned security or the risk of loss in collateral rights if the borrower fails financially. In addition, Janus Capital makes efforts to balance the benefits and risks from granting such loans. All loans will be continuously secured by collateral which may consist of cash, U.S. Government securities, domestic and foreign short-term debt instruments, letters of credit, time deposits, repurchase agreements, money market mutual funds or other money market accounts, or such other collateral as permitted by the SEC. If the Portfolio is unable to recover a security on loan, the Portfolio may use the collateral to purchase replacement securities in the market. There is a risk that the value of the collateral could decrease below the cost of the replacement security by the time the replacement investment is made, resulting in a loss to the Portfolio. In certain circumstances individual loan transactions could yield negative returns.
Upon receipt of cash collateral, Janus Capital may invest it in affiliated or non-affiliated cash management vehicles, whether registered or unregistered entities, as permitted by the 1940 Act and rules promulgated thereunder. Janus Capital currently intends to primarily invest the cash collateral in a cash management vehicle for which Janus Capital serves as investment adviser, Janus Henderson Cash Collateral Fund LLC. An investment in Janus Henderson Cash Collateral Fund LLC is generally subject to the same risks that shareholders experience when investing in similarly structured vehicles, such as the potential for significant fluctuations in assets as a result of the purchase and redemption activity of the securities lending program, a decline in the value of the collateral, and possible liquidity issues. Such risks may delay the return of the cash collateral and cause the Portfolio to violate its agreement to return the cash collateral to a borrower in a timely manner. As adviser to the Portfolio and Janus Henderson Cash Collateral Fund LLC, Janus Capital has an inherent conflict of interest as a result of its fiduciary duties to both the Portfolio and Janus Henderson Cash Collateral Fund LLC. Additionally, Janus Capital receives an investment advisory fee of 0.05% for managing Janus Henderson Cash Collateral Fund LLC, but it may not receive a fee for managing certain other affiliated cash management vehicles in which the Portfolio may invest, and therefore may have an incentive to allocate preferred investment opportunities to investment vehicles for which it is receiving a fee.
The value of the collateral must be at least 102% of the market value of the loaned securities that are denominated in U.S. dollars and 105% of the market value of the loaned securities that are not denominated in U.S. dollars. Loaned securities and related collateral are marked-to-market each business day based upon the market value of the loaned securities at the close of business, employing the most recent available pricing information. Collateral levels are then adjusted based on this mark-to-market evaluation.
The cash collateral invested by Janus Capital is disclosed in the Schedule of Investments (if applicable). Income earned from the investment of the cash collateral, net of rebates paid to, or fees paid by, borrowers and less the fees paid to the lending agent are included as “Affiliated securities lending income, net” on the Statement of Operations.
There were no securities on loan as of December 31, 2019.
4. Investment Advisory Agreements and Other Transactions with Affiliates The Portfolio pays Janus Capital an investment advisory fee which is calculated daily and paid monthly. The Portfolio’s “base” fee rate prior to any performance adjustment (expressed as an annual rate) is 0.64%.
The investment advisory fee rate is determined by calculating a base fee and applying a performance adjustment. The base fee rate is the same as the contractual investment advisory fee rate. The performance adjustment either increases or decreases the base fee depending on how well the Portfolio has performed relative to its benchmark index. The Portfolio's benchmark index used in the calculation is the MSCI All Country World ex-U.S. Index.

Janus Henderson VIT Overseas Portfolio Notes to Financial Statements
Janus Aspen Series 23
The calculation of the performance adjustment applies as follows:
Investment Advisory Fee = Base Fee Rate +/- Performance Adjustment
The investment advisory fee rate paid to Janus Capital by the Portfolio consists of two components: (1) a base fee calculated by applying the contractual fixed rate of the advisory fee to the Portfolio’s average daily net assets during the previous month (“Base Fee Rate”), plus or minus (2) a performance-fee adjustment (“Performance Adjustment”) calculated by applying a variable rate of up to 0.15% (positive or negative) to the Portfolio’s average daily net assets based on the Portfolio’s relative performance compared to the cumulative investment record of its benchmark index over a 36-month performance measurement period or shorter time period, as applicable. The investment performance of a Portfolio’s Service Shares for the performance measurement period is used to calculate the Performance Adjustment. No Performance Adjustment is applied unless the difference between the Portfolio’s investment performance and the cumulative investment record of the Portfolio’s benchmark index is 0.50% or greater (positive or negative) during the applicable performance measurement period.
The Portfolio’s prospectuses and statement(s) of additional information contain additional information about performance-based fees. The amount shown as advisory fees on the Statement of Operations reflects the Base Fee Rate plus/minus any Performance Adjustment. For the year ended December 31, 2019, the performance adjusted investment advisory fee rate before any waivers and/or reimbursements of expenses is 0.64%.
Janus Services LLC (“Janus Services”), a wholly-owned subsidiary of Janus Capital, is the Portfolio’s transfer agent. Janus Services receives an administrative services fee at an annual rate of 0.05% of the average daily net assets of the Portfolio for arranging for the provision by participating insurance companies and qualified plan service providers of administrative services, including recordkeeping, subaccounting, order processing, or other shareholder services provided on behalf of contract holders or plan participants investing in the Portfolio. Other shareholder services may include the provision of order confirmations, periodic account statements, forwarding prospectuses, shareholder reports, and other materials to existing investors, and answering inquiries regarding accounts. Janus Services expects to use this entire fee to compensate insurance companies and qualified plan service providers for providing these services to their customers who invest in the Portfolio. Any unused portion will be reimbursed to the applicable share class at least annually.
In addition, Janus Services provides or arranges for the provision of certain other internal administrative, recordkeeping, and shareholder relations services for the Portfolio. Janus Services is not compensated for these internal services related to the shares, except for out-of-pocket costs. These amounts are disclosed as “Other transfer agent fees and expenses” on the Statement of Operations.
Under a distribution and shareholder servicing plan (the “Plan”) adopted in accordance with Rule 12b-1 under the 1940 Act, the Service Shares may pay the Trust’s distributor, Janus Distributors LLC (“Janus Distributors”), a wholly-owned subsidiary of Janus Capital, a fee for the sale and distribution and/or shareholder servicing of the Service Shares at an annual rate of up to 0.25% of the average daily net assets of the Service Shares. Under the terms of the Plan, the Trust is authorized to make payments to Janus Distributors for remittance to insurance companies and qualified plan service providers as compensation for distribution and/or shareholder services performed by such entities. These amounts are disclosed as “12b-1 Distribution and shareholder servicing fees” on the Statement of Operations. Payments under the Plan are not tied exclusively to actual 12b-1 distribution and servicing fees, and the payments may exceed 12b-1 distribution and servicing fees actually incurred. If any of the Portfolio’s actual 12b-1 distribution and servicing fees incurred during a calendar year are less than the payments made during a calendar year, the Portfolio will be refunded the difference. Refunds, if any, are included in “12b-1 Distribution and shareholder servicing fees” in the Statement of Operations.
Janus Capital serves as administrator to the Portfolio pursuant to an administration agreement between Janus Capital and the Trust. Under the administration agreement, Janus Capital is obligated to provide or arrange for the provision of certain administration, compliance, and accounting services to the Portfolio, including providing office space for the Portfolio, and is reimbursed by the Portfolio for certain of its costs in providing these services (to the extent Janus Capital seeks reimbursement and such costs are not otherwise waived). In addition, employees of Janus Capital and/or its affiliates may serve as officers of the Trust. The Portfolio pays for some or all of the salaries, fees, and expenses of Janus Capital employees and Portfolio officers, with respect to certain specified administration functions they perform on behalf of the Portfolio. The Portfolio pays these costs based on out-of-pocket expenses incurred by Janus Capital, and these costs are separate and apart from advisory fees and other expenses paid in connection with the investment

Janus Henderson VIT Overseas Portfolio Notes to Financial Statements
24 DECEMBER 31, 2019
advisory services Janus Capital (or any subadvisor, as applicable) provides to the Portfolio. These amounts are disclosed as “Affiliated portfolio administration fees” on the Statement of Operations. In addition, some expenses related to compensation payable to the Portfolio’s Chief Compliance Officer and certain compliance staff, all of whom are employees of Janus Capital and/or its affiliates, are shared with the Portfolio. Total compensation of $40,392 was paid to the Chief Compliance Officer and certain compliance staff by the Trust during the year ended December 31, 2019. The Portfolio's portion is reported as part of “Other expenses” on the Statement of Operations.
The Board of Trustees has adopted a deferred compensation plan (the “Deferred Plan”) for independent Trustees to elect to defer receipt of all or a portion of the annual compensation they are entitled to receive from the Portfolio. All deferred fees are credited to an account established in the name of the Trustees. The amounts credited to the account then increase or decrease, as the case may be, in accordance with the performance of one or more of the Janus Henderson funds that are selected by the Trustees. The account balance continues to fluctuate in accordance with the performance of the selected fund or funds until final payment of all amounts are credited to the account. The fluctuation of the account balance is recorded by the Portfolio as unrealized appreciation/(depreciation) and is included as of December 31, 2019 on the Statement of Assets and Liabilities in the asset, “Non-interested Trustees’ deferred compensation,” and liability, “Non-interested Trustees’ deferred compensation fees.” Additionally, the recorded unrealized appreciation/(depreciation) is included in “Total distributable earnings (loss)” on the Statement of Assets and Liabilities. Deferred compensation expenses for the year ended December 31, 2019 are included in “Non-interested Trustees’ fees and expenses” on the Statement of Operations. Trustees are allowed to change their designation of mutual funds from time to time. Amounts will be deferred until distributed in accordance with the Deferred Plan. Deferred fees of $468,050 were paid by the Trust to the Trustees under the Deferred Plan during the year ended December 31, 2019.
Pursuant to the provisions of the 1940 Act and related rules, the Portfolio may participate in an affiliated or non-affiliated cash sweep program. In the cash sweep program, uninvested cash balances of the Portfolio may be used to purchase shares of affiliated or non-affiliated money market funds or cash management pooled investment vehicles that operate as money market funds. The Portfolio is eligible to participate in the cash sweep program (the “Investing Funds”). As adviser, Janus Capital Management LLC (“Janus Capital”) has an inherent conflict of interest because of its fiduciary duties to the affiliated money market funds or cash management pooled investment vehicles and the Investing Funds. Janus Henderson Cash Liquidity Fund LLC (the “Sweep Vehicle”) is an affiliated unregistered cash management pooled investment vehicle that invests primarily in highly-rated short-term fixed-income securities. The Sweep Vehicle operates pursuant to the provisions of the 1940 Act that govern the operation of money market funds and prices its shares at NAV reflecting market-based values of its portfolio securities (i.e., a “floating” NAV) rounded to the fourth decimal place (e.g., $1.0000). The Sweep Vehicle is permitted to impose a liquidity fee (of up to 2%) on redemptions from the Sweep Vehicle or a redemption gate that temporarily suspends redemptions from the Sweep Vehicle for up to 10 business days during a 90 day period. There are no restrictions on the Portfolio's ability to withdraw investments from the Sweep Vehicle at will, and there are no unfunded capital commitments due from the Portfolio to the Sweep Vehicle. The Sweep Vehicle does not charge any management fee, sales charge or service fee.
Any purchases and sales, realized gains/losses and recorded dividends from affiliated investments during the year ended December 31, 2019 can be found in the “Schedules of Affiliated Investments” located in the Schedule of Investments.

Janus Henderson VIT Overseas Portfolio Notes to Financial Statements
Janus Aspen Series 25
5. Federal Income Tax The tax components of capital shown in the table below represent: (1) distribution requirements the Portfolio must satisfy under the income tax regulations; (2) losses or deductions the Portfolio may be able to offset against income and gains realized in future years; and (3) unrealized appreciation or depreciation of investments for federal income tax purposes (reduced by foreign tax liability).
Other book to tax differences primarily consist of deferred compensation and foreign currency contract adjustments. The Portfolio has elected to treat gains and losses on forward foreign currency contracts as capital gains and losses, if applicable. Other foreign currency gains and losses on debt instruments are treated as ordinary income for federal income tax purposes pursuant to Section 988 of the Internal Revenue Code.
Loss Deferrals Other Book Net Tax Undistributed
Ordinary IncomeUndistributed
Long-Term GainsAccumulated
Capital LossesLate-Year
Ordinary LossPost-October Capital Loss
to Tax Differences
Appreciation/ (Depreciation)
$ 2,465,538 $ - $(361,653,802) $ - $ - $ (24,283) $157,595,763
Accumulated capital losses noted below represent net capital loss carryovers, as of December 31, 2019, that may be available to offset future realized capital gains and thereby reduce future taxable gains distributions. The following table shows these capital loss carryovers.
Capital Loss Carryover Schedule For the year ended December 31, 2019 No Expiration
Short-Term Long-TermAccumulated
Capital Losses $(48,973,659) $(312,680,143) $ (361,653,802)
During the year ended December 31, 2019, capital loss carryovers of $35,052,266 were utilized by the Portfolio.
The aggregate cost of investments and the composition of unrealized appreciation and depreciation of investment securities for federal income tax purposes as of December 31, 2019 are noted below. The primary differences between book and tax appreciation or depreciation of investments are wash sale loss deferrals and investments in partnerships.
Federal Tax Cost Unrealized
AppreciationUnrealized
(Depreciation)Net Tax Appreciation/
(Depreciation) $ 546,513,408 $176,814,788 $(18,856,985) $ 157,957,803
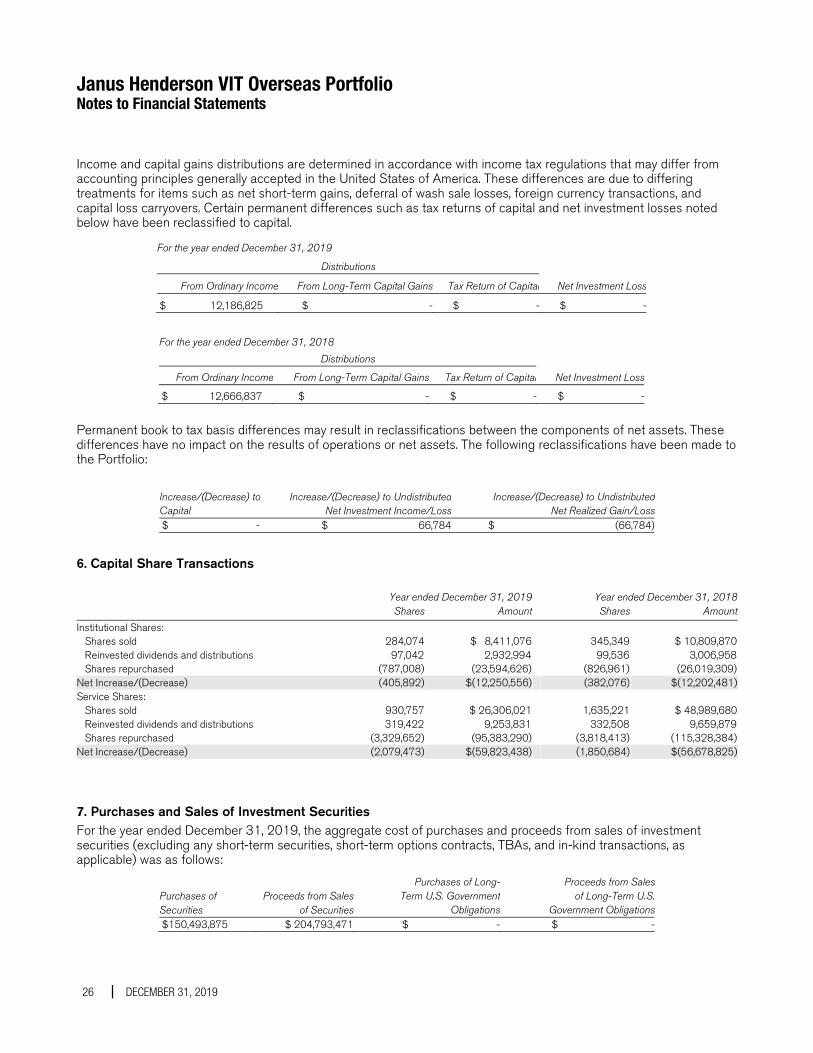
Janus Henderson VIT Overseas Portfolio Notes to Financial Statements
26 DECEMBER 31, 2019
Income and capital gains distributions are determined in accordance with income tax regulations that may differ from accounting principles generally accepted in the United States of America. These differences are due to differing treatments for items such as net short-term gains, deferral of wash sale losses, foreign currency transactions, and capital loss carryovers. Certain permanent differences such as tax returns of capital and net investment losses noted below have been reclassified to capital.
For the year ended December 31, 2019 Distributions
From Ordinary Income From Long-Term Capital Gains Tax Return of Capital Net Investment Loss
$ 12,186,825 $ - $ - $ -
For the year ended December 31, 2018 Distributions
From Ordinary Income From Long-Term Capital Gains Tax Return of Capital Net Investment Loss $ 12,666,837 $ - $ - $ -
Permanent book to tax basis differences may result in reclassifications between the components of net assets. These differences have no impact on the results of operations or net assets. The following reclassifications have been made to the Portfolio:
Increase/(Decrease) to Capital
Increase/(Decrease) to UndistributedNet Investment Income/Loss
Increase/(Decrease) to Undistributed Net Realized Gain/Loss
$ - $ 66,784 $ (66,784)
6. Capital Share Transactions Year ended December 31, 2019 Year ended December 31, 2018 Shares Amount Shares Amount
Institutional Shares: Shares sold 284,074 $ 8,411,076 345,349 $ 10,809,870 Reinvested dividends and distributions 97,042 2,932,994 99,536 3,006,958 Shares repurchased (787,008) (23,594,626) (826,961) (26,019,309)Net Increase/(Decrease) (405,892) $(12,250,556) (382,076) $(12,202,481)Service Shares: Shares sold 930,757 $ 26,306,021 1,635,221 $ 48,989,680 Reinvested dividends and distributions 319,422 9,253,831 332,508 9,659,879 Shares repurchased (3,329,652) (95,383,290) (3,818,413) (115,328,384)Net Increase/(Decrease) (2,079,473) $(59,823,438) (1,850,684) $(56,678,825)
7. Purchases and Sales of Investment Securities For the year ended December 31, 2019, the aggregate cost of purchases and proceeds from sales of investment securities (excluding any short-term securities, short-term options contracts, TBAs, and in-kind transactions, as applicable) was as follows:
Purchases of Securities
Proceeds from Salesof Securities
Purchases of Long-Term U.S. Government
Obligations
Proceeds from Sales of Long-Term U.S.
Government Obligations $150,493,875 $ 204,793,471 $ - $ -

Janus Henderson VIT Overseas Portfolio Notes to Financial Statements
Janus Aspen Series 27
8. Recent Accounting Pronouncements The FASB issued Accounting Standards Update 2018-13, Fair Value Measurement (Topic 820), in August 2018. The new guidance removes, modifies and enhances the disclosures to Topic 820. For public entities, the amendments are effective for financial statements issued for fiscal years beginning after December 15, 2019, and interim periods within those fiscal years. An entity is permitted, and Management has decided, to early adopt the removed and modified disclosures in these financial statements.
9. Subsequent Event Management has evaluated whether any events or transactions occurred subsequent to December 31, 2019 and through the date of issuance of the Portfolio’s financial statements and determined that there were no material events or transactions that would require recognition or disclosure in the Portfolio’s financial statements.

Janus Henderson VIT Overseas Portfolio Report of Independent Registered Public Accounting Firm
28 DECEMBER 31, 2019
To the Board of Trustees of Janus Aspen Series and Shareholders of Janus Henderson VIT Overseas Portfolio
Opinion on the Financial Statements We have audited the accompanying statement of assets and liabilities, including the schedule of investments, of Janus Henderson VIT Overseas Portfolio (one of the portfolios constituting Janus Aspen Series, referred to hereafter as the "Portfolio") as of December 31, 2019, the related statement of operations for the year ended December 31, 2019, the statements of changes in net assets for each of the two years in the period ended December 31, 2019, including the related notes, and the financial highlights for each of the five years in the period ended December 31, 2019 (collectively referred to as the “financial statements”). In our opinion, the financial statements present fairly, in all material respects, the financial position of the Portfolio as of December 31, 2019, the results of its operations for the year then ended, the changes in its net assets for each of the two years in the period ended December 31, 2019 and the financial highlights for each of the five years in the period ended December 31, 2019 in conformity with accounting principles generally accepted in the United States of America.
Basis for Opinion These financial statements are the responsibility of the Portfolio’s management. Our responsibility is to express an opinion on the Portfolio’s financial statements based on our audits. We are a public accounting firm registered with the Public Company Accounting Oversight Board (United States) (PCAOB) and are required to be independent with respect to the Portfolio in accordance with the U.S. federal securities laws and the applicable rules and regulations of the Securities and Exchange Commission and the PCAOB.
We conducted our audits of these financial statements in accordance with the standards of the PCAOB. Those standards require that we plan and perform the audit to obtain reasonable assurance about whether the financial statements are free of material misstatement, whether due to error or fraud.
Our audits included performing procedures to assess the risks of material misstatement of the financial statements, whether due to error or fraud, and performing procedures that respond to those risks. Such procedures included examining, on a test basis, evidence regarding the amounts and disclosures in the financial statements. Our audits also included evaluating the accounting principles used and significant estimates made by management, as well as evaluating the overall presentation of the financial statements. Our procedures included confirmation of securities owned as of December 31, 2019 by correspondence with the custodian, transfer agent, and brokers; when replies were not received from brokers, we performed other auditing procedures. We believe that our audits provide a reasonable basis for our opinion.
Denver, Colorado February 14, 2020
We have served as the auditor of one or more investment companies in Janus Henderson Funds since 1990.
Janus Henderson VIT Overseas Portfolio Additional Information (unaudited)
Janus Aspen Series 29
Proxy Voting Policies and Voting Record A description of the policies and procedures that the Portfolio uses to determine how to vote proxies relating to its portfolio securities is available without charge: (i) upon request, by calling 1-800-525-1093; (ii) on the Portfolio’s website at janushenderson.com/proxyvoting; and (iii) on the SEC’s website at http://www.sec.gov. Additionally, information regarding the Portfolio’s proxy voting record for the most recent twelve-month period ended June 30 is also available, free of charge, through janushenderson.com/proxyvoting and from the SEC’s website at http://www.sec.gov.
Full Holdings The Portfolio is required to disclose its complete holdings as an exhibit to Form N-PORT within 60 days of the end of the first and third fiscal quarters, and in the annual report and semiannual report to Portfolio shareholders. Historically, the Portfolio filed its complete portfolio holdings (schedule of investments) with the SEC for the first and third quarters each fiscal year on Form N-Q. The Portfolio’s Form N-PORT and Form N-Q filings: (i) are available on the SEC’s website at http://www.sec.gov; (ii) may be reviewed and copied at the SEC’s Public Reference Room in Washington, D.C. (information on the Public Reference Room may be obtained by calling 1-800-SEC-0330); and (iii) are available without charge, upon request, by calling a Janus Henderson representative at 1-877-335-2687 (toll free) . Portfolio holdings consisting of at least the names of the holdings are generally available on a monthly basis with a 30-day lag. Holdings are generally posted approximately two business days thereafter under Full Holdings for the Portfolio at janushenderson.com/vit.
APPROVAL OF ADVISORY AGREEMENTS DURING THE PERIOD The Trustees of Janus Aspen Series, each of whom serves as an “independent” Trustee (the “Trustees”), oversee the management of each Portfolio of Janus Aspen Series (each, a “VIT Portfolio,” and collectively, the “VIT Portfolios”), as well as each Fund of Janus Investment Fund (together with the VIT Portfolios, the “Janus Henderson Funds,” and each, a “Janus Henderson Fund”). As required by law, the Trustees determine annually whether to continue the investment advisory agreement for each Janus Henderson Fund and the subadvisory agreements for the Janus Henderson Funds that utilize subadvisers.
In connection with their most recent consideration of those agreements for each Janus Henderson Fund, the Trustees received and reviewed information provided by Janus Capital and the respective subadvisers in response to requests of the Trustees and their independent legal counsel. They also received and reviewed information and analysis provided by, and in response to requests of, their independent fee consultant. Throughout their consideration of the agreements, the Trustees were advised by their independent legal counsel. The Trustees met with management to consider the agreements, and also met separately in executive session with their independent legal counsel and their independent fee consultant.
At a meeting held on December 5, 2019, based on the Trustees’ evaluation of the information provided by Janus Capital, the subadvisers, and the independent fee consultant, as well as other information, the Trustees determined that the overall arrangements between each Janus Henderson Fund and Janus Capital and each subadviser, as applicable, were fair and reasonable in light of the nature, extent and quality of the services provided by Janus Capital, its affiliates and the subadvisers, the fees charged for those services, and other matters that the Trustees considered relevant in the exercise of their business judgment. At that meeting, the Trustees unanimously approved the continuation of the investment advisory agreement for each Janus Henderson Fund, and the subadvisory agreement for each subadvised Janus Henderson Fund, for the period from February 1, 2020 through February 1, 2021, subject to earlier termination as provided for in each agreement.
In considering the continuation of those agreements, the Trustees reviewed and analyzed various factors that they determined were relevant, including the factors described below, none of which by itself was considered dispositive. However, the material factors and conclusions that formed the basis for the Trustees’ determination to approve the continuation of the agreements are discussed separately below. Also included is a summary of the independent fee consultant’s conclusions and opinions that arose during, and were included as part of, the Trustees’ consideration of the agreements. “Management fees,” as used herein, reflect actual annual advisory fees and, for the purpose of peer comparisons, any administration fees (excluding out of pocket costs), net of any waivers, paid by a fund as a percentage of average net assets.

Janus Henderson VIT Overseas Portfolio Additional Information (unaudited)
30 DECEMBER 31, 2019
Nature, Extent and Quality of Services The Trustees reviewed the nature, extent and quality of the services provided by Janus Capital and the subadvisers to the Janus Henderson Funds, taking into account the investment objective, strategies and policies of each Janus Henderson Fund, and the knowledge the Trustees gained from their regular meetings with management on at least a quarterly basis and their ongoing review of information related to the Janus Henderson Funds. In addition, the Trustees reviewed the resources and key personnel of Janus Capital and each subadviser, particularly noting those employees who provide investment and risk management services to the Janus Henderson Funds. The Trustees also considered other services provided to the Janus Henderson Funds by Janus Capital or the subadvisers, such as managing the execution of portfolio transactions and the selection of broker-dealers for those transactions. The Trustees considered Janus Capital’s role as administrator to the Janus Henderson Funds, noting that Janus Capital generally does not receive a fee for its services but is reimbursed for its out-of-pocket costs. The Trustees considered the role of Janus Capital in monitoring adherence to the Janus Henderson Funds’ investment restrictions, providing support services for the Trustees and Trustee committees, and overseeing communications with shareholders and the activities of other service providers, including monitoring compliance with various policies and procedures of the Janus Henderson Funds and with applicable securities laws and regulations.
In this regard, the independent fee consultant noted that Janus Capital provides a number of different services for the Janus Henderson Funds and fund shareholders, ranging from investment management services to various other servicing functions, and that, in its view, Janus Capital is a capable provider of those services. The independent fee consultant also provided its belief that Janus Capital has developed a number of institutional competitive advantages that should enable it to provide superior investment and service performance over the long term.
The Trustees concluded that the nature, extent and quality of the services provided by Janus Capital or the subadviser to each Janus Henderson Fund were appropriate and consistent with the terms of the respective advisory and subadvisory agreements, and that, taking into account steps taken to address those Janus Henderson Funds whose performance lagged that of their peers for certain periods, the Janus Henderson Funds were likely to benefit from the continued provision of those services. They also concluded that Janus Capital and each subadviser had sufficient personnel, with the appropriate education and experience, to serve the Janus Henderson Funds effectively and had demonstrated its ability to attract well-qualified personnel.
Performance of the Funds The Trustees considered the performance results of each Janus Henderson Fund over various time periods. They noted that they considered Janus Henderson Fund performance data throughout the year, including periodic meetings with each Janus Henderson Fund’s portfolio manager(s), and also reviewed information comparing each Janus Henderson Fund’s performance with the performance of comparable funds and peer groups identified by Broadridge Financial Solutions, Inc. (“Broadridge”), an independent data provider, and with the Janus Henderson Fund’s benchmark index. In this regard, the independent fee consultant found that the overall Janus Henderson Funds’ performance has been reasonable: for the 36 months ended September 30, 2019, approximately 69% of the Janus Henderson Funds were in the top two quartiles of performance, as reported by Morningstar, and for the 12 months ended September 30, 2019, approximately 71% of the Janus Henderson Funds were in the top two quartiles of performance, as reported by Morningstar.
The Trustees considered the performance of each Janus Henderson Fund, noting that performance may vary by share class, and noted the following with respect to the VIT Portfolios:
• For Janus Henderson Balanced Portfolio, the Trustees noted that the Fund’s performance was in the first Broadridge quartile for the 36 months ended May 31, 2019 and the first Broadridge quartile for the 12 months ended May 31, 2019.
• For Janus Henderson Enterprise Portfolio, the Trustees noted that the Fund’s performance was in the second Broadridge quartile for the 36 months ended May 31, 2019 and the first Broadridge quartile for the 12 months ended May 31, 2019.
• For Janus Henderson Flexible Bond Portfolio, the Trustees noted that the Fund’s performance was in the bottom Broadridge quartile for the 36 months ended May 31, 2019 and the bottom Broadridge quartile for the 12 months ended May 31, 2019. The Trustees noted the reasons for the Fund’s underperformance and the steps Janus Capital had taken or was taking to improve performance.
Janus Henderson VIT Overseas Portfolio Additional Information (unaudited)
Janus Aspen Series 31
• For Janus Henderson Forty Portfolio, the Trustees noted that the Fund’s performance was in the second Broadridge quartile for the 36 months ended May 31, 2019 and the first Broadridge quartile for the 12 months ended May 31, 2019.
• For Janus Henderson Global Research Portfolio, the Trustees noted that the Fund’s performance was in the bottom Broadridge quartile for the 36 months ended May 31, 2019 and the second Broadridge quartile for the 12 months ended May 31, 2019. The Trustees noted the reasons for the Fund’s underperformance, while also noting that the Fund has a performance fee structure that results in lower management fees during periods of underperformance, and the steps Janus Capital had taken or was taking to improve performance, and that the performance trend was improving
• For Janus Henderson Global Technology Portfolio, the Trustees noted that the Fund’s performance was in the first Broadridge quartile for the 36 months ended May 31, 2019 and the first Broadridge quartile for the 12 months ended May 31, 2019.
• For Janus Henderson Mid Cap Value Portfolio, the Trustees noted that the Fund’s performance was in the second Broadridge quartile for the 36 months ended May 31, 2019 and the third Broadridge quartile for the 12 months ended May 31, 2019.
• For Janus Henderson Overseas Portfolio, the Trustees noted that the Fund’s performance was in the second Broadridge quartile for the 36 months ended May 31, 2019 and the bottom Broadridge quartile for the 12 months ended May 31, 2019.
• For Janus Henderson Research Portfolio, the Trustees noted that the Fund’s performance was in the third Broadridge quartile for the 36 months ended May 31, 2019 and the second Broadridge quartile for the 12 months ended May 31, 2019. The Trustees noted the reasons for the Fund’s underperformance, while also noting that the Fund has a performance fee structure that results in lower management fees during periods of underperformance, and the steps Janus Capital had taken or was taking to improve performance, and that the performance trend was improving
• For Janus Henderson U.S. Low Volatility Portfolio, the Trustees noted that the Fund’s performance was in the third Broadridge quartile for the 36 months ended May 31, 2019 and the first Broadridge quartile for the 12 months ended May 31, 2019. The Trustees noted the reasons for the Fund’s underperformance and the steps Janus Capital and Intech had taken or were taking to improve performance, and the performance trend was improving.
In consideration of each Janus Henderson Fund’s performance, the Trustees concluded that, taking into account the factors relevant to performance, as well as other considerations, including steps taken to improve performance, the Janus Henderson Fund’s performance warranted continuation of such Janus Henderson Fund’s investment advisory and subadvisory agreement(s).
Costs of Services Provided The Trustees examined information regarding the fees and expenses of each Janus Henderson Fund in comparison to similar information for other comparable funds as provided by Broadridge, an independent data provider. They also reviewed an analysis of that information provided by their independent fee consultant and noted that the rate of management fees (investment advisory and any administration, but excluding out-of-pocket costs) for many of the Janus Henderson Funds, after applicable waivers, was below the average management fee rate of the respective peer group of funds selected by an independent data provider. The Trustees also examined information regarding the subadvisory fees charged for subadvisory services, as applicable, noting that all such fees were paid by Janus Capital out of its management fees collected from such Janus Henderson Fund.
The independent fee consultant provided its belief that the management fees charged by Janus Capital to each of the Janus Henderson Funds under the current investment advisory and administration agreements are reasonable in relation to the services provided by Janus Capital. The independent fee consultant found: (1) the total expenses and management fees of the Janus Henderson Funds to be reasonable relative to other mutual funds; (2) the total expenses, on average, were 10% under the average total expenses of their respective Broadridge Expense Group peers; and (3) and the management fees for the Janus Henderson Funds, on average, were 7% under the average management fees for their Expense Groups. The Trustees also considered the total expenses for each share class of

Janus Henderson VIT Overseas Portfolio Additional Information (unaudited)
32 DECEMBER 31, 2019
each Janus Henderson Fund compared to the average total expenses for its Broadridge Expense Group peers and to average total expenses for its Broadridge Expense Universe.
For certain Janus Henderson Funds, the independent fee consultant also performed a systematic “focus list” analysis of expenses which assessed fund fees in the context of fund performance being delivered. Based on this analysis, the independent fee consultant found that the combination of service quality/performance and expenses on these individual Janus Henderson Funds was reasonable in light of performance trends, performance histories, and existence of performance fees, breakpoints, and/or expense waivers on such Janus Henderson Funds.
The Trustees considered the methodology used by Janus Capital and each subadviser in determining compensation payable to portfolio managers, the competitive environment for investment management talent, and the competitive market for mutual funds in different distribution channels.
The Trustees also reviewed management fees charged by Janus Capital and each subadviser to comparable separate account clients and to comparable non-affiliated funds subadvised by Janus Capital or by a subadviser (for which Janus Capital or the subadviser provides only or primarily portfolio management services). Although in most instances subadvisory and separate account fee rates for various investment strategies were lower than management fee rates for Janus Henderson Funds having a similar strategy, the Trustees considered that Janus Capital noted that, under the terms of the management agreements with the Janus Henderson Funds, Janus Capital performs significant additional services for the Janus Henderson Funds that it does not provide to those other clients, including administration services, oversight of the Janus Henderson Funds’ other service providers, trustee support, regulatory compliance and numerous other services, and that, in serving the Janus Henderson Funds, Janus Capital assumes many legal risks and other costs that it does not assume in servicing its other clients. Moreover, they noted that the independent fee consultant found that: (1) the management fees Janus Capital charges to the Janus Henderson Funds are reasonable in relation to the management fees Janus Capital charges to funds subadvised by Janus Capital and to the fees Janus Capital charges to its institutional separate account clients; (2) these subadvised and institutional separate accounts have different service and infrastructure needs; and (3) Janus Henderson mutual fund investors enjoy reasonable fees relative to the fees charged to Janus Henderson subadvised fund and separate account investors; (4) 11 of 12 Janus Henderson Funds have lower management fees than similar funds subadvised by Janus Capital; and (5) six of nine Janus Henderson Funds have lower management fees than similar separate accounts managed by Janus Capital.
The Trustees considered the fees for each Janus Henderson Fund for its fiscal year ended in 2018, including the VIT Portfolios, and noted the following with regard to each VIT Portfolio’s total expenses, net of applicable fee waivers (the VIT Portfolio’s “total expenses”):
• For Janus Henderson Balanced Portfolio, the Trustees noted that, although the Fund’s total expenses exceeded the peer group average for one share class, overall the Fund’s total expenses were reasonable.
• For Janus Henderson Enterprise Portfolio, the Trustees noted that, although the Fund’s total expenses exceeded the peer group average for one share class, overall the Fund’s total expenses were reasonable.
• For Janus Henderson Flexible Bond Portfolio, the Trustees noted that, although the Fund’s total expenses exceeded the peer group average for one share class, overall the Fund’s total expenses were reasonable. The Trustees also noted that Janus Capital has contractually agreed to limit the Fund’s expenses, although this limit did not apply because the Fund’s total expenses were already below the applicable fee limit.
• For Janus Henderson Forty Portfolio, the Trustees noted that, although the Fund’s total expenses exceeded the peer group average for one share class, overall the Fund’s total expenses were reasonable.
• For Janus Henderson Global Research Portfolio, the Trustees noted that the Fund’s total expenses were below the peer group average for both share classes.
• For Janus Henderson Global Technology Portfolio, the Trustees noted that the Fund’s total expenses were below the peer group average for both share classes.
• For Janus Henderson Mid Cap Value Portfolio, the Trustees noted that, although the Fund’s total expenses exceeded the peer group average for one share class, overall the Fund’s total expenses were reasonable. The Trustees also noted that Janus Capital has contractually agreed to limit the Fund’s expenses, although this limit did not apply because the Fund’s total expenses were already below the applicable fee limit.

Janus Henderson VIT Overseas Portfolio Additional Information (unaudited)
Janus Aspen Series 33
• For Janus Henderson Overseas Portfolio, the Trustees noted that the Fund’s total expenses were below the peer group average for both share classes.
• For Janus Henderson Research Portfolio, the Trustees noted that the Fund’s total expenses were below the peer group average for both share classes.
• For Janus Henderson U.S. Low Volatility Portfolio, the Trustees noted that the Fund’s total expenses were below the peer group average for its sole share class.
The Trustees reviewed information on the overall profitability to Janus Capital and its affiliates of their relationship with the Janus Henderson Funds, and considered profitability data of other publicly traded mutual fund advisers. The Trustees recognized that profitability comparisons among fund managers are difficult because of the variation in the type of comparative information that is publicly available, and the profitability of any fund manager is affected by numerous factors, including the organizational structure of the particular fund manager, differences in complex size, difference in product mix, difference in types of business (mutual fund, institutional and other), differences in the types of funds and other accounts it manages, possible other lines of business, the methodology for allocating expenses, and the fund manager’s capital structure and cost of capital.
Additionally, the Trustees considered the estimated profitability to Janus Capital from the investment management services it provided to each Janus Henderson Fund. In their review, the Trustees considered whether Janus Capital and each subadviser receive adequate incentives and resources to manage the Janus Henderson Funds effectively. In reviewing profitability, the Trustees noted that the estimated profitability for an individual Janus Henderson Fund is necessarily a product of the allocation methodology utilized by Janus Capital to allocate its expenses as part of the estimated profitability calculation. In this regard, the Trustees noted that the independent fee consultant found that (1) the expense allocation methodology and rationales utilized by Janus Capital were reasonable and (2) no clear correlation between expense allocations and operating margins. The Trustees also considered that the estimated profitability for an individual Janus Henderson Fund was influenced by a number of factors, including not only the allocation methodology selected, but also the presence of fee waivers and expense caps, and whether the Janus Henderson Fund’s investment management agreement contained breakpoints or a performance fee component. The Trustees determined, after taking into account these factors, among others, that Janus Capital’s estimated profitability with respect to each Janus Henderson Fund was not unreasonable in relation to the services provided, and that the variation in the range of such estimated profitability among the Janus Henderson Funds was not a material factor in the Board’s approval of the reasonableness of any Janus Henderson Fund’s investment management fees.
The Trustees concluded that the management fees payable by each Janus Henderson Fund to Janus Capital and its affiliates, as well as the fees paid by Janus Capital to the subadvisers of subadvised Janus Henderson Funds, were reasonable in relation to the nature, extent, and quality of the services provided, taking into account the fees charged by other advisers for managing comparable mutual funds with similar strategies, the fees Janus Capital and the subadvisers charge to other clients, and, as applicable, the impact of fund performance on management fees payable by the Janus Henderson Funds. The Trustees also concluded that each Janus Henderson Fund’s total expenses were reasonable, taking into account the size of the Janus Henderson Fund, the quality of services provided by Janus Capital and any subadviser, the investment performance of the Janus Henderson Fund, and any expense limitations agreed to or provided by Janus Capital.
Economies of Scale The Trustees considered information about the potential for Janus Capital to realize economies of scale as the assets of the Janus Henderson Funds increase. They noted that their independent fee consultant published a report to the Trustees in November 2019 which provided its research and analysis into economies of scale. They also noted that, although many Janus Henderson Funds pay advisory fees at a base fixed rate as a percentage of net assets, without any breakpoints or performance fees, their independent fee consultant concluded that 64% of these Janus Henderson Funds’ share classes have contractual management fees (gross of waivers) below their Broadridge expense group averages. They also noted the following: (1) that for those Janus Henderson Funds whose expenses are being reduced by the contractual expense limitations of Janus Capital, Janus Capital is subsidizing certain of these Janus Henderson Funds because they have not reached adequate scale; (2) as the assets of some of the Janus Henderson Funds have declined in the past few years, certain Janus Henderson Funds have benefited from having advisory fee rates that have remained constant rather than increasing as assets declined; (3) performance fee structures have been implemented for various Janus Henderson Funds that have caused the effective rate of advisory fees payable by such a

Janus Henderson VIT Overseas Portfolio Additional Information (unaudited)
34 DECEMBER 31, 2019
Janus Henderson Fund to vary depending on the investment performance of the Janus Henderson Fund relative to its benchmark index over the measurement period; and (4) a few Janus Henderson Funds have fee schedules with breakpoints and reduced fee rates above certain asset levels. The Trustees also noted that the Janus Henderson Funds share directly in economies of scale through the lower charges of third-party service providers that are based in part on the combined scale of all of the Janus Henderson Funds.
The Trustees also considered the independent fee consultant’s conclusion that, given the limitations of various analytical approaches to economies of scale and their conflicting results, it is difficult to analytically confirm or deny the existence of economies of scale in the Janus Henderson complex. In this regard, the independent consultant concluded that (1) to the extent there were economies of scale at Janus Capital, Janus Capital’s general strategy of setting fixed management fees below peers appeared to share any such economies with investors even on smaller Janus Henderson Funds which have not yet achieved those economies and (2) by setting lower fixed fees from the start on these Janus Henderson Funds, Janus Capital appeared to be investing to increase the likelihood that these Janus Henderson Funds will grow to a level to achieve any scale economies that may exist. Further, the independent fee consultant provided its belief that Janus Henderson Fund investors are well-served by the fee levels and performance fee structures in place on the Janus Henderson Funds in light of any economies of scale that may be present at Janus Capital.
Based on all of the information reviewed, including the recent and past research and analysis conducted by the Trustees’ independent fee consultant, the Trustees concluded that the current fee structure of each Janus Henderson Fund was reasonable and that the current rates of fees do reflect a sharing between Janus Capital and the Janus Henderson Fund of any economies of scale that may be present at the current asset level of the Janus Henderson Fund.
Other Benefits to Janus Capital The Trustees also considered benefits that accrue to Janus Capital and its affiliates and subadvisers to the Janus Henderson Funds from their relationships with the Janus Henderson Funds. They recognized that two affiliates of Janus Capital separately serve the Janus Henderson Funds as transfer agent and distributor, respectively, and the transfer agent receives compensation directly from the non-money market funds for services provided, and that such compensation contributes to the overall profitability of Janus Capital and its affiliates that results from their relationship with the Janus Henderson Funds. The Trustees also considered Janus Capital’s past and proposed use of commissions paid by the Janus Henderson Funds on portfolio brokerage transactions to obtain proprietary and third-party research products and services benefiting the Janus Henderson Fund and/or other clients of Janus Capital and/or Janus Capital, and/or a subadviser to a Janus Henderson Fund. The Trustees concluded that Janus Capital’s and the subadvisers’ use of these types of client commission arrangements to obtain proprietary and third-party research products and services was consistent with regulatory requirements and guidelines and was likely to benefit each Janus Henderson Fund. The Trustees also concluded that, other than the services provided by Janus Capital and its affiliates and subadvisers pursuant to the agreements and the fees to be paid by each Janus Henderson Fund therefor, the Janus Henderson Funds and Janus Capital and the subadvisers may potentially benefit from their relationship with each other in other ways. They concluded that Janus Capital and its affiliates share directly in economies of scale through the lower charges of third-party service providers that are based in part on the combined scale of the Janus Henderson Funds and other clients serviced by Janus Capital and its affiliates. They also concluded that Janus Capital and/or the subadvisers benefit from the receipt of research products and services acquired through commissions paid on portfolio transactions of the Janus Henderson Funds and that the Janus Henderson Funds benefit from Janus Capital’s and/or the subadvisers’ receipt of those products and services as well as research products and services acquired through commissions paid by other clients of Janus Capital and/or other clients of the subadvisers. They further concluded that the success of any Janus Henderson Fund could attract other business to Janus Capital, the subadvisers or other Janus Henderson funds, and that the success of Janus Capital and the subadvisers could enhance Janus Capital’s and the subadvisers’ ability to serve the Janus Henderson Funds.
Janus Henderson VIT Overseas Portfolio Useful Information About Your Portfolio Report (unaudited)
Janus Aspen Series 35
Management Commentary The Management Commentary in this report includes valuable insight as well as statistical information to help you understand how your Portfolio’s performance and characteristics stack up against those of comparable indices.
If the Portfolio invests in foreign securities, this report may include information about country exposure. Country exposure is based primarily on the country of risk. A company may be allocated to a country based on other factors such as location of the company’s principal office, the location of the principal trading market for the company’s securities, or the country where a majority of the company’s revenues are derived.
Please keep in mind that the opinions expressed in the Management Commentary are just that: opinions. They are a reflection based on best judgment at the time this report was compiled, which was December 31, 2019. As the investing environment changes, so could opinions. These views are unique and are not necessarily shared by fellow employees or by Janus Henderson in general.
Performance Overviews Performance overview graphs compare the performance of a hypothetical $10,000 investment in the Portfolio with one or more widely used market indices. When comparing the performance of the Portfolio with an index, keep in mind that market indices are not available for investment and do not reflect deduction of expenses.
Average annual total returns are quoted for a Portfolio with more than one year of performance history. Average annual total return is calculated by taking the growth or decline in value of an investment over a period of time, including reinvestment of dividends and distributions, then calculating the annual compounded percentage rate that would have produced the same result had the rate of growth been constant throughout the period. Average annual total return does not reflect the deduction of taxes that a shareholder would pay on Portfolio distributions or redemptions of Portfolio shares.
Cumulative total returns are quoted for a Portfolio with less than one year of performance history. Cumulative total return is the growth or decline in value of an investment over time, independent of the period of time involved. Cumulative total return does not reflect the deduction of taxes that a shareholder would pay on Portfolio distributions or redemptions of Portfolio shares.
Pursuant to federal securities rules, expense ratios shown in the performance chart reflect subsidized (if applicable) and unsubsidized ratios. The total annual fund operating expenses ratio is gross of any fee waivers, reflecting the Portfolio’s unsubsidized expense ratio. The net annual fund operating expenses ratio (if applicable) includes contractual waivers of Janus Capital and reflects the Portfolio’s subsidized expense ratio. Ratios may be higher or lower than those shown in the “Financial Highlights” in this report.
Schedule of Investments Following the performance overview section is the Portfolio’s Schedule of Investments. This schedule reports the types of securities held in the Portfolio on the last day of the reporting period. Securities are usually listed by type (common stock, corporate bonds, U.S. Government obligations, etc.) and by industry classification (banking, communications, insurance, etc.). Holdings are subject to change without notice.
The value of each security is quoted as of the last day of the reporting period. The value of securities denominated in foreign currencies is converted into U.S. dollars.
If the Portfolio invests in foreign securities, it will also provide a summary of investments by country. This summary reports the Portfolio exposure to different countries by providing the percentage of securities invested in each country. The country of each security represents the country of risk. The Portfolio’s Schedule of Investments relies upon the industry group and country classifications published by Barclays and/or MSCI Inc.
Tables listing details of individual forward currency contracts, futures, written options, swaptions, and swaps follow the Portfolio’s Schedule of Investments (if applicable).
Statement of Assets and Liabilities This statement is often referred to as the “balance sheet.” It lists the assets and liabilities of the Portfolio on the last day of the reporting period.

Janus Henderson VIT Overseas Portfolio Useful Information About Your Portfolio Report (unaudited)
36 DECEMBER 31, 2019
The Portfolio’s assets are calculated by adding the value of the securities owned, the receivable for securities sold but not yet settled, the receivable for dividends declared but not yet received on securities owned, and the receivable for Portfolio shares sold to investors but not yet settled. The Portfolio’s liabilities include payables for securities purchased but not yet settled, Portfolio shares redeemed but not yet paid, and expenses owed but not yet paid. Additionally, there may be other assets and liabilities such as unrealized gain or loss on forward currency contracts.
The section entitled “Net Assets Consist of” breaks down the components of the Portfolio’s net assets. Because the Portfolio must distribute substantially all earnings, you will notice that a significant portion of net assets is shareholder capital.
The last section of this statement reports the net asset value (“NAV”) per share on the last day of the reporting period. The NAV is calculated by dividing the Portfolio’s net assets for each share class (assets minus liabilities) by the number of shares outstanding.
Statement of Operations This statement details the Portfolio’s income, expenses, realized gains and losses on securities and currency transactions, and changes in unrealized appreciation or depreciation of Portfolio holdings.
The first section in this statement, entitled “Investment Income,” reports the dividends earned from securities and interest earned from interest-bearing securities in the Portfolio.
The next section reports the expenses incurred by the Portfolio, including the advisory fee paid to the investment adviser, transfer agent fees and expenses, and printing and postage for mailing statements, financial reports and prospectuses. Expense offsets and expense reimbursements, if any, are also shown.
The last section lists the amounts of realized gains or losses from investment and foreign currency transactions, and changes in unrealized appreciation or depreciation of investments and foreign currency-denominated assets and liabilities. The Portfolio will realize a gain (or loss) when it sells its position in a particular security. A change in unrealized gain (or loss) refers to the change in net appreciation or depreciation of the Portfolio during the reporting period. “Net Realized and Unrealized Gain/(Loss) on Investments” is affected both by changes in the market value of Portfolio holdings and by gains (or losses) realized during the reporting period.
Statements of Changes in Net Assets These statements report the increase or decrease in the Portfolio’s net assets during the reporting period. Changes in the Portfolio’s net assets are attributable to investment operations, dividends and distributions to investors, and capital share transactions. This is important to investors because it shows exactly what caused the Portfolio’s net asset size to change during the period.
The first section summarizes the information from the Statement of Operations regarding changes in net assets due to the Portfolio’s investment operations. The Portfolio’s net assets may also change as a result of dividend and capital gains distributions to investors. If investors receive their dividends and/or distributions in cash, money is taken out of the Portfolio to pay the dividend and/or distribution. If investors reinvest their dividends and/or distributions, the Portfolio’s net assets will not be affected. If you compare the Portfolio’s “Net Decrease from Dividends and Distributions” to “Reinvested Dividends and Distributions,” you will notice that dividends and distributions have little effect on the Portfolio’s net assets. This is because the majority of the Portfolio’s investors reinvest their dividends and/or distributions.
The reinvestment of dividends and distributions is included under “Capital Share Transactions.” “Capital Shares” refers to the money investors contribute to the Portfolio through purchases or withdrawals via redemptions. The Portfolio’s net assets will increase and decrease in value as investors purchase and redeem shares from the Portfolio.
Financial Highlights This schedule provides a per-share breakdown of the components that affect the Portfolio’s NAV for current and past reporting periods as well as total return, asset size, ratios, and portfolio turnover rate.
The first line in the table reflects the NAV per share at the beginning of the reporting period. The next line reports the net investment income/(loss) per share. Following is the per share total of net gains/(losses), realized and unrealized. Per share dividends and distributions to investors are then subtracted to arrive at the NAV per share at the end of the period. The next line reflects the total return for the period. The total return may include adjustments in accordance with

Janus Henderson VIT Overseas Portfolio Useful Information About Your Portfolio Report (unaudited)
Janus Aspen Series 37
generally accepted accounting principles required at the period end for financial reporting purposes. As a result, the total return may differ from the total return reflected for individual shareholder transactions. Also included are ratios of expenses and net investment income to average net assets.
The Portfolio’s expenses may be reduced through expense offsets and expense reimbursements. The ratios shown reflect expenses before and after any such offsets and reimbursements.
The ratio of net investment income/(loss) summarizes the income earned less expenses, divided by the average net assets of the Portfolio during the reporting period. Do not confuse this ratio with the Portfolio’s yield. The net investment income ratio is not a true measure of the Portfolio’s yield because it does not take into account the dividends distributed to the Portfolio’s investors.
The next figure is the portfolio turnover rate, which measures the buying and selling activity in the Portfolio. Portfolio turnover is affected by market conditions, changes in the asset size of the Portfolio, fluctuating volume of shareholder purchase and redemption orders, the nature of the Portfolio’s investments, and the investment style and/or outlook of the portfolio manager(s) and/or investment personnel. A 100% rate implies that an amount equal to the value of the entire portfolio was replaced once during the fiscal year; a 50% rate means that an amount equal to the value of half the portfolio is traded in a year; and a 200% rate means that an amount equal to the value of the entire portfolio is traded every six months.

Janus Henderson VIT Overseas Portfolio Designation Requirements (unaudited)
38 DECEMBER 31, 2019
For federal income tax purposes, the Portfolio designated the following for the year ended December 31, 2019:
Foreign Taxes Paid $1,874,352Foreign Source Income $15,565,017
Janus Henderson VIT Overseas Portfolio Trustees and Officers (unaudited)
Janus Aspen Series 39
The Portfolio’s Statement of Additional Information includes additional information about the Trustees and officers and is available, without charge, by calling 1-877-335-2687.
The following are the Trustees and officers of the Trust, together with a brief description of their principal occupations during the last five years (principal occupations for certain Trustees may include periods over five years).
Each Trustee has served in that capacity since he or she was originally elected or appointed. The Trustees do not serve a specified term of office. Each Trustee will hold office until the termination of the Trust or his or her earlier death, resignation, retirement, incapacity, or removal. Under the Portfolio’s Governance Procedures and Guidelines, the policy is for Trustees to retire no later than the end of the calendar year in which the Trustee turns 75. The Trustees review the Portfolio’s Governance Procedures and Guidelines from time to time and may make changes they deem appropriate. The Portfolio’s Nominating and Governance Committee will consider nominees for the position of Trustee recommended by shareholders. Shareholders may submit the name of a candidate for consideration by the Committee by submitting their recommendations to the Trust’s Secretary. Each Trustee is currently a Trustee of one other registered investment company advised by Janus Capital: Janus Investment Fund. Collectively, these two registered investment companies consist of 58 series or funds referred to herein as the Fund Complex.
The Trust’s officers are elected annually by the Trustees for a one-year term. Certain officers also serve as officers of Janus Investment Fund. Certain officers of the Portfolio may also be officers and/or directors of Janus Capital. Except as otherwise disclosed, Portfolio officers receive no compensation from the Portfolio, except for the Portfolio’s Chief Compliance Officer, as authorized by the Trustees.

Janus Henderson VIT Overseas Portfolio Trustees and Officers (unaudited)
40 DECEMBER 31, 2019
TRUSTEES
Name, Address, and Age
Positions Held with the Trust
Length of Time Served
Principal Occupations During the Past Five Years
Number of Portfolios/Funds in Fund Complex Overseen by Trustee
Other Directorships Held by Trustee During the Past Five Years
Independent Trustees
William F. McCalpin 151 Detroit Street Denver, CO 80206 DOB: 1957
Chairman Trustee
1/08-Present 6/02-Present
Independent Consultant. Formerly, Managing Partner, Impact Investments, Athena Capital Advisors LLC (independent registered investment advisor) (2016-2019), Managing Director, Holos Consulting LLC (provides consulting services to foundations and other nonprofit organizations) (2009-2016), Chief Executive Officer, Imprint Capital Advisors (impact investment firm) (2013-2015), and Executive Vice President and Chief Operating Officer of The Rockefeller Brothers Fund (a private family foundation) (1998-2006).
58 Director of Mutual Fund Directors Forum (a non-profit organization serving independent directors of U.S. mutual funds) (since 2016), Chairman of the Board and Trustee of The Investment Fund for Foundations Investment Program (TIP) (consisting of 2 funds) (since 2008), and Director of the F.B. Heron Foundation (a private grantmaking foundation) (since 2006).
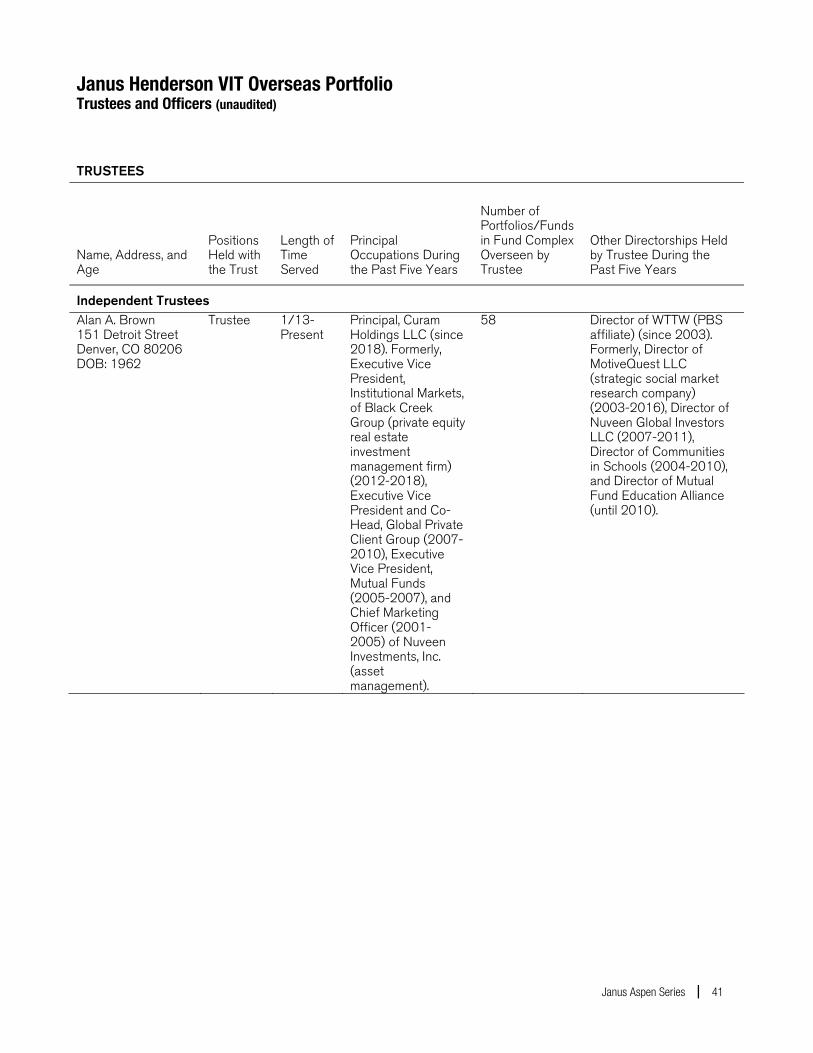
Janus Henderson VIT Overseas Portfolio Trustees and Officers (unaudited)
Janus Aspen Series 41
TRUSTEES
Name, Address, and Age
Positions Held with the Trust
Length of Time Served
Principal Occupations During the Past Five Years
Number of Portfolios/Funds in Fund Complex Overseen by Trustee
Other Directorships Held by Trustee During the Past Five Years
Independent Trustees
Alan A. Brown 151 Detroit Street Denver, CO 80206 DOB: 1962
Trustee 1/13-Present
Principal, Curam Holdings LLC (since 2018). Formerly, Executive Vice President, Institutional Markets, of Black Creek Group (private equity real estate investment management firm) (2012-2018), Executive Vice President and Co-Head, Global Private Client Group (2007-2010), Executive Vice President, Mutual Funds (2005-2007), and Chief Marketing Officer (2001-2005) of Nuveen Investments, Inc. (asset management).
58 Director of WTTW (PBS affiliate) (since 2003). Formerly, Director of MotiveQuest LLC (strategic social market research company) (2003-2016), Director of Nuveen Global Investors LLC (2007-2011), Director of Communities in Schools (2004-2010), and Director of Mutual Fund Education Alliance (until 2010).

Janus Henderson VIT Overseas Portfolio Trustees and Officers (unaudited)
42 DECEMBER 31, 2019
TRUSTEES
Name, Address, and Age
Positions Held with the Trust
Length of Time Served
Principal Occupations During the Past Five Years
Number of Portfolios/Funds in Fund Complex Overseen by Trustee
Other Directorships Held by Trustee During the Past Five Years
Independent Trustees
William D. Cvengros 151 Detroit Street Denver, CO 80206 DOB: 1948
Trustee 1/11-Present
Chief Executive Officer of SJC Capital, LLC (a personal investment company and consulting firm) (since 2002). Formerly, Venture Partner for The Edgewater Funds (a middle market private equity firm) (2002-2004), Chief Executive Officer and President of PIMCO Advisors Holdings L.P. (a publicly traded investment management firm) (1994-2000), and Chief Investment Officer (1987-1994) and Vice Chairman and Director (1990-1994) of Pacific Life Insurance Company (a mutual life insurance and annuity company) (1987-1994).
58 Advisory Board Member, RevOZ Fund LP and related funds (real estate investments for opportunity zones) (since 2020), Advisory Board Member, Innovate Partners Emerging Growth and Equity Fund I (early stage venture capital fund) (since 2014). Formerly, Managing Trustee of National Retirement Partners Liquidating Trust (2013-2016), Chairman, National Retirement Partners, Inc. (formerly a network of advisors to 401(k) plans) (2005-2013), Director of Prospect Acquisition Corp. (a special purpose acquisition corporation) (2007-2009), Director of RemedyTemp, Inc. (temporary help services company) (1996-2006), and Trustee of PIMCO Funds Multi-Manager Series (1990-2000) and Pacific Life Variable Life & Annuity Trusts (1987-1994).

Janus Henderson VIT Overseas Portfolio Trustees and Officers (unaudited)
Janus Aspen Series 43
TRUSTEES
Name, Address, and Age
Positions Held with the Trust
Length of Time Served
Principal Occupations During the Past Five Years
Number of Portfolios/Funds in Fund Complex Overseen by Trustee
Other Directorships Held by Trustee During the Past Five Years
Independent Trustees
Raudline Etienne 151 Detroit Street Denver, CO 80206 DOB: 1965
Trustee 6/16-Present
Founder, Daraja Capital (advisory and investment firm) (since 2016), and Senior Advisor, Albright Stonebridge Group LLC (global strategy firm) (since 2016). Formerly, Senior Vice President (2011-2015), Albright Stonebridge Group LLC, and Deputy Comptroller and Chief Investment Officer, New York State Common Retirement Fund (public pension fund) (2008-2011).
58 Board Member, Van Alen Institute (nonprofit architectural and design organization) (since 2019) and Director of Brightwood Capital Advisors, LLC (since 2014).
William M. Fitzgerald, Sr. 151 Detroit Street Denver, CO 80206 DOB: 1964
Trustee 9/19-Present
Founder, Fitzgerald Asset Management LLC (since 2012). Formerly, Founder and Chief Investment Officer, Global Infrastructure Asset Management LLC (2008-2017), Chief Investment Officer of Nuveen Asset Management (2000-2007), and Managing Director, Nuveen Investment LLC (1988-2007).
58 Board of Directors, Municipal Securities Rulemaking Board (since 2017). Formerly, Board of Directors of Syncora Holdings Ltd, Syncora Guarantee Inc., and Syncora Capital Assurance Inc. (2009-2016), and Trustee, Destra Investment Trust (2010-2014).

Janus Henderson VIT Overseas Portfolio Trustees and Officers (unaudited)
44 DECEMBER 31, 2019
TRUSTEES
Name, Address, and Age
Positions Held with the Trust
Length of Time Served
Principal Occupations During the Past Five Years
Number of Portfolios/Funds in Fund Complex Overseen by Trustee
Other Directorships Held by Trustee During the Past Five Years
Independent Trustees
Gary A. Poliner 151 Detroit Street Denver, CO 80206 DOB: 1953
Trustee 6/16-Present
Retired. Formerly, President (2010-2013) of Northwestern Mutual Life Insurance Company.
58 Director of MGIC Investment Corporation (private mortgage insurance) (since 2013) and West Bend Mutual Insurance Company (property/casualty insurance) (since 2013). Formerly, Trustee of Northwestern Mutual Life Insurance Company (2010-2013) and Director of Frank Russell Company (global asset management firm) (2008-2013).
William D. Stewart* 151 Detroit Street Denver, CO 80206 DOB: 1944
Trustee 6/84-Present
Retired. Formerly, President and founder of HPS Products and Corporate Vice President of MKS Instruments, Boulder, CO (a provider of advanced process control systems for the semiconductor industry) (1976-2012).
58 None
*William D. Stewart retired from his role as Independent Trustee, effective December 31, 2019.

Janus Henderson VIT Overseas Portfolio Trustees and Officers (unaudited)
Janus Aspen Series 45
TRUSTEES
Name, Address, and Age
Positions Held with the Trust
Length of Time Served
Principal Occupations During the Past Five Years
Number of Portfolios/Funds in Fund Complex Overseen by Trustee
Other Directorships Held by Trustee During the Past Five Years
Independent Trustees
Diane L. Wallace 151 Detroit Street Denver, CO 80206 DOB: 1958
Trustee 6/17-Present
Retired. 58 Formerly, Independent Trustee, Henderson Global Funds (13 portfolios) (2015-2017), Independent Trustee, State Farm Associates' Funds Trust, State Farm Mutual Fund Trust, and State Farm Variable Product Trust (28 portfolios) (2013-2017), Chief Operating Officer, Senior Vice President-Operations, and Chief Financial Officer for Driehaus Capital Management, LLC (1988-2006), and Treasurer for Driehaus Mutual Funds (1996-2002).
Linda S. Wolf 151 Detroit Street Denver, CO 80206 DOB: 1947
Trustee 11/05-Present
Retired. Formerly, Chairman and Chief Executive Officer of Leo Burnett (Worldwide) (advertising agency) (2001-2005).
58 Director of Chicago Community Trust (Regional Community Foundation), Lurie Children’s Hospital (Chicago, IL), Shirley Ryan Ability Lab and Wrapports, LLC (digital communications company). Formerly, Director of Chicago Council on Global Affairs (until 2019), InnerWorkings (until 2019), Director of Walmart (until 2017), Director of Chicago Convention & Tourism Bureau (until 2014), and The Field Museum of Natural History (Chicago, IL) (until 2014).

Janus Henderson VIT Overseas Portfolio Trustees and Officers (unaudited)
46 DECEMBER 31, 2019
OFFICERS Name, Address, and Age
Positions Held with the Trust Term of Office* and Length of Time Served
Principal Occupations During the Past Five Years
Julian McManus 151 Detroit Street Denver, CO 80206 DOB: 1970
Executive Vice President and Co-Portfolio Manager Janus Henderson Overseas Portfolio
1/18-Present Portfolio Manager for other Janus Henderson accounts and Analyst for Janus Capital.
George P. Maris 151 Detroit Street Denver, CO 80206 DOB: 1968
Executive Vice President and Co-Portfolio Manager Janus Henderson Overseas Portfolio
1/16-Present Co-Head of Equities - Americas of Janus Henderson Investors and Portfolio Manager for other Janus Henderson accounts.
Garth Yettick 151 Detroit Street Denver, CO 80206 DOB: 1970
Executive Vice President and Co-Portfolio Manager Janus Henderson Overseas Portfolio
1/18-Present Portfolio Manager for other Janus Henderson accounts.
Bruce L. Koepfgen 151 Detroit Street Denver, CO 80206 DOB: 1952
President and Chief Executive Officer
7/14-Present Executive Vice President, Head of North America at Janus Henderson Investors and Janus Capital Management LLC (since 2017), Executive Vice President and Director of Janus International Holding LLC (since 2011), Executive Vice President of Janus Distributors LLC (since 2011), Vice President and Director of Intech Investment Management LLC (since 2011), Executive Vice President and Director of Perkins Investment Management LLC (since 2011), and President and Director of Janus Management Holdings Corporation (since 2011). Formerly, President of Janus Capital Group Inc. and Janus Capital Management LLC (2013-2017), Executive Vice President of Janus Services LLC (2011-2015), Janus Capital Group Inc. and Janus Capital Management LLC (2011-2013), and Chief Financial Officer of Janus Capital Group Inc., Janus Capital Management LLC, Janus Distributors LLC, Janus Management Holdings Corporation, and Janus Services LLC (2011-2013).
* Officers are elected at least annually by the Trustees for a one-year term and may also be elected from time to time by the Trustees for an interim period.

Janus Henderson VIT Overseas Portfolio Trustees and Officers (unaudited)
Janus Aspen Series 47
OFFICERS Name, Address, and Age
Positions Held with the Trust Term of Office* and Length of Time Served
Principal Occupations During the Past Five Years
Susan K. Wold 151 Detroit Street Denver, CO 80206 DOB: 1960
Vice President, Chief Compliance Officer, and Anti-Money Laundering Officer
9/17-Present Head of Compliance, North America for Janus Henderson (since September 2017). Formerly, Vice President, Head of Global Corporate Compliance, and Chief Compliance Officer for Janus Capital Management LLC (May 2017-September 2017), Vice President, Compliance at Janus Capital Group Inc. and Janus Capital Management LLC (2005-2017).
Jesper Nergaard 151 Detroit Street Denver, CO 80206 DOB: 1962
Chief Financial Officer Vice President, Treasurer, and Principal Accounting Officer
3/05-Present 2/05-Present
Vice President of Janus Capital and Janus Services LLC.
Kathryn L. Santoro 151 Detroit Street Denver, CO 80206 DOB: 1974
Vice President, Chief Legal Counsel, and Secretary
12/16-Present Assistant General Counsel of Janus Capital (since 2016). Formerly, Vice President and Associate Counsel of Curian Capital, LLC and Curian Clearing LLC (2013-2016), and General Counsel and Secretary (2011-2012) and Vice President (2009-2012) of Old Mutual Capital, Inc.
* Officers are elected at least annually by the Trustees for a one-year term and may also be elected from time to time by the Trustees for an interim period.

Janus Henderson VIT Overseas Portfolio Notes
48 DECEMBER 31, 2019
NotesPage1

Janus Henderson VIT Overseas Portfolio Notes
Janus Aspen Series 49
NotesPage2

Knowledge. Shared At Janus Henderson, we believe in the sharing of expert insight for better investment and business decisions. We call this ethos Knowledge. Shared. Learn more by visiting janushenderson.com.
This report is submitted for the general information of shareholders of the Portfolio. It is not an offer or solicitation for the Portfolio and is not authorized for distribution to prospective investors unless preceded or accompanied by an effective prospectus. Janus Henderson, Janus, Henderson, Perkins, Intech and Knowledge. Shared are trademarks of Janus Henderson Group plc or one of its subsidiaries. © Janus Henderson Group plc. Janus Henderson Distributors
109-02-81120 02-20