japan article
TRANSCRIPT

GROWING INEQUALITIES AND THEIR IMPACTS IN JAPAN
Fumio Ohtake
Miki Kohara
Naoko Okuyama
Katsunori Yamada
Country Report for Japan
April 2013

GINI Country Report Japan

GINI Country Report Japan
Table of Contents
1. General Background to Macro and Structural Indicators in Japan, 1980-2010..........................................5
2. The Nature of Inequality and its Development over Time .........................................................................8
2.1. Has Inequality Grown? ........................................................................................................................8
2.1.1. Income Inequality and Consumption Inequality ....................................................................... 11
2.1.2. Wealth Inequality ...................................................................................................................... 13
2.1.3. Poverty ....................................................................................................................................... 14
2.1.4. Public Assistance (Public Livelihood Aid) for Poor Families ....................................................... 16
2.1.5. Educational Inequality ............................................................................................................... 17
2.1.6. Labour Market Inequality .......................................................................................................... 19
2.2. Whom has it Affected? ..................................................................................................................... 29
2.2.1. Wage Inequality between Different Education Groups is Stable, but Wage Inequality within
Groups is Increasing. ........................................................................................................................... 29
2.2.2. Inequality Increases as Population Ages. .................................................................................. 32
2.2.3 Who are Poor? ............................................................................................................................ 34
2.2.4 Who Receives Public Income Assistance? .................................................................................. 38
2.3. Chapter Conclusion: Why has Inequality Grown? ............................................................................ 40
3. Social Impacts of Inequality ..................................................................................................................... 43
3.1. Introduction ...................................................................................................................................... 43
3.2. Cumulative Disadvantage and Multidimensional Measures of Poverty........................................... 43
3.2.1. Material Deprivation ................................................................................................................. 43
3.2.2. Changes in Number of Homeless .............................................................................................. 44
3.3. Family Formation and Breakdown, Lone Parenthood, and Fertility ................................................. 46
3.3.1. Changes in Family Type ............................................................................................................. 46
3.3.2. Rates of Marriage, Divorces, and Fertility ................................................................................. 48
3.4. Housing Tenure ................................................................................................................................. 50
3.5. Crime and Punishment ..................................................................................................................... 52
3.5.1. Changes in Crime Rates ............................................................................................................. 52

GINI Country Report Japan
3.5.2. Who Commits Crimes? .............................................................................................................. 54
3.5.3. Youth Crime ............................................................................................................................... 56
3.6. Health inequalities............................................................................................................................ 58
3.6.1. Historical Changes in Health ...................................................................................................... 58
3.6.2. Causes of Death ......................................................................................................................... 60
3.7. Subjective Measures of Well-being, Satisfaction, and Happiness .................................................... 64
3.8. Chapter Conclusion: Social Impacts of Inequality ............................................................................ 67
4. Political and Cultural Impacts .................................................................................................................. 69
4.1. Introduction ...................................................................................................................................... 69
4.2. Political and Civic Participation ........................................................................................................ 69
4.3. Unionized Workforce ........................................................................................................................ 72
4.4. Trust in Others and in Institutions .................................................................................................... 73
4.5. Political Values and Legitimacy ......................................................................................................... 76
4.6. Values Related to Social Policy and Welfare State ............................................................................ 78
4.7. Chapter Conclusion: Appraisal of the Interdependence and the National Story of Inequality
Drivers and their Cultural and Political Impacts ...................................................................................... 80
5. Effectiveness of Policies for Combating Inequality .................................................................................. 83
5.1 Introduction ....................................................................................................................................... 83
5.2 Minimum Wage ................................................................................................................................. 85
5.3 Taxes .................................................................................................................................................. 87
5.4 Public Social Expenditure .................................................................................................................. 89
5.4.1 Levels and Trends ....................................................................................................................... 89
5.4.2 Social Assistance for Families with Children ............................................................................... 90
5.4.3 Active Labor Market Policy ......................................................................................................... 91
5.5. Education .......................................................................................................................................... 92
5.6 Conclusion ......................................................................................................................................... 93
References ................................................................................................................................................... 95
Appendix...................................................................................................................................................... 97

GINI Country Report Japan
List of Tables
Table 2.1 Mean years of education
Table 2.2 Employment rate

GINI Country Report Japan
List of Figures
Figure 1.1 Historical changes in Japan’s GDP growth rates.
Figure 2.1 International comparison of Gini coefficients in the mid-2000s
Figure 2.2 Gini coefficients based on the three data sets.
Figure 2.3 Gini coefficient for income and consumption
Figure 2.4 Gini coefficient for financial asset holdings
Figure 2.5: Poverty rates according to the NSFIE
Figure 2.6: Changes in the number of households living on welfare
Figure 2.7: Educational inequality among age groups
Figure 2.8: Log wage differences for men between the 90th and 50th percentiles
Figure 2.9: Log wage differences for men between the 50th and 10th
Figure 2.10: Log wage differences for women between the 90th and 50th
Figure 2.11: Log wage differences for women between the 50th and 10th percentiles
Figure 2.12: Unemployment rate
Figure 2.13: Unemployment rate by age group and gender
Figure 2.14: Employment rate by age group and gender
Figure 2.15: Proportion of non-standard workers among all employees
Figure 2.16: Proportion of hourly wage for part-time workers compared with full-time
workers
Figure 2.17: Wage differential between college and high school graduates

GINI Country Report Japan
Figure 2.18: Log wage difference for male college graduates between the 90th and 10th
percentiles
Figure 2.19: Male-female wage differential by educational group
Figure 2.20: Gini coefficient before-tax income by age group
Figure 2.21: Gini coefficient of consumption expenditure by age group
Figure 2.22: Gini coefficient of financial asset holdings by age group
Figure 2.23: Poverty rates calculated by disposable income
Figure 2.24: Poverty rates calculated by consumption
Figure 2.25: Age distribution of the poor: percentage of poor within age group
Figure 2.26: Welfare recipients by family type (monthly average)
Figure 2.27: Welfare recipients by age group
Figure 3.1: Financial difficulty meeting everyday expenses (2000)
Figure 3.2: Number of homeless
Figure 3.3: Number of households by family type
Figure 3.5: Marriage rates (number of couples per 1000 persons
Figure 3.4: Share of households by nuclear family type (detailed split of nuclear families)
Figure 3.6: Divorce rates (number of couples per 1000 persons)
Figure 3.7: Total fertility rates
Figure 3.8: Changes in residential land prices from previous year (% change)
Figure 3.9: Rates of homeownership
Figure 3.10: Crime rates

GINI Country Report Japan
Figure 3.11: New prisoners
Figure 3.12: New prisoners by education level
Figure 3.13: New juvenile prisoners by age
Figure 3.14: New juvenile prisoners by household economic classes
Figure 3.15: Life expectancy at birth by gender
Figure 3.16: Subjective health status by educational attainments (2010)
Figure 3.17: Deaths by suicide
Figure 3.18: Deaths by homicide
Figure 3.19: Rates of deaths by suicide
Figure 3.20: Living conditions
Figure 3.21: Living conditions by income quintiles
Figure 3.22: Living conditions by age of household head
Figure 3.23: Living conditions by household head's employment status
Figure 4.1: Percentage of total electorate turnout at general elections
Figure 4.2: Percentage point differences in voting rates (most recent election)
Panel A: Between people with high and low education levels
Figure 4.2: Percentage point differences in voting rates (most recent election)
Panel B: Between those aged 55+ years and those aged 16–35 years
Figure 4.3: Percentage of workforce unionized
Figure 4.4: Rates of participation in civic activities
Figure 4.5: Percentage of people expressing high level of trust in others

GINI Country Report Japan
Figure 4.6: Average annual percentage point change in “Trust in Others”
Figure 4.7: Political views: conservative vs. progressive
Figure 4.8: Political views: “the left” vs. “the right”
Figure 4.9: Percentage of people who support “Immigrants should be increased”
Figure 4.10: Percentage of people who agree that “inequalities are too large in the country
Figure 4.11: Percentage of people who agree that the “poor are lazy”
Figure 4.12: Percentage of people who agree that the “government should redistribute
wealth/income”
Figure 5.1: Real GDP per capita in Japan
Figure 5.2: Consumer Price Index for all items (index 2005=100)
Figure 5.3: Government Debt as a % of GDP
Figure 5.4: Changes in prefectural minimum wage
Figure 5.5: Kaitz index
Figure 5.6: Tax Revenue as a % of real GDP
Figure 5.7: Changes in top 1% wage income share and marginal tax rate
Figure 5.8: Ratio of social security benefits by functional category to Annual Real GDP (%)
Figure 5.9: Long-term care payments as a % of real GDP
Figure 5.10: Child allowance and child-related government expenditure as a % of GDP
Figure 5.11: Government expenditure on job training as % of GDP
Figure 5.12: National and local government expenditure on education

GINI Country Report Japan


GINI Country Report Japan
Page 1
Executive Summary
Inequality has widened continuously since the 1980s in Japan. The widening gap between the haves
and have-nots has been driven by different factors in each given period. Ohtake and Saito (1998)
argue that inequality in the 1980s and 1990s can be explained mainly by population aging.
Dispersions of income, consumption expenditure, and wealth within the age group increase among
the elderly, so an increase in older people leads to a rise in income inequality across the entire
country.
The growing income and wealth inequalities observed in the UK and the US since the 1980s are
characterized by a widening income gap due to educational attainment and an increase in the
incomes of higher income groups (Autor, Katz, and Kerney, 2006; Lemieux, 2006; Piketty and Saez,
2006). In contrast, in Japan, wage inequality due to educational attainment has remained relatively
stable over the period 1980-1990. This does not mean that skill-based technological change (SBTC)
has not substantially affected Japan over time. Kawaguchi and Mori (2008) showed that both the
demand and supply for skilled workers have increased because of the SBTC, a rise in the number of
college-educated workers induced by educational policy changes, and the aging of the population.
Because the shifts in demand and supply are similar, the effects of the shifts on the skill price were
canceled out. Thus, the skill price has been stable. They pointed out that the industries that
experienced rapid computerization also experienced an upgrading of the skills of workers.
Another characteristic of Japan’s income inequality is that the widening income differences among
higher income groups were rarely observed at least until the late 1990s. Moriguchi and Saez (2008),
who analyzed historical changes of the Japanese top income share, stated that the top wage income
shares in Japan have remained relatively stable, unlike the sharp increase in wage income inequality
observed in the United States since 1970.

GINI Country Report Japan
Page 2
The increases in inequality since the late 1990s are also attributed to the long-term trends of
population aging effects. In addition to these aging effects, however, growing gaps within generation
and educational groups have contributed to the increase in Japan’s inequality since the late 1990s.
Kambayashi, Kawaguchi, and Yokoyama (2008) explained that increases in the within-age and
within-education group variances contributed to wage inequality in the late 1990s. Sudo, Suzuki, and
Yamada (2012) described how the income levels of lower income groups started to decline from the
mid-1990s; accordingly, the income gap has grown significantly since the early 2000s. They explained
that the widening gap observed in the 2000s can be attributed to changes in family structure and
employment type. In Japan, single households and single-parent families have been increasing over
time, and unemployed people and non-standard workers have increased, especially since the late
1990s. Kohara and Ohtake (2006) also pointed out that the growing income gap in the late 1990s in
Japan is associated with an increase in income and consumption inequality within the unemployed,
especially among those aged 45 and over.
Since the late 1990s, the male employment rate of the working-age population has declined and
male non-standard employment has increased. The male employment rate of those aged 25-34 was
about 95% in the early 1990s, but declined to about 90% in the 2000s. Even among the employed,
the ratio of non-standard employees such as part-time workers, contract workers, and casualized
workers to total workers has increased over the last three decades in Japan. The share of
non-standard employees was 15.3 percent in 1984 and reached 35.1 percent in 2012. Among males,
a dramatic change in the ratio of non-standard employees occurred around the mid-1990s. Before
1995, the non-standard ratio for males was stable at roughly 8 percent. The ratio started to increase
after 1996, and reached about 18 percent in 2005. This change is prominent even among prime-age
men. For the male age group 25 to 34, the ratio of non-standard employees started to increase in
1996, reaching 13 percent in 2005. The ratio for the age group 35 to 54 started to increase in 2000,
reaching about 8 percent by the mid-2000s.

GINI Country Report Japan
Page 3
The increase in the rate of male non-standard employees is due to employment adjustments that
started in earnest from 1995 after the asset inflation-fed economic bubble burst. In Japan, full-time
permanent employees benefit from a high level of job security, whereas employment adjustments
targeting non-standard workers are carried out relatively easily. In response to economic recessions,
many Japanese companies avoided employing full-time employees in favor of part-time employees,
contract employees, and casualized employees, because of the sizable cost of employment
adjustments. Because these non-standard employees’ average earnings are lower than those of
full-time employees, increasing non-standard employment and labor market segmentation have led
to a widening income gap.
The growing share of male non-standard employees explained above caused an increase in the lower
income group in Japan. Japan’s poverty rate has increased since the mid-1990s. In particular, a rise in
the poverty rate is observed among people aged 20-39 and aged nine and under, which is distinctive
of Japan’s poverty. The income and wealth gap has been becoming more serious recently among the
young.
In the late 1990s, when income inequality widened mainly because of the increase in the population
of lower income groups, Japanese society experienced several important social changes. First, the
crime rate increased in the 2000s. In particular, the rate of violent offenses rose in the late 1990s.
Ohtake and Kohara (2010) and Kawashima (2012) found that widening income inequality led to an
increasing crime rate. Second, from the late 1990s, the suicide rate increased since the late 1990s and
remained at a high level.
Japan’s income inequality has widened, but Japanese attitudes towards income redistribution policies
did not change in the 2000s. Approximately 70% of Japanese think: “The poor are lazy.” The
percentage of people who agree that “it is the responsibility of the government to reduce differences
in income between families with high incomes and those with low incomes,” was about 50%, but

GINI Country Report Japan
Page 4
increased to 60%. Attitudes towards the government’s role in reducing income inequality have
changed, although the changes do not seem to be overly dramatic.
As one of features of Japanese attitudes about political participation, there is a wide generational
difference in voting rate. The voting rate of people aged 55 and above is 25% higher than that of
people aged 35 and under. This high generational difference in the voting rate in Japan is remarkable
among OECD countries. The higher absolute numbers of elderly people and the higher voting rate of
the elderly increasingly strengthen their political power. This makes society pay more political
attention to the elderly, which might bring undesirable results: in the past, many elderly people were
in the lower income group, but at present, poverty is more prevalent among adults aged under 40
years and children aged ten years and under.
The increasing political power of the elderly and little change in attitudes towards income
redistribution policies suggest that more efficient policies to reduce income inequality have not been
implemented. Japan’s minimum wage rates have been rising consistently since 2007, but the increase
in the minimum wage is thought to have only small effects on alleviating existing levels of income
inequality (Kawaguchi and Mori, 2009). The impact of income redistribution policies through income
tax has been smaller. This is because the maximum income tax rate has been cut and the
progressiveness of income taxes as a whole was reduced in the late 1990s. The Japanese government
has increased fiscal spending on social security for the elderly, but not on job training and education
for the working population. Although there is an urgent need for policies that address lower income
groups, which mainly consist of younger people, the government has failed to formulate and
implement more efficient policies for financial and political reasons.

GINI Country Report Japan
Page 5
General Background to Macro and Structural Indicators in Japan, 1980-2010
Macroeconomic shocks that hit Japan from 1980 to 2010 are featured by an appreciation of the yen
after the 1986 Plaza Accord, the asset inflation-fed bubble economy in the late 1980s and early 1990s,
the non-performing loan problem and employment adjustments in the mid-1990s after the economic
bubble burst, the economic recession that resulted from the 1998 financial crisis, the economic
recovery in the early 2000s, and the economic declines that followed the collapse of Lehman
Brothers.
Japan’s economy fell into recession temporarily due to the deteriorating profitability of exports that
resulted from the appreciation of the yen after the 1986 Plaza Accord. Aiming to recover from the
recession caused by the strong yen, Japan initiated expansionary financial policies. The government’s
intervention led to an increase in asset prices such as stock and housing prices and a rise in real GDP
growth from 4% in the early 1980s to 7.1% in 1988, which was followed by a real GDP growth rate of
5% growth on average until the 1990s. The unemployment rate rose from 2% in 1980 to 2.8% in 1987.
During the period of the bubble economy, the unemployment rate declined to about 2% in
1990-1992; accordingly, Japan experienced a serious labor shortage. Japan also faced economic
challenges such as a rapid rise in asset prices and overheating of economic activity, which led to the
government tightening the money supply. As a result, stock prices dropped sharply in 1991 and house
prices started to fall. This meant the eventual collapse of the bubble.
Due to the decline of stock prices, Japanese financial institutions faced the problem of
non-performing loans. During the period of the economic bubble, Japan was confronted with
problems of outstanding capitals, loans, and employment. After the bubble burst, the adjustment
process for those outstanding capitals and employment took a long time. This resulted in Japan’s
prolonged stagnation, which is referred to as the “Lost Two Decades.” The reasons behind Japan’s

GINI Country Report Japan
Page 6
Great Recession are thought to be the economic bubble and the bursting of the bubble, and some
people see the decline of Total Factor Productivity (TFP) in the 1990s as another important factor
accounting for the recession.
In the mid-1990s, the economic recession continued in the wake of the bursting of the bubble, and
the Asian financial crisis in 1997 and the economic recession from 1998 aggravated economic
conditions, which led to large-scale unemployment. In the early 2000s, the decline in the value of the
yen contributed to revitalizing export-driven industries, and this led to the continuous growth of real
GDP. This economic recovery was interrupted by the crisis that followed the collapse of Lehman
Brothers. This unexpected crisis caused a temporary large-scale employment adjustment. Since the
1990s, Japan’s economy has experienced a long period of zero or negative inflation rates. Japan’s
financial policy is also characterized by long-term zero interest rates. The GDP deflator became
negative after 1995, and declined by more than 1% every year from 1999 to 2008.
The most significant structural change in Japan’s economy is population aging. In the 1980s, the
percentage of people aged 60 and above accounted for 9.1% of the total population, but the share of
the elderly rose to 22.5% in 2010. On the other hand, the percentage of people aged 15 and under
declined from 23.5% in 1980 to 14.3% in 2010. Population aging stems from longer life expectancy
and lower fertility rate. Recently, the latter has had a bigger effect on the aging of society, and the
population of Japan began to decline in 2010. The change in Japan’s inequality is attributed to both
population aging and macroeconomic shocks. A long-term upward trend in inequality is mainly the
result of population aging. Income inequality within age groups is greater among the elderly than the
young. In addition, an increase in the employment adjustment after the bubble burst increased the
number of the unemployed and non-standard employees, and this led to an increase in the number
of people in the lower income group. Likewise, population aging and an increase of non-standard
employees are the two main factors accounting for income inequality.
Figure 1.1: Historical changes in Japan’s GDP growth rates

GINI Country Report Japan
Page 7
Source: The graph was drawn by the authors based on official GDP growth rate (supplied by Cabinet Office,
Government of Japan (http://www.esri.cao.go.jp/jp/sna/menu.html)).
Note: Annual GDP growth rates are shown in the figure.
6,8
8,1
6,6
11,2
12,0
11,7
7,5
10,4 9,5
6,2
11,0
11,0
12,4 12,0
8,2
5,0
9,1
5,1
-0,5
4,0
3,8 4,5
5,4 5,1
2,5
3,9
3,1 3,5
4,8
6,3
1,9
6,1
6,4
4,6
6,2
2,3
0,7
-0,5
1,5
2,7 2,7
0,1
-1,5
0,5
2,0
-0,4
1,1
2,3
1,5
1,9
1,8
1,8
-3,7
-2,0
3,4
0,3
-6
-4
-2
0
2
4
6
8
10
12
14
19
56
19
57
19
58
19
59
19
60
19
61
19
62
19
63
19
64
19
65
19
66
19
67
19
68
19
69
19
70
19
71
19
72
19
73
19
74
19
75
19
76
19
77
19
78
19
79
19
80
19
81
19
82
19
83
19
84
19
85
19
86
19
87
19
88
19
89
19
90
19
91
19
92
19
93
19
94
19
95
19
96
19
97
19
98
19
99
20
00
20
01
20
02
20
03
20
04
20
05
20
06
20
07
20
08
20
09
20
10
20
11
(%)
1986:
Plaza
Accord
Late 1980s-
Early 1990s
1997: Asian
Financial
Crisis
Early
2000s
:
Economic
Recovery
2008: Lehman
Shock

GINI Country Report Japan
Page 8
2. The Nature of Inequality and its Development over Time
2.1. Has Inequality Grown?
According to the OECD (2008), Japan’s Gini coefficient is close to the OECD average, at the same level
as Korea, Canada, Spain, and Greece, lower than the US and UK, and higher than France and the
Nordic countries (Figure 2.1). It is noted, however, that the Gini coefficient must be compared
carefully among countries where different household groups are targeted and different welfare
measures are used for measuring the Gini coefficient. In the case of Japan, the Gini coefficient is
usually measured based on three large samples of data compiled by the Government: (1) National
Survey on Family Income and Expenditure, which is compiled by Statistic Bureau, Ministry of Internal
Affairs and Communications, (2) Comprehensive Survey on Living Conditions, which is compiled by
Ministry of Health, Labour and Welfare, and (3) Survey on the Redistribution of Income, which is
compiled by Ministry of Health, Labour and Welfare. Although these data sets contain large
samples—NSFIE covers more than 55,000 households every five years, Comprehensive Survey on
Living Conditions covers about 50,000 households every year, and Survey on the Redistribution of
Income covers about 5,000 households—they show different degrees of inequality.
Figure 2.2 shows the trend of Japan’s household income inequality over the past three decades based
on the above three sources of data for pre-tax income as measured by the Gini coefficient. In the
figure, the Gini coefficient based on National Survey on Family Income and Expenditure is that
reported by the government every five years. Although the calculation includes households
regardless of their household heads’ employment status or employment type, it excludes single
households. The Gini coefficient based on the Comprehensive Survey on Living Conditions is
calculated by the authors based on income-class data reported by the government (income quartile
before 1985 and income quintile after 1986). It may be upwardly biased because we use group data,

GINI Country Report Japan
Page 9
although single households are also included in the calculations. The Gini coefficient based on the
Survey on the Redistribution of Income is also reported by the government.1
Figure 2.1: International comparison of Gini coefficients in the mid-2000s
Source: Gini coefficients of income inequality in OECD countries, mid-2000s (Figure 1.2) in Growing Unequal?
Income Distribution and Poverty in OECD Countries (OECD (2008);
Generally, the Survey on the Redistribution of Income shows much higher inequality compared to the
other two data sets. This is because more aged people are covered by the sample. The other two
datasets show different levels of inequality, but the same trend of inequality. The Japanese
government now provides inequality measures in Comprehensive Survey on Living Conditions to the
1 For Comprehensive Survey on Living Conditions, we use income group data, but not that reported by the
government, because the Gini coefficient is not reported before 1992.
0,00
0,05
0,10
0,15
0,20
0,25
0,30
0,35
0,40
0,45
0,50
DN
K
SWE
LUX
AU
T
CZE
SVK
FIN
BEL
NLD
CH
E
NO
R
ISL
FRA
HU
N
DEU
AU
S
OEC
D-3
0
OEC
D-3
0
KO
R
CA
N
ESP
JPN
GR
C
IRL
NZL
GB
R
ITA
PO
L
USA
PR
T
TUR
MEX

GINI Country Report Japan
Page 10
OECD, although it formerly provided those on National Survey on Family Income and Expenditure.
The differences between the two data sets arise partly because the sample coverage is different.2
Figure 2.2 Gini coefficients based on the three data sets b
Source: Authors’ calculation based on:
Gini coefficients by Comprehensive Survey on Living Conditions (CSLC), calculated using before-tax income
quartile data before 1985, and before-tax income quintile data after 1986, both of which are reported by
Ministry of Health, Labour and Welfare (MHLW).
Gini coefficients from Income Redistribution Survey (IRS), calculated using before-tax income, which are
reported by MHLW.
Gini coefficients from National Survey of Family Income and Expenditure (NSFIE), calculated using before-tax
income for all families with two or more family members, which are reported by the Statistics Bureau.
Note: The dotted lines in the figure are drawn simply by connecting each of the data points.
Based on the Comprehensive Survey on Living Conditions or National Survey on Family Income and
Expenditure, we can say that income inequality has not been increasing dramatically since around
1980, but has been increasing gradually. Note here that income inequality has several defects for
2 Because the National Survey on Family Income and Expenditure surveys details daily consumption precisely,
households in the tails of income distribution can be dropped from respondents.
0
0,2
0,4
0,6
19
76
19
78
19
80
19
82
19
84
19
86
19
88
19
90
19
92
19
94
19
96
19
98
20
00
20
02
20
04
20
06
20
08
20
10
CSLC(based on income quintile data after 1986)
CSLC(based on income quartile data before 1985)

GINI Country Report Japan
Page 11
measuring true household welfare. Income statistics are affected greatly by fluctuations in temporary
income, but a change in temporary income does not always reflect a change in household welfare. In
addition, income statistics do not reflect lifetime welfare. Because elderly people have more asset
holdings but less income, income inequality has not properly measured the gap in social welfare,
especially in a country such as Japan where an aging population occupies a large share of the entire
population. Besides, because labor force participation rates are high in Japan, income inequality
among the elderly is high. Thus, we want to show inequality based on a different measure of
welfare—Consumption expenditure. Unlike income, consumption expenditure may reflect an
individual’s welfare in the long run. Individuals consume more if they have money to survive and if
their life-time income is higher. Fortunately, in Japan, the National Survey on Family Income and
Expenditure (hereafter referred to as NSFIE) reports household consumption expenditure in detail.
Therefore, in this chapter, we attempt to show the results using consumption inequality as well as
income inequality based on NSFIE.3
2.1.1. Income Inequality and Consumption Inequality
NSFIE reports all types of income such as labor income, agricultural income, rent, pensions, other
social security payments, income from dividends, interest, and occasional work. To obtain the Gini
coefficient for after-tax income, we need to calculate the amount of tax each household pays, using
information on household and individual characteristics. This is because the NSFIE (and any other
microdata with large samples) does not contain information on an individual’s tax. By comparing
observed characteristics such as family types, ages of family members, working status, and types of
income in NSFIE with the taxation system in the corresponding year, we estimated tax payments and
3 We are allowed to use microdata of the NSFIE, which includes all types of individual and household in any age
group. The following figures are calculated by the authors.

GINI Country Report Japan
Page 12
disposable income for each household. Our calculation program is sketched in Appendix Figure 1–
Panel A for national income taxation and Panel B for local income taxation. To calculate the Gini
coefficient, we divide all values of income and consumption by the square root of the total number of
household members. Note that we use the micro data of the NSFIE in this calculation, unlike the case
where we used the aggregated data based on the NSFIE for the previous figure, so that we can
include both single households and households with more than two household members.
Figure 2.3 shows that the calculated Gini coefficients and their changes for each income and
consumption category. Gini coefficients based on any of the categories show that inequality
increased between 1984 and 1989, its rate slowed between 1989 and 1994, and it increased
significantly after 1994. Through the earliest to the latest endpoints in the figure, we can observe an
upward trend of inequality. Looking at each measure, specifically, the coefficient based on before-tax
income is the highest. After excluding tax payments, which means after redistribution, the Gini
coefficient for disposable income becomes lower. The Gini coefficient for consumption expenditure is
somewhat higher than that based on disposable income. This may happen because disposable
income here is estimated from observed characteristics, but is not calculated completely.
The important point here is that Gini coefficients based on consumption are generally lower than
before-tax income. Indeed, the lowest Gini coefficient is for non-durable expenditures. The
fluctuation range when using the consumption measure is smaller. This is exactly what the
permanent income hypothesis suggests. This difference must be important especially in a country
such as Japan, where the population is aging. The elderly may not have high incomes, but may
possess large amounts of assets. Inequality as a whole can be overestimated with income measures.

GINI Country Report Japan
Page 13
Figure 3.3: Gini coefficient for income and consumption
Source: Authors’ calculations using microdata of the NSFIE.
Note: We used an equivalence scale for the number of household members. That is, each household income
and consumption expenditure is divided by the square root of the number of household members.
2.1.2. Wealth Inequality
Japan’s wealth inequality has also increased gradually over the period encompassing the 1980s,
1990s, and 2000s. Figure 2.4 shows changes in financial assets using NSFIE. Total household asset
holdings (excluding the value of real estate) divided by the same equivalence scale as before is used
for the calculation. The figure shows a similar trend of inequality as income and consumption
inequalities. That is, wealth inequality increased between 1984 and 1989, it decreased between 1989
and 1994, and it expanded after 1994.
0,2
0,21
0,22
0,23
0,24
0,25
0,26
0,27
0,28
0,29
0,3
19
84
19
89
19
94
19
99
20
04
Before Tax Income Disposable Income Consumption Consumption of Non-durables

GINI Country Report Japan
Page 14
Figure 2.4: Gini coefficient for financial asset holdings
Source: Authors’ calculations using microdata of the NSFIE.
Note: For the calculation, total household asset holdings is divided by the square root of the number of
household members.
Sudo, Suzuki, and Yamada (2012) also report the same trend. That is, inequality of financial wealth,
like that of wage income, grew rapidly from 1984 to 1989, fell for a decade, and again grew
moderately from 1994 until 2009. The increase in inequality was driven by high-wealth households,
say the top 5%. The wealth inequality in Japan is small compared to that in the U.S., and is
comparable to that in Canada.
2.1.3. Poverty
Using the NSFIE, we calculate the proportion of people with income/consumption of less than half
the median income/consumption. For the calculation, we divide each household income or
consumption by the square root of the number of household members. Samples with less than zero
taxable income, disposable income, or consumption are dropped from the calculation.
Figure 2.5 shows that poverty rates are higher when the rate is defined using income such as taxable
0,5
0,525
0,55
0,575
0,6
0,625
0,65
19
84
19
89
19
94
19
99
20
04

GINI Country Report Japan
Page 15
income or disposable income, than when the rate is defined using consumption expenditure. The
poverty rate calculated from income data of the NSFIE remains at around 8%. On the other hand, the
poverty rate defined from consumption expenditure ranges between 5% and 6%. The reason why the
poverty rate calculated from consumption expenditure is lower is that some people facing an income
drop can cope by reducing their savings, by borrowing, and/or by receiving other transfer incomes to
sustain the same level of consumption, while other people facing an income increase may restrain
expenditure to protect against future shocks by raising savings, investment, and/or transferring to
others.

GINI Country Report Japan
Page 16
Figure 2.5: Poverty rates according to the NSFIE
Source: Authors’ calculations using microdata of NSFIE.
Note: The figure shows the ratio of the number of people whose income is less than or equal to half of the
national median income. For the calculation, household income and consumption expenditure are divided by
the square root of the number of household members.
2.1.4. Public Assistance (Public Livelihood Aid) for Poor Families
In Japan, public livelihood aid is calculated on a household basis not an individual basis. The
government calculates “affordable income” for each household, and “minimum living cost” mainly
based on family type. If affordable income is less than the minimum cost of living, public income
assistance is distributed to that household. Affordable income includes income earnings, all financial
assets, value of real estate, social security benefits except public income assistance each household
member can receive, and cash transfers households can receive from other extended family
members.
Figure 2.6 shows the historical trend of welfare recipients, where recipients are defined as those who
receive public assistance at least once a month, and is calculated as the average number of recipients
every year. The figure shows that recipients have been increasing consistently since the latter half in
1990s. The rate of households receiving public assistance has recently overtaken the level in 1970.
Details of households living on welfare are described later in Chapter 5.
0
1
2
3
4
5
6
7
8
9
10
19
84
19
89
19
94
19
99
20
04
(%)
Income Before Tax Disposable Income Consumption Expenditure

GINI Country Report Japan
Page 17
Figure 2.6: Changes in the number of households living on welfare
Source: Care Reports of Welfare Administration (Ministry of Health, Labour and Welfare (2010)).
Note: The bars show the number of people living on welfare support, which is measured on the right axis. The
line shows their percentage (number relative to 1,000 persons), which is measured on the left axis.
2.1.5. Educational Inequality
Table 2.1 shows the average years of education for various countries. Japan is ranked in the higher
group. Figure 2.7 shows that the Gini coefficient for years of education becomes smaller as age
decreases for groups aged between 60 and 85. The Gini coefficient becomes gradually higher as age
decreases for groups aged between 35 and 39, and it becomes clearly higher as age decreases for
groups aged between 20 and 34. Because Japanese people rarely go back to school once they started
working, this trend means that the inequality in years of education fell in the 1960s, started
increasing in the early 1970s, and increased gradually for three decades, expanding further from the
early 2000s.
Table 1.1: Mean years of education
Country Mean Education Years
500 000
1 000 000
1 500 000
2 000 000
2 500 000
0
0,005
0,01
0,015
0,02
0,0251
95
5
19
61
19
63
19
65
19
67
19
69
19
71
19
73
19
75
19
77
19
79
19
81
19
83
19
85
19
87
19
89
19
91
199
31
99
5
19
97
19
99
20
01
20
03
20
05
20
07
20
09
(people) (% )

GINI Country Report Japan
Page 18
Portugal 6.870
Spain 10.075
Italy 10.189
Hungary 10.488
Poland 10.493
Germany 10.524
Slovenia 10.889
Bulgaria 11.041
Switzerland 110148
Austria 11.458
Mean – all countries 11.514
Sweden 11.631
Belgium (Flanders) 11.794
Slovak Republic 11.795
Australia 11.835
Latvia 12.020
Finland 12.043
Ireland 12.056
Japan 12.148
Czech Republic 12.212
Denmark 12.571
Norway 12.844
Netherlands 12.880
France 12.909
Canada 14.412
Source: International Social Survey Programme (Mechi and Scervini (2010): A new dataset on educational
inequality).
Figure 2.7: Educational inequality among age groups

GINI Country Report Japan
Page 19
Source: International Social Survey Programme (Mechi and Scervini (2010): A new dataset on educational
inequality).
Note: Gini coefficients of years of education are listed separately by birth cohort. The weighted average of Gini
coefficients over all age groups is 0.103677, where the weight is the population in each age group.
2.1.6. Labour Market Inequality
Figure 2.8 shows the male wage gap between 90 percentile and 50 percentile of income distribution,
while Figure 2.9 shows that between 50 percentile and 10 percentile. As a general tendency of wage
inequality, until the mid-1990s, the wage income difference decreased or remained unchanged for
any age group before 60 years old. This is observed both for 90-50% difference and 50-10% difference.
Since 1997, however, the trends have differed: the 50-10% wage gap has apparently expanded, while
the 90-50% gap has been rather stable. An increase in Japan’s wage inequality after the mid-1990s
has come with an increase in the number of persons in lower wage groups.
For females, the trend is quite different. The 90-50% wage gap decreased dramatically after 1987,
and continued to follow a downward trend or remained unchanged after 1995. This is attributed to
the Gender Equal Employment Opportunity Law promulgated in 1986. The 50-10% wage gap has
been rather stable, but increased gradually from the mid-1990s, as it did for males.
Figure 2.8: Log wage differences for men between the 90th and 50th percentiles
00,020,040,060,08
0,10,120,140,160,18
20
-24
25
-29
30
-34
35
-39
40
-44
45
-49
50
-54
55
-59
60
-64
65
-69
70
-74
75
-79
80
-84
Age groups (years old)
Gini Coefficient of Eucational Years in Japan (by Age group)

GINI Country Report Japan
Page 20
Source: Basic Survey of Wage Structure (Ministry of Health, Labour, and Welfare).
Note: The figure depicts the average log wages across all industries and education-level groups, separately by
birth cohort. Because the reported age categories in the original data set differ across years for those aged 60
and over, here we list figures only for those aged less than 60 years. All ages show the average for all ages
including those aged 60 and over, which is not shown in the figure, so the figures for All ages may be higher
than those for other age groups.
0,1
0,2
0,3
0,4
0,5
0,6
0,7
0,81
98
0
19
81
19
82
19
83
19
84
19
85
19
86
19
87
19
88
19
89
19
90
19
91
19
92
19
93
19
94
19
95
19
96
19
97
19
98
19
99
20
00
20
01
20
02
20
03
20
04
20
05
20
06
20
07
20
08
20
09
20
10
20
11
All ages Age 20-24 Age 25-29 Age 30-34 Age 35-39
Age 40-44 Age 45-49 Age 50-54 Age 55-59

GINI Country Report Japan
Page 21
Figure 2.9: Log wage differences for men between the 50th and 10th
Source: Basic Survey of Wage Structure (Ministry of Health, Labour, and Welfare).
Note: See the note to the previous figure.
Figure 2.10: Log wage differences for women between the 90th and 50th
Source: Basic Survey of Wage Structure (Ministry of Health, Labour, and Welfare).
Note: See the note to the previous figure.
0,1
0,2
0,3
0,4
0,5
0,6
0,7
0,81
98
0
19
81
19
82
19
83
19
84
19
85
19
86
19
87
19
88
19
89
19
90
19
91
19
92
19
93
19
94
19
95
19
96
19
97
19
98
19
99
20
00
20
01
20
02
20
03
20
04
20
05
20
06
20
07
20
08
20
09
20
10
20
11
All ages Age 20-24 Age 25-29 Age 30-34 Age 35-39
Age 40-44 Age 45-49 Age 50-54 Age 55-59
0,1
0,2
0,3
0,4
0,5
0,6
0,7
0,8
19
80
19
81
19
82
19
83
19
84
19
85
19
86
19
87
19
88
19
89
19
90
19
91
19
92
19
93
19
94
19
95
19
96
19
97
19
98
19
99
20
00
20
01
20
02
20
03
20
04
20
05
20
06
20
07
20
08
20
09
20
10
20
11
All ages Age 20-24 Age 25-29 Age 30-34 Age 35-39Age 40-44 Age 45-49 Age 50-54 Age 55-59

GINI Country Report Japan
Page 22
Figure 2.11: Log wage differences for women between the 50th and 10th percentiles
Source: Basic Survey of Wage Structure (Ministry of Health, Labour, and Welfare).
Note: See the note to the previous figure.
What happened in the labor market that lies behind this increase in wage inequality among low wage
groups? First, the unemployment rate skyrocketed from the mid-1990s after the economic bubble
burst. Figure 2.12 shows this trend clearly both for males and females. Decomposing to age groups,
Figure 2.13 shows that the situation was more serious for young males. In Japan, workers are, once
employed, protected by laws imposing severe requirements on employers laying off employees and
by traditional employment schemes such as the seniority system. Therefore, young workers have
more difficulty entering the labor market or moving to different jobs.
0,1
0,2
0,3
0,4
0,5
0,6
0,7
0,81
98
0
19
81
19
82
19
83
19
84
19
85
19
86
19
87
19
88
19
89
19
90
19
91
19
92
19
93
19
94
19
95
19
96
19
97
19
98
19
99
20
00
20
01
20
02
20
03
20
04
20
05
20
06
20
07
20
08
20
09
20
10
20
11
All ages Age 20-24 Age 25-29 Age 30-34 Age 35-39
Age 40-44 Age 45-49 Age 50-54 Age 55-59

GINI Country Report Japan
Page 23
Figure 2.12: Unemployment rate
Source: Labor Force Survey (Ministry of Internal Affairs and Communications (2010)).
Figure 2.13: Unemployment rate by age group and gender
Panel A. Male
0,0
1,0
2,0
3,0
4,0
5,0
6,01
95
3
19
55
19
57
19
59
19
61
19
63
19
65
19
67
19
69
19
71
19
73
19
75
19
77
19
79
19
81
19
83
19
85
19
87
19
89
19
91
19
93
19
95
19
97
19
99
20
01
20
03
20
05
20
07
20
09
20
11
(%)
Total Male Female
0
2
4
6
8
10
12
14
19
89
19
90
19
91
19
92
19
93
19
94
19
95
19
96
19
97
19
98
19
99
20
00
20
01
20
02
20
03
20
04
20
05
20
06
20
07
20
08
20
09
(%)
Age 15-24 Age 25-34 Age 35-44 Age 45-54 Age 55-64

GINI Country Report Japan
Page 24
Panel B. Female
Source: Labor Force Survey (Ministry of Internal Affairs and Communications)
Note: The listed unemployment rates are based on official data for every February from 1989 to 2009.
Table 2.2 summarizes the trend of the employment rate. The total employment rate decreased by
about 1% between 1983 and 1988, and increased by about 2.5% between 1989 and 1992. It then
started decreasing steadily after the economic bubble burst: decreased by about 5% between 1993
and 2004. It has remained at around 58% since 2007.
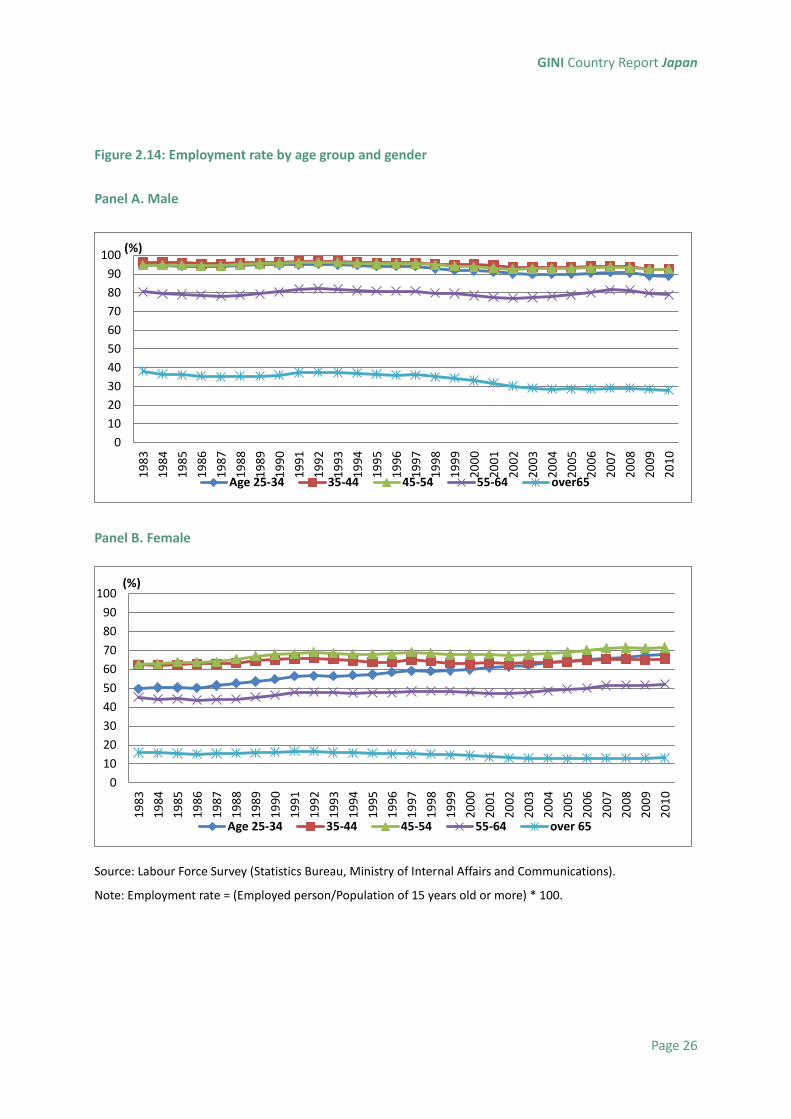
Figure 2.14 shows the trend of the employment rate for males (Panel A) and females (Panel B)
separately by age group. The male employment rate in the working-age population decreased in the
late 1990s. Especially for those aged 25-34, it was about 95% in the early 1990s, but declined to less
than 90% in the 2000s. For females, the employment rate increased for all age groups, but it is not at
a high level yet: Japan’s employment rate for those aged 15-64 was 60.1% in 2010 (Labour market
statistics, OECD Employment and Labour Market Statistics), which is lower than in North European
countries (70-80%), the United States (62.4%), the United Kingdom (65.3%), and Germany (66.1%),
but is at the same level as France (59.7%).
0
2
4
6
8
10
12
141
98
9
19
90
19
91
19
92
19
93
19
94
19
95
19
96
19
97
19
98
19
99
20
00
20
01
20
02
20
03
20
04
20
05
20
06
20
07
20
08
20
09
(%)
Age 15-24 Age 25-34 Age 35-44 Age 45-54 Age 55-64

GINI Country Report Japan
Page 25
Table 2.2: Employment rate
Year Employment
rate (%)
Total Age 15-24 25-34 35-44 45-54 55-64 over 65
1983 62.1 42.2 72.3 79.2 78.6 61.3 25.1
1984 61.7 41.6 72.5 79.1 78.7 60.5 24.3
1985 61.4 40.8 72.4 79.1 78.9 60.6 23.9
1986 61.1 40.9 72.4 79.2 79.0 60.2 23.4
1987 60.8 40.4 73.1 79.2 79.1 60.4 23.3
1988 61.0 40.5 73.8 79.6 80.1 60.7 23.5
1989 61.4 41.2 74.4 80.3 81.0 61.7 23.6
1990 61.9 42.2 75.1 80.8 81.6 62.9 24.1
1991 62.4 43.5 75.9 81.2 82.0 64.4 24.9
1992 62.6 44.5 76.2 81.4 82.5 64.6 25.1
1993 62.2 44.7 75.9 81.0 82.2 64.5 24.6
1994 61.8 45.0 75.8 80.5 81.9 63.7 24.5
1995 61.4 44.8 76.0 79.9 81.8 63.8 24.2
1996 61.4 45.1 76.6 79.9 81.9 63.6 23.8
1997 61.5 45.3 76.8 80.6 82.2 64.2 23.9
1998 60.7 44.6 76.1 79.8 81.7 63.7 23.3
1999 59.9 42.9 75.9 79.1 81.0 63.5 22.9
2000 59.5 42.8 76.0 79.0 80.7 62.8 22.1
2001 58.9 42.0 76.1 79.1 80.5 62.0 21.2
2002 57.9 41.0 75.8 78.4 79.9 61.7 20.9
2003 57.6 40.3 76.2 78.6 80.3 62.1 19.7
2004 57.6 40.0 77.0 78.5 80.5 63.1 19.4
2005 57.7 40.8 77.3 78.9 81.1 63.8 19.4
2006 57.9 41.3 78.0 79.4 81.7 64.7 19.4
2007 58.1 41.5 78.6 79.8 82.4 66.1 19.7
Source: Labour Force Survey (Statistics Bureau, Ministry of Internal Affairs and Communications).
Note: Employment rate = (Employed person/Population of 15 years old or more) * 100.
GINI Country Report Japan
Page 26
Figure 2.14: Employment rate by age group and gender
Panel A. Male
Panel B. Female
Source: Labour Force Survey (Statistics Bureau, Ministry of Internal Affairs and Communications).
Note: Employment rate = (Employed person/Population of 15 years old or more) * 100.
0
10
20
30
40
50
60
70
80
90
100
19
83
19
84
19
85
19
86
19
87
19
88
19
89
19
90
19
91
19
92
19
93
19
94
19
95
19
96
19
97
19
98
19
99
20
00
20
01
20
02
20
03
20
04
20
05
20
06
20
07
20
08
20
09
20
10
(%)
Age 25-34 35-44 45-54 55-64 over65
0
10
20
30
40
50
60
70
80
90
100
19
83
19
84
19
85
19
86
19
87
19
88
19
89
19
90
19
91
19
92
19
93
19
94
19
95
19
96
19
97
19
98
19
99
20
00
20
01
20
02
20
03
20
04
20
05
20
06
20
07
20
08
20
09
20
10
(%)
Age 25-34 35-44 45-54 55-64 over 65

GINI Country Report Japan
Page 27
In addition to this increase in the unemployment rate and decrease in the employment rate, the
increase in non-standard workers has raised social issues related to inequality. The ratio in Japan of
non-standard employees such part-time workers, casualized workers, and contract workers has
increased over the last three decades. The share of non-standard employees was 15.3 percent in
1984 and reached 35.1 percent in 2012. Figure 2.15 shows this trend. In the case of the female labor
force, more than half are now non-standard employees.
As for males, the share of non-standard employees was very low. A dramatic change in the ratio of
non-standard employees among males occurred around the mid-1990s. Before 1995, the
non-standard ratio for males was stable at roughly 8 percent. The ratio started to increase after 1996
and reached about 18 percent in 2005. This change is prominent among prime-age men. Before 2005,
most Japanese prime age males worked as regular employees. The percentage of non-standard
employees among males was about 3 percent before 2005. For the male age group 25 to 34, the ratio
of non-standard employees started to increase in 1996 and reached 13 percent in 2005. The ratio for
the age group 35 to 54 started to increase in 2000 and reached about 8 percent by the mid-2000s.

GINI Country Report Japan
Page 28
Figure 2.15: Proportion of non-standard workers among all employees
Source: The Special Survey of the Labour Force Survey (1984–2001), and Labour Force Survey (2002–present)
(both by Ministry of Health, Labour, and Welfare).
Note: The figure shows the ratio of non-standard workers to employees, excluding executives of companies or
corporations. Non-standard workers include part-time workers, contract employees, and casualized workers.
When discussing Japan’s labor market inequality, close attention needs to be paid to the wage gap
between part-time employees and full-time employees. Figure 2.16 shows the income inequality
between the two. During the period from 1980 to 2002, the hourly wage rate received by part-time
employees declined continually compared to that of full-time employees. In the 2000s, part-time
hourly wages appeared to increase slightly, but male (female) part-time employees are paid only half
(60%) as much as full-time employees. This slight increase has not mitigated large increases in the
share of non-standard workers either of men or women.
0
10
20
30
40
50
60
19
84
19
85
19
86
19
87
19
88
19
89
19
90
19
91
19
92
19
93
19
94
19
95
19
96
19
97
19
98
19
99
20
00
20
01
20
02
20
03
20
04
20
05
20
06
20
07
20
08
20
09
20
10
20
11
20
12
(%)
Total Male Female

GINI Country Report Japan
Page 29
Figure 2.16: Proportion of hourly wage for part-time workers compared with full-time workers
Source: Basic Survey of Wage Structure (Ministry of Health, Labour, and Welfare).
Note: The ratio of hourly wage includes bonuses for part-time workers relative to full-time workers.
To summarize this sub-section, the increase in the unemployed, and the increase in non-standard
workers such as part-time workers, casualized workers, and workers with short-term contracts may
have brought about the increase in wage inequality throughout society. The next section gives more
fundamental reasons for changes in income and wage inequality, decomposing inequality and
poverty by educational groups and age groups.
2.2. Whom has it Affected?
2.2.1. Wage Inequality between Different Education Groups is Stable, but Wage Inequality within
Groups is Increasing.
How are educational attainments related to the increase in wage inequality? Figure 2.17, which is
from Kawaguchi and Mori (2008), indicates that wage inequality is stable, in spite of the increase in
inequality of years of education, which is noted in the previous section. We cannot observe a greater
35
40
45
50
55
60
65
70
19
80
19
81
19
82
19
83
19
84
19
85
19
86
19
87
19
88
19
89
19
90
19
91
19
92
19
93
19
94
19
95
19
96
19
97
19
98
19
99
20
00
20
01
20
02
20
03
20
04
20
05
20
06
20
07
20
08
20
09
20
10
20
11
(%)
Male Female

GINI Country Report Japan
Page 30
disparity among different educational groups for wages. This differs from the findings in other
countries such as the US and the UK. One possible explanation is that more people attained higher
education, so the labor supply of highly educated people increased during the same time as there
was labor demand for highly educated people to adjust for higher technologies and to compete in
globalization.
Figure 2.17: Wage differential between college and high school graduates
Source: Kawaguchi and Mori (2008; Figure 5. Panel E: Relative Wage Rate).
Note: Horizontal axis shows calendar year, and each line of the figure indicates wage differential between
college and high school graduates, grouped by age range.
Figure 2.18 shows how wage inequality has changed among college or university graduates since
1980. Wage inequality within the same educational groups became larger after 1990 for almost all
age groups except that aged 60-64. Kambayashi, Kawaguchi, and Yokoyama (2008) also explained that
the increase in the within-group variance contributed to the wage disparity for males in the late
1990s. Thus, the expansion of wage inequality within college/university groups, but not between
educational groups, led to a larger wage gap after the mid-1990s in the entire country.
Figure 2.18: Log wage difference for male college graduates between the 90th and 10th percentiles

GINI Country Report Japan
Page 31
Source: Basic Survey of Wage Structure (Ministry of Health, Labour, and Welfare).
Note: The dotted line indicates average log wages across all age groups.
As additional information, wage inequality between males and females has been steadily decreasing
in Japan. Figure 2.19 shows that this tendency is found in all educational groups.
0,2
0,4
0,6
0,8
1
1,2
1,4
1,6
19
80
19
81
19
82
19
83
19
84
19
85
19
86
19
87
19
88
19
89
19
90
19
91
19
92
19
93
19
94
19
95
19
96
19
97
19
98
19
99
20
00
20
01
20
02
20
03
20
04
20
05
20
06
20
07
20
08
20
09
20
10
20
11
Total Age 20-24 Age 25-29 Age 30-34 Age 35-39Age 40-44 Age 45-49 Age 50-54 Age 55-59 Age 60-64

GINI Country Report Japan
Page 32
Figure 2.19: Male-female wage differential by educational group
Source: Basic Survey of Wage Structure (Ministry of Health, Labour, and Welfare).
Note: The figure shows the difference in log of monthly contract earnings of regular employees between males
and females.
2.2.2. Inequality Increases as Population Ages.
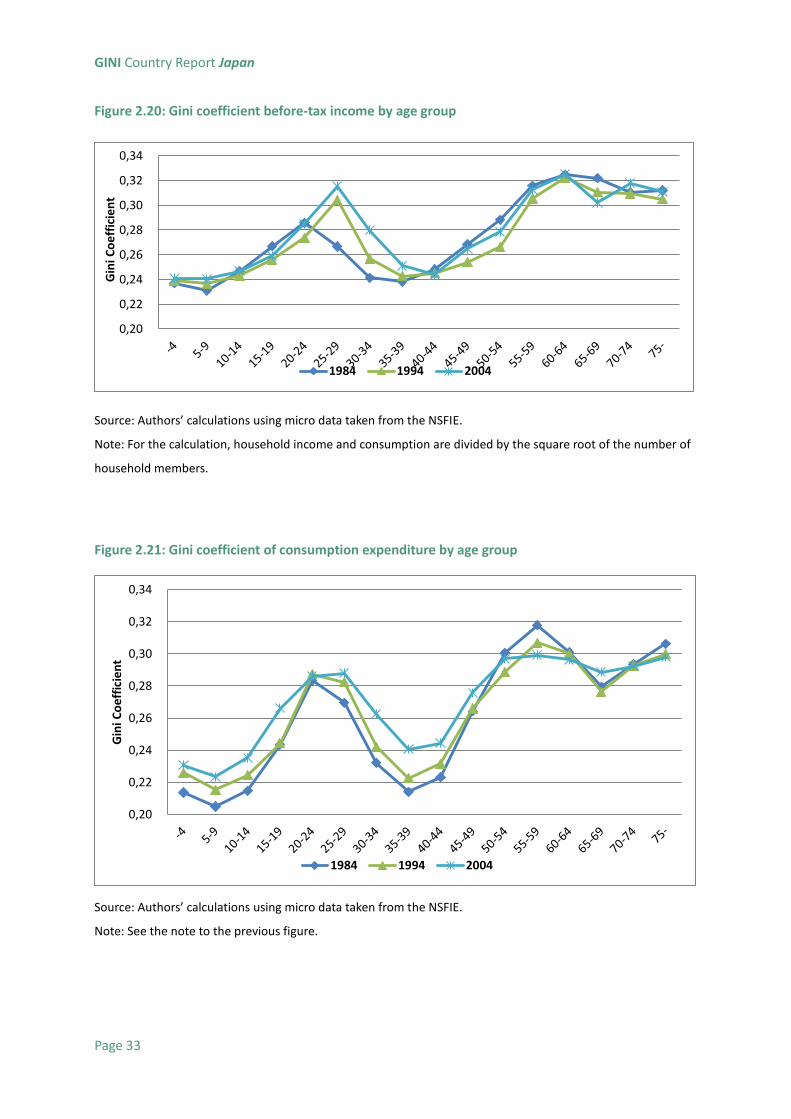
Figure 2.20 shows Gini coefficients by age groups over time. It shows a similar pattern for the periods
when parent and child live together. Income disparity expanded for age groups between late 20s to
the 30s, and for the age group between 5 to 9 years old, whereas such an expansion is not observed
for those aged over 55.
Figure 2.21 shows consumption inequality by age group over time. The disparity in consumption
expenditure is increasing for the following age groups: i) children under 20 years old and ii) their
parents’ age group of 25 to 49 years old. There is no significant change in consumption disparity for
the over 50-years old age group. In the 35- to 49-years old age group, a wider consumption disparity
is observed, although a major change in income disparity is not observed.
0,2
0,3
0,4
0,5
0,6
0,71
98
5
19
86
19
87
19
88
19
89
19
90
19
91
19
92
19
93
19
94
19
95
19
96
19
97
19
98
19
99
20
00
20
01
20
02
20
03
20
04
20
05
20
06
20
07
20
08
20
09
20
10
20
11
Junior high-school graduates High-school graduates College graduates
University (or higher) graduates Total
GINI Country Report Japan
Page 33
Figure 2.20: Gini coefficient before-tax income by age group
Source: Authors’ calculations using micro data taken from the NSFIE.
Note: For the calculation, household income and consumption are divided by the square root of the number of
household members.
Figure 2.21: Gini coefficient of consumption expenditure by age group
Source: Authors’ calculations using micro data taken from the NSFIE.
Note: See the note to the previous figure.
0,20
0,22
0,24
0,26
0,28
0,30
0,32
0,34
Gin
i Co
eff
icie
nt
1984 1994 2004
0,20
0,22
0,24
0,26
0,28
0,30
0,32
0,34
Gin
i Co
eff
icie
nt
1984 1994 2004

GINI Country Report Japan
Page 34
As for inequality in wealth, Figure 2.22 shows that the early 20s and over 50-years old groups had the
largest disparities in financial assets in 1984. However, by 2004, this asset disparity had widened for
children under 10 years old and the 25- to 39-years old age groups, while financial asset disparity
narrowed for the over 50-years old age group. This partly explains the major difference between the
trend of income disparity and consumption disparity by age group shown in Figures 2.20 and 2.21.
That is, the difference in age profile of income and consumption inequality among age groups may be
attributed to the trend of financial assets by age group.
Figure 2.22: Gini coefficient of financial asset holdings by age group
Source: Authors’ calculations using micro data taken from the NSFIE.
Note: See the note to the previous figure.
2.2.3 Who are Poor?
As is easily predicted, the poverty rate is higher among the elderly groups. The important feature in
Japan is, however, that the poverty rate increases sharply among working ages who have children.
Comprehensive Survey on Living Conditions (Ministry of Health, Labour and Welfare (2010)) shows
0,45
0,47
0,49
0,51
0,53
0,55
0,57
0,59
0,61
0,63
1984 1994 2004

GINI Country Report Japan
Page 35
that the poverty rate has increased among working ages from 10.3% of total households classified as
poor (those who have less than half the median income of the entire country) in 1985 to 14.6% in
2009.
Figure 2.23 shows the relative poverty rate measured by income, where the poverty threshold is
households with an annual income less than 50% of the median equivalent household income. The
figure shows that high poverty rates based on disposable income are observed for three age groups:
the over 60-years old elderly group, the late 20s to early 30s group, and under 10-years old group.
It is notable that the poverty rate dropped significantly in the elderly group between 1984 and 1989.
It is also notable that, from the late 1990s to the 2000s, the poverty rate increased for the 25- to
35-years old age group and the under 10-years old age group. In particular, it is marked by a rise in
the poverty rate for the under 5-years old group.
The same implication is found when measuring poverty using consumption expenditure. Figure 2.24
shows that the poverty rate for the elderly measured by consumption expenditure dropped from the
mid- to late-1980s, and has not shown a major change since then. Meanwhile, the poverty rates for
the 25- to 35-years old age group and under 10-years old age group continued to rise throughout the
1990s. As shown by income, the three groups with the highest poverty rates are the elderly over 70
years old, those in their 20s and 30s, and the under 10-years old age group, but the rise in the
poverty rate is especially large for children under five.
The poverty rate among the elderly shows a declining trend, but it still remains at a high level
compared to other age groups. This rapid increase in the proportion of the elderly in the population
make poverty rates look high in the old age groups across society. However, a striking feature of the
recent change is the emergence of new poverty-stricken groups: the under 10-years old children
group and their parents in the 25- to 35-years old group. The serious situations of younger
households must not be overlooked even in an ageing society.

GINI Country Report Japan
Page 36
Figure 2.23: Poverty rates calculated by disposable income
Source: Authors’ calculations using micro data taken from the NSFIE.
Note: The figure shows the ratio of the number of people whose income is less than or equal to half of the
national median income. For calculation, household income and consumption is divided by square root of the
number of household members.
0,00
0,02
0,04
0,06
0,08
0,10
0,12
0,14
0,16
0-4
5-9
10
-14
15
-19
20
-24
25
-29
30
-34
35
-39
40
-44
45
-49
50
-54
55
-59
60
-64
65
-69
70
-74
75
-
Po
vert
y R
ate
1984 1994 2004

GINI Country Report Japan
Page 37
Figure 2.24: Poverty rates calculated by consumption
Source: Authors’ calculations using micro data taken from the NSFIE.
Note: The figure shows the ratio of the number of people whose consumption expenditure is less than or equal
to half of the national median. For the calculation, household consumption is divided by the square root of the
number of household members.
Figure 2.26 shows the age distribution of the poor over time, which is how many people are poor
within each age group. Unlike previous figures showing the poverty rate within the entire population,
this figure indicates that poverty is fairly high and is getting more serious among the younger age
groups.4 In other words, looking at the issue of the poverty rate within the same age group as a
benchmark, it is the children and their parents who are suffering from more serious poverty problem
than before. There is more to this issue than the figures indicate.
4 Because the limited number of samples for those aged over 75 gives unstable results in this group, we should
focus on the figures for groups younger than 74.
0,00
0,02
0,04
0,06
0,08
0,10
0,12
0,14
Po
vert
y R
ate
1984 1994 2004

GINI Country Report Japan
Page 38
Figure 2.25: Age distribution of the poor: percentage of poor within age group
Source: Authors’ calculations using micro data taken from the NSFIE.
Note: The figure shows the percentage of “the poor” within each age category. The poor includes those whose
income is less than or equal to the national median income, after taking equivalent scale of income (household
income is divided by the square root of the number of household members).
2.2.4 Who Receives Public Income Assistance?
Figure 2.26 shows that the number of recipients of public income assistance has increased among
those aged over 60. Note here that the population of this age group is also increasing. The ratio of
recipients rapidly increases among younger generations: the numbers of recipients aged between 20
and 39, and between 0 and 19 years old have increased, although the population in these age groups
is decreasing significantly (Figure 2.27). According to Care Reports of Welfare Administration (2010),
the percentage of recipients working as non-standard employees (day-laborers or side-job workers) is
increasing.
2
3
4
5
6
7
8
9
10
11(%)
1984 1994 2004

GINI Country Report Japan
Page 39
Figure 2.26: Welfare recipients by family type (monthly average)
Source: Care Reports of Welfare Administration (MHLW (2010)).
Note: The number of individuals is measured on the vertical axis.
Figure 2.27: Welfare recipients by age group
Source: National Survey of Public Assistance Recipients (MHLW (2010)).
Note: The number of individuals is measured on the vertical axis.
0
200 000
400 000
600 000
800 000
1 000 000
1 200 000
1 400 000
1 600 0001
98
0
19
81
19
82
19
83
19
84
19
85
19
86
19
87
19
88
19
89
19
90
19
91
19
92
19
93
19
94
19
95
19
96
19
97
19
98
19
99
20
00
20
01
20
02
20
03
20
04
20
05
20
06
20
07
20
08
20
09
20
10
Total Households of the agedHouseholds of the disabled/invalid Households of mother and child(ren)Other Households
0
200.000
400.000
600.000
800.000
1.000.000
1.200.000
1.400.000
1.600.000
1.800.000
2000 2001 2002 2003 2004 2005 2006 2007 2008 2009
0-19 20-39 40-59 60-

GINI Country Report Japan
Page 40
2.3. Chapter Conclusion: Why has Inequality Grown?
The degrees of inequality of income and consumption, measured from individual data, have
increased slightly in 1980s, and have increased significantly after the latter half of 1990s. Such an
increase in individual income disparity resulted mainly from population aging as a long-term trend.
Because income disparity within an age group is high among the elderly, and because the elderly tend
to have lower income, the increase in older people leads to a rise in income inequality across the
entire country. This is also found in the poverty rate. Because the poverty rate within the elder group
is generally high, the poverty rate of the entire country has naturally increased along with population
aging.
In addition to this age-structure change, the decline in income level among the lower income group
of society as a whole contributed to the increase in income inequality in the late 1990s. The widening
wage gap is associated with the decreasing male employment rate and the increasing unemployment
rate of the working-age population since the late 1990s. Moreover, the rise in the share of male
non-standard employees also added to the increase in the wage gap.
The increasing rate of male non-standard employees is due to the employment adjustment that
started in earnest from 1995 after the economic bubble burst. In Japan, full-time permanent
employees benefit from a high level of job security, whereas an employment adjustment targeted at
non-standard workers is carried out relatively easily. In response to the economic recession, many
Japanese companies avoided employing full-time employees in favor of part-time employees because
of a sizable cost of an employment adjustment. Because non-standard employees’ average earnings
are lower than those of full-time employees, increasing non-standard employment and labor market
segmentation have led to a widening of the income gap.
Although skill-biased technological changes have occurred, the wage gap between educational
groups has been stable because both labor supply and demand for workers with higher education
have increased. In comparison, wage income inequality within educational groups has expanded.

GINI Country Report Japan
Page 41
Changes in family structure are also one possible reason for wider household income gaps. The
increases in relatively poor old singles (or couples), relatively poor young singles, and single-parent
households led to expanded income inequality among households. We will see these changes in
family formation later in the next chapter.

GINI Country Report Japan
Page 42

GINI Country Report Japan
Page 43
3. Social Impacts of Inequality
3.1. Introduction
Inequality affects society in many aspects. We first focus on people under a certain living standard:
those who suffer from material deprivation and the homeless. These topics are closely related to
family formation, so we describe how family formation has changed over time. We also describe how
many households own housing, summarizing changes in the price of land.
As another social impact, we will pick up crime, showing how crime rates have changed, summarizing
the economic downturn over time. We further show the relationship between youth crime and the
economic situation of households.
Inequality should be measured not only monetarily, but also from physical and psychological
conditions. We report the situation of health inequality in the country over a period of years. We
then show how it is related to economic conditions. In the final section, we summarize changes in
subjective measures of welfare.
3.2. Cumulative Disadvantage and Multidimensional Measures of Poverty
3.2.1. Material Deprivation
Figure 3.1 shows the percentage of people with difficulty affording daily food, medical and
health-care goods, and clothing needed by a family. Among selected OECD countries, Japan has the
lowest proportion of deprivation in any of these three aspects. However, as Abe (2006) points out,
“relative” deprivation, which is the condition whereby the expected standard of living is not satisfied
due to a lack of the necessary resources, may be high in Japan. Relative deprivation seems to be
higher among working households, especially those with small children.

GINI Country Report Japan
Page 44
Figure 3.1: Financial difficulty meeting everyday expenses (2000)
Source: Measures of Material Deprivation in OECD countries (OECD (2006); Figure 2).
Note: Original data are from the Pew Global Attitude Project. The figure indicates percentages of individuals
reporting three types of financial difficulty in meeting everyday expenses.
3.2.2. Changes in Number of Homeless
We next look at extremely poor people, the homeless. According to the National survey on the Actual
Conditions of the Homeless (Ministry of Health, Labour, and Welfare (2012), the number of homeless
people has been decreasing (Figure 3.2). However, other statistics from the same survey indicate that
the number of people who have been homeless for over five years has been increasing. The
structurally homeless may be increasing.
0
5
10
15
20
25
30
35
40
45
50
Japan Germany France CzechRep.
Canada Italy UnitedKingdom
UnitedStates
Poland Mexico Turkey
Not able to buy food the family neededNot able to pay for medical and health care the family neededNot able to buy clothing the family needed

GINI Country Report Japan
Page 45
Figure 3.2: Number of homeless
Source: National Survey on the Actual Conditions of the Homeless (MHLW (2012)).
Survey on the Actual Conditions of the Homeless compiled by Ministry of Health, Labour, and Welfare
(2012) summarizes the situation of the homeless, using large samples of homeless people. It reports
that the number of homeless people aged over 60 is increasing. Educational level is not very low:
more than half of all homeless have educational levels above high school. About 60% are actually
working. However, the amount of earnings has been decreasing, and has stayed at quite a low level:
about 80% of workers earn less than 5,000 yen (about 50 dollars) per month.
In this sample at least, the homeless do not always have poor health. The most serious problem is
perhaps that those who leave a life of homelessness are decreasing, and those who remain homeless
are increasing, according to samples between 2003 and 2007. Although the number of homeless, on
average, decreases during an economic upturn, some people find it difficult getting out of a homeless
state once they become homeless.
0
5.000
10.000
15.000
20.000
25.000
30.000
20
03
20
07
20
08
20
09
20
10
20
11
20
12
(people)
Male Female Unknown Total

GINI Country Report Japan
Page 46
3.3. Family Formation and Breakdown, Lone Parenthood, and Fertility
When we analyze historical changes of household income inequality, we have to note changes in the
distribution of household size. The distribution of household size has changed substantially in Japan:
the percentage of single-member households increased from 18% in 1980 to 24% in 2005. During the
same period, the average number of household members decreased from 3.2% to 2.7%. The
percentage of households with one or two members increased from 34% in 1980 to 53% in 2005.
3.3.1. Changes in Family Type
The trend of a decrease in household size can be broken down into specific changes in family
formation. Comprehensive Survey of Living Conditions (MHLW) shows historical changes in family
types. Here, family types are categorized as follows: 1. One-person Households; 2. Nuclear
Households, which include (a) Married couple only, (b) Married couple with child(ren), and (c) One
Parent with child(ren); 3. Three-generation Households, and 4. Others. We summarize the statistics in
this sub-section.
There are two apparent changes in family structure, especially after 1985. First, the number of
three-generation households (where grandparent(s), parent(s), and child(ren) co-reside together) has
decreased sharply. Second, the number of singles has increased greatly. The number of nuclear
households also increased after the 1970s, but the rate of increase has been slowing recently. These
features are shown in Figure 3.3.
Figure 3.4 reports changes in the shares of family type within nuclear households. The shares of
married couples with dependent child(ren) and three-generation households have decreased, while
the numbers of married couples without children and singles have increased.
Figure 3.3: Number of households by family type

GINI Country Report Japan
Page 47
Source: Comprehensive Survey on Living Conditions (Ministry of Health, Labour and Welfare (2010).
Note: The sample for Hyogo prefecture is not included in 1995, when the Hyogo Earthquake occurred. Total
number of households is shown as a bar measured on the right axis, while others are shown as a share of total
number of households, which is measured on left axis.
0
10000
20000
30000
40000
50000
60000
0,00
0,10
0,20
0,30
0,40
0,50
0,60
0,70
19
67
19
69
19
71
19
73
19
75
19
77
19
79
19
81
19
83
19
85
19
87
19
89
19
91
19
93
19
95
19
97
19
99
20
01
20
03
20
05
20
07
20
09
(households) (%)
Total One-person households
Nuclear households Three-generation households

GINI Country Report Japan
Page 48
Figure 3.4: Share of households by nuclear family type (detailed split of nuclear families)
Source: Comprehensive Survey of Living Conditions (Ministry of Health, Labour and Welfare (2010)).
Note: The sample for Hyogo prefecture is not included in 1995, when the Hyogo Earthquake occurred.
3.3.2. Rates of Marriage, Divorces, and Fertility
Marriage rates have been declining since the early 1970s. The rate of decline has slowed recently
(Figure 3.5). Divorce rates increased, peaking in 2003, and dropped a little subsequently (Figure 3.6).
Economic conditions might be related to fewer marriages and more divorces, although a detailed
analysis requires future research. Economic conditions, especially the labor market, have been severe
during the mid-1990s and early 2000s. High divorce rates around that time might be due to a
household head not earning enough money, and low marriage rates around that time might be due
to young people not earning enough money to get married.
In Japan, fertility rates are closely related to marriage rates, because many people give birth after
getting married. The lower marriage rates thus simply led to lower fertility rates. This is shown in
Figure 3.7. Higher female wages and greater labor supply, compared to the past, also contributed to
lower fertility rates. That is, the economic downturn decreased male workers with high wages
0,00
0,10
0,20
0,30
0,40
0,501
96
8
19
70
19
72
19
74
19
76
19
78
19
80
19
82
19
84
19
86
19
88
19
90
19
92
19
94
19
96
19
98
20
00
20
02
20
04
20
06
20
08
20
10
*10
0%
One-person households Married couple onlyMarried couple with child(ren) One-parent with child(ren)

GINI Country Report Japan
Page 49
compared to the past, and increased female workers with low wages compared to the past, which
might have lowered fertility rates. Furthermore, an increase in uncertainty about the future may lead
young people to have fewer children.
Figure 3.5: Marriage rates (number of couples per 1000 persons)
Source: Vital Statics (Ministry of Health, Labour and Welfare (2010)).
Figure 3.6: Divorce rates (number of couples per 1000 persons)
Source: Vital Statics (Ministry of Health, Labour and Welfare (2010)).
0
2
4
6
8
10
12
14
19
47
19
49
19
51
19
53
19
55
19
57
19
59
19
61
19
63
19
65
19
67
19
69
19
71
19
73
19
75
19
77
19
79
19
81
19
83
19
85
19
87
19
89
19
91
19
93
19
95
19
97
19
99
20
01
20
03
20
05
20
07
20
09
(couples/1000 people)
0
0,5
1
1,5
2
2,5
19
47
19
49
19
51
19
53
19
55
19
57
19
59
19
61
19
63
19
65
19
67
19
69
19
71
19
73
19
75
19
77
19
79
19
81
19
83
19
85
19
87
19
89
19
91
19
93
19
95
19
97
19
99
20
01
20
03
20
05
20
07
20
09
(couples/1000 people)

GINI Country Report Japan
Page 50
Figure 3.7: Total fertility rates
Source: Vital Statics (Ministry of Health, Labour and Welfare (2010)).
3.4. Housing Tenure
One of the important expenditures affecting a household’s living standard is expenditure on housing.
As is well known and clearly shown in Figure 3.8, prices of land and housing declined dramatically in
the early 1990s—the end of the economic bubble. Subsequently, prices have moved cyclically within
a narrow range. They rose until 1998, fell from 2004, rose again from 2007, and fell until 2010. They
have since remained at around the same level.
Figure 3.9 shows that homeownership declined from 1980 until 1995 (precisely, until the time point
between 1995 and 1997), then increased, and remained at a high level since 2005, according to the
Population Census Survey (the Statistics Bureau, Management and Coordination Agency). The
percentage of households with homeownership in 2010 was about 61%, which is a little lower than
that in the 1970s.
0
0,5
1
1,5
2
2,5
3
3,5
4
4,5
5
19
47
19
49
19
51
19
53
19
55
19
57
19
59
19
61
19
63
19
65
19
67
19
69
19
71
19
73
19
75
19
77
19
79
19
81
19
83
19
85
19
87
19
89
19
91
19
93
19
95
19
97
19
99
20
01
20
03
20
05
20
07
20
09
(%)

GINI Country Report Japan
Page 51
Figure 3.8: Changes in residential land prices from previous year (% change)
Source: The Published Price of Land (Ministry of Land, Infrastructure, Transport and Tourism; 2010 and 2011).
Note: The land price survey on the 1st of July reports the average land price in each prefecture based on prices
at all the survey points throughout Japan. The figure shows the rate of change of land prices for dwellings
averaged across Japan.
Figure 3.9: Rates of homeownership
Source: The Population Census Survey (conducted every five years since 1920) (the Statistics Bureau,
Management and Coordination Agency). Note: Rates of home ownership are defined as number of owned
houses relative to total number of households.
-0,06
-0,04
-0,02
0
0,02
0,04
0,06
0,08
0,1
0,12
0,14
0,161
97
6
19
78
19
80
19
82
19
84
19
86
19
88
19
90
19
92
19
94
19
96
19
98
20
00
20
02
20
04
20
06
20
08
20
10
56
57
58
59
60
61
62
19
75
19
80
19
85
19
90
19
95
20
00
20
05
20
10
(%)

GINI Country Report Japan
Page 52
3.5. Crime and Punishment
This section summarizes the broader social impact of inequality—the effects on crime. Because there
are no microdata on crime and punishment in Japan, we cannot examine the effects of household
welfare on the behavior of committing crimes. We summarize macro statistics on crime rates, mainly
using annual reports of the government (provided by National Policy Agency), and attempt to explain
the relationship between economic conditions and crime.
3.5.1. Changes in Crime Rates
Figure 3.10 shows changes in crime rates by type of offenses since 1975. Total penal code crimes are
classified into five offenses: 1: larceny offenses, 2: felonious offenses (homicide, robbery, arson, rape),
3: violent offenses (violence, bodily injury, intimidation, extortion), 4: intellectual offenses (fraud,
embezzlement, counterfeiting, official corruption, breach of trust), and 5: moral offenses (gambling,
indecency).
The crime rate is defined as the number of cases known to the police (number of cases for which the
occurrence of crime was recognized by notification of victim, complaint, prosecution, and others) per
1,000 persons.

GINI Country Report Japan
Page 53
Figure 3.10: Crime rates
Source: Criminal Statistics (The National Police Agency).
Note: Total penal code crimes and larceny offenses are measured on the left axis, while felony, violent,
intellectual, and moral offenses are measured on the right axis.
The figures indicate that the total crime rate (aggregated over all kinds of crimes) has increased
dramatically since 1998. This coincides with the time the labor market slumped. The highest share of
total crime is occupied by larceny offenses, which started increasing rapidly in 1998, peaked in 2003,
and has been decreasing since then. Other crime rates show different trends: intellectual offenses
decrease during a recession and increase during a boom; violent offenses have decreased gradually
since 1975, but rose suddenly from 2000, decreasing again from 2007.
According to Ohtake and Kohara (2010) and Kawashima (2012), an increase in inequality during the
1970s and the 1990s raised crime rates. This is causal in the sense that the effect remained even after
removing the time trend and changes in unobserved heterogeneities over the period.
0
1
2
3
4
5
6
7
8
9
10
0
5
10
15
20
25
19
75
19
77
19
79
19
81
19
83
19
85
19
87
19
89
19
91
19
93
19
95
19
97
19
99
20
01
20
03
20
05
20
07
20
09
20
11
(crimes /1000 people)
(crimes /1000 people)
Total Crime Larceny offenses Felony offenses
Violent offenses Intellectual offenses Moral offenses

GINI Country Report Japan
Page 54
3.5.2. Who Commits Crimes?
To understand who commits crimes, we summarize the characteristics of new prisoners who started
serving jail sentences.5 Among males convicted of larceny, the percentage increased among those
aged over 60 (Figure 3.11). Convictions for robbery and fraud increased among young people in their
20s. Among females, the number is quite low, so we have to be careful about finding a general trend,
but convictions for larceny increased especially among the elderly from 2007. This is very different
from the experience with males: males convicted of any offenses decreased during this period.
Figure 3.12 shows that junior high school graduates (and younger) accounted for 42% of new
convictions in 2010, which is the largest share of total new convictions. However, the shares of high
school dropouts and high school graduates have increased sharply since 2007.
5 “New prisoners” are specifically defined as inmates whose judgments were finalized, and entered an
institution for the first time during the survey year (1st of January until 31st of December in the survey year) to
serve a sentence.

GINI Country Report Japan
Page 55
Figure 3.11: New prisoners
Source: Statistical Survey on Correction (Ministry of Justice;
http://www.moj.go.jp/housei/toukei/toukei_ichiich_kousei.html)

GINI Country Report Japan
Page 56
Figure 3.12: New prisoners by education level
Source: Statistical Survey on Correction (Ministry of Justice;
http://www.moj.go.jp/housei/toukei/toukei_ichiran_kousei.html)
3.5.3. Youth Crime
Figure 3.13 shows that the number of male inmates of juvenile prisons decreased from 2004, and the
number of female inmates decreased from 2006. In contrast, the percentage of younger inmates such
as males aged 14, 15, and 16, and females aged 14, are increasing as a percentage of total inmates of
juvenile prisons.
Splitting these inmates into their family’s (parent’s) economic classes, the largest share is from “not
rich but not poor” families. We also cannot see an increase in young inmates from poor families
(Figure 3.14). We need to investigate in more detail to conclude a relationship between youth crime
and household economic conditions.
Figure 3.13: New juvenile prisoners by age
0
5.000
10.000
15.000
20.000
25.000
30.000
35.000
2002 2003 2004 2005 2006 2007 2008 2009 2010
(convicts) Unknown
Didn't go to school
Univ. graduates
Univ. dropouts
Univ. students
High school graduates
High school dropouts
High school students
Junior high schoolgraduatesJunior high schooldropoutsElementary schoolgraduatesElementary schooldropouts

GINI Country Report Japan
Page 57
Panel A. Male
Panel B. Female
Source: Statistical Survey on Treatment of Juvenile Delinquents (Ministry of Justice).
Note: Juvenile prisoners refer to inmates of prisons or reform and training schools under the provision of Article
56 of the Juvenile Law.
Figure 3.14: New juvenile prisoners by household economic classes
0
5000
10000
15000
20000
25000
2002 2003 2004 2005 2006 2007 2008 2009 2010
Nu
mb
er
of
con
vict
s
age under 13 14 years old 15 years old 16 years old
17 years old 18 years old 19 years old aged over 20
0
500
1000
1500
2000
2500
3000
2002 2003 2004 2005 2006 2007 2008 2009 2010
Nu
mb
er
of
con
vict
s
age under 13 14 years old 15 years old 16 years old
17 years old 18 years old 19 years old aged over 20

GINI Country Report Japan
Page 58
Source: Statistical Survey on Treatment of Juvenile Delinquents (Ministry of Justice).
Note: Juvenile prisoners refer to inmates of prisons or reform and training schools under the provision of Article
56 of the Juvenile Law.
3.6. Health inequalities
Inequality should also be measured on a non-monetary base. We pick up health as an example, and
summarize changes in health inequalities over time.
3.6.1. Historical Changes in Health
Japan’s life expectancy has increased for over four decades, and now is the longest in the world. It is
generally said that the Japanese diet is a factor, but public health services may also contribute. The
following figure shows how Japan’s life expectancy has extended separately for males and females.
0% 10% 20% 30% 40% 50% 60% 70% 80% 90% 100%
2005
2006
2007
2008
2009
2010
Rich Not Rich and Not Poor Poor Unknown

GINI Country Report Japan
Page 59
Figure 3.15: Life expectancy at birth by gender
Sources: Complete Life Table and Abridged Life Table (Statistics and Information Department, Minister’s
Secretariat, MHLW).
Note: People born in Okinawa prefecture are excluded from calculations before 1970.
Health is not only measured by life expectancy. Living actively is another important measure of health.
Comprehensive Survey on Living Conditions (MHLW) enquires about “self-reported state of health”
and “frequency of visits to a doctor.” The report states that about 8% of respondents had some health
problems and went to clinics or hospitals in 2010. The report also shows that the number of
unhealthy people increased between 1998 and 2007, and subsequently decreased. Considered that
Japan’s economy was in a fairly severe state between 1998 and 2001, relatively good state between
2001 and 2007, and subsequently in a little worse state, the state of health of people seems not to
move simply in accordance with economic conditions, although the increase in the number of
unhealthy people may be partly due to population aging.
Comprehensive Survey on Living Conditions also asks respondents about their health consciousness
and subjective health conditions. Figure 3.16 shows differences in subjective health between those
with different educational attainments. People with low educational levels report an unhealthy state,
60
65
70
75
80
85
90
19
61
19
62
19
63
19
64
19
65
19
66
19
67
19
68
19
69
19
70
19
71
19
72
19
73
19
74
19
75
19
76
19
77
19
78
19
79
19
80
19
81
19
82
19
83
19
84
19
85
19
86
19
87
19
88
19
89
19
90
19
91
19
92
19
93
19
94
19
95
19
96
19
97
19
98
19
99
20
00
20
01
20
02
20
03
20
04
20
05
20
06
20
07
20
08
20
09
20
10
(years)
Life expectancy at birth, female (years) Life expectancy at birth, total (years)
Life expectancy at birth, male (years)

GINI Country Report Japan
Page 60
compared to those with a higher education. Economic inequality might be related to health
inequality.
Figure 3.16: Subjective health status by educational attainments (2010)
Source: Comprehensive Survey on Living Conditions (MHLW (2010)).
3.6.2. Causes of Death
Mental health problems are becoming serious in Japan. Compared to other OECD countries, Japan
has relatively high suicide rates (Figure 3.17). This is more apparent when we compare the rate of
homicides, which is absolutely lower than those of other countries (Figure 3.18). Suicide rates
showed an increase in inequality between 2002 and 2008.
0
5
10
15
20
25
The
enti
re s
amp
le
Ele
me
nta
ry/J
un
ior-
hig
hSc
ho
ol
Hig
h-s
cho
ol
Vo
cati
on
al S
cho
ol
Co
llege
Un
iver
sity
(u
nd
ergr
adu
ate
sch
oo
l),
Un
iver
sity
(gr
adu
ate
sch
oo
l)
(%)
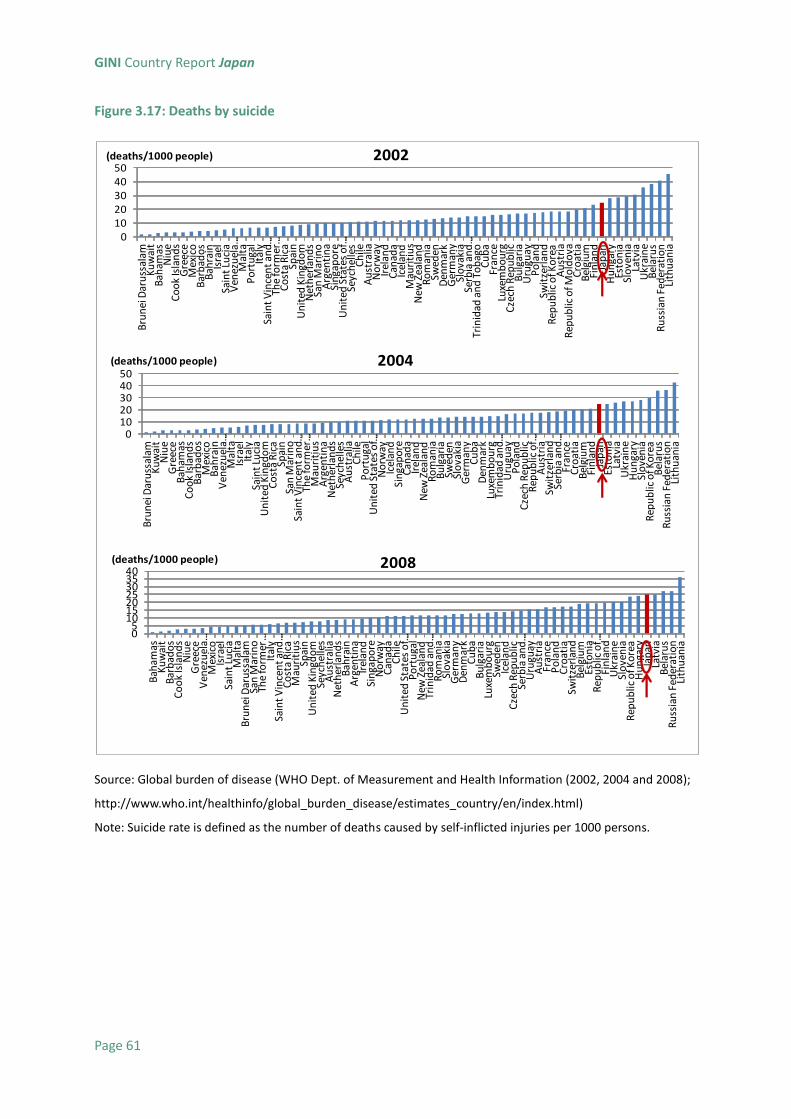
GINI Country Report Japan
Page 61
Figure 3.17: Deaths by suicide
Source: Global burden of disease (WHO Dept. of Measurement and Health Information (2002, 2004 and 2008);
http://www.who.int/healthinfo/global_burden_disease/estimates_country/en/index.html)
Note: Suicide rate is defined as the number of deaths caused by self-inflicted injuries per 1000 persons.
01020304050
Bru
nei
Dar
uss
alam
Ku
wai
tB
aham
asN
iue
Co
ok
Isla
nd
sG
reec
eM
exic
oB
arb
ado
sB
ahra
inIs
rael
Sain
t Lu
cia
Ven
ezu
ela …
Mal
taP
ort
uga
lIt
aly
Sain
t V
ince
nt
and
…Th
e fo
rmer
…C
ost
a R
ica
Spai
nU
nit
ed K
ingd
om
Net
her
lan
ds
San
Mar
ino
Arg
enti
na
Sin
gap
ore
Un
ited
Sta
tes
of …
Seyc
hel
les
Ch
ileA
ust
ralia
No
rway
Irel
and
Can
ada
Icel
and
Mau
riti
us
New
Zea
lan
dR
om
ania
Swed
enD
enm
ark
Ger
man
ySl
ova
kia
Serb
ia a
nd
…Tr
inid
ad a
nd
To
bag
oC
ub
aFr
ance
Luxe
mb
ou
rgC
zech
Rep
ub
licB
ulg
aria
Uru
guay
Po
lan
dSw
itze
rlan
dR
epu
blic
of K
ore
aA
ust
ria
Rep
ub
lic o
f Mo
ldo
vaC
roat
iaB
elgi
um
Fin
lan
dJa
pan
Hu
nga
ryEs
ton
iaSl
ove
nia
Latv
iaU
krai
ne
Bel
aru
sR
uss
ian
Fed
erat
ion
Lith
uan
ia
(deaths/1000 people) 2002
01020304050
Bru
nei
Dar
uss
alam
Ku
wai
tN
iue
Gre
ece
Bah
amas
Co
ok
Isla
nd
sB
arb
ado
sM
exic
oB
ahra
inV
enez
uel
a …M
alta
Isra
elIt
aly
Sain
t Lu
cia
Un
ited
Kin
gdo
mC
ost
a R
ica
Spai
nSa
n M
arin
oSa
int
Vin
cen
t an
d …
The
form
er …
Mau
riti
us
Arg
enti
na
Net
her
lan
ds
Seyc
hel
les
Au
stra
liaC
hile
Po
rtu
gal
Un
ited
Sta
tes
of …
No
rway
Icel
and
Sin
gap
ore
Can
ada
Irel
and
New
Zea
lan
dR
om
ania
Bu
lgar
iaSw
eden
Slo
vaki
aG
erm
any
Cu
ba
Den
mar
kLu
xem
bo
urg
Trin
idad
an
d …
Uru
guay
Po
lan
dC
zech
Rep
ub
licR
epu
blic
of …
Au
stri
aSw
itze
rlan
dSe
rbia
an
d …
Fran
ceC
roat
iaB
elgi
um
Fin
lan
dJa
pan
Esto
nia
Latv
iaU
krai
ne
Hu
nga
rySl
ove
nia
Rep
ub
lic o
f Ko
rea
Bel
aru
sR
uss
ian
Fed
erat
ion
Lith
uan
ia
(deaths/1000 people) 2004
05
10152025303540
Bah
amas
Ku
wai
tB
arb
ado
sC
oo
k Is
lan
ds
Niu
eG
reec
eV
enez
uel
a …M
exic
oIs
rael
Sain
t Lu
cia
Mal
taB
run
ei D
aru
ssal
amSa
n M
arin
oTh
e fo
rmer
…It
aly
Sain
t V
ince
nt
and
…C
ost
a R
ica
Mau
riti
us
Spai
nU
nit
ed K
ingd
om
Seyc
hel
les
Au
stra
liaN
eth
erla
nd
sB
ahra
inA
rgen
tin
aIr
elan
dSi
nga
po
reN
orw
ayC
anad
aC
hile
Un
ited
Sta
tes
of …
Po
rtu
gal
New
Zea
lan
dTr
inid
ad a
nd
…R
om
ania
Slo
vaki
aG
erm
any
Den
mar
kC
ub
aB
ulg
aria
Luxe
mb
ou
rgSw
eden
Icel
and
Cze
ch R
epu
blic
Serb
ia a
nd
…U
rugu
ayA
ust
ria
Fran
ceP
ola
nd
Cro
atia
Swit
zerl
and
Bel
giu
mEs
ton
iaR
epu
blic
of …
Fin
lan
dU
krai
ne
Slo
ven
iaR
epu
blic
of K
ore
aH
un
gary
Jap
anLa
tvia
Bel
aru
sR
uss
ian
Fed
erat
ion
Lith
uan
ia
(deaths/1000 people) 2008

GINI Country Report Japan
Page 62
Figure 3.18: Deaths by homicide
Source: Global burden of disease (WHO Dept. of Measurement and Health Information (2002, 2004 and 2008);
http://www.who.int/healthinfo/global_burden_disease/estimates_country/en/index.html)
Note: Homicide rate is defined as the number of deaths by violence per 1000 persons.
To examine the relationship between suicide rates and economic conditions or inequality, we look at
changes in suicide rates more in detail. Suicide rates increased and remained at a high level from the
latter half of 1990s when a serious recession started and labor market deteriorated. During the
recession between 1995 and 2005, suicide rates increased rapidly among middle-aged persons and
older persons. After 2005, suicide rates increased among the young both in male and female groups.
0
10
20
30
40
Jap
anIc
elan
dFr
ance
Isra
elG
erm
any
Slo
ven
iaSi
nga
po
reSw
itze
rlan
dA
ust
ria
Co
ok
Isla
nd
sIr
elan
dSp
ain
Swed
enD
enm
ark
Un
ited
…N
orw
ayIt
aly
Net
her
lan
ds
Niu
eG
reec
eN
ew Z
eala
nd
Cze
ch R
epu
blic
Ku
wai
tP
ort
uga
lB
run
ei …
Au
stra
liaC
anad
aM
alta
Bel
giu
mLu
xem
bo
urg
Po
lan
dSe
rbia
an
d …
Rep
ub
lic o
f …C
roat
iaSl
ova
kia
Hu
nga
ryM
auri
tiu
sB
ulg
aria
The
form
er …
Fin
lan
dR
om
ania
Seyc
hel
les
Do
min
ica
Cu
ba
Un
ited
Sta
tes …
Ch
ileU
rugu
ayC
ost
a R
ica
Kir
ibat
iSa
int
Luci
aB
arb
ado
sA
rgen
tin
aTr
inid
ad a
nd
…M
exic
oLi
thu
ania
Sain
t K
itts
and
…R
epu
blic
of …
Latv
iaB
elar
us
Sain
t V
ince
nt …
Esto
nia
Ukr
ain
eB
aham
asR
uss
ian
…V
enez
uel
a …
(deaths/1000 people) 2002
01020304050
Bru
nei
…Ja
pan
Icel
and
Au
stri
aN
orw
ayM
alta
Den
mar
kSw
itze
rlan
dG
erm
any
Sin
gap
ore
Swed
enN
eth
erla
nd
sSl
ove
nia
Spai
nK
uw
ait
Ital
yU
nit
ed K
ingd
om
Irel
and
Au
stra
liaG
reec
eN
ew Z
eala
nd
Fran
ceLu
xem
bo
urg
Po
lan
dSl
ova
kia
Cze
ch R
epu
blic
Can
ada
Niu
eP
ort
uga
lC
roat
iaB
elgi
um
Serb
ia a
nd
…H
un
gary
Co
ok
Isla
nd
sR
epu
blic
of …
Fin
lan
dR
om
ania
Bu
lgar
iaTh
e fo
rmer
…Se
ych
elle
sD
om
inic
aM
auri
tiu
sIs
rael
Cu
ba
Uru
guay
Un
ited
Sta
tes …
Arg
enti
na
Kir
ibat
iC
hile
Bel
aru
sR
epu
blic
of …
Ukr
ain
eLi
thu
ania
Latv
iaEs
ton
iaC
ost
a R
ica
Bar
bad
os
Bah
amas
Mex
ico
Sain
t V
ince
nt …
Ru
ssia
n …
Sain
t Lu
cia
Sain
t K
itts
an
d …
Trin
idad
an
d …
Ven
ezu
ela …
(deaths/1000 people) 2008
01020304050
Jap
anG
erm
any
Irel
and
Au
stri
aFr
ance
No
rway
Co
ok
Isla
nd
sM
alta
Gre
ece
Swit
zerl
and
Den
mar
kIt
aly
Icel
and
Bru
nei
…N
iue
Luxe
mb
ou
rgN
eth
erla
nd
sSw
eden
Au
stra
liaSi
nga
po
reC
zech
Rep
ub
licN
ew Z
eala
nd
Ku
wai
tC
anad
aSp
ain
Bel
giu
mP
ola
nd
Po
rtu
gal
Cro
atia
Slo
vaki
aU
nit
ed K
ingd
om
Slo
ven
iaH
un
gary
Rep
ub
lic o
f Ko
rea
Fin
lan
dSe
rbia
an
d …
Mau
riti
us
Bu
lgar
iaR
om
ania
Seyc
hel
les
Isra
elU
rugu
ayTh
e fo
rmer
…C
hile
Un
ited
Sta
tes …
Cu
ba
Kir
ibat
iC
ost
a R
ica
Arg
enti
na
Rep
ub
lic o
f …Es
ton
iaLi
thu
ania
Mex
ico
Do
min
ica
Latv
iaB
elar
us
Sain
t K
itts
an
d …
Ukr
ain
eTr
inid
ad a
nd
…B
arb
ado
sSa
int
Vin
cen
t …Sa
int
Luci
aB
aham
asR
uss
ian
…V
enez
uel
a …
(deaths/1000 people) 2004

GINI Country Report Japan
Page 63
The rate of increase is high among young females.
Figure 3.19: Rates of deaths by suicide
Panel A. Male
Panel B. Female
Source: Vital Statistics (Ministry of Health, Labour and Welfare).
Note: The figure shows rates of deaths caused by suicide to total deaths.
0,0
1,0
2,0
3,0
4,0
19
50
19
55
19
60
19
65
19
70
19
75
19
80
19
85
19
90
19
95
20
00
20
05
20
08
20
09
20
10
(%)
0-9 years old 10-19 years old 20-29 years old 30-39 years old
40-49 years old 50-59 years old 60-69 years old 70-79 years old
0,0
0,5
1,0
1,5
2,0
2,5
3,0
19
50
19
55
19
60
19
65
19
70
19
75
19
80
19
85
19
90
19
95
20
00
20
05
20
08
20
09
20
10
(%)
0-9 years old 10-19 years old 20-29 years old 30-39 years old40-49 years old 50-59 years old 60-69 years old 70-79 years old80-89 years old more than 90 years old unknown

GINI Country Report Japan
Page 64
3.7. Subjective Measures of Well-being, Satisfaction, and Happiness
In Comprehensive Survey on Living Conditions (MHLW), respondents are asked: "how would you
describe your living conditions?" Possible answers are “very hard,” “hard,” or “not hard but not easy,”
“easy” or “very easy.” All tables and figures in this section were originally published in the annual
report: Comprehensive Survey on Living Conditions.
According to Figure 3.20, subjective measures of living conditions, based on this survey, deteriorated
from 1992 to 2004. Those households who answered “not hard but not easy” decreased, while those
who answered “hard” or “very hard” increased sharply.
Figure 3.21 is split into four income groups (from bottom income group I to top IV). Those who
answered “very hard" or “hard” increased in all income groups, but the increase is larger in lower
groups than in higher groups. Disparity in subjective well-being might become larger than actual
inequality in observed well-being, such as levels of income and consumption.
Figure 3.22 is split into age groups. Younger people, especially those in their 30s and 40s, may be
experiencing hard living conditions, compared to the elderly. Figure 3.23 splits the sample into types
of employment. Those who work as fixed-term employees are experiencing relatively bad economic
conditions, and their deterioration rates are high. The situation is especially serious for those who
have employment contracts of less than one month.

GINI Country Report Japan
Page 65
Figure 3.20: Living conditions
Source: Comprehensive Survey on Living Conditions (MHLW (2010)).
Figure 3.21: Living conditions by income quintiles
Source: Comprehensive Survey on Living Conditions (MHLW (2010)).
0% 10% 20% 30% 40% 50% 60% 70% 80% 90% 100%
1992
1998
2004
Very hard Hard Not hard but not easy Easy Very easy
0% 10% 20% 30% 40% 50% 60% 70% 80% 90% 100%
1992
1998
2004
1992
1998
2004
1992
1998
2004
1992
1998
2004
III
III
IV
Very hard Hard Not hard but not easy Easy Very easy

GINI Country Report Japan
Page 66
Figure 3.22: Living conditions by age of household head
Source: Comprehensive Survey on Living Conditions (MHLW (2010)).
Figure 3.23: Living conditions by household head's employment status
Source: Comprehensive Survey on Living Conditions (MHLW (2010)).
0% 10% 20% 30% 40% 50% 60% 70% 80% 90% 100%
1992
2004
1998
1992
2004
1998
1992
2004
1998
1992
2004
less
than 29
year
so
ld
30
-39
year
so
ld
40
-49
year
so
ld
50
-59
year
so
ld
60
-69
year
so
ld
70
-79
year
so
ld
mo
reth
an 80
year
so
ld
Very hard Hard Not hard but not easy Easy Very easy
0% 10% 20% 30% 40% 50% 60% 70% 80% 90% 100%
199219982004199219982004199219982004199219982004199219982004
Emp
loye
e(r
egu
lar)
Emp
oly
ee
(fix
ed
-te
rmb
etw
een
1-1
2m
on
ths)
Emp
loye
e (f
ixe
d-
term
less
th
an1
mo
nth
)
Self
-em
plo
yed
Oth
er
Very hard Hard Not hard but not easy Easy Very easy
GINI Country Report Japan
Page 67
3.8. Chapter Conclusion: Social Impacts of Inequality
In this chapter, we first showed that the number of homeless has decreased since 2000, as economic
conditions improved compared to the severe conditions of the late 1990s. However, the problem of
the homeless may not be solved: more homeless people are not working and have remained
homeless for longer than before. We then showed changes in family types. Family types comprising
independent elderly households and single parent households as well as one-person households
(singles) have been increasing.
Residential land prices dropped sharply in the early 1990s—the end of the economic bubble. They
increased slightly during the first half of the 2000s, but decreased slightly again after 2008. Home
ownership has changed in parallel with these price changes.
The total crime rate increased during the serious recession in the 1990s, but decreased consistently
in the 2000s. Negative economic shocks and increased inequality may raise crime rates, although
statistics on youth crime indicate that inmates are not always from poor families.
Next, we showed the relationship between health and economic conditions. Although life expectancy
has become longer, even during serious recessions, health as measured by an active healthy life or a
subjective measure of health might be deteriorating along with the economic downturn. One serious
health problem is an increase in mental health problems, which is reflected by an increase in suicide
rates. Suicide rates in Japan are relatively high compared to other countries. During the recession
between 1995 and 2005, they increased rapidly among the middle aged and elderly, and since 2005,
suicide rates among young people have been increasing. This coincides with the fact that the severe
economic conditions after the Asian financial crises affected the employment of middle-aged people
and the recent recession after 2007 affected the employment of young people.
Finally, households’ subjective welfare at all ages decreased during the 1990s and 2000s. This is more
apparent among single-parent households and those who work as fixed-contract employees.

GINI Country Report Japan
Page 68

GINI Country Report Japan
Page 69
Political and Cultural Impacts
4.1. Introduction
How do Japanese people relate to society? In this section, we first look at voting behavior, and
memberships of organizations in society. We then look at the extent to which people trust others and
institutions. We further summarize political views and legitimacy. In the final section, we show the
extent to which people support government policies, especially redistribution policies toward a more
equal society.
4.2. Political and Civic Participation
When inequality increases, people may tend to participate in political activities to redress
deteriorating differentials in a society. Data on Voter Turnout in Visual Form reports that the average
electoral turnout in general elections has been 66.64% soon after World War II (70.47% for the House
of Representatives and 62.46% for the House of Councilors). Figure 4.1 shows that the rates are
roughly on a downward trend for either house. A closer look at changes since the late 1990s, however,
shows that there has been a recovery. This may reflect greater interest in government policies and in
growing inequality and uncertainty about the future.
OECD Social Indicators (2011) also report the average voting rates of major countries. According to
this report, the Japanese average voting rate for the most recent election in 2011 was about 67%,
which is slightly lower than the OECD average of 70%. Although a decreasing voting rate is sometimes
discussed as a problem in many countries, that report shows that the decrease has not been so large
in Japan.
The difference in voting rates between educated people and less educated people is not large (Figure
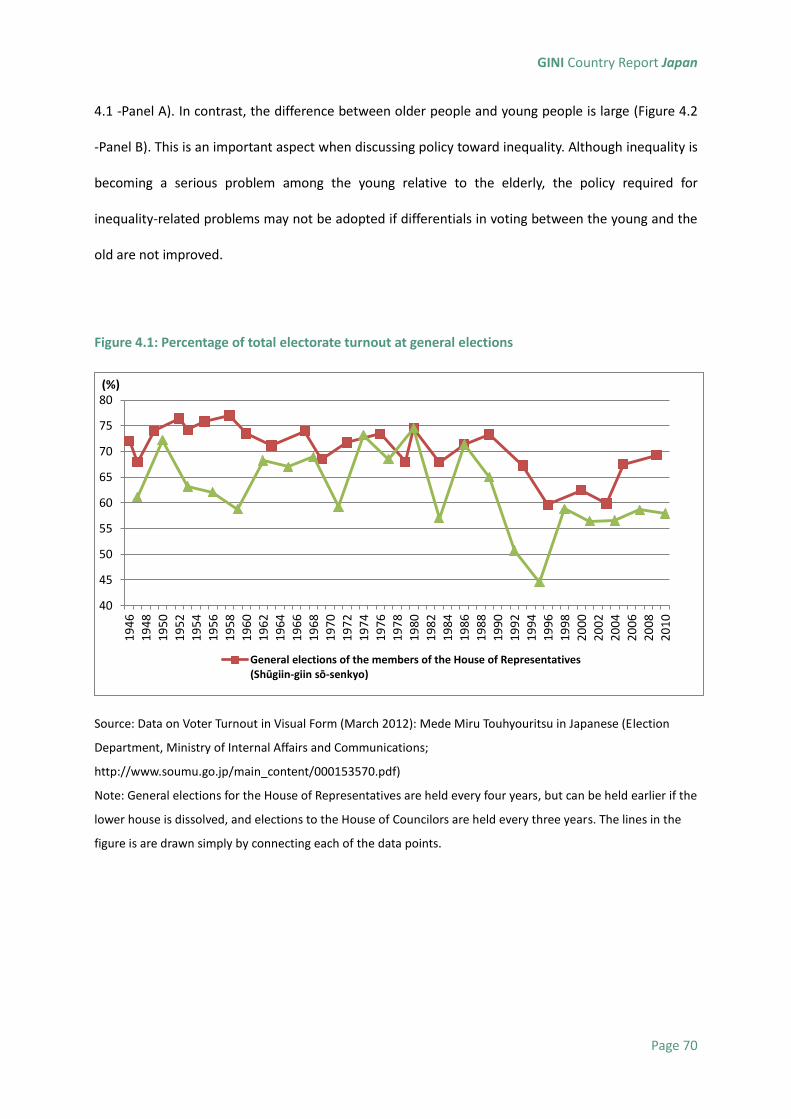
GINI Country Report Japan
Page 70
4.1 -Panel A). In contrast, the difference between older people and young people is large (Figure 4.2
-Panel B). This is an important aspect when discussing policy toward inequality. Although inequality is
becoming a serious problem among the young relative to the elderly, the policy required for
inequality-related problems may not be adopted if differentials in voting between the young and the
old are not improved.
Figure 4.1: Percentage of total electorate turnout at general elections
Source: Data on Voter Turnout in Visual Form (March 2012): Mede Miru Touhyouritsu in Japanese (Election
Department, Ministry of Internal Affairs and Communications;
http://www.soumu.go.jp/main_content/000153570.pdf)
Note: General elections for the House of Representatives are held every four years, but can be held earlier if the
lower house is dissolved, and elections to the House of Councilors are held every three years. The lines in the
figure is are drawn simply by connecting each of the data points.
40
45
50
55
60
65
70
75
80
19
46
19
48
19
50
19
52
19
54
19
56
19
58
19
60
19
62
19
64
19
66
19
68
19
70
19
72
19
74
19
76
19
78
19
80
19
82
19
84
19
86
19
88
19
90
19
92
19
94
19
96
19
98
20
00
20
02
20
04
20
06
20
08
20
10
(%)
General elections of the members of the House of Representatives(Shūgiin-giin sō-senkyo)

GINI Country Report Japan
Page 71
Figure 4.2: Percentage point differences in voting rates (most recent election)
Panel A: Between people with high and low education levels
Figure 4.2: Percentage point differences in voting rates (most recent election)
Panel B: Between those aged 55+ years and those aged 16–35 years
Source: Society at a Glance: OECD Social Indicators (OECD (2011);
http://www.oecd-ilibrary.org/social-issues-migration-health/society-at-a-glance-2011_soc_glance-2011-en)
Note: The original figures for Panel A and B are CO4.2 and CO4.3, respectively, in the source data.
-10
-5
0
5
10
15
20
25
30
35
KO
R
IRL
CH
L
GB
R
JPN
MEX
AU
S
ESP
NZL
NLD BEL IS
L
DN
K
PR
T
DEU
SWE
CA
N
FRA
OEC
D
ISR
ITA
SVN
BR
A
NO
R
CZE FIN
CH
E
HU
N
PO
L
USA
- 5
0
5
10
15
20
25
30
35
40
ITA
BEL
AU
S
NLD
DEU
SWE
ISL
HU
N
CH
L
DN
K
ESP
CZE
MEX
OEC
D
NO
R
CA
N
NZL
USA
FRA
IRL
PR
T
PO
L
SVN
ISR
CH
E
FIN
KO
R
JPN
GB
R

GINI Country Report Japan
Page 72
4.3. Unionized Workforce
The labor unionization rate has declined significantly, especially since the late 1970s (Figure 4.4).
Behind this downward trend is a change in Japan’s employment conditions. As seen in Chapter 2,
regular full-time workers have decreased and non-standard part-time workers have increased since
the late 1990s.
Figure 4.3: Percentage of workforce unionized
Source: The number of union employees is from Basic Survey on Labour Unions (MHLW), and the number of
employees is from Labour Force Survey (Statistic Bureau).
Note: The figure shows the ratio of the number of employees in labor unions relative to the total number of
employees in Japan.
A decline in the rate of union participation is also observed in the following figure. Figure 4.4 shows
the kinds of voluntary organizations and activities in which Japanese people participate, and changes
in the 1990s. The big changes between 1990 and 2000 are a decrease in labor unions and an increase
in religious groups. An increase in religious groups may reflect an increase in social and economic
instability or uncertainty, which might be related to an increase in Inequality.
0,0
10,0
20,0
30,0
40,0
50,0
60,0
19
47
19
49
19
51
19
53
19
55
19
57
19
59
19
61
19
63
19
65
19
67
19
69
19
71
19
73
19
75
19
77
19
79
19
81
19
83
19
85
19
87
19
89
19
91
19
93
19
95
19
97
19
99
20
01
20
03
20
05
20
07
20
09
(%)
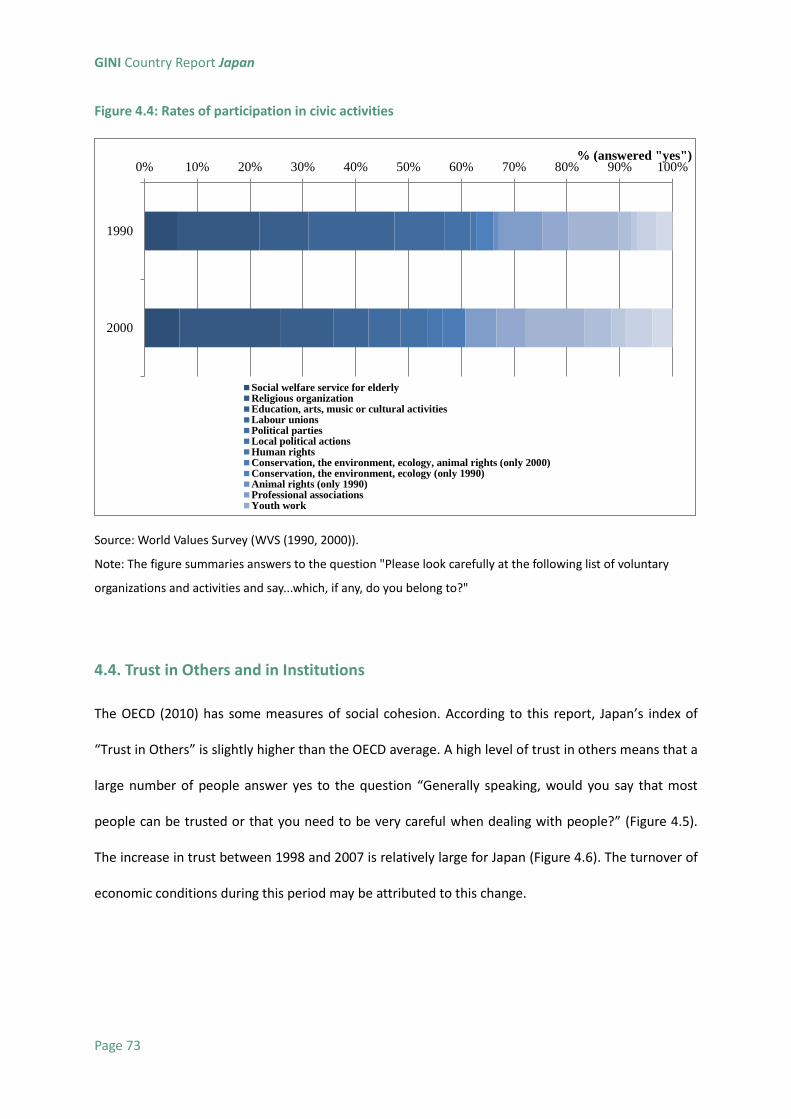
GINI Country Report Japan
Page 73
Figure 4.4: Rates of participation in civic activities
Source: World Values Survey (WVS (1990, 2000)).
Note: The figure summaries answers to the question "Please look carefully at the following list of voluntary
organizations and activities and say...which, if any, do you belong to?"
4.4. Trust in Others and in Institutions
The OECD (2010) has some measures of social cohesion. According to this report, Japan’s index of
“Trust in Others” is slightly higher than the OECD average. A high level of trust in others means that a
large number of people answer yes to the question “Generally speaking, would you say that most
people can be trusted or that you need to be very careful when dealing with people?” (Figure 4.5).
The increase in trust between 1998 and 2007 is relatively large for Japan (Figure 4.6). The turnover of
economic conditions during this period may be attributed to this change.
0% 10% 20% 30% 40% 50% 60% 70% 80% 90% 100%
1990
2000
% (answered "yes")
Social welfare service for elderlyReligious organizationEducation, arts, music or cultural activitiesLabour unionsPolitical partiesLocal political actionsHuman rightsConservation, the environment, ecology, animal rights (only 2000)Conservation, the environment, ecology (only 1990)Animal rights (only 1990)Professional associationsYouth work

GINI Country Report Japan
Page 74
Figure 4.5: Percentage of people expressing high level of trust in others
Source: European Social Survey (ESS) (2008 wave 4) for OECD-Europe and the International Social Survey
Programme (ISSP) (2007 wave) for non-OECD Europe (OECD (2010))
Note: Trust data are based on the question: “Generally speaking, would you say that most people can be
trusted or that you need to be very careful when dealing with people?” Data refer to 2007 for New Zealand,
Mexico, Australia, Austria, Japan, Korea, Ireland, United States, and Chile.
13 24
26 38
40 46 47 47 47
49 53
56 56 56
59 61 61 62 62
64 69 69 69
71 72
74 80
84 86
88 89
0 10 20 30 40 50 60 70 80 90 100
Chile
Mexico
Greece
Hungary
Poland
Slovenia
Ireland
OECD
Germany
Spain
Belgium
New Zealand
Estonia
Norway
Finland
Denmark
(%)

GINI Country Report Japan
Page 75
Figure 4.6: Average annual percentage point change in “Trust in Others”
Source: European Social Survey (ESS), International Social Survey Programme (ISSP), Income Distribution and
Poverty in OECD Countries (OECD (2008); www.oecd.org/els/social/inequality).
Note: Change refers to 1998/2007: Slovak Republic, Switzerland, New Zealand, Australia, Austria, Japan, Ireland,
United States and Chile; 2002/2008 for the other countries.
-1,4 -0,3 -0,3 -0,3 -0,2
-0,1 0,1 0,1 0,1
0,4 0,4
0,6 0,6 0,6
0,7 0,8
1,0 1,0 1,0 1,1 1,1 1,1
1,3 1,4 1,4 1,4
2,9
-2 -1,5 -1 -0,5 0 0,5 1 1,5 2 2,5 3 3,5
Portugal
Chile
Denmark
Finland
Spain
Netherlands
OECD
Greece
Austria
Slovenia
Belgium
Ireland
Slovak Republic
Japan

GINI Country Report Japan
Page 76
4.5. Political Values and Legitimacy
What are Japanese political values? We summarize statistics related to this topic, using Japanese
General Social Survey (JGSS hereafter), which has been conducted by Tokyo University and Osaka
University of Commerce since 1998. The definitions of variables/answers are summarized in the note
to each figure.
According to Figure 4.7, the percentage of conservatives is about 30% and that of progressives is
about 20%: a large number of people answer that they are neither conservatives nor progressive.
This has not changed during the 2000s. According to Figure 4.8, the percentages of people answering
left wing and right wing change over time. However, if we look at the threshold of five, right wing
(higher than or equal to five) decreased until 1990 and then increased. Those who support a policy of
expanding immigrants have decreased (Figure 4.9). Considered that economic conditions have
become severe and inequality has increased since the mid-1990s, the change in inequality may have
affected Japanese forming political views.
Figure 4.7: Political views: conservative vs. progressive
Source: Japanese General Social Surveys (JGSS (2000, 2001, 2002, 2003, 2005, 2006, 2008, 2010))
Note: The figure summarizes answers to the question “Where would you place your political views on a
0% 10% 20% 30% 40% 50% 60% 70% 80% 90% 100%
2000
2001
2002
2003
2005
2006
2008
2010
Conservative 5 Conservative 4 Conservative 3 Conservative 2 Conservative 1(Progressive)
Conservative Progressive

GINI Country Report Japan
Page 77
five-point scale?”
Figure 4.8: Political views: “the left” vs. “the right”
Source: World Values Survey (1981, 1990, 1995, 2000, 2005)
Note. The figure summarizes answers to the question “In political matters, people talk of “the left” and “the
right.” How would you position your views on this scale, generally speaking?”
0% 10% 20% 30% 40% 50% 60% 70% 80% 90% 100%
1980
1990
1995
2000
2005
left 2 3 4 5 6 7 8 9 right
left right

GINI Country Report Japan
Page 78
Figure 4.9: Percentage of people who support “Immigrants should be increased”
Source: International Social Survey Programme (1995, 2003)
http://zacat.gesis.org/webview/index.jsp?object=http://zacat.gesis.org/obj/fStudy/ZA3910,
http://zacat.gesis.org/webview/index.jsp?object=http://zacat.gesis.org/obj/fStudy/ZA2880
4.6. Values Related to Social Policy and Welfare State
How do people act toward government policies related to income redistribution? Figure 4.10 shows
the percentage of people agreeing with the view that inequalities are too large in the country. The
number of people recognizing the existence of inequality and the problem of inequality has increased
greatly during the past decade. About 62% in 1999 said: "they strongly agreed or agreed that
inequality is too large,” while the percentage was about 85% in 2009. The same survey asked whether
or not the respondent agrees with the idea that the poor are lazy. Figure 4.11 shows that more than
70% of people strongly agreed or agreed with this idea. Moreover, this tendency has not changed
during the 2000s, while inequality has changed during this period. This probably explains the limited
number of people supporting government redistribution policies. Figure 4.12 shows that those who
support income redistribution policies of the government are at most 60%, although the number has
increased during the 2000s. In 2009, about 8% disagree or strongly disagree with income
0% 10% 20% 30% 40% 50% 60% 70% 80% 90% 100%
1995
2003
Increased a lot Increased a little Remain the same as it is
Reduced a little Reduced a lot
Increase Reduce

GINI Country Report Japan
Page 79
redistribution policies.
Figure 4.10: Percentage of people who agree that “inequalities are too large in the country”
Source: International Social Survey Programme (1999, 2009)
http://zacat.gesis.org/webview/index.jsp?object=http://zacat.gesis.org/obj/fStudy/ZA3430
http://zacat.gesis.org/webview/index.jsp?object=http://zacat.gesis.org/obj/fStudy/ZA5400
Note: The figure summarizes answers to the question “How much do you agree or disagree ‘Differences in
income in Japan are too large’?”
Figure 4.11: Percentage of people who agree that the “poor are lazy”
Source: World Values Survey (2000, 2005) Note. The figure summarizes answers to the question “Do you agree
or disagree with the following statements?: People who don’t work become lazy.”
Figure 4.12: Percentage of people who agree that the “government should redistribute
0% 10% 20% 30% 40% 50% 60% 70% 80% 90% 100%
1999
2009
Strongly agree Agree Neither agree nor disagree
Disagree Strongly disagree Cant choose
0% 10% 20% 30% 40% 50% 60% 70% 80% 90% 100%
2000
2005
Strongly agree Agree Neither agree Disagree Strongly disagree

GINI Country Report Japan
Page 80
wealth/income”
Source: JGSS (2000, 2001, 2002, 2003, 2005, 2006, 2008, 2010)
Note: The figure summarizes answers to the question: “It is the responsibility of the government to reduce
differences in income between families with high incomes and those with low incomes.”
4.7. Chapter Conclusion: Appraisal of the Interdependence and the National Story
of Inequality Drivers and their Cultural and Political Impacts
In this chapter, we showed how individuals connect to society in Japan. First, we looked at voting
behavior. The voting rate is about 67% in Japan (this is also about the average among OECD countries)
and has gradually decreased over three decades. There is no difference in voting rate by educational
level, while the voting rate is significantly higher among older people than among younger people.
Second, we found that the labor unionization rate has steadily decreased over time. This reflects a
weakening of the traditional seniority system and increase in non-standard employees in Japanese
companies. Third, we found that the level of trust in others is about average in OECD countries and
increased between 1998 and 2007. Fourth, regarding political positions, about 30% of Japanese
position themselves as conservative and about 20% as progressive. The share of people with
0% 10% 20% 30% 40% 50% 60% 70% 80% 90% 100%
2000
2001
2002
2003
2005
2006
2008
2010
Agree Somewhat agree Neither agree nor disagree Somewhat disagree Disagree

GINI Country Report Japan
Page 81
rightwing political views has been increasing since 1990.
In the last section, we summarized the extent to which people support government policies,
especially redistribution policies to mitigate an expansion of inequality. More than 80% recognize that
income inequality is too large. At the same time, however, more than 70% agree that “the poor are
lazy.” As a result, the percentage of people supporting income redistribution is limited: the ratio
supporting income redistribution is at most 62%, and more than 30% neither support nor do not
support, although the number of people supporting redistribution policy has been increasing during
the 2000s.

GINI Country Report Japan
Page 82

GINI Country Report Japan
Page 83
5. Effectiveness of Policies for Combating Inequality
5.1 Introduction
The Japan faced severe economic conditions between the mid-1990s and early 2000s. Per capita GDP
has not increased significantly since the economic bubble burst in 1991 (Figure 5.1): annual GDP
growth rates hit a high of 12.8% in 1968, hovered around 5% in the 1970s and 1980s, and then fell
dramatically by around 1% after 1991. The lowest was -2% in 1998 (Asian financial shock) and -5.5%
in 2009 after the collapse of Lehman Brothers.
The Bank of Japan eased monetary policies several times, and interest rates have stayed at a low level
of 0% for the past ten years. The consumer price index decreased after 1998, and deflation is one of
the biggest recent problems in Japan (Figure 5.2). Government debt has accumulated during the
period of the recession, and was about 230% of annual GDP in 2011 (Figure 5.3). This is the highest in
the world.

GINI Country Report Japan
Page 84
Figure 5.1: Real GDP per capita in Japan
Source: Federal Reserve Economic Data (U.S. Department of Labor, Bureau of Labor Statistics;
http://research.stlouisfed.org/fred2) Note: Annual, not seasonally adjusted. Unit is 2010 U.S. dollars.
Figure 5.2: Consumer Price Index for all items (index 2005=100)
Source: Main Economic Indicators (Organization for Economic Co-operation and Development)
0
5.000
10.000
15.000
20.000
25.000
30.000
35.000
40.000
19
80
19
81
19
82
19
83
19
84
19
85
19
86
19
87
19
88
19
89
19
90
19
91
19
92
19
93
19
94
19
95
19
96
19
97
19
98
19
99
20
00
20
01
20
02
20
03
20
04
20
05
20
06
20
07
20
08
20
09
20
10
20
10
U.S
. d
olla
rs
0
20
40
60
80
100
120
19
70
-01
-01
19
71
-08
-01
19
73
-03
-01
19
74
-10
-01
19
76
-05
-01
19
77
-12
-01
19
79
-07
-01
19
81
-02
-01
19
82
-09
-01
19
84
-04
-01
19
85
-11
-01
19
87
-06
-01
19
89
-01
-01
19
90
-08
-01
19
92
-03
-01
19
93
-10
-01
19
95
-05
-01
19
96
-12
-01
19
98
-07
-01
20
00
-02
-01
20
01
-09
-01
20
03
-04
-01
20
04
-11
-01
20
06
-06
-01
20
08
-01
-01
20
09
-08
-01
20
11
-03
-01

GINI Country Report Japan
Page 85
Figure 5.3: Government Debt as a % of GDP
Source: World Economic Outlook (International Monetary Fund)
Note. Gross debt consists of all liabilities that require payment or payments of interest and/or principal by the
debtor to the creditor at a date or dates in the future. This includes debt liabilities in the form of Special
Drawing Rights (SDRs), currency and deposits, debt securities, loans, insurance, pensions and standardized
guarantee schemes, and other accounts payable. Debt can be valued at current market, nominal, or face values.
http://research.stlouisfed.org/fred2/series/GGGDTPJPA188N.
5.2 Minimum Wage
The following sections summarize government policies related to inequality. Figure 5.4 shows that
the minimum wage has increased since 1997, stayed at the same level from 2001 to 2005, but
increased again from 2007. However, the relative level of the minimum wage to average wage in the
country—the Kaitz index—has not changed tremendously. Figure 5.5 shows the Kaitz index for males
and females, respectively. For males, the minimum wage level unchanged during 1980s, decreased
between 1990 and 1993, and then slightly increased after that. For females, it unchanged during
1980s, decreased largely between 1990 and 1993, stayed at the same level until 2004, and increased
after that. That is, through the entire period from 1980 till 2009, the relative level of minimum wage
is rather constant. The increase in the minimum wage is thought to have only small effects on
alleviating existing levels of income inequality (Kawaguchi and Mori, 2009).
0
50
100
150
200
2501
98
0
19
81
19
82
19
83
19
84
19
85
19
86
19
87
19
88
19
89
19
90
19
91
19
92
19
93
19
94
19
95
19
96
19
97
19
98
19
99
20
00
20
01
20
02
20
03
20
04
20
05
20
06
20
07
20
08
20
09
20
10

GINI Country Report Japan
Page 86
Figure 5.4: Changes in prefectural minimum wage
Source: Table of Prefectural Minimum Wage (Ministry of Health, Labour and Welfare, 2002-2011)
Note: We calculate weighted average minimum wage for the country as a whole using prefectural minimum
wage level and weighting the prefectural population.
580
600
620
640
660
680
700
720
740
7601
99
7
199
8
199
9
200
0
200
1
200
2
200
3
200
4
200
5
200
6
200
7
200
8
200
9
201
0
201
1
Yen
per
ho
ur

GINI Country Report Japan
Page 87
Figure 5.5: Kaitz index
Source: Handbook on Minimum Wage Settings (Saitei-Chingin-Kettei-Yoran (Tokyo: Roudou Chousakai))
5.3 Taxes
Tax revenues have paralleled cyclical changes in economic conditions. Tax revenue as a percentage of
GDP increased in the 1980s, decreased in the 1990s, increased again from the early 2000s, but then
decreased after 2007 (Figure 5.6).
The impact of income redistribution policies using income tax has been small. This is because the
maximum income tax rate has been cut and the progressiveness of income taxes as a whole was
reduced in the late 1990s. Using information on income tax payments, Moriguchi (2010) shows that
the shares of total wage accruing to the top 1% of wage earners and above have stayed at a low level,
and have risen steadily since the late 1990s. She points out a consistent decrease in marginal tax rates
after 1990s as one of the determinants of this increase (Figure 5.7). Although this was not found by
the conventionally used survey data in Chapter 2, the income gap between those who belong to the
top group and the others may have increased.
Figure 5.6: Tax Revenue as a % of real GDP
0
0,1
0,2
0,3
0,4
0,5
0,6
0,71
98
1
19
82
19
83
19
84
19
85
19
86
19
87
19
88
19
89
19
90
19
91
19
92
19
93
19
94
19
95
19
96
19
97
19
98
19
99
20
00
20
01
20
02
20
03
20
04
20
05
20
06
20
07
20
08
20
09
Male Female

GINI Country Report Japan
Page 88
Source: The figures are reported by Cabinet Office (http://www.cao.go.jp/zei-cho/gijiroku/senmon/2010/
_icsFiles/afieldfile/2010/11/18/sen2kai9.pdf).
Figure 5.7: Changes in top 1% wage income share and marginal tax rate
Source: Data is sourced from Moriguchi Chiaki (2010). Top wage Incomes in Japan, 1951-2005, Journal of The
Japanese and International Economies, 24, 301-333.
0
0,05
0,1
0,15
0,2
0,25
19
70
19
72
19
74
19
76
19
78
19
80
19
82
19
84
19
86
19
88
19
90
19
92
19
94
19
96
19
98
20
00
20
02
20
04
20
06
20
08
20
10
*100 %
4
4,4
4,8
5,2
5,6
6
6,4
6,8
30
35
40
45
50
55
60
65
19
51
19
53
19
55
19
57
19
59
19
61
19
63
19
65
19
67
19
69
19
71
19
73
19
75
19
77
19
79
19
81
19
83
19
85
19
87
19
89
19
91
19
93
19
95
19
97
19
99
20
01
20
03
20
05
Mar
gin
al T
ax R
ate
(%
)
Marginal Tax Rate Top 1% Wage Income Shares

GINI Country Report Japan
Page 89
5.4 Public Social Expenditure
5.4.1 Levels and Trends
The amount of social security payments has increased over time. Figure 5.8 shows the upward trend
of total expenditure as a percentage of annual real GDP, which is shown by bars in the figure. Looking
at the composition of the payments, amounts related to population aging, such as social security
payments for the elderly, and for health and medical care, have increased.
Figure 5.8: Ratio of social security benefits by functional category to Annual Real GDP (%)
Source: The Cost of Social Security (National Institute of Population and Social Security Research)
As another type of expenditure related to population aging, Japan started public mandatory
long-term care insurance in 2000. People aged over 40 must pay long-term care insurance, and
receive benefits when they actually need long-term care in principle (depending on ADL). Figure 5.9
shows that LTC payments have increased since 2000 as population has aged.
Figure 5.9: Long-term care payments as a % of real GDP
0
5
10
15
20
25
19
95
19
96
19
97
19
98
19
99
20
00
20
01
20
02
20
03
20
04
20
05
20
06
20
07
20
08
20
09
(%)
Total Old age Bereaved families
Disability benefits Industrial accidents Health and medical care
Family benefits Unemployment Housing

GINI Country Report Japan
Page 90
Source: The Cost of Social Security (National Institute of Population and Social Security Research)
5.4.2 Social Assistance for Families with Children
Social assistance for families with children increased during the 2000s (Figure 5.10). The amount of
child allowance and child-related expenditure in the figure includes: 1. payments to households who
have a child under 12 years old and have an income of less than the income ceiling threshold; 2.
payments to households who have a child under 18 years old (child rearing allowance); 3.
government expenditures on child-related services; and, 4. payments for child-care leaves. The
increase in the child-related payment is partly due to a sharp drop in birth rates as mentioned in
Chapter 3.
0,00
0,20
0,40
0,60
0,80
1,00
1,20
1,40
1,60
20
00
20
01
20
02
20
03
20
04
20
05
20
06
20
07
20
08
20
09
(%)

GINI Country Report Japan
Page 91
Figure 5.10: Child allowance and child-related government expenditure as a % of GDP
Source: Social Security Benefits (National Institute of Population and Social Security Research, 1975-2009)
5.4.3 Active Labor Market Policy
Government expenditure on job training as a percentage of GDP is low (Figure 5.11). The unemployed
are given unemployment insurance, but not much job training. People participate in job training at
their own expense in many cases.
Looking at the changes, expenditure on job training has been on a downward trend for a long time.
Although it increased from 1995 through 2000 when the labor market was in a severe condition
following the bursting of the economic bubble and the Asian financial crisis, it has not increased since
the 2008 crisis that followed the collapse of Lehman Brothers.
0%
5%
10%
15%
20%
25%
30%
35%1
99
4
19
95
19
96
19
97
19
98
19
99
20
00
20
01
20
02
20
03
20
04
20
05
20
06
20
07
20
08
20
09

GINI Country Report Japan
Page 92
Figure 5.11: Government expenditure on job training as % of GDP
Source: The White Paper on Labour and Economy 2012 (Ministry of Health, Labour and Welfare)
Note: Government expenditure on job training includes general job training, job training especially for young
people, and for disabled people, which is reported by Ministry of Health, Labour and Welfare. Because the
components of all expenditure related to unemployment and job training have changed significantly since 2008,
the line is disconnected. The statistics are shown every five years before 2005.
5.5. Education
In response to serious economic conditions and austere budget conditions since the late 1990s,
government expenditures on basic education, which are financed mostly by local governments,
peaked in 1995, and have been decreasing since then (Figure 5.12). National government
expenditures on education, which are mostly for college and university education, have also
decreased since 1995, regardless of the increase in the number of people entering higher education.
The burden of expenditure on education is mostly imposed on each household in Japan. As economic
inequality increases, educational inequality increases between households who can and cannot
afford education costs. This tendency might be stronger if less educated parents who have lower
incomes tend to invest less money on child's education.
Figure 5.12: National and local government expenditure on education
0
0,0005
0,001
0,0015
0,002
0,0025
0,003
0,0035
0,0041
98
0
19
85
19
90
19
95
20
00
20
05
20
06
20
07
20
08
20
09
20
10
(*100%)

GINI Country Report Japan
Page 93
Source: National government expenditure is from Basic Survey on Schools, and local government expenditure is
from Survey of Local Educational Expenditure (both are reported by Lifelong Learning Policy Bureau, Ministry of
Education, Culture, Sports, Science and Technology).
Note: National government expenditure is mainly on college and universities, while local government
expenditure is mainly on kindergartens, elementary schools, and secondary schools.
5.6 Conclusion
This chapter summarized public policies related to inequality. Japan’s minimum wage has increased
steadily since 2007, but the increase in the minimum wage seems to have only a small effect on
alleviating existing levels of income inequality. The impact of income redistribution policies through
income taxes has been smaller. This is because the maximum income tax rate was cut and the
progressiveness of income taxes as a whole was reduced in the late 1990s. The Japanese government
has increased its fiscal spending on social security for the elderly along with population aging. The
government has increased unemployment insurance payments as the numbers of unemployed
increased, but has not increased job training for the working population. Government expenditures
on intermediate and higher education peaked in 1995, and then decreased. This decreasing trend is
probably due to serious economic conditions and austere budget conditions since the late 1990s. The
educational burden is basically imposed on households. If more educated parents with higher
0
2.000
4.000
6.000
8.000
10.000
12.000
14.000
16.000
19
80
19
85
19
90
19
95
20
00
20
05
20
08
in b
illin
os
of
yen
National government expenditure on education(mostly for upper education)
Local government expenditure on education(mostly for lower and basic education)

GINI Country Report Japan
Page 94
incomes invest more on their children’s education and less educated parents with lower income
invest less, inequalities will further increase in the future.
To conclude, Japan’s income inequality has widened gradually since the 1980s. The wage gap has
become large not between but within educational groups. An increase in the income gap has come
with a decreased income share of low income groups. The poverty rate has also risen during this
period.
Most Japanese recognize that inequality has been expanding, but their attitude towards income
redistribution policies has not changed in the 2000s. Approximately 70% of Japanese think “The poor
are lazy.” The percentage of people who agree that “it is the responsibility of the government to
reduce differences in income between families with high incomes and those with low income,” is 60%,
although it has increased during the past decade. The change in attitudes towards the government’s
role in reducing income inequality does not seem overly dramatic.
The increasing political power of the elderly and little change in attitudes towards income
redistribution policies suggest that a more efficient policy to reduce income inequality has not been
implemented. Although the policy for lower income groups that mainly consists of younger people is
an urgent issue, the government has failed to formulate and implement more efficient policies
because of financial and political reasons.

GINI Country Report Japan
Page 95
References
Abe, A. (2006) “Empirical Analysis of Relative Deprivation and Poverty in Japan,” IPSS Discussion
Paper Series, No.2005-07.
Autor, D. H., L. F. Katz, and M. S. Kerney (2006) “The Polarization of the U.S. Labor Market,” American
Economic Review, Vol.96, No.2, pp. 189-194.
Kohara, M. and F. Ohtake (2006) "Unemployment and Inequality in Japan," JCER Economic Journal,
Japan Center for Economic Research, No.55, pp.22-42. (in Japanese)
Kambayashi, R., D. Kawaguchi and I. Yokoyama(2008) “Wage Distribution in Japan, 1989-2003,”
Canadian Journal of Economics, Vol. 41, No.4, pp. 1329-1350.
Kawaguchi, D. and Y. Mori (2008) "Stable Wage Distribution in Japan, 1982-2002: A Counter Example
for SBTC?,” RIETI Discussion Paper Series, 08-E-020.
Kawaguchi, D. and Y. Mori (2009) "Is Minimum Wage an Effective Anti Poverty Policy in Japan?”
Pacific Economic Review, Vol. 14, No. 4, pp. 532-554.
Kawashima, H. (2012) "Labor Markets, Poverty and Crime," OSIPP Discussion Paper, DP-2012-J-007.
Lemieux, T. (2006) “Postsecondary Education and Increasing Wage Inequality,” American Economic
Review, Vol. 96, No.2, pp. 195-199.
Moriguchi, C. (2010) “Top Wage Incomes in Japan, 1951-2005,” Journal of Japanese and International
Economies, Vol. 24, pp. 301-333.
Moriguchi, C. and E. Saez, (2008) "The Evolution of Income Concentration in Japan, 1886-2005:
Evidence from Income Tax Statistics," The Review of Economics and Statistics, MIT Press, Vol. 90,
No.4, pp. 713-734.
Ohtake, F. and M. Saito (1998) "Population aging and consumption inequality in Japan," The Review of
Income and Wealth, Ser.44, No.3, pp.361-381.
Ohtake, F. and M. Kohara (2010), "The relationship between Unemployment and Crime: Evidence
from Time-series Data and Prefectural Panel Data," Japanese Journal of Sociological Criminology,
Japanese Association of Sociological Criminology, No.35, pp.54-71.
Piketty, T. and E. Saez(2006)”Evolution of Top Incomes: A Histrical and International Perspective,”
American Economic Review, Vol. 96, No.2, pp.200-205.

GINI Country Report Japan
Page 96
Sudo, N., M. Suzuki, and T. Yamada (2012) “Inequalities in Japanese Economy during the Lost
Decades,” CIRJE Discussion Paper, CIRJE-F-856.

GINI Country Report Japan
Page 97
Appendix
Appendix Figure 1: National income tax payment calculated in our tax calculation program (The
case of 1999 calculation)
Note: This chart summarizes our income-tax-calculation program, where disposable-income is predicted from observed before-tax income, using NSFIE. This is an example of calculation for 1999 income. The items shown in a box are calculated in our tax-calculation program, while those in a dotted box are not calculated in our program. Since taxation system changes over years, we made a different program for each year.
Earned Income(Deductions from
earnings)Basic exemption
Business incomeDeduction for
spouses
Income from real
estate
Credit for
dividends
Miscellaneous
income
Exemption for
dependents
(Pension income)
Occasional incomeDeduction for the
elderly
Retirement income(Deduction for
retirement income)
Deduction for social
insurance
premiums
Income from forestry (Special deduction)
Capital gains (Special deduction)Deduction for
medical expenses
Deduction for life
insurance
premiums
Exemption for
widows or
widowers
Income from interestTax‐free small‐sum
savings system
Exemption for the
disabled
Income from
dividendsOther deductions
Return-free system
forSmall sums of
dividend income
Selection on
separate
withholding
taxation
Return-free system
for savings account
Separate withholding
taxation
Income Tax BaseTaxable
Income
Tax rate
table
Tax
Amount
Disposable
Income=
Income-
Tax
Amount
(Deduction for public
pensions)
Credit for
foreign tax
Other
Special
credits

GINI Country Report Japan
Page 98
Appendix Figure 2: Local tax payment calculated in our tax calculation program (The case of 1999
calculation
Note: See the note for the previous chart.
Basic exemption
Deduction for
spouses
Credit for
dividends
Exemption for
dependents
Deduction for the
elderly
Deduction for
social insurance
premiums
Deduction for
medical expenses
Deduction for life
insurance
premiums
Exemption for
widows or
widowers
Exemption for the
disabled
Other deductions
Amount
of
Resident
tax
Other Special
credits
Per capita
basis tax
amount
Tax BaseTaxable
Income
Tax rate
table
Income
basis tax
amountCredit for
foreign tax

GINI Country Report Japan
Page 99
Appendix Summary Table for Japan n.a.= not applicable; n.i.=not indicated
Chapter 2 1980-1989 1990-94 1995-99 2000-04 2005-2010 Over specific period
Gini: income before taxes ↗ → ↗ ↗ n.a.
Gini: income after taxes ↗ → ↗ ↗ n.a.
Gini: consumption expenditure ↗ ↗ ↗ ↗ n.a.
Gini: asset holdings ↗ ↘ ↗ ↗ n.a.
Poverty : income before taxes ↘ ↗ ↗ ↗ n.a.
Poverty : income after taxes ↘ ↗ ↗ ↗ n.a.
Poverty : consumption expenditure → ↗ ↗ ↗ n.a.
Number of households living on welfare ↘ → ↗ ↗ ↗
Gini: Educatiional years ↗ ↗ ↗ ↗
Male wage gap between 90 and 50 percent ↘ ↘ → → ↗Male wage gap between 50 and 10 percent ↘ → ↗ ↗ ↗Female wage gap between 90 and 50 percent ↘ ↘ → → →Female wage gap between 50 and 10 percent → → ↗ ↗ ↗Unemployment rate → ↘ ↗ ↗ ↘Employment rate → ↗ ↘ ↘ ↗Share of non-standard employees ↗ ↗ ↗ ↗ ↗Wage gap between part-time to full-time workers ↘ ↘ ↘ ↗ ↗Wage gap between college graduates (male under
64)→ → ↗ ↗ ↗
Male-female wage gap ↘ ↘ ↘ ↘ ↘Gini old-young gap: income after taxes ↘ ('84-2004)
Gini old-young gap: consumption expenditure ↘ ('84-2004)
Gini old-young gap: asset holdings ↘ ('84-2004)

GINI Country Report Japan
Page 100
Chapter 3 1980-1989 1990-94 1995-99 2000-04 2005-2010 Over specific period
Number of homeless n.i. n.i. n.i. ↘ ↘Lone Parenthood ↗ ↗ ↗ ↗ ↗Marriages ↘ ↗ → ↘ ↘Divorces ↘ ↗ ↗ ↘ ↘Fertility ↘ ↘ ↘ ↘
Housing, House prices ↗ ↘ → ↘ ↗Home-ownership ↘ ↘ ↗ ↗ →
Crime rate → ↗ ↗ ↘ ↘Youth crime rates n.i. → → n.i. n.i.
Life expectancy at birth ↗ ↗ ↗ ↗ ↗Suicied rates ↘ → ↗ ↗ ↗Living conditions n.i. ↘ ↘ ↘ n.i.
Chapter 4 1980-1989 1990-94 1995-99 2000-04 2005-2010 Over specific period
Electorate turn up, general ↘ ↘ ↘ ↘ ↘
Unionization ↘ ↘ ↘ ↘ ↘Political participation (civic organizations) → ('90-2000)
Trust in others n.i. n.i. ↗ n.i. n.i.
Conservatives n.i. n.i. n.i. → →
Right wing ↘ ↘ → ↗ →Agreeing no further immigrants to be allowed to
country↘ ('95-2003)
Income differences are too large in the country ↗ ('99-2009)
Poor are lazy n.i. n.i. n.i. → n.i.
Government should redistribute wealth or income n.i. n.i. n.i. ↗ ↗

GINI Country Report Japan
Page 101
Chapter 5 1980-1989 1990-94 1995-99 2000-04 2005-2010 Over specific period
Growth rate (real GDP per capita) ↗ ↘ ↘ ↗ ↘
Price index ↗ ↗ ↘ ↘ ↘
Government debt (% of GDP) → ↗ ↗ ↗ ↗
Minimum wage level n.i. n.i. ↗ → ↗
Kaitz Index → ↘ → → ↗
Total tax receipt (% of GDP) ↗ ↘ ↘ ↗ ↘
Marginal tax rate for top 1% → → → ↘ →
Expenditures on social security (% of GDP) n.i. n.i. ↗ ↗ ↗
Expenditures on long-term care (% of GDP) n.a. n.a. n.a. ↗ ↗Expenditures on child allowance and child-
related services (% of GDP)n.i. n.i. → ↗ ↗
Expenditures on job-training (% of GDP) ↘ ↘ ↗ ↘ ↘
Expenditures on higher education ↗ ↗ ↘ ↘ ↘
Expenditures on lower education ↗ ↗ → ↗ →