japan prime realty investment corporation
TRANSCRIPT

DISCLOSURE APPENDIX AT THE BACK OF THIS REPORT CONTAINS IMPORTANT DISCLOSURES, ANALYST CERTIFICATIONS, AND THE STATUS OF NON-US ANALYSTS. US Disclosure: Credit Suisse does and seeks to do business with companies covered in its research reports. As a result, investors should be aware that the Firm may have a conflict of interest that could affect the objectivity of this report. Investors should consider this report as only a single factor in making their investment decision.
CREDIT SUISSE SECURITIES RESEARCH & ANALYTICS BEYOND INFORMATION®
Client-Driven Solutions, Insights, and Access
04 April 2014
Asia Pacific/Japan
Equity Research
REITs (REIT (Japan)) / OVERWEIGHT
Japan Prime Realty Investment Corporation (8955 / 8955 JP)
DOWNGRADE RATING
Valuation appeal waning; downgrade to NEUTRAL
■ Action: We revise our forecasts after contacting Japan Prime Realty (JPR)
and lower our target price from ¥390,000 to ¥360,000 (potential return 6.4%).
We also add forecasts for FT6/15. We now assume a higher risk premium
than previously in view of possible erosion in external growth expectations.
The lower TP erases JPR’s valuation appeal and mandates a downgrade
from Outperform to NEUTRAL.
■ Investment case: JPR has outperformed other large-cap J-REITs amid
expectations for the acquisition of high-quality properties. P/NAVPU is
currently 1.52x, well above the 1.37x simple average for other large caps.
■ In addition, property deals by JPR’s sponsor so far in 2014 have made it less
likely in our view that JPR will acquire the kind of S-class buildings this year
that the market anticipates. We believe this could erode the expectations for
external growth that have been a key driver of outperformance.
■ Risks: Upside risks include the acquisition of an S-class building in central
Tokyo at a good price. Downside risks include a failure to announce any new
acquisitions at end-June and the departure of major tenants.
■ Valuation: We base our ¥360,000 TP on the sum of our DPU forecasts for
FT12/14 and FT6/15 (¥12,128; previously the ¥11,825 total of our FT6/14
and FT12/14 forecasts) and a 3.36% (previously 3.04%) distribution yield
(risk-free rate 0.66%, risk premium 3.7%, expected CPI growth 1.0%).
Share price performance
80
100
120
140
200000
250000
300000
350000
400000
Apr-12 Aug-12 Dec-12 Apr-13 Aug-13 Dec-13
Price (LHS) Rebased Rel (RHS)
The price relative chart measures performance against the
TOPIX which closed at 1216.77 on 03/04/14
On 03/04/14 the spot exchange rate was ¥103.91/US$1
Performance Over 1M 3M 12M Absolute (%) -1.2 0.4 -4.1 Relative (%) -1.5 7.0 -21.4
Financial and valuation metrics
Fiscal Term 12/13A 6/14E 12/14E 6/15E Operating revenue (¥ mn) 13,592 13,592 13,705 13,463 Operating profit (¥ mn) 6,368 6,349 6,337 6,226 Recurring profit (¥ mn) 4,900 4,983 4,964 5,044 Net income (¥ mn) 4,954 4,982 4,963 5,043 EPS (¥) 6,005 6,038 6,016 6,113 Change from previous EPS (%) n.a. 1.9 1.9 Consensus EPS (¥) n.a. 6,124.3 6,190.9 6,372.2 EPS growth (%) -0.4 0.6 -0.4 1.6 P/E (x) 28.1 28.0 28.1 27.7 Dividend per share (¥) 6,006 6,038 6,016 6,113 FFO per share (¥) 8,270 8,261 8,239 8,336 Dividend yield-(%) 3.6 3.6 3.6 3.6 FFO ratio (x) 20.4 20.5 20.5 20.3 ROE (%) 5.0 5.1 5.0 5.1 LTV (%) 32.7 32.3 32.3 32.3
Source : Company data, IFIS, Credit Suisse estimates Note : Dividend yield, FFO ratio, ROE and PER are annual basis.
Rating (from Outperform) NEUTRAL* Price (03 Apr 14, ¥) 338,500 Target price (¥) (from 390,000) 360,000¹ Chg to TP (%) 6.4 Market cap. (¥ bn) 279.3 (US$ 2.7) Enterprise value (¥ bn) 403.3 Number of shares (mn) 0.82 52-week price range 379,000 - 262,600
*Stock ratings are relative to the coverage universe in each
analyst's or each team's respective sector.
¹Target price is for 12 months.
Research Analysts
Atsuro Takemura
81 3 4550 7372
Masahiro Mochizuki
81 3 4550 7389
04 April 2014
Japan Prime Realty Investment Corporation (8955 / 8955 JP) 2
Downgrade to NEUTRAL We revise our forecasts after contacting JPR and lower our TP from ¥390,000 to ¥360,000.
We now assume a higher risk premium than previously in view of possible erosion in
external growth expectations. The lower TP erases JPR’s valuation appeal and mandates
a downgrade from Outperform to NEUTRAL.
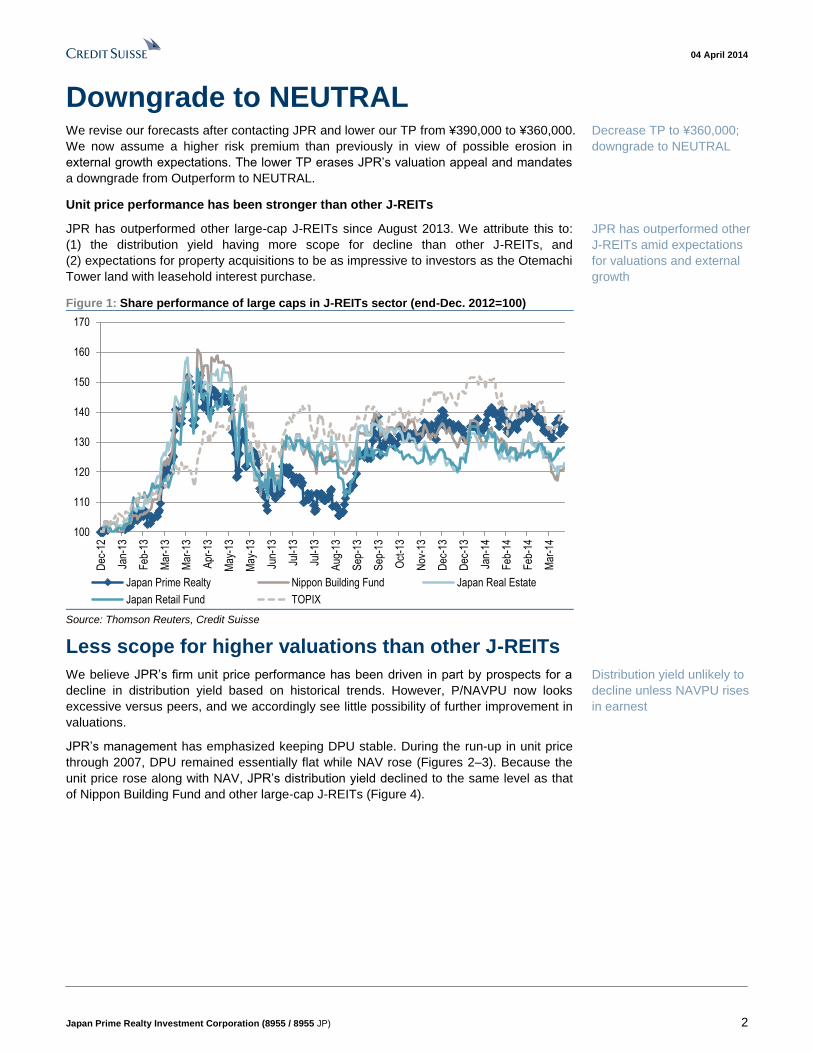
Unit price performance has been stronger than other J-REITs
JPR has outperformed other large-cap J-REITs since August 2013. We attribute this to:
(1) the distribution yield having more scope for decline than other J-REITs, and
(2) expectations for property acquisitions to be as impressive to investors as the Otemachi
Tower land with leasehold interest purchase.
Figure 1: Share performance of large caps in J-REITs sector (end-Dec. 2012=100)
100
110
120
130
140
150
160
170
Dec
-12
Jan-
13
Feb
-13
Mar
-13
Mar
-13
Apr
-13
May
-13
May
-13
Jun-
13
Jul-1
3
Jul-1
3
Aug
-13
Sep
-13
Sep
-13
Oct
-13
Nov
-13
Dec
-13
Dec
-13
Jan-
14
Feb
-14
Feb
-14
Mar
-14
Japan Prime Realty Nippon Building Fund Japan Real Estate
Japan Retail Fund TOPIX Source: Thomson Reuters, Credit Suisse
Less scope for higher valuations than other J-REITs
We believe JPR’s firm unit price performance has been driven in part by prospects for a
decline in distribution yield based on historical trends. However, P/NAVPU now looks
excessive versus peers, and we accordingly see little possibility of further improvement in
valuations.
JPR’s management has emphasized keeping DPU stable. During the run-up in unit price
through 2007, DPU remained essentially flat while NAV rose (Figures 2–3). Because the
unit price rose along with NAV, JPR’s distribution yield declined to the same level as that
of Nippon Building Fund and other large-cap J-REITs (Figure 4).
Decrease TP to ¥360,000;
downgrade to NEUTRAL
JPR has outperformed other
J-REITs amid expectations
for valuations and external
growth
Distribution yield unlikely to
decline unless NAVPU rises
in earnest

04 April 2014
Japan Prime Realty Investment Corporation (8955 / 8955 JP) 3
Figure 2: JPR’s NAVPU increased in last rally (2H
2002=100)
Figure 3: JPR’s DPU did not increase in last rally (2H
2002=100)
50
70
90
110
130
150
170
190
210
230
2H 2
002
1H 2
003
2H 2
003
1H 2
004
2H 2
004
1H 2
005
2H 2
005
1H 2
006
2H 2
006
1H 2
007
2H 2
007
1H 2
008
2H 2
008
1H 2
009
2H 2
009
1H 2
010
2H 2
010
1H 2
011
2H 2
011
1H 2
012
2H 2
012
1H 2
013
2H 2
013
Japan Prime Realty (refference) Nippon Building Fund
50
60
70
80
90
100
110
120
130
140
150
2H 2
002
1H 2
003
2H 2
003
1H 2
004
2H 2
004
1H 2
005
2H 2
005
1H 2
006
2H 2
006
1H 2
007
2H 2
007
1H 2
008
2H 2
008
1H 2
009
2H 2
009
1H 2
010
2H 2
010
1H 2
011
2H 2
011
1H 2
012
2H 2
012
1H 2
013
2H 2
013
1H 2
014
CS
E
2H 2
014
CS
E
1H 2
015
CS
E
Japan Prime Realty (refference) Nippon Building Fund
Source: Company data, Credit Suisse Source: Company data, Credit Suisse
Figure 4: Dividend yields (JPR's dividend yield declined to the same level as Nippon
Building Fund in last rally)
0.0%
1.0%
2.0%
3.0%
4.0%
5.0%
6.0%
7.0%
8.0%
9.0%
Jun-
02
Dec
-02
Jun-
03
Dec
-03
Jun-
04
Dec
-04
Jun-
05
Dec
-05
Jun-
06
Dec
-06
Jun-
07
Dec
-07
Jun-
08
Dec
-08
Jun-
09
Dec
-09
Jun-
10
Dec
-10
Jun-
11
Dec
-11
Jun-
12
Dec
-12
Jun-
13
Dec
-13
Japan Prime Realty Nippon Building Fund
Source: Thomson Reuters, Credit Suisse
However, P/NAVPU has now become comparatively high amid expectations for property
acquisitions (Figure 5). JPR’s 1.52x is well above the 1.37x simple average for other large
caps (Nippon Building Fund, Japan Real Estate Investment, Japan Retail Fund, ORIX
JREIT). This makes a further decline in distribution yield unlikely in our view unless NAV
rises.

04 April 2014
Japan Prime Realty Investment Corporation (8955 / 8955 JP) 4
Figure 5: P/NAVPU is relatively high
0.4
0.6
0.8
1.0
1.2
1.4
1.6
1.8
2.0
2.2
Jul-0
2
Jan-
03
Jul-0
3
Jan-
04
Jul-0
4
Jan-
05
Jul-0
5
Jan-
06
Jul-0
6
Jan-
07
Jul-0
7
Jan-
08
Jul-0
8
Jan-
09
Jul-0
9
Jan-
10
Jul-1
0
Jan-
11
Jul-1
1
Jan-
12
Jul-1
2
Jan-
13
Jul-1
3
Jan-
14
Japan Prime Realty (for refference) Nippon Building Fund
(x)
Source: Company data, Thomson Reuters, Credit Suisse
External growth expectations could decline
We believe JPR’s unit-price performance has also been supported by expectations for
property acquisitions as impressive as in the past. However, we now see little possibility
that this year JPR will purchase S-class buildings that its sponsor is involved in. We
believe this could erode expectations for external growth.
The stock market welcomed JPR’s announcement in March 2013 of its acquisition of land
with leasehold interest for Otemachi Tower from sponsor Tokyo Tatemono. We suspect
this had investors looking for JPR to also acquire properties included in major projects in
which Tokyo Tatemono has a major share.
However, portions of Otemachi Tower on which JPR had priority negotiating rights were
sold to Mizuho Bank on 26 March 2014, with JPR taking a pass.
Nakano Central Park was sold by the SPC on 27 March to Tokyo Tatemono, Hulic, AXA
Life Insurance and to a private fund. We believe the property did not meet JPR’s criteria in
terms of NOI yield, as some tenants were still receiving free rent and existing tenant rents
were below market levels.
We also see little possibility of JPR acquiring Tokyo Square Garden this year, as the
building will not generate profits until 2015.
Unlikely to acquire S-class
buildings, at least this year

04 April 2014
Japan Prime Realty Investment Corporation (8955 / 8955 JP) 5
Unit price performance
JPR has outperformed the TSE REIT Index amid expectations for the acquisition of
sponsor properties. While it underperformed TOPIX in 2H 2013 as long-term interest rates
rose, it has outperformed in 2014, with its status as a yield play supporting comparatively
firm performance amid a decline in the broader market as foreign investors sold.
We expect JPR to perform in line with the TSE REIT Index as expectations for external
growth erode. We look for slight outperformance versus TOPIX.
Figure 6: Share performance
60
80
100
120
140
160
180
200
Jan-
09
Apr
-09
Jul-0
9
Oct
-09
Jan-
10
Apr
-10
Jul-1
0
Oct
-10
Jan-
11
Apr
-11
Jul-1
1
Oct
-11
Jan-
12
Apr
-12
Jul-1
2
Oct
-12
Jan-
13
Apr
-13
Jul-1
3
Oct
-13
Jan-
14
Japan Prime Realty Japan Prime Realty/TSE REIT Japan Prime Realty/TOPIX
(Jan 2009=100)
Source: Thomson Reuters, Credit Suisse
Unit price and valuation
We base our ¥360,000 TP on the sum of our DPU forecasts for FT12/14 and FT6/15
(¥12,128) and a 3.36% distribution yield (risk-free rate 0.66%, risk premium 3.7%,
expected CPI growth 1.0%).
We previously expected the risk premium to decline to 3.3% on expectations for higher
rents and external growth but now go with 3.7% as external growth expectations look set
to erode. Our 3.7% risk premium assumption is the bottom between 2011 and 2012, when
the BoJ was buying J-REITs but market expectations for inflation did not rise.
Figure 7: Implied yields Figure 8: Risk premiums
0.0%
1.0%
2.0%
3.0%
4.0%
5.0%
6.0%
7.0%
8.0%
9.0%
Jun-
02
Dec
-02
Jun-
03
Dec
-03
Jun-
04
Dec
-04
Jun-
05
Dec
-05
Jun-
06
Dec
-06
Jun-
07
Dec
-07
Jun-
08
Dec
-08
Jun-
09
Dec
-09
Jun-
10
Dec
-10
Jun-
11
Dec
-11
Jun-
12
Dec
-12
Jun-
13
Dec
-13
Implied NOI yield Dividend yield
0.0%
1.0%
2.0%
3.0%
4.0%
5.0%
6.0%
7.0%
8.0%
Jun-
02
Jan-
03
Aug
-03
Mar
-04
Oct
-04
May
-05
Dec
-05
Jul-0
6
Feb
-07
Sep
-07
Apr
-08
Nov
-08
Jun-
09
Jan-
10
Aug
-10
Mar
-11
Oct
-11
May
-12
Dec
-12
Jul-1
3
Feb
-14
Risk premium of dividend yield (distribution yield less the 10-year JGB yield)
Risk premium of NOI yield (distribution yield less the 10-year JGB yield)
Source: Thomson Reuters, Credit Suisse Source: Thomson Reuters, Credit Suisse

04 April 2014
Japan Prime Realty Investment Corporation (8955 / 8955 JP) 6
Our forecasts
DPU for FT12/13 was ¥6,006. We forecast ¥6,038 (+0.5% ToT) for FT6/14, ¥6,016
(–0.4%) for FT12/14, and ¥6,113 (+1.6%) for FT6/15.
New acquisitions
We look for full-year contributions from Science Plaza-Yonbancho Plaza and Shibadaimon
Center Building, acquired in December 2013.
Occupancy
The overall office occupancy rate at end-FT12/13 was 94.8% (94.4% in Tokyo’s 23 wards,
95.4% elsewhere). We look for 94.2% (94.4%, 95.4%) in FT6/14, 95.3% (95.3%, 95.4%) in
FT12/14, and 93.7% (93.0%, 94.6%) in FT6/15.
Adjusting our figures to count rent-free tenants as vacancies, we forecast overall
occupancy of 94.2% (94.4%, 93.9%) in FT6/14, 94.8% (94.4%, 95.4%) in FT12/14, and
93.7% (93.0%, 94.6%) in FT6/15.
The occupancy rate of commercial facilities at end-FT12/13 was 99.7%, and we look for it
to remain at that level in FT6/14.
Average rents
The per-tsubo average monthly rent in Tokyo’s 23 wards was ¥24,705 in FT12/13. We
forecast ¥24,589 (–0.5% ToT) in FT6/14, ¥24,449 (–0.5%) in FT12/14, and ¥24,543
(–0.5%) in FT6/15. The per-tsubo average monthly rent in other areas was ¥15,233 in
FT12/13. We look for ¥15,199 (–0.5% ToT) in FT6/14, ¥15,085 (–0.5%) in FT12/14, and
¥15,032 (–0.5%) in FT6/15.
We expect per-tsubo rent for commercial facilities to remain flat at the FT12/13 level of
¥10,764.
Figure 9: Occupancy rates and average rents in the portfolio
84.0%
86.0%
88.0%
90.0%
92.0%
94.0%
96.0%
98.0%
100.0%
0
5,000
10,000
15,000
20,000
25,000
30,000
35,000
40,000
FT
6/0
2
FT
12
/02
FT
6/0
3
FT
12
/03
FT
6/0
4
FT
12
/04
FT
6/0
5
FT
12
/05
FT
6/0
6
FT
12
/06
FT
6/0
7
FT
12
/07
FT
6/0
8
FT
12
/08
FT
6/0
9
FT
12
/09
FT
6/1
0
FT
12
/10
FT
6/1
1
FT
12
/11
FT
6/1
2
FT
12
/12
FT
6/1
3
FT
12
/13
FT
6/1
4(C
SE
)
FT
12
/14(C
SE
)
FT
6/1
5(C
SE
)
Office avg. rent in Tokyo 23 wards (LHS) Office avg. rent in Tokyo 23 wards (LHS)Retail avg. rent in the other area (LHS) Office occ. rate in Tokyo 23 wards (RHS)Office occ. rate in Tokyo 23 wards (RHS) Retail occ. rate in other area (RHS)
(Yen/tsubo per month)
Source: Company data, Credit Suisse estimates

04 April 2014
Japan Prime Realty Investment Corporation (8955 / 8955 JP) 7
Earnings forecasts and valuations Figure 10: Earnings forecasts
¥mn YoY (%) ¥mn YoY (%) ¥mn YoY (%) ¥mn YoY (%) ¥ YoY (%)
Consolidated
Dec-13 A 13,592 2.4 6,368 -0.3 4,900 -1.5 4,954 -0.4 6,004.9 -0.4
Jun-14 CS E (new) 13,592 0.0 6,349 -0.3 4,983 1.7 4,982 0.6 6,038.3 0.6
(prev) 13,399 -1.4 6,285 -1.3 4,849 -1.0 4,848 -2.1 5,876.2 -2.1
CoE 13,630 0.3 6,348 -0.3 4,992 1.9 4,991 0.7 6,050.0 0.8
Dec-14 CS E (new) 13,705 0.8 6,337 -0.2 4,964 -0.4 4,963 -0.4 6,015.5 -0.4
(prev) 13,465 0.5 6,206 -1.3 4,909 1.2 4,908 1.2 5,949.0 1.2
Jun-15 CS E (new) 13,463 -1.8 6,226 -1.8 5,044 1.6 5,043 1.6 6,112.8 1.6
EPSOperating revenue Operating profit Recurring profit Net profit
Source: Company data, Credit Suisse estimates
Figure 11: Income statement
12/12 6/13 12/13 6/14 6/14 12/14 6/15
(¥mn) Co.E CS.E CS.E CS.E
Operating revenue 12,963 13,279 13,592 13,630 13,592 13,705 13,463
Real estate rental revenues 12,963 13,279 13,592 13,630 13,592 13,705 13,463
Rental revenues 12,160 12,510 12,694 12,879 12,841 12,828 12,712
Other operating revenue 803 769 898 751 751 877 751
Profit on sale of real estate 0 0 0 0 0 0 0
Dividends received 0 0 0 0 0 0 0
(Changes in rental revenue) 147 (14) (116)
Contribution from new properties or full-term contribution 244 0 0
Revised rents (43) (68) 16
Change in vacancy rate (54) 54 (132)
Decrease by sales of properties 0 0 0
Others 0 0 (0)
Operating expenses 6,198 6,894 7,223 7,282 7,243 7,367 7,237
Property-related expenses 5,519 6,208 6,535 6,562 6,555 6,678 6,549
Property and other taxes 1,025 1,822 1,879 1,992 1,992 1,986 1,986
Other expensed 2,663 2,502 2,787 2,729 2,729 2,858 2,729
Depreciation 1,831 1,885 1,869 1,837 1,834 1,834 1,834
Loss on sale of real estate 0 0 0 0 0 0 0
Asset management fees 465 469 473 473 474 473
Administrative service and custodian fees 77 79 81 81 81 81
Director's fee 7 7 7 7 7 7
Trust fees 40 37 35 35 35 35
Other operating expenses 89 94 92 92 92 92
Profit on real estate business (excluding capital gain/loss) 7,444 7,070 7,057 7,037 7,027 6,914
(Changes in profit in real estate business) 0 0 0 (20) (11) (113)
Contribution from new properties or full-term contribution 162 0 0
Revised rents (43) (68) 16
Change in vacancy rate (54) 54 (132)
Decrease by sales of properties 0 0 0
Others (85) 3 3
NOI (excluding profit on sale) 9,275 8,955 8,926 8,904 8,871 8,861 8,748
NOI growth (YoY) 392 (320) (29) 0 (55) (11) (113)
Operating profits 6,765 6,385 6,368 6,348 6,349 6,337 6,226
(% of revenues) 52.2% 48.1% 46.9% 46.6% 46.7% 46.2% 46.2%
Non-operating profit/loss (1,739) (1,410) (1,468) (1,366) (1,374) (1,182)
Non-operating profit 10 60 17 57 7 57
Non-operating loss 1,749 1,470 1,485 1,423 1,380 1,239
Recurring profits 5,026 4,975 4,900 4,992 4,983 4,964 5,044
(% of revenues) 38.8% 37.5% 36.1% 36.6% 36.7% 36.2% 37.5%
Extraordinary loss 0 0 55 0 0 0
Net income before tax 5,026 4,975 4,955 4,983 4,964 5,044
Net income 5,025 4,975 4,954 4,991 4,982 4,963 5,043 Source: Company data, Credit Suisse estimates

04 April 2014
Japan Prime Realty Investment Corporation (8955 / 8955 JP) 8
Figure 12: Balance sheet
12/12 6/13 12/13 6/14 12/14 6/15
(¥mn) CS.E CS.E CS.E
Total current assets 20,696 22,896 22,139 20,904 21,623 22,440
Cash and bank deposits 8,402 10,852 9,781 8,546 9,264 10,082
Trust cash and trust deposits 11,596 11,569 11,857 11,857 11,857 11,857
Rental receivables 229 321 271 271 271 271
Prepaid expenses 203 145 189 189 189 189
Deferred tax assets 0 0 0 0 0 0
Consumption 259 0 0 0 0 0
Other current assets 5 8 41 41 41 41
Fixed assets 381,111 386,614 391,657 390,947 390,237 389,527
Tangible fixed assets 375,722 381,291 386,429 385,719 385,009 384,299
Intangible fixed assets 4,799 4,799 4,798 4,798 4,798 4,798
Other investment assets 589 525 429 429 429 429
Deferred assets 176 206 178 151 124 96
Issuance costs of bond 176 206 178 151 124 96
Total assets 401,984 409,716 413,974 412,002 411,983 412,063
Current liabilities 35,659 40,903 35,460 37,225 39,625 33,625
Trade accounts payable 1,722 1,825 1,699 1,699 1,699 1,699
Short-term loans 0 0 2,000 2,000 2,000 2,000
Current portion of long-term loans 30,618 30,468 12,235 6,000 19,400 26,400
Current portion of bond 0 5,000 16,000 24,000 13,000 0
Accrued payable 581 695 691 691 691 691
Accrued expenses 211 208 215 215 215 215
Accrued corporate taxes 1 1 1 1 1 1
Accrued consumption taxes 64 192 174 174 174 174
Rent received in advance 2,461 2,515 2,446 2,446 2,446 2,446
Deposits 0 0 0 0 0 0
Others 1 0 0 0 0 (0)
Fixed liabilities 169,156 171,696 181,419 177,654 175,254 181,254
Bond 49,500 51,500 40,500 32,500 43,500 56,500
Long-term loans 100,439 100,190 121,024 125,259 111,859 104,859
Tenant leasehold and security 7,871 7,959 7,553 7,553 7,553 7,553
Trust tenant leasehold and security 11,345 12,047 12,342 12,342 12,342 12,342
Total unit holders' equity 197,168 197,117 197,095 197,123 197,104 197,184
Total liabilities and unit holders' equity 401,984 409,716 413,974 412,002 411,983 412,063 Source: Company data, Credit Suisse estimates

04 April 2014
Japan Prime Realty Investment Corporation (8955 / 8955 JP) 9
Figure 13: Cash flow statement
12/12 6/13 12/13 6/14 12/14 6/15
(¥mn) CS.E CS.E CS.E
Cash flow from operating activities 6,612 7,785 6,722 6,843 6,824 6,904
Income before income taxes 5,025 4,975 4,954 4,982 4,963 5,043
Depreciation and amortization 1,831 1,884 1,869 1,834 1,834 1,834
Others 0 0 0 0 0 0
Cash flow from investing activities (12,709) (6,886) (7,132) (1,124) (1,124) (1,124)
Fixed assets (11,867) (343) (359) (1,124) (1,124) (1,124)
Entrusted property and equipment (1,122) (7,446) (6,712) 0 0 0
Tenant leasehold and security deposits 342 251 0 0 0 0
Entrusted tenant leasehold and security deposits (61) 652 0 0 0 0
Others (1) (0) (61) 0 0 0
Cash flow from financing activities 1,435 1,523 (372) (6,954) (4,982) (4,963)
Short-term debt (20,600) 0 2,000 0 0 0
Long-term debt 8,076 (399) 2,601 (2,000) 0 0
Bond (2,051) 6,948 0 0 0 0
Payment of Bond issuance cost 0 0 0 0 0 0
Proceeds from issuance of units 20,606 0 0 0 0 0
Dividends to unit holders (4,596) (5,025) (4,973) (4,954) (4,982) (4,963)
Others 0 (0) 0 0 0 0
Net increase(decrease) in cash (4,662) 2,422 (783) (1,235) 719 818 Source: Company data, Credit Suisse estimates

04 April 2014
Japan Prime Realty Investment Corporation (8955 / 8955 JP) 10
Figure 14: Valuation sheet
12/12 6/13 12/13 6/14 12/14 6/15
(¥mn) CS.E CS.E CS.E
Total assets 401,984 409,716 413,974 412,002 411,983 412,063
Net assets 197,168 197,117 197,095 197,123 197,104 197,184
Total dividends 5,025 4,975 4,954 4,982 4,963 5,043
NOI (excluding capital gain/loss) 9,275 8,955 8,926 8,871 8,861 8,748
FFO 6,856 6,859 6,823 6,816 6,797 6,877
FFO payout ratio 73.3% 72.5% 72.6% 73.1% 73.0% 73.3%
Dividend (annualized) 10,051 9,950 9,908 9,963 9,926 10,086
NOI (annualized) (excluding capital gain/loss) 18,550 17,910 17,852 17,742 17,721 17,496
FFO (annualized) 13,713 13,718 13,646 13,631 13,594 13,754
EBITDA (annualized) 17,192 16,538 16,475 16,366 16,343 16,120
NOI yield (NOI/acquisition price) 4.9% 4.6% 4.6% 4.5% 4.5% 4.5%
Number of shares outstanding (share) 825,000 825,000 825,000 825,000 825,000 825,000
Net income per share (¥) 6,093 6,030 6,005 6,038 6,016 6,113
growth rate (%) -5.2% -1.0% -0.4% 0.6% -0.4% 1.6%
Dividend per share (¥) 6,093 6,030 6,005 6,038 6,016 6,113
NOI per share (¥) (excluding capital gain/loss) 11,242 10,855 10,819 10,753 10,740 10,604
FFO per share (¥) 8,311 8,314 8,270 8,261 8,239 8,336
shareholders' equity per share (¥) 238,992 238,929 238,903 238,937 238,914 239,011
Dividend per share (¥) (annualized) 12,183 12,060 12,010 12,077 12,031 12,226
NOI per share (¥) (excluding capital gain/loss)(annualized) 22,485 21,709 21,638 21,506 21,480 21,207
FFO per share (¥) (annualized) 16,622 16,628 16,541 16,523 16,477 16,672
Share price (¥) 249,200 303,500 337,000 338,500 338,500 338,500
Market capitalization at end of fiscal term 205,590 250,388 278,025 279,263 279,263 279,263
Dividend yield 4.9% 4.0% 3.6% 3.6% 3.6% 3.6%
PER 20.5 25.2 28.1 28.0 28.1 27.7
FFO ratio 15.0 18.3 20.4 20.5 20.5 20.3
Share price/NAV (book value) 1.0 1.3 1.4 1.4 1.4 1.4
Share price/NAV (appraisal value) 1.2 1.4 1.5 1.5 1.5 1.5
Implied NOI yield 4.7% 4.0% 3.7% 3.7% 3.7% 3.7%
EV/EBITDA 22.0 25.8 27.9 28.1 28.1 28.5
Interest-bearing debt 180,557 187,158 191,759 189,759 189,759 189,759
Tenant leasehold and security deposits 19,216 20,006 19,895 19,895 19,895 19,895
LTV (interest-bearing debt / total assets) 44.9% 45.7% 46.3% 46.1% 46.1% 46.1%
LTV (interest-bearing debt +deposit/total assets) 49.7% 50.6% 51.1% 50.9% 50.9% 50.9%
ROA 2.5% 2.4% 2.4% 2.4% 2.4% 2.4%
ROE 5.1% 5.0% 5.0% 5.1% 5.0% 5.1%
DSCR 6.0 6.3 6.1 6.3 6.3 7.0
D/E 0.9 0.9 1.0 1.0 1.0 1.0
FFO=Net profit+depreciation±capital gain/loss
DSCR=(Net profits+depreciation+interest payment)/(interest payment)
Annualized data except dividends are calculated by doubling data of each fiscal term.
Annualized dividend=(dividend±capital gain/loss)×2±capital gain/loss. Source: Company data, Credit Suisse estimates
04 April 2014
Japan Prime Realty Investment Corporation (8955 / 8955 JP) 11
Companies Mentioned (Price as of 03-Apr-2014)
AXA (AXAF.PA, €19.48) Hulic (3003.T, ¥1,410) Japan Prime Realty Investment Corporation (8955.T, ¥338,500, NEUTRAL, TP ¥360,000) Japan Real Estate Investment Corporation (8952.T, ¥522,000) Japan Retail Fund (8953.T, ¥203,700) Mizuho Financial Group (8411.T, ¥210) Nippon Building Fund (8951.T, ¥565,000) Orix Jreit (8954.T, ¥129,200) Tokyo Tatemono (8804.T, ¥891)
Disclosure Appendix
Important Global Disclosures
Atsuro Takemura and Masahiro Mochizuki, each certify, with respect to the companies or securities that the individual analyzes, that (1) the views expressed in this report accurately reflect his or her personal views about all of the subject companies and securities and (2) no part of his or her compensation was, is or will be directly or indirectly related to the specific recommendations or views expressed in this report.
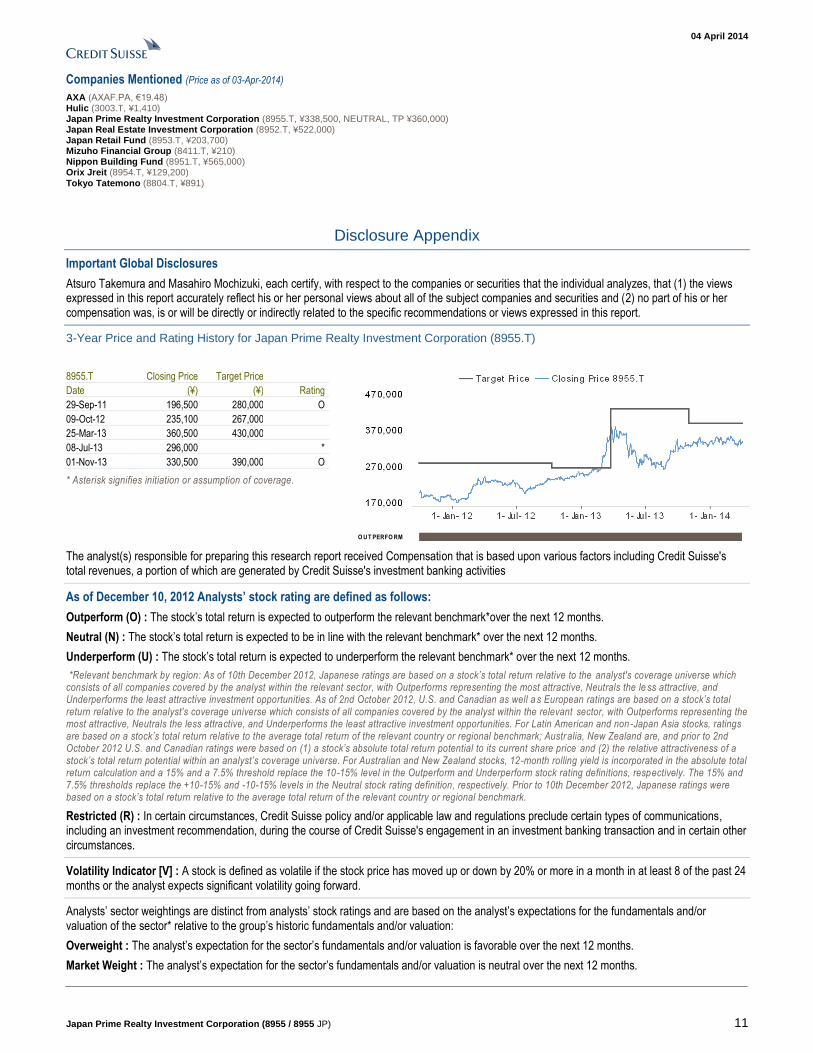
3-Year Price and Rating History for Japan Prime Realty Investment Corporation (8955.T)
8955.T Closing Price Target Price
Date (¥) (¥) Rating
29-Sep-11 196,500 280,000 O
09-Oct-12 235,100 267,000
25-Mar-13 360,500 430,000
08-Jul-13 296,000 *
01-Nov-13 330,500 390,000 O
* Asterisk signifies initiation or assumption of coverage.
O U T PERFO RM
The analyst(s) responsible for preparing this research report received Compensation that is based upon various factors including Credit Suisse's total revenues, a portion of which are generated by Credit Suisse's investment banking activities
As of December 10, 2012 Analysts’ stock rating are defined as follows:
Outperform (O) : The stock’s total return is expected to outperform the relevant benchmark*over the next 12 months.
Neutral (N) : The stock’s total return is expected to be in line with the relevant benchmark* over the next 12 months.
Underperform (U) : The stock’s total return is expected to underperform the relevant benchmark* over the next 12 months.
*Relevant benchmark by region: As of 10th December 2012, Japanese ratings are based on a stock’s total return relative to the analyst's coverage universe which consists of all companies covered by the analyst within the relevant sector, with Outperforms representing the most attractive, Neutrals the le ss attractive, and Underperforms the least attractive investment opportunities. As of 2nd October 2012, U.S. and Canadian as well a s European ratings are based on a stock’s total return relative to the analyst's coverage universe which consists of all companies covered by the analyst within the relevant sector, with Outperforms representing the most attractive, Neutrals the less attractive, and Underperforms the least attractive investment opportunities. For Latin American and non -Japan Asia stocks, ratings are based on a stock’s total return relative to the average total return of the relevant country or regional benchmark; Australia, New Zealand are, and prior to 2nd October 2012 U.S. and Canadian ratings were based on (1) a stock’s absolute total return potential to its current share price and (2) the relative attractiveness of a stock’s total return potential within an analyst’s coverage universe. For Australian and New Zealand stocks, 12-month rolling yield is incorporated in the absolute total return calculation and a 15% and a 7.5% threshold replace the 10-15% level in the Outperform and Underperform stock rating definitions, respectively. The 15% and 7.5% thresholds replace the +10-15% and -10-15% levels in the Neutral stock rating definition, respectively. Prior to 10th December 2012, Japanese ratings were based on a stock’s total return relative to the average total return of the relevant country or regional benchmark.
Restricted (R) : In certain circumstances, Credit Suisse policy and/or applicable law and regulations preclude certain types of communications, including an investment recommendation, during the course of Credit Suisse's engagement in an investment banking transaction and in certain other circumstances.
Volatility Indicator [V] : A stock is defined as volatile if the stock price has moved up or down by 20% or more in a month in at least 8 of the past 24 months or the analyst expects significant volatility going forward.
Analysts’ sector weightings are distinct from analysts’ stock ratings and are based on the analyst’s expectations for the fundamentals and/or valuation of the sector* relative to the group’s historic fundamentals and/or valuation:
Overweight : The analyst’s expectation for the sector’s fundamentals and/or valuation is favorable over the next 12 months.
Market Weight : The analyst’s expectation for the sector’s fundamentals and/or valuation is neutral over the next 12 months.

04 April 2014
Japan Prime Realty Investment Corporation (8955 / 8955 JP) 12
Underweight : The analyst’s expectation for the sector’s fundamentals and/or valuation is cautious over the next 12 months.
*An analyst’s coverage sector consists of all companies covered by the analyst within the relevant sector. An analyst may cover multiple sectors.
Credit Suisse's distribution of stock ratings (and banking clients) is:
Global Ratings Distribution
Rating Versus universe (%) Of which banking clients (%)
Outperform/Buy* 43% (53% banking clients)
Neutral/Hold* 40% (50% banking clients)
Underperform/Sell* 14% (45% banking clients)
Restricted 2%
*For purposes of the NYSE and NASD ratings distribution disclosure requirements, our stock ratings of Outperform, Neutral, an d Underperform most closely correspond to Buy, Hold, and Sell, respectively; however, the meanings are not the same, as our stock ratings are determined on a relative ba sis. (Please refer to definitions above.) An investor's decision to buy or sell a security should be based on investment objectives , current holdings, and other individual factors.
Credit Suisse’s policy is to update research reports as it deems appropriate, based on developments with the subject company, the sector or the market that may have a material impact on the research views or opinions stated herein.
Credit Suisse's policy is only to publish investment research that is impartial, independent, clear, fair and not misleading. For more detail please refer to Credit Suisse's Policies for Managing Conflicts of Interest in connection with Investment Research: http://www.csfb.com/research and analytics/disclaimer/managing_conflicts_disclaimer.html
Credit Suisse does not provide any tax advice. Any statement herein regarding any US federal tax is not intended or written to be used, and cannot be used, by any taxpayer for the purposes of avoiding any penalties.
Price Target: (12 months) for Japan Prime Realty Investment Corporation (8955.T)
Method: We base our ¥360,000 TP on the sum of our DPU forecasts for FT12/14 and FT6/15 (¥12,128) and a 3.36% distribution yield (risk-free rate 0.66%, risk premium 3.7%, expected CPI growth 1.0%). Our 3.7% risk premium assumption is the bottom between 2011 and 2012, when the BoJ was buying J-REITs but market expectations for inflation did not rise.
Risk: Risks that may impede achievement of our ¥360,000 TP for Japan Prime Realty Investment Corporation (JPR) are the the acquisition of an S-class building in central Tokyo at a good price, a failure to announce any new acquisitions at end-June and the departure of major tenants.
Please refer to the firm's disclosure website at https://rave.credit-suisse.com/disclosures for the definitions of abbreviations typically used in the target price method and risk sections.
See the Companies Mentioned section for full company names
The subject company (8951.T, AXAF.PA, 8411.T) currently is, or was during the 12-month period preceding the date of distribution of this report, a client of Credit Suisse.
Credit Suisse provided investment banking services to the subject company (AXAF.PA, 8411.T) within the past 12 months.
Credit Suisse provided non-investment banking services to the subject company (AXAF.PA, 8411.T) within the past 12 months
Credit Suisse has managed or co-managed a public offering of securities for the subject company (8411.T) within the past 12 months.
Credit Suisse has received investment banking related compensation from the subject company (AXAF.PA, 8411.T) within the past 12 months
Credit Suisse expects to receive or intends to seek investment banking related compensation from the subject company (8951.T, AXAF.PA, 8411.T, 3003.T) within the next 3 months.
Credit Suisse has received compensation for products and services other than investment banking services from the subject company (AXAF.PA, 8411.T) within the past 12 months
For other important disclosures concerning companies featured in this report, including price charts, please visit the website at https://rave.credit-suisse.com/disclosures or call +1 (877) 291-2683.
Important Regional Disclosures
Singapore recipients should contact Credit Suisse AG, Singapore Branch for any matters arising from this research report.
The analyst(s) involved in the preparation of this report have not visited the material operations of the subject company (8955.T, 8951.T, 8952.T, 8953.T, 8804.T, AXAF.PA, 8411.T, 3003.T) within the past 12 months
Restrictions on certain Canadian securities are indicated by the following abbreviations: NVS--Non-Voting shares; RVS--Restricted Voting Shares; SVS--Subordinate Voting Shares.

04 April 2014
Japan Prime Realty Investment Corporation (8955 / 8955 JP) 13
Individuals receiving this report from a Canadian investment dealer that is not affiliated with Credit Suisse should be advised that this report may not contain regulatory disclosures the non-affiliated Canadian investment dealer would be required to make if this were its own report.
For Credit Suisse Securities (Canada), Inc.'s policies and procedures regarding the dissemination of equity research, please visit http://www.csfb.com/legal_terms/canada_research_policy.shtml.
The following disclosed European company/ies have estimates that comply with IFRS: (AXAF.PA).
Credit Suisse has acted as lead manager or syndicate member in a public offering of securities for the subject company (8411.T) within the past 3 years.
As of the date of this report, Credit Suisse acts as a market maker or liquidity provider in the equities securities that are the subject of this report.
Principal is not guaranteed in the case of equities because equity prices are variable.
Commission is the commission rate or the amount agreed with a customer when setting up an account or at any time after that.
To the extent this is a report authored in whole or in part by a non-U.S. analyst and is made available in the U.S., the following are important disclosures regarding any non-U.S. analyst contributors: The non-U.S. research analysts listed below (if any) are not registered/qualified as research analysts with FINRA. The non-U.S. research analysts listed below may not be associated persons of CSSU and therefore may not be subject to the NASD Rule 2711 and NYSE Rule 472 restrictions on communications with a subject company, public appearances and trading securities held by a research analyst account.
Credit Suisse Securities (Japan) Limited .................................................................................................... Atsuro Takemura ; Masahiro Mochizuki
For Credit Suisse disclosure information on other companies mentioned in this report, please visit the website at https://rave.credit-suisse.com/disclosures or call +1 (877) 291-2683.

04 April 2014
Japan Prime Realty Investment Corporation (8955 / 8955 JP) 14
References in this report to Credit Suisse include all of the subsidiaries and affiliates of Credit Suisse operating under its investment banking division. For more information on our structure, please use the following link: https://www.credit-suisse.com/who_we_are/en/This report may contain material that is not directed to, or intended for distribution to or use by, any person or entity who is a citizen or resident of or located in any locality, state, country or other jurisdiction where such distribution, publication, availability or use would be contrary to law or regulation or which would subject Credit Suisse AG or its affiliates ("CS") to any registration or licensing requirement within such jurisdiction. All material presented in this report, unless specifically indicated otherwise, is under copyright to CS. None of the material, nor its content, nor any copy of it, may be altered in any way, transmitted to, copied or distributed to any other party, without the prior express written permission of CS. All trademarks, service marks and logos used in this report are trademarks or service marks or registered trademarks or service marks of CS or its affiliates. The information, tools and material presented in this report are provided to you for information purposes only and are not to be used or considered as an offer or the solicitation of an offer to sell or to buy or subscribe for securities or other financial instruments. CS may not have taken any steps to ensure that the securities referred to in this report are suitable for any particular investor. CS will not treat recipients of this report as its customers by virtue of their receiving this report. The investments and services contained or referred to in this report may not be suitable for you and it is recommended that you consult an independent investment advisor if you are in doubt about such investments or investment services. Nothing in this report constitutes investment, legal, accounting or tax advice, or a representation that any investment or strategy is suitable or appropriate to your individual circumstances, or otherwise constitutes a personal recommendation to you. CS does not advise on the tax consequences of investments and you are advised to contact an independent tax adviser. Please note in particular that the bases and levels of taxation may change. Information and opinions presented in this report have been obtained or derived from sources believed by CS to be reliable, but CS makes no representation as to their accuracy or completeness. CS accepts no liability for loss arising from the use of the material presented in this report, except that this exclusion of liability does not apply to the extent that such liability arises under specific statutes or regulations applicable to CS. This report is not to be relied upon in substitution for the exercise of independent judgment. CS may have issued, and may in the future issue, other communications that are inconsistent with, and reach different conclusions from, the information presented in this report. Those communications reflect the different assumptions, views and analytical methods of the analysts who prepared them and CS is under no obligation to ensure that such other communications are brought to the attention of any recipient of this report. CS may, to the extent permitted by law, participate or invest in financing transactions with the issuer(s) of the securities referred to in this report, perform services for or solicit business from such issuers, and/or have a position or holding, or other material interest, or effect transactions, in such securities or options thereon, or other investments related thereto. In addition, it may make markets in the securities mentioned in the material presented in this report. CS may have, within the last three years, served as manager or co-manager of a public offering of securities for, or currently may make a primary market in issues of, any or all of the entities mentioned in this report or may be providing, or have provided within the previous 12 months, significant advice or investment services in relation to the investment concerned or a related investment. Additional information is, subject to duties of confidentiality, available on request. Some investments referred to in this report will be offered solely by a single entity and in the case of some investments solely by CS, or an associate of CS or CS may be the only market maker in such investments. Past performance should not be taken as an indication or guarantee of future performance, and no representation or warranty, express or implied, is made regarding future performance. Information, opinions and estimates contained in this report reflect a judgment at its original date of publication by CS and are subject to change without notice. The price, value of and income from any of the securities or financial instruments mentioned in this report can fall as well as rise. The value of securities and financial instruments is subject to exchange rate fluctuation that may have a positive or adverse effect on the price or income of such securities or financial instruments. Investors in securities such as ADR's, the values of which are influenced by currency volatility, effectively assume this risk. Structured securities are complex instruments, typically involve a high degree of risk and are intended for sale only to sophisticated investors who are capable of understanding and assuming the risks involved. The market value of any structured security may be affected by changes in economic, financial and political factors (including, but not limited to, spot and forward interest and exchange rates), time to maturity, market conditions and volatility, and the credit quality of any issuer or reference issuer. Any investor interested in purchasing a structured product should conduct their own investigation and analysis of the product and consult with their own professional advisers as to the risks involved in making such a purchase. Some investments discussed in this report may have a high level of volatility. High volatility investments may experience sudden and large falls in their value causing losses when that investment is realised. Those losses may equal your original investment. Indeed, in the case of some investments the potential losses may exceed the amount of initial investment and, in such circumstances, you may be required to pay more money to support those losses. Income yields from investments may fluctuate and, in consequence, initial capital paid to make the investment may be used as part of that income yield. Some investments may not be readily realisable and it may be difficult to sell or realise those investments, similarly it may prove difficult for you to obtain reliable information about the value, or risks, to which such an investment is exposed. This report may provide the addresses of, or contain hyperlinks to, websites. Except to the extent to which the report refers to website material of CS, CS has not reviewed any such site and takes no responsibility for the content contained therein. Such address or hyperlink (including addresses or hyperlinks to CS's own website material) is provided solely for your convenience and information and the content of any such website does not in any way form part of this document. Accessing such website or following such link through this report or CS's website shall be at your own risk. This report is issued and distributed in Europe (except Switzerland) by Credit Suisse Securities (Europe) Limited, One Cabot Square, London E14 4QJ, England, which is authorised by the Prudential Regulation Authority and regulated by the Financial Conduct Authority and the Prudential Regulation Authority. This report is being distributed in Germany by Credit Suisse Securities (Europe) Limited Niederlassung Frankfurt am Main regulated by the Bundesanstalt fuer Finanzdienstleistungsaufsicht ("BaFin"). This report is being distributed in the United States and Canada by Credit Suisse Securities (USA) LLC; in Switzerland by Credit Suisse AG; in Brazil by Banco de Investimentos Credit Suisse (Brasil) S.A or its affiliates; in Mexico by Banco Credit Suisse (México), S.A. (transactions related to the securities mentioned in this report will only be effected in compliance with applicable regulation); in Japan by Credit Suisse Securities (Japan) Limited, Financial Instruments Firm, Director-General of Kanto Local Finance Bureau (Kinsho) No. 66, a member of Japan Securities Dealers Association, The Financial Futures Association of Japan, Japan Investment Advisers Association, Type II Financial Instruments Firms Association; elsewhere in Asia/ Pacific by whichever of the following is the appropriately authorised entity in the relevant jurisdiction: Credit Suisse (Hong Kong) Limited, Credit Suisse Equities (Australia) Limited, Credit Suisse Securities (Thailand) Limited, having registered address at 990 Abdulrahim Place, 27 Floor, Unit 2701, Rama IV Road, Silom, Bangrak, Bangkok 10500, Thailand, Tel. +66 2614 6000, Credit Suisse Securities (Malaysia) Sdn Bhd, Credit Suisse AG, Singapore Branch, Credit Suisse Securities (India) Private Limited regulated by the Securities and Exchange Board of India (registration Nos. INB230970637; INF230970637; INB010970631; INF010970631), having registered address at 9th Floor, Ceejay House, Dr.A.B. Road, Worli, Mumbai - 18, India, T- +91-22 6777 3777, Credit Suisse Securities (Europe) Limited, Seoul Branch, Credit Suisse AG, Taipei Securities Branch, PT Credit Suisse Securities Indonesia, Credit Suisse Securities (Philippines ) Inc., and elsewhere in the world by the relevant authorised affiliate of the above. Research on Taiwanese securities produced by Credit Suisse AG, Taipei Securities Branch has been prepared by a registered Senior Business Person. Research provided to residents of Malaysia is authorised by the Head of Research for Credit Suisse Securities (Malaysia) Sdn Bhd, to whom they should direct any queries on +603 2723 2020. This report has been prepared and issued for distribution in Singapore to institutional investors, accredited investors and expert investors (each as defined under the Financial Advisers Regulations) only, and is also distributed by Credit Suisse AG, Singapore branch to overseas investors (as defined under the Financial Advisers Regulations). By virtue of your status as an institutional investor, accredited investor, expert investor or overseas investor, Credit Suisse AG, Singapore branch is exempted from complying with certain compliance requirements under the Financial Advisers Act, Chapter 110 of Singapore (the "FAA"), the Financial Advisers Regulations and the relevant Notices and Guidelines issued thereunder, in respect of any financial advisory service which Credit Suisse AG, Singapore branch may provide to you. This research may not conform to Canadian disclosure requirements. In jurisdictions where CS is not already registered or licensed to trade in securities, transactions will only be effected in accordance with applicable securities legislation, which will vary from jurisdiction to jurisdiction and may require that the trade be made in accordance with applicable exemptions from registration or licensing requirements. Non-U.S. customers wishing to effect a transaction should contact a CS entity in their local jurisdiction unless governing law permits otherwise. U.S. customers wishing to effect a transaction should do so only by contacting a representative at Credit Suisse Securities (USA) LLC in the U.S. Please note that this research was originally prepared and issued by CS for distribution to their market professional and institutional investor customers. Recipients who are not market professional or institutional investor customers of CS should seek the advice of their independent financial advisor prior to taking any investment decision based on this report or for any necessary explanation of its contents. This research may relate to investments or services of a person outside of the UK or to other matters which are not authorised by the Prudential Regulation Authority and regulated by the Financial Conduct Authority and the Prudential Regulation Authority or in respect of which the protections of the Prudential Regulation Authority and Financial Conduct Authority for private customers and/or the UK compensation scheme may not be available, and further details as to where this may be the case are available upon request in respect of this report. CS may provide various services to US municipal entities or obligated persons ("municipalities"), including suggesting individual transactions or trades and entering into such transactions. Any services CS provides to municipalities are not viewed as "advice" within the meaning of Section 975 of the Dodd-Frank Wall Street Reform and Consumer Protection Act. CS is providing any such services and related information solely on an arm's length basis and not as an advisor or fiduciary to the municipality. In connection with the provision of the any such services, there is no agreement, direct or indirect, between any municipality (including the officials, management, employees or agents thereof) and CS for CS to provide advice to the municipality. Municipalities should consult with their financial, accounting and legal advisors regarding any such services provided by CS. In addition, CS is not acting for direct or indirect compensation to solicit the municipality on behalf of an unaffiliated broker, dealer, municipal securities dealer, municipal advisor, or investment adviser for the purpose of obtaining or retaining an engagement by the municipality for or in connection with Municipal Financial Products, the issuance of municipal securities, or of an investment adviser to provide investment advisory services to or on behalf of the municipality. If this report is being distributed by a financial institution other than Credit Suisse AG, or its affiliates, that financial institution is solely responsible for distribution. Clients of that institution should contact that institution to effect a transaction in the securities mentioned in this report or require further information. This report does not constitute investment advice by Credit Suisse to the clients of the distributing financial institution, and neither Credit Suisse AG, its affiliates, and their respective officers, directors and employees accept any liability whatsoever for any direct or consequential loss arising from their use of this report or its content. Principal is not guaranteed. Commission is the commission rate or the amount agreed with a customer when setting up an account or at any time after that.
Copyright © 2014 CREDIT SUISSE AG and/or its affiliates. All rights reserved.
Investment principal on bonds can be eroded depending on sale price or market price. In addition, there are bonds on which investment principal can be eroded due to changes in redemption amounts. Care is required when investing in such instruments. When you purchase non-listed Japanese fixed income securities (Japanese government bonds, Japanese municipal bonds, Japanese government guaranteed bonds, Japanese corporate bonds) from CS as a seller, you will be requested to pay the purchase price only.
8955_JPR_040414_E.doc