japanese ajapanese a-bomb survivor databomb survivor data...
TRANSCRIPT
Japanese A-bomb Survivor DataJapanese A bomb Survivor Data and Studies of Low-Dose Effects
Beebe SymposiumBeebe SymposiumNational Academy of Sciences
December 1, 2010,Roy Shore,
K. Ozasa, Y. Shimizu, K. Kasagi, K. Furukawa, W-L. Hsu,D Preston K Neriishi A Suyama K KodamaD. Preston, K. Neriishi, A. Suyama, K. Kodama
Wh i th A b b h tWh i th A b b h tWhy is the A-bomb cohort considered a benchmark for Why is the A-bomb cohort
considered a benchmark for assessment of radiation risks?assessment of radiation risks?
22
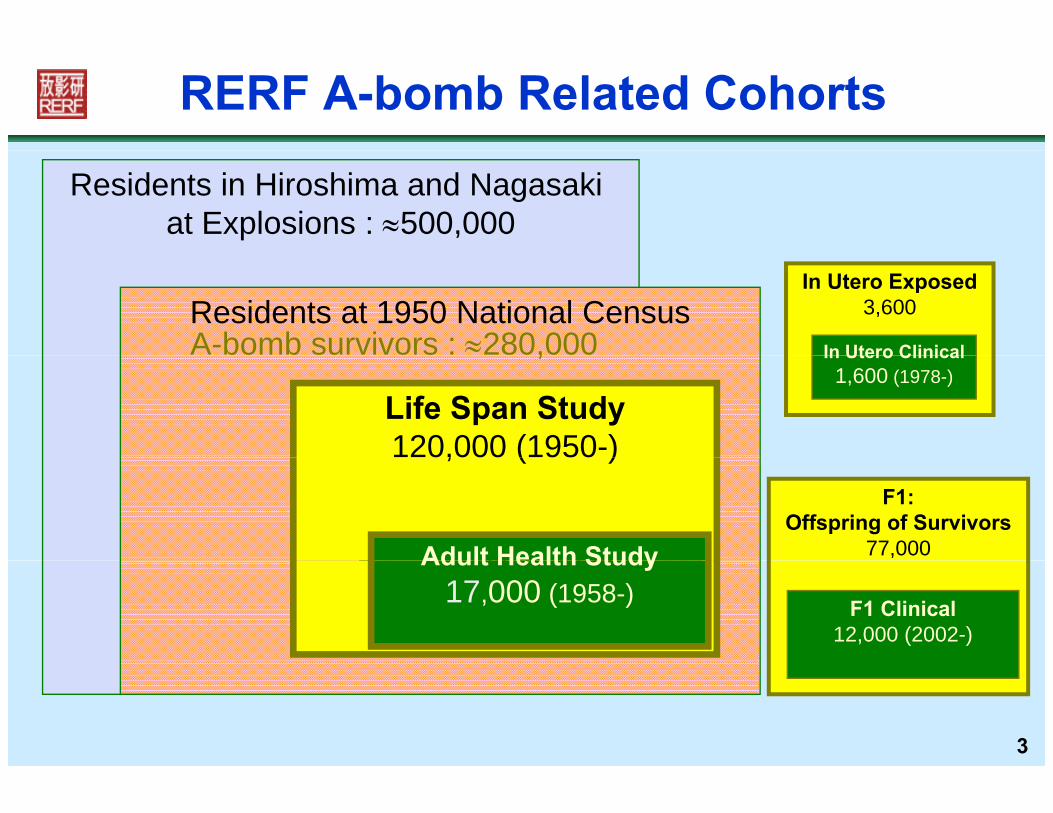
RERF A-bomb Related Cohorts
Residents in Hiroshima and Nagasaki at Explosions : 500,000
In Utero Exposed3,600
In Utero Clinical
Residents at 1950 National CensusA-bomb survivors : 280,000 In Utero Clinical
1,600 (1978-),
Life Span Study120,000 (1950-)
F1:Offspring of Survivors
77,000Adult Health Study 22,000 (1958-)
, ( )
Adult Health Study
F1 Clinical12,000 (2002-)
22,000 (1958 )Adult Health Study17,000 (1958-)
3
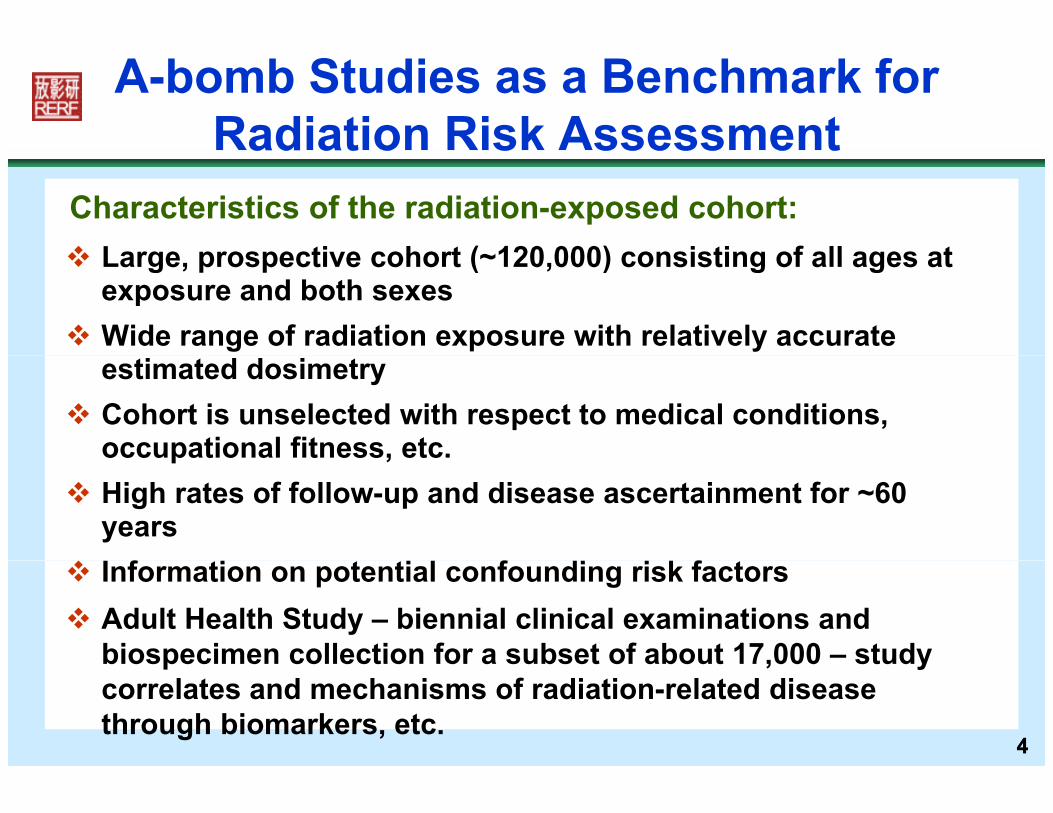
A-bomb Studies as a Benchmark for Radiation Risk Assessment
A-bomb Studies as a Benchmark for Radiation Risk Assessmentad at o s ssess e tad at o s ssess e t
Large prospective cohort ( 120 000) consisting of all ages atCharacteristics of the radiation-exposed cohort: Large, prospective cohort (~120,000) consisting of all ages at
exposure and both sexes Wide range of radiation exposure with relatively accurate
estimated dosimetry Cohort is unselected with respect to medical conditions,
occupational fitness, etc.p , High rates of follow-up and disease ascertainment for ~60
years f f f Information on potential confounding risk factors Adult Health Study – biennial clinical examinations and
biospecimen collection for a subset of about 17,000 – study
44
biospecimen collection for a subset of about 17,000 study correlates and mechanisms of radiation-related disease through biomarkers, etc.
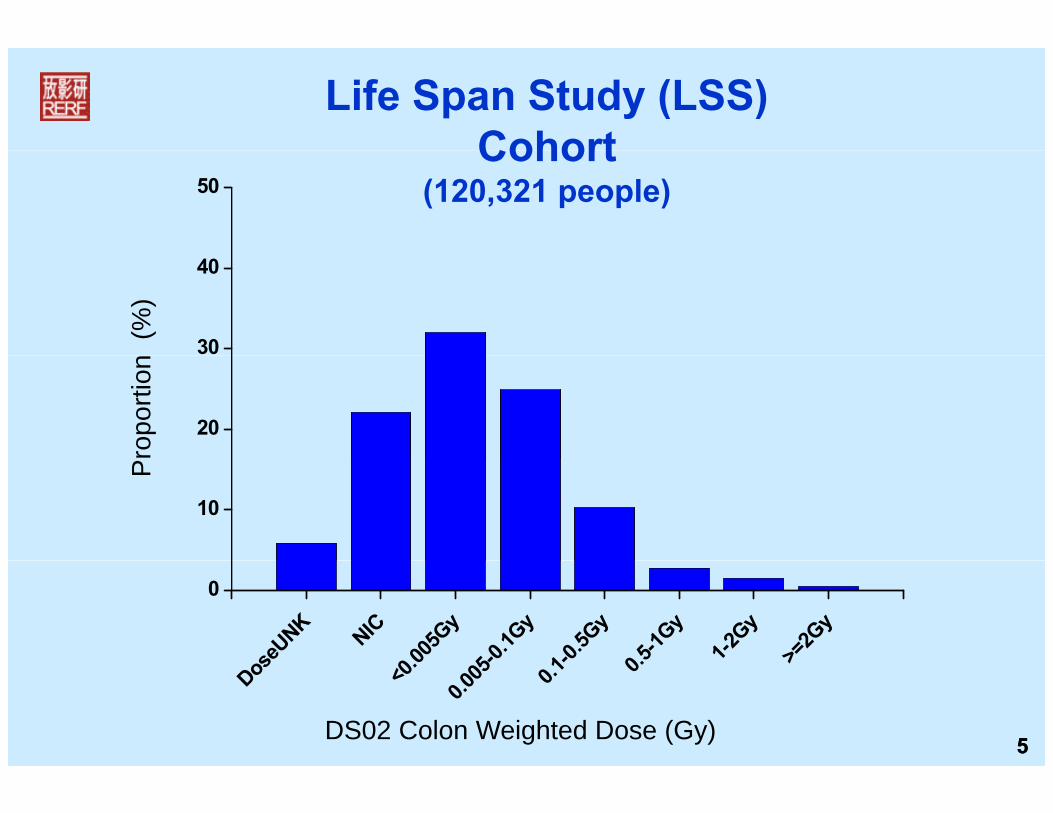
Life Span Study (LSS) Cohort
50Cohort
(120,321 people)
30
40
(%
)
20
ropo
rtion
10
P
oseU
NK
NIC0 00
5Gy
5-0.1G
y1-0
.5Gy
0.5-1G
y
1-2Gy
>=2G
y
0
55
Dos <0.0
0.005 0.
1 0. >
DS02 Colon Weighted Dose (Gy)

Are the excess risks of cancer at low doses proportional to those at high doses? – i eproportional to those at high doses? – i.e.,
Is there dose-response linearity, less than or more than linear risk at low dosesless-than or more-than linear risk at low doses,
or a dose threshold?
66

LSS dose response: Solid-cancer incidence
No evidence of non-linearity in the dose response Significant dose response on 0-150 mGy
L d l i i h f ll Low dose-range slope consistent with full range
150
(LSS Incidence, 1958(LSS Incidence, 1958--1998)1998)
100
150
ativ
e R
isk ERR/Gy= 47% (95%CI: 40-54%)
Dose-threshold: 40 mGy(CI: <0, 85 mGy)
50Exce
ss R
ela
Fitted linear dose response at age
00 1 2 3
% Fitted linear dose response at age
70 following exposure at age 30Smoothed non-parametric dose response
77(Preston D et al: Radiat Res 168:1-64, 2007)
0 1 2 3Colon Weighted Dose (Gy)
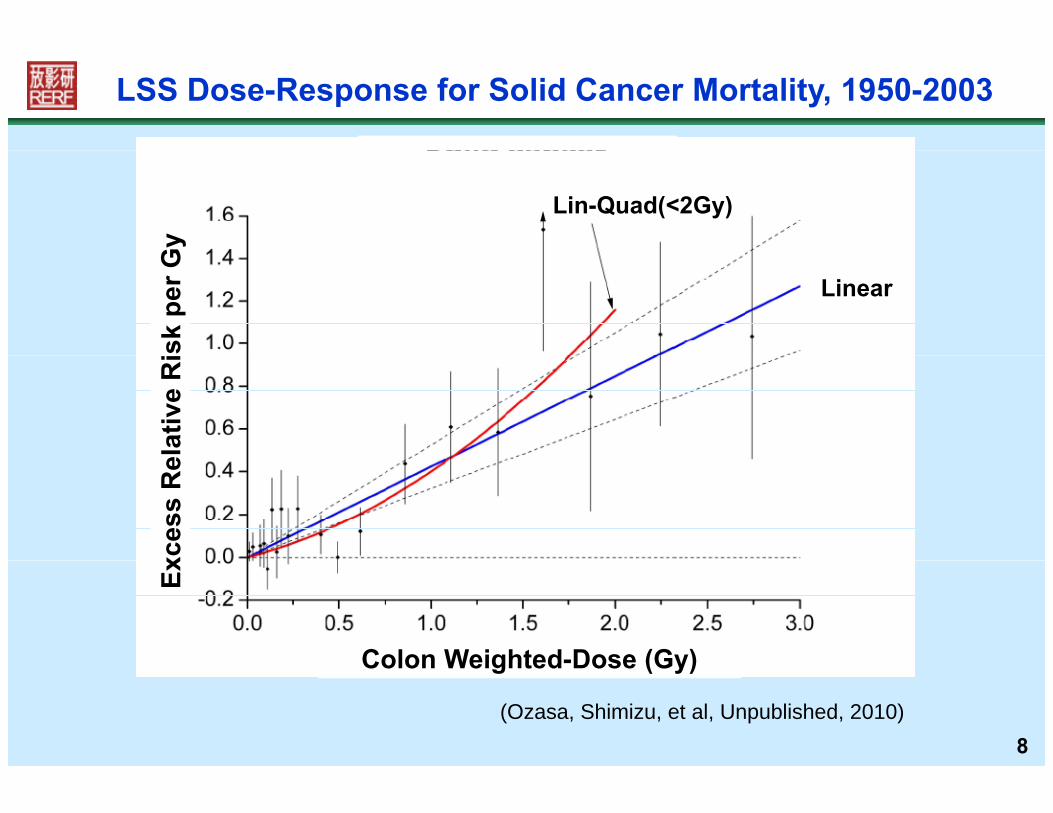
LSS Dose-Response for Solid Cancer Mortality, 1950-2003
Gy
Lin-Quad(<2Gy)sk
per
G
Linear
elat
ive
Ri
xces
s R
e
Colon Weighted-Dose (Gy)
Ex
8
Colon Weighted-Dose (Gy)
(Ozasa, Shimizu, et al, Unpublished, 2010)
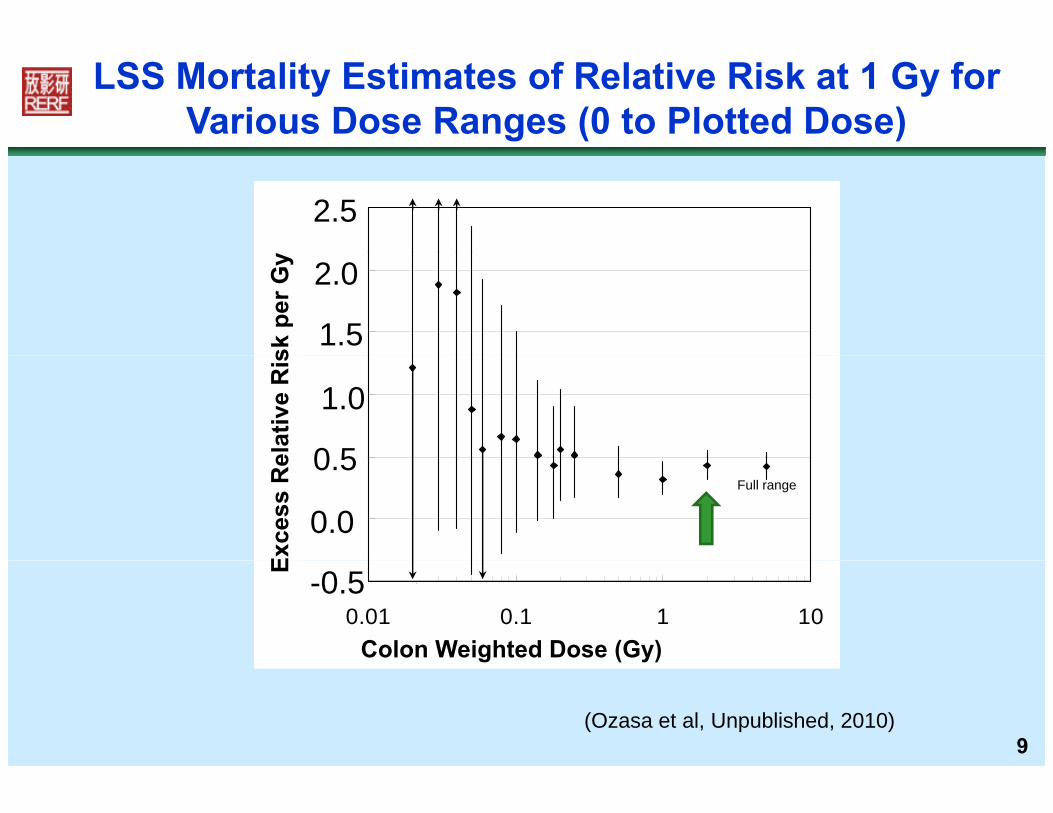
LSS Mortality Estimates of Relative Risk at 1 Gy for Various Dose Ranges (0 to Plotted Dose)
2.52.5
y
1.5
2.0
1.5
2.0sk
per
Gy
0 5
1.0
ERR
/Gy
0 5
1.0
elat
ive
Ris
0.0
0.5Full range
0.0
0.5
Exce
ss R
e
-0.50.01 0.1 1 10
Colon dose (Gy)
-0.5
Colon Weighted Dose (Gy)
E
(Ozasa et al, Unpublished, 2010)9
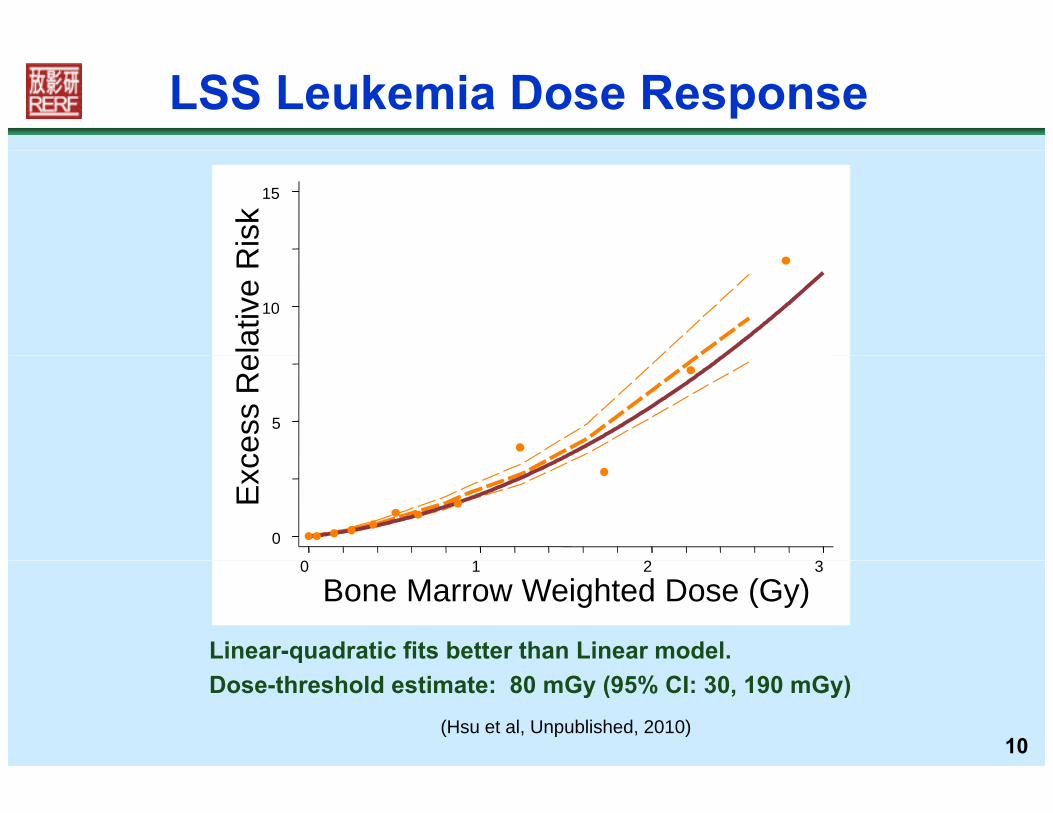
LSS Leukemia Dose Response
15
Ris
kFitted linear-quadratic dose response at age 70 following exposure at age 30Smoothed non-parametric dose response
10
elat
ive
R
5
cess
Re
0
Exc
0 1 2 3
Linear-quadratic fits better than Linear model.
0 1 2 3
Bone Marrow Weighted Dose (Gy)
10
qDose-threshold estimate: 80 mGy (95% CI: 30, 190 mGy)
(Hsu et al, Unpublished, 2010)
Which organs are at risk of radiation-related cancer?radiation-related cancer?
11
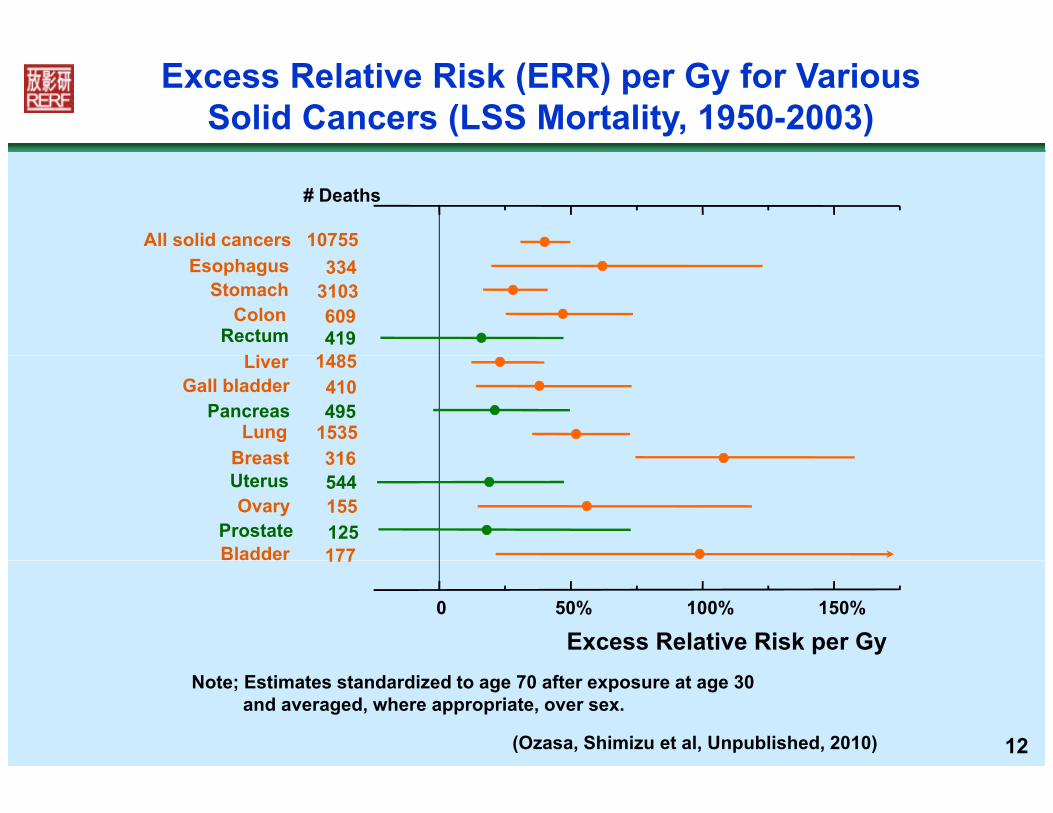
Excess Relative Risk (ERR) per Gy for VariousSolid Cancers (LSS Mortality, 1950-2003)
# Deaths
All solid cancers 10755
LiRectum
ColonStomach
Esophagus
1485419609
3103334
BreastLung
PancreasGall bladder
Liver
3161535495410
1485
BladderProstate
OvaryUterusBreast
177125155544316
Excess Relative Risk per Gy0 50% 100% 150%
177
12
Note; Estimates standardized to age 70 after exposure at age 30 and averaged, where appropriate, over sex.
(Ozasa, Shimizu et al, Unpublished, 2010)

D t i b h tDo certain subgroups have greater risk of cancer from radiation
exposure?
13

LSS Cancer Incidence: Site-specific Excess Relative Risk (ERR) Estimates by Gender
2.0
1.5
k pe
r Gy
1.0
ativ
e R
isk
FemaleMale
0.5
xces
s R
el
0.0
Ex
14
Breast Lung Bladder Stomach All solid Thyroid Liver Colon
Preston et al, Radiat Res, 2007; 168:1-64
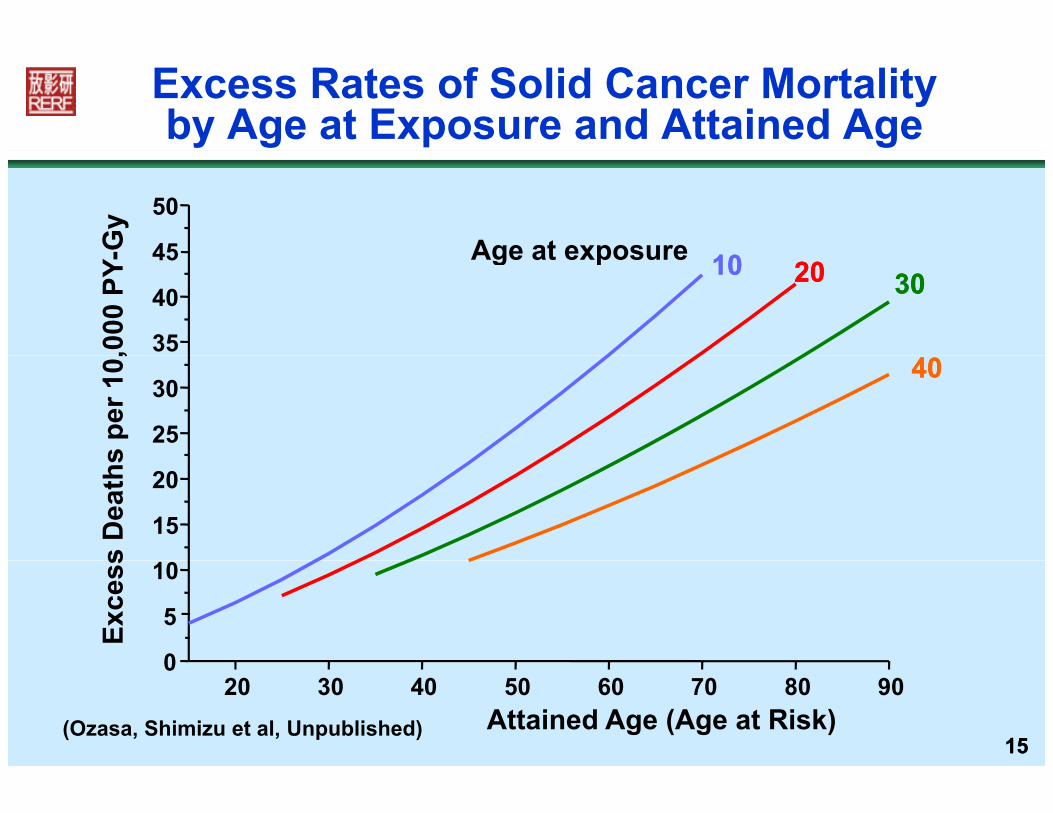
Excess Rates of Solid Cancer Mortalityby Age at Exposure and Attained Age
Age at exposure45
50
-Gy
Age at exposure
35
40
45303020201010
,000
PY-
25
304040
s pe
r 10,
15
20
s D
eath
s
0
5
10
Exce
ss
1515Attained Age (Age at Risk)(Ozasa, Shimizu et al, Unpublished)
20 30 40 50 60 70 80 900
How great is the cancer riskfollowing in utero exposure?following in utero exposure?
16

Very large risks from in utero exposurehave been predicted
Based mostly on the large Stewart-Knealet l t d f f t l di ti
p
case-control study of fetal radiation exposure and childhood cancer, it was predicted that an additional 6% of persons would die fromadditional 6% of persons would die from cancer after 1 Gy of in utero radiation.(Doll & Wakeford, Br J Radiol, 70:130-39, 1997)
6% lifetime cancer mortality risk per Gy is: ~3 times as large as the corresponding estimated g p g
A-bomb risk after exposure at age 10, or ~6 times as large as estimated risk after exposure
t 30 (Preston et al Radiat Res 160:381 407 2003)
17
at age 30. (Preston et al, Radiat Res, 160:381-407, 2003)
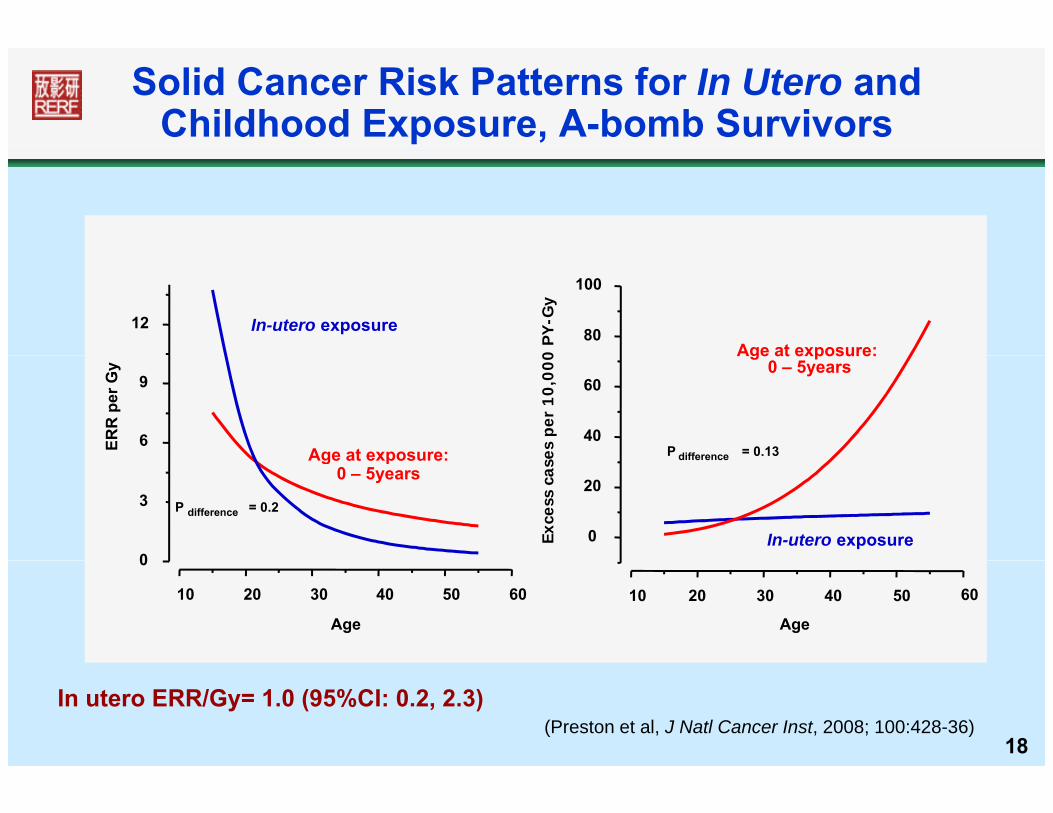
Solid Cancer Risk Patterns for In Utero andChildhood Exposure, A-bomb Survivors
12 In-utero exposure 80
100
Age at exposure:0 P
Y-G
y
6
9
Age at exposure:ERR
per
Gy
40
60
Age at exposure: 0 – 5years
es p
er 1
0,0
00
P difference = 0.13
0
3 P difference = 0.2
Age at exposure: 0 – 5years
0
20
In-utero exposureExce
ss c
ase difference
10 20 30 40 50 60
0
Age
10 20 30 40 50 60
Age
18(Preston et al, J Natl Cancer Inst, 2008; 100:428-36)
In utero ERR/Gy= 1.0 (95%CI: 0.2, 2.3)
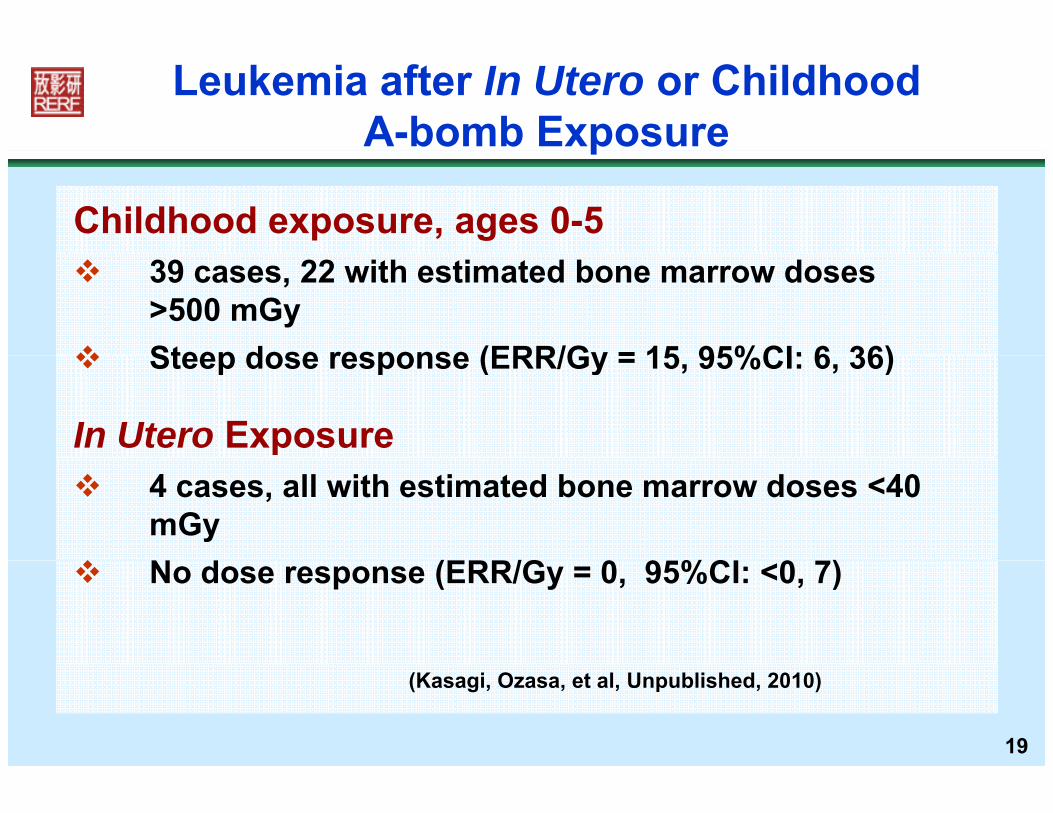
Leukemia after In Utero or ChildhoodA-bomb Exposure
Childhood exposure, ages 0-5
p
39 cases, 22 with estimated bone marrow doses >500 mGy
Steep dose response (ERR/Gy = 15 95%CI: 6 36) Steep dose response (ERR/Gy = 15, 95%CI: 6, 36)
In Utero Exposure 4 cases, all with estimated bone marrow doses <40
mGy N d (ERR/G 0 9 %CI 0 ) No dose response (ERR/Gy = 0, 95%CI: <0, 7)
19
(Kasagi, Ozasa, et al, Unpublished, 2010)
I th it d f di ti i kIs the magnitude of radiation risk altered by other environmental
exposures?
20
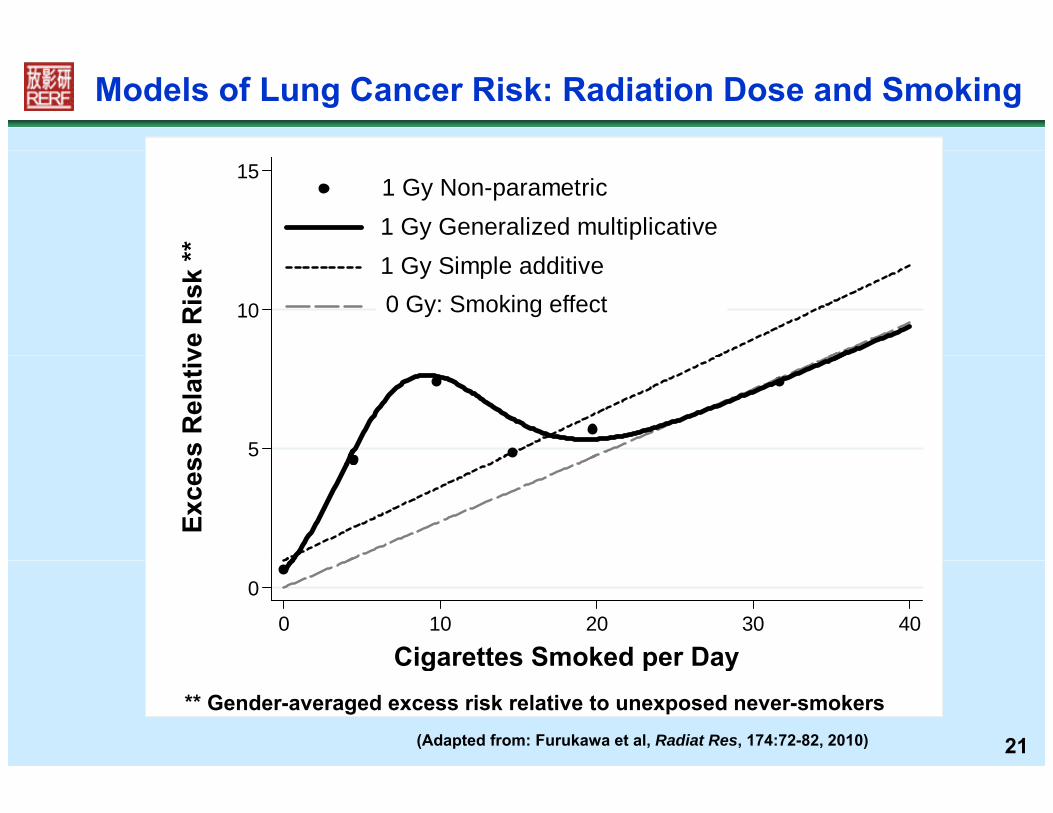
Models of Lung Cancer Risk: Radiation Dose and Smoking
151 Gy Non-parametric1 Gy Generalized multiplicative
**
10
1 Gy Simple additive0 Gy Generalized multiplicative
ve R
isk
*
0 Gy: Smoking effect
5ss R
elat
ivEx
ces
0
0 10 20 30 40
Cigarettes Smoked per Day
21
Cigarettes Smoked per Day** Gender-averaged excess risk relative to unexposed never-smokers
(Adapted from: Furukawa et al, Radiat Res, 174:72-82, 2010)

Liver Cancer Risk from Hepatitis C Virus (HCV) and Radiation
40
20
30
s R
atio
HCV-,1 Gy radiation
HCV+, No rad
HCV+ 1 Gy rad
10
20
Od
d HCV+, 1 Gy rad
0
2222
(Sharp et al, Int J Cancer, 103:531-37, 2003)

Are there noncancer risks from radiation exposure at low doses?radiation exposure at low doses?
2323

Radiation and Heart Disease Mortality
•• Clear evidence of heart disease risk at doses below 4-5 Gy • Dose-response for heart disease mortality appears linear, butthere is considerable ncertaint belo abo t 0 5 G
Heart Disease Mortality
there is considerable uncertainty below about 0.5 Gy.
Corroborative Clinical Evidence for Radiation Effects
30
40
50 ERR = 14% per Gy†
( 95% CI: 6, 23%) LLQ
(ER
R) P
erce
nt
for Radiation Effects
• ↑ Circulatory systeminflammation – numerous markers
10
20
30
s R
elat
ive
Ris
k (
of inflammation are ↑• Blood lipids – ↑ totalcholesterol triglycerides; HDL
0.0 0.5 1.0 1.5 2.0 2.5 3.0-10
0 L: linear
LQ: linear-quadratic
Weighted Colon Dose (Gy)
Exce
ss cholesterol, triglycerides; HDL cholesterol• Cardiovascular risk factors –
24
Weighted Colon Dose (Gy)†Adjusted for gender, age at exposure, attained age, diabetes, etc.
(Shimizu et al, Br Med J, 340:193, 2010)
↑ blood pressure andcalcification of arteries

• Radiation protection agencies had long believed there was no risk for
Cataract-Surgery Incidence, 1986-2005• Radiation protection agencies had long believed there was no risk for vision-impairing cataracts below about 5 Gy and set safety standards accordingly. More protective safety standards for the eye are now being considered.
35
40
Year
ERR/Gy = 21% (95%CI: 9-36%)
considered.
20
25
30
P < 0.001
0 Pe
rson
s pe
r Dose-Threshold: ~0.5 Gy (95%CI: 0.1-1.0)
10
15
20
Cas
es p
er 1
000
-5
0
5
Exce
ss C
25(Nakashima, Neriishi et al, Unpublished, 2010)
0 2 4
(Adjusted for city, gender, age at exposure, attained age and diabetes)Eye Dose-Equivalent (Gy)

How large is the risk to offspring from parental gonadal irradiation?from parental gonadal irradiation?
26
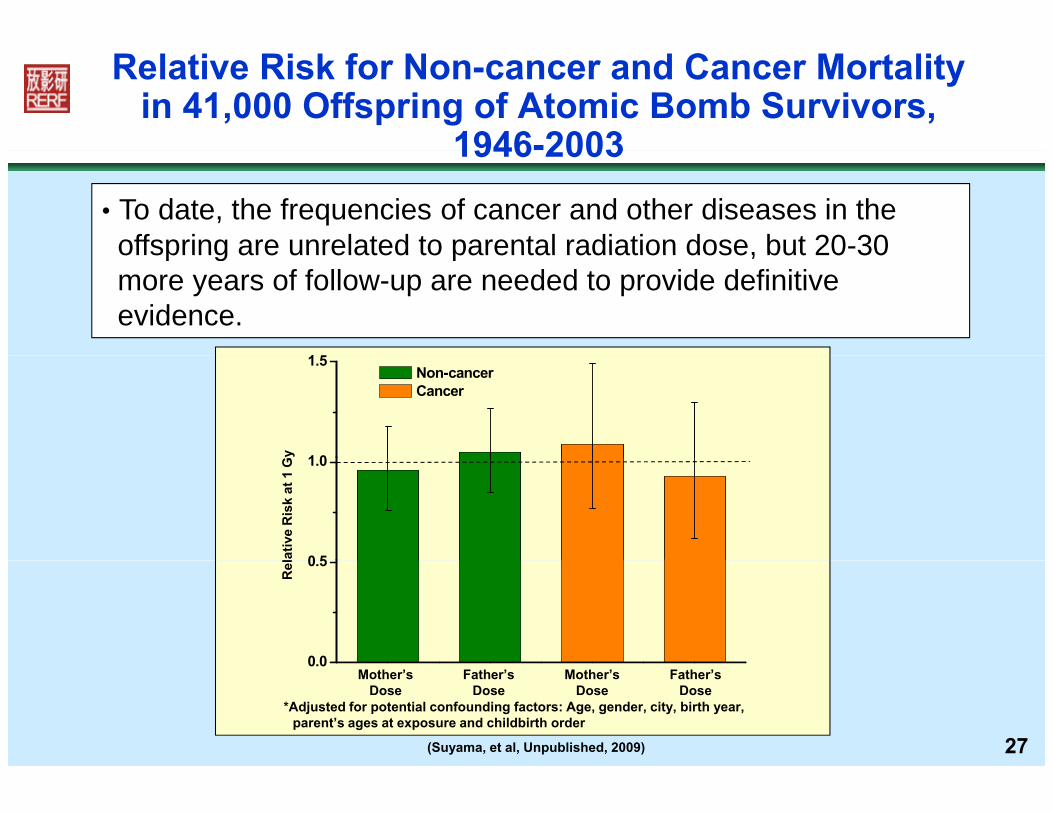
Relative Risk for Non-cancer and Cancer Mortalityin 41,000 Offspring of Atomic Bomb Survivors,
1946-2003
• To date, the frequencies of cancer and other diseases in theoffspring are unrelated to parental radiation dose, but 20-30
1946 2003
1 5
offspring are unrelated to parental radiation dose, but 20 30more years of follow-up are needed to provide definitiveevidence.
y 1 0
1.5 Non-cancer Cancer
lativ
e R
isk
at 1
G
0 5
1.0
Rel
0 0
0.5
27(Suyama, et al, Unpublished, 2009)
*Adjusted for potential confounding factors: Age, gender, city, birth year, parent’s ages at exposure and childbirth order
Mother’s Father’s Mother’s Father’sDose Dose Dose Dose
0.0
28Thank You