jason lai, james s. tucker professor virginia tech jeff...
TRANSCRIPT

Solar Forum 2013 High Penetration
F e b 1 3 - 1 4 , S a n D i e g o , C A
HIGH-PENETRATION PV MODELING, MONITORING, AND ANALYSIS WITH ADVANCED POWER ELECTRONICS
Jason Lai, James S. Tucker Professor Virginia Tech
Jeff Smith, Senior Manager EPRI
Virginia Tech: Jason Lai, Jason Dominic, Bin Gu, Nathan Kees, Ben York, Wensong Yu
Electric Power Research Institute: Jeff Smith,
Tom Key, Chris Trueblood Baylor University: Mack Grady

Solar Forum 2013 High Penetration
F e b 1 3 - 1 4 , S a n D i e g o , C A 2
Focus Areas
Power Electronics
PV inverter testing Cost effectiveness study of PV
power conditioning systems Development of advanced power
conditioners Field demonstration with
advanced power conditioners
Modeling and Simulation
Solar PV modeling Grid Integration analysis Smart inverters Solar PV monitoring PV ramp rate PV variability assessments Open-source utility modeling
tool

Solar Forum 2013 High Penetration
F e b 1 3 - 1 4 , S a n D i e g o , C A 3
Key Deliverables
Power Electronics
Micro-converter (DC optimizer) design with isolation
Micro-inverter design without electrolytic capacitors
String/centralized inverter design without cooling fans
Hardware-in-the-loop simulation
Modeling and Simulation
Evaluation of smart inverters for increasing feeder hosting capacity
Website hosting measurement data and feeder models (open-source)
Statistical analysis of PV variability at distribution level
Hosting capacity results considering % boundary limits
Comparison of single-point vs multi-point cloud models for distribution analysis

Solar Forum 2013 High Penetration
F e b 1 3 - 1 4 , S a n D i e g o , C A 4
1 mi
Substation
PV Site4 miles from Sub
Capacitor BankRegulator
Feeder Comparison Fe
eder
B
Measured Overvoltage Due to PV
ANSI voltage limit
Increasing PV Output (kW)
Feed
er A
Measured Voltage as Function of PV Output
ANSI voltage limit
Increasing PV Output (kW)

Solar Forum 2013 High Penetration
F e b 1 3 - 1 4 , S a n D i e g o , C A 5
Measurement Data Solar Monitoring
DPV Pole-Mount Panels Metered Large-Scale PV

Solar Forum 2013 High Penetration
F e b 1 3 - 1 4 , S a n D i e g o , C A 6
Time Series Response with Existing PV

Solar Forum 2013 High Penetration
F e b 1 3 - 1 4 , S a n D i e g o , C A 7
Hosting Capacity Comparison Quick Look at Overvoltage Impacts
5000 cases shown Each point = highest primary voltage
ANSI voltage limit
Max
imum
Fee
der V
olta
ges
(pu)
Increasing penetration (kW)
Minimum Hosting Capacity Maximum Hosting Capacity
No observable violations regardless of size/location
Possible violations based upon size/location
Observable violations occur regardless of size/location
Max
imum
Fee
der V
olta
ge
Increasing penetration (kW)
Feeder B Feeder A

Solar Forum 2013 High Penetration
F e b 1 3 - 1 4 , S a n D i e g o , C A 8
Hosting Capacity Comparison
Feeder Comparison Feeder A Feeder B
Feeder Characteristics
Voltage (kV) 13.2 12.47 Peak Load 5 MW 6 MW
Minimum Load 0.8 MW 0.7 MW Min Daytime Load 1.1 MW 0.7 MW Existing PV (MW) 1.0 1.7
Total Circuit Miles 28 58 Minimum Hosting Capacity (kW)
Voltage Primary Overvoltage >3500 420 Regulator Deviation >3500 250
Protection
Total Fault Contribution >3500 1685 Sympathetic Tripping 1478 1426
Reduction of Reach >3500 1489 Fuse Saving 1771 1426
Anti-Islanding – Breaker 400 390 Customer-based PV results shown

Solar Forum 2013 High Penetration
F e b 1 3 - 1 4 , S a n D i e g o , C A 9
What About PV With Smart Inverters? Use of Smart Inverters for Increasing Hosting Capacity
Volt-Var Control* Volt-Watt Control**
Dynamic Var Control** Volt-Var w/ Hysteresis**
*Currently in OpenDSS **available in OpenDSS Q1 2013

Solar Forum 2013 High Penetration
F e b 1 3 - 1 4 , S a n D i e g o , C A 10
Increasing Hosting Capacity with Smart Inverters Sample Results from Feeder with Limited Hosting Capacity
Without Volt/var Control Volt/var Control
PV Hosting Capacity (kW) Without Volt/var With Volt/var
Primary Voltage Deviation
1st violation 938 >2500 50% scenarios with violation 1323 >2500 All scenarios with violation 1673 >2500
Primary Over Voltage
1st violation 540 880 50% scenarios with violation 871 1464 All scenarios with violation 1173 2418
5000 cases shown Each point = highest primary voltage
ANSI voltage limit
ANSI voltage limit
160% increase in hosting capacity
60% increase in hosting capacity
Increasing penetration (kW) M
axim
um F
eede
r Vol
tage
(pu)
Max
imum
Fee
der V
olta
ges
(pu)
Increasing penetration (kW)

Solar Forum 2013 High Penetration
F e b 1 3 - 1 4 , S a n D i e g o , C A 11
Maximum Voltages, Minimum load
Without Volt/var Control Volt/var Control w/
deadband
Volt/var Control w/o deadband
Max
imum
Fee
der V
olta
ge (p
u)
Increasing penetration (kW)
2500 cases shown Each point = highest primary voltage
ANSI voltage limit

Solar Forum 2013 High Penetration
F e b 1 3 - 1 4 , S a n D i e g o , C A 12
Improvement in Hosting Capacity
PV Hosting Capacity (kW)
Hosting Capacity increase with volt/var (%)
Without Volt/var 4pt volt/var 6pt volt/var
Voltage Deviation Primary 970 kW 105 % 17 %
Regulator 288 21 0 Secondary 1795 inf 109
Over Voltage Primary 540 95 24 Secondary 877 283 87
PV Hosting Capacity (kW)
Hosting Capacity increase with volt/var (%)
Without Volt/var 4pt volt/var 6pt volt/var
Voltage Deviation Primary 1132 kW inf inf
Regulator 397 Inf 507 % Secondary 2275 inf inf
Over Voltage Primary 421 689 395 Secondary 229 1409 832
Peak Load
Offpeak Load

Solar Forum 2013 High Penetration
F e b 1 3 - 1 4 , S a n D i e g o , C A 13
Ramp Rate Analysis
Benefit > How often and
when significant ramping events occur
Time intervals > 10 seconds > 1 & 10 minutes > 1 hour
Scope
> Single site: PV plant or representative single module
> Aggregated single modules
(Sep 29, 2011)... 12:00 15:00 18:000
200
400
600
800
1000
AC
Pow
er (k
W)
(Sep 29, 2011)... 13:10 13:11 13:12 13:130
200
400
600
800
1000
X: 29-Sep-2011 13:11:15Y: 157.9
AC
Pow
er (k
W)
Local Date & Time (Eastern)
X: 29-Sep-2011 13:11:40Y: 927.6
X: 29-Sep-2011 13:09:55Y: 908.6
X: 29-Sep-2011 13:10:20Y: 165.6
–743kW in 25 sec (2.9% per sec)
+770kW in 25 sec (3.0% per sec)

Solar Forum 2013 High Penetration
F e b 1 3 - 1 4 , S a n D i e g o , C A 14
Hardware-in-the-Loop (HIL) Simulation for a Grid-Connected Inverter
Li
iac vac
Lg Ls
DC-ACInverter
PVStack Relay
phase lock loop
(PLL)
–
PWM+
θ
iref
isense
vsense
look-uptable
gatingsignals
GridDSP Controller
Cf
vgscaling
Pref
Calculateiref
Qref
vi
MPPT A/D &low-pass
filtersCurrent controller
Gi(s)
IPV VPV
scaling
iac

Solar Forum 2013 High Penetration
F e b 1 3 - 1 4 , S a n D i e g o , C A 15
Experimental Voltage Level with Voltage-VAR Control Using a Scaled System
By making transformer power level equal to PV or inverter power level, the real power sent to grid represents PV penetration level
Grid voltage increases as penetration level increases
Unity power factor condition drives the grid voltage higher than that under lagging power factor condition
Inverter Circuit
vi
Ls ig Lg
Equivalent infinite bus voltage
vs vg
Equivalent grid PV
Source
0.960.970.980.99
11.011.021.031.04
0% 20% 40% 60% 80% 100%Equivalent PV Penetration Level
Grid
Vol
tage
vg (
V)
PF = 0.8 lagging
PF = 1.0

Solar Forum 2013 High Penetration
F e b 1 3 - 1 4 , S a n D i e g o , C A 16
Volt-Watt Control under Pure-Inductive Source Impedance Condition
HIL simulation reveals that due to the nature of a phase-locked loop, there is no guarantee that volt-watt will increase the grid voltage
Vs Ig
Vg
jXsIg
Vs
Ig
Vg
jXsIg
0.960.970.980.99
11.011.021.031.04
0% 10% 20% 30% 40% 50%Equivalent PV Penetration Level
Grid
Vol
tage
vg (
V)
Ig

Solar Forum 2013 High Penetration
F e b 1 3 - 1 4 , S a n D i e g o , C A 17
Standards Compliance Design – A New PLL Algorithm for Abnormal Frequency Detection
A new phase-locked-loop (PLL) algorithm is proposed to add a notch filter to eliminate 120-Hz ripple for precise frequency detection
+
Frequency Reference
Low-pass Filter (20Hz)
Frequency Integrator Phase × Normalized Sine
Cosine
Notch Filter
(120Hz)
Low-pass Filter (20Hz)

Solar Forum 2013 High Penetration
F e b 1 3 - 1 4 , S a n D i e g o , C A 18
Summary IEEE 1547 Compliance Test with VT-FEEC Inverter Abnormal voltage test results
Abnormal frequency test results
Voltage range (%) Disconnection Time (s) IEEE 1547 FEEC Inverter Test Result
V < 50 0.16 0.08
50 ≤ V < 88 2.00 1.60
110 < V < 120 1.00 0.64
V ≥ 120 0.16 0.11
Frequency range (Hz) Disconnection Time (s)
IEEE 1547 FEEC Inverter Test Result
f > 60.5 f < 59.3 0.16 0.084

Solar Forum 2013 High Penetration
F e b 1 3 - 1 4 , S a n D i e g o , C A 19
High-Efficiency Soft-Switching Inverter
VT soft-switching inverter achieved CEC efficiency >99%
With natural convection, hot spot temperature was found at 51.9° after 1-hour operation no cooling fan is needed
Output current THD < 2% under full-load condition
92%93%94%95%96%97%98%99%
100%
0 1 2 3 4 5Po (kW)
Effi
cien
cy Versions reported in 12/2011, ηCEC=98.49 and 98.75%, respectively
New Version 3/2012, ηCEC=99.1%
C1S1
C2
Vdc Cdc
C3
C4
S3
S4S2

Solar Forum 2013 High Penetration
F e b 1 3 - 1 4 , S a n D i e g o , C A 20
DC Distributed System Configuration 14×250W PV Panels, 3.5kW Total Installation
VT soft-sw. inverter
(>99% eff.)
VT DC-DC converter (>97% eff.)
A DC distributed system
400V DC Bus
VT DC-DC converter (>97% eff.)
• Paralleled power optimizers for individual panels • High overall system efficiency (>96%) with VT
micro-converter and soft-switching inverter • DC micro-grid architecture with isolation and
protection at local PV panels • Potentially low cost with more integration
VT DC-DC converter (>97% eff.)
Front view of PV panels
Other DC sources
Back view of PV panels
3.5kW PV source
Other DC sources
Weather tight connections
DC link cable
VT FEEC building
5kW inverter 240V
AC
Idc iac

Solar Forum 2013 High Penetration
F e b 1 3 - 1 4 , S a n D i e g o , C A 21
A Soft-Switched Micro-converter Features Low Cost and High Efficiency
Low component counts low cost Soft switching high efficiency Galvanic isolation improved safety and
protection No aluminum electrolytic capacitors
G1
D1
G2
Cc Co1
Cr
Vin
D2
CoS2
iD1
iD2
Vo
+
−
Load
S1
T
0.92
0.93
0.94
0.95
0.96
0.97
0.98
0 50 100 150 200 250Output power (W)
Effic
ienc
y
20V input
30V input
40V input

Solar Forum 2013 High Penetration
F e b 1 3 - 1 4 , S a n D i e g o , C A 22
Eliminate Electrolytic Capacitors Using Advanced Control for PV-Inverters
PV voltage loop controller design with double line frequency rejection
DC bus voltage loop controller design with double line frequency filter to avoid grid current distortion
+
−Vdc
MPPT Control
−
Gi2(s)
PWMVPVIPV
+
DC-ACInverter
Grid
VPV* −
Gv1(s)
PWM
+Vdc
*
iac
VPV
Gv2(s)
Vdc iac
iac*
−
+
DC-DCConverter
H(s)
PLL
×

Solar Forum 2013 High Penetration
F e b 1 3 - 1 4 , S a n D i e g o , C A 23
Frequency Response Plot Showing Double-line Frequency Content Attenuation
Using conventional proportional-integral (PI) controller for DC-DC converter, the double line frequency ripple is reduced by 16 dB (6.3X reduction)
Using a novel PI plus quasi-resonant (QR) controller for the DC-DC converter stage, the double line frequency ripple is reduced by 46 dB (200X reduction)
-60
-40
-20
0
Mag
nitu
de (
dB)
180
Bode Diagram of Gvb
Frequency (Hz) 100k 10k 1k 100
with PI control only uncompensated
10
30dB With PI+QR control

Solar Forum 2013 High Penetration
F e b 1 3 - 1 4 , S a n D i e g o , C A 24
Experimental Results Showing PV Voltage Ripple Elimination Using PI+QR Control
PV voltage ripple is significantly reduced with PI+QR control for the DC-DC converter Way to eliminate electrolytic capacitor without any added penalty
Vdc
With PI+QR control With PI control only
vg
VPV
10V
1V
2A iac
240Vrms

Solar Forum 2013 High Penetration
F e b 1 3 - 1 4 , S a n D i e g o , C A 25
Summary
Modeling and Simulation
Website hosting measurement data and feeder models
Statistical analysis of PV variability at distribution level
Study of hosting capacity boundary limits
Evaluation of smart inverters that increase hosting capacity
Power Electronics
Development of low-cost high-efficiency power electronics: > Micro-converter, > Micro-inverter, > String inverter
Development of HIL simulation/hardware
Novel abnormal voltage/ frequency detection

Solar Forum 2013 High Penetration
F e b 1 3 - 1 4 , S a n D i e g o , C A
Q &A AND DISCUSSION
Jason Lai: [email protected] 540.231.4741 Jason Dominic: [email protected] 540.808.0217 Bin Gu: [email protected] 540.808.0217 Nathan Kees: [email protected] 540.808.0217 Ben York: [email protected] 540.808.0217 Wensong Yu: [email protected] 540.808.0217 Jeff Smith: [email protected] 865.218.8069 Tom Key : [email protected] 865.218.8082 Chris Trueblood : [email protected] 865.218.8118 Mack Grady: [email protected] 254.710.3307

Solar Forum 2013 High Penetration
F e b 1 3 - 1 4 , S a n D i e g o , C A
BACKUP SLIDES

Solar Forum 2013 High Penetration
F e b 1 3 - 1 4 , S a n D i e g o , C A 28
An Integrated-Boost Resonant Converter for Isolated DC-DC Stage
•Integrate a boost converter and a resonant half-bridge converter to reduce parts count •The PWM duty cycle of S2 controls the “boost voltage” Vb = Vin/(1 – D) •S2 carries boost and resonant current and operates under hard switching •S1 operating under ZVS •D1, D2 operating under ZVZCS •Simple control
–Traditional duty-cycle modulation –Constant voltage gain over load
•Guaranteed transformer V⋅s balanced
+−
Vin S3
+
D1
C1
−
L
C2
S1
S2
Vo
S1 S2 S1 S2
vpri
iD1
ipri
iD2
Tsw 2Tsw 0
+−
Vin
+
−
LVo
C1
C2
S1
S2C4
C3D1
D2
Vb

Solar Forum 2013 High Penetration
F e b 1 3 - 1 4 , S a n D i e g o , C A 29
Experimental Waveforms with Voltage-VAR Control Using a Scaled System
vg ig vg ig
CASE A: Inverter sends real power to the grid • Power factor = 1.0 • Equivalent PV penetration level: 88% • Equivalent inverter KVA level: 0.88 pu • Grid voltage increases by 3.5%
CASE B: Inverter sends real and reactive power to the grid • Power factor = 0.8 lagging • Equivalent PV penetration level: 85% • Equivalent inverter KVA level: 1.06 pu • Grid voltage increases by 1.7%

Solar Forum 2013 High Penetration
F e b 1 3 - 1 4 , S a n D i e g o , C A 30
Current Waveform Comparison between VT and Enphase Microinverters
Output current 2A/div
Output current
Output Current
Transition between CCM and DCM Enphase microinverter
VT microinverter
012345678
20 30 40 50 60 70 80 90 100
Percent load
Perc
ent T
HD
Enphase
VT
With continuous operation, VT microinverter current THD is <2.5% under full-load condition
Enphase modulates between continuous and discontinuous current modes (CCM and DCM), resulting poorer THD (>3%).

Solar Forum 2013 High Penetration
F e b 1 3 - 1 4 , S a n D i e g o , C A 31
Design of Hardware-in-the-loop Simulation
Target Hardware System Circuit Model (in PSIM)
Feeder circuit network Generator
Distribution line Load
PV Panels
DSP Controller A-to-D
Var and frequency control Pulse width modulation
Voltage and Current
Feedback
Monitoring results
Gating signals
Inverter
Solar Forum 2013 High Penetration
F e b 1 3 - 1 4 , S a n D i e g o , C A 32
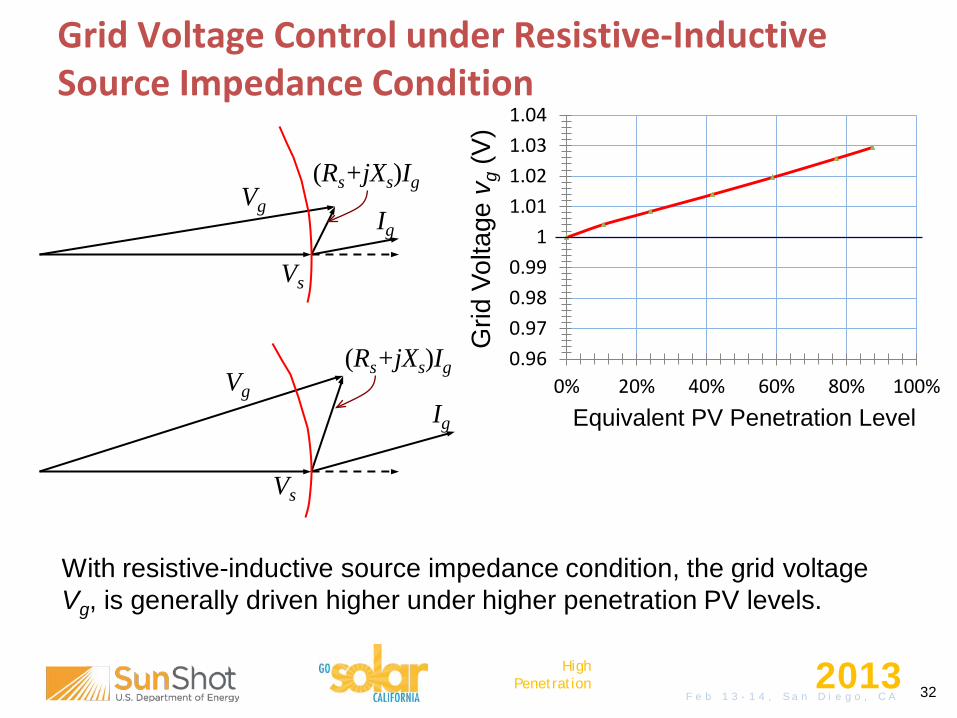
Grid Voltage Control under Resistive-Inductive Source Impedance Condition
With resistive-inductive source impedance condition, the grid voltage Vg, is generally driven higher under higher penetration PV levels.
Vs
Ig Vg
Vs
Ig Vg
(Rs+jXs)Ig
(Rs+jXs)Ig 0.960.970.980.99
11.011.021.031.04
0% 20% 40% 60% 80% 100%Equivalent PV Penetration Level
Grid
Vol
tage
vg (
V)

Solar Forum 2013 High Penetration
F e b 1 3 - 1 4 , S a n D i e g o , C A 33
Hosting Capacity Comparison
Each feeder has similar characteristics that are typically used to classify feeders (load level and voltage class)
Two significantly different PV penetration levels can be accommodated before violating voltage criteria
Feeder Comparison Feeder A Feeder B
Feeder Characteristics
Voltage (kV) 13.2 12.47 Peak Load 5 MW 6 MW
Minimum Load 0.8 MW 0.7 MW Min Daytime Load 1.1 MW 0.7 MW Existing PV (MW) 1.0 1.7
Total Circuit Miles 28 58 Minimum Hosting Capacity (kW)
Voltage Primary Overvoltage >3500 420 Regulator Deviation >3500 250
Protection
Total Fault Contribution >3500 1685 Sympathetic Tripping 1478 1426
Reduction of Reach >3500 1489 Fuse Saving 1771 1426
Anti-Islanding – Breaker 777 390 Customer-based PV results shown
70% of Peak Load 4% of Peak Load

Solar Forum 2013 High Penetration
F e b 1 3 - 1 4 , S a n D i e g o , C A 34
Leveraging Work Throughout Industry
From Research to Application
Development of Solar PV System Modeling
DOE Hi-Pen Phase I
Development of “Hosting Capacity” Method Hi-Pen Analysis of large set of feeders
EPRI DPV Feeder Analysis Project
Hi-res PV Monitoring and Hosting Capacity Analysis of 2 feeders
DOE Hi-Pen Phase II
Development of smart inverter functions in OpenDSS
EPRI member-funded project
Hosting Capacity results with smart inverters, PV data resource DB
DOE Hi-Pen Phase III
Development of Alternate Screening Methods
CPUC/DOE/EPRI Funded Project

Solar Forum 2013 High Penetration
F e b 1 3 - 1 4 , S a n D i e g o , C A 35
Categories for Daily Variability Conditions Sandia’s variability index (VI) and clearness index (CI) to classify days
Clear Sky POA IrradianceMeasured POA Irradiance
High
Moderate
Mild Overcast
Clear
VI < 2 CI ≥ 0.5
VI < 2 CI ≤ 0.5
2 ≤ VI < 5
5 ≤ VI < 10
VI > 10

Solar Forum 2013 High Penetration
F e b 1 3 - 1 4 , S a n D i e g o , C A 36
Daily Variability Conditions by Season At 1MW plant on feeder A, measured with plane-of-array pyranometer
(Jan-Mar) (Apr-Jun) (Jul-Sep)0
0.2
0.4
0.6
0.8
1
Rel
ativ
e N
umbe
r of D
ays
Season
HighModerateMildClearOvercast
11%
35%
29%
20% 28%
46% 28%
17% 31%
14% 13% 9% 11% = 4%

Solar Forum 2013 High Penetration
F e b 1 3 - 1 4 , S a n D i e g o , C A 37
Predicting Cloud Movement Impact on Power Distribution Systems Having Widespread PV
PV MAX DC POWER Using I-V Curve Sweeper, 5-Second Spacing Between Readings, for a 10 Minute Window, Dec. 20, 2010. Mack Grady, U.T. Austin.
0
20
40
60
80
100
120
140
160
10-Minute Window Near 12 Noon
Pane
l DC
Wat
ts

Solar Forum 2013 High Penetration
F e b 1 3 - 1 4 , S a n D i e g o , C A 38
Example Cloud Movement over a Substation with a Total Load about 20 to 40 MW
One substation transformer feeding approximately four distribution feeders and several hundred individual load busses with about 20 – 40 MW total load
x (east)
y (north)
Heading angle shown is 165º
Transition shading ring
Fully shaded circle Xc,Yc
Xb,Yb
Dcb 2A
2C
Bus
Illustration of calculation within the transition shading ring

Solar Forum 2013 High Penetration
F e b 1 3 - 1 4 , S a n D i e g o , C A 39
Cloud Movement Model
For cloud shadow speed = 5 m/s, A = 250 meters, C = 300 meters For cloud shadow speed = 7 m/s, A = 350 meters, C = 420 meters
•When there is no shadow, use panel clear sky Pmax for the given time of day and panel orientation. •When inside a 50-second diameter, or A, use Pmax/3. •When inside a 5-second circular transition ring, or C – A, the power is assumed to be linearly varied between Pmax and Pmax/3