jce4600 fundamentals of traffic engineering …...1 jce4600 fundamentals of traffic engineering...
TRANSCRIPT

1
JCE4600Fundamentals of Traffic Engineering
Introduction to Geometric Design
Agenda Kinematics
Human Factors
Stopping Sight Distance
Cornering
Intersection Design
Cross Sections

2
AASHTO Green Book
Kinematics
3
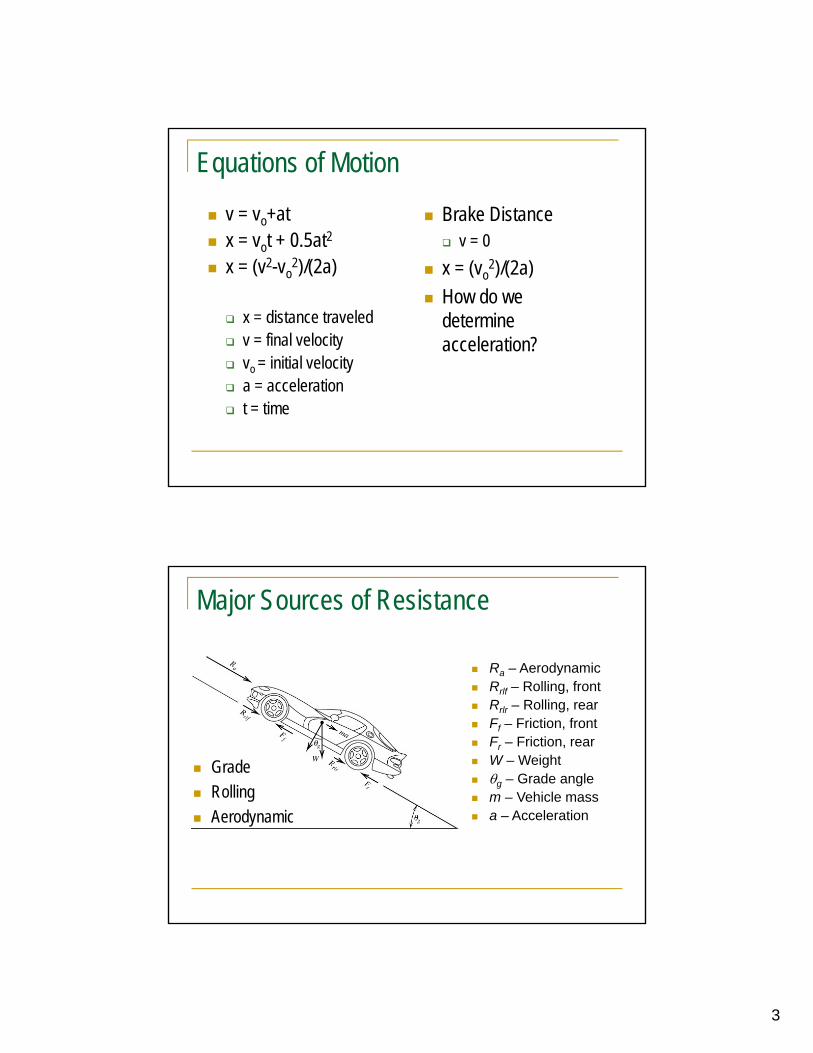
Equations of Motion
v = vo+at x = vot + 0.5at2
x = (v2-vo2)/(2a)
x = distance traveled v = final velocity vo = initial velocity a = acceleration t = time
Brake Distance v = 0
x = (vo2)/(2a)
How do we determine acceleration?
Major Sources of Resistance
Grade
Rolling
Aerodynamic
Ra – Aerodynamic Rrlf – Rolling, front Rrlr – Rolling, rear Ff – Friction, front Fr – Friction, rear W – Weight g – Grade angle m – Vehicle mass a – Acceleration

4
Balance of Forces Force balance
Friction force = Acceleration force + resistance
ma = ± FFriction ± FGrade – Force Resistance
Rolling and Aerodynamic forces are typically discounted
FFriction = fWN = fWcosg
FGrade = sing
f=friction coefficient
Breaking Distance
Db = Breaking Distance (ft)
v = final velocity (ft/sec)
vo = initial velocity (ft/sec)
g = gravity force (32.2 ft/sec2)
f = friction coefficient
G = Percent Grade/100
Db = Breaking Distance (ft)
v = final velocity (mph)
vo = initial velocity (mph)
f = friction coefficient
G = Percent Grade/100

5
Friction Coefficient
Friction between sliding objects is lower than when the same objects are still
This is why it is harder to push something from standstill than keeping it moving
Tires that are not slipping have a zero velocity at the point they touch the ground; thus - maximum friction
Friction Chart

6
Road Adhesion
Pavement Maximum Friction
Slide Friction
Good, dry 1.0 0.8
Good, wet 0.9 0.6
Poor, dry 0.8 0.55
Poor, wet 0.6 0.3
Ice 0.25 0.1
Antilock Braking Systems
Serve three purposes Allow steering while braking
Keep wheels from locking to maintain the coefficient of road adhesion from dropping to the sliding values
Achieve a braking efficiency near 1.0 by appropriately managing the braking force ratio between the front and the rear

7
Braking Distance Example
A student drove his 1983 Dodge into a dorm adjacent to the student parking lot. Police found 30’ long skid marks leading to the point of impact. The damage assessment found that the speed at the time of impact was 10 mph. The parking lot was level, and the pavement was wet (f = 0.6). The speed limit in the parking lot is 15 mph. How fast was the student traveling at the time that he began to skid?
Was he speeding?
What would have the impact speed have been had the parking lot been on a 6% uphill grade ? How about a 3% downhill grade?
What would the impact speed have been given level, icy pavement (f = 0.1)
Would there have been a different result, coefficient of friction and vehicle braking capabilities being equal, if he would have been driving a fully loaded newspaper truck?
Human Factors
8
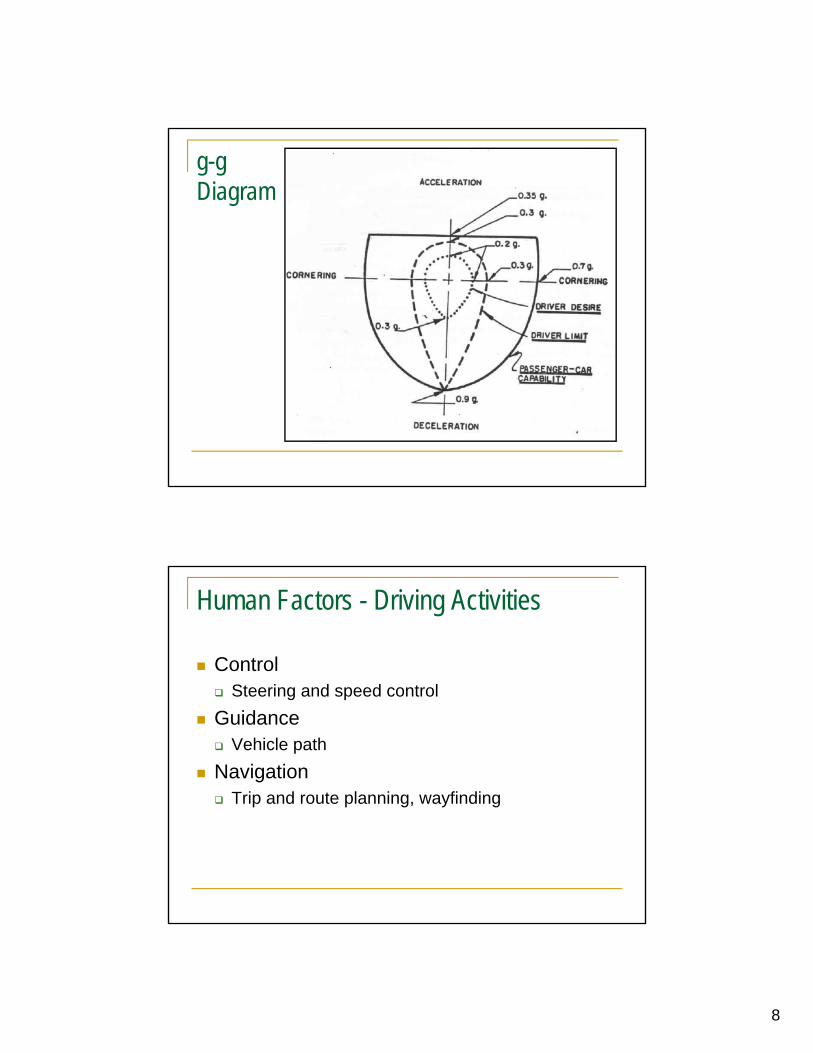
g-g Diagram
Human Factors - Driving Activities
Control Steering and speed control
Guidance Vehicle path
Navigation Trip and route planning, wayfinding

9
Guidance/Control Process Diagram
Perception Reaction Time

10
Stopping Sight Distance
Stopping Sight Distance
SSD = Stopping Sight Distance (ft)
tpr = perception/reaction time (2.5 sec)
v = final velocity (mph)
vo = initial velocity (mph)
f = friction coefficient G = % Grade/100
Two components: Braking distance
Wet pavement and tires
Emergency braking: 3.4 m/sec2 (11.2 ft/sec2)
2.5-second perception/reaction distance
11
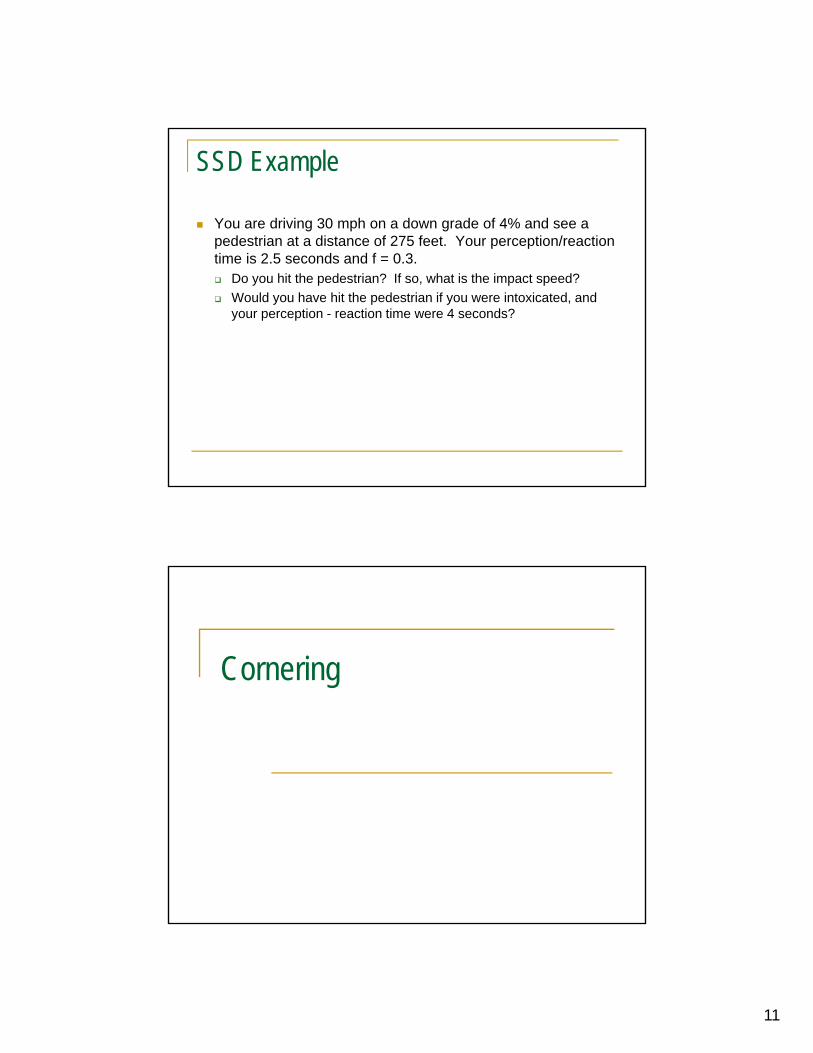
SSD Example
You are driving 30 mph on a down grade of 4% and see a pedestrian at a distance of 275 feet. Your perception/reaction time is 2.5 seconds and f = 0.3. Do you hit the pedestrian? If so, what is the impact speed?
Would you have hit the pedestrian if you were intoxicated, and your perception - reaction time were 4 seconds?
Cornering

12
Vehicle Cornering
When a vehicle traverses a horizontal curve it has a tendency to continue on the straight line
The driver forces the vehicle to traverse the curve The side friction between the road and the tires keeps
the vehicle from slipping out of the curve
Vehicle Cornering
Rv – radius of curve a – angle of incline e – superelevation W – weight Wn – weight normal Wp – weight parallel to road Ff – side friction Fc – centripetal force Fcn – centripetal force normal Fcp – centripetal force
parallel to road
cos
sin
2
ccp
ccn
vc
FF
FF
gR
WVF
sin
cos
WW
WW
p
n
tan100e
13
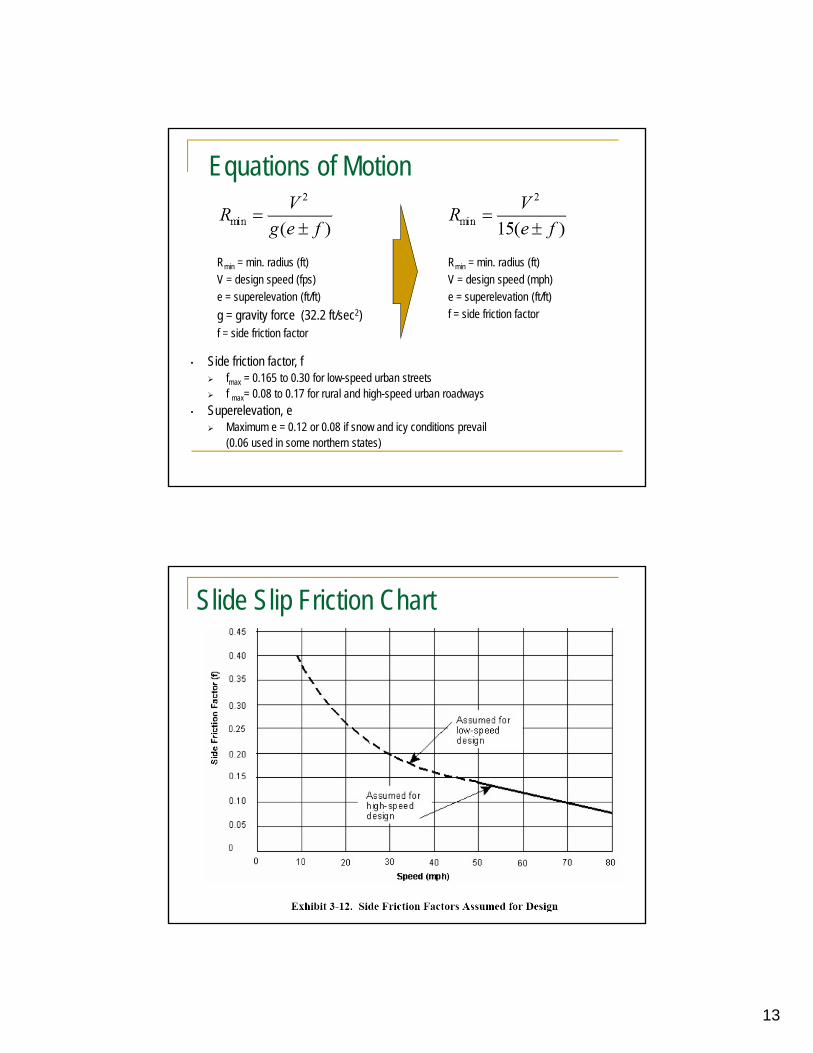
Equations of Motion
Rmin = min. radius (ft)
V = design speed (mph)
e = superelevation (ft/ft)
f = side friction factor
Rmin = min. radius (ft)
V = design speed (fps)
e = superelevation (ft/ft)
g = gravity force (32.2 ft/sec2)f = side friction factor
• Side friction factor, f fmax = 0.165 to 0.30 for low-speed urban streets f max= 0.08 to 0.17 for rural and high-speed urban roadways
• Superelevation, e Maximum e = 0.12 or 0.08 if snow and icy conditions prevail
(0.06 used in some northern states)
Slide Slip Friction Chart

14
Cornering Example
Consider the design for a curve with a 60 mph design speed, maximum side friction = 0.15, and and superelevation = 0.08. What is the minimum radius of the curve?
Can a larger radius be used? Why?
How does the answer change if a 5% superelevation is used?
Overturning

15
Overturning
fOT = T/2H
f required < fmax and f required < fOT = Success!
f max or fOT < required = Failure
f max < required and f max < fOT = Sliding
fOT < required and fOT < fmax = Overturning
Overturning Example
Consider a 8’ wide truck with a center of gravity 6’ from the pavement. Given a speed of 70 mph and e = 0.08, fmax = 0.8, and R = 250 feet. What happens?
16
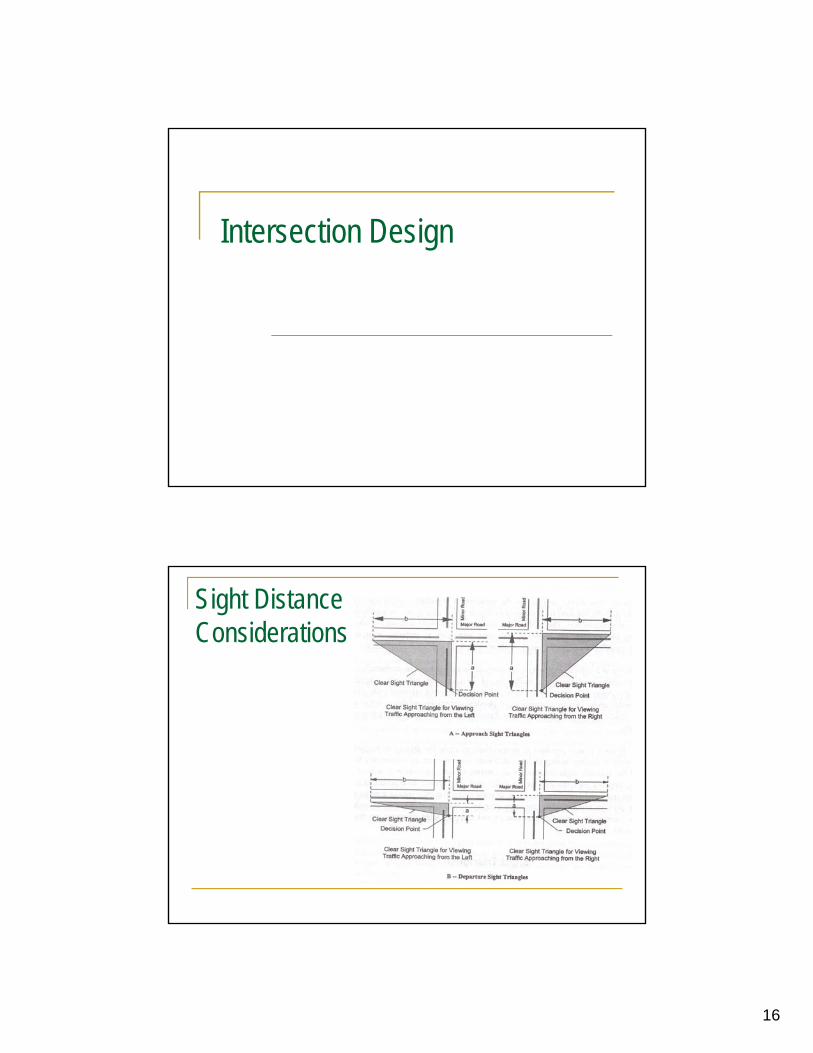
Intersection Design
Sight Distance Considerations
17
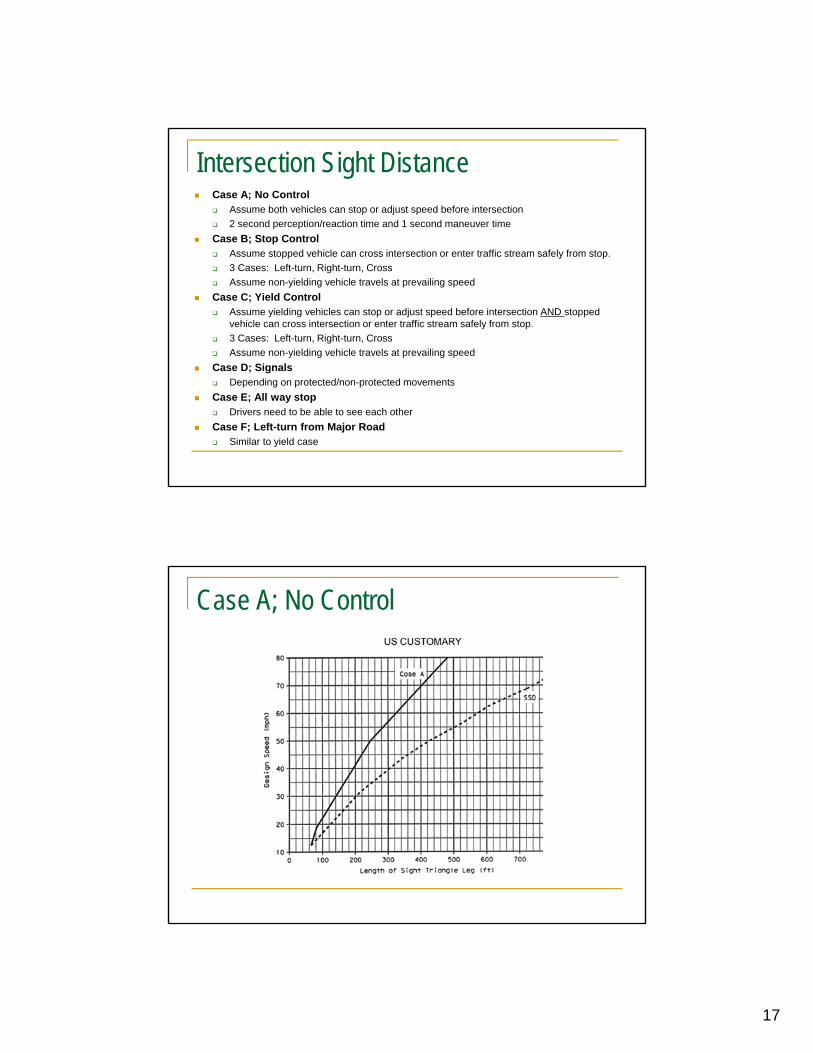
Intersection Sight Distance Case A; No Control
Assume both vehicles can stop or adjust speed before intersection
2 second perception/reaction time and 1 second maneuver time
Case B; Stop Control Assume stopped vehicle can cross intersection or enter traffic stream safely from stop.
3 Cases: Left-turn, Right-turn, Cross
Assume non-yielding vehicle travels at prevailing speed
Case C; Yield Control Assume yielding vehicles can stop or adjust speed before intersection AND stopped
vehicle can cross intersection or enter traffic stream safely from stop.
3 Cases: Left-turn, Right-turn, Cross
Assume non-yielding vehicle travels at prevailing speed
Case D; Signals Depending on protected/non-protected movements
Case E; All way stop Drivers need to be able to see each other
Case F; Left-turn from Major Road Similar to yield case
Case A; No Control

18
Case B; Stop Control
Case B; Stop Control
19
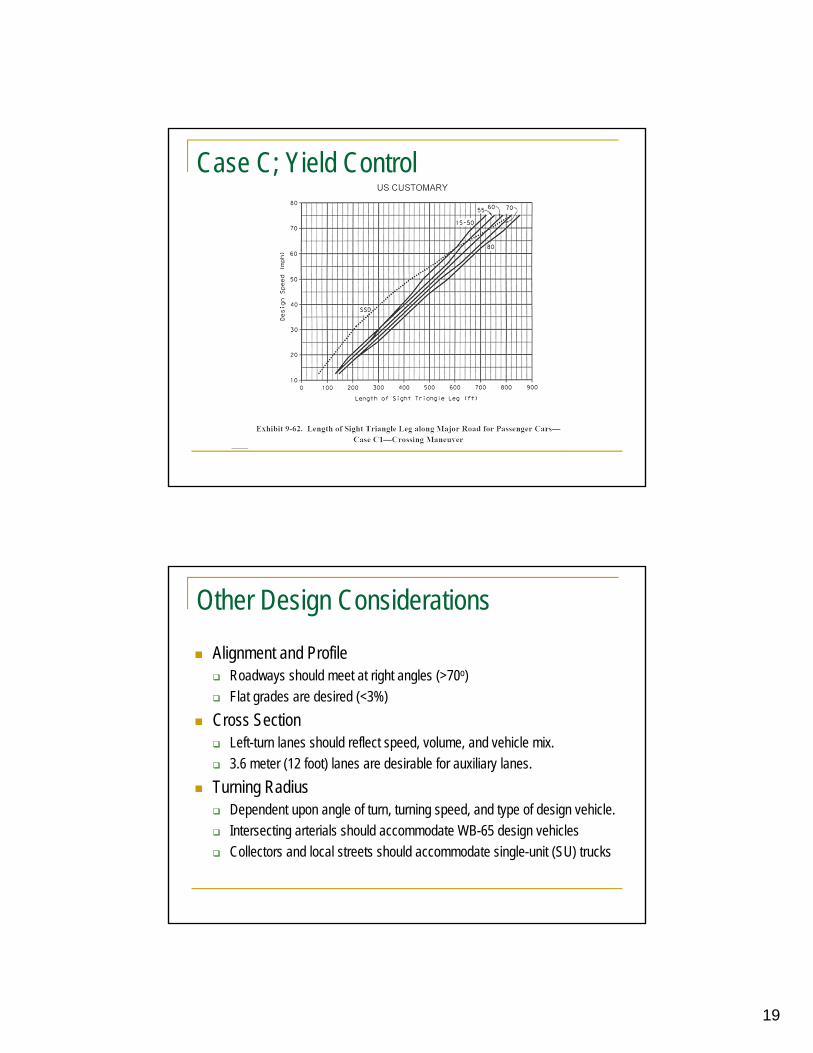
Case C; Yield Control
Other Design Considerations
Alignment and Profile Roadways should meet at right angles (>70o)
Flat grades are desired (<3%)
Cross Section Left-turn lanes should reflect speed, volume, and vehicle mix.
3.6 meter (12 foot) lanes are desirable for auxiliary lanes.
Turning Radius Dependent upon angle of turn, turning speed, and type of design vehicle.
Intersecting arterials should accommodate WB-65 design vehicles
Collectors and local streets should accommodate single-unit (SU) trucks

20
Cross Sections
Major Elements
Travel Lanes
Road margins Shoulders, curbs, swales, medians
Traffic separation devices Barriers, medians, crash cushions
Sidewalks and bikeways
21
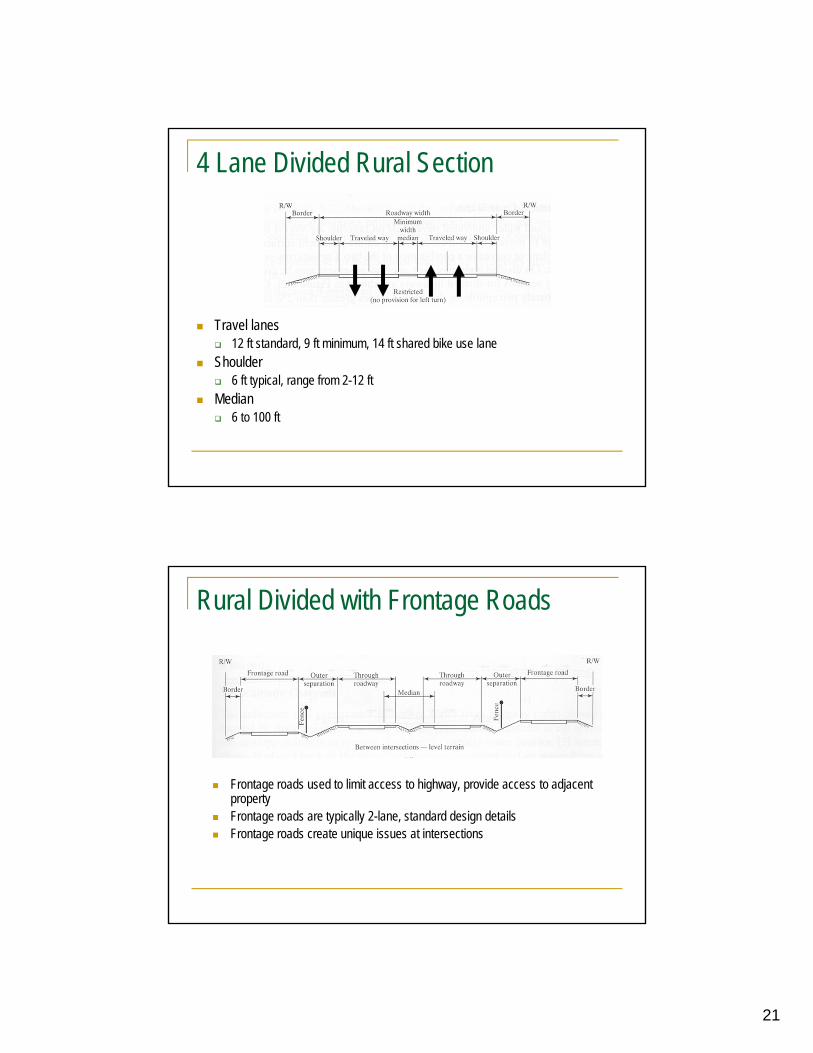
4 Lane Divided Rural Section
Travel lanes 12 ft standard, 9 ft minimum, 14 ft shared bike use lane
Shoulder 6 ft typical, range from 2-12 ft
Median 6 to 100 ft
Rural Divided with Frontage Roads
Frontage roads used to limit access to highway, provide access to adjacent property
Frontage roads are typically 2-lane, standard design details Frontage roads create unique issues at intersections

22
R/W Example
What would the R/W width be for a 6 lane divided rural roadway? 6 travel lanes * 12’ = 72 feet
Full width median = 60 feet
4 shoulders * 8 feet = 32 feet
Totals 164 feet plus 2 clear zones/drainage swales
Typical 6 lane rural R/W 200 feet +
Shoulders
Emergency use for parking or errant vehicles
Lateral clearance
Structural support to roadway

23
Homework (±1.5 hours); Due: Next Class1. A driver loses control of their vehicle and skids 70 feet on a level asphalt
surface (f = 0.7) and then 50 feet on the adjacent level gravel shoulder (f = 0.5). What was the speed of the at the beginning of the skid?
Assuming your answer from above, how far would they have slid on the gravel (f = 0.5) if the asphalt would have been ice covered (f = 0.1)?
2. Given a curve with a superelevation of 6%, 700 foot radius, and icy pavement (f = 0.1): What is the maximum speed you can travel before you start to slip?
What is the minimum speed you can travel before you start to slip?
3. A driver traveling at 55 mph sees a deer at 200 feet and leaves 60 foot skid marks before impact. (f = 0.7; 0% grade) What is the perception reaction time?
What is the speed at impact?
4. Consider a 8’ wide truck with a center of gravity 6.5’ from the pavement. Given a speed of 65 mph and e = 0.04, fmax = 0.8, and R = 300 feet. What happens?