jdr annual report 2013 - cable manufacturers … · annual report for the year ended 31 december...
TRANSCRIPT

ANNUAL REPORT FOR THE YEAR ENDED 31 DECEMBER 2013JDR CABLE SYSTEMS (HOLDINGS) LIMITED
PROVIDING THE VITAL CONNECTION
ANNUAL REPORT2013

Financial Highlights
• Revenues £88m, down 32% on 2012, a record breaking year for JDR
• EBITDA £12.3m, with EBITDA margin at 14%
• Operating cash inflow of £6.3m, ensuring revolving facility fully repaid
• Performance impacted by oil and gas project delays and uncertainty in offshore wind
• Invested in infrastructure and people for future growth
Operational Highlights
• Strong product demand, especially for Installation Workover Control Systems
• Increased capacity due to on-going benefit of long-term investment in manufacturing facilities, business processes and people
• Continued to grow full-service capability: from design services, to product solutions, and offshore services
• Entered new markets, importantly Brazil, and strengthened relationships with EPIC partners
• Investment in new strategic initiatives for long-term growth; targeting technology evolution, geographic expansion and people development
• Performance impacted by some oil & gas project delays and uncertainty in offshore wind markets
FinancialsOrder Intake
Summary
Revenue EBITDA
£97m £88m £12mHistory
0
10
20
30(£
’M)
CY09CY10
CY11CY12
CY13
6 0
-4
26
12
0
30
60
90
120
(£’M
)
CY09CY10
CY11CY12
CY13
62
94
70
11397
0
30
60
90
120
(£’M
)
CY09CY10
CY11CY12
CY13
51 54
83
130
88
The group changed its accounting year-end date in the prior period from 31 March to 31 December to bring the group into line with industry practice. To compare similar periods in this report, the directors are reporting with unaudited pro forma calendar year comparatives for 2012. The directors believe this gives a more transparent and comparable presentation for the reader.

Chairman’s Statement 4
CFO Statement 8
Health, Safety and the Environment 12
JDR Board of Directors 14
JDR Executive Management Team 16
Directors’ Report 18
Strategic Report 20
Corporate Governance 21
Risk Management Report 26
Independent Auditor’s Report 28
Financial Statements and Notes to the Financial Statements 29
Advisors and Registered Head Office 60
JDR is a leading provider of technology connecting the global energy industry.
PROVIDING THE VITAL CONNECTION
In this report...
Specialising in connecting subsea infrastructures
Oil & GasJDR’s subsea production umbilicals and power cables maximise the efficient delivery of power, control and communications. The team creates custom built systems for subsea installations at ever increasing water depths for many of the globe’s major energy companies and offshore service providers.
RenewablesJDR has led the development of inter-array cable design and manufacture, creating product systems for some of the world’s largest offshore wind projects. Embracing the future of renewable energy, JDR is committed to enabling the next generation of more cost-efficient wind power projects.
Global ServicesThe JDR team provides global aftermarket, installation and maintenance services for oil & gas and renewables clients. Through its network of experienced and certified technicians and service support facilities JDR can manage customer projects, for JDR and non-JDR products, on or offshore.
1

Rio de Janiero,Macaé Brazil
Hamburg, Germany
Houston, USA
Aberdeen
Hartlepool
Littleport
Bangkok & Sattahip, Thailand
Singapore
Kuala Lumpur, Malaysia
JDR 2007 TO 2013
The AmericasJDR’s Americas base is Houston, Texas. From the Houston sales office JDR manages relationships with its worldwide customer base. The team is an integral part of the local, and globally important, oil & gas community.
Houston is a hub for JDR’s Global Services operation, with a facility dedicated to IWOCs and reeler support and maintenance. Projects from this facility are primarily for clients involved in oil & gas exploration in the Gulf of Mexico.
From Houston JDR is spearheading its development in the world’s most important market for subsea production umbilicals: Brazil. In addition to a sales office in Rio de Janeiro, JDR has now established a service centre in Macaé. From this centre JDR will support existing customers, building up operations over the next two years.
JDR is a leading provider of technology connecting the global offshore energy industry. Our products and services enable vital control and power delivery to offshore oil, gas and renewable energy systems.
The world’s major energy companies and subsea service providers depend on high performance subsea control umbilicals and subsea power cables that operate in the world’s harshest offshore environments. JDR invests in state-of-the-art manufacturing facilities, technology and people to deliver these world-class subsea products.
We have a proven track record of delivering client expectations and are totally committed to lifecycle customer service. We achieve this through our specialist engineering teams, experienced project management, integrated safety systems and a global service network that ensures 24/7 aftermarket support.
Europe, Middle East and Africa (EMEA)The UK is the centre of JDR’s global network, with the Group’s HQ in Cambridgeshire. JDR has made significant investment in its UK design and manufacturing operations – in Littleport and Hartlepool – creating world-class facilities for the creation of subsea production umbilicals, subsea power cables, inter-array cables and an ever increasing range of accessories and support services.
JDR has continued to invest in Aberdeen and is now ideally positioned to grow its North Sea business, alongside its markets in Africa and Middle East.
JanuaryHartlepool
Phase 2 Investment approved
2010
£54m
SeptemberJDR acquired by Vision Capital & Goldman Sachs
2007
£30m
JulyHartlepool officially opened
H2Completion of
inter-array cable and SPU lines at
Hartlepool
2009
£51m
MarchHartlepool Phase 1
Investment approved by shareholders
MayAwarded Greater Gabbard offshore
wind contract
2008
£44mTotal revenue
2

Rio de Janiero,Macaé Brazil
Hamburg, Germany
Houston, USA
Aberdeen
Hartlepool
Littleport
Bangkok & Sattahip, Thailand
Singapore
Kuala Lumpur, Malaysia
Asia PacificThe centre of JDR’s Asia Pacific operations is Thailand where JDR has a design and sales office in Bangkok and manufacturing facility in Sattahip. JDR is growing its customer base in this region with further sales offices in Kuala Lumpur and Singapore, working on projects from offshore China to offshore Australia.
Our strategy is based on growth, funded by productivity and technology investment, delivered by a flexible customer-focussed organisation.
Products and Technology
• New product launches: bringing new products to market, such as steel tube umbilicals and aluminium core inter-array and power cables that utilise JDR’s core design and manufacturing skills
• Evolve existing product capability: developing current product ranges in response to developing customer and market needs
• Develop new differentiating technologies: led by JDR’s new Technology Centre in Cambridge
Markets
• Establish JDR in Brazil: the world’s largest market for subsea production umbilicals
• Expand Asia Pacific: building on JDR’s long-term success in this region
• Grow North Sea presence: targeting subsea production umbilical opportunities
Capability
The JDR team is at the heart of the Group’s long-term success. Our people development programme will continue to enhance skillsets across the business to better serve our customers. At the same time we are investing in systems that will streamline our internal development processes and improve quality management systems.
JDR Strategy
AutumnCompletion of
upgrade to Littleport manufacturing facility
2013
£88m
DecemberRecord performance year and large
projects completed for oil & gas customers in Asia Pacific and JDR’s first renewable project in Germany
2012
£130m
January / FebruaryLaunch of
Project New Vista (PNV)
AprilSale of Marine
Cables; all senior
debt repaid
Q3New senior
management team appointed
2011
£83m
3

Rio de Janiero,Macaé Brazil
Hamburg, Germany
Houston, USA
Aberdeen
Hartlepool
Littleport
Bangkok & Sattahip, Thailand
Singapore
Kuala Lumpur, Malaysia
JDR operates in a fast-growing market, where oil & gas production is moving further and deeper offshore.
2013JDR established its Brazilian operations, the world’s largest subsea umbilical market
4

Our ability to achieve this is due to long-term investments in our manufacturing infrastructure, project management, engineering design and a host of new technologies that connect the infrastructure of the offshore energy industry. JDR operates in a fast-growing market, where oil & gas production is moving further and deeper offshore. Our expertise in the design and manufacture of products that thrive in these environments, combined with our lifecycle customer support, has delivered ongoing long-term growth in revenue and profitability.
In 2012 this approach enabled us to outperform expectations. 2013 was another strong year, and although while not at the same level as 2012 we have continued to invest in new technologies and internal capabilities to support our clearly defined strategy for long-term growth.
JDR is now performing significantly ahead of what was possible three or four years ago. 2013 saw revenues of £88m and EBITDA of £12.3m for the twelve months to 31 December 2013. Our financial performance was impacted by some project delays in oil and gas markets and uncertainty in offshore wind markets, both of which slowed order intake. So, while I am disappointed that the 2013 outcome did not match our record 2012 performance, I am delighted to see how JDR continues to benefit from the growth platform we have built since 2009.
We have won new business and shipped customer projects across the JDR product range. Wins included work with ConocoPhillips for umbilicals in Phase 3 of the Bayu-Undan Field, three IWOCS projects for Chevron and a follow-up award with
CNOOC for the Enping project. We have also deepened relationships with some of our major EPIC customers, establishing frame agreements that form the basis of long-term strategic partnerships. Our performance was recognised by the Engineering Employers Federation (EEF), where JDR was runner-up in their national business growth awards.
Our strategy is supporting a transition; from supplying many products to a small group of customers, to a strategic partner on larger projects to a growing international customer base. Increasingly we are delivering a full service package from front end engineering and design to project execution and aftermarket service and installation support. The infrastructure we have created since 2011 has made it possible to evolve our business to this new scope. This change has brought with it a steep learning curve, as we move from a revenue model with quick turnaround and more predictable outcomes in any given year, to a growth platform with a wider range of major projects that have longer lead-times.
Building on this strategy, 2013 saw us make further investments that will drive our technical and regional growth and strengthen our internal capabilities.
JDR ANNUAL REPORT 2013
Chairman’s Statement During 2013 we continued to increase our global business, fulfilling projects of increasing scope and complexity for oil, gas and renewable energy customers.
5

Technical Growth
Our engineering team has a deep understanding of subsea engineering, built through extensive experience in project delivery. We are ideally positioned to identify and develop new products and technologies to support our customers’ evolving requirements. Our technology leadership was established with the launch of self-supporting open water IWOC umbilical technology, an innovative approach to IWOCS deployment that significantly reduces offshore operating costs.
In 2013 we continued to invest in expanding our product scope. Importantly we commenced work on our first steel tube umbilical and also on aluminium conductors as an alternative to copper in subsea power cables. As oil & gas projects move further offshore and into deeper waters and the renewables industry works to deliver cost-effective alternative energy, our ability to innovate will create further new opportunities for JDR. We intend to continue to invest in the talent and technology that will ensure we thrive in these environments.
Our developments in inter-array cable technology was boosted by funding from by the Department of Energy and Climate Change (DECC) in the second call of the Offshore Wind Components Scheme. These contributions are supporting further JDR research into high voltage inter-array cabling and power cable technologies and materials. These initiatives will help drive down the cost of each megawatt of power produced by an offshore wind farm, helping make offshore wind a more cost-effective and competitive source of power. The initial beneficiaries are expected to
6

be offshore wind developers as they look to use inter-array cabling at higher voltages in a number of Round 3 UK wind farm installations.
Regional Growth
We operate in a global industry and have won business in all major offshore markets for our products and services.
Our IWOCS business has flourished. 2013 was our best year yet for order intake, with orders of major scale and scope for customer projects in the North Sea, West Africa and the South China Sea. JDR has been at the forefront of this industry segment for over a decade, testament to our technical ability to deliver for top-tier oil and gas operators.
Other oil and gas contracts included subsea power and communication (composite) cables to Petrofac for the Satah Al Razboot (SARB) package 3 project, offshore Abu Dhabi and subsea power cables for the Total Ofon Phase 2 project in Nigeria. We also delivered a major subsea production umbilical and power cable project for the Santos Fletcher Finucane development, offshore Western Australia, and our first inter-array cables were installed in the fast-growing German offshore wind market for Wind MW.
In 2013 we launched initiatives to further develop JDR’s business in Brazil, the North Sea and Asia. Brazil in particular is a major deepwater market, where we believe there is significant opportunity for our subsea products and our service business. First steps include establishing additional sales offices and service centres and in 2014 we intend to further develop capabilities in each of these markets.
Internal Growth
2013 saw us make further investment in people and infrastructure to support our next phase of growth. We are committed to making JDR one of the most attractive employers in our industry. Attracting and retaining human resources is an ongoing challenge in
our industry and I am proud of our employees and our ability to attract and retain great people. New appointments to our Executive Management Team in 2014 include Charlie Backhouse as Global Services Director and Richard Turner as Chief Operating Officer.
Last year we extended our training capability and resources for employee development. We established an Apprentice Scheme and continued our Graduate Programme, introducing new people and talent to our industry. We intend to continue to invest in these programmes and our commitment to provide personal development opportunities for all our employees.
We also made further investments in JDR’s manufacturing infrastructure with a £1 million programme to upgrade our Littleport factory.
New equipment and improvements to the factory layout are now enabling us to produce longer length hoses, a core component of our subsea production umbilicals and IWOCS products, more safely and more efficiently. This initiative better supports our customers as they move oil and gas exploration into increasingly deeper offshore fields, enabling JDR to deliver even more cost effective and reliable products.
We also made further investments in IT systems and business processes in particular to improve project execution. This initiative delivered systems to enhance our engineering and design capabilities, better manage product data and streamline our business systems.
All of this work is underpinned by a culture of rigorous commitment to health, safety and environmental standards. Our facilities in Hartlepool, Sattahip and Houston joined Littleport with recertification of their safety management systems to OHSAS18001:2007. We have continued to roll out the ISO14001:2004 environmental management system.
Littleport successfully achieved ISO 14001 re-certification and Hartlepool and Houston passed their first certification audits in 2014. Underlying our successful audits is a wide ranging programme of initiatives from HSE
training to recycling schemes.
Having made significant investments in world class facilities, we are now shifting to a long-term growth programme investing in our people and capabilities across all aspects of our operations. I believe this work will position us as a major player in all of our key markets, where we will continue to focus on delivering world-class products & services.
Evolution
The Board has entered 2014 with some changes. Andrew Norman has stepped down as CEO and a recruitment process to find a successor is underway. I will continue as Executive Chairman and, in the interim, take on the CEO responsibilities. Joining the Board was Jonathan Guest, from Vision Capital who has replaced Johan van de Steen. Peter Sayles, COO, has also stepped down from the company. I would like to thank Andrew, Johan and Peter for their contributions.
I am also delighted to report that JDR has won a 2014 Queen’s Award for Enterprise in International Trade. This prestigious award recognises our success in international oil, gas and renewable energy markets and is JDR’s second Queen’s Award for Enterprise. This award is testament to the hard work of the JDR team and the strategy we established in 2008: to grow JDR by targeting new global markets through investment in our products, technology and infrastructure.
Finally, 2013 was the year JDR kicked off its establishment of operations in Brazil, the world’s largest subsea oil and gas market. We have a service centre in Macae to support non-Petrobras customers in the country, in step with many of our existing global frame agreements. We expect to build our Brazilian operations significantly over the next two years. This development fills out our geographic portfolio, and JDR now operates in every offshore market in our industry.
Pat Herbert, Executive Chairman. 30 September 2014
7

JDR ANNUAL REPORT 2013
CFO StatementIN 2013 WE CONTINUED OUR INVESTMENT IN PEOPLE, TECHNOLOGY AND MANUFACTURING INFRASTRUCTURE TO PREPARE FOR OUR NEXT GROWTH CYCLE.
In 2013 JDR continued to perform strongly, although not repeating the record year seen in 2012. 2013 was a year of consolidation and investment, with a 32% reduction in revenues and a 52% reduction in EBITDA in the 12 months to 31 December 2013. This is primarily caused by a temporary slowdown in the renewables market, which is expected to pick up again in 2014 as the German wind farm market recovers following the elections in 2013.
The Group changed its accounting year-end date in the prior period from 31 March to 31 December to bring the Group into line with industry practice. The financial statements attached therefore have a comparative period of nine months to 31 December 2012.
To compare similar periods in this annual report, the directors are reporting with unaudited pro forma calendar year comparatives for 2012. The directors believe that this gives a more transparent and comparable presentation for the reader. The full
pro forma calendar year results for 2012 and 2013 are shown on pages 57 to 59.
Revenue reduced from £129.9m in the 12 months to 31 December 2012 to £87.8m in the 12 months to 31 December 2013 which, combined with continued investment in technology and employees, resulted in an EBITDA of £12.3m for the year.
Operating cash flow decreased from a net inflow of £19.6m in the 12 months to 31 December 2012 to a net inflow of £6.3m in the 12 months to 31 December 2013,
continuing the strengthening of the balance sheet over the year. Net assets, at the year end, stood at £35.0m.
Having reaped the benefits of its investment in developing technologies and manufacturing infrastructure, the Group invested £4.1m in its capital expenditure programme for the year, with £2.3m of this going towards continued enhancements at JDR’s Littleport plant.
8

Financial Key Performance Indicators*
We measure a range of operational and financial metrics to help us manage our performance and achieve our business plans.
2013 2012 MovementRevenue 87.8 129.9 -32%EBITDA 12.3 25.8 -52%Order intake 97.2 112.5 -14%Operating cash flow 6.3 19.6 -68%
Order Intake
JDR saw demand for its products reduce in 2013, when compared to a record year in 2012. However, JDR has achieved an order intake CAGR of 10% since 2009. The Group expects the order intake level to return to 2012 levels in 2014/15 with strong demand for IWOCS and a recovery in renewables driving this growth. Revenue*
Year-on-year revenues decreased by 32% from £129.9m in 2012 to £87.8m in 2013. This is primarily due to a temporary slowdown in the renewables market.
The revenue mix in the year is shown in the table below.
2013 2012 MovementSPU 28.6 32.5 -12%SPC 21.6 24.7 -13%IWOCS 21.5 25.6 -16%Global Services 11.9 10.8 +10%Oil & Gas 83.6 93.6 -11%REC 4.2 36.3 -88%TOTAL 87.8 129.9 -32%
The Group’s pro forma revenue Compound Annual Growth Rate (CAGR) is at 12% over the last five years, demonstrating a strong track record of growth.
Operating Profit*
The table below reconciles operating profit to EBITDA. The major items are the depreciation charge and exceptional items, mainly relating to a strategic review of the business to consider the timing of a potential sale. This review concluded that the shareholders would continue to invest in the business to realise the opportunities available to JDR in both the oil and gas and renewable energy sectors. £’000OPERATING PROFIT 4,165Amortisation 171Goodwill 408 Depreciation 4,708
Exceptional items 2,861EBITDA 12,313
Taxation
Group trading losses carried forward from prior years have been used to offset the corporation tax charge for the year. The Group has fully utilised these losses and will be liable for the payment of corporation tax in the 2014 calendar year.
Earnings
As in previous years, the Group continues to use EBITDA as the primary measure of its financial performance, particularly in measuring underlying performance.
The Group delivered an EBITDA of £12.3m in 2013, with a CAGR of 14% over the past five years.
Dividends
The directors are not recommending the payment of a dividend in the year (2012: nil) as operating cash flow has largely been used to pay down debt and strengthen the balance sheet.
Profit Before Taxation (PBT)
Profit before taxation (PBT) for the twelve months to 31 December 2013 was £3.7m, an 80% reduction when compared to the record year ending 31 December 2012.
Cash flow and Net Debt*
Operating cash flow amounted to £6.3m in the calendar year 2013, with £3.5m of this being used to repay debt, consisting of short-term bank lending. This has helped continue the strengthening of the group balance sheet, so that net assets totalled £35.0m at 31 December 2013 (2012: £31.6m).
Reconciliation of EBITDA to net cashflow :
2013 2012EBITDA 12.3 25.8Change in working capital (6.0) (6.2)Operating cash flow 6.3 19.6Capital expenditure (4.1) (4.3)Taxation (0.3) (0.1)Net interest (0.4) (2.4)Revolving credit facility loans repaid (3.5) (1.5)Loan from parent repaid/borrowed (0.1) (11.8)Net cash flow (2.2) (0.5)
Payments to suppliers
The Group is pleased to report that it continues to pay suppliers promptly. All creditors are paid to terms.
Capital expenditure
Capital expenditure in the calendar year amounted to £4.1m, of which £0.9m related to an reconfiguration of the layout at the Littleport plant. A further £1.4m related to new machinery for the Littleport site.
Exchange rates
The Group operates in a number of different countries. However, the impact of foreign exchange rates on consolidated EBITDA is negligible as a result of the relatively low amount of income and costs recognised in the foreign entities. Where justified, Group companies seek to cover any foreign exchange exposure on customer contracts by use of forward contracts taken out on contract acceptance.
*All periods are 12 months to year-end 31 December.
9
Martin Boden Chief Financial & Compliance Officer 30 September 2014
0
5
10
15
(£’M
)
RCFHSBC
BONDING
UKEF
BONDING
0
8.27.910
1514
Headroom
Drawn
UKEF = UK Export Finance (the UK’s Export Finance Agency)
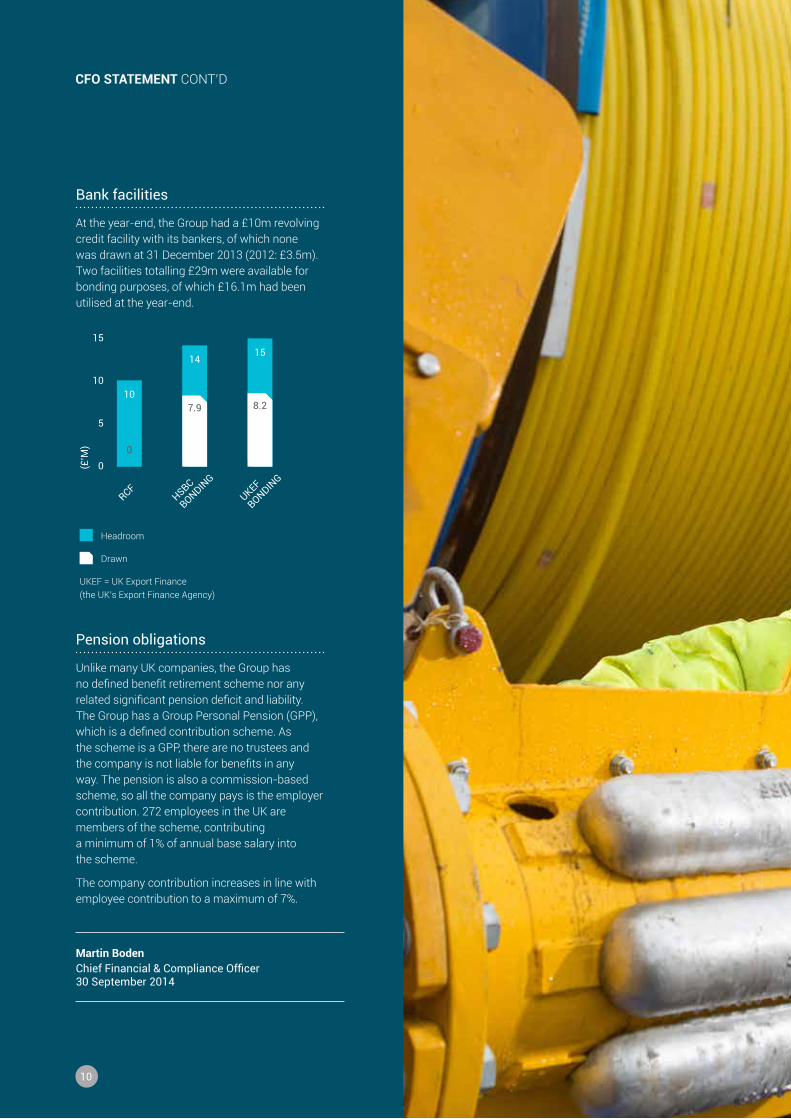
Bank facilities
At the year-end, the Group had a £10m revolving credit facility with its bankers, of which none was drawn at 31 December 2013 (2012: £3.5m). Two facilities totalling £29m were available for bonding purposes, of which £16.1m had been utilised at the year-end.
Pension obligations
Unlike many UK companies, the Group has no defined benefit retirement scheme nor any related significant pension deficit and liability. The Group has a Group Personal Pension (GPP), which is a defined contribution scheme. As the scheme is a GPP, there are no trustees and the company is not liable for benefits in any way. The pension is also a commission-based scheme, so all the company pays is the employer contribution. 272 employees in the UK are members of the scheme, contributing a minimum of 1% of annual base salary into the scheme.
The company contribution increases in line with employee contribution to a maximum of 7%.
10
CFO STATEMENT CONT’D

11

We have integrated our approach to Health, Safety and the Environment (HSE) into the JDR culture, management systems and practices; our employees are empowered to ‘own’ HSE. We also involve our clients and suppliers in the identification and implementation of industry best practice. Our approach is driving performance improvements; for example our preventative health and safety strategy resulted in a 50% reduction in people accidents in 2013.
JDR ANNUAL REPORT 2013
Health, Safety and the EnvironmentTHE JDR MISSION STATEMENT IS TO MINIMISE THE ENVIRONMENTAL IMPACT OF OUR ACTIVITIES AND PREVENT DEATH, INJURY AND ILL HEALTH TO THOSE AT WORK AND THOSE AFFECTED BY THE WORK ACTIVITIES OF JDR
Health and safety Environmental performance Sub-contractors and suppliers
we ensure all employees, visitors and contractors, wherever they may be in our global organisation, return from work uninjured.
we work to minimise any adverse environmental impacts of our business activities by continually reviewing product design and manufacturing methodologies.
all sub-contractors and suppliers are audited against our HSE requirements before they can be added to the approved supplier list.
We have achieved this by working with three guiding principles
12

JDR has a well-established HSE programme, which in 2013 developed on a number of fronts
Launch of JDR’s Golden Rules
JDR devised and launched its 12 golden HSE rules. These rules were widely publicised throughout our facilities, with each rule reinforcing an aspect of JDR’s HSE activity.
Industry Audits
We ensure that our practices are independently verified to a number of important industry standards.
Our Safety Management System is regularly verified by Lloyd’s Register Quality Assurance (LRQA), a UKAS-accredited provider of management system certification, verification and training. In 2013 LRQA visited our facilities in Hartlepool, Sattahip (Thailand) and Houston. All were successfully recertified to the OHSAS18001:2007 Safety Management Standard.
Recertification is a rolling programme and our Littleport facility was successfully recertified in August 2014.
Training
We have continued to invest in structured learning and development programmes to support our HSE development:
• Managing Safely: 42 UK-based managers and supervisors participated in the IOSH Managing Safely course. This nationally recognised programme is designed to support managers and supervisors manage health and safety within their teams.
• Behavioural Safety: we launched the DuPont STOP behavioural safety programme, which increases safety awareness and helps employees talk with each other about safety. In 2013 over 100 JDR employees took part in the training programme and over 1000 STOP observation cards were submitted.
• HSE legal compliance training: we supported employee training across forklift, abrasive wheel, first aid, crane operations, manual handling and DSE. This accounted for over 5000 training hours in 2013.
Continuous Improvement (CI)
JDR has created CI teams at its main facilities to improve our health, safety and environmental performance.
For example the Littleport CI Team introduced Communities of Practice (CoP) meetings, utilizing lean tools, to target operational improvements. The CoP teams 2013 successes include reducing braid fluff issues within extrusion, removing sheath water marks during extrusion, improving our standard operating procedures, improving hose specifications and identifying better ways of carrying out some of our daily activities.
In Hartlepool, the team has rolled out a CI programme, building on Working Group activity that captures relevant issues on each element of the manufacturing process. For example, the quality system enabled the CI team to identify materials over usage, on our armouring lines. The team, using root cause analysis, has reduced material over use; on three recent projects 29% of RP3 tape used to wrap the final cable in the armouring process was returned to stores.
The Suggestion Scheme has also identified ways to improve our HSE performance across all sites, from improvements to manual handling, to a reduction in potential hazards. The scheme enables operators to have a direct input into ideas applied on the shop floor; an approach that has had a positive response from all involved.
Recycling
We work in partnership with our authorised waste contractors to identify waste streams and recycling options. Waste created during our manufacturing processes includes copper, rope, paper, cardboard, plastic, wood, ferrous metal, nylon chippings and a range of polymers. Together we have increased recycling to over 98% of all waste generated. Looking ahead we aim to achieve a target of zero percentage to landfill.
13

PAT HERBERT Executive Chairman
Pat joined JDR in 2002 as Group Chief Executive Officer and drove the Group’s most dramatic growth since its founding in 1994. Appointed Executive Chairman in 2011 he continues to provide strategy & sales support to management. He began his career in 1976 at Smith International Inc., becoming a corporate officer in 1986. He joined Baker Hughes in 1988 as a division president with global P&L then appointed as a corporate executive officer in 1994 responsible for corporate governance, oversight of emerging markets, M&A strategies and leading market and technology development.
ANDREW RICH Non-Executive Director
Andrew is a Partner at Vision Capital having joined in 2007. In addition to JDR he sits on boards at Nordax Finans, Park Cake, Pork Farms, Fletchers Bakeries and the Advisory Board of Trio LLP (holding company for ABL, MG and SwissHaus). Previously he spent three years at Lazard and five years at Arthur Anderson/Deloitte where he qualified as a chartered accountant.
MARTIN BODEN Chief Financial & Compliance Officer
Martin joined JDR from Betty’s & Taylors where he was Chief Financial Officer for 18 months. Martin previously worked as Group Finance Director at Genus plc, and for Great Universal Stores, Zurich Financial Services (UKISA), NatWest UK and WH Smith.
JDR ANNUAL REPORT 2013
JDR Board of Directors
14

JONATHAN GUEST Non-Executive Director
Jonathan joined the JDR Board in 2014. He is an Associate at Vision Capital and has portfolio responsibilities including BrightHouse, JDR, CPL Industries and Elegant Hotels Group. Previously, Jon was at Nomura in the UK Financial Institutions Group investment banking team and qualified as a Chartered Accountant with Ernst & Young in 2008.
BOB SOLBERG Non-Executive Director
Bob joined JDR as Chairman in 2004, stepping down to become a Non-executive director in 2012. For over 30 years Bob held increasingly responsible positions with Texaco, becoming president of Texaco Inc’s Worldwide Development division from 1998 until his retirement in 2002. Since then he has served on a number of boards including Pioneer Natural Resources, helping the company triple its market capitalization, Scorpion Offshore Ltd and Hyperdynamics, both of which he took to successful IPOs.
15

JDR ANNUAL REPORT 2013
JDR Executive Management Team
PAT HERBERT Executive Chairman
MARTIN BODEN Chief Financial & Compliance Officer
CRAIG EWING Business Systems Director
Craig joined JDR in 2011 from TNT Post UK where he was IT Director. Craig’s IT experience spans a number of world class organisations in the B2B, logistics and construction sectors and has included roles with Parcelforce Worldwide, Wallenius Wilhelmsen Logistics and the Miller Group.
JAMES YOUNG Engineering Director
James joined JDR in April 2000 as a Senior Design Engineer for new product development. He was appointed Engineering Director in November 2011 after a series of technical management roles within the business. Prior to JDR, James worked for BICC and Dowty. James has a degree in Mechanical Engineering, is a Chartered Engineer and has an MBA from Cranfield.
CHARLIE BACKHOUSE Global Services Director
Charlie joined JDR in 2014 and leads the global service and support team. Before JDR he was General Manager of Heil Farid and Oceanering Multiflex in the UK. He has over 20 years of experience in oil, petrochemical, power and nuclear markets, which has included roles at the Weir Group and David Brown Pumps. Charlie has a degree in Mechanical Engineering and an MBA.
See Board of Directors on previous pages
16

RICHARD TURNER Chief Operating Officer
Richard joined JDR in 2014 to head up JDR’s global manufacturing, product management and supply chain functions. He joined JDR from Technip/DUCO, where, as Vice President Global Manufacturing & Planning, he led the organisation through a period of significant investment and growth. Previously Richard worked in the construction equipment industry with Komatsu and Terex. He has a Mechanical Engineering degree and MBA from Durham.
PAUL GAHM Executive Vice-President Sales & Marketing
Paul joined JDR in 2005 with responsibility for Business Development, Marketing and Strategic planning. Formerly with Oceaneering’s Multiflex Division, Paul has held various senior management positions throughout Europe and the US.
LOUISE CLIFTON Head of HR
Louise joined JDR in 2012 and is responsible for Human Resources and Health, Safety & Environment. Louise joined from PPG Industries, and has also held key HR positions in Random House, Grampian Foods, British Steel and Bosch. Louise has a degree in Sociology with Industrial Relations and is a Chartered member of the CIPD.
17

Principal Activities
The principal activities of the Group are the design and manufacture of umbilical systems and subsea power cables for the offshore oil and gas and renewable energy industries and the provision of offshore support services. These products are some of the essential components for the development and production of offshore oil and gas and the delivery of energy derived from offshore wind farms. The group has an international manufacturing footprint with facilities in Littleport (Cambridgeshire) and Hartlepool in the UK, and Sattahip in Thailand.
The principal activity of the company is to act as a holding company. The subsidiary undertakings principally affecting the profits or net assets of the Group in the period are listed in note 9 to the financial statements.
Year End Change
In the previous reporting period, the Group and company changed the accounting year end from 31 March to 31 December. Pro forma calendar results can be found in the appendix to the financial statements on pages 57 to 59.
Results and Dividends
The Group’s sales for the 12 month period to 31 December 2013 amounted to £87,757,000 (nine months to 31 December 2012: £83,628,000). The company’s net profit for the 12 month period to 31 December 2013 amounted to £3,308,000 (nine months to 31 December 2012: £12,236,000) and has been transferred to reserves. The directors do not recommend the payment of a dividend (2012:£nil).
£3,308,000
£87,757,000
Net Profit
Group Sales
JDR ANNUAL REPORT 2013
Directors’ Report
The directors present their report and the audited financial statements of the Group and of the company for the 12 months ended 31 December 2013.
12 month period to 31December 2013
(nine months to 31 December 2012: £12,236,000)
12 month period to 31December 2013
(nine months to 31 December 2012: £83,628,000)
18

Substantial Shareholders
The share capital of the ultimate holding company is owned by funds advised by Vision Capital LLP, Goldman Sachs and management
Directors
The directors who held office during the period and at the date of this report were as follows:
• Pat Herbert Executive Chairman
• Andrew Norman Chief Executive Officer (resigned as Director of the company 30 September 2014)
• Martin Boden Chief Financial & Compliance Officer
• Peter Sayles Chief Operations Officer (resigned as a director of the company on 15 November 2013)
• Andrew Rich Investor Director
• Johan Van de Steen Investor Director (resigned as a director of the company on 24 January 2014)
• Jonathan Guest Investor Director (appointed to the Board on 24 January 2014)
• Robert Solberg Non-executive Director
Directors’ IndemnityAs permitted by the Companies Act 2006, the Company has indemnified the Directors and officers in respect of proceedings that may be brought by third parties and such indemnification was in place during the year. Neither the Company’s indemnity nor insurance provides cover in the event that a Director or officer is proved to have acted fraudulently
or dishonestly.
Employment Policy and InvolvementThe Board believes that the group’s success is due to the quality and commitment of its workforce. The Group’s employee management priorities, including its remuneration strategies, are based on recruiting and retaining the best people in the industry and encouraging working practices that improve productivity, reduce costs, develop talent and provide job satisfaction. Further, the Board recognises the need for communication with employees at every level and is committed to ongoing interaction with all its employees. This is achieved in a number of ways, including regular newsletters from the Chief Executive Officer, and frequent “all hands” presentations by the Executive Management Team to groups of staff at all company locations. During the period, JDR employed, on average, 453 employees, excluding contractors, who were based in UK, Houston, Thailand, Germany and Singapore.
The Group is committed to a policy of equal opportunity in matters relating to employment, training and career development, and is opposed to any form of less favourable treatment afforded on the grounds of age, disability, sex, marital status, sexual orientation, nationality, race or religion.
Disabled EmployeesApplications for employment for disabled persons are always fully considered, bearing in mind the abilities of the applicant concerned. In the event of members of staff becoming disabled, every effort is made to ensure that their employment with the Group continues and that appropriate training is arranged. It is the policy
of the Group that the training, career development and promotion of disabled persons should, as far as is possible, be identical to that of other employees.
Community InvolvementJDR supports a range of initiatives within its local communities in the UK. At both the Littleport and Hartlepool sites, the JDR workforce selects and supports a local charity each year. In 2013 the Hartlepool team supported the Hartlepool and District Hospice, raising £14,487. In Littleport JDR employees supported Scotty’s Little Soldiers, raising £1,100.
JDR also supports the local business community, sponsoring business awards in Littleport and Hartlepool. These awards strengthen JDR’s links in area, raising awareness of JDR’s contribution to the local economy.
AuditorsThe auditors, Grant Thornton UK LLP, have indicated their willingness to continue in office and appropriate arrangements have been put in place for them to be deemed reappointed as auditors in the absence of an annual general meeting.
Walker ReportThis report has been prepared in the context of the report dated 20 November 2007, Guidelines for Disclosure and Transparency in Private Equity.
BY ORDER OF THE BOARD: Martin Boden, Director. 30 September 2014
19

Business Review
A full review of JDR’s business performance can be found in the Chairman and Chief Financial Officer’s reports on pages four to 10. The Group continues to invest in its people and in research and development, and more details can be found in the report on page four. The directors regard investment in its people and in research and development as a prerequisite for success in the medium to long-term future.
A review of the business of the Group during the year ended 31 December 2013, the position of the Group as at 31 December and a description of the principal risks and uncertainties facing the Group can be found on pages 26 to 27.
Key Performance Indicators
We measure a range of operational and financial metrics to help us manage our performance and achieve our business plans: revenue, earnings before interest tax, depreciation and amortisation (EBITDA), order intake and cash flow.
9 mths (Decrease) 2013 2012 /Increase
£’M £’M £’M
Revenue 87.8 83.6 4.2 EBITDA 12.3 17.6 (5.3) Order intake 97.2 71.7 25.5 Operating cash flow 6.3 22.0 (15.7)
We also track non-financial metrics across the business. As our people have been at the heart of our success as a business, we focus on tracking the safety and satisfaction of our employees.
Financial Risk Management
The Group’s activities expose it to a number of financial risks including credit risk, cashflow and foreign exchange risk, and liquidity risk. The use of financial derivatives is controlled by the Board and finance
function. The Group does not use derivative financial instruments for speculative purposes.
(a) Cashflow and foreign exchange risk
The Group’s activities expose it primarily to the financial risks of changes to foreign currency exchange rates, although revenues and costs are matched where possible. The Group uses foreign exchange forward contracts where necessary to hedge residual material exposures.
(b) Credit risk
The Group’s principal financial assets are bank balances and cash, and trade and other receivables. The Group’s credit risk is primarily attributable to its trade receivables. The amounts presented in the balance sheet are net of allowances for doubtful receivables. The Group has no significant concentration of credit risk, with exposure spread over a large number of counterparties and customers, most of which have high credit ratings.
(c) Liquidity risk
The Group uses a mixture of long-term and short-term debt finance to ensure that sufficient funds are available for ongoing operations and future developments.
Future Developments
In 2013 JDR reviewed and updated its strategy for its oil & gas and renewables activity. The next stage of JDR’s growth will focus in three key areas:
• Introduction of new products and technology: next generation products and differentiating technologies
• Regional Growth: targeting Brazil, North Sea and Asia pacific
• Development of Internal Capabilities: investing in management skills and infrastructure to support growth plans.
JDR ANNUAL REPORT 2013
Strategic Report
£87,757,000Revenue
£12,313,000EBITDA
£97,177,000Order intake
£6,278,000Operating cash flow
BY ORDER OF THE BOARD: Martin Boden, Director. 30 September 2014
20

The UK Corporate Governance Code
As a privately-owned company, JDR is not required to comply with the Code but seeks to abide by the spirit of its principles. The UK Code is being used to update a range of JDR policy statements.
Role of the Executive Chairman
As Executive Chairman, Pat Herbert is ultimately responsible for appraising the Board of all matters affecting the Group and its performance. He is also responsible for the effective operation and chairing of the Board and ensuring that all directors are able to play a full part in its activities. The Chairman ensures effective communication with shareholders and that all the Board members are aware of the views of the shareholders.
Board of Directors
JDR’s Board consists of an Executive Chairman, Chief Executive Officer, Chief Financial & Compliance Officer, two investor directors and one non-executive director. The Board believes that it has the appropriate balance of skills, experience, independence and knowledge of the company to enable it to discharge its duties and responsibilities effectively.
The directors update their skills, knowledge and familiarity with the company by attending appropriate external seminars and training courses, meeting with senior management and visiting the regional offices and manufacturing plants.
The Board is responsible to the shareholders for the success of the Group and determines the Group’s long-term direction, business objectives, key policies and strategy.
The Board also monitors business performance and reviews risk controls. The Board has delegated authority for all day-to-day management of the Group’s affairs to the Executive Management Team, details of which can be found on page 16.
The Board had a programme of 10 board meetings in the 12-month period, plus an additional strategy day. The Board is provided with monthly and timely information on the financial performance of the business, together with reports on operational matters, market conditions, competitor environment and other relevant issues. The directors have equal voting rights when making decisions, except the Executive Chairman who has a casting vote. All directors have access to the advice and services of the company secretary and may, if they wish, take professional advice at the Group’s expense.
JDR ANNUAL REPORT 2013
Corporate Governance
“The Board is firmly committed to achieving the highest standards of corporate governance. We take seriously our responsibility in demonstrating leadership in good governance practices that ultimately informs the decisions and actions of our employees during their day-to-day work.
“The Board is ambitious in growing the company and is actively improving its governance tools and training for our people. This will in turn enable us to achieve our strategic objectives, create value for our shareholders and build a sustainable business for the long-term.”
Pat Herbert Executive Chairman
21

Activities of the Board in 2013
During the year, the Board approved and endorsed:
• The Annual Report and Accounts
• Group budgets
• Strategic plans and priorities, including repayment of debt and investor’s loans
• Capital allocation and investment priorities
• The acceptance of high-value or high-risk orders
Committees and their activities in 2013
The Board delegates certain governance responsibilities to Board Committees and these are detailed below.
Audit CommitteeThe Audit Committee is chaired by Andrew Rich, investor director and a chartered accountant, and includes Pat Herbert, Executive Chairman, and the Chief Executive Officer. The Board remains satisfied that the recent and
relevant financial experience of the Audit Committee Chairman, together with members Pat Herbert and the Chief Executive Officer, enables the Committee to discharge its duties.
The Committee met four times in the period and reported its conclusions to the Board after every meeting. The Chief Financial & Compliance Officer attended every meeting.
The Committee has fully defined terms of reference, which are reviewed annually. The terms of reference outline the Committee’s objectives and responsibilities relating to financial reporting, internal controls, risk management, and the application of appropriate accounting standards and procedures. Specific responsibilities include reviewing and recommending for approval the annual financial statements, reviewing the Group’s accounting policies, reviewing the effectiveness of internal controls, and reviewing the scope and results of the external audit.
The Chief Financial and Compliance Officer has responsibility for improving the suite of corporate
governance policies and procedures, including a code of ethics, anti-bribery and corruption and the confidential reporting hotline.
The Committee also monitors the independence and objectivity of Grant Thornton, the external auditors, by agreeing the level of their remuneration and the extent of their non-audit services.
Remuneration Committee
The remuneration committee is chaired by Pat Herbert. The Committee has defined terms of reference, which are reviewed annually. The Committee is responsible for making recommendations to the Board concerning the remuneration strategy, recruitment framework and long-term incentive plans for the business.
During 2013, the Committee:
• Approved bonuses
• Reviewed the salary levels and increases for all staff
TYPE OF MEETING:
Number of meetings held in 12 month period
Number of meetings attended by:Pat Herbert Executive Chairman
Martin Boden Chief Financial & Compliance Officer
Robert Solberg Non-Executive Director
Andrew Rich Investor Director
BOARD COMMITTEE
10
10
10
10
10
BUSINESS UPDATES
2
2
2
1
2
AUDIT COMMITTEE
4
4
(4)
-
4
REMUNERATION COMMITTEE
4
4
(1)
4
4
HSE
2
-
(1)
2
2
Note: A dash indicates a director is not a member of a board committee. ( ) Brackets mean attendance by invitation, not as a member.
22
CORPORATE GOVERNANCE CONT’D

Health, Safety and Environmental (HSE) Committee
The Health, Safety and Environmental Committee is chaired by Robert Solberg. The Committee has a mandate to maintain a comprehensive overview of the policies, practices and performance of the group in respect of health, safety and the environment. Conclusions and recommendations from the committee are reported directly to the Board.
During 2013, the Committee reviewed the accident and incident figures, encouraged the continued success of various health and safety initiatives and considered resourcing.
Executive Management Team (EMT)
The Executive Management Team has responsibility for the day-to-day running of the Group and meets weekly. At this meeting, all members of the team give a brief report over their individual areas of responsibility.
How we communicate with our shareholders
Funds advised by Vision Capital LLP are the largest shareholder in the Group and two investor directors have non-executive positions on the Board. The Executive Chairman, Chief Executive Officer and Chief Financial & Compliance Officer have a continuing dialogue with the shareholders. In addition, Goldman Sachs, as a minority shareholder, receives all board documents.
Statement of Directors’ Responsibilities
The directors are responsible for preparing the annual report and the financial statements in accordance with applicable law and regulations. The Directors’ Report can be found on pages 18 to 19.
Company law requires the directors to prepare financial statements for each financial year. Under that law,
the directors have elected to prepare financial statements in accordance with United Kingdom Generally Accepted Accounting Practice (UK Accounting Standards and applicable law). The financial statements are required by law to give a true and fair view of the state of affairs of the Group and Parent Company and of the profit or loss of the Group for that period. In preparing these financial statements, the directors are required to:
• Select suitable accounting policies and then apply them consistently
• Make judgements and estimates that are reasonable and prudent
• State whether applicable UK Accounting Standards have been followed, subject to any material departures disclosed and explained in the financial statements, and
• Prepare the financial statements on the going concern basis unless it is inappropriate to presume that the Group will continue in business.
The directors are responsible for keeping adequate accounting records that disclose with reasonable accuracy at any time the financial position of the Group and enable them to ensure that the financial statements comply with the Companies Act 2006. They are also responsible for safeguarding the assets of the Group and hence for taking reasonable steps for the prevention and detection of fraud and other irregularities.
In so far as each of the directors is aware:
• There is no relevant audit information of which the Group’s auditors are unaware; and
• The directors have taken all steps that they ought to have taken to make themselves aware of any relevant audit information and to establish that the auditors are aware of that information.
The directors are responsible for the maintenance and integrity of the corporate and financial information included on the Group’s website. Legislation in the UK governing the preparation and dissemination of financial statements may differ from legislation in other jurisdictions.
The Board takes ultimate responsibility for the Group’s systems of risk management and internal controls and for reviewing their effectiveness. The Group’s principal risks and uncertainties and how they are mitigated are summarised on pages 26 to 27.
The Group’s systems and controls are designed to manage, rather than eliminate, the risk of failure to achieve business objectives, and can only provide reasonable and not absolute assurance against material misstatement or loss.
The key features of the Group’s system of internal controls are:
• An established management structure operating throughout the group with defined levels of responsibility and delegation of authorities
• Operating guidelines and systems with authorisation limits set at appropriate levels
• A comprehensive budgeting and forecasting system, which is regularly reviewed and updated
• Monthly management reporting including regular comparison of actual results against latest forecasts
• Regular reporting from project managers on the performance and ongoing risks of every project
• Approval of investment and capital expenditure decisions
• Regular monitoring, review and reporting of health, safety and environmental matters.
Going Concern
As described above, the directors have a reasonable expectation that the Group has adequate resources to continue in operational existence for the foreseeable future. For this reason, they continue to adopt the going concern basis in preparing the financial statements. In forming this view, the directors have reviewed the Group’s budgets, plans and cashflow forecasts, and the existing banking facilities.
23
CORPORATE GOVERNANCE CONT’D


“The effective management of risks within the Group is essential in helping us achieve our vision of growth and customer service.”
Martin Boden Chief Financial & Compliance Officer
Risk Management is Fundamental to Sustainable Growth
Risk management is key to delivering project success for our customers and driving sustainable growth for our stakeholders. Our customers require us to provide solutions, and we must overcome a number of risks to do this safely, on-time and on-budget.
The diagram to the left shows the risk management process within the Group. The Board leads the discussions relating to risk and provides direction. This approach is cascaded down the Group through the Executive Management Team, line managers and individual project teams.
Ongoing Risk Management
JDR involves our customers and partners in agreeing risk matters and how these are best mitigated. Although risk is managed constantly on every one of our projects, we also have risk management discussions across the Group at the following key checkpoints when:
• Discussing and agreeing the business strategy
• Bidding for new work
• Planning for projects
• Monitoring existing projects
• Reviewing business performance
At JDR, risk management is an essential part of our business operations. Risk is not outsourced to a specialist team but is integrated into our processes and owned by everyone. However, the business is not complacent and we are making
efforts to improve certain areas, such as corporate risk reporting, business continuity and compliance.
Specific Risk Management
The business has experienced significant growth over the past two years, and this brings its own challenges to ensure we have the capacity to deliver to our high standards. We have focused on developing and standardising our internal processes and systems, as well as expanding and streamlining our production capacity.
The importance of the order book is key and we have invested in developing our usage of our customer relationship management system and improving communications between the sales and operations functions. The increasing size of the business also requires more focus on corporate governance and matters such as training on anti-bribery and corruption and competition law.
JDR ANNUAL REPORT 2013
Risk Management Report
IDENTIFYOPPORTUNITIES AND
RISKS
ACCESS AND QUANTIFYBENEFITS AND RISKS
DEVELOPACTION PLAN TO MITIGATE RISK
ONGOING REVIEWOF RISK
DEFINEBUSINESS OBJECTIVES
26

RiskEconomic Environment Our customers may cancel, postpone or reduce existing or future projects due to the effects of global economic conditions and the price of oil.
Order intake We may not be successful at winning bids for new work, or bid errors/decisions adversely affect performance.
Project Delivery Projects may not be delivered to our high standards of safety, on time, on budget and to the required quality.
People We may not be able to attract or retain employees with the right qualification, skills, experience, competence and values to meet our current and future needs.
Finance and Liquidity Cash and longer-term financing may reduce if cash is not collected, capital expenditure not managed, and costs not controlled.
Information Technology We may not have the right systems to manage our business in a controlled and efficient way, or these systems may fail.
Potential Impact Significant changes in customer spending or investment plans may adversely affect our order book, and ultimately revenue and profit.
Not winning work, or winning work at low margins, so adversely affecting order book and margins
May affect the profitability and reputation of the Group and ability to secure repeat work.
Failure to meet our customers’ expectations and contractual commitments and limit our capability to meet future growth plans.
Reduced growth and expansion opportunities.
Workflows are inefficient or are interrupted.
Mitigation Focus on repeat business and strategic clients. Broaden product type. Exploration of new markets. Strengthen aftercare offer.
Significant attention is given to bidding to ensure we meet customer needs and manage the risks. Defined authority levels for bid approval and order acceptance.
Mitigated by allocating the right people, operating controlled processes and rigorous and regular project reviews.
We use vigorous selection techniques and a bespoke competency framework to support our hiring decisions. All employees undertake performance and development reviews, supported by robust Learning & Development plans to ensure that they have the right skills to meet both current and future needs and demonstrate desirable behaviours. We have a market-based compensation and benefits structure to help us attract and retain key valued employees.
Balance sheet and cash management is closely controlled by our Finance team, including frequent reporting, cash forecasting, working capital, and investment analysis. Banking facilities provide headroom should it be needed.
Strong management of function and control over applications and ERP system. IT recovery plans. Continued investment through capital expenditure plans.
PrinciPal risks
27

We have audited the financial statements of JDR Cable Systems (Holdings) Limited for the year ended 31 December 2013 which comprise the group and parent company profit and loss account, the group and parent company balance sheets, the group cash flow statement, and the related notes on pages 35 to 56. The financial reporting framework that has been applied in their preparation is applicable law and United Kingdom Accounting Standards (United Kingdom Generally Accepted Accounting Practice).
This report is made solely to the company’s members, as a body, in accordance with Chapter 3 of Part 16 of the Companies Act 2006. Our audit work has been undertaken so that we might state to the company’s members those matters we are required to state to them in an auditor’s report and for no other purpose. To the fullest extent permitted by law, we do not accept or assume responsibility to anyone other than the company and the company’s members as a body, for our audit work, for this report, or for the opinions we have formed.
Respective responsibilities of directors and auditor
As explained more fully in the Directors’ Responsibilities Statement, the directors are responsible for the preparation of the financial
statements and for being satisfied that they give a true and fair view. Our responsibility is to audit and express an opinion on the financial statements in accordance with applicable law and International Standards on Auditing (UK and Ireland). Those standards require us to comply with the Auditing Practices Board’s (APB’s) Ethical Standards for Auditors.
Scope of the audit of the financial statements
A description of the scope of an audit of financial statements is provided on the Financial Reporting Council’s website at www.frc.org.uk/apb/scope/private.cfm.
Opinion on financial statements
In our opinion the financial statements:
• give a true and fair view of the state of the group’s and of the parent company’s affairs as at 31 December 2013 and of the group’s profit for the year then ended;
• have been properly prepared in accordance with United Kingdom Generally Accepted Accounting Practice; and
• have been prepared in accordance with the requirements of the Companies Act 2006.
Opinion on other matter prescribed by the Companies Act 2006
In our opinion the information given in the Strategic Report and Directors’ Report for the financial year for which the financial statements are prepared is consistent with the financial statements.
Matters on which we are required to report by exception
We have nothing to report in respect of the following matters where the Companies Act 2006 requires us to report to you if, in our opinion:
• adequate accounting records have not been kept by the parent company, or returns adequate for our audit have not been received from branches not visited by us; or
• the parent company financial statements are not in agreement with the accounting records and returns; or
• certain disclosures of directors’ remuneration specified by law are not made; or
• we have not received all the information and explanations we require for our audit.
JDR ANNUAL REPORT 2013
Independent Auditor’s Report Independent auditor’s report to the members of JDR Cable Systems (Holdings) Limited
Paul Naylor, Senior Statutory Auditor
for and on behalf of Grant Thornton UK LLP, Statutory Auditor, Chartered Accountants, Cambridge
30 September 2014
28

Profit and Loss Account 30
Balance Sheet 32
Cash Flow Statement 34
Notes to the Financial Statements 35
Appendix – 57 Unaudited Pro Forma Summary Financial Statements
Financial Statements and Notes to the Financial Statements
29

GROUP PROFIT AND LOSS ACCOUNT FOR THE YEAR ENDED 31 DECEMBER 2013
Revenue
Cost of sales
Gross profit
Administrative expenses
Administrative expenses - exceptional
Operating profit before goodwill amortisation
Goodwill amortisation
Operating profit
Interest payable and similar charges
Profit on ordinary activities before taxation
Tax charge on profit on ordinary activities
Profit for the financial period
The accompanying accounting policies and notes from an integral part of these financial statements.
2
3
3
7
3
5
6
19
NOTE
87,757
(56,952)
30,805
(23,371)
(2,861)
4,573
(408)
4,165
(442)
3,723
(415)
3,308
12 MTHS TO 31 DEC 2013
£’000
83,628
(52,082)
31,546
(17,410)
(300)
13,836
(306)
13,530
(231)
13,299
(1,063)
12,236
9 MTHS TO 31 DEC 2012
£’000
GROUP STATEMENT OF TOTAL RECOGNISED GAINS AND LOSSES FOR THE YEAR ENDED 31 DECEMBER 2013
Retained profit for the financial period
Exchange rate (loss)/gain
Total gains and losses recognised since the last financial statements
3,308
(2)
3,306
12MTHS TO 31 DEC 2013
£’000
12,236
11
12,247
9 MTHS TO 31 DEC 2012
£’000
30
FINANCIAL STATEMENTS GROUP P&L

COMPANY PROFIT AND LOSS ACCOUNT FOR THE YEAR ENDED 31 DECEMBER 2013
Net operating income
Administrative expenses - exceptional
Interest receivable and similar charges
Operating (loss) / profit
(Loss) / Profit on ordinary activities before taxation
Tax credit/(charge) on profit on ordinary activities
(Loss) / Profit for the financial period
All operations are continuing.
The company has no recognised gains and losses other than the profit above and therefore no separate statement of total recognised gains and losses has been presented.
The accompanying accounting policies and notes form an integral part of these financial statements.
There is no difference between the profit on ordinary activities and retained profit for the financial year stated above and their historical cost equivalents.
5
3
6
19
NOTE
99
(2,164)
67
(1,998)
(1,998)
-
(1,998)
12 MTHS TO 31 DEC 2013
£’000
617
-
139
756
756
-
756
9 MTHS TO 31 DEC 2012
£’000
31
FINANCIAL STATEMENTS COMPANY P&L

Fixed assets
Intangible assets
Tangible assets
Current assets
Stock
Debtors
Cash at bank and in hand
Creditors – amounts falling due within one year
Net current assets
Total assets less current liabilities
Creditors – amounts falling due after more than one year
Provisions for liabilities
Net assets
Capital and reserves
Called up share capital
Share premium account
Profit and loss account
Total equity shareholders’ funds
GROUP BALANCE SHEET AS AT 31 DECEMBER 2013
The financial statements on pages 30 to 56 were approved by the board of directors on 30 September 2014 and were signed on its behalf by:
Martin Boden Director Registered Number SC186919
The accompanying accounting policies and notes form an integral part of these financial statements.
7
8
10
11
12
13
16
17
18
19
20
NOTE
2,552
33,143
35,695
17,468
27,895
537
45,900
(28,813)
17,087
52,782
(13,561)
(4,268)
34,953
28,360
904
5,689
34,953
31 DEC 2013£’000
2,954
34,264
37,218
15,146
33,463
2,701
51,310
(40,531)
10,779
47,997
(13,878)
(2,472)
31,647
28,360
904
2,383
31,647
31 DEC 2012£’000
32
FINANCIAL STATEMENTS GROUP BALANCE SHEET

COMPANY BALANCE SHEET AS AT 31 DECEMBER 2013
Fixed assets
Tangible assets
Investments
Current assets
Debtors – amounts falling due within one year
Debtors – amounts falling due after one year
Cash at Bank
Creditors – amounts falling due within one year
Net current assets
Total assets less current liabilities
Creditors – amounts falling due after more than one year
Net assets
Capital and reserves
Called up share capital
Share premium account
Profit and loss account
Total equity shareholders’ funds
The accompanying accounting policies and notes form an integral part of these financial statements.
The financial statements on pages 30 to 56 were approved by the board of directors on 30 September 2014 and were signed on its behalf by:
Martin Boden Director Registered Number SC186919
8
9
11
11
12
13
17
18
19
20
NOTE
-
21,140
21,140
24,050
4,609
22
28,681
(191)
28,490
49,630
(11,380)
38,250
28,360
904
8,986
38,250
31 DEC 2013 £’000
-
21,242
21,242
30,847
4,437
10
35,294
(4,808)
30,486
51,728
(11,480)
40,248
28,360
904
10,984
40,248
31 DEC 2012£’000
33
FINANCIAL STATEMENTS COMPANY ONLY BALANCE SHEET

GROUP CASH FLOW STATEMENT FOR YEAR ENDED 31 DECEMBER 2013
Net cash inflow from operating activities
Returns on investments and servicing of finance
Interest paid
Interest received
Net cash outflow from returns on investments and servicing of finance
Taxation
Capital expenditure and financial investments
Purchase of intangible assets
Disposal of tangible fixed assets
Purchase of tangible fixed assets
Net cash outflow from capital expenditure and financial investments
Financing
Decrease in borrowings
Government grant received
Decrease in loan from parent company
Net cash outflow from financing
(Decrease)/Increase in net cash
21
NOTE
NOTE
6,278
(442)
-
(442)
(261)
(183)
-
(3,956)
(4,139)
(3,500)
-
(100)
(3,600)
(2,164)
12 MTHS TO 31 DEC 2013
£’000
31 DEC 2013£’000
22,018
(231)
-
(231)
(52)
(446)
8
(2,702)
(3,140)
(18,568)
203
-
(18,365)
230
RECONCILIATION TO NET DEBT
Net debt at 1 January 2013 and 1 April 2012
(Decrease)/Increase in net cash in the period
Movement in borrowings
Other non-cash changes
Net debt at 31 December
22
22
22
(12,279)
(2,164)
3,600
-
(10,843)
(31,077)
230
18,568
-
(12,279)
9 MTHS TO 31DEC 2012
£’000
31 DEC 2012£’000
34
FINANCIAL STATEMENTS GROUP CASH FLOW

Going concern basis
The company’s business activities, together with the factors likely to affect its future development, performance and position are set out in the Directors’ Report. The financial position of the company, its cash flows, liquidity position and borrowing facilities are described in the Directors’ Report and Strategic Report. In addition, notes (a) to (c) in the Financial Risk Management section of the Strategic Report (page 20) include the company’s objectives, policies and processes for managing its capital; its financial risk management objectives; details of its financial instruments and hedging activities; and its exposures to credit risk and liquidity risk.
The company has considerable financial resources together with
long-term contracts with a number of customers and suppliers across different geographical areas and industries. The company has also benefited from the continued support of both Vision Capital LLP and HSBC and the directors are confident that this support will continue in the future. As a consequence, the directors believe that the company is well placed to manage its business risks successfully.
The directors have a reasonable expectation that the company has adequate resources to continue in operational existence for the foreseeable future. Thus they continue to adopt the going concern basis of accounting in the preparing the annual financial statements.
The financial statements have been prepared under the historical cost convention and in accordance with the Companies Act 2006 and in accordance with applicable accounting standards. The principal accounting policies are set out below.
1. ACCOUNTING POLICIES
JDR ANNUAL REPORT 2013
Notes to the Financial Statements for the year ended 31 December 2013
35
FINANCIAL STATEMENTS NOTES - YEAR ENDED DECEMBER 2013

Basis of consolidation
The Group financial statements incorporate the financial statements of the company and all of its subsidiary undertakings up to the end of the financial period. The results of the subsidiaries acquired or disposed of in the year are included in the consolidated profit and loss account from the date of acquisition or up to the date of disposal.
Revenue
Revenue is measured at the fair value of the consideration received or receivable and represents amounts receivable for goods and services provided in the normal course of business.
Significant cables and umbilicals are accounted for using the percentage-of-completion method. Under the percentage-of-completion method, we recognise estimated contract revenue based on costs incurred to date as a percentage of total estimated costs.
When the outcome of a significant cable order cannot be estimated reliably, contract revenue is recognised to the extent of contract costs incurred that are expected to be recoverable. Contract costs are recognised as expenses in the period in which they are incurred. When it is probable that the total contract costs will exceed total contract revenue, the expected loss is recognised as an expense immediately.
The preconditions for revenue recognition for non-significant umbilicals are:
(i) A complete deliverable product or service exists and corresponds with a priced item on the customer contract or purchase order;
(ii) The product has passed the contractual final factory acceptance test agreed with the client or the service deliverable has been completed to the client’s satisfaction;
(iii) The product or service is available for client uplift, or has been dispatched if this is within JDR’s scope of supply; and
(iv) Collectability of the revenue is reasonably assured.
Revenue is stated net of associated sales tax.
Goodwill
Goodwill is disclosed as an intangible asset stated at cost less accumulated amortisation. Amortisation is provided in equal instalments over 20 years. Goodwill balances are assessed for possible impairment whenever events or changes in circumstances indicate impairment may have arisen and are written down to the directors’ estimates of their fair values accordingly.
Research and development
Expenditure on new product development is capitalised where the cost incurred has resulted in a product that the directors believe has a commercially viable future. Capitalised development costs are disclosed as intangible assets stated at cost less accumulated amortisation. Amortisation is provided in equal instalments over 5 years, the expected economic life of the new products.
Government grants
Government grants are of a capital nature and are released to the profit and loss account over the expected useful life of the related asset in accordance with SSAP4.
Other intangibles
Investments in key business software and licenses has been capitalised as intangible assets and are written off over their expected economic life of 5 years.
Tangible assets
Tangible assets are stated at cost less accumulated depreciation. Depreciation is provided in equal instalments over their estimated useful lives by using the following rates:
Leasehold Improvements 10-15 years
Plant and equipment 5-15 years
Computer equipment 5 years
Office furniture and equipment 5 years
Assets in the course of construction Not depreciated
The company undertakes a review for impairment of fixed assets if events or changes in circumstances indicate that the carrying amount may not be recoverable. To the extent that the carrying amount exceeds the recoverable amount, that is the higher of net realisable value and value in use, the fixed asset is written down to its recoverable amount.
Stock
Stock is stated at the lower of cost and net realisable value.
FINANCIAL STATEMENTS NOTES - YEAR ENDED DECEMBER 2013
1. ACCOUNTING POLICIES (Cont’d)
36

Financial instruments
Financial liabilities and equity instruments are classified according to the substance of the contractual arrangements entered into. An equity instrument is any contract that evidences a residual interest in the assets of the entity after deducting all of its financial liabilities.
Where the contractual obligations of financial instruments (including share capital) are equivalent to a similar debt instrument, those financial instruments are classed as financial liabilities. Financial liabilities are presented as such in the balance sheet. Finance costs and gains or losses relating to financial liabilities are included in the profit and loss account. Finance costs are calculated so as to produce a constant rate of return on the outstanding liability.
Where the contractual terms of share capital do not have any terms meeting the definition of a financial liability then this is classified as an equity instrument. Dividends and distributions relating to equity instruments are debited direct to equity.
Investments
Investments are stated at cost less provision for impairment where necessary to reduce book value to recoverable amount. Cost is purchase price including acquisition expenses.
Finance leases and hire purchase agreements
Assets purchased under finance leases or hire purchase agreements are capitalised in the balance sheet and are depreciated over the lesser
of their estimated useful lives and the period of the agreement. The interest element of the rental obligations is charged to the profit and loss account over the period of the contract on a straight line basis and the capital element of future rentals is treated as a liability.
Operating leases
Expenditure on operating leases is charged to the profit and loss account on a basis representative of the benefit derived from the asset, normally on a straight-line basis over the lease period.
Foreign currencies
Assets and liabilities of overseas subsidiaries and associated undertakings have been expressed in sterling at the market rate ruling at the end of each financial year. Trading results are translated at the average rates for the year. Exchange differences arising on translation of the financial statements of overseas subsidiaries are taken to reserves.
Trading activities denominated in foreign currencies are translated at the average rate for the period. Monetary assets and liabilities denominated in foreign currencies are translated at the rate of exchange ruling at the balance sheet date and differences on exchange are included in the profit and loss account.
Pension costs
Contributions made to personal pension schemes, which are administered independently of the company, are charged to the profit and loss account as incurred.
Related party disclosures
The company is exempt under the terms of Financial Reporting Standard 8 from disclosing related party transactions with entities that are part of the Group.
Taxation
Current tax, including UK corporation tax and foreign tax, is provided on taxable profits at current rates in the respective taxation jurisdictions.
Deferred tax is recognised in respect of all timing differences that have originated but not reversed at the balance sheet date where transactions or events that result in an obligation to pay more tax in the future or a right to pay less tax in the future have occurred at the balance sheet date. Timing differences are differences between the company’s taxable profits and its results as stated in the financial statements that arise from the inclusion of gains and losses in tax assessments in periods different from those in which they are recognised in the financial statements.
A deferred tax asset is regarded as recoverable and therefore recognised only when, on the basis of all available evidence, it can be regarded as more likely than not that there will be suitable taxable profits from which the future reversal of the underlying timing difference can be deducted. Deferred tax is measured on a non-discounted basis.
Deferred tax is measured at the tax rates that are expected to apply in the periods in which the timing differences are expected to reverse.
FINANCIAL STATEMENTS NOTES - YEAR ENDED DECEMBER 2013
1. ACCOUNTING POLICIES (Cont’d)
37

2 SEGMENTAL REPORTING
Revenue by origin
Continental Europe
United Kingdom
North America
Rest of the World
Revenue by destination
Continental Europe
United Kingdom
North America
Rest of the World
-
82,124
5,557
76
87,757
13,389
5,045
13,692
55,631
87,757
GROUP
-
81,703
1,893
32
83,628
25,082
9,546
6,210
42,790
83,628
Additional segmental disclosures have not been provided as the directors consider that the provision of such information could be prejudicial to the business.
12 MTHS TO31 DEC 2013
£’000
9 MTHS TO31 DEC 2012
£’000
FINANCIAL STATEMENTS NOTES - YEAR ENDED DECEMBER 2013
38

3 OPERATING PROFIT/(LOSS)
Operating profit/(loss) is stated after charging
Goodwill amortisation
Amortisation of development costs
Depreciation
- owned assets
Operating lease charges
- plant and machinery
- land and buildings
Loss on the sale of fixed assets
Exceptional administrative expenses1
Auditors’ remuneration
Services to the Group and its subsidiaries
- fees payable to the Company’s auditor for the audit of the financial statements
- audit of the financial statements of the Company’s subsidiaries (associates) pursuant to legislation
- other services supplied pursuant to legislation
Foreign exchange gain
408
171
4,708
430
2,705
136
2,861
22
28
10
115
12 MTHS TO31 DEC 2013
£’000
-
-
-
-
-
-
-
-
-
-
-
9 MTHS TO31 DEC 2012
£’000
COMPANY
306
77
3,386
235
2,396
8
300
21
23
8
66
9 MTHS TO31 DEC 2012
£’000
GROUP
-
-
-
-
-
-
2,164
-
-
-
-
12 MTHS TO31 DEC 2013
£’000
1 During the year to December 2013, various one-off administrative expenses were incurred by the group, mainly relating to a strategic review of the best timing for the shareholders to consider a potential sale of the business.
In the 9 months to 31 December 2012, the Group’s UK subsidiary incurred exceptional administration expenses of £300,000 relating to warranty costs.
FINANCIAL STATEMENTS NOTES - YEAR ENDED DECEMBER 2013
39

Aggregate emoluments
Compensation for loss of office
Company contributions to defined contribution pension schemes
Highest paid director
Total amount of emoluments and amounts (excluding shares) receivable under long term incentive schemes
4 EMPLOYEE COSTS
Wages and salaries
Social security costs
Other pension costs (See note 25)
17,804
1,845
866
20,515
12 MTHS TO31 DEC 2013
£’000
919
51
16
986
9 MTHS TO31 DEC 2012
£’000
COMPANY
12,623
1,251
562
14,436
9 MTHS TO31 DEC 2012
£’000
GROUP
779
77
23
879
12 MTHS TO31 DEC 2013
£’000
THE AVERAGE NUMBER OF EMPLOYEES (INCLUDING EXECUTIVE DIRECTORS) DURING THE PERIOD WAS
By activity
Production
Selling and distribution
Administration
382
31
40
453
12 MTHS TO31 DEC 2013
£’000
12 MTHS TO31 DEC 2013
£’000
-
-
6
6
9 MTHS TO31 DEC 2012
£’000
9 MTHS TO31 DEC 2012
£’000
COMPANY
COMPANY
373
24
37
434
9 MTHS TO31 DEC 2012
£’000
9 MTHS TO31 DEC 2012
£’000
GROUP
GROUP
-
-
6
6
12 MTHS TO31 DEC 2013
£’000
12 MTHS TO31 DEC 2013
£’000
1,057
111
26
1,194
348
645
-
16
661
205
1,012
111
23
1,146
348
764
-
22
786
205
DETAILS OF DIRECTORS’ EMOLUMENTS ARE AS FOLLOWS
There are retirement benefits accruing to two (31 December 2012: four) directors under defined contribution personal pension schemes.
FINANCIAL STATEMENTS NOTES - YEAR ENDED DECEMBER 2013
40

5 NET INTEREST PAYABLE
Bank loan interest
Bank interest
Other interest & charges
Net exchange difference on foreign currency borrowings
Total interest payable and similar charges
Interest due from Group undertakings
Other interest
Total interest receivable and similar income
Net interest (payable)/receivable
(124)
-
(318)
-
(442)
-
-
-
(442)
12 MTHS TO31 DEC 2013
£’000
(114)
-
(9)
-
(123)
262
-
262
139
9 MTHS TO31 DEC 2012
£’000
COMPANY
(114)
(5)
(46)
(66)
(231)
-
-
-
(231)
9 MTHS TO31 DEC 2012
£’000
GROUP
(124)
-
-
(218)
(342)
407
2
409
67
12 MTHS TO31 DEC 2013
£’000
FINANCIAL STATEMENTS NOTES - YEAR ENDED DECEMBER 2013
41

6 TAX ON PROFIT ON ORDINARY ACTIVITIES
Current tax
UK tax
Foreign tax
Total current tax charge
Deferred tax
Current period
Prior period
Tax charge for the period
-
10
10
427
(22)
415
12 MTHS TO31 DEC 2013
£’000
-
-
-
-
-
-
9 MTHS TO31 DEC 2012
£’000
COMPANY
GROUP
-
13
13
1,583
(533)
1,063
9 MTHS TO31 DEC 2012
£’000
-
-
-
-
-
-
12 MTHS TO31 DEC 2013
£’000
THE TAX ASSESSED FOR THE PERIOD VARIES FROM THE STANDARD RATE OF CORPORATION TAX IN THE UK (23%). THE DIFFERENCES ARE EXPLAINED BELOW:
Profit on ordinary activities before taxation
Profit/(loss) on ordinary activities multiplied by standard rate in the UK 23% (2012: 24%)
Effects of:
Transfer pricing adjustments
Group relief claimed
Expenses not deductible for tax purposes
Foreign tax
Utilisation of brought forward losses and other deductions
Accelerated capital allowances
Total current tax charge for the period
3,723
865
-
(1,117)
394
10
414
(556)
10
12 MTHS TO31 DEC 2013
£’000
756
181
131
-
3
-
(315)
-
-
9 MTHS TO31 DEC 2012
£’000
COMPANY
13,299
3,192
(95)
(1,265)
847
13
(2,771)
92
13
9 MTHS TO31 DEC 2012
£’000
GROUP
(1,998)
(464)
248
-
411
-
(195)
-
-
12 MTHS TO31 DEC 2013
£’000
FINANCIAL STATEMENTS NOTES - YEAR ENDED DECEMBER 2013
42

GROUP
7 INTANGIBLE ASSETS
Cost
At 1 January 2013
Additions
Foreign exchange revaluation
At 31 December 2013
Accumulated amortisation
At 1 January 2013
Charge for the period
Foreign exchange revaluation
At 31 December 2013
Net book value
At 31 December 2013
At 31 December 2012
10,639
183
-
10,822
(7,685)
(579)
(6)
(8,270)
2,552
2,954
TOTAL
£’000
9,260
-
-
9,260
(7,005)
(408)
-
(7,413)
1,847
2,255
GOODWILL
£’000
1,178
-
-
1,178
(680)
(131)
(6)
(817)
361
498
DEVELOPMENT COST £’000
The company has no intangible fixed assets (31 December 2012: nil).
FINANCIAL STATEMENTS NOTES - YEAR ENDED DECEMBER 2013
201
183
-
384
-
(40)
-
(40)
344
201
SOFTWARE
£’000
43

8 TANGIBLE FIXED ASSETS
Cost
At 1 January 2013
Additions
Disposal
Transfers
Foreign exchange
At 31 December 2013
Accumulated depreciation
At 1 January 2013
Charge for the period
Disposal
Transfers
Foreign exchange revaluation
At 31 December 2013
Net book value
At 31 December 2013
At 31 December 2012
51,845
3,956
(507)
-
(523)
54,771
(17,581)
(4,708)
371
-
290
(21,628)
33,143
34,264
TOTAL
£’000
41,760
2,761
(241)
649
(502)
44,427
(14,248)
(3,756)
163
(432)
279
(17,994)
26,433
27,512
PLANT ANDEQUIPMENT
£’000
7,265
318
-
(6)
(4)
7,573
(1,697)
(531)
-
-
2
(2,226)
5,347
5,568
LEASEHOLD IMPROVEMENTS
£’000
GROUP
2,278
278
(266)
(436)
(6)
1,848
(1,465)
(398)
208
436
4
(1,215)
633
813
COMPUTEREQUIPMENT
£’000
No assets held under finance leases are included within tangible fixed assets.
FINANCIAL STATEMENTS NOTES - YEAR ENDED DECEMBER 2013
331
19
-
4
(11)
343
(171)
(23)
-
(4)
5
(193)
150
160
OFFICE FIXTURES
AND FITTINGS £’000
211
580
-
(211)
-
580
-
-
-
-
-
-
580
211
ASSETS UNDER CON-
STRUCTION £’000
44

8 TANGIBLE FIXED ASSETS (CONTINUED)
Cost
At 1 January 2013
Additions
At 31 December 2013
Accumulated depreciation
At 1 January 2013
Charge for the period
At 31 December 2013
Net book value
At 31 December 2013
At 31 December 2012
COMPANY
53
-
53
(53)
-
(53)
-
-
OFFICEEQUIPMENT
£’000
FINANCIAL STATEMENTS NOTES - YEAR ENDED DECEMBER 2013
45

9 INVESTMENTS
Shares in subsidiary undertakings
Cost
At 1 January 2013 and 1 April 2012
Disposals
Additions
At 31 December
Provisions for impairment
At 1 January 2013 and 1 April 2012
Additions
At 31 December
Net Book Value
At 1 January 2013 and 1 April 2012
At 31 December
21,222
-
20
21,242
-
-
-
21,222
21,242
21,242
(102)
-
21,140
-
-
-
21,242
21,140
COMPANY31 DEC 2012
£’000
COMPANY31 DEC 2013
£’000
THE COMPANY’S PRINCIPAL TRADING SUBSIDIARY OPERATING UNDERTAKINGS AT 31 DECEMBER 2013 WERE AS FOLLOWS
JDR Cable Systems Ltd
JDR Cable Systems Inc
JDR Cable Systems (Thailand) Ltd
100%
100%
100%
Scotland
United States
Thailand
Offshore oil & gas services
Offshore oil & gas services
Offshore oil & gas services
PERCENTAGE OF NOMINAL SHARE CAPITAL
NAME OF SUBSIDIARY
NATURE OF BUSINESS
COUNTRY OF REGISTRATION / INCORPORATION
The shares in JDR Cable Systems Inc are held by JDR Cable Systems (Holdings) Inc.
FINANCIAL STATEMENTS NOTES - YEAR ENDED DECEMBER 2013
46

10 STOCK
Raw materials
Work in progress
Finished goods
6,493
8,653
-
15,146
10,299
7,169
-
17,468
31 DEC 2012£’000
31 DEC 2013 £’000
GROUP
11 DEBTORS
Trade debtors
Prepayments and accrued income
Corporation tax recoverable
Amounts owed by Group undertakings
Other debtors
-
16
-
30,808
23
30,847
31 DEC 2012£’000
31,190
993
-
-
1,177
33,360
31 DEC 2012£’000
-
20
-
23,290
740
24,050
31 DEC 2013£’000
24,640
1,423
150
-
1,587
27,800
31 DEC 2013 £’000
GROUP COMPANYAMOUNTS FALLING DUE WITHIN ONE YEAR
Prepayments and accrued income
Amounts owed by Group undertakings
-
4,437
4,437
31 DEC 2012£’000
103
-
103
31 DEC 2012£’000
-
4,609
4,609
31 DEC 2013£’000
95
-
95
31 DEC 2013£’000
GROUP COMPANYAMOUNTS FALLING DUE AFTER ONE YEAR
Amounts owed by Group undertakings are unsecured and have no fixed date of repayment. The directors do not intend to demand repayment of these amounts within 12 months of the balance sheet date.
FINANCIAL STATEMENTS NOTES - YEAR ENDED DECEMBER 2013
47

12 CREDITORS – AMOUNTS FALLING DUE WITHIN ONE YEAR
Revolving Credit Facility (RCF) (note 14)
Trade creditors
Accruals and deferred income
Other tax and social security
Other creditors
Payments on account
Amounts due to Group undertakings
3,500
-
440
-
-
-
868
4,808
31 DEC 2012£’000
3,500
17,280
3,957
639
784
14,371
-
40,531
31 DEC 2012£’000
-
-
191
-
-
-
-
191
31 DEC 2013 £’000
-
8,149
3,523
514
842
15,785
-
28,813
31 DEC 2013£’000
GROUP COMPANY
Amounts due to Group undertakings are unsecured, and are repayable on demand.
FINANCIAL STATEMENTS NOTES - YEAR ENDED DECEMBER 2013
48

At 1 January 2013
Received during the period
At 31 December 2013
Amortisation
At 1 January 2013
Charge during the period
At 31 December 2013
Carrying value
At 31 December 2013
At 31 December 2012
13 CREDITORS – AMOUNTS FALLING DUE AFTER MORE THAN ONE YEAR
Bank loan and accrued interest (note 14)
Amount due to parent company (note 14)
Government grant
Other
-
11,480
-
-
11,480
31 DEC 2012£’000
-
11,480
2,398
-
13,878
31 DEC 2012£’000
-
11,380
-
-
11,380
31 DEC 2013 £’000
-
11,380
2,181
-
13,561
31 DEC 2013 £’000
GROUP COMPANY
Amounts due to parent company are not payable until the expiry of bank debt in 2015.
2,835
-
2,835
437
217
654
2,181
2,398
GOVERNMENT GRANTS ARE AS FOLLOWS
£’000
FINANCIAL STATEMENTS NOTES - YEAR ENDED DECEMBER 2013
49

14 BORROWINGS
Borrowings are repayable as follows
Within one year
Bank loans and accrued interest (a)
After 5 years
Loan due to parent undertaking (b)
Total borrowings
3,500
3,500
11,480
11,480
14,980
31 DEC 2012£’000
3,500
3,500
11,480
11,480
14,980
31 DEC 2012£’000
-
-
11,380
11,380
11,380
31 DEC 2013£’000
-
-
11,380
11,380
11,380
31 DEC 2013£’000
GROUP COMPANY
(a) HSBC is the sole bank lender to JDR. Bank loans comprise of a Revolving Credit Facility (RCF) (£10.0m). The loans are denominated in Sterling. The RCF expires in June 2015. HSBC charge a fee for non-utilisation of the RCF and interest is charged at a fixed rate when the facility is utilised. The Group bank loans at balance sheet date were secured by a bond and floating charge over the assets of the Group.
(b) The Loans due to parent undertaking are ultimately provided by the shareholders of JDR Enterprises Ltd. No interest is charged on Loans due to parent undertaking. Payment of any accrued interest on the parent company loans and repayment of principal is not permitted under the Term & Revolving Facilities Agreement between JDR Cable Systems (Holdings) Ltd, JDR Enterprises Ltd, the shareholders of JDR Enterprises and HSBC, prior to the discharge of the Bank’s debt. The Bank’s debt is not fully discharged until 31 March 2015.
FINANCIAL STATEMENTS NOTES - YEAR ENDED DECEMBER 2013
50

15 DEFERRED TAXATION
Accelerated capital allowances
Other short term timing differences
-
-
-
31 DEC 2012£’000
387
(117)
270
31 DEC 2012£’000
-
-
-
31 DEC 2013 £’000
728
(154)
574
31 DEC 2013£’000
GROUPTHE DEFERRED TAX LIABILITY THAT HAS BEEN RECOGNISED IS AS FOLLOWS
COMPANY
Accelerated capital allowances
Losses
Other short term timing differences
1
1,601
-
1,602
31 DEC 2012£’000
1
1,601
-
1,602
31 DEC 2012£’000
1
1,208
-
1,209
31 DEC 2013£’000
1
1,208
-
1,209
31 DEC 2013 £’000
GROUPTHE POTENTIAL DEFERRED TAX ASSET WHICH HAS NOT BEEN RECOGNISED IS AS FOLLOWS
COMPANY
The deferred tax liability/(asset) is based on a corporation tax rate of 20% (31 December 2012; 23%).
FINANCIAL STATEMENTS NOTES - YEAR ENDED DECEMBER 2013
51

AUTHORISED
Equity
26,450,000 Ordinary shares of £0.10 each
22,600,121,895 Deferred Shares of £0.001 each
4,800,000 Preference Shares of £1.00 each
ALLOTTED, CALLED UP AND FULLY PAID
Equity
9,600,000 Ordinary shares of £0.10 each
22,600,121,895 Deferred Shares of £0.01 each
4,800,000 Preference shares of £1.00
960
22,600
4,800
28,360
31 DEC 2012£’000
960
22,600
4,800
28,360
31 DEC 2013£’000
2,645
22,600
4,800
30,045
31 DEC 2012£’000
2,645
22,600
4,800
30,045
31 DEC 2013£’000
GROUP AND COMPANY
17 CALLED UP SHARE CAPITAL
GROUP AND COMPANY
GROUP
Dividends The profits of the Company available for distribution shall be applied in paying to the holders of the Ordinary Shares pro rata, according to the amounts paid up or credited as paid up on the ordinary shares held by them respectively, such amount as the directors may decide, subject to the consent of an Investor Majority and the Company’s bankers. The Deferred Shares carry no right to a dividend.
Voting Rights A member has one vote for every ordinary share held. The deferred shares have no voting rights.
Capital On a return of assets on liquidation or capital reduction or otherwise, the assets of the company remaining after the payment of its liabilities shall be distributed to the holders of the ordinary shares. The holders of the deferred shares are not entitled to any share of the surplus assets until each of the ordinary shareholders has received £10,000,000 per ordinary share.
16 PROVISIONS FOR LIABILITIES AND CHARGES
At 1 January 2013
(Utilised)/provided in the year
At 31 December 2013
300
2,902
3,202
WARRANTY
£’000
270
304
574
DEFERREDTAXATION
£’000
2,472
1,796
4,268
TOTAL
£’000
1,902
(1,410)
492
OTHER
£’000
The other provision relates to a number of excess contractual costs which the company believes it may incur on projects which have been delivered to clients. These costs are not fully known, subject to negotiation and are unlikely to be offset by additional revenue. It is expected that the majority
of expenditures will be incurred in the next financial year and that all will be incurred within two years. The provision has been estimated in accordance with the appropriate contract documents.
The company has no provision for liabilities (31 December 2012: nil).
FINANCIAL STATEMENTS NOTES - YEAR ENDED DECEMBER 2013
52

18 SHARE PREMIUM ACCOUNT
At 1 January and 31 December 2013 904
COMPANY£’000
904
GROUP£’000
19 PROFIT AND LOSS ACCOUNT
At 1 January 2013
Profit / (loss) for the financial period
Exchange adjustments
At 31 December 2013
10,984
(1,998)
-
8,986
COMPANY£’000
2,383
3,308
(2)
5,689
GROUP£’000
FINANCIAL STATEMENTS NOTES - YEAR ENDED DECEMBER 2013
53

21 CASH FLOW FROM OPERATING ACTIVITIES
Operating profit
Amortisation of goodwill
Amortisation of development costs
Depreciation charge
Amortisation of grant
Loss on sale of fixed assets
Increase in stocks
Decrease in debtors
(Decrease)/increase in creditors
Increase in provisions
Other non-cash movements
Net cash inflow from operating activities
13,530
306
77
3,386
(152)
-
(3,703)
3,425
5,785
(634)
(2)
22,018
9 MTHS TO31 DEC 2012
£’000
4,165
408
171
4,708
(217)
137
(2,322)
5,718
(8,218)
1,492
236
6,278
12 MTHS TO31 DEC 2013
£’000
GROUP
20 RECONCILIATION OF MOVEMENTS IN SHAREHOLDERS’ FUNDS
Profit/(loss) for the financial period
Exchange adjustments
Net addition to / (reduction in) shareholders’ funds
Opening shareholders’ funds
Closing shareholders’ funds
756
-
756
39,492
40,248
9 MTHS TO31 DEC 2012
£’000
12,236
11
12,247
19,400
31,647
9 MTHS TO31 DEC 2012
£’000
(1,998)
-
(1,998)
40,248
38,250
12 MTHS TO31 DEC 2013
£’000
3,308
(2)
3,306
31,647
34,953
12 MTHS TO31 DEC 2013
£’000
GROUP COMPANY
FINANCIAL STATEMENTS NOTES - YEAR ENDED DECEMBER 2013
54

22 ANALYSIS OF NET DEBT
Cash at bank and in hand
Debt less than one year
Debt more than one year
Net debt
537
-
(11,380)
(10,843)
31 DEC 2013
£’000
(2,164)
3,500
100
1,436
CASH FLOW
£’000
2,701
(3,500)
(11,480)
(12,279)
1 JAN 2013
£’000
23 OPERATING LEASE COMMITMENTS
Annual commitments under non-cancellable operating leases expiring:
Within 1 year
Within 2 to 5 years
After 5 years
51
240
-
291
31 DEC 2012PLANT ANDEQUIPMENT
£’000
22
231
-
253
31 DEC 2013PLANT ANDEQUIPMENT
£’000
322
530
1,961
2,813
31 DEC 2012
PROPERTY£’000
71
478
2,066
2,615
31 DEC 2013
PROPERTY£’000
GROUP
GROUP
GROUP
24 CAPITAL COMMITMENT
25 PENSION COMMITMENT
Contract placed for future capital expenditure not provided in the financial statements
The Group contributes to personal pension schemes on behalf of certain employees. These schemes are administered independently of the Group. The total pension cost which is charged against profit represents contributions payable by the Group and amounted to £866,000 (31 December 2012: £562,000).
At 31 December 2013 the Group has lease agreements in respect of properties, plant and equipment.
1,126755
31 DEC 2012£’000
31 DEC 2013 £’000
FINANCIAL STATEMENTS NOTES - YEAR ENDED DECEMBER 2013
-
-
-
-
OTHER NON-CASH
£’000
55

The ultimate parent company and controlling party is JDR Enterprises Limited, which is the parent company of the largest Group to consolidate these financial statements. Copies of the Group financial statements can be obtained from the Company Secretary at JDR Cable Systems (Holdings) Limited, Littleport Innovation Park, Wisbech Road, Littleport, Ely, Cambridgeshire, CB6 1RA.
26 ULTIMATE PARENT UNDERTAKING
During the normal course of business the Group has given bank guarantees totalling £16,129,000 (31 December 2012: £18,308,000).
The Group receives government grants to assist in the funding of capital expenditure. The aggregate amount of such grants received in the year to 31 December 2013 was nil (9 months to 31 December 2012: £210,000).
In the event of any breach of grant conditions the full amount of the grant received would be repayable. The Group is not aware of any actual, or potential, breach of conditions, no provision is required for repayment.
JDR Cable Systems (Holdings) Ltd is a guarantor for all Group borrowing facilities under the agreement between the company and its bankers. Total sums outstanding under this agreement at 31 December 2013 were £nil (31 December 2012: £3,500,000).
28 CONTINGENT LIABILITIES
Mr Rich and Mr Van de Steen were representative directors for Vision Capital LLP, the largest shareholder in JDR Enterprises Ltd. Vision Capital LLP charged a monitoring fee of £99,000 in the period.
During the year ended March 2012, loans were advanced to two directors totalling £171,930.
The outstanding balance at 1 January 2013 was £106,342 which was the highest balance at any point during the year. The amounts attract interest at 4% p.a. The balance at 31 December 2013 was £46,699 and was fully repaid in February 2014.
27 RELATED PARTY TRANSACTIONS
FINANCIAL STATEMENTS NOTES - YEAR ENDED DECEMBER 2013
56

APPENDIX UNAUDITED ANNUALISED GROUP PROFIT AND LOSS ACCOUNT (CONTINUING GROUP) FOR THE 12 MONTHS ENDED 31 DECEMBER
Revenue
Cost of sales
Gross profit
Administrative expenses
Administrative expenses - exceptional
Operating profit before goodwill amortisation
Goodwill amortisation
Operating profit
Interest payable and similar charges
Profit on ordinary activities before taxation
Tax charge on profit on ordinary activities
Profit for the financial period
Retained profit for the financial period
Exchange rate gain
Total gains and losses recognised since the last financial statements
129,899
(86,014)
43,885
(22,336)
(607)
20,942
(492)
20,450
(2,387)
18,063
(45)
18,018
18,018
150
18,168
87,757
(56,952)
30,805
(23,371)
(2,861)
4,573
(408)
4,165
(442)
3,723
(415)
3,308
3,308
(2)
3,306
12 MTHS TO 31 DEC 2012
£’000
12 MTHS TO 31 DEC 2012
£’000
12 MTHS TO 31 DEC 2013
£’000
12 MTHS TO 31 DEC 2013
£’000
UNAUDITED ANNUALISED GROUP STATEMENT OF TOTAL RECOGNISED GAINS AND LOSSES FOR THE 12 MONTHS ENDED 31 DECEMBER
APPENDIX
Unaudited Pro Forma Summary Financial Statements
57

APPENDIX
APPENDIX UNAUDITED ANNUALISED GROUP BALANCE SHEET AS AT 31 DECEMBER
Fixed assets
Intangible assets
Tangible assets
Current assets
Stock
Debtors
Cash at bank and in hand
Creditors – amounts falling due within one year
Net current assets
Total assets less current liabilities
Creditors – amounts falling due after more than one year
Provisions for liabilities
Net assets
Capital and reserves
Called up share capital
Share premium account
Profit and loss account
Total equity shareholders’ funds
2,954
34,264
37,218
15,146
33,463
2,701
51,310
(40,531)
10,779
47,997
(13,878)
(2,472)
31,647
28,360
904
2,383
31,647
2,552
33,143
35,695
17,468
27,895
537
45,900
(28,813)
17,087
52,782
(13,561)
(4,268)
34,953
28,360
904
5,689
34,953
31 DEC 2012£’000
31 DEC 2013£’000
Unaudited Pro Forma Summary Financial Statements
58

APPENDIX
Earnings before interest, tax, depreciation and amortisation (EBITDA)
Less: exceptional items
Add: movement in working capital
(Increase)/decrease in stock
Decrease/(Increase) in trade debtors
Decrease in trade creditors and customer advances
Other
Net cash inflow from operating activities
Returns on investments and servicing of finance
Interest paid
Interest received
Net cash outflow from returns on investments and servicing of finance
Taxation
Capital expenditure and financial investments
Increase in tangible and intangible fixed assets
Net cash outflow from capital expenditure and financial investments
Financing
Decrease in borrowings
Decrease in loan from parent company
Net cash outflow from financing
Decrease in net cash
25,766
(607)
7,685
(9,512)
(8,196)
4,477
19,613
(2,387)
-
(2,387)
(139)
(4,288)
(4,288)
(1,500)
(11,840)
(13,340)
(541)
12,313
(2,861)
(2,322)
5,718
(8,218)
1,648
6,278
(442)
-
(442)
(261)
(4,139)
(4,139)
(3,500)
(100)
(3,600)
(2,164)
12 MTHS TO 31 DEC 2012
£’000
12 MTHS TO 31 DEC 2013
£’000
Unaudited Pro Forma Summary Financial Statements
APPENDIX UNAUDITED ANNUALISED GROUP CASH FLOW STATEMENT FOR THE 12 MONTHS ENDED 31 DECEMBER
59

JDR ANNUAL REPORT 2013
Advisors and Registered Head Office
JDR Cable Systems Ltd Saltire Court 20 Castle Terrace Edinburgh EH1 2EN
Registered company number: SC 186 919
REGISTERED HEAD OFFICE
HSBC Bank plc Home & Eastern Counties Corporate Banking Centre Level 6 Metropolitan House, CBX3 321 Avebury Boulevard Milton Keynes MK9 2GA
BANKERS
Eversheds LLP Kett House Station Road Cambridge CB1 2JY
Bird and Bird LLP Taunusanlage 1 60329 Frankfurt am Main Germany
Macfarlanes LLP 20 Cursitor Street London EC4A 1LT
LAWYERS
Grant Thornton UK LLP 101 Cambridge Science Park Milton Road Cambridge CB4 OFY
AUDITORS
Lazard & Co., Ltd 50 Stratton Street Mayfair London W1J 8LL
FINANCIAL ADVISORS
Brunswick Group LLP 16 Lincoln’s Inn Fields London WC2A 3ED
COMMUNICATIONS ADVISORS
60


Brazil • Germany • Malaysia • Singapore • Thailand • United Kingdom • United States JDRGLOBAL.COM
Littleport Innovation ParkWisbech Road
LittleportCambridgeshire
CB6 1RA