je muchert sa1 13333 - dallas parks
TRANSCRIPT

SHOP SUBMITTAL / DRAWING REVIEW
RESPONSE
Project Name: JE Muchert SA1 From: John Piazza
Project No: 13333
Description: 26 51 00 Gear Study
SW Associates Consulting Engineers Engineer’s review is for general compliance with the design
concept and contract documents. Markings or comments or the lack there of shall not be construed as relieving the Contractor from compliance with the project plans and specifications. The Contractor remains responsible for details and accuracy, for confirming and correlating all quantities and dimensions, for selecting fabrication processes, for techniques of construction, for performing this work in a safe manner and for coordinating his work with that of other trades This review does not constitute approval or acceptance of deviations from contract documents, such deviations if any must be requested in writing or clearly identified as deviations in accordance with contract documents.
No Exception Taken
Make Corrections Noted
Revise and Submit
Rejected
SWA Project No. 13333
Submittal No. 26 51 00 Gear Study
Date 7-16-2019
Checked By: John Piazza
Comments:
SW Associates Consulting Engineers 5429 LBJ Freeway Suite 300 LB129 Dallas, TX 75240 www.swaengineers.com Tel 1.214.397.0211 Fax 1.214.397.0886
Formerly Consulting Engineers

SUBMITTAL TRANSMITTAL
CONTRACTOR’S REVIEW STAMP A/E REVIEW STAMP
SUBMITTAL DATA Project Dallas Park & Rec Dept Admin Offices Location 10031 E. Northwest Highway Dallas, TX 75238 General Contractor DENCO CONSTRUCTION SPECIALISTS Trade Electrical Items Submitted Gear Supplier CONSOLIDATED ELECTRICAL DISTRIBUTORS, INC. Phone 214-932-3000 Substitutions and Deviations Remarks I CERTIFY THAT THE ABOVE ITEM DESCRIBED IN THE ATTACHED SUBMITTAL COMPLIES WITH THE CONTRACT DOCUMENTS EXCEPT AS NOTED ABOVE. Shawnee Hallmark 972-226-2609 ext. 108 7-10-18 NAME (TRADE) PHONE NO. DATE Review Comments:
DENCO CONSTRUCTION SPECIALISTS SHOP DRAWING AND SUBMITTAL REVIEW
JOB NO. DPA-265100
DATE 7-10-18
REVIEWER Shawnee Hallmark
Corrections or comments made relative to submittals during this review do not relieve the subcontractor from compliance with the requirements of the drawings and specifications. This check is only for review of general conformance with the design concept of the project and general compliance with the information given in the contract documents. The subcontractor is responsible for conforming and correlating all quantities and dimensions, selecting fabrication processes and techniques of construction, coordinating his work with that of other trades and performing his work in a safe and satisfactory manner. THIS REVIEW DOES NOT INDICATE NOR IMPLY ANY APPROVAL
OF CHANGES TO TIME OR CHANGES IN COSTS

Power System Engineering1601 Mercer Road
Lexington, KY [email protected]
COVER LETTERCOVER PAGE
POWER SYSTEM ANALYSIS
DPARD Administrative Offices Dallas, TX
Prepared byPramod Naik under the supervision and direct control of
Jonathan M Wheelis, P.E.Schneider Electric Engineering Services, LLC
Texas Firm No. F-10107
Job Number - March 27, 2019Q2C: 41959861 Rev. 1 May 27, 2019
Rev. 2 -Rev. 3 -
This document has been authorized for release by the engineer whose seal and signature are hereto affixed. Altering this document is unlawful unless performed by or under the direction of a licensed professional engineer. Any changes shall be described and the engineer authorizing such alterations shall seal, sign, and date the revised document.
1 of 955/28/19
Power System Engineering
May 2019
DISCLAIMER
The following report was prepared by the Power System Engineering group of Schneider Electric Engineering Services, LLC (SEES) utilizing industry-accepted standards and practices along with the proprietary methodologies and analysis tools of SEES. Data used in this analysis was acquired by Power System Engineering and provided by others, through onsite discovery, published information, equipment nameplates, manufacturer ratings, testing, analysis, or other means. SEES assumes no responsibility for inaccuracies in data provided by others. The study is intended for use by qualified individuals to facilitate the installation, operation, maintenance, and safety of the electrical power system depicted. Modification of equipment, changes to system configuration, adjustment of protective device settings, or failure to properly maintain equipment may invalidate these results.
The stylized trademarks “Square D” and “Schneider Electric” and any other trademarks and trade names that are the property of Schneider Electric USA, Inc are used by permission.
TABLE OF CONTENTS1 EXECUTIVE SUMMARY .......................................................................................41.1 Overview ..............................................................................................................................................41.2 Revision History ...................................................................................................................................41.3 Study Recommendations.....................................................................................................................5
1.3.1 Priority Improvements .................................................................................................................51.3.2 Study Recommendation Tables....................................................................................................6
1.4 Study Highlights ...................................................................................................................................81.4.1 Short-Circuit..................................................................................................................................81.4.2 Coordination .................................................................................................................................81.4.3 Arc Flash .......................................................................................................................................9
2 INTRODUCTION ...............................................................................................103 STUDY DATA....................................................................................................113.1 Importance .........................................................................................................................................113.2 Estimates & Assumptions ..................................................................................................................11
4 SHORT-CIRCUIT ANALYSIS ................................................................................124.1 General Procedure .............................................................................................................................124.2 Data Used in the Calculations ...........................................................................................................15
4.2.1 Power Company Data .................................................................................................................154.2.2 Cable Data...................................................................................................................................154.2.3 Motor Contribution to Short-Circuit Current .............................................................................15
4.3 Short-Circuit Analysis Results............................................................................................................174.4 Short-Circuit Evaluation Table...........................................................................................................18
5 OVERCURRENT DEVICE COORDINATION ANALYSIS.............................................205.1 General Procedure .............................................................................................................................205.2 Specific Procedure .............................................................................................................................21
2 of 95

Power System Engineering
May 2019
5.2.1 Short-Circuit Current Considerations .........................................................................................215.2.2 Molded Case Breaker Coordination ...........................................................................................215.2.3 Transformer Protective Devices .................................................................................................225.2.4 Cable Protection .........................................................................................................................24
5.3 Overcurrent Device Coordination Analysis Results ..........................................................................255.4 Overcurrent Device Setting Table .....................................................................................................265.5 Time-Current Coordination Graphs...................................................................................................28
6 ARC FLASH HAZARD ANALYSIS ..........................................................................336.1 General Procedure .............................................................................................................................336.2 Specific Procedure .............................................................................................................................356.3 AF Hazard Analysis Results ................................................................................................................39
6.3.1 Common Arc Flash Hazard Table Terms.....................................................................................406.3.2 Protective Arc Rated (AR) Clothing Characteristics....................................................................416.3.3 Arc Flash Hazard Analysis Table – Recommended Settings .......................................................45
6.4 Power System Engineering Arc Flash Labeling Practice ...................................................................476.4.1 Arc Flash Information Labels ......................................................................................................476.4.2 General Safety Labels .................................................................................................................48
APPENDIX A: ABBREVIATIONS AND TRADEMARKS...................................................51APPENDIX B: SHORT CIRCUIT INPUT/OUTPUT DATA ................................................54APPENDIX C: REFERENCES ......................................................................................76APPENDIX D: SYSTEM STUDY ONE-LINE DIAGRAM ...................................................94
_
3 of 95

Power System Engineering
May 2019
1 EXECUTIVE SUMMARY
1.1 Overview
This report documents the results of a Power System Engineering analysis for the DPARD Administrative Offices in Dallas, TX. The objective of this section is to briefly summarize the results of the analysis and highlight key issues and findings in the electrical distribution equipment. For items addressed by equipment, conductor, or device settings changes, the power system study results may need to be re-evaluated in a revision to this study. The full analysis can be found in the main body of the report.
The scope of this study is limited to new equipment shown on the study one-line diagram located in the back of the report. Unless specifically required by job specifications, branch circuit utilization equipment, as defined per NEC Article 100, was not included in this study (this may consist of small equipment, 100A and less, such as: safety switches, industrial control panels, and enclosed starters/drives).
1.2 Revision History
Revision 1 (May 27, 2019)
Study was revised to incorporate newly received data.
Updated missing cable lengths, breaker data, short-circuit table, input/output report, TCC’s, reference documents and one-line.
Added arc flash analysis and arc flash recommendation table.
4 of 95

Power System Engineering
May 2019
1.3 Study Recommendations
1.3.1 Priority Improvements
Arc Flash Recommendations
1. AFIE level at 900 ECB is over 40 cal/cm2. It is not recommended to work on this equipment while it is energized.
Refer to the Study Recommendation Tables section.
Reducing arc flash incident energy hazard levels improves personnel protection.
Short-Circuit Recommendations
1. None.
It’s vital for equipment to withstand or to interrupt fault currents to comply with the NEC, reduce excessive damage, reduce fire hazards, & improve safety.
Site / NEC / Other Recommendations
1. None
All equipment should be installed to meet local NEC requirements and be properly maintained to prevent premature failure and outages.
Coordination Recommendations
1. None.
A well-coordinated system maximizes electrical service continuity while attempting to minimize arc flash incident energy.
5 of 95

Power System Engineering
May 2019
1.3.2 Study Recommendation Tables
6 of 95

DPARD Administrative Offices
Dallas,TX
POWER SYSTEM ENGINEERING REFER TO DRAWING
Equipment Designation / Dwg No. General Issue Recommendations
900 ECB Over 40 cal/cm2 - Power company owned fuse is the line-side protection AFIE level at 900 ECB is over 40 cal/cm2. It is not recommended to work on this equipment while it is energized.
AF RECOMMENDATIONS TABLE
7 of 95

Power System Engineering
May 2019
1.4 Study Highlights
1.4.1 Short-Circuit
Of the 11 device locations evaluated for adequacy to interrupt or withstand the maximum three-phase short-circuit current to which they could be subjected, all were identified to be ADEQUATE.
1.4.2 Coordination
Setting recommendations have been made for adjustable devices to ensure optimum selectivity, reduce arc flash, or protect equipment. Time-current coordination (TCC) graphs were used to perform the evaluation for the overcurrent devices. Overall, the results showed that acceptable levels of selectivity were achieved among devices in the system.
The breakers in the system should be set to the recommended levels found in the Overcurrent Device Setting Tables section.
Recommendations for equipment changes can result in equipment which is larger in ampacity and/or physical footprint, may require changes to other parts of the electrical design (e.g., cable and conduit sizing), and could also impact the architectural design. When selective coordination, per NEC 700, is required, further analysis beyond the scope of this study will be necessary as well as possible equipment construction or design changes.
8 of 95

Power System Engineering
May 2019
1.4.3 Arc Flash
Equipment was analyzed to determine the level of arc flash incident energy to which a worker might be exposed during an arc flash event. The graph below shows the number of pieces of equipment for each IE level denoted in the key. It is not recommended to perform work on energized equipment.
Graph of arc flash hazard incident energy occurrence
Regardless of which IE calorie breakpoint levels are favored, or which NFPA 70E PPE selection table is used in this facility, a common approach is to use a clothing system with protection at 8 cal/cm2 and 40 cal/cm2. This method simplifies what workers must select/wear as well as what companies must issue to their employees and most importantly, will comply with NFPA 70E.
It is recognized that recommendations in this report may not be implemented simultaneously. It is the customer’s responsibility to apply and update labels as recommendations are implemented or as conditions change.
9 of 95

Power System Engineering
May 2019
2 INTRODUCTION
This report has the following components:
Studies were performed using nationally recognized electrical engineering analysis software.
The system short-circuit analysis evaluates the adequacy of the distribution equipment shown on the enclosed one-line diagrams to withstand or to interrupt the calculated maximum available short-circuit current at its location.
The overcurrent device time-current coordination analysis determines the suggested settings and, where appropriate, the ampere ratings and types for the electrical power system protective devices to achieve the desired system protection and electrical service continuity goals.
The arc flash analysis establishes the arc flash boundary around electrical equipment within which a worker exposed to an arcing fault would expect to receive 2nd degree burns if not adequately protected. The analysis also determines the incident energy levels at specific working distances from equipment, which can be used to select appropriate personal protective equipment (PPE) to be worn when working within the arc flash boundary.
This report supersedes and invalidates results from any prior study for the scope of equipment being reviewed.
Electrical system changes within the facility or in the utility system can have a significant impact on the results of this power system analysis, which is a “snapshot” of as-found system conditions. As such, it is recommended that this analysis be re-evaluated on a regular basis, not to exceed 5 years, to account for electrical system changes. NFPA 70B and 70E address the issue of equipment maintenance and failure to properly maintain equipment may invalidate these results
A “REFERENCES” section near the end of the report cites who supplied information or how the data was obtained. The majority of this data is filed with the project and has not been reproduced in this report. Abbreviations and trademarks referenced throughout this report are also listed in an appendix.
10 of 95

Power System Engineering
May 2019
3 STUDY DATA
3.1 Importance
The results of the study analyses are highly dependent on the accuracy of study data. Modifications or clarifications of study data will likely alter study results.
3.2 Estimates & Assumptions
Some assumptions, or estimates, were required and may affect the results of this study. In general, assumptions, or estimates, are needed because of limited access, safety concerns in obtaining equipment nameplate data, or lack of documentation. Significant differences between the assumptions, or estimates, listed here and actual values will require that this power system analysis be revised.
The following assumptions, or estimates, were made for the reasons given above:
1. Bussmann FRN-R fuses were assumed at L1 and L2 disconnect.
2. Motor loads fed by 3SA was estimated to be 25% of the main breaker rating rating.
11 of 95

Power System Engineering
May 2019
4 SHORT-CIRCUIT ANALYSIS
4.1 General Procedure
An electrical system short-circuit analysis is used for the following:
1) To compare the calculated maximum fault current with the interrupting ratings of overcurrent protective devices such as fuses and circuit breakers.
2) To investigate applicable short-circuit series ratings and the protection of electrical equipment by current-limiting devices.
3) To verify the adequacy of other equipment, such as switches and equipment bussing, to withstand the effects of the calculated maximum fault current levels.
4) To assist in the selection and/or determination of settings for relays, fuses and circuit breakers.
5) To provide input (along with device trip characteristics) to an arc flash hazard analysis.
This analysis calculates maximum available three-phase, RMS symmetrical, short-circuit amperes at each piece of equipment in the system. The calculation procedures are based on recommendations included in ANSI/IEEE/IEC standards: 399 (Brown Book), 551 (Violet Book), 62271-37-013 (supersedes C37.013), C37.04, C37.13, & C37.010.
The modeling software simulates a bolted three-phase fault at each point of consideration in the system and calculates the maximum available short-circuit current at that point without any reduction due to current-limiting overcurrent devices which may be present. (However, the effects of current-limiting devices are considered when determining the adequacy of the equipment.) The calculated short-circuit values are RMS symmetrical amperes and are comparable with the RMS symmetrical short-circuit ratings of electrical equipment.
Electrical distribution equipment must be able to withstand and/or interrupt the most severe fault duty that it may be subjected to at its location in the system. In particular, NEC Section 110.9 requires circuit breakers to have a rating sufficient for interrupting the maximum available fault current present at their line side terminals. For locations where calculated fault currents exceed the ratings of the equipment, recommendations for corrective actions are provided.
Equipment short-circuit withstand and interrupting ratings are expressed in symmetrical RMS current. However, fault currents are not purely symmetrical in practice, as system inductance introduces a degree of asymmetry for at least the first few cycles of a fault.
12 of 95

Power System Engineering
May 2019
The magnitude and duration of this asymmetrical component depends on several factors, including characteristics of system components (conductors, transformers, and loads) and the exact point on the current waveform that the fault begins—the level of asymmetry even differs from phase to phase in a three-phase system. Because of the uncertainty in asymmetry for a given fault event, the capability of devices to interrupt asymmetrical fault current is based on the maximum possible asymmetrical fault current level at the point of application. The more inductive the circuit, as measured by the calculated system X/R ratio, the more asymmetrical the fault current can be. If the calculated X/R level exceeds a certain level, then the increased asymmetrical duty must be taken into account when breaker ratings are assessed.
Low-voltage circuit breakers and fuses are tested to establish their interrupting ratings based on a circuit with a fixed X/R ratio, as defined in the various product standards (UL and ANSI). For example, an ANSI low-voltage power circuit breaker is tested in a circuit with an X/R ratio of 6.591. If such a breaker is applied at a system bus with a calculated X/R ratio of 6.591 or less and the calculated RMS symmetrical fault current is within the symmetrical interrupting rating of the breaker, then it is assumed that the breaker is also able to interrupt and withstand the asymmetrical current resulting from a fault at that location. If a low voltage breaker is applied at a location with an X/R ratio greater than that of the design test circuit, the calculated fault current must be multiplied by an adjustment factor that accounts for this. This resultant “fault duty,” which is greater than the calculated fault current, is then compared to the breaker’s interrupting rating in order to determine if the breaker is adequately rated. Different classes of low-voltage breakers have different test X/R values, and each type has its own set of multiplication factors. Design test circuit power factors and associated X/R ratios are as shown in Table 1. The low-voltage short-circuit output report shows the calculated fault duty levels calculated at each bus, and when these values differ from the calculated short-circuit current levels, they are used in the device evaluation tables. See IEEE 1015-1997, IEEE Recommended Practice for Applying Low-Voltage Circuit Breakers Used in Industrial and Commercial Power Systems, for additional details.
Table 1: Summary of Test Power Factor and X/R Values for LV Devices.
Device pf X/R RatioPower circuit breaker, unfused 0.15 6.591
Power circuit breaker, fused 0.20 4.899Molded case breaker, interrupting rating
greater than 20000 A 0.15-0.20 6.591-4.899
Molded case breaker, interrupting rating 10001 to 20000 A 0.25-0.30 3.9-3.18
Molded case breaker, interrupting rating 10000 A and less 0.45-0.50 2.0-1.732
For power circuit breakers, the power factors are taken from ANSI/IEEE C37.13. For molded case breakers, the power factors are taken from NEMA standard AB1. Since the NEMA standard specifies a range of test circuit power factors, the highest value (lowest
13 of 95

Power System Engineering
May 2019
X/R ratio) is used to determine the multiplying factor. This produces the most conservative (largest) factor.
The included one-line diagram is a simplified version of the system drawings, showing only those parts of the electrical system under consideration. The various circuit locations on the diagram have been labeled with bus identification numbers so input data could be supplied to the computer and the computer output could be readily interpreted.
14 of 95

Power System Engineering
May 2019
4.2 Data Used in the Calculations
4.2.1 Power Company Data
ONCOR has advised that the maximum available three-phase short-circuit current is 25.775kA at 208V. An X/R ratio of 8 was assumed for this current. These values determined the starting point for the analysis. No minimum or alternate switching levels were given.
4.2.2 Cable Data
The conductor (cable and/or busway) data used for each circuit segment are shown in the SHORT CIRCUIT INPUT/OUTPUT DATA appendix. Included are lengths, number per phase, size, conductor material, cable insulation type, conduit material and resistance and reactance values. Also, conductor lengths, number per phase, and size and conductor material are recorded on the one-line diagram.
Resistance values are based on 25 degrees Celsius (room temperature) rather than the full load temperature usually shown in descriptive literature because short-circuits can occur when the circuit is initially energized or lightly loaded as well as when fully loaded.
4.2.3 Motor Contribution to Short-Circuit Current
Motor contribution to the short-circuit current is taken into account in this short-circuit analysis. During the first few cycles of a fault, running motors act as generators and produce a current which will combine with the source short-circuit current flowing to the fault as illustrated in Figure 1. Sources may be, but are not limited to, the Power Company, local generators, or both.
Figure 1: Example motor contribution.
Connected motors shown on the study one-line were assumed to be running at the time of the fault. Motors fed by adjustable speed drives equipped with bypass contactors were considered to contribute to system fault currents as well. However, motors fed by drives without bypass contactors were not considered since they do not contribute to
15 of 95

Power System Engineering
May 2019
fault current. Redundant motors shown on the study one-line were also assumed to be running at the time of the fault unless operating controls prohibit these conditions.
A motor’s contribution to a fault at its terminals is equal to the full-load ampere (FLA) rating of the motor divided by its per-unit subtransient reactance, similar to the contribution from a generator. However, at the upstream switchboard, panelboard, or motor-control center, the fault contribution from the individual motors is reduced by the impedance of the motor branch circuit conductors. Since data on motor subtransient reactances and branch-circuit conductor lengths is often difficult to obtain, assumptions regarding the motors’ subtransient reactances are typically made when the system model is built.
For calculation of low-voltage fault duty, the contribution from induction motors and synchronous motors in the system are considered. For small induction motors (less than 50 hp) where the impedance of the installation (i.e., motor and conductor) is not known, a fault contribution of 4 times rated current, is estimated. Larger motors (50 hp and above) have an estimated fault contribution of 5 times rated current. This is consistent with recommendations in IEEE Std. 141, IEEE Recommended Practice for Electric Power Distribution for Industrial Plants (the IEEE Red Book).
If applicable, multiplying factors are adjusted per Table 7 of ANSI/IEEE C37.010, IEEE Application Guide for AC High-Voltage Circuit Breakers Rated on a Symmetrical Current Basis for medium/high voltage fault duty. The table also shows contributions from induction motors less than 50 hp to be neglected.
The motor short-circuit contribution is determined and included in the computer short-circuit analysis so that the results should represent the highest short-circuit current to which the equipment might be subjected.
Unless otherwise indicated in the SC Computer Input Tabulations appendix, some motor loads are modeled as lumped induction motors connected directly to the low voltage buses using the recommended subtransient reactance values from C37.010, C37.13, and IEEE Std. 141. These modeled values appear in the appendices.
16 of 95

Power System Engineering
May 2019
4.3 Short-Circuit Analysis Results
After making the calculations, the distribution equipment was checked to determine its adequacy to interrupt or withstand the effects of the calculated maximum short-circuit current at its location. For some solidly-grounded systems, like close-coupled unit substations and generator gear, it is possible the bolted three-phase fault current is not the maximum fault current. When applicable, the bolted line-to-ground fault current was considered instead. The results are listed in the "SHORT-CIRCUIT EVALUATION TABLE".
Short-circuit case description(s): 25.775kA at 208V with motors in service.
Listed in the tables are the calculated short-circuit currents at each piece of equipment and the ratings of the lowest rated device in the equipment enclosure.
For equipment evaluation, if a low voltage breaker is applied at a location with an X/R ratio greater than that of the design test circuit, the calculated fault current must be multiplied by an adjustment factor found in industry standards. Refer to the Summary of Test Power Factor and X/R Values for LV Devices table in the General Procedure section for more information.
Input data and short-circuit output data are included in the appendices.
17 of 95

Power System Engineering
May 2019
4.4 Short-Circuit Evaluation Table
18 of 95

DPARD Administrative Offices
Dallas,TX
POWER SYSTEM ENGINEERING REFER TO DRAWING
EQUIP. DESCRIPTION LOWEST RATED DEVICE MAXIMUM LINE SIDE LINE SIDE
BUS PER SYSTEM ONE NOMINAL IN EQUIPMENT ENCLOSURE AVAILABLE X/R MAXIMUM SERIES NOTES
NO. LINE DIAGRAM(S) L-L VOLTS TYPE AIC OR WCR SCA OR DUTY RATIO DEVICE RATING EVALUATION #
900 ECB 208 PG 65,000 26,138 6.61 Adequate
1000 MDP I 208 QG 65,000 19,386 4.75 Adequate
1005 DPA 208 QHB 65,000 14,484 2.34 Adequate
1010 L1A 208 QHB 65,000 13,863 2.19 Adequate
1015 1LB 208 QHB 65,000 6,439 1.21 Adequate
1020 1LC 208 QHB 65,000 3,809 1.01 Adequate
1025 2LA 208 QHB 65,000 8,481 1.40 Adequate
1035 L1 DISC 208 SCCR100 100,000 1,023 0.70 Adequate
1040 L1 208 QHB 65,000 1,016 0.70 Adequate
1045 L2 DISC 208 SCCR5 5,000 1,020 0.70 Adequate 1
1050 L2 208 SCCR5 5,000 1,011 0.70 Adequate 1
1. Evaluation based on industry standard 5kA minimum rating for panelboards and disconnect.
SHORT-CIRCUIT
EVALUATION TABLE
ETAP SCET Page 1 of 1
[Template Ver. 14.7]
19 of 95

Power System Engineering
May 2019
5 OVERCURRENT DEVICE COORDINATION ANALYSIS
5.1 General Procedure
An overcurrent device time-current coordination analysis is an organized effort to determine the settings and, where appropriate, the ampere ratings and types for the over-current protective devices in an electrical system. The objective of the coordination analysis is to establish time-current coordination among the devices, thereby achieving the desired system protection and electrical service continuity goals.
Maximum protection requires that the overcurrent protective devices be rated, selected, and adjusted to allow the normal load currents to flow while instantaneously opening the circuit when abnormal currents flow.
However, maximum service continuity requires that the overcurrent protective devices be rated, selected, and adjusted so that only the overcurrent protective device nearest the fault opens and isolates the faulted circuit from the system, permitting the rest of the system to remain in operation. Protective devices farther from the fault location should therefore essentially act as backup protection for the devices nearer to the fault, allowing the fault to be cleared with a minimum of disruption to the system. This is referred to as “coordination” between the protective devices. This may allow longer duration faults when the fault point is nearer the service entrance; however, such faults are not as common, and setting the protective devices to operate in this manner is generally more desirable than deenergizing most or all of the system for a fault near one of the loads.
Selecting and setting the overcurrent devices is a procedure where the time-current characteristic curves of the various devices in series are compared with one another on a log-log graph. This procedure should take into account boundaries defined by load currents, short-circuit currents, and ANSI and NEC requirements.
Coordination usually will be obtained when the log-log plots of time-current characteristics show sufficient clear space or no overlap between the curves for the protective devices operating in series. Coordination will often stop short of complete selectivity when an acceptable compromise is reached between the various boundaries imposed on the selecting and setting procedure.
As shown on the one-line diagram, each overcurrent protective device or motor under consideration by the program has been assigned an identification number so that the computer output could be readily interpreted.
20 of 95

Power System Engineering
May 2019
5.2 Specific Procedure
5.2.1 Short-Circuit Current Considerations
All protective device characteristic curves shown on the time-current graphs end at the calculated maximum short-circuit current at that device.
5.2.2 Molded Case Breaker Coordination
A molded case circuit breaker will trip with no intentional time delay for short-circuit currents above its instantaneous trip setting. Because of this, molded case breakers in series can only be selectively coordinated with each other if there is sufficient impedance between them so that the maximum available short-circuit current at the downstream breaker is less than the instantaneous trip setting of the upstream breaker. In Figure 2, breaker “C” illustrates this principle.
Figure 2: Example molded case breaker coordination.
21 of 95

Power System Engineering
May 2019
There is enough cable impedance to limit the maximum available short-circuit current at “C” to less than the instantaneous trip setting of either “A” or “B”. When molded case breakers are in series without sufficient impedance between them to permit complete coordination, e.g., a panel main breaker and one of the branch devices in the panel, the time-current curves will overlap in the high-current instantaneous trip region. This is illustrated by the overlap between the curves for devices “A” and “B” in Figure 2. Most molded case breakers exhibit some degree of current limitation that will often result in selective operation in the overlap region. Time-current coordination curves included in this report do not match the results from the latest edition of the Schneider Electric data bulletin 0100DB0501. The software used to generate the curves is incapable of accounting for the dynamic impedance the system has when two or more devices in series “see” a fault. The data bulletin takes the dynamic impedance introduced by the downstream device into account. Greater separation between the instantaneous settings may increase the likelihood that the two devices will operate selectively. The potential lack of coordination is generally not considered critical and can be avoided only by adopting a different and, in general, less economically practical design especially when the following are considered:
Most faults occur in equipment such as motors, lighting panels, and process control panels which typically are located at the end of branch circuits, significantly reducing fault level and thereby reducing or eliminating the possibility of non-selective operation.
Lower magnitude arcing faults in rotating machinery and lighting panels are statistically more common than bolted three-phase faults.
Ground faults are more common than three-phase faults. Maximum fault current is a random event depending on point-on-wave of the
fault occurrence and other factors. The device cutoff points on time-current coordination graphs are based on
bolted fault current levels which correspond to zero impedance. Typical fault current impedance is usually greater than zero so the actual fault current seen by overcurrent devices can be less than what is shown on the time-current coordination graphs.
Recommended breaker trip settings are given in the "OVERCURRENT DEVICE SETTING TABLE – LV CIRCUIT BREAKERS".
5.2.3 Transformer Protective Devices
If in the project scope, medium- and/or low-voltage transformer primary overcurrent protective devices were checked for compliance with NEC Article 450. Also, medium voltage protective devices, primary, secondary and secondary feeder, were evaluated with respect to the applicable ANSI/IEEE Through Fault Guides (C57.12.59 for dry and cast resin type and C57.109 for liquid immersed type) and the Appendix for ANSI/IEEE C37.91. Transformer standards define low-voltage transformers as having a primary
22 of 95

Power System Engineering
May 2019
voltage less than or equal to 600V. Transformer full load currents and magnetizing inrush currents were also considered.
If a transformer is subject to a through fault, thermal damage occurs to conductors and insulation due to resistive heating. Mechanical damage occurs to windings and structural components due to large magnetic forces associated with the fault current. In general, smaller transformers are assigned a single damage characteristic that accounts for both thermal and mechanical damage. Larger transformers are assigned a two-part characteristic with a thermal characteristic and a more restrictive mechanical characteristic. For the most conservative protection, the thermal-mechanical limits should be used. In many cases, it may be acceptable to use only the thermal characteristic, especially if the transformer is not subject to frequent through faults. Transformers connected to overhead secondary feeders should be considered to be subject to frequent through faults.
To evaluate through fault protection according to the ANSI Guides, the applicable curve was plotted representing a transformer's projected damage threshold for the cumulative effects of through faults. However, this ANSI through fault curve must be reduced for certain unbalanced secondary faults, because even though full short-circuit current is flowing in one or more secondary windings, the primary overcurrent device experiences less current.
Secondary line-to-neutral faults on delta-wye connected transformers produce only 0.577 of the maximum 3-phase fault current in the primary overcurrent device while one secondary winding experiences the full short-circuit current as illustrated in Figure 3 below. Therefore, to account for this fault condition, the ANSI through fault curve has been adjusted by a factor of 0.577. Both curves (three phase line-to-line and single phase line-to-neutral) are plotted on the time-current graphs.
Figure 3: Delta–Wye 3-PH and L-N fault current per unit values.
Since the through fault curves represent a transformer's projected damage threshold for the cumulative mechanical and thermal effects of through faults, all applicable primary and secondary overcurrent devices were checked to ensure interruption before these through fault curves were reached.
Further, to avoid nuisance interruptions, the primary overcurrent devices were also checked to ensure they will carry the transformers rated full load and equivalent magnetic inrush currents which are plotted on the time-current graphs.
23 of 95

Power System Engineering
May 2019
Because of the restrictions mentioned above, coordination between the transformer primary and secondary main devices may not exist for any transformers examined as shown by the overlapping of their characteristics on the time-current graphs. However, this is judged acceptable, because the opening of either device results in the same extent of service interruption.
5.2.4 Cable Protection
Feeder overcurrent protective devices were reviewed to verify the protection of their load side cables as shown on the one-line diagram in accordance with NEC Article 240.
However, the above analysis does not include any aspects of cable ampacity adjustment factors such as derating for conduit fill, elevated ambient temperature, and so on allowed by the NEC.
24 of 95

Power System Engineering
May 2019
5.3 Overcurrent Device Coordination Analysis Results
The basic results of an overcurrent device coordination analysis are the time-current coordination graphs which are plotted to illustrate the degree of coordination achieved in the system. Settings for devices which have adjustable characteristics are summarized in the appropriate overcurrent device setting tables. Smaller devices with fixed time-current characteristics are not shown on the graphs unless they directly affect the setting of an adjustable upstream device.
To generate the time-current graphs, a computer program was used which allows the power system engineer to determine optimum coordination, after first ensuring that loading and protection requirements are satisfied. The engineer’s objective is to determine the best coordination for the entire system. This approach necessitates tradeoffs in selectivity for some parts of the system to achieve maximum coordination in more critical areas. System protective zones involving transformer primary and secondary main devices, series devices in the same zone, or high current regions of molded case breakers may not show full device coordination.
25 of 95

Power System Engineering
May 2019
5.4 Overcurrent Device Setting Table
26 of 95

DEVICE SETTING TABLE DPARD Administrative Offices
LV CIRCUIT BREAKERS Dallas,TX
POWER SYSTEM ENGINEERING REFER TO DRAWING
Frame (A) Instantaneous
Sensor (A)Pickup
Setting
Pickup
SettingPickup Setting
Pickup
Setting
Model Rating Plug (A) Trip (A) Trip (A) Trip (A) Trip (A)
1000-01 DPA FDR 1000 MDP 0.24
Square-DLG (OR)
Micrologic 3.3 (PP)
400400
400 A400
44 x In1600
900-01 ECB 900 ECB 0.24Square-D
PGLET1.0I (PG)
12001200
fixed1200
Fixed3
3600
Short-Time Ground
Delay
Curve
Device ID Equipment Designation
ManufacturerMax
Voltage
(kV)
Long-Time
Delay
CurveBand Band I
2T
Delay
CurveBand I
2T
Frame, Sensor and Plug types must be verified to agree with this list prior to installing settings. I2t dial settings follow In = On and Out = Off.
LVCB - Page 1 of 1
[Form Ver. 1.5]27 of 95

Power System Engineering
May 2019
5.5 Time-Current Coordination Graphs
28 of 95
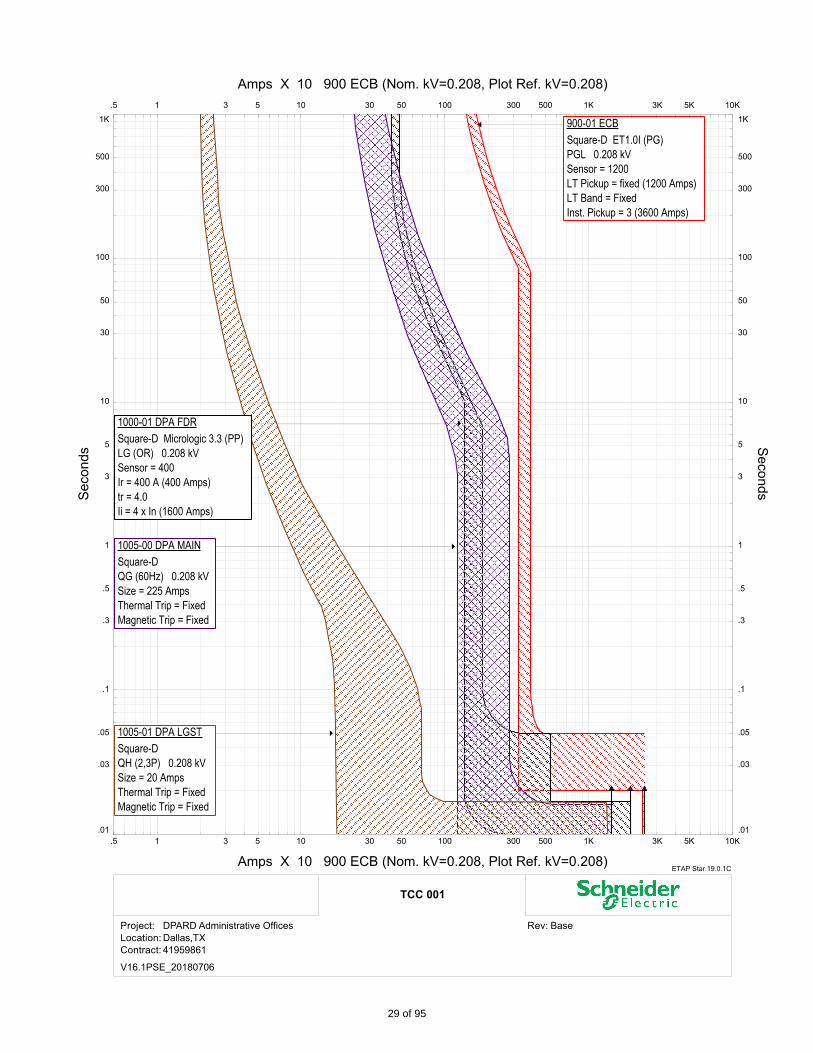
1005-01 DPA LGST
Square-D
QH (2,3P) 0.208 kV
Size = 20 Amps
Thermal Trip = Fixed
Magnetic Trip = Fixed
900-01 ECB
Square-D ET1.0I (PG)
PGL 0.208 kV
Sensor = 1200
LT Pickup = fixed (1200 Amps)
LT Band = Fixed
Inst. Pickup = 3 (3600 Amps)
1000-01 DPA FDR
Square-D Micrologic 3.3 (PP)
LG (OR) 0.208 kV
Sensor = 400
Ir = 400 A (400 Amps)
tr = 4.0
Ii = 4 x In (1600 Amps)
1005-00 DPA MAIN
Square-D
QG (60Hz) 0.208 kV
Size = 225 Amps
Thermal Trip = Fixed
Magnetic Trip = Fixed
10K.5 1 10 100 1K3 5 30 50 300 500 3K 5K
Amps X 10 900 ECB (Nom. kV=0.208, Plot Ref. kV=0.208)
10K.5 1 10 100 1K3 5 30 50 300 500 3K 5K
Amps X 10 900 ECB (Nom. kV=0.208, Plot Ref. kV=0.208)
1K
.01
.1
1
10
100
.03
.05
.3
.5
3
5
30
50
300
500
Seconds
1K
.01
.1
1
10
100
.03
.05
.3
.5
3
5
30
50
300
500
Seconds
ETAP Star 19.0.1C
TCC 001
Project: DPARD Administrative Offices
Location: Dallas,TX
Contract: 41959861
Rev: Base
V16.1PSE_20180706
29 of 95

1010-01 L1A LGST
Square-D
QH (2,3P) 0.208 kV
Size = 30 Amps
Thermal Trip = Fixed
Magnetic Trip = Fixed
1000-02 L1A FDR
Square-D
QG (60Hz) 0.208 kV
Size = 200 Amps
Thermal Trip = Fixed
Magnetic Trip = Fixed
900-01 ECB
Square-D ET1.0I (PG)
PGL 0.208 kV
Sensor = 1200
LT Pickup = fixed (1200 Amps)
LT Band = Fixed
Inst. Pickup = 3 (3600 Amps)
10K.5 1 10 100 1K3 5 30 50 300 500 3K 5K
Amps X 10 1010 L1A (Nom. kV=0.208, Plot Ref. kV=0.208)
10K.5 1 10 100 1K3 5 30 50 300 500 3K 5K
Amps X 10 1010 L1A (Nom. kV=0.208, Plot Ref. kV=0.208)
1K
.01
.1
1
10
100
.03
.05
.3
.5
3
5
30
50
300
500
Seconds
1K
.01
.1
1
10
100
.03
.05
.3
.5
3
5
30
50
300
500
Seconds
ETAP Star 19.0.1C
TCC 002
Project: DPARD Administrative Offices
Location: Dallas,TX
Contract: 41959861
Rev: Base
V16.1PSE_20180706
30 of 95

1020-01 1LC LGST
Square-D
QH (2,3P) 0.208 kV
Size = 30 Amps
Thermal Trip = Fixed
Magnetic Trip = Fixed
1000-04 1LC FDR
Square-D
Powerpact B-frame (60Hz) 0.208 kV
Size = 100 Amps
Thermal Trip = Fixed
Magnetic Trip = Fixed
900-01 ECB
Square-D ET1.0I (PG)
PGL 0.208 kV
Sensor = 1200
LT Pickup = fixed (1200 Amps)
LT Band = Fixed
Inst. Pickup = 3 (3600 Amps)
10K.5 1 10 100 1K3 5 30 50 300 500 3K 5K
Amps X 10 1020 1LC (Nom. kV=0.208, Plot Ref. kV=0.208)
10K.5 1 10 100 1K3 5 30 50 300 500 3K 5K
Amps X 10 1020 1LC (Nom. kV=0.208, Plot Ref. kV=0.208)
1K
.01
.1
1
10
100
.03
.05
.3
.5
3
5
30
50
300
500
Seconds
1K
.01
.1
1
10
100
.03
.05
.3
.5
3
5
30
50
300
500
Seconds
ETAP Star 19.0.1C
TCC 003
Project: DPARD Administrative Offices
Location: Dallas,TX
Contract: 41959861
Rev: Base
V16.1PSE_20180706
31 of 95

1000-07 WIREWAY FDR
Square-D
QG (60Hz) 0.208 kV
Size = 150 Amps
Thermal Trip = Fixed
Magnetic Trip = Fixed
1040-01 L1 LGST
Square-D
Powerpact H-frame (60Hz) 0.208 kV
Size = 40 Amps
Thermal Trip = Fixed
Magnetic Trip = Fixed
1035-01 L1 DISC
Bussmann
FRN-R (8/00) 0.208 kV
Time Delay 0.25 kV
150A
900-01 ECB
Square-D ET1.0I (PG)
PGL 0.208 kV
Sensor = 1200
LT Pickup = fixed (1200 Amps)
LT Band = Fixed
Inst. Pickup = 3 (3600 Amps)
10K.5 1 10 100 1K3 5 30 50 300 500 3K 5K
Amps X 10 1000 MDP I (Nom. kV=0.208, Plot Ref. kV=0.208)
10K.5 1 10 100 1K3 5 30 50 300 500 3K 5K
Amps X 10 1000 MDP I (Nom. kV=0.208, Plot Ref. kV=0.208)
1K
.01
.1
1
10
100
.03
.05
.3
.5
3
5
30
50
300
500
Seconds
1K
.01
.1
1
10
100
.03
.05
.3
.5
3
5
30
50
300
500
Seconds
ETAP Star 19.0.1C
TCC 004
Project: DPARD Administrative Offices
Location: Dallas,TX
Contract: 41959861
Rev: Base
V16.1PSE_20180706
32 of 95
Power System Engineering
May 2019
6 ARC FLASH HAZARD ANALYSIS
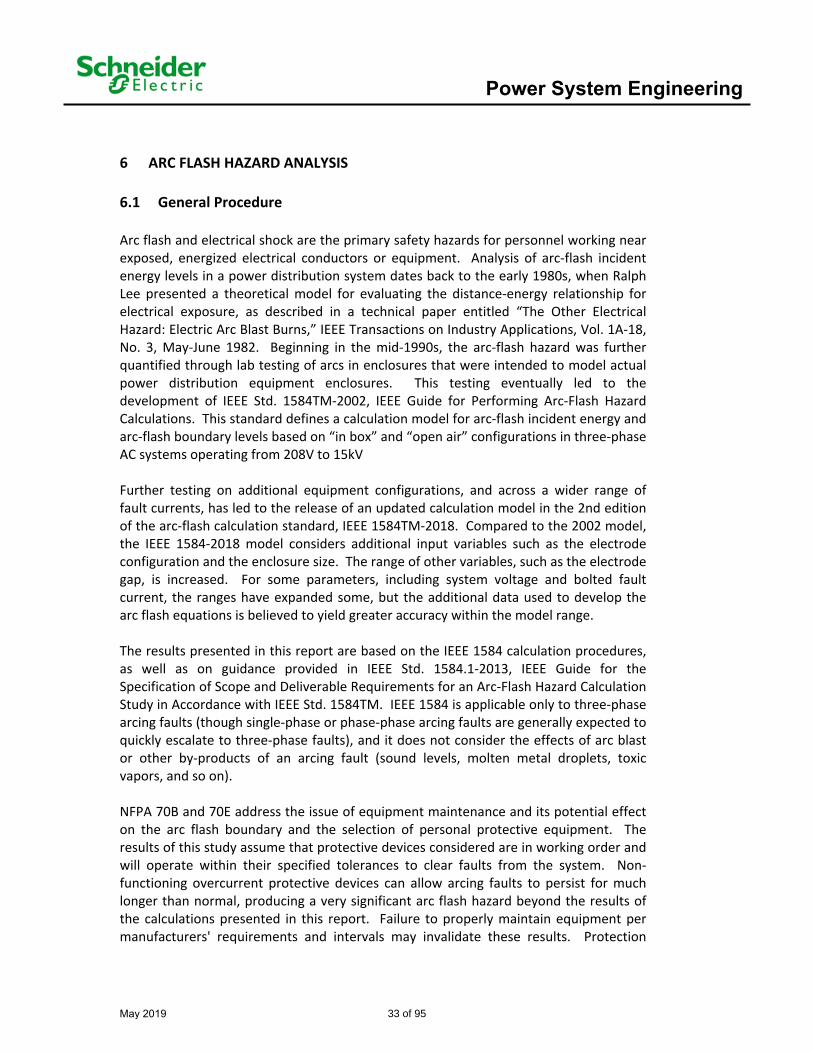
6.1 General Procedure
Arc flash and electrical shock are the primary safety hazards for personnel working near exposed, energized electrical conductors or equipment. Analysis of arc-flash incident energy levels in a power distribution system dates back to the early 1980s, when Ralph Lee presented a theoretical model for evaluating the distance-energy relationship for electrical exposure, as described in a technical paper entitled “The Other Electrical Hazard: Electric Arc Blast Burns,” IEEE Transactions on Industry Applications, Vol. 1A-18, No. 3, May-June 1982. Beginning in the mid-1990s, the arc-flash hazard was further quantified through lab testing of arcs in enclosures that were intended to model actual power distribution equipment enclosures. This testing eventually led to the development of IEEE Std. 1584TM-2002, IEEE Guide for Performing Arc-Flash Hazard Calculations. This standard defines a calculation model for arc-flash incident energy and arc-flash boundary levels based on “in box” and “open air” configurations in three-phase AC systems operating from 208V to 15kV
Further testing on additional equipment configurations, and across a wider range of fault currents, has led to the release of an updated calculation model in the 2nd edition of the arc-flash calculation standard, IEEE 1584TM-2018. Compared to the 2002 model, the IEEE 1584-2018 model considers additional input variables such as the electrode configuration and the enclosure size. The range of other variables, such as the electrode gap, is increased. For some parameters, including system voltage and bolted fault current, the ranges have expanded some, but the additional data used to develop the arc flash equations is believed to yield greater accuracy within the model range.
The results presented in this report are based on the IEEE 1584 calculation procedures, as well as on guidance provided in IEEE Std. 1584.1-2013, IEEE Guide for the Specification of Scope and Deliverable Requirements for an Arc-Flash Hazard Calculation Study in Accordance with IEEE Std. 1584TM. IEEE 1584 is applicable only to three-phase arcing faults (though single-phase or phase-phase arcing faults are generally expected to quickly escalate to three-phase faults), and it does not consider the effects of arc blast or other by-products of an arcing fault (sound levels, molten metal droplets, toxic vapors, and so on).
NFPA 70B and 70E address the issue of equipment maintenance and its potential effect on the arc flash boundary and the selection of personal protective equipment. The results of this study assume that protective devices considered are in working order and will operate within their specified tolerances to clear faults from the system. Non-functioning overcurrent protective devices can allow arcing faults to persist for much longer than normal, producing a very significant arc flash hazard beyond the results of the calculations presented in this report. Failure to properly maintain equipment per manufacturers' requirements and intervals may invalidate these results. Protection
33 of 95

Power System Engineering
May 2019
from arc flash hazards can best be provided by working only on circuits or equipment that have been placed in an electrically safe work condition.
The results of the arc flash analysis show both the calculated arc flash incident energy (AFIE) and arc flash boundary distances at each bus under study. In some locations, more than one value for AFIE levels and/or the arc flash boundary are given (e.g., one for the main section and one for the feeder sections of a switchgear lineup) to reflect different zones of protection for a given piece of equipment. Equipment warning labels or safety programs should take these variations in energy levels and arc flash boundaries into account.
For buses that represent low-voltage switchboards, panelboards, or most motor control centers, the values shown in the Arc Flash Hazard Analysis – Summary Tables assume that the fault is cleared by the upstream protective device, even if the equipment contains a main overcurrent protective device. This assumption is intended to produce conservative results and therefore cover the case where faults originating in such equipment may propagate to the line side of the local main. See the Arc Flash Specific Procedure for additional details regarding the analysis procedure.
Equipment should not be worked on unless it has been placed into an electrically safe work condition. Additional discussion of buses with incident energy over 40 cal/cm2 is given in the Arc Flash Analysis of Results, if applicable. Even though PPE with arc ratings of at least 140 cal/cm2 is commercially available, NFPA 70E does not define protective clothing classes with arc ratings above 40 cal/cm2, and many employers have used this level as a threshold above which no energized work is allowed under any conditions, due to the increased risk of non-burn injuries (e.g., concussions, hearing damage, or other internal injuries) at such high-energy locations.
The arc flash hazard analysis is no substitute for safe work practices. As stated in 130.7(A), Informational Note No. 1 of NFPA 70E, burn injuries can occur even when adequate PPE is employed, and arc rated PPE may provide little or no protection against arc blast and its effects. Protection from arc flash can best be provided by working only on circuits or equipment that has been placed in an electrically safe work condition.
34 of 95

Power System Engineering
May 2019
6.2 Specific Procedure
Arc-flash calculations are based primarily on the IEEE 1584-2018 model, with the key exceptions being locations operating above 15kV or for DC systems. First, the 2018 calculation model is applied to calculate the arcing fault current at each bus in the system based on the available three-phase bolted fault current determined during the short-circuit analysis. The arcing current level and the characteristics of the applicable phase overcurrent protective device are used to determine the arcing duration, i.e., the clearing time of the arcing fault, at each location. When applicable, clearing times are modified when there are special situations that may cause them to either speed up (e.g., presence of fast-acting optical arc-flash relays) or slow down (e.g., presence of a lockout relay, or communication delays that increase the total clearing time). The arcing fault current and clearing time values are then used to calculate an incident energy (IE) value. An Arcing Current Variation factor is applied to determine a minimum arcing current level for each bus. This is intended to account for typical variations in the characteristics of the arcs themselves. The minimum arcing current values are used to calculate a second clearing time and IE level. The result reported for each bus is the higher of the two values. Arc-flash boundary distances, which define the distance from the source of the arc where IE is equal to 1.2 cal/cm2 and within which arc-rated PPE is required, are estimated by a similar process.
As with the 2002 model, arc-flash levels under the 2018 calculation model are influenced by the selection of the bus gap, i.e., the distance between phase conductors or busbars, and the working distance, i.e., the distance from the source of the arc to the worker. Gap values can vary within equipment, and so standard values based on IEEE 1584-2018 Table 8 were used. Standard working distance values of 36” for MV equipment, 24” for LV switchgear, and 18” for other LV equipment were used.
The equipment electrode configuration, original to the 2018 model, can significantly affect calculation results. In the 2002 model, locations were defined as either “in box” or “open air”, with the “box” referring to an equipment enclosure, such as an MCC starter bucket. “In box” arcing faults produce higher IE values than “open air” arcs since the enclosure tends to focus energy towards the worker standing in front of an open equipment door or panel. In the 2018 model, there are five possible configurations – two open air (VOA or HOA) and three in-box (VCB, VCBB, or HCB). The difference between the two open-air configurations is the orientation of conductors relative to the worker – the VOA (vertical open air) configuration assumes electrodes oriented parallel to the worker, while the HOA (horizontal open air) assumes electrodes perpendicular to the worker. The horizontal configuration would tend to eject energy towards the worker and result in higher IE exposure – see Figure 4.
35 of 95

Power System Engineering
May 2019
Figure 4: Diagram Showing HOA Electrode Configuration (L) and Horizontal Electrodes Under Test (R). (From IEEE 1584-2018)
The three in-box configurations include two with vertical electrodes (VCB, VCBB) and one with horizontal electrodes (HCB). VCB and HCB are similar to VOA and HOA, except that the electrodes are inside a metallic enclosure. The second “B” in VCBB denotes that the conductors are terminated in an insulating barrier. This is a common situation – for example, consider conductors run to the top of a circuit breaker, in which case the breaker itself would be the insulating barrier. In some types of equipment, multiple electrode configurations are possible. When HCB is possible, it will represent the worst-case incident energy level, so no other cases are run. Where equipment can contain VCB and VCBB orientations, either one could produce worst-case incident energy, depending on other system parameters. For those buses, two study cases are run and the higher IE level is reported.
As discussed above, for arcs in an enclosure such as a switchgear breaker cubicle, more incident energy is directed at the worker due to the “focusing” effect of the enclosure. While this effect is considered in both versions of IEEE 1584, the 2018 model goes a step beyond 2002 in that it allows for adjustment of IE results based on enclosure opening size. Larger opening sizes indicate that less energy is focused towards the worker. The model adjustment is done by consideration of an Enclosure Correction Factor (ECF), which allows enclosure dimensions up to 49”. The effects of the ECF can be significant – a 49” x 49” opening would result in a 25% reduction in IE when the ECF is applied, though the actual effect varies slightly depending on the electrode configuration and system nominal voltage. While IEEE 1584-2018 provides default enclosure sizes that may be used in calculations, the ECF in this study is calculated from the typical enclosure dimension values determined based on review of several classes of equipment from multiple manufacturers per the following table.
A summary of study input parameters – electrode configurations, dimensions, gap, and working distances – are shown in Table 2 below.
36 of 95

Power System Engineering
May 2019
Table 2: Default Study Input Parameters.
Equipment Electrode Height Width Depth Working Gap
Type Config. (in.) (in.) (in.) Dist. (in.) (mm)
LV Equipment VCB + VCBB 20 20 20 18 25
LV Power Panel VCB + VCBB 48 26 8 18 25
LV Switchboard HCB 49 24 36 18 25
LV Switchgear HCB 20 20 20 24 32
5kV Equipment VCB + VCBB 20 20 20 36 104
5kV Switchgear HCB 45 36 36 36 104
5kV MCC VCB + VCBB 49 20 36 36 104
15kV Equipment VCB + VCBB 20 20 20 36 152
15kV Switchgear HCB 45 36 36 36 152
The “generic” types (e.g., LV Equipment, 5kV Equipment, and 15kV Equipment) include equipment that does not readily fit into the other categories, or particularly for the LV equipment, LV panelboard enclosures that are not appreciably different than the default 20x20x20 dimension. LV Power Panels include larger distribution panels like Square D I-Line panelboards. LV MCCs, where many MCC starter buckets of varying size may be present, would be analyzed as “LV Equipment” for the sake of simplicity.
For buses that represent low-voltage switchboards, panelboards, and most MCCs the values shown in the Flash Hazard tables assume that the fault is cleared by the upstream protective device, even if the equipment contains a main overcurrent protective device. Since this equipment typically lacks the internal barriers or compartments that are typical of switchgear construction, it may be possible for arcing faults—particularly those that originate close to the main section and that are not cleared instantaneously—to propagate to the line side of the main overcurrent protective device. If this happens, then the fault can no longer be cleared by the local main, but rather by the next upstream overcurrent protective device. In cases where the next upstream device is a fuse or relay on the primary side of a step-down transformer, the fault clearing time and resulting AFIE level can increase significantly. Specific equipment testing has not been performed to assess the risk of such fault propagation, but the assumption that the upstream device clears the fault produces conservative results.
Note: For most motor control centers it is assumed that the fault is cleared by the upstream protective device; however, for specific designs and conditions, some Model 6 MCCs may use the main breaker as the clearing device for certain distribution sections. This equipment is reviewed on a case by case basis at the time of the study.
37 of 95

Power System Engineering
May 2019
Ingress/egress should always be reviewed as part of the overall safety program as it cannot be solely determined by this analysis. However, some maximum arcing durations are cut off at 2.0 seconds. Clause 6.9 of IEEE 1584 recognizes that it is likely a worker exposed to an arcing fault will quickly move away from the source of the arc if physically possible, and states under such conditions that two seconds is a reasonable maximum arcing duration. Situations where such a cutoff might not be appropriate include workers in a lift bucket inspecting or operating overcurrent devices in elevated plug-in busway, or in other locations where clear ingress/egress is not available.
Neither the calculated incident energy levels nor the arc flash boundaries calculated as part of this analysis are relevant to the shock hazard that exists near all energized equipment. Shock hazard analyses may also be required before qualified employees can work on or near energized equipment. NFPA 70E defines shock hazard as “A dangerous condition associated with the possible release of energy caused by contact or approach to energized electrical conductors or circuit parts.” The standard also defines the Limited Approach Boundary as “An approach limit at a distance from an exposed energized electrical conductor or circuit part within which a shock hazard exists.” Only qualified employees can cross the Limited Approach Boundary and enter the limited space to perform a given task. A shock hazard analysis shall determine the voltage to which the personnel will be exposed, boundary requirements, and the personal protective equipment necessary to minimize the possibility of electric shock. In addition to the Limited Approach Boundary, the Restricted Approach Boundary is also applicable to situations in which qualified personnel are exposed to live parts. See NFPA 70E Tables 130.4(D)(a) and 130.4(D)(b) for the boundary distances associated with various system voltages.
38 of 95

Power System Engineering
May 2019
6.3 AF Hazard Analysis Results
The results of the arc flash hazard analysis are presented in the “ARC FLASH HAZARD ANALYSIS TABLE.” The parameters that the analysis is based upon—fault current, arc duration, electrode configuration and working distance—are presented along with the incident energy, and arc flash boundary for each piece of equipment. The electrode configuration shown is the one that resulted in the highest incident energy and arc-flash boundary levels.
The calculations are cut off at a maximum arcing duration of 2.0 seconds.
Overly conservative available fault current values should not be used solely for an arc flash analysis. Therefore, two arc flash fault current scenarios were considered. The results of all the scenarios were combined into one composite table showing the worst-case results for each piece of equipment evaluated. Arc Flash recommendations are summarized in the Study Recommendations section.
The first consisted of 25.775kA at 0.208kV, a maximum/high source based on an actual fault current with motor loads turned off.
The second consisted of 12.887kA at 0.208kV, a minimum/low source based on an assumed fault current with motor loads turned off.
IEEE 1584-2018 states that sustainable arcs are less likely in systems operating at 240V or less with less than 2kA available bolted fault current. Based on this, the incident energy level was assumed to be 1.2 cal/cm2 or less at such locations. The arc flash boundary at these locations is a maximum of 1 ft 6 in. A simplified label approach is sometimes adopted which uses 8 cal/cm2 and 40 cal/cm2 maximum breaks for labeling. The minimum 8 cal/cm2 incident energy level would use 5 ft 0 in. for the arc flash boundary distance.
For some buses, more than one AFIE value and arc flash boundary distance are provided. This is the case when various parts of a single piece of equipment may be in different arc flash “zones of protection.” For example, consider a lineup of low-voltage drawout switchgear containing both a main breaker and several feeder breakers. The compartmentalized switchgear construction would be expected to reduce the chance that faults in the feeder sections would propagate to the line-side of the main, so any fault occurring in a feeder section would be considered to be cleared by the main breaker. However, an arcing fault in the main section could either occur on the load side or the line side of the main, so such faults must be considered to be cleared by the next upstream protective device (e.g., the transformer primary overcurrent protective device). This results in different values for AFIE and for the arc flash boundary for such locations, possibly requiring different levels of PPE for workers depending on which section they are working on or near. In such cases, the results of both calculations are presented in the tables.
39 of 95

Power System Engineering
May 2019
Equipment should not be worked on unless it has been placed into an electrically safe work condition. While NFPA 70E does not explicitly prohibit work at locations with energy levels above 40 cal/cm2, research into the potential for non-burn injuries (internal injuries, hearing damage, etc.) indicates that these other injuries become a significant concern at such high-energy locations.
Locations with incident energy levels over 8 cal/cm2, or higher than the customer’s target level, are discussed in the Arc Flash Recommendations Table located in the Study Recommendations section.
6.3.1 Common Arc Flash Hazard Table Terms
The arc flash hazard table summarizes the results of the arc flash hazard analysis. The calculations are based on the protective relay and low voltage circuit breaker settings developed in previous sections. Following is a brief description of common arc flash hazard analysis terms.
Connected Bus (Bus Name): The designation for the equipment for which the arc-flash calculations are presented.
Location: the location within the equipment where the arc-flash results apply. For most locations, the location will be “Bus” and the values will apply for the entire equipment enclosure. For equipment with an isolated main protective device, separate results will be provided for the “Source PD”.
Type (Eqpt Type): This indicates the type of equipment in which the arc is assumed to occur, such as switchgear, panelboard, cable, or open air.
Electrode (Busbar) Configuration: The electrode configuration (VOA, HOA, VCB, VCBB, or HCB) upon which the calculation results are based. In locations where multiple electrode configurations are considered, this column will show which configuration resulted in worst-case incident energy levels.
Conductor (Arc) Gap: This is the gap between conductors. Since IEEE 1584-2018 considers three-phase faults, the phase-phase gap rather than the phase-ground gap is considered. Standard gap distances are defined in IEEE 1584.
Working Distance: The assumed distance from the arc point to the head and body of the worker positioned in place to perform the assigned task.
Output Rpt (Eqpt Configuration).: Identifies the analysis scenario upon which the reported values are based – e.g., “Generator Source” or “Alternate Utility”. In most cases, the levels are reported based on the scenario that results in the highest incident energy.
Incident Energy (Total Energy): The thermal energy density to which a person at the working distance is exposed.
40 of 95

Power System Engineering
May 2019
Arc Flash Boundary (AFB): This is the working distance at which incident energy equals 1.2 cal/cm2, considered to be the level which can produce second-degree burns on exposed skin. Any approach closer than the arc flash boundary requires use of personal protective equipment.
Final FCT (sec) or Trip/Delay Time: Fault Clearing Time (FCT); accounts for the device trip time plus the opening time of the device to clear the arc.
Protective Device Name (Source PD ID): The designation for the overcurrent protective device that clears the arcing fault. In cases where several sources are connected to a single bus (e.g., multiple mains, motor contribution to an MCC, etc.), the main device to operate is sometimes reported.
Prot. Dev. Arcing Fault / Ia at FCT (kA): The calculated bus arcing fault current associated with the bolted fault current.
Bus Bolted Fault (kA) / Total Ibf’’: The calculated three-phase bolted fault current, RMS symmetrical amperes.
6.3.2 Protective Arc Rated (AR) Clothing Characteristics
One fundamental principle of NFPA 70E is that work should not be performed on or near electrical equipment until it has been placed in an electrically safe work condition. Nevertheless, testing to verify equipment is “dead”, or energized work justified by exceptions in 70E, may still result in exposure of workers to electrical hazards. Selection of personal protective equipment (PPE) to help guard against hazards is always left up to the worker and the safety policy of the worker’s facility based on the type of exposure for a given task. Being in the same room with energized equipment does not necessarily constitute exposure; and in fact, it may be possible to perform some common tasks without being exposed. Refer to Table 130.5(C) Estimate of the Likelihood of Occurrence of an Arc Flash Incident for ac and dc Systems which is permitted to be used per the Risk Assessment Procedure specified in 70E, Article 110, when an incident energy analysis method has been performed.
Using PPE categories has been a convenient way to determine arc-rated (AR) clothing and other PPE, but there are other ways to decide what level of AR clothing is required. A simplified approach is to use a two-level clothing system, with protection at 8 cal/cm2 and 40 cal/cm2. This makes it easier for workers and companies by reducing the type of PPE issued and selected/worn.
Simplified AR clothing characteristics are based on NFPA 70E, Annex H, as shown in Table 2. Consult 70E and manufacturers’ AR specifications for additional requirements for hearing, face, and eye protection. The latest edition of 70E should be followed regarding limitations and requirements for working on equipment. Energized work requirements are restrictive and include mandatory energized work permits.
41 of 95

Power System Engineering
May 2019
Table 3: Simplified AR Clothing Characteristics
NFPA 70E has transformed over the years reflecting different approaches used to determine estimated incident energy and permits alternative choices for selecting PPE based on different incident energy levels. PPE categories have simplified and reduced over time as shown by the following tables. Many employers simplify things further to avoid giving each employee four or five different sets of PPE; and instead, use a two-level PPE approach as defined in Table H.2. A similar approach is possible for the incident energy analysis method. In 2017, NFPA 70E introduced Table 130.5(G), a two-level system used with a breakpoint of 12 cal/cm2; however, PPE with protection at 8 cal/cm2 and 40 cal/cm2 remains the most common AR clothing combination used. Site-specific PPE levels are permitted to be defined by an owner's electrical safe work practices per 70E – break points can be based on the PPE categories, or other PPE level break points. For selection of PPE, refer to the latest edition of NFPA 70E.
42 of 95

Power System Engineering
May 2019 43 of 95

Power System Engineering
May 2019 44 of 95

Power System Engineering
May 2019
6.3.3 Arc Flash Hazard Analysis Table – Recommended Settings
45 of 95

DPARD Administrative Offices
Dallas,TX
REFER TO DRAWING
POWER SYSTEM ENGINEERING BASED ON RECOMMENDED SETTINGS
Connected Bus Location kV TypeElectrode
Configuration
Conduct
or Gap
LL (mm)
Working
Distance LL
(in)
Output Rpt.Total Energy
(cal/cm²)
AFB (ft-
in)
Final
FCT
(sec)
Source PD IDIa at FCT
(kA)
Total Ibf''
(kA)
900 ECB Bus Arc Fault 0.208 Panelboard VCBB 25 18 AF H 70 14' 2" 2.000 12.400 23.6431000 MDP I Bus Arc Fault 0.208 Panelboard VCBB 25 18 AF H 1.12 1' 5" 0.050 900-01 ECB 9.703 18.4081005 DPA Bus Arc Fault 0.208 Panelboard VCBB 25 18 AF L 0.55 0' 12" 0.050 1000-01 DPA FDR 4.491 9.0101010 L1A Bus Arc Fault 0.208 Panelboard VCBB 25 18 AF H 0.29 0' 8" 0.016 1000-02 L1A FDR 6.908 13.3661015 1LB Bus Arc Fault 0.208 Panelboard VCBB 25 18 AF H 11.83 5' 4" 2.000 1000-03 1LB FDR 2.627 6.3391020 1LC Bus Arc Fault 0.208 Panelboard VCBB 25 18 AF L 6.14 3' 8" 2.000 1000-04 1LC FDR 1.463 3.1251025 2LA Bus Arc Fault 0.208 Panelboard VCB 25 18 AF L 12.10 6' 4" 2.000 1000-05 2LA FDR 2.708 6.172
1030 1LP (ETR) Bus Arc Fault 0.208 Panelboard VCBB 25 18 AF H 0.22 0' 7" 0.017 1000-06 1LP FDR 5.191 10.2881035 L1 DISC Bus Arc Fault 0.208 Panelboard VCB 25 18 AF H 1.20 1' 6" 0.383 1.020
1040 L1 Bus Arc Fault 0.208 Panelboard VCB 25 18 AF H 1.20 1' 6" 0.381 1.0141045 L2 DISC Bus Arc Fault 0.208 Panelboard VCB 25 18 AF H 1.20 1' 6" 0.382 1.018
1050 L2 Bus Arc Fault 0.208 Panelboard VCB 25 18 AF H 1.20 1' 6" 0.379 1.009
ARC FLASH HAZARD
ANALYSIS TABLE
AFH RECOMMENDED Page 1 of 1
[Form Ver. 2.0]
46 of 95

Power System Engineering
May 2019
6.4 Power System Engineering Arc Flash Labeling Practice
The Power System Engineering arc flash labeling practice will be used for this job. Labels for each piece of equipment, or for each section of multi-section equipment, will consist of two labels: (1) An Arc Flash Information label and (2) a general safety label. The Arc Flash Information label is printed with values produced by the arc flash hazard analysis and is field installed. The general safety label is factory installed on new Schneider Electric, Square D brand, equipment and will be provided for field installation on any electrical equipment (Square D or other) lacking these labels, or having existing safety labels not meeting the intent of these general safety labels.
6.4.1 Arc Flash Information Labels
The Arc Flash Information labels are printed with black letters on white polyester label stock (2 mil ±10%) using a thermal transfer printer. The labels have a pressure sensitive permanent acrylic adhesive backing (1 mil ±10%) and are 4.0-inches by 6.0-inches. Clear acrylic overlaminates (2 mil ±10%) are available for outdoor application where UV resistance is required. The following information is included on each label:
“Arc Flash Information” banner on the top of the label Incident Energy in cal/cm2
Arc Flash Boundary distance Working Distance Shock hazard when cover is open Limited Approach distance Restricted Approach distance Equipment name Arc Flash Analysis study (Q2C) number Arc Flash Analysis study date
The Arc Flash Information label (typical labels shown in Figure 5) will report the calculated incident energy and arc flash boundary for a given piece of equipment. Equipment names are on these labels as well as the information previously listed.
47 of 95

Power System Engineering
May 2019
Figure 5: Typical Arc Flash Information Labels – Actual sizes are 4” x 6”. Under 40 cal/cm2 (shown top); Over 40 cal/cm2 (shown bottom).
Once authorized, Arc Flash Information labels will be supplied.
Multiple labels for one piece of equipment are sometimes sent for a variety of reasons which may include but are not limited to the following: multiple sections of equipment, side/rear accessible equipment, equipment built to low-voltage Metal-Enclosed Switchgear or medium-voltage Metal-Clad Switchgear standards, and so on.
6.4.2 General Safety Labels
General safety labels (typical label shown in Figure 6) are applied to power distribution equipment to warn of general electrical hazards associated with shock, arc flash, and explosions, and to instruct workers to turn off power prior to work. The labels remind workers to de-energize equipment prior to work.
New Schneider Electric, Square D brand, factory installed general safety labels vary in size, wording and physical characteristics, but convey the safety message outlined
48 of 95

Power System Engineering
May 2019
below. General safety labels provided for field installation are printed with black letters (unless otherwise noted below) on white polyester label stock (2 mil ±10%) with UV resistant lamination (3 mil ±10%). The labels have a pressure sensitive permanent acrylic adhesive backing (1 mil ±10%) and are 3.6-inches by 3.6-inches. The following information is printed on each label:
a. A safety symbol/pictorial (ANSIMan - figure of a person contacting an energized conductor) in the upper left corner of the label.
b. A header in ANSI “Safety Red” with white lettering consisting of a safety alert symbol (an “!” inside a triangle) preceding the signal word “DANGER”.
c. HAZARD OF ELECTRIC SHOCK, EXPLOSION OR ARC FLASHd. Apply appropriate personal protective equipment (PPE) and follow safe
electrical work practices. See NFPA 70E.e. This equipment must be installed and serviced only by qualified electrical
personnel.f. Turn off all power supplying this equipment before working on or inside
equipment.g. Always use a properly rated voltage sensing device to confirm power is off.h. Replace all devices, doors and covers before turning on power to this
equipment.i. Failure to follow these instructions will result in death or serious injury.
For Square D brand equipment manufactured in 2006 or more recently, general safety labels do not need to be affixed. General safety labels prior to 2006 lack the words “OR ARC FLASH” in the warning statement. In 2014, REV 01 was issued which added “or CSA Z462” to the label.
For older Square D brand equipment lacking appropriate general safety labels, or for equipment manufactured by others, affix Schneider Electric general safety labels (Figure 6) as close as possible to the Arc Flash Information labels – DO NOT REMOVE OR COVER UP EXISTING SAFETY LABELS (ONES HAVING THE WORDS: DANGER, WARNING, OR CAUTION).
49 of 95

Power System Engineering
May 2019
Figure 6: Typical General Safety Label for Electrical Equipment (Actual size is 3.6” x 3.6”).
50 of 95

Power System Engineering
May 2019
APPENDIX A: ABBREVIATIONS AND TRADEMARKS
Organizations and StandardsANSI American National Standards InstituteIEEE Institute of Electrical and Electronics EngineersICEA Insulated Cable Engineers AssociationNEC National Electrical Code (NFPA No. 70)NEMA National Electrical Manufacturers AssociationNFPA National Fire Protection AssociationUL Underwriters' Laboratories, Inc.
Other Abbreviations1P 1-Pole or single-phase3P 3-Pole or three-phaseA Amperes (RMS symmetrical)AFB Arc Flash BoundaryAFIE Arc Flash Incident Energy (cal/cm2)AIC Amperes Interrupting Capacity
(Three-Phase RMS sym.)AMS Alternate Maintenance Setting (switch)ASD Adjustable Speed ac DriveATPV Protective Clothing Arc RatingATS Automatic Transfer SwitchBOM Bill of MaterialsCB Circuit BreakerCHP Combined HorsepowerCFLA Combined Full Load AmperesCT Current TransformerDC Direct CurrentFLA Full Load AmperesERMS Energy Reduction Maintenance SwitchHP HorsepowerIL Max. Demand Load Current at PCCISC Short-Circuit Current at PCCkVA Kilovolt-AmperekVAm Kilovolt-Amperes of Motor Short
Circuit contributionkW KilowattL-L Line-To-LineLRA Locked-Rotor AmperesLV Low VoltageLSIG L = Long Time, S = Short time,
I = Instantaneous, G = Ground fault protection
MCC Motor Control CenterMCS Molded Case SwitchMDGF Modified-Differential Ground FaultMohms MilliohmsMTS Manual Transfer SwitchMV Medium VoltageOCPD Overcurrent Protective DeviceOL OverloadPCC Point of Common CouplingPF Power FactorPPE Personal Protective EquipmentPWM Pulse Width ModulatedR ResistanceRMS Root-Mean-Square
51 of 95

Power System Engineering
May 2019
SCA Short-Circuit AmperesSCAm Short-Circuit Amperes of Motor
ContributionSCCR Short-Circuit Current RatingSF Service FactorSLG Single Line to Groundsym. SymmetricalTCC Time Current Coordination graphTCR Trip Current RatingTDD Total Demand DistortionTHD Total Harmonic DistortionV Line-To-Line Volts (RMS sym.)VFD Variable Frequency DriveWCR Withstand Current RatingX ReactanceZ ImpedanceZSI Zone Selective Interlocking%Z Percent Impedance
52 of 95

Power System Engineering
May 2019
TrademarksBOLT-LOC, ECONOPAK, EZ METER-PAK, GROUND CENSOR, I-LIMITER, I-LINE, ISO-FLEX, MAG-GARD, MICROLOGIC, MINI POWER-ZONE, OMEGAPAK, POWER-CAST, POWER STYLE, POWER ZONE, QF, QO, QWIK-GARD, SORGEL, SPEED-D, SQUARE D, VACARC and WATCHDOG are registered trademarks of Schneider Electric North America. I-75,000, METER-PAK, and PZ-8 are trademarks of Schneider Electric North America.
Company Abbreviations
Allen-Bradley A-BAllis-Chalmers A-CASEA Brown Boveri ABBAutomatic Switch Co ASCOBasler BASBussmann BUSSChallenger CHACooper COOPCutler – Hammer C-HEconomy Fuse ECONFederal Pacific Electric FPEG & W Electric G&WGeneral Electric GEGould Shawmut GSI-T-E Imperial ITEKearney KEAKlockner KLOLittelfuse LITMcGraw Edison MEMerlin Gerin MGPowell POWReliance RELRTE Corp. RTERusselectric RUSSS & C Electric S&CSchneider Electric SESchweitzer Engr. Labs SELSiemens SIESquare D SQDThomas Betts T-BToshiba TOSWestinghouse WESTZenith Z
53 of 95

Power System Engineering
May 2019
APPENDIX B: SHORT CIRCUIT INPUT/OUTPUT DATA
54 of 95

Study Case: SC UtilMax Revision: Base
Config.: CFG UTIL
V16.1PSE_20180706
Project: DPARD Administrative Offices Page: 1
Date: 03-27-2019
SN: SCHNDR-CA3
16.1.0C
ETAP
Filename: DPARD Admin Offices
Engineer:
Contract: 41959861
Location: Dallas,TX
Electrical Transient Analyzer Program
Short-Circuit Analysis
ANSI Standard
3-Phase, LG, LL, & LLG Fault Currents
1/2 Cycle Network
Number of Buses:
Number of Branches:
Number of Machines:
Total
13
Tie PD
Total
2
0
Impedance
Lumped
Load
0
0
Total
Induction
Machines
1
Line/Cable
13
14
Load
Synchronous
Motor
0
Reactor
0
13
V-Control
1
Power
Grid
XFMR3
0
0
Swing
Synchronous
Generator
0
XFMR2
0
1
Unit System:
Project Filename:
Output Filename:
System Frequency: 60.00
English
DPARD Admin Offices
C:\Users\SESA487537\Box Sync\Project_Pramod\Projects 2019\41959861 - DPARD Admin
Offices\ETAP\SC.SA2S
55 of 95
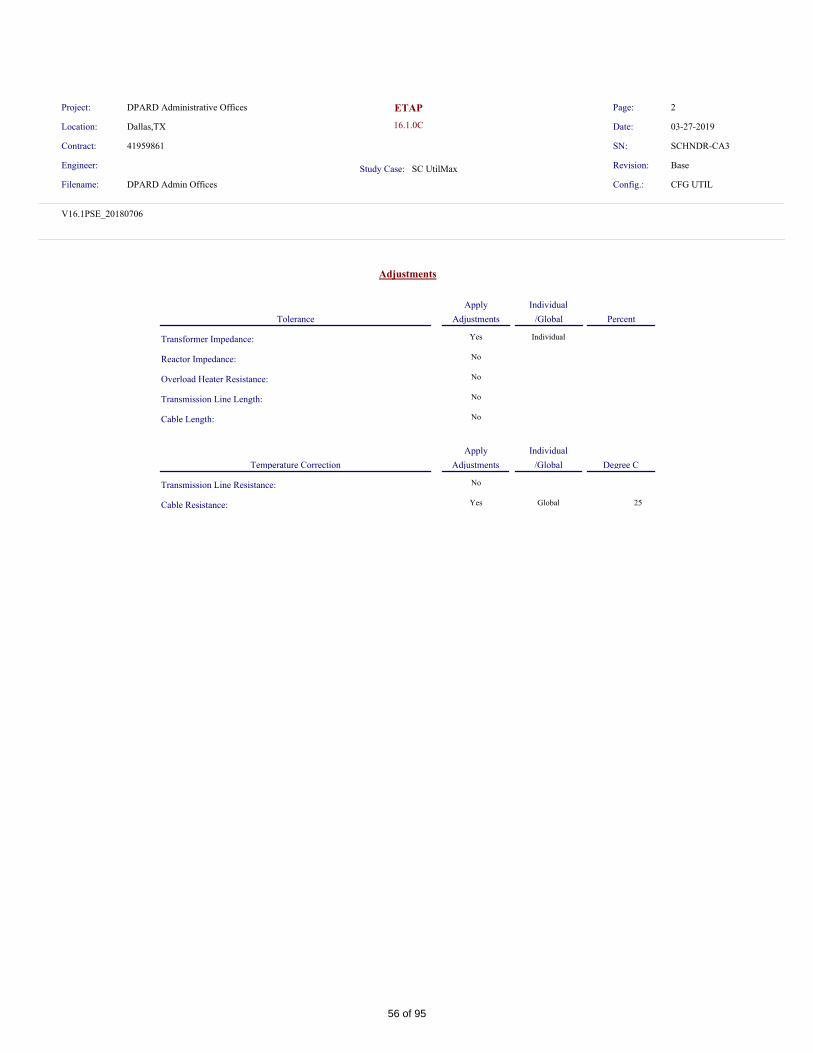
Study Case: SC UtilMax Revision: Base
Config.: CFG UTIL
V16.1PSE_20180706
Project: DPARD Administrative Offices Page: 2
Date: 03-27-2019
SN: SCHNDR-CA3
16.1.0C
ETAP
Filename: DPARD Admin Offices
Engineer:
Contract: 41959861
Location: Dallas,TX
Adjustments
Transformer Impedance:
Reactor Impedance:
Tolerance
Overload Heater Resistance:
Transmission Line Length:
Cable Length:
Temperature Correction
Transmission Line Resistance:
Cable Resistance:
Percent
Degree C
25
Individual
/Global
Individual
/Global
Global
Individual
Apply
Adjustments
Apply
Adjustments
Yes
No
No
No
No
No
Yes
56 of 95

Study Case: SC UtilMax Revision: Base
Config.: CFG UTIL
V16.1PSE_20180706
Project: DPARD Administrative Offices Page: 3
Date: 03-27-2019
SN: SCHNDR-CA3
16.1.0C
ETAP
Filename: DPARD Admin Offices
Engineer:
Contract: 41959861
Location: Dallas,TX
Bus Input Data
ID Type
Bus Initial Voltage
%Mag. Ang.Sub-sysBase kVNom. kV
0.208 0.208Load900 ECB 1 100.00 0.00
0.208 0.208Load1000 MDP 1 100.00 0.00
0.208 0.208Load1005 DPA 1 100.00 0.00
0.208 0.208Load1010 L1A 1 100.00 0.00
0.208 0.208Load1015 1LB 1 100.00 0.00
0.208 0.208Load1020 1LC 1 100.00 0.00
0.208 0.208Load1025 2LA 1 100.00 0.00
0.208 0.208Load1030 1LP (ETR) 1 100.00 0.00
0.208 0.208Load1035 L1 DISC 1 100.00 0.00
0.208 0.208Load1040 L1 1 100.00 0.00
0.208 0.208Load1045 L2 DISC 1 100.00 0.00
0.208 0.208Load1050 L2 1 100.00 0.00
0.208 0.208SWNGBus1 1 100.00 0.00
0.208 0.208LoadWIRE WAY 1 100.00 0.00
14 Buses Total
All voltages reported by ETAP are in % of bus Nominal kV.
Base kV values of buses are calculated and used internally by ETAP.
57 of 95

Study Case: SC UtilMax Revision: Base
Config.: CFG UTIL
V16.1PSE_20180706
Project: DPARD Administrative Offices Page: 4
Date: 03-27-2019
SN: SCHNDR-CA3
16.1.0C
ETAP
Filename: DPARD Admin Offices
Engineer:
Contract: 41959861
Location: Dallas,TX
Line/Cable Input Data
ID Library Size #/Phase T (°C) R1 X1 Y1
Line/Cable
R0 X0 Y0
ohms or siemens per 1000 ft per Conductor (Cable) or per Phase (Line)
Adj. (ft) % Tol.
Length
Cable1 0.6MCUN1 600 9.0 3 0.0209612 0.048 0.0660279 0.11808 25 0.0
Cable11 0.6MCUN1 600 9.0 3 0.0209612 0.048 0.0660279 0.11808 25 0.0
Cable12 0.6MCUN1 3/0 70.0 1 0.0662375 0.052 0.2086481 0.12792 25 0.0
Cable13 0.6MCUN1 3/0 35.0 1 0.0662375 0.052 0.2086481 0.12792 25 0.0
Cable14 0.6MCUN1 3/0 125.0 1 0.0662375 0.052 0.2086481 0.12792 25 0.0
Cable15 0.6MCUN1 3/0 220.0 1 0.0662375 0.052 0.2086481 0.12792 25 0.0
Cable16 0.6MCUN1 3/0 120.0 1 0.0662375 0.052 0.2086481 0.12792 25 0.0
Cable17 0.6MCUN1 3/0 70.0 1 0.0662375 0.052 0.2086481 0.12792 25 0.0
Cable18 0.6MCUN1 3/0 9.0 2 0.0662375 0.052 0.2086481 0.12792 25 0.0
Cable19 0.6MCUN1 3/0 9.0 1 0.0662375 0.052 0.2086481 0.12792 25 0.0
Cable21 0.6MCUN1 3/0 9.0 1 0.0662375 0.052 0.2086481 0.12792 25 0.0
Cable22 0.6MCUN1 1/0 9.0 1 0.1006139 0.055 0.3169338 0.1353 25 0.0
Cable23 0.6MCUN1 1/0 9.0 1 0.1006139 0.055 0.3169338 0.1353 25 0.0
Line / Cable resistances are listed at the specified temperatures.
58 of 95

Study Case: SC UtilMax Revision: Base
Config.: CFG UTIL
V16.1PSE_20180706
Project: DPARD Administrative Offices Page: 5
Date: 03-27-2019
SN: SCHNDR-CA3
16.1.0C
ETAP
Filename: DPARD Admin Offices
Engineer:
Contract: 41959861
Location: Dallas,TX
Branch Connections
ID From Bus To Bus R X ZType
CKT/Branch % Impedance, Pos. Seq., 100 MVAbConnected Bus ID
Y
Cable1 Bus1 14.53 33.28 36.32900 ECBCable
Cable11 900 ECB 14.53 33.28 36.321000 MDPCable
Cable12 1000 MDP 1071.71 841.35 1362.501005 DPACable
Cable13 1000 MDP 535.85 420.67 681.251010 L1ACable
Cable14 1000 MDP 1913.76 1502.40 2433.041015 1LBCable
Cable15 1000 MDP 3368.22 2644.23 4282.151020 1LCCable
Cable16 1000 MDP 1837.21 1442.31 2335.721025 2LACable
Cable17 1000 MDP 1071.71 841.35 1362.501030 1LP (ETR)Cable
Cable18 1000 MDP 68.90 54.09 87.59WIRE WAYCable
Cable19 WIRE WAY 137.79 108.17 175.181035 L1 DISCCable
Cable21 1035 L1 DISC 137.79 108.17 175.181040 L1Cable
Cable22 WIRE WAY 209.30 114.41 238.531045 L2 DISCCable
Cable23 1045 L2 DISC 209.30 114.41 238.531050 L2Cable
59 of 95

Study Case: SC UtilMax Revision: Base
Config.: CFG UTIL
V16.1PSE_20180706
Project: DPARD Administrative Offices Page: 6
Date: 03-27-2019
SN: SCHNDR-CA3
16.1.0C
ETAP
Filename: DPARD Admin Offices
Engineer:
Contract: 41959861
Location: Dallas,TX
Power Grid Input Data
kV X/R R X
Rating 100 MVA Base
MVASC
% Positive Seq. Impedance
ID ID
Power Grid Connected Bus% Zero Seq. Impedance
X/R R0 X0
100 MVA BaseGrounding
Type
UTILITY 0.208Bus1 9.286 133.57360 1068.58900 8.00 133.573600 1068.58900 8.00Wye - Solid
Total Power Grids (= 1 ) 9.286 MVA
60 of 95

Study Case: SC UtilMax Revision: Base
Config.: CFG UTIL
V16.1PSE_20180706
Project: DPARD Administrative Offices Page: 7
Date: 03-27-2019
SN: SCHNDR-CA3
16.1.0C
ETAP
Filename: DPARD Admin Offices
Engineer:
Contract: 41959861
Location: Dallas,TX
Induction Machine Input Data
Induction Machine
ID kVA kV RPM X"/R % R % X'% X"
Rating (Base) Positive Seq. Imp.
Type Qty Type Amp X/R % R0 % X0
Grounding Zero Seq. Imp.
Conn.
4ASSUMED MOTORS 0.208 1800 5.567 27.83 9999.00 27.83WyeMotor Open 5.00 24.99 5.00 5.57
Total Connected Induction Machines ( = 4 ): 100.0 kVA
61 of 95

Study Case: SC UtilMax Revision: Base
Config.: CFG UTIL
V16.1PSE_20180706
Project: DPARD Administrative Offices Page: 8
Date: 03-27-2019
SN: SCHNDR-CA3
16.1.0C
ETAP
Filename: DPARD Admin Offices
Engineer:
Contract: 41959861
Location: Dallas,TX
SHORT- CIRCUIT REPORT
ID Symm. rmsFrom BusID Va
From Bus To Bus % V kA % Voltage at From Bus
Contribution 3-Phase Fault Looking into "From Bus"
Vb Vc Ia 3I0 R1 X1 R0 X0
kA Symm. rms % Impedance on 100 MVA base
Line-To-Ground Fault
Positive & Zero Sequence Impedances
Fault at bus: 900 ECB
Prefault voltage = 0.208 kV = 100.00 % of nominal bus kV ( 0.208 kV)
= 100.00 % of base kV ( 0.208 kV)
900 ECB Total 0.00 25.941 0.00 100.91 102.00 25.201 1.79E+002 1.15E+003 25.201 1.45E+002 1.06E+003
Bus1 900 ECB 3.27 24.966 4.95 100.70 100.53 24.570 1.79E+002 1.15E+003 25.201 1.48E+002 1.10E+003
1000 MDP 900 ECB 0.13 0.976 0.08 100.93 102.03 0.632 0.000 5.58E+003 2.79E+004
# Indicates fault current contribution is from three-winding transformers
* Indicates a zero sequence fault current contribution (3I0) from a grounded Delta-Y transformer
62 of 95

Study Case: SC UtilMax Revision: Base
Config.: CFG UTIL
V16.1PSE_20180706
Project: DPARD Administrative Offices Page: 9
Date: 03-27-2019
SN: SCHNDR-CA3
16.1.0C
ETAP
Filename: DPARD Admin Offices
Engineer:
Contract: 41959861
Location: Dallas,TX
ID Symm. rmsFrom BusID Va
From Bus To Bus % V kA % Voltage at From Bus
Contribution 3-Phase Fault Looking into "From Bus"
Vb Vc Ia 3I0 R1 X1 R0 X0
kA Symm. rms % Impedance on 100 MVA base
Line-To-Ground Fault
Positive & Zero Sequence Impedances
Fault at bus: 1000 MDP
Prefault voltage = 0.208 kV = 100.00 % of nominal bus kV ( 0.208 kV)
= 100.00 % of base kV ( 0.208 kV)
1000 MDP Total 0.00 25.181 0.00 101.18 103.31 24.089 2.25E+002 1.23E+003 24.089 1.59E+002 1.09E+003
900 ECB 1000 MDP 3.17 24.205 4.73 100.92 101.91 23.467 2.25E+002 1.23E+003 24.089 1.63E+002 1.14E+003
1005 DPA 1000 MDP 0.00 0.000 0.00 101.18 103.31 0.000 0.000
1010 L1A 1000 MDP 0.00 0.000 0.00 101.18 103.31 0.000 0.000
1015 1LB 1000 MDP 0.00 0.000 0.00 101.18 103.31 0.000 0.000
1020 1LC 1000 MDP 0.00 0.000 0.00 101.18 103.31 0.000 0.000
1025 2LA 1000 MDP 0.00 0.000 0.00 101.18 103.31 0.000 0.000
1030 1LP (ETR) 1000 MDP 0.00 0.000 0.00 101.18 103.31 0.000 0.000
WIRE WAY 1000 MDP 0.00 0.000 0.00 101.18 103.31 0.000 0.000
ASSUMED MOTORS 1000 MDP 100.00 0.978 100.00 100.00 100.00 0.623 0.000 5.57E+003 2.78E+004
# Indicates fault current contribution is from three-winding transformers
* Indicates a zero sequence fault current contribution (3I0) from a grounded Delta-Y transformer
63 of 95

Study Case: SC UtilMax Revision: Base
Config.: CFG UTIL
V16.1PSE_20180706
Project: DPARD Administrative Offices Page: 10
Date: 03-27-2019
SN: SCHNDR-CA3
16.1.0C
ETAP
Filename: DPARD Admin Offices
Engineer:
Contract: 41959861
Location: Dallas,TX
ID Symm. rmsFrom BusID Va
From Bus To Bus % V kA % Voltage at From Bus
Contribution 3-Phase Fault Looking into "From Bus"
Vb Vc Ia 3I0 R1 X1 R0 X0
kA Symm. rms % Impedance on 100 MVA base
Line-To-Ground Fault
Positive & Zero Sequence Impedances
Fault at bus: 1005 DPA
Prefault voltage = 0.208 kV = 100.00 % of nominal bus kV ( 0.208 kV)
= 100.00 % of base kV ( 0.208 kV)
1005 DPA Total 0.00 12.118 0.00 109.04 123.71 8.872 3.60E+003 3.30E+003 8.872 1.23E+003 1.93E+003
1000 MDP 1005 DPA 59.48 12.118 71.10 101.19 100.44 8.872 3.60E+003 3.30E+003 8.872 1.23E+003 1.93E+003
# Indicates fault current contribution is from three-winding transformers
* Indicates a zero sequence fault current contribution (3I0) from a grounded Delta-Y transformer
64 of 95
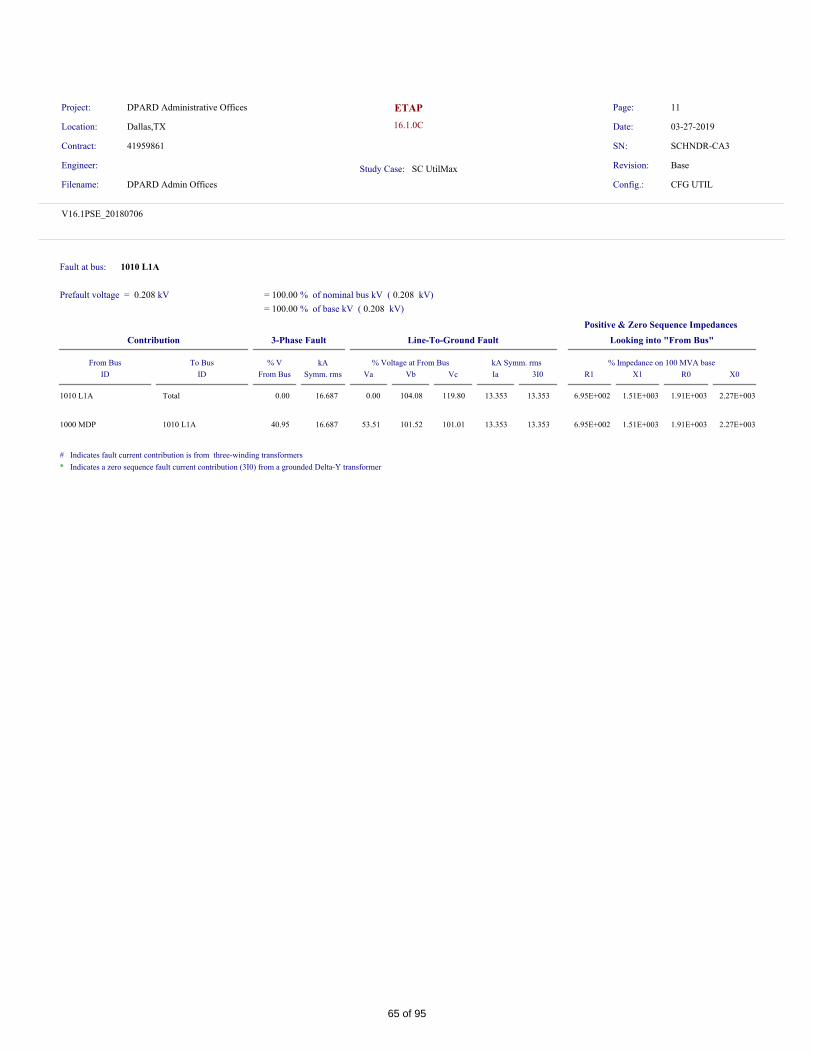
Study Case: SC UtilMax Revision: Base
Config.: CFG UTIL
V16.1PSE_20180706
Project: DPARD Administrative Offices Page: 11
Date: 03-27-2019
SN: SCHNDR-CA3
16.1.0C
ETAP
Filename: DPARD Admin Offices
Engineer:
Contract: 41959861
Location: Dallas,TX
ID Symm. rmsFrom BusID Va
From Bus To Bus % V kA % Voltage at From Bus
Contribution 3-Phase Fault Looking into "From Bus"
Vb Vc Ia 3I0 R1 X1 R0 X0
kA Symm. rms % Impedance on 100 MVA base
Line-To-Ground Fault
Positive & Zero Sequence Impedances
Fault at bus: 1010 L1A
Prefault voltage = 0.208 kV = 100.00 % of nominal bus kV ( 0.208 kV)
= 100.00 % of base kV ( 0.208 kV)
1010 L1A Total 0.00 16.687 0.00 104.08 119.80 13.353 1.91E+003 2.27E+003 13.353 6.95E+002 1.51E+003
1000 MDP 1010 L1A 40.95 16.687 53.51 101.52 101.01 13.353 1.91E+003 2.27E+003 13.353 6.95E+002 1.51E+003
# Indicates fault current contribution is from three-winding transformers
* Indicates a zero sequence fault current contribution (3I0) from a grounded Delta-Y transformer
65 of 95

Study Case: SC UtilMax Revision: Base
Config.: CFG UTIL
V16.1PSE_20180706
Project: DPARD Administrative Offices Page: 12
Date: 03-27-2019
SN: SCHNDR-CA3
16.1.0C
ETAP
Filename: DPARD Admin Offices
Engineer:
Contract: 41959861
Location: Dallas,TX
ID Symm. rmsFrom BusID Va
From Bus To Bus % V kA % Voltage at From Bus
Contribution 3-Phase Fault Looking into "From Bus"
Vb Vc Ia 3I0 R1 X1 R0 X0
kA Symm. rms % Impedance on 100 MVA base
Line-To-Ground Fault
Positive & Zero Sequence Impedances
Fault at bus: 1015 1LB
Prefault voltage = 0.208 kV = 100.00 % of nominal bus kV ( 0.208 kV)
= 100.00 % of base kV ( 0.208 kV)
1015 1LB Total 0.00 8.362 0.00 113.12 125.54 5.740 6.25E+003 4.93E+003 5.740 2.07E+003 2.59E+003
1000 MDP 1015 1LB 73.29 8.362 82.16 100.84 100.18 5.740 6.25E+003 4.93E+003 5.740 2.07E+003 2.59E+003
# Indicates fault current contribution is from three-winding transformers
* Indicates a zero sequence fault current contribution (3I0) from a grounded Delta-Y transformer
66 of 95

Study Case: SC UtilMax Revision: Base
Config.: CFG UTIL
V16.1PSE_20180706
Project: DPARD Administrative Offices Page: 13
Date: 03-27-2019
SN: SCHNDR-CA3
16.1.0C
ETAP
Filename: DPARD Admin Offices
Engineer:
Contract: 41959861
Location: Dallas,TX
ID Symm. rmsFrom BusID Va
From Bus To Bus % V kA % Voltage at From Bus
Contribution 3-Phase Fault Looking into "From Bus"
Vb Vc Ia 3I0 R1 X1 R0 X0
kA Symm. rms % Impedance on 100 MVA base
Line-To-Ground Fault
Positive & Zero Sequence Impedances
Fault at bus: 1020 1LC
Prefault voltage = 0.208 kV = 100.00 % of nominal bus kV ( 0.208 kV)
= 100.00 % of base kV ( 0.208 kV)
1020 1LC Total 0.00 5.403 0.00 116.16 126.40 3.547 1.08E+004 7.74E+003 3.547 3.53E+003 3.74E+003
1000 MDP 1020 1LC 83.36 5.403 89.34 100.54 100.07 3.547 1.08E+004 7.74E+003 3.547 3.53E+003 3.74E+003
# Indicates fault current contribution is from three-winding transformers
* Indicates a zero sequence fault current contribution (3I0) from a grounded Delta-Y transformer
67 of 95

Study Case: SC UtilMax Revision: Base
Config.: CFG UTIL
V16.1PSE_20180706
Project: DPARD Administrative Offices Page: 14
Date: 03-27-2019
SN: SCHNDR-CA3
16.1.0C
ETAP
Filename: DPARD Admin Offices
Engineer:
Contract: 41959861
Location: Dallas,TX
ID Symm. rmsFrom BusID Va
From Bus To Bus % V kA % Voltage at From Bus
Contribution 3-Phase Fault Looking into "From Bus"
Vb Vc Ia 3I0 R1 X1 R0 X0
kA Symm. rms % Impedance on 100 MVA base
Line-To-Ground Fault
Positive & Zero Sequence Impedances
Fault at bus: 1025 2LA
Prefault voltage = 0.208 kV = 100.00 % of nominal bus kV ( 0.208 kV)
= 100.00 % of base kV ( 0.208 kV)
1025 2LA Total 0.00 8.607 0.00 112.86 125.45 5.932 6.01E+003 4.78E+003 5.932 2.00E+003 2.53E+003
1000 MDP 1025 2LA 72.43 8.607 81.51 100.86 100.19 5.932 6.01E+003 4.78E+003 5.932 2.00E+003 2.53E+003
# Indicates fault current contribution is from three-winding transformers
* Indicates a zero sequence fault current contribution (3I0) from a grounded Delta-Y transformer
68 of 95

Study Case: SC UtilMax Revision: Base
Config.: CFG UTIL
V16.1PSE_20180706
Project: DPARD Administrative Offices Page: 15
Date: 03-27-2019
SN: SCHNDR-CA3
16.1.0C
ETAP
Filename: DPARD Admin Offices
Engineer:
Contract: 41959861
Location: Dallas,TX
ID Symm. rmsFrom BusID Va
From Bus To Bus % V kA % Voltage at From Bus
Contribution 3-Phase Fault Looking into "From Bus"
Vb Vc Ia 3I0 R1 X1 R0 X0
kA Symm. rms % Impedance on 100 MVA base
Line-To-Ground Fault
Positive & Zero Sequence Impedances
Fault at bus: 1030 1LP (ETR)
Prefault voltage = 0.208 kV = 100.00 % of nominal bus kV ( 0.208 kV)
= 100.00 % of base kV ( 0.208 kV)
1030 1LP (ETR) Total 0.00 12.118 0.00 109.04 123.71 8.872 3.60E+003 3.30E+003 8.872 1.23E+003 1.93E+003
1000 MDP 1030 1LP (ETR) 59.48 12.118 71.10 101.19 100.44 8.872 3.60E+003 3.30E+003 8.872 1.23E+003 1.93E+003
# Indicates fault current contribution is from three-winding transformers
* Indicates a zero sequence fault current contribution (3I0) from a grounded Delta-Y transformer
69 of 95

Study Case: SC UtilMax Revision: Base
Config.: CFG UTIL
V16.1PSE_20180706
Project: DPARD Administrative Offices Page: 16
Date: 03-27-2019
SN: SCHNDR-CA3
16.1.0C
ETAP
Filename: DPARD Admin Offices
Engineer:
Contract: 41959861
Location: Dallas,TX
ID Symm. rmsFrom BusID Va
From Bus To Bus % V kA % Voltage at From Bus
Contribution 3-Phase Fault Looking into "From Bus"
Vb Vc Ia 3I0 R1 X1 R0 X0
kA Symm. rms % Impedance on 100 MVA base
Line-To-Ground Fault
Positive & Zero Sequence Impedances
Fault at bus: 1035 L1 DISC
Prefault voltage = 0.208 kV = 100.00 % of nominal bus kV ( 0.208 kV)
= 100.00 % of base kV ( 0.208 kV)
1035 L1 DISC Total 0.00 21.266 0.00 100.46 112.87 18.760 8.76E+002 1.63E+003 18.760 3.65E+002 1.25E+003
WIRE WAY 1035 L1 DISC 13.42 21.266 19.33 101.08 105.62 18.760 8.76E+002 1.63E+003 18.760 3.65E+002 1.25E+003
1040 L1 1035 L1 DISC 0.00 0.000 0.00 100.46 112.87 0.000 0.000
# Indicates fault current contribution is from three-winding transformers
* Indicates a zero sequence fault current contribution (3I0) from a grounded Delta-Y transformer
70 of 95

Study Case: SC UtilMax Revision: Base
Config.: CFG UTIL
V16.1PSE_20180706
Project: DPARD Administrative Offices Page: 17
Date: 03-27-2019
SN: SCHNDR-CA3
16.1.0C
ETAP
Filename: DPARD Admin Offices
Engineer:
Contract: 41959861
Location: Dallas,TX
ID Symm. rmsFrom BusID Va
From Bus To Bus % V kA % Voltage at From Bus
Contribution 3-Phase Fault Looking into "From Bus"
Vb Vc Ia 3I0 R1 X1 R0 X0
kA Symm. rms % Impedance on 100 MVA base
Line-To-Ground Fault
Positive & Zero Sequence Impedances
Fault at bus: 1040 L1
Prefault voltage = 0.208 kV = 100.00 % of nominal bus kV ( 0.208 kV)
= 100.00 % of base kV ( 0.208 kV)
1040 L1 Total 0.00 19.126 0.00 101.82 116.58 16.112 1.31E+003 1.90E+003 16.112 5.03E+002 1.36E+003
1035 L1 DISC 1040 L1 12.07 19.126 16.60 101.42 110.50 16.112 1.31E+003 1.90E+003 16.112 5.03E+002 1.36E+003
# Indicates fault current contribution is from three-winding transformers
* Indicates a zero sequence fault current contribution (3I0) from a grounded Delta-Y transformer
71 of 95

Study Case: SC UtilMax Revision: Base
Config.: CFG UTIL
V16.1PSE_20180706
Project: DPARD Administrative Offices Page: 18
Date: 03-27-2019
SN: SCHNDR-CA3
16.1.0C
ETAP
Filename: DPARD Admin Offices
Engineer:
Contract: 41959861
Location: Dallas,TX
ID Symm. rmsFrom BusID Va
From Bus To Bus % V kA % Voltage at From Bus
Contribution 3-Phase Fault Looking into "From Bus"
Vb Vc Ia 3I0 R1 X1 R0 X0
kA Symm. rms % Impedance on 100 MVA base
Line-To-Ground Fault
Positive & Zero Sequence Impedances
Fault at bus: 1045 L2 DISC
Prefault voltage = 0.208 kV = 100.00 % of nominal bus kV ( 0.208 kV)
= 100.00 % of base kV ( 0.208 kV)
1045 L2 DISC Total 0.00 20.824 0.00 100.12 115.27 18.063 1.10E+003 1.65E+003 18.063 4.37E+002 1.26E+003
WIRE WAY 1045 L2 DISC 17.90 20.824 25.87 101.50 105.12 18.063 1.10E+003 1.65E+003 18.063 4.37E+002 1.26E+003
1050 L2 1045 L2 DISC 0.00 0.000 0.00 100.12 115.27 0.000 0.000
# Indicates fault current contribution is from three-winding transformers
* Indicates a zero sequence fault current contribution (3I0) from a grounded Delta-Y transformer
72 of 95

Study Case: SC UtilMax Revision: Base
Config.: CFG UTIL
V16.1PSE_20180706
Project: DPARD Administrative Offices Page: 19
Date: 03-27-2019
SN: SCHNDR-CA3
16.1.0C
ETAP
Filename: DPARD Admin Offices
Engineer:
Contract: 41959861
Location: Dallas,TX
ID Symm. rmsFrom BusID Va
From Bus To Bus % V kA % Voltage at From Bus
Contribution 3-Phase Fault Looking into "From Bus"
Vb Vc Ia 3I0 R1 X1 R0 X0
kA Symm. rms % Impedance on 100 MVA base
Line-To-Ground Fault
Positive & Zero Sequence Impedances
Fault at bus: 1050 L2
Prefault voltage = 0.208 kV = 100.00 % of nominal bus kV ( 0.208 kV)
= 100.00 % of base kV ( 0.208 kV)
1050 L2 Total 0.00 18.284 0.00 102.30 119.89 14.912 1.76E+003 1.93E+003 14.912 6.46E+002 1.37E+003
1045 L2 DISC 1050 L2 15.71 18.284 21.36 101.75 111.76 14.912 1.76E+003 1.93E+003 14.912 6.46E+002 1.37E+003
# Indicates fault current contribution is from three-winding transformers
* Indicates a zero sequence fault current contribution (3I0) from a grounded Delta-Y transformer
73 of 95

Study Case: SC UtilMax Revision: Base
Config.: CFG UTIL
V16.1PSE_20180706
Project: DPARD Administrative Offices Page: 20
Date: 03-27-2019
SN: SCHNDR-CA3
16.1.0C
ETAP
Filename: DPARD Admin Offices
Engineer:
Contract: 41959861
Location: Dallas,TX
Short-Circuit Summary Report
Prefault Voltage = 100 % of the Bus Nominal Voltage
ID kV
Bus
Real Imag. Mag. Real Real RealImag. Imag. Imag.Mag. Mag. Mag.
3-Phase Fault Line-to-Ground Fault Line-to-Line Fault *Line-to-Line-to-Ground
1/2 Cycle - 3-Phase, LG, LL, & LLG Fault Currents
3.518 -25.701 25.941 3.581 -24.945 25.201 22.258 3.046 22.465 -24.074 9.069 25.726900 ECB 0.208
3.625 -24.919 25.181 3.780 -23.791 24.089 21.580 3.139 21.808 -23.529 8.237 24.9291000 MDP 0.208
6.509 -10.221 12.118 5.729 -6.773 8.872 8.852 5.637 10.494 -11.290 -3.168 11.7261005 DPA 0.208
6.967 -15.163 16.687 7.071 -11.327 13.353 13.131 6.034 14.451 -16.434 -1.617 16.5131010 L1A 0.208
5.220 -6.532 8.362 4.115 -4.003 5.740 5.657 4.521 7.241 -7.308 -3.111 7.9431015 1LB 0.208
3.710 -3.929 5.403 2.702 -2.297 3.547 3.402 3.213 4.679 -4.447 -2.416 5.0611020 1LC 0.208
5.327 -6.761 8.607 4.228 -4.161 5.932 5.855 4.613 7.454 -7.558 -3.144 8.1861025 2LA 0.208
6.509 -10.221 12.118 5.729 -6.773 8.872 8.852 5.637 10.494 -11.290 -3.168 11.7261030 1LP (ETR) 0.208
5.953 -20.416 21.266 6.792 -17.488 18.760 17.680 5.155 18.417 -21.224 2.402 21.3601035 L1 DISC 0.208
6.631 -17.940 19.126 7.222 -14.403 16.112 15.536 5.743 16.564 -19.115 0.164 19.1151040 L1 0.208
6.825 -19.674 20.824 7.739 -16.321 18.063 17.038 5.911 18.034 -21.006 0.933 21.0271045 L2 DISC 0.208
7.782 -16.545 18.284 8.153 -12.486 14.912 14.328 6.740 15.834 -18.208 -1.871 18.3041050 L2 0.208
All fault currents are symmetrical (1/2 Cycle network) values in rms kA.
* LLG fault current is the larger of the two faulted line currents.
74 of 95

Study Case: SC UtilMax Revision: Base
Config.: CFG UTIL
V16.1PSE_20180706
Project: DPARD Administrative Offices Page: 21
Date: 03-27-2019
SN: SCHNDR-CA3
16.1.0C
ETAP
Filename: DPARD Admin Offices
Engineer:
Contract: 41959861
Location: Dallas,TX
Sequence Impedance Summary Report
ID kV
Bus
Resistance Reactance Impedance
Positive Seq. Imp. (ohm) Negative Seq. Imp. (ohm)
Resistance Reactance Impedance
Zero Seq. Imp. (ohm)
Resistance Reactance Impedance
Fault Zf (ohm)
Resistance Reactance Impedance
900 ECB 0.208 0.00463 0.00459 0.00063 0.00463 0.00459 0.00063 0.00498 0.00078 0.00504 0.00000 0.00000 0.00000
1000 MDP 0.208 0.00477 0.00472 0.00069 0.00477 0.00472 0.00069 0.00533 0.00097 0.00542 0.00000 0.00000 0.00000
1005 DPA 0.208 0.00991 0.00836 0.00532 0.00991 0.00836 0.00532 0.01429 0.01558 0.02114 0.00000 0.00000 0.00000
1010 L1A 0.208 0.00720 0.00654 0.00300 0.00720 0.00654 0.00300 0.00981 0.00828 0.01283 0.00000 0.00000 0.00000
1015 1LB 0.208 0.01436 0.01122 0.00897 0.01436 0.01122 0.00897 0.02132 0.02706 0.03445 0.00000 0.00000 0.00000
1020 1LC 0.208 0.02223 0.01616 0.01526 0.02223 0.01616 0.01526 0.03347 0.04688 0.05760 0.00000 0.00000 0.00000
1025 2LA 0.208 0.01395 0.01096 0.00863 0.01395 0.01096 0.00863 0.02068 0.02601 0.03323 0.00000 0.00000 0.00000
1030 1LP (ETR) 0.208 0.00991 0.00836 0.00532 0.00991 0.00836 0.00532 0.01429 0.01558 0.02114 0.00000 0.00000 0.00000
1035 L1 DISC 0.208 0.00565 0.00542 0.00158 0.00565 0.00542 0.00158 0.00706 0.00379 0.00801 0.00000 0.00000 0.00000
1040 L1 0.208 0.00628 0.00589 0.00218 0.00628 0.00589 0.00218 0.00821 0.00567 0.00998 0.00000 0.00000 0.00000
1045 L2 DISC 0.208 0.00577 0.00545 0.00189 0.00577 0.00545 0.00189 0.00712 0.00477 0.00857 0.00000 0.00000 0.00000
1050 L2 0.208 0.00657 0.00594 0.00280 0.00657 0.00594 0.00280 0.00834 0.00762 0.01130 0.00000 0.00000 0.00000
75 of 95

Power System Engineering
May 2019
APPENDIX C: REFERENCES
I. SUPPLIED DATA
1 Customer one-line diagram
2 Feeder schedule
3 Fault current data
4 Missing breakers data
5 Updated cable data
II. POWER SYSTEM ENGINEERING
1 Trip Dials for L-Frame Micrologic 3.3 & 3.3S
2 Trip Dials for Molded Case Breakers
3 Std AF Study Options - ETAP
4 Approach Boundaries Table - 70E
5 Project Recommendation & Action Table
76 of 95

NEWWORK
LINEWEIGHT
DESCRIPTION
EXISTING
Fax: 214.397.0886
5429 LBJ FREEWAY #300
Consulting EngineersSW ASSOCIATES
www.swaengineers.com
Dallas, TX 75240Tel: 214.397.0211
PROJECT #TEXAS REGISTERED ENGINEERING FIRM F-6872
Sheet
Title
Approved
Checked
Drawn
Job Number
Sheet Information
Revisions
10100 North Central ExpresswaySuite 300
Dallas, Texas 75231t 214.283.8700f 214.283.8701
www.perkinswill.com
15 234
A
D
B
C
15 234
A
D
B
C
STRUCTURAL
LANDSCAPE
MEP
Date
13333
ELECTRICALONE-LINEDIAGRAM
OR
LR
146054.000
OR
DPARDADMINISTRATIVE
OFFICES
10031 E. NORTHWEST HWYDALLAS, TX 75238
DALLAS PARK& RECREATION
DEPARTMENT
Copyright © 2013 Perkins+Will
KEVIN SLOAN STUDIO2400 EMPIRE CENTRAL, SUITE F
DALLAS, TX 75235ELIZABETH VAUGHN
(214) 459-1784
EBG ENGINEERING10300 N. CENTRAL EXPY SUITE 160
DALLAS, TX 75231BRYAN ERWIN
214.321.3861
SW ASSOCIATES5429 LBJ FWY
SUITE 300 – LB129DALLAS, TX 75240
CARL HEWETT214.397.0211
JULY 15, 2014
08/25/16
SCALE: N.T.S.
ELECTRICAL ONE-LINE DIAGRAM
NO ISSUE DATE
50% CONSTRUCTIONDOCUMENTS
07.15.14
95% CONSTRUCTIONDOCUMENTS
09.10.14
ISSUED FOR BID 05.25.16
ISSUED FOR PERMIT 08.25.16
77 of 95

Power System Engineering
FEEDER SCHEDULE
*FromEquipment
*To Equipment Conductor Material(CU, AL)
Conductor Length in
Feet
Cables per Phase
Size(AWG,kcmil)
Insulation Type
(THHN, XLP, etc.)
ConduitType (Steel,
Plastic,Aluminum)
*Panelboard, switchboard, and transformer designations, etc…
78 of 95

Square D Engineering Services
1601 Mercer RoadLexington, KY 40511
(859) 296-3600
1. Power Company Name______________________________________________________________
2. Location (voltage level) at which fault currents (below) are given__________________(if utility owned, line side
of service transformer is preferred)
3. Available 3-Phase RMS Sym. Fault Current: ____________________(maximum),
__________________(minimum), & _______________________(actual)
4. X/R Ratio: _______________________(maximum), _______________________(minimum), &
_________________________(actual)
5. Service Transformer (if utility owned):
KVA____________________________________________________________________
Primary Connection (D or U-grounded)___________________________________
Secondary Connection (D or U-grounded)________________________________
Rated Primary Voltage__________________________________________________
Rated Secondary Voltage_______________________________________________
Percent Impedance (%Z): ____________________(maximum), __________________(minimum), &
_______________________(nominal)
X/R Ratio_____________________________________________________(nominal)
6. UPSTREAM OVERCURRENT DEVICE NEAREST SERVICE POINT
Þ If FUSES:
Fuse Manufacturer_________________________________________,
Type_____________________, Catalog Number_______________________, Class____________________,
and Continuous Current Rating (with speed rating if applicable)____________________________________
Þ If OVERCURRENT RELAYS:
Relay Manufacturer____________________________________________________________
Phase Relay Type______________________________________________________________
Ground Relay Type____________________________________________________________
Please Complete the Following Relay Setting Table:
COMMENTS (if necessary, supply on an additional page):
RELAY
PHASE
GROUND
C.T. RATIO
AMPERE TAP
RANGE SETTING
TIME DIAL
SETTING
INSTANTANEOUS
RANGE SETTING
79 of 95

Customer Name
Address
Calculated By
Verified By
Date
Transformer GLN
Transformer TSN & Description
Transformer Configuration
Service is Single-Phase with a Neutral (Yes or No)
Delta Configured Secondary (Yes or No)
Transformer Line-to-Line Secondary Voltage 240 Volts
Single Transformer Rating 50 kVA
Transformer Impedance 1.4 % (xfrmr base)
Transformer Full Load Current 208 Amps
Transformer Available Fault Current 25,775 Amps
Transformer Available Fault Current
No
10031 e Northwest
Required Information
(ver 8.0)
Disclaimer
Specific information set forth herein, directly or indirectly related to the Oncor Electric Delivery equipment,
impedances, and available fault current values, is being provided at the request of the customer, or customer
agent, and is based upon a number of assumptions made at the time such information was determined. The
actual installed equipment, impedances, available fault current, and related information may be different than
what is indicated in this document and is subject to change without notice.
The information provided herein, shall not in any manner modify, alter, revise, or amend the rights, duties,
liabilities and obligations of the parties as set forth in Oncor Electric Delivery’s applicable tariff, as approved by
the Public Utility Commission of Texas.
Customer Request - Response Form
June 20, 2018
Electrical Direct
06N06E - 00520
Information Provided
000000 - TSN Not Listed (user provided data)
Yes
3 Single-Phase
80 of 95

From:
Sent: Thursday, May 23, 2019 9:51 PM
To:
Cc:
Subject: RE: 41959861 - DPARD Admin Offices
Contractor has confirmed the Oncor supplied voltage will be 208V.
81 of 95

1
From:
Sent: Tuesday, May 21, 2019 12:27 AM
To:
Subject: FW: DPARD - Electrical Gear Info
Importance:
From:
Sent: Monday, May 20, 2019 1:52 PM
To:
Cc:
Subject: DPARD - Electrical Gear Info
Importance: High
Below are the cable lengths and sizes that you needed for the Gear
Studies:
Utility Pole to MB is 25’
Main Disconnect to MDP is 85’
82 of 95

83 of 95

�
���
����
�
���
� ���
�
�
�
���
� ���
�������
�
�
�
��
���
�����
��
���
����
���
� ���
�
�
�
�������
���
� ���
���
�������
����
���
����
�������
��
��
��
��
��
�������� ����
��
��
���
��������������
������
��� �������
��������������
����������������
�����������
����������������
�����������
���� ������������
�������������
������������
�������������
������������
��� ��������
�����������
�������
���������
������
�����������
��
��������������� �������
���� �����������������
�������������
��
��
�����������
�������
���������
��
�������
�������
�������
��� �
��
�������
����
��
������
�������
���
���
������
�������
�������
�������
�����
� ��
��������� ���� �
����� ���
��� �������
� ��
��������� ���� �
����� ���
��� �������
� ��
��������� ���� �
����� ���
��� �������
�� ��
��������� ���� �
����� ���
��� �������
�������� �� !�"
�#$�%���
&!
" �%'���(�)����*
����� ��
������ �
+��,(-��(."./�
�0 &�
1$�����2� �
���0���� ������
3$��'���
4/5�/�67���8
���+
� ��
��������� ���� �
����� ���
��� ������7
���0���� ������
3$��'���
4/5�/�67���8
�0�+
� ��
��������� ���� �
����� ���
��� �������
�0 ��
��������� ���� �
����� ���
��� �������
���0������+� !�"
�#$�%���
1&3
" �%'���(�)����*
����� ��
������ �
�������� �+�4�/
�#$�%���
1!
" �%'���(�)����*
����� ���
�������� �+� !�"
�#$�%���
1&3
" �%'���(�)����*
����� ��
�� ��
��������� ���� �
����� ���
��� �������
����������+�4�/
�#$�%���
!�6./8
�����������"%�9
����� ���
4$�*������ �
���0������+�(+�5
�#$�%���
1!
" �%'���(�)����*
����� ��0
��� ��
��������� ���� �
����� ���
��� ������:
�������-�3
�#$�%���
�!
�����������"%�9
����� ����
4$�*������ -"���6�!8
;�/� 7
���0����� 3� !�"
�#$�%���
1&3
" �%'���(�)����*
����� ��
� ��
��������� ���� �
����� :��
��� ������
��� ��
��������� ���� �
����� ���
��� ������0
��������� 3�4�/
�#$�%���
1!
" �%'���(�)����*
����� ���
��������� �� !�"
�#$�%���
1&3
" �%'���(�)����*
����� ��
���0����� +� !�"
�#$�%���
1&3
" �%'���(�)����*
����� ��
� ��
��������� ���� �
����� :��
��� �������
��0 ��
��������� ���� �
����� ���
��� �������
POWER SYSTEM
ENGINEERING
1601 MERCER ROAD LEXINGTON, KY 40511
NOTES:
ALL LOW-VOLTAGE CABLES WERE CONSIDERED TO BE TYPE RHH, SINGLE CONDUCTOR COPPER, RUN IN STEEL CONDUIT, UNLESS OTHERWISE NOTED.
ALL DEVICES WERE CONSIDERED TO BE THREE-POLE UNLESS NOTED OTHERWISE.
* - DENOTES THE VALUE WAS ASSUMED
KVAm - CONNECTED MOTOR KVA USED FOR FAULT CALCULATIONS.
AF - AMPERE FRAME RATING
AS - AMPERE SENSOR RATING
AP - AMPERE PLUG RATING
AT - AMPERE TRIP RATING
L - LONG TIME FUNCTION
S - SHORT TIME FUNCTION
I - INSTANTANEOUS FUNCTION
G - GROUND FUNCTION
DPARD Administrative Offices
Power System Study
Dallas,TX
PN
03/27/2019
NTS
41959861
1 of 1
Manufacturer, model,
size, type and trip
information?
cable length?
1.from wire way to L1 DISC
2. from L1 DISC to L1
3.from wire way to L2 DISC
4. from L2 DISC to L2
Cable size
(AWG), type
(Cu/Al), and
length?
The utility information supplied from
ONCOR is given at 240V when the
system in the scope of the study is at
208V. Please confirm with the ONCOR.
Square D
BG
Thermal Magnetic
100A/3P
Square D
QG
Thermal Magnetic
200A/3P
Square D
BG
Thermal Magnetic
100A/3P
Square D
QG
Thermal Magnetic
150A/3P
9' is the correct
distance for these
cables.
4 - #2/0, 1#6G, 2"C
CU, 2251'
84 of 95

Power System Engineering
May 2019
Trip Dials for L-Frame Micrologic 3.3 & 3.3S
The following dial descriptions may be applicable for Micrologic 3.3 & 3.3S trip units.
Sensor rating is InLong-time pickup protection adjustment dial IrLong-time delay protection adjustment dial trShort-time pickup protection adjustment dial IsdInstantaneous protection adjustment dial Ii
For more information on how to set these trip units, please refer to the User Guide 48940-313-01.
85 of 95

Power System Engineering
May 2019
MOLDED CASE CIRCUIT BREAKERSMAGNETIC (INSTANTANEOUS) TRIP ADJUSTMENT DIALS
(ON FRONT OF CIRCUIT BREAKER)
J-Frame Thermal-Magnetic Trip UnitIn: 150A – 250AIm: Low – High (5x – 10x In)
NOTE: THE “LO” AND “HI” MARKINGS APPEAR ON THE DIAL FACES.(THE MARKINGS IN PARENTHESIS DO NOT)
SETTINGS ARE SHOWN FOR ILLUSTRATION ONLY
“LO” typically corresponds to a 5.0x Magnetic Trip level.“HI” typically corresponds to a 10.0x Magnetic Trip level.
86 of 95

Power System Engineering
May 2019
STANDARD ARC FLASH STUDY OPTIONS – ETAP
Options for 1-Ph systems, 3-Ph and 1-Ph Panels, and 1-Ph UPS are used when applicable.
87 of 95

Power System Engineering
May 2019 88 of 95

Power System Engineering
May 2019
The Exclude if Motor <= is set to 49 HP/kW for Motors ON.The Exclude if Motor <= is set to 9999 HP/kW for Motors OFF. For motors exceeding 9999 HP/kW:
ETAP Configuration can be used to turn motors ON/OFF. Changing the Demand Factor to Spare results in motors OFF.
Determine from Decrement Curve is used when complete generator data is available.
For LV buses that use the 1.2 cal/cm2 result because they meet the criteria of the Incident Energy for LV Eqpt checkbox, the AF results will not have Final FCT, Source PD ID, and Trip Time shown.
Switchgear will be modeled using two (2) buses so that bus and line-side results can both be shown.
89 of 95

Power System Engineering
May 2019
For maximum type AF cases:
90 of 95

Power System Engineering
May 2019
If 7.5% transformer tolerance is specified, ETAP will use +7.5% tolerance (6.18%Z) for load flow, motor starting, dynamic stability, and harmonic calculations, while using -7.5% tolerance (5.32%Z) for short-circuit and AF calculations.
For minimum type AF cases:
Using the Apply Positive Tolerance and Max. Temperature for ANSI Minimum Short-Circuit Calculation & Arc Flash feature will set the impedance tolerance, length tolerance (not used by PSE as standard) and resistance temperature impedance corrections as positive adjustments instead of negative. For transformers, higher impedance is used if the Impedance Tolerance has been entered for a transformer. Likewise for cables, the Max Temp. will be used — the cable Max Temp. should be 75 deg C for all the cables. This means smaller fault and arcing currents will result. It’s possible the worst-case incident energy may occur when the system provides minimum short-circuit currents because of the inverse characteristic of some protective devices. A small reduction in the arcing current may increase the fault clearing time, making for more arc flash incident energy
91 of 95

Power System Engineering
May 2019
FROM NFPA 70E
Table 130.4(D)(a) Shock Protection Approach Boundaries to Exposed Energized Electrical Conductors or Circuit Parts for Alternating-Current Systems
(1) (2) (3) (4)
Limited Approach Boundaryb
Nominal System Voltage Range,
Phase to Phasea Exposed Movable
Conductorc Exposed Fixed
Circuit Part
Restricted Approach Boundaryb; Includes
Inadvertent Movement Adder
< 50 V Not specified Not specified Not specified 50 V to 150d V 3.0 m (10 ft 0 in.) 1.0 m (3 ft 6 in.) Avoid contact 151 V to 750 V 3.0 m (10 ft 0 in.) 1.0 m (3 ft 6 in.) 0.3 m (1 ft 0 in.)
751 to 15 kV 3.0 m (10 ft 0 in.) 1.5 m (5 ft 0 in.) 0.7 m (2 ft 2 in.) 15.1 kV to 36 kV 3.0 m (10 ft 0 in.) 1.8 m (6 ft 0 in.) 0.8 m (2 ft 7 in.) 36.1 kV to 46 kV 3.0 m (10 ft 0 in.) 2.5 m (8 ft 0 in.) 0.8 m (2 ft 9 in.)
46.1 kV to 72.5 kV 3.0 m (10 ft 0 in.) 2.5 m (8 ft 0 in.) 1.0 m (3 ft 3 in.) 72.6 kV to 121 kV 3.3 m (10 ft 8 in.) 2.5 m (8 ft 0 in.) 1.0 m (3 ft 4 in.) 138 kV to 145 kV 3.4 m (11 ft 0 in.) 3.0 m (10 ft 0 in.) 1.2 m (3 ft 10 in.)
161 kV to 169 kV 3.6 m (11 ft 8 in.) 3.6 m (11 ft 8 in.) 1.3 m (4 ft 3 in.) 230 kV to 242 kV 4.0 m (13 ft 0 in.) 4.0 m (13 ft 0 in.) 1.7 m (5 ft 8 in.) 345 kV to 362 kV 4.7 m (15 ft 4 in.) 4.7 m (15 ft 4 in.) 2.8 m (9 ft 2 in.)
500 kV to 550 kV 5.8 m (19 ft 0 in.) 5.8 m (19 ft 0 in.) 3.6 m (11 ft 10 in.) 765 kV to 800 kV 7.2 m (23 ft 9 in.) 7.2 m (23 ft 9 in.) 4.9 m (15 ft 11 in.)
Note (1): For arc flash boundary, see 130.5(A). Note (2): All dimensions are distance from exposed energized electrical conductors or circuit part to employee.
a For single-phase systems above 250 V, select the range that is equal to the system’s maximum phase-to-ground voltage multiplied by 1.732. b See definition in Article 100 and text in 130.4(D)(2) and Informative Annex C for elaboration.c Exposed movable conductors describes a condition in which the distance between the conductor and a person is not under the control of the person. The term is normally applied to overhead line conductors supported by poles. d This includes circuits where the exposure does not exceed 120V nominal.
92 of 95

Power System Engineering
May 2019
IMPLEMENTING AND MAINTAINING AN ELECTRICAL SAFE WORK PRACTICES (ESWP) PROGRAM
Action No. Recommendation Action Person Assigned Due Date
1 Establish Safety-Related Work Practices
Implement and document a comprehensive Electrical Safety Program to address items such as safe work practices, training, PPE, Risk Assessment, and maintenance of equipment. See NFPA 70E for guidance.
2 Establish Electrical Safety Training Program
1) Develop training curriculum for employees potentially exposed to electrical hazards.2) Train workers to become Qualified Employees as appropriate for their job duties.3) Document training results and re-train (or update) as necessary.
3 Project Management
Keep accurate records on system changes and re-evaluate arc flash results when major changes are made, or at most every 5 years. Failure to do this may invalidate the arc flash results.
4 Provide and Train Employees on PPE
Equip all employees with proper PPE and train them regarding proper selection, use, and maintenance of PPE for use when working on or around energized equipment.
5 Implement a Formal Maintenance Program
Inspect, test, and maintain all electrical equipment based upon O&M manuals provided with each individual piece of equipment, or on industry standards such as NFPA 70B.
6 System One-Line Diagram Management Program
Establish a routine program of updating all one-line diagrams associated with the electrical system to be used for future reference as well as lockout-tagout procedures and other system maintenance.
This table is a summary of various recommendations to implement a training and maintenance program for an electrical system. It is to be used in conjunction with NFPA, OSHA, and other industry recommendations for safety and maintenance of an electrical system.
93 of 95

Power System Engineering
May 2019
APPENDIX D: SYSTEM STUDY ONE-LINE DIAGRAM
94 of 95
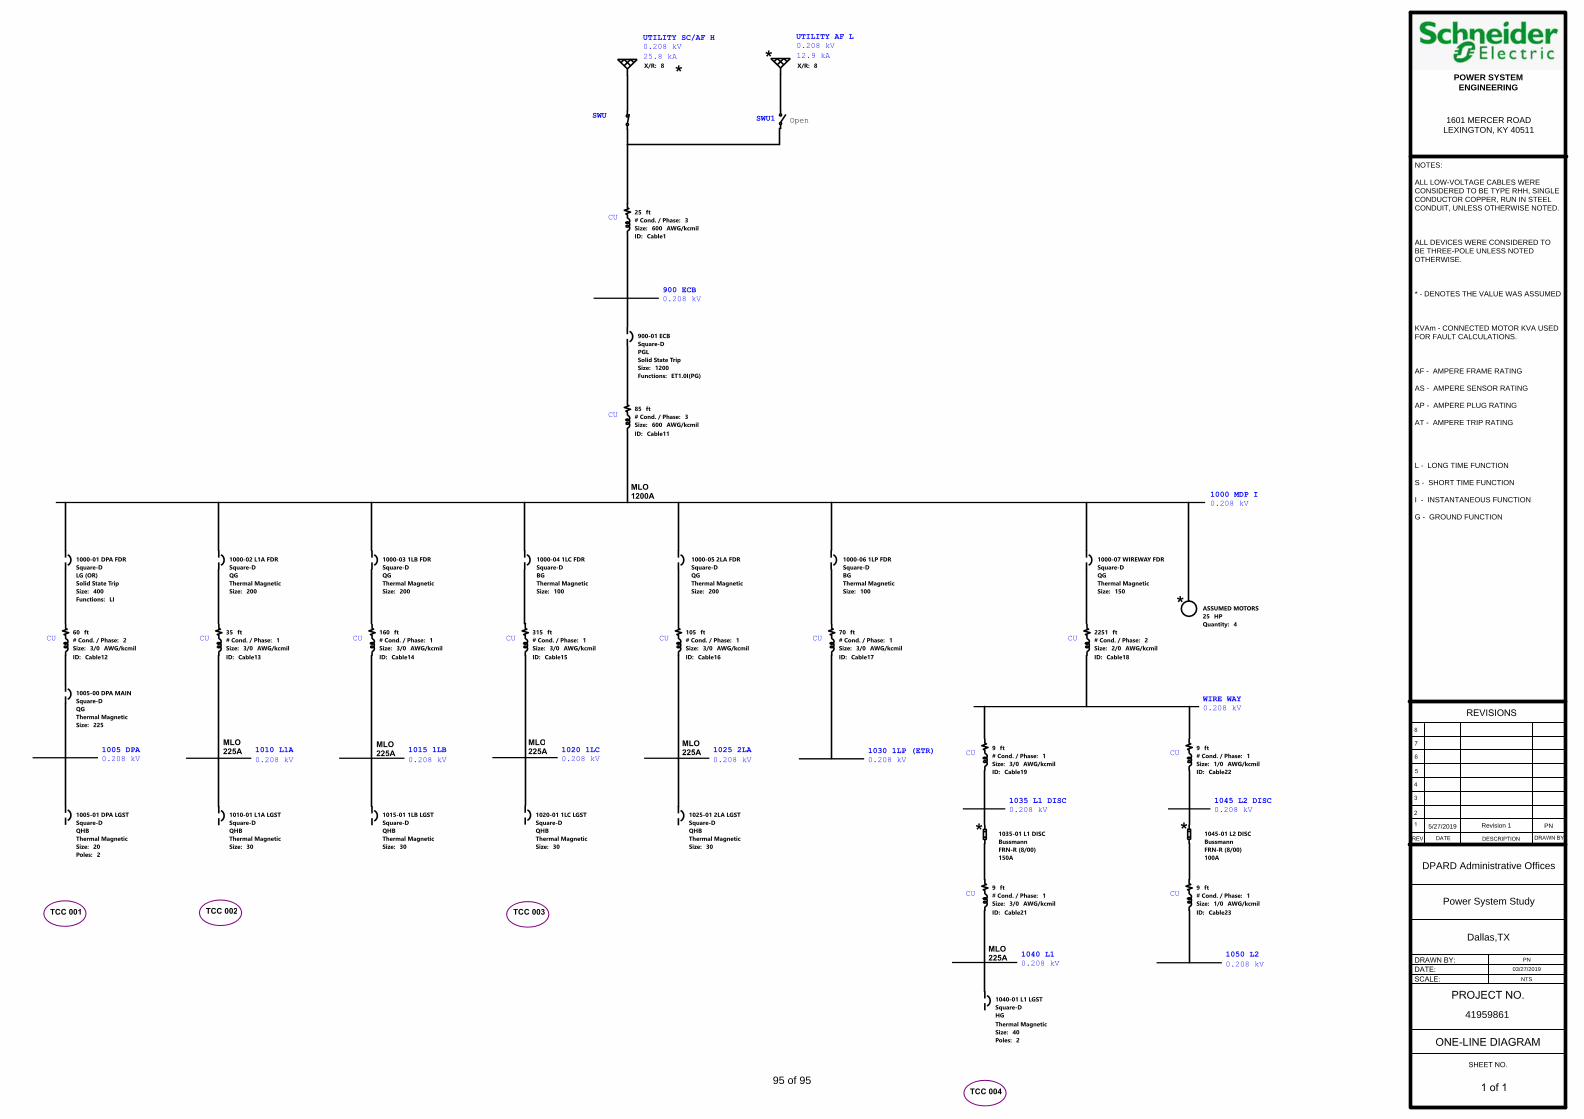
*
TCC 001
TCC 004
*
*
MLO
225A
*
TCC 002
MLO
225A
MLO
225A
TCC 003
MLO
225A
MLO
225A
*
MLO
1200A
CU
CU
CU
CU
CU
CUCUCUCU
SWU1 Open
UTILITY AF L
0.208 kV
12.9 kA
CUCU
CU
CU
SWU
UTILITY SC/AF H
0.208 kV
25.8 kA
1030 1LP (ETR)
0.208 kV
1025 2LA
0.208 kV
1020 1LC
0.208 kV
1015 1LB
0.208 kV
1010 L1A
0.208 kV
1005 DPA
0.208 kV
900 ECB
0.208 kV
1045 L2 DISC
0.208 kV
WIRE WAY
0.208 kV
1000 MDP I
0.208 kV
1050 L2
0.208 kV
1035 L1 DISC
0.208 kV
1040 L1
0.208 kV
25 ft
# Cond. / Phase: 3
Size: 600 AWG/kcmil
ID: Cable1
X/R: 8
900-01 ECB
Square-D
PGL
Solid State Trip
Size: 1200
Functions: ET1.0I(PG)
85 ft
# Cond. / Phase: 3
Size: 600 AWG/kcmil
ID: Cable11
70 ft
# Cond. / Phase: 1
Size: 3/0 AWG/kcmil
ID: Cable17
1000-06 1LP FDR
Square-D
BG
Thermal Magnetic
Size: 100
X/R: 8
1000-05 2LA FDR
Square-D
QG
Thermal Magnetic
Size: 200
105 ft
# Cond. / Phase: 1
Size: 3/0 AWG/kcmil
ID: Cable16
ASSUMED MOTORS
25 HP
Quantity: 4
2251 ft
# Cond. / Phase: 2
Size: 2/0 AWG/kcmil
ID: Cable18
1000-07 WIREWAY FDR
Square-D
QG
Thermal Magnetic
Size: 150
1040-01 L1 LGST
Square-D
HG
Thermal Magnetic
Size: 40
Poles: 2
9 ft
# Cond. / Phase: 1
Size: 1/0 AWG/kcmil
ID: Cable23
9 ft
# Cond. / Phase: 1
Size: 3/0 AWG/kcmil
ID: Cable19
1045-01 L2 DISC
Bussmann
FRN-R (8/00)
100A
9 ft
# Cond. / Phase: 1
Size: 3/0 AWG/kcmil
ID: Cable21
1035-01 L1 DISC
Bussmann
FRN-R (8/00)
150A
9 ft
# Cond. / Phase: 1
Size: 1/0 AWG/kcmil
ID: Cable22
160 ft
# Cond. / Phase: 1
Size: 3/0 AWG/kcmil
ID: Cable14
315 ft
# Cond. / Phase: 1
Size: 3/0 AWG/kcmil
ID: Cable15
1000-04 1LC FDR
Square-D
BG
Thermal Magnetic
Size: 100
60 ft
# Cond. / Phase: 2
Size: 3/0 AWG/kcmil
ID: Cable12
1005-00 DPA MAIN
Square-D
QG
Thermal Magnetic
Size: 225
1000-03 1LB FDR
Square-D
QG
Thermal Magnetic
Size: 200
1000-02 L1A FDR
Square-D
QG
Thermal Magnetic
Size: 200
1000-01 DPA FDR
Square-D
LG (OR)
Solid State Trip
Size: 400
Functions: LI
35 ft
# Cond. / Phase: 1
Size: 3/0 AWG/kcmil
ID: Cable13
1005-01 DPA LGST
Square-D
QHB
Thermal Magnetic
Size: 20
Poles: 2
1015-01 1LB LGST
Square-D
QHB
Thermal Magnetic
Size: 30
1020-01 1LC LGST
Square-D
QHB
Thermal Magnetic
Size: 30
1010-01 L1A LGST
Square-D
QHB
Thermal Magnetic
Size: 30
1025-01 2LA LGST
Square-D
QHB
Thermal Magnetic
Size: 30
POWER SYSTEM ENGINEERING
1601 MERCER ROAD LEXINGTON, KY 40511
NOTES:
ALL LOW-VOLTAGE CABLES WERE CONSIDERED TO BE TYPE RHH, SINGLE CONDUCTOR COPPER, RUN IN STEEL CONDUIT, UNLESS OTHERWISE NOTED.
ALL DEVICES WERE CONSIDERED TO BE THREE-POLE UNLESS NOTED OTHERWISE.
* - DENOTES THE VALUE WAS ASSUMED
KVAm - CONNECTED MOTOR KVA USED FOR FAULT CALCULATIONS.
AF - AMPERE FRAME RATING
AS - AMPERE SENSOR RATING
AP - AMPERE PLUG RATING
AT - AMPERE TRIP RATING
L - LONG TIME FUNCTION
S - SHORT TIME FUNCTION
I - INSTANTANEOUS FUNCTION
G - GROUND FUNCTION
5/27/2019 Revision 1 PN
DPARD Administrative Offices
Power System Study
Dallas,TX
PN
03/27/2019
NTS
41959861
1 of 195 of 95