je ournal of nvironment & biotechnology research vinanie ... · surface as oriented by nbr...
TRANSCRIPT

Journal of
Environment & Research VINANIE PUBLISHERS
Evaluation of metal bioavailability in the Tega River watershed sediments in Southern Brazil
Michele Schmitz, Marcelo Giovanela, Vania Elisabete Schneider*
Universidade de Caxias do Sul, Rua Francisco Getúlio Vargas, 1130, Caxias do Sul, 95070-560, RS, Brazil
ORIGINAL RESEARCH ARTICLE
ABSTRACT Anthropogenic activities have an impact on water resources, especially due to industrial effluent releases. Sediments
are the main component of pollutant accumulation, particularly for metals such as lead, cadmium, chromium, zinc and copper. In view of these facts, this work aimed to evaluate the behavior of a hydric body in the municipality of Caxias do Sul (southern Brazil) by analyzing the metal bioavailability in the Tega River watershed sediments and water column at five sampling points. The obtained results showed that the metal concentrations in sediment samples were higher than the values for surface water samples, especially for Cu, Ni, Zn and Cr. Moreover, the largest metal concentrations in the sediments were observed at sampling points 1 and 2, which were located directly in the urban area of the municipality of Caxias do Sul, receiving releases of industrial and domestic effluents, which also possessed the worst water quality indexes. At the other sampling points, the data revealed better water quality indexes and lower metal concentrations, except for sampling point 3, which drains water from the municipality’s industrial district. This municipality is Brazil’s second largest metal-mechanic industrial state, making this activity’s contribution to the level of metal ions at the studied hydric body evident, which highlights the importance of monitoring the quality of water and sediments and promoting an efficient control over the local pollution sources.
KEYWORDSBioavailable metals; environmental diagnosis; sediments; water quality
1. INTRODUCTION
Starting from the development of urban areas, water resources have suffered a direct impact either from hydrological cycle alterations, impermeable area increase and superficial drainage or from the pollutant charge transferred from watershed to water bodies (Poleto 2007; Gastaldini and Silva, 2012). The release of residues and both domestic and industrial wastewaters, besides superficial drainage as a result of precipitation in cities and rural areas, have been contributing significantly to water pollution levels with a number of pollutants, such as metals (Alves et al., 2014). Although some of these metals are essential, others such as lead (Pb), cadmium (Cd), chromium (Cr), zinc (Zn) and copper (Cu) are highly
toxic and persistent and are able to bioaccumulate and biomagnify within the trophic chain (Bi et al., 2014; Wang et al., 2014; Abubacker and Sathya, 2017). The metal availability in soil and sediment is directly related to geochemical retention forms, which are controlled by chemical reactions and physical processes that depend particularly on the potential of hydrogen (pH), cation exchange capacity (CEC), organic matter (OM) and humidity contents (Cotta et al., 2006; Chiappetta et al., 2016; Díez et al., 2017). Metals with weak association that are commonly found linked to sediment and whose links can be easily broken by the biota are denominated bioavailable metals (Guimarães and Sígolo, 2008; Lemes, 2001). In that direction, speciation studies in addition to toxicity tests reveal that the quantification
www.vinanie.com/jebrBiotechnology
Corresponding author: V.E. Schneider
Tel: +55 54 32182100Fax: +55 54 32182159 E. mail: [email protected]
Received: 18-04-2017Revised: 25-05-2017Accepted: 06-06-2017Available online: 01-07-2017
Journal of Environment and Biotechnology Research, Vol. 6, No. 3, Pages 248-259, 2017248

Schmitz et al., Journal of Environment and Biotechnology Research, Vol. 6, No. 3, Pages 248-259, 2017
of the total concentration of metals existent in a set environment is not the best indicator of toxic potential, since the bioavailability factor cannot be estimated by this variable (Fan et al., 2014; Yuan et al., 2014). Within this context, this work aims to integrally analyze the behavior of a hydric body through the analysis of bioavailable metals (Al, Cd, Pb, Cu, Cr, Ni and Zn) in the sediment and water column of a watershed located in the municipality of Caxias do Sul (southern Brazil, Rio Grande do Sul state) and to evaluate the physico-chemical parameters of superficial water samples considering the already mentioned metals, cyanide, conductivity, biochemical oxygen demand (BOD), chemical oxygen demand (COD), pH, total solids (TS), total suspended solids (TSS), total dissolved solids (TDS) and dissolved oxygen (DO). Moreover, the sediment samples were equally characterized by a set of analyses, including pH, humidity, OM and CEC, aiming to establish relationships between these parameters.
2. MATERIALS AND METHODS
2.1. Study area description and definition of sampling points
The Tega River watershed is inside the Taquari-Antas watershed and located between latitudes 29° 0’ 48.16” and 29° 12’ 52.92” S and longitudes 51° 21’ 20.67” and 51° 7’ 9.53” W in the northeastern region of the Rio Grande do Sul state (southern Brazil) with a perimeter 116.81 km and draining area of 294.76 km². This watershed extends over part of the municipalities of Caxias do Sul, Flores da Cunha and Nova Pádua; however, approximately 40% of its area is within the Caxias do Sul urban perimeter, as shown in Figure 1. The main economic activities in this last municipality are the textile industry, plastic transformation, metallurgy, agriculture and livestock, as this is Brazil’s second largest metal-mechanic industry state (IBGE, 2016). The Tega River is within the urban perimeter of Caxias do Sul and drains the city’s urban area. After a course of 34 km, the river reaches its mouth on the Antas River at the border between the municipalities of Flores da Cunha and Nova Pádua (Vieceli et al., 2013). To elaborate the present study, five sampling points were selected considering the access, geographic location and the usage of the soil in the direct influence area, according to the locations on Figure 1. In this watershed, five campaigns were specifically made with bimonthly collections involving the sampling of
sediments and water, starting in November 2013 and finishing in July 2014. Table 1 presents the description of the sampling points.
Figure 1. Map presenting soil occupation and course of Tega River watershed and sampling points.
Table 1. Description of the Tega River watershed evaluated sampling points.
Sampling point
Collecting point description
UTM system coordinates (zone
22J)E (East) N
(North)
1
Located next to residential areas, receives pluvial
and small arroyos (drainages)
483185 6775491
2Located within a
largely urbanized and industrialized area
479575 6774453
3Effluent that drains
the industrial district region
476603 6773330
4
Located at the Central Geradora Hidrelétrica
Dona Maria Piana reservoir
469881 6781985
5
Watershed’s mouth, located before the
waters enter the Das Antas River
465295 6785536
2.2. Collecting procedures
The sediment samples were collected using regular shovels in backwater areas and placed into polyethylene flasks, which were previously washed with a 15% v/v alkaline solution of Extran detergent
249
and decontaminated with HNO3 50% v/v. The samples were kept at 4 °C until the moment of the analysis. The water samples were collected from the surface as oriented by NBR 9,897 and 9,898 (ABNT, 1987). The flasks with the samples were kept in proper containers and refrigerated at 4 °C until the beginning of the tests.
2.3. Characterization of sediment samples
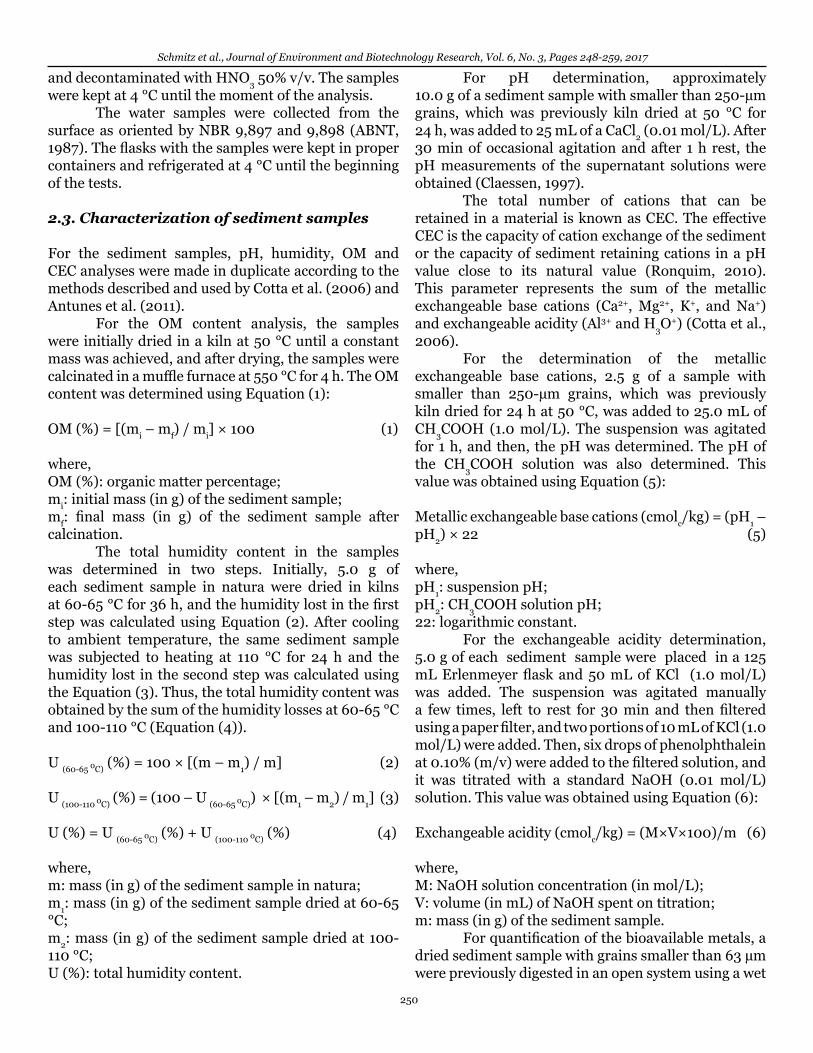
For the sediment samples, pH, humidity, OM and CEC analyses were made in duplicate according to the methods described and used by Cotta et al. (2006) and Antunes et al. (2011). For the OM content analysis, the samples were initially dried in a kiln at 50 °C until a constant mass was achieved, and after drying, the samples were calcinated in a muffle furnace at 550 °C for 4 h. The OM content was determined using Equation (1):
OM (%) = [(mi – mf) / mi] × 100 (1)
where,OM (%): organic matter percentage;mi: initial mass (in g) of the sediment sample;mf: final mass (in g) of the sediment sample after calcination. The total humidity content in the samples was determined in two steps. Initially, 5.0 g of each sediment sample in natura were dried in kilns at 60-65 °C for 36 h, and the humidity lost in the first step was calculated using Equation (2). After cooling to ambient temperature, the same sediment sample was subjected to heating at 110 °C for 24 h and the humidity lost in the second step was calculated using the Equation (3). Thus, the total humidity content was obtained by the sum of the humidity losses at 60-65 °C and 100-110 °C (Equation (4)).
U (60-65 oC) (%) = 100 × [(m – m1) / m] (2)
U (100-110 oC) (%) = (100 – U (60-65 oC)) × [(m1 – m2) / m1] (3) U (%) = U (60-65 oC) (%) + U (100-110 oC) (%) (4)
where,m: mass (in g) of the sediment sample in natura;m1: mass (in g) of the sediment sample dried at 60-65 °C;m2: mass (in g) of the sediment sample dried at 100-110 °C;U (%): total humidity content.
For pH determination, approximately 10.0 g of a sediment sample with smaller than 250-µm grains, which was previously kiln dried at 50 °C for 24 h, was added to 25 mL of a CaCl2 (0.01 mol/L). After 30 min of occasional agitation and after 1 h rest, the pH measurements of the supernatant solutions were obtained (Claessen, 1997). The total number of cations that can be retained in a material is known as CEC. The effective CEC is the capacity of cation exchange of the sediment or the capacity of sediment retaining cations in a pH value close to its natural value (Ronquim, 2010). This parameter represents the sum of the metallic exchangeable base cations (Ca2+, Mg2+, K+, and Na+) and exchangeable acidity (Al3+ and H3O
+) (Cotta et al., 2006). For the determination of the metallic exchangeable base cations, 2.5 g of a sample with smaller than 250-µm grains, which was previously kiln dried for 24 h at 50 °C, was added to 25.0 mL of CH3COOH (1.0 mol/L). The suspension was agitated for 1 h, and then, the pH was determined. The pH of the CH3COOH solution was also determined. This value was obtained using Equation (5):
Metallic exchangeable base cations (cmolc/kg) = (pH1 – pH2) × 22 (5)
where,pH1: suspension pH;pH2: CH3COOH solution pH;22: logarithmic constant. For the exchangeable acidity determination, 5.0 g of each sediment sample were placed in a 125 mL Erlenmeyer flask and 50 mL of KCl (1.0 mol/L) was added. The suspension was agitated manually a few times, left to rest for 30 min and then filtered using a paper filter, and two portions of 10 mL of KCl (1.0 mol/L) were added. Then, six drops of phenolphthalein at 0.10% (m/v) were added to the filtered solution, and it was titrated with a standard NaOH (0.01 mol/L) solution. This value was obtained using Equation (6):
Exchangeable acidity (cmolc/kg) = (M×V×100)/m (6)
where,M: NaOH solution concentration (in mol/L);V: volume (in mL) of NaOH spent on titration;m: mass (in g) of the sediment sample. For quantification of the bioavailable metals, a dried sediment sample with grains smaller than 63 µm were previously digested in an open system using a wet
Schmitz et al., Journal of Environment and Biotechnology Research, Vol. 6, No. 3, Pages 248-259, 2017
250

method with conventional heating at 95 °C in a digesting block in presence of HNO3, HCl and H2O2 (based on method 3050-B proposed by the Environmental Protection Agency (EPA)). The solutions were then filtered and expanded to 50 mL with Milli-Q water. The determination was made by ICP-OES. A detailing of the method is summarized in Figure 2.
~ 95 oC for 15 min
~ 85 oC for 2 h
~ 95 oC for 2 h and 30 min
~ 95 oC for 15 min
Addition of 5.0 mL of concentrated HNO3
Cooling to ambient temperature
Addition of 2.0 mL of deionized water and 8.0 mL of H2O2 30% (v/v)
Addition of 10.0 mL of concentrated HCl
Cooling to ambient temperature
Filtration
Expansion in a 50 mL flask with Milli-Q water
Quantification of metals by ICP -OES
1.0 g of dry sediment + 10.0 mL of HNO3 1:1 (v/v)
Figure 2. Schema indicating the details of EPA 3050-B.
To analyze bioavailable metals, an iCAP7000 series ICP-OES spectrometer with an axial mode view was used. The optical system was previously calibrated with a multielement reference solution. The spectral lines were selected considering the intensities of the emission signals, sensitivity, and absence of interferences. The ICP operating parameters were as follows: 1.15 kW radiofrequency power; 13 L/min argon plasma flow rate; 0.5 L/min auxiliary argon flow rate; 0.2 L/min nebulizer argon flow rate; and 1.5 L/min sample flow rate. The calibration curves were prepared from a multielement reference solution of metals at 1000
mg/L in 0.05, 0.10, 0.50, and 1.0 mg/L concentrations. The quality of analysis results was accompanied using a blank. The recovery levels of the bioavailable metals were evaluated in triplicate using a certified reference material (RM8704/Buffalo River Sediment) subjected to the same digestion procedure of the sediment samples.
2.4. Superficial water sample analysis
The superficial water samples were analyzed by the Laboratório de Análises e Pesquisas Ambientais (LAPAM) of the University of Caxias do Sul based on the methods proposed by the Standard Methods for the Examination of Water and Wastewater (Rice et al., 2012) (Table 2). Metal concentrations were determined using a Perkin Elmer Analyst 200 flame atomic absorption spectrophotometer (AAS), while pH, conductivity, DO and TDS were analyzed in loco using a Horiba U50 multi parameter meter.
3. RESULTS AND DISCUSSION
3.1. Superficial water samples
Table 3 shows the total metal concentrations and cyanide for the superficial water samples from the Tega River compared to the parameters mentioned in the Resolution of the National Environment Council (CONAMA) no 357/2005 (Resolução CONAMA n° 357, 2005), which provides classification of the water bodies and environmental directions for its framing. According to the Resolution of the Water Resources Council (CRH) from Rio Grande do Sul state no 121/2012 (Rio Grande do Sul, 2013), the Tega River is framed in “Class II”. However, taking into account the results obtained in the present study, its waters can be classified as "Class III" with respect to the presence of metal and cyanides, since some values were not in conformity with the predisposed in the legislation. Although Cd, Pb, and total cyanide concentrations were found below the detection limits of the methods (LODs) in some campaings, this is not representative of recent pollution by anthropogenic influences. At sampling points 1 and 2, the presence of metals Cu, Ni, Zn, and Cr as well as cyanide were identified. These parameters are associated with industrial waste; the metals are used in electroplating and in other industrial activities. According to Dash et al. (2009), most of the compounds that contain
Schmitz et al., Journal of Environment and Biotechnology Research, Vol. 6, No. 3, Pages 248-259, 2017
251

cyanide come from human activities, especially the chemical and electroplating industry effluents, mineral processing, vehicle exhaustion and pesticide release. Table 4 shows the results of the superficial water physico-chemical analysis. For sampling points 1, 2 and 3, which are located in an urban area, the highest values for conductivity, BOD, COD, cyanide, TSS, TDS and TS, and the smallest values for DO were observed, characterizing the waters with a great degree of pollution. Accordingly, it is important to highlight that on sampling point 1 the observed values for DO were close to those observed on sampling points 4 and 5, which may be justified by water turbulence that is promoted in this site. Quege and Siqueira (2005) highlighted that the DO parameter evaluation is an important factor for auto depuration, which is the reestablishment of water environment balance by only natural mechanisms. The same authors also highlighted that during auto depuration the organic compounds are converted to inert compounds and are not prejudicial to rivers from an ecological view. Thus, it is important to highlight the capacity of auto depuration of the studied hydric body, especially considering region terrain with a significant declivity and geographic accidents such as waterfalls and chutes. For sampling point 5, the values of conductivity, BOD, COD, TDS and TSS were smaller than those for the other sampling points. Conversely, the DO values were considerably greater at this sampling point. It is
important to highlight that the mentioned sampling point is located in a more turbulent water zone, where the Tega River joins the Antas River. Thus, it is evident, based on the mentioned parameters, that this sampling point suffers the smallest direct influence of anthropogenic actions. By the same reasons, similar characteristics can be observed on sampling point 4, which is also located in a site that does not directly receive urban waste. Increase of solids (suspended, total and dissolved) in a water resource may have anthropogenic or natural origin. Dissolved materials from soils and rocks and the OM decomposition are the main natural sources of solids in water. Conversely, the anthropogenic sources connected to solid concentrations are related to domestic and industrial waste release. There are no established criteria for COD acceptable values on water, but hydric bodies with high COD may present an oxygen deficiency for water organisms. Nonetheless, the low rates of DO may be related to the release of effluents of either domestic or industrial origin, especially those that contain soaps, phosphates, ammonia, and organic residues, which favor the biological activity and, consequently, decrease the amount of available oxygen (Quege and Siqueira, 2005). As with all other described parameters, conductivity expresses the capacity that water has to conduct electricity by the presence of dissolved
Schmitz et al., Journal of Environment and Biotechnology Research, Vol. 6, No. 3, Pages 248-259, 2017
252
Parameter Unit Analysis method LOD(a)
Total aluminum mg Al/L Standard Methods 3030 E and 3111-Al D 0.10Total cadmium mg Cd/L Standard Methods 3030 E and 3111 B 0.02
Total lead mg Pb/L Standard Methods 3120 B 0.118Total cyanide mg CN/L Standard Methods 4500-CN C and E 0.01Total copper mg Cu/L Standard Methods 3030 E and 3111 B 0.023
Total chromium mg Cr/L Standard Methods 3030 E and 3111 B 0.04Biochemical oxygen demand (BOD) mg O2/L Standard Methods 5210 B 1
Chemical oxygen demand (COD) mg O2/L Standard Methods 5220 B 5Total nickel mg Ni/L Standard Methods 3120 B 0.053
Total suspended solids (TSS) mg/L Standard Methods 2540 10Total solids (TS) mg/L Standard Methods 2540 D 10
Total zinc mg Zn/L Standard Methods 3030 E and 3111 B 0.034In loco determination
pH - HORIBA U50 - multi parameter -Conductivity μs/cm HORIBA U50 - multi parameter -
Dissolved oxygen (DO) mg O2/L HORIBA U50 - multi parameter -Total dissolved solids (TDS) mg/L HORIBA U50 - multi parameter -
Table 2. Physico-chemical analysis made on the superficial water samples.
(a)LOD: Detection limit of the method

substances, which is directly proportional to ionic concentration (Libânio, 2005). This parameter indicates possible modifications in water quality, especially mineral concentration. Waters that possess low pH values may potentiate the liberation and solubilization of sediment-adsorbed metals, influencing the phosphor and nitrogen concentrations. The mean pH of the samples were in the neutral region for all the sampling points, but on campaign 5, for all the evaluated sampling points, there was a variation of 5.81 (sampling point 2) to 6.07 (sampling point 4).
3.2. Sediment samples
Table 5 shows the results for CEC, pH, total humidity and OM of the sediment samples. Sediments with OM contents higher than 10% dry weight are considered organic, while mineral sediments (inorganic) are characterized by lower than 10% OM content. In this
case, silica, clay and calcium, iron and manganese compounds, among others, may predominate in the composition (Antunes et al., 2011; Esteves, 2011). In this study, OM content was below 10% in all campaigns at sampling points 1, 2, 3 and 5, except for campaign 3 for the last point, which might indicate a tendency for the solubilization of minerals for the water column (Campagna et al., 2008). For the sampling point 4, on the other hand, the OM values were above 10% in all campaigns. Metals in sediments are primarily associated with OM and fractions of fine grain size (clay, silt and fine sand) iron and manganese oxides or in insoluble forms such as hydroxides, sulfides, or carbonates (Zhou et al., 2014). In addition, a pH increase can raise the metal adsorption in the finest particles of the sediment due to the concurrent decrease of binding sites between H3O
+ ions and metallic cations (Fagnani et al., 2011). Palanques et al. (2017) states that this research related the Cr, Cu, Pb and Zn accumulation mechanisms
253
Schmitz et al., Journal of Environment and Biotechnology Research, Vol. 6, No. 3, Pages 248-259, 2017
Table 3. Results for metal and cyanide concentrations on superficial water samples.
Samplingpoint Campaign Total Al
(mg Al/L)Total Cd
(mg Cd/L)Total Pb
(mg Pb/L)
Total Cu(mg
Cu/L)
Total Ni(mg Ni/L)
Total Zn(mg Zn/L)
Total Cr(mg Cr/L)
Total cyanide
(mg CN/L)
1
1 0.438 <0.02 <0.118 0.742 0.560 1.146 0.483 0.2452 0.350 <0.02 <0.118 0.056 <0.053 0.091 <0.04 0.0303 0.020 <0.02 <0.118 0.467 0.124 0.044 0.100 0.0304 0.240 <0.02 <0.118 0.034 0.124 0.084 <0.04 0.0605 0.470 <0.02 <0.118 <0.023 <0.053 0.078 <0.04 <0.01
2
1 0.156 <0.02 <0.118 0.305 0.389 0.599 0.237 0.1492 0.588 <0.02 <0.118 0.266 0.093 <0.034 <0.04 0.3943 0.200 <0.02 <0.118 0.648 0.292 1.024 0.670 0.4904 2.880 <0.02 <0.118 0.246 0.229 0.649 0.420 0.0405 0.590 <0.02 <0.118 0.160 0.153 0.366 0.870 0.080
3
1 0.282 <0.02 <0.118 <0.023 <0.053 0.101 <0.04 <0.012 0.214 <0.02 <0.118 <0.023 <0.053 0.141 0.062 <0.013 0.100 <0.02 <0.118 <0.023 <0.053 0.197 <0.04 0.0204 0.370 <0.02 <0.118 <0.023 <0.053 0.121 <0.04 <0.015 0.380 <0.02 <0.118 0.032 0.070 0.136 0.110 <0.01
4
1 0.264 <0.02 <0.118 0.040 0.134 0.120 0.790 <0.012 0.637 <0.02 <0.118 <0.023 <0.053 0.034 <0.04 <0.013 0.290 <0.02 <0.118 0.034 0.069 0.173 0.070 <0.014 0.440 <0.02 <0.118 0.023 0.082 0.134 0.060 0.0205 0.310 <0.02 <0.118 0.038 0.054 0.138 0.100 <0.01
5
1 0.178 <0.02 <0.118 <0.023 0.090 0.107 0.040 <0.012 0.382 <0.02 <0.118 <0.023 <0.053 0.034 <0.04 <0.013 0.340 <0.02 <0.118 0.050 <0.053 0.052 <0.04 <0.014 0.510 <0.02 <0.118 0.028 0.080 0.146 0.060 0.0205 0.470 <0.02 <0.118 <0.023 <0.053 0.078 <0.04 <0.01
Classes I and II 0.1 0.001 0.01 0.009 0.025 0.18 0.05 0.005Class III 0.2 0.01 0.033 0.013 0.025 5 0.05 0.022
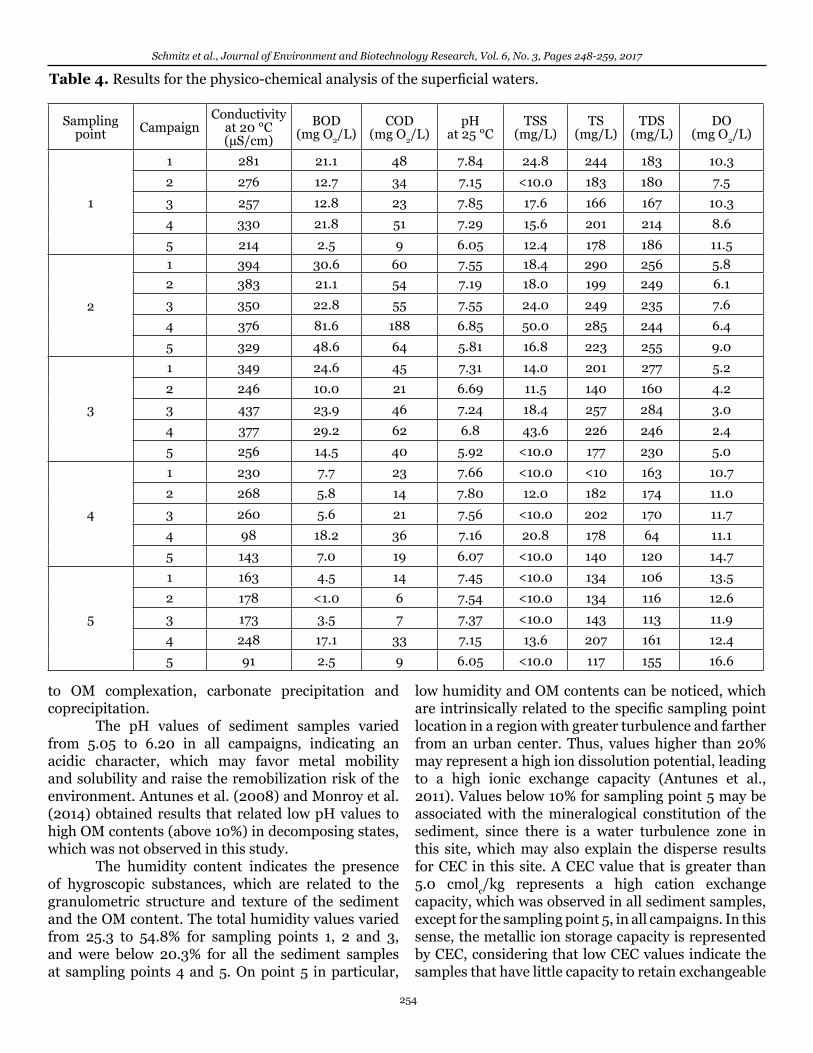
to OM complexation, carbonate precipitation and coprecipitation. The pH values of sediment samples varied from 5.05 to 6.20 in all campaigns, indicating an acidic character, which may favor metal mobility and solubility and raise the remobilization risk of the environment. Antunes et al. (2008) and Monroy et al. (2014) obtained results that related low pH values to high OM contents (above 10%) in decomposing states, which was not observed in this study. The humidity content indicates the presence of hygroscopic substances, which are related to the granulometric structure and texture of the sediment and the OM content. The total humidity values varied from 25.3 to 54.8% for sampling points 1, 2 and 3, and were below 20.3% for all the sediment samples at sampling points 4 and 5. On point 5 in particular,
low humidity and OM contents can be noticed, which are intrinsically related to the specific sampling point location in a region with greater turbulence and farther from an urban center. Thus, values higher than 20% may represent a high ion dissolution potential, leading to a high ionic exchange capacity (Antunes et al., 2011). Values below 10% for sampling point 5 may be associated with the mineralogical constitution of the sediment, since there is a water turbulence zone in this site, which may also explain the disperse results for CEC in this site. A CEC value that is greater than 5.0 cmolc/kg represents a high cation exchange capacity, which was observed in all sediment samples, except for the sampling point 5, in all campaigns. In this sense, the metallic ion storage capacity is represented by CEC, considering that low CEC values indicate the samples that have little capacity to retain exchangeable
254
Schmitz et al., Journal of Environment and Biotechnology Research, Vol. 6, No. 3, Pages 248-259, 2017
Table 4. Results for the physico-chemical analysis of the superficial waters.
Sampling point Campaign
Conductivity at 20 °C (µS/cm)
BOD(mg O2/L)
COD(mg O2/L)
pH at 25 °C
TSS(mg/L)
TS(mg/L)
TDS(mg/L)
DO(mg O2/L)
1
1 281 21.1 48 7.84 24.8 244 183 10.3
2 276 12.7 34 7.15 <10.0 183 180 7.5
3 257 12.8 23 7.85 17.6 166 167 10.3
4 330 21.8 51 7.29 15.6 201 214 8.6
5 214 2.5 9 6.05 12.4 178 186 11.5
2
1 394 30.6 60 7.55 18.4 290 256 5.82 383 21.1 54 7.19 18.0 199 249 6.1
3 350 22.8 55 7.55 24.0 249 235 7.6
4 376 81.6 188 6.85 50.0 285 244 6.4
5 329 48.6 64 5.81 16.8 223 255 9.0
3
1 349 24.6 45 7.31 14.0 201 277 5.2
2 246 10.0 21 6.69 11.5 140 160 4.2
3 437 23.9 46 7.24 18.4 257 284 3.0
4 377 29.2 62 6.8 43.6 226 246 2.4
5 256 14.5 40 5.92 <10.0 177 230 5.0
4
1 230 7.7 23 7.66 <10.0 <10 163 10.7
2 268 5.8 14 7.80 12.0 182 174 11.0
3 260 5.6 21 7.56 <10.0 202 170 11.7
4 98 18.2 36 7.16 20.8 178 64 11.1
5 143 7.0 19 6.07 <10.0 140 120 14.7
5
1 163 4.5 14 7.45 <10.0 134 106 13.5
2 178 <1.0 6 7.54 <10.0 134 116 12.6
3 173 3.5 7 7.37 <10.0 143 113 11.9
4 248 17.1 33 7.15 13.6 207 161 12.4
5 91 2.5 9 6.05 <10.0 117 155 16.6
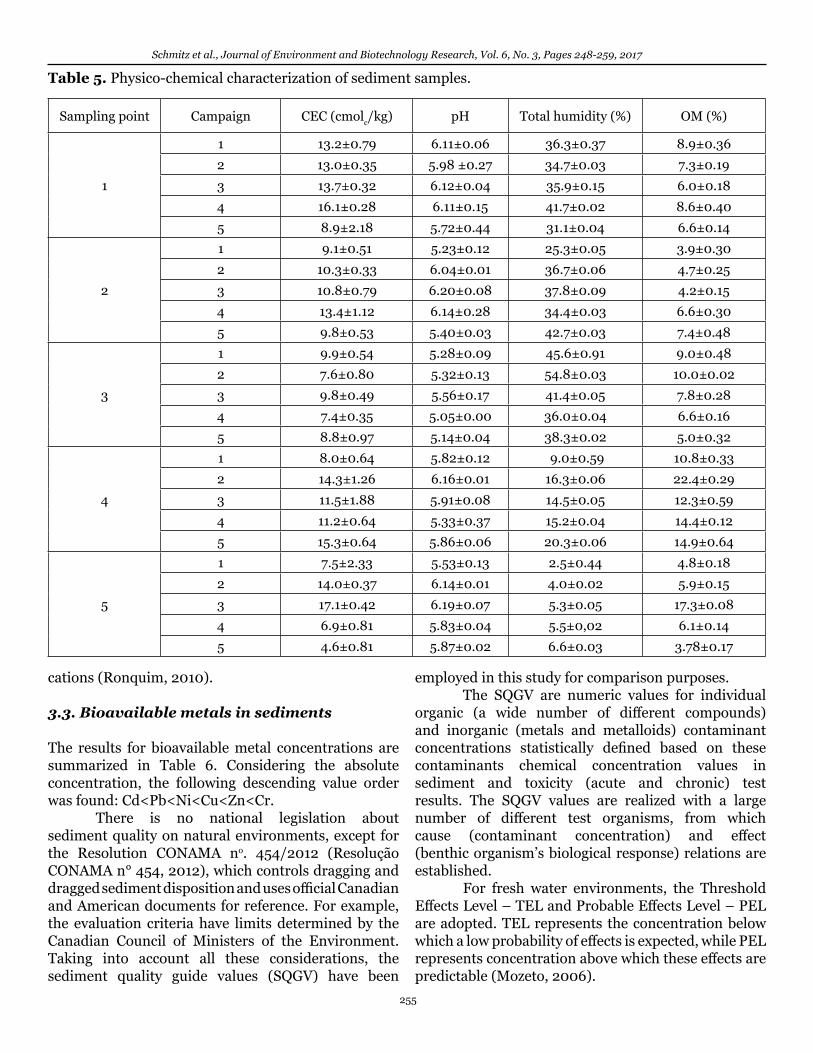
cations (Ronquim, 2010).
3.3. Bioavailable metals in sediments
The results for bioavailable metal concentrations are summarized in Table 6. Considering the absolute concentration, the following descending value order was found: Cd<Pb<Ni<Cu<Zn<Cr. There is no national legislation about sediment quality on natural environments, except for the Resolution CONAMA no. 454/2012 (Resolução CONAMA n° 454, 2012), which controls dragging and dragged sediment disposition and uses official Canadian and American documents for reference. For example, the evaluation criteria have limits determined by the Canadian Council of Ministers of the Environment. Taking into account all these considerations, the sediment quality guide values (SQGV) have been
employed in this study for comparison purposes. The SQGV are numeric values for individual organic (a wide number of different compounds) and inorganic (metals and metalloids) contaminant concentrations statistically defined based on these contaminants chemical concentration values in sediment and toxicity (acute and chronic) test results. The SQGV values are realized with a large number of different test organisms, from which cause (contaminant concentration) and effect (benthic organism’s biological response) relations are established. For fresh water environments, the Threshold Effects Level – TEL and Probable Effects Level – PEL are adopted. TEL represents the concentration below which a low probability of effects is expected, while PEL represents concentration above which these effects are predictable (Mozeto, 2006).
255
Schmitz et al., Journal of Environment and Biotechnology Research, Vol. 6, No. 3, Pages 248-259, 2017
Table 5. Physico-chemical characterization of sediment samples.
Sampling point Campaign CEC (cmolc/kg) pH Total humidity (%) OM (%)
1
1 13.2±0.79 6.11±0.06 36.3±0.37 8.9±0.36
2 13.0±0.35 5.98 ±0.27 34.7±0.03 7.3±0.19
3 13.7±0.32 6.12±0.04 35.9±0.15 6.0±0.18
4 16.1±0.28 6.11±0.15 41.7±0.02 8.6±0.40
5 8.9±2.18 5.72±0.44 31.1±0.04 6.6±0.14
2
1 9.1±0.51 5.23±0.12 25.3±0.05 3.9±0.30
2 10.3±0.33 6.04±0.01 36.7±0.06 4.7±0.25
3 10.8±0.79 6.20±0.08 37.8±0.09 4.2±0.15
4 13.4±1.12 6.14±0.28 34.4±0.03 6.6±0.30
5 9.8±0.53 5.40±0.03 42.7±0.03 7.4±0.48
3
1 9.9±0.54 5.28±0.09 45.6±0.91 9.0±0.48
2 7.6±0.80 5.32±0.13 54.8±0.03 10.0±0.02
3 9.8±0.49 5.56±0.17 41.4±0.05 7.8±0.28
4 7.4±0.35 5.05±0.00 36.0±0.04 6.6±0.16
5 8.8±0.97 5.14±0.04 38.3±0.02 5.0±0.32
4
1 8.0±0.64 5.82±0.12 9.0±0.59 10.8±0.33
2 14.3±1.26 6.16±0.01 16.3±0.06 22.4±0.29
3 11.5±1.88 5.91±0.08 14.5±0.05 12.3±0.59
4 11.2±0.64 5.33±0.37 15.2±0.04 14.4±0.12
5 15.3±0.64 5.86±0.06 20.3±0.06 14.9±0.64
5
1 7.5±2.33 5.53±0.13 2.5±0.44 4.8±0.18
2 14.0±0.37 6.14±0.01 4.0±0.02 5.9±0.15
3 17.1±0.42 6.19±0.07 5.3±0.05 17.3±0.08
4 6.9±0.81 5.83±0.04 5.5±0,02 6.1±0.14
5 4.6±0.81 5.87±0.02 6.6±0.03 3.78±0.17
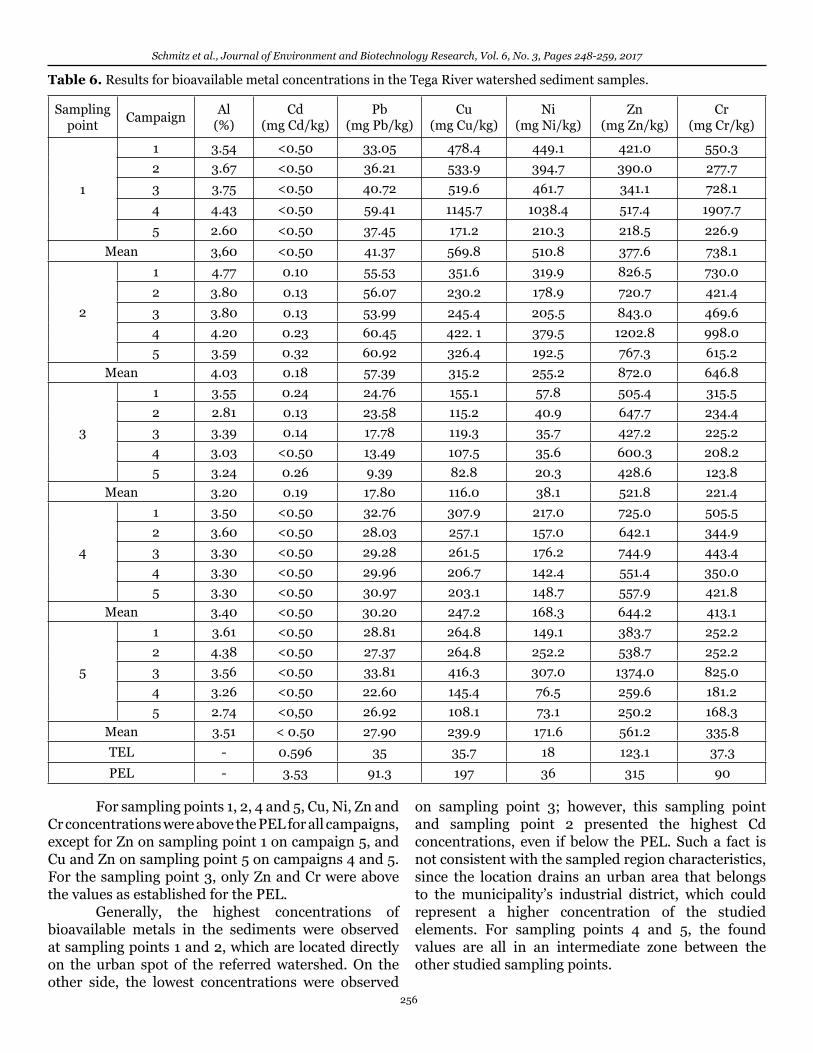
For sampling points 1, 2, 4 and 5, Cu, Ni, Zn and Cr concentrations were above the PEL for all campaigns, except for Zn on sampling point 1 on campaign 5, and Cu and Zn on sampling point 5 on campaigns 4 and 5. For the sampling point 3, only Zn and Cr were above the values as established for the PEL. Generally, the highest concentrations of bioavailable metals in the sediments were observed at sampling points 1 and 2, which are located directly on the urban spot of the referred watershed. On the other side, the lowest concentrations were observed
on sampling point 3; however, this sampling point and sampling point 2 presented the highest Cd concentrations, even if below the PEL. Such a fact is not consistent with the sampled region characteristics, since the location drains an urban area that belongs to the municipality’s industrial district, which could represent a higher concentration of the studied elements. For sampling points 4 and 5, the found values are all in an intermediate zone between the other studied sampling points.
256
Schmitz et al., Journal of Environment and Biotechnology Research, Vol. 6, No. 3, Pages 248-259, 2017
Table 6. Results for bioavailable metal concentrations in the Tega River watershed sediment samples.
Sampling point Campaign Al
(%)Cd
(mg Cd/kg)Pb
(mg Pb/kg)Cu
(mg Cu/kg)Ni
(mg Ni/kg)Zn
(mg Zn/kg)Cr
(mg Cr/kg)
1
1 3.54 <0.50 33.05 478.4 449.1 421.0 550.32 3.67 <0.50 36.21 533.9 394.7 390.0 277.73 3.75 <0.50 40.72 519.6 461.7 341.1 728.1
4 4.43 <0.50 59.41 1145.7 1038.4 517.4 1907.7
5 2.60 <0.50 37.45 171.2 210.3 218.5 226.9
Mean 3,60 <0.50 41.37 569.8 510.8 377.6 738.1
2
1 4.77 0.10 55.53 351.6 319.9 826.5 730.02 3.80 0.13 56.07 230.2 178.9 720.7 421.43 3.80 0.13 53.99 245.4 205.5 843.0 469.64 4.20 0.23 60.45 422. 1 379.5 1202.8 998.05 3.59 0.32 60.92 326.4 192.5 767.3 615.2
Mean 4.03 0.18 57.39 315.2 255.2 872.0 646.8
3
1 3.55 0.24 24.76 155.1 57.8 505.4 315.52 2.81 0.13 23.58 115.2 40.9 647.7 234.43 3.39 0.14 17.78 119.3 35.7 427.2 225.24 3.03 <0.50 13.49 107.5 35.6 600.3 208.25 3.24 0.26 9.39 82.8 20.3 428.6 123.8
Mean 3.20 0.19 17.80 116.0 38.1 521.8 221.4
4
1 3.50 <0.50 32.76 307.9 217.0 725.0 505.52 3.60 <0.50 28.03 257.1 157.0 642.1 344.93 3.30 <0.50 29.28 261.5 176.2 744.9 443.44 3.30 <0.50 29.96 206.7 142.4 551.4 350.05 3.30 <0.50 30.97 203.1 148.7 557.9 421.8
Mean 3.40 <0.50 30.20 247.2 168.3 644.2 413.1
5
1 3.61 <0.50 28.81 264.8 149.1 383.7 252.22 4.38 <0.50 27.37 264.8 252.2 538.7 252.23 3.56 <0.50 33.81 416.3 307.0 1374.0 825.04 3.26 <0.50 22.60 145.4 76.5 259.6 181.25 2.74 <0,50 26.92 108.1 73.1 250.2 168.3
Mean 3.51 < 0.50 27.90 239.9 171.6 561.2 335.8TEL - 0.596 35 35.7 18 123.1 37.3
PEL - 3.53 91.3 197 36 315 90

In a similar study conducted by Antunes et al. (2011) on the same watershed, the metallic species Cu, Ni, Pb and Zn presented the lowest concentrations on the Tega River mouth (Cu = 3.25 mg/kg, Ni = 0.60 mg/kg, Pb = 1.34 mg/kg, Zn = 2.36 mg/kg) from the analyzed sampling points. These results are associated with the fact that the sediment may be retained at the dam made at the Central Geradora Elétrica Dona Maria Piana, located upstream, which was not analyzed on that study. Such conclusions agree partially with the results obtained in this study, since sampling point 4, located at the Central Geradora Hidrelétrica Dona Maria Pina dam, presents similar results to sampling point 5. However, the obtained concentrations are higher than those obtained by Antunes et al. (2011). An accumulation of metallic species may be occurring in the dam and the transportation of ions to Antas River, which the Tega River is an affluent, may be occurring. Furthermore, Antunes et al. (2011) also evaluated the site characterized as sampling point 2 in this study and found the following results: Cd = 0.11 mg/kg, Cr = 17.99 mg/kg, Cu = 29.09 mg/kg, Ni = 14.43 mg/kg, Pb = 5.02 mg/kg, and Zn = 45.71 mg/kg. These values were considerably lower than the results presented here, except for Cd (mean value of 0.18 mg/kg). However, in that study, among the studied points, this site presented the highest content of metals, which was associated with the accumulation of OM on the site. Rodrigues et al. (2015) analyzed the metal contents in sediment samples collected from the Gravataí River watershed, which is also located in the northeastern region of the Rio Grande do Sul state (Brazil), and found the following mean concentrations: Cd = 2.30 mg/kg, Cr = 66.3 mg/kg, Cu = 78.5 mg/kg, Ni = 29.6 mg/kg, and Zn = 288.0 mg/kg. Compared to the present study, only the mean value of Cd was higher than the data obtained for the Tega River in all sampling points. For Cr, the concentrations are up to 10 times greater than the values found by these same authors.
Generally, the highest concentrations of bioavailable metals were observed at sampling points 1 and 2 as well as sampling point 4. As seen before, these same points presented high mean CEC compared to the other sampling points. CEC evinces the ability for the sediment to retain and exchange positively charged ions at the colloidal surface, representing the total cations retained at the surface of these materials in an exchangeable condition (Ronquim, 2010). CEC values higher than 5.0 cmolc/kg evince a high exchange capacity, which means the total availability of metal in the sediments depends on the strength of the geochemical binder/substrate interaction (Cotta et al., 2006). In the present study, only CEC showed a direct relationship with the bioavailable metal content in the sediments. In this context, similar results were found in other studies. Yuan et al. (2014), for example, observed that for samples with a 6.6 and 8.4 (mean of 7.5) variation in pH value, a significant relation between the OM content and the metal concentration was not observed. Additionally, another study held by Lemes (2001) showed that a correlation between bioavailable metals and OM was also not observed, while Monroy et al. (2014) reported that the OM content was positively related to Cu, Zn, Cd and Co concentrations, and the pH value was negatively related to the OM content and all metal concentrations in the sediments. Many industries in Caxias do Sul started their activities in the 1970s, and the municipality urbanization is related to this fact (Corrêa et al., 2012). Therefore, the Tega River, which drains the municipality, has been the hydric resource that acts as a channel for treating effluents coming from point resources for residences and industries, and the effluent treatment system is not enough to match the release standards present on state legislation. The watershed urban area drain also contributes to water quality degradation, and considering that during precipitation events, the surface runoff generated by rain promotes OM, soil
257
Schmitz et al., Journal of Environment and Biotechnology Research, Vol. 6, No. 3, Pages 248-259, 2017
MetalValues (mg/kg)
Recovery (%) LOD (mg/L)Certified ExperimentalAl 6.10±0.18(a) 5.91±0.19(a) 96.9 0.08Cd 2.94±0.29 2.89±0.14 98.3 0.01
Cr 121.9±3.8 100.2±2.3 82.2 0.02
Pb 150±17 144±5 96.0 0.03Ni 42.9±3.7 41.1±0.25 95.8 0.03
Zn 408±15 397±3 97.3 0.01
Table 7. Recovery data for metals on the RM 8704 certified material/Buffalo River Sediment.
(a)% values
particles and solid residue dragging into hydric bodies, which raises the pollutant concentrations.
3.4. Metals recovery rate
Table 7 shows the results related to the recovery rates for Al, Cd, Cr, Pb, Ni and Zn metals from RM 8704 certified material/Buffalo River Sediment. For Cu, there is not a concentration value on that certified material, and for this reason, it was not included in the analysis. All the materials, except for Cr, presented recovery higher than 95%. For Cr, the rate was 82.2%, which may be explained by the fact that this metal, being refractory, is strongly connected to silicates that are difficult to solubilize. Other works from Sussulini and Arruda (2006) and Antunes et al. (2008) also found a low recovery for that particular element. The results obtained show that the studied metals are within the recommended recovery zone for those elements, since most of the analytical validation procedures adopt values between 70 and 120% as acceptable (Furtado, 2007).
4. CONCLUSIONS
The results obtained by this study allowed us to conclude that the studied watershed is characterized by the influence of a population and industrial concentration present in the urban area of the municipality of Caxias do Sul. Concentration values found for bioavailable metals were higher for sediment samples compared to superficial water samples, showing that those are important metallic species accumulation areas, especially for Cu, Ni, Zn and Cr that showed concentrations above the PEL. The highest metal concentrations in the sediments were observed at sampling points 1 and 2, which were located directly in the urban area, while on sampling point 3, the mean concentrations were the smallest. However, this referred sampling point drains the waters from the municipality industrial district. Furthermore, on sampling point 4, which is located at a dam, the accumulation of metallic species may be occurring due to the lake conditions, as it is a hydroelectric dam. The results for sampling point 5 indicate that the Tega River may act as a metallic ion transporter to the Antas River, since it is the studied watershed mouth. Considering superficial water quality, sampling points 1, 2 and 3 possessed the worst quality, which is directly influenced by their locations in the urban
area with a greater population and industry presence and, consequently, greater effluent and sewer release. On the other hand, sampling points 4 and 5 presented quality that compared to that of sampling points 1, 2 and 3. It is important to highlight that the origin of the mentioned studied contaminants may be associated with the region’s industrial characteristics, with a strong presence of electroplating that makes chroming, nickeling, zincking, coppering and anodizing (Al). Finally, this study provides evidence on the importance of monitoring the sediment quality and promoting an efficient control of local pollutant sources. However, it is still necessary to advance the development of new strategies and to introduce new tools for managing the environments of hydric resources.
ACKNOWLEDGEMENTS
The authors thank the Caxias do Sul Environmental Office (Secretaria de Meio Ambiente – SEMMA) and the Environmental Sanitation Institute (Instituto de Saneamento Ambiental – ISAM) by the support.
REFERENCES
ABNT, Associação Brasileira das Normas Técnicas (1987) NBR 9897: Planejamento de amostragem de efluentes Líquidos e corpos receptores. Rio de Janeiro: ABNT, pp. 1-14.
Abubacker, M.N. and Sathya, C. (2017) In vitro phytoremediation potential of heavy metals by duck weed Lemna polyrrhiza L. (Lemnaceae) and its combustion process as manure value. Journal of Environment and Biotechnology Research, 6, 82-87.
Alves, R.I.S., Sampaio, C.F., Nadal, M., Schuhmacher, M., Domingo, J.L. and Muñoz, S.I.S. (2014) Metal concentrations in surface water and sediments from Pardo River, Brazil: Human health risks. Environmental Research, 133, 149-155.
Antunes, M., Antunes, M.T., Adamatti, D.S., Gelain, R., Schneider, V.E., Giovanela, M. and Fernandes, A.N. (2011) Avaliação preliminar de impactos ambientais através da determinação de metais em sedimentos de bacias urbanizadas. In: Lima, J.E.F.W. and Lopes, W.T.A. Eds.; Engenharia de Sedimentos: na busca de soluções para problemas de erosão e assoreamento. Brasília: Associação Brasileira de Recursos Hídricos, 65-87.
Antunes, M., Dillon, D.B., Crespo, J.S. and Giovanela, M. (2008) Avaliação dos parâmetros físico-químicos e do teor de metais em amostras de sedimento de uma microbacia gaúcha. Geochimica Brasiliensis, 22, 178-188.
Bi, N., Zuosheng, Y., Wang, H., Congliang, X. and Zhigang, G. (2014) Impact of artificial water and sediment discharge regulation in the Huanghe (Yellow River) on the transport of particulate heavy metals to the sea. Catena, 121, 232-240.
Campagna, A.F., Fracácio, R., Rodrigues, B.K., Eler, M.N., Verani, N.F. and Espíndola, E.L.G. (2008) Analyses of the sediment toxicity of Monjolinho River, São Carlos, São Paulo State, Brazil, using survey, growth and gill morphology of two fish species (Danio rerio and Poecili areticulata). Brazilian Archives of Biology and Technology, 51, 193-201.
Schmitz et al., Journal of Environment and Biotechnology Research, Vol. 6, No. 3, Pages 248-259, 2017
258

Chiappetta, J.M.M., Machado, W., Santos, J.M. and Lessa, J.A. (2016) Trace metal bioavailability in sediments from a reference site, Ribeira Bay, Brazil. Marine Pollution Bulletin, 106, 395-399.
Claessen, M.E.C. (1997) Manual de Métodos de Análise de Solo. 2nd edition, Embrapa-CNPS: Rio de Janeiro, 212p.
Corrêa, G.O., Nunes, M.F.O., Barroso, A. and Gullo, M.C. (2012) Industrialização e sub-habitação em Caxias do Sul. Diálogo Canoas, 21, 173-205.
Cotta, J.A., Rezende, M.O.O. and Piovani, M.R. (2006) Avaliação do Teor de Metais em Sedimento do Rio Betari no Parque Estadual Turístico do Alto Ribeira - Petar, São Paulo, Brasil. Química Nova, 29, 40-45.
Dash, R.R., Gaurb, A.A. and Balomajumder, C. (2009) Cyanide in industrial wastewaters and its removal: A review on biotreatment. Journal of Hazardous Materials, 163, 1-11.
Díez, E.G., Corella, J.P., Adatte, T., Thevenon, F. and Loizeau, J.C. (2017) High-resolution reconstruction of the 20th century history of trace metals, major elements, and organic matter in sediments in a contaminated area of Lake Geneva, Switzerland. Applied Geochemistry, 78, 1-11.
Esteves, F.A. (2011) Fundamentos de Limnologia. 3edition, Rio de Janeiro: Interciência, 790.
Fagnani, E., Guimarães, J.R., Mozeto, A.A. and Fadini, O.S. (2011) Sulfetos volatilizáveis por acidificação e metais extraídos simultaneamente na avaliação de sedimentos de água doce. Química Nova, 34, 1618-1628.
Fan, W., Xu, Z. and Wang, W.X. (2014) Metal pollution in a contaminated bay: Relationship between metal geochemical fractionation in sediments and accumulation in a polychaete. Environmental Pollution, 191, 50-57.
Furtado, J.G.C. (2007) Estudo de impactos ambientais causados por metais pesados em água do mar na baía de São Marcos: correlações e níveis background. Dissertação de mestrado apresentada ao Programa de Pós-graduação em Química da Universidade Federal da Paraíba.
Gastaldini, M.C.C. and Silva, A.R.V. (2012) Estudo da distribuição de poluentes em superfícies urbanas. Revista Brasileira de Recursos Hídricos, 17, 97-107.
Guimarães, V. and Sígolo, J.B. (2008) Detecção de contaminantes em espécie bioindicadora (Corbicula fluminea) – Rio Ribeira de Iguape – SP. Química Nova, 15, 254-261
IBGE, Instituto Brasileiro de Geografia e Estatística. Cidades. (2016) Disponível em: <http://www.cidades.ibge.gov.br/v3/cidades/municipio/4305108> Acesso em: 20 dez. 2016.
Lemes, M.J.L. (2001) Avaliação de metais e elementos-traço em águas e sedimentos das Bacias Hidrográficas dos rio Mogi-Guaçú e Pardo, São Paulo. Dissertação de Mestrado: São Paulo: Instituto de Pesquisas Energética e Nucleares.
Libânio, M. (2005) Fundamentos de qualidade e tratamento de água. 2ed. Campinas: Átomo, 444p.
Monroy, M., Veiga, A.M. and Sostoa, A. (2014) Metal concentration in water, sediment and four fish species from Lake Titicaca reveals a large-scale environmental concern. Science of the Total Environment, 487, 233-244.
Mozeto, A.A. (2006) Coleta de sedimentos de ambientes aquáticos continentais, extração de águas intersticiais e determinação granulométrica. In: Mozeto, A.A., Umbuzeiro, G.A. and Jardim, W.F. Eds.; Métodos de coleta, análises físico-químicas e ensaios biológicos e ecotoxicológicos de sedimentos de água doce. São Carlos. Cubo Multimídia, 26-35.
Palanques, A., Lopez, L., Guillén, J., Puiga, P. and Masqué, P. (2017) Decline of trace metal pollution in the bottom sediments of the Barcelona City continental shelf (NWMediterranean). Science of the Total Environment, 579, 755-767.
Poleto, C. (2007) Fontes potenciais e qualidade dos sedimentos fluviais em suspensão em ambiente urbano. 159p. Tese de Doutorado. Programa de Pós-Graduação em Recursos Hídricos e Saneamento Ambiental. Universidade Federal do Rio Grande do Sul, Porto Alegre.
Quege, K.E. and Siqueira, E.Q. (2005) Avaliação da Qualidade de água no Córrego Botafogo na cidade de Goiânia – GO. XXIII Congresso Brasileiro de Engenharia Sanitária e Ambiental, Campo Grande, MS.
Resolução CONAMA n° 357 (2005) Dispõe sobre a classificação dos corpos de água e diretrizes ambientais para o seu enquadramento, bem como estabelece as condições e padrões de lançamento de efluentes, e dá outras providências. Brasília, DF. Disponível em: <http://www.mma.gov.br/port/conama/res/res05/res35705.pdf>. Acesso em: 21 fev. 2012.
Resolução CONAMA n° 454 (2012) Estabelece as diretrizes gerais e os procedimentos referenciais para o gerenciamento do material a ser dragado em águas sob jurisdição nacional. Brasília, DF. Disponível em: <http://www.mma.gov.br/port/conama/legiabre.cfm?codlegi=693> Acesso em: 20 mar. 2014.
Rice, E.W., Baird, R.B., Eaton, E.A. and Clesceri, L.S. (2012) Standard methods for the examination of water and wastewater. 22nd edition Washington: American Public Health Association, 1496.
Rio Grande do Sul. Resolução CRH nº 121, de 12 de dezembro de 2013. Aprova o enquadramento das águas superficiais da Bacia Hidrográfica do Rio Taquari-Antas. 2013. Diário Oficial do Estado do Rio Grande do Sul, Porto Alegre, 07 January 2013.
Rodrigues, M.L.K., Pasqualini, J.P., Guerra, M.P.L., Stival, V., Carvalho, C.T. and Ferraro, L.M.W. (2015) Emprego de análise fatorial para identificação de sedimentos contaminados por metais no Rio Gravataí, RS. In: I Congresso Internacional de Hidrossedimentologia, Porto Alegre, RS.
Ronquim, C.C. (2010) Conceitos de fertilidade do solo e manejo adequado para as regiões tropicais. Campinas: Embrapa Monitoramento por Satélite, 27.
Sussulini, A. and Arruda, M. A. Z. (2006) Determinação de cromo (VI) por espectrometria de absorção atômica com chama após a extração e pré-concentração no ponto nuvem. Eclética Química, 31, 73-80.
Vieceli, N.C., Bortolin, T.A., Mendes, L.A., Bacarim, G., Cemin, G. and Schneider, V.E. (2013) Avaliação da Fisiografia de Bacias Hidrográficas de Caxias do Sul, RS. In: XX Simpósio Brasileiro de Recursos Hídricos, Bento Gonçalves: Associação Brasileira de Recursos Hídricos.
Wang, Z., Yao, L., Liu, G. and Liu, W. (2014) Heavy metals in water, sediments and submerged macrophytes in ponds around the Dianchi Lake, China. Ecotoxicology and Environmental Safety, 107, 200-206.
Yuan, X., Zhang, L., Li, J., Wang, C. and Ji, J. (2014) Sediment properties and heavy metal pollution assessment in the river, estuary and lake environments of a fluvial plain, China. Catena, 119, 52-60.
Zhou, G., Sun, B., Zeng, D., Wei, H., Liu, Z. and Zhang, B. (2014) Vertical distribution of trace elements in the sediment cores from major rivers in East China and its implication on geochemical background and anthropogenic effects. Journal of Geochemical Exploration, 139, 53-67.
259
Schmitz et al., Journal of Environment and Biotechnology Research, Vol. 6, No. 3, Pages 248-259, 2017