jefferies consumer conference presentation
TRANSCRIPT

Jefferies Consumer Conference PresentationJune 22 2021
DisclaimerForward-Looking Statements
Certain statements made herein are not historical facts but are ldquoforward-looking statementsrdquo within the meaning of the ldquosafe harborrdquo provisions of the Private Securities Litigation Reform Act of 1995 as amended The forward-looking statements generally are accompanied by or include without limitation statements such as ldquowillrdquo ldquoexpectrdquo ldquointendsrdquo ldquogoalrdquo or other similar words phrases or expressions These forward-looking statements include the expected effects from the COVID-19 pandemic future plans for the Company the estimated or anticipated future results and benefits of the Companyrsquos future plans and operations future capital structure future opportunities for the Company and other statements that are not historical facts These statements are based on the current expectations of the Companyrsquos management and are not predictions of actual performance These statements are subject to a number of risks and uncertainties and the Companyrsquos business and actual results may differ materially Factors that may cause such differences include but are not limited to the risk that the recently completed business combination with Collier Creek Holdings and other acquisitions recently completed by the Company (collectively the ldquoBusiness Combinationsrdquo) disrupt plans and operations the ability to recognize the anticipated benefits of such Business Combinations which may be affected by among other things competition and the ability of the Company to grow and manage growth profitably and retain its key employees the outcome of any legal proceedings that may be instituted against the Company following the consummation of such Business Combinations changes in applicable law or regulations costs related to the Business Combinations the inability of the Company to maintain the listing of the Companyrsquos Class A Common Stock on the New York Stock Exchange the inability of the Company to develop and maintain effective internal controls the risk that the Companyrsquos gross profit margins may be adversely impacted by a variety of factors including variations in raw materials pricing retail customer requirements and mix sales velocities and required promotional support changes in consumersrsquo loyalty to the Companyrsquos brands due to factors beyond the Companyrsquos control changes in demand for the Companyrsquos products affected by changes in consumer preferences and tastes or if the Company is unable to innovate or market its products effectively costs associated with building brand loyalty and interest in the Companyrsquos products which may be affected by the Companyrsquos competitorsrsquo actions that result in the Companyrsquos products not suitably differentiated from the products of competitors fluctuations in results of operations of the Company from quarter to quarter because of changes in promotional activities the possibility that the Company may be adversely affected by other economic business or competitive factors and other risks and uncertainties set forth in the section entitled ldquoRisk Factorsrdquo and ldquoForward-Looking Statementsrdquo in the Companyrsquos Annual Report on Form 10-K filed with the US Securities and Exchange Commission (the ldquoCommissionrdquo) for the fiscal year ended January 3 2021 as amended and other reports filed by the Company with the Commission In addition forward-looking statements provide the Companyrsquos expectations plans or forecasts of future events and views as of the date of this communication Except as required by law the Company undertakes no obligation to update such statements to reflect events or circumstances arising after such date and cautions investors not to place undue reliance on any such forward-looking statements These forward-looking statements should not be relied upon as representing the Companyrsquos assessments as of any date subsequent to the date of this communication The Company cautions investors not to place undue reliance upon any forward-looking statements which speak only as of the date made The Company does not undertake or accept any obligation or undertaking to release publicly any updates or revisions to any forward-looking statements to reflect any change in its expectations or any change in events conditions or circumstances on which any such statement is based except as otherwise required by law
Non-GAAP Financial Measures
This presentation includes certain financial measures not presented in accordance with US generally accepted accounting principles (ldquoGAAPrdquo) including but not limited to Pro Forma Net Sales Adjusted Gross Profit Pro Forma Adjusted Gross Profit Adjusted SGampA EBITDA Adjusted EBITDA Further Adjusted EBITDA Normalized Further Adjusted EBITDA Adjusted Net Income and certain ratios and other metrics derived there from These non-GAAP financial measures do not represent financial performance in accordance with GAAP and may exclude items that are significant in understanding and assessing financial results Therefore these measures should not be considered in isolation or as an alternative to net income cash flows from operations or other measures of profitability liquidity or performance under GAAP You should be aware that the presentation of these measures may not be comparable to similarly-titled measures used by other companies Reconciliations of these non-GAAP measures to the most directly comparable GAAP measures are set forth in the appendix to this presentation We believe (i) these non-GAAP measures of financial results provide useful information to management and investors regarding certain financial and business trends relating to the financial condition and results of operations of the Company to date and (ii) that the use of these non-GAAP financial measures provides an additional tool for investors to use in evaluating ongoing operating results and trends in comparing financial measures with other similar companies many of which present similar non-GAAP financial measures to investors These non-GAAP financial measures are subject to inherent limitations as they reflect the exercise of judgments by management about which expense and income are excluded or included in determining these non-GAAP financial measures The non-GAAP financial measures are not recognized in accordance with GAAP and should not be viewed as an alternative to GAAP measures of performance
2
Todayrsquos Agenda
Value Creation StrategyII
Business Overview
Recent PerformanceIII
IV
I
3
Todayrsquos Presenters
Dylan Lissette
Chief Executive Officer
Cary Devore
Chief Financial Officer
CEO of Utz since 2012
Joined Utz in 1995 worked in a variety of capacities prior to becoming CEO
EVP amp CFO joined Utz in 2016
Former Managing Director at Metropoulos amp Co
25 years in privateequity investmentbanking and publicaccounting
Ajay Kataria
EVP Finance amp Accounting
Joined Utz in 2017
20 years of CPG experience in senior finance roles including nine years at PepsiCo
4
I Business Overview
49
17
11
5
15
3
Utz Overview
1) Based on MULO+C Total US IRI data for 52-weeks ended 12272020 Pro forma for acquisitions of Truco HK Anderson and Vitnerrsquos 2) 2020 Pro Forma Net Sales and Further Adj EBITDA reflects acquisitions of HK Anderson Truco and Vitnerrsquos on a 52-week basis Excludes Festida Foods acquisition Please see appendix for reconciliations
Business Overview
Leading manufacturer marketer and distributor of branded snacks in the US including potato chips tortilla chips pretzels cheese snacks pork skins pub party mixes veggie snacks and popcorn
Strong portfolio of brands including Utzreg ON THE BORDERreg Zapprsquosreg Golden Flakereg Boulder Canyonreg and Good Healthreg
100-year-old family managed company with deep heritage and authenticity
2 salty snack company in its Core geographies and 3 nationally(1)
Distributes products through the Companyrsquos direct store delivery (ldquoDSDrdquo) network direct to warehouse (ldquoDTWrdquo) and via distributors
ndash Direct to Store (DSD) 70000+ doors 1700+ routes
ndash Direct to Warehouse ~25000 doors ~525 retailer distribution centers
ndash Distributor ~18000 doors ~725 routes
Operates 15 manufacturing facilities including seven located in PA and one located in each of AL IL IN LA MA MI AZ and WA
Strong financial performance within growing recession-resistant salty snack category
Generated 2020 Pro Forma Net Sales of $116 billion and Further Adj EBITDA of $181 million(2)
Sales Breakdown(1)
By Product Type By Brand
Portfolio Overview
Power Brands Foundation Brands
Pork SkinsChipsCheese
bull Partner Brandsbull Private Label
Potato Chips
Tortillas
All Other
Pretzels
Cheese
PorkPopcorn
40
19
11
11
106
1Other
6
2011-2021 ndash Rapid Geographic and Brand Portfolio Expansion Driven by Strategic MampA
100-Year Old Family Company with Tremendous Heritage
TodayRich Heritage and Regional Expansion(1921ndash2011)
National Scale Multi-Branded Snack Platform Created
(2011ndash2021)
1940s-1960s ndash First Dedicated Manufacturing Plant (1947) and Expansion of Production Capabilities
1970s-1980s ndash Expansion into Other Salty Snack Sub-Categories Including Pretzels and Cheese
1920s-1930s ndash Iconic ldquoLittle Utz Girlrdquo Born
1920
2021
1990s-2010 ndash Geographic Expansion Throughout Mid-Atlantic and Northeast Expansion of
Direct to Warehouse Capability and DSD Transformation
Source Management estimates1) IRI MULO+C data for 52-weeks ended 12272020 Pro forma for the acquisitions of Truco HK Anderson and Vitnerrsquos
Today ndash3 Player in US Salty Snacks Universe(1)
ndash 55+ million Pounds of Snacks per Week
ndash Reaching 100000+ Retail Stores Across the Country
1921 ndash Founding by Bill and Salie Utz in Hanover PA
Aug 2020 Business Combination with Collier Creek Holdings ndash Go public
in 2011 (Craft Geographic Expansion)
in 2014 (BFY)
Snacks
in 2016 (Craft Geographic Expansion)
in 2017 (BFY Geographic Expansion)
in 2017 (C-Store Geographic Expansion)
in 2019 (Craft Geographic Expansion)
in 2020 (Tortilla Geographic Expansion)
in 2021 (Geographic Expansion)
in 2021 (Tortilla Geographic Expansion)
2011
7
Salty Snacks Is a Highly Attractive CPG Category
Supported by Strong Consumer Trends and Category Dynamics
Source Euromonitor International
Category leaders compete primarily with marketing and innovation versus price
Low penetration by Private Label at 5-6 and flat for the last decade
Provides exposure to faster growing distribution channels
2010 ndash 2020 US Retail Sales Growth(1)
95 of US population snacking at least once per day
Average American snacks 26x times per day
~50 of US eating occasions are snacks
~50 of US consumers replacing meals with snacks
51
32
41
28 28 25
19
44
28 24
(2)Salty Snacks Total
Packaged FampB
Sweet Biscuits
Snack Bars
Non-Alcoholic
Drinks
Confect Baked Goods
Ice Creamand
Frozen Desserts
AlcoholicDrinks
Beauty Personal
Care
HomeCare
(3)
Source Euromonitor IRI the Hartman Group and The Consumer Goods Forum1) Represents CAGR2) Defined as Euromonitor US Savory Snacks category with Savory Biscuits removed3) Excludes dairy products
8
Note Utz figures include all acquisitions1) IRI MULO+C Total US for the Salty Snacks category for the last 52 weeks ended December 27 2020 Excludes Salsa and Queso2) Pro forma for acquisitions of Truco HK Anderson and Vitnerrsquos
Total United States Salty Snack Dollar Sales(1)
Scale is Important
Increases scale and relevance with key retailers
Optimizes ability to capitalize on growth opportunities across channels sub-categories and geographies
Leverages fixed infrastructure which helps grow margins long term
Scale Growth Platform in Salty Snacks Category
(2)
($ in mm)
DSD
Other Branded(1400+)
$17506
$1377 $1350 $1233
$604 $536 $436
$293 $256 $230
~$2000
Pepsi Campbells Utz Kelloggs GrupoBimbo
GeneralMills
Hershey Hain Conagra Arca
$2735
9
$216 $222 $228$254 $266
$290
$359
$318
$398 $403
$707
$772
Track Record of Consistent Growth
2001 2002 2003 2004 2005 2006 2007 2008 2009 2010 2011 2012
1) Source Internal financials Figures for 2001 ndash 2020 represent Net Sales2) 2020 pro forma for the full year impact of Truco HK Anderson and Vitnerrsquos acquisitions and excludes Festida acquisition 2019 pro forma
for full year impact of Kennedy Endeavors and Kitchen Cooked acquisitions Periods prior to 2019 are actual3) Based on management estimates for growth excluding acquisitions
Net Sales ($ in millions)(1)
Recession
$656
Recession
2001 ndash 2020(2) CAGR
Total 9
Organic(3) 4
4) Represents standalone Utz growth over the comparable pro forma 2019 net sales including the impact of the Kennedy Endeavors and Kitchen Cooked acquisitions5) 2020 figure excludes additional ~$16mm contribution from 53rd week
COVID-19 Recession
Utz 2020AYoY Growth
+8(4)
$866
2013 2014 2015 2016 2017 2018 2019 2020
$1164
(2) (5)(2)
$618
$559$535
$513
$468
10
Strong Brand Portfolio with Focus on Power Brands
PorkSkins
Foundation Brands (13 of Retail Sales)(1)
Iconic Heritage
Power Brands (87 of Retail Sales)(1)
Craft Better For You
Regional
Licensed
Other
bull Partner Brands
bull Private Label
1) Source IRI MULO + C Total US for 52-weeks ended December 27 2020
ChipsCheese
11
Broad Distribution Across Channels and Customers
15+ Year Average Relationship with Top Customers
2020 Retail Sales by Channel(1) Illustrative Customers
1) Source IRI MULO-C data (52-week period ended 12272020) Includes dollardiscount Pro forma for impact of Truco and HK Anderson acquisitions2) IRI eCommerce includes direct to the consumer and ldquoclick and collectrdquo Instacart
Food Grocery
52
Mass19
C-Store14
Club8
Other7
E-commerce(2) (including retailer sites click amp collect) was 68 of FY20 retail sales growing 125 YoY
12
Distributor
Flexible Efficient DSD and Warehouse Distribution System
Direct to Warehouse Direct to Store (DSD)
~18000Doors
~725Routes
70000+Doors
~1700+ Total Routes
Each of Top 3Salty Snacking Companies Operate DSD Networks(1)
Note Includes impact of Truco acquisition1) Top 3 Salty Snacking companies determined by IRI MULO+C Total US Retail Sales for 52W ended 12272020
Utz Transition to IOs
of Routes 2016 Q1 2021
Company-Owned 67 20
Independent Operators (IO) 33 80
~25000 Doors
~525 Retailer Distribution Centers
Completed Transition to IOs Expected by Q2 2022
13
National Manufacturing Footprint with Broad Capabilities
400+ Million Lbs Annual Capacity(1)
Low 70s Capacity Utilization(1)
Strong Quality and Safety Record Opportunities to Optimize Footprint
15 Manufacturing Facilities
Packaging
MultipacksBarrelsBags
TraysSeasonals
Olive OilAvocado Oil Gluten-Free
Organic
Ingredients
ContinuousChips
KettleChips
Extruded
Popped Baked
Processes
Sheeted Veggie Pork
(4)
1) Based on management estimates of available capacity in 2020 over a seven-day work schedule excluding weekly clean-up time Excludes Festida acquisition
Festida Acquisition
Largest Manufacturer of ON THE BORDERreg Tortilla Chips Located in Grand Rapids MI Provides Increased Access to Midwest
Festida Facility (Acquisition closed on June 7 2021)
14
2021 60x 51x 71
2021 87x 59x 44
2020 93x 84x 25
2020 57x 49x 24
2019 112x 72x 62
2017 NM 102x 138
2016 158x 76x 96
2013 132x 57x 87
2011 80x 56x 70
All Acquisitions(3) 76x 65
Track Record of Accretive and Well-Integrated Acquisitions
Year Pre-SynergyAdj EBITDA Multiple
Cost Synergy of Revenue
Snacks
Target Post-SynergyAdj EBITDA Multiple
Source Management estimates Table presented above highlights select transactions and excludes 6 additional tuck-in acquisitions details 1) Reflects NPV of tax attributes and run-rate cost synergies2) Estimated run rate cost synergies as percentage of third party 2020 net sales3) All acquisition statistics based on weighted average and includes 6 additional tuck-in acquisitions completed since 20114) Represents management estimates as synergies are not yet fully realized
(1)
(1)
(1)
(1) (2)(4)
(4)
(4)
(4)
(Closed on June 7 2021)
(1) (4)
15
Attractive Value Creation Potential
Plus Additional Upside From Strategic Acquisitions
Long-Term Organic Growth Model
Adj EBITDA 6 ndash 8 Productivity Margin Enhancements
Adj EPS 8 ndash 10 Deleveraging
~10 ndash 12
(1) Based on management estimates and long-term historical category trend
Net Sales In-Line with Category3 ndash 4
Power Brands Focus
Exp Dividend Yield ~2 ~40 Target Payout Ratio
(1)
Total Shareholder Return
16
II Value Creation Strategy
Goal Be Fastest Growing Pure-Play Branded Snack Platform of Scale in the US
1 Drive Productivity2 Optimize Revenue and
Trade3 Improve Margin Mix
1 Focus on Branded Snacking in the US
2 Deliver Strong Synergies
1 Accelerate Power Brands Through Enhanced Marketing and Innovation2 Expand Distribution in Underpenetrated Channels and Customers3 Continue National Geographic Expansion4 Increase Presence in Key Salty Snack Sub-Categories and Adjacencies
Reinvest to Accelerate Revenue Growth
Reduce Costs and Enhance Margins
Continue Strategic
Acquisitions
Value Creation Strategies
1
2
12
3
1234
18
Reduce Costs and Enhance Margins
Manufacturing Efficiencies Line automation Equipment upgradesexpansion Wastescrap reduction
Network Optimization Distribution optimization Palletcase efficiency Order management automation
Product Design Bagcase pack efficiencies Packaging material utilization Multiple supplier qualifications
Sourcing Flexible formulas Purchasing inputs Indirect sourcing standardization2020 Actual 2023E2021E
1
2
Productivity Targets (1)
Productivity Targets by Category
Key Productivity Drivers
(1) Excluding FY 2020 and FY 2021 acquisitions
3 ndash 4
Manufacturing Efficiencies
40
Product Design30
Network Optimization
20Sourcing10
Price pack architecture initiatives
New trade management software
Grow higher-margin Power Brands increasing of portfolio
De-emphasize lower-margin private label and Partner Brands
Leverage insights from ERP rollout
Key Revenue Trade amp Margin Drivers(Annual Savings as of COGS)
(Annual Savings as of COGS)
19
49
67
2015 2020
2020 ~1
40
Utz Peer Average
$517 $650
2015 2020
18
53
2015 2020
$25
$66
2015 2020
10 21
2015 2020
$41
$69
2015 2020
$146
$234
2015 2020
5055
2015 2020
Accelerate Power Brands Through Enhanced Marketing and Innovation
Source Company filings Management estimates IRI MULO-C data for 2015 and 2020 calendar years1) Represents last reported fiscal year advertising expense as a of Net Sales per most recent Form 10-K filed by our peers through May 21 2021 Peers include Campbellrsquos Flowers Foods General Mills Hain Hershey Hostess JampJ Snack Foods Kellogg Mondelez and PepsiCo
Increase Marketing Spend (as a percentage of net sales) Strong Momentum in Key Power Brands
Add ldquopullrdquo marketing to successful trade ldquopushrdquo strategies
Reallocate existing spend to higher ROI marketing and strengthen sales execution with improved analytics and technology
Focus on elevating insights expanding capabilities and creating consumer pull of our Power Brands and in particular Utzreg ON THE BORDERreg and Zapprsquosreg
Targeting growth in Digital and e-Commerce spend in 2021 of approximately 60 versus 2020
Launched updated Utz website (utzsnackscom) and DTC e-Commerce platform in February 2021
LT Target ~3-4
Peer Average(1)
Retail Sales ($mm) ACV Distribution ()
Pork Skins
Improve Brand Marketing Execution
20
Flavored Pretzels are 35 of Sub-Category and Growing over 30 and Utz is Meaningfully Underweight in Flavored (lt10 of our mix)(1)
(1) Source IRI Total US MULO + C
Authentic Mexican Style and Flavor Portfolio Expansion
Strategic Variety Pack Partnerships
100 Year Celebration and Seasonal Offering Iconic Flavors Extended into New Textures
Accelerate Power Brands Through Enhanced Marketing and Innovation
21
679
41 39 34 34
661
50 42 31 25
570 78
52 42 33
576 75
55 37
17
Expand Distribution in Underpenetrated Channels and Customers
Source IRI MULO-C data (52-week period ended 12272020) for salty snack category by channel Pro forma for acquisitions of Truco HK Anderson and Vitnerrsquos 1) Based on IRI data Pro Forma for acquisitions of HK Anderson and Truco E-commerce includes retailer sites click amp collect BOPIS etc2) 55 target share represents Utz share in Food channel per IRI MULO-C data (52-week period ended 12272020
55(2) Share in C-Store and Mass Represents~$200M of Incremental Retail Sales
C-Store and Mass Strategies
Expand C-Store presence through strengthened retailer master distributor and redistributor relationships and drive for customer growth in the West
Drive Mass distribution by leveraging expanding national scale and brand portfolio
Continued geographic expansion organically and through acquisitions
Share by Channel
55
55
Food
C-Store
Mass
Club
Rapidly Growing E-Commerce(1)
of RetailSales 35 68 71
YoY Growth -- 125 43
2019 Q1 lsquo212020
Peer 1 Peer 2 Peer 3 Peer 4
Peer 1 Peer 2 Peer 3 Peer 4
Peer 1 Peer 2 Peer 3 Peer 4
Peer 1 Peer 2 Peer 3 Peer 4
22
Focus on Large Population Markets
ndashKey Expansion Markets South Midwest Colorado
ndashKey Emerging Markets Florida Texas California West
Drive Power Brands
Expand DSD Route Network
Purchase 3rd party Master Distributors
Make Tuck-in Acquisitions
Continue National Geographic ExpansionGeographic Priorities(1) Strategies
Significant Opportunity for Growth in Expansion and Emerging Geographies(1)
Each Point of Share Gain in ExpansionEmerging Geographies Represents $200M of Incremental Retail Sales(3)
93 Share Nationally Represents ~$12B of Incremental Retail Sales(3)
Utz Definition
of Market Retail Sales
2020 Utz RetailSales
RankUtz $
Market Share
Core ~27 ~50 2 93
Expansion ~23 ~23 4 45
Emerging ~50 ~27 5 25
National 100 100 4 48
1) Geographic areas of Core Expansion and Emerging based on Utz internal definitions for retail sales in various states 2) Pro forma for acquisitions of HK Anderson and Truco Sourced from IRI MULO-C data (52-week period ended 12272020) Geographies refer to core comps in states outlined above 3) Based on 2020 Retail Sales per IRI MULO+C Salty Snack data
CoreExpansionEmerging
FL
NM
DEMD
TX
OK
KS
NE
SD
NDMT
WY
COUT
ID
AZ
NV
WA
CA
OR
KY
ME
NY
PA
VTNH MA
RICT
WVINIL
NCTN
SC
ALMS
AR
LA
MO
IA
MNWI
NJ
GA
DCVA
OH
MI
HI
AK
23
Continue Strategic Acquisitions
Scalable MampA Platform
Significant Synergy Opportunities Driven by Highly Leverageable Manufacturing and Distribution System
Robust Pipeline amp Favorable CompetitiveDynamics
Utz is Logical Consolidator in Category with Numerous Opportunities
Smaller Tuck-ins
Transformative RMT Vehicle
Proven Track Record
Acquisition-Savvy Management Team and Experienced Board
Near-Term Acquisition Criteria
1 Focus on Branded Snacking in the US with Concentration on Salty Snacks
ndash Facilitate Geographic Expansion
ndash Increase Presence in Sub-Categories
ndash Enhance Growth
2 Deliver Strong Synergies
Financial Priorities
Accretive and Multiple Enhancing
Consistent with Target Leverage Policy
1
2
24
III Recent Performance
Lapping Significant Market Share Gains in Early 2020
26
23
1013
10 10 98 9 8 8 6
31
2527
2018 17
1512
10 108
55000000
56000000
57000000
58000000
59000000
60000000
61000000
62000000
0
5
10
15
20
25
30
35
4WE
02-2
3-20
4WE
03-2
2-20
4WE
04-1
9-20
4WE
05-1
7-20
4WE
06-1
4-20
4WE
07-1
2-20
4WE
08-0
9-20
4WE
09-0
6-20
4WE
10-0
4-20
4WE
11-0
1-20
4WE
11-2
9-20
4WE
12-2
7-20
Total Salty Snacks
Source IRI Total US MULO + C 4-week ending 22320 through 122720 on a pro forma basis
4-Week Period Retail Sales YoY Change and Buyer Trends
Trailing 52-week Utz Buyers
Change vs YAG
611M
577M
During the early stages of the COVID-19 pandemic Utz significantly outperformed the category and we continued to gain buyers throughout the year
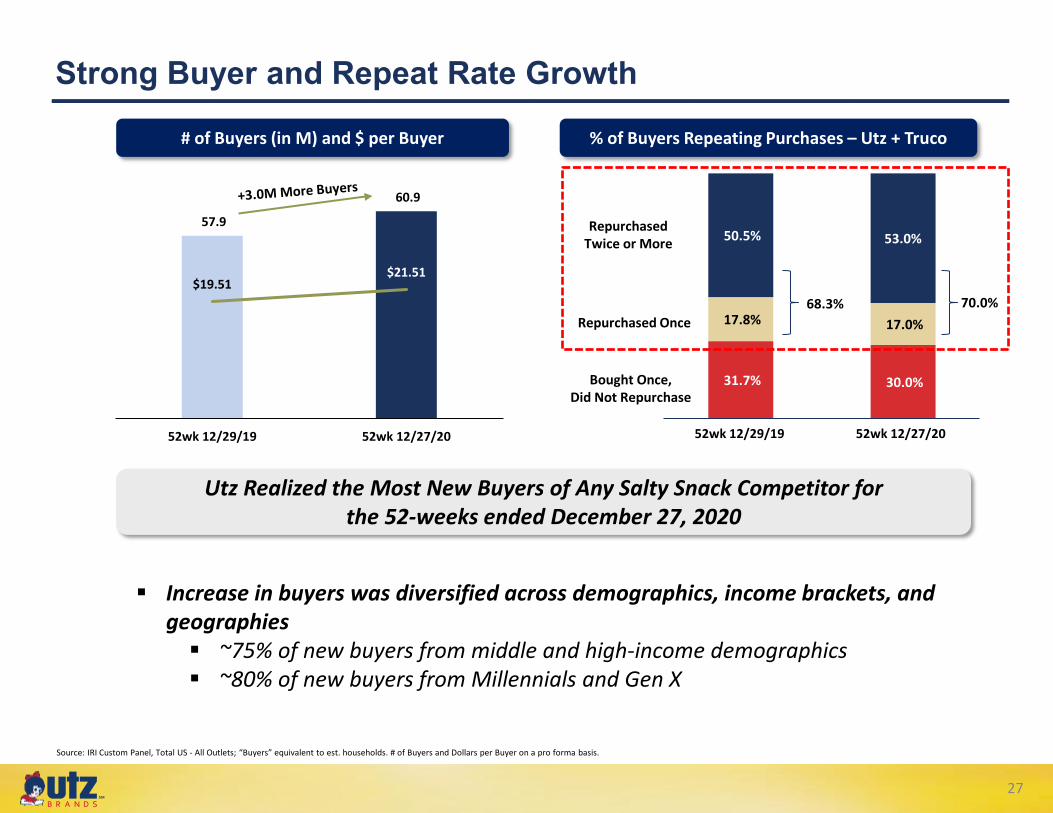
505 530
178 170
317 300
579
609
$1951 $2151
52wk 122919 52wk 122720
Source IRI Custom Panel Total US - All Outlets ldquoBuyersrdquo equivalent to est households of Buyers and Dollars per Buyer on a pro forma basis
52wk 122919 52wk 122720
Repurchased Twice or More
Repurchased Once
Bought OnceDid Not Repurchase
of Buyers (in M) and $ per Buyer of Buyers Repeating Purchases ndash Utz + Truco
Increase in buyers was diversified across demographics income brackets and geographies ~75 of new buyers from middle and high-income demographics ~80 of new buyers from Millennials and Gen X
Utz Realized the Most New Buyers of Any Salty Snack Competitor for the 52-weeks ended December 27 2020
Strong Buyer and Repeat Rate Growth
683 700
27
Strong 2-Year Growth Rates to Begin 2021
Retail Sales 2-Year CAGR Rolling 12-Week Trend
Source IRI Total US MULO + C 4-week trend on a pro forma basis
As we begin to lap COVID-19 pantry stocking we are driving strong 2-year growth rates led by our Power Brands partially offset by our planned decline in Foundation Brands
54
59 61 6055
55 57 60
71 71 7478
-36 -35 -39 -43
-5
0
5
10
12-WeeksEnding 1-24-21
12-WeeksEnding 2-21-21
12-WeeksEnding 3-21-21
12-WeeksEnding 4-18-21
Utz Foundation Brands(13 of sales)
Utz Power Brands(87 of sales)
Total Salty Snacks
Utz Brands
28
(1) Source IRI Custom Panel Total US MULO + C 13-weeks ended 442021 YoY Growth compared to the comparable period in the prior year on a pro forma basis(2) IRI does not include Partner Brands and Private Label retail sales
Pork Skins ChipsCheese
Other(2)
bull Partner Brands
bull Private Label
Power Brands Increased to Nearly 87 of Retail Sales
Power Brands Retail Sales Change(1)
(13-Weeks Ended 4421)Foundation Brands Retail Sales Change(1)(2)
(13-Weeks Ended 4421)
Power Brands Foundation Brands
2-Year CAGR
Total Salty Snacks Utz Power Brands
2-Year CAGR
Total Salty Snacks Utz Foundation Brands
Our long-term value creation strategies are working as we continue to prioritize our investments and reduce emphasis on Foundation Brands
60
76 60
(43)
29
30
Significant Two-Year Share Gains in our Major Sub-Categories
Sub-Category Retail Sales 2-Year CAGR (13-Weeks Ended 4421)
Tortilla Chips
Total Salty Snacks
76
Pork Rinds
Cheese Snacks
Potato Chips
27
Pretzels
05
40
6456
77
6555
80 76
Salsa
154
Queso
95
71
221
Total Sub-Category Power Brands
Potato chips and tortilla chips comprise nearly 60 of our retail sales and significantly outpaced the category over the last two years
5960
Utz Rank(1)
Utz Retail Sales(1)
3
$13B
4
$541M
3
$259M
2
$152M
3
$134M
3
$80M
4
$53M
3
$16M
Source IRI Total US MULO + C on a pro forma basis (1) Rank and Retail Sales are based on 52-week period ended 12272020
Expansion amp Emerging Geographic Momentum Continues
Geographic Channel Retail Sales 2-Year CAGR (13-Weeks Ended 4421)
ExpansionTotal US Core Emerging
60 59
97
49
76
33
123
45
68
91
65
83
Core performance relative to market driven by Good Healthreg and Foundation Brands that are more weighted towards the Core
Total Sub-Category Power Brands
Utz Retail Sales Mix(1)
Utz Market Share and Rank(1)
~50 ~23 ~27
Source IRI Total US MULO + C on a pro forma basis (1) Rank and Retail Sales Mix are based on 52-week period ended 12272020
93 2 45 4 25 5
31
Driving 2-Year Share Gains in Grocery Club and C-Store
Retail Channel Retail Sales 2-Year CAGR (13-Weeks Ended 4421)
C-Store
112
MULO + C MassGrocery
38
60
Club
59
7667
73
99 97
133
37 37
130
01
15
Total Sub-Category Power Brands
Mass performance driven by a lap faced by ON THE BORDERreg and we expect trends will improve as we move throughout the year
Utz Rank(1)
Utz Retail Sales(1)
3
$13B
3
$697M
3
$260M
2
$113M
5
$181M
Source IRI Total US MULO + C on a pro forma basis (1) Rank and Retail Sales are based on 52-week period ended 12272020
32
Q1 2021 Highlights
Source Company filings Company information Note Pro Forma Net Sales Adjusted Gross Profit Adjusted SGampA Adjusted Gross Margin Adjusted EBITDA Adjusted EBITDA Margin Adjusted net Income and Adjusted EPS are non-GAAP financial measures See appendix for reconciliation of non-GAAP financial measures to most directly comparable GAAP measures
1Qrsquo20 Results
1Qrsquo21 Results
In $millions except per share amounts
Net Sales
Adj SGampA
of net sales
2280
570
250
Adj Gross Profit
of net sales
853
374
YoY Change
Adj EBITDA
of net sales
Adj Net Income
Pro Forma Net Sales
292
128
115
2692
672
250
1045
388
379
141
190
180
181
--
225
140bps
(22)
298
130bps
652
Adj EPS nm $013 nm
2752 2692
Q1 net sales growth of 18 and Adjusted EBITDA growth of 30
Reflects positive contribution from acquisitions partially offset by transitory events (lapping COVID-19 impact in 2020 February 2021 snowstorms)
Pro Forma Net Sales 2-year CAGR of 43
Utz IRI retail sales two-year CAGR of 59 shows continued strength across our platform and new buyers and repeat rates remain consistent
Continued to further penetrate key channels and increase distribution in Emerging and Expansion geographies
Completed the ERP go-live and remain on target to increase productivity from 1 to 2 of COGS in 2021
MampA pipeline remains robust as we continue to enhance our growth and margin profile with value enhancing acquisitions targeted at geographic sub-category and channel share growth as well as margin-enhancing opportunities
Closed acquisition of Vitnerrsquos on February 8 2021
Announced acquisition of Festida Foods and closed on June 7 2021
33
Managing Through an Inflationary Environment
Cost Driver FY21 Considerations Actions We are Taking
Commodity Inflation(COGS)
Continue to expect commodity inflation of approximately 4 vs last year
Primarily driven by cooking oils and packaging
Covered on 80 of positions
Improve net price realization through price pack architecture enhancements
Deliver on our plan to increase productivity from 1 to 2 of COGS
Initiatives are back-half weighted with 60 of pricing actions and 80 of productivity improvements planned for the second half of fiscal 2021
Transportation (SGampA)
Higher transportation costs driven by increased spot market rates contract delivery costs and driver scarcity
Diesel prices per gallon up ~40 vs LY and supply truck availability index near 5-year lows
Delivery costs for Utz are running higher than originally planned for fiscal 2021
Strategic carrier management Implementing transportation systems
management improvement and load efficiency projects
Heightened customer collaboration to drive efficiencies across product orders
Our price pack architecture and productivity initiatives which have long-term benefits are actively being deployed and are weighted towards the second half of 2021
34
Capital Focused on Driving Growth
1 Business Growth(Including MampA)
2 Debt Reduction
3 Dividend Increase
4 Share Buyback
bull Target Net Leverage of 3 ndash 4x
bull Higher Net Debt Adj EBITDA Possible for Strategic Acquisitions Returning to Target Range within 1 ndash 2 Years
bull LTM Q1 Net Debt Normalized Further Adj EBITDA of 40x
Cash Flow Priorities Target Leverage
Source Company information
35
Delivering on Foundational Strategies With Further Opportunity Ahead
Value Creation Strategy
Reduce Costs and Enhance Margins
(1) Current figure based on 13-weeks ended 04042021 2019 based on 13-weeks ended 03312019 and does not include subsequent acquisitions
Margin profile strengthened
Productivity initiatives on-track to double in 2021
Drove PampL-wide value creation
Completed new ERP system implementation
bull Targeting productivity of 3-4 of COGS by 2023 in-line with initial expectations
bull IO conversion in 2022 to further streamline business and improve margins
bull Leverage new ERP for superior decision-making
bull Drive price pack architecture strategies
Progress to Date Go-Forward Strategy
Reinvest to Accelerate
Revenue Growth
Significant incremental investment in digital eComm to retain new buyers and drive awareness
Power Brands now represent 87 of retail sales vs81 in 2019(1)
Gained share in all major channels in FY 2020
Outperformed Salty Snacks category in Expansion and Emerging geographies in FY 2020
bull Invest behind pull marketing strategies
bull Drive geographic expansion of Power Brands(Utz Zapprsquos and ON THE BORDER in particular)
bull Focus innovation on highest-impact products and brands
bull Leverage increasing national scale to drive Mass and C-store distribution gains
bull Fill gaps in product portfolio
Continue Strategic Acquisitions
Closed acquisitions of HK Anderson Truco Enterprises (ON THE BORDER) Vitnerrsquos and Festida Foods since going public in August 2020
On track to deliver targeted synergies and enhanced scale and margin
bull Acquisition pipeline remains strong
bull Focused on accretive opportunities that bolster Power Brands improve margins and expand geographies channels and subcategories
36
Questions
Appendix
Reconciliation of Non-GAAP Financial Measures to Reported Financial Measures
39
Reconciliation of Non-GAAP Financial Measures to Reported Financial Measures
(1) Income Tax Rate Adjustment calculated as (Loss) Income before taxes plus (i) Acquisition Step-Up Depreciation and Amortization and (ii) Other Non-Cash andor Non-Recurring Adjustments multiplied by an effective cash tax rate minus the actual tax provision recorded in the Consolidated Statement of Operations and Comprehensive Income (Loss) The effective cash tax rate includes corporate income tax payments plus non-resident withholding and tax distributions which are considered equivalent to tax
40
Reconciliation of Non-GAAP Financial Measures to Reported Financial Measures
See footnotes in Utzrsquos Q1 earnings press release dated May 13 2021
41
Reconciliation of Non-GAAP Financial Measures to Reported Financial Measures
Net Sales and Pro Forma Net Sales 14-Wks Ended 1-Wk Ended
13-Wks Ended
13-Wks Ended
53-Wks Ended 1-Wk Ended
52-Wks Ended
52-Wks Ended
(dollars in millions) 1321 1321 122720 122919 1321 1321 122720 122919Net Sales $ 2463 $ 159 $ 2304 $ 2018 $ 9643 $ 159 $ 9484 $ 7682 Conagra DSD Snacks (Kennedy) Pre-Acquisition Net Sales - 82 - 888Kitchen Cooked Pre-Acquisition Net Sales - 22 - 85HKA Pre-Acquisition Net Sales 11 31 80 109Truco Pre-Acquisition Net Sales 371 362 1878 1462Pro Forma Net Sales $ 2686 $ 2515 $ 11442 $ 10226
Gross Profit Adjusted Gross Profit and PF Adj Gross Profit14-Wks Ended 1-Wk Ended 13-Wks Ended 13-Wks Ended 53-Wks Ended 1-Wk Ended 52-Wks Ended 52-Wks Ended
(dollars in millions) 1321 1321 122720 122919 1321 1321 122720 122919Gross Profit $ 816 $ 49 $ 767 $ 657 $ 3327 $ 49 $ 3278 $ 2538 Depreciation and Amortization 75 - 75 53 313 - 313 168 Non-Cash non-recurring adjustments 14 - 14 - 14 - 14 - Adjusted Gross Profit $ 905 $ 49 856 710 $ 3654 $ 49 3605 2706 Adjusted Gross Margin as a of Net Sales 367 308 372 352 379 308 380 352Depreciation and Amortization - COGS (75) (53) (313) (168)Conagra DSD Snacks (Kennedy) Pre-Acquisition Gross Profit - 23 - 280 Kitchen Cooked Pre-Acquisition Gross Profit - 13 - 52 HKA Pre-Acquisition Gross Profit 01 05 11 16 Truco Pre-Acquisition Gross Profit 145 150 769 588 Pro Forma Gross Profit 927 848 4072 3474
Depreciation and Amortization 75 53 313 168 Conagra DSD Snacks (Kennedy) Pre-Acquisition DampA - 05 - 20 HKA Pre-Acquisition DampA - - - - Truco Pre-Acquisition DampA - - - - Depreciation and Amortization - Total 75 58 313 188 Pro Forma Adjusted Gross Profit $ 1002 $ 906 $ 4385 $ 3662 Pro Forma Adjusted Gross Margin as a of Pro Forma Net Sales 373 360 383 358
42

DisclaimerForward-Looking Statements
Certain statements made herein are not historical facts but are ldquoforward-looking statementsrdquo within the meaning of the ldquosafe harborrdquo provisions of the Private Securities Litigation Reform Act of 1995 as amended The forward-looking statements generally are accompanied by or include without limitation statements such as ldquowillrdquo ldquoexpectrdquo ldquointendsrdquo ldquogoalrdquo or other similar words phrases or expressions These forward-looking statements include the expected effects from the COVID-19 pandemic future plans for the Company the estimated or anticipated future results and benefits of the Companyrsquos future plans and operations future capital structure future opportunities for the Company and other statements that are not historical facts These statements are based on the current expectations of the Companyrsquos management and are not predictions of actual performance These statements are subject to a number of risks and uncertainties and the Companyrsquos business and actual results may differ materially Factors that may cause such differences include but are not limited to the risk that the recently completed business combination with Collier Creek Holdings and other acquisitions recently completed by the Company (collectively the ldquoBusiness Combinationsrdquo) disrupt plans and operations the ability to recognize the anticipated benefits of such Business Combinations which may be affected by among other things competition and the ability of the Company to grow and manage growth profitably and retain its key employees the outcome of any legal proceedings that may be instituted against the Company following the consummation of such Business Combinations changes in applicable law or regulations costs related to the Business Combinations the inability of the Company to maintain the listing of the Companyrsquos Class A Common Stock on the New York Stock Exchange the inability of the Company to develop and maintain effective internal controls the risk that the Companyrsquos gross profit margins may be adversely impacted by a variety of factors including variations in raw materials pricing retail customer requirements and mix sales velocities and required promotional support changes in consumersrsquo loyalty to the Companyrsquos brands due to factors beyond the Companyrsquos control changes in demand for the Companyrsquos products affected by changes in consumer preferences and tastes or if the Company is unable to innovate or market its products effectively costs associated with building brand loyalty and interest in the Companyrsquos products which may be affected by the Companyrsquos competitorsrsquo actions that result in the Companyrsquos products not suitably differentiated from the products of competitors fluctuations in results of operations of the Company from quarter to quarter because of changes in promotional activities the possibility that the Company may be adversely affected by other economic business or competitive factors and other risks and uncertainties set forth in the section entitled ldquoRisk Factorsrdquo and ldquoForward-Looking Statementsrdquo in the Companyrsquos Annual Report on Form 10-K filed with the US Securities and Exchange Commission (the ldquoCommissionrdquo) for the fiscal year ended January 3 2021 as amended and other reports filed by the Company with the Commission In addition forward-looking statements provide the Companyrsquos expectations plans or forecasts of future events and views as of the date of this communication Except as required by law the Company undertakes no obligation to update such statements to reflect events or circumstances arising after such date and cautions investors not to place undue reliance on any such forward-looking statements These forward-looking statements should not be relied upon as representing the Companyrsquos assessments as of any date subsequent to the date of this communication The Company cautions investors not to place undue reliance upon any forward-looking statements which speak only as of the date made The Company does not undertake or accept any obligation or undertaking to release publicly any updates or revisions to any forward-looking statements to reflect any change in its expectations or any change in events conditions or circumstances on which any such statement is based except as otherwise required by law
Non-GAAP Financial Measures
This presentation includes certain financial measures not presented in accordance with US generally accepted accounting principles (ldquoGAAPrdquo) including but not limited to Pro Forma Net Sales Adjusted Gross Profit Pro Forma Adjusted Gross Profit Adjusted SGampA EBITDA Adjusted EBITDA Further Adjusted EBITDA Normalized Further Adjusted EBITDA Adjusted Net Income and certain ratios and other metrics derived there from These non-GAAP financial measures do not represent financial performance in accordance with GAAP and may exclude items that are significant in understanding and assessing financial results Therefore these measures should not be considered in isolation or as an alternative to net income cash flows from operations or other measures of profitability liquidity or performance under GAAP You should be aware that the presentation of these measures may not be comparable to similarly-titled measures used by other companies Reconciliations of these non-GAAP measures to the most directly comparable GAAP measures are set forth in the appendix to this presentation We believe (i) these non-GAAP measures of financial results provide useful information to management and investors regarding certain financial and business trends relating to the financial condition and results of operations of the Company to date and (ii) that the use of these non-GAAP financial measures provides an additional tool for investors to use in evaluating ongoing operating results and trends in comparing financial measures with other similar companies many of which present similar non-GAAP financial measures to investors These non-GAAP financial measures are subject to inherent limitations as they reflect the exercise of judgments by management about which expense and income are excluded or included in determining these non-GAAP financial measures The non-GAAP financial measures are not recognized in accordance with GAAP and should not be viewed as an alternative to GAAP measures of performance
2
Todayrsquos Agenda
Value Creation StrategyII
Business Overview
Recent PerformanceIII
IV
I
3
Todayrsquos Presenters
Dylan Lissette
Chief Executive Officer
Cary Devore
Chief Financial Officer
CEO of Utz since 2012
Joined Utz in 1995 worked in a variety of capacities prior to becoming CEO
EVP amp CFO joined Utz in 2016
Former Managing Director at Metropoulos amp Co
25 years in privateequity investmentbanking and publicaccounting
Ajay Kataria
EVP Finance amp Accounting
Joined Utz in 2017
20 years of CPG experience in senior finance roles including nine years at PepsiCo
4
I Business Overview
49
17
11
5
15
3
Utz Overview
1) Based on MULO+C Total US IRI data for 52-weeks ended 12272020 Pro forma for acquisitions of Truco HK Anderson and Vitnerrsquos 2) 2020 Pro Forma Net Sales and Further Adj EBITDA reflects acquisitions of HK Anderson Truco and Vitnerrsquos on a 52-week basis Excludes Festida Foods acquisition Please see appendix for reconciliations
Business Overview
Leading manufacturer marketer and distributor of branded snacks in the US including potato chips tortilla chips pretzels cheese snacks pork skins pub party mixes veggie snacks and popcorn
Strong portfolio of brands including Utzreg ON THE BORDERreg Zapprsquosreg Golden Flakereg Boulder Canyonreg and Good Healthreg
100-year-old family managed company with deep heritage and authenticity
2 salty snack company in its Core geographies and 3 nationally(1)
Distributes products through the Companyrsquos direct store delivery (ldquoDSDrdquo) network direct to warehouse (ldquoDTWrdquo) and via distributors
ndash Direct to Store (DSD) 70000+ doors 1700+ routes
ndash Direct to Warehouse ~25000 doors ~525 retailer distribution centers
ndash Distributor ~18000 doors ~725 routes
Operates 15 manufacturing facilities including seven located in PA and one located in each of AL IL IN LA MA MI AZ and WA
Strong financial performance within growing recession-resistant salty snack category
Generated 2020 Pro Forma Net Sales of $116 billion and Further Adj EBITDA of $181 million(2)
Sales Breakdown(1)
By Product Type By Brand
Portfolio Overview
Power Brands Foundation Brands
Pork SkinsChipsCheese
bull Partner Brandsbull Private Label
Potato Chips
Tortillas
All Other
Pretzels
Cheese
PorkPopcorn
40
19
11
11
106
1Other
6
2011-2021 ndash Rapid Geographic and Brand Portfolio Expansion Driven by Strategic MampA
100-Year Old Family Company with Tremendous Heritage
TodayRich Heritage and Regional Expansion(1921ndash2011)
National Scale Multi-Branded Snack Platform Created
(2011ndash2021)
1940s-1960s ndash First Dedicated Manufacturing Plant (1947) and Expansion of Production Capabilities
1970s-1980s ndash Expansion into Other Salty Snack Sub-Categories Including Pretzels and Cheese
1920s-1930s ndash Iconic ldquoLittle Utz Girlrdquo Born
1920
2021
1990s-2010 ndash Geographic Expansion Throughout Mid-Atlantic and Northeast Expansion of
Direct to Warehouse Capability and DSD Transformation
Source Management estimates1) IRI MULO+C data for 52-weeks ended 12272020 Pro forma for the acquisitions of Truco HK Anderson and Vitnerrsquos
Today ndash3 Player in US Salty Snacks Universe(1)
ndash 55+ million Pounds of Snacks per Week
ndash Reaching 100000+ Retail Stores Across the Country
1921 ndash Founding by Bill and Salie Utz in Hanover PA
Aug 2020 Business Combination with Collier Creek Holdings ndash Go public
in 2011 (Craft Geographic Expansion)
in 2014 (BFY)
Snacks
in 2016 (Craft Geographic Expansion)
in 2017 (BFY Geographic Expansion)
in 2017 (C-Store Geographic Expansion)
in 2019 (Craft Geographic Expansion)
in 2020 (Tortilla Geographic Expansion)
in 2021 (Geographic Expansion)
in 2021 (Tortilla Geographic Expansion)
2011
7
Salty Snacks Is a Highly Attractive CPG Category
Supported by Strong Consumer Trends and Category Dynamics
Source Euromonitor International
Category leaders compete primarily with marketing and innovation versus price
Low penetration by Private Label at 5-6 and flat for the last decade
Provides exposure to faster growing distribution channels
2010 ndash 2020 US Retail Sales Growth(1)
95 of US population snacking at least once per day
Average American snacks 26x times per day
~50 of US eating occasions are snacks
~50 of US consumers replacing meals with snacks
51
32
41
28 28 25
19
44
28 24
(2)Salty Snacks Total
Packaged FampB
Sweet Biscuits
Snack Bars
Non-Alcoholic
Drinks
Confect Baked Goods
Ice Creamand
Frozen Desserts
AlcoholicDrinks
Beauty Personal
Care
HomeCare
(3)
Source Euromonitor IRI the Hartman Group and The Consumer Goods Forum1) Represents CAGR2) Defined as Euromonitor US Savory Snacks category with Savory Biscuits removed3) Excludes dairy products
8
Note Utz figures include all acquisitions1) IRI MULO+C Total US for the Salty Snacks category for the last 52 weeks ended December 27 2020 Excludes Salsa and Queso2) Pro forma for acquisitions of Truco HK Anderson and Vitnerrsquos
Total United States Salty Snack Dollar Sales(1)
Scale is Important
Increases scale and relevance with key retailers
Optimizes ability to capitalize on growth opportunities across channels sub-categories and geographies
Leverages fixed infrastructure which helps grow margins long term
Scale Growth Platform in Salty Snacks Category
(2)
($ in mm)
DSD
Other Branded(1400+)
$17506
$1377 $1350 $1233
$604 $536 $436
$293 $256 $230
~$2000
Pepsi Campbells Utz Kelloggs GrupoBimbo
GeneralMills
Hershey Hain Conagra Arca
$2735
9
$216 $222 $228$254 $266
$290
$359
$318
$398 $403
$707
$772
Track Record of Consistent Growth
2001 2002 2003 2004 2005 2006 2007 2008 2009 2010 2011 2012
1) Source Internal financials Figures for 2001 ndash 2020 represent Net Sales2) 2020 pro forma for the full year impact of Truco HK Anderson and Vitnerrsquos acquisitions and excludes Festida acquisition 2019 pro forma
for full year impact of Kennedy Endeavors and Kitchen Cooked acquisitions Periods prior to 2019 are actual3) Based on management estimates for growth excluding acquisitions
Net Sales ($ in millions)(1)
Recession
$656
Recession
2001 ndash 2020(2) CAGR
Total 9
Organic(3) 4
4) Represents standalone Utz growth over the comparable pro forma 2019 net sales including the impact of the Kennedy Endeavors and Kitchen Cooked acquisitions5) 2020 figure excludes additional ~$16mm contribution from 53rd week
COVID-19 Recession
Utz 2020AYoY Growth
+8(4)
$866
2013 2014 2015 2016 2017 2018 2019 2020
$1164
(2) (5)(2)
$618
$559$535
$513
$468
10
Strong Brand Portfolio with Focus on Power Brands
PorkSkins
Foundation Brands (13 of Retail Sales)(1)
Iconic Heritage
Power Brands (87 of Retail Sales)(1)
Craft Better For You
Regional
Licensed
Other
bull Partner Brands
bull Private Label
1) Source IRI MULO + C Total US for 52-weeks ended December 27 2020
ChipsCheese
11
Broad Distribution Across Channels and Customers
15+ Year Average Relationship with Top Customers
2020 Retail Sales by Channel(1) Illustrative Customers
1) Source IRI MULO-C data (52-week period ended 12272020) Includes dollardiscount Pro forma for impact of Truco and HK Anderson acquisitions2) IRI eCommerce includes direct to the consumer and ldquoclick and collectrdquo Instacart
Food Grocery
52
Mass19
C-Store14
Club8
Other7
E-commerce(2) (including retailer sites click amp collect) was 68 of FY20 retail sales growing 125 YoY
12
Distributor
Flexible Efficient DSD and Warehouse Distribution System
Direct to Warehouse Direct to Store (DSD)
~18000Doors
~725Routes
70000+Doors
~1700+ Total Routes
Each of Top 3Salty Snacking Companies Operate DSD Networks(1)
Note Includes impact of Truco acquisition1) Top 3 Salty Snacking companies determined by IRI MULO+C Total US Retail Sales for 52W ended 12272020
Utz Transition to IOs
of Routes 2016 Q1 2021
Company-Owned 67 20
Independent Operators (IO) 33 80
~25000 Doors
~525 Retailer Distribution Centers
Completed Transition to IOs Expected by Q2 2022
13
National Manufacturing Footprint with Broad Capabilities
400+ Million Lbs Annual Capacity(1)
Low 70s Capacity Utilization(1)
Strong Quality and Safety Record Opportunities to Optimize Footprint
15 Manufacturing Facilities
Packaging
MultipacksBarrelsBags
TraysSeasonals
Olive OilAvocado Oil Gluten-Free
Organic
Ingredients
ContinuousChips
KettleChips
Extruded
Popped Baked
Processes
Sheeted Veggie Pork
(4)
1) Based on management estimates of available capacity in 2020 over a seven-day work schedule excluding weekly clean-up time Excludes Festida acquisition
Festida Acquisition
Largest Manufacturer of ON THE BORDERreg Tortilla Chips Located in Grand Rapids MI Provides Increased Access to Midwest
Festida Facility (Acquisition closed on June 7 2021)
14
2021 60x 51x 71
2021 87x 59x 44
2020 93x 84x 25
2020 57x 49x 24
2019 112x 72x 62
2017 NM 102x 138
2016 158x 76x 96
2013 132x 57x 87
2011 80x 56x 70
All Acquisitions(3) 76x 65
Track Record of Accretive and Well-Integrated Acquisitions
Year Pre-SynergyAdj EBITDA Multiple
Cost Synergy of Revenue
Snacks
Target Post-SynergyAdj EBITDA Multiple
Source Management estimates Table presented above highlights select transactions and excludes 6 additional tuck-in acquisitions details 1) Reflects NPV of tax attributes and run-rate cost synergies2) Estimated run rate cost synergies as percentage of third party 2020 net sales3) All acquisition statistics based on weighted average and includes 6 additional tuck-in acquisitions completed since 20114) Represents management estimates as synergies are not yet fully realized
(1)
(1)
(1)
(1) (2)(4)
(4)
(4)
(4)
(Closed on June 7 2021)
(1) (4)
15
Attractive Value Creation Potential
Plus Additional Upside From Strategic Acquisitions
Long-Term Organic Growth Model
Adj EBITDA 6 ndash 8 Productivity Margin Enhancements
Adj EPS 8 ndash 10 Deleveraging
~10 ndash 12
(1) Based on management estimates and long-term historical category trend
Net Sales In-Line with Category3 ndash 4
Power Brands Focus
Exp Dividend Yield ~2 ~40 Target Payout Ratio
(1)
Total Shareholder Return
16
II Value Creation Strategy
Goal Be Fastest Growing Pure-Play Branded Snack Platform of Scale in the US
1 Drive Productivity2 Optimize Revenue and
Trade3 Improve Margin Mix
1 Focus on Branded Snacking in the US
2 Deliver Strong Synergies
1 Accelerate Power Brands Through Enhanced Marketing and Innovation2 Expand Distribution in Underpenetrated Channels and Customers3 Continue National Geographic Expansion4 Increase Presence in Key Salty Snack Sub-Categories and Adjacencies
Reinvest to Accelerate Revenue Growth
Reduce Costs and Enhance Margins
Continue Strategic
Acquisitions
Value Creation Strategies
1
2
12
3
1234
18
Reduce Costs and Enhance Margins
Manufacturing Efficiencies Line automation Equipment upgradesexpansion Wastescrap reduction
Network Optimization Distribution optimization Palletcase efficiency Order management automation
Product Design Bagcase pack efficiencies Packaging material utilization Multiple supplier qualifications
Sourcing Flexible formulas Purchasing inputs Indirect sourcing standardization2020 Actual 2023E2021E
1
2
Productivity Targets (1)
Productivity Targets by Category
Key Productivity Drivers
(1) Excluding FY 2020 and FY 2021 acquisitions
3 ndash 4
Manufacturing Efficiencies
40
Product Design30
Network Optimization
20Sourcing10
Price pack architecture initiatives
New trade management software
Grow higher-margin Power Brands increasing of portfolio
De-emphasize lower-margin private label and Partner Brands
Leverage insights from ERP rollout
Key Revenue Trade amp Margin Drivers(Annual Savings as of COGS)
(Annual Savings as of COGS)
19
49
67
2015 2020
2020 ~1
40
Utz Peer Average
$517 $650
2015 2020
18
53
2015 2020
$25
$66
2015 2020
10 21
2015 2020
$41
$69
2015 2020
$146
$234
2015 2020
5055
2015 2020
Accelerate Power Brands Through Enhanced Marketing and Innovation
Source Company filings Management estimates IRI MULO-C data for 2015 and 2020 calendar years1) Represents last reported fiscal year advertising expense as a of Net Sales per most recent Form 10-K filed by our peers through May 21 2021 Peers include Campbellrsquos Flowers Foods General Mills Hain Hershey Hostess JampJ Snack Foods Kellogg Mondelez and PepsiCo
Increase Marketing Spend (as a percentage of net sales) Strong Momentum in Key Power Brands
Add ldquopullrdquo marketing to successful trade ldquopushrdquo strategies
Reallocate existing spend to higher ROI marketing and strengthen sales execution with improved analytics and technology
Focus on elevating insights expanding capabilities and creating consumer pull of our Power Brands and in particular Utzreg ON THE BORDERreg and Zapprsquosreg
Targeting growth in Digital and e-Commerce spend in 2021 of approximately 60 versus 2020
Launched updated Utz website (utzsnackscom) and DTC e-Commerce platform in February 2021
LT Target ~3-4
Peer Average(1)
Retail Sales ($mm) ACV Distribution ()
Pork Skins
Improve Brand Marketing Execution
20
Flavored Pretzels are 35 of Sub-Category and Growing over 30 and Utz is Meaningfully Underweight in Flavored (lt10 of our mix)(1)
(1) Source IRI Total US MULO + C
Authentic Mexican Style and Flavor Portfolio Expansion
Strategic Variety Pack Partnerships
100 Year Celebration and Seasonal Offering Iconic Flavors Extended into New Textures
Accelerate Power Brands Through Enhanced Marketing and Innovation
21
679
41 39 34 34
661
50 42 31 25
570 78
52 42 33
576 75
55 37
17
Expand Distribution in Underpenetrated Channels and Customers
Source IRI MULO-C data (52-week period ended 12272020) for salty snack category by channel Pro forma for acquisitions of Truco HK Anderson and Vitnerrsquos 1) Based on IRI data Pro Forma for acquisitions of HK Anderson and Truco E-commerce includes retailer sites click amp collect BOPIS etc2) 55 target share represents Utz share in Food channel per IRI MULO-C data (52-week period ended 12272020
55(2) Share in C-Store and Mass Represents~$200M of Incremental Retail Sales
C-Store and Mass Strategies
Expand C-Store presence through strengthened retailer master distributor and redistributor relationships and drive for customer growth in the West
Drive Mass distribution by leveraging expanding national scale and brand portfolio
Continued geographic expansion organically and through acquisitions
Share by Channel
55
55
Food
C-Store
Mass
Club
Rapidly Growing E-Commerce(1)
of RetailSales 35 68 71
YoY Growth -- 125 43
2019 Q1 lsquo212020
Peer 1 Peer 2 Peer 3 Peer 4
Peer 1 Peer 2 Peer 3 Peer 4
Peer 1 Peer 2 Peer 3 Peer 4
Peer 1 Peer 2 Peer 3 Peer 4
22
Focus on Large Population Markets
ndashKey Expansion Markets South Midwest Colorado
ndashKey Emerging Markets Florida Texas California West
Drive Power Brands
Expand DSD Route Network
Purchase 3rd party Master Distributors
Make Tuck-in Acquisitions
Continue National Geographic ExpansionGeographic Priorities(1) Strategies
Significant Opportunity for Growth in Expansion and Emerging Geographies(1)
Each Point of Share Gain in ExpansionEmerging Geographies Represents $200M of Incremental Retail Sales(3)
93 Share Nationally Represents ~$12B of Incremental Retail Sales(3)
Utz Definition
of Market Retail Sales
2020 Utz RetailSales
RankUtz $
Market Share
Core ~27 ~50 2 93
Expansion ~23 ~23 4 45
Emerging ~50 ~27 5 25
National 100 100 4 48
1) Geographic areas of Core Expansion and Emerging based on Utz internal definitions for retail sales in various states 2) Pro forma for acquisitions of HK Anderson and Truco Sourced from IRI MULO-C data (52-week period ended 12272020) Geographies refer to core comps in states outlined above 3) Based on 2020 Retail Sales per IRI MULO+C Salty Snack data
CoreExpansionEmerging
FL
NM
DEMD
TX
OK
KS
NE
SD
NDMT
WY
COUT
ID
AZ
NV
WA
CA
OR
KY
ME
NY
PA
VTNH MA
RICT
WVINIL
NCTN
SC
ALMS
AR
LA
MO
IA
MNWI
NJ
GA
DCVA
OH
MI
HI
AK
23
Continue Strategic Acquisitions
Scalable MampA Platform
Significant Synergy Opportunities Driven by Highly Leverageable Manufacturing and Distribution System
Robust Pipeline amp Favorable CompetitiveDynamics
Utz is Logical Consolidator in Category with Numerous Opportunities
Smaller Tuck-ins
Transformative RMT Vehicle
Proven Track Record
Acquisition-Savvy Management Team and Experienced Board
Near-Term Acquisition Criteria
1 Focus on Branded Snacking in the US with Concentration on Salty Snacks
ndash Facilitate Geographic Expansion
ndash Increase Presence in Sub-Categories
ndash Enhance Growth
2 Deliver Strong Synergies
Financial Priorities
Accretive and Multiple Enhancing
Consistent with Target Leverage Policy
1
2
24
III Recent Performance
Lapping Significant Market Share Gains in Early 2020
26
23
1013
10 10 98 9 8 8 6
31
2527
2018 17
1512
10 108
55000000
56000000
57000000
58000000
59000000
60000000
61000000
62000000
0
5
10
15
20
25
30
35
4WE
02-2
3-20
4WE
03-2
2-20
4WE
04-1
9-20
4WE
05-1
7-20
4WE
06-1
4-20
4WE
07-1
2-20
4WE
08-0
9-20
4WE
09-0
6-20
4WE
10-0
4-20
4WE
11-0
1-20
4WE
11-2
9-20
4WE
12-2
7-20
Total Salty Snacks
Source IRI Total US MULO + C 4-week ending 22320 through 122720 on a pro forma basis
4-Week Period Retail Sales YoY Change and Buyer Trends
Trailing 52-week Utz Buyers
Change vs YAG
611M
577M
During the early stages of the COVID-19 pandemic Utz significantly outperformed the category and we continued to gain buyers throughout the year
505 530
178 170
317 300
579
609
$1951 $2151
52wk 122919 52wk 122720
Source IRI Custom Panel Total US - All Outlets ldquoBuyersrdquo equivalent to est households of Buyers and Dollars per Buyer on a pro forma basis
52wk 122919 52wk 122720
Repurchased Twice or More
Repurchased Once
Bought OnceDid Not Repurchase
of Buyers (in M) and $ per Buyer of Buyers Repeating Purchases ndash Utz + Truco
Increase in buyers was diversified across demographics income brackets and geographies ~75 of new buyers from middle and high-income demographics ~80 of new buyers from Millennials and Gen X
Utz Realized the Most New Buyers of Any Salty Snack Competitor for the 52-weeks ended December 27 2020
Strong Buyer and Repeat Rate Growth
683 700
27
Strong 2-Year Growth Rates to Begin 2021
Retail Sales 2-Year CAGR Rolling 12-Week Trend
Source IRI Total US MULO + C 4-week trend on a pro forma basis
As we begin to lap COVID-19 pantry stocking we are driving strong 2-year growth rates led by our Power Brands partially offset by our planned decline in Foundation Brands
54
59 61 6055
55 57 60
71 71 7478
-36 -35 -39 -43
-5
0
5
10
12-WeeksEnding 1-24-21
12-WeeksEnding 2-21-21
12-WeeksEnding 3-21-21
12-WeeksEnding 4-18-21
Utz Foundation Brands(13 of sales)
Utz Power Brands(87 of sales)
Total Salty Snacks
Utz Brands
28
(1) Source IRI Custom Panel Total US MULO + C 13-weeks ended 442021 YoY Growth compared to the comparable period in the prior year on a pro forma basis(2) IRI does not include Partner Brands and Private Label retail sales
Pork Skins ChipsCheese
Other(2)
bull Partner Brands
bull Private Label
Power Brands Increased to Nearly 87 of Retail Sales
Power Brands Retail Sales Change(1)
(13-Weeks Ended 4421)Foundation Brands Retail Sales Change(1)(2)
(13-Weeks Ended 4421)
Power Brands Foundation Brands
2-Year CAGR
Total Salty Snacks Utz Power Brands
2-Year CAGR
Total Salty Snacks Utz Foundation Brands
Our long-term value creation strategies are working as we continue to prioritize our investments and reduce emphasis on Foundation Brands
60
76 60
(43)
29
30
Significant Two-Year Share Gains in our Major Sub-Categories
Sub-Category Retail Sales 2-Year CAGR (13-Weeks Ended 4421)
Tortilla Chips
Total Salty Snacks
76
Pork Rinds
Cheese Snacks
Potato Chips
27
Pretzels
05
40
6456
77
6555
80 76
Salsa
154
Queso
95
71
221
Total Sub-Category Power Brands
Potato chips and tortilla chips comprise nearly 60 of our retail sales and significantly outpaced the category over the last two years
5960
Utz Rank(1)
Utz Retail Sales(1)
3
$13B
4
$541M
3
$259M
2
$152M
3
$134M
3
$80M
4
$53M
3
$16M
Source IRI Total US MULO + C on a pro forma basis (1) Rank and Retail Sales are based on 52-week period ended 12272020
Expansion amp Emerging Geographic Momentum Continues
Geographic Channel Retail Sales 2-Year CAGR (13-Weeks Ended 4421)
ExpansionTotal US Core Emerging
60 59
97
49
76
33
123
45
68
91
65
83
Core performance relative to market driven by Good Healthreg and Foundation Brands that are more weighted towards the Core
Total Sub-Category Power Brands
Utz Retail Sales Mix(1)
Utz Market Share and Rank(1)
~50 ~23 ~27
Source IRI Total US MULO + C on a pro forma basis (1) Rank and Retail Sales Mix are based on 52-week period ended 12272020
93 2 45 4 25 5
31
Driving 2-Year Share Gains in Grocery Club and C-Store
Retail Channel Retail Sales 2-Year CAGR (13-Weeks Ended 4421)
C-Store
112
MULO + C MassGrocery
38
60
Club
59
7667
73
99 97
133
37 37
130
01
15
Total Sub-Category Power Brands
Mass performance driven by a lap faced by ON THE BORDERreg and we expect trends will improve as we move throughout the year
Utz Rank(1)
Utz Retail Sales(1)
3
$13B
3
$697M
3
$260M
2
$113M
5
$181M
Source IRI Total US MULO + C on a pro forma basis (1) Rank and Retail Sales are based on 52-week period ended 12272020
32
Q1 2021 Highlights
Source Company filings Company information Note Pro Forma Net Sales Adjusted Gross Profit Adjusted SGampA Adjusted Gross Margin Adjusted EBITDA Adjusted EBITDA Margin Adjusted net Income and Adjusted EPS are non-GAAP financial measures See appendix for reconciliation of non-GAAP financial measures to most directly comparable GAAP measures
1Qrsquo20 Results
1Qrsquo21 Results
In $millions except per share amounts
Net Sales
Adj SGampA
of net sales
2280
570
250
Adj Gross Profit
of net sales
853
374
YoY Change
Adj EBITDA
of net sales
Adj Net Income
Pro Forma Net Sales
292
128
115
2692
672
250
1045
388
379
141
190
180
181
--
225
140bps
(22)
298
130bps
652
Adj EPS nm $013 nm
2752 2692
Q1 net sales growth of 18 and Adjusted EBITDA growth of 30
Reflects positive contribution from acquisitions partially offset by transitory events (lapping COVID-19 impact in 2020 February 2021 snowstorms)
Pro Forma Net Sales 2-year CAGR of 43
Utz IRI retail sales two-year CAGR of 59 shows continued strength across our platform and new buyers and repeat rates remain consistent
Continued to further penetrate key channels and increase distribution in Emerging and Expansion geographies
Completed the ERP go-live and remain on target to increase productivity from 1 to 2 of COGS in 2021
MampA pipeline remains robust as we continue to enhance our growth and margin profile with value enhancing acquisitions targeted at geographic sub-category and channel share growth as well as margin-enhancing opportunities
Closed acquisition of Vitnerrsquos on February 8 2021
Announced acquisition of Festida Foods and closed on June 7 2021
33
Managing Through an Inflationary Environment
Cost Driver FY21 Considerations Actions We are Taking
Commodity Inflation(COGS)
Continue to expect commodity inflation of approximately 4 vs last year
Primarily driven by cooking oils and packaging
Covered on 80 of positions
Improve net price realization through price pack architecture enhancements
Deliver on our plan to increase productivity from 1 to 2 of COGS
Initiatives are back-half weighted with 60 of pricing actions and 80 of productivity improvements planned for the second half of fiscal 2021
Transportation (SGampA)
Higher transportation costs driven by increased spot market rates contract delivery costs and driver scarcity
Diesel prices per gallon up ~40 vs LY and supply truck availability index near 5-year lows
Delivery costs for Utz are running higher than originally planned for fiscal 2021
Strategic carrier management Implementing transportation systems
management improvement and load efficiency projects
Heightened customer collaboration to drive efficiencies across product orders
Our price pack architecture and productivity initiatives which have long-term benefits are actively being deployed and are weighted towards the second half of 2021
34
Capital Focused on Driving Growth
1 Business Growth(Including MampA)
2 Debt Reduction
3 Dividend Increase
4 Share Buyback
bull Target Net Leverage of 3 ndash 4x
bull Higher Net Debt Adj EBITDA Possible for Strategic Acquisitions Returning to Target Range within 1 ndash 2 Years
bull LTM Q1 Net Debt Normalized Further Adj EBITDA of 40x
Cash Flow Priorities Target Leverage
Source Company information
35
Delivering on Foundational Strategies With Further Opportunity Ahead
Value Creation Strategy
Reduce Costs and Enhance Margins
(1) Current figure based on 13-weeks ended 04042021 2019 based on 13-weeks ended 03312019 and does not include subsequent acquisitions
Margin profile strengthened
Productivity initiatives on-track to double in 2021
Drove PampL-wide value creation
Completed new ERP system implementation
bull Targeting productivity of 3-4 of COGS by 2023 in-line with initial expectations
bull IO conversion in 2022 to further streamline business and improve margins
bull Leverage new ERP for superior decision-making
bull Drive price pack architecture strategies
Progress to Date Go-Forward Strategy
Reinvest to Accelerate
Revenue Growth
Significant incremental investment in digital eComm to retain new buyers and drive awareness
Power Brands now represent 87 of retail sales vs81 in 2019(1)
Gained share in all major channels in FY 2020
Outperformed Salty Snacks category in Expansion and Emerging geographies in FY 2020
bull Invest behind pull marketing strategies
bull Drive geographic expansion of Power Brands(Utz Zapprsquos and ON THE BORDER in particular)
bull Focus innovation on highest-impact products and brands
bull Leverage increasing national scale to drive Mass and C-store distribution gains
bull Fill gaps in product portfolio
Continue Strategic Acquisitions
Closed acquisitions of HK Anderson Truco Enterprises (ON THE BORDER) Vitnerrsquos and Festida Foods since going public in August 2020
On track to deliver targeted synergies and enhanced scale and margin
bull Acquisition pipeline remains strong
bull Focused on accretive opportunities that bolster Power Brands improve margins and expand geographies channels and subcategories
36
Questions
Appendix
Reconciliation of Non-GAAP Financial Measures to Reported Financial Measures
39
Reconciliation of Non-GAAP Financial Measures to Reported Financial Measures
(1) Income Tax Rate Adjustment calculated as (Loss) Income before taxes plus (i) Acquisition Step-Up Depreciation and Amortization and (ii) Other Non-Cash andor Non-Recurring Adjustments multiplied by an effective cash tax rate minus the actual tax provision recorded in the Consolidated Statement of Operations and Comprehensive Income (Loss) The effective cash tax rate includes corporate income tax payments plus non-resident withholding and tax distributions which are considered equivalent to tax
40
Reconciliation of Non-GAAP Financial Measures to Reported Financial Measures
See footnotes in Utzrsquos Q1 earnings press release dated May 13 2021
41
Reconciliation of Non-GAAP Financial Measures to Reported Financial Measures
Net Sales and Pro Forma Net Sales 14-Wks Ended 1-Wk Ended
13-Wks Ended
13-Wks Ended
53-Wks Ended 1-Wk Ended
52-Wks Ended
52-Wks Ended
(dollars in millions) 1321 1321 122720 122919 1321 1321 122720 122919Net Sales $ 2463 $ 159 $ 2304 $ 2018 $ 9643 $ 159 $ 9484 $ 7682 Conagra DSD Snacks (Kennedy) Pre-Acquisition Net Sales - 82 - 888Kitchen Cooked Pre-Acquisition Net Sales - 22 - 85HKA Pre-Acquisition Net Sales 11 31 80 109Truco Pre-Acquisition Net Sales 371 362 1878 1462Pro Forma Net Sales $ 2686 $ 2515 $ 11442 $ 10226
Gross Profit Adjusted Gross Profit and PF Adj Gross Profit14-Wks Ended 1-Wk Ended 13-Wks Ended 13-Wks Ended 53-Wks Ended 1-Wk Ended 52-Wks Ended 52-Wks Ended
(dollars in millions) 1321 1321 122720 122919 1321 1321 122720 122919Gross Profit $ 816 $ 49 $ 767 $ 657 $ 3327 $ 49 $ 3278 $ 2538 Depreciation and Amortization 75 - 75 53 313 - 313 168 Non-Cash non-recurring adjustments 14 - 14 - 14 - 14 - Adjusted Gross Profit $ 905 $ 49 856 710 $ 3654 $ 49 3605 2706 Adjusted Gross Margin as a of Net Sales 367 308 372 352 379 308 380 352Depreciation and Amortization - COGS (75) (53) (313) (168)Conagra DSD Snacks (Kennedy) Pre-Acquisition Gross Profit - 23 - 280 Kitchen Cooked Pre-Acquisition Gross Profit - 13 - 52 HKA Pre-Acquisition Gross Profit 01 05 11 16 Truco Pre-Acquisition Gross Profit 145 150 769 588 Pro Forma Gross Profit 927 848 4072 3474
Depreciation and Amortization 75 53 313 168 Conagra DSD Snacks (Kennedy) Pre-Acquisition DampA - 05 - 20 HKA Pre-Acquisition DampA - - - - Truco Pre-Acquisition DampA - - - - Depreciation and Amortization - Total 75 58 313 188 Pro Forma Adjusted Gross Profit $ 1002 $ 906 $ 4385 $ 3662 Pro Forma Adjusted Gross Margin as a of Pro Forma Net Sales 373 360 383 358
42