jerusalem tourism cluster microeconomics of ......jerusalem tourism cluster microeconomics of...
TRANSCRIPT
Jerusalem Tourism Cluster
Microeconomics of Competitiveness 2013
Catherine Lin - Chingiz Dosmukhambetov –
Roy Folkman - Krishnavenee Krishnan
Jerusalem Tourism Cluster
Microeconomics of Competitiveness 2013
2
Table of Contents
1.0 Executive Summary ...................................................................................................................... 3
2.0 Israel’s Competitive Position ...................................................................................................... 4
2.1 Country Overview................................................................................................................................... 4
2.2 Israel’s economic performance ....................................................................................................... 5
2.2 Competitiveness of Israel and Jerusalem ................................................................................................................... 8
2.2.1 Location and Endowments........................................................................................................................................... 8
2.2.2 Macroeconomic conditions .......................................................................................................................................... 8
2.2.3 Microeconomic Competitiveness and National Diamond Analysis .......................................................... 10
3.0 Jerusalem Competitive Position ................................................................................................ 13
3.1 City Overview ............................................................................................................................................................. 13
3.2 Jerusalem Competitiveness .................................................................................................................... 14
4.0 Jerusalem Tourism Industry ...................................................................................................... 15
4.1 Global Tourism Trends ............................................................................................................................... 15
4.2 Jerusalem Tourism Cluster Profile .......................................................................................................... 16
4.3 Cluster Performance .................................................................................................................................... 17
4.4 Cluster History and Evolution ................................................................................................................... 19
5.0 Jerusalem Tourism Cluster Analysis ....................................................................................... 21
5.1 Cluster Map ................................................................................................................................................... 21
5.2 Jerusalem Tourism Cluster Diamond Analysis ..................................................................................... 22
5.3 Strategic vision, challenges, and recommendations ............................................................................. 26
6.0 Acknowledgements ........................................................................................................................ 31
7.0 Bibliography ..................................................................................................................................... 32
Jerusalem Tourism Cluster
Microeconomics of Competitiveness 2013
3
1.0 Executive Summary
Jerusalem is an ancient city with historical, religious and cultural significance like no other. It
is a place of immense religious importance to 3.5 billion people and the home to three great
religions - Judaism, Christianity and Islam. It is therefore surprising to learn that as a tourist
destination, Jerusalem draws in only about 2.5 million visitors annually, falling far short of other
world class cities. Despite good natural endowments and stable macroeconomic conditions in
Israel, the overall business environment still faces major challenges such as low participation in
the workforce and limited vocational training, small local markets and limited competition in key
sectors, ineffective bureaucracy and high burden of regulation. The volatile political environment,
particularly with regard to Israel‘s relationships with countries in its region, affects not only
potential tourists, but also investors who are reluctant to take on such risk. Furthermore, a tense
connection with the Palestinian tourism cluster in Jerusalem underutilizes the huge potential of the
combined clusters.
Facing these challenges the current mayor of the city, Nir Barkat, have adopted a cluster
approach for the tourism industry in 2009. With cooperation of the national government the sum
of investments grew, marketing efforts more then doubled, and a leading institute for cooperation
(IFC) was appointed to operate as the cluster hub. A central part of the development strategy was
focused in the creation of a unique cultural experience that will expand the visit more then
pilgrimage and holy places, thus combing festivals, arts and culinary to an overall experience that
can compete with other urban touristic destinations.
Cluster development takes a long time for real changes to be seen, in our value proposition
and recommendations we focus on the need to improve the tourist experience with connection to
major complimentary actors especially retail and attractions that address tourist clientele. The
Jerusalem Tourism Cluster
Microeconomics of Competitiveness 2013
4
unfulfilled potential that exist in the greater combination with the health services cluster in the
city, and the potential in better connection with the Palestinian tourism cluster that can supply a
cheaper access to hospitality and other services and also increase the offering of local authentic
retail for tourists.
2.0 Israel’s Competitive Position
2.1 Country Overview
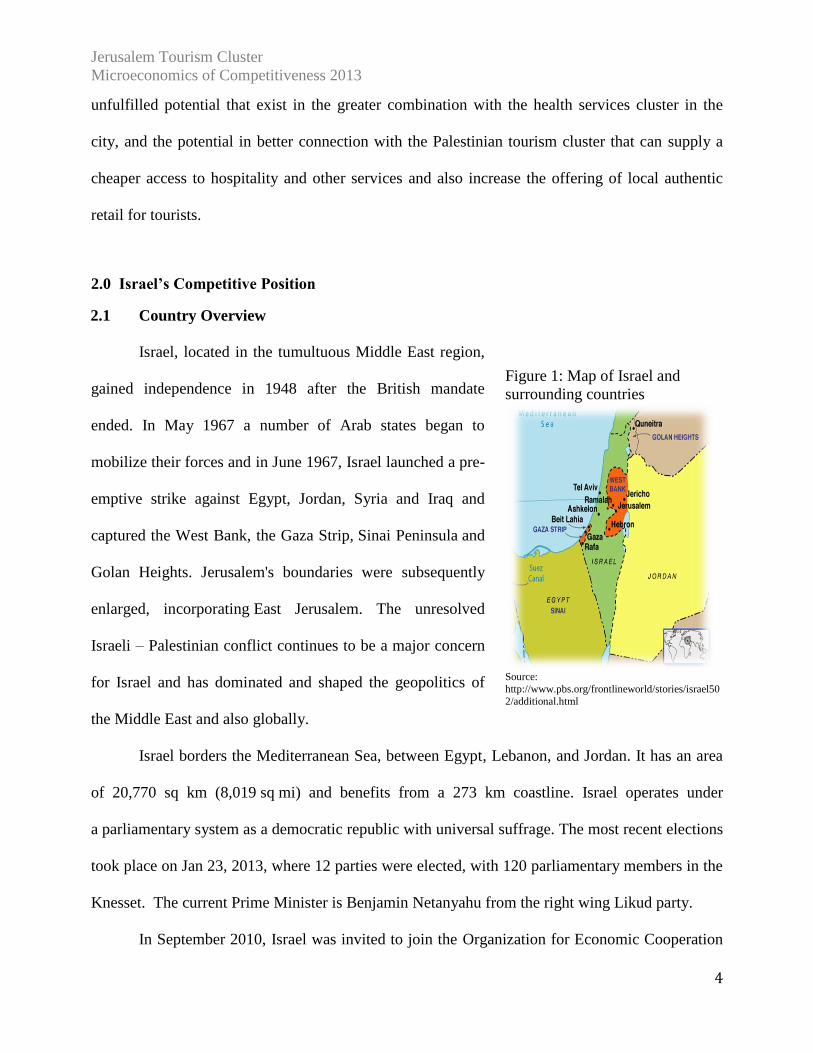
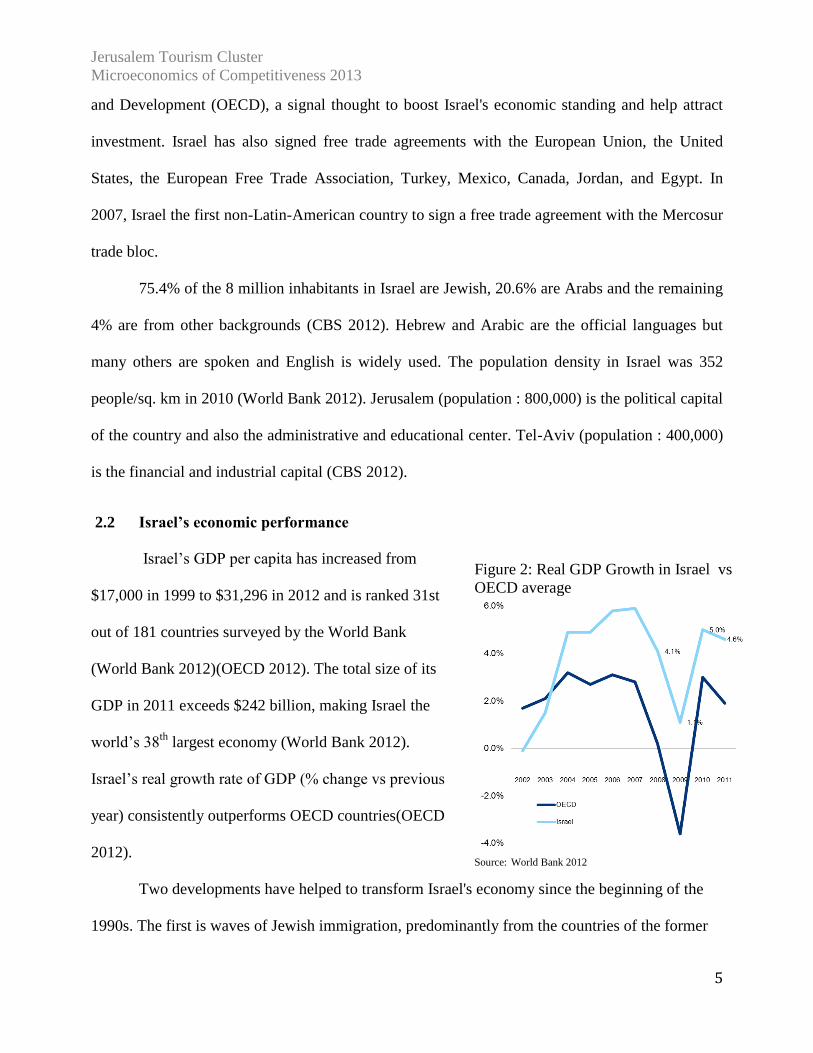
Israel, located in the tumultuous Middle East region,
gained independence in 1948 after the British mandate
ended. In May 1967 a number of Arab states began to
mobilize their forces and in June 1967, Israel launched a pre-
emptive strike against Egypt, Jordan, Syria and Iraq and
captured the West Bank, the Gaza Strip, Sinai Peninsula and
Golan Heights. Jerusalem's boundaries were subsequently
enlarged, incorporating East Jerusalem. The unresolved
Israeli – Palestinian conflict continues to be a major concern
for Israel and has dominated and shaped the geopolitics of
the Middle East and also globally.
Israel borders the Mediterranean Sea, between Egypt, Lebanon, and Jordan. It has an area
of 20,770 sq km (8,019 sq mi) and benefits from a 273 km coastline. Israel operates under
a parliamentary system as a democratic republic with universal suffrage. The most recent elections
took place on Jan 23, 2013, where 12 parties were elected, with 120 parliamentary members in the
Knesset. The current Prime Minister is Benjamin Netanyahu from the right wing Likud party.
In September 2010, Israel was invited to join the Organization for Economic Cooperation
Figure 1: Map of Israel and
surrounding countries
Source: http://www.pbs.org/frontlineworld/stories/israel50
2/additional.html
Jerusalem Tourism Cluster
Microeconomics of Competitiveness 2013
5
and Development (OECD), a signal thought to boost Israel's economic standing and help attract
investment. Israel has also signed free trade agreements with the European Union, the United
States, the European Free Trade Association, Turkey, Mexico, Canada, Jordan, and Egypt. In
2007, Israel the first non-Latin-American country to sign a free trade agreement with the Mercosur
trade bloc.
75.4% of the 8 million inhabitants in Israel are Jewish, 20.6% are Arabs and the remaining
4% are from other backgrounds (CBS 2012). Hebrew and Arabic are the official languages but
many others are spoken and English is widely used. The population density in Israel was 352
people/sq. km in 2010 (World Bank 2012). Jerusalem (population : 800,000) is the political capital
of the country and also the administrative and educational center. Tel-Aviv (population : 400,000)
is the financial and industrial capital (CBS 2012).
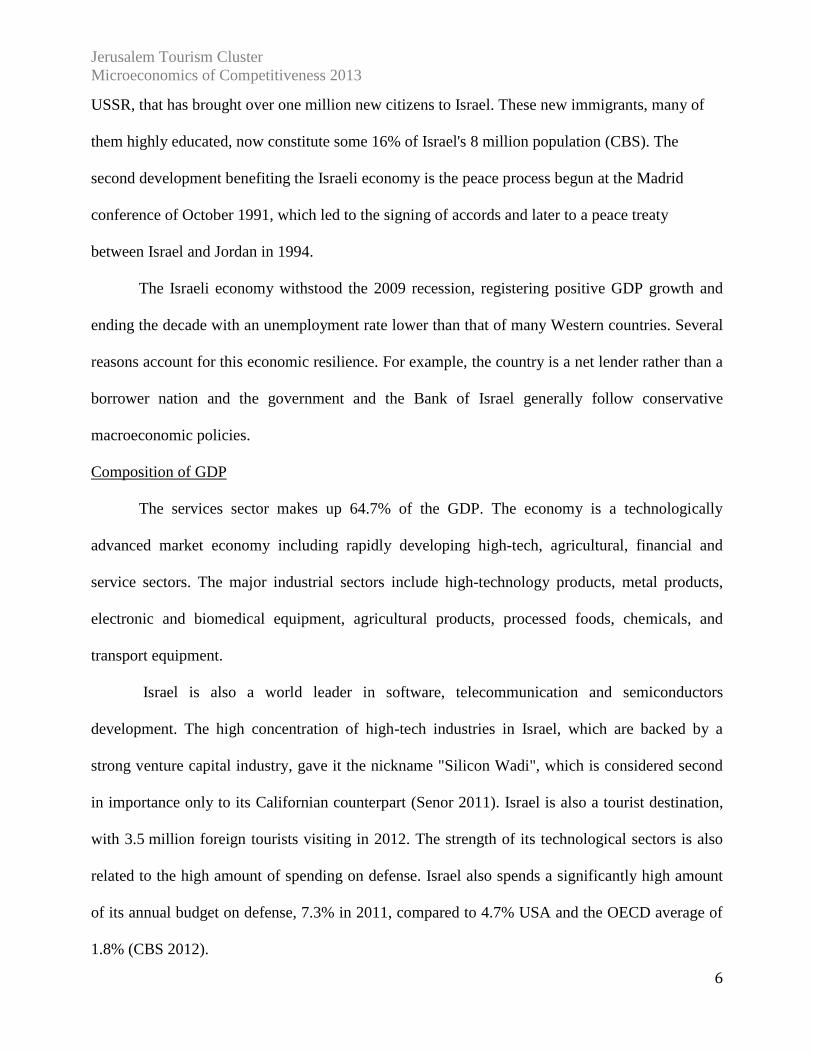
2.2 Israel’s economic performance
Israel‘s GDP per capita has increased from
$17,000 in 1999 to $31,296 in 2012 and is ranked 31st
out of 181 countries surveyed by the World Bank
(World Bank 2012)(OECD 2012). The total size of its
GDP in 2011 exceeds $242 billion, making Israel the
world‘s 38th
largest economy (World Bank 2012).
Israel‘s real growth rate of GDP (% change vs previous
year) consistently outperforms OECD countries(OECD
2012).
Two developments have helped to transform Israel's economy since the beginning of the
1990s. The first is waves of Jewish immigration, predominantly from the countries of the former
Figure 2: Real GDP Growth in Israel vs
OECD average
Source: World Bank 2012
Jerusalem Tourism Cluster
Microeconomics of Competitiveness 2013
6
USSR, that has brought over one million new citizens to Israel. These new immigrants, many of
them highly educated, now constitute some 16% of Israel's 8 million population (CBS). The
second development benefiting the Israeli economy is the peace process begun at the Madrid
conference of October 1991, which led to the signing of accords and later to a peace treaty
between Israel and Jordan in 1994.
The Israeli economy withstood the 2009 recession, registering positive GDP growth and
ending the decade with an unemployment rate lower than that of many Western countries. Several
reasons account for this economic resilience. For example, the country is a net lender rather than a
borrower nation and the government and the Bank of Israel generally follow conservative
macroeconomic policies.
Composition of GDP
The services sector makes up 64.7% of the GDP. The economy is a technologically
advanced market economy including rapidly developing high-tech, agricultural, financial and
service sectors. The major industrial sectors include high-technology products, metal products,
electronic and biomedical equipment, agricultural products, processed foods, chemicals, and
transport equipment.
Israel is also a world leader in software, telecommunication and semiconductors
development. The high concentration of high-tech industries in Israel, which are backed by a
strong venture capital industry, gave it the nickname "Silicon Wadi", which is considered second
in importance only to its Californian counterpart (Senor 2011). Israel is also a tourist destination,
with 3.5 million foreign tourists visiting in 2012. The strength of its technological sectors is also
related to the high amount of spending on defense. Israel also spends a significantly high amount
of its annual budget on defense, 7.3% in 2011, compared to 4.7% USA and the OECD average of
1.8% (CBS 2012).

Jerusalem Tourism Cluster
Microeconomics of Competitiveness 2013
7
Work force participation and productivity
Unemployment has been consistently low
for the past decade, and currently is at 5% (CBS
2012). However, labor participation is relatively
low due to low participation from Ultra Orthodox
men and Arab Israeli women. Labor productivity is
also low at $33.80 compared to OECD average of
$44.10. Part of the low productivity is due to small
number of holding firms that dominant key sectors in the economy, and due to low investment in
manufacturing infrastructure and transportation (Bank of Israel 2013).
Intermediate Indicators and Enablers of Productivity
Israel was ranked 10th
out of the 34 OECD countries in terms of inbound FDIs and 8th
in
terms of outbound FDIs. This strong performance is tempered by the fact that most inbound FDI
goes only towards the high technology sector. Because of these strengths, Israeli investment in
R&D as a % of gross domestic expenditure is the highest in the world, and it has high innovative
output of 300 patents per million people. Israel‘s major exports are services, processed ad semi
processed goods and its largest export partner is the US.
Figure 3: Unemployment and Labor
Participation
Figure 4: Export Composition
Jerusalem Tourism Cluster
Microeconomics of Competitiveness 2013
8
2.2 Competitiveness of Israel and Jerusalem
Following the framework of Microeconomics of Competitiveness, a country‘s
competitiveness is determined by its endowments, macroeconomic, and microeconomics factors.
2.2.1 Location and Endowments
Israel‘s location is both a strength and weakness. It has a particularly favorable climate for
tourism and high level of biodiversity. On the other hand, Israel has hostile relationships with its
neighboring countries and unresolved Israeli-Palestinian conflict continues to give rise to security
concerns. As a result, intra-region trade is fairly low, and Israel is geographically distant from its
major export partners (US, Belgium, UK) (Israel Export and International Cooperation Institute
2012). Israel also has limited natural resources, and historically had to fulfill its oil and gas
demand through imports. However, significant reserves of natural gas were recently discovered at
Tamar, Leviathan and Tanin (Kershner 2013).
The long history and legacy of cultural and religious events hold unparalleled religious
importance to a diverse population, including Jews, Muslims, and Christians. Nevertheless, this
diversity also poses social integration challenges due to strife between each of these groups.
2.2.2 Macroeconomic conditions
Human development and political institutions
Israel is ranked fairly high in the Global Competitiveness Index with regards to human
development (#26) and rule of law (#29) in comparison to 128 countries. The major positive
indicators are a high life expectancy of 81.5 years, 97.8% literacy rate, high secondary school
enrollment rate, and a world class healthcare system. Health measures thus are close to OECD
averages, although primary education is slightly behind comparable nations (OECD 2012). Social
Jerusalem Tourism Cluster
Microeconomics of Competitiveness 2013
9
inequality is moderately high with a GINI coefficient of 38.6 and Israel is ranked number 59 of the
99 countries surveyed by the World Bank (World Bank 2012).
Israel also has strong rule of law with low corruption, strong judicial independence and good
protection of property rights (Institute for Strategy and Competitiveness 2012). In terms of
political institutions, Israel also has a vibrant political civic society and strong political
engagement. However, Israel stills ranks lower for political institutions (#48) due to low
government effectiveness in reducing poverty and inequality, cumbersome bureaucracy, and low
public trust in politicians.
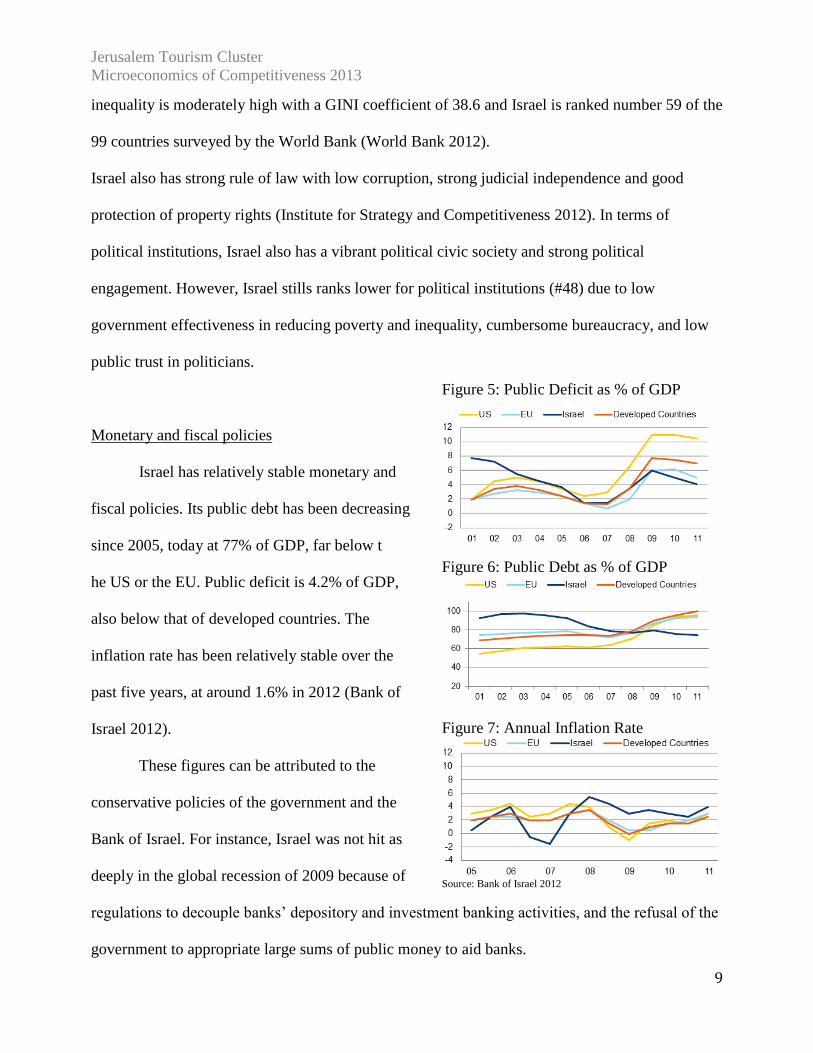
Monetary and fiscal policies
Israel has relatively stable monetary and
fiscal policies. Its public debt has been decreasing
since 2005, today at 77% of GDP, far below t
he US or the EU. Public deficit is 4.2% of GDP,
also below that of developed countries. The
inflation rate has been relatively stable over the
past five years, at around 1.6% in 2012 (Bank of
Israel 2012).
These figures can be attributed to the
conservative policies of the government and the
Bank of Israel. For instance, Israel was not hit as
deeply in the global recession of 2009 because of
regulations to decouple banks‘ depository and investment banking activities, and the refusal of the
government to appropriate large sums of public money to aid banks.
Figure 5: Public Deficit as % of GDP
Figure 6: Public Debt as % of GDP
Figure 7: Annual Inflation Rate
Source: Bank of Israel 2012

Jerusalem Tourism Cluster
Microeconomics of Competitiveness 2013
10
Since the financial crisis, Israel‘s policies have also been influenced by a moderation of
inflation in Israel amid continued increases in home prices and regional geopolitical developments
that impact government defense expenditure and Israel‘s sovereign credit risk. New policies
increased expenditures, particularly in social services and in preserving the defense budgets,
through increased taxes and a larger deficit targets to counteract the recession. However, the
budget deficit is large considering the low level of unemployment, which may reflect a large
structural deficit that has persisted for several years (Bank of Israel 2012).
2.2.3 Microeconomic Competitiveness and National Diamond Analysis
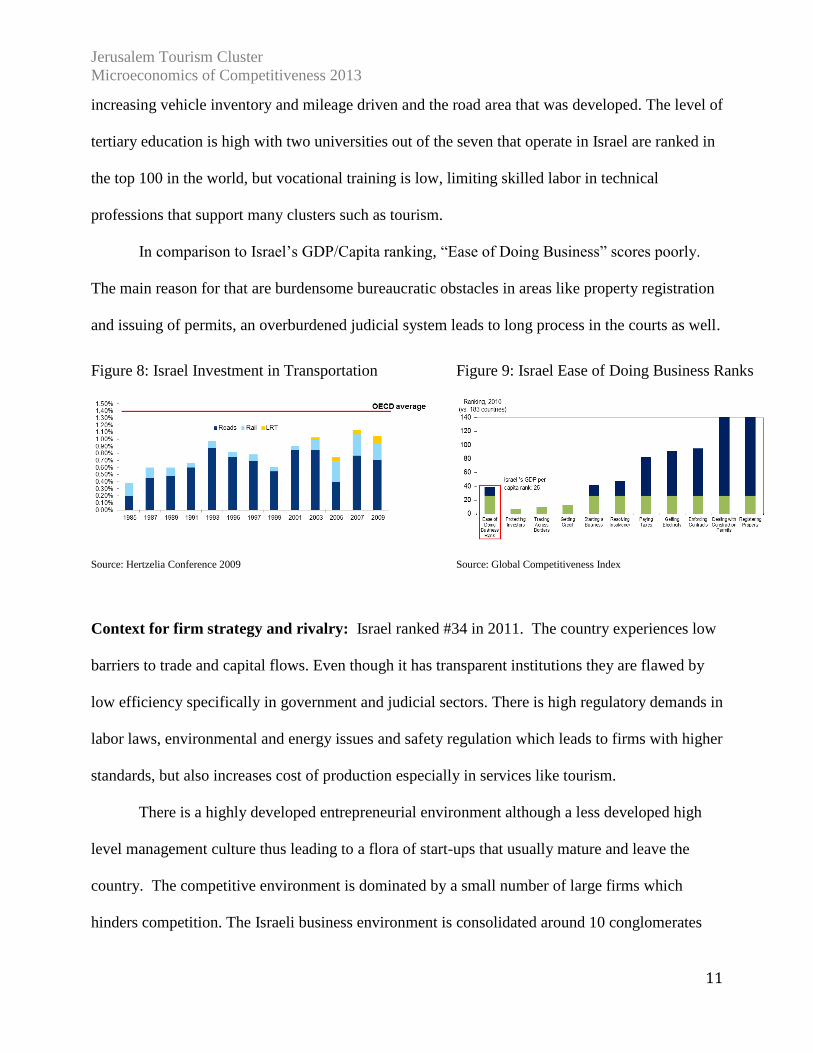
Factor conditions: Israel ranked #28 in factor conditions in 2011. The nation has developed
capital markets and high availability that is most notable in the high tech and IT industry. Israel
also has developed transportation infrastructure, however, this area experiences low investment in
comparison to OECD standards, thus leading to a growing gap between the need of the rapidly
Jerusalem Tourism Cluster
Microeconomics of Competitiveness 2013
11
increasing vehicle inventory and mileage driven and the road area that was developed. The level of
tertiary education is high with two universities out of the seven that operate in Israel are ranked in
the top 100 in the world, but vocational training is low, limiting skilled labor in technical
professions that support many clusters such as tourism.
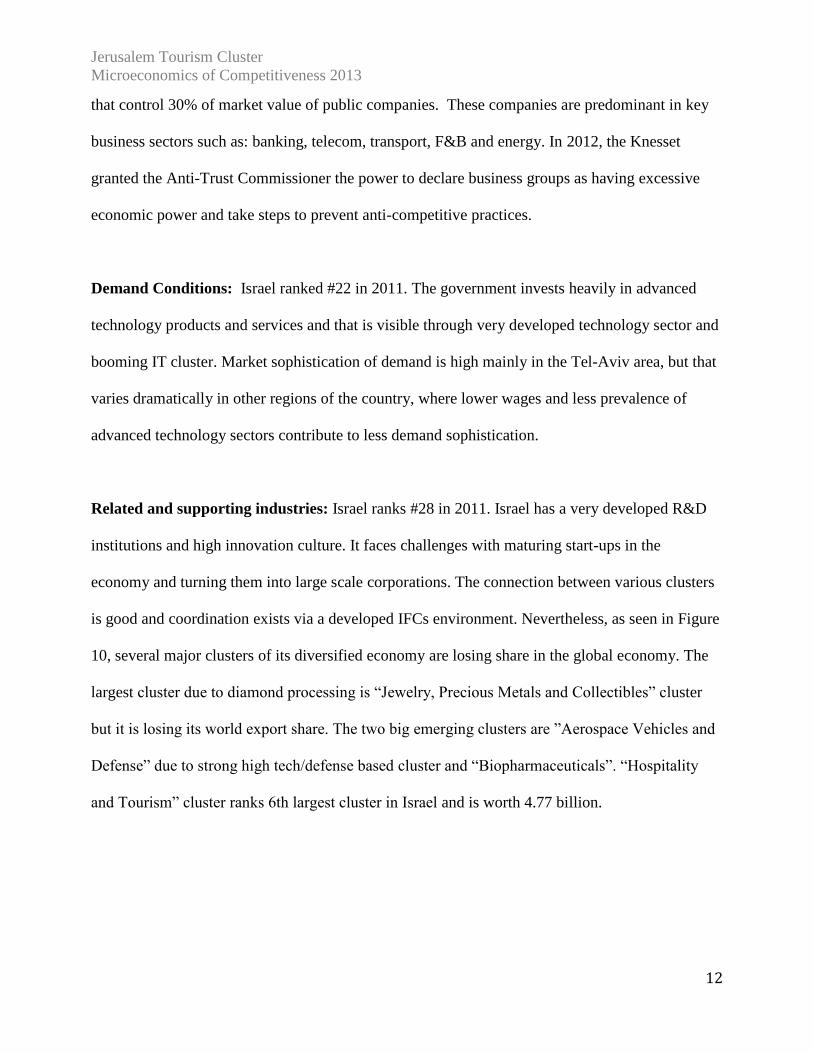
In comparison to Israel‘s GDP/Capita ranking, ―Ease of Doing Business‖ scores poorly.
The main reason for that are burdensome bureaucratic obstacles in areas like property registration
and issuing of permits, an overburdened judicial system leads to long process in the courts as well.
Context for firm strategy and rivalry: Israel ranked #34 in 2011. The country experiences low
barriers to trade and capital flows. Even though it has transparent institutions they are flawed by
low efficiency specifically in government and judicial sectors. There is high regulatory demands in
labor laws, environmental and energy issues and safety regulation which leads to firms with higher
standards, but also increases cost of production especially in services like tourism.
There is a highly developed entrepreneurial environment although a less developed high
level management culture thus leading to a flora of start-ups that usually mature and leave the
country. The competitive environment is dominated by a small number of large firms which
hinders competition. The Israeli business environment is consolidated around 10 conglomerates
Figure 8: Israel Investment in Transportation Figure 9: Israel Ease of Doing Business Ranks
Source: Hertzelia Conference 2009 Source: Global Competitiveness Index
Jerusalem Tourism Cluster
Microeconomics of Competitiveness 2013
12
that control 30% of market value of public companies. These companies are predominant in key
business sectors such as: banking, telecom, transport, F&B and energy. In 2012, the Knesset
granted the Anti-Trust Commissioner the power to declare business groups as having excessive
economic power and take steps to prevent anti-competitive practices.
Demand Conditions: Israel ranked #22 in 2011. The government invests heavily in advanced
technology products and services and that is visible through very developed technology sector and
booming IT cluster. Market sophistication of demand is high mainly in the Tel-Aviv area, but that
varies dramatically in other regions of the country, where lower wages and less prevalence of
advanced technology sectors contribute to less demand sophistication.
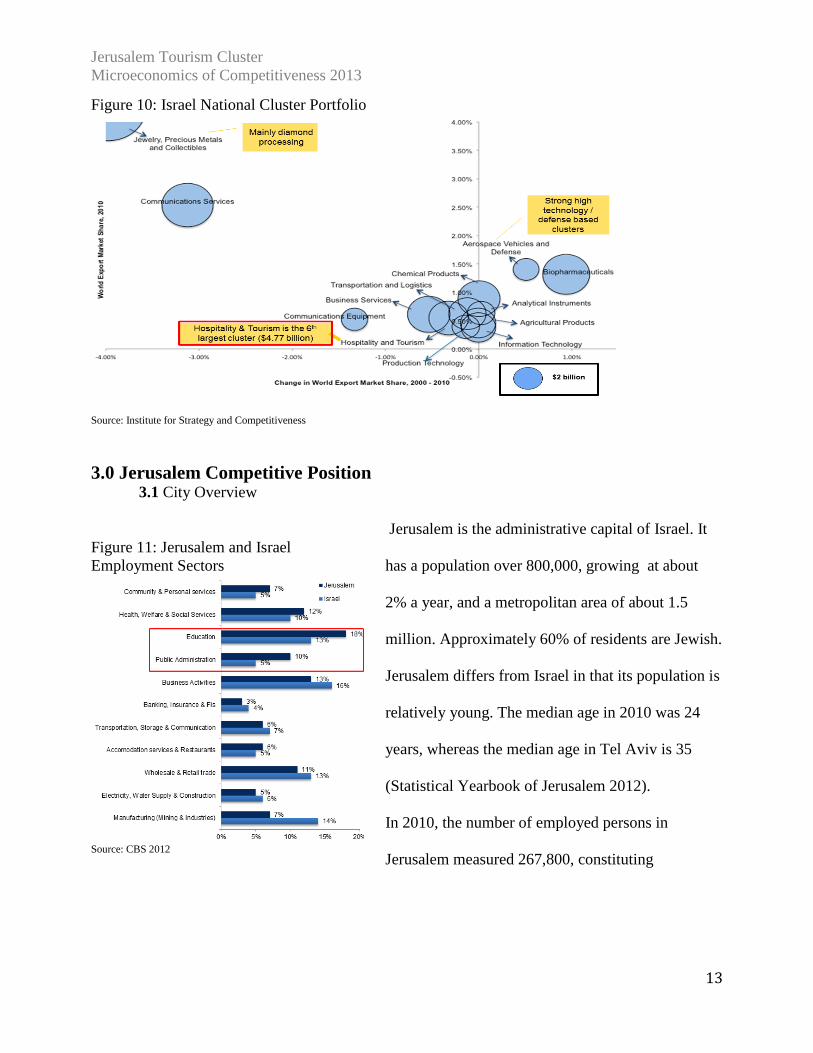
Related and supporting industries: Israel ranks #28 in 2011. Israel has a very developed R&D
institutions and high innovation culture. It faces challenges with maturing start-ups in the
economy and turning them into large scale corporations. The connection between various clusters
is good and coordination exists via a developed IFCs environment. Nevertheless, as seen in Figure
10, several major clusters of its diversified economy are losing share in the global economy. The
largest cluster due to diamond processing is ―Jewelry, Precious Metals and Collectibles‖ cluster
but it is losing its world export share. The two big emerging clusters are ‖Aerospace Vehicles and
Defense‖ due to strong high tech/defense based cluster and ―Biopharmaceuticals‖. ―Hospitality
and Tourism‖ cluster ranks 6th largest cluster in Israel and is worth 4.77 billion.
Jerusalem Tourism Cluster
Microeconomics of Competitiveness 2013
13
Figure 10: Israel National Cluster Portfolio
Source: Institute for Strategy and Competitiveness
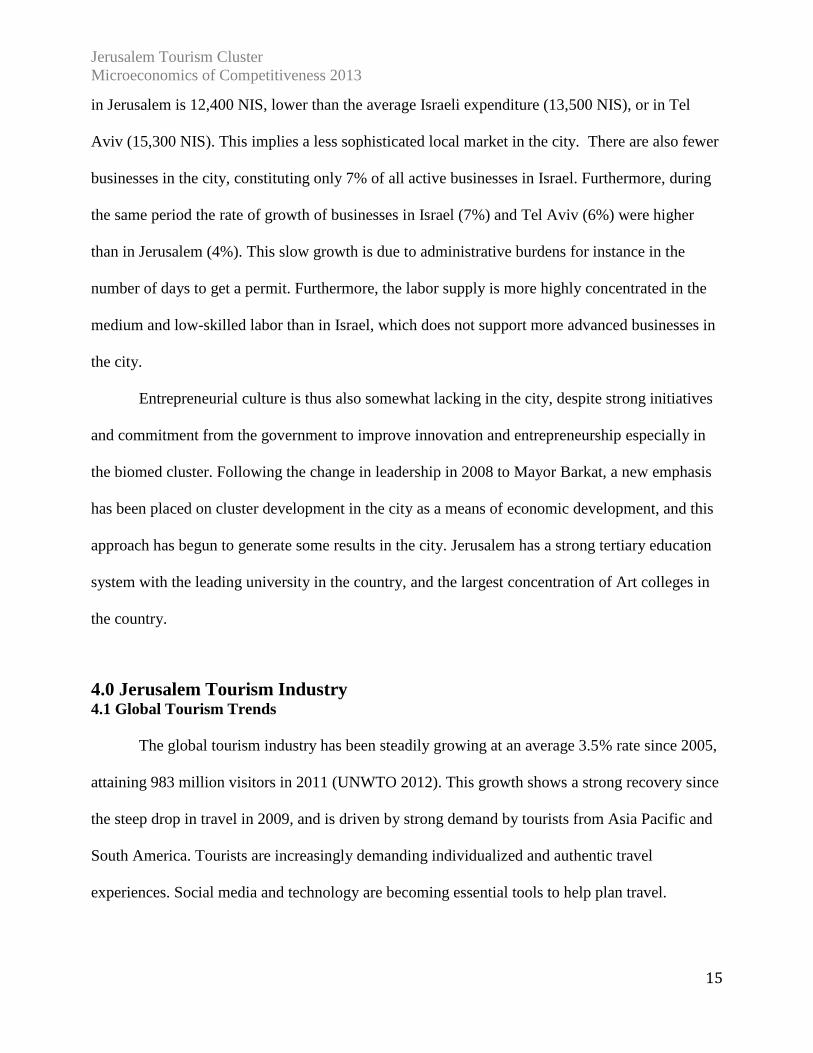
3.0 Jerusalem Competitive Position 3.1 City Overview
Jerusalem is the administrative capital of Israel. It
has a population over 800,000, growing at about
2% a year, and a metropolitan area of about 1.5
million. Approximately 60% of residents are Jewish.
Jerusalem differs from Israel in that its population is
relatively young. The median age in 2010 was 24
years, whereas the median age in Tel Aviv is 35
(Statistical Yearbook of Jerusalem 2012).
In 2010, the number of employed persons in
Jerusalem measured 267,800, constituting
Figure 11: Jerusalem and Israel
Employment Sectors
Source: CBS 2012

Jerusalem Tourism Cluster
Microeconomics of Competitiveness 2013
14
approximately 9% of the total number of employed in Israel. In 2010, the number of employed
persons in Jerusalem constituted 34% of the city‘s residents (267,800 employed and 788,100
residents).
3.2 Jerusalem Competitiveness
For the most part, Jerusalem‘s business environment is very similar to and faces the same
challenges as the nation. We point out some of the key differences in the following section.
Endowments: In terms of endowments, it has an even higher concentration of sites of
religious importance and over 3,000 years of religious and cultural history. The diversity and
proximity of those of many different religions and cultures is an asset for tourism in providing a
variety of cultural and culinary experiences.
Macroeconomic Competitiveness
Although Israel has a relatively high per capita
income, Jerusalem has one of the highest poverty
rates in Israel with over 34% of families in poverty.
In addition, the city has one of the lowest labor
participation rates at 48% (Jerusalem Institute for
Israel Studies (JIIS) and the Municipality of
Jerusalem 2012). Similar to the nation, there is much lower participation in the labor force by
Ultraorthodox men and Arab women, but this problem is further exacerbated in Jerusalem by
higher concentrations of these populations. The city‘s budget is balanced, but heavily depends
upon transfers from the national government, which makes it challenging to develop the resources
for large-scale projects such as infrastructure development.
Microeconomic Competitiveness: Microeconomic conditions in Jerusalem are also slightly
weaker than the nation over all. The average monthly expenditure for consumption per household
Figure 11: Labor Participation in 2010
Source: Jerusalem Institute for Israel Studies
Jerusalem Tourism Cluster
Microeconomics of Competitiveness 2013
15
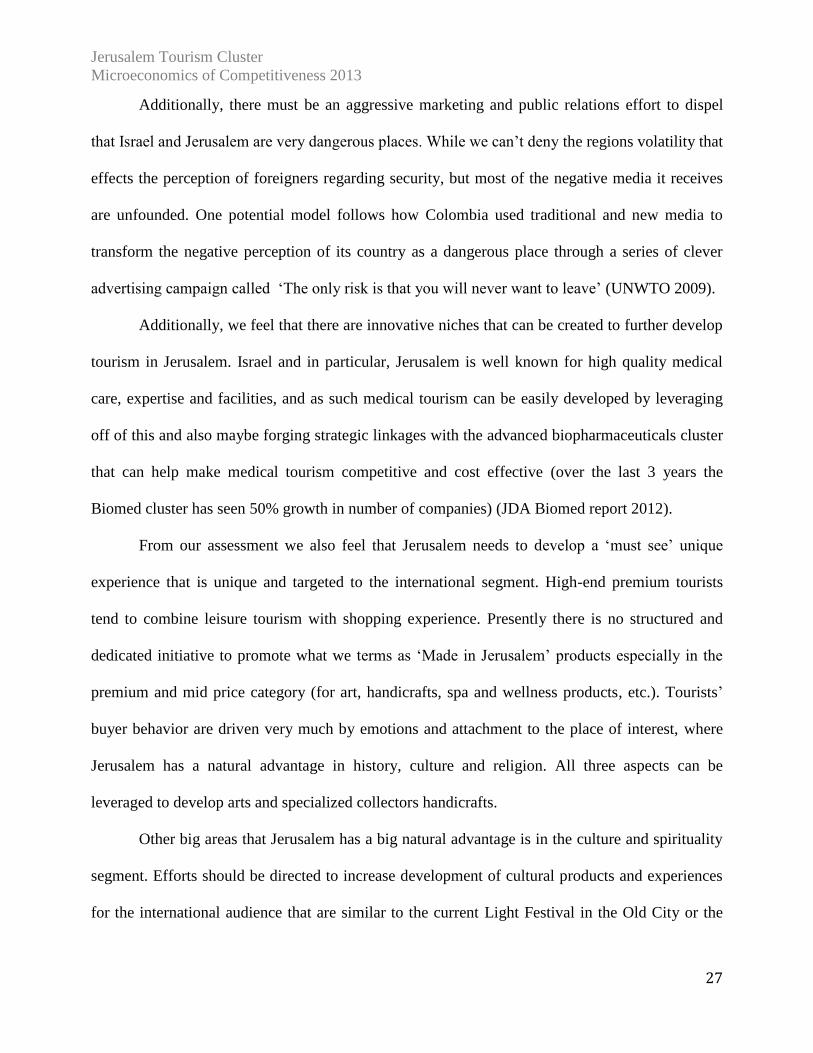
in Jerusalem is 12,400 NIS, lower than the average Israeli expenditure (13,500 NIS), or in Tel
Aviv (15,300 NIS). This implies a less sophisticated local market in the city. There are also fewer
businesses in the city, constituting only 7% of all active businesses in Israel. Furthermore, during
the same period the rate of growth of businesses in Israel (7%) and Tel Aviv (6%) were higher
than in Jerusalem (4%). This slow growth is due to administrative burdens for instance in the
number of days to get a permit. Furthermore, the labor supply is more highly concentrated in the
medium and low-skilled labor than in Israel, which does not support more advanced businesses in
the city.
Entrepreneurial culture is thus also somewhat lacking in the city, despite strong initiatives
and commitment from the government to improve innovation and entrepreneurship especially in
the biomed cluster. Following the change in leadership in 2008 to Mayor Barkat, a new emphasis
has been placed on cluster development in the city as a means of economic development, and this
approach has begun to generate some results in the city. Jerusalem has a strong tertiary education
system with the leading university in the country, and the largest concentration of Art colleges in
the country.
4.0 Jerusalem Tourism Industry 4.1 Global Tourism Trends
The global tourism industry has been steadily growing at an average 3.5% rate since 2005,
attaining 983 million visitors in 2011 (UNWTO 2012). This growth shows a strong recovery since
the steep drop in travel in 2009, and is driven by strong demand by tourists from Asia Pacific and
South America. Tourists are increasingly demanding individualized and authentic travel
experiences. Social media and technology are becoming essential tools to help plan travel.
Jerusalem Tourism Cluster
Microeconomics of Competitiveness 2013
16
4.2 Jerusalem Tourism Cluster Profile
Jerusalem has long been a destination for visitors because of the rich legacy of its religious
sites. It benefits from its worldwide recognition as a city of incomparable historical and religious
significance. Attracting millions of pilgrims, Jerusalem is a holy city for the world‘s three major
religions: Christianity, Judaism, and Islam. In 2012, 77% of all visitors to Israel go to Jerusalem
(about 2.5 million visitors out of 3.3 million to the country), illustrating the city‘s continuing
importance in the context of the country (CBS 2012). Despite the relatively small size of the
country and thus relative ease in visiting multiple cities, Jerusalem stands alone in the uniqueness
and value of its historic and cultural sites. Furthermore, Jerusalem is a point of entry for many
visitors to Israel, and is one of the most widely-known cities in the world, particularly compared to
others in Israel. Jerusalem has also benefitted from increased investment in recent years by a
tourism cluster initiative led by the mayor, which further distinguishes the city‘s value as a
tourism destination from others in Israel.
The most visited locations in the country are within the Old City of Jerusalem, including
the Wailing Wall, the Jewish Quarter, the Church of the Holy Sepulchre, and Via Dolorosa
(Ministry of Tourism 2012). Israel also has the highest number of museums per capita in the
world. Jerusalem‘s 60 museums received over 1.4 million visitors in 2010 (CBS 2012).
The majority of visitors to Israel come for personal reasons, whether for leisure (37%),
pilgrimage (28%), or visiting relatives (17%) (CBS 2012). The high number of pilgrimage
visitors translates into a high percentage of visitors as part of an organized tour or package deal,
which is contrary to the global trend of more individualized travel.
International visitors to Israel are largely from the US and European markets. The top five
countries, USA, Russia, France, UK, and Germany account for 65% of total visitors. Following
the elimination of the need for a visa to travel between Israel and Russia in 2008, the number of
Jerusalem Tourism Cluster
Microeconomics of Competitiveness 2013
17
Russian tourists has increased exponentially. The number of Russian visitors is now only second
to American visitors (CBS 2012).
Jerusalem has also been focusing on increasing the amount of business travel, particularly
through conventions. In 2010, there were only three conventions. In 2012, there were 10
conventions in the city which brought in 14,000 participants and 13.5 million NIS in revenue
(CBS 2012).
4.3 Cluster Performance
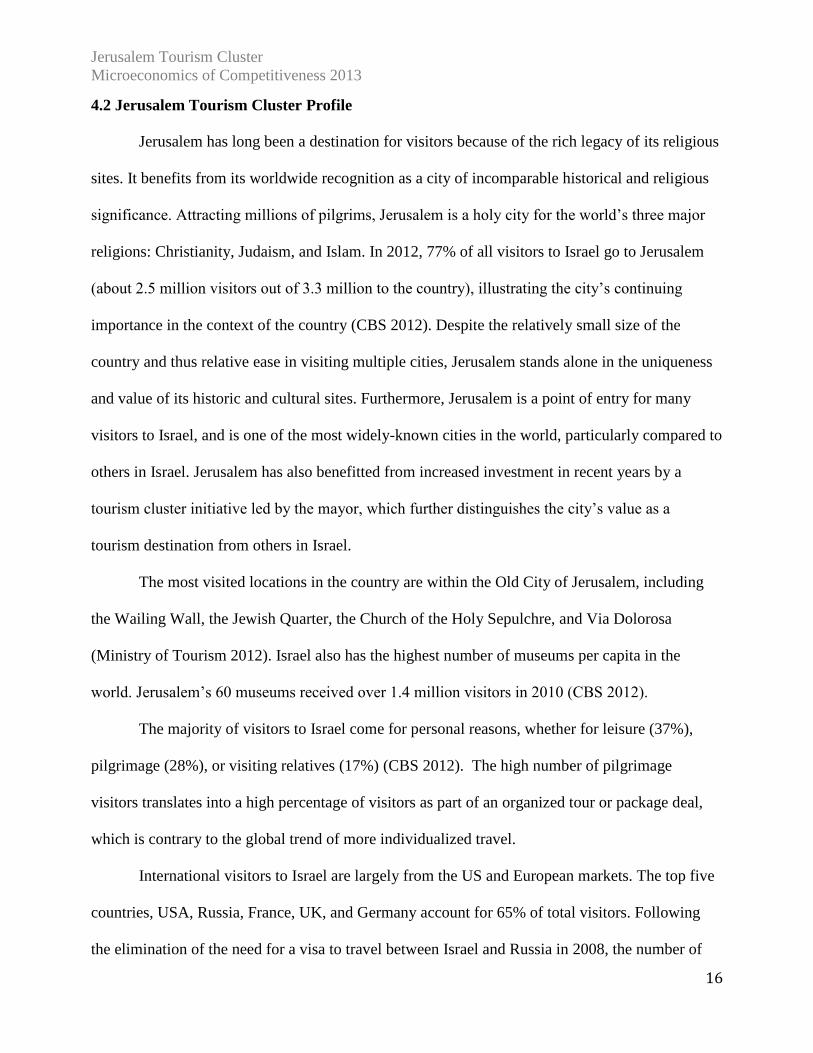
Despite the strong attractions in Jerusalem, tourism performance in the past two decades
has revealed major weaknesses of the tourism industry. Jerusalem underperforms compared to the
nation in terms of overnight stays in tourist hotels. The total number of nights stayed increased by
27% in Israel between 1995 and 2010, but only 17% in Jerusalem. The increase in overnight stays
in the nation largely stems from domestic demand growth, but domestic demand in Jerusalem
remained relatively flat over this 15-year period. In 2012, the number of domestic overnight stays
has increased slightly to 762,000 overnight domestic stays in Jerusalem.
Figure 12: Overnight Stays in Israel and Jerusalem
Source: CBS 2012
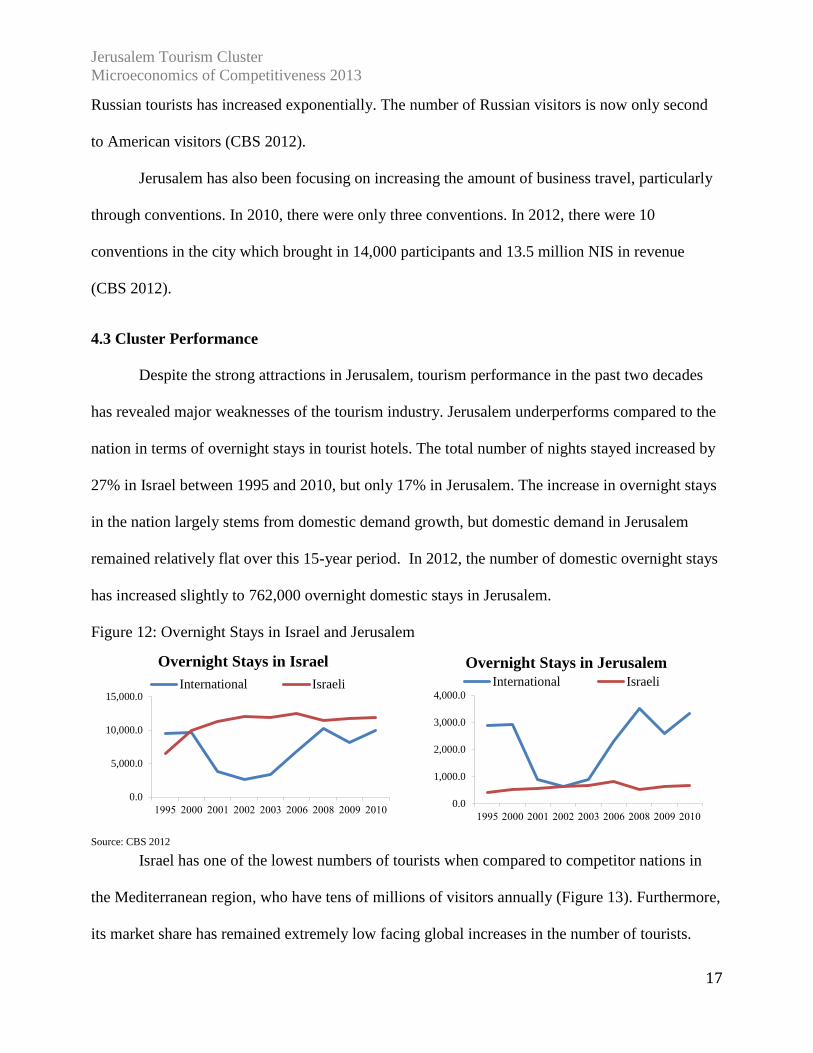
Israel has one of the lowest numbers of tourists when compared to competitor nations in
the Mediterranean region, who have tens of millions of visitors annually (Figure 13). Furthermore,
its market share has remained extremely low facing global increases in the number of tourists.
0.0
5,000.0
10,000.0
15,000.0
1995 2000 2001 2002 2003 2006 2008 2009 2010
Overnight Stays in Israel
International Israeli
0.0
1,000.0
2,000.0
3,000.0
4,000.0
1995 2000 2001 2002 2003 2006 2008 2009 2010
Overnight Stays in Jerusalem
International Israeli
Jerusalem Tourism Cluster
Microeconomics of Competitiveness 2013
18
Jerusalem also has much lower tourists than similar cities of religious significance. For example,
the Vatican Museums received 5 million visitors in 2011, and the city of Rome had over 10
million visitors compared to Jerusalem‘s 1.4 million museum visitors and 2.5 million tourists to
the city (Wooden 2012).
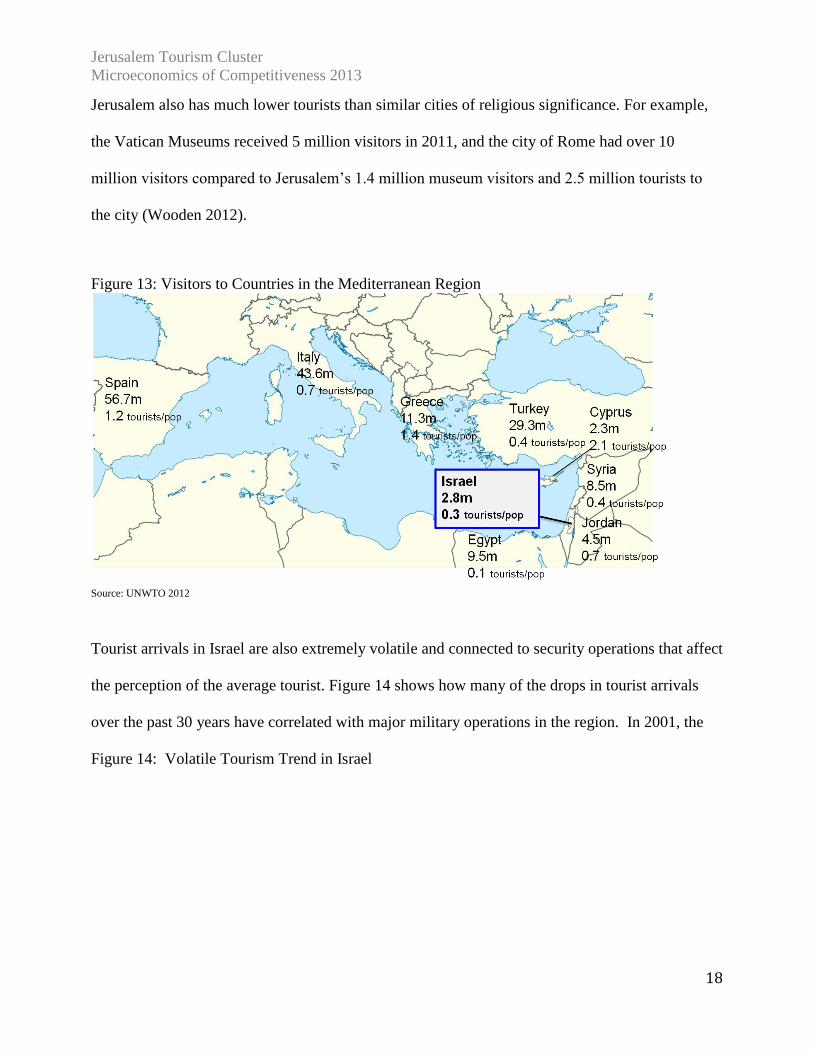
Tourist arrivals in Israel are also extremely volatile and connected to security operations that affect
the perception of the average tourist. Figure 14 shows how many of the drops in tourist arrivals
over the past 30 years have correlated with major military operations in the region. In 2001, the
Figure 13: Visitors to Countries in the Mediterranean Region
Source: UNWTO 2012
Figure 14: Volatile Tourism Trend in Israel
Jerusalem Tourism Cluster
Microeconomics of Competitiveness 2013
19
Second Intifada led to one of
the lowest levels of foreign
tourists in Israel, dropping from
2.4 million visitors in 2000 to
0.9 million visitors in 2002.
Nevertheless, tourism has
steadily grown since and
reached 2000 levels by 2008.
Tourism contributes only about 2.5% to the national GDP (21.7 billion NIS), a figure much
lower than its competitor nations. 3% of all employment in Israel is in the tourism industry. In
Jerusalem, the number of tourism-related jobs is about 15,000 (5.5% of the employees in the city)
(Jerusalem Institute for Israel Studies (JIIS) 2013) an 18% growth since 2008. For comparison, the
city of Eilat still has nearly twice as many tourism jobs as Jerusalem.
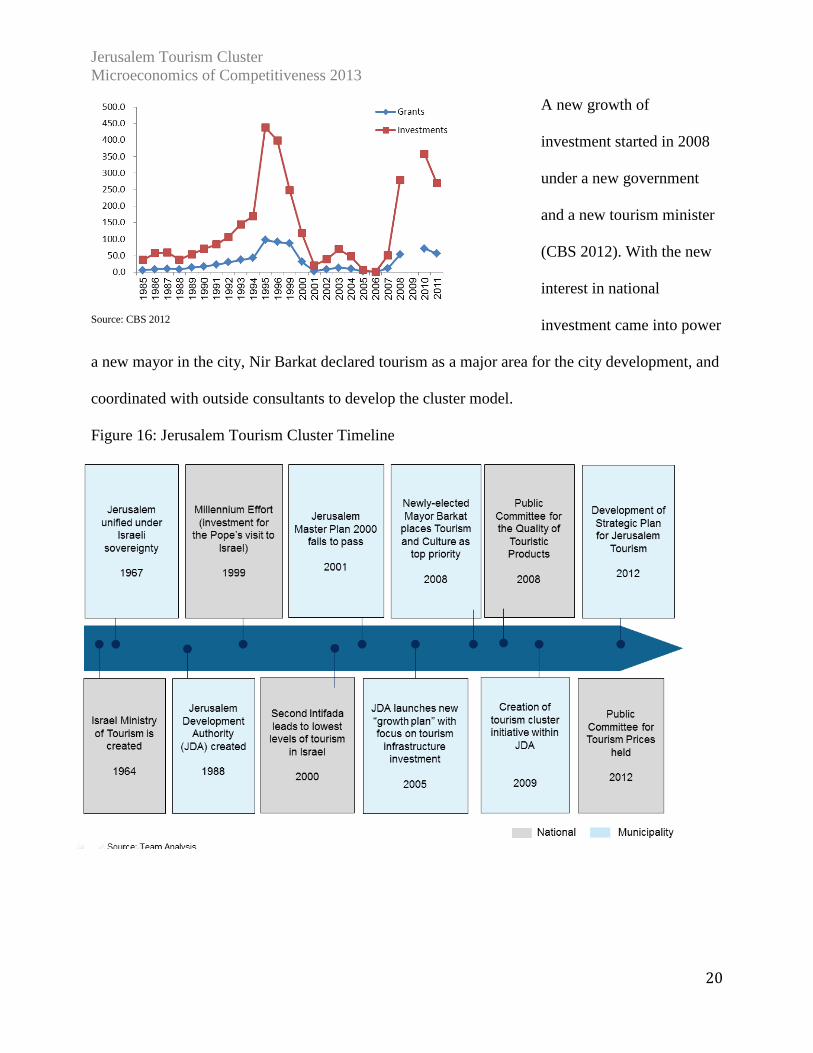
4.4 Cluster History and Evolution
A new era in the development of tourism in Jerusalem started after 1967 when the city was
unified under Israeli rule and open access was granted to all holy sites. Tourism was a relatively
low priority for the city for many years, facing geopolitical tensions. The Jerusalem Development
Authority, created in 1988, now is the lead agency for tourism development in the city. The mid-
1990s saw a spike in investment in preparation of the 50th
anniversary of Israel in 1998 and the
millennium year visit of the Pope. Unfortunately, the benefit of these investments was largely in
vain due to the second uprising and terror wave in 2001 that have lowered tourism dramatically
and with it investments.
Source: CBS 2012
Figure 15: Government Investments and Grants in Tourism
Jerusalem Tourism Cluster
Microeconomics of Competitiveness 2013
20
A new growth of
investment started in 2008
under a new government
and a new tourism minister
(CBS 2012). With the new
interest in national
investment came into power
a new mayor in the city, Nir Barkat declared tourism as a major area for the city development, and
coordinated with outside consultants to develop the cluster model.
Figure 16: Jerusalem Tourism Cluster Timeline
Source: CBS 2012
Jerusalem Tourism Cluster
Microeconomics of Competitiveness 2013
21
5.0 Jerusalem Tourism Cluster Analysis
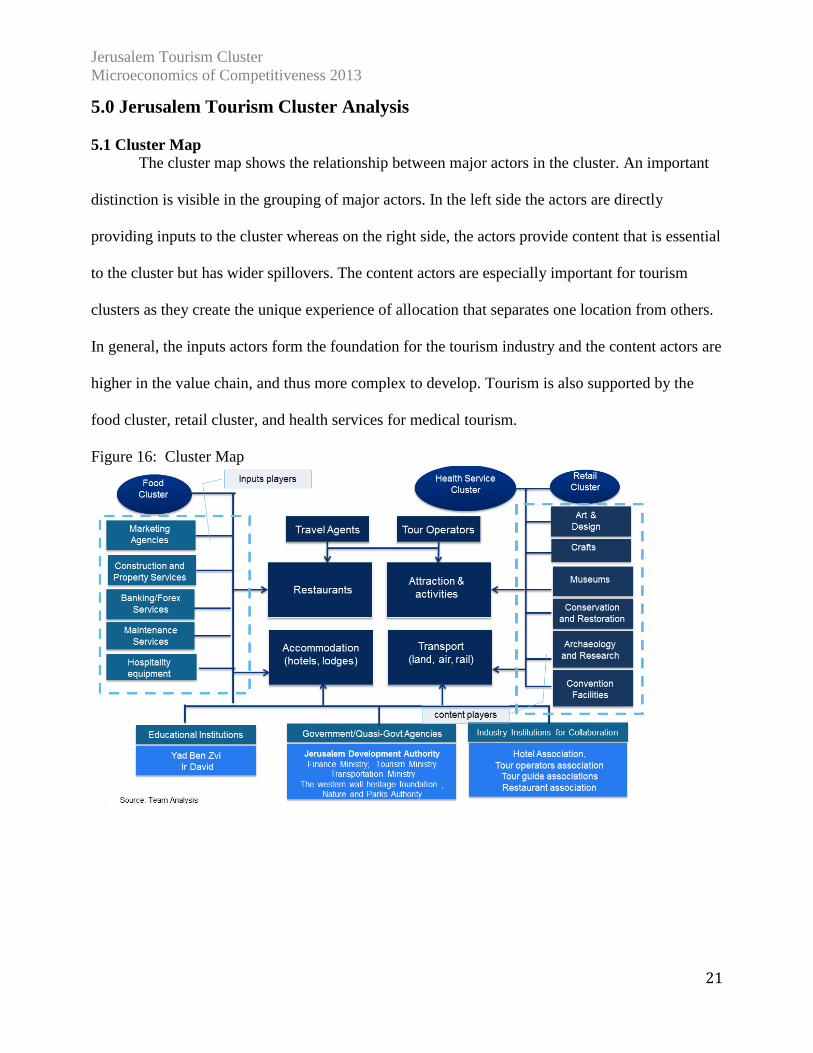
5.1 Cluster Map
The cluster map shows the relationship between major actors in the cluster. An important
distinction is visible in the grouping of major actors. In the left side the actors are directly
providing inputs to the cluster whereas on the right side, the actors provide content that is essential
to the cluster but has wider spillovers. The content actors are especially important for tourism
clusters as they create the unique experience of allocation that separates one location from others.
In general, the inputs actors form the foundation for the tourism industry and the content actors are
higher in the value chain, and thus more complex to develop. Tourism is also supported by the
food cluster, retail cluster, and health services for medical tourism.
Figure 16: Cluster Map
Jerusalem Tourism Cluster
Microeconomics of Competitiveness 2013
22
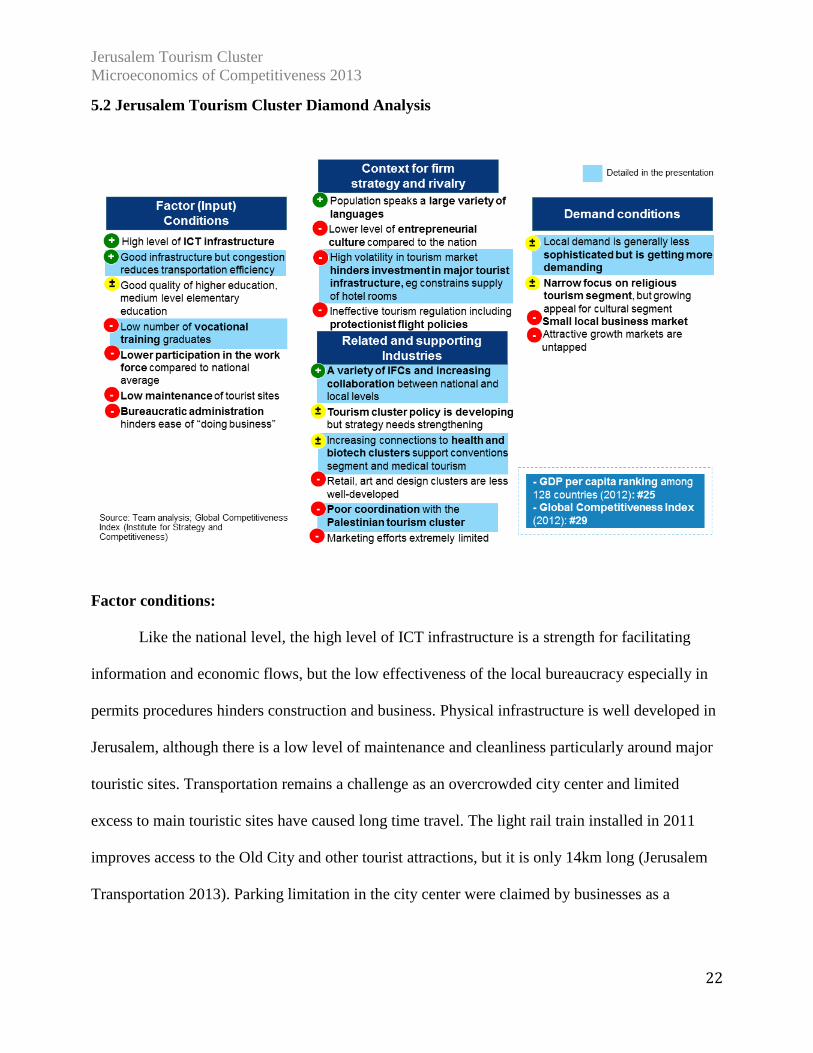
5.2 Jerusalem Tourism Cluster Diamond Analysis
Factor conditions:
Like the national level, the high level of ICT infrastructure is a strength for facilitating
information and economic flows, but the low effectiveness of the local bureaucracy especially in
permits procedures hinders construction and business. Physical infrastructure is well developed in
Jerusalem, although there is a low level of maintenance and cleanliness particularly around major
touristic sites. Transportation remains a challenge as an overcrowded city center and limited
excess to main touristic sites have caused long time travel. The light rail train installed in 2011
improves access to the Old City and other tourist attractions, but it is only 14km long (Jerusalem
Transportation 2013). Parking limitation in the city center were claimed by businesses as a
Jerusalem Tourism Cluster
Microeconomics of Competitiveness 2013
23
constraint on development. An ambitious plan to expand the train and road system was approved
in 2012.
Low labor force participation and a lower quality of basic education raise concerns about
human capital availability in the city. Vocational education is an area of particular concern. Only
32% of Israeli high school students attend vocational education, compared with 60% and more in
western European countries (Knesset Research Center. 2013). In the tourism field, several types of
institutions exist such as 8 culinary schools; 9 tour guides programs; 5 colleges and universities
with tourism skills programs; 7 tour operators programs; 4 hotel management programs; 2
general tourism schools. The Ministry of Tourism also provides funding supporting research
certification for licensed tour guides in Israel. However, with few graduates from these programs,
there is a lack of trained labor appropriate for tourism. Furthermore, it is difficult to retain highly-
skilled labor in the industry, as turnover is also impacted by the volatility of tourism. One major
hotel manager and consultant claimed ―there can be no long-term planning in the hotel industry.
People will stay for four years, then leave and never return.‖1
Context for firm strategy and rivalry
The economic make-up of the city, with heavy concentration of activities related to
government and administration, has created a smaller business environment that is less
competitive and has prevented the entrepreneurial culture in Jerusalem from reaching the same
levels as the nation.
Furthermore the volatility of the market and high level of regulations have constrained the supply
of hotel rooms in the city. Regulations that require additional employees such as kosher inspectors
as well as security guards, deter investors, particularly from abroad, and also raise costs.
1 Interview with Shlomo Preisach
Jerusalem Tourism Cluster
Microeconomics of Competitiveness 2013
24
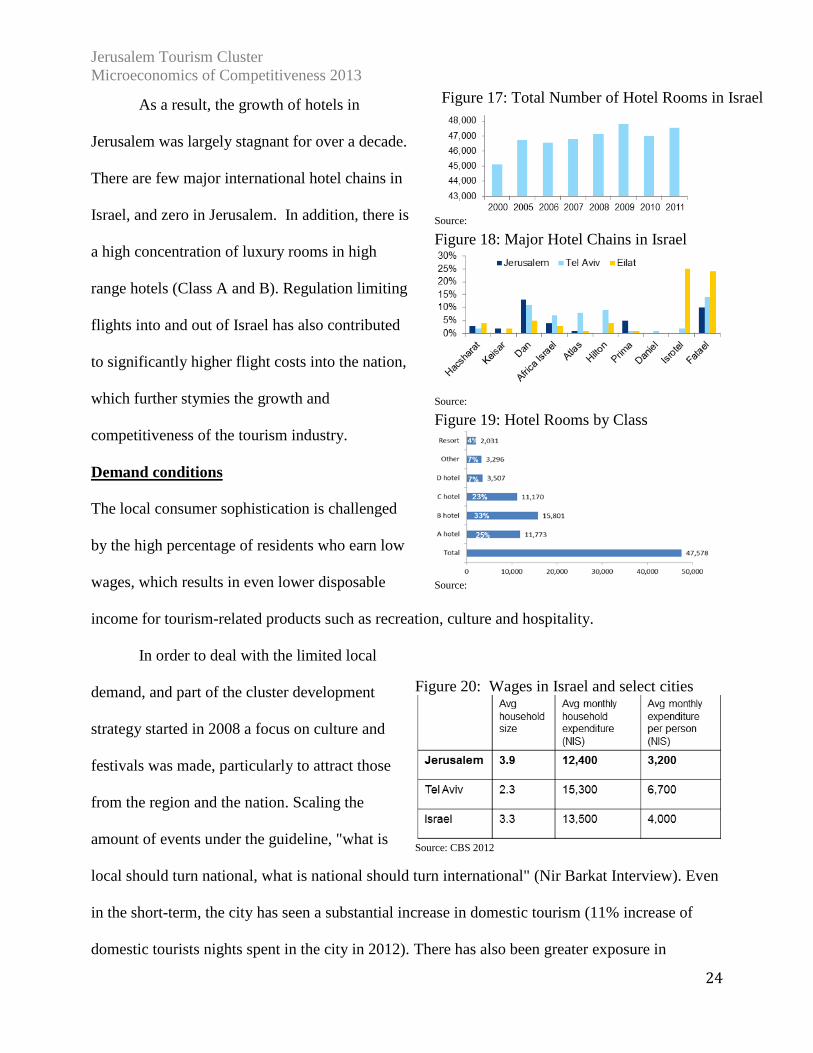
As a result, the growth of hotels in
Jerusalem was largely stagnant for over a decade.
There are few major international hotel chains in
Israel, and zero in Jerusalem. In addition, there is
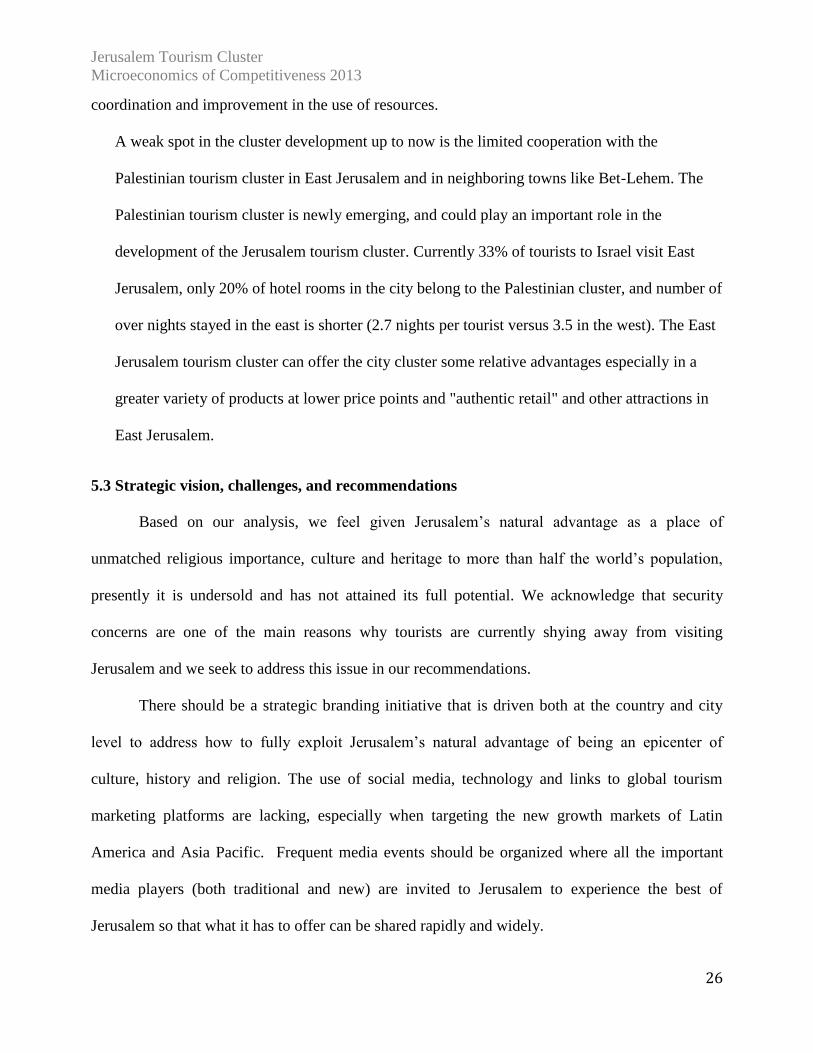
a high concentration of luxury rooms in high
range hotels (Class A and B). Regulation limiting
flights into and out of Israel has also contributed
to significantly higher flight costs into the nation,
which further stymies the growth and
competitiveness of the tourism industry.
Demand conditions
The local consumer sophistication is challenged
by the high percentage of residents who earn low
wages, which results in even lower disposable
income for tourism-related products such as recreation, culture and hospitality.
In order to deal with the limited local
demand, and part of the cluster development
strategy started in 2008 a focus on culture and
festivals was made, particularly to attract those
from the region and the nation. Scaling the
amount of events under the guideline, "what is
local should turn national, what is national should turn international" (Nir Barkat Interview). Even
in the short-term, the city has seen a substantial increase in domestic tourism (11% increase of
domestic tourists nights spent in the city in 2012). There has also been greater exposure in
Source:
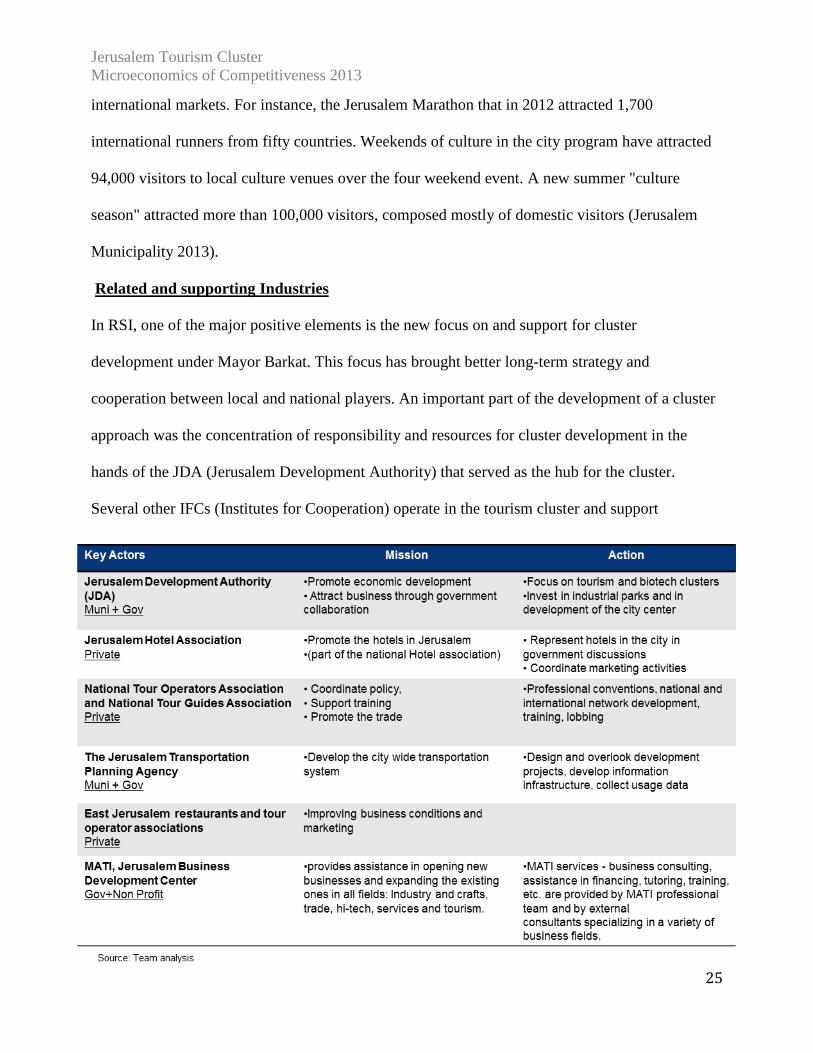
Figure 18: Major Hotel Chains in Israel
Source:
Figure 19: Hotel Rooms by Class
Source:
Figure 20: Wages in Israel and select cities
Source: CBS 2012
Figure 17: Total Number of Hotel Rooms in Israel
Jerusalem Tourism Cluster
Microeconomics of Competitiveness 2013
25
international markets. For instance, the Jerusalem Marathon that in 2012 attracted 1,700
international runners from fifty countries. Weekends of culture in the city program have attracted
94,000 visitors to local culture venues over the four weekend event. A new summer "culture
season" attracted more than 100,000 visitors, composed mostly of domestic visitors (Jerusalem
Municipality 2013).
Related and supporting Industries
In RSI, one of the major positive elements is the new focus on and support for cluster
development under Mayor Barkat. This focus has brought better long-term strategy and
cooperation between local and national players. An important part of the development of a cluster
approach was the concentration of responsibility and resources for cluster development in the
hands of the JDA (Jerusalem Development Authority) that served as the hub for the cluster.
Several other IFCs (Institutes for Cooperation) operate in the tourism cluster and support
Jerusalem Tourism Cluster
Microeconomics of Competitiveness 2013
26
coordination and improvement in the use of resources.
A weak spot in the cluster development up to now is the limited cooperation with the
Palestinian tourism cluster in East Jerusalem and in neighboring towns like Bet-Lehem. The
Palestinian tourism cluster is newly emerging, and could play an important role in the
development of the Jerusalem tourism cluster. Currently 33% of tourists to Israel visit East
Jerusalem, only 20% of hotel rooms in the city belong to the Palestinian cluster, and number of
over nights stayed in the east is shorter (2.7 nights per tourist versus 3.5 in the west). The East
Jerusalem tourism cluster can offer the city cluster some relative advantages especially in a
greater variety of products at lower price points and "authentic retail" and other attractions in
East Jerusalem.
5.3 Strategic vision, challenges, and recommendations
Based on our analysis, we feel given Jerusalem‘s natural advantage as a place of
unmatched religious importance, culture and heritage to more than half the world‘s population,
presently it is undersold and has not attained its full potential. We acknowledge that security
concerns are one of the main reasons why tourists are currently shying away from visiting
Jerusalem and we seek to address this issue in our recommendations.
There should be a strategic branding initiative that is driven both at the country and city
level to address how to fully exploit Jerusalem‘s natural advantage of being an epicenter of
culture, history and religion. The use of social media, technology and links to global tourism
marketing platforms are lacking, especially when targeting the new growth markets of Latin
America and Asia Pacific. Frequent media events should be organized where all the important
media players (both traditional and new) are invited to Jerusalem to experience the best of
Jerusalem so that what it has to offer can be shared rapidly and widely.
Jerusalem Tourism Cluster
Microeconomics of Competitiveness 2013
27
Additionally, there must be an aggressive marketing and public relations effort to dispel
that Israel and Jerusalem are very dangerous places. While we can‘t deny the regions volatility that
effects the perception of foreigners regarding security, but most of the negative media it receives
are unfounded. One potential model follows how Colombia used traditional and new media to
transform the negative perception of its country as a dangerous place through a series of clever
advertising campaign called ‗The only risk is that you will never want to leave‘ (UNWTO 2009).
Additionally, we feel that there are innovative niches that can be created to further develop
tourism in Jerusalem. Israel and in particular, Jerusalem is well known for high quality medical
care, expertise and facilities, and as such medical tourism can be easily developed by leveraging
off of this and also maybe forging strategic linkages with the advanced biopharmaceuticals cluster
that can help make medical tourism competitive and cost effective (over the last 3 years the
Biomed cluster has seen 50% growth in number of companies) (JDA Biomed report 2012).
From our assessment we also feel that Jerusalem needs to develop a ‗must see‘ unique
experience that is unique and targeted to the international segment. High-end premium tourists
tend to combine leisure tourism with shopping experience. Presently there is no structured and
dedicated initiative to promote what we terms as ‗Made in Jerusalem‘ products especially in the
premium and mid price category (for art, handicrafts, spa and wellness products, etc.). Tourists‘
buyer behavior are driven very much by emotions and attachment to the place of interest, where
Jerusalem has a natural advantage in history, culture and religion. All three aspects can be
leveraged to develop arts and specialized collectors handicrafts.
Other big areas that Jerusalem has a big natural advantage is in the culture and spirituality
segment. Efforts should be directed to increase development of cultural products and experiences
for the international audience that are similar to the current Light Festival in the Old City or the
Jerusalem Tourism Cluster
Microeconomics of Competitiveness 2013
28
Israel Museum. Products associated with spirituality immersion e.g. mini half day camps, spa and
wellness packages that focus on spiritual enlightenment can also be developed.
The following are other specific challenges and recommendations based on the categories
of cluster analysis.
Factor Conditions
Challenge no 1: Physical infrastructure in Jerusalem is underdeveloped and needs additional
maintenance
Recommendations : (Responsible party: National / Local Priority :1)
The national and state government must continue to invest in the development and management of
public transportation systems. There is also an immediate need to raise the quality of the taxi
services within Jerusalem. There must also be investments to improve the signage in the tourist
areas especially in English / multilingual (if possible). This can make it easier to tourists to move
around the city independently, which is what most of the large segments of tourists want.
Challenge no 2: Tourist areas are not well maintained
Recommendations: (Responsible party: Local Priority: 1)
The state government should immediately invest in improving the general maintenance of popular
tourist locations. There must be clear accountabilities and again necessary investments to ensure
cleanliness is maintained at acceptable levels at all times. Launch awareness campaigns and
impose steep fines to deter people from dirtying the tourist sites.
Challenge no 3: Low efficiency of local bureaucracy
Overall the local government is inefficient and riddled with unnecessary processes and procedures.
Recommendations: (Responsible party: Local Priority: 2)
Jerusalem Tourism Cluster
Microeconomics of Competitiveness 2013
29
To drastically improve by simplifying policies, procedures and processes that can cut the existing
red tape especially in the approvals of building permits and business permits that directly affect
the tourism cluster. Use electronic platforms where ever possible.
Challenge no 4: Need for qualified human capital in order to attract premium class tourists
Recommendations: (Responsible party: National / Local Priority: 2)
Develop state sponsored and targeted vocational training programs in various sectors. And support
job placement and integration into the work force. Local vocational schools / skills training center
should develop practical, effective and cost effective training programs that can develop
specialized skills that is needed throughout the tourism value chain.
Demand conditions
Challenge no 5 : Volatility in the region
The unresolved Israeli – Palestinian conflict and the geopolitical instability in the Middle East
region creates perception of great volatility in the region and in Israel
Recommendations: (Responsible party: National / Local Priority: 2)
Providing a recommendation on the issue of the Palestinian Israeli conflict is beyond the scope of
this report. We do believe that increased economic cooperation will have important effects on
improving political conditions in the region.
There must be a strategic and concerted effort to use both traditional and social media
platforms to communicate the ‗real‘ security / volatility situation in Jerusalem, Israel and the
region. Presently there isn‘t much positive publicity especially in the social media platforms.
Engagement with the popular travel and tour web sites e.g. Tripadvisor, Expedia, Travelocity,
BBC Travel and such must be leveraged further to carry positive news and to reflect the ‗reality‘
of the situation in a clearer and more transparent manner.
Jerusalem Tourism Cluster
Microeconomics of Competitiveness 2013
30
Challenge no 6 : Small local market
Recommendations: (Responsible party: Local Priority: 2)
Invest in development of night activities that will increase night stays and spending in local
business. Also invest in formation of BID (Business Improvement Districts) that will improve the
attraction of the retail and culinary clusters.
Context for firm strategy and rivalry
Challenge no 7 : Capital investment in tourism related infrastructure is very low
Capital investments in tourism related infrastructure is considered very high risk due to security
concerns and prohibits entrepreneurs to invest and develop much needed infrastructure.
Recommendations: (Responsible party: National Priority: 2)
Work with insurance companies through a private public partnership to provide some kind of
safety net insurance that can spur private and public capital investment in tourism.
Challenge no 8 : Limited supply of hotel rooms across different price segments
Recommendations: (Responsible party: National / Local / Business Priority: 1)
There must be a concerted effort to increase the number of hotel rooms across all price ranges.
This can be done through public private capital investments mechanism and coupled with reducing
bureaucracy and relooking at processes and policies that over regulate and are burdensome.
Another way of dealing with the problem is through better cooperation with the Palestinian
tourism cluster that can produce cheaper hotel rooms.
Challenge no 9 : Low level of local competition in air transportation
The national carrier ‗Al El‘ has a natural monopoly and this has led to prices for flights to and
from Israel to be less competitive and relatively expensive.
Recommendations: (Responsible party: National Priority: 1)
Jerusalem Tourism Cluster
Microeconomics of Competitiveness 2013
31
Israel should advance the ―open sky‖ agreement with the EU so that flight and package prices to
Israel and be competitively priced. On the 21st of April, the Israeli government approved the "open
sky" agreement, but implementation will determine the effect on the price levels.
Related and supporting industries
Challenge no 10 : Supply of high quality complementary products are lacking
There is a lack of supply of high quality complementary products ie. shopping (especially local
arts and crafts), culinary, and other recreation.
Recommendations: (Responsible party: Local / Business Priority: 1)
Work with local businesses to develop the retail and culinary and art & design clusters. This is
also an opportunity to establish relationship with the Palestinian tourism cluster which has a low
cost arts and crafts expertise.
6.0 Acknowledgements
We would like to express our deepest gratitude to Professor Michael Porter and Professor
Hirotaka Takeuchi for making each class to be informative, engaging and thought provoking, and
our gratitude to Professor Jorge Ramirez-Vallejo for his expert guidance and his commitment to
our project. We would also like to thank Katie Schlepp, Jem Hudson and Rich Bryden for their
support.
We also deeply appreciate the participation of the following distinguished individuals in
interviews for our research:
• Stas Misejnikov - Israel Minister of Tourism (2009-2012)
• Nir Barkat – Mayor of Jerusalem (2008- present)
• Ilanit Melchior - Tourism Director in the Jerusalem Development Authority
Jerusalem Tourism Cluster
Microeconomics of Competitiveness 2013
32
• Gil Rivosh - Head of Strategy, Jerusalem Municipality
• Dvir Kahana - Head of Jerusalem Tourism Master Plan Project (2012)
• Yael Mevorach - Head of Tourism team, Budget Department, Ministry of Finance
• Shlomo Preisach - Hotel Manager, and consultant
• Amy Etgar - CEO tour operator organization in Israel
• Arie Somer - GM, Hotel Association in Jerusalem
• Noam Shoval - Head of the Geography department, Hebrew University in Jerusalem
• Alex Krieger- Professor of Urban Planning and Design, Harvard GSD
• Karen Lee Bar-Sinai - Loeb Fellow, Architect with SAYA
7.0 Bibliography
Ayad, Tamer Hamdy Abd El Latif, and Ye Shujun. 2013. ―Local People Attitudes Toward Social,
Economic and Environmental Impacts of Tourism in Siwa Oasis.‖ Accessed May 9.
http://www.lsj-marsland.com/uploadfiles/AB118420130312103429/B00388-lsj-part20130312.pdf.
Bank Of Israel. 2013. ―Bank of Israel Annual Report 2012.‖ Accessed May 9.
http://www.boi.org.il/en/NewsAndPublications/RegularPublications/Documents/Doch2012/chap-
1.pdf.
Bloomberg. 2013. ―Israel News - Bloomberg.‖ Accessed May 9.
http://topics.bloomberg.com/israel/.
Central bureau of statistics israel (cbs). 2013. ― תיירות - ענפי הכלכלה - הלשכה המרכזית לסטטיסטיקה
.Accessed May 9 ‖.ושירותי הארחה
Central Bureau of Statistics (2012). ―Tourism in Israel 1990-2011‖
http://www.cbs.gov.il/reader/?MIval=cw_usr_view_SHTML&ID=336.
Choshen, Maya. 1998. Jerusalem on the Map: Basic Facts and Trends, 1967-1996. Jerusalem
Institute for Israel Studies.
CIA. 2013. ―CIA - The World Factbook.‖ Accessed May 9.
https://www.cia.gov/library/publications/the-world-factbook/geos/is.html.
Jerusalem Tourism Cluster
Microeconomics of Competitiveness 2013
33
Finance Ministry. 2012. ―Israel Economy Overview.‖
Harvard Business School. 2013. ―Harvard Business School - Institute for Strategy and
Competitiveness.‖ Accessed May 9. http://www.isc.hbs.edu/.
Harvard Business School. 2012. ―Harvard Business School - Institute for Strategy and
Competitiveness.‖ Competitiveness index 2012
Greenfield-Gilat, Yehuda, Bar-Sinai, Karen Lee, Farkas, Chen (2010). ―The Border Regime for
Jerusalem in Peace: An Israeli - Palestinian proposal‖.
IPK. 2013. ―IPK International: World Travel Monitor, Tourism
Research/Marketing/Consulting/Masterplanning.‖ Accessed May 9.
http://www.ipkinternational.com/en/home/.
Israel Ministry of Tourism (2012). Inbound Tourism Survey, accessed
http://www.imra.org.il/story.php3?id=59516.
Jerusalem Development Authority. 2012. ―Jerusalem Tourism Report 2012.‖
Jerusalem Development Authority. 2012. ―Jerusalem BioMed Report 2012.‖
Jerusalem Institute for Israel Studies (JIIS) . 2013. ―The Jerusalem Institute for Israel Studies ::
Statistical Yearbook :: 2013 Edition.‖ Accessed May 9. http://jiis.org/?cmd=statistic.477.
Jerusalem Municipality. 2013. ― יריית ירושליםהאתר הרשמי של ע .‖ Accessed May 9.
http://www.jerusalem.muni.il/jer_main/defaultnew.asp?lng=1.
Jerusalem Transportation. 2013. ―ראשי | Jerusalem Transportation.‖ Accessed May 9.
http://www.jet.org.il/Web/En/Default.aspx.

Jerusalem Tourism Cluster
Microeconomics of Competitiveness 2013
34
Kershner, Isabel. The New York Times. 3 31, 2013.
http://www.nytimes.com/2013/04/01/world/middleeast/israel-turns-on-natural-gas-flow-at-
offshore-site.html?_r=0 (accessed 5 3, 2013).
Knesset Research Center. 2013. ―Vocational Training in Israel Compared to the World.‖ Accessed
May 9. http://www.knesset.gov.il/mmm/data/pdf/m02141.pdf.
Nathanson, Roby. 2012. Growth, Economic Policies and Employment Linkages: Israel. Working
paper. http://www.ilo.org/employment/Whatwedo/Publications/working-
papers/WCMS_174581/lang--en/index.htm.
OECD. 2011. OECD Science, Technology and Industry Scoreboard 2011. Paris: Organisation for
Economic Co-operation and Development. http://www.oecd-
ilibrary.org/content/book/sti_scoreboard-2011-en.
———. 2013. ―OECD Better Life Index.‖ OECD Better Life Index. Accessed May 9.
http://oecdbetterlifeindex.org/.
OECD. Israel. 12 2, 2012. http://www.oecd.org/israel/ (accessed 5 3, 2013).
Senor, Dan, and Saul Singer. 2011. Start-up Nation: The Story of Israel’s Economic Miracle.
Reprint. Twelve.
Taub Center. 2013a. ―Gridlock on the Roads and in Israel‘s Priorities « Taub Center.‖ Accessed
May 9. http://taubcenter.org.il/index.php/publications/e-bulletin/gridlock-on-the-roads/lang/en/.
———. 2013b. ―Transportation Eng _11 12 19_ E2011_Transportation_Mobility.pdf.‖ Accessed
May 9. http://taubcenter.org.il/tauborgilwp/wp-
content/uploads/E2011_Transportation_Mobility.pdf.
The Economist. 2013. ―The Economist Intelligence Unit,Israel Economy, Politics and GDP
Growth Summary.‖ Accessed May 9. http://country.eiu.com/Israel.

Jerusalem Tourism Cluster
Microeconomics of Competitiveness 2013
35
The Israel Export and International Cooperation Institute. ―Development and Trends in Israeli
Export.‖ May 2012. http://www.export.gov.il/uploadfiles/06_2012/ieici-
reviewdevelopmentstrendsisraelexportsq1-2012.pdf.
UNDP. 2013. ―International Human Development Indicators - UNDP.‖ Accessed May 9.
http://hdrstats.undp.org/en/countries/profiles/ISR.html.
UNWTO. "Colombia: Back on the Map of World Tourism." 2009.
UNWTO .2012. World Tourism Highlights 2012 Edition.
USPTO. 2013. ―Patents By Country, State, and Year - All Patent Types (December 2012).‖
Accessed May 9. http://www.uspto.gov/web/offices/ac/ido/oeip/taf/cst_all.htm.
Wooden, Cindy (2012). Catholic News Service. ―Number of Visitors to Vatican Museums tops 5
million‖.
World Bank. 2013. ―Israel | Data.‖ Accessed May 9. http://data.worldbank.org/country/israel.