jibu hmt working capital management project
TRANSCRIPT

A STUDY ON WORKING CAPITAL MANAGEMENT IN
HMT MACHINE TOOLS, KALAMASSERY
Project Report submitted by
JIBU AB
REGISTER No: 0113514029
Of
NOORUL ISLAM CENTRE FOR HIGHER EDUCATION
A TRAINING REPORT
Submitted to the
FACULTY OF MANAGEMENT STUDIES
In partial fulfillment of the requirements for the award of the degree
Of
MASTER OF BUSINESS ADMINISTRATION
Noorul Islam Centre for Higher Education
Noorul Islam University, Kumaracoil
May- 2015

NOORUL ISLAM CENTRE FOR HIGHER EDUCATION
(declared as deemed-to-be university under section 3 of the UGC act 1956)
NOORUL ISLAM UNIVERSITY
Kumaracoil, Thuckalay, Kanyakumari District, Tamilnadu -629 175
Website: www.niuniv.com; email: [email protected]
Ms. A.V ROOPA
Assistant Professor,
School Of management
BONAFIDE CERTIFICATE
Certified that this training report titles “A STUDY ON WORKING CAPITAL
MANAGEMENT ON HMT MACHINE TOOLS, KALAMASSERY” is the bonafide work of
JIBU AB (Register No. 0113514029) who carried out the project work under my supervision.
Certified further, that to the best of my knowledge the work reported here in does not form part of
any other project report or dissertation on the basis of which a degree or award was conferred to
his on an earlier occasion or any other candidate.
Place: Kumaracoil Signature of the Guide
Date:
Forwarded by
Dr. D. Kinslin
Head of the Department
Internal Examiner External Examiner

DECLARATION
I hereby declare that the training report titled “A STUDY ON WORKING CAPITAL
MANAGEMENT OF HMT MACHINE TOOLS, KALAMASSERY”, submitted in partial
fulfillment for the award of Master of Business Administration, to the Noorul Islam Centre for
Higher Education, Kumaracoil is a record of training under the guidance of Ms. A.V ROOPA,
Asst.Professor, School of Management, Noorul Islam Centre for Higher Education, Kumaracoil. I
also declare that this training report is the result of my own effort and has not been submitted
earlier for the award of any other Degree.
Place: Kumaracoil JIBU AB
Date: (Reg No: 0113514029)

ACKNOWLEDGEMENT
First and foremost I would like to thank Almightily GOD for his presence and guidance
Which he has showered upon me through out to do this project.
I gratefully acknowledge my indebtedness to Dr.B. Chandrachoodan Nair, Director, and
Dr.D.Kinslin, Head of department, School of Management Studies, NICHE for making necessary
arrangements to enable me to complete this project successfully.
I obliged to express my deep gratitude to my guide Ms. A.V ROOPA, Asst.Professor, School of
Management, NICHE, Kumaracoil, for his valuable guidance constructive criticism, constant
support and encouragement during this study.
I wish to express my gratitude to HMT MACHINE TOOLS LIMITED, KALAMASSERY
for granting me the permission to do my Project Work in the Company. In addition, I express my
thanks to Mr.MIDHUN.S, senior finance officer, cost & accounts and project Guide, HMT
CO.LTD for sincere and valuable advice which helped me to conduct this project work
successfully.
Finally my sincere thanks to my parents, my faculty, my friends and everyone who helped me to
complete this project report successfully.
JIBU AB
(Reg No:0113514029

TABLE OF CONTENTS
Title Page No.
Chapter - I
1.1 Introduction 1
1.2 Need of the Study 3
1.3 Statement of the problem 4
1.4 Objective of the study 5
1.5 Scope of the study 6
1.6 Organizational chart 10
1.7 Industry profile 11
Chapter – II
2.1 Review of literature 20
Chapter - III
3.1 Research methodology 28
Chapter - IV
4.1 Data Analysis & Interpretation 30
Chapter - V
5.1 Findings of the study 33
5.2 Suggestions of the study 33
5.3 Conclusion 34
Bibliography 35

LIST OF TABLES
Table No
List of Tables
Page No
4.1
Balance sheet on the year 2010
26
4.2
Balance sheet on the year 2011
27
4.3
Balance sheet on the year 2012
28
4.4
Balance sheet on the year 2013
29
4.5
Balance sheet on the year 2014
30
4.6
Working Capital & Working Capital Ratio
31

LIST OF CHARTS
Chart No
LIST OF CHARTS
Page No
1.7.1
Organizational Chart of HMT
11
1.8.1
Finance Department Chart
13
1.8.2
Purchase Department Chart
16
1.8.3
Human Resources Department Chart
17

CHAPTER-I
INTRODUCTION

CHAPTER-I
1.1 INTRODUCTION
Working Capital Management is important part in firm financial management decision improper
management makes on the WIP- Working In Process to the develop on the various development
of working financial process on the basis of managing on developing the financial statements.
Working capital management the develop mentation of the manufacturing their goods on the basis
of short term liabilities and non-short liabilities.
The working capital requirements is the minimum amount of resources that a company requires to
effectively cover the usual costs and expenses necessary to operate the business. Since the capital
needs of each company will be a little different there is no ideal amount of working capital there
is a universally applicable to all business or even to companies engaged in the same industry. Even
so new companies can develop an idea of what type of requirement there will need to operate at
given levels of researching the cost and expenses associated with other corporations engaged in
similar operations.
Working Capital Ratio or WCR is used to rat ionize between the capitals ratios used in every year.
In every financial year the working capital ratio where calculated by the HMT.CO.LTD. The
working capital ratio is the same as the current ratio. It is the relative proportion of an entity current
assets to its current liabilities, and is intended to show the ability of a business to pay for its current
liabilities with its current assets. A working capital ratio of less than
1.0 is an stronger indicator that there will be liquidity problems in the future while a ratio in the
vicinity of 2.0 is considered to represent good short term liquidity.
To calculate the working capital ratio or WCR divided all current assets by all current liabilities.
Working capital involves the relationship between a firm’s short term assets and its short term
liabilities. The goal of working capital management is to ensure that a firm is able to continue its
operations and that it has sufficient ability to satisfy both maturing short term debt and upcoming
operational expenses. The working capital management of working capital involves managing
inventories accounts receivables and cash payables.

1.2 NEED OF THE STUDY
The study has been conducted for gaining particular knowledge about working capital
management & activities of HMT MACHINE TOOLS LIMITED, KALAMASSERY.
1.3 STATEMENT OF THE PROBLEM
The current problem of HMT machine tools is generally explain giving less attention has been paid
in the area of short term finance. In particular to the working capital but the effective working
capital has a crucial play in the enhancing the profitability and growth of the firm.
1.4 OBJECTIVES OF THE STUDY
To study the overall working of the organization of study all department and organizational
structure.
To study the efficiency of the working management of the company.
To study the efficiency of cash, inventory and receivables of the company.
To understand the analyze the working capital position of HMT Co.Ltdduring the period of
2010-2014
To measure the overall financial position of the organization with the help of ratio analysis.
1.5. SCOPE OF THE STUDY
Since the decision regarding working capital are of an operating nature not one time decision the
scope of the study is geared toward identifying important areas of control and to establish model
for better control of the various components of working capital.
The study would also attempt to identify the various source available for financing of working
capital.The study gives a fair idea of improvement in efficiency of working capital management
and also to have control over the components of working capital and managing of efficiency.
1.6 Industry Profile
INDIAN SCENARIO
The Machine tool industry constitutes backbone of the industrial sector and is vital for the growth
of the Indian machine tools industry. Even though the Indian machine tools industry is a small
segment of the engineering industry it plays a very important role in the development and
technology of up graduation of the engineering industry. The quality of mother machine tools and
their automation level. The development of the machine tools industry is therefore of paramount
importance for a competitive and self-industrial structure.

The growth of Indian machine tools industry and major user industries clearly shows the close
interdependeries of indigenous machine tools and the major user industries. This level of
performance of the major user industries has been made possible only because of support of
indigenous manufacturer large and small, to meet almost all the requirement of machine tools
conventional CNC special purpose and flexible manufacturing lines required by them.
Had the indigenous machine tools industry not have been able to meet the major user industries
demand then these machine tools would have to be imported at much higher prices, irrespective of
rising cost of foreign or not. This would have severely affected not only the country GNPand the
overall economy of the country. But not severely impained the country space and the defense
sector.
It was in the early post-independence era that HMT began in a small way to meet a big commitment
to manufacture other machine to build modern industrial era. HMT was conceived by the
Government of India in 1949 and was incorporated in 1953 with the objective of producing a
limited range of machine tools required for building an industrial edifice for the country.
Today, HMT Ltd has 16 manufacturing units with 22 product divisions, spread through the length
and breadth of India. The HMT machine tools limited is engaged in the manufacture and marketing
of general purpose machine tools, special purpose machine tools, computer numerically controlled
machine tools, precision machinery systems, printing machines, metal forming presses, die-casting
and plastic injection molding machines, ferrous and non-ferrous castings.
WORLD SCENARIO
The engineering industry is the largest segment of the overall industrial sectors in India, accounting
for 3% of India’s GDP, offering employment to over 4 mn skilled and semi-skilled workers (direct
and indirect). It is diverse with a number of segments and can be broadly categorised into two
segments: heavy engineering and light engineering. Engineering is relatively less fragmented at
the top as the competencies required are high and more fragmented at the lower end, in terms of
technology and capital investment and are dominated by comparatively smaller players.
The major end-user industries for heavy engineering goods are power, infrastructure, steel, cement,
petrochemicals, oil and gas, refineries, fertilisers, mining, railways, automobiles, and textiles

among others. Light engineering goods are essentially used as inputs by the heavy engineering
industry.
Growth in the domestic engineering industry has been fuelled by growth in key end-user industries
and many new projects undertaken in various core industries such as railways, power and
infrastructure. Capacity creation in sectors such as infrastructure, oil and gas, power, mining,
automobiles, auto components, steel, refinery and consumer durables has driven growth in this
sector. For example, the domestic sales of automobiles have grown at a CAGR of around 18%
over the past four years thereby increasing the demand for engineering goods.
1.7 Company Profile
By the end of the Second World War, the government of India was confronted by a big problem
of disposingthe colossal war waste. Ultimately a committee was constructedto inquire into the
possibilities. The committee report of 1948 proposed the establishment of a Govtowned machine
tool industry. This was expected to fulfill two aspects. The first was being utilization of the Rs
4000 million worth of metallic waste. The second was the incorporation of a state owned
infrastructure manufacturing facility. The result was birth of the Hindustan machine Tools
Limitedwhich diversified in due course of time to the present stature of the multi core, multi-unit,
multi-location, multi-Product industrial giant limited HMT Ltd (Holding Company)
The HMT Ltd was started a single factory to produce tool room lathes at Bangalore in collaboration
with M/s Oerlikonof Switzerland in 1953, with a capacity to manufacture around 400 machine per
year. Since then different collaborations continued in house R&D and tremendous marketing
efforts brought HMT, to its present status.
The growth of HMT.Ltd was characterized by the forward and backward integration technology
and product diversification. Thus the company which started with manufacturing and selling lathes
expanded its machine toolsproduct range to evolve as the ultimate solution in metal cutting.
The product diversification efforts took the company to the business of watches in 1962, tractors
in 1971, die-casting on plastic machinery in 1971, Lamp & Lamp making machinery in 1980, CNC
system in1986, Bull Screws in 1986 and reconditioning in 1990.

The multi-product activities made its identity Hindustan Machine Tools Limited to change
HMT.Ltd Today HMT. Ltd has 16 manufacturing units with 22 product divisions spread through
the length and breadth of India.
A subsidiary Viz HMT (International). Ltd taken care of the exports of the company products.
They also export several items for the Indiancompanies.
HMT.Ltd was restructured in 1992 to facilitate better administration of the multi-product business
activities. Accordingly the following business group were established.
Machine Tools Business group, to concentrate on metal cutting machines.
Industrial machinery business group, to deal with printing machines, Die casting and plastic
injection moldings machines, food processing machines, and metal forming machines.
Agricultural business group, to concentrate on tractor.
Engineering components business groups, to deal with watches & Lamps.
Consumer products business groups, to deals with watches and lamps.
In addition to the business groups, the company owns three subsidiaries as follows:
HMT (International).Ltd which undertakes overseas projects and topics.
Praga Tools.Ltdwhich manufactures machine tools.
HMT Bearings.Ltdwhich manufactures precision bearings in collaboration with M/s KOYO
of Japan.
THE PRODUCT RANGE OF MACHINE TOOLS BUSINESS GROUP
Banglore
Heavy duty lathes
Single and multi-spindle automates
Radial drilling machines
Multi Spindle Drills
Cylindrical and Surface Grinders
Gear Cutting Machines
Laser Cutting Habbers
CNCTurn Mill Centres
Fine Boring Machines / SPM’s

Pinjore
FMS&FMC
Horizontal Machining Centres
Vertical Machining Centres
Milling Machines
Broaching Machines
Kalamassery
CNC Turning Centres
Turn Mills Centres
Flexible Turning Cells
Copying Lathes
Centre Lathes
Offset Printing Presses
Cutting Machines
Hydreabad
Special Purpose Machines
Horizontal Machining Centres
FMS
CNC Horizontal Boring Machines
Bed Type and Floor Boring Machines
Ajmer
Grinding Machines
SPM Grinders
CNC Grinders
Major Machines/Inspection Facilities Available In Different MTBS Units
1) CNC ram type Plano millers
2) Horizontal machining centres
3) Vertical Machining centres
4) Horizontal jig boring machines

5) Vertical jig boring machines
6) CNC turning machines
7) Turn mill centres
8) Slide way grinders
9) Cylindrical grinders
10) Internal grinders
11) Precision gear shapers
12) Precision gear hoppers
13) Gear grinders
14) Induction hardening machines
15) 3D coordinate measuring machines
The Kalamassery Complex of HMT Machine Tools Limited, Kalamssery
The Kalamassery unit, the 4th machine tools units was established in 1963 and started in 1964. The
unit originally manufactured only two years of centre lathes Viz, H&LBbut later added special
purpose lathes, like copying and turret lathes. Model LT-20 was the first product was landmark in
the history of the unit. The production of this machine was later licensed to M/s QETCOS.Ltd:
Quilon, Kerala, MATOOLS, Philippines Ceylon Steel Corporation, Srilanka.The original centre
lathes H&LB were then replaced by a new family of unified series of lathes. Which was designed
and developed by the unit incorporating the concepts of computer optimized design manufacturing
standardization and unification.
HMT had developed conventional machines of different sizes of NH and NL machines. Later the
following products were added through collaboration with world renowned machine manufactures
1. S-Pilote and T-Pilotecopying lathes in collaboration with M/s Erault Souma of France.
2. RTV 50 drum turret in collaboration with M/s Gilder misterof Germany.
And our unit had developed a completely hydraulic machine heavy duty front chucker (FC-25).
During the early 1980’s HMT.Ltd, Kalamassery designed developed and introduced the
manufacturing of CNC Lathes which cater to the turning requirements of light and medium
industries.
Diversification of kalamassey unit diversified its product range to include printing machines. Thus
was the born the printing machinery division (PMK). The commercial entry of PMK was with two

types of letter presses Viz. RTE and RTAE under collaboration with M/s Neibolo of Italy. Auto
platen, an indigenous development came up subsequently. During the ensuring years, the printing
machinery division come up with offset presses Viz. OMIR in collaboration with M/s Neibolo
later indigenous offsetpresses Viz SOM 136 were introduced to the market. The first two-color
machine from HMT was KPO in collaboration with M/s Koenig&Bearer of Germany. The latest
development of PMK is the paper cutting guideline PG-92, in collaboration with M/s Pivano
Binders of Italy.
The Current Product Range
Product Model
Offset Printing SOM 436
Offset Printing SOM 425
Offset Printing SOM 236
Offset Printing SOM 231
Offset Printing SOM 225
Offset Printing SOM 136
Offset Printing SOM 131
Offset Printing SOM 125G
Offset Printing SOM 120
Offset Printing MOM1015
Offset Printing MOM1520
HMT.Ltd holding company including tractors is a multi-product, multi-technology, multi-division
company and presently comprises of the following subsidiaries.
I. HMT Machine Tools Limited

II. HMT Watches Limited
III. HMT Chinar Watches Limited
IV. HMT Bearings Limited
V. HMT International Limited
VI. PRAGA TOOLS Limited
The Kalamassery unit of HMT is well knownfor development activities. Their products have
always fetched awards and prizes bugged in different IMTEX fairs by FC 25, SBC and SBCNC
machines. The CNC lathes model STC 25 has won the VASVIK industrial research award 1987
instituted by the VividhaLaxmiAudiyogikSamsodhanVikas Kendra (VASVIK), Mumbai for
outstanding contribution to advancement of science and technology.
The machine tool products of the unit, have been certified by RW-TUV, Reinsich west (falischer
Technischer uber wachungs verein) an international certification agency of high repute as
confirming total quality management system. Presently both the divisions have been awarded ISO
9001 certification by IRQS.
The manufacturing shops at kalamassery are supported by various infrastructural facilities like
high technology CNC machinery Centre’s, testing facilities foundry heat treatment computer
system CAD system etc. Around 870 will experienced personnel form the human resources of the
unit (MTK, PMK andFYK)put together keeping in line with the currentcorporate trends this unit
views HRD as one of primary concerns as a measure to increase productivity and enhance social
and standing. The company has a well-established training system by personnel of high technical
and management skills.
The HRD programme undertaken by theyinclude the following:
Management oriental programs.
Supervisory Development Programs.
Customer Training Programs to equip customers in optimum utilization on HMT machines.
Periodic awareness programs for employees relating to safety quality technology modern
secretarial practices etc.
Multi skills training to machine operators.
Induction and in plant training to fresh recruit.
Apprentices training programs under the apprentice act.

Project guidance in management or technology to students.
The Marketing Network of HMT .Ltd
The machine tools marketing divisions with its headquartersat Bangaloreand having wide network
of regional and divisional officers spread throughoutIndiacaters to the marketing needs of this unit
at the primary level to coordinate the marketing activities at unit at the primary level. To offer
technical support to MTM, a strong sales and services team is constituted at unit level.
HMT’s major customers includes Defense, Railways, Automobile and other engineering industries
in various sectors.
Main Inland Competitors for the Unit’s Products
Mysore Kirlosker .Ltd
ACE Designers.
NC Machines Private.Ltd
Lakshmi Machine Works.
Main Foreign Competitors for the Unit’s Products
o Okuma, Japan
o Nori Saiki, Japan
o Tukisama, Japan
o Muzak, Japan
o Ikegai, Japan
o GDM, Germany
o Churchill, England
o Erault Tayoda, Japan
o Victor, Taiwan
o Tuma, Korea
o EMAS, Geamany

HMT Machine Tools Ltd Kalamassery
Unit Organization
A. Officers
Designation Grade
General Manager (GM) PS IX
Joint General Manager (JGM) PS VIII
Deputy General Manager(DGM) PS VII
Assistant General Manager (AGM) PS VI
Deputy Chief Engineer (DCE) PS VI
Senior Engineer / Manager (SE/M) PS V
Engineer / Deputy Manager (E/DY.M) PS IV
Deputy Engineer , Officer (DY.E/O) PS III
Assistant Engineer / Officer (DY.E/O) PS II
B. Employees
Designation Grade
Worker Supervisor WSI
Worker Grade WSVI
Worker Grade WGV
Worker Grade WGIV
Worker Grade WG III
Worker Grade WG II
Worker Grade WG I

Top Executives
General Manager (Kalamassery Unit) Sri. Balachandran K.K
Joint General Manager (JGM) (Finance) Sri. Philip John
General Manager (P) Sri. Bidar C.M
Joint General Manager (JGM) (D) Sri. Hemalatha T.R
Joint General Manager (JGM) (ME) Sri. Purushothaman .K
Joint General Manager (JGM) (MM) Sri. Devanadan P.R
Joint General Manager (JGM) (S) Sri. Joy Panicker P.L
Joint General Manager (JGM) (PS) Sri.Sailish Kumar A.V
Joint General Manager (JGM) (FY) Sri. Damodaran .V
Joint General Manager (JGM) (Q) Sri.Alias Koruth
Joint General Manager (JGM) (AY) Sri.Balamurugaesan .S

Chart No: 1.6
HMT Organizational Chart
Source: Journals and Prospectus of HMT
President Of India
Ministry Of Heavy Industries
Board Of Directors
Chairman & Managing Director
Departments

1.8 DEPARTMENTS
Chart No: 1.8.1
HMT Finance Department Chart
Source: Companies journals & books
Finance Department
Joint Finance Manager(JGM)
Cost Accounts
Officers
Junior Officers
Office Staffs

Following are the major functions of finance department in HMT Machine Tools, Kalamassery.
To provide strategic financial support regarding operational and general business planning.
To meet internal and external needs and financial reporting requirements of the company at
large.
Providing financial information guidance and advising to other departments.
Vetting and appraisal of capital expenditure investment proposals to ensure their financial
viability.
Budgeting and monitoring variance.
Management of taxes.
Ensuring timely payment of employee’s salary and other welfare expenses.
Working capital management.
HMT Finance Department Has the Following Sections
1. Outward Bills Section (OBS)
2. Inward Bills Section (IBS)
3. Wages/Time Office
4. Provident Fund
5. Main Accounts & Cost Accounts
6. Cash
7. Concurrence
1) Outward Bills Section (OBS)
OBS maintains the records of sundry debtor’s accounts of sales of machines special accessories
spares and job order.OBS monitors and follow up with debtor for realization of outstanding
dues. OBS also prepares the provision entries servicing invoices. All the works related to sales
tax, excise duty and service tax comes under the ambit of OBS.
2) Inward Bills Section (IBS)
IBS is concerned with purchase accounting and authorizing payments to creditors contractors
and also variance expenses. Like water, Electricity, Hire charges, Insurance, Welfare expenses,
Legal charges, AMC’s. This section also handles import proceedurylike LC opening,
authorizing direct transfer to foreign customer (TT) monitoring exchange rate variations
arranging for forward cover from bank etc.

3) Wages / Time Office
Wages prepares payrolls of officers, workers, trainees on the basis of muster roll given by the
time office given by the time office. Payroll preparations is computerized and the
salary/wagesare also engage with the work of leave of employees, conveyance reimburse
settlement, calculation and disbursement of retirement benefits etc.
4). PROVIDENT FUND
Provident Fund section arranges for the recovery of Provident Fund from the employee salary.
Present statutory, minimum recovery is 12% of basic salary + Dearness allowance ( DA ) .The
employees re allowed to contribute higher amount voluntary (VPF).Out of 12% contribution
made by employer an amount equal to 8.33% is transferred to employees’ pension fund.
Provident Fund section also provides the loan facility to employees as per stipulated terms and
conditions.
5). MAIN ACCOUNT AND COST ACCOUNTS
All cost data required by financial accounts such as SIT, WIP are prepared by cost accounts
section. Main accounts related to material accounts. Weighted average rate is following for
inventory valuation .Half yearly periodical physical verification of stock is conducted by main
accounts and whenever discrepancies occurred they are analyzed and rectified. This section
prepares monthly and annual financial statements (balance sheet, P & L account, notes to
accounts, cash flow statements etc.) and co-ordinates with internal / statutory auditors and also
with comptroller and auditor general of India.
6). CASH
Cash section keeps cash day book a bank day book. The payment vouchers prepared by wages
/ IBS are sent to cash department for payments. Generally payments are made though NEFT
or RTGS. This section also prepares bank reconciliation statement and daily cash flow
statement and also monitor that cash credit does not exceed the permitted limit.
7). CONCURRENCE
All purchase proposals are sent to concurrence section for financial department. They make it
sure that all purchase is made according to the purchase manual. In short all purchase (whatever
it may be) can be made only with the approval of finance department.
Total Employees Strength – 25

JGM-1, DMF’s-2, officers-5, junior officers-1, workers-2, contract labours-6, Traninees-4,
Casual Labours-4.
1.8.2 PURCHASE DEPARTMENT
Chart No: 1.8.2
Purchase department Chart
Source: Companyprospectus journals
OBJECTIVES
Timely procurement and supply of required materials with prescribed specifications and
quality at the most competitive price and terms.
Fair, consistent and transparent purchase practices.
Continuous search for alternate sources of supply and to develop reliable sources of supply.

RESPONSIBILITIES OF PURCAHSE DEPARTMENT
The functions of purchase department are:
Adherence to guidelines contained in the purchase manual.
Maintenance of an updated vendor registers system.
To issue enquires/ tenders, analyze the quotations received and prepare comparative
statements with a view to obtain competitive prices to HMT.
To conduct negotiation with L1 tender.
To keep tender box with lock for receiving offers in sealed tender. Tender box shall be
opened in the presence of vendors and representative of finance department in the case of
open tender, limited tender, single tender etc.
1.8.3 HUMAN RESOURCE DEPARTMENT
Chart No: 1.8.3
Human Resources Department
Source: Company Prospectus & Journals
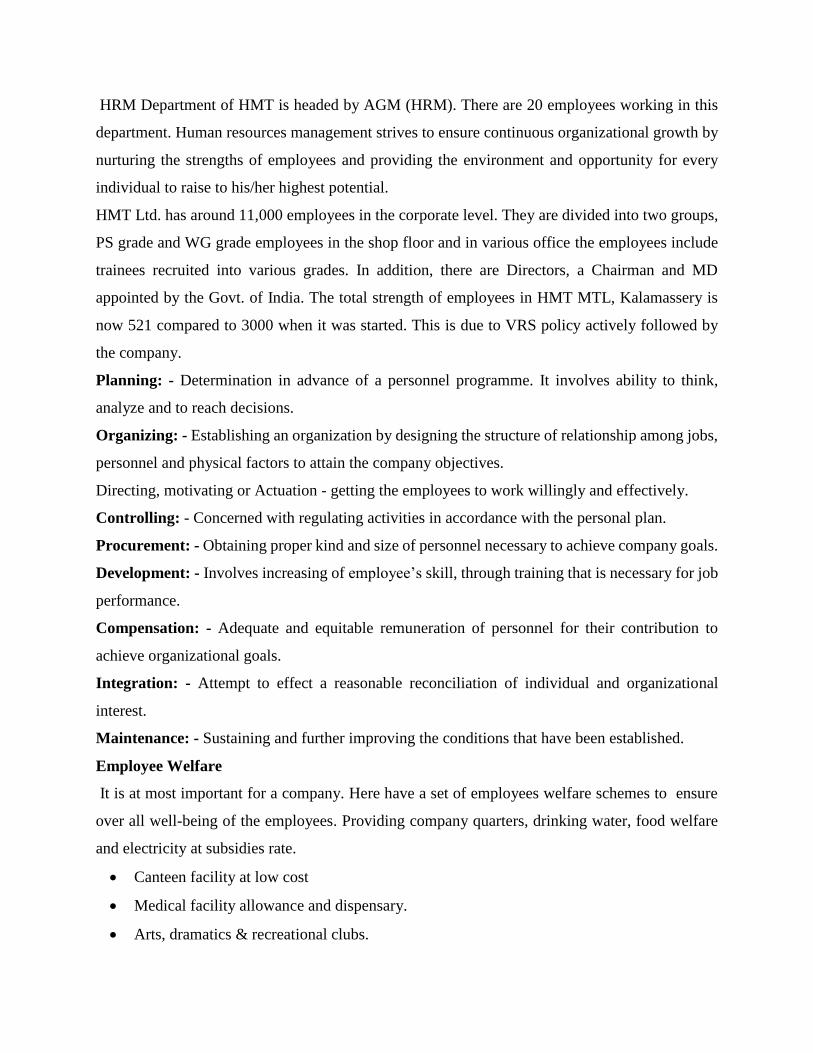
HRM Department of HMT is headed by AGM (HRM). There are 20 employees working in this
department. Human resources management strives to ensure continuous organizational growth by
nurturing the strengths of employees and providing the environment and opportunity for every
individual to raise to his/her highest potential.
HMT Ltd. has around 11,000 employees in the corporate level. They are divided into two groups,
PS grade and WG grade employees in the shop floor and in various office the employees include
trainees recruited into various grades. In addition, there are Directors, a Chairman and MD
appointed by the Govt. of India. The total strength of employees in HMT MTL, Kalamassery is
now 521 compared to 3000 when it was started. This is due to VRS policy actively followed by
the company.
Planning: - Determination in advance of a personnel programme. It involves ability to think,
analyze and to reach decisions.
Organizing: - Establishing an organization by designing the structure of relationship among jobs,
personnel and physical factors to attain the company objectives.
Directing, motivating or Actuation - getting the employees to work willingly and effectively.
Controlling: - Concerned with regulating activities in accordance with the personal plan.
Procurement: - Obtaining proper kind and size of personnel necessary to achieve company goals.
Development: - Involves increasing of employee’s skill, through training that is necessary for job
performance.
Compensation: - Adequate and equitable remuneration of personnel for their contribution to
achieve organizational goals.
Integration: - Attempt to effect a reasonable reconciliation of individual and organizational
interest.
Maintenance: - Sustaining and further improving the conditions that have been established.
Employee Welfare
It is at most important for a company. Here have a set of employees welfare schemes to ensure
over all well-being of the employees. Providing company quarters, drinking water, food welfare
and electricity at subsidies rate.
Canteen facility at low cost
Medical facility allowance and dispensary.
Arts, dramatics & recreational clubs.

Social clubs/ educational clubs.
Employee safety is ensured by a specified safety department.
1.8.4 FOUNDRY DEPARTMENT
Foundry industry is the mother industry for all types of industry agricultural and consumers’
products. The developments in this industry therefore are bound to have a far reaching effect on
the production in all other sectors. Though the casting processes are based on techniques that
are age old and amazingly simple in principle considering the effectiveness of the results
achieved the metal casting industries have become the key industries in the world today.
Foundry industries based on casting principles. Casting is a process and producing metal parts
of desired shape by pouring molten metal into a prepared mould and then allowing the metal to
cool and solidity. This solidified metal is known as casting.
HMT FOUNDRY
The foundry attached to the machine tools division to manufacture all cast iron and spherical
graphite iron required for machine tools and printing machinery division and can also under take
job orders. Established in 1968 with POLISH design, it is semi mechanized foundry producing
heavy duty grey and SG iron, castings for machine tools and printing machines using means
frequency induction furnace for melting and resin bounded sand for molding and core making.
OBJECTIVES OF FOUNDRY DIVISION
• Reducing percentage rejection of casting in foundry.
• Reducing percentage rejection of castings at customer’s end.
• Reducing energy consumption.
PRODUCT PROFILE
WATCHES
HMT Watches, a pioneer in chorological industry in India since 1961, welcomes you to its
products from the Brand name known for decades for its accurate time keeping and trouble free
performance that lasts a life time. The models come in a wide range of attractive designs and
prices, there surely is a model to suit your taste and pocket. HMT watches unveil its stupendous
creations. Watches that are an exquisite blend of form and function, of style and substance.

PRINTING MACHINERY
HMT exporter of a wide range of products which include Printing Machines such as Single
Colour Sheet fed Offset Printing Machines; Two Colour Sheet fed Offset Printing Machines,
Four Colour Sheet-fed Offset Printing Machines and Programmable Guillotine Shears.
BEARINGS
Each bearing undergoes as many as 150 checks before it is supplied to the customer. Vigorous
inspection and quality checks at each of the stages of manufacture till assembly ensure that the
bearings of required accuracies and precision only are made available to the customer.
TRACTORS
HMT stepped in by introducing tractors that met the specific needs of the agricultural sector.
HMT manufactures a wide range of tractor from 25 HP to 75 HP. Keeping in tune with HMT's
philosophy of introducing innovative products and continuously upgrading its tractors with
better technology, these models incorporate contemporary technology viz. fuel efficient engine
meeting emission norms, floor gears, direct axle, latest styling giving value for money to its
customers.
MACHINE TOOLS
HMT Machine Tools Limited, the pioneers in Machine Tools Industry in India and
manufacturers of a diversified range of products. A multi-technology company manufacturing a
wide variety of state-of-the-art machine tools.

CHAPTER-II
REVIEW OF LITERATURE

CHAPTER-II
2.1REVIEW OF LITERATURE
Pass CL, Pike RH (1984) studied that over the past 40 years major theoretical developments have
occurred in the areas of long terminvestment and financial decision making. Many of these new
concepts and the related techniques are now been employed successfully in industrial practices.
By contrast far or less attention can been made to the short term finance, in particular that of
working capital management. That neglect might be acceptable were working capital
considerations of relatively little importance to the firm. Indeed experience shows that adequate
planning and control of working capital is one of the more common causes for the failure of
business.
According to Beard Larry H; Hart graves A.I.L; (2005) an inventory frequently represent a major
portion of the total assets of a small business. Because of the magnitude of the investment,
managers are often told to reduce the level of inventories. Although necessity large inventories
reduce the profitability of a business, low inventories can be even more costly. Inventories must
be monitored to make sure that they do not become too large or too small. Effective inventory
management requires an intensive examination of the relationships between costs and benefits with
in a business. There are 3 categories of inventory costs that must be considered when evaluating
any type of inventory:
• The costs incurred in manufacturing or producing the merchandise.
• The cost of ordering
• The cost of carrying or holding the inventory
• The primary aim of inventory management is to maintain an adequate stock of units which
will permit flexibility in the production and or sales of the product but will not tie up an excessive
amount of a firm’s limited liquid resources.
Paradise, Louis J (2006) states that ‘while inventories have been rising, sales have been advancing
just as fast, keeping the inventory sales ratio, close to its historical lows. Latest reports show the
ratio near 1.80’ compared with a high of over 2.06 a few years’ ages. Given today’s high inventory
carrying costs, improved inventory control, ample supplies and growing interest in Just-in-time
deliveries, there is little incentive to increase inventories. All ratios are calculated in real or
physical volume terms rather than current dollar ratios that tend to have a downward bias because
of inflation. However, using the volume concept during times of rising prices will signal the

beginning on an inventory buildup faster than the current dollars measure. While this analysis,
method covers the entire manufacturing sector, it can also be used to pinpoint ratios for specific
industries where comparable inventory and sales data are available.
Sheridan, John W (2008) describes that besides its ability to signal changes in the business cycle
the inventory-to-sales (I/S) ratios is also looked upon as an indicator of economic health. While
the manufacturing I/S ratio are currently outstanding and the system ratio appear good, smart
buyers are continuing go view these ratios with caution. Although the low level of inventories
currently kept by manufactures significantly reduces the possibly of an economic downturn
stimulated by this sector, the retail sector is a cause for concern. A number of factors reinforce the
idea that there has been a fundamental shift in the structural relationship between manufacturing
and retail. This new inventory relationship is as yet untested. If inventories have been shifted to
the retail level and not actually lowered, then the benefits are mainly to manufacturing and will
not be realized by the system over all. It could be that the current system I/S ratios are too high.
Solver, Alan (2011) Using a representative model case, as illustrated by an “distribution of sales
and inventory by value report” an ABC inventory management strategy is described that resulted
in:1). Improved inventory turnover rates (2) Reduced back orders and 3) A reduced number of line
items issued on stock purchase orders. For most industrial distributors, “A” items represent the
20% of stock that generally account for 80% of total sales; “B” items represent the next 20% of
items, accounting for 15% of sales and “C” items represent the remaining 60% of stock that
account for only 5% of sales. In the ABC approach, A items are recorded on an order-up-to-level
basis with a relatively low level of safety stock maintained. Larger quantities of B and C items are
ordered perhaps 2 or 3 months stock at a time and more safety stock is carried. As a result the costs
of acquisition are reduced for a relatively slight increase in the cost carrying inventory in stock.
Customer service is also improved by maintaining a higher level of safety stock for B and C items.
According to Lee and Wang (2012), it provides information regarding inventory levels and
position, sales data and forecasts, order status, production and delivery schedules and capacity. It
is considered as the most reliable "real time" tool to decrease uncertainty in the chain which leads
to the bullwhip effect (Lewis, 2003).This refers to variations in demand and supply which are
caused by information uncertainties in the chain (Taylor, 2000). This helps to reduce safety stock
at each stage which leads to a reduction in inventory carrying costs (Yao, Evers and Dresner,
2000). Product and delivery lead times are shortened making products available on time to
customers (Tachizawa and Ginemez, 2005).Access to information enables channel members to
plan how much to stock for a given period of time (Fasanghari, Roudsari and Kamal, 2008). In
order for information sharing to take place, chain partners should have a collaborative potential
and IT infrastructure (Shore and Venkatachalam, 2003).
HerzfeldB (1992): studiedthat “Cash is King” –so say the money managers who share the
responsibility of running this country businesses and with banks demand more from their
prospective borrowers greater emphasis can been placed on those accountable for so called
working capital. Working capital management refers to the management or current on short term
assets and short term liabilities. In essence these purpose of that function is to make certain that
the company has enough assets to operate its business.Here are things you should know about
working capital.
Thomas.M.Krueger (2005): studied distinct levels of working capital management measures for
different industries, which tend to be stable over time. Many factors helps to explain this discovery.
The improving economy during the period of study may have resulted in improved turnover in
some industries. While showing turnover may have been a signal of troubles a head. Our results
should be interpreted cautiously.

CHAPTER-III
RESEARCH METHODOLOGY

CHAPTER-III
3.1 RESEARCH METHODOLOGY
The process used to collect information and data for the purpose of making financial decisions.
The methodology may include publication research, interview, surveys and other research
techniques and could both present and historical information.
Type of research is based on descriptive and analytical research.
3.2 Sources of data collection:
Secondary data means the data which has already been collected by some other persons at some
other time for the other purpose important source of secondary collections are:
1. Annual reports of HMT for the past five years.
2. Internet
3. Project reports
Period of the study- two months
Sampling Design
Sampling Units: Financial Statements
Sampling Size: Last Five Years Financial Statements
Tools used: Working Capital Turnover Ratios, Quick Ratios, Super Quick Ratios, Debtors
Turnover Ratios, Creditors Turnover Ratios, Working Capital Ratios.
3.4 Limitations of the study
The Working Finance Departments are always busy with their work and difficult to give proper
attention to the project section.
CHAPTER-IV
DATA ANALYSIS & INTERPRETATION

CHAPTER-IV
4.1 DATA ANALYSIS AND INTERPRETATION
Working Capital Management is important part in firm financial management decision improper
management makes on the WIP- Working In Process to the develop on the various development
of working financial process on the basis of managing on developing the financial statements.
Working capitalmanagement the develop mentation of the manufacturing their goods on the basis
of short term liabilities and non-short liabilities.
The working capital requirements is the minimum amount of resources that a company requires to
effectively cover the usual costs and expenses necessary to operate the business. Since the capital
needs of each company will be a little different there is no ideal amount of working capital there
is a universally applicable to all business or even to companies engaged in the same industry. Even
so new companies can develop an idea of what type of requirement there will need to operate at
given levels of researching the cost and expensesassociated with other corporations engaged in
similar operations.
Working Capital Ratio or WCR is used to rat ionizebetween the capitalsratios used in every year.
In every financial year the working capital ratio where calculated by the HMT.CO.LTD. The
working capital ratio is the same as the current ratio. It is the relative proportion of an entity current
assets to its current liabilities, and is intended to show the ability of a business to pay for its current
liabilities with its current assets. A working capital ratio of less than
1.0 is an stronger indicator that there will be liquidity problems in the future while a ratio in the
vicinity of 2.0 is considered to represent good short term liquidity.
To calculate the working capital ratio or WCR divided all current assets by all current liabilities.
The Formula is:
Working Capital Ratio = Current Assets
Current Liabilities

Table No: 4.1.1
Balance sheet of HMT on the year 2010
Source: Company’s financial statements
Working Capital = Current Assets – Current Liabilities
WC = 434414584-419131050
WC = 15283534
Working Capital Ratio = Current Assets
Current Liabilities
WCR = 434414584
419131050
WCR = 1.03646
Current Liabilities Current Assets
Current Liabilities 219973407
Provisions 199157643
Inventories 152601938
Sundry Debtors 180633762
Cash & Bank Balances 2774449
Other Current Assets 4495952
Loans & Advances 93908483
Total Current Liabilities = 419131050 Total Current Assets = 434414584

Table No: 4.1.2
Balance sheet of HMT on the year 2011
Source: Company’s financial statements
Working Capital = Current Assets – Current Liabilities
WC = 428885887-438070303
WC = -9184419
Working Capital Ratio = Current Assets
Current Liabilities
WCR = 428885887
438070306
WCR = 0.97903
Current Liabilities Current Assets
Short Term Borrowings 81127245
Trade Payables 71701944
Other Current Liabilities 175501961
Short Term Provisions 109739156
Inventories 152052469
Trade Receivables 171843630
Cash & Receivables 73197
Short Term Loans & Advances 99043367
Other Current Assets 5873224
Total Current Liabilities = 438070306 Total Current Assets = 428885887

Table No: 4.1.3
Balance sheet of HMT on the year 2012
Source: Company’s financial statements
Working Capital = Current Assets – Current Liabilities
WC = 433697677-452109870
WC = 18412193
Working Capital Ratio = Current Assets
Current Liabilities
WCR = 433697677
452109870
WCR = 0.95927
Current Liabilities Current Assets
Short term borrowings 68567606
Trade Payables 103898347
Other Current Liabilities 195229138
Short term provisions 84414779
Inventories 169780425
Trade Receivables 170327794
Cash & Cash equivalents 76067
Short terms loans & Advances 85224046
Other Current Assets 8289345
Total Current Liabilities = 452109870 Total Current Assets = 433697677

Table No: 4.1.4
Balance sheet of HMT on the year 2013
Source: Company’s financial statements
Working Capital Ratio = Current Assets
Current Liabilities
WCR = 495861130
5262736312
WCR = 0.94221
Current Liabilities Current Assets
Short Term Borrowings 82653264
Trade Payables 70888197
Other Current Liabilities 281591160
Short Term Provisions 91140691
Inventories 143657435
Trade receivables 251713881
Cash & Cash Equivalents 1409201
Short Term Loans & Advances 91245052
Other Current Assets 7835561
Total Current Liabilities = 5262736312 Total Current Assets = 495861130
Working Capital = Current Assets-Current Liabilities
WC = 495861130-5262736312
WC = -30412182

Table No: 4.1.5
Balance sheet of HMT on the year 2014
Source: Company’s financial statements
Working Capital = Current Assets-Current Liabilities
WC = 520042983-573648756
WC = -53605773
Working Capital Ratio = Current Assets
Current Liabilities
WCR = 520042983
573648756
WCR = 0.90655
Current Liabilities Current Assets
Short Term Borrowings 83083395
Trade Payables 111659326
Other Current Liabilities 300623164
Short Term Provisions 78282871
Incentives 191003844
Trade Receivables 221851604
Cash & Cash Equivalents 17509886
Short Term Loans & Advances 82211666
Other Current Assets 7465983
Total Current Liabilities = 573648756 Total Current Assets = 520042983

Table No: 4.1.6
Table showing WC & WCR of past five years (2010-2014)
Source: Company Books & Journals
Chart No: 4.6.1
Graphical representation of WC&WCR
Source: Company Books & Prospectus 2014
-60000000 -50000000 -40000000 -30000000 -20000000 -10000000 0 10000000 20000000 30000000
2010
2011
2012
2013
2014
Graphical representation of working capital &working capital ratio of past five years (2010-2014)
Working Capital Ratio (WCR) Working Capital (WC)
Year Working Capital (WC) Working Capital Ratio
(WCR)
2010 15283534 1.03646
2011 -9184419 0.97903
2012 18412193 0.95927
2013 -30412182 0.94221
2014 -53605773 0.90655

Particulars MAR'14
(₹ Cr.)
MAR'13
(₹ Cr.)
MAR'12
(₹ Cr.)
MAR'11
(₹ Cr.)
MAR'10
(₹ Cr.)
EQUITY AND LIABILITIES
Share Capital 1,420.35 760.35 760.35 760.35 760.35
Share Warrants &out standings
Shareholder's Funds 1,138.38 390.43 535.81 618.00 697.24
Long-Term Borrowings 0.00 0.00 0.00 0.00 0.00
Secured Loans 0.00 58.00 60.50 60.50 254.65
Unsecured Loans 48.48 416.62 341.85 259.26 366.26
Deferred Tax Assets / Liabilities 0.00 0.00 0.00 0.00 0.00
Other Long Term Liabilities 0.00 0.00 0.00 0.00 0.00
Long Term Trade Payables 0.00 0.00 0.00 0.00 0.00
Long Term Provisions 60.49 34.06 40.54 38.27 0.00
Total Non-Current Liabilities 108.96 508.68 442.89 358.04 620.91
Trade Payables 34.85 39.33 48.55 44.15 61.03
Current Liabilities
Other Current Liabilities 113.10 456.20 393.71 337.56 81.53
Short Term Borrowings 35.85 57.57 53.21 64.79 0.00
Short Term Provisions 38.51 30.99 32.66 37.27 71.81
Total Current Liabilities 222.30 584.09 528.13 483.77 214.37
Total Liabilities 1,469.64 1,483.20 1,506.82 1,459.81 1,532.52
Non-Current Assets 0.00 0.00 0.00 0.00 0.00

ASSETS
Gross Block 139.49 139.37 139.78 136.48 136.39
Less: Accumulated Depreciation 111.18 107.78 104.71 100.40 96.93
Less: Impairment of Assets 0.00 0.00 0.00 0.00 0.00
Net Block 28.31 31.59 35.07 36.08 39.46
Lease Adjustment A/c 0.00 0.00 0.00 0.00 0.00
Capital Work in Progress 0.00 0.00 0.00 0.01 0.00
Intangible assets under
development 0.00 0.00 0.00 0.00 0.00
Pre-operative Expenses pending 0.00 0.00 0.00 0.00 0.00
Assets in transit 0.00 0.00 0.00 2.59 0.82
Non-Current INVESTMENTS 763.90 765.56 765.56 765.56 765.56
Long Term Loans & Advances 3.23 0.92 0.92 0.00 0.00
Other Non-Current Assets 0.00 0.00 0.00 0.00 0.00
Total Non-Current Assets 795.44 798.07 801.55 804.24 805.84
Trade Receivables 221.85 251.71 170.32 171.84 0.00
Total Reserves -725.71 -812.92 -667.54 -585.35 -506.11
Current Assets Loans & Advances
Currents INVESTMENTS 0.00 0.00 0.00 0.00 0.00
Inventories 43.43 32.99 56.14 28.36 29.00
Cash and Bank 43.74 4.53 3.62 3.83 4.39
Other Current Assets 10.89 11.21 6.69 4.00 1.11
Short Term Loans and Advances 545.18 601.10 574.29 550.02 623.55

Total Current Assets 674.20 685.12 705.28 655.57 726.68
Net Current Assets (Including
Current INVESTMENTS) 451.90 101.03 177.15 171.80 512.31
Total Current Assets Excluding
Current INVESTMENTS 674.20 685.12 705.28 655.57 726.68
Miscellaneous Expenses not
written off 0.00 0.00 0.00 0.00 0.00
Total Assets 1,469.64 1,483.20 1,506.82 1,459.81 1,532.52
Contingent Liabilities 13.74 17.71 33.92 30.59 32.81
Total Debt 98.27 559.31 531.33 475.68 620.91
Book Value (in ₹) 0.46 0.00 1.22 2.30 3.34
Adjusted Book Value (in ₹) 0.46 0.00 1.22 2.30 3.34
Sundry Debtors 30.96 35.30 64.54 72.49 68.64

Quick Ratio
Quick Ratio is the same as the current ratio, but without the value of inventory and prepaid
expenses in the numerator. In other words only assets that can be quickly converted into cash.
Interpretation
The current ratio analysis is satisfy only at the year 2010-11 & 2014-15. But the current ratio
analysis is not satisfactory at 2011-2012, 2012-13&2013-14.
Interpretation
The quick ratio analysis is satisfy at year from 2010 to 2015.
Year Current Assets
(in crores)
Current
Liabilities
(in crores)
CA/CL=
Current Ratio
Standard
Ratio
2010-11 726.8 214.37 3.3904 2
2011-12 655.57 483.77 1.35513 2
2012-13 705.28 528.13 1.33543 2
2013-14 685.12 584.09 1.17297 2
2014-15 674.20 222.30 3.03284 2
Year Quick Assets
(in crores)
Current
Liabilities
(in crores)
QA/CL=
Ratio
Standard Ratio
2010-11 1532.52 214.37 7.14895 1
2011-12 1459.81 483.77 3.01757 1
2012-13 1506.82 528.13 2.85312 1
2013-14 1483.20 584.09 2.53933 1
2014-15 1469.64 222.30 6.61107 1

Super Quick Ratio
Some businesses may have trouble converting their accounts receivables into cash quickly, so
another measure of liquidity is the cash ratio equal to the cash plus marketable securities over
current liabilities.
Super Quick Ratio Formula:
Super Quick Ratio = Cash + Marketable Securities
Current Liabilities
Marketable Securities = Quick ratio * Current Liabilities – Cash and Cash Equivalents- Trade
Receivables
Year (QR*CL)-CCE-TR
(in crores)
Marketable
Securities
(incrores)
2010-11 (7.14895*214.37)-4.39 1528.13
2011-12 (3.01757*483.77)-3.83-171.84 1284.13
2012-13 (2.85312*528.13)-3.62-170.32 1332.87
2013-14 (2.53933*584.09)-4.53-251.71 1226.95
2014-15 (6.61107*222.30)-43.74-221.85 1204.05
Year Cash + Marketable Securities
Current Liabilities
Super Quick Ratio
2010-11 4.39+1528.13
214.37
11.51
2011-12 3.83+1284.13
483.77
6.48
2012-13 3.62+1332.87
528.13
6.14
2013-14 4.53+1226.95
584.09
6.63
2014-15 43.74+1204.05
222.30
49.15

Interpretation
In super ratio analysis at the year 2010-11 and 2014-15 the ratio is increase more than which is
expected with the standard ratio analyze with other years super quick ratios and it is satisfied with
this super quick ratio analysis.
Working Capital Turnover Ratio
The working capital turnover ratio measures how well a company is utilizing its working
capital.Working Capital Turnover Ratio divide net sales by working capital (which is current
assets
Minus current liabilities)
Working Capital Turnover Ratio divide net sales by working capital (which is current assets
Minus current liabilities)
Net Sales
Trade Receivables + Inventories - Trade Payables
Year Net Sales
Trade Receivables +
Inventories - Trade Payables
Working Capital Turnover
Ratio
2010-11 193.46
0.00+29.00-61.03
-6.04
2011-12 200.94
171.84+28.36-44.15
0.12
2012-13 159.56
170.32+56.14-48.55
0.90
201314 99.42
251.71+32.99-39.33
0.41
2014-15 78.44
221.85+43.43-34.85
0.34

Interpretation
In the year 2010-11, the working capital turnover ratio gets decreased due to less ability to generate
the sales from their working capital and to balance 4 years the working capital turnover gets
increase so that more ability in making its sales with their working capital
Inventory Turnover Ratio
Inventory turnover ratios details how much inventory is sold over a period of time
Costs of goods sold / Average Inventory
Or
Sales / Inventory
Interpretation
The inventory turnover ratio is analyzing the inventory with sales so the inventory is satisfied.
Year Sales/Inventory Inventory Turnover Ratio
2010-11 193.46/29.00 6.67
2011-12 200.94/28.36 7.08
2012-13 159.56/56.14 2.84
2013-14 99.42/32.99 3.01
2014-15 78.44/43.43 1.80

Debtors Turnover Ratio
Debtors Turnover Ratio = Credit Sales / Average Debtors
Average Debtors = (Opening Debtors Balance + Closing Debtors Balance) / 2
Year (Opening Debtors Balance+
Closing Debtors Balance)/2
Average Debtors
(in crores)
2010-11 (68.64+34.32)/2 51.48
2011-12 (72.49+36.24)/2 54.36
2012-13 (64.54+32.27)/2 48.40
2013-14 (35.30+17.65)/2 26.47
2014-15 (30.96+15.48)/2 23.22
Interpretation
Debtor’s turnover ratio is analyzing the credit sales with debtors the turnover also satisfied.
Year Average Debtors/Credit
Sales
Debtors Turnover Ratio
(in times)
2010-11 51.48/193.49 2.70
2011-12 54.36/200.94 2.85
2012-13 48.40/159.56 2.33
2013-14 26.47/99.42 1.99
2014-15 23.22/78.44 2.37

Creditors Turnover Ratio
Creditors Turnover Ratio = Credit Purchases / Average Creditors
Year (Opening Creditors
Balance+Closing Creditors
Balance)/2
Average Creditors
2010-11 (219973407+199157643)/2 209565525
2011-12 (175501961+109739156)/2 142620558.5
2012-13 (195229138+84414779)/2 101835308.5
2013-14 (281591160+91140691)/2 186365925.5
2014-15 (300623164+78282871)/2 189453017.5
Year Average Creditors/Credit
Purchases
Creditors TurnoverRatio
(in times)
2010-11 209565525/219973407 0.95269
2011-12 142620558.5/175501961 0.81264
2012-13 101835308.5/195229138 0.52162
2013-14 186365925.5/281591160 0.66183
2014-15 189453017.5/300623164 0.6302

CHAPTER-V
FINDINGS, SUGGESTIONS&CONCLUSION

CHAPTER-V
5.1 Findings
Debtor’sturnover ratio is increase at 2011-12 as 2.85times and simultaneously the debtor’s
turnover ratio decreases at 2013-14 as 1.99 times.
Creditors turnover ratio increased at 2010-11 as0.95269 times and creditors turnover ratio
decreases at 2012-13 as 0.52162 times
Working capital turnover ratio increased at 2012-13 as 0.90 and working capital turnover
ratio decreases at 2010-11 as -6.04.
Super quick ratio increases at 2014-15 as 49.15 and super quick ratio decreased at 2012-13 as
6.14.
Quick ratio is increase at 2010-11 as 7.14 and quick ratio decreased at 2013-2014 as 2.53.
Current ratio increased at 2010-11 as 3.39 and current ratio decreased at 2013-14 as 1.17.
5.2 Suggestions
The Debtors turnover of the company is less the times when it is come down from the 2010-
11 to 2014-15.
The Creditors turnover of the company is less the times when it is come down from the 2010-
11 to 2014-15.
Working capital of the company is more care in handling for the day-to-day operations of the
company.
Current assets and current liabilities were analyzed in proper manner always current assets
are always equal to the current liabilities.
Current assets and current liabilities of the companies is always better analyzing through
continuous current ratio process.
More handling with care for working management of the company due to the proper running
of the company.

5.3 CONCLUSIONS
HMT is pioneer in the market and has created reliability and credibility among the customers. It
has an excellent transporting facilities and proximity to national high way, railway line, sea port
and airport as well. A better inventory management will surely be helpful in solving the problem
that the company is facing with respect to inventory and will pave the way for reducing the huge
investment or blocking of investment in inventory. Inventory management is vitally important to
almost every type of business, whether product or service oriented. Inventory control touches
almost every facets if operation. A proper balance must be struck to maintain proper inventory
with the minimum financial impact on the customer. Inventory control is the activities that
maintain stock keeping items at desired level. In manufacturing since the focus is on physical
product, inventory control focus on material control. The goal of the wealth maximization is
affected by the efficiency with which inventory is managed. Inventories constitute about 60% of
current assets of companies in India. The manufacturing companies hold inventories smooth
production and sales operation to guard against the risk of unpredictable changes in usage.

BIBILOGRAPHY
BIBILOGRAPHY
BOOKS
* Bhagirathi Singh (1994), Working Capital Management, Arabians Publishers, Jaipur
* Dutta A K (1998), Working Capital and Capital control, Jockopublishers, Mumbai
* Nair N K (1994) Working Capitalmanagement, Vikas publications, New Delhi
REPORTS
Annual Reports 2010, 2011,2012,2013,2014
WEBSITE
Www. Wikipedia.com
www.hmt.com