jing heng wen e-z-go, textron - ansys · pdf filejing heng wen. e-z-go, textron. ... when heat...
TRANSCRIPT

© 2011 ANSYS, Inc. August 11, 20111
Jing Heng Wen
E-Z-GO, Textron
Optimization of Heat-sink Fin Features using ANSYS

© 2011 ANSYS, Inc. August 11, 20112
Background:Heat sinks are frequently used when heat exchange is required for electric circuits.
In cases where the heat generation is evenly distributed, the height and spacing of fins are uniform. However, when heat generation is locally concentrated, uniform fin distribution is not the most efficient design.
Tasks of Virtual Prototyping:Virtual prototyping is applied to the investigation of fin feature design in order to
reduce the cost when re-tooling is required. (1) To make sure that the new design will increase the heat transforming efficiency; (2) To reduce the weight.
Optimization of Heat-sink Fin Features using ANSYS
Procedures:(1) Analyze original design as the baseline;(2) Investigating heat generation sources;(3) Simple method to see the possibility for weight cut; (4) Optimize Fin Space, Height following the structure/installation requirement.(5) Validation

© 2011 ANSYS, Inc. August 11, 20113
Heat Exchange: Improve ~10-15% Material Reduction: ~10% of Heat Sink
Optimization of Heat-sink Fin Features using ANSYS
Original Product vs. Optimized Product

© 2011 ANSYS, Inc. August 11, 20114
Am
bien
t T=5
0C, M
ax. 1
08.9
0 C
Am
bien
t T=2
0C M
ax. 7
5.63
0 C
Step 1. Original Model (Baseline)
Optimization of Heat-sink Fin Features using ANSYS

© 2011 ANSYS, Inc. August 11, 20115
Total Heat Source: 88W (1) Center Wall: 12W+10W+10W+10W+18W=60W (2) Longer Side: 15W(R) +7W = 22W (3) Shorter Side: 6W (R)
The investigation of heat generation: Concentrate Distribution
Center WallWall 1, at Longer Side
Wall 2, at Shorter Side
Optimization of Heat-sink Fin Features using ANSYS
Step 2. Heat Generating Source Investigation

© 2011 ANSYS, Inc. August 11, 20116
Am
b T=
20C,
Max
. 77.
80 C
Test
Mod
el 1
Step 3. Simple Method (Conduct/Film) for the Possibility of Weight Cut (A)
Optimization of Heat-sink Fin Features using ANSYSTe
st M
odel
2
Increasing the height of 3 Fins +0.025M. So total adding is 0.075M
Removing 3 Fins at the end of one side, Cut fin 0.05*3=0.15M
Am
bien
t T=2
0C, M
ax. 7
5.80 C

© 2011 ANSYS, Inc. August 11, 20117
Summary of Test Model 1, Test Model 2 and Original
The results suggests that changing the height of fin and density could reduce the weight by increasing heat transform efficient.
We know the possible method. Now, we need to know how to determine their height and space
(density) in detail. Optimization analysis by FEA is used.
Model Description LC 1, Tbulk = 50C LC 2, Tbulk = 20C
Max. T Min. T Max/Min Difference Max. T Min. T Max/Min Difference
Model 1 Original 108.9C 77.5C 31.4C 75.6 C 43.5C 32.1C
Model 2 Removed 3 side fins 111.6C 84.3C 27.3C 77.8C 49.6C 28.2C
Model 3 Removed 3 side fins 109.4C 83C 26.1C 75.8C 48.6C 27.2C
1.5 X H of 3 center Fins
Step 3 (B). Simple Method to Find the Possibility of Weight Cut
Optimization of Heat-sink Fin Features using ANSYS

© 2011 ANSYS, Inc. August 11, 20118
Max
. 74.
80 C u
nder
Bul
k 20
0 C
Optimization of Heat-sink Fin Features using ANSYS
Straight Fin Baseline, Max. M=0.631kg
Max
. 107
.50 C
und
er B
ulk
500 C
Step 4. Fin Density (Space) & Height Change, Model with Straight Fin Optimization Analyzing Base Model w/Straight Fin (Step 4-1, 4-2 & 4-3)
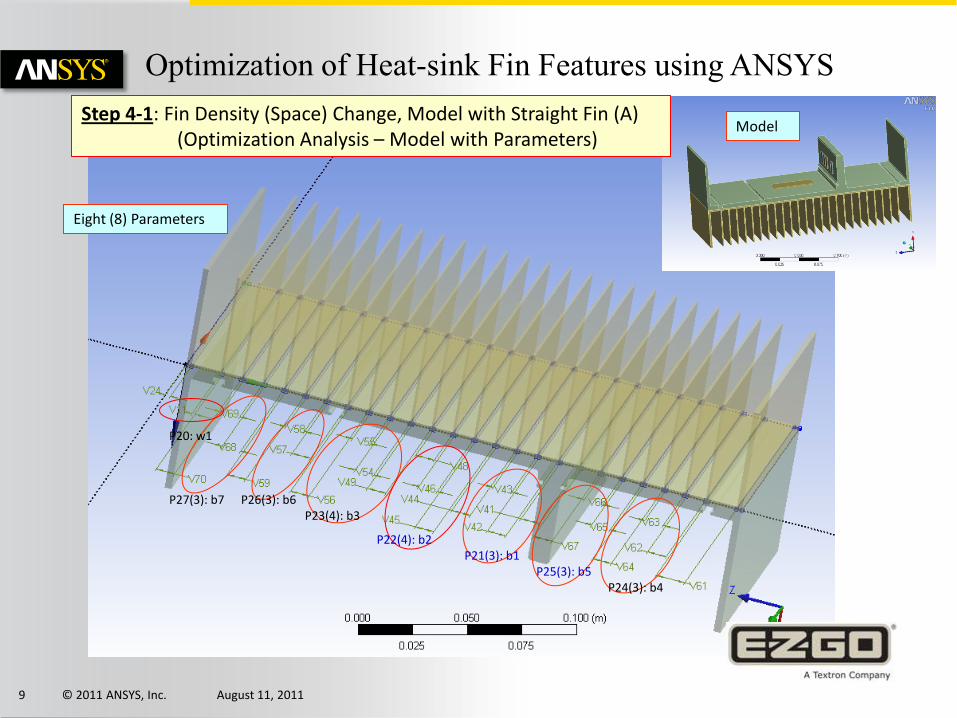
© 2011 ANSYS, Inc. August 11, 20119
P27(3): b7 P26(3): b6P23(4): b3
P22(4): b2P21(3): b1
P25(3): b5P24(3): b4
P20: w1
Step 4-1: Fin Density (Space) Change, Model with Straight Fin (A) (Optimization Analysis – Model with Parameters)
Eight (8) Parameters
Model
Optimization of Heat-sink Fin Features using ANSYS

© 2011 ANSYS, Inc. August 11, 201110
4-1 (B): Fin Density (Space) Change, Model with Straight Fin(Optimization -- Response Surface Result – Local Sensitivity)
Optimization of Heat-sink Fin Features using ANSYS
b1
b2
b5
b7
b3
b4
b6w1
Max. Temperature
Min. Temperature

© 2011 ANSYS, Inc. August 11, 201111
Max
. T v
s.. b
1an
d b6
Max
. T v
s.. b
1an
d b7
Max
. T v
s.. b
1an
d b5
Max
. T v
s.. b
1an
d b2
Optimization of Heat-sink Fin Features using ANSYS4-1 (C) : Fin Density (Space) Change, Model with Straight Fin
(Optimization Analysis Result – Sensitivity Chart)
Hold b1, see how T changes (sensitivity) following b7/b6 (Left) and b5/b2 (right)?

© 2011 ANSYS, Inc. August 11, 201112
4-1 (D): Fin Density (Space) Change, Model with Straight Fin(Goal Driven Optimization Analysis Result Summary)
Tradeoff – Max. Temperature vs. Mass
Best: 71.9 vs. 74.80C (base), M=0.631
Reduced Samples
Optimization of Heat-sink Fin Features using ANSYS

© 2011 ANSYS, Inc. August 11, 201113
Step 4-2: Fin Height Change, Model with Straight Fin & Equal Space (A) (Optimization Analysis - Model)
P30:l1
P31:h3
P28:h2
C: 0.075m
P29:h4
Four Parameters in DesignModeler
Model
APDL Command in Mechanical (add another parameter ARG1)
Optimization of Heat-sink Fin Features using ANSYS

© 2011 ANSYS, Inc. August 11, 201114
4-2 (B): Fin Height Change, Model with Straight Fin (Optimization – Response Surface – Local Sensitivity)
P29:h4
h4
h2
h3
l1
Mass
Max. T
Optimization of Heat-sink Fin Features using ANSYS
Max. TemperatureMass
h3
l1
h4
h2

© 2011 ANSYS, Inc. August 11, 201115
4-2 (C): Fin Height Change of Model with Straight Fin(Optimization Analysis –Sensitivity Chart)
Max. T vs. h2 and h4
Mass vs. h2 and h4
Max. T vs. h2 and l1
Mass vs. h2 and l1 Mass vs. h2 and h3
P29:h4
Optimization of Heat-sink Fin Features using ANSYS
Hold h2, see how T & Mass change (sensitivity) following l1 (best l1 for T, Left low), h4 (right) and h3 (center)?
Model with Parameters
© 2011 ANSYS, Inc. August 11, 201116
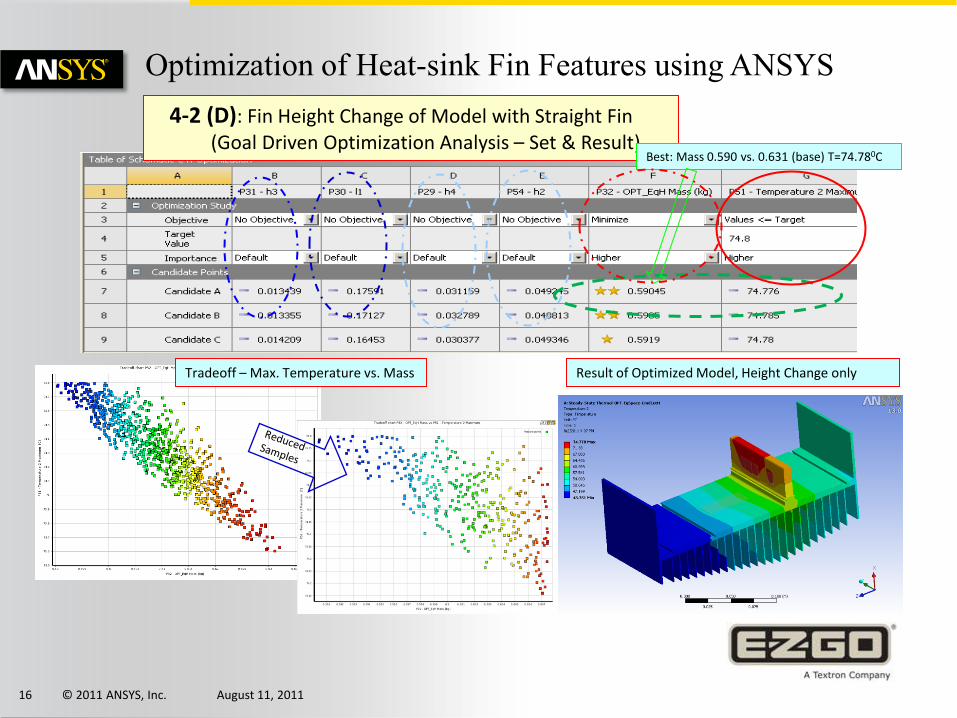
4-2 (D): Fin Height Change of Model with Straight Fin(Goal Driven Optimization Analysis – Set & Result)
Tradeoff – Max. Temperature vs. Mass
Best: Mass 0.590 vs. 0.631 (base) T=74.780C
Result of Optimized Model, Height Change only
Optimization of Heat-sink Fin Features using ANSYS

© 2011 ANSYS, Inc. August 11, 201117
Step 4-3. Combining Fin Height and Space Change (A) Optimization Model with Dimension Parameters
P29: h4
Optimization of Heat-sink Fin Features using ANSYS
+ 8+4=12 Parameters

© 2011 ANSYS, Inc. August 11, 201118
Am
bien
t T=2
0C, M
ax. T
=74.
550 C
Optimization of Heat-sink Fin Features using ANSYSO
ptim
ized
Par
amet
ers
Am
bien
t T=5
0C, M
ax. T
=107
0 C
4-3 (B). Combining Fin Height and Space Change Optimized 12 Parameters, Mass=0.576kg, T=74.550C (Base M:0.631Kg,T:74.80C)
Inacceptable gap

© 2011 ANSYS, Inc. August 11, 201119
4-3(C). Combining Fin Height and Space Change Re-adjusted 8 Parameters Toward to Market-Manufacture Acceptable Model - Optimization
Optimization of Heat-sink Fin Features using ANSYS
Note - h3: Shipping package; l1: optimized; b7: gap limit; w1: limited; TL: defined
Parameter Table Detail of Design of Experiments

© 2011 ANSYS, Inc. August 11, 201120
Sens
itivi
ty
Max
. T &
Mas
s Tr
ade-
off
Opt
imiz
ed C
andi
date
sM
anuf
. Acc
epta
ble
-Ve
rific
atio
n
1. S
elec
ted
as r
espo
nse
poin
t
2. Acceptable /Round for Manufacture 3. Pints Verification, Mass=0.573Kg, Max. T=74.70C
Optimization of Heat-sink Fin Features using ANSYS4-3 (D). Combining Fin Height and Space Change , Goal Driven Optimization Results
b1
b2
b6b1
Mass Max. T
b5
b5
b2b6

© 2011 ANSYS, Inc. August 11, 201121
Am
bien
t T=2
0C, M
ax. T
=74.
70 C
Optimization of Heat-sink Fin Features using ANSYS
Opt
imiz
ed /A
ccep
ted
Para
met
ers
(Edi
t in
Para
met
er S
et T
able
/Ref
resh
)
Am
bien
t T=5
0C, M
ax. T
=107
.40 C
Mod
el G
eom
etryStep 4-3(E). Combining Straight Fin Height and Space Change (Manufacture)
Results of ALL Accepted Parameters, Mass=0.579kg, T=74.7C (Base Mass=0.631,T=74.80C)
Update

© 2011 ANSYS, Inc. August 11, 201122
Model FEA Thermal Analysis LC 4 (50C) LC 5 (50C) Volume ( Fin L )
LC 1, Ta=50C, LC 2, Ta=20C, Thermal Thermal + V (Fin L) V (Fin L)
# Detail Report Max. T Min. T Max. T Min. T Stress F 11 lbf cm^3 (cm) Reduction
Model 1 Original A 108.9 C 77.5 C 75.6 C 43.5 C N/A N/A V547.82(L116.3) Base
Model 5 2400C C, enforced 108.4 C 82.7 C 75.3 C 45.3 C 14 Mpa 150 Mpa V484.44(L101.7) 11.50%(13%)
Ori
gina
l Hea
t Sin
k
Rede
sign
ed H
eat S
ink
(Spa
ce/H
eigh
t/In
stal
latio
n/Th
ick/
Prof
ile/W
ave)
Step 5: Final Model Validation (A) Summary, Optimized vs. Original (Geometry & Results)
Optimization of Heat-sink Fin Features using ANSYS

© 2011 ANSYS, Inc. August 11, 201123
Original Model of Thermal Analysis Results
Final Model of Thermal Analysis Results (T+5%)
Step 5 (B): Final Model Validation -- Compared with Original in FEA Thermal
Am
bien
t T=5
2.50 C
, Max
. 108
.40 C
Max
-Min
=25.
80 CA
mbi
ent T
=500 C
, Max
. 108
.90 C
M
ax-M
in=3
1.40 C
Am
bien
t T=2
10 C, M
ax. 7
5.30 C
M
ax-M
in=3
00 CA
mbi
ent T
=200 C
, Max
. 75.
60 C
Max
-Min
=32.
10 C
Optimization of Heat-sink Fin Features using ANSYS

© 2011 ANSYS, Inc. August 11, 201124
Step 5 (C). Final Model Validation -- Thermal Structure Stress Check
Optimization of Heat-sink Fin Features using ANSYS
Static Structure Analysis
Thermal Structure Analysis

© 2011 ANSYS, Inc. August 11, 201125
Test PASS/FAIL Criteria:Test 2. Operating Temperature:
-20 0C to +60 0C. The power supply shall operate without any evidence of degradation throughout a “Normal Temperature” range of 0 0C to +40 0C. For thermal protection above +40 0C, its output will be reduced by 2.5% / 0C until reaches 50% power at 60 0C, above which it will shutdown
Test Figure 1: Current Thermal de-rating curve
Test Figure 2: Current in normal T (-20 0C to +40 0C)
Step 5 (D). Final Model Validation -- Prototype Test
Optimization of Heat-sink Fin Features using ANSYS
Test Figure 3: Charge parts temperature distribution
All prototypes passed test successfully.

© 2011 ANSYS, Inc. August 11, 201126
RESULTS & CONCLUSION
In summary, ANSYS , a virtual prototyping tool, is used for Heat Sink Redesign:(1) The electric charge has been in mass production years and is very successful. The
finding has been submitted to and is pending in US patent office. (2) ANSYS is providing a powerful tool to help us to decide whether improvement is
accessible; (3) Optimization tool help us to determine the dimension rapidly and accurately ; (4) Saved cost and valuable time.
Without the full cooperation in R&D lab and product design team, the strong support and leadership from the management in E-Z-GO Product Engineering Department, the virtual
prototyping could not be implemented. The author is indebted to many colleagues from E-Z-GO, Textron.
ACKNOWLEDGEMENTS
Optimization of Heat-sink Fin Features using ANSYS