jinjun xue - anu presspress-files.anu.edu.au/downloads/press/p93731/pdf/ch191.pdf · carbon...
TRANSCRIPT

431
Moving towards low- carbon economic growth19
Jinjun Xue
Deng Xiaoping famously proclaimed that ‘it doesn’t matter if a cat is black or white, so long as it catches mice’. This rejection of ideological purity and embrace of pragmatism became the basis of China’s new development model. The new approach led to 30 years of rapid economic growth, directing China toward a new place in the global economy. This development has, however, not been without cost. The environmental impact of China’s rapid industrialisation has been particularly severe. Deng may not have been concerned with the colour of the cat, but we might now be concerned if the mouse is blackened by pollution. This chapter analyses the potential for environmental issues to act as a constraint on economic growth. A growth model that displays characteristics of an environmental Kuznets curve (EKC) is developed to assess the most recent data.
The EKC derives from long-run empirical observations across countries. It is observed that environmental degradation associated with economic growth increases most rapidly at low levels of per capita income. As income grows, the additional degradation due to each successive economic gain slows until it eventually peaks. As per capita income continues to grow, degradation eventually diminishes.
An implication of the EKC is that environmental degradation could act as a constraint on future economic growth. This chapter develops a theoretical model for incorporating environmental constraints on economic growth, but allowing for the possibility of innovation in environmental technologies as well as government policies that fortify the environment. A modified EKC is then estimated for China.
The chapter is composed of four parts. Section one discusses the EKC and illustrates how environmental pollution can act as a potential constraint on economic growth in some circumstances. Section two provides a growth model that assumes that technological innovation with regard to environmental measures can render environmental constraints

China’s New Place in a World in Crisis
432
on economic growth redundant and, in turn, promote sustainable development. Section three tests the hypothesis by drawing on data from China and presents a new EKC developed from time series. Section four discusses the main findings and offers some tentative conclusions.
The EKC model with environmental constraints on growth
The Kuznets curve originated as a theory illustrating the relationship between economic growth and income inequality—that is, the income Kuznets curve (IKC) (Kuznets 1955). In recent years, it has been developed into a model showing a process of high economic growth accompanied by high environmental pollution. In this chapter, we will discuss a growth model, incorporating environmental constraints, and highlight how pollution influences the path of economic growth.
The structure and implications of the EKC
Paralleling the IKC model, the EKC model describes the dynamic relationship between gross domestic product (GDP) growth and pollutant emissions as an inverted U curve. Pollution per capita will increase rapidly as the economy accelerates in the take-off stage, reaches a peak (turning point) in the high growth stage and then decreases in the stable growth stage. Through this process, the EKC assumes that the pollution problem will be solved gradually and the economy will arrive at a stable growth stage eventually (Figure 19.1).
The EKC is a market fundamentalist-based model and it suggests that pollution will be reduced automatically by the market mechanism as an economy matures. Consequently, there is no need for government intervention in the economy (for example, via a strong environmental policy regime).
Most analysis and country-based case studies, however, show that the progression from a high-pollution regime to a low-pollution regime can be more protracted if there is no strong government policy intervention, if distortions exist that sponsor inefficient practices or if technological progress/transfer linked to improvement in the environment is not pursued aggressively. Furthermore, damage to the wider environment while the EKC is on its upswing could be so pervasive that it impinges on current and future economic growth.

Moving towards low carbon economic growth
433
Figure 19.1 Traditional EKC
Source: Based on the Kuznets hypothesis in Kuznets, S. 1955, ‘Economic growth and income inequality’, American Economic Review, vol. 45, no. 1, pp. 1–28.
In studying the case of China, it has been argued that the extensive damage to the environment is primarily a consequence of its high growth and mass consumption of energy and the distorted policy of economic development (Nature, no. 5, 2005); therefore we cannot wait for an early arrival of the gradual sustainable development predicted by the EKC. In other words, we have to seek a new approach based on the revised EKC that can help China out of its current state of high growth-accelerating pollution and find a way to shorten the process of transition from a high-pollution to a low-pollution stage of development.
An environmentally constrained EKC without technological progress
Considering the unique case of China, and the search for a new EKC, it is useful to set a formal framework of economic growth as a benchmark. A short discussion of the theory of economic growth is therefore in order.

China’s New Place in a World in Crisis
434
A growth model without technological progress
In the growth theory literature, the Cobb-Douglas production function illustrates that capital investment and the labour force are the only factors determining the quantity of production. Following the inferences of this function, we assume that the economy is driven by capital, but that technological progress is absent. In light of this, the Cobb-Douglas production function can be expressed as Equation 19.1.
Equation 19.1
),( LKFY N = or βα LKY N =
in which L = capital investment, L = labour force and )1( βα −= .
Because saving is equal to investment in the Keynesian equilibrium of national income, s can be interpreted as investment and i includes physical investment and human capital. Here, we define human capital as labour force, therefore we can develop the equation into a Harrod-style growth model (Harrod 1948) as Equation 19.2.
Equation 19.2
ksG /=
or
LK LdL
KdK
YdY ωω +=
in which A = growth rate, A = saving rate, A = coefficient of capital, which can be defined as the ratio of input–output, TEω = the elasticity of capital and TEω = the elasticity of labour.
A growth model with technological progress
The Harrod-style growth model stresses the absolute role of savings or investment in the process of economic growth but ignores the role of technological progress. To modify the model, we change the economy into a modern economy by introducing the factor of technological progress, A , into the production function. The above production function can therefore be rewritten as Equation 19.3.

Moving towards low carbon economic growth
435
Equation 19.3
),,( ELKFY A =or
),( LKAFY N =
Based on the new production function, we can transfer the Harrod-style model into the Solow model in which technological progress (designated as AdA / ) is included (Equation 19.4).
Equation 19.4
AdA
LdL
KdK
YdY
LK ++= ωω
in which TEω is economic growth. Explicitly, the Solow model demonstrates that technological progress is the decisive factor in modern economic growth (Solow 1956). Because technological progress is an external factor, however, the Solow model is treated as an endogenous growth model and, implicitly, the economy will grow with constant returns to factors of production.
A growth model with an environmental constraint but without technological progress
Now we can develop an EKC model in which the environmental factor, E, is considered. As a consequence, we get the following production function (Equation 19.5).
Equation 19.5
),,( ELKFY A =
in which TEω is economic growth available and E equates to the environmental factor, which can be defined as the cost of environmental pollution, and is negatively related to economic growth.
By introducing E into the growth model, we can develop a new growth model incorporating the environmental factor (Equation 19.6).

China’s New Place in a World in Crisis
436
Equation 19.6
ELK EdE
LdL
KdK
YdY ωωω −+=
Here, AdA / is the cost of environmental pollution measured by the ratio of investment in environmental control in GDP and TEω is the elasticity of resource consumption.
The environmentally constrained EKC model
To explain the relationship between economic growth and environmental change, we introduced the environmental factor into the EKC model and constructed an environmentally constrained EKC model. This aims to show that when the economy grows at an accelerating speed, as a side product of mass consumption of energy (for example, coal and crude oil), environmental pollution (for example, emissions of sulphur dioxide, carbon dioxide, and so on) will become more and more problematic. Furthermore, the pollutants will cause damage not only to nature, people and society, but to economic growth because they will induce huge cost and place a heavy burden on the economy. As a result, the economy will have to invest in environmental measures in order to improve economic performance and the quality of people’s lives. In other words, the cost of environmental pollution and investment in pollution-control measures will have a significant impact on GDP growth and induce a constraint on future economic growth. This is what we defined as the cost of high growth or ‘the black mice effect’, using Deng Xiaoping’s description about mice.
To illustrate the cost of high growth, consider in Figure 19.2 an EKC with a binding environmental constraint. It demonstrates that at the high-growth stage, in the absence of technological change, increasing pollution will induce a strong environmental constraint on the growth path of per capita GDP. As a result of environmental degradation, the growth path of per capita GDP might not go up but will instead bend in the direction of a low-speed, unstable-growth position. Accordingly, the distorted growth path will delay arrival at the turning point (peak) and not enable the economy to reach the third stage—that is, stable growth with low pollution, as shown by the EKC—and it will remain in a stage of low growth and high pollution.1 As a consequence, many mice become black mice.

Moving towards low carbon economic growth
437
Figure 19.2 The EKC with environmental constraint
A new EKC with environmentally related technological progress
In this section, we will develop a new EKC model that incorporates technological progress driving positive environmental outcomes into the basic neoclassical growth theories discussed above.
Economic growth with pollution-suppressing technology
Here we introduce pollution-suppressing technology into the EKC system to derive sustainable economic and environmental development.
To evaluate the applicability of our hypothesis, we will perform a simulation assuming a set of growth rates. We presume that the EKC includes a pollution-suppressing technology, which can guarantee sustainable development. Therefore, production functions of gross output can be written as Equations 19.6 and 19.7.

China’s New Place in a World in Crisis
438
Equation 19.6βα LAKY N = , 1=+ βα
Equation 19.7δγ LBKR = , 1)( >+ δγ
Here, we assume δγ + exceeds unity. This means that the pollution-suppressing technology possesses the nature of increasing returns to scale.
With these conditions, we can get a new growth model for sustainable development (Equation 19.8).
Equation 19.8
TEE
ELK T
dTA
dAL
dLK
dKYdY ωωω +++=
in which AdA / = technological progress for production, EE TdT / = environmentally related technological progress and TEω = elasticity of environmentally related technological progress.
There are two kinds of technologies being used in this mode. One focuses on production (for example, energy-saving technology, sulphur-deodorant technology, and so on) and the other on environmental controls (for example, energy-saving technology, sulphur-deodorant technology, and so on). Figure 19.3 is a demonstration of the new EKC based on this model.
The new EKC shows that by introducing environmental-control technology, the growth path of per capita GDP can move forward gradually while pollution emissions increase slowly at first, tending to decrease and finally arrive at the third stage in which ideal sustainable development can be obtained and environmental pollution can be contained in a reasonable manner. The model implies, however, that per capita GDP should grow at a reasonable speed with effective pollution control but not at high speed and beyond the environmental burden.

Moving towards low carbon economic growth
439
Figure 19.3 A new EKC with a growth model for sustainable development
Source: Author’s own schema.
The flying-geese model and catch-up effect
According to historical data, most industrialised countries spent between 50 and 200 years overcoming the trade-off between economic growth and environmental pollution. For example, it took the United Kingdom 185 years to reach its peak of carbon dioxide emissions, while it took the United States 135 years. It took even the East Asian miracle economy of Japan more than 100 years from the Meiji era to reach its peak year in 2005 (CAS 2009:45), as well as suffering from a painful experience of ‘the four big pollution diseases’ (Xue et al. 2002). Meanwhile, some empirical studies show that most countries pass the turning point of their EKC at income levels of US$10 000–23 000 (at 1990 prices). There are, however, some exceptions; South Korea is one example. It took only 40 years from 1946–97 for South Korea to reach the peak point of its carbon dioxide emissions—at $4114 per capita GDP. This phenomenon can be explained by the flying-geese paradigm—an Asian version of the theory of catch-up.

China’s New Place in a World in Crisis
440
The flying-geese paradigm was developed by Japanese scholars as a way to view the technological development of South-East Asia, with Japan as a leading power. In the theory, Kaname Akamatsu (1962) postulated that Asian nations would catch up with the West as part of a regional hierarchy in which the production of commoditised goods would continuously move from industrialised countries to developing ones. The underdeveloped nations in the region could be considered as being ‘aligned successively behind the advanced industrial nations in the order of their different stages of growth in a wild-geese-flying pattern’. Using the theory, we can distinguish that one important factor that has induced the shortcut in the Kuznets curve of South Korea might be foreign direct investment (FDI) and its export-oriented economy.
Here, the effects of foreign capital introduction can be summarised in the following way. The introduction of foreign capital induces technological transfer to developing countries. The multinational cooperation brings with it new products in which new technologies, including environmentally related technology, are embodied. Through the production of the new products, developing countries can catch up with industrial-country technology, especially environmentally related technology, in a relatively short time.
It also introduces international standards of environmental control and greatly improves the environmental management of invested countries by stimulating the production of environmentally friendly products.
It brings environmental management and know-how to the developing countries and improves management by introducing new production methods (Toyota Production System, TPS, is one example).
It brings domestic enterprises into environmental investment and environmentally friendly product development by driving competition between foreign and domestic enterprises.
It improves people’s attitudes towards the environment and brings about changes in human behaviour, which in turn induces improvements in production activity.
The above functions can than generate a catch-up effect and improve productivity and environmental quality in a short rather than a long period.

Moving towards low carbon economic growth
441
The tunnel effect of the EKC
Recently, the idea of a low-carbon economy has become a popular idea for dealing with global warming issues. One of the methodologies used is the so-called ‘tunnel effect’ (Figure 19.4), which is a combination of the flying-geese model and the EKC.
Figure 19.4 The tunnel effect model
Source: Author’s own schema.
Figure 19.4 shows that one economy can take a shortcut from the first stage to the third stage through the tunnel. The tunnel effect can be described as a result of the catch-up effect and the effects of technological transfer through the FDI activities summarised above. The following conditions, however, will determine whether the tunnel effect can be realised.
1. The amount and speed of technological transfer from industrialised to developing countries.
2. The absorption capability of the accepting country, including human resources, management, institutional change, technology application and so on.
3. Technological innovation to utilise the efficiency of technological application in the developing country.
4. Policy orientation (one example is the low-carbon economy development path followed by some countries).

China’s New Place in a World in Crisis
442
The Chinese EKC
In this section, we test the new EKC hypothesis using historical Chinese data.
The high-growth–high-cost pattern
China has been experiencing high growth with a correspondingly high cost of environmental degradation. Some estimates put the figure for the cost of environmental degradation as high as 15 per cent of GDP.2 We review the evidence on environmental pollution in China in its high-growth period.
Table 19.1 is an international comparison of economic growth. It shows that China has high growth rates comparable with Japan and other Asian late-comer industrialisers, but China’s high-growth period has been more protracted than the others. What we can draw from this is that the phase of accelerating environmental pollution per capita in China could be more serious and the painful period might last longer than in other economies. In other words, it could take much longer for China to ensure that the EKC moves from the increasing to the decreasing phase of the curve.
Table 19.1 An international comparison of high-growth periods
Countries and regions Period Years Annual growth rate
Japan 1958–73 15 9.71973–88 15 3.61988–93 5 3.0
South Korea 1962–77 15 9.61977–87 10 8.01987–95 8 8.1
Taiwan 1962–77 15 10.11977–87 10 8.71987–95 8 6.6
China 1978–96 18 10.61981–90 10 9.4
1991–2000 10 10.12001–05 5 9.5
1978–2008 30 8.9
Sources: Economic Planning Agency of Japan 1996, Asian Economy 1996, Economic Planning Agency of Japan, Tokyo, Japan; National Bureau of Statistics (NBS) 2008, China Statistical Yearbook 2008, China Statistics Press, Beijing.

Moving towards low carbon economic growth
443
Figure 19.5 shows that as per capita GDP grows, energy consumption grows at a much higher rate. Meanwhile, Figure 19.6 shows that pollutants such as sulphur dioxide, waste water, solid waste and exhaust-gas emissions are increasing at a high rate. Smog dust is alone in displaying a increasing trend.
Figure 19.5 GDP growth and energy consumption in China, 1983–2005
Source: National Bureau of Statistics (NBS) 2006, China Statistical Yearbook 2006, CD-ROM version, China Statistics Press, Beijing.

China’s New Place in a World in Crisis
444
Figure 19.6 Pollutant emissions in China (log tonnes)
Source: National Bureau of Statistics (NBS) various years, China Statistical Yearbook, China Statistics Press, Beijing; State Environmental Protection Administration (SEPA) various years, China Environmental Statistics Yearbook, China Environmental Yearbook Press, Beijing.
The China EKC
Using the data sets of per capita GDP and per capita carbon dioxide emissions and sulphur dioxide emissions, we shaped China’s Kuznets curve using carbon dioxide emissions data from the World Bank’s World Development Indicators (2008) and sulphur dioxide data from the China Statistics Yearbook (NBS 2008). We found that carbon dioxide and sulphur dioxide emissions have very high correlations with GDP growth (Figures 19.7 and 19.8). More importantly, we found that both the EKCs of China appear to still be very much in the second stage and have not arrived at the turning point. This means that environmental pollution in China will continue to worsen for some time if the Chinese Government introduces no further restrictions to control pollution.

Moving towards low carbon economic growth
445
Figure 19.7 China’s EKC (carbon dioxide emissions and GDP per capita, 1980–2006)
Source: Author’s own estimation.
Can China catch up?
As discussed earlier, it is possible for a developing country to catch up with industrialised countries in terms of environmental improvement. The question here is whether China can catch up.
To answer this question, we analyse the trends of unit consumption of energy and unit carbon dioxide emissions through international comparison.
Figure 19.9 shows that China is at a high level of energy consumption measured by tonnes of petroleum equivalent per CNY1 million. Figure 19.10 shows the same outcome, but with a decreasing trend in per capita carbon dioxide emissions. This shows there is a possibility for China to take a shortcut in reducing pollution and increasing the pace of improvement of environmental quality.
China’s New Place in a World in Crisis
446
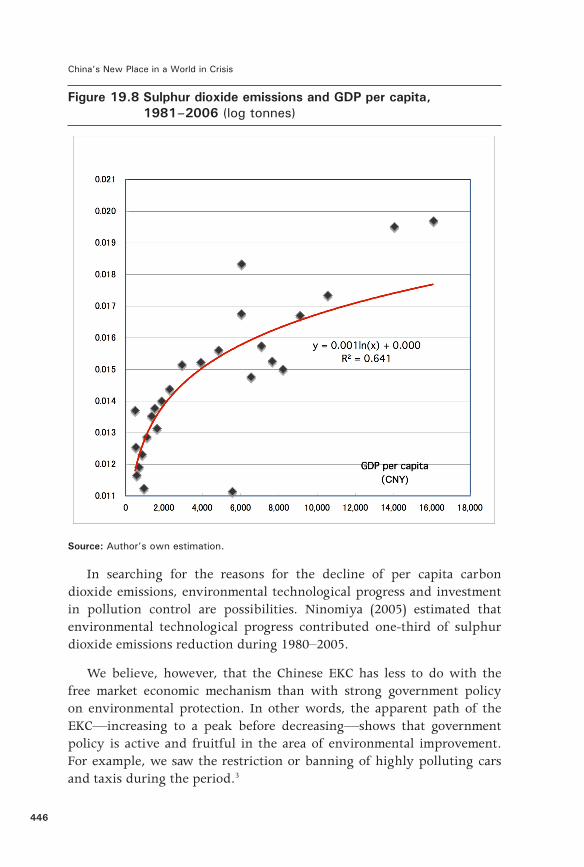
Figure 19.8 Sulphur dioxide emissions and GDP per capita, 1981–2006 (log tonnes)
Source: Author’s own estimation.
In searching for the reasons for the decline of per capita carbon dioxide emissions, environmental technological progress and investment in pollution control are possibilities. Ninomiya (2005) estimated that environmental technological progress contributed one-third of sulphur dioxide emissions reduction during 1980–2005.
We believe, however, that the Chinese EKC has less to do with the free market economic mechanism than with strong government policy on environmental protection. In other words, the apparent path of the EKC—increasing to a peak before decreasing—shows that government policy is active and fruitful in the area of environmental improvement. For example, we saw the restriction or banning of highly polluting cars and taxis during the period.3

Moving towards low carbon economic growth
447
Figure 19.9 Energy consumption per tonne per CNY1 million GDP (tonnes petroleum equivalent)
Source: National Bureau of Statistics (NBS) 2006, China Statistical Yearbook 2006, CD-ROM version, China Statistics Press, Beijing.
Figure 19.10 Carbon dioxide emissions per 100 GDP production, 1990–2006
Source: Calculated using the data from World Bank 2008, World Development Indicators 2008, CD-ROM version, The World Bank, Washington, DC.

China’s New Place in a World in Crisis
448
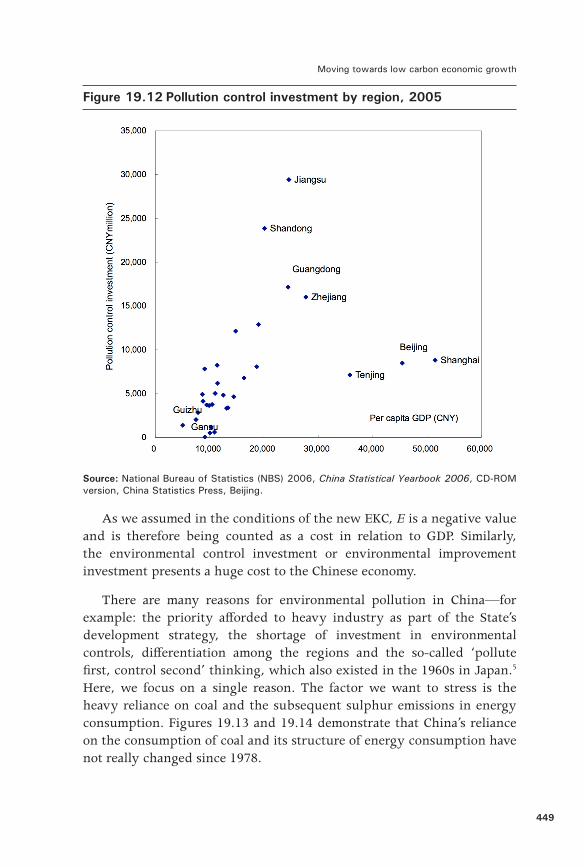
As we know, the Chinese Government has been promulgating a substantial number of regulations on pollution control and has invested large amounts of money in environmental improvement schemes (Figure 19.11). Just as there are wide regional differences in economic growth and income distribution, the same can be said of investment in environmental controls. As with regional income disparity in China, there are large differences in environmental investment (Figure 19.12). Data show that the provinces in eastern China—such as Guangdong, Jiangsu, Zhejiang and Shandong—have invested the most in pollution control, while the figures for the provinces in central and western China, such as Guizhou and Gansu, are much lower.4
Figure 19.11 Pollution control investment and its share in GDP
Source: National Bureau of Statistics (NBS) 2006, China Statistical Yearbook 2006, CD-ROM version, China Statistics Press, Beijing.
Moving towards low carbon economic growth
449
Figure 19.12 Pollution control investment by region, 2005
Source: National Bureau of Statistics (NBS) 2006, China Statistical Yearbook 2006, CD-ROM version, China Statistics Press, Beijing.
As we assumed in the conditions of the new EKC, E is a negative value and is therefore being counted as a cost in relation to GDP. Similarly, the environmental control investment or environmental improvement investment presents a huge cost to the Chinese economy.
There are many reasons for environmental pollution in China—for example: the priority afforded to heavy industry as part of the State’s development strategy, the shortage of investment in environmental controls, differentiation among the regions and the so-called ‘pollute first, control second’ thinking, which also existed in the 1960s in Japan.5 Here, we focus on a single reason. The factor we want to stress is the heavy reliance on coal and the subsequent sulphur emissions in energy consumption. Figures 19.13 and 19.14 demonstrate that China’s reliance on the consumption of coal and its structure of energy consumption have not really changed since 1978.

China’s New Place in a World in Crisis
450
Figure 19.13 Structure of energy consumption, 1978
Source: National Bureau of Statistics (NBS) 2006, China Statistical Yearbook 2006, CD-ROM version, China Statistics Press, Beijing.
Figure 19.14 Structure of energy consumption, 2005
Source: National Bureau of Statistics (NBS) 2006, China Statistical Yearbook 2006, CD-ROM version, China Statistics Press, Beijing.
Conclusion
This chapter discussed the Chinese EKC and showed that during the high growth stage, environmental destruction could constrain future economic growth. This is what has been called ‘the cost of high growth’. Our environmentally constrained growth model demonstrated that increasing pollution could induce a strong environmental constraint on economic growth and force the growth path to fall into a trap of low growth–high pollution. It was argued that the benevolent path of the theoretical EKC would not appear without the introduction of appropriate pollution-suppressing technologies.

Moving towards low carbon economic growth
451
Our adapted growth theory assumes, however, that the technological innovation of environmental measures can solve the environmental constraints placed on economic growth and, in turn, can promote sustainable development. The new EKC derived from this analysis shows that pollution-suppressing technology can push an economy onto the traditional EKC path. In other words, it promotes the growth path to arrive at the third stage—namely, the stage of sustainable development. The theory also illustrates that pollution can be reduced through technological progress/transfer. Endowing this factor with increasing returns to scale in an adapted neoclassical framework allows the system to generate a sustainable model of growth in output per capita. The importance of this theory is that it gives countries with environmental issues a chance to solve their problems and catch up with industrialised countries through a shortcut in economic development.
The Chinese case illustrates that environmental pollution has been worsening seriously since the beginning of its period of high growth. China is a production factory for the world but also a pollutant factory for the world. The per capita and unit data of carbon dioxide emissions indicate, however, that it is possible to reduce pollution and improve the environment through the environmental policy and environmentally related technological progress. Recent developments indicate that policy changes need to be made to expedite the market-based turning point for environmentally friendly growth.
Consequently, it will be a long march for China to arrive at the third stage of its EKC and realise sustainable development. It is time for China to transform its development pattern from ‘black growth’ to ‘green growth’ and change the coloured mice to white or return the mice to their natural colours.
China created an economic miracle in the past 30 years and we expect that China can create another miracle in its environmental protection in the next 30 years.

China’s New Place in a World in Crisis
452
References
Akamatsu, K. 1962, ‘A historical pattern of economic growth in developing countries’, Journal of Developing Economies, vol. 1, no. 1 (March–August), pp. 3–25.
Chinese Academy of Science (CAS) 2009, China Sustainable Development Strategy Report 2009, Science Press, Beijing.
Economic Planning Agency of Japan 1996, Asian Economy 1996, Economic Planning Agency of Japan, Tokyo, Japan.
Harrod, R. 1948, Towards a Dynamic Economics: Some recent developments of economic theory and their application to policy, Macmillan, London.
Kuznets, S. 1955, ‘Economic growth and income inequality’, American Economic Review, vol. 45, no. 1, pp. 1–28.
Liu, J. and Diamond, J. 2005, ‘China’s environment in a globalizing world’, Nature, vol. 435 (30 June).
National Bureau of Statistics (NBS) 2006, China Statistical Yearbook 2006, CD-ROM version, China Statistics Press, Beijing.
—— 2008, China Statistical Yearbook 2008, China Statistics Press, Beijing.
—— various years, China Statistical Yearbook, China Statistics Press, Beijing.
Ninomiya, Y. 2005, ‘An empirical analysis of economic growth and SO2 emission in China—examination of the environment Kuznets curve’, Journal of International Cooperation Studies, vol. 21, no. 1.
Rawski, T. 2002, ‘Measuring China’s recent GDP growth: where do we stand?’, China Economic Quarterly, vol. 2, no. 1 (October).
Solow, R. 1956, ‘A contribution to the theory of economic growth’, Quarterly Journal of Economics, vol. 70.
State Environmental Protection Administration (SEPA) 2006, China Green National Accounting—Study Report 2004, [Public version], National Bureau of Statistics, Beijing.
—— various years, China Environmental Statistics Yearbook, China Environmental Yearbook Press, Beijing.
World Bank 2008, World Development Indicators, The World Bank, Washington, DC.

Moving towards low carbon economic growth
453
Xue, J. and Arayama, Y. 2004, ‘Western development and environment problem in China’, in C. Yulian and L. Hai Ying (eds), Western Development Project in China: The actual problems and the policy, Finance and Economics Press, Beijing.
Xue, J., Arayama, Y. and Peng, J. (eds) 2002, Economic Growth and Environment Issues in China, Northwest University of Finance and Economics, Dalian.
—— 2003, Economic Development and Environment Control in China: Theory and the actual, Northeast University of Finance and Economics, Dalian.
Endnotes1. Here, we define ‘growth’ as the growth rate of per capita GDP.
2. According to Liu and Diamond (2005), the cost of environmental damage to the economy is 8–15 per cent of China’s GDP. Meanwhile, an official research report estimated a cost of CNY51 billion from environmental damage in 2004—3.05 per cent of total GDP. The share will reach 6.8 per cent, however, if environmental damage is not controlled with current technology (SEPA 2005).
3. There could be other reasons for this result. One might be the data problem as summarised by the ‘Rawski puzzle’, which states that the official statistical data, especially GDP growth, are not coordinated to the growth of energy production and consumption (Rawski 2002). The data published in the Statistical Yearbooks are therefore suspicious because we know that data collection related to pollution is very difficult and the statistical system for such data is not yet mature in China.
4. For the issue of regional difference in environmental controls, see Xue and Arayama (2004) and Xue et al. (2003).
5. For the experiences of high growth and high pollution in Japan and China, see Xue et al. (2003).
