jitesh lalwani jims project of nfm division mmtc
TRANSCRIPT
Identifying various motivational factors influencing the purchase/selection decisions of various buyers of Non ferrous metals in India
and create perceptual maps for the same
At
MMTC Limited, New Delhi
Submitted to: Mr. Vikram.s.meena (DGM NFM Division, MMTC)
Mr. Diwa kujur (Deputy Manager NFM Division,MMTC)
Under the guidance of: Mr. Ramakrishna (prof. Jims)
Identifying various motivational factors influencing the purchase/selection decisions of various buyers of Non ferrous metals in India
and create perceptual maps for the same
By
Jitesh lalwani
Under the guidance of
Mr. Vikram.s.meena Prof. Ramakrishna (DGM NFM Division, MMTC) ProfessorMMTC Ltd. Jims, kalkaji
2
CERTIFICATE OF APPROVAL
The following Summer Project Report titled “Identifying various motivational factors influencing the purchase/selection decisions of various buyers of Non ferrous metals in India and create perceptual maps for the same” is hereby approved as a certified study in management carried out and presented in a manner satisfactory to warrant its acceptance as a prerequisite for the award of Post-Graduate Diploma in Business Management for which it has been submitted. It is understood that by this approval the undersigned do not necessarily endorse or approve any statement made, opinion expressed or conclusion drawn therein but approve the Summer Project Report only for the purpose it is submitted.
Summer Project Report Examination Committee for evaluation of Summer Project Report
Name Signature
1. Faculty Examiner _______________________ ___________________
2. PG Summer Project Co-coordinator _______________________ ___________________
3
CERTIFICATE FROM SUMMER PROJECT GUIDES
This is to certify that Mr jitesh lalwani, a student of the Post-Graduate Diploma in Business Management has worked under our guidance and supervision. This Summer Project Report has the requisite standard and to the best of our knowledge no part of it has been reproduced from any other summer project, monograph, report or book.
Mr. Ramakrishna Organizational Guide: Mr.Vikram.s.meenaProfessor Designation: DGM, Non ferrous Metal DeptJims, kalkaji Organization: MMTC Ltd.
Date: Date:
4
DECLARATION
I jitesh lalwani student of Post Graduate Diploma in Management at jims kalkaji, jagannath International Management school, New Delhi hereby declare that I have completed project on “Identifying various motivational factors influencing the purchase/selection decisions of various buyers of Non ferrous metals in India and create perceptual maps for the same” at MMTC Limited, New Delhi.
I further declare that the information presented in this project is true and original to the best of my knowledge.
Jitesh lalwani
PGDM
Jims
Jagannath international Management school, New Delhi
5
EXECUTIVE SUMMARY
MMTC was established in 1963, in the era where public sector companies dominated the industry and private players were either not allowed entering in the industry or if they were they had to obtain a license which in contrary was difficult to get. Consequently the public sector companies were acting as monopolies (with the aim of welfare and growth for the country at large). However the year 1991 brought with itself a change. Change in the form of globalization, decentralization and privatization. This change like a coin with two sides had both the positives and the negatives. No second thoughts that due to this change the IP numbers improved, the GPD improved etc, however this change brought with itself competition for the existing public sector. This competition was from both global and local players.
Thus once where MMTC had 100% market share in trading of non ferrous metals, the figures now have dropped drastically. Thus this project intends to study how and why competition took over MMTC, i.e. why customers prefer other companies in front of MMTC through perceptual mapping.
The factors chosen for perceptual mapping are:1. Cost
2. Quality
3. Delivery time
4. Flexible order quality
5. Longer pricing period
6. Transparent processing
7. Payment terms
8. Credibility
9. Terms of L/C
10. Loyalty
6
ContentsACKNOWLDGEMENT.................................................................................................................9
MMTC Limited.............................................................................................................................10
NON FERROUS METALS...........................................................................................................12
ABOUT LONDON METALS EXCHANGE................................................................................14
ALUMINIUM................................................................................................................................15
Aluminum - LME Cash Prices..................................................................................................17
NICKEL.........................................................................................................................................18
Nickel - LME Cash Prices.........................................................................................................20
COPPER........................................................................................................................................21
Copper - LME Cash Prices........................................................................................................22
LEAD.............................................................................................................................................23
Lead - LME Cash Prices............................................................................................................25
TIN.................................................................................................................................................26
Tin - LME Cash Prices..............................................................................................................28
ZINC..............................................................................................................................................29
Zinc - LME Cash Prices............................................................................................................31
FLUCTUATIONS IN THE PRICES OF NON FERROUS METALS.........................................32
India’s import-export quantity of Non Ferrous Metals..................................................................34
MMTC’s SHARE of IMPORTS...................................................................................................35
II. THE PROJECT......................................................................................................................37
PROBLEM DEFINATION.......................................................................................................37
WHAT IS PERCEPTUAL MAPPING.....................................................................................38
RESEARCH APPROACH............................................................................................................39
Exploratory Research.................................................................................................................39
Company’s Chosen....................................................................................................................39
ATTRIBUTES CHOSEN..........................................................................................................39
QUESTIONNAIRE DESIGN...................................................................................................40
DATA ANALYSIS.......................................................................................................................42
T-TEST ANALYSIS.....................................................................................................................48
ANNOVA AND TUKEY KRAMER............................................................................................54
FACTOR ANALYSIS-MMTC.....................................................................................................65
PERCEPTUAL MAPS..................................................................................................................67
7
RECOMMENDATIONS AND CONCLUSION..........................................................................71
REFERENCES..............................................................................................................................73
Appendix........................................................................................................................................74
8
ACKNOWLDGEMENT
No project sees the light of day without help of certain individuals. I would like to express my sincere gratitude to people who were instrumental in making this project possible.
I would like to thank Mr. Diwa kujur (DM, NFM, Dept.) for giving me an opportunity to
work in this highly esteemed organization and for guiding me to complete my project
I would like to extend our heartfelt thanks to Mr.vikram.s.meena (Deputy General
Manager NFM Division) MMTC Ltd. For helping me to initialize, conceptualize and
finish this research. I am indebted for the constant support and direction provided at
each stage of the research. I am grateful to entire nfm staff of mmtc ltd.for guiding me
all through the project and helping me wherever needed.
I am also grateful to Prof. Ramakrishna, faculty Guide, Jims for providing me with his
valuable suggestions whenever required and correcting me all through my project.
The time and efforts of all the people who have filled the questionnaire is also valued
and I thank them as well.
Finally we thank the jagannath international Management school, New Delhi for
providing us the opportunity & means to complete this project.
The results and learning’s of research project helped me to gain in-depth knowledge of
the subject
Jitesh lalwani
PGDM
Jims, kalkaji
9
MMTC Limited
Minerals and Metals Trading Corporation of India
MMTC where opportunities are explored consistently and continuously with dedication and persistence was established in 1963. The last four decades of MMTC's dedication has richly rewarded the company by placing the company in its present enviable position of India's largest international trading house Minerals and Metals Trading Corporation of India Ltd. (MMTC) is one of the two highest earners of foreign exchange for India and India's largest public sector trading body. It is not only handling the export of primary products such as coal, iron ore, and manufactured agro and industrial products but also imports important commodities such as ferrous and nonferrous metals for industry, and agricultural fertilizers. MMTC's diverse trade activities cover Third Country Trade, Joint Ventures and Link Deals and all modern forms of international trading. The Company has vast international trade network, spanning almost in all countries in Asia, Europe, Africa, Oceania, Americas and also includes a wholly owned international subsidiary in Singapore.
MMTC is one of the two highest foreign exchange earner for India, is a leading international trading company with a turnover of over US$ 7 billion. It is the largest international trading company of India and the first Public Sector Enterprise to be accorded the status of "FIVE STAR EXPORT HOUSE" by Government of India for long standing contribution to exports. Minerals and metals trading corporation is India’s largest foreign trade enterprise with 1882 employees and market capitalization of Rs 1,586,150,000,000.
India’s Largest trading GiantDIA'S LARGEST TRADING GIANT NDIA India’s Leading Exporter of Minerals
One of the largest Buyer’s of Fertilizers
The single largest bullion trader in Indian sub-continent
The biggest importer of Non-ferrous Metal and Industrial Raw Material to INDIA
10
MMTC’S UNIQUE POSITION
MMTC has remained one of the largest institutional buyers of fertilizers across the globe. MMTC has built this unique position through its continued presence for about four decades in the fertilizer arena internationally.
MMTC has been successful in building confidence both amongst its suppliers as well as its buyers in India and abroad through its unstinted transparency in dealings and commitments to contractual terms of international trade.
MMTC, through these four decades of buying, selling and net-working, has created a strong leverage for itself, benefiting both the suppliers as well as the buyers. It thereby adds value in the supply chain with its reliable sourcing ability.
MMTC, through these four decades of buying, selling and net-working, has created a strong leverage for itself, benefiting both the suppliers as well as the buyers. It thereby adds value in the supply chain with its reliable sourcing ability.
MMTC has remained one of the largest institutional buyers of fertilizers across the globe.
.
11
NON FERROUS METALS
Non Ferrous Metals are basically metals not containing iron or its alloys or compounds. Copper, brass, bronze, aluminum bronze, lead, pewter, zinc and other metals to which a magnet will not adhere are non ferrous metals.
MMTC is India's largest seller of imported non-ferrous metals viz. copper, aluminum, zinc, lead, tin and nickel. It also sells imported minor metals like magnesium, antimony, silicon and mercury, as also industrial raw materials like asbestos and also steel and its products.
MMTC imports quality products conforming to international specifications like ASTM or BSS or LME approved brands.
MMTC is a proud winner of gold trophy for exports of Engineering and Metallurgical product in non-SSI Sector and also awarded the All India Trophy for highest export in the category of prime metal by EEPC.
The Company also provides risk management tools such as future trading and hedging options through international/national commodity exchanges offering value added services for the benefits of its customers.
Imports are the basic work at NFM division. All non ferrous metals ranging from Tin, Nickel, Zinc, Lead, Aluminum etc including Minor metals are traded in this department. The Imports are done through a very stringent and cautious procedure confirming the safety and secrecy of transactions done at the division. Ethics and professionalism drives in every member of the team working in this division.
Process of Buying:
The process of buying is a very lengthy task followed by a lot of research and paper work supporting the decision of buying. NFM division mostly buys the stock whenever there is a demand by a customer in market.
12
The buying process at MMTC:
13
Tender is floated (usually through
newspapers)
offer comes from seller within due
date and time
L1(lowest price) bidder is selected
Letter of Intent is made and contract
is finallized
the material is shipped and it reaches the
required port destination.
ABOUT LONDON METALS EXCHANGEEstablished for over 130 years and located in the heart of The City of London, the London Metal Exchange is the world’s premier non-ferrous metals market. It offers futures and options contracts for aluminium, copper, nickel, tin, zinc and lead plus two regional aluminium alloy contracts. In 2005 the Exchange launched the world’s first futures contracts for plastics; for polypropylene and linear low density polyethylene, with the introduction of regional plastics contracts in 2007. In addition, it offers LMEminis, which are smaller-sized contracts for copper, aluminium and zinc plus an index contract (LMEX).
The Exchange provides a transparent forum for all trading activity and as a result helps to ‘discover’ what the price of material will be months and years ahead. This helps thel industry to plan forward in a world subject to often severe and rapid price movements. Such is the liquidity at the Exchange that the prices ‘discovered’ at the LME are recognised and relied upon by industry throughout the world.
The LME is a highly liquid market and in 2007 achieved volumes of 93 million lots, equivalent to $9,500 billion annually and between $35-45 billion on an average business per day. Despite its London location the LME is a global market with an international membership and with more than 95% percent; of its business coming from overseas.
Being a principal-to-principal market, the only organizations able to trade are its member firms, of which there are various categories. LME members provide the physical industry with access to the market, to the risk management tools and to the delivery mechanism. Trading takes place across three trading platforms: through open-outcry trading in the ‘Ring’, through an inter-office telephone market and through LME Select, the Exchange’s electronic trading platform.
The Role of the London Metal Exchange Limited
The objective of The London Metal Exchange Limited is to provide facilities, along with a management and regulatory structure, for trading in LME contracts. Although its activities are closely related to the physical markets, it operates with in the regulatory framework of the Financial Services and Markets Act 2000.
It is a Recognized Investment Exchange (RIE), regulated directly by the Financial Services Authority (FSA). The Act closely defines the conditions under which the Exchange operates and requires that as an RIE it maintains orderly markets in all its contracts.
Where it carries out its activities in the United States (US), the Exchange is governed by the relevant US legislation and by the Commodities and Futures Trading Commission (CFTC). It is also subject to any relevant directives of the European Union.
14
ALUMINIUM
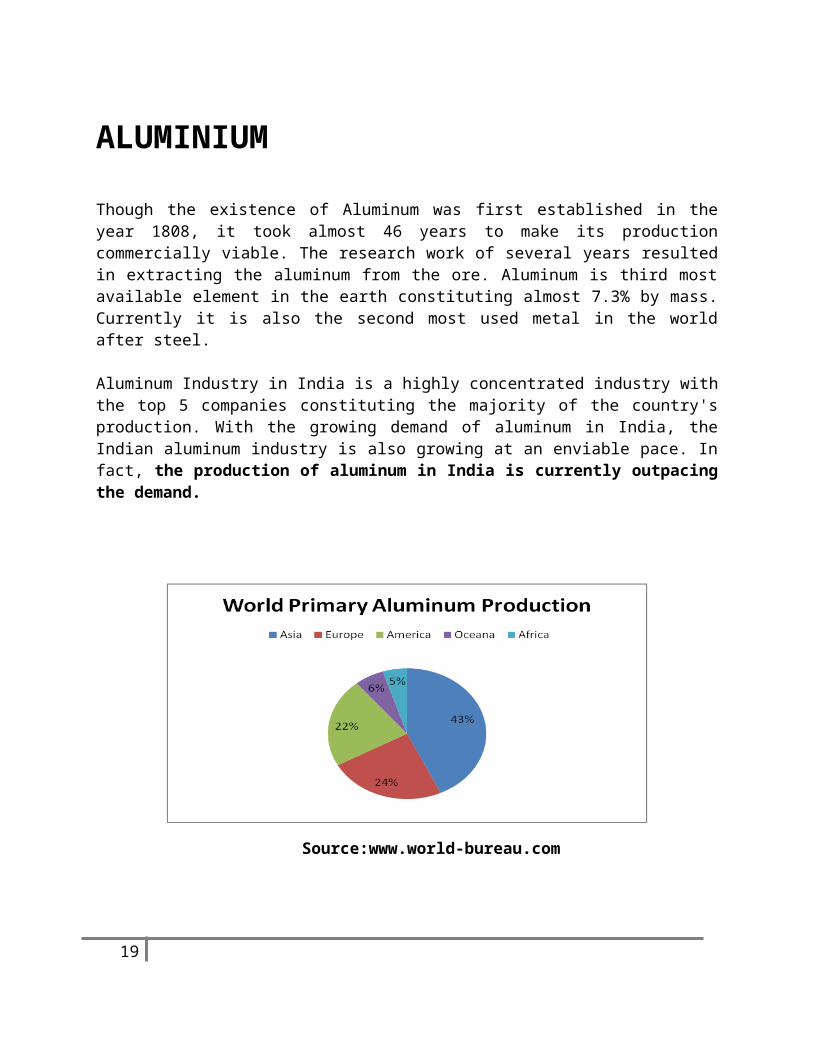
Though the existence of Aluminum was first established in the year 1808, it took almost 46 years to make its production commercially viable. The research work of several years resulted in extracting the aluminum from the ore. Aluminum is third most available element in the earth constituting almost 7.3% by mass. Currently it is also the second most used metal in the world after steel.
Aluminum Industry in India is a highly concentrated industry with the top 5 companies constituting the majority of the country's production. With the growing demand of aluminum in India, the Indian aluminum industry is also growing at an enviable pace. In fact, the production of aluminum in India is currently outpacing the demand.
Source:www.world-bureau.com
The ProductionIndia lies at the eighth position in the list of leading primary aluminium producers in the world. India saw a significant growth in aluminium production in the past five years. In 2006-07, the production target of aluminium in India laid by the Ministry of Mines, Government of India was 1,153 KT, which was augmented to 1,237 KT in the next year (2007-08). Due to the growing demand from the construction, electrical, automobiles and packaging industry, the production of aluminium also hiked up. In FY 09, the total aluminium production in India was around 1.35 million tonnes.
15
The ConsumptionAfter a stagnant consumption of primary aluminium in India from the end of 1990s to 2002 (when the consumptions were between 500 – 600 KT), it started rising sharply since 2002. The consumption reached at 1,080 KT in 2006. The consumption of aluminium in India is dominated by the industries like power, infrastructure, and transportation etc.
The Major PlayersThe Indian aluminium industry is dominated by four or five companies that constitute the majority of India's aluminium production. Following are the major players in the Indian aluminium industry:
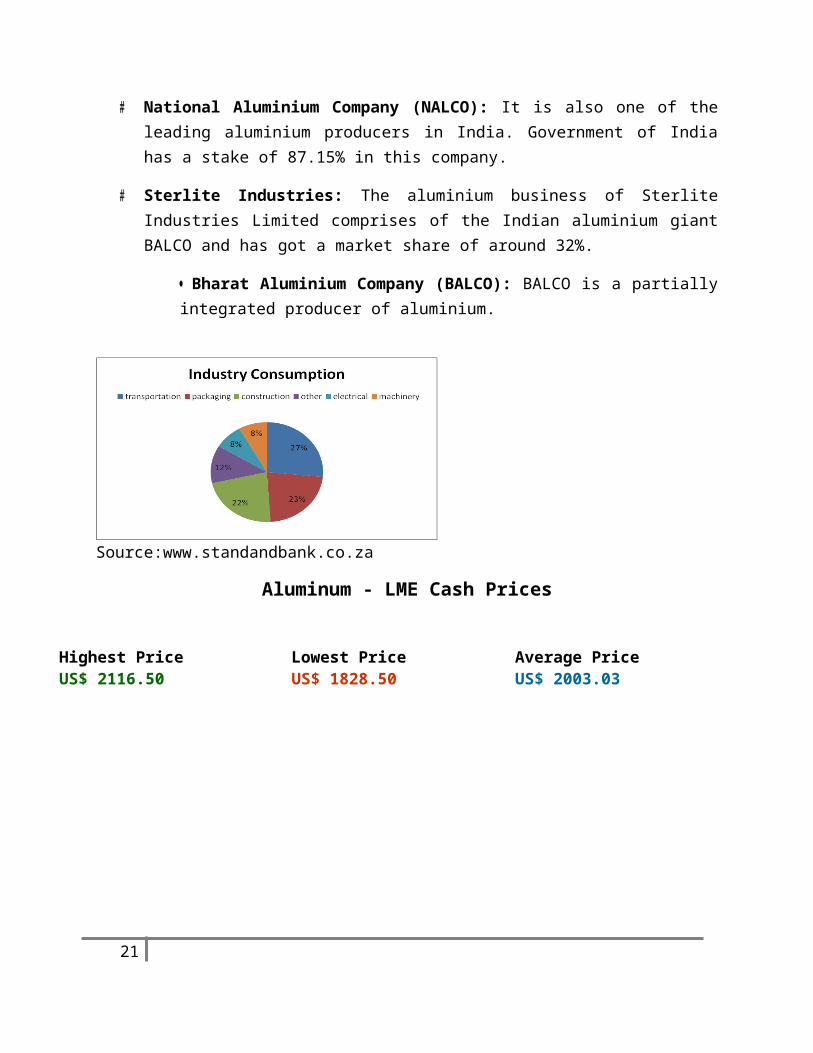
Hindustan Aluminium Company (HINDALCO): it is the biggest player in the aluminium industry in India with around 39% of market share. An Aditya Birla Group flagship company, HINDALCO has its aluminium plant at Renukoot in Uttar Pradesh. It has various aluminium products with a market share of 42% in primary aluminium, 20% in extrusions 63% in rolled products, 31% in wheels and 44% in foils.
National Aluminium Company (NALCO): It is also one of the leading aluminium producers in India. Government of India has a stake of 87.15% in this company.
Sterlite Industries: The aluminium business of Sterlite Industries Limited comprises of the Indian aluminium giant BALCO and has got a market share of around 32%.
Bharat Aluminium Company (BALCO): BALCO is a partially integrated producer of aluminium.
Source:www.standandbank.co.za
16
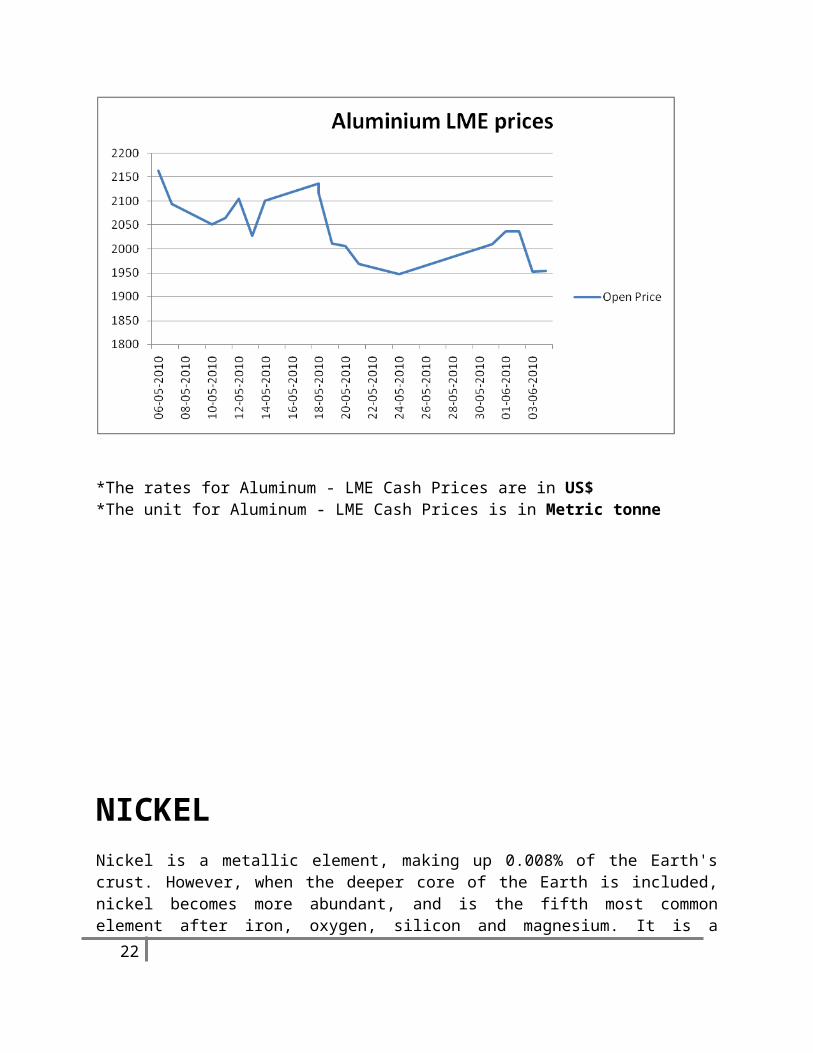
Aluminum - LME Cash Prices
Highest Price US$ 2116.50
Lowest PriceUS$ 1828.50
Average PriceUS$ 2003.03
*The rates for Aluminum - LME Cash Prices are in US$*The unit for Aluminum - LME Cash Prices is in Metric tonne
17
NICKELNickel is a metallic element, making up 0.008% of the Earth's crust. However, when the deeper core of the Earth is included, nickel becomes more abundant, and is the fifth most common element after iron, oxygen, silicon and magnesium. It is a silvery-white lustrous metal with a slight golden tinge. It is one of the four ferromagnetic elements at about room temperature, the other three being iron, cobalt and gadolinium.
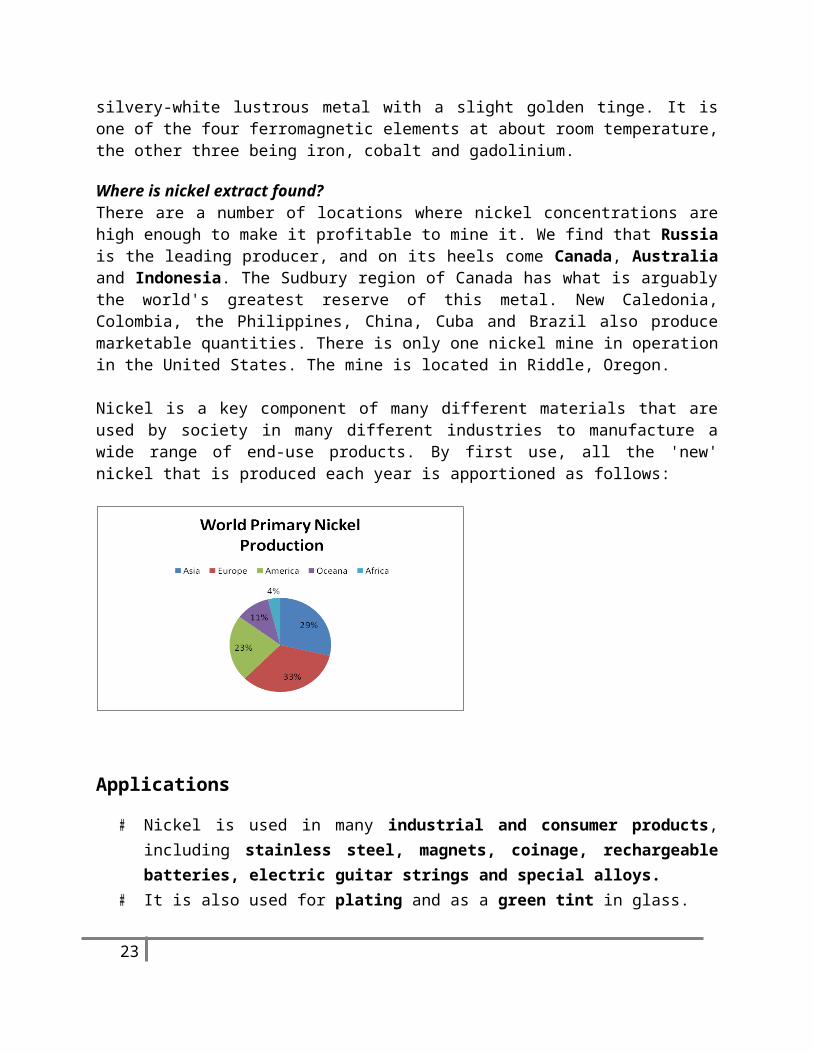
Where is nickel extract found?There are a number of locations where nickel concentrations are high enough to make it profitable to mine it. We find that Russia is the leading producer, and on its heels come Canada, Australia and Indonesia. The Sudbury region of Canada has what is arguably the world's greatest reserve of this metal. New Caledonia, Colombia, the Philippines, China, Cuba and Brazil also produce marketable quantities. There is only one nickel mine in operation in the United States. The mine is located in Riddle, Oregon.
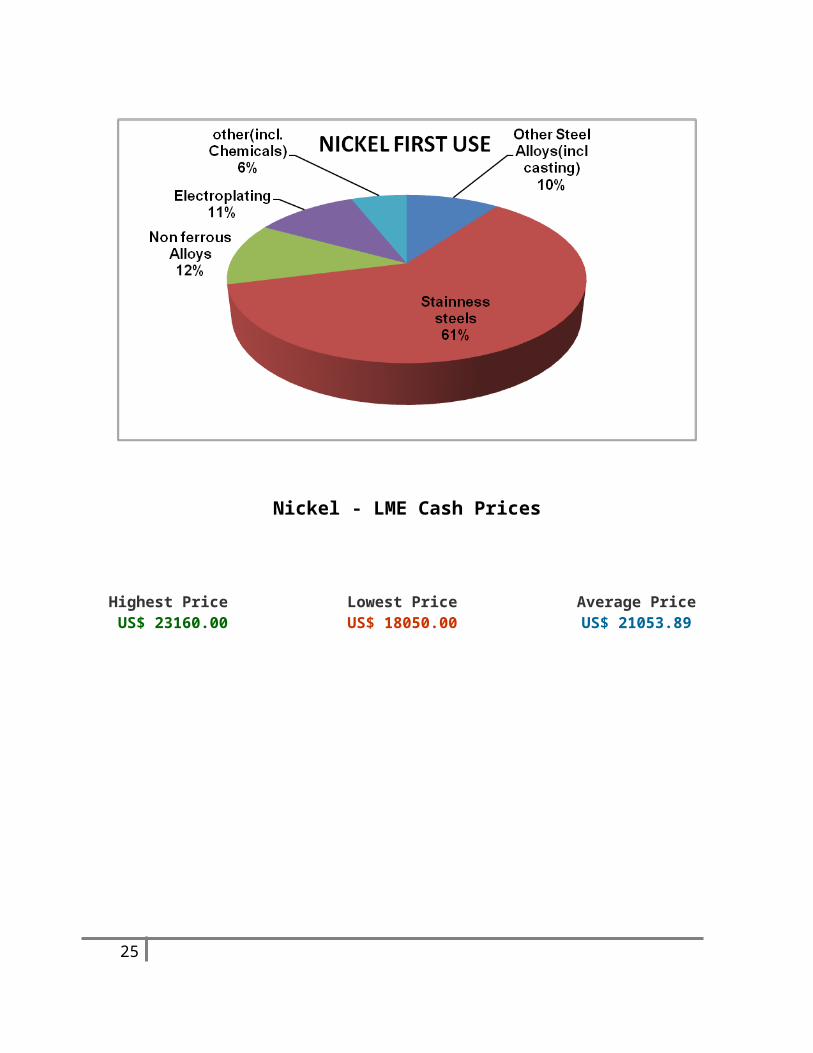
Nickel is a key component of many different materials that are used by society in many different industries to manufacture a wide range of end-use products. By first use, all the 'new' nickel that is produced each year is apportioned as follows:
Applications
Nickel is used in many industrial and consumer products, including stainless steel, magnets, coinage, rechargeable batteries, electric guitar strings and special alloys.
It is also used for plating and as a green tint in glass. Nickel is pre-eminently an alloy metal, and its chief use is in the nickel steels and nickel
cast irons, of which there are many varieties. It is also widely used in many other alloys, such as nickel brasses and bronzes, and
alloys with copper, chromium, aluminum, lead, cobalt, silver, and gold.
18
Nickel is also used in fire assay as a collector of platinum group elements, as it is capable of full collection of all 6 elements, in addition to partial collection of gold.
Nickel is used in thousands of applications in virtually every industry
19
24%
16%
16%15%
11%
10% 7%
Industries in which nickel is used
Engineering
Metal Goods
Transportation
Eectro & electronic
Building & Construction
Tubular Products
others
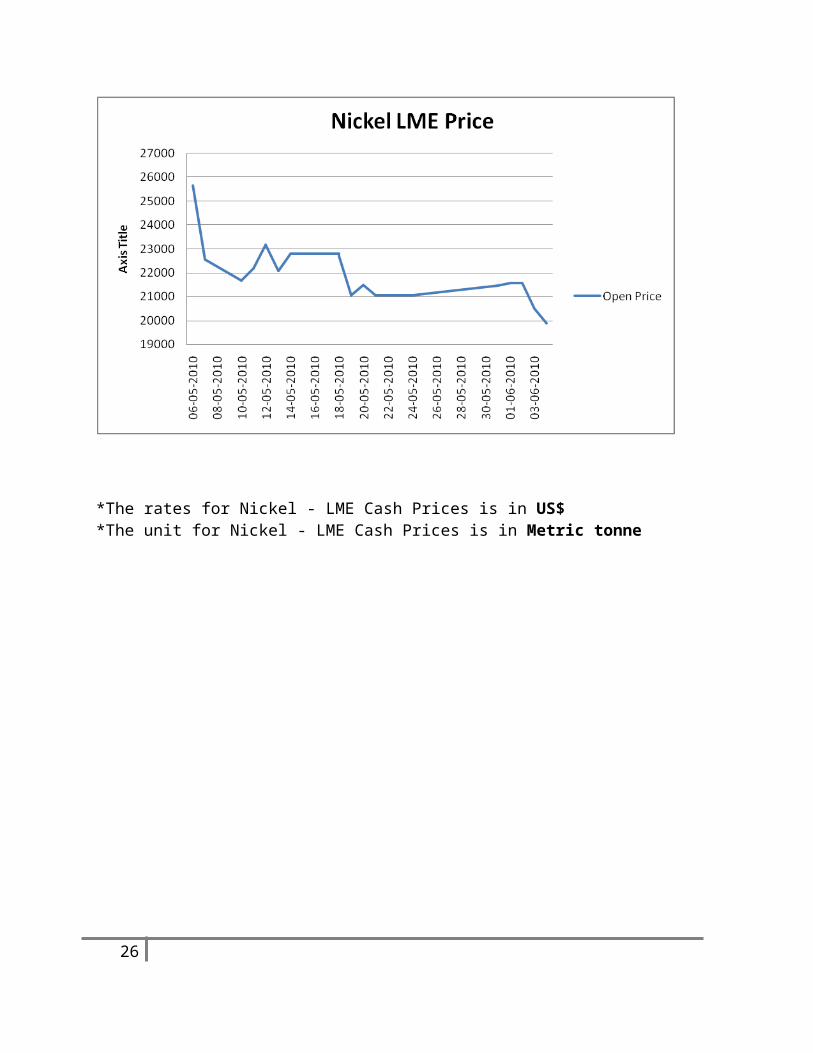
Nickel - LME Cash Prices
Highest Price US$ 23160.00
Lowest PriceUS$ 18050.00
Average PriceUS$ 21053.89
*The rates for Nickel - LME Cash Prices is in US$*The unit for Nickel - LME Cash Prices is in Metric tonne
20
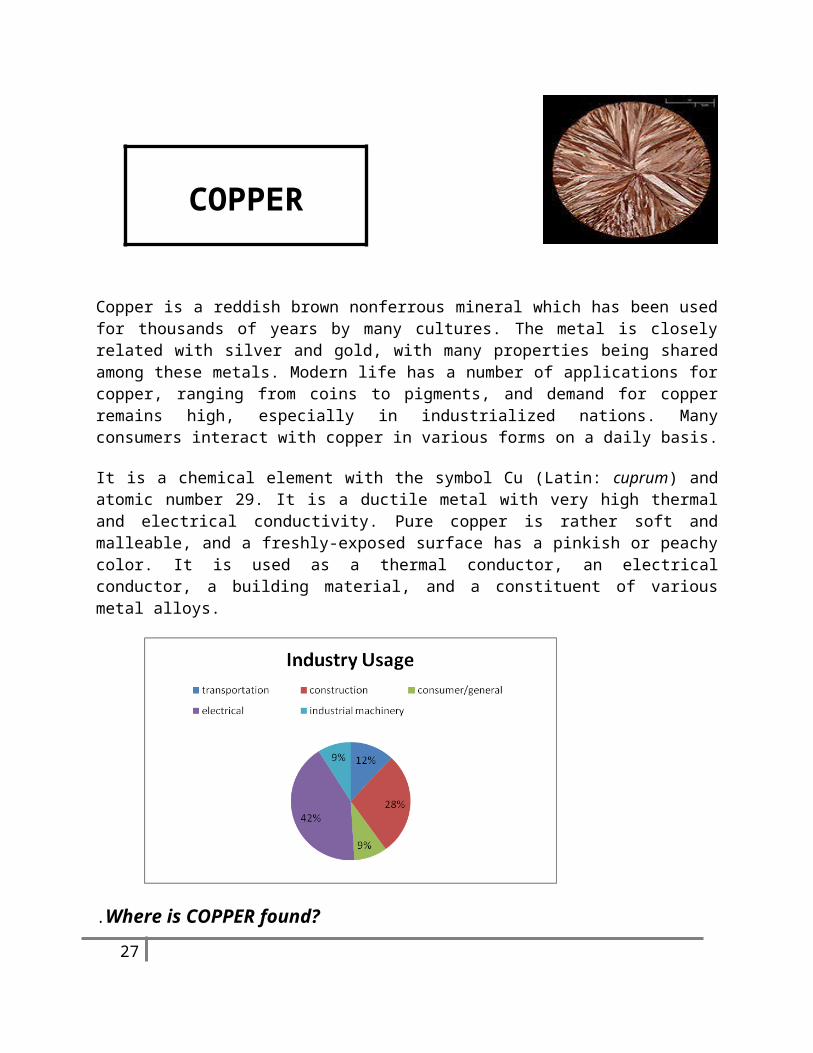
Copper is a reddish brown nonferrous mineral which has been used for thousands of years by many cultures. The metal is closely related with silver and gold, with many properties being shared among these metals. Modern life has a number of applications for copper, ranging from coins to pigments, and demand for copper remains high, especially in industrialized nations. Many consumers interact with copper in various forms on a daily basis.
It is a chemical element with the symbol Cu (Latin: cuprum) and atomic number 29. It is a ductile metal with very high thermal and electrical conductivity. Pure copper is rather soft and malleable, and a freshly-exposed surface has a pinkish or peachy color. It is used as a thermal conductor, an electrical conductor, a building material, and a constituent of various metal alloys.
.Where is COPPER found?
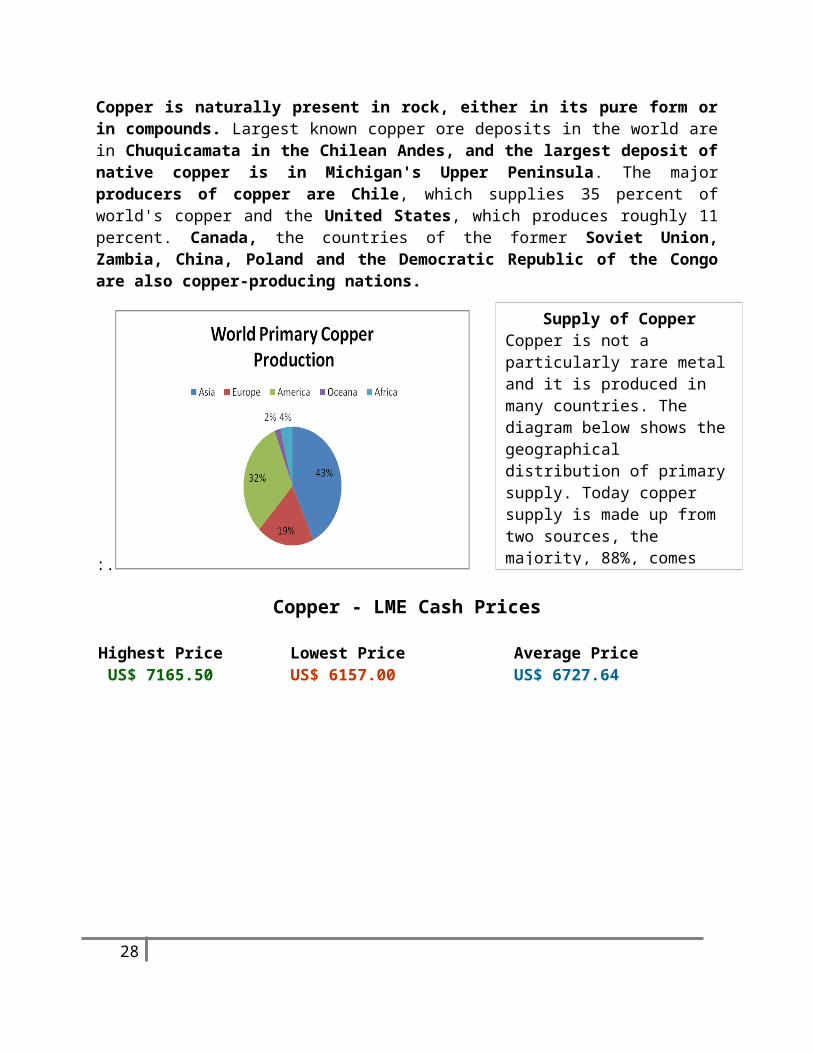
Copper is naturally present in rock, either in its pure form or in compounds. Largest known copper ore deposits in the world are in Chuquicamata in the Chilean Andes, and the largest deposit of native copper is in Michigan's Upper Peninsula. The major producers of copper are Chile, which supplies 35 percent of world's copper and the United States, which produces roughly 11 percent. Canada, the countries of
21
COPPER
the former Soviet Union, Zambia, China, Poland and the Democratic Republic of the Congo are also copper-producing nations.
:.
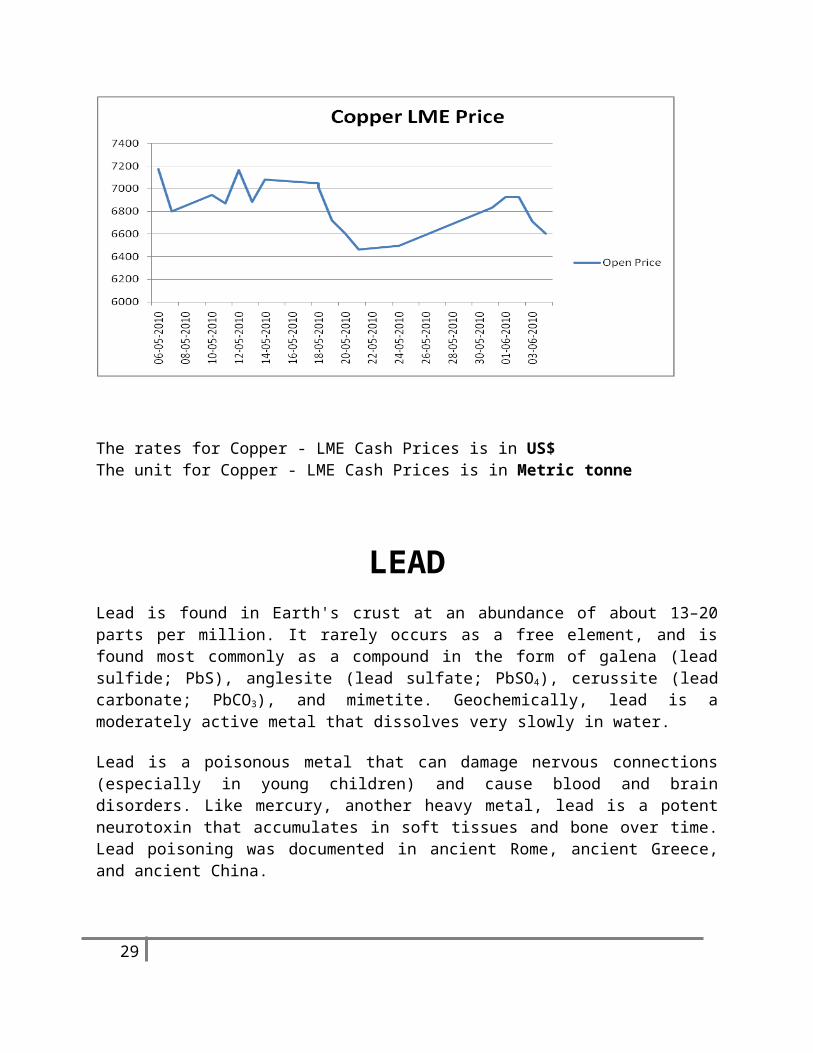
Copper - LME Cash Prices
Highest Price US$ 7165.50
Lowest PriceUS$ 6157.00
Average PriceUS$ 6727.64
The rates for Copper - LME Cash Prices is in US$The unit for Copper - LME Cash Prices is in Metric tonne
22
Supply of CopperCopper is not a particularly rare metal and it is produced in many countries. The diagram below shows the geographical distribution of primary supply. Today copper supply is made up from two sources, the majority, 88%, comes from primary production, that new copper that is mined from the ground, but of growing importance is secondary supply which accounts for 12% of total refined copper supply.
LEADLead is found in Earth's crust at an abundance of about 13–20 parts per million. It rarely occurs as a free element, and is found most commonly as a compound in the form of galena (lead sulfide; PbS), anglesite (lead sulfate; PbSO4), cerussite (lead carbonate; PbCO3), and mimetite. Geochemically, lead is a moderately active metal that dissolves very slowly in water.
Lead is a poisonous metal that can damage nervous connections (especially in young children) and cause blood and brain disorders. Like mercury, another heavy metal, lead is a potent neurotoxin that accumulates in soft tissues and bone over time. Lead poisoning was documented in ancient Rome, ancient Greece, and ancient China.
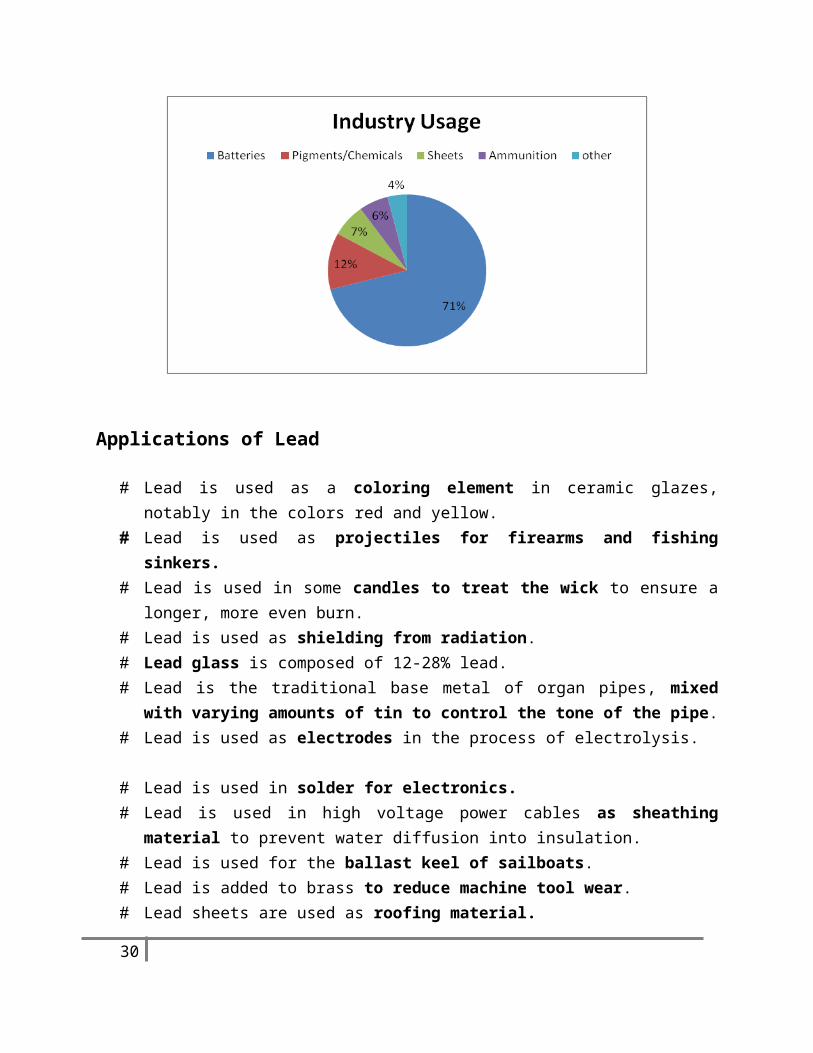
Applications of Lead
Lead is used as a coloring element in ceramic glazes, notably in the colors red and yellow.
Lead is used as projectiles for firearms and fishing sinkers. Lead is used in some candles to treat the wick to ensure a longer, more even
burn. Lead is used as shielding from radiation. Lead glass is composed of 12-28% lead. Lead is the traditional base metal of organ pipes, mixed with varying amounts
of tin to control the tone of the pipe. Lead is used as electrodes in the process of electrolysis.
23

Lead is used in solder for electronics. Lead is used in high voltage power cables as sheathing material to prevent
water diffusion into insulation. Lead is used for the ballast keel of sailboats. Lead is added to brass to reduce machine tool wear. Lead sheets are used as roofing material. Lead is frequently used in scuba diving weight belts.
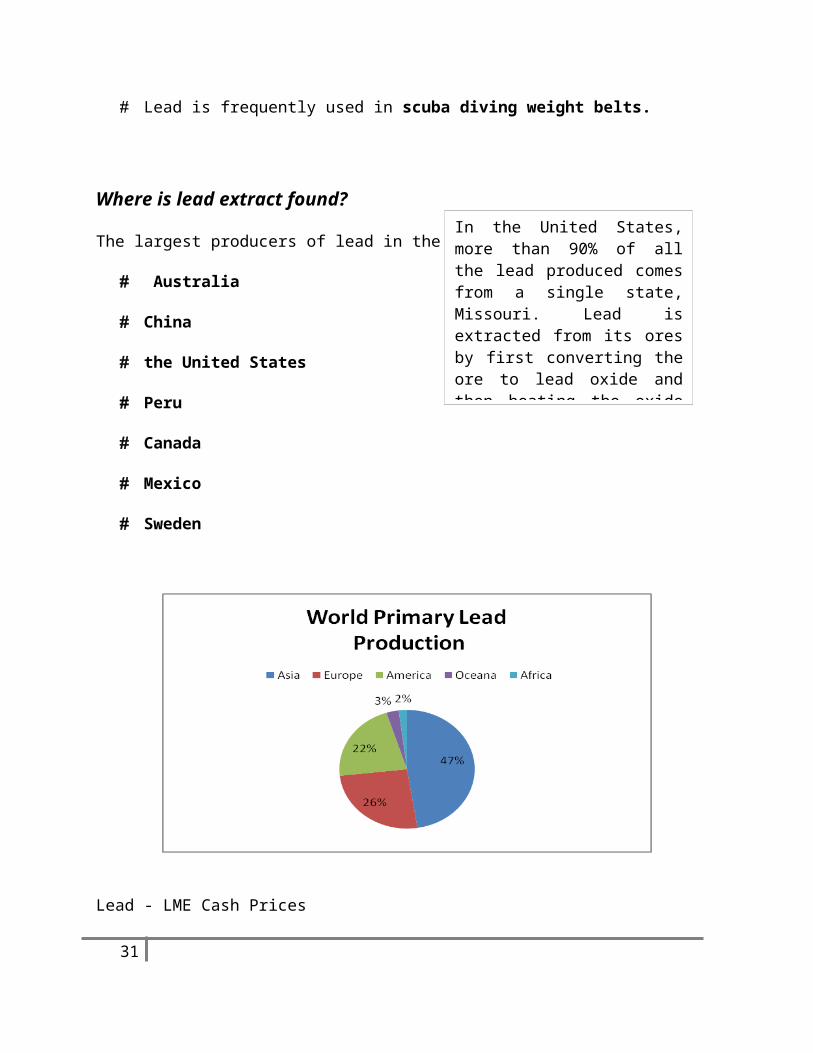
Where is lead extract found?
The largest producers of lead in the world are:
Australia
China
the United States
Peru
Canada
Mexico
Sweden
24
In the United States, more than 90% of all the lead produced comes from a single state, Missouri. Lead is extracted from its ores by first converting the ore to lead oxide and then heating the oxide with charcoal (pure carbon). The lead produced by this process is usually not very pure and can be further refined
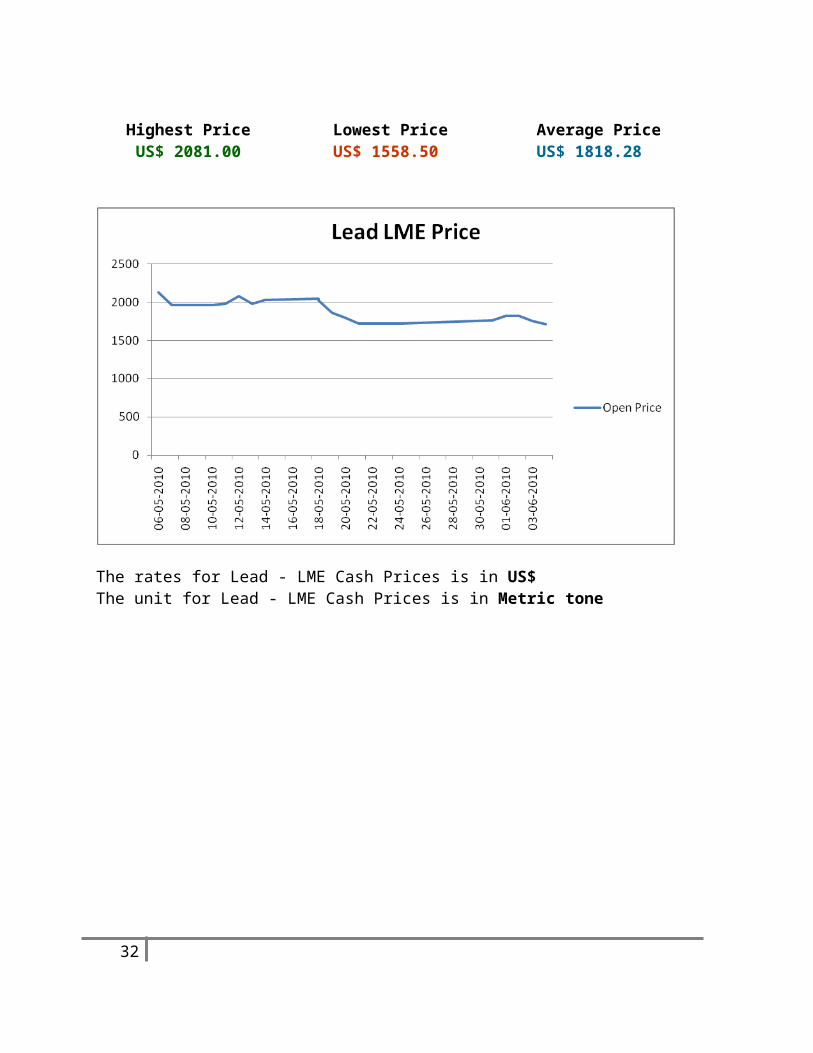
Lead - LME Cash Prices
Highest Price US$ 2081.00
Lowest PriceUS$ 1558.50
Average PriceUS$ 1818.28
The rates for Lead - LME Cash Prices is in US$The unit for Lead - LME Cash Prices is in Metric tone
25
26
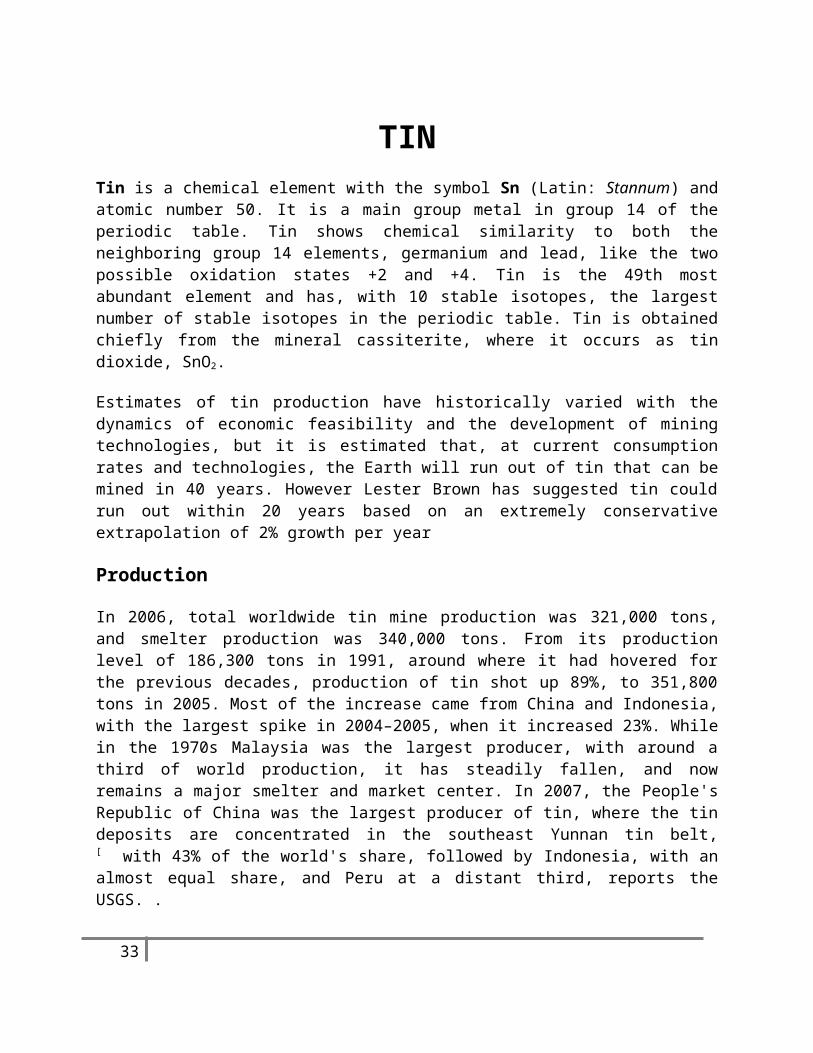
TINTin is a chemical element with the symbol Sn (Latin: Stannum) and atomic number 50. It is a main group metal in group 14 of the periodic table. Tin shows chemical similarity to both the neighboring group 14 elements, germanium and lead, like the two possible oxidation states +2 and +4. Tin is the 49th most abundant element and has, with 10 stable isotopes, the largest number of stable isotopes in the periodic table. Tin is obtained chiefly from the mineral cassiterite, where it occurs as tin dioxide, SnO2.
Estimates of tin production have historically varied with the dynamics of economic feasibility and the development of mining technologies, but it is estimated that, at current consumption rates and technologies, the Earth will run out of tin that can be mined in 40 years. However Lester Brown has suggested tin could run out within 20 years based on an extremely conservative extrapolation of 2% growth per year
Production
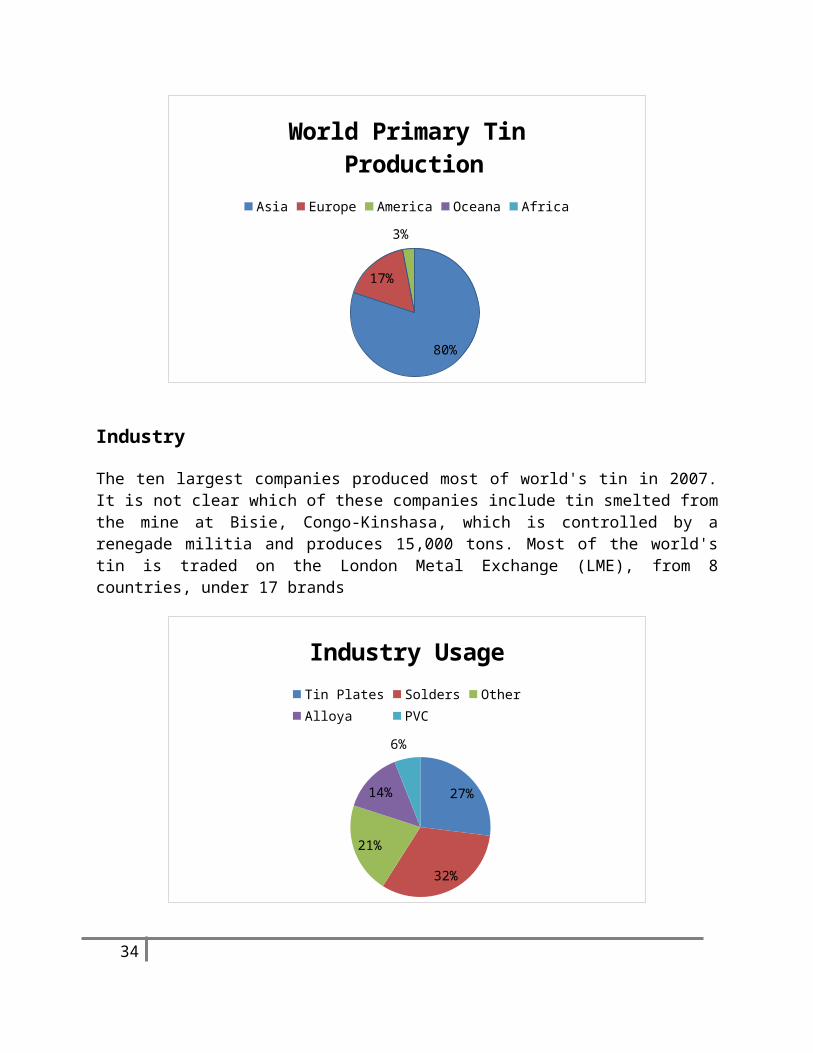
In 2006, total worldwide tin mine production was 321,000 tons, and smelter production was 340,000 tons. From its production level of 186,300 tons in 1991, around where it had hovered for the previous decades, production of tin shot up 89%, to 351,800 tons in 2005. Most of the increase came from China and Indonesia, with the largest spike in 2004–2005, when it increased 23%. While in the 1970s Malaysia was the largest producer, with around a third of world production, it has steadily fallen, and now remains a major smelter and market center. In 2007, the People's Republic of China was the largest producer of tin, where the tin deposits are concentrated in the southeast Yunnan tin belt,[ with 43% of the world's share, followed by Indonesia, with an almost equal share, and Peru at a distant third, reports the USGS. .
80%
17%
3%
World Primary Tin Production
Asia Europe America Oceana Africa
27
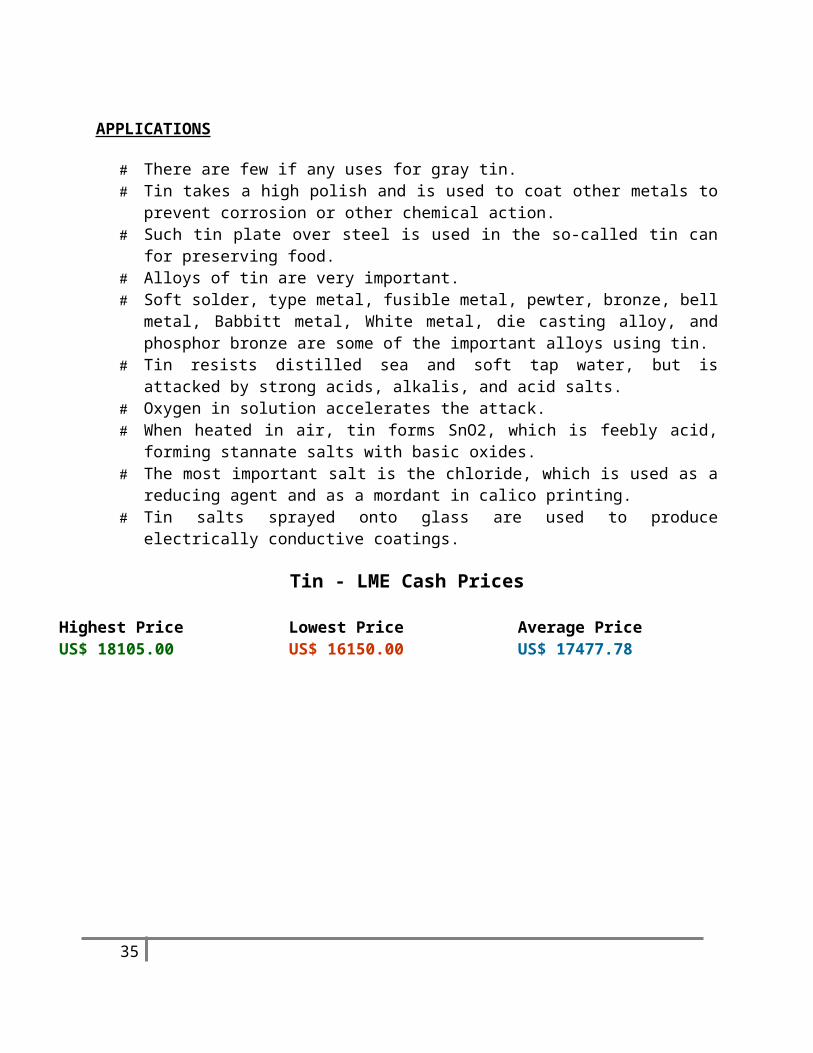
Industry
The ten largest companies produced most of world's tin in 2007. It is not clear which of these companies include tin smelted from the mine at Bisie, Congo-Kinshasa, which is controlled by a renegade militia and produces 15,000 tons. Most of the world's tin is traded on the London Metal Exchange (LME), from 8 countries, under 17 brands
27%
32%
21%
14%
6%
Industry UsageTin Plates Solders Other Alloya PVC
APPLICATIONS
There are few if any uses for gray tin. Tin takes a high polish and is used to coat other metals to prevent corrosion or
other chemical action. Such tin plate over steel is used in the so-called tin can for preserving food. Alloys of tin are very important. Soft solder, type metal, fusible metal, pewter, bronze, bell metal, Babbitt metal,
White metal, die casting alloy, and phosphor bronze are some of the important alloys using tin.
Tin resists distilled sea and soft tap water, but is attacked by strong acids, alkalis, and acid salts.
Oxygen in solution accelerates the attack. When heated in air, tin forms SnO2, which is feebly acid, forming stannate salts
with basic oxides. The most important salt is the chloride, which is used as a reducing agent and as
a mordant in calico printing. Tin salts sprayed onto glass are used to produce electrically conductive coatings.
28
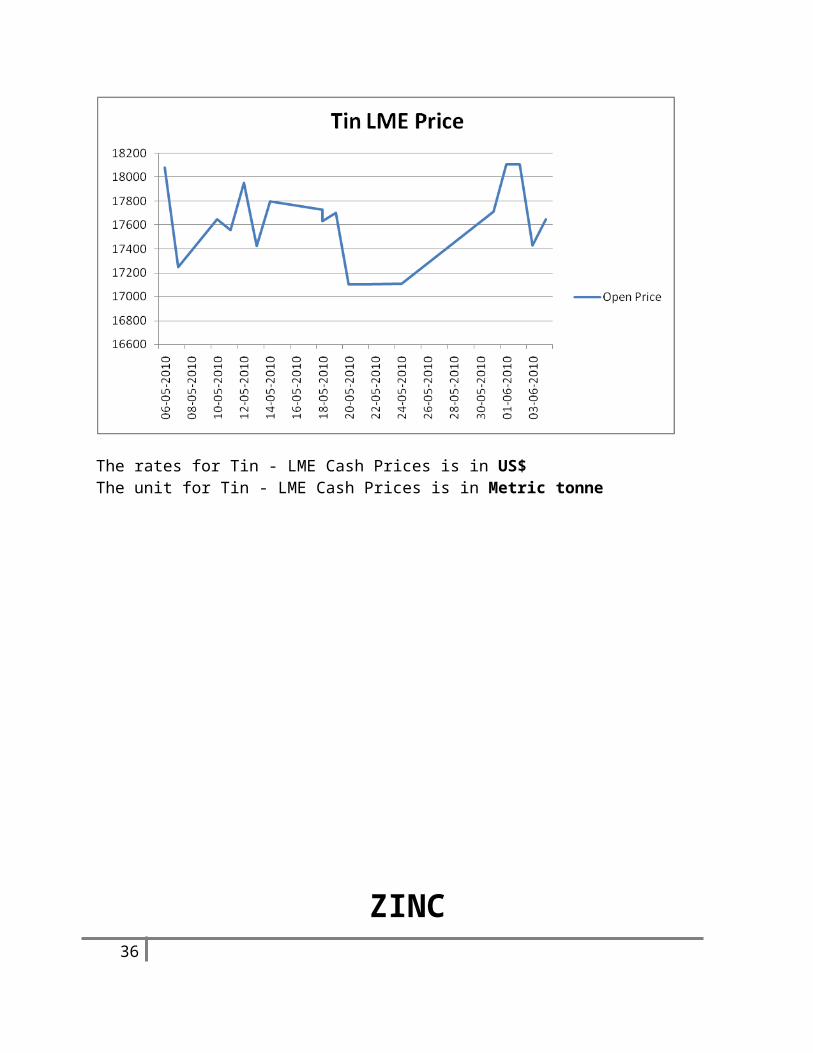
Tin - LME Cash Prices
Highest Price US$ 18105.00
Lowest PriceUS$ 16150.00
Average PriceUS$ 17477.78
The rates for Tin - LME Cash Prices is in US$The unit for Tin - LME Cash Prices is in Metric tonne
29
ZINCCenturies before zinc was discovered in the metallic form, its ores were used for making brass and zinc compounds were used for healing wounds and sore eyes. Brass was produced by the Romans in the time of Augustus (20 B.C. - 14 A.D.). By 1374, zinc was recognized in India as a new metal and at Zawar, India, both zinc metal and zinc oxide were produced from the 12th to the 16th century. From India, zinc manufacture moved to China in the 17the century. Zinc was recognized as a separate metal in Europe in 1546. In 1743, the first European zinc smelter was established at Bristol in the United Kingdom.
Usually zinc ores are found in association with those of lead, copper, gold, silver as well as other metals. Rarely is the ore, as mined, rich enough to be used directly by smelters; it needs to be concentrated. Typically zinc ores contain 3% to more than 10% zinc and zinc concentrates will contain 55% zinc.
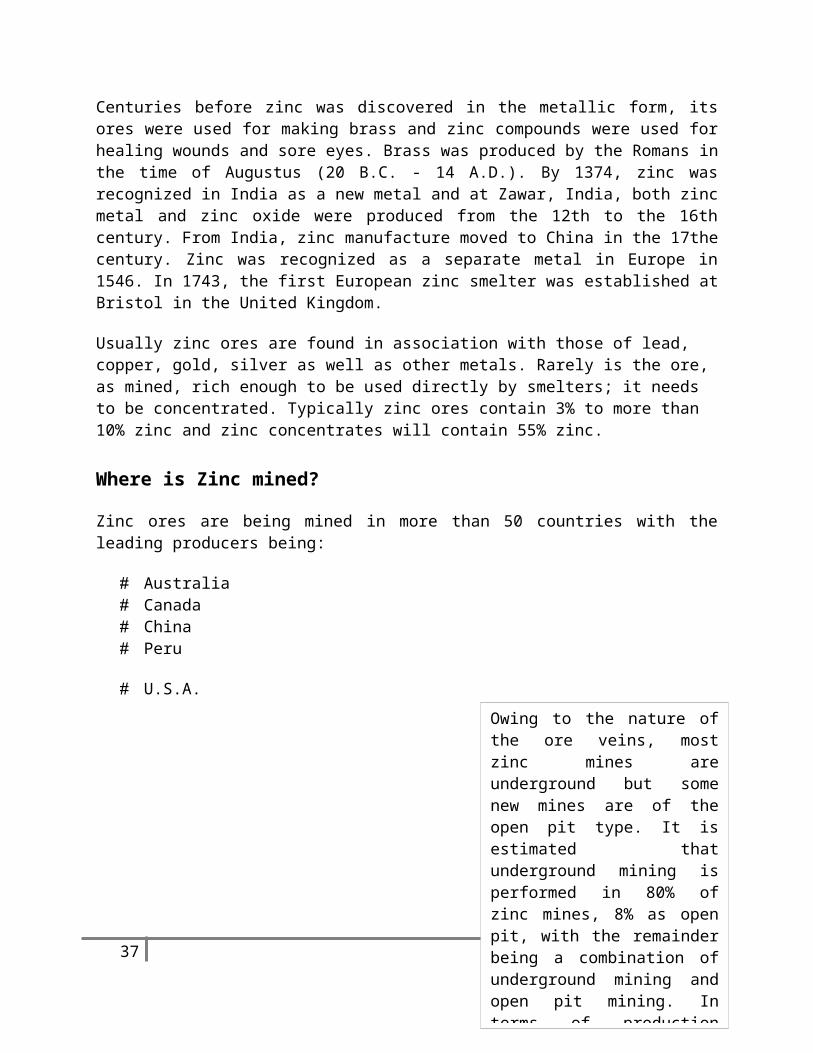
Where is Zinc mined?
Zinc ores are being mined in more than 50 countries with the leading producers being:
Australia Canada China Peru
U.S.A.
30
Owing to the nature of the ore veins, most zinc mines are underground but some new mines are of the open pit type. It is estimated that underground mining is performed in 80% of zinc mines, 8% as open pit, with the remainder being a combination of underground mining and open pit mining. In terms of production volume, however, open pit mines account for as much as 15% with underground mines producing 64%. 21% of mine production comes from the combination of underground and open pit mining.
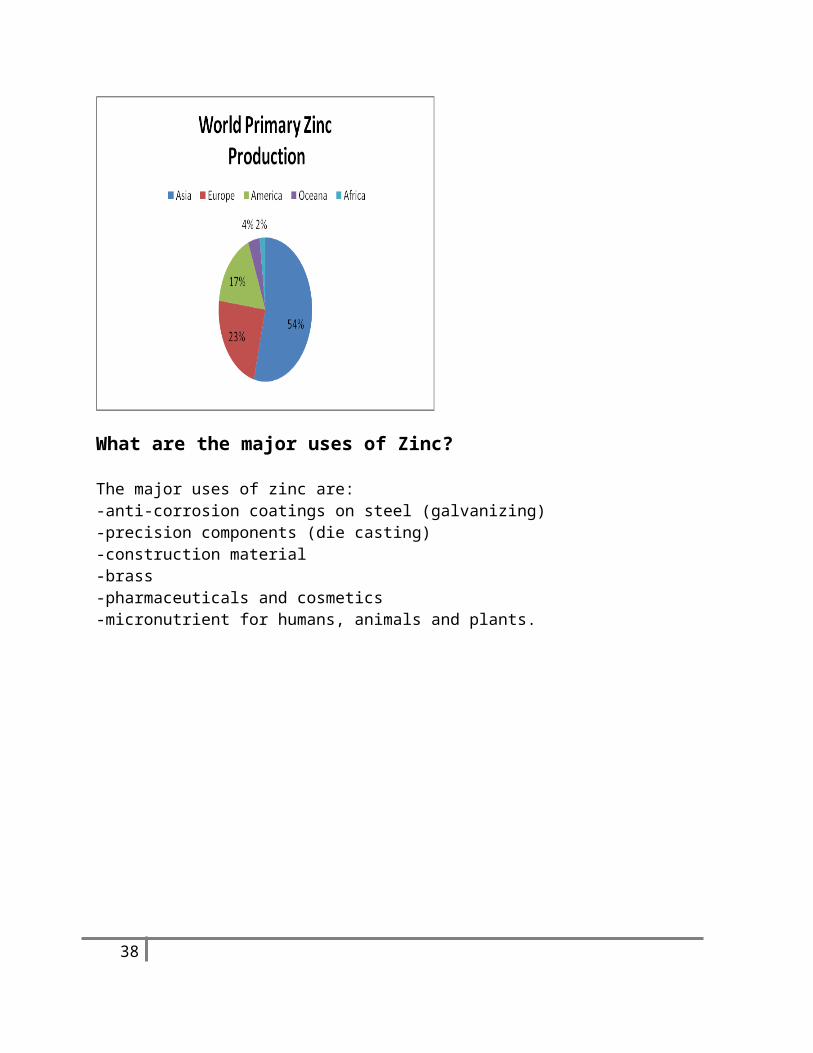
What are the major uses of Zinc?
The major uses of zinc are:-anti-corrosion coatings on steel (galvanizing) -precision components (die casting) -construction material -brass -pharmaceuticals and cosmetics -micronutrient for humans, animals and plants.
31
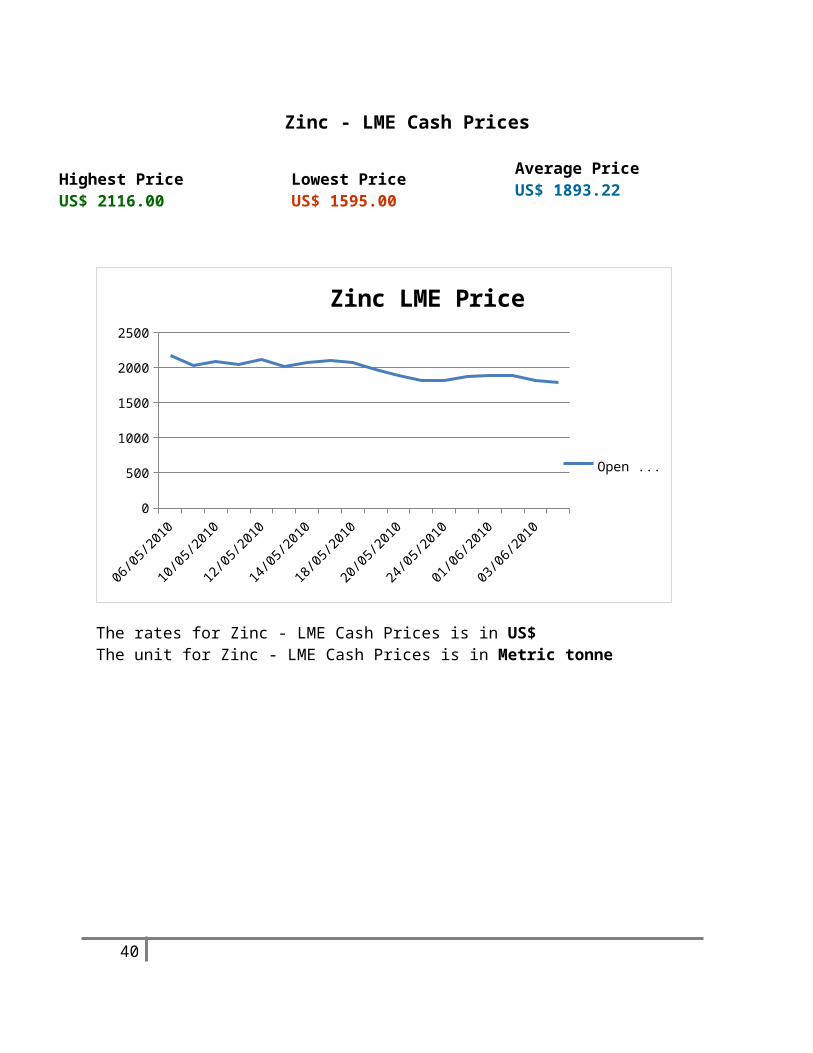
Zinc - LME Cash Prices
Highest Price US$ 2116.00
Lowest PriceUS$ 1595.00
Average PriceUS$ 1893.22
06/05/2
010
08/05/2
010
10/05/2
010
12/05/2
010
14/05/2
010
16/05/2
010
18/05/2
010
20/05/2
010
22/05/2
010
24/05/2
010
26/05/2
010
28/05/2
010
30/05/2
010
01/06/2
010
03/06/2
0100
500
1000
1500
2000
2500
Zinc LME Price
Open Price
The rates for Zinc - LME Cash Prices is in US$The unit for Zinc - LME Cash Prices is in Metric tonne
32
FLUCTUATIONS IN THE PRICES OF NON FERROUS METALS
Hindalco Industries Ltd., the nation’s biggest aluminum producer, and Sterlite Industries (India) Ltd., the largest copper and zinc producer, dropped the most in three months. Indian stocks fell to the lowest in eight weeks, led by metal producers on lower prices.The May June prices of the non ferrous metals clearly shows the fluctuations in the prices. The trend in the past few months has been of falling prices.
The reasons that might justify the fluctuations in the prices are:
a) The fluctuating demand from China: “The overall demand for non-ferrous metals will come down in the near term as China withdraws stimulus leading to production cuts and fall in prices,” said Sumeet Singhania, an analyst at Antique Stock Broking Ltd. in Mumbai
b) The failure of EURO: Intensified fears over government debt in the eurozone are pushing the euro weaker against the dollar.
There may be direct effects on the US, as its banking system remains undercapitalized. Or the effect may be through making it harder to export -- one of the few bright spots for the American economy over the past 12 months has been trade. But this is unlikely to hold up as a driver of growth if the euro depreciation continues.
Asymmetric trends not asymmetric shocks
The reason why the Euro zone does not work is not asymmetric shocks – their cost is constant over time and therefore unlikely to lead to the single currency's eventual demise – but asymmetric trends. Over the last decade, countries in the Euro zone have quietly but stubbornly diverged in terms of inflation, growth, fiscal performance and competitiveness.
* Some have had 2% inflation on average, others 4%.
* Some have built up trade surpluses, others are increasingly indebted with respect to the rest of the world.
33
* Some have kept their government budget in check, others have let debt grow.
This divergence comes from different policy choices, different institutions, and different cultures. But the common currency, contrary to the hopes of those who believed such a the divergence.
Germany's decision in May 2010 to ban speculative short selling of certain types of financial instruments has rattled financial markets around the world, further weakening the euro. The 16-nation currency, which has been battered by continuing concerns about the European debt crisis, fell to a four-year low on Wednesday
c) At present non ferrous metals industry, primarily in the three major problems remain to be resolved: excess capacity; industry, the degree of intensification is not high, enterprise comprehensive strength of the weak; raw materials, foreign dependency, the lack of international pricing right to speak.
Impact of Union Budget on the Non Ferrous Metals manufacturers in India
The rise in the excise duty from 8% to 10% is expected to be passed on to the end customer.
The planned 46% outlay in infrastructure investment would create demand that could absorb these rises in prices.
Thus the overall effect is neutral on the ferrous manufacturers.
34
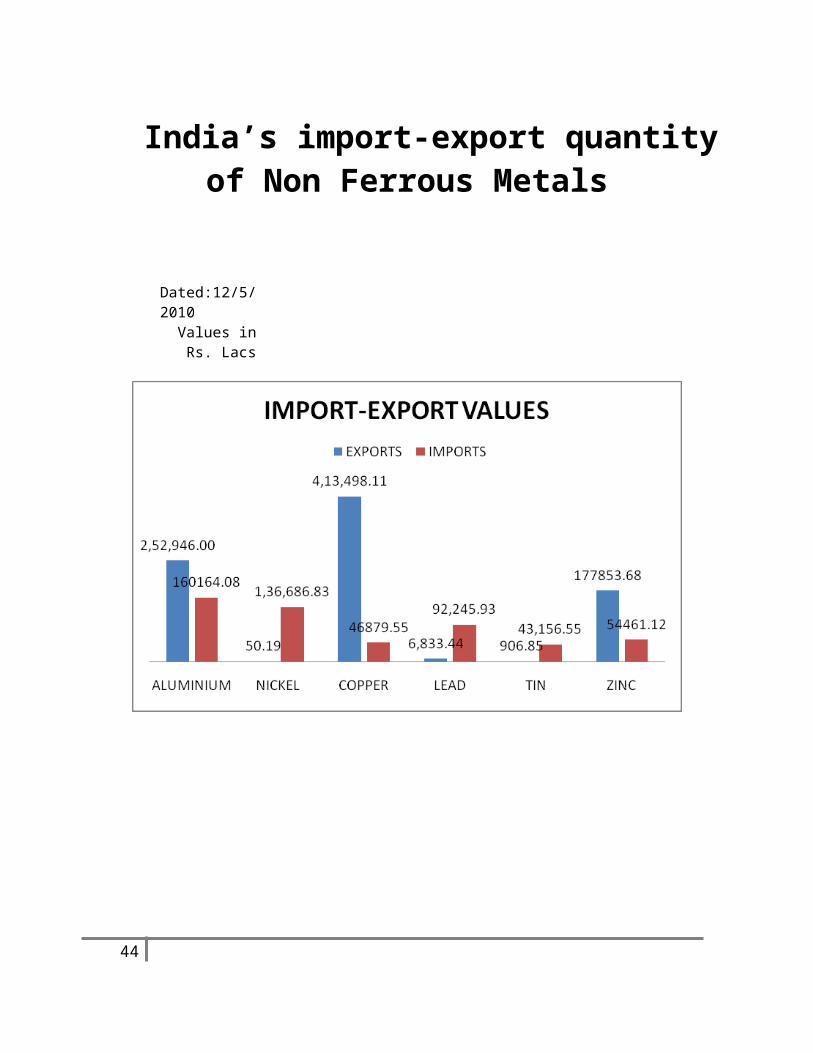
India’s import-export quantity of Non Ferrous Metals
Dated:12/5/2010
Values in Rs. Lacs
35
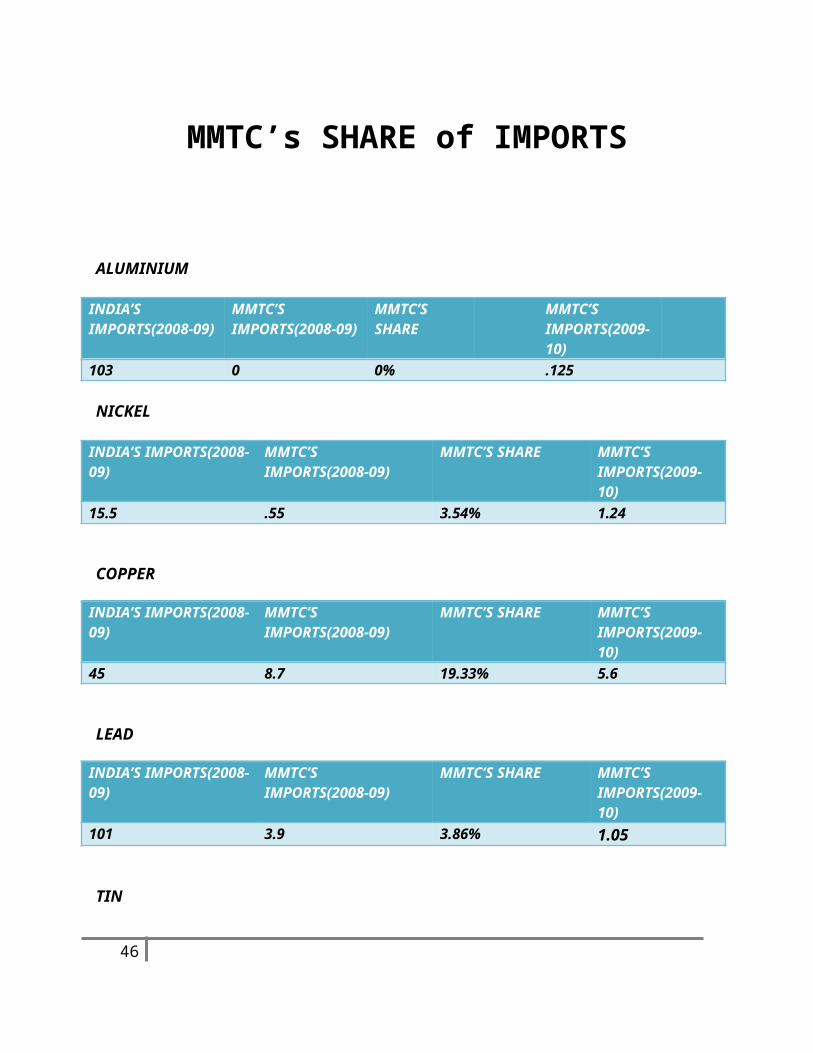
MMTC’s SHARE of IMPORTS
ALUMINIUM
INDIA’S IMPORTS(2008-09)
MMTC’S IMPORTS(2008-09)
MMTC’S SHARE
MMTC’S IMPORTS(2009-10)
103 0 0% .125
NICKEL
INDIA’S IMPORTS(2008-09)
MMTC’S IMPORTS(2008-09)
MMTC’S SHARE MMTC’S IMPORTS(2009-10)
15.5 .55 3.54% 1.24
COPPER
INDIA’S IMPORTS(2008-09)
MMTC’S IMPORTS(2008-09)
MMTC’S SHARE MMTC’S IMPORTS(2009-10)
45 8.7 19.33% 5.6
LEAD
INDIA’S IMPORTS(2008-09)
MMTC’S IMPORTS(2008-09)
MMTC’S SHARE MMTC’S IMPORTS(2009-10)
101 3.9 3.86% 1.05
TIN
INDIA’S IMPORTS(2008-09)
MMTC’S IMPORTS(2008-09)
MMTC’S SHARE MMTC’S IMPORTS(2009-10)
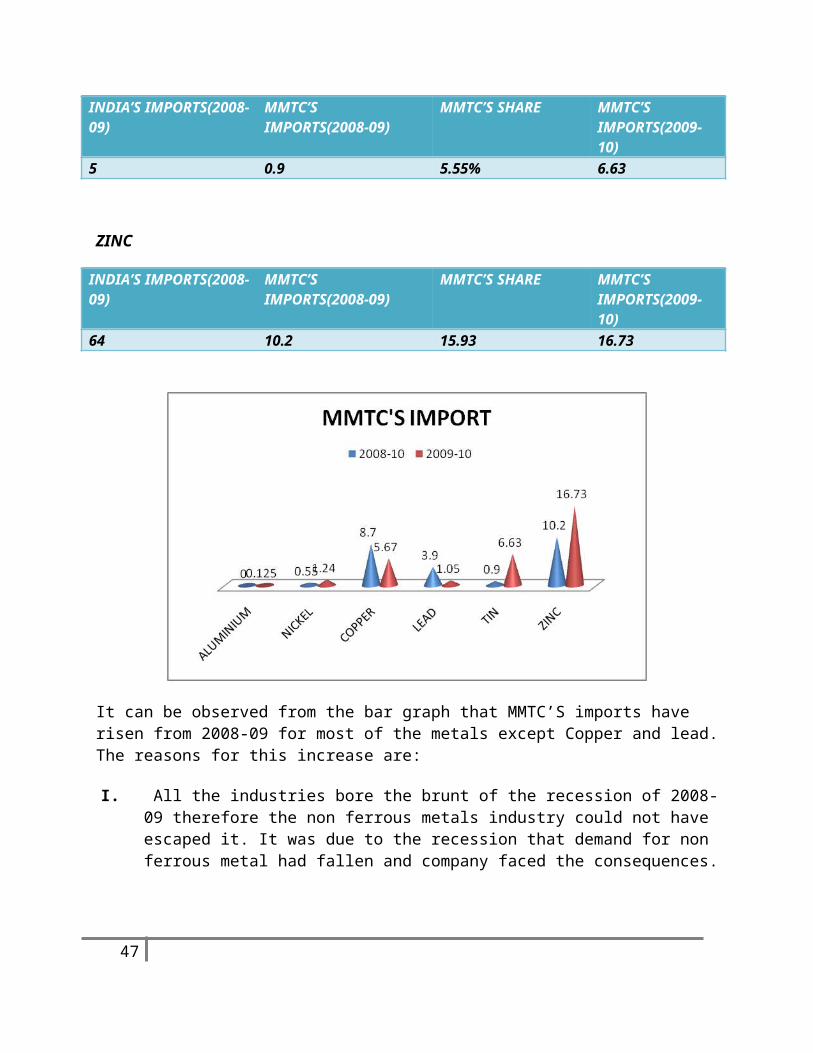
5 0.9 5.55% 6.63
36
ZINC
INDIA’S IMPORTS(2008-09)
MMTC’S IMPORTS(2008-09)
MMTC’S SHARE MMTC’S IMPORTS(2009-10)
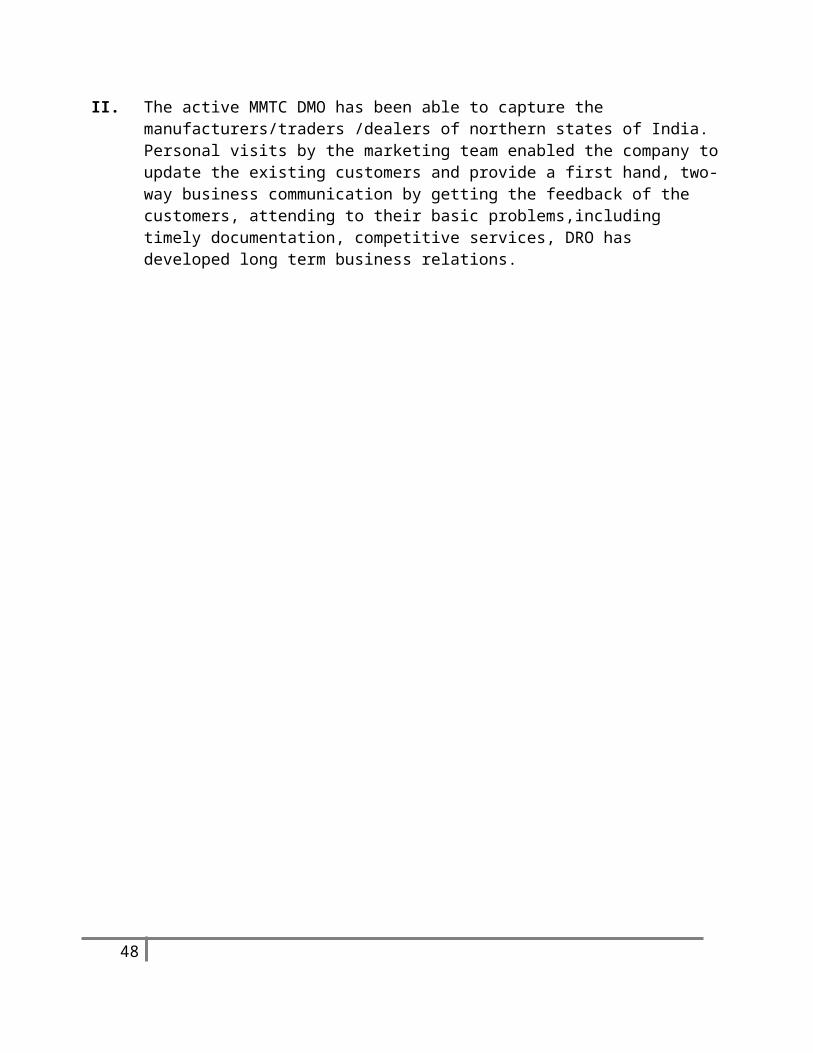
64 10.2 15.93 16.73
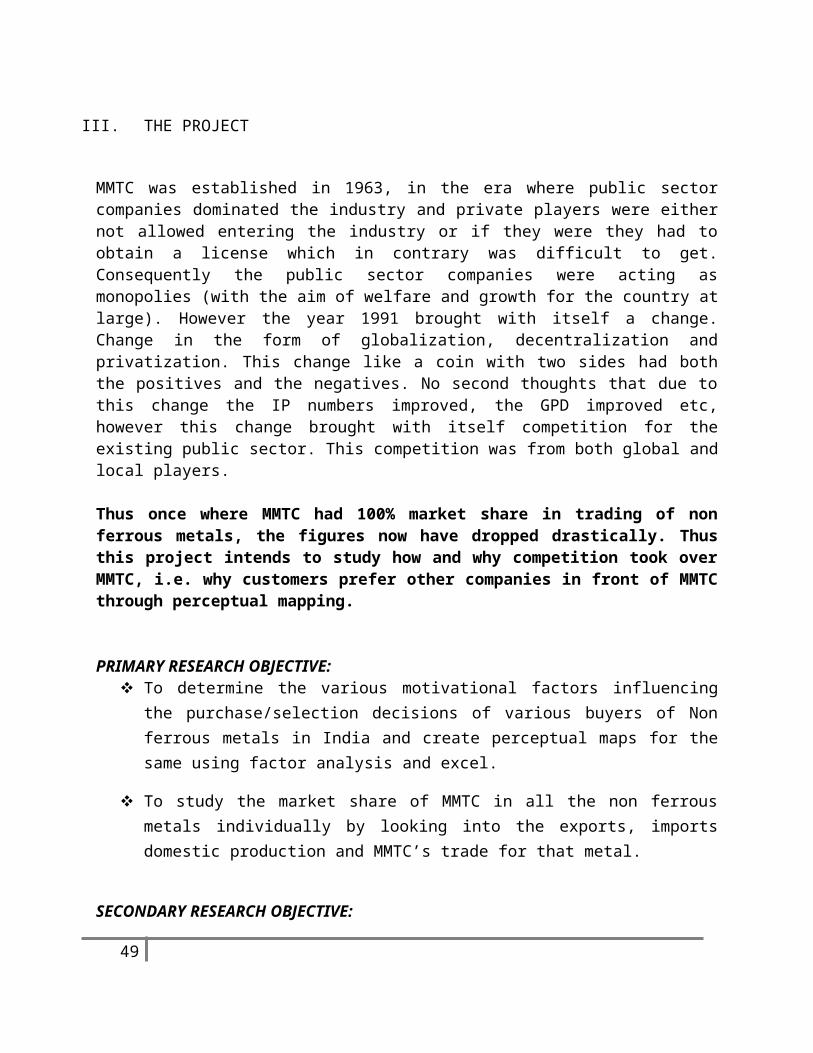
It can be observed from the bar graph that MMTC’S imports have risen from 2008-09 for most of the metals except Copper and lead. The reasons for this increase are:
I. All the industries bore the brunt of the recession of 2008-09 therefore the non ferrous metals industry could not have escaped it. It was due to the recession that demand for non ferrous metal had fallen and company faced the consequences.
II. The active MMTC DMO has been able to capture the manufacturers/traders /dealers of northern states of India. Personal visits by the marketing team enabled the company to update the existing customers and provide a first hand, two-way business communication by getting the feedback of the customers, attending to their basic problems,including timely documentation, competitive services, DRO has developed long term business relations.
37
III. THE PROJECT
MMTC was established in 1963, in the era where public sector companies dominated the industry and private players were either not allowed entering the industry or if they were they had to obtain a license which in contrary was difficult to get. Consequently the public sector companies were acting as monopolies (with the aim of welfare and growth for the country at large). However the year 1991 brought with itself a change. Change in the form of globalization, decentralization and privatization. This change like a coin with two sides had both the positives and the negatives. No second thoughts that due to this change the IP numbers improved, the GPD improved etc, however this change brought with itself competition for the existing public sector. This competition was from both global and local players.
Thus once where MMTC had 100% market share in trading of non ferrous metals, the figures now have dropped drastically. Thus this project intends to study how and why competition took over MMTC, i.e. why customers prefer other companies in front of MMTC through perceptual mapping.
PRIMARY RESEARCH OBJECTIVE: To determine the various motivational factors influencing the purchase/selection
decisions of various buyers of Non ferrous metals in India and create perceptual maps for the same using factor analysis and excel.
To study the market share of MMTC in all the non ferrous metals individually by looking into the exports, imports domestic production and MMTC’s trade for that metal.
SECONDARY RESEARCH OBJECTIVE: To determine the various attributes which influence the selection of a particular
company for purchasing non ferrous metals.
PROBLEM DEFINATION
A) Background Of The Problem
Market research is constantly used by companies to know where they were?, where they are and where they are heading to? With respect to market share, consumer perceptions, brand equity, customer awareness, etc. Now-a-days customer is the centre of every company’s strategy. So companies take the help
38
of market research techniques to find all these factors. This project also aims at doing something like this, it would help the companies to know what buyers think about them and where MMTC stands with respect to other suppliers and domestic producers.
B) Statement Of The Problem
The problem statement is:- “To determine the various motivational factors influencing the purchase/selection decisions of various buyers of Non ferrous metals in India and create perceptual maps for the same using Multi Dimensional Scaling Techniques”
C) Approach To The Problem
1) T test for each question of the questionnaire: this is done to check whether there is any scope of elimination of the questions which are not required. This can be done by seeing whether the P values calculated lies within the critical zone or not.
2) Anova and Tukey Kramer for each variable3) Factor Analysis for MMTC using SPSS.4) Plotting Perceptual Maps
WHAT IS PERCEPTUAL MAPPINGPerceptual mapping is the process by which the customers’ perception about a brand of product/services is charted. Perception is generally based on attitude and attitude is created by
i. Liking or disliking towards a brand → Affinity
ii. Knowledge about the brand → Cognitive
iii. Purchase decision of customer → Behavioral
Perceptual maps are usually used to find out the gap existing in the market so that a firm can place or position their product/brand in the gap based on their existing competitive brands. Perceptual mapping can be either carried on an individual or on a group of people in a segment.
39
RESEARCH APPROACH
Exploratory ResearchThis is the first step carried out to determine all the factors which influence the target audience while selecting a company and also to select the leading competitive brands for the purpose of study.Secondary Data Research: With the help of internet I have searched various competitors of MMTC and various buyers who will be i8nterviewed in the process.
Company’s Chosen As the non ferrous metal industry in India is very big rather than choosing different companies, 3 categories have been made. These are:
MMTC Domestic producers Other suppliers
Metals like Aluminum, Lead, Zinc and copper are produced in India as well and hence customers rather than importing these metals buy them directly from the domestic producers. Also as discussed before the non ferrous metal industry is fragmented, both the organised and unorganised players together form this industry. Thus rather than naming few individuals categories have been made.
ATTRIBUTES CHOSEN
From the exploratory research the following were found out to be highly valued by the target audience while deciding from where they will purchase the metal:
11.Cost: The cost of the metal includes the LME price of the metal plus the margin, the premium charged by the company and sometimes the insurance cost as well.
12.Quality: whether a metal is of good quality or not is dependent on its weight. Metal with higher weight would be better. For instance ZINC ,not alloyed, containing by WT>=99.99% ZINC or ZINC, not alloyed, containing by WT<99.99% ZINC
13.Delivery time: Delivery time is the length of time between the preparation of a product for shipping and the delivery of the product to the end consumer. It is also sometimes referred to as the delivery period. Companies keep track of their
40
delivery times for the purpose of being able to provide accurate estimates when orders are placed so that consumers know when to expect a delivery.
14.Flexible order quantities: Different buyers need different quantities of metal they are purchasing. Some might need 1mt others might need 10mt. Thus the flexibility given to buyers in terms of the quantity of metal to be purchased influences the buyer’s decision to choose the company.
15.Longer pricing period: The duration of the time for which price is set.
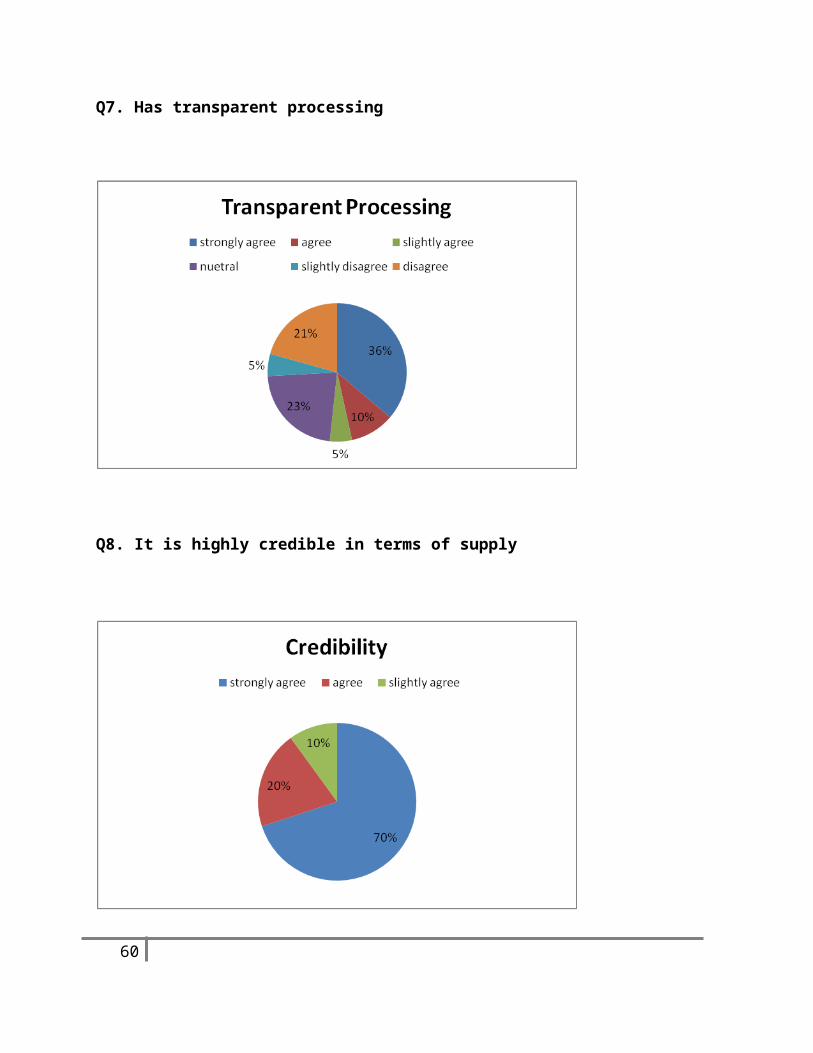
16.Transparent processing: The full, accurate, and timely disclosure of information. Transparency makes it more likely that assets will be accurately valued.
17.Payment terms: Conditions of payment agreed between a buyer and a seller for goods sold or services rendered. Three basic terms of payment are (1) cash, (2) open account, (3) secured account. The stipulation by a business as to when it should be paid for goods or services supplied, for example, cash with order, payment on delivery, or within a particular number of days of the invoice date
18.Credibility: it is the trust that people show in the company.
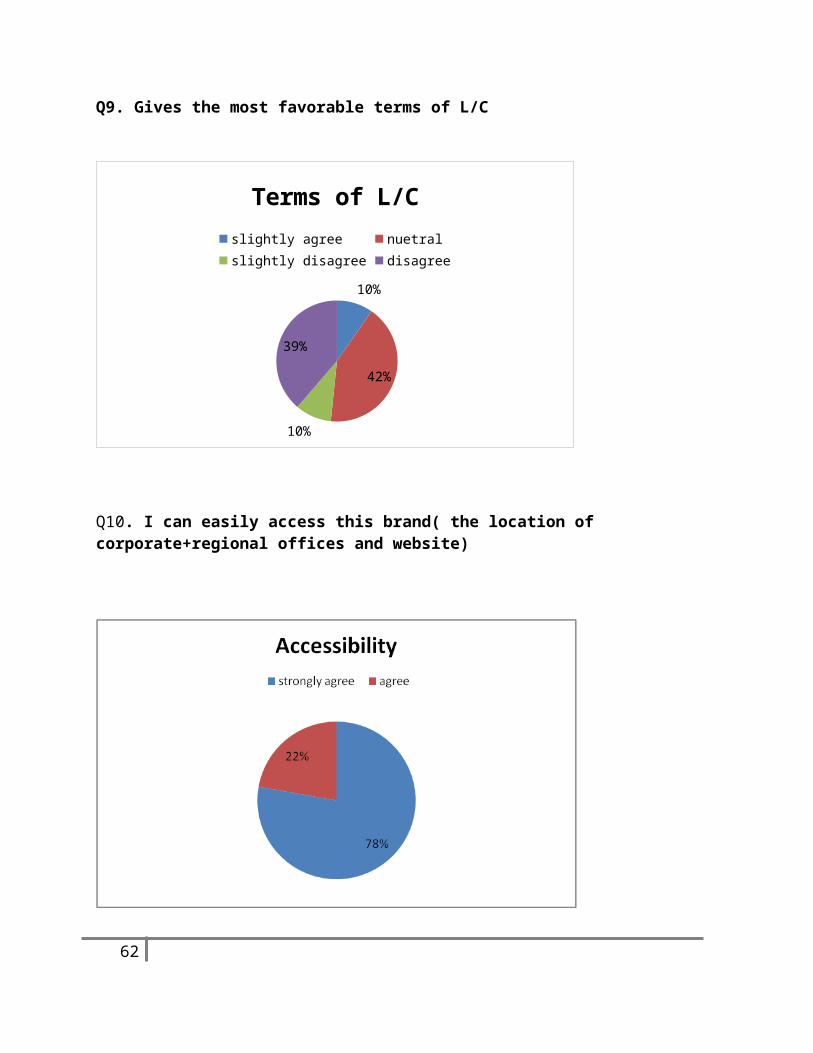
19.Terms of L/C: The letter of credit can also be source of payment for a transaction, meaning that redeeming the letter of credit will pay an exporter. Letters of credit are used primarily in international trade transactions of significant value, for deals between a supplier in one country and a customer in another.
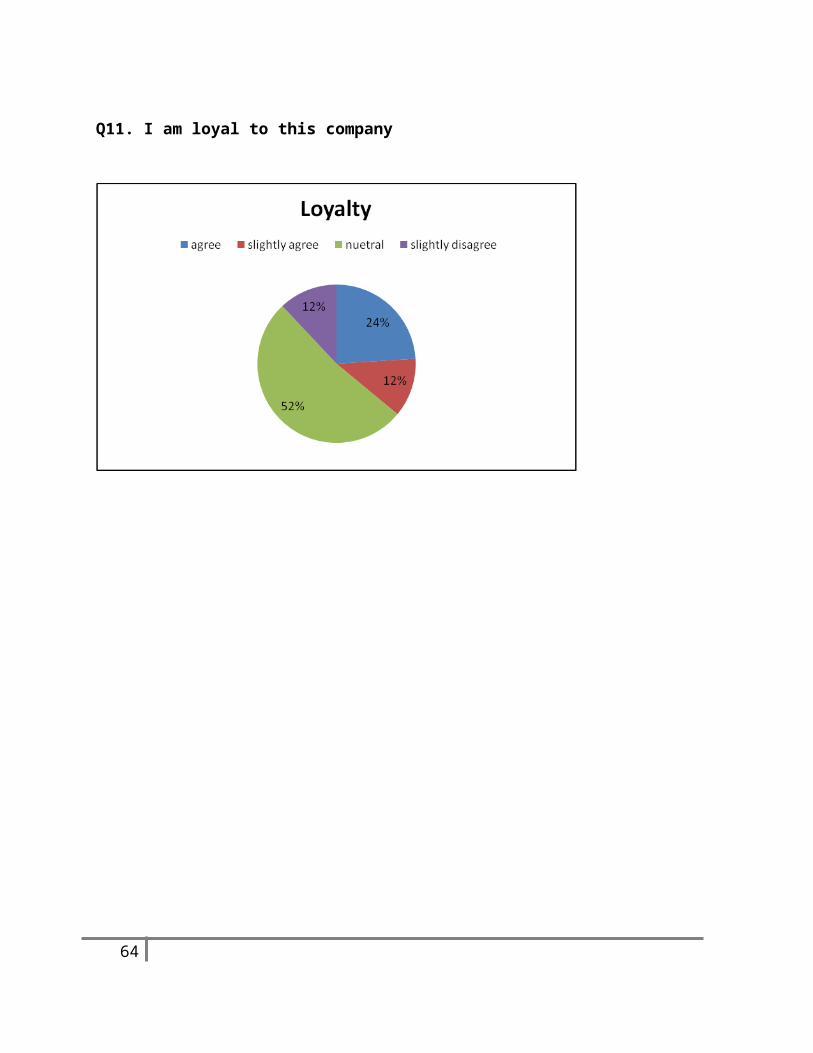
20. Loyalty: The term customer loyalty is used to describe the behaviour of repeat customers, as well as those that offer good ratings, reviews, or testimonials. Some customers do a particular company a great service by offering favourable word of mouth publicity regarding a product, telling friends and family, thus adding them to the number of loyal customers
QUESTIONNAIRE DESIGN
A questionnaire is a formalized set of questions for obtaining information from respondents. Following are the objectives of a questionnaire:-
1) It must translate the information needed into a set of specific questions that the respondent will answer.
2) It must uplift, motivate, and encourage the respondent to cooperate and to complete the questionnaire.
3) It should minimize the response error.
41
The questionnaire has the following types of questions:
1. SIMILARITY vs. DISSIMILARITY QUESTIONS
This is a DIRECT APPROACH wherein the respondents were asked to judge how similar or dissimilar the various brands or stimuli are, using their own criteria. Respondents are asked to rate all possible pairs of brands in terms of similarity on a Likert Scale. These data are referred to as Similarity Judgements.
2. ATTRIBUTE BASED QUESTIONS
This is a DERIVED APPROACH used to collect perception data based on attributes requiring the respondents to rate each brand on the different identifies factors/attributes as listed above using Likert Scale. This helps in identifying the true perception of the target audience for a particular brand with respect to a particular attribute and helps to identify the respondents with homogenous perception.
SAMPLING AND DATA COLLECTION
For the purpose of conducting this research we conducted a primary research analysis. The most important part of the project is to make the respondent fill data. Proper care is required to make that questionnaire filled, as it requires respondent time. It is very important that every respondent should fill it seriously.Data will be collected from candidates through a questionnaire. A sample of 25 respondents has been taken (These would be buyers of non ferrous metals in Delhi). This sample has been taken keeping in mind the size of the industry and the time period of the project.
42
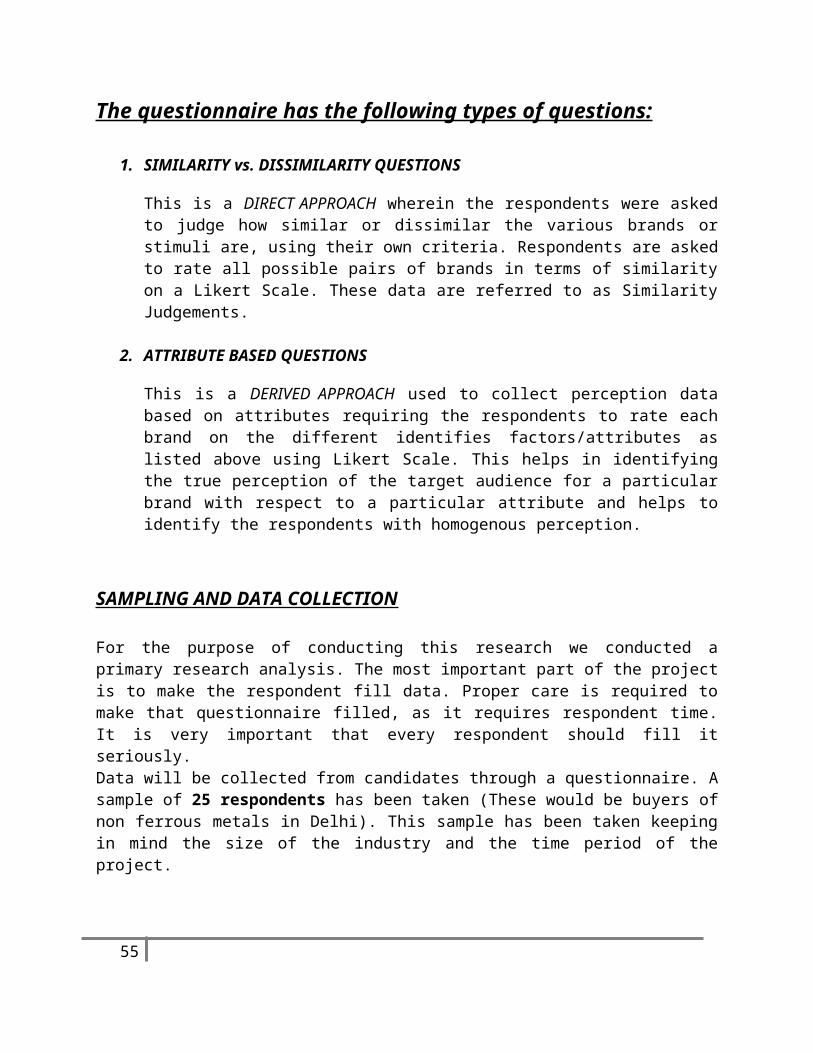
DATA ANALYSISQ1. I can buy my metal at minimum cost from this company
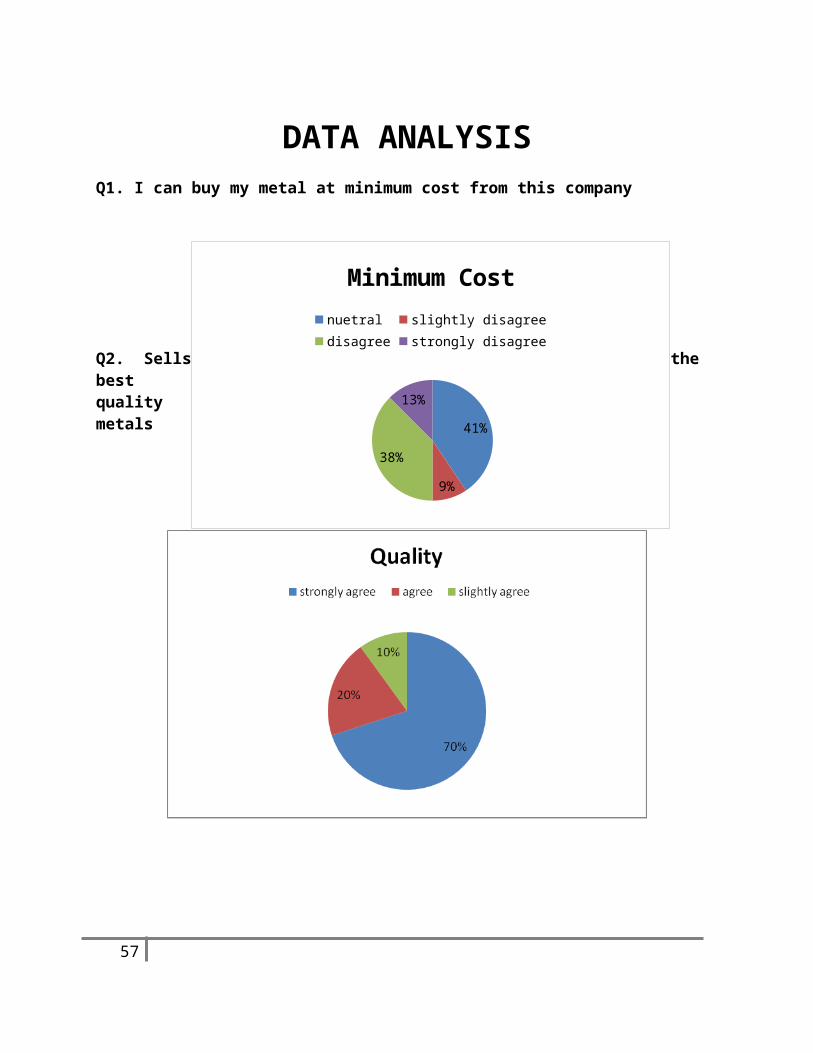
Q2. Sells the best quality metals
43
41%
9%
38%
13%
Minimum Costnuetral slightly disagree disagree strongly disagree
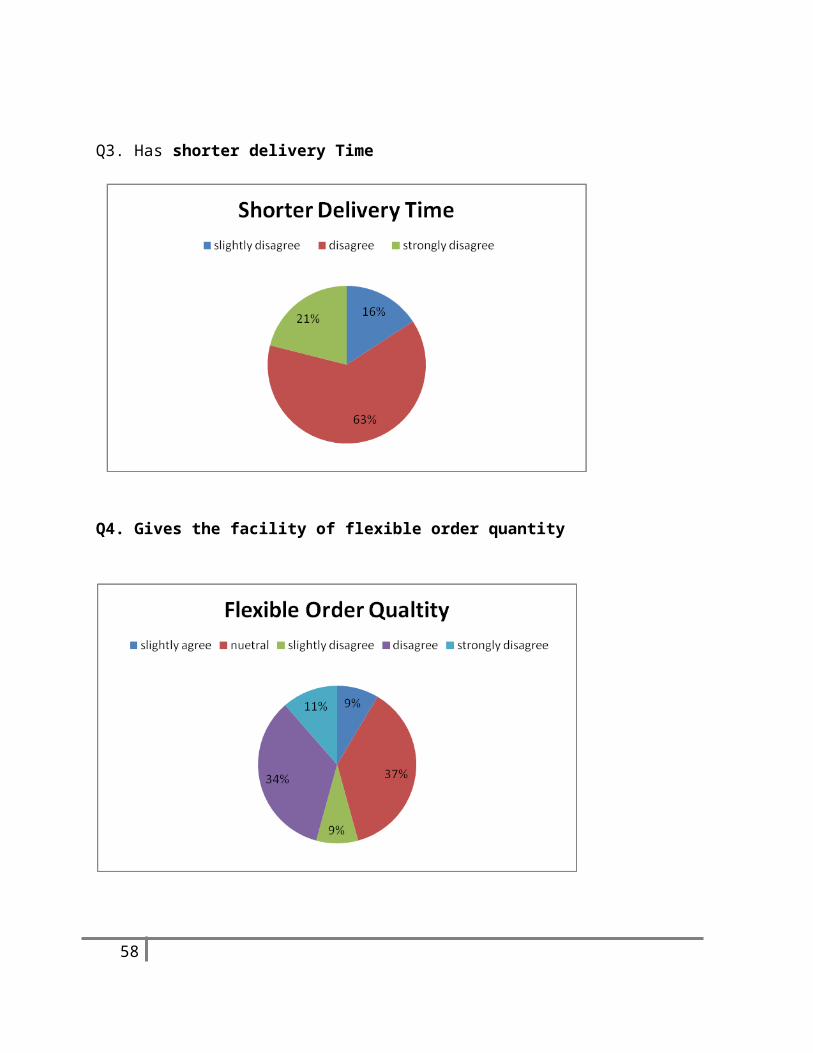
Q3. Has shorter delivery Time
Q4. Gives the facility of flexible order quantity
44

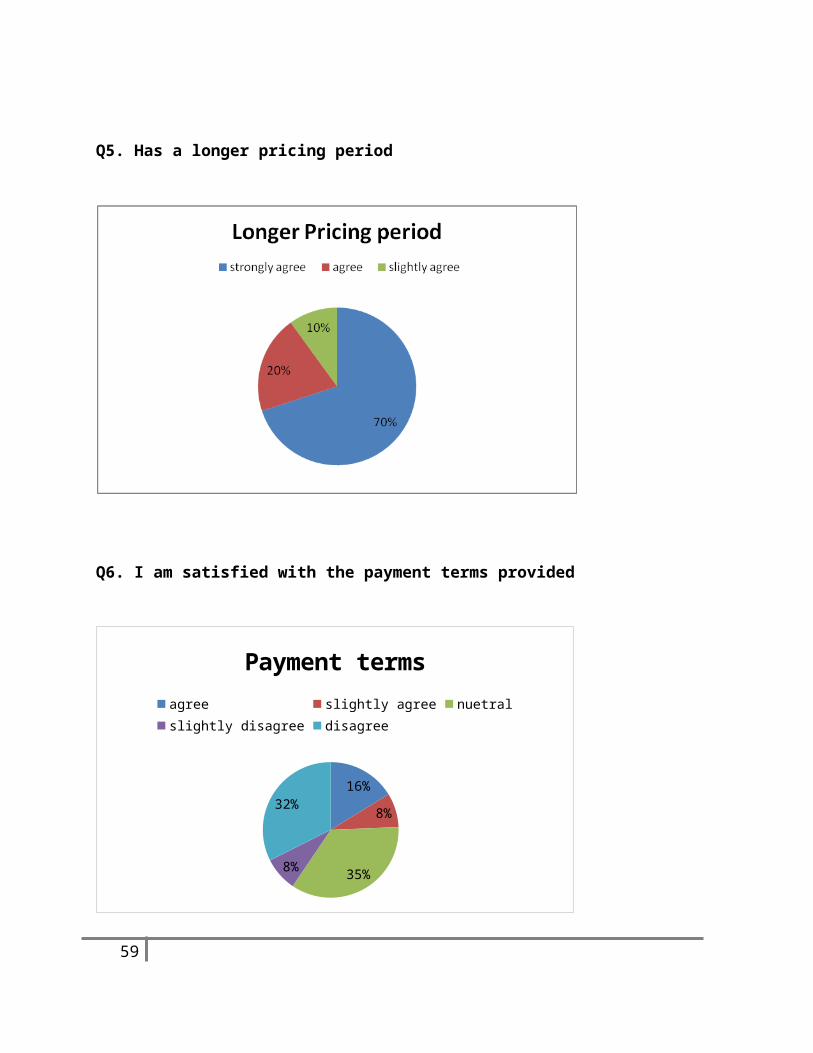
Q5. Has a longer pricing period
Q6. I am satisfied with the payment terms provided
16%
8%
35%8%
32%
Payment termsagree slightly agree nuetralslightly disagree disagree
45
Q7. Has transparent processing
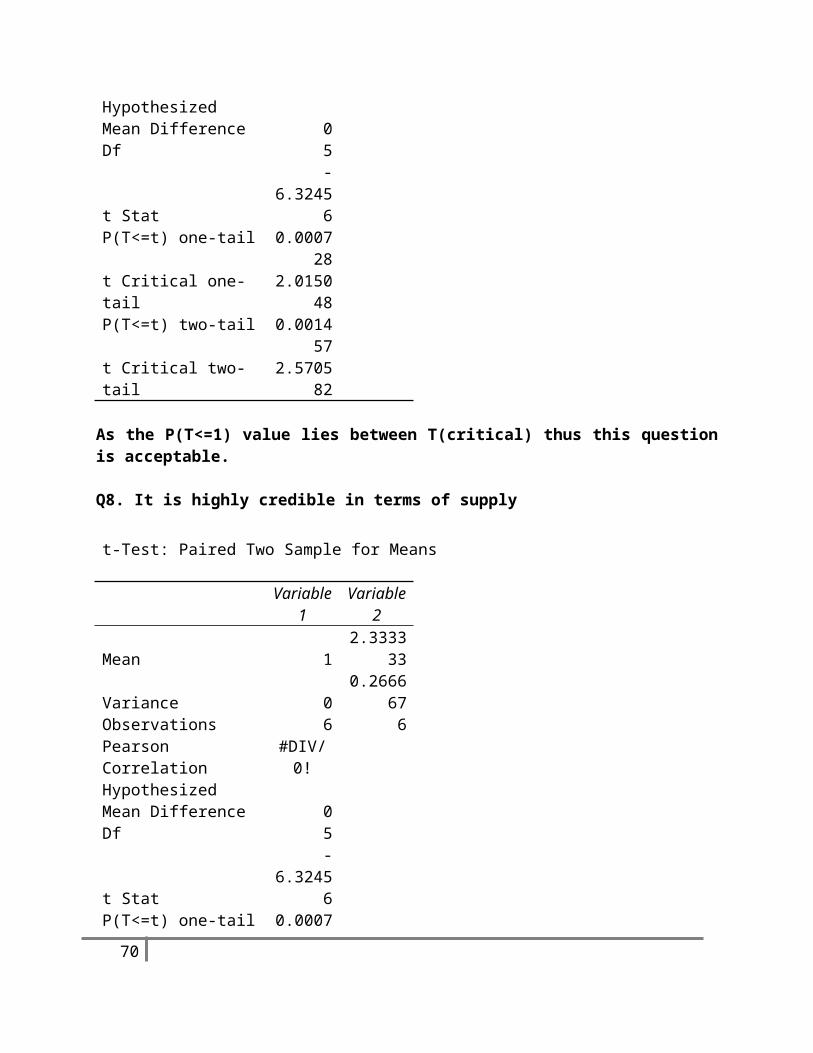
Q8. It is highly credible in terms of supply
46
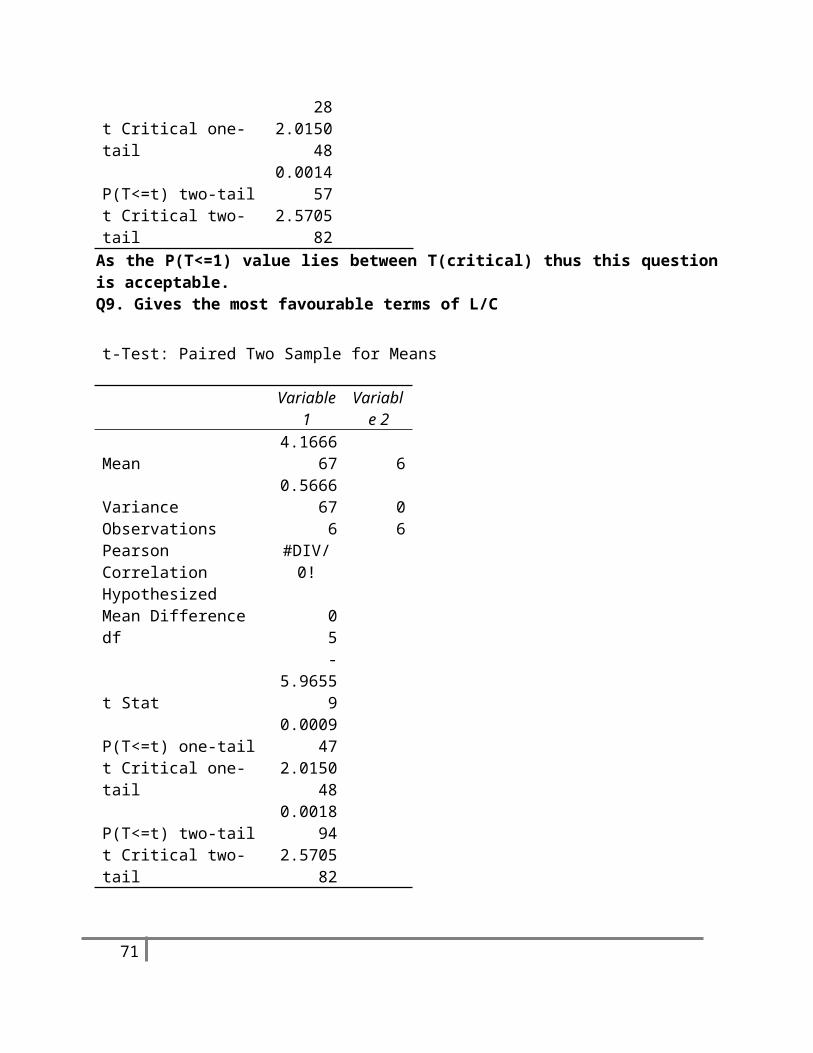
Q9. Gives the most favorable terms of L/C
10%
42%
10%
39%
Terms of L/Cslightly agree nuetral slightly disagree disagree
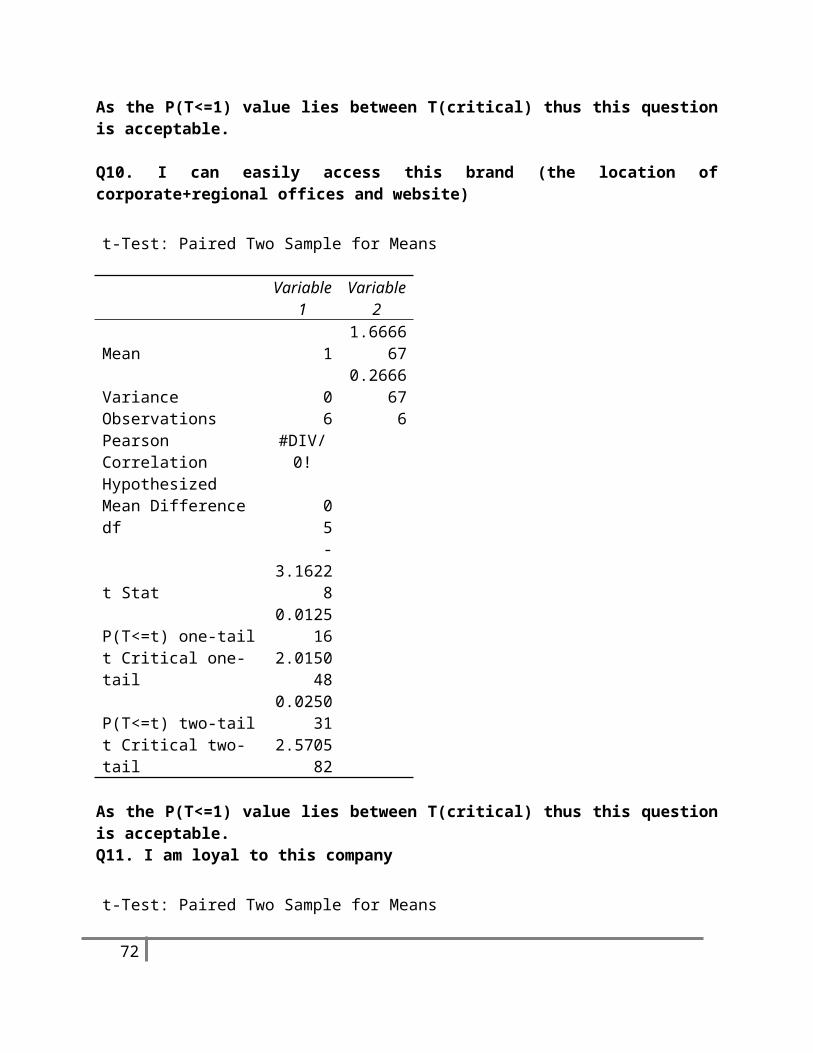
Q10. I can easily access this brand( the location of corporate+regional offices and website)
47
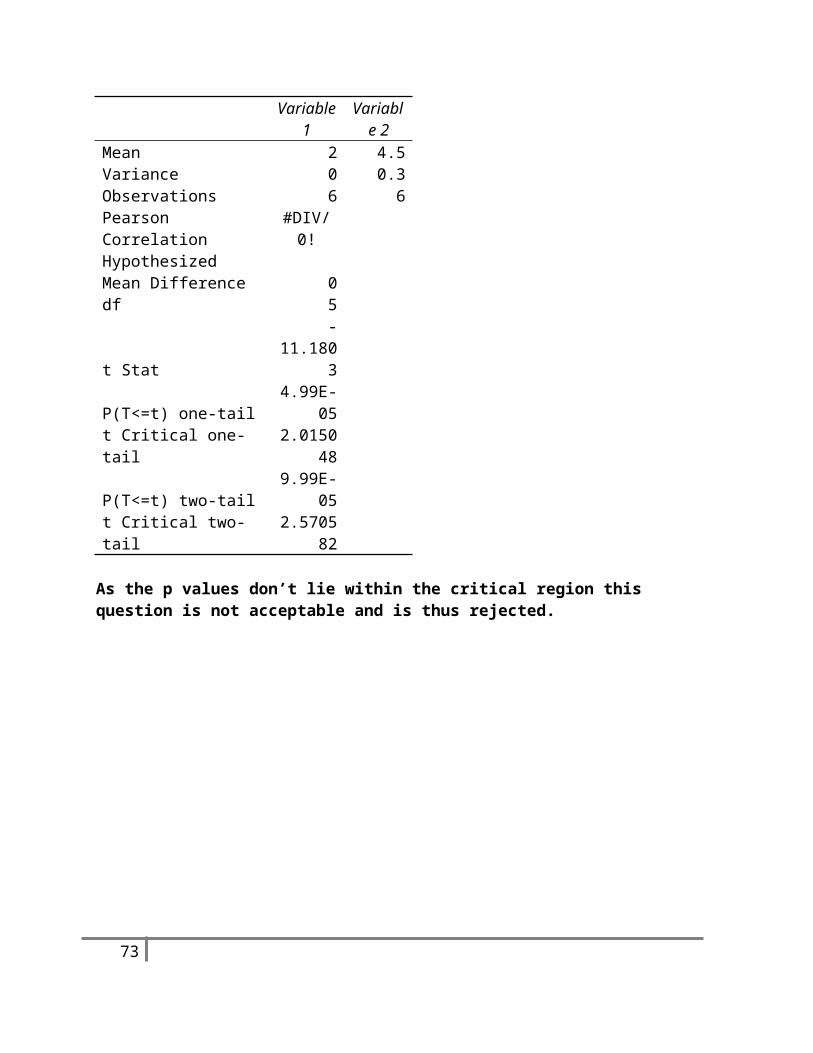
Q11. I am loyal to this company
48
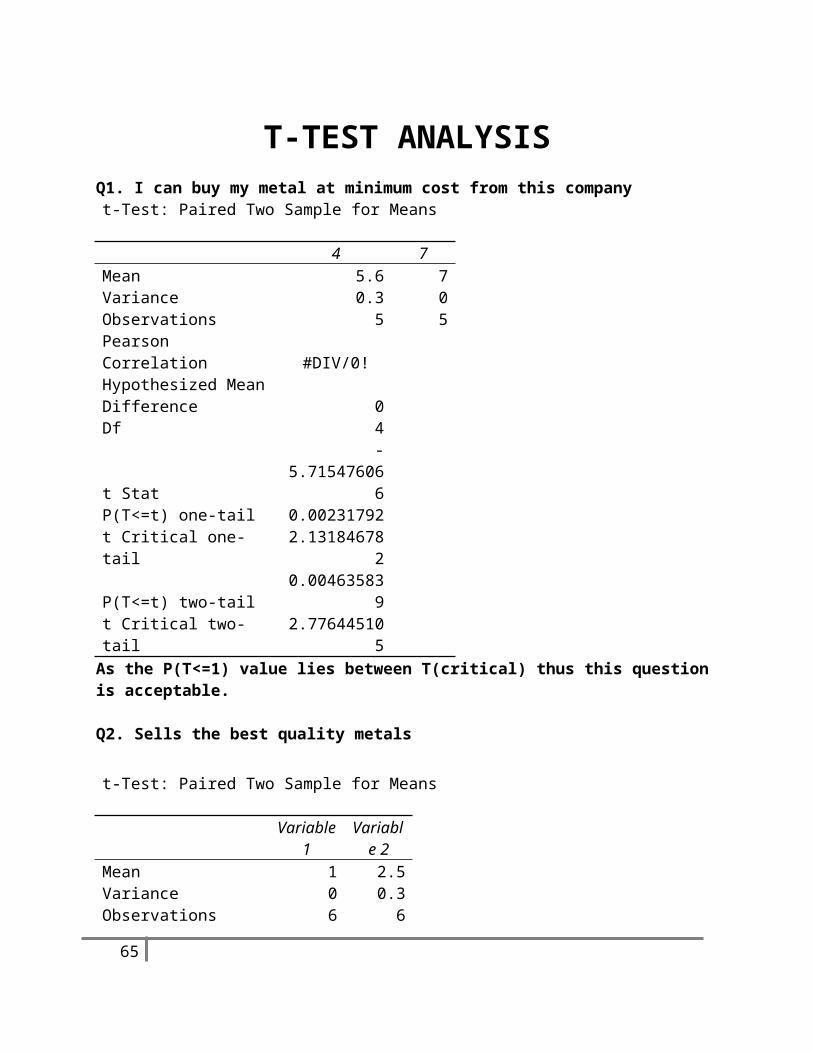
T-TEST ANALYSISQ1. I can buy my metal at minimum cost from this company
t-Test: Paired Two Sample for Means
4 7Mean 5.6 7Variance 0.3 0Observations 5 5Pearson Correlation #DIV/0!Hypothesized Mean Difference 0Df 4
t Stat-
5.715476066P(T<=t) one-tail 0.00231792t Critical one-tail 2.131846782P(T<=t) two-tail 0.004635839t Critical two-tail 2.776445105
As the P(T<=1) value lies between T(critical) thus this question is acceptable.
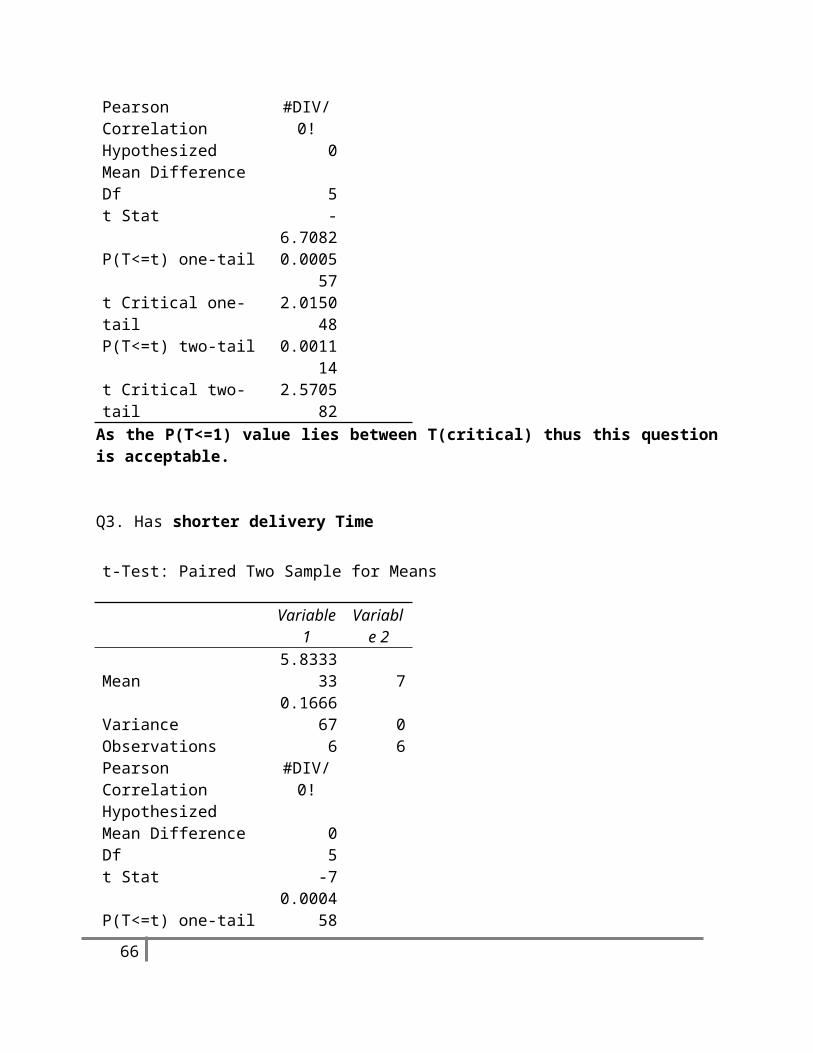
Q2. Sells the best quality metals
t-Test: Paired Two Sample for Means
Variable
1Variabl
e 2Mean 1 2.5Variance 0 0.3Observations 6 6Pearson Correlation #DIV/0!Hypothesized Mean Difference 0Df 5t Stat -6.7082
P(T<=t) one-tail0.00055
7
t Critical one-tail2.01504
8
P(T<=t) two-tail0.00111
4
49
t Critical two-tail2.57058
2 As the P(T<=1) value lies between T(critical) thus this question is acceptable.
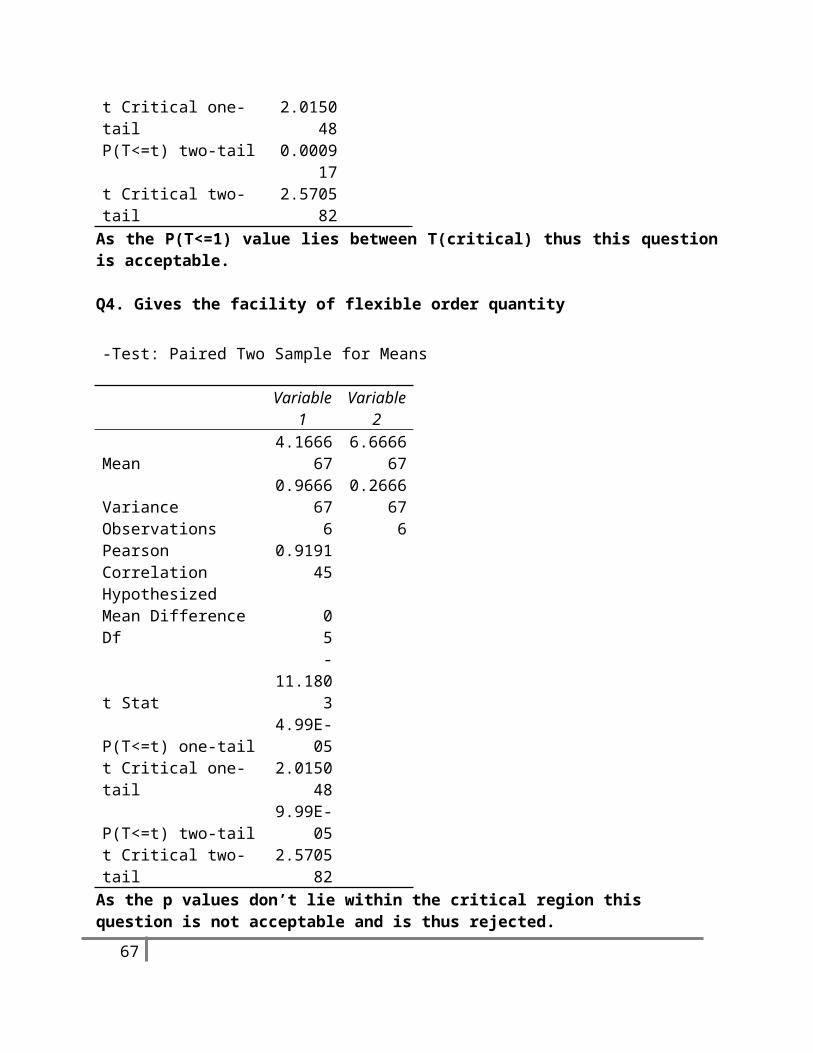
Q3. Has shorter delivery Time
t-Test: Paired Two Sample for Means
Variable
1Variabl
e 2
Mean5.83333
3 7
Variance0.16666
7 0Observations 6 6Pearson Correlation #DIV/0!Hypothesized Mean Difference 0Df 5t Stat -7
P(T<=t) one-tail0.00045
8
t Critical one-tail2.01504
8
P(T<=t) two-tail0.00091
7
t Critical two-tail2.57058
2 As the P(T<=1) value lies between T(critical) thus this question is acceptable.
Q4. Gives the facility of flexible order quantity
-Test: Paired Two Sample for Means
Variable
1Variable
2
Mean4.16666
76.66666
7
Variance0.96666
70.26666
7Observations 6 6
Pearson Correlation0.91914
5
50
Hypothesized Mean Difference 0Df 5
t Stat-
11.1803
P(T<=t) one-tail4.99E-
05
t Critical one-tail2.01504
8
P(T<=t) two-tail9.99E-
05
t Critical two-tail2.57058
2 As the p values don’t lie within the critical region this question is not acceptable and is thus rejected.
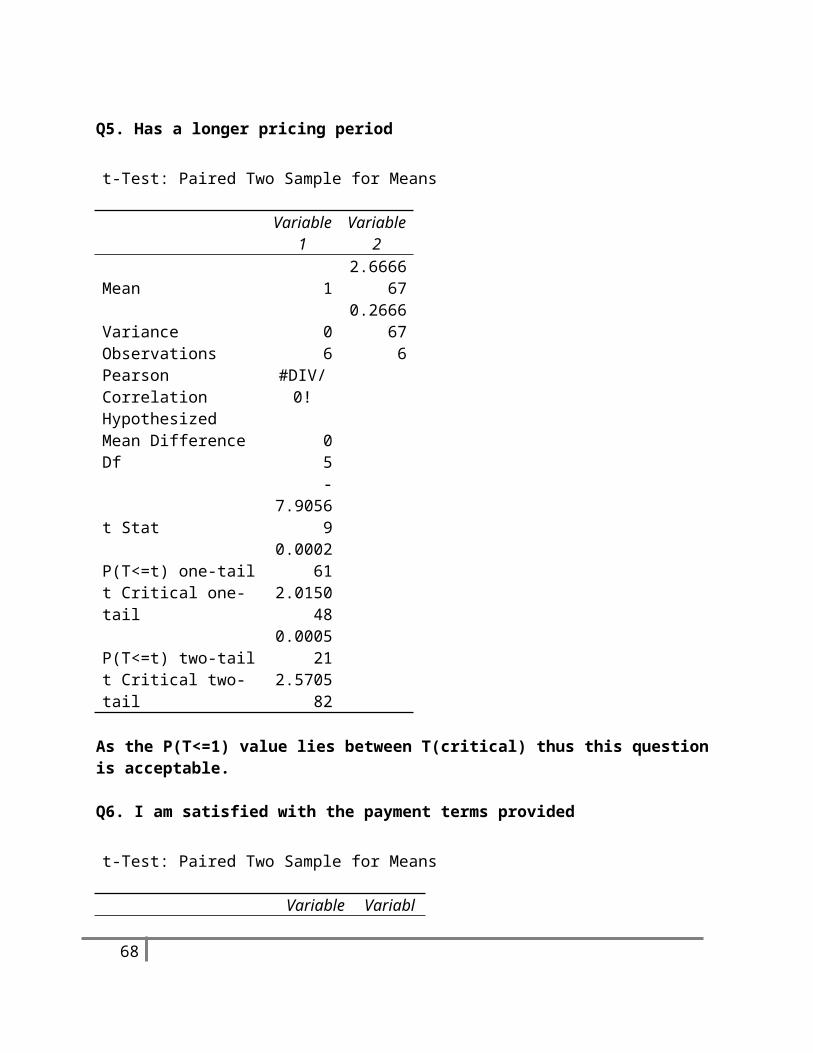
Q5. Has a longer pricing period
t-Test: Paired Two Sample for Means
Variable
1Variable
2
Mean 12.66666
7
Variance 00.26666
7Observations 6 6Pearson Correlation #DIV/0!Hypothesized Mean Difference 0Df 5
t Stat-
7.90569
P(T<=t) one-tail0.00026
1
t Critical one-tail2.01504
8
P(T<=t) two-tail0.00052
1
t Critical two-tail2.57058
2
As the P(T<=1) value lies between T(critical) thus this question is acceptable.
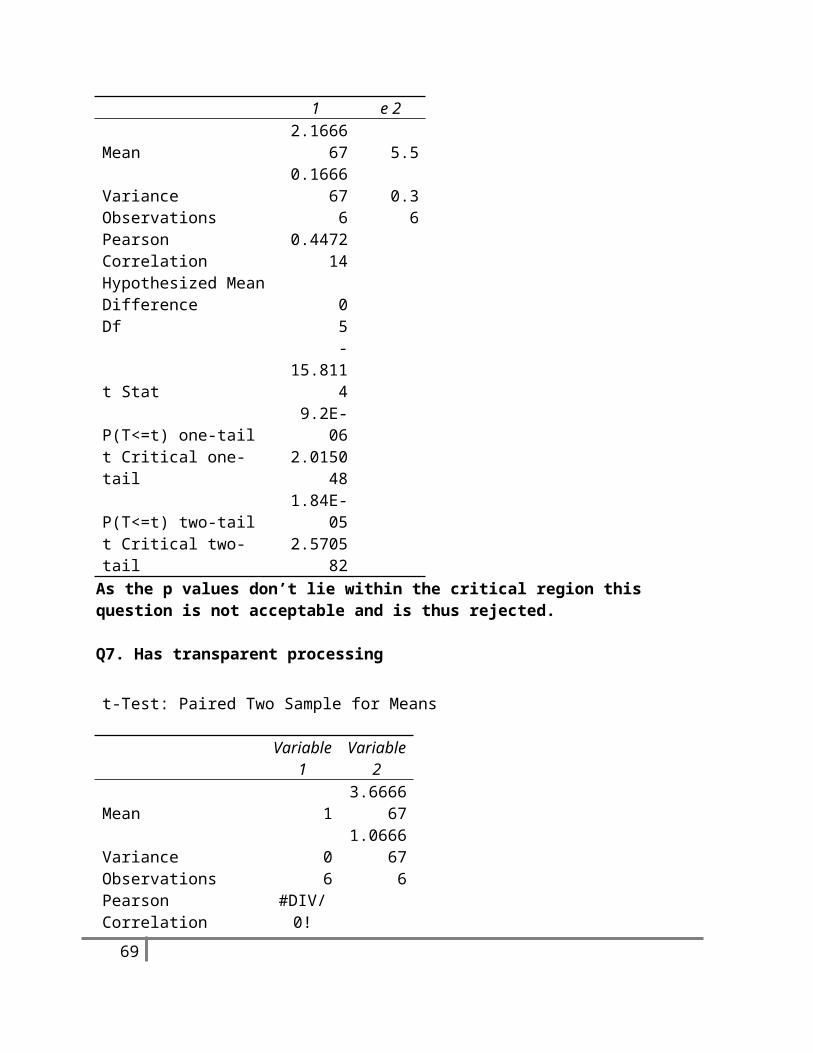
Q6. I am satisfied with the payment terms provided51
t-Test: Paired Two Sample for Means
Variable
1Variabl
e 2
Mean2.16666
7 5.5
Variance0.16666
7 0.3Observations 6 6
Pearson Correlation0.44721
4Hypothesized Mean Difference 0Df 5t Stat -15.8114P(T<=t) one-tail 9.2E-06
t Critical one-tail2.01504
8
P(T<=t) two-tail1.84E-
05
t Critical two-tail2.57058
2 As the p values don’t lie within the critical region this question is not acceptable and is thus rejected.
Q7. Has transparent processing
t-Test: Paired Two Sample for Means
Variable
1Variable
2
Mean 13.66666
7
Variance 01.06666
7Observations 6 6Pearson Correlation #DIV/0!Hypothesized Mean Difference 0Df 5
t Stat-
6.32456P(T<=t) one-tail 0.00072
52
8
t Critical one-tail2.01504
8
P(T<=t) two-tail0.00145
7
t Critical two-tail2.57058
2
As the P(T<=1) value lies between T(critical) thus this question is acceptable.
Q8. It is highly credible in terms of supply
t-Test: Paired Two Sample for Means
Variable
1Variable
2
Mean 12.33333
3
Variance 00.26666
7Observations 6 6Pearson Correlation #DIV/0!Hypothesized Mean Difference 0Df 5
t Stat-
6.32456
P(T<=t) one-tail0.00072
8
t Critical one-tail2.01504
8
P(T<=t) two-tail0.00145
7
t Critical two-tail2.57058
2 As the P(T<=1) value lies between T(critical) thus this question is acceptable.Q9. Gives the most favourable terms of L/C
t-Test: Paired Two Sample for Means
Variable
1Variabl
e 2
Mean4.16666
7 6
53
Variance0.56666
7 0Observations 6 6Pearson Correlation #DIV/0!Hypothesized Mean Difference 0df 5
t Stat-
5.96559
P(T<=t) one-tail0.00094
7
t Critical one-tail2.01504
8
P(T<=t) two-tail0.00189
4
t Critical two-tail2.57058
2
As the P(T<=1) value lies between T(critical) thus this question is acceptable.
Q10. I can easily access this brand (the location of corporate+regional offices and website)
t-Test: Paired Two Sample for Means
Variable
1Variable
2
Mean 11.66666
7
Variance 00.26666
7Observations 6 6Pearson Correlation #DIV/0!Hypothesized Mean Difference 0df 5
t Stat-
3.16228
P(T<=t) one-tail0.01251
6
t Critical one-tail2.01504
8
P(T<=t) two-tail0.02503
1
54
t Critical two-tail2.57058
2
As the P(T<=1) value lies between T(critical) thus this question is acceptable.Q11. I am loyal to this company
t-Test: Paired Two Sample for Means
Variable
1Variabl
e 2Mean 2 4.5Variance 0 0.3Observations 6 6Pearson Correlation #DIV/0!Hypothesized Mean Difference 0df 5
t Stat-
11.1803
P(T<=t) one-tail4.99E-
05
t Critical one-tail2.01504
8
P(T<=t) two-tail9.99E-
05
t Critical two-tail2.57058
2
As the p values don’t lie within the critical region this question is not acceptable and is thus rejected.
55

ANNOVA AND TUKEY KRAMER
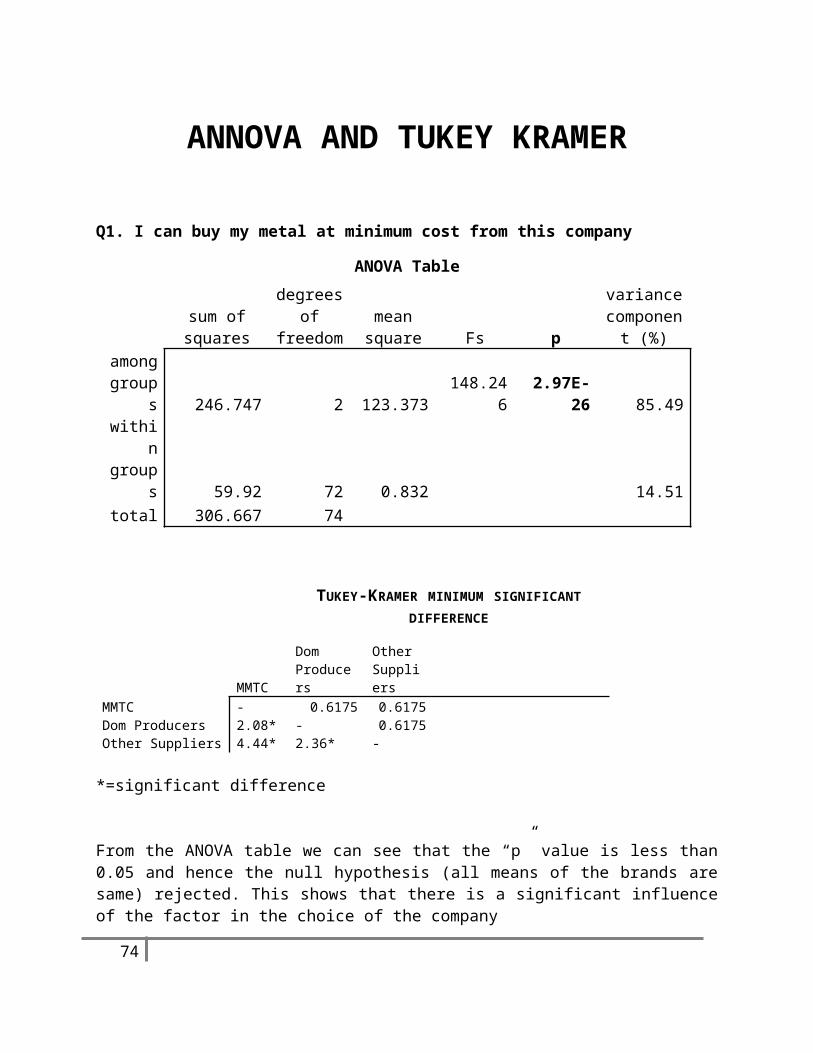
Q1. I can buy my metal at minimum cost from this company
ANOVA Table
sum of squares
degrees of
freedommean square Fs p
variance component
(%)
among groups 246.747 2 123.373 148.246 2.97E-26 85.49
within groups 59.92 72 0.832 14.51
total 306.667 74
TUKEY-KRAMER MINIMUM SIGNIFICANT DIFFERENCE
MMTCDom Producers
Other Suppliers
MMTC - 0.6175 0.6175 Dom Producers 2.08* - 0.6175 Other Suppliers 4.44* 2.36* -
*=significant difference
From the ANOVA table we can see that the “p” value is less than 0.05 and hence the null hypothesis (all means of the brands are same) rejected. This shows that there is a significant influence of the factor in the choice of the company
To identify which brand significantly differs from the others, Tukey Kramer’s MSD is used and the following are inferred
a) MMTC: dissimilar w.r.t. cost from Domestic Producers and Other Suppliersb) Domestic Producers: dissimilar w.r.t. cost from MMTC and Other Suppliersc) Other Suppliers: dissimilar w.r.t. cost from MMTC and Domestic Producers
56
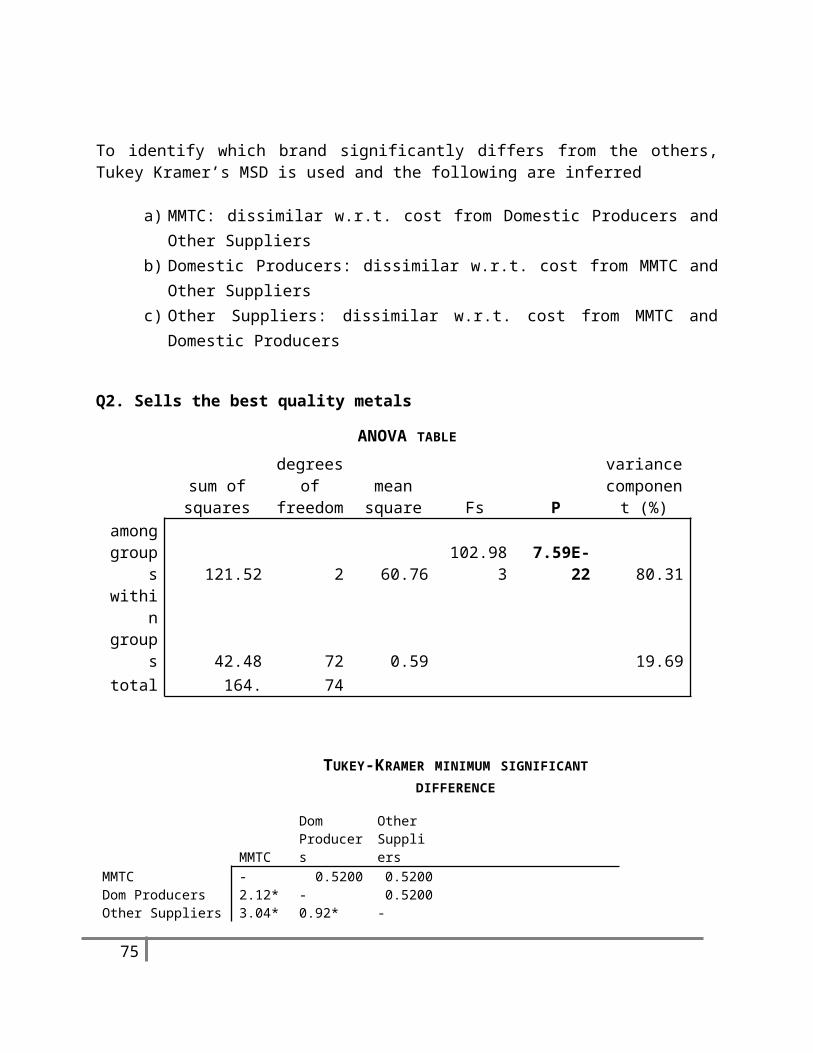
Q2. Sells the best quality metals
ANOVA TABLE
sum of squares
degrees of
freedommean
square Fs P
variance component
(%)
among groups 121.52 2 60.76 102.983 7.59E-22 80.31
within groups 42.48 72 0.59 19.69
total 164. 74
TUKEY-KRAMER MINIMUM SIGNIFICANT DIFFERENCE
MMTCDom Producers
Other Suppliers
MMTC - 0.5200 0.5200 Dom Producers 2.12* - 0.5200 Other Suppliers 3.04* 0.92* -
From the ANOVA table we can see that the “p” value is less than 0.05 and hence the null hypothesis (all means of the brands are same) rejected. This shows that there is a significant influence of the factor in the choice of the company
To identify which brand significantly differs from the others, Tukey Kramer’s MSD is used and the following are inferred
a) MMTC: dissimilar w.r.t. Quality from Domestic Producers and Other Suppliersb) Domestic Producers: dissimilar w.r.t. quality from MMTC and Other Suppliersc) Other Suppliers: dissimilar w.r.t. quality from MMTC and Domestic Producers
57
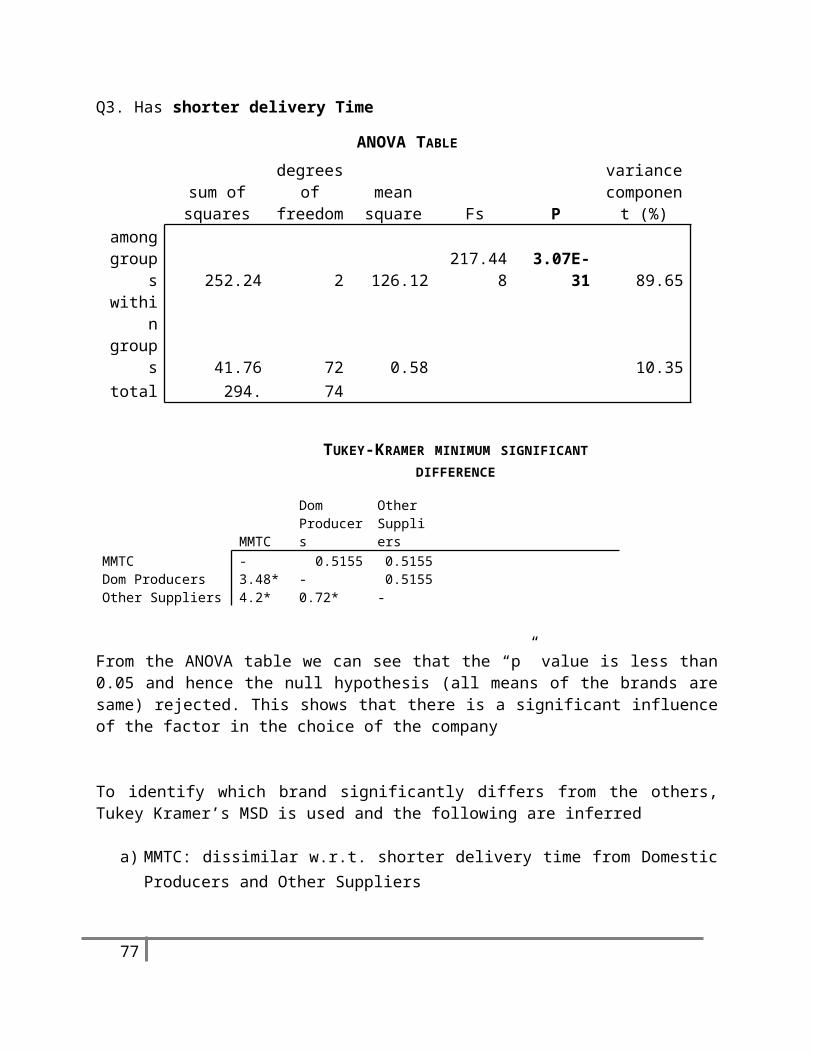
Q3. Has shorter delivery Time
ANOVA TABLE
sum of squares
degrees of
freedommean square Fs P
variance component
(%)
among groups 252.24 2 126.12 217.448 3.07E-31 89.65
within groups 41.76 72 0.58 10.35
total 294. 74
TUKEY-KRAMER MINIMUM SIGNIFICANT DIFFERENCE
MMTCDom Producers
Other Suppliers
MMTC - 0.5155 0.5155 Dom Producers 3.48* - 0.5155 Other Suppliers 4.2* 0.72* -
From the ANOVA table we can see that the “p” value is less than 0.05 and hence the null hypothesis (all means of the brands are same) rejected. This shows that there is a significant influence of the factor in the choice of the company
To identify which brand significantly differs from the others, Tukey Kramer’s MSD is used and the following are inferred
a) MMTC: dissimilar w.r.t. shorter delivery time from Domestic Producers and Other Suppliers
b) Domestic Producers: dissimilar w.r.t shorter delivery time from MMTC and Other Suppliers
c) Other Suppliers: dissimilar w.r.t shorter delivery time from MMTC and Domestic Producers
58
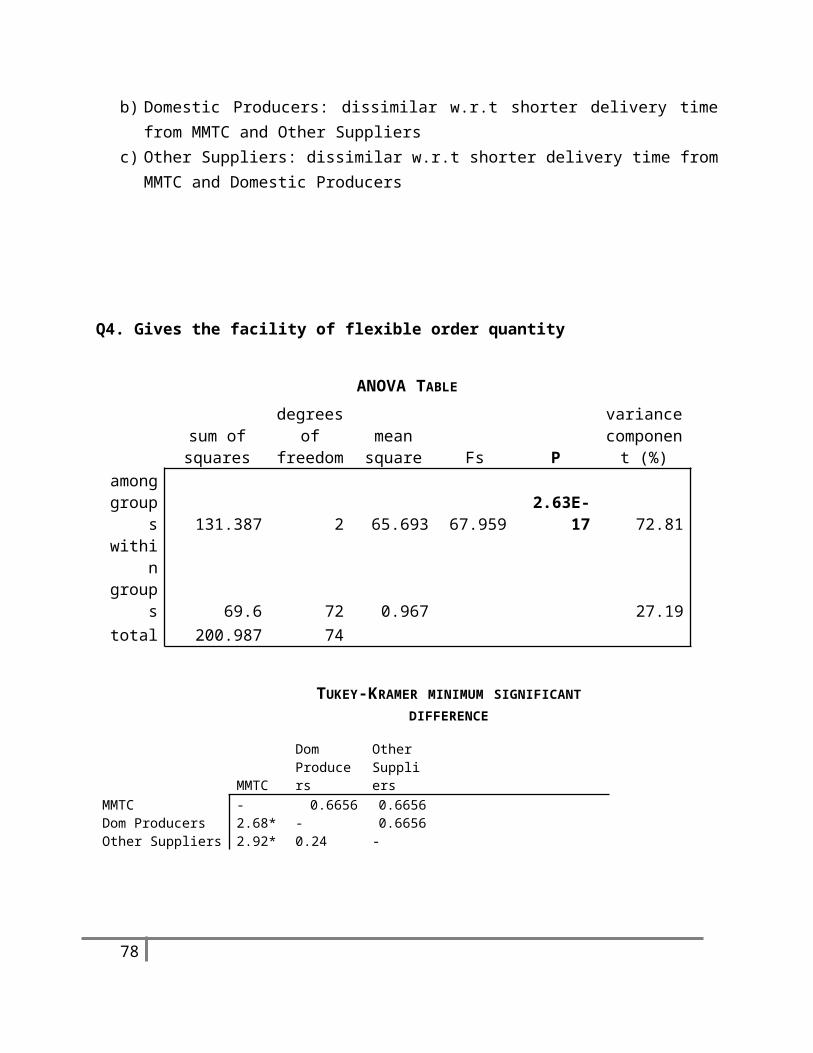
Q4. Gives the facility of flexible order quantity
ANOVA TABLE
sum of squares
degrees of
freedommean
square Fs P
variance component
(%)
among groups 131.387 2 65.693 67.959 2.63E-17 72.81
within groups 69.6 72 0.967 27.19
total 200.987 74
TUKEY-KRAMER MINIMUM SIGNIFICANT DIFFERENCE
MMTCDom Producers
Other Suppliers
MMTC - 0.6656 0.6656 Dom Producers 2.68* - 0.6656 Other Suppliers 2.92* 0.24 -
From the ANOVA table we can see that the “p” value is less than 0.05 and hence the null hypothesis (all means of the brands are same) rejected. This shows that there is a significant influence of the factor in the choice of the company
To identify which brand significantly differs from the others, Tukey Kramer’s MSD is used and the following are inferred
a) MMTC: dissimilar w.r.t. flexible order quantity from Domestic Producers and Other Suppliers
b) Domestic Producers: dissimilar w.r.t flexible order quantity from MMTC and similar to Other Suppliers
c) Other Suppliers: dissimilar w.r.t flexible order quantity from MMTC and similar to Domestic Producers
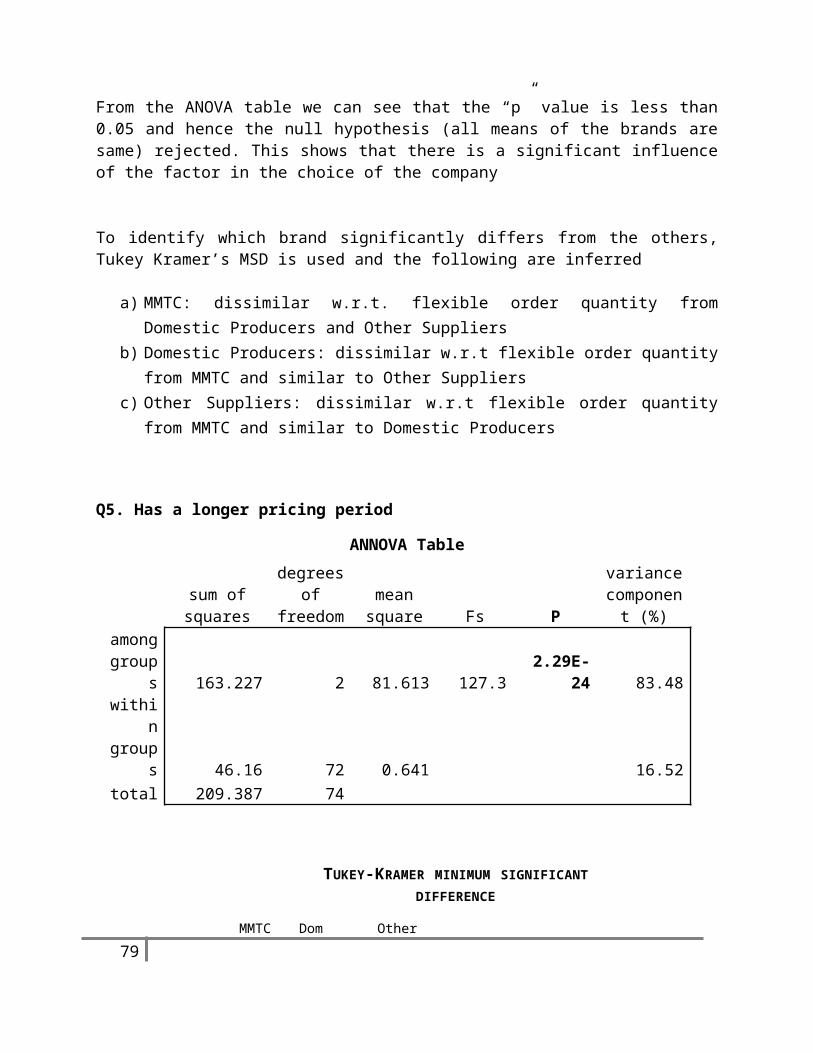
Q5. Has a longer pricing period
59
ANNOVA Table
sum of squares
degrees of
freedommean square Fs P
variance component
(%)
among groups 163.227 2 81.613 127.3 2.29E-24 83.48
within groups 46.16 72 0.641 16.52
total 209.387 74
TUKEY-KRAMER MINIMUM SIGNIFICANT DIFFERENCE
MMTCDom Producers
Other Suppliers
MMTC - 0.5420 0.5420 Dom Producers 2.76* - 0.5420 Other Suppliers 3.4* 0.64* -
From the ANOVA table we can see that the “p” value is less than 0.05 and hence the null hypothesis (all means of the brands are same) rejected. This shows that there is a significant influence of the factor in the choice of the company
To identify which brand significantly differs from the others, Tukey Kramer’s MSD is used and the following are inferred
a) MMTC: dissimilar w.r.t. longer pricing period from Domestic Producers and Other Suppliers
b) Domestic Producers: dissimilar w.r.t longer pricing period from MMTC and Other Suppliers
c) Other Suppliers: dissimilar w.r.t longer pricing period from MMTC and Domestic Producers
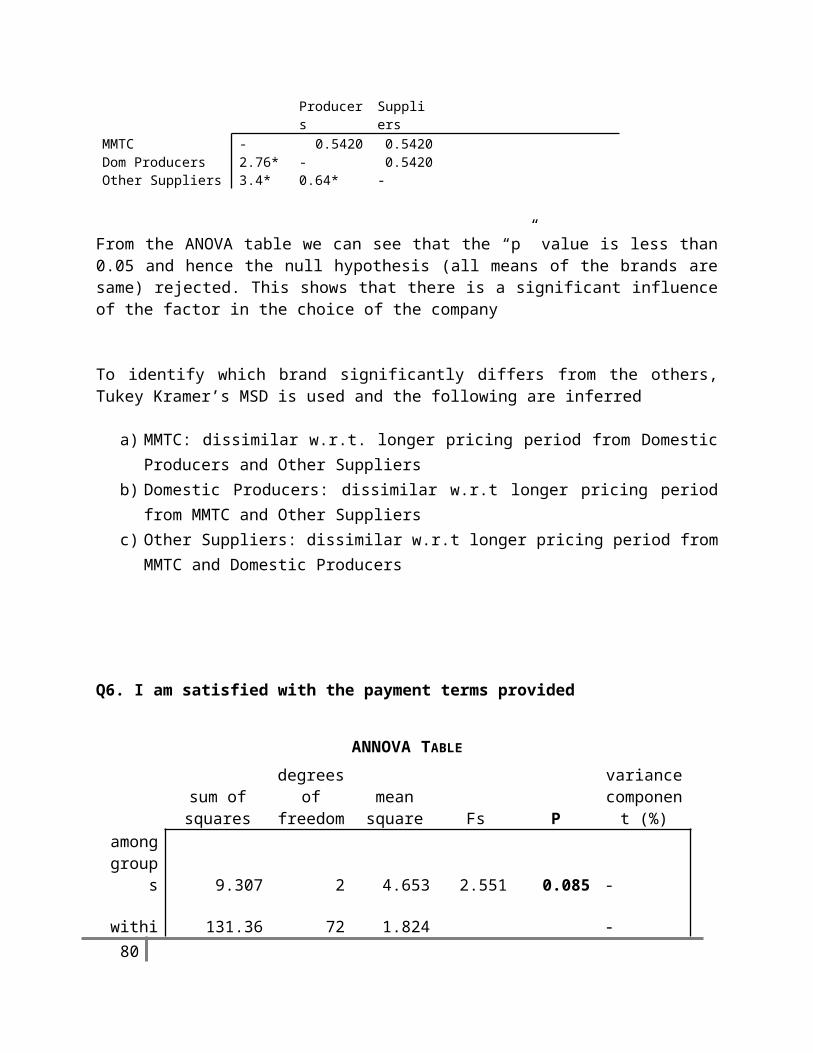
Q6. I am satisfied with the payment terms provided
60

ANNOVA TABLE
sum of squares
degrees of
freedommean
square Fs P
variance component
(%)
among groups 9.307 2 4.653 2.551 0.085 -
within groups 131.36 72 1.824 -
total 140.667 74
TUKEY-KRAMER MINIMUM SIGNIFICANT DIFFERENCE
MMTC
Dom Producer
s
Other Supplier
sMMTC - 0.9143 0.9143 Dom Producers 0.12 - 0.9143 Other Suppliers 0.68 0.8 -
From the ANOVA table we can see that the “p” value is more than 0.05 and hence the alternate hypothesis (all means of the brands are same) rejected. This shows that there is no significant influence of the factor in the choice of the company
To identify which brand significantly differs from the others, Tukey Kramer’s MSD is used and the following are inferred
a) MMTC: similar w.r.t. payment terms from Domestic Producers and Other Suppliers
b) Domestic Producers: similar w.r.t payment terms from MMTC and Other Suppliers
c) Other Suppliers: similar w.r.t payment terms from MMTC and Domestic Producers
61
Q7. Has transparent processing
ANNOVA TABLE
sum of squares
degrees of
freedommean square Fs P
variance component
(%)
among groups 138.96 2 69.48 46.946 8.92E-14 64.76
within groups 106.56 72 1.48 35.24
total 245.52 74
TUKEY-KRAMER MINIMUM SIGNIFICANT DIFFERENCE
MMTCDom Producers
Other Suppliers
MMTC - 0.8235 0.8235 Dom Producers 2.76* - 0.8235 Other Suppliers 3* 0.24 -
From the ANOVA table we can see that the “p” value is less than 0.05 and hence the null hypothesis (all means of the brands are same) rejected. This shows that there is a significant influence of the factor in the choice of the company
To identify which brand significantly differs from the others, Tukey Kramer’s MSD is used and the following are inferred
a) MMTC: dissimilar w.r.t. transparent processing from Domestic Producers and Other Suppliers
b) Domestic Producers: dissimilar w.r.t . transparent processing from MMTC and similar to Other Suppliers
c) Other Suppliers: dissimilar w.r.t . transparent processing from MMTC and similar to Domestic Producers
Q8. It is highly credible in terms of supply
62

ANNOVA TABLE
sum of squares
degrees of
freedommean square Fs P
variance component
(%)
among groups 195.92 2 97.96 118.024 1.88E-23 82.40
within groups 59.76 72 0.83 17.60
total 255.68 74
TUKEY-KRAMER MINIMUM SIGNIFICANT DIFFERENCE
MMTCDom Producers
Other Suppliers
MMTC - 0.6167 0.6167 Dom Producers 1.48* - 0.6167 Other Suppliers 3.92* 2.44* -
From the ANOVA table we can see that the “p” value is less than 0.05 and hence the null hypothesis (all means of the brands are same) rejected. This shows that there is a significant influence of the factor in the choice of the company
To identify which brand significantly differs from the others, Tukey Kramer’s MSD is used and the following are inferred
a) MMTC: dissimilar w.r.t. credibilty from Domestic Producers and Other Suppliersb) Domestic Producers: dissimilar w.r.t credibilty from MMTC and Other Suppliersc) Other Suppliers: dissimilar w.r.t credibilty from MMTC and Domestic Producers
63
Q9. Gives the most favourable terms of L/C
ANNOVA TABLE
sum of squares
degrees of
freedommean
square Fs P
variance component
(%)
among groups 79.707 2 39.853 45.576 1.62E-13 64.07
within groups 62.96 72 0.874 35.93
total 142.667 74
TUKEY-KRAMER MINIMUM SIGNIFICANT DIFFERENCE
MMTCDom Producers
Other Suppliers
MMTC - 0.6330 0.6330 Dom Producers 1.12* - 0.6330 Other Suppliers 2.52* 1.4* -
From the ANOVA table we can see that the “p” value is less than 0.05 and hence the null hypothesis (all means of the brands are same) rejected. This shows that there is a significant influence of the factor in the choice of the company
To identify which brand significantly differs from the others, Tukey Kramer’s MSD is used and the following are inferred
a) MMTC: dissimilar w.r.t. terms of L/C from Domestic Producers and Other Suppliers
b) Domestic Producers: dissimilar w.r.t terms of L/C from MMTC and Other Suppliers
c) Other Suppliers: dissimilar w.r.t terms of L/C from MMTC and Domestic Producers
64
Q10. I can easily access this brand( the location of corporate+regional offices and website)
ANNOVA TABLE
sum of squares
degrees of
freedommean square Fs P
variance component
(%)
among groups 55.387 2 27.693 70.807 9.94E-18 73.63
within groups 28.16 72 0.391 26.37
total 83.547 74
TUKEY-KRAMER MINIMUM SIGNIFICANT DIFFERENCE
MMTCDom Producers
Other Suppliers
MMTC - 0.4233 0.4233 Dom Producers 1.76* - 0.4233 Other Suppliers 1.88* 0.12 -
From the ANOVA table we can see that the “p” value is less than 0.05 and hence the null hypothesis (all means of the brands are same) rejected. This shows that there is a significant influence of the factor in the choice of the company
To identify which brand significantly differs from the others, Tukey Kramer’s MSD is used and the following are inferred
a) MMTC: dissimilar w.r.t. accessibility from Domestic Producers and Other Suppliers
b) Domestic Producers: dissimilar w.r.t . accessibilty from MMTC and similar to Other Suppliers
c) Other Suppliers: dissimilar w.r.t . accessibilty from MMTC and similar to Domestic Producers
65
Q11. I am loyal to this company
ANNOVA TABLE
sum of squares
degrees of
freedommean square Fs P
variance component
(%)
among groups 5.787 2 2.893 2.492 0.09 -
within groups 83.6 72 1.161 -
total 89.387 74
TUKEY-KRAMER MINIMUM SIGNIFICANT DIFFERENCE
MMTCDom Producers
Other Suppliers
MMTC - 0.7294 0.7294 Dom Producers 0.68 - 0.7294 Other Suppliers 0.32 0.36 -
From the ANOVA table we can see that the “p” value is more than 0.05 and hence the alternate hypothesis (all means of the brands are same) rejected. This shows that there is no significant influence of the factor in the choice of the company
To identify which brand significantly differs from the others, Tukey Kramer’s MSD is used and the following are inferred
a) MMTC: similar w.r.t. loyalty from Domestic Producers and Other Suppliersb) Domestic Producers: similar w.r.t loyalty from MMTC and Other Suppliersc) Other Suppliers: similar w.r.t loyalty from MMTC and Domestic Producers
66
FACTOR ANALYSIS-MMTCTo find the motivational factors that influence the buyer’s decision to buy non ferrous metals we will use factor analysis. Factor analysis will help us eliminate the factors that are not required and further combines the similar factors together.
KMO and Bartlett's Test
Kaiser-Meyer-Olkin Measure of Sampling Adequacy. .336
Bartlett's Test of Sphericity Approx. Chi-Square 70.258
Df 55
Sig. .081
According to the KMO and barletts test we cannot proceed with factor analysis. KMO should be at least .50 to satisfy factor analysis. As we will eliminate the factors that are not desired we shall achieve the required KMO.First accessibility was removed, then flexible order quantity and at last loyalty. Thereafter the result was:
KMO and Bartlett's Test
Kaiser-Meyer-Olkin Measure of Sampling Adequacy. .499
Bartlett's Test of Sphericity Approx. Chi-Square 25.727
Df 28
Sig. .588
Total Variance Explained
Component
Initial EigenvaluesExtraction Sums of Squared Loadings
Rotation Sums of Squared Loadings
Total% of Variance
Cumulative % Total
% of Variance
Cumulative % Total
% of Variance
Cumulative %
1 2.021 25.263 25.263 2.021 25.263 25.263 1.579 19.734 19.7342 1.609 20.112 45.375 1.609 20.112 45.375 1.488 18.601 38.336
3 1.125 14.057 59.432 1.125 14.057 59.432 1.339 16.738 55.074
4 1.000 12.506 71.937 1.000 12.506 71.937 1.149 14.369 69.443
5 .856 10.706 82.643 .856 10.706 82.643 1.056 13.200 82.643
6 .626 7.820 90.464 7 .391 4.882 95.345 8 .372 4.655 100.000
67
Rotated Component Matrixa
Component
1 2 3 4 5
Shorter Delivery Time .812 -.125 -.237
Credible .761 .107 .124 .242
Quality -.112 .877 -.239 .105
Transparent processing .814 .203 .315
Terms of L/C -.301 -.865 .136 -.100
Payment terms -.472 .174 .726 .228
Longer Pricing period .113 .947 .106
Cost .950
Extraction Method: Principal Component Analysis.
Rotation Method: Varimax with Kaiser Normalization.
a. Rotation converged in 6 iterations.
According to factor analysis, there should be 5 components and the factors that should be combined with each other are:
1) Shorter Delivery Time and Credibility: MMTC not only delivers the metal in lesser time but is also consistently doing that increasing the credibility of the buyers. This component can be termed as Credible Delivery Time.
2) Quality and Transparent Processing: the buyers of MMTC trusts MMTC as it has transparent processing. The transparent processing helps them to know what quality of metal they are buying, where has the metal reached etc. This component can be termed as Transparency in Quality Trade.
3) Terms of L/C and Payment Terms: Payment term can be defined as Conditions of payment agreed between a buyer and a seller for goods sold or services rendered on the other hand Letter of Credit can also be source of payment for a transaction. Hence this component can be termed as Payment Terms only.
4) Longer Pricing Period: The 4th component has not been combined with any other factor thus it remains as it is.
5) Cost: The 5th component has not been combined with any other factor thus it remains as it is.
68
PERCEPTUAL MAPS
QualityShorter delivery Time
MMTC 8.32 3.64Domestic producers 6.2 7.12Other Suppliers 5.28 7.84
It can be observed from the map that MMTC has better quality than both domestic producers and other supplier. However others stand tough against MMTC in terms of shorter delivery time.MMTC is also dissimilar to others with respect to both quality and shorter delivery time.
69
Quality
Delivery time
Transparent Processing
Payment Terms
MMTC 8 6.28Domestic producers
5.33 6.16
Other Suppliers 5 6.96
It can be observed from the map that MMTC has transparency in processing more than both domestic producers and other supplier. However others suppliers stand tough against MMTC in terms of payment terms.MMTC is dissimilar to others with respect to transparent processing but similar to Domestic producers with respect to payment terms.
70
Transparent processing
Payment
Terms
Credible Terms of L/C
MMTC 8.56 4.72Domestic producers
7.08 5.84
Other Suppliers 4.64 7.24
It can be observed from the map that buyers trust MMTC and perceive believes it to be credible more than both domestic producers and other supplier. However others suppliers stand tough against MMTC in terms of L/C.MMTC is not very far from Domestic Producers with respect to both credibility and Terms of L/C.
71
Credibility
Te rms
of
L/C
Cost Longer pricing period
MMTC 3.76 8.2
Domestic producers
5.84 5.44
Other Suppliers 8.2 4.74
3 4 5 6 7 8 94
4.5
5
5.5
6
6.5
7
7.5
8
8.5
9
MMTC
Domestic Producers
other suppliers
It can be observed from the map that MMTC has longer pricing period more than both domestic producers and other supplier. However when it comes to cost MMTC has been ranked costly by most of the buyers.
MMTC is dissimilar to others with respect to both cost and longer pricing period. Also longer pricing period is not preferred by buyers, thus MMTC stands unfavorable with respect to both Cost and Pricing period.
72
Minimum Cost
Longer Pricing Pd.
RECOMMENDATIONS AND CONCLUSION
MMTC has presence in almost all states. It has a well established network however still its market share is less.
MMTC is the largest seller of imported non ferrous metals in India. However the company faces tough competition from domestic producers.
The unanimous reply to the query on cost was that MMTC is an expensive choice in comparison to the other players in the market. According to respondents cost plays an important role while influencing their decision to buy Non ferrous Metal.
Being a government organization MMTC is regarded as trustworthy and thus has credibility.
MMTC is similar to domestic producers and suppliers only with respect to payment terms. For the all the other factors MMTC has a unique positioning in the mind of the customers.
73
LARGE TRADERS(LESS IN NUMBER)
Most of them are either buyers and suppliers of MMTC for eg Assem global
limited,Bhagwati aluminiums etc.
Others deals with overseas traders, overseas dealers and
some times with domestic traders
There are basically 5 motivational factors that influence the decisions of buyers of non ferrous metals. These are:
i. Credible Delivery Time
ii. Transparency in Quality Trade
iii. Payment Terms
iv. Longer Pricing Period
v. Cost
MMTC has huge potential to grow by tapping the market of small traders which fall under the second category. However for that MMTC needs to market itself effectively. Despite of having features like LIBOR based credit, Extended pricing period, Delivery without opening a L/C, Variable order quantity the company is unable to capture the market.
The main reason behind this is the communication gap between the company and the customers. When respondents were being interviewed, it was discovered that they didn’t know the features that makes MMTC better from the rest. This communication gap can be removed if the company increases its marketing activities so as to directly reach the consumers and make them aware of these various facilities.
The above point mentioned holds true only for the potential customers as MMTC is taking all the possible steps to be in direct contact with its customers and develop and establish long term relations.
74
REFERENCES
BOOKS: Malhotra, Naresh. K, 2007, Market Research- An applied orientation. Kothari, C.R. , Research Methodology
MAGAZINE: Spectrum, Quarterly House Magazine, July-Aug-Sept 2009
INTERNET WEBSITES
http://www.lme.com/ http://www.mmtclimited.com http://www.wikipedia.com http://www.dgft.com http://www. metalbulletin.com http://www.exim.com http://in.reuters.com/ http://www.EMC.GDMB.de
75
Appendix
QUESTIONNAIRE
INSTRUCTION: Please indicate your level of agreement with each of the following statements given below. (Kindly tick mark your preference √)
1=Strongly Agree 2=Agree 3=Slightly Agree 4=Neither Agree nor Disagree 5=Slightly Disagree 6=Disagree 7=Strongly Disagree
Q1. I can buy my metal at minimum cost from this company
BRANDS 1 2 3 4 5 6 7MMTC ltdDomestic producersOther suppliers
Q2. Sells the best quality metals
BRANDS 1 2 3 4 5 6 7MMTC ltdDomestic producersOther suppliers
76
Q3. Has shorter delivery Time
BRANDS 1 2 3 4 5 6 7MMTC ltdDomestic producersOther suppliers
Q4. Gives the facility of flexible order quantity
BRANDS 1 2 3 4 5 6 7MMTC ltdDomestic producersOther suppliers
Q5. Has a longer pricing period
BRANDS 1 2 3 4 5 6 7MMTC ltdDomestic producersOther suppliers
77
Q6. I am satisfied with the payment terms provided
BRANDS 1 2 3 4 5 6 7MMTC ltdDomestic producersOther suppliers
Q7. Has transparent processing
BRANDS 1 2 3 4 5 6 7MMTC ltdDomestic producersOther suppliers
Q8. It is highly credible in terms of supply
BRANDS 1 2 3 4 5 6 7MMTC ltdDomestic producersOther suppliers
Q9. Gives the most favourable terms of L/C
BRANDS 1 2 3 4 5 6 7MMTC ltdDomestic producersOther
78
suppliersQ10. I can easily access this brand( the location of corporate+regional offices and website)
BRANDS 1 2 3 4 5 6 7MMTC ltdDomestic producersOther suppliers
Q11. I am loyal to this company:
BRANDS 1 2 3 4 5 6 7MMTC ltdDomestic producersOther suppliers
INSTRUCTION: Please indicate your response on the basis of Similarity/Dissimilarity between each pair of brands given in the table below
Companies MMTC Domestic producers
Other suppliers
MMTC -Domestic producers -Other suppliers -
1=Highly Similar 2=Similar 3=Somewhat Similar 4=Neutral 5=Somewhat Dissimilar 6=Dissimilar 7=Highly Dissimilar
79
PERSONAL INFORMATION:
1. Name:................................................................................................................................................
2. What business are you in:...............................................................................................................................................
3. In which Non ferrous metal do you dealAluminium ZincNickel CopperTin Industrial Raw MaterialsLead Any other…………………………
4. Do you buy the metal forTrading Consumption in manufacturing Both
5. Where do you buy the non ferrous metal from:
MMTCDomestic Producers (please name)…………………………………………………Other Supplier (please name)………………………………………………….........
80
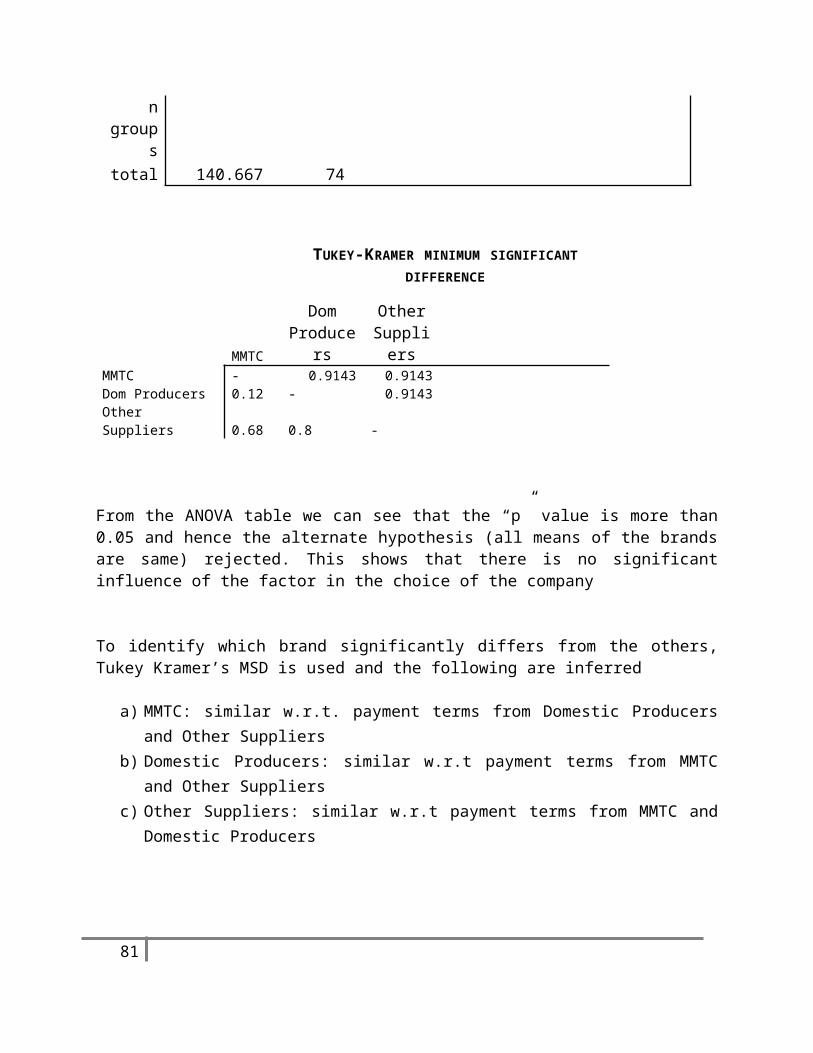
Table no1: LME prices of aluminium May-June 2010 Daily Aluminum - LME Cash Prices
Date DayOpen Price
Close Price ChangeUp /
DownChanges in (%)
05-06-2010 Thursday 2164 2095 -69 -3.29%
05-07-2010 Friday 2095 2051 -44 -2.15%
05-10-2010 Monday 2051 2065.5 +14.5 +0.70%
05-11-2010 Tuesday 2065.5 2104.5 +39 +1.85%
05-12-2010 Wednesday 2104.5 2028 -76.5 -3.77%
05-13-2010 Thursday 2028 2100.5 +72.5 +3.45%
05-14-2010 Friday 2100.5 2116.5 +16 +0.76%
05-18-2010 Tuesday 2137 2040 -97 -4.75%
05-18-2010 Tuesday 2116.5 2011 -105.5 -5.25%
05-19-2010 Wednesday 2011 2005.5 -5.5 -0.27%
05-20-2010 Thursday 2005.5 1969 -36.5 -1.85%
05-21-2010 Friday 1969 1947 -22 -1.13%
05-24-2010 Monday 1947 1991 +44 +2.21%
05-31-2010 Monday 2010.5 2037 +26.5 +1.30%
06-01-2010 Tuesday 2037 2037 no change no change
06-02-2010 Wednesday 2037 1953 -84 -4.30%
06-03-2010 Thursday 1953 1954 +1 +0.05%
06-04-2010 Friday 1954 1951 -3 -0.15%
Table no 2: LME prices of Nickel May-June 2010
Date Day Open Price Close Price ChangeUp /
DownChanges in (%)
05-06-2010
Thursday 25650 22560 -3090 -13.70%
81
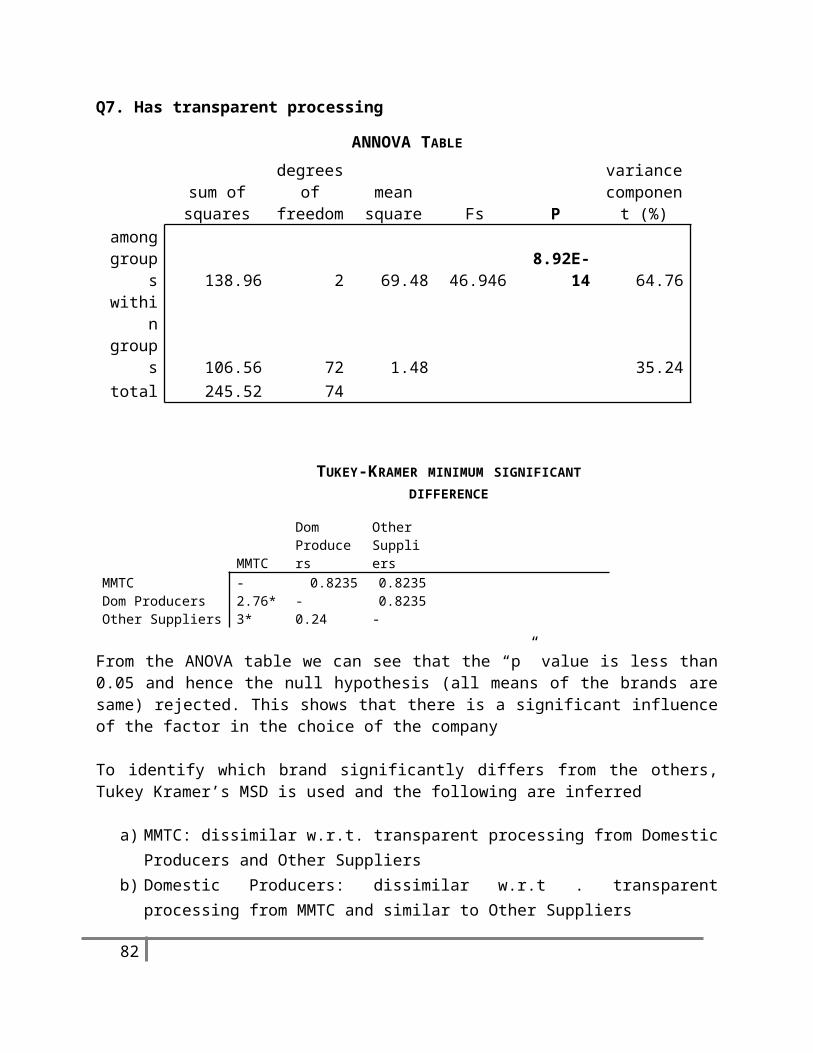
05-07-2010
Friday 22560 21670 -890 -4.11%
05-10-2010
Monday 21670 22170 +500 +2.26%
05-11-2010
Tuesday 22170 23160 +990 +4.27%
05-12-2010
Wednesday 23160 22075 -1085 -4.92%
05-13-2010
Thursday 22075 22805 +730 +3.20%
05-14-2010
Friday 22805 22680 -125 -0.55%
05-18-2010
Tuesday 22790 21200 -1590 -7.50%
05-18-2010
Tuesday 22680 21050 -1630 -7.74%
05-19-2010
Wednesday 21050 21475 +425 +1.98%
05-20-2010
Thursday 21475 21055 -420 -1.99%
05-21-2010
Friday 21055 21050 -5 -0.02%
05-24-2010
Monday 21050 21200 +150 +0.71%
05-31-2010
Monday 21460 21555 +95 +0.44%
06-01-2010
Tuesday 21555 21555 no change no change
06-02-2010
Wednesday 21555 20505 -1050 -5.12%
06-03-2010
Thursday 20505 19880 -625 -3.14%
06-04-2010
Friday 19880 19205 -675 -3.51%
Table no 3: LME prices of Copper May-June 2010
Daily Copper - LME Cash Prices
Date DayOpen Price
Close Price ChangeUp /
DownChanges in (%)
05-06-2010 Thursday 7175.5 6801 -374.5 -5.51%
05-07-2010 Friday 6801 6945 +144 +2.07%
82
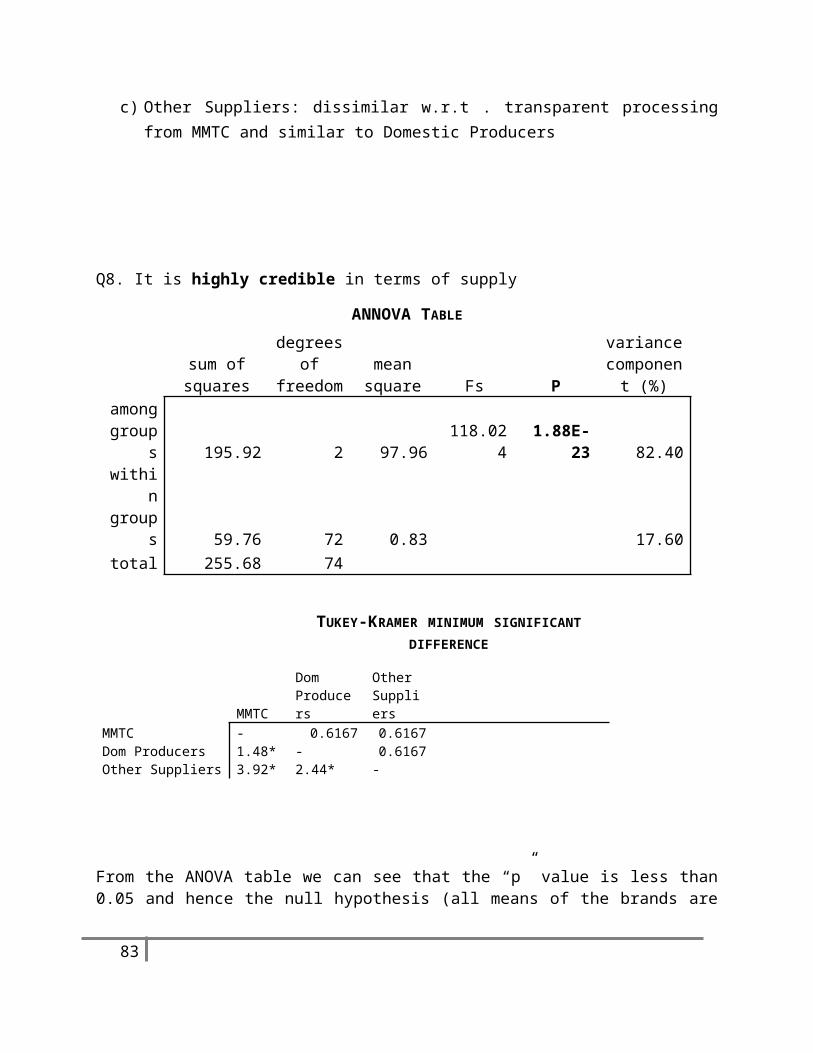
05-10-2010 Monday 6945 6872 -73 -1.06%
05-11-2010 Tuesday 6872 7165.5 +293.5 +4.10%
05-12-2010 Wednesday 7165.5 6885 -280.5 -4.07%
05-13-2010 Thursday 6885 7082 +197 +2.78%
05-14-2010 Friday 7082 7010.5 -71.5 -1.02%
05-18-2010 Tuesday 7051 6752 -299 -4.43%
05-18-2010 Tuesday 7010.5 6721 -289.5 -4.31%
05-19-2010 Wednesday 6721 6605.5 -115.5 -1.75%
05-20-2010 Thursday 6605.5 6465.5 -140 -2.17%
05-21-2010 Friday 6465.5 6500 +34.5 +0.53%
05-24-2010 Monday 6500 6639 +139 +2.09%
05-31-2010 Monday 6836 6926 +90 +1.30%
06-01-2010 Tuesday 6926 6926 no change no change
06-02-2010 Wednesday 6926 6715 -211 -3.14%
06-03-2010 Thursday 6715 6605 -110 -1.67%
06-04-2010 Friday 6605 6620.5 +15.5 +0.23%
Table no 4: LME prices of Lead May-June 2010
Daily Lead - LME Cash Prices
Date DayOpen Price
Close Price ChangeUp /
DownChanges in (%)
05-06-2010 Thursday 2129.5 1962 -167.5 -8.54%
05-07-2010 Friday 1962 1965 +3 +0.15%
05-10-2010 Monday 1965 1979 +14 +0.71%
05-11-2010 Tuesday 1979 2081 +102 +4.90%
05-12-2010 Wednesday 2081 1976 -105 -5.31%
83
05-13-2010 Thursday 1976 2026 +50 +2.47%
05-14-2010 Friday 2026 2016.5 -9.5 -0.47%
05-18-2010 Tuesday 2045.5 1905 -140.5 -7.38%
05-18-2010 Tuesday 2016.5 1864 -152.5 -8.18%
05-19-2010 Wednesday 1864 1795.5 -68.5 -3.82%
05-20-2010 Thursday 1795.5 1721 -74.5 -4.33%
05-21-2010 Friday 1721 1720 -1 -0.06%
05-24-2010 Monday 1720 1722.5 +2.5 +0.15%
05-31-2010 Monday 1760 1821 +61 +3.35%
06-01-2010 Tuesday 1821 1821 no change no change
06-02-2010 Wednesday 1821 1751 -70 -4.00%
06-03-2010 Thursday 1751 1709.5 -41.5 -2.43%
06-04-2010 Friday 1709.5 1640.5 -69 -4.21%
Table no 5: LME prices of Tin May-June 2010
Daily Tin - LME Cash Prices
Date DayOpen Price
Close Price ChangeUp /
DownChanges in (%)
05-06-2010 Thursday 18080 17250 -830 -4.81%
05-07-2010 Friday 17250 17650 +400 +2.27%
05-10-2010 Monday 17650 17555 -95 -0.54%
05-11-2010 Tuesday 17555 17950 +395 +2.20%
05-12-2010 Wednesday 17950 17425 -525 -3.01%
05-13-2010 Thursday 17425 17795 +370 +2.08%
05-14-2010 Friday 17795 17630 -165 -0.94%
05-18-2010 Tuesday 17725 17700 -25 -0.14%
05-18-2010 Tuesday 17630 17700 +70 +0.40%
84
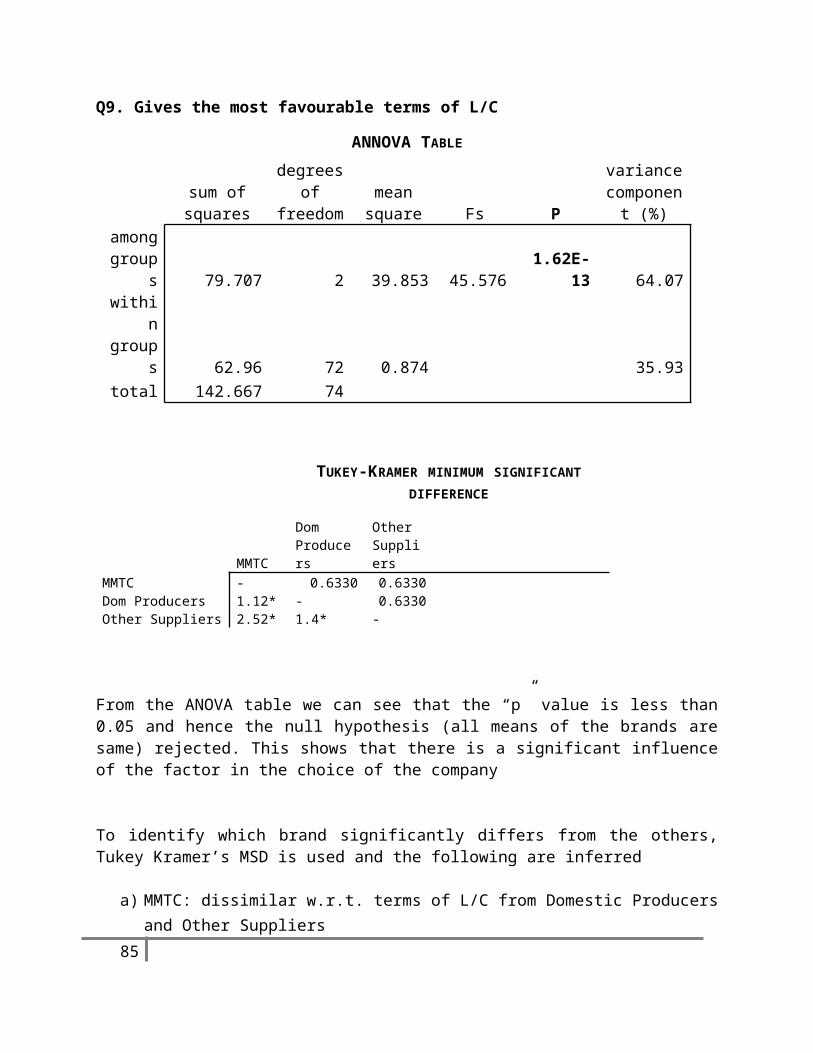
05-19-2010 Wednesday 17700 17105 -595 -3.48%
05-20-2010 Thursday 17105 17105 no change no change
05-21-2010 Friday 17105 17110 +5 +0.03%
05-24-2010 Monday 17110 17255 +145 +0.84%
05-31-2010 Monday 17710 18105 +395 +2.18%
06-01-2010 Tuesday 18105 18105 no change no change
06-02-2010 Wednesday 18105 17430 -675 -3.87%
06-03-2010 Thursday 17430 17650 +220 +1.25%
06-04-2010 Friday 17650 17585 -65 -0.37%
Table no 6: LME prices of Zinc May-June 2010
Daily Zinc - LME Cash Prices
Date DayOpen Price
Close Price ChangeUp /
DownChanges in (%)
05-06-2010 Thursday 2180 2036 -144 -7.07%
05-07-2010 Friday 2036 2090.5 +54.5 +2.61%
05-10-2010 Monday 2090.5 2045 -45.5 -2.22%
05-11-2010 Tuesday 2045 2116 +71 +3.36%
05-12-2010 Wednesday 2116 2011 -105 -5.22%
05-13-2010 Thursday 2011 2069 +58 +2.80%
05-14-2010 Friday 2069 2073 +4 +0.19%
05-18-2010 Tuesday 2110 2003 -107 -5.34%
05-18-2010 Tuesday 2073 1968 -105 -5.34%
05-19-2010 Wednesday 1968 1893 -75 -3.96%
05-20-2010 Thursday 1893 1822.5 -70.5 -3.87%
05-21-2010 Friday 1822.5 1817.5 -5 -0.28%
05-24-2010 Monday 1817.5 1855.5 +38 +2.05%
05-31-2010 Monday 1881.5 1895.5 +14 +0.74%
85
06-01-2010 Tuesday 1895.5 1895.5 no change no change
06-02-2010 Wednesday 1895.5 1821 -74.5 -4.09%
06-03-2010 Thursday 1821 1791 -30 -1.68%
06-04-2010 Friday 1791 1741 -50 -2.87%
86