jlbc staff report - fy 2016 debt and lease-purchase ... · jlbc staff report – fy 2016 debt and...
TRANSCRIPT

JLBC Staff Report – FY 2016 Debt and Lease-Purchase Financing Report 1 January 31, 2017
JLBC Staff Report - FY 2016 Debt and Lease-Purchase Financing Report
A.R.S. § 41-1277 requires the JLBC Staff to present to the House and Senate Appropriations Committees a report on state debt and obligations. Due by January 31 of each year, the report is to include the following information from the prior fiscal year (FY 2016):
• The statewide aggregate level of outstanding principal, by type of debt or obligation • The principal and interest payments on each of the state’s long-term obligations • A description of the state’s payment deferrals (“rollovers”) by agency, including: the date the payment was originally scheduled to be
made, interest paid to date on the deferral, and interest paid in the prior and current fiscal years (FY 2016/FY 2017) • Historical information on the state’s overall debt balance and per capita debt obligations, based on available data.
To the extent possible, A.R.S. § 41-1277 requires data contained in the report to be based on the State Treasurer’s Arizona Report of Bonded Indebtedness, which is published annually along with an online searchable database. This report provides a current and historical summary of the state’s outstanding financing obligations (Table 1 and Table 2). In addition, it includes specific details on each of the individual financing issuances (Table 3) and the state’s payment deferrals (Table 4). The report also contains a slideshow (Attachment A) which includes the above information and gives an overall view of the state’s methods and process for using long-term financing. The presentation also contains the relative mix of uses for long-term financing (state government facilities, local school district facilities, and operating shortfalls) and summarizes issues relating to debt retirement. Total FY 2016 outstanding bond, lease-purchase and payments deferral balances were $8.84 billion, of which $931 million was related to payments deferrals. Excluding the payment deferrals, the outstanding FY 2016 balance was $7.91 billion. This equates to a per capita amount of $1,157. In comparison to the FY 2016 level of $7.91 billion, the outstanding FY 2007 balance was $4.89 billion. The growth was due to several factors: 1) the state’s use of long-term financing for the New School Facilities program; 2) An increase in Universities financing activity (both under their general authority and specifically authorized programs such as Lottery-backed issuances); and 3) Operating financing used to solve to the FY 2010 budget shortfall. Of the total FY 2016 outstanding balance of $7.91 billion, the General Fund share was $2.51 billion. In FY 2016, the General Fund made debt services payments totaling $326 million, of which 36% was paid towards interest. By comparison, in FY 2015, after excluding the Lottery Revenue Bonds for comparability, the General Fund debt service payments totaled $332 million, of which 38% was paid towards interest. Table 1 below gives a brief summary of the report.

JLBC Staff Report – FY 2016 Debt and Lease-Purchase Financing Report 2 January 31, 2017
Table 1
State Debt and Financing Summary
(As of FY 2016)
Total Outstanding Balance $ 8.84 B
Total Outstanding Balance (excludes Payment Deferrals) $ 7.91 B
General Fund Outstanding Balance $ 2.51 B
FY 2016 General Fund Debt Service $ 326 M
Interest as a % of General Fund Debt Service 36%
Total Outstanding Balance Per Capita $ 1,157
Table 2 Per Capita State Debt Historical Summary
Fiscal Year Outstanding Principal (Total Funds - $ in B)
Per-Capita Outstanding
% Change from Prior FY
2007 4.89 793 (7.6)% 2008 5.96 949 19.7% 2009 7.29 1,150 21.2% 2010 8.33 1,299 13.0% 2011 8.64 1,335 2.8% 2012 2013 2014
8.71 8.60 8.26
1,329 1,296 1,227
(0.4)% (2.5)% (5.3)%
2015 8.07 1,194 (2.7)% 2016 7.91 1,157 (3.1)%

JLBC Staff Report – FY 2016 Debt and Lease-Purchase Financing Report 3 January 31, 2017
Overall FY 16 FY 16 FY 16 FY 16 FY 16Overall GF FY 16 Principal Interest GF GF Principal GF Interest
LEASE-PURCHASE SUMMARY Balance 2/ Balance 2/ Payment 3/ Payment 3/ Payment 3/ Payment 4/ Payment 4/ Payment 4/State Buildings2008A Issuance (ADC Prisons Expansions/DHS Forensic Hospital)
$55,400,000 $55,400,000 $14,200,600 $11,505,000 $2,695,600 $14,200,600 $11,505,000 $2,695,600
2013A Issuance (DHS Building Refinance) 21,435,000 12,861,000 1,852,900 910,000 942,900 1,111,700 546,000 565,700
2013B Issuance (Health Lab Refinance/ADC Prison Issuance Refinance)
20,570,000 8,550,000 5,098,300 3,990,000 1,108,300 3,069,300 2,590,000 479,300
2015 Issuance (2008A ADC and DHS) 107,515,000 107,515,000 4,850,500 0 4,850,500 4,850,500 0 4,850,500
2015 A Issuance (PLTO Refinance - Capitol Mall) 54,115,000 54,115,000 2,103,900 640,000 1,463,900 424,200 129,000 295,200
Subtotal - ADOA 259,035,000 238,441,000 28,106,200 17,045,000 11,061,200 23,656,300 14,770,000 8,886,300
ABOR Building SystemArizona State University 324,033,000 151,905,000 28,138,000 14,494,000 13,644,000 11,422,000 5,580,000 5,842,000 Northern Arizona University 54,985,000 54,790,000 5,705,100 3,300,000 2,405,100 5,493,200 3,105,000 2,388,200 University of Arizona 348,995,000 151,570,000 65,359,000 47,461,000 17,898,000 9,594,000 2,505,000 7,089,000 Subtotal - ABOR 728,013,000 358,265,000 99,202,100 65,255,000 33,947,100 26,509,200 11,190,000 15,319,200
OtherPhoenix Convention Center 5/ 260,124,400 260,124,400 20,449,000 0 20,449,000 20,449,000 0 20,449,000
Subtotal - State Building System $1,247,172,400 $856,830,400 $147,757,300 $82,300,000 $65,457,300 $70,614,500 $25,960,000 $44,654,500
Operating Shortfall2010 Sale/Leaseback A/B Issuance 845,280,000 845,280,000 84,094,500 41,135,000 42,959,500 84,094,500 41,135,000 42,959,500
School Facilities BoardNew School Construction - FY 2003 - FY 2005 0 0 66,228,700 64,615,000 1,613,700 66,228,700 64,615,000 1,613,700 New School Construction - FY 2008 - FY 2009 161,945,000 161,945,000 44,926,400 37,385,000 7,541,400 44,926,400 37,385,000 7,541,400
2010 Qualified School Construction Bonds 60,346,600 60,346,600 9,938,100 5,028,900 4,909,200 9,938,100 5,028,900 4,909,200
2010 Refinance (FY 2011) 58,785,000 58,785,000 2,449,800 0 2,449,800 2,449,800 0 2,449,800
2013 Refinance 45,125,000 45,125,000 24,780,300 22,310,000 2,470,300 24,780,300 22,310,000 2,470,300
2014 Refinance 219,020,000 219,020,000 10,345,500 7,105,000 3,240,500 10,345,500 7,105,000 3,240,500
2015 Refinance 257,835,000 257,835,000 12,440,100 5,710,000 6,730,100 12,440,100 5,710,000 6,730,100
Subtotal - SFB 803,056,600 803,056,600 171,108,900 142,153,900 28,955,000 171,108,900 142,153,900 28,955,000
TOTAL - Lease-Purchase $2,895,509,000 $2,505,167,000 $402,960,700 $265,588,900 $137,371,800 $325,817,900 $209,248,900 $116,569,000
Table 3
Lease-Purchase and Bonding Summary 1/

JLBC Staff Report – FY 2016 Debt and Lease-Purchase Financing Report 4 January 31, 2017
Overall FY 16 FY 16 FY 16 FY 16 FY 16Overall GF FY 16 Principal Interest GF GF Principal GF Interest
Balance 2/ Balance 2/ Payment 3/ Payment 3/ Payment 3/ Payment 4/ Payment 4/ Payment 4/Bonding SummarySchool Facilities BoardDeficiencies Correction:Proposition 301 $245,885,000 $0 $64,138,100 $59,800,000 $4,338,100 $0 $0 $0 State Land Trust 46,396,900 0 24,903,500 21,718,500 3,185,000 0 0 0 Subtotal - SFB 292,281,900 0 89,041,600 81,518,500 7,523,100 0 0 0
Department of Transportation 6/ 1,667,090,000 0 201,345,300 117,545,000 83,800,300 0 0 0
ABOR Building SystemArizona State University 1,206,720,000 0 101,361,000 45,675,000 55,686,000 0 0 0 Northern Arizona University 548,848,200 0 39,424,700 12,765,300 26,659,400 0 0 0 University of Arizona 943,745,000 0 76,230,000 34,465,000 41,765,000 0 0 0 Subtotal - ABOR 2,699,313,200 0 217,015,700 92,905,300 124,110,400 0 0 0
Operating ShortfallLottery Revenue Bonds 7/ 353,675,000 0 37,501,800 19,205,000 18,296,800 0 0 0
TOTAL - Bonding $5,012,360,100 $0 $544,904,400 $311,173,800 $233,730,600 $0 $0 $0
TOTAL - Lease-Purchase & Bonding $7,907,869,100 $2,505,167,000 $947,865,100 $576,762,700 $371,102,400 $325,817,900 $209,248,900 $116,569,000
TOTAL - Payment Deferrals $930,727,700 $930,727,700
TOTAL ALL OBLIGATIONS $8,838,596,800 $3,435,894,700 $947,865,100 $576,762,700 $371,102,400 $325,817,900 $209,248,900 $116,569,000
4/ Represents lease-purchase or debt service payments paid from a General Fund source in FY 2016, along with the portions of the payments consisting of principal and interest costs.5/ Phoenix Convention Center financing was not included in the State Treasurer's Debt Report as the issuance was made by the City of Phoenix. However, the state’s portion of the financing is displayed above as the payments are long-term obligations of the state.6/ Excludes Regional Area Road Fund (RARF) Bonds which are paid from the local Maricopa County regional transportation sales tax.7/ Debt service for the Lottery Revenue Bonds is paid for with Lottery profits which would have otherwise been revenues deposited into the General Fund.
Table 3 (Cont'd)
1/ Pursuant to A.R.S. § 41-1277, all information listed is from the FY 2016 State Treasuer Debt Report, except where noted. The State Treasurer's report does not delineate between General Fund and non-General Fund financing. While most issuances have a distinct financing source, in circumstances where this source was unclear the table estimates the GF/Non-GF split using historical averages. 2/ Represents outstanding principal on the respective lease-purchase agreement or debt issuance, including the portion paid from a General Fund source, which is represented in the “GF Balance” column. Balances are displayed as of the end of FY 2016.3/ Represents total FY 2016 lease-purchase or debt service payments from all fund sources, along with the portions of the payments consisting of principal and interest costs.

JLBC Staff Report – FY 2016 Debt and Lease-Purchase Financing Report 5 January 31, 2017
Table 4
Payment Deferral Summary
Overall Original Due Interest Paid to Interest Paid Interest to be Agency Deferral Balance Date(s) of Deferral Date for Deferral in FY 16 Paid in FY 17
Department of Education 930,727,700 1/ $273 M in FY 2008, $330 M in FY 2009, and $350 M in FY 2010. $21.9 M paid in FY 2013. 2,400,100 2/ 0 0
Department of Economic Security 0 $25 M in FY 2009 and $10 M in FY 2010 3/
0 0 0
Department of Child Safety 0
Universities 0 $100 M in FY 2009 and $100 M in FY 2010 4/ 0 0 0
Total $930,727,700 $2,400,100 $0 $0
1/ Laws 2013, 1st Special Session, Chapter 1 reduced the outstanding payment deferral by $(21,900,000) by eliminating the deferral for school districts with less than 600 pupils.
2/ Interest was paid for the ADE payment deferral in FY 2008 - FY 2010.
3/ With the creation of the new Department of Child Safety, Laws 2014, 2nd Special Session, Chapter 2 paid off $3 million of the $35 million Department of Economic Security deferral and allocated $21 million of the deferral to the Department of Economic Security and $11 million of the deferral to the Department of Child Safety. Laws 2016, Chapter 117 paid off the $21 million payment deferral to the Department of Economics Security and paid off the $11 million payment deferral to the Department of Child Safety in FY 2016.
4/ Laws 2016, Chapter 117 paid off the $200 million payment deferral to the Universities in FY 2016.

JLBC Staff Report – FY 2016 Debt and Lease-Purchase Financing Report 6 January 31, 2017
Explanation of Issuances Lease-Purchase Summary State Buildings ADOA Building System – Lease-Purchase 2008 A – Laws 2007, Chapter 261 authorized 4,000 new public prison beds through a $200.0 million lease-purchase agreement. Laws 2007, Chapter 257 authorized a $39.0 million lease-purchase agreement for the following 2 projects: $32.2 million for a new forensic hospital unit at the Arizona State Hospital and $6.8 million for water supply projects at 4 prison complexes. The total $239.0 million in agreements was issued in April 2008; the prison beds have a 20-year term while the forensic unit and water projects have a 15-year term. While Chapter 261 authorized 4,000 beds, the department was able to construct and open 5,000 beds in FY 2011 - 1,250 beds at Perryville SPC, 1,250 beds at Tucson SPC, and 2,500 beds at Yuma SPC. 2013 A – Issued in January 2013, the 2013 A lease-purchase transaction refinanced the privatized lease-to-own (PLTO) agreement (executed in 2001) which had initially funded the DHS office building at 150 North 18th Avenue. The refinancing transaction reduced the existing payment schedule for the building by approximately $(330,000) annually through FY 2029. While a PLTO agreement usually requires a private entity to maintain the building until the life of the agreement is complete, the conversion of this agreement into a traditional lease-purchase has been accompanied by an agreement with a private entity that will continue to be responsible for the maintenance of the DHS building through the end of the issuance in FY 2029. 2013 B – Issued in January 2013, the 2013 B transaction refinanced the 2 existing lease-purchase transactions (2002 A and 2004 B). The refinancing transaction reduced the existing payment schedule for these buildings by approximately $(390,000) annually through FY 2019. 2015 – Issued in July 2015, the 2015 transaction refinanced a portion of the 2008 A transaction. The refinancing transaction reduced the existing payment schedule for these buildings by approximately $(950,000) annually through FY 2028. 2015 A – Issued in July 2015, the 2015 A lease-purchase transaction refinanced the privatized lease-to-own (PLTO) agreement (executed in 2005) which had initially funded the 2 office buildings on the Capitol Mall. The 2 buildings house ADOA and the Department of Environmental Quality. The refinancing transaction reduced the existing payment schedule for the building by approximately $(480,000) annually through FY 2028. While a PLTO agreement usually requires a private entity to maintain the building until the life of the agreement is complete, the conversion of this agreement into a traditional lease-purchase has been accompanied by an agreement with a

JLBC Staff Report – FY 2016 Debt and Lease-Purchase Financing Report 7 January 31, 2017
private entity that will continue to be responsible for the maintenance of the DHS building through the end of the issuance in FY 2029. As a result of the refinanced ADOA and ADEQ buildings, the state currently has no active PLTO agreements. ABOR Building System – Lease-Purchase Arizona Board of Regents (ABOR) – Laws 2003, Chapter 267 appropriated $34.6 million from the state General Fund to the universities to be used to finance lease-purchase payments from FY 2008 to FY 2031 for research infrastructure project agreements entered into prior to July 1, 2006. These projects include science and technology buildings and the debt service payments are made from annual General Fund appropriations. Laws 2016, Chapter 130 modified statute to reflect long-term debt service savings from the refinancing of research infrastructure projects and specified appropriations through the end of the debt service in FY 2031. Other Phoenix Convention Center – While not a state building, the Phoenix Convention Center represents a state obligation. Laws 2003, Chapter 266 authorized the state to make distributions to provide for the debt service related to the financing of certain convention center projects, provided that the state funding would account for no more than 50% of the total project cost and would not exceed $300 million. Funding of the Phoenix Convention Center project was approved by Phoenix voters in 2001, and the renovation and expansion of the center subsequently qualified as an eligible project. In 2005, the City of Phoenix issued $600 million of bonds, 50% of which were to be paid from the state share of funding, with payments beginning in FY 2012 for a term of 33 years. The state distribution occurs according to a statutory schedule, which was modified by Laws 2011, Chapter 28. The Convention Center expansion was completed in 2009. Operating Shortfall 2010 State Building Sale/Leaseback – FY 2010 budget legislation (Laws 2009, 3rd Special Session, Chapter 6 and Laws 2010, 6th Special Session, Chapter 4) authorized the Arizona Department of Administration (ADOA) to enter into sale/lease-back agreements for 22 existing state-owned facilities, requiring the funds to be deposited to the General Fund to subsidize state operating expenses. ADOA sold the issuances in 2 series (January 2010 and June 2010) at a tax-exempt yield of approximately 4%. These issuances range up to 20 years in period of time. The transaction generated $1.04 billion of up front proceeds, in exchange for annual lease payments through the term of the agreements. While the titles of the buildings were used as collateral for the financing, the state maintains operational control of the facilities. Upon the expiration of the agreements, the legal titles to the buildings will be transferred back to the state. When the financing was originally issued, the state agreed to the Working Capital Surplus Limitation, which would have required certain cash reserves to be used for mandatory repayment of the financing. Given the concerns about the mandatory repayment, the state

JLBC Staff Report – FY 2016 Debt and Lease-Purchase Financing Report 8 January 31, 2017
converted to the Investment Yield Restriction in May 2014. The selection of this limitation is irrevocable for the duration of the financing. Because the state is no longer subject to the mandatory repayment requirements of the Working Capital Surplus Limitation, the operating financing is not subject to prepayment by the state until FY 2020. (Please see the FY 2017 JLBC Baseline Summary for more information on these requirements.) School Facilities Board – Lease-Purchase SFB – The School Facilities Board (SFB) is responsible for providing capital funding for K-12 school districts within the state. A.R.S. § 15-2004 authorizes SFB generally to enter into lease-purchase financing agreements in order to provide funding for the agency’s New School Facilities program. However, these transactions have been prohibited since May 2006, except in cases of specific legislative authorization. SFB has entered into 6 broad types of lease-purchase financing agreements.
• New Construction Financing 2003 – 2005 and 2008 - 2009 – Both classes of financing were issued as traditional tax-exempt Certificates of Participation. While in some years SFB New Construction has been paid for with cash financing, in certain years the Legislature has authorized SFB to enter into lease-purchase agreements. During FY 2003 – FY 2005, SFB issued financing with a principal amount totaling $854.0 million, with terms ranging from 11-16 years. In FY 2008/2009, SFB entered into a lease-purchase agreement with a principal amount of $580.0 million for a term of 15 years.
• 2010 Qualified School Construction Bonds – Authorized by Laws 2010, 3rd Special Session, Chapter 12, SFB entered into $91.3
million worth of lease-purchase financing through a federal program known as Qualified School Construction Bonds. This type of financing entitles the state to interest rate subsidy from the federal government, which amounts to 4.86% of the 6.0% due on the bonds, leaving the state with an effective interest rate of 1.14%. Beginning in FY 2014, the subsidy was reduced due to federal budget reductions.
• 2010 SFB Refinance – Authorized by Laws 2010, 7th Special Session, Section 20, SFB entered into a refinancing agreement
whereby $58.8 million of new financing was issued, and the cash proceeds were used to lower the agency’s FY 2011 debt service obligations to achieve one-time savings. Through FY 2018, the state will pay approximately $2.4 million of interest annually, until the principal amount is paid in installments during both FY 2019 and FY 2020.
• 2013 SFB Refinance – Authorized by Laws 2013, 1st Special Session, Chapter 3, SFB entered into a refinancing agreement whereby $79.6 million of new financing was issued, and the cash proceeds were used to refinance outstanding agreements and lower the agency’s FY 2014 and FY 2015 debt service obligations to achieve non-recurring savings of $1.4 million in FY 2014 and $3.8 million in FY 2015.
JLBC Staff Report – FY 2016 Debt and Lease-Purchase Financing Report 9 January 31, 2017
• 2014 SFB Refinance – Authorized by Laws 2013, 1st Special Session, Chapter 3, SFB entered into a second refinancing agreement whereby $226.1 million of new financing was issued, and the cash proceeds were used to refinance outstanding agreements and lower the agency’s debt service obligations to achieve non-recurring savings of $9.4 million in FY 2015 along with approximately $100,000 annually between FY 2016 and FY 2020.
• 2015 SFB Refinance – Authorized by Laws 2015, 1st Special Session, Chapter 15, SFB entered into a refinancing agreement whereby $263.5 million of new financing was issued, and the cash proceeds were used to refinance outstanding agreements and lower the agency's debt service obligations to achieve debt service savings of approximately $1.7 million annually through the end of the issuance in FY 2024.
Bonding Summary School Facilities Board In addition to the agency’s general lease-purchase authority, SFB was authorized to issue revenue bonds, to be paid for with a dedicated source of funding:
• Proposition 301 Bonds (State School Improvement Revenue Bonds) – Proposition 301, approved by voters in 2000, authorized SFB to issue up to $800 million of revenue bonds to finance its Deficiencies Correction program which made school repairs statewide. The bonds were issued in this amount during FY 2001 – FY 2003, and are paid from the 0.6% sales tax enacted by the ballot measure. The term of the bonds runs through FY 2021, which coincides with the expiration of the measure’s sales tax, at which point the entire issuance will have been retired.
• State Land Trust Bonds (School Trust Revenue Bonds) – Laws 2003, Chapter 264 authorized SFB to issue $246.6 million of State
School Trust revenue bonds to provide further funding for the Deficiencies Correction program. Debt service on the bonds is paid from expendable earnings of the state’s land trust, which consists of monies received from the sale or lease of state school trust lands and investment earnings in the fund. Earnings from this fund are first used to fund payments related to the SFB trust revenue bonds, with any excess funds above this amount transferred to the Department of Education. The bonds were issued with a term of 15 years, and are scheduled to be retired in FY 2018.
JLBC Staff Report – FY 2016 Debt and Lease-Purchase Financing Report 10 January 31, 2017
Department of Transportation Financing largely consists of 2 broad categories:
• Highway User Revenue Fund (HURF) bonds are used to finance the State Transportation Board’s 5-year construction program. HURF consists of monies received in the state from transportation-related licenses, taxes, fees, penalties and interest, such as the motor vehicle fuel tax, vehicle license tax, vehicle registration, driver’s license, and others. In order for the department to issue subordinate HURF bonds, State Highway Fund revenues must exceed 3 times the maximum annual debt service on current outstanding debt. The State Highway Fund is the source of debt service for HURF bonds.
• Grant Anticipation Notes (GAN) allow ADOT to issue debt secured by future federal aid for the purposes of accelerating or
advancing mostly large highway construction projects. Federal Funds are the source of debt service for GANs. ABOR Building System A.R.S. § 15-1683 allows each state university to incur a projected annual debt service for bonds and certificates of participation of up to 8% of each institution’s total projected annual expenditures. Universities fund revenue bond debt service payments with university system revenues. While tuition represents the primary source of these revenues, they may also be directly related to the capital project. For instance, the debt service payments for renovations to a student recreation center may be paid for with student recreation fees. Laws 2008, Chapter 287, as amended by Laws 2009, 1st Special Session, Chapter 6 and Laws 2009, 3rd Special Session, Chapter 9, authorized ABOR to enter into lease-to-own and bond transactions up to $800 million to pay for building renewal projects and new facilities with university lottery bonds (also known as SPEED bonds). ABOR is required to allocate $376.0 million of the $800.0 million for the Phoenix Biomedical Campus. Of the remaining $424.0 million in proceeds, ABOR allocated $16.0 million to ASU’s School of Construction and $136.0 million to each of the 3 universities for building renewal, deferred maintenance, and new construction projects. Under Chapter 287, the annual debt payments are comprised of up to 80% lottery revenues and at least 20% university system revenues. (Please see the Arizona Board Regents Building Systems narrative pages in the FY 2018 JLBC Baseline for more information.) Operating Shortfall Lottery Revenue Bonds – FY 2010 budget legislation (Laws 2010, 6th Special Session, Chapter 4) authorized the department to issue Lottery revenue bonds, which generated $450 million of up front proceeds for the state, in exchange for fixed payments over a 20-year term. Under A.R.S. § 5-572, the funds necessary to make debt service payments relating to the lottery revenue bonds receive the first priority in the distribution of lottery profits, and are taken from monies that would have otherwise been transferred to the General Fund.

JLBC Staff Report – FY 2016 Debt and Lease-Purchase Financing Report 11 January 31, 2017
When the Lottery Revenue Bonds were originally issued, the state agreed to the Working Capital Surplus Limitation, which would have required certain cash reserves to be used for mandatory repayment of the issuance. Given the concerns about the mandatory repayment, the state converted to the Investment Yield Restriction in May 2014. The selection of this limitation is irrevocable for the duration of the financing. Because the state is no longer subject to the mandatory repayment requirements of the Working Capital Surplus Limitation, the Lottery Revenue Bonds are not subject to prepayment by the state until FY 2020. (Please see the FY 2017 JLBC Baseline Summary for more information on these requirements.)
JLBC
Report on State Debt and Lease-Purchase Financing
Attachment A
Debt Overview
JLBC

JLBC 3
Statute Requires JLBC to Annually Report on State Debt and Other Obligations
Outstanding principal on State debt, along with principal and interest payments in the prior fiscal year (FY 2016)
Summary of payment deferrals (“rollovers”) by budget unit and the cost of these deferrals
Information on per-capita State debt and other long-term obligations
A 10-year history of State debt and long-term financing based on available data
JLBC 4
Arizona Constitution Limits General Fund Backed Debt to $350,000
This limit has been interpreted as applying to debt secured by General Fund revenues
This interpretation does not apply to debt secured by non-General Fund revenues• State has outstanding bonds supported by
transportation, lottery and University revenues
Lease-purchase financing has also been viewed as not applying to the limit

JLBC 5
Lease-Purchase Financing vs. Bonds
Lease-purchase financing has no pledged source of repayment• Lease agreements typically have language that payments are
“subject to annual appropriation by the State Legislature” and are not “a general obligation or indebtedness of the State”
• Non-payment would terminate lease and cause loss of property/project
Bonds have a dedicated funding source and are secured by non-General Fund source, such as:• Lottery Revenue• Highway User Fees• University Tuition

JLBC 666
Arizona’s Credit Rating Was Upgraded in May 2015
In May, 2015, both major credit rating agencies upgraded AZ’s credit rating (S&P: AA- to AA; Moody’s: Aa3 to Aa2)• Outlook from both agencies is stable
In comparison to other states, 28 states have a higher rating, 12 states have the same rating, and 9 states have a lower rating or are not rated due to a lack of state level debt

JLBC 7
Uses For State Debt and Lease-Purchase Financing
State owned capital facilities/uses
School Facilities Board to fund local new school construction
During budget shortfalls, financing has been used for operating expenses
JLBC 8
State Used Operating Financing For $1.5 B of Solutions To Budget Shortfalls in 2010
$1.0 B from the sale and leaseback of 22 state properties• Building titles transferred to 3rd party – transfers
back after 20 years of lease payments
• Sale/Leaseback financing paid off in FY 2030
$450 M from the issuance of lottery revenue bonds • Debt service paid from General Fund portion of
lottery revenues – represents foregone revenues
• Lottery financing paid off in FY 2029

Debt Balance and Payment Information
JLBC

JLBC 10
SFB New Construction
803.1
SFB Repairs 292.3
ADOT 1,667.1
ADOA 259.0
Universities 3,427.3
Phoenix Convention
Center 260.1
Lottery Bonds353.7
State Building Sale/Leaseback
845.3
Total Outstanding State Debt/Lease-Purchase Financing is $7.9 Billion- Reflects Multiple Payment Sources
Capital Facilities/Uses
School Facilities Board
Operating
Capital SFB Operating
$ 5.6 B
$ 1.1 B
$ 1.2 B
Outstanding Balances
End of FY 2016 - $ in Millions

JLBC 11
Arizona Overall Debt Obligations Peaked in ‘12
4.89
5.96
7.29
8.33 8.64 8.71 8.60
8.26 8.07 7.91
0
1
2
3
4
5
6
7
8
9
10
11
12
FY 07 FY 08 FY 09 FY 10 FY 11 FY 12 FY 13 FY 14 FY 15 FY 16
Out
stan
ding
Deb
t ($
in B
illio
ns)
JLBC 12
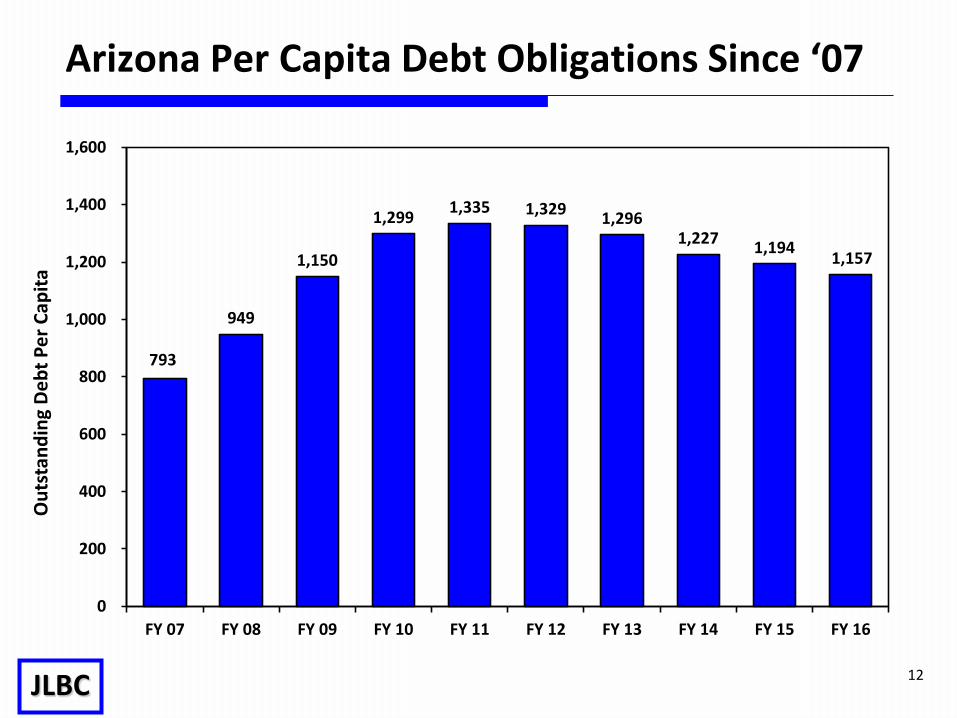
793
949
1,150
1,299 1,335 1,329 1,296 1,227 1,194 1,157
0
200
400
600
800
1,000
1,200
1,400
1,600
FY 07 FY 08 FY 09 FY 10 FY 11 FY 12 FY 13 FY 14 FY 15 FY 16
Out
stan
ding
Deb
t Per
Cap
itaArizona Per Capita Debt Obligations Since ‘07
JLBC 13
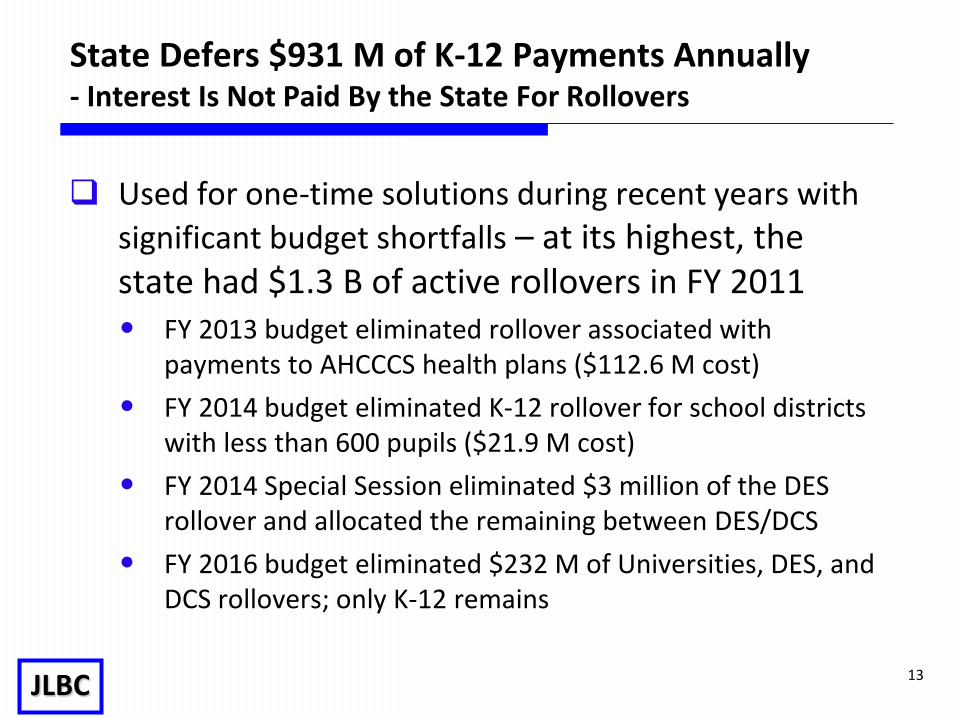
State Defers $931 M of K-12 Payments Annually- Interest Is Not Paid By the State For Rollovers
Used for one-time solutions during recent years with significant budget shortfalls – at its highest, the state had $1.3 B of active rollovers in FY 2011• FY 2013 budget eliminated rollover associated with
payments to AHCCCS health plans ($112.6 M cost)• FY 2014 budget eliminated K-12 rollover for school districts
with less than 600 pupils ($21.9 M cost)• FY 2014 Special Session eliminated $3 million of the DES
rollover and allocated the remaining between DES/DCS• FY 2016 budget eliminated $232 M of Universities, DES, and
DCS rollovers; only K-12 remains
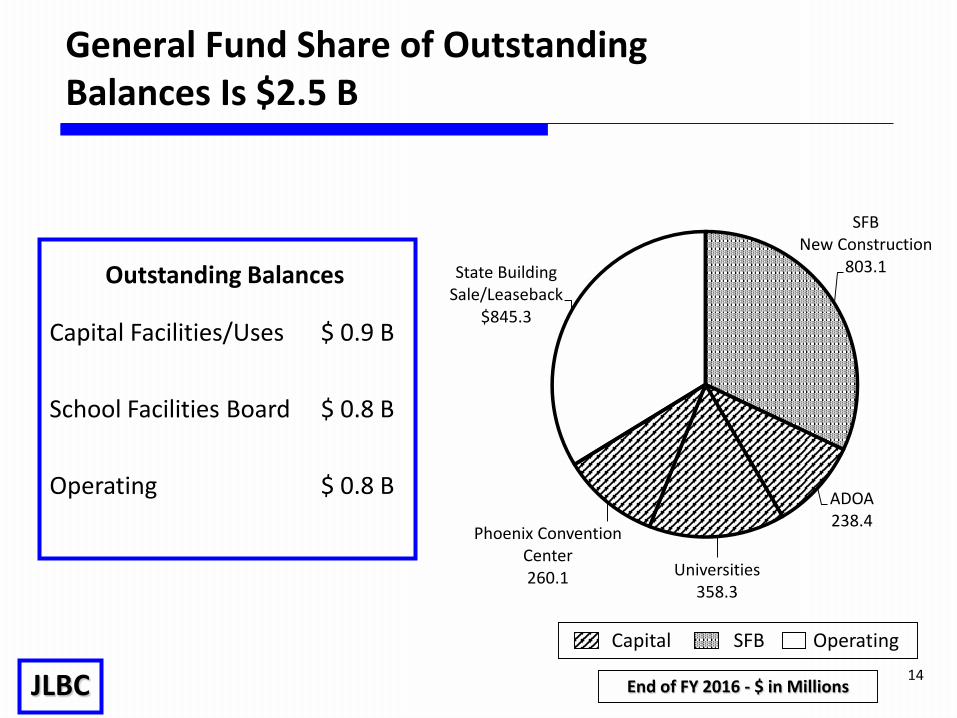
JLBC 14
SFB New Construction
803.1
ADOA 238.4
Universities 358.3
Phoenix Convention Center 260.1
State Building Sale/Leaseback
$845.3
General Fund Share of Outstanding Balances Is $2.5 B
Capital Facilities/Uses
School Facilities Board
Operating
Capital SFB Operating
$ 0.9 B
$ 0.8 B
$ 0.8 B
Outstanding Balances
End of FY 2016 - $ in Millions

JLBC 15
SFB New
Construction 171.1
ADOA 23.7
Universities 26.5
Phoenix ConventionCenter
20.4
State Building Sale/Leaseback
84.1
General Fund Debt Service Cost $326 M - Represented 8th Largest Budget Unit
Capital Facilities/Uses
School Facilities Board
Operating
Capital SFB Operating
$ 71 M
$ 171 M
$ 84 M
Annual Payments
FY 2016 - $ in Millions

JLBC 16
$ in Millions
FY ‘16 FY ‘17 FY ’18
Capital Facilities/Uses 71 76 100
School Facilities Board 171 170 170
Operating 84 84 84
Total $326 M $330 M $354 M
Annual General Fund Debt Service Increases in ‘18
FY 2018 General Fund Debt Service Increase – $24 M $18 M – Refinance of ADC Kingman private prison
• Occurred in November 2016 and generated a net savings of $8.8 M annually• State will now make direct debt service payment – prior to refinance payment was
included in overall funding amount for private vendor
$4 M – Decline in savings from refinance of Universities research financing $2 M – Phoenix Convention Center debt service

JLBC 17
Potential Issues for Debt Retirement
Laws 2013, Chapter 99 created an annual report from ADOA on debt retirement options • 2016 Report estimated that $100 M debt retirement would generate future
total debt service savings of $46 M through FY 2030
Variety of factors when selecting issuances to retire early• Call date – Most financing agreements have a time period where the state is
prohibited from paying off the outstanding balance, typically 10 years from issuance
• Principal amount/interest rate – Both of which affect the level of annual debt service
• Length of term – As financing period become longer, the state generates more savings from avoided payments
Transaction costs may affect whether debt retirement occurs in one transaction or over several years