jmpr 2008 report dec 11
TRANSCRIPT

9 7 8 9 2 5 1 0 6 1 1 3 8
TC/M/I0450E/1/01.09/800
ISBN 978-92-5-106113-8 ISSN 0259-2517

WORLD HEALTH ORGANIZATIONFOOD AND AGRICULTURE ORGANIZATION OF THE UNITED NATIONSRome, 2009
Pesticide residues in food 2008Joint FAO/WHO Meetingon Pesticide Residues
FAOPLANT
PRODUCTIONAND PROTECTION
PAPER
Report of the Joint Meeting of the FAO Panel of Experts on Pesticide Residues in Food and the Environment and the WHO Core Assessment Group on Pesticide ResiduesRome, Italy, 9–18 September 2008
193

The designations employed and the presentation of material in this information product do not imply the expression of any opinion whatsoever on the part of the Food and Agriculture Organization of the United Nations (FAO) concerning the legal or development status of any country, territory, city or area or of its authorities, or concerning the delimitation of its frontiers or boundaries. The mention of specific companies or products of manufacturers, whether or not these have been patented, does not imply that these have been endorsed or recommended by FAO in preference to others of a similar nature that are not mentioned.
ISBN 978-92-5-106113-8
All rights reserved. Reproduction and dissemination of material in this information product for educational or other non-commercial purposes are authorized without any prior written permission from the copyright holders provided the source is fullyacknowledged. Reproduction of material in this information product for resale or other commercial purposes is prohibited without written permission of the copyright holders. Applications for such permission should be addressed to: Chief Electronic Publishing Policy and Support BranchCommunication Division FAO Viale delle Terme di Caracalla, 00153 Rome, Italy or by e-mail to: [email protected]
© FAO 2009
i
CONTENTS
List of participants................................................................................................................................iii
Abbreviations ........................................................................................................................................ ix
Use of JMPR reports and evaluations by registration authorities...................................................xi
1. Introduction .................................................................................................................................1
1.1 Declaration of interest .........................................................................................................2 2. General considerations................................................................................................................3
2.1 Comments from JMPR on a pilot pocess for JMPR to recommend maximum residue levels prior to national government registration .................................................................3
2.2 Comments on the “global assessment” of chlorantraniliprole in terms of its usefulness as a work-sharing tool for JMPR.............................................................................................4
2.3 A process to ensure the scientific robustness and transparency of retrospective analyses of toxicity data on pesticide chemicals ...............................................................................5
2.4 Comments on OECD Draft Guidance Document for Derivation of an Acute Reference Dose.....................................................................................................................................6
2.5 Cumulative risk assessment for pesticide residues in food: activities of the European Food Safety Authority.........................................................................................................7
2.6 Safety factors for acute Cmax-dependent effects: specific considerations with respect to carbamates such as carbofuran............................................................................................7
2.7 Transparency in the maximum residue level estimation process of the JMPR ............... 11 2.8 Nature of residue data populations and methods for combining residue trial data sets....29 2.9 Evaluation for follow-up crops .........................................................................................41 2.10 Selection of representative commodities when establishing commodity group MRLs ....42 2.11 Proportionality of pesticide residue concentrations and application rates in supervised
trials...................................................................................................................................43 3. Responses to specific concerns raised by the Codex Committee on Pesticide Residues
(CCPR) .......................................................................................................................................45
3.1 Carbaryl (008) ...................................................................................................................45 3.2 Lambda-Cyhalothrin (146)................................................................................................46 3.3 Flusilazole (165)................................................................................................................47 3.4 Oxamyl 126)......................................................................................................................48
4. Dietary risk assessment for pesticide residues in foods .........................................................51
5. Evaluation of data for acceptable daily intake and acute dietary intake for humans,
maximum residue levels and supervised trial median residue values ..................................55
5.1 Azoxystrobin (229) (T, R)*...............................................................................................55 5.2 Bifenazate (219) (R)..........................................................................................................97 5.3 Boscalid (221) (R) ..........................................................................................................99 5.4 Buprofezin (173) (T, R)** ..............................................................................................101 5.5 Carbofuran (096) (T).......................................................................................................123 5.6 Chlorantraniliprole (230) (T, R)*....................................................................................127 5.7 Chlorpropham (201) (R)..................................................................................................145 5.8 Lambda-Cyhalothrin (146) (R)** ...................................................................................147 5.9 Cypermethrins (118) (R)** .............................................................................................169 5.10 Dimethoate (027) (R) ......................................................................................................209 5.11 Diphenylamine (030) (R) ................................................................................................213

ii
5.12 Ethoxyquin (035) (R) ......................................................................................................215 5.13 Imidacloprid (206) (R) ....................................................................................................217 5.14 Hexythiazox (176) (T)**.................................................................................................225 5.15 Malathion (049) (R) ........................................................................................................231 5.16 Mandipropamid (231) (T, R)*.........................................................................................231 5.17 Methomyl (094) (R) ........................................................................................................251 5.18 Profenofos (171) (T, R)**...............................................................................................255 5.19 Prothioconazole (232) (T, R)* ........................................................................................265 5.20 Spinetoram (233) (T, R)*................................................................................................293 5.21 Spinosad (203) (R) ..........................................................................................................313 5.22 Spirotetramat (234) (T, R)*.............................................................................................315 5.23 Tebuconazole (189) (R) ..................................................................................................341 5.24 Triazole fungicide metabolites (T)..................................................................................355
1, 2, 4-Triazole………………………………………………………………...………...356 Triazole alanine and triazole acetic acid………………………………………….……..360
6. Recommendations....................................................................................................................365
6.1 General considerations ....................................................................................................365 6.2 Evaluation of data for acceptable daily intake and acute dietary intake for humans,
maximum residue levels and supervised trial median residue values.............................366 7. Future work .............................................................................................................................367
Annex 1: Acceptable daily intakes, short-term dietary intakes, acute reference doses,
recommended maximum residue limits and supervised trials median residue values
recorded by the 2008 Meeting ................................................................................................369
Annex 2: Index of reports and evaluations of pesticides by the JMPR....................................383
Annex 3: International estimated daily intakes of pesticide residues ......................................395
Annex 4: International estimates of short-term dietary intakes of pesticide residues ...........445
Annex 5: Reports and other documents resulting from previous Joint Meetings of the
FAO Panel of Experts on Pesticide Residues in Food and the Environment and the WHO
Expert Groups on Pesticide Residues ....................................................................................489
Annex 6: Livestock dietary burden..............................................................................................497
Annex 7: Corrections to the Report of the 2007 Meeting ..........................................................521
FAO Technical Papers ......................................................................................................................525
D, dietary risk assessment; R, residue and analytical aspects; T, toxicological evaluation.
* New compound
** Evaluated within the periodic review programme of the Code Committee on Pesticide Residues

iii
LIST OF PARTICIPANTS
2008 JOINT FAO/WHO MEETING ON PESTICIDE RESIDUES
ROME, 9–18 SEPTEMBER 2008
FAO Members
Dr Ursula Banasiak, Federal Institute for Risk Assessment, Thielallee 88-92, D-14195 Berlin, Germany
Professor Eloisa Dutra Caldas, University of Brasilia, College of Health Sciences, Pharmaceutical Sciences Department, Campus Universitário Darci Ribeiro, 70919-970 Brasília/DF, Brazil
Mr Stephen Funk, Health Effects Division (7509P), United States Environmental Protection Agency, 1200 Pennsylvania Avenue NW, Washington DC 20460, USA (FAO Chairman)
Mr Denis J. Hamilton, Principal Scientific Officer, Biosecurity Queensland, Department of Primary Industries and Fisheries, PO Box 46, Brisbane, QLD 4001, Australia
Mr David Lunn, Senior Programme Manager (Residues–Plants), Export Standards Group, New Zealand Food Safety Authority, PO Box 2835, Wellington, New Zealand (FAO Rapporteur)
Dr Dugald MacLachlan, Australian Quarantine and Inspection Service, Australian Government Department of Agriculture, Fisheries and Forestry, GPO Box 858, Canberra, ACT 2601, Australia
Dr Yukiko Yamada, Deputy Director-General, Food Safety and Consumer Affairs Bureau, Ministry of Agriculture, Forestry and Fisheries, 1-2-1 Kasumigaseki, Tokyo 100-8950, Japan
WHO Members
Professor Alan R. Boobis, Experimental Medicine & Toxicology, Division of Investigative Science, Faculty of Medicine, Imperial College London, Hammersmith Campus, Ducane Road, London W12 0NN, England
Dr Les Davies, Chemical Review, Australian Pesticides & Veterinary Medicines Authority, PO Box E240, Kingston ACT 2604, Australia
Dr Vicki L. Dellarco, Health Effects Division, Office of Pesticide Programs (7501P), United States Environmental Protection Agency, 1200 Pennsylvania Avenue NW, Washington, DC 20460, USA (WHO Rapporteur)

iv
Professor Angelo Moretto, Department of Environmental and Occupational Health, University of Milan, International Centre for Pesticides and Health Risk Prevention, Luigi Sacco Hospital, Via Stephenson 94, 20157 Milan, Italy (WHO Chairman)
Dr David Ray, Biomedical Sciences, University of Nottingham, Queens Medical Centre, Nottingham NG7 2UH, England
Dr Roland Solecki, Chemical Safety Division, Management and Overall Assessment, Federal Institute for Risk Assessment, Thielallee 88-92, D-14195 Berlin, Germany
Dr Maria Tasheva, Consultant, National Service for Plant Protection, Ministry of Agriculture and Food, 17 Hristo Botev Bul. 1040 Sofia, Bulgaria
Secretariat
Mr Árpád Ambrus, Hungarian Food Safety Office, Gyali ut 2-6, 1097 Budapest, Hungary (FAO
Temporary Adviser)
Ms Catherine Adcock, Toxicological Evaluation Section 2, Health Effects Division II, Health Evaluation Directorate, Pest Management Regulatory Agency, 2720 Riverside Drive, AL 6605E Ottawa, Ontario K1A 0K9, Canada (WHO Temporary Adviser)
Mr Kevin Bodnaruk, 26/12 Phillip Mall, West Pymble, NSW 2073, Australia (FAO Editor)
Professor Zongmao Chen, Chairman of Codex Committee on Pesticide Residues, Academician, Chinese Academy of Engineering, Chinese Academy of Agricultural Sciences, No.9, Meilin Road, Hangzhou/Zhejiang 310008, P.R. China (CCPR Chairman)
Dr Myoengsin Choi, International Programme on Chemical Safety, World Health Organization, 1211 Geneva 27, Switzerland (WHO Staff Member)
Dr Ian Dewhurst, Pesticides Safety Directorate, Mallard House, King’s Pool, 3 Peasholme Green, York YO1 7PX, England (WHO Temporary Adviser)
Dr Ronald D. Eichner, 13 Cruikshank Street, Wanniassa ACT 2903, Australia (FAO Temporary
Adviser)
Dr Yibing He, Department of Science and Education, Ministry of Agriculture, No. 11 Nong Zhan Guan Nanli, Chaoyang District, Beijing 100125, P.R. China (FAO Temporary Adviser)
Mr George Herndon, Deputy Director, Health Effects Division, Office of Pesticide Programs (7501P), US Environmental Protection Agency, 1200 Pennsylvania Avenue NW, Washington, DC 20460, USA (FAO Temporary Adviser)

v
Mr Makoto Irie, Plant Product Safety Division, Food Safety and Consumer Affairs Bureau, Ministry of Agriculture, Forestry and Fisheries, 1-2-1 Kasumigaseki, Chiyoda-ku, Tokyo 100-8950, Japan (FAO Temporary Adviser)
Dr D. Kanungo, Additional DG, Directorate General of Health Services, Ministry of Health and Family Welfare, West, Block No. 1, R.K. Puram, New Delhi, India (WHO Temporary Adviser)
Dr Katerina Mastovska, Eastern Regional Research Center (ERRC), Agricultural Research Service (ARS), United States Department of Agriculture, 600 E. Mermaid Lane, Wyndmoor, PA 19038, USA (FAO Temporary Adviser)
Dr Jeronimas Maskeliunas, Food Standards Officer, Joint FAO/WHO Food Standards Programme, Nutrition and Consumer Protection Division, Food and Agriculture Organization of the United Nations, Viale delle terme di Caracalla, 00153 Rome, Italy (Codex Secretariat)
Dr Heidi Mattock, 21 bis rue du Mont Ouest, 38230 Tignieu-Jameyzieu, France (WHO Editor)
Dr Douglas B. McGregor, Toxicity Evaluation Consultants, 38 Shore Road, Aberdour KY3 0TU, Scotland (WHO Temporary Adviser)
Dr Francesca Metruccio, Department of Environmental and Occupational Health, University of Milan, International Centre for Pesticides and Health Risk Prevention (ICPS), Luigi Sacco Hospital, Via Stephenson 94, 20157 Milan, Italy (WHO Temporary Adviser)
Dr Rudolf Pfeil, Toxicology of Pesticides and Biocides, Federal Institute for Risk Assessment, Thielallee 88-92, D-14195 Berlin, Germany (WHO Temporary Adviser)
Dr Prakashchandra V. Shah, US Environmental Protection Agency (EPA), Mail Stop: 7505P, 1200 Pennsylvania Ave., N.W., Washington DC 20460, USA (WHO Temporary Adviser)
Mr Christian Sieke, Federal Institute for Risk Assessment, Thielallee 88-92, D-14195 Berlin, Germany (FAO Temporary Adviser)
Ms T. van der Velde-Koerts, Centre for Substances and Integrated Risk Assessment, National Institute of Public Health and the Environment (RIVM), Antonie van Leeuwenhoeklaan 9, PO Box 1, 3720 BA Bilthoven, Netherlands
Dr Qiang Wang; Institute of Quality and Standard for Agricultural Products, Zhenjiang Academy of Agricultural Sciences, 198 Shiqiao Road, Hangzhou 310021, China (FAO Temporary Adviser)

vi
Ms Yong Zhen Yang, FAO Joint Secretary, Plant Protection Service (AGPP), Food and Agriculture Organization of the United Nations (FAO), Viale delle Terme di Caracalla, 00153 Rome, Italy (FAO Joint Secretary)
Dr. Midori Yoshida, Section Chief, Division of Pathology, Biological Safety Research Center, National Institute of Health Sciences, Ministry of Health, Labour and Welfare, 1-18-1 Kamiyoga, Setagaya-ku, Tokyo 158-8501 Japan (WHO Temporary Adviser)
Dr Angelika Tritscher, WHO Joint Secretary, International Programme on Chemical Safety, World Health Organization, 1211 Geneva 27, Switzerland (WHO Joint Secretary; unable to attend)
Dr Gerrit Wolterink, Centre for Substances & Integrated Risk Assessment, National Institute of Public Health and the Environment (RIVM), Antonie van Leeuwenhoeklaan 9, PO Box 1, 3720 BA Bilthoven, Netherlands (WHO Temporary Adviser)
Dr Jürg Zarn, Swiss Federal Office of Public Health, Food Toxicology Section, Stauffacherstrasse 101, CH-8004 Zurich, Switzerland (WHO Temporary Adviser)

ix
ABBREVIATIONS
ADI acceptable daily intake
ai active ingredient
ALP alkaline phosphatase
ALT alanine aminotransferase
ARfD acute reference dose
AST aspartate aminotransferase
AUC area under the curve for concentration–time
BBCH derives from Biologische Bundesanstalt, Bundessortenamt and CHemical industry
BMDL10 benchmark-dose lower 95% confidence level
bw body weight
CAS Chemical Abstracts Service
CCFAC Codex Committee on Food Additives and Contaminants
CCN Codex classification number (for compounds or commodities)
CCPR Codex Committee on Pesticide Residues
Cmax maximum concentration
CV co-efficient of variation
dw dry weight
EC50 the concentration of agonist that elicits a response that is 50% of the possible maximum
F0 parental generation
F1 first filial generation
F2 second filial generation
FAO Food and Agricultural Organization of the United Nations
FOB functional observational battery
GAP good agricultural practice
GC gas chromatography
GC-NPD gas chromatography coupled with Nitrogen-Phosphorous detector
GGT gamma-glutamyltransferase
GEMS/Food Global Environment Monitoring System–Food Contamination Monitoring and Assessment Programme
GPC gel permeation chromatography
HR highest residue in the edible portion of a commodity found in trials used to estimate a maximum residue level in the commodity
HR-P highest residue in a processed commodity calculated by multiplying the HR of the raw commodity by the corresponding processing factor
IC50 concentration required to inhibit activity by 50%
IEDI international estimated daily intake
IESTI international estimate of short-term dietary intake
ISO International Organization for Standardization
x
IUPAC International Union of Pure and Applied Chemistry
JECFA Joint Expert Committee on Food Additives
JMPR Joint Meeting on Pesticide Residues
JMPS Joint FAO/WHO Meeting on Pesticide Specifications
LC liquid chromatography
LC50 median lethal concentration
LD50 median lethal dose
LOAEL lowest-observed-adverse-effect level
LOAEC lowest-observed-adverse-effect concentration
LOD limit of detection
LOQ limit of quantification
MCH mean corpuscular haemoglobin
MCV mean corpuscular volume
MEQ methylethoxyquin
mrl maximum residue level
MRL maximum residue limit
MS mass spectrometry
MS/MS tandem mass spectrometry
NAFTA North American Free Trade Agreement
NOAEL no-observed-adverse-effect level
OECD Organization for Economic Co-operation and Development
PPARα peroxisome proliferator-induced receptor alpha
PHI pre-harvest interval
ppm parts per million
SPE solid phase extraction
STMR supervised trials median residue
STMR-P supervised trials median residue in a processed commodity calculated by multiplying the STMR of the raw commodity by the corresponding processing factor
T3 triiodothyronine
T4 thyroxine
TRR total radiolabelled residue
TSH thyroid stimulating hormone
TMDI theoretical maximum daily intake
WHO World Health Organization

xi
USE OF JMPR REPORTS AND EVALUATIONS BY REGISTRATION AUTHORITIES
Most of the summaries and evaluations contained in this report are based on unpublished proprietary data submitted for use by JMPR in making its assessments. A registration authority should not grant a registration on the basis of an evaluation unless it has first received authorization for such use from the owner of the data submitted for the JMPR review or has received the data on which the summaries are based, either from the owner of the data or from a second party that has obtained permission from the owner of the data for this purpose.

Introduction 1
PESTICIDE RESIDUES IN FOOD
REPORT OF THE 2008 JOINT FAO/WHO MEETING OF EXPERTS
INTRODUCTION
A Joint FAO/WHO Meeting on Pesticide Residues (JMPR) was held at the headquarters of the Food and Agriculture Organization of the United Nations (FAO), Rome, Italy, from 9 to 18 September 2008. The Meeting brought together the FAO Panel of Experts on Pesticide Residues in Food and the Environment and the World Health Organization (WHO) Core Assessment Group.
The Meeting was opened by Mr Shivaji Pandey, Director, Plant Production and Protection Division of FAO, on behalf of the Director-General of FAO and the Director-General of WHO.
Mr Pandey welcomed the participants, noting that there were 40 participants from 16 countries. Mr Pandey stated that the importance of the work of the JMPR had been highlighted in several important events that had taken place at FAO recently. These included the FAO Independent External Evaluation (IEE), the High Level Conference on World Food Security and the Global Minor Use Summit.
The IEE, an independent evaluation of all aspects of the technical and policy work, governance and structure of FAO, was the first to be carried out since the establishment of FAO in 1945. While the impact of this evaluation was hard to predict, Mr Pandey noted that the IEE report gave a high priority to the work of JMPR, the Joint Meeting on Pesticide Specifications (JMPS) and other scientific advisory bodies that provide scientific advice to Codex Alimentarius to support the Codex standards, and the collaboration between FAO and WHO in the field of food safety standard and pesticide management (Code of Conduct).
The aim of the High Level Conference on World Food Security, held in June 2008 at FAO headquarters by the United Nations and FAO, was to address the impact of soaring food prices, climate change and bio-energy production on world food security. Mr Pandey mentioned how the JMPR recommendations on Codex maximum residue limits (MRLs) for food and feed make an important contribution to the improvement of food availability and enhanced food safety and thus contribute to the resolution adopted by the Conference to continue the fight against food insecurity, hunger and malnutrition.
Mr Pandey mentioned the Global Minor Use Summit – a joint initiative of FAO, the United States Department of Agriculture (USDA), the United States Environmental Protection Agency (US EPA) – which had taken place at FAO headquarters in December 2007. The purpose of the Summit was to seek ways to improve the harmonization of protection measures and residue standards for speciality crops and minor uses. He reminded the JMPR participants that the JMPR had considered the issue of minor uses at its meeting in 2005 and that the Summit was thus an outcome of the JMPR recommendations.
Mr Pandey highlighted the challenges faced by the present Meeting, not only because of the large number of pesticides to be evaluated but also in view of the need to consider some important general issues, in particular, the proposal of achieving globally harmonized MRLs through Codex and also the issue of combination of residue data for the estimation of MRLs and STMRs.
Mr Pandey thanked the participants for their efforts and their dedication to the Meeting.
The Meeting was held in pursuance of recommendations made by previous Meetings and accepted by the governing bodies of FAO and WHO that studies should be undertaken jointly by experts to evaluate possible hazards to humans arising from the occurrence of residues of pesticides in foods. The reports of previous Meetings (see Annex 5) contain information on acceptable daily intakes (ADIs), acute reference doses (ARfDs), MRLs, and the general principles that have been used

2 Introduction
for evaluating pesticides. The supporting documents (residue and toxicological evaluations) contain detailed monographs on these pesticides and include evaluations of analytical methods.
During the Meeting, the FAO Panel of Experts was responsible for reviewing residue and analytical aspects of the pesticides under consideration, including data on their metabolism, fate in the environment, and use patterns, and for estimating the maximum levels of residues that might occur as a result of use of the pesticides according to good agricultural practice. The estimation of MRLs and supervised trials median residues (STMR) values for commodities of animal origin was elaborated. The WHO Core Assessment Group was responsible for reviewing toxicological and related data in order to establish ADIs, and ARfDs, where necessary and possible.
The Meeting evaluated 28 pesticides, including six new compounds and five compounds that were re-evaluated within the Code Committee on Pesticide Residues (CCPR) periodic review programme for toxicity or residues, or both. The Meeting allocated ADIs and ARfDs, estimated MRLs and recommended them for use by the CCPR, and estimated STMR and highest residue (HR) levels as a basis for estimating dietary intakes.
The Meeting also estimated the dietary intakes (both short-term and long-term) of the pesticides reviewed and, on this basis, performed a dietary risk assessment in relation to their ADIs or ARfDs. Cases in which ADIs or ARfDs may be exceeded were clearly indicated in order to facilitate the decision-making process by the CCPR. The rationale for methodologies for long-term and short-term dietary risk assessment are described in detail in the reports of the 1997 JMPR (Annex 5, reference 80, section 2.3) and 1999 JMPR (Annex 5, reference 86, section 2.2). Additional considerations are described in the report of the 2000 JMPR (Annex 5, reference 89, sections 2.1–2.3).
The Meeting also considered a number of general issues addressing current issues related to the risk assessment of chemicals, the evaluation of pesticide residues and the procedures used to recommend maximum residue levels.
DECLARATION OF INTEREST
The Secretariat informed the Committee that all experts participating in the 2008 JMPR had completed declaration-of-interest forms, and that no conflicts of interest had been identified.

General Considerations 3
GENERAL CONSIDERATIONS
2.1 COMMENTS FROM JMPR ON A PILOT POCESS FOR JMPR TO RECOMMEND
MAXIMUM RESIDUE LEVELS PRIOR TO NATIONAL GOVERNMENT
REGISTRATION
Background
At the 40th Session of the Codex Committee on Pesticide Residues (CCPR), the Delegation of the United States (US) presented a document describing recommendations for the development of a process to accelerate the evaluation of new pesticides, which would allow JMPR to recommend maximum residue levels (MRLs) to CCPR before the new pesticide has been registered by national governments. This might facilitate the alignment of national MRLs with Codex.
CCPR agreed to establish an electronic working group led by the US delegation and co-chaired by Australia and Kenya; the objective of this working group was to prepare a discussion paper describing in more detail a proposal for a pilot process and report back to CCPR at its Forty-first Session (April 2009). CCPR noted that this pilot process would have significant implications. The Joint JMPR Secretariats requested comments from the present Meeting.
Comments from the JMPR on the pilot process
The Meeting indicated that it would embrace any development that would improve the efficiency with which public health is protected from exposures to pesticide residues.
The Meeting considered that there were several potential advantages in the proposal to accelerate the evaluation of new pesticides by giving the JMPR evaluator access to the relevant joint (work-share) assessment documents and deliberations of participating national governments and the full data packages. In particular, many of the technical issues involved would be identified by the governments and authorities during the commenting process. However, the Meeting noted that there are some issues that required further consideration before implementation of any pilot project.
The Meeting emphasized for the pilot process that all relevant procedural issues need to be resolved and the data need to be available at least 6 months prior to the annual meeting of the JMPR in September.
Successful completion of an evaluation by JMPR requires registered label information, including good agricultural practice (GAP), for estimation of maximum residue levels. GAP for a pesticide means more than just the maximum proposed use pattern (rate of application, pre-harvest interval, efficacy). It also includes advice relevant to worker/operator and environmental exposure as well as management of pesticide resistance. JMPR is concerned that national government evaluation of these additional aspects may lead to changes in the GAP that is ultimately registered. Those governments involved in the pilot project should ensure that the proposed GAP is as final as possible before submission of the residue data to the JMPR.
For the JMPR evaluation to be completed before final registration of the new pesticide by national governments, interaction is required between the JMPR evaluator preparing the first draft of documents for the Meeting and reviewers from governments and authorities participating in the pilot project. The Meeting noted that increased correspondence would increase time involved but not necessarily change the meeting process. However, the process timeframes should align with JMPR timeframes including the time needed to prepare papers for the Meeting. Therefore the JMPR Secretariats will need to assign evaluators/reviewers and provide them with the necessary contacts and access to relevant information.

4 General Considerations
2.2 COMMENTS ON THE “GLOBAL ASSESSMENT” OF CHLORANTRANILIPROLE IN
TERMS OF ITS USEFULNESS AS A WORK-SHARING TOOL FOR JMPR
The Meeting had previously used work-sharing reports on trifloxystrobin (JMPR, 2004) and quinoxyfen (JMPR, 2006) to develop monographs for these chemicals. The Meeting had concluded that evaluations conducted by national and regional authorities were useful in the preparation of JMPR evaluations. Appropriate use of material from these evaluations reduced the amount of time required by the JMPR temporary advisor to prepare toxicological and residue monographs.
A pilot assessment entitled “Chlorantraniliprole (DPX-E2Y45) global assessment 1 ” was conducted in 2006–2008 by several regulatory authorities under the auspices of the Organization for Economic Cooperation and Development (OECD) with the aims of accelerating the timeline between review and approval and furthering regulatory harmonization. Ten countries were involved in the preparation of a global assessment of chlorantraniliprole. The global assessment was presented in the OECD format.2
In continuation of its support of work-sharing, the present Meeting used this global assessment to aid in the preparation of a JMPR toxicology monograph on chlorantraniliprole, which was reviewed by the present Meeting at the request of the Codex Committee on Pesticide Residues (CCPR). The JMPR Secretariat provided the JMPR temporary advisors responsible for the preparation of the first draft of the JMPR monograph with the relevant documents used for toxicological evaluations in the global assessment of chlorantraniliprole.
The final version of the residue component of the global assessment was not available at the time the JMPR residue evaluation was prepared.
The Meeting made a number of comments on the usefulness of the toxicological component of the global assessment to assist the work of the JMPR.
Format of the global assessment
The general format of the toxicology component of the global assessment was similar to that of a JMPR monograph.
The study evaluations within each section were summarized at the end of the section. A summary of mammalian toxicology and the selection of end-points was then presented, with a brief conclusion that summarized the toxicological profile of the substance. Again, this had some similarities to the style of the JMPR monograph.
Since the toxicology of the substance under evaluation was summarized at several places in the global assessment, this leads to considerable redundancy.
Study evaluations in the global assessment
The study evaluations in the global assessment were lengthy, describing in great detail the study design, methods and materials, results and conclusions. In addition, the study evaluations often contained a considerable number of tables presenting the values for the parameters investigated, irrespective of whether or not these parameters were affected by treatment with chlorantraniliprole. As the studies with chlorantraniliprole were modern and complied with current OECD guidelines and the degree of toxicity observed was very low, the extensive descriptions of the study methods in the evaluations of the global assessment were of limited value. Owing to such lengthy description of basic information, the key findings of the study were not always immediately clear, although detailed
1 Referred to as ‘Joint Review of Chlorantraniliprole (DPX-E2Y45)’ by OECD 2 OECD monograph guidance http://www.oecd.org/document/59/0,3343,en_2649_34383_1916347_1_1_1_1,00.html

General Considerations 5
descriptions of the study results may avoid the need to consult the original study reports3. The description of arguments used in the identification of no-observed-adverse-effect levels (NOAELs) was also helpful for the preparation of the JMPR monograph.
These study evaluations formed a useful basis for the JMPR monograph, although it was necessary to considerably reduce the lengthy descriptions in order to focus on the essential points of the studies.
In general, the Meeting agreed with the conclusions of the global assessment for chlorantraniliprole. However, it should be noted that this was a straightforward assessment of a compound that was without potential for severe toxicity.
Reporting table, including comments of the peer reviewers
An extensive reporting table was provided with the global assessment, which presented the comments and questions that had been raised by the regulatory authorities or the applicant, and the response of the Rapporteur Member State.
The reporting table clarified the points of discussion, presented the different arguments raised by the participants and, in general, made clear what final decision was reached and on what basis. This table was considered to be very useful for the preparation of the JMPR monograph, although it was noted that a considerable part of the table dealt with minor issues (e.g., editorial points), which made it more difficult to identify the critical points of discussion.
Conclusion
The global assessment of chlorantraniliprole (particularly the accompanying reporting table with the reviewer comments) was helpful for the preparation of the JMPR monograph on this pesticide.
In summary, some suggestions are listed below that might make the global assessment more useful for the JMPR:
− Decrease the level of methodological detail provided.
− Reduce the level of reporting of inconsequential findings.
− Continue to give details of comments and responses by participants.
− If possible, separate critical discussion points from minor issues in the reporting table.
2.4 A PROCESS TO ENSURE THE SCIENTIFIC ROBUSTNESS AND TRANSPARENCY
OF RETROSPECTIVE ANALYSES OF TOXICITY DATA ON PESTICIDE
CHEMICALS
The current paradigm of toxicity testing that is used to assess the potential risk of pesticide chemicals has been in place for many years. Such risk assessments have been conducted for hundreds of chemicals. Together they form a rich database on the toxicity of these chemicals. Compilation and analysis (known as “retrospective analyses”) of this existing extensive toxicity database can play an important role, for example, in refining test methods and guiding changes in data requirements, in identifying and prioritizing key issues associated with current tests for toxicity, in enhancing
3 The Meeting noted that in 2001 and 2002 the OECD had published two guidance documents in the OECD Series on Testing and Assessment that recommended ways of providing an adequate level of detail in toxicology reports without including unnecessary information or duplicating information that was common to different types of studies.

6 General Considerations
interpretation of data from current tests for toxicity, and in supporting predictions of toxicity (e.g., building and testing of SAR/QSAR models).
A number of different retrospective analyses by national and supranational bodies of various studies of toxicity in experimental animals have either been completed or are ongoing. These retrospective analyses address issues such as the duration of a study of toxicity in dogs that is appropriate for the determination of an acceptable daily intake (ADI), the amount of additional information relevant to hazard and risk assessment provided currently by the bioassay for cancer in mice, and the contribution of the F2 generation in studies of reproductive toxicity in rats in order to consider a possible replacement of the multigeneration study of reproductive toxicity by the “extended F1” study.
Given the interest in retrospective analyses, the OECD Working Group on Pesticides has established a task group to develop a document that describes, in general terms, a process for improving the transparency and harmonization of retrospective analyses. In considering which organizations need to be involved in this process and what their roles should be, that task group asked the WHO Core Assessment Group on Pesticide Residues of the JMPR to comment on how retrospective analyses could be used most effectively to improve the risk assessment of pesticides.
Comments from the JMPR
The present Meeting acknowledged the importance of retrospective analyses of toxicity databases for pesticides and recommended that the WHO Core Assessment Group on Pesticide Residues of the JMPR or a working group established by the WHO Joint Secretariat of the JMPR could serve a valuable role in the review of these analyses that are conducted by national/supranational bodies. The JMPR would provide an independent international opinion on the scientific robustness and transparency of these analyses, make suggestions on how they may be improved, and provide comment on the implications of the results. If multiple analyses by different countries have been or will be conducted, the JMPR could also make recommendations on how to harmonize the approach and interpretation of the results. Retrospective analyses may be submitted to the JMPR/WHO Joint Secretariat for consideration by national authorities or other organizations or by the OECD Working Group on Pesticides. Given that the JMPR convenes once each year, in order for the JMPR to provide meaningful input, the analyses would need to be made available to the WHO Core Assessment Group at least 6 months before the JMPR annual meeting normally held in September and such analyses would need to be well documented (i.e., not anonymized, if possible).
The Meeting also recommended that the JMPR take on a pilot process and thus asked the JMPR/WHO Joint Secretariat to liaise with the OECD Working Group on Pesticides to identify a suitable retrospective analysis.
2.4 COMMENTS ON OECD DRAFT GUIDANCE DOCUMENT FOR DERIVATION OF AN
ACUTE REFERENCE DOSE
The present Meeting discussed the most recent draft version of the OECD Guidance Document for
Derivation of an Acute Reference Dose (Version 6, 30 June 2008), the purpose of which is to provide harmonized guidance on how to use all available information to derive acute reference values (ARV)4 and how to proceed should additional data be necessary. Although it was not possible to discuss the document in detail since it was not provided to the JMPR before the present meeting, the Meeting was able to offer some general comments, summarized below.
4 In the OECD draft guidance, the term “acute reference value (ARV)” is applied, which is related not only to the amount of a substance that can be ingested from food or drinking-water, but also that can be tolerated by dermal and inhalation exposures.

General Considerations 7
The OECD guidance document is generally based on the JMPR Guidance on the
Establishment of Acute Reference Doses,5 which is intended to be used for the assessment of dietary
exposure to pesticide residues. In contrast to the guidance provided by JMPR, the most recent OECD guidance document also applies to dermal and inhalational exposure, which complicates the guidance offered, e.g., the principles for not setting an ARV based on a NOAEL of > 500 mg/kg bw are very specific for oral ingestion of pesticide residues.
The Meeting recommended that the OECD guidance document should address only oral exposure. The issues associated with setting ARVs for inhalation and dermal exposure, including route-to-route extrapolation methods, should be moved to a separate guidance document or to an annex attached to the current document.
The present Meeting noted that the provision of more guidance on issues relating to assessment of acute risk would improve both the WHO and the OECD guidance on setting of acute reference doses (ARfDs). Several of these issues were recently discussed and published by the JMPR (e.g., section 2.6 of the present report; sections 2.1 and 2.4 of the JMPR report 2007; section 2.4 of the JMPR report 2006).
2.5 CUMULATIVE RISK ASSESSMENT FOR PESTICIDE RESIDUES IN FOOD:
ACTIVITIES OF THE EUROPEAN FOOD SAFETY AUTHORITY
The Meeting was informed that the Scientific Panel on Plant Protection Products and their Residues (PPR Panel) of the European Food Safety Authority had issued an opinion “to evaluate the suitability of existing methodologies and, if appropriate, the identification of new approaches to assess cumulative and synergistic risks from pesticides to human health with a view to set MRLs for those pesticides in the frame of Regulation (EC) 396/2005”. 6 It was also informed of an ongoing application of the tiered approach provided in the opinion to risk assessment of cumulative dietary exposure of triazole fungicides. The Meeting was aware of other similar evaluations conducted by other bodies and considered the relevance of cumulative risk assessment for pesticide residues in food. The Meeting would continue to monitor ongoing activities in this field and eventually advise on the need for cumulative risk assessment for certain groups of compounds.
2.6 SAFETY FACTORS FOR ACUTE CMAX-DEPENDENT EFFECTS: SPECIFIC
CONSIDERATIONS WITH RESPECT TO CARBAMATES SUCH AS CARBOFURAN
General considerations
In deriving health-based guidance values for exposure-based risk assessment, i.e., ADI and ARfD, the JMPR uses the paradigm developed by the International Programme on Chemical Safety (IPCS) and widely adopted by risk-assessment bodies throughout the world. For toxicological effects that would be anticipated to have a biological threshold and for which there is an experimentally observable threshold, the ADI or ARfD, as appropriate, is derived from the NOAEL, or other suitable point of departure, by application of an appropriate safety factor.7 The safety factor allows for inter-species 5 In: Pesticide Residues in Food—2004. Report of the JMPR 2004, FAO Plant Production and Protection Paper, 178, FAO, Rome, pp 3–9. 6 http://www.efsa.eu.int/EFSA/efsa_locale-1178620753812_1178712607885.htm 7 Safety factors are also known as “assessment factors”, “adjustment factors” (AFs) or “uncertainty factors” (UFs). In the IPCS document on chemical-specific adjustment factors (CSAFs), the term “uncertainty factor” applies to default factors, while “adjustment factor” applies to data-derived factors. In this IPCS terminology, the overall safety factor is known as the “combined uncertainty factor” (CUF).

8 General Considerations
and human inter-individual differences in sensitivity attributable to both toxicokinetics and toxicodynamics. When using data obtained from experimental animals, the default safety factor is 100. This comprises a factor of 10 to allow for inter-species differences and a factor of 10 for intra-species (human inter-individual) differences. The overall safety factor is the product of these two factors, i.e., 10 × 10.
While this approach allows for the use of data either from experimental animals (safety factor of 100) or from humans (safety factor of 10), it does not allow quantitative incorporation of specific information on toxicokinetic or toxicodynamic differences for a chemical, either between or within species, in the risk assessment. To overcome this limitation, IPCS recommended that the two 10-fold factors each be further subdivided into toxicokinetic and toxicodynamic sub-factors. The sub-factors agreed were 4-fold and 2.5-fold for inter-species toxicokinetic and toxicodynamic differences, respectively, and 3.16 (101/2) each for human inter-individual toxicokinetic and toxicodynamic differences. The resulting sub-factors were termed “default sub-factors” (uncertainty factors or UFs).8 Where available, information on one or more specific sources of variability and uncertainty could be used to enable derivation of one or more chemical-specific adjustment factors, CSAFs, replacing the defaults.
Table 1 Values for IPCS default sub-factors for uncertainty8
Default sub-factor Source of uncertainty Toxicokinetic Toxicodynamic Combined
Interspecies variation 4.0 2.5 10 Human inter-individual variation 3.16 3.16 10
IPCS, International Programme on Chemical Safety
The overall or combined uncertainty factor (CUF; equivalent to the safety factor as used by JMPR) is obtained from the product of the CSAFs, using defaults for those sub-factors for which chemical specific information is not available. Hence:
Combined UF (safety factor) = (AKAF or AKUF) × (ADAF or ADUF) × (HKAF or HKUF) × (HDAF or
HDUF)
where AK represents inter-species toxicokinetic variability
AD represents inter-species toxicodynamic variability
HK represents human interindividual toxicokinetic variability
HD represents human interindividual toxicodynamic variability
AF represents a chemical-specific adjustment factor
UF represents a default uncertainty subfactor
CSAFs enable information on inter-species or human interindividual differences in the toxicokinetics or toxicodynamics of a specific chemical to be incorporated into the risk assessment. Although such information is often not available, information on pathways of elimination or mode of action may be available. As information is available on the extent to which some of these pathways or processes vary between or within species, an approach has been proposed to enable this information to be used to inform the choice of safety factors.9 This approach is therefore somewhere between the
8 WHO. Chemical-specific adjustment factors for interspecies differences and human variability: guidance document for use of data in dose/concentration–response assessment. Geneva, World Health Organization, 2005 (http://whqlibdoc.who.int/publications/2005/9241546786_eng.pdf) 9 Renwick AG, Lazarus NR. Human variability and noncancer risk assessment – an analysis of the default uncertainty factor. Regul. Toxicol. Pharmacol., 1998;27:3–20.

General Considerations 9
normal default situation (100-fold safety factor) and the derivation of CSAFs on the basis of chemical-specific information. Such factors have been termed “categorical factors”.10
The default uncertainty factors for inter-species and human inter-individual toxicokinetic differences were derived on the basis of protection from long-term exposure to chemicals.11 As such, these factors reflect differences in clearance processes, i.e., are-under-the-curve of concentration–time (AUC)-dependent effects. As the effects of acute exposure are often dependent on Cmax, it is pertinent to ask whether this parameter varies to the same extent as AUC or clearance (CL) between or within species.
Kinetically, ( )
( )kkV
eeFDkC
a
tkkt
aa
−×
−××=
−− maxmax
max
where
ka = absorption rate constant
k = elimination rate constant
V = apparent volume of distribution
tmax = time of maximum plasma concentration (Cmax)
F = systemic bioavailability
D = administered dose
Hence, Cmax does not depend directly upon either CL or AUC. Although k depends upon both
CL and V, in general ka exceeds k. Hence, the main determinants of Cmax are ka and V, i.e., the rate of absorption and the volume of distribution. 12 These are determined largely by physicochemical properties and basic body composition. Basic body composition, e.g., the thickness and composition of the plasma membrane, major determinants of passive diffusion, do not vary widely between or within species. Analysis of a database on pharmaceuticals used in humans confirmed that Cmax varied less between species than did CL or AUC.11 Hence, it was concluded on the basis of these considerations that a reduction in the inter-species toxicokinetic factor (AKAF) from the default of 4 to 2 was justified (Renwick, 2000) for rapidly eliminated compounds, the effects of which were dependent on Cmax. The JMPR reached a similar conclusion at its meeting in 2000.
Cmax is influenced by the presence of food in the gastrointestinal tract, for example, because of effects on gastric emptying.13 However, as it is assumed that a large portion of a particular relevant food commodity would be present when undertaking an acute risk assessment of residues of a pesticide, this factor would make a less important contribution to inter-individual variability in Cmax.
Hence, some reduction in the adjustment factor for human toxicokinetic differences (HKAF), from its default value of 3.16, would seem to be justified. The JMPR in 2000 had previously suggested that a 50% reduction would be appropriate. Hence, for compounds whose effects are dependent on Cmax, and which are rapidly eliminated, the combined adjustment factor would be:
CUF = AKAF × ADUF × HKAF × HDUF 10 Walton K, Dorne JL & Renwick AG. Categorical default factors for interspecies differences in the major routes of xenobiotic elimination. Hum. Ecol. Risk Assess., 2001;7:181–201. 11 WHO. Principles for the toxicological assessment of pesticide residues in food. Environmental Health Criteria 104. (http://www.inchem.org/documents/ehc/ehc/ehc104.htm) 12 Renwick AG. The use of safety or uncertainty factors in the setting of acute reference doses. Food Addit.
Contam., 2000;17:627–635. 13 Krishna R, Jensen BK. Pharmacokinetics: effects of food and fasting. In: Swarbrick J, editor. Encyclopaedia
of Pharmaceutical Technology, Third Edition, Informa Healthcare, London; 2004: pp 2816–2828.

10 General Considerations
= 2 (categorical) × 2.5 (default) × 1.58 (categorical) × 3.16 (default)
= 25
The example of carbamates
The toxicological effects of carbamates such as carbofuran are Cmax dependent. As carbamates are rapidly absorbed and eliminated, the above considerations would apply, and the combined uncertainty factor would be 25, rather than the default of 100.
The toxicity of carbamates such as carbofuran is caused by inhibition of neuronal acetylcholinesterase activity. The clinical signs indicate that neurons in the central nervous system are the primary target, and are responsible for the critical effects upon which the risk assessment is based. This is true for acute (single dose) and for long-term exposure. The NOAELs for the toxicological effect of carbofuran are the same, regardless of the duration of exposure. This is a consequence of the toxicokinetics of carbofuran, which is rapidly absorbed and eliminated, and the toxicodynamics of the effect, in which acetylcholinesterase is rapidly reactivated because of spontaneous hydrolysis. There is therefore no opportunity for progressive effects to develop, due to either bioaccumulation or to cumulative inhibition from one exposure to another.
Neuronal acetylcholinesterase, which is identical to the acetylcholinesterase protein expressed in erythrocytes, is well conserved between species. Studies in vitro have shown that erythrocyte acetylcholinesterase from a number of species, including humans, shows similar sensitivity to inhibition by carbamates. 14 This has been confirmed in vivo, for example with carbofuran (see report of the present Meeting). The NOAELs for inhibition of acetylcholinesterase activity by this compound and for effects dependent upon such inhibition in rats, dogs and humans were very similar (see report of the present Meeting). The default uncertainty subfactor for interspecies toxicodynamic differences (ADUF) of 2.5 assumes that humans are more sensitive than the test species. As there is good evidence that this is not the case for carbofuran, some modification of ADAF would be justified.
The default uncertainty subfactor for human inter-individual differences in toxicodynamics (HDUF) is 3.16. In the case of carbamates such as carbofuran, such differences will depend on the level of expression of acetylcholinesterase and the rate of enzyme reactivation, which is a passive process. Rat pups were more sensitive to inhibition of acetylcholinesterase activity by carbofuran than were adults. Hence, in basing the risk assessment on this end-point, one component of potential variability within the population has already been taken into account and the remaining inter-individual differences are likely to be less than the default, as they are due to passive processes.
On the basis of the above considerations, the Meeting concluded that the default uncertainty sub-factors for toxicodynamic differences between and within species for carbofuran were conservative and that some modification of these sub-factors to account for the reduced variability expected for such compounds would be justified, on the basis of both chemical-specific and generic information. This, together with the arguments for categorical toxicokinetic factors for compounds where toxicity is dependent on Cmax, provides strong support for the use of a combined uncertainty factor (safety factor) of no more than 25 for carbofuran.
14 Rao PS, Roberts GS, Pope CN & Ferguson PW. Comparative inhibition of rodent and human erythrocyte acetylcholinesterase by carbofuran and carbaryl. Pestic. Biochem. Physiol., 1994;48:79–84.

General Considerations 11
2.7 TRANSPARENCY IN THE MAXIMUM RESIDUE LEVEL ESTIMATION PROCESS
OF THE JMPR
The JMPR adopted the statistically based methodology used in the NAFTA15 countries at its 2005 Meeting as an aid in the estimation of maximum residue levels (2005 Report). Prior to that, estimations of the maximum residue level (mrl) were based solely on the collective scientific judgment of the JMPR after careful consideration of the results of the relevant supervised trials. Values were rounded according to a step system (1, 2, 3, 5, 7, 10…). With the inclusion of the NAFTA spreadsheet in the estimation process, the step system of rounding was abandoned and values were rounded up to one significant figure (with the addition of 15). The Meeting has reported each year on its experiences with the NAFTA calculation routine.
The Meeting has been using the NAFTA spreadsheet as a tool and not as the primary determinant of estimations. This means that the evaluator considers the data set, the crop, the properties of the particular pesticide, and supporting data, and then proposes an estimate. This estimate is checked against the NAFTA spreadsheet. The evaluator’s preliminary estimates are debated by the entire FAO expert group and may be changed on reconsideration of the data and knowledge of the particular pesticide and its uses and properties and the situations with each crop data set, as well as review of the NAFTA spreadsheet results. The estimation is not a simple matter of entering the residue trial numbers into a spreadsheet and recording the output.
The NAFTA spreadsheet is not a statistical model for the accurate estimation of maximum residue levels. Rather it is a decision-tree logic that utilizes statistical calculations to arrive at a reasonable maximum residue level that should be acceptable to different parties considering the same data set. It is designed to give a consistent decision, independent of the prejudice of the reviewer(s). The spreadsheet looks only at numbers and not at the basis of those numbers. The JMPR looks both at the numbers and the basis of those numbers (See General Consideration 2.8).
It is imperative that the JMPR consider all relevant aspects in arriving at its maximum residue level estimates. Otherwise, a value intended as an international trade standard may be set too low thereby creating trade difficulties for a commodity that was treated in accordance with a national GAP. On the other hand, the JMPR attempts to not overestimate the maximum residue level and thereby allow commodities in trade from applications in excess of the GAP. Many such aspects that cannot be factored in by a spreadsheet.
The 40th Session of the CCPR requested that the JMPR Secretaries consider providing brief explanations on the derivation of each maximum residue level estimate and publishing a calculation summary table.
The Meeting acknowledged that following the derivation of a maximum residue level from the data set recorded in the JMPR Report may not be a facile process.
A simple example will illustrate the process, but no number of examples can address all the situations encountered by the Meeting in reaching decisions on maximum residue levels. Residue data for the foliar application of spirotetramat to hops was considered by the Meeting. The data set consists of 4 independent data points: 2.8, 4.5, 5.8, 5.8 mg/kg. The data set is very small (n = 4) and is only acceptable because the crop is minor or specialty. There is little confidence that the four values include the maximum residue that might be encountered from treatment according to GAP. Moreover, the FAO realized from experience that residues on dried hops can be extremely variable. Therefore, the Meeting concluded to estimate 15 mg/kg, the choices being 6, 7, 8, 9, 10, 15, 20 mg/kg, and checked this against the statistical analysis which selected 8.85 mg/kg based on log normality at the 99th percentile. The opinion of the FAO experts was that a lesser value (such as 9 mg/kg) might lead to violations for crops treated in accordance with GAP.
15 North American Free Trade Agreement
12 General Considerations
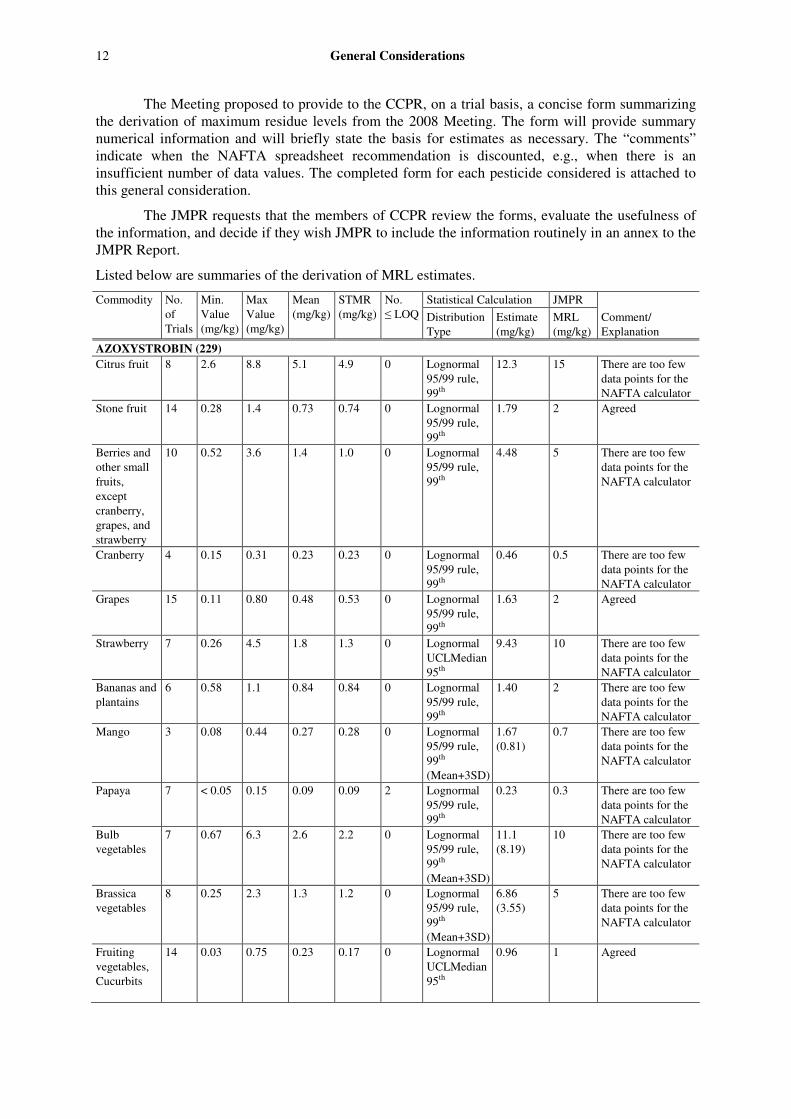
The Meeting proposed to provide to the CCPR, on a trial basis, a concise form summarizing the derivation of maximum residue levels from the 2008 Meeting. The form will provide summary numerical information and will briefly state the basis for estimates as necessary. The “comments” indicate when the NAFTA spreadsheet recommendation is discounted, e.g., when there is an insufficient number of data values. The completed form for each pesticide considered is attached to this general consideration.
The JMPR requests that the members of CCPR review the forms, evaluate the usefulness of the information, and decide if they wish JMPR to include the information routinely in an annex to the JMPR Report.
Listed below are summaries of the derivation of MRL estimates.
Statistical Calculation JMPR Commodity No. of Trials
Min. Value (mg/kg)
Max Value (mg/kg)
Mean (mg/kg)
STMR (mg/kg)
No. ≤ LOQ Distribution
Type Estimate (mg/kg)
MRL (mg/kg)
Comment/ Explanation
AZOXYSTROBIN (229)
Citrus fruit 8 2.6 8.8 5.1 4.9 0 Lognormal 95/99 rule, 99th
12.3 15 There are too few data points for the NAFTA calculator
Stone fruit 14 0.28 1.4 0.73 0.74 0 Lognormal 95/99 rule, 99th
1.79 2 Agreed
Berries and other small fruits, except cranberry, grapes, and strawberry
10 0.52 3.6 1.4 1.0 0 Lognormal 95/99 rule, 99th
4.48 5 There are too few data points for the NAFTA calculator
Cranberry 4 0.15 0.31 0.23 0.23 0 Lognormal 95/99 rule, 99th
0.46 0.5 There are too few data points for the NAFTA calculator
Grapes 15 0.11 0.80 0.48 0.53 0 Lognormal 95/99 rule, 99th
1.63 2 Agreed
Strawberry 7 0.26 4.5 1.8 1.3 0 Lognormal UCLMedian95th
9.43 10 There are too few data points for the NAFTA calculator
Bananas and plantains
6 0.58 1.1 0.84 0.84 0 Lognormal 95/99 rule, 99th
1.40 2 There are too few data points for the NAFTA calculator
Mango 3 0.08 0.44 0.27 0.28 0 Lognormal 95/99 rule, 99th (Mean+3SD)
1.67 (0.81)
0.7 There are too few data points for the NAFTA calculator
Papaya 7 < 0.05 0.15 0.09 0.09 2 Lognormal 95/99 rule, 99th
0.23 0.3 There are too few data points for the NAFTA calculator
Bulb vegetables
7 0.67 6.3 2.6 2.2 0 Lognormal 95/99 rule, 99th (Mean+3SD)
11.1 (8.19)
10 There are too few data points for the NAFTA calculator
Brassica vegetables
8 0.25 2.3 1.3 1.2 0 Lognormal 95/99 rule, 99th (Mean+3SD)
6.86 (3.55)
5 There are too few data points for the NAFTA calculator
Fruiting vegetables, Cucurbits
14 0.03 0.75 0.23 0.17 0 Lognormal UCLMedian95th
0.96 1 Agreed

General Considerations 13
Statistical Calculation JMPR Commodity No. of Trials
Min. Value (mg/kg)
Max Value (mg/kg)
Mean (mg/kg)
STMR (mg/kg)
No. ≤ LOQ Distribution
Type Estimate (mg/kg)
MRL (mg/kg)
Comment/ Explanation
Fruiting vegetables, other than Cucurbits, except fungi and sweet corn
11 0.08 1.4 0.48 0.35 0 Lognormal UCLMedian95th
2.17 3 There are too few data points for the NAFTA calculator
Lettuce 20 < 0.01 1.6 0.46 0.28 5 Not lognormal Mean+3SD
1.97 3 Not lognormal distribution
Legume vegetables
6 0.11 1.5 0.94 1.0 0 Lognormal 95/99 rule, 99th (Mean+3SD)
7.34 (2.64)
3 There are too few data points for the NAFTA calculator
Soya beans, dry
19 < 0.01 0.33 0.09 0.06 1 Lognormal 95/99 rule, 99th (UCLMedian95th)
0.64 (0.33)
0.5 Lognormality plot indicated saturation, resulting in overestimated 95/99th percentile
Root and tuber vegetables
15 0.03 0.45 0.23 0.23 0 Not lognormal Mean+3SD
0.57 1 Not lognormal distribution
Artichoke, globe
3 1.6 2.4 1.9 1.8 0 Lognormal 95/99 rule, 99th
3.09 5 There are too few data points for the NAFTA calculator
Asparagus 6 < 0.01 < 0.02 0.01 6 0.01* Data < LOQ Celery 7 0.23 3.2 1.2 0.43 0 Lognormal
UCLMedian95th
3.12 5 There are too few data points for the NAFTA calculator
Witloof chicory (sprouts)
5 0.03 0.11 0.06 0.05 0 Lognormal 95/99 rule, 99th
0.24 0.3 There are too few data points for the NAFTA calculator
Barley and oat
38 0.01 0.28 0.08 0.08 0 Not lognormal Mean+3SD
0.28 0.5 Not lognormal distribution, HR value equal the estimate
Wheat, rye and triticale
31 < 0.01 0.14 0.02 0.01 13 Not lognormal Mean+3SD
0.09 0.2 Not lognormal distribution, HR value higher than the estimate
Maize 20 < 0.01 0.02 0.01 0.01 17 0.02 Most data < LOQ Rice 16 0.07 3.3 1.1 0.68 0 Lognormal
95/99 rule, 99th (UCL Median 95th)
8.91 (3.85)
5 Lognormality plot indicated saturation, resulting in overestimated 95/99th percentile
Tree nuts, except pistachios
9 < 0.01 0.01 0.01 0.01 8 0.01 Most data < LOQ
Pistachios 3 0.25 0.48 0.39 0.44 0 Lognormal 95/99 rule, 99th
0.86 1 There are too few data points for the NAFTA calculator
Cotton seed 12 < 0.01 0.54 0.06 0.01 5 Not lognormal Mean+3SD
0.51 0.7 There are too few data points for the NAFTA calculator

14 General Considerations
Statistical Calculation JMPR Commodity No. of Trials
Min. Value (mg/kg)
Max Value (mg/kg)
Mean (mg/kg)
STMR (mg/kg)
No. ≤ LOQ Distribution
Type Estimate (mg/kg)
MRL (mg/kg)
Comment/ Explanation
Peanuts 11 < 0.01 0.13 0.03 0.01 5 Not lognormal Mean+3SD
0.14 0.2 There are too few data points for the NAFTA calculator
Sunflower seed
6 0.01 0.24 0.07 0.04 0 Lognormal UCLMedian95th
0.31
0.5 There are too few data points for the NAFTA calculator
Herbs, fresh 7 17 48 26 23 0 Lognormal 95/99 rule, 99th
52.3 70 There are too few data points for the NAFTA calculator
Peanut fodder (dw)
11 1.8 15 6.8 5.1 0 Lognormal 95/99 rule, 99th
25.0 30 There are too few data points for the NAFTA calculator
Soya bean fodder (dw)
19 8.0 62 36 36 0 Not lognormal Mean+3SD
77.3 100 Not lognormal distribution
Straw and fodder (dry) of cereal grains, except maize (dw)
87 0.25 11 2.3 1.7 0 Lognormal 95/99 rule, 95th (95/99 rule, 99th)
8.57 (11.75)
15 HR higher that the estimate
Maize fodder (dw)
20 1.1 25 7.0 5.0 0 Lognormal 95/99 rule, 99th
32.3 40 Agreed
Dried herbs, except dry hops
4 135 235 169 152 0 Lognormal 95/99 rule, 99th (Mean+3SD)
297 (307)
300 There are too few data points for the NAFTA calculator
Hops, dry 4 5.7 12 9.9 11 0 Not lognormal Mean+3SD
18.5 30 There are too few data points for the NAFTA calculator
Almond hulls (dw)
5 0.77 3.3 2.0 2.1 0 Lognormal 95/99 rule, 99th
6.47 7 There are too few data points for the NAFTA calculator
BOSCALID (219)
Banana 22 0.05 0.42 0.1 0.08 6 Log-normal 95/99
0.6 0.6 MLE method was used to replace the non-detects. AA 8.1×0.08=0.645
Kiwi 4 0.8 2.38 1.42 1.24 0 - 5 The Meeting took into account that post harvest treatment normally produce more uniform residue distribution than foliar application, AA 5.1×1.24=6.2
BUPROFEZIN (173) Citrus 16 0.11 0.46 0.26 0.23 none 95/99 rule 0.61 1 Good agreement Mango 5 < 0.01 0.045 0.021 0.01 2 UCLmedian
95th 0.09 0.1 Too many data
points below LOQ There are too few data points for calculator
Cucumber 8 < 0.01 0.1 0.043 0.035 1 95/99 rule 0.17 0.2 Too few data points for calculator

General Considerations 15
Statistical Calculation JMPR Commodity No. of Trials
Min. Value (mg/kg)
Max Value (mg/kg)
Mean (mg/kg)
STMR (mg/kg)
No. ≤ LOQ Distribution
Type Estimate (mg/kg)
MRL (mg/kg)
Comment/ Explanation
Tomato 8 0.05 0.52 0.27 0.24 none 95/99 rule 1.40 1 Too few data points for calculator
CHLORANTRANILIPROLE (230) Pome fruit 25 0.01 0.23 0.07 0.07 0 95th
lognormal 0.32 0.4 Agreed with expert
opinion and modelling
Cherry (stone fruit)
8 0.06 0.57 0.25 0.2 0 99th lognormal
1.13 1 Agreed with expert opinion and modelling
Grape 17 0.02 0.52 0.2 0.12 0 99th lognormal
1.39 1 NAFTA calculator did not agree with experience, rounded down
Melons (cucurbits)
7 0.01 0.1 0.06 0.07 0 99th lognormal
0.33 0.3 Agreed with expert opinion
Chilli pepper (fruiting vegetables other than cucurbits)
9 0.02 0.41 0.12 0.07 0 UCLmed 95th
0.43 0.6 Agreed with expert opinion
Spinach (leafy vegetables)
7 3.4 8.9 6.86 7.3 0 99th lognormal
14.16 20 Experience and modelling suggested higher residues, rounded to 20
Celery 7 0.99 3.6 2.34 2.1 0 99th lognormal
6.46 7 Agreed with expert opinion
Cotton seed 13 0.01 0.25 0.07 0.05 1 UCLmed 95th
0.29 0.3 Agreed with expert opinion
Cereal hay 11 0.01 0.15 0.06 0.05 1 UCLmed 95th
0.28 0.3 Agreed with expert opinion
CYPERMETHRIN (118) (including alpha- and zeta-Cypermethrin) Alfalfa fodder
6 8.2 18 11.6 10.3 0 99 22.4 30 The MRL was estimated before the NAFTA SC was used. 'n' is too small for the NAFTA calculator.
Bean straw 7 0.32 1.1 0.60 0.51 0 99 1.61 2 The MRL was estimated before the NAFTA estimate was calculated. 'n' is too small for the NAFTA calculator.
Cabbage 53 0.003 0.65 0.047 0.02 30 X(mean)+3SD
0.32 1 The MRL was estimated before the NAFTA estimate was calculated. There are too many '< LOQ' values for the NAFTA calculator.

16 General Considerations
Statistical Calculation JMPR Commodity No. of Trials
Min. Value (mg/kg)
Max Value (mg/kg)
Mean (mg/kg)
STMR (mg/kg)
No. ≤ LOQ Distribution
Type Estimate (mg/kg)
MRL (mg/kg)
Comment/ Explanation
Carambola 5 0.02 0.09 0.036 0.02 3 X+3SD 0.13 0.2 The MRL was estimated before the NAFTA estimate was calculated. 'n' is too small for the NAFTA calculator. There are too many '< LOQ' values for the NAFTA calculator.
Cereal grains
26 0.01 0.22 0.052 0.036 4 95UCL 0.26 0.3 The MRL was estimated before the NAFTA estimate was calculated. The data originate from barley trials in 4 countries. There is no evidence for random or stratified random selection to represent areas of commercial production (an implicit assumption required by the NAFTA calculation).
Chilli peppers
6 0.24 0.69 0.47 0.495 0 99 1.2 2 The MRL was estimated before the NAFTA estimate was calculated. 'n' is too small for the NAFTA calculator.
Cucurbits 8 0.01 0.048 0.019 0.01 5 X+3SD 0.06 0.07 The MRL was estimated before the NAFTA estimate was calculated. 'n' is too small for the NAFTA calculator. There are too many '< LOQ' values for the NAFTA calculator.
Durian 6 0.04 0.47 0.21 0.135 0 99 1.32 1 The MRL was estimated before the NAFTA estimate was calculated. 'n' is too small for the NAFTA calculator.

General Considerations 17
Statistical Calculation JMPR Commodity No. of Trials
Min. Value (mg/kg)
Max Value (mg/kg)
Mean (mg/kg)
STMR (mg/kg)
No. ≤ LOQ Distribution
Type Estimate (mg/kg)
MRL (mg/kg)
Comment/ Explanation
Grapes 18 0.01 0.09 0.028 0.01 10 X+3SD 0.11 0.2 The MRL was estimated before the NAFTA estimate was calculated. There are too many '< LOQ' values for the NAFTA calculator.
Leafy vegetables
12 0.01 0.52 0.11 0.066 1 UCLmed 0.48 0.7 The MRL was estimated before the NAFTA estimate was calculated. The data originate from lettuce trials in 4 countries. There is no evidence for random or stratified random selection to represent areas of commercial production (an implicit assumption required by the NAFTA calculation).
Leeks 8 0.01 0.03 0.015 0.01 4 X+3SD 0.04 0.05 The MRL was estimated before the NAFTA SC was used. 'n' is too small for the NAFTA calculator. There are too many '< LOQ' values for the NAFTA calculator.
Legume vegetables
12 0.01 0.45 0.19 0.22 3 X+3SD 0.69 0.7 The MRL was estimated before the NAFTA SC was used. The data originate from bean trials in one country. There is no evidence for random or stratified random selection to represent areas of commercial production (an implicit assumption required by the NAFTA calculation).

18 General Considerations
Statistical Calculation JMPR Commodity No. of Trials
Min. Value (mg/kg)
Max Value (mg/kg)
Mean (mg/kg)
STMR (mg/kg)
No. ≤ LOQ Distribution
Type Estimate (mg/kg)
MRL (mg/kg)
Comment/ Explanation
Litchi 6 0.25 0.79 0.50 0.495 0 99 1.16 2 The MRL was estimated before the NAFTA estimate was calculated. 'n' is too small for the NAFTA calculator.
Longan 6 0.25 0.47 0.33 0.3 0 99 0.54 2 The MRL was estimated before the NAFTA estimate was calculated. 'n' is too small for the NAFTA calculator.
Mango 6 0.09 0.35 0.20 0.19 0 99 0.61 0.7 The MRL was estimated before the NAFTA estimate was calculated. 'n' is too small for the NAFTA calculator.
Oilseeds 20 0.01 0.06 0.035 0.05 19 X+3SD 0.1 0.1 The MRL was estimated before the NAFTA estimate was calculated. There are too many '< LOQ' values for the NAFTA calculator.
Okra 6 0.01 0.2 0.095 0.08 0 UCLmed 0.92 0.5 The MRL was estimated before the NAFTA estimate was calculated. 'n' is too small for the NAFTA calculator.
Papaya 6 0.08 0.23 0.14 0.135 0 99 0.31 0.5 The MRL was estimated before the NAFTA SC was used. 'n' is too small for the NAFTA calculator.
Pea hay 10 0.24 1 0.44 0.37 0 99 1.09 2 The MRL was estimated before the NAFTA SC was used. The data originate from pea trials in 3 countries. There is no evidence for random or stratified random selection to represent areas of commercial production (an implicit assumption required by the NAFTA calculation).
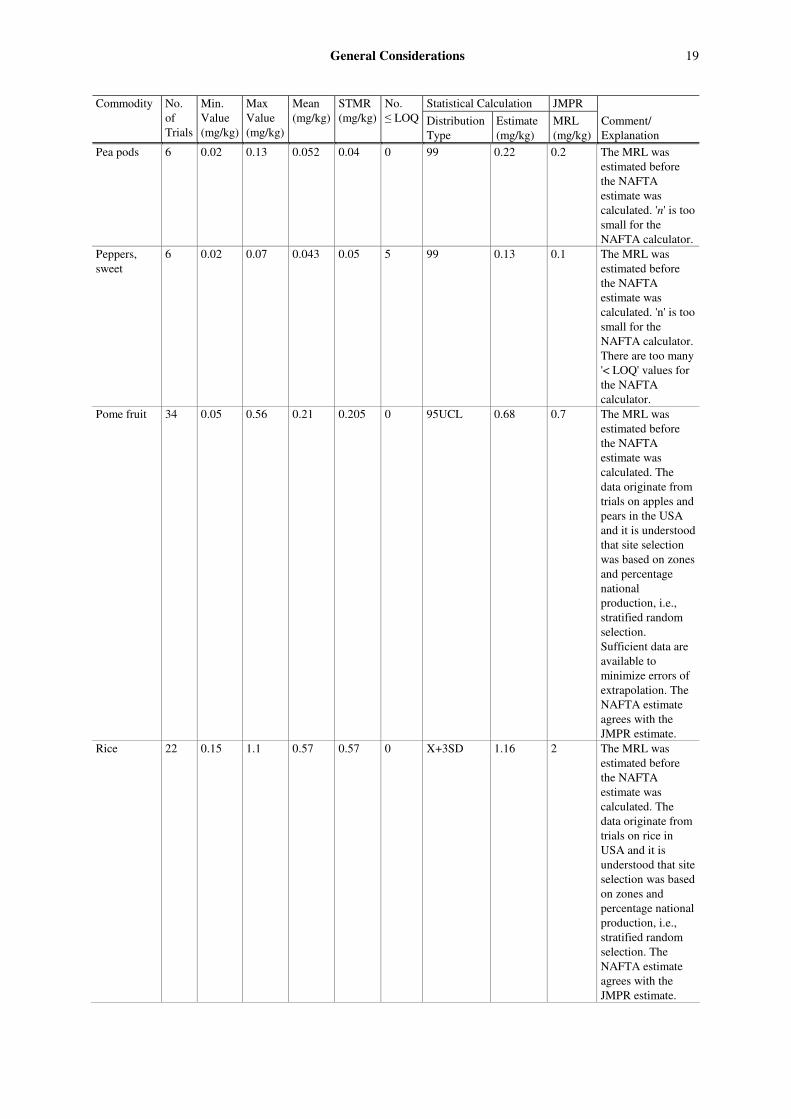
General Considerations 19
Statistical Calculation JMPR Commodity No. of Trials
Min. Value (mg/kg)
Max Value (mg/kg)
Mean (mg/kg)
STMR (mg/kg)
No. ≤ LOQ Distribution
Type Estimate (mg/kg)
MRL (mg/kg)
Comment/ Explanation
Pea pods 6 0.02 0.13 0.052 0.04 0 99 0.22 0.2 The MRL was estimated before the NAFTA estimate was calculated. 'n' is too small for the NAFTA calculator.
Peppers, sweet
6 0.02 0.07 0.043 0.05 5 99 0.13 0.1 The MRL was estimated before the NAFTA estimate was calculated. 'n' is too small for the NAFTA calculator. There are too many '< LOQ' values for the NAFTA calculator.
Pome fruit 34 0.05 0.56 0.21 0.205 0 95UCL 0.68 0.7 The MRL was estimated before the NAFTA estimate was calculated. The data originate from trials on apples and pears in the USA and it is understood that site selection was based on zones and percentage national production, i.e., stratified random selection. Sufficient data are available to minimize errors of extrapolation. The NAFTA estimate agrees with the JMPR estimate.
Rice 22 0.15 1.1 0.57 0.57 0 X+3SD 1.16 2 The MRL was estimated before the NAFTA estimate was calculated. The data originate from trials on rice in USA and it is understood that site selection was based on zones and percentage national production, i.e., stratified random selection. The NAFTA estimate agrees with the JMPR estimate.

20 General Considerations
Statistical Calculation JMPR Commodity No. of Trials
Min. Value (mg/kg)
Max Value (mg/kg)
Mean (mg/kg)
STMR (mg/kg)
No. ≤ LOQ Distribution
Type Estimate (mg/kg)
MRL (mg/kg)
Comment/ Explanation
Stone fruit 12 0.52 0.94 0.66 0.59 0 99 1.05 1 The MRL was estimated before the NAFTA estimate was calculated. ‘n’ is marginally too small for the NAFTA calculator and the lognormal probability plot is not ideal for extrapolation.
Straw and fodder of cereal grains
16 0.7 6.1 3.04 3.2 0 99 12.44 10 The MRL was estimated before the NAFTA estimate was calculated. The data originate from wheat trials in the USA, where it is understood that site selection was based on zones and percentage national production, i.e., stratified random site selection. The NAFTA estimate is higher than the JMPR estimate.
Strawberries 8 0.01 0.048 0.017 0.01 5 X+3SD 0.06 0.07 The MRL was estimated before the NAFTA estimate was calculated. 'n' is too small for the NAFTA calculator.
Sugar cane 9 0.01 0.17 0.05 0.05 6 99 0.39 0.2 The MRL was estimated before the NAFTA estimate was calculated. 'n' is too small for the NAFTA calculator.
Sugar cane 9 0.01 0.17 0.050 0.05 6 99 0.39 0.2 The MRL was estimated before the NAFTA estimate was calculated. 'n' is too small for the NAFTA calculator. There are too many '< LOQ' values for the NAFTA calculator.

General Considerations 21
Statistical Calculation JMPR Commodity No. of Trials
Min. Value (mg/kg)
Max Value (mg/kg)
Mean (mg/kg)
STMR (mg/kg)
No. ≤ LOQ Distribution
Type Estimate (mg/kg)
MRL (mg/kg)
Comment/ Explanation
Sugar cane 9 0.05 0.17 0.068 0.05 6 X+3SD 0.19 0.2 The MRL was estimated before the NAFTA estimate was calculated. 'n' is too small for the NAFTA calculator. There are too many '< LOQ' values for the NAFTA calculator.
Tomato 12 0.05 0.08 0.060 0.05 6 X+3SD 0.1 0.2 The MRL was estimated before the NAFTA estimate was calculated. There are too many '< LOQ' values for the NAFTA calculator.
CYHALOTHRIN (146) (includes lambda-Cyhalothrin) Citrus fruit 15 0.02 0.16 0.06 0.05 0 99th 0.16 0.2 Pome fruit 8 0.05 0.1 0.08 0.08 0 99th 0.15 0.2 There are too few
datapoints for NAFTA calculation
Cherries 10 0.05 0.18 0.12 0.13 0 99th 0.28 0.3 There are too few datapoints for NAFTA calculation
Peaches and apricots
14 0.02 0.33 0.11 0.1 0 99th 0.34 0.5 There are too few datapoints for NAFTA calculation
Plums 12 0.01 0.1 0.03 0.02 2 Mean+3xSD 0.15 0.2 There are too few datapoints to usethe NAFTA calculation
Berries and other small fruit
18 0.01 0.09 0.03 0.02 1 Mean+3xSD 0.13 0.2
Olives 12 0.03 0.42 0.17 0.13 0 99th 0.75 1 There are too few datapoints to usethe NAFTA calculation
Mango 5 0.01 0.07 0.03 0.03 0 99th 0.15 0.2 There are too few datapoints to usethe NAFTA calculation
Bulb vegetables
8 0.02 0.11 0.06 0.05 0 99th 0.15 0.2 There are too few datapoints to usethe NAFTA calculation
Flowerhead brassica
10 0.04 0.3 0.19 0.22 0 Mean+3xSD 0.5 0.5 There are too few datapoints to usethe NAFTA calculation

22 General Considerations
Statistical Calculation JMPR Commodity No. of Trials
Min. Value (mg/kg)
Max Value (mg/kg)
Mean (mg/kg)
STMR (mg/kg)
No. ≤ LOQ Distribution
Type Estimate (mg/kg)
MRL (mg/kg)
Comment/ Explanation
Head cabbages
6 0.01 0.17 0.08 0.08 0 99th 0.74 0.5 There are too few datapoints to usethe NAFTA calculation
Fruiting vegetables, Cucurbits
22 0.01 0.02 0.01 0.01 16 Mean+3xSD 0.02 0.05 There are too many datapoints < LOQ for NAFTA calculation
Fruiting vegetables, other than Cucurbits except mushrooms
37 0.01 0.18 0.05 0.03 8 Mean+3xSD 0.19 0.3 Difference HR-MRL considered not sufficient
Legume vegetables
23 0.01 0.11 0.03 0.02 5 Mean+3xSD 0.11 0.2
Pulses 33 0.01 0.05 0.01 0.01 32 not calculated
- 0.05 Too many datapoints < LOQ for NAFTA calculation
Root and tuber vegetables
15 0.01 0.01 0.01 0.01 15 not calculated
- 0.01* There are too many datapoints < LOQ for NAFTA calculation
Asparagus 6 0.01 0.01 0.01 0.01 0 not calculated
- 0.02 Too few datapoints for NAFTA calculation
Barley grain 29 0.01 0.33 0.04 0.02 3 Mean+3xSD 0.22 0.5 MRL recommended above HR
Maize grain 29 0.01 0.01 0.01 0.01 18 not calculated
- 0.02 Too many datapoints < LOQ for NAFTA calculation
Oats, rye, triticale and wheat grain
33 0.01 0.03 0.01 0.01 25 not calculated
- 0.05 There are too many datapoints < LOQ for NAFTA calculation
Rice grain 16 0.06 0.79 0.34 0.295 0 99th 1.33 1 Sugar cane 9 0.01 0.03 0.02 0.02 2 Mean+3xSD 0.04 0.05 There are too few
datapoints for NAFTA calculation
Oilseeds 16 0.01 0.15 0.02 0.01 10 Mean+3xSD 0.13 0.2 There are too many datapoint < LOQ for NAFTA calculation
Cereal straw and fodder, dry
16 0.17 1.6 0.7 0.54 0 99th 2.73 2
Almond hulls, dry
5 0.32 1.1 0.56 0.42 0 99th 1.55 2 There are too few datapoints for NAFTA calculation
DIMETHOATE (027) Peppers, sweet
5 0.03 0.26 0.1 0.06 0 UCL med 95th
0.52 0.5 There are too few data points for the NAFTA calculator
Lettuce. head
25 0.01 0.17 0.04 0.02 7 95th lognormal
0.33 0.3
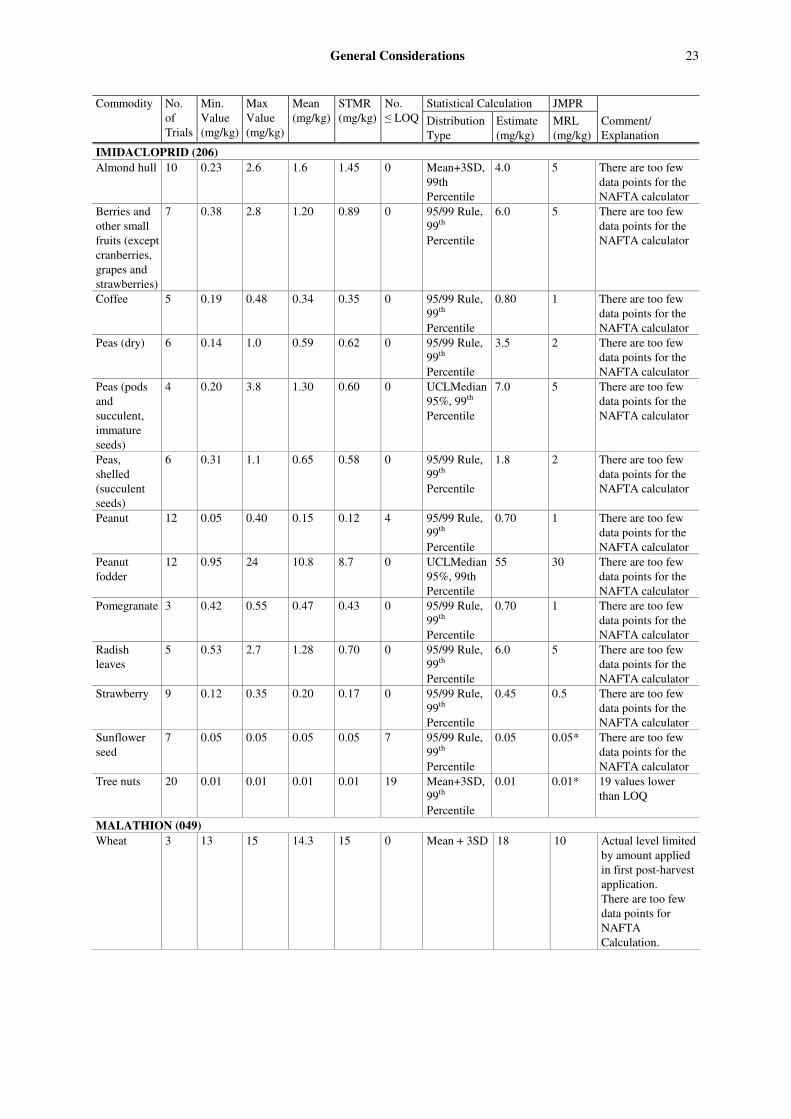
General Considerations 23
Statistical Calculation JMPR Commodity No. of Trials
Min. Value (mg/kg)
Max Value (mg/kg)
Mean (mg/kg)
STMR (mg/kg)
No. ≤ LOQ Distribution
Type Estimate (mg/kg)
MRL (mg/kg)
Comment/ Explanation
IMIDACLOPRID (206) Almond hull 10 0.23 2.6 1.6 1.45 0 Mean+3SD,
99th Percentile
4.0 5 There are too few data points for the NAFTA calculator
Berries and other small fruits (except cranberries, grapes and strawberries)
7 0.38 2.8 1.20 0.89 0 95/99 Rule, 99th Percentile
6.0 5 There are too few data points for the NAFTA calculator
Coffee 5 0.19 0.48 0.34 0.35 0 95/99 Rule, 99th Percentile
0.80 1 There are too few data points for the NAFTA calculator
Peas (dry) 6 0.14 1.0 0.59 0.62 0 95/99 Rule, 99th Percentile
3.5 2 There are too few data points for the NAFTA calculator
Peas (pods and succulent, immature seeds)
4 0.20 3.8 1.30 0.60 0 UCLMedian95%, 99th Percentile
7.0 5 There are too few data points for the NAFTA calculator
Peas, shelled (succulent seeds)
6 0.31 1.1 0.65 0.58 0 95/99 Rule, 99th Percentile
1.8 2 There are too few data points for the NAFTA calculator
Peanut 12 0.05 0.40 0.15 0.12 4 95/99 Rule, 99th Percentile
0.70 1 There are too few data points for the NAFTA calculator
Peanut fodder
12 0.95 24 10.8 8.7 0 UCLMedian95%, 99th Percentile
55 30 There are too few data points for the NAFTA calculator
Pomegranate 3 0.42 0.55 0.47 0.43 0 95/99 Rule, 99th Percentile
0.70 1 There are too few data points for the NAFTA calculator
Radish leaves
5 0.53 2.7 1.28 0.70 0 95/99 Rule, 99th Percentile
6.0 5 There are too few data points for the NAFTA calculator
Strawberry 9 0.12 0.35 0.20 0.17 0 95/99 Rule, 99th Percentile
0.45 0.5 There are too few data points for the NAFTA calculator
Sunflower seed
7 0.05 0.05 0.05 0.05 7 95/99 Rule, 99th Percentile
0.05 0.05* There are too few data points for the NAFTA calculator
Tree nuts 20 0.01 0.01 0.01 0.01 19 Mean+3SD, 99th Percentile
0.01 0.01* 19 values lower than LOQ
MALATHION (049) Wheat 3 13 15 14.3 15 0 Mean + 3SD 18 10 Actual level limited
by amount applied in first post-harvest application. There are too few data points for NAFTA Calculation.

24 General Considerations
Statistical Calculation JMPR Commodity No. of Trials
Min. Value (mg/kg)
Max Value (mg/kg)
Mean (mg/kg)
STMR (mg/kg)
No. ≤ LOQ Distribution
Type Estimate (mg/kg)
MRL (mg/kg)
Comment/ Explanation
MANDIPROPAMID (231) Broccoli 6 0.29 0.70 0.46 0.435 0 95/99 Rule 1.0 2 There are too few
datapoints to usethe NAFTA calculation
Cabbage, head
6 0.90 1.80 1.30 1.21 0 95/99 Rule 2.5 3 There are too few datapoints for NAFTA calculation
Celery 6 0.74 7.80 3.66 2.70 0 95/99 Rule and UCLMedian95th
25 20 There are too few datapoints for NAFTA calculation
Cucumber 7 0.01 0.07 0.02 0.02 0 99/95 Rule 0.15 0.2 There are too few datapoints for NAFTA calculation
Grapes 13 0.20 0.85 0.47 0.43 0 95/99 Rule 1.5 2 Rounded up Leafy vegetables
22 1.20 11.5 6.28 5.65 0 95/99 Rule 25 25 Agreed
Melons except watermelon
6 0.06 0.26 0.14 0.115 0 95/99 Rule 0.45 0.5 There are too few datapoints for NAFTA calculation
Onion, bulb 8 0.01 0.04 0.02 0.01 5 mean+3σ 0.05 0.1 There are too many values below LOQ
Peppers 9 0.04 0.38 0.17 0.12 0 95/99 Rule 0.80 1 There are too few datapoints for NAFTA calculation
Potatoes 17 0.01 0.01 0.01 0.01 17 Not calculated
- 0.01* All values below LOQ
Spring onion
3 0.25 1.74 0.82 0.48 0 95/99 Rule 6.0 7 There are too few datapoints for NAFTA calculation
Summer squash
5 0.02 0.08 0.05 0.04 0 95/99 Rule 0.20 0.2 There are too few datapoints for NAFTA calculation
Tomato 11 0.02 0.20 0.07 0.06 0 95/99 Rule 0.30 0.3 Agreed METHOMYL (094)
Apples 15 0.03 0.17 0.1 0.09 0 95/99 Rule 0.26 0.3 Grapes (wine)
11 0.01 0.2 0.09 0.09 0 Mean+3SD 0.24 0.3 There are too few data points for NAFTA calculation
Lettuce 16 0 0.07 0.02 0.01 8 95/99 Rule 0.09 0.2 50% < LOQ and HR almost twice the penultimate value
PROFENOFOS (171) Cotton seed
11 < 0.05 1.2 0.49 0.35 3 UCLMedian 2.5 3 There are too few data points for NAFTA calculation.
Mango 6 < 0.01 0.07 0.05 0.06 1 Mean+3SD 0.15 0.2 There are too few data points for NAFTA calculation.

General Considerations 25
Statistical Calculation JMPR Commodity No. of Trials
Min. Value (mg/kg)
Max Value (mg/kg)
Mean (mg/kg)
STMR (mg/kg)
No. ≤ LOQ Distribution
Type Estimate (mg/kg)
MRL (mg/kg)
Comment/ Explanation
Mangosteen 4 1.9 3.7 2.45 2.1 0 95/99 Rule 5.0 10 There are too few data points for NAFTA calculation.
Tomato 9 0.18 4.7 1.74 1.3 0 UCLMedian 9.0 10 There are too few data points for NAFTA calculation.
PROTHIOCONAZOLE (232) Barley, wheat straw
30 0.07 1.2 0.38 0.25 0 Log-normal 1.8 2 MRL estimated on dry weight basis, 7.4×Med would give 1.85
Peanut 12 0.02 0.02 12 0.02 Statistical methods are not applicable
Barley and wheat
32 0.01 0.02 0.01 28 0.05 28 values at or below 0.01. Statistical methods are not applicable
Rape seed 11 0.01 0.02 0.01 0.01 7 0.05 10 values at or below 0.01. Statistical methods are not applicable
SPINETORAM (233) Oranges 6 < 0.01 0.03 0.02 2 Mean+3SD 0.007 0.007 There are too few
data points for NAFTA calculation.
Apple 10 < 0.01 0.03 0.01 4 Mean+3SD 0.05 0.05 There are too few data points for NAFTA calculation. There are too many values below LOQ.
Tomato 6 < 0.01 0.03 0.01 2 99/95 Rule 0.06 0.06 There are too few data points for NAFTA calculation.
Leaf lettuce 6 0.15 7.80 1.58 0.33 0 Mean+3SD 11 10 There are too few data points for NAFTA calculation.
Sugar beet 6 < 0.01 < 0.01 0.01 6 0.01(*) There are too few data points for NAFTA calculation. There are too many values below LOQ.
Tree nuts 6 < 0.01 0.01 0.01 3Φ 0.01 There are too few datapoints to usethe NAFTA calculation. There are too many values below LOQ. MRL based on pecan trial results, supported by trials on almonds. ΦIn five trials, samples were

26 General Considerations
Statistical Calculation JMPR Commodity No. of Trials
Min. Value (mg/kg)
Max Value (mg/kg)
Mean (mg/kg)
STMR (mg/kg)
No. ≤ LOQ Distribution
Type Estimate (mg/kg)
MRL (mg/kg)
Comment/ Explanation
harvested earlier than required PHI.
SPIROTETRAMAT (234) Citrus 23 0.10 0.32 0.17 0.18 3 Mean+3SD 0.37 0.5 Pome fruit 18 0.04 0.49 0.15 0.13 0 LN99 0.65 0.7 Adequate n = 18. Stone fruit 6 0.68 1.6 1.3 1.3 0 Mean+3SD 2.19 3 There are too few
samples for NAFTA calculation. Supporting data from peaches and plums for cherry.
Grapes 15 0.06 1.0 0.37 0.32 0 LN99 1.50 2 Adequate n = 15. Flowering Brassica
8 0.08 0.39 0.19 0.16 0 LN99 0.69 1 There are too few samples for NAFTA calculation. Diversity in flowering Brassica.
Cucurbit 21 0.02 0.13 0.04 0.02 12 Mean+3SD 0.15 0.2 Excessive LOQ for NAFTA calculation.
Fruiting vegetables
8 0.27 0.76 0.43 0.40 0 LN99 0.93 1 Small field trial data set but substantial supporting data from greenhouse trials. There are too few samples for NAFTA calculation.
Leafy vegetables
10 0.61 5.0 2.5 2.8 0 Mean+3SD 6.95 7 Based on mustard green, but substantial supporting data from lettuce, spinach. There are too few samples for NAFTA calculation.
Potato 20 0.02 0.37 0.13 0.09 0 LN99 0.66 0.8 Adequate n = 20. Celery 8 0.26 2.4 0.81 0.42 0 Mean+3SD 3.33 4 There are too few
samples for NAFTA calculation.
Tree nuts 11 0.02 0.25 0.08 0.05 0 LN99 0.29 0.5 There are too few samples for NAFTA calculation.
Hops (dry) 4 2.2 4.9 3.9 4.25 0 LN99 8.85 15 Very small data set. Known variability in hops residues.
Almond hulls
6 1.3 4.7 3.4 4.05 0 LN99 10.55 10 There are too few samples for NAFTA calculation.

General Considerations 27
Statistical Calculation JMPR Commodity No. of Trials
Min. Value (mg/kg)
Max Value (mg/kg)
Mean (mg/kg)
STMR (mg/kg)
No. ≤ LOQ Distribution
Type Estimate (mg/kg)
MRL (mg/kg)
Comment/ Explanation
TEBUCONAZOLE (189)
Pome fruit 13 < 0.05 0.47 0.21 0.19 2 LN, 99th 0.82 1 Plums 22 < 0.02 0.12 0.06 0.06 5 LN, 99th 0.2 0.2 Elderberries 4 0.32 0.73 0.37 0 NA 2 There are too few
datapoints to usethe NAFTA calculation
Mango 8 < 0.05 <0.1 0.02 6 LN, 99th 0.24 0.1 Too few data points to use the SC 75% of the values < LOQ
Papaya 6 0.06 1.2 0.35 0.18 0 UPL Median 95th
2.07 2 There are too few datapoints to usethe NAFTA calculation
Leek 12 0.03 0.44 0.21 0.20 0 µ ± 3SD 0.5 1 There are too few datapoints to usethe NAFTA calculation
Garlic 7 < 0.02 0.06 0.03 0.02 4 µ ± 3SD 0.07 0.1 There are too few datapoints to usethe NAFTA calculation
Onions 11 < 0.02 0.06 0.04 0.05 8 µ ± 3SD 0.09 0.1 Too few data points to use the SC 73% of the values < LOQ
Brassicas 19 < 0.05 0.56 0.17 0.07 8 µ ± 3SD 0.66 1 42% of the values < LOQ
Melons 20 < 0.01 0.10 0.05 0.05 2 µ ± 3SD 0.12 0.2 There are too few datapoints to usethe NAFTA calculation
Watermelon 5 < 0.01 0.04 0.02 0.02 2 LN, 99th 0.08 0.1 There are too few datapoints to usethe NAFTA calculation
Sweet corn 4 < 0.01 4 NA 0.1 There are too few datapoints to usethe NAFTA calculation
Tomato 15 0.03 0.46 0.21 0.19 0 LN, 99th 1.06 1 Head lettuce 8 0.18 3.2 1.21 0.98 0 UPL Median
95th 8.8 5 There are too few
datapoints to usethe NAFTA calculation
Beans 8 0.12 1.2 0.51 0.49 0 LN, 99th 2.05 2 There are too few datapoints to usethe NAFTA calculation
Soya beans 28 < 0.01 0.06 0.03 0.02 7 µ ± 3SD 0.09 0.1 - Carrot 13 < 0.1 0.22 0.14 0.12 3 LN, 99th 0.28 0.5 23% of the values
< LOQ Artichoke 6 < 0.05 0.32 0.18 0.15 1 LN, 99th 0.73 0.5 Too few data
points to use the SC 16% of the values < LOQ
Barley 37 < 0.05 1.1 0.19 0.06 17 µ ± 3SD 1.08 2 46% of the values < LOQ

28 General Considerations
Statistical Calculation JMPR Commodity No. of Trials
Min. Value (mg/kg)
Max Value (mg/kg)
Mean (mg/kg)
STMR (mg/kg)
No. ≤ LOQ Distribution
Type Estimate (mg/kg)
MRL (mg/kg)
Comment/ Explanation
Rice 8 0.11 0.97 0.36 0.28 0 LN, 99th 1.5 2 There are too few datapoints to usethe NAFTA calculation
Maize 4 < 0.1 NA 0.1 There are too few datapoints to usethe NAFTA calculation
Peanut 19 < 0.01 0.08 0.04 0.04 13 µ ± 3SD 0.1 0.1 - Rape seed 26 < 0.05 0.28 0.09 0.09 3 LN, 95th 0.39 0.5 There are too few
datapoints to usethe NAFTA calculation
Coffee 5 0.02 < 0.1 3 NA 0.1 There are too few datapoints to usethe NAFTA calculation. 60% of the values < LOQ
Hops 8 5.8 21 11 9.65 0 LN, 95th 31.5 30 There are too few datapoints to usethe NAFTA calculation
Barley straw 36 0.16 19.3 3.6 2.5 0 LN, 95th 22.6 30 a 95LN is the 95% upper confidence bound on the point estimate of the 95th percentile.
99LN is the 99% point estimate.
UCL Median 95 is the 95th percentile of the upper confidence limit of the median value (50th percentile), assuming a coefficient of variation of 1 and a lognormal distribution. In such cases the 95th percentile is 3.9 times the median. The value is 3.9 times the upper confidence limit on the median.
Mean + 3 SD is the mean plus three standard deviations. According to the Chebychev Rule, at least 89% of measurements are within three standard deviations of the mean, and this is regardless of the shape of the frequency distribution.
Dw - dry weight, LOQ, limit of quantification; NA - NAFTA, SC – Statisical calculator, SD - Standard deviation

General Considerations 29
2.8 NATURE OF RESIDUE DATA POPULATIONS AND METHODS FOR COMBINING
RESIDUE TRIAL DATA SETS
The JMPR estimates maximum residue levels (indicated with mrl to distinguish from the Codex MRL) for use as Codex MRLs.16 The recommended maximum residue levels (mrl) are based on supervised trials reflecting the highest of the nationally recommended dosage and shortest pre-harvest intervals. The number of such trials is usually limited. In order to improve the reliability of the estimated supervised trial median residues (STMRs), the JMPR regularly combined those data sets which reflected similar use patterns and they appeared to come from similar residue populations, and verified the assumption with the Mann-Whitney U-test.17 The JMPR has recently been exploring the approach of combining data sets for estimation of mrls.
Statistical methods of mrl estimation generally aim to estimate a prescribed percentile value (e.g., 95th percentile) for the underlying population based on the available data. This involves making assumptions regarding the underlying distribution and estimating the range of residues beyond the observed values. In particular, care is required in selection of data which should be:
− from a single population or the equivalent of a single population;
− a random sample (or equivalent such as stratified random) from the population;
− available in sufficient number to provide some assurance about the data distribution and to minimize the errors of extrapolation required to estimate high percentiles.
The NAFTA Working Group published the final version of a method for the statistically based estimation of the MRLs.18 The Working Group stated that “when the sample size is 15 or larger, the calculated MRLs consistently provide narrower ranges”, and “if the data set has less than 10 data points, the MRL calculations ... are not very precise”.
An independent review of the NAFTA calculator noted that for small sample sizes the methods employed lead to “both poor theoretical grounding and poor simulation performance” which is “not surprising given the problem of extreme percentile of an unknown distribution based on a small sample is an extremely difficult one”. It was suggested that “rather than trying to modify the appropriate tolerance limit calculation so that its performance in small samples is less variable (and thus less appropriate), it is more sensible to simply place a lower limit on the allowable size of
16 Codex Alimentarius Procedural Manual: Codex maximum limit for pesticide residues (MRLP) is the maximum concentration of a pesticide residue (expressed as mg/kg), recommended by the Codex Alimentarius Commission to be legally permitted in or on food commodities and animal feeds. MRLs are based on GAP data and foods derived from commodities that comply with the respective MRLs are intended to be toxicologically acceptable.
Codex MRLs, which are primarily intended to apply in international trade, are derived from estimations made by the JMPR following:
(a) toxicological assessment of the pesticide and its residue; and
(b) review of residue data from supervised trials and supervised uses including those reflecting national good agricultural practices. Data from supervised trials conducted at the highest nationally recommended, authorized or registered uses are included in the review. In order to accommodate variations in national pest control requirements, Codex MRLs take into account the higher levels shown to arise in such supervised trials, which are considered to represent effective pest control practices. 17 In: Pesticide Residues in Food—2001. Report of the JMPR 2001, FAO Plant Production and Protection Paper, 167, p. 14 18 http://www.pmra-arla.gc.ca/english/pdf/mrl/calc2-eng.xls

30 General Considerations
samples to be used in mrl setting.” The review strongly recommended that no adopted methodology allow the setting of an MRL based on a sample of less than 15 observations.
The individual or combined residue data sets available for estimation of STMR or mrls typically vary from 3 to 50 or more (minimum of 1 to a maximum of 71). Figure 1 shows the frequency of the number of trials, from which the mrls were estimated by the JMPR from 2002 to 2007, excluding those trials with over 80% of non-detected residues.
Figure 1 Frequency of occurrence of data sets consisting of n residue values used by JMPR between 2002 and 2007
The figure indicates that most frequently the STMR/mrl estimates were based on 8 (61), 6 (47) and 9 (38) supervised trials, and data sets consisting of 9 or less trials represented 47.2% of the 551 cases studied.
In the majority of cases (70%) less than 15 relevant residue trials were available to JMPR for estimating an mrl. The number of available trials reflects the requirements of national regulators. The use of combined sets of observations, from related, but not identical, field trials (i.e., deriving from similar GAPs) may allow more reliable use of statistical methods for estimating mrls, as they consist of larger number of observations than the individual ones. However, the validity of mrl estimates based on combined data sets is reliant on the comparability of the information from the individual trials. The various data sets derived from supervised trials carried out in various countries or on similar crops cannot be automatically pooled together. The distribution of residue data shall be carefully examined and only those which may be expected to form the same populations should be combined.
The proper evaluation of residue data requires the understanding of the nature of residue populations and the limitations of the estimations based on small samples.

General Considerations 31
1. Nature of residue data populations
1.1 Between fields variability of residues
Due to the large number of factors affecting the distribution and magnitude of the residues within a field trial, the variability of residues among field trials in composite samples of typical size of 12–25 units is large (typical co-efficient of variation (CV) values are in the range of 60 to 110%19).
Statistical analysis of supervised trial data sets with minimum 15 residue values, evaluated by the JMPR between 1997 and 2007, indicates that in many cases (70% of 144 data sets) log-normality of the data sets cannot be excluded. Although this should not be taken as evidence that the underlying populations conform to log-normal distributions, the following discussion will proceed on the assumption of log-normality for residue populations.
Figures 2 and 3 illustrate the hypothetical log normal distribution of residues simulating thousands of supervised trials where a crop has been harvested at different times after application at the same rate, say 1 kg ai/ha. Table 2 contains the parameters of the distributions used for constructing the figures.
Table 2 Parameters used to generate the lognormal curves of hypothetical residues.
PHI (days) 7 14 21 28 All data Limited decline Mean ln(residue)a -0.78 -0.88 -0.98 -1.08 SD ln(residue) a 0.98 0.98 0.98 0.98 Median a 0.46 0.42 0.38 0.34 0.39 95th percentile a 2.30 2.08 1.88 1.70 2.00 Moderate decline Mean ln(residue) -0.78 -1.08 -1.38 -1.68 SD ln(residue) 0.98 0.98 0.98 0.98 Median 0.46 0.34 0.25 0.19 0.29 95th percentile 2.3 1.7 1.26 0.94 1.62
a Parameters of the hypothetical log-normal distribution
The graphs have been constructed to examine the case where the application rate is the same in two countries but the pre-harvest interval (PHI) is different, however the conclusions would equally apply to other situations (different application rate, same PHI; different application rate and different PHI).
The graphs can be thought of as the actual distribution of residues from which a small number of residue trial data are evaluated in MRL estimation. Although for each graph there is significant overlap in the distributions, each distribution has a different 95th percentile and could potentially lead to a different MRL recommendation for GAPs that have different PHI values.
In the first example (Figure 2) there is limited decline in residues with time, the median for residues at 7 days PHI is 0.46 mg/kg and at 28 days 0.34 mg/kg while the 95th percentiles are 2.3 and 1.7 mg/kg respectively. In the second example the decline in residues is moderate with median values of 0.46 mg/kg at 7 days and 0.19 mg/kg at 28 days while the 95th percentiles are 2.3 and 0.94 mg/kg respectively.
19 Ambrus A., 2000. Measurement of uncertainty in pesticide residue analysis: implications in legal limits, Ital. J. Food Sci. N. 3 vol 12. 259-278.

32 General Considerations
Limited decline
0
0.2
0.4
0.6
0.8
1
1.2
1.4
1.6
1.8
2
0 0.5 1 1.5 2 2.5
residue (mg/kg)
freq
uen
cy
7 days
14 days
21 days
28 days
Figure 2 Distribution of residues at different PHIs following treatment with a pesticide with limited decline in time
Under practical conditions the true distribution of the residues is not known, we can only estimate them from a small number of samples.
We may assume that a set of trials conducted at maximum label conditions is equivalent to a random sample taken from a large residue population resulted from the pesticide application according to maximum GAP that occur in typical farming practice. The set of such trials is then considered as a stratified random sample representing the agriculture practice where the maximum amount of pesticides (dosage rate, number of applications) were used at shortest PHI permitted by the national GAP. Thus the residues indicate their upper concentration range that may be present in marketed commodities treated according to the particular GAP.
In reality, many crops are treated with longer PHIs and/or lower application rates resulting in residues lower than the MRLs, as indicated by the results of market place monitoring programmes, where only a very small proportion of the marketed commodities contains residues close or above the MRL.

General Considerations 33
Moderate decline
0
0.5
1
1.5
2
2.5
3
3.5
0 0.5 1 1.5 2 2.5
residue (mg/kg)
freq
uen
cy
7 days
14 days
21 days
28 days
Figure 3 Distribution of residues at different PHIs following treatment with a pesticide with moderate decline in time
1.2 Variability of residues deriving from sampling
The inevitable variability of residues resulting from the wide dispersion of the residues within and among fields is illustrated with the results of random samples of size 4–50 drawn with replacement from a fixed parent population.
In the described process 1000 samples, consisting of either 50 or 30 residue values, were drawn with replacement from the parent population shown in the left column of Table 3. From the 1000 samples ordered according to their mean residue, the 975th (R0.975) and 25th (R0.025) samples were taken and their maximum, mean, median, minimum, CV and SD values were listed in the columns under R0.975 and R0.025. Similarly the parameters of samples ordered according to their median values are listed under columns P0.975 and P0.025.
Even when 1000 random samples, representing 50 and 30 residue trials (sample size), were drawn with replacement from a theoretical parent sample population with log-normal distribution and a CV value of 0.77, the characteristics of the populations showed substantial variation. The results are summarized in Table 3.

34 General Considerations
Table 3 Characteristic parameters of samples drawn with replacement from a log-normally distributed parent populations with a CV of 0.77
Parent population
Sample populations (1000 samples of n trials)
n = 10 000 n = 50 n = 50 n = 30 n = 30
Sample R0.97520 R0.025 P0.97521 P0.025 R0.975 R0.025 P0.975 P0.025 Max 25.21 13.54 16.14 11.14 16.14 19.39 9.60 14.08 8.05 Mean 3.52 4.32 2.82 3.84 2.87 4.59 2.63 3.22 2.90 Min 0.20 0.52 0.73 0.73 0.56 0.73 0.73 0.44 0.52 Median 2.78 3.55 2.39 3.47 2.19 2.96 2.37 2.46 2.07 CV 0.77 0.69 0.83 0.59 0.94 1.04 0.75 0.87 0.72 SD 2.717 2.973 2.350 2.253 2.705 4.782 1.959 2.802 2.077 Notes: Parent population consists of residues in samples taken from 10 000 trials
Columns marked with R0.975 and R0.025 show the maximum, mean, median and minimum co-efficient of variation and standard deviation for the dataset representing the 97.5th and 2.5th percentile of residues in 1000 samples, each with n = 30 or 50 residue values, ordered according to their average residues. The columns P0.975 and P0.025 show the same parameters of samples ordered according to their median
The range of R0.025 and R0.975 encompasses the values obtained from samples corresponding to the 2.5% and 97.5% of the sample populations (covering the 95% centre portion of the of the sample population)
When small number of trials (4–10 data points) is sampled from the same parent population, the variability in individual sample mean, median, maximum and minimum residues is larger and show inverse relationship with the square root of sample size.
The expectable variation is demonstrated with the 66 trial data obtained with tolylfluanid on tomato. 22 As the range of residues measured as parent tolylfluanid and the sum of the parent compound and its metabolite (DMST) was very similar, for this example the 33 residue values for tolyfluanid have been combined with the 33 values for the sum of tolyfluanid and DMST, in order to obtain a reasonably large realistic data set used as parent population for simulation of sampling. Table 4 shows the individual residue values for samples that represent the 2.5th and 97.5th percentile of 1000 data sets ordered first according to their median residues and then sets having the same median values were ordered by their maximum residue values.
20 R0.975 refers to the individual dataset that is at rank represented by the 97.5th percentile when datasets are ordered by average. 21 P0.975 refers to the individual dataset that is at rank represented by the 97.5th percentile when datasets are by ordered median 22 In: Pesticide Residues in Food—2002. Report of the JMPR 2002, FAO Plant Production and Protection Paper, 172.

General Considerations 35
Table 4 Residues in data sets obtained with random sampling from a parent population of 66 residue values
N Percentile Individual residues in the relevant data set P.025 0.05 0.05 0.19 0.49
4 P.975 0.18 0.4 1.27 1.4 P.025 0.05 0.07 0.14 0.14 0.48
5 P.975 0.07 0.27 0.67 0.77 1.27 P.025 0.07 0.15 0.15 0.18 0.27 0.56
6 P.975 0.05 0.42 0.47 0.77 0.77 0.99 P.025 0.04 0.08 0.1 0.15 0.22 0.24 0.6 0.72
8 P.975 0.18 0.4 0.54 0.59 0.59 0.67 1.5 1.5 P.025 0.05 0.07 0.15 0.15 0.16 0.23 0.47 0.5 0.54 0.67
10 P.975 0.14 0.29 0.34 0.35 0.54 0.59 0.6 0.7 1.4 2.2
Table 5 includes the characteristic parameters of the original residue population (66 data points) called parent population and the samples covering the 95% range of sample populations (between 2.5th and 97.5th percentiles).
Comparing the estimated maximum residue levels based on the NAFTA and the traditional JMPR procedures indicates the uncertainty of the estimation based on small number of residue data points (samples). For instance, there is 95% probability that we may get random samples from the same ‘true’ parent data population leading to an estimated mrl ranging from 1–6 mg/kg for sample size of 5 or from 1.5–3.5 for sample size of 10 with NAFTA method and 0.5–2 and 1–3 with the JMPR procedure for the same samples.
The large inevitable variation of residues in small samples underlines the importance of proper selection of valid residue data which form the data base for the estimation of the mrls, especially in those cases where statistically based estimation of mrls is aimed, for instance, by applying the NAFTA calculation method.
Table 5 Characteristic values of original supervised residue data set and those of 1000 samples of size n withdrawn from the original residue data
Residues in samples a Estimated MRLs n Percentile
Max Med Mean Min NAFTA JMPR 66 2.20 0.370 0.452 0.040 1.8 2 3
P.025 0.49 0.120 0.195 0.050 1.3 1.5 0.7 4
P.975 1.40 0.835 0.813 0.180 6 6 2 P.025 0.48 0.140 0.176 0.050 1 1 0.5
5 P.975 1.27 0.670 0.610 0.070 6 6 2 P.025 0.56 0.165 0.230 0.070 1 1 0.7
6 P.975 0.99 0.620 0.578 0.050 1.6 2 2 P.025 0.72 0.185 0.269 0.040 1.3 1.5 1
8 P.975 1.50 0.590 0.746 0.180 3.5 3.5 2 P.025 0.67 0.195 0.299 0.050 1.3 1.5 1
10 P.975 2.200 0.565 0.715 0.140 3.5 3.5 3
Notes: a The values presented represent the 95% range of the 1000 small samples
The maximum observed median and mean values of all data are indicated with bold and the minimum values are with bold-italics numbers

36 General Considerations
2. Principles of selection of residue data for estimation of mrls
2.1 Estimation based on the residues derived from the maximum (one) GAP
In accordance with the Codex definitions and general practice of the JMPR, the mrls are primarily estimated based on the GAP that leads to the highest residue (ONE GAP, the critical or maximum
GAP), i.e., the trials represent the maximum residue anticipated when a pesticide is applied according to the one GAP (label directions, usually maximum permitted application rate, shortest PHI). The Codex Alimentarius definition (JMPR practice) implies that only the results of “supervised trials conducted at the highest nationally recommended, authorized or registered use” are included in mrl estimation (i.e., one maximum GAP per country, one of these is used to select data for mrl estimation).
The focus on one GAP allows for alternative GAP to be assessed if there is an identified dietary intake problem.
As a general precondition, for reliable estimation of maximum residue levels an adequate number of independent trials are required which reflect the national maximum GAP and conducted according to well designed protocols that consider geographical distribution and the inclusion of a number of different growing and management practices, and growing seasons.
Maximum residue level estimates may be based on an accepted/recognized extrapolation of trial data to cover commodities within a group which had shown similar residue pattern. Application should be made using equipment and spray volumes likely to give rise to the highest residues. As weather (not climate) is usually the major factor in determining the resultant residues for such trials, only one field trial would normally be selected per trial site if multiple plots/trials are conducted in parallel.
The decline rate of a pesticide may be different at various geographical locations depending on, among others, the weather, cultivation mode and soil conditions. Under practical conditions the number of trials which can be performed for a given commodity is limited. On the other hand, a larger data set representing statistically not different residue population provides more accurate estimation of the selected percentile than a small data set derived from trials representing the critical GAP but only if the data are not biased by missing a segment of the underlying population such as might occur if data were from a single season and from the same region, and consequently did not reflect the actual range of growing conditions and management practices.
Consequently, where only limited number of trial data is available from the ‘ONE’ GAP assumed to lead to the highest magnitude of residues, one approach is to consider those GAPs which may possibly lead to similar magnitude of residues, and this assumption can be confirmed based on prior experience and with suitable statistical methods described in section 3.
2.2 Consideration of all trials conducted at various maximum GAPs
As an alternative to the selection of the ONE GAP described in section 2.1, the other possibility would be to include all trials in the residue data set used for estimation of mrls provided that residues are derived from trials conducted with maximum dosage rate at shortest PHI permitted by any relevant national maximum GAP.
Though, from global trade prospective such an approach may better reflect the residue population in traded commodities, this method leads to two conceptual problems as it would include residue data with significantly lower median (mean) values, which would result in lower estimated daily intake than that obtained from the residues reflecting the highest GAP, and lower MRLs if the latter one would be calculated with the NAFTA procedure.
The effect of combining all residues deriving from any maximum GAP is illustrated with an example:

General Considerations 37
Lets assume that the data set A, showing lognormal distribution (0.050, 0.060, 0.070, 0.100, 0.130, 0.140, 0.140, 0.140, 0.160, 0.170, 0.210, 0.210, 0.230, 0.270, 0.270, 0.280, 0.290, 0.330, 0.340, 0.340, 0.380, 0.380, 0.410, 0.440, 0.490, 0.500, 0.570, 0.570, 0.680, 0.680, 0.730, 0.800, 0.840, 0.860, 0.900, 0.900, 0.900, 0.910, 0.920, 1.060, 1.070, 1.170, 1.210, 1.360, 1.430, 1.480, 1.800, 1.890, 1.990, 3.550) would be combined with additional low residue values (15×0.05 and 16×0.10) representing a different maximum GAP. The estimated maximum residues based on 95UCL calculation would be 3.51 mg/kg and 2.24 (based on California mean+3×SD), respectively, leading to mrl estimates of 4 mg/kg and 2.5 mg/kg, regardless that the maximum valid residue value is 3.55 mg/kg. The median values would be 0.5 mg/kg and 0.17 mg/kg, respectively.
Combination of such data is clearly inappropriate as the deterministic approach used for estimation of daily intake aims to identify the highest residue level, which a certain portion of the world populations might be exposed to.
The above approach would also contradict with one of the purposes of Codex MRLs as MRLs for trade and it would also be unfair to growers of a country with critical GAP if the estimated mrl would be much lower than the residues expected after applying the pesticide at maximum GAP.
It should be noted that:
1. there is a subtle difference in the two selection procedures and the mrl recommendations will differ. In scenario 1 with data set A, the residues at the high end of the distribution dominate and this leads to an estimation of a larger mrl value. In scenario 2, adding trials with low residues, as occurs when datasets are combined, gives a smaller estimate for the 95th percentile even though the highest residue remains the same;
2. the mrl estimated with the NAFTA method may also be different where similar data sets are combined due to the different calculation methods used depending on the size of the sample and the distribution of residues.
3. In special cases where residues do not show evidence of decline and do not scale with application rate, such as triadimefon/triadimenol in grapes (JMPR 2007) it may be appropriate to consider wider range of GAPs.
3. Statistical methods for deciding on the similarity of data sets
As it was shown in section 1, the inevitable sampling variation may lead to an inaccurate estimation of the true residue population resulted from the use of a pesticide according to maximum GAP. The NAFTA statistical procedure for estimation of mrls claimed to provide reasonable estimates based on samples larger than 15, and the estimation becomes more precise if it is based on larger residue data sets.
Under practical conditions such number of trials reflecting the critical GAP is rarely available; one approach is to combine similar data sets. While similarity of data is extremely difficult to assess statistically and should primarily be based on other scientific criteria, tools are available that can be used to ascertain if data sets come from populations characterized by similar median/mean and variance.
In view of the skewed distribution of residues and the difficulties of describing the residue distribution with parametric methods, distribution free statistical methods should be applied for testing the similarity of sample populations.
The JMPR routinely applied the Mann-Whitney U test for comparing two data sets before they were combined. However, there are cases where more than two data sets should be compared. In such cases the U-test is not applicable, and the so called Kruskal-Wallis H-test may be used. It assumes that the samples are taken from continuous populations of similar shape, the errors in individual residue values are independent. Thus, if the null hypothesis is rejected we do not know whether the median values, the shape or the variance of the tested populations are different. It is

38 General Considerations
applicable for k independent samples, provided that the data sets are not too small (≥ 4). For the purpose of the test, samples are independent if the supervised trials had been carried out at different sites.
The null hypothesis, H0, is that the k independent sets of samples were taken from the same parent population. The calculation is illustrated in Table 5 with the example of deltamethrin residues in leafy vegetables (2002 JMPR) and performed as follows:
4. Mark, with different colours and or letters, the residue values belonging to the k data sets consisting of Ni residue values to enable the distinction of data sets from each other.
5. Combine the residues from the k data sets in one data set consisting of N=∑Ni residue data, and arrange the residues in ascending order.
6. Determine the rank number of individual residues (ri) giving the same rank for the same residue values (ties) and calculate the sum of the ranks (Ri) for each data set.
7. Calculate the H statistics and the correction factor (Cf) for the ties.
)1(3)1(
12
1
2
+−
+= ∑
=
NNN
Hk
i i
i
NR
NN
TC
jj
f−
−=
∑31
Where Tj= t3-t, and t is the number of ties. For instance the residue values of 0.03 occur twice, so t =2 and Tj = 23 - 2 = 6. The value of 0.1 occurs 5 times, so t = 5 and Tj = 53 – 5 = 120.
8. Calculate the corrected Hc value:
CH
f
C
H=
9. The Hc value follows χ2 (chi square) distribution with ν = k-1 degrees of freedom. If
Hc ≤ χ20.05,ν the null hypothesis is retained, which indicates that the tested residue populations are not significantly different and can be combined for the estimation of mrls.
The critical χ20.05 values are:
ν 2 3 4 5 6 χ
20.05 5.9915 7.8147 9.4877 11.0705 12.5916

General Considerations 39
Table 6 Illustration of the calculations for Kruskal-Wallis test for comparison of multiple independent samples
Independent residue data sets All residues
Corrected ranks
Corrected rank numbers for sample sets
Ties Tj
Curly kale
Lettuce Spinach
Curly kale
Lettuce Spinach
No of data
8 10 16 34 34 8 10 16
Sum of ranks, Ri
595 160 215.5 219.5
Ri3/Ni 3200 4644.02 3011.27
0.07 0.07 0.03 0.03 1.5 1.5 2 6 0.08 0.12 0.03 0.03 1.5 1.5 0.1 0.13 0.04 0.04 3 3 0.11 0.15 0.06 0.06 4 4 0.32 0.18 0.08 0.07 5.5 5.5 2 6 0.32 0.18 0.09 0.07 5.5 5.5 0.34 0.25 0.09 0.08 7.5 7.5 2 6 0.39 0.26 0.1 0.08 7.5 7.5 0.29 0.1 0.09 9.5 9.5 2 6 0.41 0.1 0.09 9.5 9.5 0.1 0.1 13 13 5 120 0.14 0.1 13 13 0.17 0.1 13 13 0.2 0.1 13 13 0.5 0.1 13 13 1 0.11 16 16 0.12 17 17 0.13 18 18 0.14 19 19 0.15 20 20 0.17 21 21 0.18 22.5 22.5 2 6 0.18 22.5 22.5 0.2 24 24 0.25 25 25 0.26 26 26 0.29 27 27 0.32 28.5 28.5 2 6 0.32 28.5 28.5 0.34 30 30 0.39 31 31 0.41 32 32 0.5 33 33 1.0 34 34 17 156
The performance of the Kruskal-Wallis test is facilitated by an Excel template, which performs the calculations for 7 data sets after inserting the residues composing of the data sets and arranging the ranks corrected for ties for each sample set.
The ranks are corrected for ties accurately if the sum of corrected ranks is equal to the total number of samples.

40 General Considerations
4. Recommendations
The Meeting confirms the applicability of its current practice and emphasizes the importance of the following principles:
1. Only the results of “supervised trials conducted at the highest nationally recommended, authorized or registered uses” should be considered in mrl estimation (i.e., maximum GAP per country)
2. Where prior experience indicate that the agricultural practice and climatic conditions lead to similar residues the critical GAP of one country can be applied for the evaluation of supervised trials carried out in another country.
3. Statistical calculations in support for mrl estimation should only be used where the data are suitable for those data to yield valid conclusions. Considerations should include:
o data from a single population or the equivalent of a single population;
o the data should be from a random sample or stratified random sample from the population; and
o sufficient data (≥ 15) should be available to minimize the errors of extrapolation to the required high percentile values;
o the number of residue values below the LOQ and the residue distribution around LOQ;
o no statistical test should be applied for excluding potential outliers; residue data should only be excluded if experimental evidence indicates that the data is invalid.
4. If a sufficient number of trials is available reflecting the maximum GAP of one country or geographical region, the mrl estimates should be based those residue data alone.
5. When considering combining different residue data, the distribution of residue data shall be carefully examined and only those datasets combined which may be expected to arise from the same parent populations based on comparable GAP. The expert judgement (see also point 6) could be assisted with appropriate statistical tests (e.g., Mann-Whitney U-test or Kruskal-Wallis H-test)
6. The focus on one GAP allows for alternative GAP to be assessed if there is an identified dietary intake problem. In such cases, where residue data permits, an alternative national GAP is considered and the supporting residue data sets are used for estimation of mrls which do not raise acute intake concern.
7. In cases, where only small number of residue data are available, mrl estimates should take into account:
o the highest values, median value and approximate 75th percentile value in the available data set of supervised residue trials;
o residue levels resulting from application rates other than the label rate (for instance, using residues below LOQ in samples derived from double rate treatments to support no detectable residues following the application at maximum label rate, using highest residues from samples taken at longer intervals than PHI);
o experience of typical distributions of residue data from supervised trials;
o knowledge of residue behaviour from the metabolism studies (e.g., is it a surface residue, does it translocate from foliage to seeds, roots, etc.); and
o knowledge of residue trials on comparable crops.
8. The Meeting does not consider it appropriate to combine residue data sets deriving from different GAPs without sufficient justification. This method would include residue data with

General Considerations 41
different median (mean) values, which would result in lower estimated daily intake and also lower mrls if the latter would be calculated with the NAFTA statistical calculator.
9. There may be some situations which are not covered by the general principles outlined in this section. Such cases require a casa-by-case consideration and expert judgement based on all available information and prior experience.
10. Principles used for the evaluation of data sets for one pesticide-commodity combination may be applied for evaluation of residues within one commodity group (e.g., application of ‘one GAP’ principle for estimating mrl for a group based on the highest residues data set obtained in one commodity).
2.9 EVALUATION FOR FOLLOW-UP CROPS
The JMPR 2006 recommended the CCPR to request member countries to provide information on how residues in follow crops are regulated at the national level. This information will be taken into account in making recommendations based on the evaluation of residues in follow crops.
In member countries which provided information (Australia, the EU, Japan and the United States) residues in follow crops are regulated either by setting specific MRLs for “other plant commodities or crop groups” according to the residue definition for primary treated crops or by setting label restrictions on the type of succeeding crops and/or the plant back interval after harvest. The Meeting recognized that neither approach is applicable for the JMPR, since label restrictions are limited to national authorisations and MRLs for “other plant commodities” are currently not supported by the Codex classification system for foods and animal feeds.
For an estimation of possible residues in follow crops the Meeting must rely on the information provided. In 2006 the JMPR emphasized that in cases where residues in follow crops may occur at levels above the LOQ, in addition to the minimum data requirements as specified in the FAO Manual, the data submitters should automatically provide information on metabolism in root or tuber vegetables, environmental fate studies and the results of field studies on follow crops carried out at various times after the application of the pesticide.
Field studies on follow crops in particular provide important information for an estimation of possible residues levels under more realistic conditions. By comparing these residues with results obtained from supervised residue trails on primary treated crops (if available) a decision can be made if the recommended maximum residue levels are also sufficient for commodities from follow crops including theoretical additional treatments with the same active substance in subsequent years.
More realistic maximum residues expected in succeeding crop groups (e.g., root and tuber vegetables, leafy vegetables or cereals) can be estimated based on an extrapolation from the representative follow crops used in the field studies. For such an extrapolation the metabolism in rotational crops as well as the aerobic metabolism in soil must be investigated sufficiently. The estimation of residues level must be based on the maximum annual application rate according to the labels provided, the residue definition for enforcement purposes proposed for plant commodities and the residue data for representative crops obtained from follow field studies. In addition the interval between last treatment and the crop rotation must be taken into account when considering the degradation rate in soil under field conditions, in order to estimate a realistic concentration of the active ingredient in the soil at the planting/sowing of the following crops.
As an example, chlorantraniliprole (5.6) evaluated by JMPR 2008 various studies on follow crops were provided to the Meeting conducted according to the maximum seasonal application rate.
For the leafy vegetables group investigated in lettuce, spinach and Swiss chard residues found were in the range of < 0.01 to 0.01 mg/kg. In comparison to the group maximum residue level

42 General Considerations
recommended for leafy vegetables of 20 mg/kg no significant contribution to total residues in these commodities by follow-crops is expected by the Meeting.
Root and tuber vegetables gave residues ranging from < 0.01 up to 0.01 mg/kg in turnip, beet and radish roots. Under consideration of the maximum residue level recommended for root and tuber vegetables of 0.01 mg/kg, the Meeting decided to combine residues from direct treatment and follow-crops to recommend a maximum residue level of 0.02 mg/kg and an STMR of 0.01 mg/kg for root and tuber vegetables.
Cereals are not registered for direct treatment using chlorantraniliprole according to the labels provided. In follow crop studies, residues in cereal grain, forage and straw/hay of up to < 0.01, 0.083 and 0.15 mg/kg were found, respectively. Based on this data the Meeting recommended maximum residue levels and STMR values of 0.02 and 0.01 mg/kg for cereal grain and 0.3 and 0.051 mg/kg (dry-weight based) for straw and fodder of cereal grain, respectively. For cereal straw and hay also a highest residue of 0.17 mg/kg (dry-weight based) was recommended. For cereal forage an STMR of 0.022 mg/kg and a highest residue of 0.083 mg/kg were used in the livestock animal’s dietary burden.
For pulses only two data points from follow crop studies with detections below the LOQ of 0.01 mg/kg were available. The Meeting considered two trials on pulses to be inadequate for the purpose of estimating maximum residue levels.
No trials on residues in follow crops were available on brassica vegetables, stalk and stem vegetables, legume vegetables, bulb vegetables, oilseeds, grass/pasture and legume animal feeds. No recommendations were given for commodities of these crop groups.
In view of the purpose of these studies the Meeting pointed out that all information obtained is utilized in estimating the maximum residues in follow crop commodities after treatment of the primary crops according to the GAP. In most cases the data provided are not intended for an estimation of median residues in plant commodities used in the dietary risk assessment or livestock animal dietary burden resulting in an overestimation of the exposure.
The Meeting also noted that several special cases for residues in follow crops besides the normal agricultural farming exist. Examples may be the transfer of carbendazim from treated cereal straw used as substrate for fungi cultivation or clopyralid in manure and compost made from cattle excreta. In these special cases where an unexpected transfer into follow crops is observed, data submitters as well as member countries are encouraged to submit additional data suitable to assess residues in these commodities. Helpful data might be transfer studies for the individual scenario as well as monitoring data for commodities without authorizations for direct treatment.
2.10 SELECTION OF REPRESENTATIVE COMMODITIES WHEN ESTABLISHING
COMMODITY GROUP MRLS
The Codex Classification of Foods and Animal Feeds is being revised by CCPR with one of the aims being to facilitate the establishment and interpretation of Codex MRLs.
In 2007, JMPR reported on ‘Crop groups and commodity group MRLs’. The proposed draft revision of the Codex Classification of Foods and Animal Feeds was an agenda item of the 2008 session of the CCPR. The agenda item included a proposal for guidance on the selection of representative commodities.23
23 Codex Alimentarius Commission. Report of the 40
th Session of the Codex Committee on Pesticides Residues,
14–19 April 2008, Hangzhou, China, (ALINORM 08/31/24). Draft document outlining the principles of and guidance on the selection of representative crops for the purpose of extrapolation of MRLs. The selection of representative commodities, principles and guidance. Addendum II to CX/PR 08/40/4.

General Considerations 43
The document (CX/PR 08/40/4) provided advice to JMPR about the use of representative crops and commodities for the purposes of residue extrapolation to commodity groups. Suggestions are based on practices from JMPR, USA, EU and Japan.
Ideally, groupings should be chosen so that members of the crop group, or sub-group, would be subject to the same GAP and the resultant commodities would form a group, or sub-group, with similar residue characteristics.
Representative crops and commodities should then be chosen according to their commercial importance and their residue characteristics.
The most important crop from a commercial perspective may not be the most important from a residue perspective. For example, Chilli peppers because of their size, normally have a higher residue than sweet peppers for the same GAP and are likely to drive a peppers MRL. However, a group MRL should not generally be established on the basis of data from a minor crop only.
The Meeting noted that the selection of representative crops and corresponding commodities for particular crop and commodity groups would be very valuable to proponents planning residue trials.
JMPR evaluates available data, whether on a ‘representative’ commodity or not. In estimating a group MRL, JMPR includes available data, if valid and sufficient, from all commodities whether potentially representative or not. Residue behaviour cannot always be predicted, and therefore the residue data driving the group MRL will not necessarily arise from suggested ‘representative’ commodities.
The Meeting looked forward to further progress with commodity grouping and representative commodities. Careful attention to grouping will assist the JMPR to propose group MRLs more often.
2.11 PROPORTIONALITY OF PESTICIDE RESIDUE CONCENTRATIONS AND
APPLICATION RATES IN SUPERVISED TRIALS
JMPR often receives residue data from supervised trials on crops where the application rates in the trials do not match the GAP rate. Maximum residue level estimates are based on trials with application at the GAP rate. Applications at other rates are commonly used as additional evidence and context for the GAP trials. However, it would be advantageous to make more direct use of the data if possible.
The Meeting was aware of research work on ‘proportionality’, including the work reported at the IUPAC Congresses in 199824 and 2006.25 Conclusions were drawn from JMPR residue data summaries. Also, side-by-side trials were initiated in USA. Until now, the data analysed have included only foliar uses of insecticides and fungicides.
Before the results of such work can be applied to residue evaluation, it is important to examine the conditions where proportionality is valid and where it is not. For example, proportionality may not apply to the use of herbicides or plant growth regulators on crops because the different application rates may have different effects on the crop.
Where proportionality is valid, the residues from trials other than the GAP rate could be adjusted to values equivalent to the GAP rate.
24 Banasiak U, Hohgardt K, Koinecke A, Plass R and Moll E. 1998. Extrapolation of residue data - based on the RUEDIS Information System. Abstract. IUPAC International Congress on Pesticide Chemistry, London, August 1998. 25 Villanueva P and Hamilton DJ. 2006. Is the resulting residue proportional to pesticide application rate? Abstract. IUPAC International Congress on Pesticide Chemistry, Kobe, August 2006.

44 General Considerations
The Meeting invited research workers to publish their findings in the scientific literature and to describe the boundary conditions where ‘proportionality’ has been validated. This would provide a basis for JMPR and national authorities to make more use of non-GAP rate trials in residue evaluation.

Responses to CCPR 45
3. RESPONSES TO SPECIFIC CONCERNS RAISED BY THE CODEX COMMITTEE ON
PESTICIDE RESIDUES (CCPR)
3.1 CARBARYL (008)
The insecticide carbaryl was last evaluated by the 2002 JMPR within the periodic review programme. The Meeting concluded that the IESTI for children exceeded the ARfD (130–1100% for several crops). The 40th Session of the CCPR26 reiterated the decision by the 39th CCPR (Para 42 of Alinorm 08/31/24) to return to Step 6 the draft MRLs for cherries; citrus fruits; citrus juice; citrus pulp, dry; dried grapes (=currants, raisins and sultanas); grape juice; grape pomace, dry; grapes and stone fruits, awaiting the outcome of the 2008 JMPR evaluation.
The Meeting noted that the 2002 JMPR did not report an intake concern for citrus fruits.
Updated GAP information was provided by The Netherlands and United States. The GAP from the Netherlands could not be matched with any trial data. The updated US GAP was the same as previously reported by the 2002 JMPR. The sponsor announced that no additional data would be submitted; the evaluation was then rescheduled to the 2008 JMPR.
Results of supervised residue trials on crops
Citrus fruits
The GAP in USA for citrus is up to 8 applications of 2.42 to 8.4 kg ai/ha, with a maximum of 22.4 kg ai/ha per season and 5 days PHI.
Supervised trials reported by the 2002 JMPR performed according to maximum GAP resulted in highest residues of 10, 5.5 and 6.8 mg/kg in orange, lemon and grapefruit, respectively. The calculated short-term intakes based on the highest residue of 1.16 mg/kg in pulp estimated by the 2002 JMPR for children and adults consuming orange and grapefruit are 40% and 20% of the ARfD of 0.2 mg/kg, respectively. Mandarin and lemon short-term intake for children was estimated as 20% and 10% of the ARfD.
Based on the available information the Meeting concluded that there was no need to consider an alternative GAP for citrus fruits and processed products prepared from them.
Cherries
For stone fruit including cherries, the available supervised trials were performed according to the maximum US GAP only. No alternative GAP or new trial data was made available.
Consequently the Meeting could make no new proposals for stone fruits or cherries.
Grapes
Similarly, trials performed in grapes reflected the maximum US GAP. No alternative GAP or trial data were made available to the Meeting. Consequently the Meeting could make no new proposal for grapes.
26 Codex Alimentarius Commission. Report of the 40
th Session of the Codex Committee on Pesticides Residues,
14–19 April 2008, Hangzhou, China, (ALINORM 08/31/24)

46 Responses to CCPR
3.2 LAMBDA-CYHALOTHRIN (146)
Background
At the 40th Session of the CCPR,27 the delegation of the European Community (EC) raised concerns regarding the ADI and ARfD for lambda-cyhalothrin, established by JMPR in 2007 on the basis of neurotoxic effects.28 The ADI and ARfD established by the EC were both lower than the values established by the JMPR.
Evaluation of lambda-cyhalothrin by the JMPR
In 2007, the JMPR established a group ADI for cyhalothrin and lambda-cyhalothrin of 0–0.02 mg/kg bw on the basis of neurotoxicity observed in a study of acute toxicity in rats given lambda-cyhalothrin orally (decreased motor activity), with a threshold dose of 0.5 mg/kg bw; and in repeat-dose studies with cyhalothrin and lambda-cyhalothrin in dogs treated orally (ataxia, tremors, occasionally convulsions) with a NOAEL of 0.5 mg/kg bw per day, using a safety factor of 25. Because lambda-cyhalothrin is relatively rapidly absorbed and excreted and the neurotoxic effects are rapidly reversible and dependent on Cmax, the Meeting considered it appropriate to adjust the safety factor for the reduced variability in Cmax compared with AUC.
In 2007 the JMPR established a group ARfD for cyhalothrin and lambda-cyhalothrin of 0.02 mg/kg bw on the basis of systemic neurotoxicity (decreased motor activity) observed in a study of acute toxicity in rats given lambda-cyhalothrin orally with a threshold dose of 0.5 mg/kg bw per day; and in repeat-dose studies with cyhalothrin and lambda-cyhalothrin in dogs treated orally, in which neurotoxic effects (ataxia, tremors, occasionally convulsions) occurred during the first week, within a few hours after treatment, with an overall NOAEL of 0.5 mg/kg bw per day, and using an safety factor of 25. For the same reasons as described above, the JMPR considered it appropriate to adjust the safety factor for the reduced variability in Cmax compared with AUC.
Evaluation of lambda-cyhalothrin by the EC
The ADI established by the EC for lambda-cyhalothrin (0.005 mg/kg bw) was based on the NOAEL of 0.5 mg/kg bw per day, identified in 1-year and 26-week studies in dogs, on the basis of clinical signs of neurotoxicity observed at 3.5 mg/kg bw per day, and using a safety factor of 100.
In the EC evaluation, the ARfD for lambda-cyhalothrin (0.0075 mg/kg bw) was based on the NOAEL of 0.75 mg/kg bw per day, obtained from a 6-week study in dogs treated orally, on the basis of neurotoxicity observed at 1.5 mg/kg bw per day, and a safety factor of 100. For both the ADI and the ARfD, the EC considered that an extra safety factor could be necessary when undertaking a risk assessment for children.
Comment by the JMPR
The JMPR and the EC identified the same overall NOAEL for neurotoxicity as the basis for the ADI. The difference between the ADI established by the EC and that established by the JMPR is determined by the safety factor used. The EC used the default safety factor of 100, while the JMPR considered that it was appropriate and scientifically justified in this case to adjust the safety factor for these substances that are rapidly absorbed and excreted and have effects that are rapidly reversible
27 Codex Alimentarius Commission. Report of the 40
th Session of the Codex Committee on Pesticides Residues,
14–19 April 2008, Hangzhou, China, (ALINORM 08/31/24). 28 In: Pesticide Residues in Food—2007. Report of the JMPR 2007, FAO Plant Production and Protection Paper, 191. Lambda cyhalothrin (146), pp 91–98.

Responses to CCPR 47
and dependent on Cmax, compared with AUC.29 Thus, the kinetic portion of the inter- and intraspecies safety factors was reduced by half, yielding an overall safety factor of 25 (see general item 2.6 of the present report)
The difference between the ARfDs established by the EC and by the JMPR can be explained by the different studies used as a basis for this decision and the different safety factors used. The ARfD established by the EC for lambda-cyhalothrin was based on a NOAEL of 0.75 mg kg bw per day identified on the basis of tremors observed at 1.5 mg/kg bw per day in a 6-week pilot study in dogs treated orally. JMPR noted that in this study each dosing group comprised only one male and one female. In view of this limitation, JMPR did not identify a NOAEL from this study and did not consider it to be appropriate to establish the ARfD on the basis of the results of this study. The studies that formed the basis for the ARfD established by the JMPR are described above.
The reasoning behind the choice of safety factor for the ARfD used by the JMPR was the same as for the ADI. The JMPR considered that there were no indications for increased sensitivity of children to acute or long-term oral exposure to lambda-cyhalothrin. Therefore, JMPR considered that the applied safety factor of 5 for intraspecies variation was adequate to protect all sensitive groups, including children.
3.3 FLUSILAZOLE (165)
Background
At the 40th Session of the CCPR, the delegation of the European Community (EC) raised concerns regarding the ARfD for flusilazole established by the JMPR in 2007 on the basis of developmental effects (Annex 5, reference 191), the ARfD established by the EC differing from that established by JMPR
Evaluation of flusilazole by the JMPR
In 2007, the Meeting established an ARfD for flusilazole of 0.02 mg/kg bw based on the NOAEL of 2 mg/kg bw per day for skeletal variations in a study of developmental toxicity in rats treated orally, with a safety factor of 100. The lowest-observed-adverse-effect level (LOAEL) for embryo and fetal toxicity was identified as 10 mg/kg on the basis of a higher incidence of skeletal variations – extra cervical ribs. The incidence of rudimentary cervical ribs was slightly, but not statistically significantly, increased at 2 mg/kg bw per day (3 fetuses out of 3 litters, 4 fetuses out of 4 litters, 9 fetuses out of 6 litters, 27 fetuses out of 15 litters, and 141 fetuses out of 22 litters in the groups at 0, 0.5, 2, 10, 50 mg/kg bw per day, respectively).
Evaluation of flusilazole by the EC
The ARfD established by the EC, described in the EC review report as being relevant to women of childbearing age, was established on the basis of the same study of developmental toxicity in rats as used by the JMPR, but was based on a NOAEL of 0.5 mg/kg bw per day, resulting in an ARfD of 0.005 mg/kg bw. The EC considered that the non-statistically significant increase in rudimentary cervical ribs at 2 mg/kg bw per day was treatment-related and an adverse effect, as it represented the beginning of a dose–response relationship. The EC also identified two additional developmental effects at 2 mg/kg bw per day that the JMPR considered to be maternal effects, and not adverse effects at that dose. The first effect was an increase in red vaginal discharge (0, 0, 3, 12 and 22 out of
29 In: Pesticide Residues in Food—2000. Report of the JMPR 2000, FAO Plant Production and Protection Paper, 163. Annex 5. page 198

48 Responses to CCPR
25 rats at 0, 0.5, 2, 10 or 50 mg/kg bw per day, respectively) and the second was an increase in mean placental weight (0.54, 0.57, 0.67, 0.87 and 0.99 g at 0, 0.5, 2, 10 and 50 mg/kg bw per day, respectively). In both cases, statistical significance was achieved at doses of 2 mg/kg bw per day and above. The red vaginal discharge occurred late in gestation and was not associated with adverse reproductive outcomes in the three dams at 2 mg/kg bw per day.
Comment by the JMPR
The JMPR and the EC identified the same critical effects in the same study of developmental toxicity as being the basis for the ARfD. The primary differences in the JMPR and EC assessments were the identification of the NOAEL for skeletal variations and the inclusion by the EC of the placental weights and vaginal discharge as critical effects. The JMPR considered that vaginal discharge late in gestation and changes in placental weights at 2 mg/kg bw per day were not toxicologically significant effects, and were not the result of a single exposure. The identification of the NOAEL for skeletal variations by the JMPR was reconfirmed on the basis of the lack of statistical significance.
3.4 OXAMYL (126)
At the 40th Session of the CCPR, the delegation of Ireland raised concerns regarding the ARfD for oxamyl, established by the JMPR in 2002. The ARfD of 0.001 mg/kg bw established by the EC was based on a study in rats. This ARfD differed from that set by the JMPR, 0.009 mg/kg bw, which was based on a study in humans. The EC as a policy does not accept data from studies in humans as a basis for setting health-based guidance values (e.g., ARfD) for plant-protection products.
The difference in the respective ARfDs is due to differences in policy with respect to the use of data from studies in humans, not to any differences in the data evaluated or their interpretation. The Meeting reaffirmed the basis of the ARfD established by the JMPR in 2002.
Evaluation for Alternative GAP
Oxamyl was evaluated for residues and toxicology by the JMPR in 2002 under the periodic review programme, where a residue definition was established as the sum of oxamyl and oxamyl oxime, expressed as oxamyl (for both animal and plant commodities). However the 2002 Meeting noted that for dietary intake estimation, this definition could result in an overestimate of the dietary intake calculations because the only residue of toxicological concern was the parent compound (oxamyl).
The 2002 JMPR estimated short-term intakes that exceeded the ARfD of 0.009 mg/kg bw for apple, cucumber, grapefruit, lemon, mandarin, melons, oranges, peppers and tomato.
At the 39th Session of the CCPR in 2007, the Committee requested JMPR to consider using alternative GAPs to recommend lower MRLs for citrus; cucumber; melon and pepper and at the 40th Session the CCPR (2008) noted that additional data would be available to support an alternative GAP assessment for tomato.
Information on current and proposed GAPs, analytical methods and new supervised trials data were submitted to the 2008 JMPR for citrus fruits (orange and mandarin), cucurbits (cucumbers, courgettes, melons), peppers and tomatoes.
The Meeting noted that while the accepted residue definition included both the parent compound and its oxime metabolite, the method used in the new supervised trials reported only the parent compound (oxamyl).
Bridging studies were reported to the meeting on the relative concentrations of oxamyl (parent compound) and total oxamyl (i.e., oxamyl plus oxamyl-oxime) in sweet peppers and lettuce following drip irrigation treatments to support the extrapolation of the oxamyl results reported in the

Responses to CCPR 49
new supervised field trials to total oxamyl residues (this being the residue definition for MRL compliance).
In the plant metabolism studies reviewed by the 2002 JMPR, relative concentrations of oxamyl and oxamyl-oxime were measured in a tobacco plant 3 weeks after being transplanted into soil treated with oxamyl (6 mg/kg). Residues of the oxamyl-oxime were present at about 70% of the oxamyl residues (i.e., a total oxamyl/oxamyl ratio of 1.7).
In the bridging studies on lettuce and sweet peppers following five soil drip irrigation treatments, the ratio of total oxamyl/oxamyl residues ranged from 1.1 to 2.6 in lettuce sampled 0–7 days after the last application and from 5.5 to 35 in peppers sampled 1–28 days after the last application.
The Meeting concluded that these studies were insufficient to extrapolate residue values for oxamyl alone to total oxamyl residues in citrus fruits, cucurbits, peppers and tomatoes and concluded there was insufficient data to support alternative GAP assessments for these commodities.

Dietary Risk Assessment 51
4. DIETARY RISK ASSESSMENT FOR PESTICIDE RESIDUES IN FOODS
At the present Meeting, compounds with recommended maximum residue levels and estimated STMRs were assessed for risks associated with long-term dietary intake. International estimated daily intakes (IEDIs) were calculated by multiplying the concentrations of residues (STMRs and STMR-Ps) by the average estimated daily per capita consumption for each commodity on the basis of the 13 GEMS/Food Consumption cluster diets.30 IEDIs are expressed as a percentage of the ADI for a 55 kg or 60 kg person, depending on the cluster diet.
The percentages are rounded up to one whole number up to nine and to the nearest 10 above that. Percentages above 100 should not necessarily be interpreted as giving rise to a health concern because of the conservative assumptions used in the assessments.
Hexythiazox was evaluated toxicologically at the current Meeting under the periodic re-evaluation programme, with the previous ADI confirmed. The long-term dietary risk assessment for this compound will be considered at a subsequent Meeting’s periodic review of residues.
The assessment for boscalid was not conducted, as STMR values could not be estimated for plant commodities due to a lack of data on follow crops. Consequently a complete dietary risk assessment could not be performed.
The evaluations of bifenazate, carbaryl, chlorpropham, diphenylamine, oxamyl and spinosad performed at this Meeting do not supersede the long-term dietary assessments conducted by previous Meetings of the JMPR for these compounds.
An ADI for prothioconazole was established by the present Meeting. As this parent compound is present in food commodities at very low levels, the residue definition for dietary intake assessment is:
prothioconazole-desthio metabolite only for plant commodities;
prothioconazole-desthio plus its 3- and 4-hydroxy derivatives and their conjugates, expressed as prothioconazole-desthio in animal commodities.
Therefore, the long-term dietary risk assessment for prothioconazole was based on prothioconazole-desthio residues and the relevant ADI.
The triazole fungicide metabolites 1,2,4-triazole, 1,2,4-triazolyl-3-alanine and 1,2,4-triazole-1-yl- acetic acid have been considered by the present Meeting following recommendation from the 2007 Meeting of the JMPR (General Consideration 2.3). ADIs were established for 1,2,4-triazole and for 1,2,4-triazolyl-3- alanine/1,2,4-triazole-1-yl acetic acid. These ADIs are intended to provide future guidance in the event these metabolites are found as residues in food commodities. No long-term dietary risk assessment was performed.
A summary of the long-term dietary risk assessments conducted by the present Meeting is presented in Table 7. The detailed calculations of long-term dietary intakes are given in Annex 3. Calculations of dietary intake can be further refined at the national level by taking into account more detailed information, as described in the Guidelines for predicting intake of pesticide residues.31
30 http://www.who.int/foodsafety/chem/gems/en/index1.html 31 WHO (1997) Guidelines for predicting dietary intake of pesticide residues. 2nd Revised Edition, GEMS/Food Document WHO/FSF/FOS/97.7, Geneva

52 Dietary Risk Assessment
Table 7 Summary of long-term dietary of risk assessments conducted by the 2008 JMPR
CCPR code Compound Name
ADI (mg/kg bw) Range of IEDI as % of maximum ADI
229 Azoxystrobin 0–0.2 2–10
173 Buprofezin 0–0.009 0–9
096 Carbofuran 0–0.001 20–70
230 Chlorantraniliprole 0–2 0
146 Cyhalothrin/lambda cyhalothrin 0–0.02 3–10
118 Cypermethrin (includes alpha and zeta cypermethrin)
0–0.02 5–20
027 Dimethoate 0–0.002 20–100
035 Ethoxyquin 0–0.005 0–40
206 Imidacloprid 0–0.06 1–5
049 Malathion 0–0.3 0–3
231 Mandipropamid 0–0.2 0–3
094 Methomyl 0–0.02 0–3
171 Profenofos 0–0.03 1–10
232 Prothioconazole a
Prothioconazole-desthio 0–0.01 0–1
233 Spinetoram 0–0.05 0–1
234 Spirotetramat 0–0.05 1–10
189 Tebuconazole b 0–0.03 1–8 a Based on prothioconazole-desthio b The assessment includes residues at MRL level for some commodities
Assessment of risk from short-term dietary intake
Available consumption data was reviewed at the present Meeting to assess the risks associated with short-term dietary intake for compounds with estimated STMR and HR values and established acute reference doses (ARfDs). The procedures for calculating the short-term intake were defined primarily in 1997 at an FAO/WHO Geneva Consultation32, then refined both at the International Conference on Pesticide Residues Variability and Acute Dietary Risk Assessment sponsored by the Pesticide Safety Directorate, and at subsequent JMPR Meetings.
Data on the consumption of large portions were provided to GEMS/Food by the governments of Australia, France, The Netherlands, Japan, South Africa, Thailand, the UK and the USA. Data on unit weights and per cent edible portions were provided to GEMS/Food by the governments of Belgium, France, Japan, Sweden, the UK and the USA. The body weights of adults and children aged ≤ 6 years were provided to GEMS/Food by the governments of Australia, France, the Netherlands, South Africa, Thailand, the UK and the USA. The consumption, unit weight and body weight data used for the short-term intake calculation were compiled by GEMS/Food.33 The documents are dated April, 2008 (large portions and body weights) and May, 2003 (unit weights). The procedures used for calculating the International Estimated Short-term Intake (IESTI) are described in detail in Chapter 3
32 WHO (1997) Food consumption and exposure assessment of chemicals. Report of a FAO/WHO Consultation. Geneva, Switzerland, 10–14 February 1997, Geneva 33 http://www.who.int/foodsafety/chem/acute_data/en/

Dietary Risk Assessment 53
of the 2003 Report of the JMPR. Detailed guidance on the setting of ARfD is described in Section 2.1 of the 2004 Report of the JMPR.34
On the basis of data received by the present or previous Meetings, JMPR considered the establishment of an ARfD to be unnecessary for azoxystrobin, bifenazate, boscalid, chlorantraniliprole, hexythiazox, mandipropamid, spinetoram, spinosad and the triazole fungicide metabolites 1,2,4-triazoyl-3-alanine and 1,2,4-triazole-1-yl-acetic acid. Therefore, it was not necessary to estimate the short-term intakes for these compounds.
An ARfD for 1,2,4-triazole was established by the present Meeting (0.3 mg/kg bw). This ARfD should provide guidance for future consideration when residues of this metabolite are found in traded food commodities. No short-dietary intake assessment was performed.
An ARfD for prothioconazole (only for women of childbearing age) was established by the present Meeting. However, as the residue definition for dietary intake does not include the parent compound (see previous section), the short-term dietary assessment was based on prothioconazole-desthio residues and that compounds ARfDs (see Table 8).
The evaluations of bifenazate, chlorpropham, diphenylamine and oxamyl performed at this Meeting do not supersede the short-term dietary intake assessments conducted by previous Meetings of the JMPR for these compounds.
The short-term intake of tebuconazole was estimated by the present Meeting, however the need for an ARfD has not yet been considered by the JMPR. Therefore, the short-term risk assessment for this compound could not be finalized.
The short-term intakes as percentages of the ARfDs for the general population and for children are summarized in Table 8. The detailed calculations of short-term dietary intakes are given in Annex 4.
Table 8 Summary of short-term dietary risk assessments conducted by the 2008 JMPR
Percentage of ARfD
CCPR code
Compound Name ARfD (mg/kg bw)
Commodity General population
Children aged ≤ 6 years
008 Carbaryl 0.2 All 3–20 10–40
096 Carbofuran 0.001 Banana Cucumber Cantaloupe Mandarins Milks Orange Potato Summer squash Sweet corn on the cob Other commodities
320 510 230 90 190 130 180 360 120 0–40
760 830 700 190 430 290 390 810 280 0–70
173 Buprofezin 0.5 All 0–1 0–3
05 Ethoxyquin 0.5 Pear 20 50
171 Profenofos 1 All 0–6 0–10
146 Cyhalothrin/ lambda cyhalothrin
0.02 All 0–40 0–60
118 Cypermethrin (includes alpha and zeta cypermethrin)
0.04 All 0–40 0–90
34 In: Pesticide Residues in Food–2004. Report of the JMPR 2004, FAO Plant Production and Protection Paper, 178. Rome, Italy, 20–29 September 2004
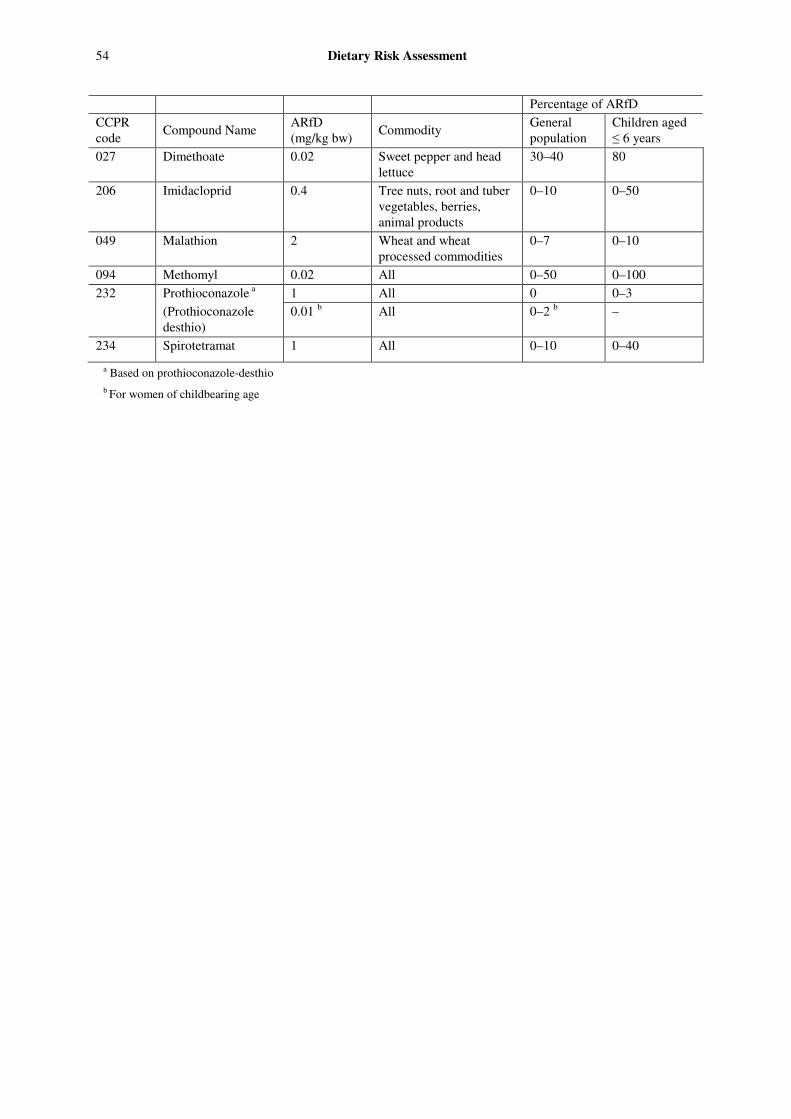
54 Dietary Risk Assessment
Percentage of ARfD
CCPR code
Compound Name ARfD (mg/kg bw)
Commodity General population
Children aged ≤ 6 years
027 Dimethoate 0.02 Sweet pepper and head lettuce
30–40 80
206 Imidacloprid 0.4 Tree nuts, root and tuber vegetables, berries, animal products
0–10 0–50
049 Malathion 2 Wheat and wheat processed commodities
0–7 0–10
094 Methomyl 0.02 All 0–50 0–100
232 Prothioconazole a 1 All 0 0–3
(Prothioconazole desthio)
0.01 b All 0–2 b –
234 Spirotetramat 1 All 0–10 0–40
a Based on prothioconazole-desthio b For women of childbearing age

Recommendations 365
6. RECOMMENDATIONS
GENERAL CONSIDERATIONS
Comments on a pilot process for JMPR to recommend maximum residue levels prior to national
government registration
The present Meeting acknowledged the importance of retrospective analyses of toxicity databases for pesticides and recommended that the WHO Core Assessment Group on Pesticide Residues of the JMPR or a working group established by the WHO Joint Secretariat of the JMPR could serve a valuable role in the review of these analyses that are conducted by national/supranational bodies. The JMPR would provide an independent international opinion on the scientific robustness and transparency of these analyses, make suggestions on how they may be improved, and provide comment on the implications of the results. If multiple analyses by different countries have been or will be conducted, the JMPR could also make recommendations on how to harmonize the approach and interpretation of the results. Retrospective analyses may be submitted to the JMPR/WHO Joint Secretariat for consideration by national authorities or other organizations or by the OECD Working Group on Pesticides. The analyses would need to be made available to the WHO Core Assessment Group at least 6 months before the JMPR annual meeting normally held in September and such analyses would need to be well documented (i.e., not anonymized, if possible).
The Meeting also recommended that the JMPR take on a pilot process and thus asked the JMPR/WHO Joint Secretariat to liaise with the OECD Working Group on Pesticides to identify a suitable retrospective analysis.
Comments on OECD Draft Guidance Document for Derivation of an Acute Reference Dose
The Meeting recommended that the OECD guidance document should address only oral exposure. The issues associated with setting ARVs for inhalation and dermal exposure, including route-to-route extrapolation methods, should be moved to a separate guidance document or to an annex attached to the current document.
The Meeting also noted that the provision of more guidance on issues relating to assessment of acute risk would improve both the WHO and the OECD guidance on setting of acute reference doses (ARfDs).
The global assessment of chlorantraniliprole (particularly the accompanying reporting table with the reviewer comments) was helpful for the preparation of the JMPR monograph on this pesticide.
In summary, some suggestions are listed below that might make the global assessment more useful for the JMPR:
− Decrease the level of methodological detail provided.
− Reduce the level of reporting of inconsequential findings.
− Continue to give details of comments and responses by participants.
− If possible, separate critical discussion points from minor issues in the reporting table.

366 Recommendations
EVALUATION OF DATA FOR ACCEPTABLE DAILY INTAKE AND ACUTE DIETARY
INTAKE FOR HUMANS, MAXIMUM RESIDUE LEVELS AND SUPERVISED TRIAL
MEDIAN RESIDUE VALUES
Triazole derivative metabolites
The Meeting recommended that the ADI and ARfD values established for these triazole metabolites may be used in risk assessment on a case-by-case basis, depending on the residue and toxicity profile of the parent compound. The Meeting also noted that these values may also be useful in a combined risk assessment, depending on the exposure situation, including whether exposure to these metabolites comes from more than one source of the parent conazoles.

367
7. FUTURE WORK
The items listed below should be considered by the Meeting in 2010 and 2011. The compounds listed include those recommended as priorities by the CCPR at its 41st and earlier sessions and compounds scheduled for re-evaluation within the CCPR periodic review programme.
Updated calls for data are available at least ten months before each JMPR meeting from the web pages of the Joint Secretariat:
http://www.fao.org/ag/AGP/AGPP/Pesticid/
http://www.who.int/ipcs/food/en/
2010 JMPR
Toxicological evaluations Residue evaluations
New compounds
Clopyralid Clopyralid
Clothianidin Clothianidin
Cyproconazole Cyproconazole
Dicamba Dicamba
Emamectin benzoate Emamectin benzoate
Etoxazole Etoxazole
Flubendiamide Flubendiamide
Meptyldinocap Meptyldinocap
Thiamethoxam Thiamethoxam
Periodic re-evaluations
Vinclozolin (159) Vinclozolin (159)
Dithianon (028) 2011R Azinphos-methyl (002) 2007T
Fenbutatin oxide (109) 2011R Chlorothalonil (081) 2009T
Cadusafos (174) 2009T
Bifenthrin (178) 2009T
Cycloxydim (179) 2009T
Evaluations
Fenpyroximate (193) – re-evaluate data for grapes following JMPR recommended new ARfD.
Difenoconazole (224) – review of alternative GAP (banana – higher MRL; additional MRLs (green beans and passion fruit)

368 Future work
Triazophos (143) – residue evaluation in edible
portion (soya bean – immature seeds); cereals including. Rice
Endosulfan (032) – Tea green/black
2011 JMPR
Toxicological evaluations Residue evaluations
New Compounds
Periodic re-evaluations
Diquat (031) Diquat (031)
Etofenprox (184) Etofenprox (184)
Dichlorvos (025) Dithianon (028) 2010T
Fenpropathrin (185) Fenbutatin oxide (109) 2010T

Annex 1 369
ANNEX 1: ACCEPTABLE DAILY INTAKES, SHORT-TERM DIETARY INTAKES,
ACUTE REFERENCE DOSES, RECOMMENDED MAXIMUM RESIDUE LIMITS AND
SUPERVISED TRIALS MEDIAN RESIDUE VALUES RECORDED BY THE 2008 MEETING
The following extracts of the results of the annual Joint FAO/WHO Meeting on Pesticide Residues (JMPR) are provided to make them accessible to interested parties at an early date.
The Meeting evaluated 28 pesticides, of which 6 were new compounds, and 5 were re-evaluated within the periodic review programme of the Codex Committee on Pesticide Residues (CCPR). The Meeting established acceptable daily intakes (ADIs) and acute reference doses (ARfDs).
The Meeting estimated maximum residue levels, which it recommended for use as maximum residue limits (MRLs) by the CCPR. It also estimated supervised trials median residue (STMR) and highest residue (HR) levels as a basis for estimation of the dietary intake of residues of the pesticides reviewed. Application of HR levels is explained in the report of the 1999 Meeting (section 2.4). The allocations and estimates are shown in the table.
Pesticides for which the estimated dietary intakes might, on the basis of the available information, exceed their ADIs are marked with footnotes, as explained in detail in the report of the 1999 Meeting (section 2.2). Footnotes are also applied to specific commodities when the available information indicated that the ARfD of a pesticide might be exceeded when the commodity was consumed. It should be noted that these distinctions apply only to new compounds and those re-evaluated within the CCPR periodic review programme.
The table includes the Codex reference numbers of the compounds and the Codex classification numbers (CCNs) of the commodities, to facilitate reference to the Codex maximum limits for pesticide residues (Codex Alimentarius, Vol. 2B) and other documents and working documents of the Codex Alimentarius Commission. Both compounds and commodities are listed in alphabetical order.
Apart from the abbreviations indicated above, the following qualifications are used in the Table.
* (following name of pesticide) New compound
** (following name of pesticide) Compound reviewed within CCPR periodic review programme
* (following recommended MRL) At or about the limit of quantification
HR-P Highest residue in a processed commodity, in mg/kg, calculated by multiplying the HR in the raw commodity by the processing factor
Po The recommendation accommodates post-harvest treatment of the commodity.
PoP (following recommendation for processed foods (classes D and E in the Codex classification)
The recommendation accommodates post-harvest treatment of the primary food commodity.
STMR-P An STMR for a processed commodity calculated by applying the concentration or reduction factor for the process to the STMR calculated for the raw agricultural commodity.
W (in place of a recommended MRL)
The previous recommendation is withdrawn, or withdrawal of the recommended MRL or existing Codex or draft MRL is recommended.
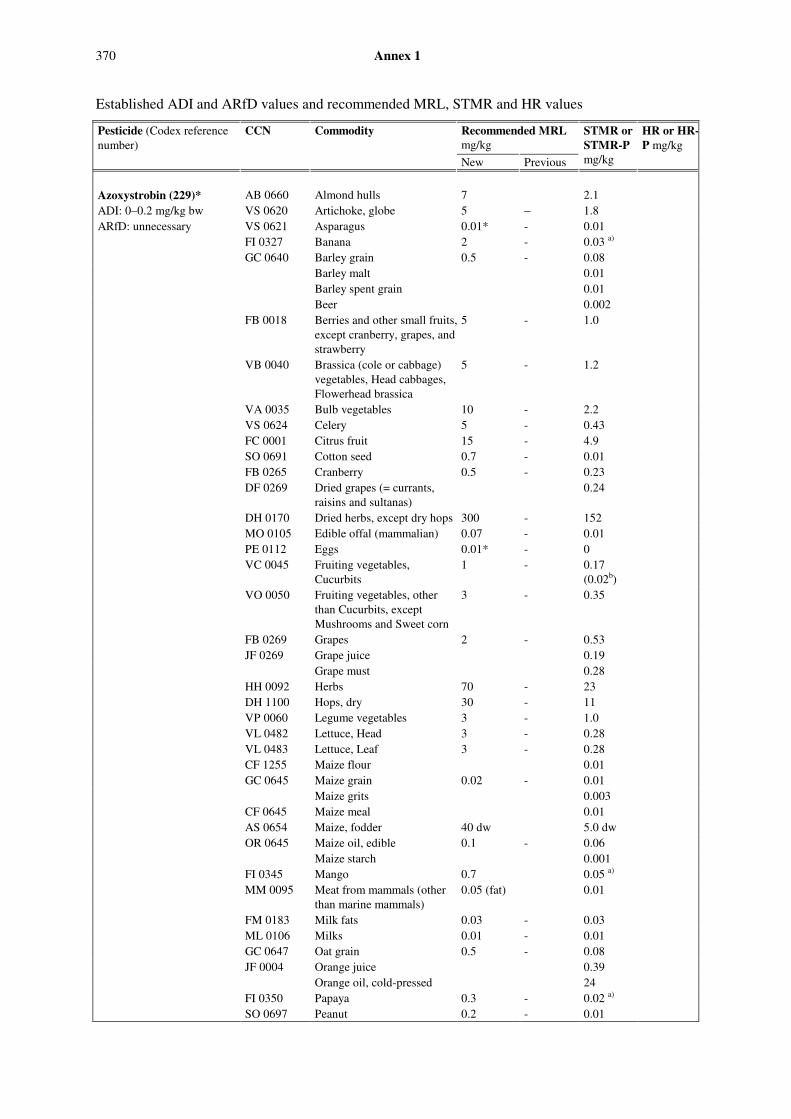
370 Annex 1
Established ADI and ARfD values and recommended MRL, STMR and HR values
Pesticide (Codex reference number)
CCN Commodity Recommended MRL mg/kg
New Previous
STMR or
STMR-P
mg/kg
HR or HR-
P mg/kg
Azoxystrobin (229)* AB 0660 Almond hulls 7 2.1 ADI: 0–0.2 mg/kg bw VS 0620 Artichoke, globe 5 − 1.8 ARfD: unnecessary VS 0621 Asparagus 0.01* - 0.01 FI 0327 Banana 2 - 0.03 a) GC 0640 Barley grain 0.5 - 0.08 Barley malt 0.01 Barley spent grain 0.01 Beer 0.002 FB 0018 Berries and other small fruits,
except cranberry, grapes, and strawberry
5 - 1.0
VB 0040 Brassica (cole or cabbage) vegetables, Head cabbages, Flowerhead brassica
5 - 1.2
VA 0035 Bulb vegetables 10 - 2.2 VS 0624 Celery 5 - 0.43 FC 0001 Citrus fruit 15 - 4.9 SO 0691 Cotton seed 0.7 - 0.01 FB 0265 Cranberry 0.5 - 0.23 DF 0269 Dried grapes (= currants,
raisins and sultanas) 0.24
DH 0170 Dried herbs, except dry hops 300 - 152 MO 0105 Edible offal (mammalian) 0.07 - 0.01 PE 0112 Eggs 0.01* - 0 VC 0045 Fruiting vegetables,
Cucurbits 1 - 0.17
(0.02b)
VO 0050 Fruiting vegetables, other than Cucurbits, except Mushrooms and Sweet corn
3 - 0.35
FB 0269 Grapes 2 - 0.53 JF 0269 Grape juice 0.19 Grape must 0.28 HH 0092 Herbs 70 - 23 DH 1100 Hops, dry 30 - 11 VP 0060 Legume vegetables 3 - 1.0 VL 0482 Lettuce, Head 3 - 0.28 VL 0483 Lettuce, Leaf 3 - 0.28 CF 1255 Maize flour 0.01 GC 0645 Maize grain 0.02 - 0.01 Maize grits 0.003 CF 0645 Maize meal 0.01 AS 0654 Maize, fodder 40 dw 5.0 dw OR 0645 Maize oil, edible 0.1 - 0.06 Maize starch 0.001 FI 0345 Mango 0.7 0.05 a) MM 0095 Meat from mammals (other
than marine mammals) 0.05 (fat) 0.01
FM 0183 Milk fats 0.03 - 0.03 ML 0106 Milks 0.01 - 0.01 GC 0647 Oat grain 0.5 - 0.08 JF 0004 Orange juice 0.39 Orange oil, cold-pressed 24 FI 0350 Papaya 0.3 - 0.02 a) SO 0697 Peanut 0.2 - 0.01

Annex 1 371
Pesticide (Codex reference number)
CCN Commodity Recommended MRL mg/kg
New Previous
STMR or
STMR-P
mg/kg
HR or HR-
P mg/kg
AL 1270 Peanut fodder 30 5.1 OR 0697 Peanut oil, edible 0.03 HS 0444 Peppers, chili (dried) 30 - 3.5 TN 0675 Pistachios 1 - 0.44 FI 0354 Plantain 2 - 0.03 a) PM 0110 Poultry meat 0.01* - 0 PO 0111 Poultry, Edible offal of 0.01* - 0 DF 0014 Prunes 0.14 GC 0649 Rice 5 - 0.68 CF 0649 Rice bran, processed 0.82 CM 1205 Rice, polished 0.06 VR 0075 Root and tuber vegetables 1 - 0.23 GC 0650 Rye 0.2 - 0.01 OR 0541 Soya bean oil, refined 0.05 VD 0541 Soya bean (dry) 0.5 - 0.06 AL 0541 Soya bean fodder (dry) 100 dw 36 dw FS 0012 Stone fruits 2 - 0.74 FB 0275 Strawberry 10 - 1.3 AS 0081 Straw and fodder (dry) of
cereal grains, except maize 15 dw 1.7 dw
OR 0702 Sunflower seed oil, edible 0.01 SO 0702 Sunflower seed 0.5 - 0.04 Tomato conserve 0.05 JF 0448 Tomato juice 0.16 Tomato ketchup 0.21 VW 0448 Tomato paste 1.1 Tomato purée 0.35 TN 0085 Tree nuts, except pistachios 0.01 - 0.01 GC 0653 Triticale 0.2 - 0.01 CF 0654 Wheat bran, processed 0.004 CP 1211 White bread 0.001 CP 1212 Wholemeal bread 0.001 Wheat flour, low grade 0.003 Wheat flour, patent 0.003 CF 1212 Wheat flour, wholemeal 0.003 GC 0654 Wheat 0.2 - 0.01 Wheat shorts 0.001 Wine 0.36 VS 0469 Witloof chicory (sprouts) 0.3 - 0.05 Definition of the residue (for compliance with the MRL and for estimation of dietary intake) for plant and animal commodities: azoxystrobin. The residue is fat soluble. a) STMR and HR values in edible portion (pulp). b) Melons only
Bifenazate (219) ADI: 0–0.01 mg/kg bw An incomplete data submission precluded the estimation of MRL or STMR values ARfD: Unnecessary

372 Annex 1
Pesticide (Codex reference number)
CCN Commodity Recommended MRL mg/kg
New Previous
STMR or
STMR-P
mg/kg
HR or HR-
P mg/kg
Boscalid (221) FI 0327 Banana 0.6 0.2 0.05 ADI: 0–0.04 mg/kg bw FI 0341 Kiwi fruit 5 - 0.073 ARfD: Unnecessary Definition of the residue (for compliance with the MRL for plant and animal commodities and for estimation of dietary intake for plant commodities): boscalid. Definition of the residue (for estimation of dietary intake for animal commodities): sum of boscalid, 2-chloro-N-(4’-chloro-5-hydroxybiphenyl-2-yl)nicotinamide including its conjugate, expressed as boscalid. The residue is fat soluble.
Buprofezin (173)** FC 0001 Citrus fruits 1 - 0.04 0.1 ADI: 0–0.009 mg/kg bw JF 0004 Citrus juice 0.13 ARfD: 0.5 mg/kg bw FC 0004 Oranges, sweet and sour W 0.5 - - FI 0345 Mango 0.1 - 0.01 0.01 VC 0424 Cucumber 0.2 - 0.035 0.1 VO 0448 Tomato 1 1 0.24 0.52 JF 0448 Tomato juice 0.053 - VW 0448 Tomato paste 0.22 - Tomato, peeled 0.041 0.088 MM 0095 Meat from mammals (other
than marine mammals) 0.05* - 0 0
MO 0105 Edible offal (Mammalian) 0.05* - 0 0 ML 0106 Milks 0.01* - 0 0 Citrus pulp, Dry 2 Definition of the residue (for compliance with the MRL and for estimation of dietary intake) for plant and animal commodities: buprofezin Carbaryl (008) The Meeting concluded that there was insufficient data to support alternative GAP
assessments for citrus, cherries and grapes. ADI: 0–0.008 mg/kg bw ARfD: 0.2 mg/kg bw Definition of the residue (for compliance with the MRL and for estimation of dietary intake) for plant and animal commodities: carbaryl
Carbofuran (096) ADI: 0–0.001 mg/kg bw ARfD: 0.001 mg/kg bw Definition of the residue (for compliance with the MRL and for estimation of dietary intake) for plant and animal commodities: sum of carbofuran, 3-hydroxycarbofuran and conjugated 3-hydroxycarbofuran, expressed as carbofuran. Chlorantraniliprole (230)* VS 0624 Celery 7 - 2.1 ADI: 0–2 mg/kg bw GC 0080 Cereal grains 0.02 - 0.01 ARfD: Unnecessary SO 0691 Cotton seed 0.3 - 0.049 PE 0112 Eggs 0.01* - 0 VC 0045 Fruiting vegetables,
Cucurbits 0.3 - 0.065
VO 0050 Fruiting vegetables, other than Cucurbits (except Mushrooms and Sweet corn)
0.6 - 0.066
HS 0444 Peppers, chili (dried) 5 - 0.46 JF 0448 Tomato juice 0.0589 Tomato ketchup 0.0691 Tomato purée 0.102 VW 0448 Tomato paste 0.109

Annex 1 373
Pesticide (Codex reference number)
CCN Commodity Recommended MRL mg/kg
New Previous
STMR or
STMR-P
mg/kg
HR or HR-
P mg/kg
FB 0269 Grapes 1 - 0.119 JF 0269 Grape juice 0.0869 DF 5263 Raisins 0.411 White wine 0.0262 Red wine 0.140 VL 0053 Leafy vegetables 20 - 7.3 MO 0105 Edible offal (Mammalian) 0.01* - 0 ML 0106 Milks 0.01* - 0 FM 0183 Milk fats 0.1 - 0.047 MM 0095 Meat (from mammals other
than marine mammals) 0.01* (fat) - 0 M
0 F
FP 0009 Pome fruits 0.4 - 0.07 JF 0226 Apple juice 0.0098 Apple purée 0.0063 Apple sauce 0.0189 PM 0110 Poultry meat 0.01* (fat) - 0 M
0 F
PO 0111 Poultry, Edible offal of 0.01* - 0 VR 0075 Root and tuber vegetables 0.02 - 0.01 FS 0012 Stone fruits 1 - 0.2 AS 0081 Straw and fodder (dry) of
cereal grains 0.3 - 0.51
Definition of the residue (for compliance with the MRL and for estimation of dietary intake) for plant and animal commodities: chlorantraniliprole The residue is fat-soluble
Chlorpropham (201) ML 0812 Cattle Milk W 0.0005* F 0.0003 ADI: 0–0.05 mg/kg bw ML 0106 Milks 0.01* - 0.00195 0.0085 ARfD: 0.5 mg/kg bw FM 0183 Milk fats 0.02 - 0.00195 0.011 Definition of the residue (for compliance with the MRL and for estimation of dietary intake) for plant and animal commodities: Chlorpropham The residue is fat-soluble
Cyhalothrin (146)** AB 0660 Almond hulls 2 0.42 (includes lambda-cyhalothrin)
JF 0226 Apple, juice 0.008 -
Group ADI: 0–0.02 mg/kg bw
FS 0240 Apricots 0.5 - 0.1 0.33
Group ARfD: 0.02 mg/kg bw VS 0621 Asparagus 0.02 - 0.01 0.01 GC 0640 Barley 0.5 - 0.02 - FB 0018 Berries and other small fruits 0.2 - 0.02 0.09 VA 0035 Bulb vegetables 0.2 - 0.05 0.11 VB 0041 Cabbages, Head 0.3 0.2 0.08 0.17 FS 0013 Cherries 0.3 - 0.125 0.18 FC 0001 Citrus fruits 0.2 - 0.01 0.01 OC 0691 Cotton seed, crude oil W 0.02* 0.005 - OR 0691 Cotton seed, refined oil W 0.02* 0.001 - SO 0691 Cotton seeds W 0.02* 0.01 DF 0269 Dried grapes (= currants,
Raisins and Sultanas) 0.3 - 0.06 0.27
VB 0042 Flowerhead brassica 0.5 - 0.215 0.3 VC 0045 Fruiting vegetables,
Cucurbits 0.05 - 0.01 0.02
VO 0050 Fruiting vegetables, other 0.3 - 0.03 0.18

374 Annex 1
Pesticide (Codex reference number)
CCN Commodity Recommended MRL mg/kg
New Previous
STMR or
STMR-P
mg/kg
HR or HR-
P mg/kg
than Cucurbits except Mushrooms
JF 0269 Grape, juice 0.01 - MO 0098 Kidney of cattle, goats, pigs
and sheep 0.2 - 0.03 0.09
VP 0060 Legume vegetables 0.2 - 0.02 0.11 MO 0099 Liver of cattle, goats, pigs
and sheep 0.05 - 0.008 0.02
GC 0645 Maize 0.02 - 0.01 FI 0345 Mango 0.2 - 0.03 0.07 MM 0095 Meat (from mammals other
than marine mammals) 3 (fat) - 0.04
(muscle) 1 (fat)
0.1 (muscle) 2.2 (fat)
ML 0106 Milks 0.2 - 0.08 - FS 0245 Nectarine 0.5 - 0.1 0.33 GC 0647 Oats 0.05 - 0.01 SO 0088 Oilseeds 0.2 - 0.01 - OR 0305 Olive oil, refined 0.077 - OR 0305 Olive oil, virgin 0.091 - FT 0305 Olives 1 - 0.125 0.42 JF 0004 Orange, juice 0.0165 - - Orange, marmalade 0.05 - FS 0247 Peaches 0.5 - 0.1 0.33 HS 0444 Peppers, chili (dried) 3 - 0.35 1.5 FS 0014 Plums, except prunes 0.2 - 0.02 0.1 FP 0009 Pome fruits 0.2 0.2 0.08 0.1 VR 0589 Potato W 0.02* 0 0 VD 0070 Pulses 0.05 - 0.01 GC 0649 Rice 1 - 0.295 CM 0649 Rice bran, unprocessed 0.065 - CM 1205 Rice, polished 0.003 - VR 0075 Root and tuber vegetables 0.01* - 0 0 GC 0650 Rye 0.05 - 0.01 AS 0081 Straw and fodder (dry) of
cereal grains 2 dw 0.54 dw
GS 0659 Sugar cane 0.05 - 0.02 0.03 DM 0659 Sugar cane, molasses 0.001 - - Sugar cane, refined sugar 0.001 - JF 0048 Tomato, juice 0.002 - VW 0448 Tomato, paste 0.007 - TN 0085 Tree nuts 0.01* - 0.01 0.01 GC 0653 Triticale 0.05 - 0.01 GC 0654 Wheat 0.05 - 0.01 0.03 CF 0654 Wheat bran, unprocessed 0.1 - 0.045 - CF 1211 Wheat, flour 0.005 - - Wine 0.01 - Definition of the residue (for compliance with the MRL and for estimation of dietary intake) for plant and animal commodities: cyhalothrin (sum of isomers) a) on dry matter basis
Cypermethrins (118) ** AL 1020 Alfalfa fodder 30 acZ 11.5 20 ADI: 0–0.02 mg/kg bw VS 0620 Artichoke, Globe 0.1 Ac - 0.025 0.04 ARfD: 0.04 mg/kg bw VS 0621 Asparagus 0.01* Ac - 0.01 0.01 GC 0640 Barley W 1) 0.5 AL 0061 Bean fodder 2 Acz - 0.58 1.3

Annex 1 375
Pesticide (Codex reference number)
CCN Commodity Recommended MRL mg/kg
New Previous
STMR or
STMR-P
mg/kg
HR or HR-
P mg/kg
VP 0062 Beans, Shelled W 1) 0.05* FB 0018 Berries and other small fruits W 0.5 VB 0040 Brassica (cole or cabbage)
vegetables, Head cabbages, Flowerhead brassica
1 cAz 1 0.02 0.65
FT 0289 Carambola 0.2 C - 0.02 0.09 GC 0080 Cereal grains, except rice 0.3 Acz - 0.035 FS 0013 Cherries W 1) 1 HS 0444 Peppers, chili (dried) 10 C - 3.5 4.8 FC 0001 Citrus fruits W 2 SB 0716 Coffee beans 0.05* aZ 0.05* 0 VP 0526 Common bean (pods and/or
immature seeds) W 1) 0.5
VC 0424 Cucumber W 1) 0.2 DF 0269 Dried grapes (=Currants,
Raisins and Sultanas) 0.5 cA - 0.033 0.3
FI 0334 Durian 1 C - 0.135 0.47 MO 0105 Edible offal (mammalian) 0.05* 3) 0.05* 0.014 0.04 VO 0440 Egg plant 0.03 A 0.2 0.01 0.02 PE 0112 Eggs 0.01* 0.05* 0.001 0.0033 VC 0045 Fruiting vegetables,
Cucurbits 0.07 cAz - 0.01
(0.01)5) 0.05 (0.01) 5)
FB 0269 Grapes 0.2 cA - 0.01 0.09 VL 0480 Kale W 1) 1 VL 0053 Leafy vegetables 0.7 cAz - 0.07 0.52 VA 0384 Leek 0.05 cA 0.5 0.01 0.03 VP 0060 Legume vegetables 0.7 caZ - 0.22 0.45 VL 0482 Lettuce, Head W 1) 2 FI 0343 Litchi 2 C - 0.495 0.79 FI 0342 Longan 1 C - 0.3 0.47 GC 0645 Maize W 1) 0.05 * AS 0645 Maize fodder W 1) 5 dry wt FI 0345 Mango 0.7 C - 0.19 0.35 MM 0095 Meat (from mammals other
than marine mammals) 2 (fat) 3) 0.2 (fat) 0.15 fat
0.014 muscle
0.76 fat 0.04 muscle
VC 0046 Melons, except Watermelon W 1) - 0.01 0.01 FM 0183 Milk fats 0.5 0.15 ML 0106 Milks 0.05 0.05 F. 0.011 VO 0450 Mushrooms W 0.05* FS 0245 Nectarine W 1) 2 SO 0088 Oilseed 0.1 Acz - 0.05 SO 0089 Oilseed, except peanut W 1) 0.2 VO 0442 Okra 0.5 C - 0.08 0.2 OR 0305 Olive oil, refined 0.5 cA - 0.41 OC 0305 Olive oil, virgin 0.5 cA - 0.38 FT 0305 Olives 0.05* cA - 0.05 0.05 VA 0385 Onion, Bulb 0.01* cAz 0.1 0.01 0.01 FI 0350 Papaya 0.5 C - 0.135 0.23 AL 0072 Pea hay or Pea fodder (dry) 2 Acz 0.42 1.1 FS 0247 Peach W 1) 2 SO 0697 Peanut W 1) 0.05* VO 0051 Peppers W 0.5 VO 0444 Peppers, Chili 2 Cz - 0.495 0.69 VO 0445 Peppers, Sweet 0.1 aZ - 0.05 0.07 FS 0014 Plums (including prunes) W 1) 1

376 Annex 1
Pesticide (Codex reference number)
CCN Commodity Recommended MRL mg/kg
New Previous
STMR or
STMR-P
mg/kg
HR or HR-
P mg/kg
FP 0009 Pome fruits 0.7 aZ 4) 2 0.205 0.56
PM 0110 Poultry meat 0.05* (fat) 0.05* 0.002 muscle 0.008 fat
0.007 muscle 0.027 fat
PO 0111 Poultry, Edible offal of 0.05* - 0.002 0.007 DF 0014 Prunes W 1) - 1.9 3 VD 0070 Pulses 0.05* aZ - 0.05 GC 0649 Rice 2 aZ - 0.57 VR 0075 Root and tuber vegetables W 1) 0.05* VR 0075 Root and tuber vegetables
(except sugar beet) 0.01* ACz - 0.01 0.01
AS 0651 Sorghum straw and fodder, dry
W 1)
VD 0541 Soya bean (dry) W 1) 0.05* VL 0502 Spinach W 1) 2 FS 0012 Stone fruits 2 aZ 0.59 0.94 AS 0081 Straw and fodder (dry) of
cereal grains 10 3.6 6.9
FB 0275 Strawberry 0.07 A - 0.01 0.05 VR 0596 Sugar beet 0.1 Acz - 0.01 GS 0659 Sugar cane 0.2 Z - 0.05 0.17 VO 0447 Sweet corn (corn-on-the-
cob) 0.05* Z 0.05* 0 0
DT 1114 Tea, Green, Black W 20 VO 0448 Tomato 0.2 caZ 0.5 0.05 0.08 OR 0172 Vegetable oils, Edible W 2) 0.5 GC 0654 Wheat W 1) 0.2 OR 0495 Rape seed oil, edible 0.06 JF 0448 Tomato juice 0.015 CM 0654 Wheat bran, unprocessed 0.084 CF 1211 Wheat flour 0.015 CF 1210 Wheat germ 0.02 AS 0654 Wheat straw and fodder, Dry W 5 Beer 0.0011 Tomato canned 0.006 Tomato puree 0.025 Wine 0.001 Definition of the residue (for compliance with the MRL and for estimation of dietary intake) for plant and animal commodities: cypermethrin (sum of isomers). The residue is fat soluble. 1) Replaced by commodity group MRL 2) Replaced by olive oil MRLs. Other vegetable oils are covered by the oilseeds MRL. 3) CCRVDF has established veterinary drug MRLs for cypermethrin and alpha-cypermethrin in cattle muscle (50 µg/kg), cattle liver (50µg/kg), cattle kidney (50 µg/kg) and cattle fat (1000 µg/kg) and the same for sheep muscle (50 µg/kg), sheep liver (50 µg/kg), sheep kidney (50 µg/kg) and sheep fat (1000 µg/kg). 4) Source of data supporting the proposed MRL: a: alpha-cypermethrin. c: cypermethrin. z: zeta-cypermethrin. Capital letters show the source of data responsible for the MRL estimate. Small letters show the sources of other data for that commodity 5) Melons only Dimethoate (027) VL 0482 Lettuce, Head 0.3 3 0.13 0.76 ADI: 0–0.002 mg/kg bw VO 0445 Peppers, sweet 0.5 5 0.28 1.3 ARfD:0.02 mg/kg bw HS 0444 Peppers, chili (dried) 3 50 2.8 13 Definition of the residue for compliance with MRLs: dimethoate Definition of the residue for estimation of dietary intake: dimethoate and omethoate.

Annex 1 377
Pesticide (Codex reference number)
CCN Commodity Recommended MRL mg/kg
New Previous
STMR or
STMR-P
mg/kg
HR or HR-
P mg/kg
Diphenylamine (030) ML 0812 Cattle milk W 0.0004* 0.00015 - ADI: 0–0.08 mg/kg bw ML 0106 Milks 0.01* - 0.0019 - ARfD: unnecessary FM 0183 Milk fats 0.01 - 0.0075 - Definition of the residue (for compliance with the MRL and for estimation of dietary intake) for plant and animal commodities: diphenylamine. Ethoxyquin (035) ADI: 0–0.005 mg/kg bw FP 0230 Pears 3 W 5 6 ARfD: 0.5 mg/kg bw Definition of the residue (for compliance with the MRL and for estimation of dietary intake) for plant and animal commodities: ethoxyquin Hexythiazox (176)** ADI: 0–0.03 mg/kg bw ARfD: Unnecessary Definition of the residue (for compliance with the MRL and for estimation of dietary intake) for plant and animal commodities: hexythiazox. Imidacloprid (206) AM 0660 Almond hulls 5 1.7 ADI: 0–0.06 mg/kg bw FB 0018 Berries and small fruits
(except cranberries, grapes and strawberries)
5 - 0.89 2.8
ARfD: 0.4 mg/kg bw SB 0716 Coffee beans 1 - 0.35 - MO 0095 Edible offal (Mammalian) 0.3 0.05 0.06 0.18 PE 0112 Eggs 0.02 0.02 0.003 0.007 ML 0106 Milks 0.1 0.02* 0.018 MM 0095 Meat (from mammals other
than marine mammals) 0.1 0.02* 0.012
(muscle) 0.007 (fat)
0.04 (muscle) 0.02 (fat)
VD 0072 Peas (dry) 2 - 0.62 - VP 0063 Peas (pods and succulent =
immature seeds) 5 - 0.60 3.8
VP 0064 Pea, shelled (succulent seeds) 2 - 0.58 1.1 SO 0697 Peanut 1 - 0.12 0.40 AL 1270 Peanut fodder TN 0672 Pecan W 0.05 FI 0355 Pomegranate 1 - 0.43 0.55 VR 0589 Potato W 0.5 PM 0110 Poultry meat 0.02 0.02 0.001
(muscle) 0.0004 (fat)
0.003 (muscle) 0.001 (fat)
PO 0111 Poultry, edible offal of 0.05 0.02* 0.007 0.02 VL 0494 Radish leaves (including
Radish tops) 5 - 0.70 2.7
VR 0075 Root and tuber vegetables 0.5 - 0.05 0.28 FB 0275 Strawberry 0.5 - 0.17 0.35 VR 0596 Sugar beet W 0.05* SO 0702 Sunflower seed 0.05* - 0.05 TN 0660 Tree nuts 0.01 - 0.01 0.01 Definition of the residue (for compliance with the MRL and for estimation of dietary intake) for plant and animal commodities: Sum of imidacloprid and its metabolites containing the 6-chloropyridinyl moiety, expressed as imidacloprid

378 Annex 1
Pesticide (Codex reference number)
CCN Commodity Recommended MRL mg/kg
New Previous
STMR or
STMR-P
mg/kg
HR or HR-
P mg/kg
a on dry matter basis
Malathion (049) GC 0654 Wheat 10 0.5 10 10 ADI: 0–0.3 mg/kg bw CF 1211 Wheat flour W 0.2 0.87 0.87 ARfD: 2 mg/kg bw CM 0654 Wheat bran, unprocessed 25 - 25 25 CF 1212 Wheat wholemeal 7.5 7.5 Wheat gluten 0.012 0.012 CP 1212 Wholemeal bread 1.2 1.2 CP 1211 White bread 0.2 0.2 Definition of the residue (for compliance with the MRL and for estimation of dietary intake) for plant and animal commodities: malathion.
Mandipropamid (231) * VB 0400 Broccoli 2 - 0.435 ADI: 0–0.2 mg/kg bw VB 0041 Cabbages, Head 3 - 0.01 ARfD: Unnecessary VS 0624 Celery 20 - 2.70 HS 0444 Peppers, chili (dried) 10 - 0.84 VC 0424 Cucumber 0.2 - 0.02 FB 0269 Grapes 2 - 0.51 DF 0269 Dried grapes (= Currants,
Raisins, Sultanas) 5 - 1.68
Wine 0.366 JF 0269 Grape, juice 0.14 VL 0053 Leafy vegetables 25 - 5.65 VC 0046 Melons, except Watermelon 0.5 - 0.115 VA 0385 Onion, Bulb 0.1 - 0.01 VO 0051 Peppers 1 - 0.12 VR 0589 Potatoes 0.01* - 0.01 VA 0389 Spring onion 7 - 0.48 VC 0431 Squash, summer 0.2 - 0.04 VO 0448 Tomato 0.3 - 0.06 JF 0448 Tomato juice 0.059 Tomato puree 0.068 Canned tomatoes 0.022 Definition of the residue (for compliance with the MRL and for estimation of dietary intake for plant and animal commodities): mandipropamid Methomyl (094) FP 0226 Apples 0.3 1) 2 2) 0.09 0.17 ADI: 0–0.02 mg/kg bw VB 0400 Brassica (cole or cabbage)
vegetables, Head cabbages, Flowerhead brassica W 7 3)
ARfD: 0.02 mg/kg bw VS 0624 Celery W 3 1) VC 0045 Fruiting vegetables,
Cucurbits 0.1 4) 0.1 1) 0.02 0.07
FB 0269 Grapes 0.3 1) 7 1) 0.01 0.09 (for processing)
0.08 0.2 (for processing)
VL 0482 Lettuce, Head 0.2 1) - 0.01 0.07 VL 0483 Lettuce, Leaf 0.2 1)) - 0.01 0.07 VL 0053 Leafy vegetables W 30 3) FP 0230 Pear 0.3 4) 0.3 1) 0.09 0.18 VO 0448 Tomato 1 4) 1 2) 0.16 0.73 JF 0226 Apple juice 0.026 VW 0448 Tomato paste 0.0085 Wine 0.053 JF 0269 Grape, juice 0.0198

Annex 1 379
Pesticide (Codex reference number)
CCN Commodity Recommended MRL mg/kg
New Previous
STMR or
STMR-P
mg/kg
HR or HR-
P mg/kg
DF 0269 Dried grapes (= Currants, Raisins, Sultanas)
0.018 0.04
Definition of the residue (for compliance with the MRL and for estimation of dietary intake) for plant and animal commodities: sum of methomyl and thiodicarb expressed as methomyl 1) Resulting from data on supervised trials with methomyl 2) Resulting from data on supervised trials with thiodicarb 3) Resulting from data on supervised trials with methomyl plus thiodicarb 4) Previous MRL confirmed.
Oxamyl (126) The Meeting concluded that there was insufficient data to support alternative GAP
assessments for citrus, cucumber, melons (except watermelon), summer squash, peppers and tomatoes.
Profenofos (171) ** VB 0041 Cabbages, Head W 1 ADI: 0–0.03 mg/kg bw SO 0691 Cotton seed 3 2 0.35 ARfD: 1 mg/kg bw OR 0691 Cotton seed oil, edible W 0.05* 0.14 MO 0105 Edible offal (Mammalian) 0.05* - 0 0 PE 0112 Eggs 0.02* 0.02* 0 0 FI 0345 Mango 0.2 - 0.06 0.07 FI 0346 Mangosteen 10 - 2.1 3.7 MM 0095 Meat (from mammals other
than marine mammals) 0.05* 0.05* 0 0
ML 0106 Milks 0.01* 0.01* 0 VO 0444 Peppers, Chili W 5 HS 0444 Peppers, Chili (dried) W 50 VO 0445 Peppers, Sweet W 0.5 VR 0589 Potato W 0.05* PM 0110 Poultry meat 0.05* - 0 0 PM 0111 Poultry, Edible offal of 0.05* - 0 0 VO 0448 Tomato 10 2 1.3 4.7 Definition of the residue (for compliance with the MRL and for estimation of dietary intake) for plant and animal commodities: profenofos
- Prothioconazole (232) * GC 0640 Barley 0.05 - 0.01 ADI: 0 - 0.05mg/kg bw OS 0640 Barley straw 2 - 0.30 ARfD: 0.8 mg/kg bw (woman of child bearing age)
MO 0032 Edible offal (Mammalian) 0.2 - 0.05 0.1
ARfD not necessary (general population)
MM 0095 Meat (from mammals other than marine mammals)
0.01 - 0.01 0.01
MF 0100 Mammalian fats (except milk fats)
0.01 - 0.01 0.01
ML 0106 Milks 0.004* - 0.004 Prothioconazole - Desthio GC 0647 Oat 0.05 - 0.01 ADI: 0–0.01 mg/kg bw OS 0647 Oat straw 2 - 0.3 ARfD: 0.01 mg/kg bw OS 0697 Peanut 0.02* 0.01 (woman of child bearing age) SO 4703 Rape seed 0.05 - 0.01 ARfD: 1 mg/kg bw GC 0650 Rye 0.05 - 0.01 (general population) OS 0650 Rye straw 2 - 0.30 GC 0653 Triticale 0.05 - 0.01 OS 0653 Triticale straw 2 0.30 GC 0654 Wheat 0.05 - 0.01 CM 0081 Wheat bran 0.024 CF 1211 Wheat flour 0.05 - 0.004 CF 1210 Wheat germ 0.02

380 Annex 1
Pesticide (Codex reference number)
CCN Commodity Recommended MRL mg/kg
New Previous
STMR or
STMR-P
mg/kg
HR or HR-
P mg/kg
OS 0654 Wheat straw 2 0.30 Definition of the residue (for compliance with MRL and estimation of dietary intake) for plant commodities: prothioconazole-desthio, Definition of the residue (for compliance with MRL) for animal commodities: prothioconazole-desthio. Definition of the residue (for the estimation of dietary intake) for animal commodities: the sum of prothioconazole-desthio, prothioconazole-desthio-3-hydroxy, prothioconazole-desthio-4-hydroxy and their conjugates expressed as prothioconazole-desthio.
Spinetoram (233) * MO 0105 Edible offal (Mammalian) 0.01* - 0.00625 ADI: 0–0.05 mg/kg bw VL 0482 Lettuce, Head 10 - 0.0895 ARfD: Unnecessary VL 0483 Lettuce, Leaf 10 0.0895 MM 0095 Meat (from mammals other
than marine mammals) 0.2 (fat) - 0.00625
(muscle) 0.042 (fat)
FM 0183 Milk fats 0.1 - 0.12 ML 0106 Milks 0.01* - 0.00925 FC 0004 Oranges, sweet, sour 0.07 - 0.0435 JF 0004 Orange juice 0.003 FP 0009 Pome fruits 0.05 - 0.025 JF 0226 Apple juice 0.011 Apple puree or sauce 0.012 VR 0596 Sugar beet 0.01* - 0.02 VO 0448 Tomato 0.06 - 0.02 TN 0085 Tree nuts 0.01 - 0.02 Definition of the residue for compliance with MRLs: Spinetoram Definition of the residue for estimation of dietary intake: Spinetoram and N-demethyl and N-formyl metabolites of the major spinetoram component. The residue is fat soluble.
Spinosad (203) ADI: 0–0.02 mg/kg bw An incomplete data submission precluded the estimation of MRL or STMR values ARfD: Unnecessary
Spirotetramat (234)* AB 0660 Almond hulls 10 4.9 ADI: 0–0.5 mg/kg bw VB 0041 Cabbages, Head 2 - 0.23 0.92 ARfD: 1.0 mg/kg/bw VS 0624 Celery 4 - 0.58 2.6 FS 0012 Stone Fruit 3 - 1.6 2.1 FC 0001 Citrus fruit 0.5 - 0.33 0.47 VC 0011 Fruiting Vegetables,
Cucurbits 0.2 - 0.057 0.18
DF 0269 Dried grapes (=currants, Raisins and Sultanas)
4 - 1.1 3.4
MO 0105 Edible offal (Mammalian) 0.03 - 0.014 0.024 VB 0042 Flowerhead Brassica 1 - 0.50 0.87 VO 0050 Fruiting vegetables, other
than Cucurbits (except sweet corn, mushrooms and chili pepper)
1 - 0.43 1.1
FB 0269 Grapes 2 - 0.41 1.3 AB 0269 Grape pomace (dry) 4 0.74 DH 1100 Hops (dry) 15 - 5.2 VL 0053 Leafy vegetables 7 - 3.7 5.5 MM 0095 Meat (from mammals other 0.01* - 0 muscle 0 muscle

Annex 1 381
Pesticide (Codex reference number)
CCN Commodity Recommended MRL mg/kg
New Previous
STMR or
STMR-P
mg/kg
HR or HR-
P mg/kg
than marine mammals) 0 fat 0 fat ML 0106 Milks 0.005* - 0 0 VO 0444 Pepper, chili (non-bell) 2 - 0.95 1.5 HS 0444 Peppers, Chili (Dry) 15 - 6.6 11 FP 0009 Pome fruits 0.7 - 0.17 0.55 VR 0589 Potato 0.8 - 0.12 0.46 DF 0014 Prunes (dried plums) 5 - 3.5 4.6 TN 0022 Tree nuts 0.5 - 0.084 0.29 JF 0226 Apple juice 0.082 Beer hops 0.11 JF 0269 Grape juice 0.27 Grape wine 0.23 Grape jelly 0.11 JF 0004 Orange juice 0.18 Tomato, dried 5.0 JF 0448 Tomato juice 0.27 VW 0448 Tomato paste 3.2 Definition of the residue (for compliance with MRL) for plant commodities: Spirotetramat and its enol metabolite, 3-(2,5-dimethylphenyl)-4-hydroxy-8-methoxy-1-azaspiro[4.5]dec-3-en-2-one, expressed as spirotetramat. Definition of the residue (for estimation of dietary intake) for plant commodities: Spirotetramat, enol metabolite 3-(2,5-dimethylphenyl)-4-hydroxy-8-methoxy-1-azaspiro[4.5]dec-3-en-2-one, ketohydroxy metabolite 3-(2,5-dimethylphenyl)-3-hydroxy-8-methoxy-1-azaspiro[4.5]decane-2,4-dione, monohydroxy metabolite cis-3-(2,5-dimethylphenyl)-4-hydroxy-8-methoxy-1-azaspiro[4.5]decan -2-one, and enol glucoside metabolite glucoside of 3-(2,5-dimethylphenyl)-4-hydroxy-8-methoxy-1-azaspiro[4.5]dec-3-en-2-one, expressed as spirotetramat. Definition of the residue (for compliance with MRL and estimation of dietary intake) for animal commodities: Spirotetramat enol metabolite, 3-(2,5-dimethylphenyl)-4-hydroxy-8-methoxy-1-azaspiro[4.5]dec-3-en-2-one, expressed as spirotetramat.
Tebuconazole (189) DF 0226 Apple dried 0.19 ADI: 0–0.03 mg/kg bw JF 0226 Apple juice 0.08 Apple sauce 0.08 VS 0620 Artichoke, globe 0.5 - 0.15 0.32 GC 0640 Barley 2 0.2 0.06 AS 0640 Barley straw and fodder, dry 30 10 Beer 0.001 VB 0400 Brassica (cole or cabbage)
vegetables, Head cabbages, Flowerhead brassica
1 - 0.07 0.56
VP 0526 Common bean (pods and/or immature seeds)
2 - 0.49 1.2
Common bean (pods and/or immature seeds) cooked
0.096
VR 0577 Carrot 0.5 - 0.11 0.22 MO 0812 Cattle, Edible offal of W 0.05* MM 0812 Cattle meat W 0.05* ML 0812 Cattle milk W 0.05* PE 0840 Chicken eggs W 0.05* PO 0840 Chicken, Edible offal W 0.05* PM 0840 Chicken meat W 0.05* SB 0716 Coffee beans 0.1 - 0.1 SM 0716 Coffee beans, roasted 0.5 - 0.2 Coffee instant 0.08 MO 0105 Edible offal (Mammalian) 0.5 - 0.2 0.2 PE 0112 Eggs 0.05* - 0 0 FB 0267 Elderberries 2 - 0.345 0.70 VA 0381 Garlic 0.1 - 0.02 0.06

382 Annex 1
Pesticide (Codex reference number)
CCN Commodity Recommended MRL mg/kg
New Previous
STMR or
STMR-P
mg/kg
HR or HR-
P mg/kg
DH 1100 Hops, dry 30 - 9.65 Beer, from hops 0.009 VA 0384 Leek 1 - 0.195 0.44 VL 0482 Lettuce, Head 5 - 0.98 3.2 GC 0645 Maize 0.1 - 0.1 FI 0345 Mango 0.1 - 0.02 0.1 MM 0095 Meat (from mammals other
than marine mammals) 0.05* - 0 0
VC 0106 Melons, except Watermelon 0.2 - 0.02 0.02 ML 0106 Milks 0.01* - 0 0 VA 0385 Onion, Bulb 0.1 - 0.05 0.06 FI 0350 Papaya 2 - 0.18 1.2 SO 0697 Peanut 0.1 0.05 0.04 FS 0014 Plums, excluding prunes 0.2 - 0.055 0.12 FP 0009 Pome fruits 1 0.5 0.19 0.47 PM 0110 Poultry meat 0.05* - 0 0 PO 0111 Poultry, Edible offal of 0.05* - 0 0.05 DF 0014 Prunes 0.5 - 0.18 SO 0495 Rape seed 0.5 0.05 0.09 OR 0495 Rape seed oil, edible 0.064 GC 0649 Rice 2 - 0.275 VD 0541 Soya bean (dry) 0.1 - 0.02 OR 0541 Soya bean oil, refined 0.001 VO 0447 Sweet corn (on-the-cob) 0.1 - 0.1 0.1 VO 0448 Tomato 0.5 0.2 0.19 0.46 JF 0448 Tomato juice 0.1 Tomato preserve 0.057 VW 0448 Tomato paste 0.16 Tomato purée 0.06 Tomato peeled 0.05 0.115 VC 0432 Watermelon 0.1 - 0.02 0.02 Definition of the residue (for compliance with the MRL and for estimation of dietary intake) for plant and animal commodities: tebuconazole Metabolites of triazoles 1, 2, 4- Triazole ADI: 0–0.2 mg/kg bw ARfD: 0.3 mg/kg bw Triazole alanine and Triazole acetic acid
Group ADI: 0–1 mg/kg bw Group ARfD: Unnecessary

383
ANNEX 2: INDEX OF REPORTS AND EVALUATIONS OF PESTICIDES BY THE JMPR
Numbers in parentheses after the names of pesticides are Codex classification numbers. The abbreviations used are:
T, evaluation of toxicology
R, evaluation of residue and analytical aspects
E, evaluation of effects on the environment
Abamectin (177) 1992 (T,R), 1994 (T,R), 1995 (T), 1997 (T,R), 2000 (R)
Acephate (095) 1976 (T, R), 1979 (R), 1981 (R), 1982 (T), 1984 (T,R), 1987 (T), 1988 (T), 1990 (T,R), 1991 (corr. to 1990 R evaluation), 1994 (R), 1996 (R), 2002 (T), 2003 (R), 2004 (corr. to 2003 report), 2005 (T), 2006 (R)
Acrylonitrile 1965 (T, R)
Aldicarb (117) 1979 (T, R), 1982 (T, R), 1985 (R), 1988 (R), 1990 (R), 1991 (corr. to 1990 evaluation), 1992 (T), 1993 (R), 1994 (R), 1996 (R), 2001 (R), 2002 (R), 2006 (R)
Aldrin (001) 1965 (T), 1966 (T,R), 1967 (R), 1974 (R), 1975 (R), 1977 (T), 1990 (R), 1992 (R)
Allethrin 1965 (T,R)
Aminocarb (134) 1978 (T,R), 1979 (T,R)
Aminomethylphosphonic acid (AMPA, 198) 1997 (T,R)
Aminopyralid (220) 2006 (T, R), 2007 (T, R)
Amitraz (122) 1980 (T,R), 1983 (R), 1984 (T,R), 1985 (R), 1986 (R), 1989 (R), 1990 (T,R), 1991 (R & corr. to 1990 R evaluation), 1998 (T)
Amitrole (079) 1974 (T,R), 1977 (T), 1993 (T,R), 1997 (T), 1998 (R)
Anilazine (163) 1989 (T,R), 1992 (R)
Atrazine 2007 (T)
Azinphos-ethyl (068) 1973 (T,R), 1983 (R)
Azinphos-methyl (002) 1965 (T), 1968 (T,R), 1972 (R), 1973 (T), 1974 (R), 1991 (T,R), 1992 (corr. to 1991 report), 1993 (R), 1995 (R), 2007 (T)
Azocyclotin (129) 1979 (R), 1981 (T), 1982 (R),1983 (R), 1985 (R), 1989 (T,R), 1991 (R), 1994 (T), 2005 (T,R)
Azoxystrobin (229) 2008 (T, R)
Benalaxyl (155) 1986 (R), 1987 (T), 1988 (R), 1992 (R), 1993 (R), 2005 (T)
Bendiocarb (137) 1982 (T,R), 1984 (T,R), 1989 (R), 1990 (R)
Benomyl (069) 1973 (T,R), 1975 (T,R), 1978 (T,R), 1983 (T,R),

384 Annex 2
1988 (R), 1990 (R), 1994 (R), 1995 (T,E), 1998 (R)
Bentazone (172) 1991 (T,R), 1992 (corr. to 1991 report, Annex I), 1994 (R), 1995 (R), 1998 (T,R), 1999 (corr. to 1998 report), 2004(T)
BHC (technical-grade) 1965 (T), 1968 (T,R), 1973 (T,R) (see also Lindane)
Bifenazate (219) 2006 (T, R)
Bifenthrin (178) 1992 (T,R), 1995 (R), 1996 (R), 1997 (R)
Binapacryl (003) 1969 (T,R), 1974 (R), 1982 (T), 1984 (R), 1985 (T,R)
Bioresmethrin (093) 1975 (R), 1976 (T,R), 1991 (T,R)
Biphenyl See Diphenyl
Bitertanol (144) 1983 (T), 1984 (R), 1986 (R), 1987 (T), 1988 (R), 1989 (R), 1991 (R), 1998 (T), 1999 (R), 2002 (R)
Boscalid (221) 2006 (T, R), 2008 (R)
Bromide ion (047) 1968 (R), 1969 (T,R), 1971 (R), 1979 (R), 1981 (R), 1983 (R), 1988 (T,R), 1989 (R), 1992 (R)
Bromomethane (052) 1965 (T,R), 1966 (T,R), 1967 (R), 1968 (T,R), 1971 (R), 1979 (R), 1985 (R), 1992 (R)
Bromophos (004) 1972 (T,R), 1975 (R), 1977 (T,R), 1982 (R), 1984 (R), 1985 (R)
Bromophos-ethyl (005) 1972 (T,R), 1975 (T,R), 1977 (R)
Bromopropylate (070) 1973 (T,R), 1993 (T,R)
Butocarboxim (139) 1983 (R), 1984 (T), 1985 (T), 1986 (R)
Buprofezin (173) 1991 (T,R), 1995 (R), 1996 (corr. to 1995 report.), 1999 (R), 2008 (T, R)
sec-Butylamine (089) 1975 (T,R), 1977 (R), 1978 (T,R), 1979 (R), 1980 (R), 1981 (T), 1984 (T,R: withdrawal of temporary ADI, but no evaluation)
Cadusafos (174) 1991 (T,R), 1992 (R), 1992 (R)
Campheclor (071) 1968 (T,R), 1973 (T,R)
Captafol (006) 1969 (T,R), 1973 (T,R), 1974 (R), 1976 (R), 1977 (T,R), 1982 (T), 1985 (T,R), 1986 (corr. to 1985 report), 1990 (R), 1999 (acute Rf D)
Captan (007) 1965 (T), 1969 (T,R), 1973 (T), 1974 (R), 1977 (T,R), 1978 (T,R), 1980 (R), 1982 (T), 1984 (T,R), 1986 (R), 1987 (R and corr. to 1986 R evaluation), 1990 (T,R), 1991 (corr. to 1990 R evaluation), 1994 (R), 1995 (T), 1997 (R), 2000 (R), 2004 (T), 2007 (T)
Carbaryl (008) 1965 (T), 1966 (T,R), 1967 (T,R), 1968 (R), 1969 (T,R), 1970 (R), 1973 (T,R), 1975 (R), 1976 (R), 1977 (R), 1979 (R), 1984 (R), 1996 (T), 2001 (T), 2002 (R), 2007 (R)
Carbendazim (072) 1973 (T,R), 1976 (R), 1977 (T), 1978 (R), 1983 (T,R), 1985 (T,R), 1987 (R), 1988 (R), 1990 (R), 1994 (R), 1995 (T,E), 1998 (T,R), 2003 (R), 2005 (T)

Annex 2 385
Carbofuran (096) 1976 (T,R), 1979 (T,R), 1980 (T), 1982 (T), 1991 (R), 1993 (R), 1996 (T), 1997 (R), 1999 (corr. to 1997 report), 2002 (T, R), 2003 (R) (See also carbosulfan), 2004 (R), 2008 (T)
Carbon disulfide (009) 1965 (T,R), 1967 (R), 1968 (R), 1971 (R), 1985 (R)
Carbon tetrachloride (010) 1965 (T,R), 1967 (R), 1968 (T,R), 1971 (R), 1979 (R), 1985 (R)
Carbophenothion (011) 1972 (T,R), 1976 (T,R), 1977 (T,R), 1979 (T,R), 1980 (T,R), 1983 (R)
Carbosulfan (145) 1984 (T,R), 1986 (T), 1991 (R), 1992 (corr. to 1991 report), 1993 (R), 1997 (R), 1999 (R), 2002 (R), 2003 (T, R), 2004 (R, corr. to 2003 report)
Cartap (097) 1976 (T,R), 1978 (T,R), 1995 (T,R)
Chinomethionat (080) 1968 (T,R) (as oxythioquinox), 1974 (T,R), 1977 (T,R), 1981 (T,R), 1983 (R), 1984 (T,R), 1987 (T)
Chlorantraniliprole (230) 2008 (T, R)
Chlorbenside 1965 (T)
Chlordane (012) 1965 (T), 1967 (T,R), 1969 (R), 1970 (T,R), 1972 (R), 1974 (R), 1977 (T,R), 1982 (T), 1984 (T,R), 1986 (T)
Chlordimeform (013) 1971 (T,R), 1975 (T,R), 1977 (T), 1978 (T,R), 1979(T), 1980(T), 1985(T), 1986 (R), 1987 (T)
Chlorfenson 1965 (T)
Chlorfenvinphos (014) 1971 (T,R), 1984 (R), 1994 (T), 1996 (R)
Chlormequat (015) 1970 (T,R), 1972 (T,R), 1976 (R), 1985 (R), 1994 (T,R), 1997 (T), 1999 (acute Rf D), 2000 (R)
Chlorobenzilate (016) 1965 (T), 1968 (T,R), 1972 (R), 1975 (R), 1977 (R), 1980 (T)
Chloropicrin 1965 (T,R)
Chloropropylate 1968 (T,R), 1972 (R)
Chlorothalonil (081) 1974 (T,R), 1977 (T,R), 1978 (R), 1979 (T,R), 1981 (T,R), 1983 (T,R), 1984 (corr. to 1983 report and T evaluation), 1985 (T,R), 1987 (T), 1988 (R), 1990 (T,R), 1991 (corr. to 1990 evaluation), 1992 (T), 1993 (R), 1997 (R)
Chlorpropham (201) 1965 (T), 2000 (T), 2001 (R), 2005 (T), 2008 (R)
Chlorpyrifos (017) 1972 (T,R), 1974 (R), 1975 (R), 1977 (T,R), 1981 (R), 1982 (T,R), 1983 (R), 1989 (R), 1995 (R), 1999 (T), 2000 (R), 2004 (R), 2006 (R)
Chlorpyrifos-methyl (090) 1975 (T,R), 1976 (R, Annex I only), 1979 (R), 1990, (R), 1991 (T,R), 1992 (T and corr. to 1991 report), 1993 (R), 1994 (R), 2001 (T)
Chlorthion 1965 (T)
Clethodim (187) 1994 (T,R), 1997 (R), 1999 (R), 2002 (R)
Clofentezine (156) 1986 (T,R), 1987 (R), 1989 (R), 1990 (R), 1992 (R), 2005 (T), 2007 (R)
Coumaphos (018) 1968 (T,R), 1972 (R), 1975 (R), 1978 (R),

386 Annex 2
1980 (T,R), 1983 (R), 1987 (T), 1990 (T,R)
Crufomate (019) 1968 (T,R), 1972 (R)
Cyanophenfos (091) 1975 (T,R), 1978 (T: ADI extended, but no evaluation), 1980, (T), 1982 (R), 1983 (T)
Cycloxydim (179) 1992 (T,R), 1993 (R)
Cyfluthrin (157) 1986 (R), 1987 (T and corr. to 1986 report), 1989 (R), 1990 (R), 1992 (R), 2006 (T), 2007 (R)
Cyhalothrin (146) 1984 (T,R), 1986 (R), 1988 (R), 2007 (T), 2008 (R)
Cyhexatin (067) 1970 (T,R), 1973 (T,R), 1974 (R), 1975 (R), 1977 (T), 1978 (T,R), 1980 (T), 1981 (T), 1982 (R), 1983 (R), 1985 (R), 1988 (T), 1989 (T), 1991 (T,R), 1992 (R), 1994 (T), 2005 (T,R)
Cypermethrin (118) 1979 (T,R), 1981 (T,R), 1982 (R), 1983 (R), 1984 (R), 1985 (R), 1986 (R), 1987 (corr. to 1986 evaluation), 1988 (R), 1990 (R), 2006 (T), 2008 (R)
Cyprodinil (207) 2003 (T,R), 2004 (corr. to 2003 report)
Cyromazine (169) 1990 (T,R), 1991 (corr. to 1990 R evaluation), 1992 (R), 2006 (T), 2007 (R)
2,4-D (020) 1970 (T,R), 1971 (T,R), 1974 (T,R), 1975 (T,R), 1980 (R), 1985, (R), 1986 (R), 1987 (corr. to 1986 report, Annex I), 1996 (T), 1997 (E), 1998 (R), 2001 (R)
Daminozide (104) 1977 (T,R), 1983 (T), 1989 (T,R), 1991 (T)
DDT (021) 1965 (T), 1966 (T,R), 1967 (T,R),1968 (T,R), 1969 (T,R), 1978 (R), 1979 (T), 1980 (T), 1983 (T), 1984 (T), 1993 (R), 1994 (R), 1996 (R)
Deltamethrin (135) 1980 (T,R), 1981 (T,R), 1982 (T,R), 1984 (R), 1985 (R), 1986 (R), 1987 (R), 1988 (R), 1990 (R), 1992 (R), 2000 (T), 2002 (R)
Demeton (092) 1965 (T), 1967 (R), 1975 (R), 1982 (T)
Demeton-S-methyl (073) 1973 (T,R), 1979 (R), 1982 (T), 1984 (T,R), 1989 (T,R), 1992 (R), 1998 (R)
Demeton-S-methylsulfon (164) 1973 (T,R), 1982 (T), 1984 (T,R), 1989 (T,R), 1992 (R)
Dialifos (098) 1976 (T,R), 1982 (T), 1985 (R)
Diazinon (022) 1965 (T), 1966 (T), 1967 (R), 1968 (T,R), 1970 (T,R), 1975 (R), 1979 (R), 1993 (T,R), 1994 (R), 1996 (R), 1999 (R), 2001 (T) , 2006 (T, R)
1,2-Dibromoethane (023) 1965 (T,R), 1966 (T,R), 1967 (R), 1968 (R), 1971 (R), 1979 (R), 1985 (R)
Dicloran (083) 2003 (R)
Dichlorfluanid (082) 1969 (T,R), 1974 (T,R), 1977 (T,R), 1979 (T,R), 1981 (R),1982 (R), 1983 (T,R), 1985 (R)
1,2-Dichloroethane (024) 1965 (T,R), 1967 (R), 1971 (R), 1979 (R), 1985 (R)
Dichlorvos (025) 1965 (T,R), 1966 (T,R), 1967 (T,R), 1969 (R), 1970 (T,R), 1974 (R), 1977 (T), 1993 (T,R)
Dicloran (083) 1974 (T,R), 1977 (T,R), 1998 (T,R)
Dicofol (026) 1968 (T,R), 1970 (R), 1974 (R), 1992 (T,R),

Annex 2 387
1994 (R)
Dieldrin (001) 1965 (T), 1966 (T,R), 1967 (T,R), 1968 (R), 1969 (R), 1970, (T,R), 1974 (R), 1975 (R), 1977 (T), 1990 (R), 1992 (R)
Difenoconazole (224) 2007 (T, R)
Diflubenzuron (130) 1981 (T,R), 1983 (R), 1984 (T,R), 1985 (T,R), 1988 (R), 2001 (T), 2002 (R)
Dimethenamid- P (214) 2005 (T,R)
Dimethipin (151) 1985 (T,R), 1987 (T,R), 1988 (T,R), 1999 (T), 2001 (R), 2004 (T)
Dimethoate (027) 1965 (T), 1966 (T), 1967 (T,R), 1970 (R), 1973 (R in evaluation of formothion), 1977 (R), 1978 (R), 1983 (R) 1984 (T,R) 1986 (R), 1987 (T,R), 1988 (R), 1990 (R), 1991 (corr. to 1990 evaluation), 1994 (R), 1996 (T), 1998 (R), 2003 (T,R), 2004 (corr. to 2003 report), 2006 (R), 2008 (R)
Dimethomorph 2007 (T, R)
Dimethrin 1965 (T)
Dinocap (087) 1969 (T,R), 1974 (T,R), 1989 (T,R), 1992 (R), 1998 (R), 1999 (R), 2000 (T), 2001 (R)
Dioxathion (028) 1968 (T,R), 1972 (R)
Diphenyl (029) 1966 (T,R), 1967 (T)
Diphenylamine (030) 1969 (T,R), 1976 (T,R), 1979 (R), 1982 (T), 1984 (T,R), 1998 (T), 2001 (R), 2003 (R), 2008 (R)
Diquat (031) 1970 (T,R), 1972 (T,R), 1976 (R), 1977 (T,R), 1978 (R), 1994 (R)
Disulfoton (074) 1973 (T,R), 1975 (T,R), 1979 (R), 1981 (R), 1984 (R), 1991 (T,R), 1992 (corr. to 1991 report, Annex I), 1994 (R), 1996 (T), 1998 (R), 2006 (R)
Dithianon (180) 1992 (T,R), 1995 (R), 1996 (corr. to 1995 report)
Dithiocarbamates (105) 1965 (T), 1967 (T,R), 1970 (T,R), 1983 (R propineb, thiram), 1984 (R propineb), 1985 (R), 1987 (T thiram), 1988 (R thiram), 1990 (R), 1991 (corr. to 1990 evaluation), 1992 (T thiram), 1993 (T,R), 1995 (R), 1996 (T,R ferbam, ziram;, R thiram), 2004 (R)
4,6-Dinitro-ortho-cresol (DNOC) 1965 (T)
Dodine (084) 1974 (T,R), 1976 (T,R), 1977 (R), 2000 (T), 2003(R) 2004 (corr. to 2003 report)
Edifenphos (099) 1976 (T,R), 1979 (T,R), 1981 (T,R)
Endosulfan (032) 1965 (T), 1967 (T,R), 1968 (T,R), 1971 (R), 1974 (R), 1975 (R), 1982 (T), 1985 (T,R), 1989 (T,R), 1993 (R), 1998 (T), 2006 (R)
Endrin (033) 1965 (T), 1970 (T,R), 1974 (R), 1975 (R), 1990 (R), 1992 (R)
Esfenvalerate (204) 2002 (T, R)
Ethephon (106) 1977 (T,R), 1978 (T,R), 1983 (R), 1985 (R), 1993 (T), 1994 (R), 1995 (T), 1997 (T), 2002 (T)

388 Annex 2
Ethiofencarb (107) 1977 (T,R), 1978 (R), 1981 (R), 1982 (T,R), 1983 (R)
Ethion (034) 1968 (T,R), 1969 (R), 1970 (R), 1972 (T,R), 1975 (R), 1982 (T), 1983 (R), 1985 (T), 1986 (T), 1989 (T), 1990 (T), 1994 (R)
Ethoprophos (149) 1983 (T), 1984 (R), 1987 (T), 1999 (T), 2004 (R)
Ethoxyquin (035) 1969 (T,R), 1998 (T), 1999 (R). 2005 (T), 2008 (R)
Ethylene dibromide See 1,2-Dibromoethane
Ethylene dichloride See 1,2-Dichloroethane
Ethylene oxide 1965 (T,R), 1968 (T,R), 1971 (R)
Ethylenethiourea (ETU) (108) 1974 (R), 1977 (T,R), 1986 (T,R), 1987 (R), 1988 (T,R), 1990 (R), 1993 (T,R)
Etofenprox (184) 1993 (T,R)
Etrimfos (123) 1980 (T,R), 1982 (T,R1 ), 1986 (T,R), 1987 (R), 1988 (R), 1989 (R), 1990 (R)
Famoxadone (208) 2003 (T,R)
Fenamiphos (085) 1974 (T,R), 1977 (R), 1978 (R), 1980 (R), 1985 (T), 1987 (T), 1997 (T), 1999 (R), 2002 (T), 2006 (R)
Fenarimol (192) 1995 (T, R, E), 1996 (R and corr. to 1995 report)
Fenbuconazole (197) 1997 (T,R)
Fenbutatin oxide (109) 1977 (T,R), 1979 (R), 1992 (T), 1993 (R)
Fenchlorfos (036) 1968 (T,R), 1972 (R), 1983 (R)
Fenhexamid (215) 2005 (T,R)
Fenitrothion (037) 1969 (T,R), 1974 (T,R), 1976 (R), 1977 (T,R), 1979(R), 1982, (T) 1983 (R), 1984 (T,R), 1986 (T,R), 1987 (R and corr. to 1986 R evaluation), 1988 (T), 1989 (R), 2000 (T), 2003 (R), 2004 (R, corr. to 2003 report), 2007 (T, R)
Fenpropathrin (185) 1993 (T,R), 2006 (R)
Fenpropimorph (188) 1994 (T), 1995 (R), 1999 (R), 2001 (T), 2004 (T)
Fenpyroximate (193) 1995 (T,R), 1996 (corr. to 1995 report.), 1999 (R), 2004 (T), 2007 (T)
Fensulfothion (038) 1972 (T,R), 1982 (T), 1983 (R)
Fenthion (039) 1971 (T,R), 1975 (T,R), 1977 (R), 1978 (T,R), 1979 (T), 1980 (T), 1983 (R), 1989 (R), 1995 (T,R,E), 1996 (corr. to 1995 report), 1997 (T), 2000 (R)
Fentin compounds (040) 1965 (T), 1970 (T,R), 1972 (R), 1986 (R), 1991 (T,R), 1993 (R), 1994 (R)
Fenvalerate (119) 1979 (T,R), 1981 (T,R), 1982 (T), 1984 (T,R), 1985 (R), 1986 (T,R), 1987 (R and corr. to 1986 report), 1988 (R), 1990 (R), 1991 (corr. to 1990 R evaluation)
Ferbam See Dithiocarbamates, 1965 (T), 1967 (T,R), 1996 (T,R)
Fipronil (202) 1997 (T), 2000 (T), 2001 (R)
Fipronil-desulfinyl 1997 (T)

Annex 2 389
Flucythrinate (152) 1985 (T, R), 1987 (R), 1988 (R), 1989 (R), 1990 (R), 1993 (R)
Fludioxonil (211) 2004 (T,R), 2006 (R)
Flumethrin (195) 1996 (T,R)
Flusilazole (165) 1989 (T, R), 1990 (R), 1991 (R), 1993 (R), 1995 (T), 2007 (T, R)
Flutolanil (205) 2002 (T, R)
Folpet (041) 1969 (T,R), 1973 (T), 1974 (R), 1982 (T), 1984 (T,R), 1986 (T), 1987 (R), 1990 (T,R), 1991 (corr. to 1990 R evaluation), 1993 (T,R), 1994 (R), 1995 (T), 1997 (R), 1998 (R), 1999(R) , 2002 (T), 2004 (T), 2007 (T)
Formothion (042) 1969 (T,R), 1972 (R), 1973 (T,R), 1978 (R), 1998 (R)
Glufosinate-ammonium (175) 1991 (T,R), 1992 (corr. to 1991 report, Annex I), 1994 (R), 1998 (R), 1999 (T,R)
Glyphosate (158) 1986 (T,R), 1987 (R and corr. to 1986 report), 1988 (R), 1994 (R), 1997 (T,R), 2004 (T), 2005 (R)
Guazatine (114) 1978 (T.R), 1980 (R), 1997 (T,R)
Haloxyfop (194) 1995 (T,R), 1996 (R and corr. to 1995 report), 2001 (R), 2006 (T)
Heptachlor (043) 1965 (T), 1966 (T,R), 1967 (R), 1968 (R), 1969 (R), 1970 (T,R), 1974 (R), 1975 (R), 1977 (R), 1987 (R), 1991 (T,R), 1992 (corr. to 1991 report, Annex I), 1993 (R), 1994 (R)
Hexachlorobenzene (044) 1969 (T,R), 1973 (T,R), 1974 (T,R), 1978(T), 1985 (R)
Hexaconazole (170) 1990 (T,R), 1991 (R and corr. to 1990 R evaluation), 1993 (R)
Hexythiazox (176) 1991 (T,R), 1994 (R), 1998 (R), 2008 (T)
Hydrogen cyanide (045) 1965 (T,R)
Hydrogen phosphide (046) 1965 (T,R), 1966 (T,R), 1967 (R), 1969 (R), 1971 (R)
Imazalil (110) 1977 (T,R), 1980 (T,R), 1984 (T,R), 1985 (T,R), 1986 (T), 1988 (R), 1989 (R), 1991 (T), 1994 (R), 2000 (T), 2001 (T), 2005 (T)
Imidacloprid (206) 2001 (T), 2002 (R), 2006 (R), 2008 (R)
Indoxacarb (216) 2005 (T,R), 2007 (R)
Iprodione (111) 1977 (T,R), 1980 (R), 1992 (T), 1994 (R), 1995 (T), 2001 (R)
Isofenphos (131) 1981 (T,R), 1982 (T,R), 1984 (R), 1985 (R), 1986 (T,R), 1988 (R), 1992 (R)
Kresoxim-methyl (199) 1998 (T,R), 2001 (R)
Lead arsenate 1965 (T), 1968 (T,R)
Leptophos (088) 1974 (T,R), 1975 (T,R), 1978 (T,R)
Lindane (048) 1965 (T), 1966 (T,R), 1967 (R), 1968 (R), 1969 (R), 1970 (T,R, published as Annex VI to 1971 evaluations), 1973 (T,R), 1974 (R), 1975 (R),

390 Annex 2
1977 (T,R), 1978 (R), 1979 (R), 1989 (T,R), 1997 (T), 2002 (T), 2003 (R), 2004 (corr. to 2003 report)
Malathion (049) 1965 (T), 1966 (T,R), 1967 (corr. to 1966 R evaluation), 1968 (R), 1969 (R), 1970 (R), 1973 (R), 1975 (R), 1977 (R), 1984 (R), 1997 (T), 1999 (R), 2000 (R), 2003 (T), 2004 (R), 2008 (R)
Maleic hydrazide (102) 1976 (T,R), 1977 (T,R), 1980 (T), 1984 (T,R), 1996 (T), 1998 (R)
Mancozeb (050) 1967 (T,R), 1970 (T,R), 1974 (R), 1977 (R), 1980 (T,R), 1993 (T,R)
Mandipropamid (231) 2008 (T, R)
Maneb See Dithiocarbamates, 1965 (T), 1967 (T,R), 1987 (T), 1993 (T,R)
Mecarbam (124) 1980 (T,R), 1983 (T,R), 1985 (T,R), 1986 (T,R), 1987 (R)
Metalaxyl (138) 1982 (T,R), 1984 (R), 1985 (R), 1986 (R), 1987 (R), 1989 (R), 1990 (R), 1992 (R), 1995 (R)
Metalaxyl –M (212) 2002 (T), 2004 (R)
Methacrifos (125) 1980 (T,R), 1982 (T), 1986 (T), 1988 (T), 1990 (T,R), 1992 (R)
Methamidophos (100) 1976 (T,R), 1979 (R), 1981 (R), 1982 (T,R ), 1984 (R), 1985 (T), 1989 (R), 1990 (T,R), 1994 (R), 1996 (R), 1997 (R), 2002 (T), 2003 (R), 2004 (R, corr. to 2003 report)
Methidathion (051) 1972 (T,R), 1975 (T,R), 1979 (R), 1992 (T,R), 1994 (R), 1997 (T)
Methiocarb (132) 1981 (T,R), 1983 (T,R), 1984 (T), 1985 (T), 1986 (R), 1987 (T,R), 1988 (R), 1998 (T), 1999 (R), 2005 (R)
Methomyl (094) 1975 (R), 1976 (R), 1977 (R), 1978 (R), 1986 (T,R), 1987 (R), 1988 (R), 1989 (T,R), 1990 (R), 1991 (R), 2001 (T,R), 2004 (R), 2008 (R)
Methoprene (147) 1984 (T,R), 1986 (R), 1987 (T and corr. to 1986 report), 1988 (R), 1989 (R), 2001 (T), 2005 (R)
Methoxychlor 1965 (T), 1977 (T)
Methoxyfenozide (209) 2003 (T, R), 2004 (corr. to 2003 report), 2006 (R)
Methyl bromide (052) See Bromomethane
Metiram (186) 1993 (T), 1995 (R)
Mevinphos (053) 1965 (T), 1972 (T,R), 1996 (T), 1997 (E,R), 2000 (R)
MGK 264 1967 (T,R)
Monocrotophos (054) 1972 (T,R), 1975 (T,R), 1991 (T,R), 1993 (T), 1994 (R)
Myclobutanil (181) 1992 (T,R), 1997 (R), 1998 (R)
Nabam See Dithiocarbamates, 1965 (T), 1976 (T,R)
Nitrofen (140) 1983 (T,R)
Novaluron (217) 2005 (T,R)
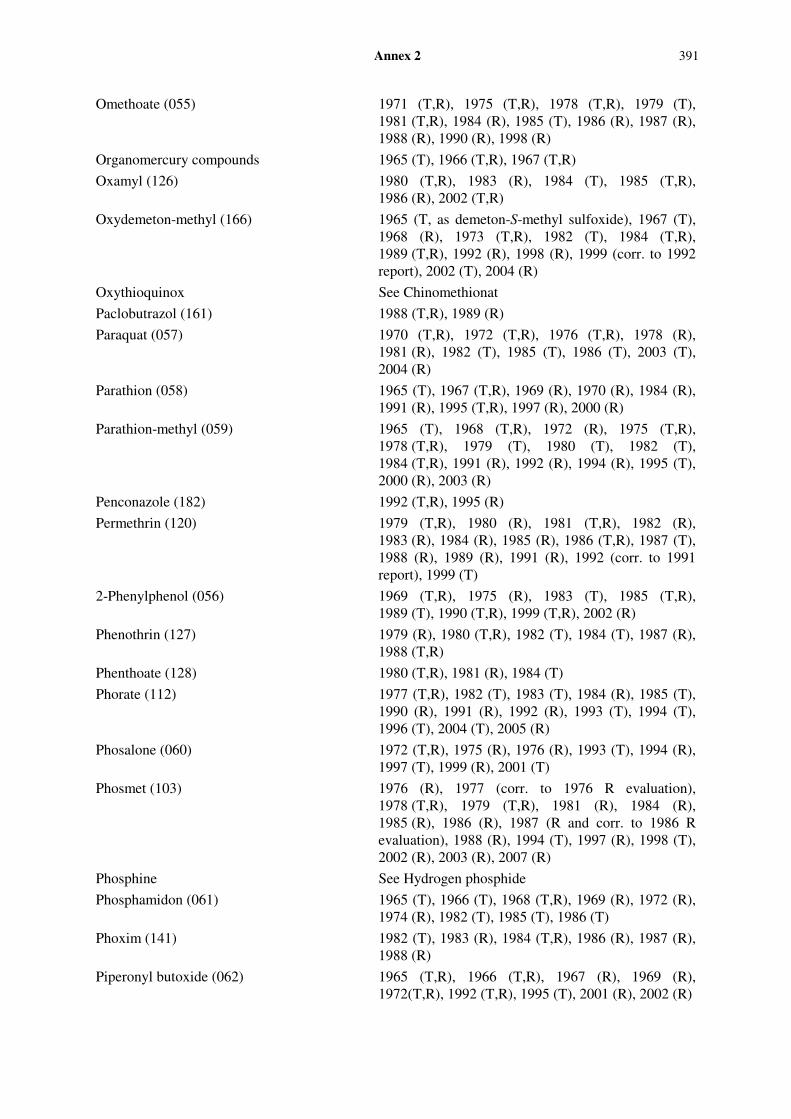
Annex 2 391
Omethoate (055) 1971 (T,R), 1975 (T,R), 1978 (T,R), 1979 (T), 1981 (T,R), 1984 (R), 1985 (T), 1986 (R), 1987 (R), 1988 (R), 1990 (R), 1998 (R)
Organomercury compounds 1965 (T), 1966 (T,R), 1967 (T,R)
Oxamyl (126) 1980 (T,R), 1983 (R), 1984 (T), 1985 (T,R), 1986 (R), 2002 (T,R)
Oxydemeton-methyl (166) 1965 (T, as demeton-S-methyl sulfoxide), 1967 (T), 1968 (R), 1973 (T,R), 1982 (T), 1984 (T,R), 1989 (T,R), 1992 (R), 1998 (R), 1999 (corr. to 1992 report), 2002 (T), 2004 (R)
Oxythioquinox See Chinomethionat
Paclobutrazol (161) 1988 (T,R), 1989 (R)
Paraquat (057) 1970 (T,R), 1972 (T,R), 1976 (T,R), 1978 (R), 1981 (R), 1982 (T), 1985 (T), 1986 (T), 2003 (T), 2004 (R)
Parathion (058) 1965 (T), 1967 (T,R), 1969 (R), 1970 (R), 1984 (R), 1991 (R), 1995 (T,R), 1997 (R), 2000 (R)
Parathion-methyl (059) 1965 (T), 1968 (T,R), 1972 (R), 1975 (T,R), 1978 (T,R), 1979 (T), 1980 (T), 1982 (T), 1984 (T,R), 1991 (R), 1992 (R), 1994 (R), 1995 (T), 2000 (R), 2003 (R)
Penconazole (182) 1992 (T,R), 1995 (R)
Permethrin (120) 1979 (T,R), 1980 (R), 1981 (T,R), 1982 (R), 1983 (R), 1984 (R), 1985 (R), 1986 (T,R), 1987 (T), 1988 (R), 1989 (R), 1991 (R), 1992 (corr. to 1991 report), 1999 (T)
2-Phenylphenol (056) 1969 (T,R), 1975 (R), 1983 (T), 1985 (T,R), 1989 (T), 1990 (T,R), 1999 (T,R), 2002 (R)
Phenothrin (127) 1979 (R), 1980 (T,R), 1982 (T), 1984 (T), 1987 (R), 1988 (T,R)
Phenthoate (128) 1980 (T,R), 1981 (R), 1984 (T)
Phorate (112) 1977 (T,R), 1982 (T), 1983 (T), 1984 (R), 1985 (T), 1990 (R), 1991 (R), 1992 (R), 1993 (T), 1994 (T), 1996 (T), 2004 (T), 2005 (R)
Phosalone (060) 1972 (T,R), 1975 (R), 1976 (R), 1993 (T), 1994 (R), 1997 (T), 1999 (R), 2001 (T)
Phosmet (103) 1976 (R), 1977 (corr. to 1976 R evaluation), 1978 (T,R), 1979 (T,R), 1981 (R), 1984 (R), 1985 (R), 1986 (R), 1987 (R and corr. to 1986 R evaluation), 1988 (R), 1994 (T), 1997 (R), 1998 (T), 2002 (R), 2003 (R), 2007 (R)
Phosphine See Hydrogen phosphide
Phosphamidon (061) 1965 (T), 1966 (T), 1968 (T,R), 1969 (R), 1972 (R), 1974 (R), 1982 (T), 1985 (T), 1986 (T)
Phoxim (141) 1982 (T), 1983 (R), 1984 (T,R), 1986 (R), 1987 (R), 1988 (R)
Piperonyl butoxide (062) 1965 (T,R), 1966 (T,R), 1967 (R), 1969 (R), 1972(T,R), 1992 (T,R), 1995 (T), 2001 (R), 2002 (R)

392 Annex 2
Pirimicarb (101) 1976 (T,R), 1978 (T,R), 1979 (R), 1981 (T,R), 1982 (T), 1985 (R), 2004 (T), 2006 (R)
Pirimiphos-methyl (086) 1974 (T,R), 1976 (T,R), 1977 (R), 1979 (R), 1983 (R), 1985 (R), 1992 (T), 1994 (R), 2003 (R), 2004 (R, corr. to 2003 report), 2006 (T)
Prochloraz (142) 1983 (T,R), 1985 (R), 1987 (R), 1988 (R), 1989 (R), 1990 (R), 1991 (corr. to 1990 report, Annex I, and R evaluation), 1992 (R), 2001 (T), 2004 (R)
Procymidone(136) 1981 (R), 1982 (T), 1989 (T,R), 1990 (R), 1991 (corr. to 1990 Annex I), 1993 (R), 1998 (R), 2007 (T)
Profenofos (171) 1990 (T,R), 1992 (R), 1994 (R), 1995 (R), 2007 (T), 2008 (R)
Propamocarb (148) 1984 (T,R), 1986 (T,R), 1987 (R), 2005 (T), 2006 (R)
Propargite (113) 1977 (T,R), 1978 (R), 1979 (R), 1980 (T,R), 1982 (T,R), 1999 (T), 2002 (R), 2006 (R)
Propham (183) 1965 (T), 1992 (T,R)
Propiconazole (160) 1987 (T,R), 1991 (R), 1994 (R), 2004 (T), 2007 (R)
Propineb 1977 (T,R), 1980 (T), 1983 (T), 1984 (R), 1985 (T,R), 1993 (T,R), 2004 (R)
Propoxur (075) 1973 (T,R), 1977 (R), 1981 (R), 1983 (R), 1989 (T), 1991 (R), 1996 (R)
Propylenethiourea (PTU, 150) 1993 (T,R), 1994 (R), 1999 (T)
Prothioconazole (232) 2008 (T, R)
Pyraclostrobin (210) 2003 (T), 2004 (R), 2006 (R)
Pyrazophos (153) 1985 (T,R), 1987 (R), 1992 (T,R), 1993 (R)
Pyrethrins (063) 1965 (T), 1966 (T,R), 1967 (R), 1968 (R), 1969 (R), 1970 (T), 1972 (T,R), 1974 (R), 1999 (T), 2000 (R), 2003 (T,R), 2005 (R)
Pyrimethanil 2007 (T, R)
Pyriproxyfen (200) 1999 (R,T), 2000 (R), 2001 (T)
Quinoxyfen (223) 2006 (T, R)
Quintozene (064) 1969 (T,R) 1973 (T,R), 1974 (R), 1975 (T,R), 1976 (Annex I, corr. to 1975 R evaluation), 1977 (T,R), 1995 (T,R), 1998 (R)
Spinetoram (233) 2008 (T, R)
Spinosad (203) 2001 (T, R, 2004 (R)
Spirotetramat (234) 2008 (T, R)
Sulfuryl fluoride (218) 2005 (T, R)
2,4,5-T (121) 1970 (T,R), 1979 (T,R), 1981 (T)
Tebuconazole (189) 1994 (T,R), 1996 (corr. to Annex II of 1995 report), 1997 (R), 2008 (R)
Tebufenozide (196) 1996 (T,R), 1997 (R), 1999 (R), 2001 (T,R), 2003(T)
Tecnazine (115) 1974 (T,R), 1978 (T,R), 1981 (R), 1983 (T), 1987 (R), 1989 (R), 1994 (T,R)
Teflubenzuron (190) 1994 (T), 1996 (R)
Temephos 2006 (T)

Annex 2 393
Terbufos (167) 1989 (T,R), 1990 (T,R), 2003 (T), 2005 (R)
Thiabendazole (065) 1970 (T,R), 1971 (R), 1972 (R), 1975 (R), 1977 (T,R), 1979 (R), 1981 (R), 1997 (R), 2000 (R), 2006 (T, R)
Thiacloprid (223) 2006 (T, R)
Thiodicarb (154) 1985 (T,R), 1986 (T), 1987 (R), 1988 (R), 2000 (T),
2001 (R)
Thiometon (076) 1969 (T,R), 1973 (T,R), 1976 (R), 1979 (T,R), 1988 (R)
Thiophanate-methyl (077) 1973 (T,R), 1975 (T,R), 1977 (T), 1978 (R), 1988 (R), 2002 (R), 1990 (R), 1994 (R), 1995 (T,E), 1998 (T,R), 2006 (T)
Thiram (105) See Dithiocarbamates, 1965 (T), 1967 (T,R), 1970 (T,R), 1974 (T), 1977 (T), 1983 (R), 1984 (R), 1985 (T,R), 1987 (T), 1988 (R), 1989 (R), 1992 (T), 1996 (R)
Tolclofos-methyl (191) 1994 (T,R) 1996 (corr. to Annex II of 1995 report)
Tolylfluanid (162) 1988 (T,R), 1990 (R), 1991 (corr. to 1990 report), 2002 (T,R), 2003 (R)
Toxaphene See Camphechlor
Triadimefon (133) 1979 (R), 1981 (T,R), 1983 (T,R), 1984 (R), 1985 (T,R), 1986 (R), 1987 (R and corr. to 1986 R evaluation), 1988 (R), 1989 (R), 1992 (R), 1995 (R), 2004 (T), 2007 (R)
Triadimenol (168) 1989 (T, R), 1992 (R), 1995 (R), 2004 (T), 2007 (R)
Triazolylalanine 1989 (T, R)
Triazophos (143) 1982 (T), 1983 (R), 1984 (corr. to 1983 report, Annex I), 1986 (T, R), 1990 (R), 1991 (T and corr. to 1990 R evaluation), 1992 (R), 1993 (T,R), 2002 (T), 2007 (R)
Trichlorfon (066) 1971 (T,R), 1975 (T,R), 1978 (T,R), 1987 (R)
Trichloronat 1971 (T,R)
Trichloroethylene 1968 (R)
Tricyclohexyltin hydroxide See Cyhexatin
Trifloxystrobin (213) 2004 (T, R)
Triforine (116) 1977 (T), 1978 (T, R), 1997 (T)
Triphenyltin compounds See Fentin compounds
Vamidothion (078) 1973 (T, R), 1982 (T), 1985 (T,R), 1987 (R), 1988 (T), 1990 (R), 1992 (R)
Vinclozolin (159) 1986 (T, R), 1987 (R and corr. to 1986 report and R evaluation), 1988 (T,R), 1989 (R), 1990 (R), 1992 (R), 1995 (T)
Zineb (105) See Dithiocarbamates, 1965 (T), 1967 (T, R), 1993 (T)
Ziram (105) See Dithiocarbamates, 1965 (T), 1967 (T, R), 1996 (T, R)
Zoxamide (227) 2007 (T, R)

An
nex
3
AN
NE
X 3
: IN
TE
RN
AT
ION
AL
ES
TIM
AT
ED
DA
ILY
IN
TA
KE
S O
F P
ES
TIC
IDE
RE
SID
UE
S
A
ZO
XY
ST
RO
BIN
(2
29
) In
tern
atio
nal E
stim
ated
Dai
ly In
take
(IE
DI)
AD
I = 0
- 0
.2 m
g/kg
bw
STM
R o
r D
iets
: g/p
erso
n/da
y In
take
= d
aily
inta
ke: µ
g/pe
rson
STM
R-P
A
B
C
D
E
F
Cod
ex
Cod
e C
omm
odit
y m
g/kg
di
et
inta
ke
diet
in
take
di
et
inta
ke
diet
in
take
di
et
inta
ke
diet
in
take
VS
0620
A
rtic
hoke
glo
be
1.8
0.0
0.0
10.0
18
.0
2.1
3.8
0.1
0.2
0.8
1.4
0.1
0.2
VS
0621
A
spar
agus
0.
01
0.0
0.0
1.1
0.0
0.6
0.0
0.2
0.0
1.2
0.0
0.1
0.0
FI 0
327
Ban
ana
0.03
38
.8
1.2
17.4
0.
5 16
.0
0.5
6.6
0.2
21.5
0.
6 33
.8
1.0
GC
064
0 B
arle
y (i
ncl p
ot, i
ncl p
earl
ed, i
ncl f
lour
& g
rits
, ex
cl b
eer)
0.
08
40.6
3.
2 0.
0 0.
0 93
.9
7.5
0.0
0.0
0.0
0.0
3.8
0.3
- B
arle
y be
er
0.00
2 18
.3
0.0
84.1
0.
2 4.
1 0.
0 66
.0
0.1
243.
1 0.
5 16
1.3
0.3
FB 0
264
Bla
ckbe
rrie
s 1
0.0
0.0
0.1
0.1
0.0
0.0
0.3
0.3
0.1
0.1
0.3
0.3
FB 0
020
Blu
eber
ries
1
0.0
0.0
0.0
0.0
0.0
0.0
0.2
0.2
0.3
0.3
0.8
0.8
FB 4
079
Boy
senb
erry
1
0.0
0.0
0.0
0.0
0.0
0.0
0.3
0.3
0.0
0.0
0.3
0.3
VB
040
2 B
russ
els
spro
uts
1.2
0.0
0.0
0.1
0.1
2.8
3.4
5.5
6.6
1.5
1.8
1.9
2.3
VA
003
5 B
ulb
vege
tabl
es
2.2
8.5
18.7
60
.3
132.
7 37
.7
82.9
37
.2
81.8
31
.8
70.0
16
.7
36.7
VB
004
1 C
abba
ges,
Hea
d 1.
2 1.
2 1.
4 14
.4
17.3
2.
7 3.
2 16
.4
19.7
15
.4
18.5
18
.5
22.2
VS
0624
C
eler
y 0.
43
0.0
0.0
0.9
0.4
0.0
0.0
2.0
0.9
1.5
0.6
0.0
0.0
VC
042
3 C
hayo
te
0.17
N
D
- N
D
- N
D
- N
D
- N
D
- N
D
-
FC 0
001
Cit
rus
frui
t (in
cl le
mon
juic
e, in
cl m
anda
rin
juic
e,
excl
ora
nge
juic
e, in
cl g
rape
frui
t jui
ce, i
ncl N
ES
juic
e)
4.9
15.7
76
.9
96.7
47
3.9
55.3
27
0.9
25.3
12
3.9
23.4
11
4.9
16.2
79
.5
SO 0
691
Cot
ton
seed
(fo
r oi
l pro
cess
ing
only
) 0.
01
5.6
0.1
30.6
0.
3 10
.6
0.1
41.3
0.
4 0.
0 0.
0 1.
9 0.
0
FB 0
265
Cra
nber
ries
0.
23
0.1
0.0
0.0
0.0
0.0
0.0
0.3
0.1
0.0
0.0
0.6
0.1
VC
042
4 C
ucum
ber
0.17
0.
3 0.
1 12
.7
2.2
5.9
1.0
11.5
2.
0 6.
1 1.
0 7.
1 1.
2
FB 0
021
Cur
rant
s, r
ed, b
lack
, whi
te
1 0.
0 0.
0 0.
0 0.
0 0.
0 0.
0 2.
2 2.
2 3.
1 3.
1 2.
0 2.
0
FB 0
266
Dew
berr
ies,
incl
boy
senb
erry
& lo
ganb
erry
1
0.0
0.0
0.0
0.0
0.0
0.0
0.3
0.3
0.0
0.0
0.3
0.3
DH
017
0 D
ried
her
bs
152
ND
-
ND
-
ND
-
ND
-
ND
-
ND
-
MO
010
5 E
dibl
e of
fal (
mam
mal
ian)
0.
01
3.9
0.0
14.4
0.
1 5.
2 0.
1 11
.8
0.1
11.7
0.
1 7.
6 0.
1
VO
044
0 E
gg p
lant
(=
aub
ergi
ne)
0.35
1.
7 0.
6 17
.5
6.1
12.3
4.
3 1.
7 0.
6 0.
8 0.
3 0.
4 0.
1
PE 0
112
Egg
s 0
2.5
0.0
29.7
0.
0 25
.1
0.0
24.5
0.
0 37
.8
0.0
27.4
0.
0
FB 0
267
Eld
erbe
rrie
s 1
ND
-
ND
-
ND
-
ND
-
ND
-
ND
-
VB
004
2 Fl
ower
head
bra
ssic
as
1.2
0.2
0.2
11.1
13
.3
3.6
4.3
0.4
0.5
7.7
9.2
4.1
4.9
VC
042
5 G
herk
in
0.17
0.
3 0.
1 12
.7
2.2
5.9
1.0
11.5
2.
0 6.
1 1.
0 7.
1 1.
2
FB 0
268
Goo
sebe
rrie
s 1
0.0
0.0
12.0
12
.0
0.0
0.0
0.6
0.6
1.1
1.1
0.2
0.2
FB 0
269
Gra
pe (
excl
dri
ed, e
xcl j
uice
, exc
l win
e)
0.53
1.
9 1.
0 9.
2 4.
9 23
.8
12.6
9.
8 5.
2 0.
0 0.
0 0.
0 0.
0

A
nn
ex 3
396
AZ
OX
YS
TR
OB
IN (
22
9)
Inte
rnat
iona
l Est
imat
ed D
aily
Inta
ke (
IED
I)
A
DI =
0 -
0.2
mg/
kg b
w
STM
R o
r D
iets
: g/p
erso
n/da
y In
take
= d
aily
inta
ke: µ
g/pe
rson
STM
R-P
A
B
C
D
E
F
Cod
ex
Cod
e C
omm
odit
y m
g/kg
di
et
inta
ke
diet
in
take
di
et
inta
ke
diet
in
take
di
et
inta
ke
diet
in
take
JF 0
269
Gra
pe ju
ice
0.19
0.
0 0.
0 0.
1 0.
0 0.
1 0.
0 0.
1 0.
0 1.
4 0.
3 1.
0 0.
2
DF
0269
G
rape
, dri
ed (
= c
urra
nts,
rai
sins
and
sul
tana
s)
0.24
0.
0 0.
0 2.
9 0.
7 0.
4 0.
1 0.
4 0.
1 2.
3 0.
6 1.
7 0.
4
HH
072
0 H
erbs
23
N
D
- N
D
- N
D
- N
D
- N
D
- N
D
-
DH
110
0 H
ops,
dry
11
0.
1 1.
1 0.
1 1.
1 0.
1 1.
1 0.
1 1.
1 0.
3 3.
3 0.
1 1.
1
VB
040
5 K
ohlr
abi
1.2
0.3
0.4
0.1
0.1
0.0
0.0
5.5
6.6
12.3
14
.8
1.9
2.3
VP
0060
L
egum
e ve
geta
bles
1
6.1
6.1
23.0
23
.0
18.0
18
.0
12.8
12
.8
26.9
26
.9
5.3
5.3
- L
ettu
ce (
head
, lea
f)
0.28
0.
1 0.
0 21
.5
6.0
2.3
0.6
0.2
0.1
5.5
1.5
18.0
5.
0
CF
1255
M
aize
flo
ur
0.01
68
.9
0.7
15.4
0.
2 51
.3
0.5
16.6
0.
2 14
.7
0.1
2.0
0.0
GC
064
5 M
aize
(ex
cl f
lour
, exc
l oil,
incl
bee
r)
0.01
0.
0 0.
0 1.
4 0.
0 51
.4
0.5
11.9
0.
1 0.
2 0.
0 0.
2 0.
0
OR
064
5 M
aize
oil,
edi
ble
0.06
0.
1 0.
0 4.
0 0.
2 2.
3 0.
1 0.
5 0.
0 0.
9 0.
1 0.
2 0.
0
MF
0100
M
amm
alia
n fa
ts (
exce
pt m
ilk f
ats)
0.
01
0.8
0.0
10.0
0.
1 0.
9 0.
0 6.
6 0.
1 11
.8
0.1
3.7
0.0
FI 0
345
Man
go (
incl
juic
e, in
cl p
ulp)
0.
05
6.3
0.3
1.0
0.1
4.6
0.2
0.2
0.0
0.7
0.0
0.3
0.0
MM
009
5 M
eat f
rom
mam
mal
s ot
her
than
mar
ine
mam
mal
s 0.
01
27.7
0.
3 11
6.5
1.2
38.5
0.
4 55
.1
0.6
90.2
0.
9 13
1.3
1.3
VC
004
6 M
elon
s, e
xcep
t wat
erm
elon
0.
02
3.6
0.1
26.7
0.
5 22
.6
0.5
11.5
0.
2 5.
6 0.
1 2.
0 0.
0
ML
0106
M
ilks
(exc
l pro
cess
ed p
rodu
cts)
0.
01
68.8
0.
7 19
0.6
1.9
79.4
0.
8 30
2.6
3.0
179.
6 1.
8 23
7.9
2.4
GC
064
7 O
ats
(inc
l rol
led)
0.
08
1.4
0.1
0.6
0.0
0.2
0.0
4.2
0.3
5.7
0.5
8.9
0.7
VO
044
2 O
kra
0.35
3.
9 1.
4 1.
0 0.
4 5.
3 1.
9 0.
1 0.
0 0.
0 0.
0 0.
0 0.
0
JF 0
004
Ora
nge
juic
e 0.
39
0.0
0.0
2.1
0.8
4.4
1.7
1.4
0.5
16.2
6.
3 22
.6
8.8
FI 0
350
Papa
ya
0.02
5.
1 0.
1 0.
1 0.
0 0.
0 0.
0 0.
0 0.
0 0.
1 0.
0 0.
0 0.
0
OR
069
7 Pe
anut
oil,
edi
ble
0.03
1.
7 0.
1 0.
8 0.
0 0.
5 0.
0 0.
1 0.
0 1.
4 0.
0 0.
4 0.
0
SO 0
697
Pean
ut, s
helle
d (e
xcl o
il)
0.01
1.
5 0.
0 1.
3 0.
0 1.
0 0.
0 0.
5 0.
0 0.
8 0.
0 0.
5 0.
0
VO
005
1 Pe
pper
s 0.
35
1.4
0.5
29.9
10
.5
13.0
4.
6 6.
3 2.
2 6.
2 2.
2 4.
0 1.
4
TN
067
5 Pi
stac
hio
nut
0.44
0.
0 0.
0 0.
7 0.
3 0.
5 0.
2 0.
9 0.
4 0.
3 0.
1 0.
0 0.
0
FI 0
354
Plan
tain
0.
03
275.
7 8.
3 1.
7 0.
1 0.
0 0.
0 0.
1 0.
0 0.
3 0.
0 0.
0 0.
0
DF
0014
Pl
um, d
ried
(pr
unes
) 0.
14
0.0
0.0
0.2
0.0
0.0
0.0
0.1
0.0
0.5
0.1
0.6
0.1
PM 0
110
Poul
try
mea
t 0
7.1
0.0
58.5
0.
0 31
.9
0.0
24.0
0.
0 61
.0
0.0
27.3
0.
0
PO 0
111
Poul
try,
Edi
ble
offa
l of
0 0.
4 0.
0 0.
4 0.
0 1.
7 0.
0 0.
1 0.
0 0.
6 0.
0 0.
2 0.
0
FB 0
272
Ras
pber
ries
, red
, bla
ck
1 0.
0 0.
0 0.
0 0.
0 0.
0 0.
0 1.
8 1.
8 0.
9 0.
9 0.
2 0.
2
GC
064
9 R
ice
(inc
l hus
ked,
exc
l pol
ishe
d)
0.68
46
.3
31.5
0.
3 0.
2 3.
4 2.
3 9.
1 6.
2 4.
3 2.
9 0.
6 0.
4
CM
120
5 R
ice,
pol
ishe
d (i
ncl f
lour
) 0.
06
29.8
1.
8 20
.9
1.3
60.8
3.
6 16
.1
1.0
5.6
0.3
8.1
0.5
VR
0075
R
oot a
nd tu
ber
vege
tabl
es
0.23
52
8.2
121.
5 35
2.8
81.1
78
.5
18.0
27
0.3
62.2
32
4.1
74.5
26
1.3
60.1
GC
065
0 R
ye (
incl
flo
ur)
0.01
0.
1 0.
0 3.
7 0.
0 0.
3 0.
0 24
.3
0.2
25.8
0.
3 45
.8
0.5

A
nn
ex 3
397
AZ
OX
YS
TR
OB
IN (
22
9)
Inte
rnat
iona
l Est
imat
ed D
aily
Inta
ke (
IED
I)
A
DI =
0 -
0.2
mg/
kg b
w
STM
R o
r D
iets
: g/p
erso
n/da
y In
take
= d
aily
inta
ke: µ
g/pe
rson
STM
R-P
A
B
C
D
E
F
Cod
ex
Cod
e C
omm
odit
y m
g/kg
di
et
inta
ke
diet
in
take
di
et
inta
ke
diet
in
take
di
et
inta
ke
diet
in
take
VD
054
1 So
ya b
ean
(dry
, exc
l oil)
0.
06
0.9
0.1
0.0
0.0
0.7
0.0
0.0
0.0
0.0
0.0
0.0
0.0
OR
054
1 So
ya b
ean
oil,
refi
ned
0.05
1.
6 0.
1 6.
5 0.
3 6.
0 0.
3 4.
0 0.
2 6.
3 0.
3 7.
0 0.
4
VC
043
1 Sq
uash
, sum
mer
(=
cou
rget
te, z
ucch
ini)
0.
17
0.0
0.0
8.3
1.4
11.4
1.
9 7.
3 1.
2 3.
2 0.
5 0.
3 0.
1
FS 0
012
Ston
e fr
uit (
excl
dri
ed p
lum
s, in
cl d
ried
apr
icot
s)
0.74
0.
7 0.
5 44
.1
32.6
14
.1
10.4
26
.6
19.7
26
.3
19.4
8.
3 6.
1
FB 0
275
Stra
wbe
rry
1.3
0.0
0.0
5.0
6.5
2.0
2.6
1.7
2.2
5.2
6.8
4.1
5.3
VR
059
6 Su
gar
beet
0.
08
0.0
0.0
40.7
3.
3 0.
0 0.
0 0.
1 0.
0 6.
0 0.
5 0.
1 0.
0
SO 0
702
Sunf
low
er s
eed
(exc
l oil)
0.
04
0.0
0.0
13.1
0.
5 0.
0 0.
0 0.
1 0.
0 0.
1 0.
0 0.
1 0.
0
OR
070
2 Su
nflo
wer
see
d oi
l, ed
ible
0.
01
0.3
0.0
13.1
0.
1 8.
6 0.
1 12
.3
0.1
8.8
0.1
2.2
0.0
VO
044
8 To
mat
o (e
xcl j
uice
, exc
l pas
te, i
ncl p
eele
d)
0.35
3.
3 1.
2 17
9.2
62.7
10
3.5
36.2
54
.1
18.9
7.
8 2.
7 3.
9 1.
4
JF 0
448
Tom
ato
juic
e 0.
13
5.2
0.7
0.5
0.1
0.4
0.1
2.1
0.3
6.9
0.9
15.2
2.
0
-d
Tom
ato
past
e 0.
91
0.5
0.5
1.3
1.2
3.5
3.2
1.0
0.9
3.8
3.5
4.5
4.1
TN
008
5 T
ree
nuts
0.
01
4.2
0.0
21.5
0.
2 3.
9 0.
0 3.
0 0.
0 5.
5 0.
1 10
.2
0.1
GC
065
3 T
riti
cale
(in
cl f
lour
) 0.
01
0.0
0.0
115.
8 1.
2 0.
0 0.
0 0.
0 0.
0 0.
3 0.
0 0.
0 0.
0
VC
043
2 W
ater
mel
on
0.02
6.
1 0.
1 43
.1
0.9
47.1
0.
9 25
.8
0.5
4.4
0.1
6.0
0.1
GC
065
4 W
heat
(ex
cl b
ulgu
r w
hole
mea
l, ex
cl f
lour
) 0.
01
0.0
0.0
0.0
0.0
0.0
0.0
0.0
0.0
0.1
0.0
0.0
0.0
CM
065
4 W
heat
bra
n, u
npro
cess
ed
0.00
4 N
D
- N
D
- N
D
- N
D
- N
D
- N
D
-
CF
1211
W
heat
flo
ur (
incl
mac
aron
i, br
ead,
pas
try,
sta
rch,
gl
uten
) 0.
003
63.4
0.
2 29
6.3
0.9
327.
5 1.
0 30
0.0
0.9
181.
6 0.
5 16
6.2
0.5
CP
1211
W
hite
bre
ad
0.00
1 0.
0 0.
0 0.
1 0.
0 0.
0 0.
0 0.
1 0.
0 0.
1 0.
0 1.
0 0.
0
CP
1212
W
hole
mea
l bre
ad
0.00
1 0.
0 0.
0 0.
1 0.
0 0.
0 0.
0 0.
1 0.
0 0.
1 0.
0 1.
0 0.
0
- W
ine
0.36
1.
3 0.
5 76
.8
27.6
1.
1 0.
4 15
.4
5.5
68.8
24
.8
25.6
9.
2
VC
043
3 W
inte
r sq
uash
(=
pum
pkin
) 0.
02
0.0
0.0
0.5
0.0
1.5
0.0
7.3
0.1
0.0
0.0
0.3
0.0
VS
0469
W
itlo
of c
hico
ry (
spro
uts)
0.
05
0.0
0.0
0.2
0.0
0.0
0.0
0.1
0.0
1.6
0.1
0.0
0.0
To
tal i
ntak
e (µ
g/pe
rson
)=
282.
2
953.
7
508.
1
398.
6
423.
6
274.
2
B
ody
wei
ght p
er r
egio
n (k
g bw
) =
60
60
60
60
60
60
A
DI (
µg/
pers
on)=
12
000
12
000
12
000
12
000
12
000
12
000
%
AD
I=
2.4%
7.9%
4.2%
3.3%
3.5%
2.3%
R
ound
ed %
AD
I=
2%
8%
4%
3%
4%
2%

A
nn
ex 3
398A
ZO
XY
ST
RO
BIN
(2
29
) In
tern
atio
nal E
stim
ated
Dai
ly In
take
(IE
DI)
AD
I = 0
- 0
.2 m
g/kg
bw
STM
R o
r D
iets
: g/p
erso
n/da
y In
take
= d
aily
inta
ke: µ
g/pe
rson
STM
R-P
G
H
I
J K
L
M
C
odex
C
ode
Com
mod
ity
mg/
kg
diet
in
take
di
et
inta
ke
diet
in
take
di
et
inta
ke
diet
in
take
di
et
inta
ke
diet
in
take
VS
0620
A
rtic
hoke
glo
be
1.8
0.1
0.2
0.1
0.2
0.0
0.0
0.0
0.0
0.0
0.0
0.0
0.0
1.0
1.8
VS
0621
A
spar
agus
0.
01
3.7
0.0
0.3
0.0
0.2
0.0
0.0
0.0
0.0
0.0
0.5
0.0
1.1
0.0
FI 0
327
Ban
ana
0.03
21
.4
0.6
36.6
1.
1 11
.4
0.3
9.2
0.3
70.2
2.
1 40
.5
1.2
32.6
1.
0
GC
064
0 B
arle
y (i
ncl p
ot, i
ncl p
earl
ed, i
ncl f
lour
&
grit
s, e
xcl b
eer)
0.
08
1.5
0.1
0.0
0.0
0.0
0.0
0.0
0.0
0.0
0.0
0.4
0.0
0.0
0.0
- B
arle
y be
er
0.00
2 21
.9
0.0
102.
7 0.
2 29
.5
0.1
12.6
0.
0 10
0.9
0.2
82.2
0.
2 21
8.8
0.4
FB 0
264
Bla
ckbe
rrie
s 1
0.0
0.0
0.0
0.0
0.0
0.0
0.0
0.0
0.1
0.1
0.0
0.0
0.3
0.3
FB 0
020
Blu
eber
ries
1
0.0
0.0
0.0
0.0
0.0
0.0
0.0
0.0
0.0
0.0
0.0
0.0
1.3
1.3
FB 4
079
Boy
senb
erry
1
0.0
0.0
0.0
0.0
0.0
0.0
0.0
0.0
0.1
0.1
0.0
0.0
0.0
0.0
VB
040
2 B
russ
els
spro
uts
1.2
3.4
4.1
0.4
0.5
0.0
0.0
0.0
0.0
0.5
0.6
7.9
9.5
0.3
0.4
VA
003
5 B
ulb
vege
tabl
es
2.2
31.6
69
.5
29.6
65
.1
9.7
21.3
19
.6
43.1
25
.7
56.5
47
.2
103.
8 33
.1
72.8
VB
004
1 C
abba
ges,
Hea
d 1.
2 10
.0
12.0
1.
0 1.
2 7.
2 8.
6 1.
0 1.
2 1.
4 1.
7 23
.9
28.7
17
.0
20.4
VS
0624
C
eler
y 0.
43
0.0
0.0
0.3
0.1
0.0
0.0
0.0
0.0
1.0
0.4
0.0
0.0
4.2
1.8
VC
042
3 C
hayo
te
0.17
N
D
- N
D
- N
D
- N
D
- N
D
- N
D
- N
D
-
FC 0
001
Cit
rus
frui
t (in
cl le
mon
juic
e, in
cl m
anda
rin
juic
e, e
xcl o
rang
e ju
ice,
incl
gra
pefr
uit j
uice
, in
cl N
ES
juic
e)
4.9
16.9
83
.0
155.
0 75
9.5
8.6
42.1
42
.5
208.
3 22
0.5
1080
.3
28.9
14
1.5
30.1
14
7.3
SO 0
691
Cot
ton
seed
(fo
r oi
l pro
cess
ing
only
) 0.
01
6.3
0.1
4.4
0.0
6.3
0.1
8.8
0.1
9.4
0.1
34.4
0.
3 7.
5 0.
1
FB 0
265
Cra
nber
ries
0.
23
0.0
0.0
0.0
0.0
0.0
0.0
0.0
0.0
0.0
0.0
0.0
0.0
2.5
0.6
VC
042
4 C
ucum
ber
0.17
7.
9 1.
3 0.
6 0.
1 0.
2 0.
0 0.
0 0.
0 0.
4 0.
1 5.
5 0.
9 5.
3 0.
9
FB 0
021
Cur
rant
s, r
ed, b
lack
, whi
te
1 0.
0 0.
0 0.
0 0.
0 0.
0 0.
0 0.
0 0.
0 0.
0 0.
0 0.
0 0.
0 0.
0 0.
0
FB 0
266
Dew
berr
ies,
incl
boy
senb
erry
& lo
ganb
erry
1
0.0
0.0
0.0
0.0
0.0
0.0
0.0
0.0
0.1
0.1
0.0
0.0
0.1
0.1
DH
017
0 D
ried
her
bs
152
ND
-
ND
-
ND
-
ND
-
ND
-
ND
-
ND
-
MO
010
5 E
dibl
e of
fal (
mam
mal
ian)
0.
01
4.8
0.0
10.7
0.
1 4.
0 0.
0 4.
0 0.
0 6.
5 0.
1 6.
6 0.
1 5.
6 0.
1
VO
044
0 E
gg p
lant
(=
aub
ergi
ne)
0.35
20
.1
7.0
0.1
0.0
0.6
0.2
6.3
2.2
0.5
0.2
6.3
2.2
0.7
0.2
PE 0
112
Egg
s 0
22.1
0.
0 71
.5
0.0
16.6
0.
0 5.
1 0.
0 17
.6
0.0
35.2
0.
0 57
.4
0.0
FB 0
267
Eld
erbe
rrie
s 1
ND
-
ND
-
ND
-
ND
-
ND
-
ND
-
ND
-
VB
004
2 Fl
ower
head
bra
ssic
as
1.2
9.6
11.5
7.
9 9.
5 0.
6 0.
7 0.
2 0.
2 0.
9 1.
1 1.
1 1.
3 8.
0 9.
6
VC
042
5 G
herk
in
0.17
7.
9 1.
3 0.
6 0.
1 0.
2 0.
0 0.
0 0.
0 0.
4 0.
1 5.
5 0.
9 5.
3 0.
9
FB 0
268
Goo
sebe
rrie
s 1
0.0
0.0
0.0
0.0
0.0
0.0
0.0
0.0
1.0
1.0
0.0
0.0
0.0
0.0
FB 0
269
Gra
pe (
excl
dri
ed, e
xcl j
uice
, exc
l win
e)
0.53
1.
2 0.
6 2.
6 1.
4 0.
0 0.
0 0.
2 0.
1 0.
0 0.
0 3.
7 2.
0 0.
0 0.
0
JF 0
269
Gra
pe ju
ice
0.19
0.
0 0.
0 0.
1 0.
0 1.
0 0.
2 0.
0 0.
0 0.
6 0.
1 0.
4 0.
1 3.
6 0.
7

A
nn
ex 3
399A
ZO
XY
ST
RO
BIN
(2
29
) In
tern
atio
nal E
stim
ated
Dai
ly In
take
(IE
DI)
AD
I = 0
- 0
.2 m
g/kg
bw
STM
R o
r D
iets
: g/p
erso
n/da
y In
take
= d
aily
inta
ke: µ
g/pe
rson
STM
R-P
G
H
I
J K
L
M
C
odex
C
ode
Com
mod
ity
mg/
kg
diet
in
take
di
et
inta
ke
diet
in
take
di
et
inta
ke
diet
in
take
di
et
inta
ke
diet
in
take
DF
0269
G
rape
, dri
ed (
= c
urra
nts,
rai
sins
and
sul
tana
s)
0.24
0.
0 0.
0 0.
2 0.
0 0.
2 0.
0 0.
0 0.
0 0.
3 0.
1 0.
4 0.
1 2.
6 0.
6
HH
072
0 H
erbs
23
N
D
- N
D
- N
D
- N
D
- N
D
- N
D
- N
D
-
DH
110
0 H
ops,
dry
11
0.
0 0.
0 0.
1 1.
1 0.
1 1.
1 0.
1 1.
1 0.
1 1.
1 0.
1 1.
1 0.
6 6.
6
VB
040
5 K
ohlr
abi
1.2
3.4
4.1
0.0
0.0
0.0
0.0
0.3
0.4
0.5
0.6
7.9
9.5
0.7
0.8
VP
0060
L
egum
e ve
geta
bles
1
19.6
19
.6
6.2
6.2
6.9
6.9
6.0
6.0
1.7
1.7
29.5
29
.5
26.3
26
.3
- L
ettu
ce (
head
, lea
f)
0.28
2.
4 0.
7 7.
0 2.
0 0.
2 0.
1 0.
6 0.
2 2.
0 0.
6 2.
4 0.
7 18
.2
5.1
CF
1255
M
aize
flo
ur
0.01
28
.8
0.3
248.
8 2.
5 20
6.7
2.1
47.8
0.
5 46
.2
0.5
10.5
0.
1 21
.5
0.2
GC
064
5 M
aize
(ex
cl f
lour
, exc
l oil,
incl
bee
r)
0.01
0.
6 0.
0 0.
0 0.
0 0.
1 0.
0 0.
0 0.
0 7.
7 0.
1 0.
0 0.
0 19
.4
0.2
OR
064
5 M
aize
oil,
edi
ble
0.06
0.
1 0.
0 0.
6 0.
0 1.
8 0.
1 0.
0 0.
0 1.
0 0.
1 1.
6 0.
1 1.
8 0.
1
MF
0100
M
amm
alia
n fa
ts (
exce
pt m
ilk f
ats)
0.
01
2.2
0.0
18.6
0.
2 0.
5 0.
0 0.
8 0.
0 5.
7 0.
1 4.
5 0.
0 18
.2
0.2
FI 0
345
Man
go (
incl
juic
e, in
cl p
ulp)
0.
05
12.7
0.
6 26
.2
1.3
6.1
0.3
12.7
0.
6 9.
2 0.
5 8.
0 0.
4 1.
9 0.
1
MM
00
95
Mea
t fro
m m
amm
als
othe
r th
an m
arin
e m
amm
als
0.01
54
.8
0.5
89.4
0.
9 30
.6
0.3
28.6
0.
3 82
.1
0.8
61.1
0.
6 15
8.3
1.6
VC
004
6 M
elon
s, e
xcep
t wat
erm
elon
0.
02
7.5
0.2
6.1
0.1
0.7
0.0
1.4
0.0
2.5
0.1
6.9
0.1
12.4
0.
2
ML
0106
M
ilks
(exc
l pro
cess
ed p
rodu
cts)
0.
01
66.0
0.
7 12
1.1
1.2
81.6
0.
8 10
2.4
1.0
207.
7 2.
1 57
.0
0.6
287.
9 2.
9
GC
064
7 O
ats
(inc
l rol
led)
0.
08
0.2
0.0
2.0
0.2
0.8
0.1
0.0
0.0
3.5
0.3
0.7
0.1
7.6
0.6
VO
044
2 O
kra
0.35
4.
1 1.
4 1.
0 0.
4 7.
0 2.
5 15
.9
5.6
1.1
0.4
3.9
1.4
0.2
0.1
JF 0
004
Ora
nge
juic
e 0.
39
0.2
0.1
1.0
0.4
3.5
1.4
0.0
0.0
1.3
0.5
6.4
2.5
56.8
22
.2
FI 0
350
Papa
ya
0.02
1.
3 0.
0 11
.5
0.2
1.6
0.0
13.7
0.
3 14
.5
0.3
1.0
0.0
0.6
0.0
OR
069
7 Pe
anut
oil,
edi
ble
0.03
3.
0 0.
1 0.
3 0.
0 1.
5 0.
0 7.
9 0.
2 0.
3 0.
0 0.
0 0.
0 0.
4 0.
0
SO 0
697
Pean
ut, s
helle
d (e
xcl o
il)
0.01
0.
7 0.
0 1.
4 0.
0 1.
3 0.
0 3.
6 0.
0 0.
2 0.
0 0.
7 0.
0 6.
0 0.
1
VO
005
1 Pe
pper
s 0.
35
8.7
3.0
22.4
7.
8 8.
4 2.
9 9.
4 3.
3 3.
3 1.
2 5.
3 1.
9 8.
9 3.
1
TN
067
5 Pi
stac
hio
nut
0.44
0.
0 0.
0 0.
1 0.
0 0.
0 0.
0 0.
0 0.
0 0.
0 0.
0 0.
0 0.
0 0.
2 0.
1
FI 0
354
Plan
tain
0.
03
1.8
0.1
51.2
1.
5 93
.3
2.8
40.6
1.
2 39
.2
1.2
1.1
0.0
1.9
0.1
DF
0014
Pl
um, d
ried
(pr
unes
) 0.
14
0.1
0.0
0.2
0.0
0.0
0.0
0.0
0.0
0.2
0.0
0.2
0.0
0.6
0.1
PM 0
110
Poul
try
mea
t 0
17.6
0.
0 13
1.3
0.0
25.1
0.
0 4.
7 0.
0 14
5.9
0.0
27.7
0.
0 11
5.1
0.0
PO 0
111
Poul
try,
Edi
ble
offa
l of
0 0.
4 0.
0 1.
0 0.
0 1.
9 0.
0 0.
0 0.
0 0.
7 0.
0 1.
0 0.
0 0.
3 0.
0
FB 0
272
Ras
pber
ries
, red
, bla
ck
1 0.
0 0.
0 0.
0 0.
0 0.
0 0.
0 0.
0 0.
0 0.
2 0.
2 0.
0 0.
0 0.
5 0.
5
GC
064
9 R
ice
(inc
l hus
ked,
exc
l pol
ishe
d)
0.68
1.
4 1.
0 1.
0 0.
7 2.
3 1.
6 29
.6
20.1
92
.0
62.6
9.
2 6.
2 0.
4 0.
3
CM
120
5 R
ice,
pol
ishe
d (i
ncl f
lour
) 0.
06
250.
3 15
.0
42.2
2.
5 23
.8
1.4
29.8
1.
8 97
.6
5.9
248.
1 14
.9
22.8
1.
4
VR
0075
R
oot a
nd tu
ber
vege
tabl
es
0.23
13
9.1
32.0
10
9.8
25.3
40
9.6
94.2
44
4.6
102.
3 14
5.3
33.4
12
7.0
29.2
22
5.6
51.9
GC
065
0 R
ye (
incl
flo
ur)
0.01
0.
4 0.
0 0.
0 0.
0 0.
2 0.
0 0.
1 0.
0 0.
1 0.
0 0.
9 0.
0 0.
8 0.
0

A
nn
ex 3
400A
ZO
XY
ST
RO
BIN
(2
29
) In
tern
atio
nal E
stim
ated
Dai
ly In
take
(IE
DI)
AD
I = 0
- 0
.2 m
g/kg
bw
STM
R o
r D
iets
: g/p
erso
n/da
y In
take
= d
aily
inta
ke: µ
g/pe
rson
STM
R-P
G
H
I
J K
L
M
C
odex
C
ode
Com
mod
ity
mg/
kg
diet
in
take
di
et
inta
ke
diet
in
take
di
et
inta
ke
diet
in
take
di
et
inta
ke
diet
in
take
VD
054
1 So
ya b
ean
(dry
, exc
l oil)
0.
06
1.8
0.1
0.0
0.0
0.0
0.0
3.2
0.2
0.1
0.0
0.0
0.0
0.0
0.0
OR
054
1 So
ya b
ean
oil,
refi
ned
0.05
4.
3 0.
2 10
.6
0.5
2.0
0.1
1.4
0.1
19.5
1.
0 9.
2 0.
5 22
.0
1.1
VC
043
1 Sq
uash
, sum
mer
(=
cou
rget
te, z
ucch
ini)
0.
17
2.4
0.4
1.5
0.3
0.0
0.0
0.0
0.0
3.8
0.6
2.2
0.4
2.5
0.4
FS 0
012
Ston
e fr
uit (
excl
dri
ed p
lum
s, in
cl d
ried
ap
rico
ts)
0.74
6.
7 5.
0 4.
3 3.
2 1.
4 1.
0 0.
1 0.
1 4.
9 3.
6 4.
9 3.
6 17
.7
13.1
FB 0
275
Stra
wbe
rry
1.3
0.0
0.0
1.8
2.3
0.1
0.1
0.0
0.0
0.3
0.4
6.2
8.1
5.9
7.7
VR
059
6 Su
gar
beet
0.
08
0.0
0.0
0.1
0.0
0.0
0.0
0.0
0.0
0.2
0.0
0.0
0.0
14.3
1.
1
SO 0
702
Sunf
low
er s
eed
(exc
l oil)
0.
04
0.1
0.0
0.2
0.0
0.1
0.0
0.0
0.0
0.0
0.0
0.1
0.0
1.8
0.1
OR
070
2 Su
nflo
wer
see
d oi
l, ed
ible
0.
01
1.1
0.0
3.6
0.0
5.6
0.1
0.1
0.0
1.5
0.0
0.2
0.0
3.6
0.0
VO
044
8 To
mat
o (e
xcl j
uice
, exc
l pas
te, i
ncl p
eele
d)
0.35
23
.1
8.1
22.3
7.
8 12
.5
4.4
5.6
2.0
33.2
11
.6
1.3
0.5
41.7
14
.6
JF 0
448
Tom
ato
juic
e 0.
13
0.0
0.0
0.8
0.1
0.1
0.0
7.2
0.9
0.0
0.0
2.4
0.3
45.2
5.
9
-d
Tom
ato
past
e 0.
91
0.1
0.1
2.1
1.9
0.6
0.5
0.4
0.4
0.6
0.5
1.4
1.3
1.2
1.1
TN
008
5 T
ree
nuts
0.
01
16.3
0.
2 15
.7
0.2
9.7
0.1
1.9
0.0
19.1
0.
2 29
.0
0.3
5.6
0.1
GC
065
3 T
riti
cale
(in
cl f
lour
) 0.
01
1.3
0.0
0.0
0.0
0.0
0.0
0.0
0.0
0.0
0.0
0.0
0.0
0.0
0.0
VC
043
2 W
ater
mel
on
0.02
39
.3
0.8
14.0
0.
3 2.
5 0.
1 13
.6
0.3
8.4
0.2
14.5
0.
3 13
.6
0.3
GC
065
4 W
heat
(ex
cl b
ulgu
r w
hole
mea
l, ex
cl f
lour
) 0.
01
0.0
0.0
0.9
0.0
0.0
0.0
0.0
0.0
0.1
0.0
0.0
0.0
0.1
0.0
CM
065
4 W
heat
bra
n, u
npro
cess
ed
0.00
4 N
D
- N
D
- N
D
- N
D
- N
D
- N
D
- N
D
-
CF
1211
W
heat
flo
ur (
incl
mac
aron
i, br
ead,
pas
try,
st
arch
, glu
ten)
0.
003
133.
0 0.
4 60
.1
0.2
52.4
0.
2 32
.2
0.1
87.7
0.
3 79
.6
0.2
180.
1 0.
5
CP
1211
W
hite
bre
ad
0.00
1 0.
0 0.
0 2.
2 0.
0 0.
1 0.
0 0.
0 0.
0 0.
0 0.
0 0.
0 0.
0 0.
0 0.
0
CP
1212
W
hole
mea
l bre
ad
0.00
1 0.
0 0.
0 2.
2 0.
0 0.
1 0.
0 0.
0 0.
0 0.
0 0.
0 0.
0 0.
0 0.
0 0.
0
- W
ine
0.36
1.
0 0.
4 0.
9 0.
3 6.
8 2.
4 0.
1 0.
0 3.
4 1.
2 3.
6 1.
3 31
.0
11.2
VC
043
3 W
inte
r sq
uash
(=
pum
pkin
) 0.
02
2.4
0.0
1.5
0.0
0.0
0.0
0.0
0.0
1.6
0.0
2.2
0.0
0.7
0.0
VS
0469
W
itlo
of c
hico
ry (
spro
uts)
0.
05
0.0
0.0
0.0
0.0
0.0
0.0
0.0
0.0
0.0
0.0
0.0
0.0
0.8
0.0
To
tal i
ntak
e (µ
g/pe
rson
)=
286.
7
911.
0
201.
4
404.
4
1278
.4
40
8.5
44
3.2
B
ody
wei
ght p
er r
egio
n (k
g bw
) =
55
60
60
60
60
55
60
A
DI (
µg/
pers
on)=
11
000
12
000
12
000
12
000
12
000
11
000
12
000
%
AD
I=
2.6%
7.6%
1.7%
3.4%
10.7
%
3.
7%
3.
7%
R
ound
ed %
AD
I=
3%
8%
2%
3%
10%
4%
4%

A
nn
ex 3
401
BU
PR
OF
EZ
IN (
17
3)
Inte
rnat
iona
l Est
imat
ed D
aily
Inta
ke (
IED
I)
AD
I = 0
- 0
.009
mg/
kg b
w
STM
R o
r
Die
ts: g
/per
son/
day
Inta
ke =
dai
ly in
take
: µg/
pers
on
STM
R-P
A
B
C
D
E
F C
odex
C
ode
Com
mod
ity
mg/
kg
diet
co
rrec
tion
fa
ctor
diet
in
take
di
et
inta
ke
diet
in
take
di
et
inta
ke
diet
in
take
di
et
inta
ke
FC 0
001
Cit
rus
frui
t (ex
cl le
mon
juic
e, e
xcl m
anda
rin
juic
e, e
xcl o
rang
e ju
ice,
exc
l gra
pefr
uit j
uice
, ex
cl N
ES
juic
e)
0.04
0.
7 15
.7
0.4
86.5
2.
4 52
.6
1.5
24.2
0.
7 16
.2
0.5
12.0
0.
3
- C
itru
s ju
ice
NE
S 0.
13
1 0.
0 0.
0 1.
7 0.
2 0.
1 0.
0 0.
0 0.
0 1.
1 0.
1 0.
3 0.
0
VC
042
4 C
ucum
ber
0.03
5 1
0.3
0.0
12.7
0.
4 5.
9 0.
2 11
.5
0.4
6.1
0.2
7.1
0.2
JF 0
203
Gra
pefr
uit j
uice
0.
13
1 0.
0 0.
0 0.
2 0.
0 0.
1 0.
0 0.
1 0.
0 1.
1 0.
1 0.
2 0.
0
-d
Lem
on ju
ice
0.13
1
0.0
0.0
0.9
0.1
0.1
0.0
0.0
0.0
0.2
0.0
0.4
0.1
- M
anda
rin
+ m
anda
rin-
like
hybr
id ju
ice
0.13
1
0.0
0.0
1.4
0.2
0.9
0.1
0.4
0.1
0.7
0.1
0.9
0.1
FI 0
345
Man
go (
incl
juic
e, in
cl p
ulp)
0.
01
0.7
6.3
0.0
1.0
0.0
4.6
0.0
0.2
0.0
0.7
0.0
0.3
0.0
JF 0
004
Ora
nge
juic
e 0.
13
1 0.
0 0.
0 2.
1 0.
3 4.
4 0.
6 1.
4 0.
2 16
.2
2.1
22.6
2.
9
VO
044
8 To
mat
o (e
xcl j
uice
, exc
l pas
te, e
xcl p
eele
d)
0.24
1
1.3
0.3
178.
4 42
.8
102.
8 24
.7
53.4
12
.8
1.6
0.4
0.0
0.0
JF 0
448
Tom
ato
juic
e 0.
053
1 5.
2 0.
3 0.
5 0.
0 0.
4 0.
0 2.
1 0.
1 6.
9 0.
4 15
.2
0.8
-d
Tom
ato
past
e 0.
22
1 0.
5 0.
1 1.
3 0.
3 3.
5 0.
8 1.
0 0.
2 3.
8 0.
8 4.
5 1.
0
-d
Tom
ato,
pee
led
0.04
1 1
0.1
0.0
0.4
0.0
0.5
0.0
0.4
0.0
4.9
0.2
3.2
0.1
To
tal i
ntak
e (µ
g/pe
rson
)=
1.
2
46.8
27.9
14.5
5.0
5.
7
B
ody
wei
ght p
er r
egio
n (k
g bw
) =
60
60
60
60
60
60
A
DI (
µg/
pers
on)=
540
54
0
540
54
0
540
54
0
%
AD
I=
0.
2%
8.
7%
5.
2%
2.
7%
0.
9%
1.
1%
R
ound
ed %
AD
I=
0%
9%
5%
3%
1%
1%
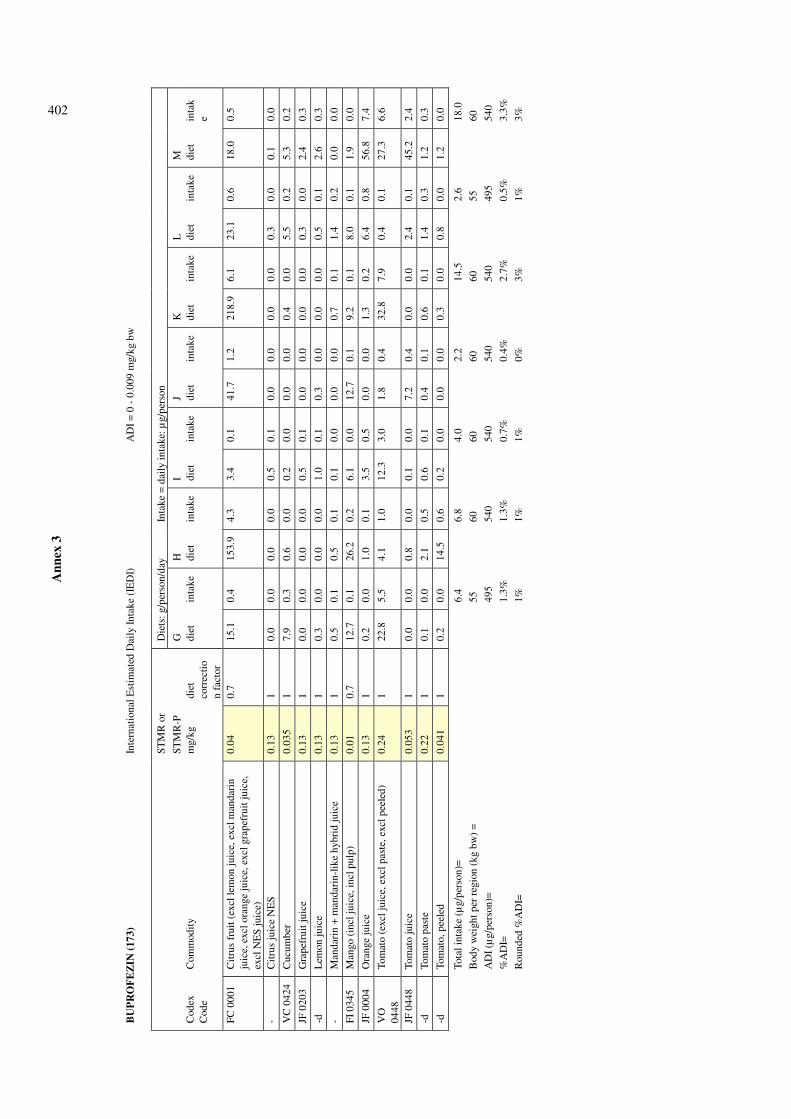
A
nn
ex 3
402 B
UP
RO
FE
ZIN
(1
73
) In
tern
atio
nal E
stim
ated
Dai
ly In
take
(IE
DI)
A
DI =
0 -
0.0
09 m
g/kg
bw
STM
R o
r
Die
ts: g
/per
son/
day
Inta
ke =
dai
ly in
take
: µg/
pers
on
STM
R-P
G
H
I J
K
L
M
Cod
ex
Cod
e C
omm
odit
y m
g/kg
di
et
corr
ecti
on
fact
or
diet
in
take
di
et
inta
ke
diet
in
take
di
et
inta
ke
diet
in
take
di
et
inta
ke
diet
in
tak
e
FC 0
001
Cit
rus
frui
t (ex
cl le
mon
juic
e, e
xcl m
anda
rin
juic
e, e
xcl o
rang
e ju
ice,
exc
l gra
pefr
uit j
uice
, ex
cl N
ES
juic
e)
0.04
0.
7 15
.1
0.4
153.
9 4.
3 3.
4 0.
1 41
.7
1.2
218.
9 6.
1 23
.1
0.6
18.0
0.
5
- C
itru
s ju
ice
NE
S 0.
13
1 0.
0 0.
0 0.
0 0.
0 0.
5 0.
1 0.
0 0.
0 0.
0 0.
0 0.
3 0.
0 0.
1 0.
0
VC
042
4 C
ucum
ber
0.03
5 1
7.9
0.3
0.6
0.0
0.2
0.0
0.0
0.0
0.4
0.0
5.5
0.2
5.3
0.2
JF 0
203
Gra
pefr
uit j
uice
0.
13
1 0.
0 0.
0 0.
0 0.
0 0.
5 0.
1 0.
0 0.
0 0.
0 0.
0 0.
3 0.
0 2.
4 0.
3
-d
Lem
on ju
ice
0.13
1
0.3
0.0
0.0
0.0
1.0
0.1
0.3
0.0
0.0
0.0
0.5
0.1
2.6
0.3
- M
anda
rin
+ m
anda
rin-
like
hybr
id ju
ice
0.13
1
0.5
0.1
0.5
0.1
0.1
0.0
0.0
0.0
0.7
0.1
1.4
0.2
0.0
0.0
FI 0
345
Man
go (
incl
juic
e, in
cl p
ulp)
0.
01
0.7
12.7
0.
1 26
.2
0.2
6.1
0.0
12.7
0.
1 9.
2 0.
1 8.
0 0.
1 1.
9 0.
0
JF 0
004
Ora
nge
juic
e 0.
13
1 0.
2 0.
0 1.
0 0.
1 3.
5 0.
5 0.
0 0.
0 1.
3 0.
2 6.
4 0.
8 56
.8
7.4
VO
04
48
Tom
ato
(exc
l jui
ce, e
xcl p
aste
, exc
l pee
led)
0.
24
1 22
.8
5.5
4.1
1.0
12.3
3.
0 1.
8 0.
4 32
.8
7.9
0.4
0.1
27.3
6.
6
JF 0
448
Tom
ato
juic
e 0.
053
1 0.
0 0.
0 0.
8 0.
0 0.
1 0.
0 7.
2 0.
4 0.
0 0.
0 2.
4 0.
1 45
.2
2.4
-d
Tom
ato
past
e 0.
22
1 0.
1 0.
0 2.
1 0.
5 0.
6 0.
1 0.
4 0.
1 0.
6 0.
1 1.
4 0.
3 1.
2 0.
3
-d
Tom
ato,
pee
led
0.04
1 1
0.2
0.0
14.5
0.
6 0.
2 0.
0 0.
0 0.
0 0.
3 0.
0 0.
8 0.
0 1.
2 0.
0
To
tal i
ntak
e (µ
g/pe
rson
)=
6.
4
6.8
4.
0
2.2
14
.5
2.
6
18.0
B
ody
wei
ght p
er r
egio
n (k
g bw
) =
55
60
60
60
60
55
60
A
DI (
µg/
pers
on)=
495
54
0
540
54
0
540
49
5
540
%
AD
I=
1.
3%
1.
3%
0.
7%
0.
4%
2.
7%
0.
5%
3.
3%
R
ound
ed %
AD
I=
1%
1%
1%
0%
3%
1%
3%

A
nn
ex 3
403
CA
RB
OF
UR
AN
(0
96
) In
tern
atio
nal E
stim
ated
Dai
ly In
take
(IE
DI)
AD
I = 0
- 0
.001
mg/
kg b
w
STM
R o
r D
iets
: g/p
erso
n/da
y In
take
= d
aily
inta
ke: µ
g/pe
rson
STM
R-P
A
B
C
D
E
F
Cod
ex
Cod
e C
omm
odit
y m
g/kg
di
et
inta
ke
diet
in
take
di
et
inta
ke
diet
in
take
di
et
inta
ke
diet
in
take
FI 0
327
Ban
ana
0.1
38.8
3.
9 17
.4
1.7
16.0
1.
6 6.
6 0.
7 21
.5
2.2
33.8
3.
4
SM 0
716
Cof
fee
bean
s, r
oast
ed
0.00
5 0.
4 0.
0 6.
0 0.
0 0.
5 0.
0 0.
6 0.
0 9.
4 0.
0 16
.4
0.1
VC
042
4 C
ucum
ber
0.05
0.
3 0.
0 12
.7
0.6
5.9
0.3
11.5
0.
6 6.
1 0.
3 7.
1 0.
4
MO
009
7 E
dibl
e of
fal o
f ca
ttle
, pig
s &
she
ep
0.05
3.
2 0.
2 13
.3
0.7
3.5
0.2
11.0
0.
6 11
.7
0.6
7.5
0.4
MM
009
5 M
eat f
rom
mam
mal
s ot
her
than
mar
ine
mam
mal
s:
20%
as
fat
0.05
5.
5 0.
3 23
.3
1.2
7.7
0.4
11.0
0.
6 18
.0
0.9
26.3
1.
3
MM
009
5 M
eat f
rom
mam
mal
s ot
her
than
mar
ine
mam
mal
s: 8
0%
as m
uscl
e 0.
05
22.2
1.
1 93
.2
4.7
30.8
1.
5 44
.1
2.2
72.2
3.
6 10
5.0
5.3
VC
004
6 M
elon
s, e
xcep
t wat
erm
elon
0.
02
3.6
0.1
26.7
0.
5 22
.6
0.5
11.5
0.
2 5.
6 0.
1 2.
0 0.
0
ML
0106
M
ilks
(exc
l pro
cess
ed p
rodu
cts)
0.
05
68.8
3.
4 19
0.6
9.5
79.4
4.
0 30
2.6
15.1
17
9.6
9.0
237.
9 11
.9
JF 0
004
Ora
nge
juic
e 0.
001
0.0
0.0
2.1
0.0
4.4
0.0
1.4
0.0
16.2
0.
0 22
.6
0.0
FC 0
004
Ora
nge,
sw
eet,
sour
+ o
rang
e-lik
e hy
brid
(ex
cl ju
ice)
0.
05
4.2
0.2
54.1
2.
7 30
.1
1.5
11.9
0.
6 0.
2 0.
0 0.
5 0.
0
VR
058
9 Po
tato
(in
cl f
lour
, fro
zen,
sta
rch,
tapi
oca)
0.
05
19.1
1.
0 16
0.8
8.0
61.2
3.
1 24
3.6
12.2
23
0.1
11.5
20
4.7
10.2
SO 0
495
Rap
e se
ed (
excl
oil)
0.
05
0.1
0.0
0.0
0.0
0.0
0.0
0.1
0.0
0.1
0.0
0.1
0.0
GC
064
9 R
ice
(inc
l hus
ked,
exc
l pol
ishe
d)
0.02
5 46
.3
1.2
0.3
0.0
3.4
0.1
9.1
0.2
4.3
0.1
0.6
0.0
VC
043
1 Sq
uash
, sum
mer
(=
cou
rget
te, z
ucch
ini)
0.
05
0.0
0.0
8.3
0.4
11.4
0.
6 7.
3 0.
4 3.
2 0.
2 0.
3 0.
0
GS
0659
Su
gar
cane
0.
1 30
.9
3.1
43.1
4.
3 51
.3
5.1
0.1
0.0
5.5
0.6
0.0
0.0
SO 0
702
Sunf
low
er s
eed
(exc
l oil)
0.
1 0.
0 0.
0 13
.1
1.3
0.0
0.0
0.1
0.0
0.1
0.0
0.1
0.0
VO
044
7 Sw
eet c
orn
(cor
n-on
-the
-cob
) 0.
03
7.3
0.2
1.0
0.0
0.1
0.0
0.5
0.0
3.3
0.1
3.6
0.1
To
tal i
ntak
e (µ
g/pe
rson
)=
14.6
35.8
18.8
33.3
29.2
33.1
B
ody
wei
ght p
er r
egio
n (k
g bw
) =
60
60
60
60
60
60
A
DI (
µg/
pers
on)=
60
60
60
60
60
60
%
AD
I=
24.3
%
59
.6%
31.3
%
55
.5%
48.6
%
55
.2%
R
ound
ed %
AD
I=
20%
60%
30%
60%
50%
60%

A
nn
ex 3
404 C
AR
BO
FU
RA
N (
09
6)
Inte
rnat
iona
l Est
imat
ed D
aily
Inta
ke (
IED
I)
A
DI =
0 -
0.0
01 m
g/kg
bw
STM
R o
r D
iets
: g/p
erso
n/da
y In
take
= d
aily
inta
ke: µ
g/pe
rson
STM
R-P
G
H
I
J K
L
M
C
odex
C
ode
Com
mod
ity
mg/
kg
diet
in
take
di
et
inta
ke
diet
in
take
di
et
inta
ke
diet
in
take
di
et
inta
ke
diet
in
take
FI 0
327
Ban
ana
0.1
21.4
2.
1 36
.6
3.7
11.4
1.
1 9.
2 0.
9 70
.2
7.0
40.5
4.
1 32
.6
3.3
SM 0
716
Cof
fee
bean
s, r
oast
ed
0.00
5 0.
0 0.
0 1.
3 0.
0 0.
1 0.
0 0.
0 0.
0 0.
8 0.
0 0.
3 0.
0 7.
0 0.
0
VC
042
4 C
ucum
ber
0.05
7.
9 0.
4 0.
6 0.
0 0.
2 0.
0 0.
0 0.
0 0.
4 0.
0 5.
5 0.
3 5.
3 0.
3
MO
009
7 E
dibl
e of
fal o
f ca
ttle
, pig
s &
she
ep
0.05
4.
0 0.
2 10
.4
0.5
3.5
0.2
2.7
0.1
6.4
0.3
6.2
0.3
5.4
0.3
MM
009
5 M
eat f
rom
mam
mal
s ot
her
than
mar
ine
mam
mal
s: 2
0% a
s fa
t 0.
05
11.0
0.
5 17
.9
0.9
6.1
0.3
5.7
0.3
16.4
0.
8 12
.2
0.6
31.7
1.
6
MM
009
5 M
eat f
rom
mam
mal
s ot
her
than
mar
ine
mam
mal
s: 8
0% a
s m
uscl
e 0.
05
43.8
2.
2 71
.5
3.6
24.5
1.
2 22
.9
1.1
65.7
3.
3 48
.9
2.4
126.
6 6.
3
VC
004
6 M
elon
s, e
xcep
t wat
erm
elon
0.
02
7.5
0.2
6.1
0.1
0.7
0.0
1.4
0.0
2.5
0.1
6.9
0.1
12.4
0.
2
ML
0106
M
ilks
(exc
l pro
cess
ed p
rodu
cts)
0.
05
66.0
3.
3 12
1.1
6.1
81.6
4.
1 10
2.4
5.1
207.
7 10
.4
57.0
2.
9 28
7.9
14.4
JF 0
004
Ora
nge
juic
e 0.
001
0.2
0.0
1.0
0.0
3.5
0.0
0.0
0.0
1.3
0.0
6.4
0.0
56.8
0.
1
FC 0
004
Ora
nge,
sw
eet,
sour
+ o
rang
e-lik
e hy
brid
(ex
cl
juic
e)
0.05
7.
0 0.
4 11
7.1
5.9
2.0
0.1
2.4
0.1
200.
7 10
.0
0.5
0.0
0.2
0.0
VR
058
9 Po
tato
(in
cl f
lour
, fro
zen,
sta
rch,
tapi
oca)
0.
05
52.7
2.
6 57
.1
2.9
50.1
2.
5 4.
3 0.
2 54
.7
2.7
41.0
2.
1 16
8.0
8.4
SO 0
495
Rap
e se
ed (
excl
oil)
0.
05
0.0
0.0
0.0
0.0
0.0
0.0
0.0
0.0
0.0
0.0
0.0
0.0
0.0
0.0
GC
064
9 R
ice
(inc
l hus
ked,
exc
l pol
ishe
d)
0.02
5 1.
4 0.
0 1.
0 0.
0 2.
3 0.
1 29
.6
0.7
92.0
2.
3 9.
2 0.
2 0.
4 0.
0
VC
043
1 Sq
uash
, sum
mer
(=
cou
rget
te, z
ucch
ini)
0.
05
2.4
0.1
1.5
0.1
0.0
0.0
0.0
0.0
3.8
0.2
2.2
0.1
2.5
0.1
GS
0659
Su
gar
cane
0.
1 26
.2
2.6
1.5
0.2
33.8
3.
4 5.
5 0.
6 18
.6
1.9
3.0
0.3
20.2
2.
0
SO 0
702
Sunf
low
er s
eed
(exc
l oil)
0.
1 0.
1 0.
0 0.
2 0.
0 0.
1 0.
0 0.
0 0.
0 0.
0 0.
0 0.
1 0.
0 1.
8 0.
2
VO
044
7 Sw
eet c
orn
(cor
n-on
-the
-cob
) 0.
03
0.2
0.0
2.4
0.1
2.2
0.1
3.3
0.1
1.7
0.1
2.8
0.1
11.2
0.
3
To
tal i
ntak
e (µ
g/pe
rson
)=
14.7
23.9
13.1
9.4
39
.1
13
.5
37
.5
B
ody
wei
ght p
er r
egio
n (k
g bw
) =
55
60
60
60
60
55
60
A
DI (
µg/
pers
on)=
55
60
60
60
60
55
60
%
AD
I=
26.7
%
39
.9%
21.8
%
15
.6%
65.1
%
24
.5%
62.5
%
R
ound
ed %
AD
I=
30%
40%
20%
20%
70%
20%
60%

A
nn
ex 3
405
CH
LO
RA
NT
RA
NIL
IPR
OL
E (
23
0)
Inte
rnat
iona
l Est
imat
ed D
aily
Inta
ke (
IED
I)
A
DI =
0 -
2 m
g/kg
bw
STM
R o
r D
iets
: g/p
erso
n/da
y In
take
= d
aily
inta
ke: µ
g/pe
rson
STM
R-P
A
B
C
D
E
F
Cod
ex
Cod
e C
omm
odit
y m
g/kg
di
et
inta
ke
diet
in
take
di
et
inta
ke
diet
in
take
di
et
inta
ke
diet
in
take
VS
0624
C
eler
y 2.
1 0.
0 0.
0 0.
9 1.
9 0.
0 0.
0 2.
0 4.
2 1.
5 3.
2 0.
0 0.
0
GC
008
0 C
erea
l gra
ins
0.01
35
6.9
3.6
713.
9 7.
1 76
3.0
7.6
504.
5 5.
0 36
5.2
3.7
328.
7 3.
3
OR
069
1 C
otto
n se
ed o
il, e
dibl
e 0.
0122
0.
9 0.
0 4.
9 0.
1 1.
7 0.
0 6.
6 0.
1 0.
0 0.
0 0.
3 0.
0
MO
010
5 E
dibl
e of
fal (
mam
mal
ian)
0
3.9
0.0
14.4
0.
0 5.
2 0.
0 11
.8
0.0
11.7
0.
0 7.
6 0.
0
VO
044
0 E
gg p
lant
0.
06
1.7
0.1
17.5
1.
2 12
.3
0.8
1.7
0.1
0.8
0.1
0.4
0.0
PE 0
112
Egg
s 0
2.5
0.0
29.7
0.
0 25
.1
0.0
24.5
0.
0 37
.8
0.0
27.4
0.
0
VC
004
5 Fr
uiti
ng v
eget
able
s, C
ucur
bits
0.
065
26.6
1.
7 10
7.5
7.0
95.9
6.
2 82
.2
5.3
25.4
1.
7 23
.2
1.5
FB 0
269
Gra
pe (
incl
dri
ed, j
uice
, win
e)
0.11
9 3.
7 0.
4 12
8.5
15.3
27
.1
3.2
33.1
3.
9 10
7.5
12.8
44
.0
5.2
VL
0053
L
eafy
veg
etab
les
7.3
5.8
42.3
45
.6
332.
9 10
.9
79.6
26
.8
195.
6 18
.7
136.
5 38
.9
284.
0
MM
009
5 M
eat f
rom
mam
mal
s ot
her
than
mar
ine
mam
mal
s 0
27.7
0.
0 11
6.5
0.0
38.5
0.
0 55
.1
0.0
90.2
0.
0 13
1.3
0.0
ML
0106
M
ilks
(exc
l pro
cess
ed p
rodu
cts)
0
68.8
0.
0 19
0.6
0.0
79.4
0.
0 30
2.6
0.0
179.
6 0.
0 23
7.9
0.0
VO
044
2 O
kra
0.06
6 3.
9 0.
3 1.
0 0.
1 5.
3 0.
3 0.
1 0.
0 0.
0 0.
0 0.
0 0.
0
VO
005
1 Pe
pper
s 0.
066
1.4
0.1
29.9
2.
0 13
.0
0.9
6.3
0.4
6.2
0.4
4.0
0.3
FP 0
009
Pom
e fr
uit (
incl
app
le ju
ice)
0.
07
0.5
0.0
84.1
5.
9 21
.9
1.5
45.2
3.
2 61
.7
4.3
46.2
3.
2
PM 0
110
Poul
try
mea
t 0
7.1
0.0
58.5
0.
0 31
.9
0.0
24.0
0.
0 61
.0
0.0
27.3
0.
0
PO 0
111
Poul
try,
Edi
ble
offa
l of
0 0.
4 0.
0 0.
4 0.
0 1.
7 0.
0 0.
1 0.
0 0.
6 0.
0 0.
2 0.
0
VR
0075
R
oot a
nd tu
ber
vege
tabl
es
0.01
52
8.2
5.3
352.
8 3.
5 78
.5
0.8
270.
3 2.
7 32
4.1
3.2
261.
3 2.
6
FS 0
012
Ston
e fr
uit
0.2
0.7
0.1
44.7
8.
9 14
.1
2.8
26.9
5.
4 27
.7
5.5
10.0
2.
0
VO
044
8 To
mat
o (i
ncl j
uice
, pas
te, p
eele
d)
0.06
6 11
.8
0.8
185.
0 12
.2
118.
0 7.
8 60
.7
4.0
31.6
2.
1 40
.9
2.7
To
tal i
ntak
e (µ
g/pe
rson
)=
54.8
398.
0
111.
6
230.
0
173.
4
304.
8
B
ody
wei
ght p
er r
egio
n (k
g bw
) =
60
60
60
60
60
60
A
DI (
µg/
pers
on)=
12
0 00
0
120
000
12
0 00
0
120
000
12
0 00
0
120
000
%
AD
I=
0.0%
0.3%
0.1%
0.2%
0.1%
0.3%
R
ound
ed %
AD
I=
0%
0%
0%
0%
0%
0%

A
nn
ex 3
406 C
HL
OR
AN
TR
AN
ILIP
RO
LE
(2
30
) In
tern
atio
nal E
stim
ated
Dai
ly In
take
(IE
DI)
AD
I = 0
- 2
mg/
kg b
w
STM
R o
r D
iets
: g/p
erso
n/da
y In
take
= d
aily
inta
ke: µ
g/pe
rson
STM
R-P
G
H
I
J K
L
M
C
odex
C
ode
Com
mod
ity
mg/
kg
diet
in
take
di
et
inta
ke
diet
in
take
di
et
inta
ke
diet
in
take
di
et
inta
ke
diet
in
take
VS
0624
C
eler
y 2.
1 0.
0 0.
0 0.
3 0.
6 0.
0 0.
0 0.
0 0.
0 1.
0 2.
1 0.
0 0.
0 4.
2 8.
8
GC
008
0 C
erea
l gra
ins
0.01
61
7.0
6.2
487.
1 4.
9 38
9.4
3.9
385.
7 3.
9 44
0.2
4.4
567.
7 5.
7 40
9.9
4.1
OR
069
1 C
otto
n se
ed o
il, e
dibl
e 0.
0122
1.
0 0.
0 0.
7 0.
0 1.
0 0.
0 1.
4 0.
0 1.
5 0.
0 5.
5 0.
1 1.
2 0.
0
MO
01
05
Edi
ble
offa
l (m
amm
alia
n)
0 4.
8 0.
0 10
.7
0.0
4.0
0.0
4.0
0.0
6.5
0.0
6.6
0.0
5.6
0.0
VO
044
0 E
gg p
lant
0.
066
20.1
1.
3 0.
1 0.
0 0.
6 0.
0 6.
3 0.
4 0.
5 0.
0 6.
3 0.
4 0.
7 0.
0
PE 0
112
Egg
s 0
22.1
0.
0 71
.5
0.0
16.6
0.
0 5.
1 0.
0 17
.6
0.0
35.2
0.
0 57
.4
0.0
VC
004
5 Fr
uiti
ng v
eget
able
s, C
ucur
bits
0.
065
69.7
4.
5 25
.9
1.7
14.9
1.
0 18
.0
1.2
18.7
1.
2 39
.1
2.5
44.2
2.
9
FB 0
269
Gra
pe (
incl
dri
ed, j
uice
, win
e)
0.11
9 2.
6 0.
3 4.
8 0.
6 11
.7
1.4
0.3
0.0
6.8
0.8
10.9
1.
3 58
.8
7.0
VL
0053
L
eafy
veg
etab
les
7.3
40.8
29
7.8
12.0
87
.6
12.5
91
.3
9.5
69.4
5.
4 39
.4
50.0
36
5.0
39.9
29
1.3
MM
00
95
Mea
t fro
m m
amm
als
othe
r th
an m
arin
e m
amm
als
0 54
.8
0.0
89.4
0.
0 30
.6
0.0
28.6
0.
0 82
.1
0.0
61.1
0.
0 15
8.3
0.0
ML
0106
M
ilks
(exc
l pro
cess
ed p
rodu
cts)
0
66.0
0.
0 12
1.1
0.0
81.6
0.
0 10
2.4
0.0
207.
7 0.
0 57
.0
0.0
287.
9 0.
0
VO
044
2 O
kra
0.06
6 4.
1 0.
3 1.
0 0.
1 7.
0 0.
5 15
.9
1.0
1.1
0.1
3.9
0.3
0.2
0.0
VO
005
1 Pe
pper
s 0.
066
8.7
0.6
22.4
1.
5 8.
4 0.
6 9.
4 0.
6 3.
3 0.
2 5.
3 0.
3 8.
9 0.
6
FP 0
009
Pom
e fr
uit (
incl
app
le ju
ice)
0.
07
20.9
1.
5 12
.3
0.9
3.4
0.2
0.1
0.0
11.7
0.
8 24
.9
1.7
45.4
3.
2
PM 0
110
Poul
try
mea
t 0
17.6
0.
0 13
1.3
0.0
25.1
0.
0 4.
7 0.
0 14
5.9
0.0
27.7
0.
0 11
5.1
0.0
PO 0
111
Poul
try,
Edi
ble
offa
l of
0 0.
4 0.
0 1.
0 0.
0 1.
9 0.
0 0.
0 0.
0 0.
7 0.
0 1.
0 0.
0 0.
3 0.
0
VR
0075
R
oot a
nd tu
ber
vege
tabl
es
0.01
13
9.1
1.4
109.
8 1.
1 40
9.6
4.1
444.
6 4.
4 14
5.3
1.5
127.
0 1.
3 22
5.6
2.3
FS 0
012
Ston
e fr
uit
0.2
7.0
1.4
4.9
1.0
1.4
0.3
0.1
0.0
5.5
1.1
5.5
1.1
19.4
3.
9
VO
044
8 To
mat
o (i
ncl j
uice
, pas
te, p
eele
d)
0.06
6 23
.5
1.6
31.7
2.
1 15
.0
1.0
16.2
1.
1 35
.6
2.3
9.9
0.7
103.
0 6.
8
To
tal i
ntak
e (µ
g/pe
rson
)=
316.
8
101.
9
104.
2
82.1
54.0
380.
4
330.
8
B
ody
wei
ght p
er r
egio
n (k
g bw
) =
55
60
60
60
60
55
60
A
DI (
µg/
pers
on)=
11
0 00
0
120
000
12
0 00
0
120
000
12
0 00
0
110
000
12
0 00
0
%
AD
I=
0.3%
0.1%
0.1%
0.1%
0.0%
0.3%
0.3%
R
ound
ed %
AD
I=
0%
0%
0%
0%
0%
0%
0%
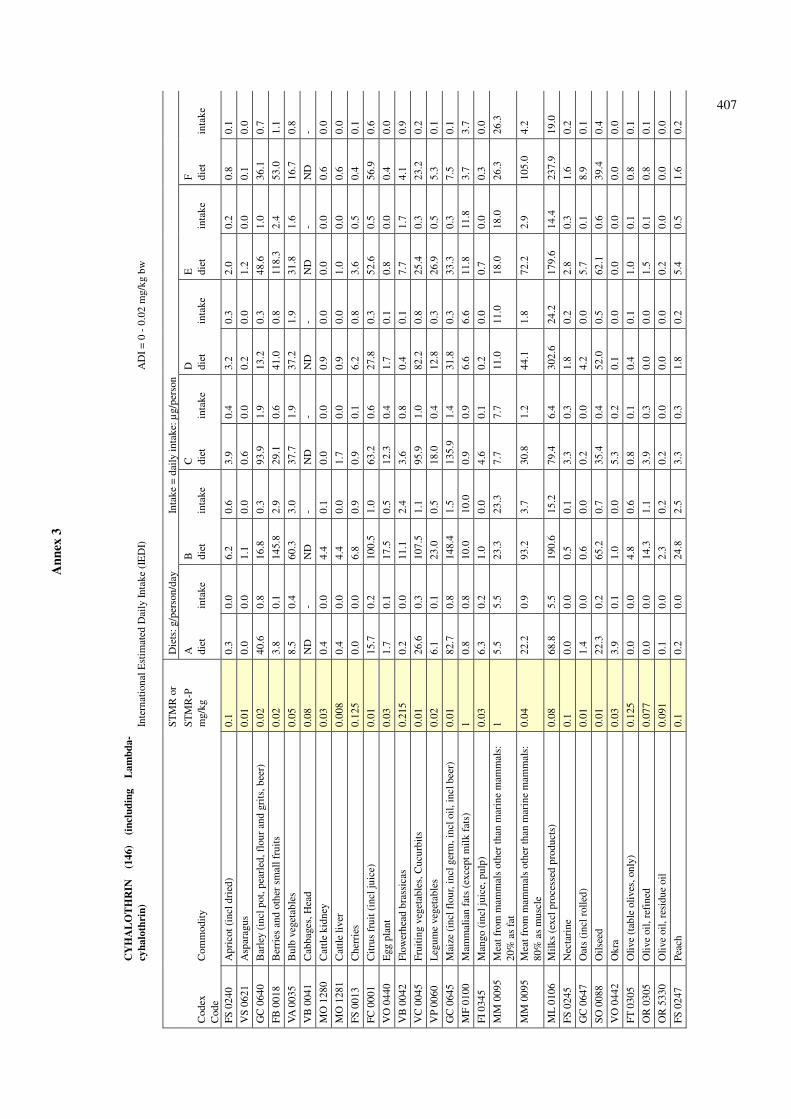
A
nn
ex 3
407
CY
HA
LO
TH
RIN
(1
46
) (i
ncl
ud
ing
L
am
bd
a-
cyh
alo
thri
n)
Inte
rnat
iona
l Est
imat
ed D
aily
Inta
ke (
IED
I)
A
DI =
0 -
0.0
2 m
g/kg
bw
STM
R o
r D
iets
: g/p
erso
n/da
y In
take
= d
aily
inta
ke: µ
g/pe
rson
STM
R-P
A
B
C
D
E
F
Cod
ex
Cod
e C
omm
odit
y m
g/kg
di
et
inta
ke
diet
in
take
di
et
inta
ke
diet
in
take
di
et
inta
ke
diet
in
take
FS 0
240
Apr
icot
(in
cl d
ried
) 0.
1 0.
3 0.
0 6.
2 0.
6 3.
9 0.
4 3.
2 0.
3 2.
0 0.
2 0.
8 0.
1
VS
0621
A
spar
agus
0.
01
0.0
0.0
1.1
0.0
0.6
0.0
0.2
0.0
1.2
0.0
0.1
0.0
GC
064
0 B
arle
y (i
ncl p
ot, p
earl
ed, f
lour
and
gri
ts, b
eer)
0.
02
40.6
0.
8 16
.8
0.3
93.9
1.
9 13
.2
0.3
48.6
1.
0 36
.1
0.7
FB 0
018
Ber
ries
and
oth
er s
mal
l fru
its
0.02
3.
8 0.
1 14
5.8
2.9
29.1
0.
6 41
.0
0.8
118.
3 2.
4 53
.0
1.1
VA
003
5 B
ulb
vege
tabl
es
0.05
8.
5 0.
4 60
.3
3.0
37.7
1.
9 37
.2
1.9
31.8
1.
6 16
.7
0.8
VB
004
1 C
abba
ges,
Hea
d 0.
08
ND
-
ND
-
ND
-
ND
-
ND
-
ND
-
MO
128
0 C
attle
kid
ney
0.03
0.
4 0.
0 4.
4 0.
1 0.
0 0.
0 0.
9 0.
0 0.
0 0.
0 0.
6 0.
0
MO
128
1 C
attle
live
r 0.
008
0.4
0.0
4.4
0.0
1.7
0.0
0.9
0.0
1.0
0.0
0.6
0.0
FS 0
013
Che
rrie
s 0.
125
0.0
0.0
6.8
0.9
0.9
0.1
6.2
0.8
3.6
0.5
0.4
0.1
FC 0
001
Cit
rus
frui
t (in
cl ju
ice)
0.
01
15.7
0.
2 10
0.5
1.0
63.2
0.
6 27
.8
0.3
52.6
0.
5 56
.9
0.6
VO
044
0 E
gg p
lant
0.
03
1.7
0.1
17.5
0.
5 12
.3
0.4
1.7
0.1
0.8
0.0
0.4
0.0
VB
004
2 Fl
ower
head
bra
ssic
as
0.21
5 0.
2 0.
0 11
.1
2.4
3.6
0.8
0.4
0.1
7.7
1.7
4.1
0.9
VC
004
5 Fr
uiti
ng v
eget
able
s, C
ucur
bits
0.
01
26.6
0.
3 10
7.5
1.1
95.9
1.
0 82
.2
0.8
25.4
0.
3 23
.2
0.2
VP
0060
L
egum
e ve
geta
bles
0.
02
6.1
0.1
23.0
0.
5 18
.0
0.4
12.8
0.
3 26
.9
0.5
5.3
0.1
GC
064
5 M
aize
(in
cl f
lour
, inc
l ger
m, i
ncl o
il, in
cl b
eer)
0.
01
82.7
0.
8 14
8.4
1.5
135.
9 1.
4 31
.8
0.3
33.3
0.
3 7.
5 0.
1
MF
0100
M
amm
alia
n fa
ts (
exce
pt m
ilk f
ats)
1
0.8
0.8
10.0
10
.0
0.9
0.9
6.6
6.6
11.8
11
.8
3.7
3.7
FI 0
345
Man
go (
incl
juic
e, p
ulp)
0.
03
6.3
0.2
1.0
0.0
4.6
0.1
0.2
0.0
0.7
0.0
0.3
0.0
MM
009
5 M
eat f
rom
mam
mal
s ot
her
than
mar
ine
mam
mal
s:
20%
as
fat
1 5.
5 5.
5 23
.3
23.3
7.
7 7.
7 11
.0
11.0
18
.0
18.0
26
.3
26.3
MM
009
5 M
eat f
rom
mam
mal
s ot
her
than
mar
ine
mam
mal
s:
80%
as
mus
cle
0.04
22
.2
0.9
93.2
3.
7 30
.8
1.2
44.1
1.
8 72
.2
2.9
105.
0 4.
2
ML
0106
M
ilks
(exc
l pro
cess
ed p
rodu
cts)
0.
08
68.8
5.
5 19
0.6
15.2
79
.4
6.4
302.
6 24
.2
179.
6 14
.4
237.
9 19
.0
FS 0
245
Nec
tari
ne
0.1
0.0
0.0
0.5
0.1
3.3
0.3
1.8
0.2
2.8
0.3
1.6
0.2
GC
064
7 O
ats
(inc
l rol
led)
0.
01
1.4
0.0
0.6
0.0
0.2
0.0
4.2
0.0
5.7
0.1
8.9
0.1
SO 0
088
Oils
eed
0.01
22
.3
0.2
65.2
0.
7 35
.4
0.4
52.0
0.
5 62
.1
0.6
39.4
0.
4
VO
044
2 O
kra
0.03
3.
9 0.
1 1.
0 0.
0 5.
3 0.
2 0.
1 0.
0 0.
0 0.
0 0.
0 0.
0
FT 0
305
Oliv
e (t
able
oliv
es, o
nly)
0.
125
0.0
0.0
4.8
0.6
0.8
0.1
0.4
0.1
1.0
0.1
0.8
0.1
OR
030
5 O
live
oil,
refi
ned
0.07
7 0.
0 0.
0 14
.3
1.1
3.9
0.3
0.0
0.0
1.5
0.1
0.8
0.1
OR
533
0 O
live
oil,
resi
due
oil
0.09
1 0.
1 0.
0 2.
3 0.
2 0.
2 0.
0 0.
0 0.
0 0.
2 0.
0 0.
0 0.
0
FS 0
247
Peac
h 0.
1 0.
2 0.
0 24
.8
2.5
3.3
0.3
1.8
0.2
5.4
0.5
1.6
0.2

A
nn
ex 3
408
CY
HA
LO
TH
RIN
(1
46
) (i
ncl
ud
ing
L
am
bd
a-
cyh
alo
thri
n)
Inte
rnat
iona
l Est
imat
ed D
aily
Inta
ke (
IED
I)
A
DI =
0 -
0.0
2 m
g/kg
bw
STM
R o
r D
iets
: g/p
erso
n/da
y In
take
= d
aily
inta
ke: µ
g/pe
rson
STM
R-P
A
B
C
D
E
F
Cod
ex
Cod
e C
omm
odit
y m
g/kg
di
et
inta
ke
diet
in
take
di
et
inta
ke
diet
in
take
di
et
inta
ke
diet
in
take
VO
005
1 Pe
pper
s 0.
03
1.4
0.0
29.9
0.
9 13
.0
0.4
6.3
0.2
6.2
0.2
4.0
0.1
FS 0
014
Plum
(in
cl d
ried
) 0.
02
0.1
0.0
5.9
0.1
2.5
0.1
7.3
0.1
6.9
0.1
2.6
0.1
FP 0
009
Pom
e fr
uit (
incl
app
le ju
ice)
0.
08
0.5
0.0
84.1
6.
7 21
.9
1.8
45.2
3.
6 61
.7
4.9
46.2
3.
7
GC
065
6 Po
pcor
n 0.
01
0.1
0.0
0.2
0.0
0.0
0.0
0.1
0.0
0.1
0.0
0.1
0.0
VD
007
0 Pu
lses
0.
01
54.5
0.
5 62
.9
0.6
51.4
0.
5 36
.8
0.4
49.4
0.
5 47
.9
0.5
GC
064
9 R
ice
(hus
ked
+ p
olis
hed)
0.
295
91.0
26
.8
31.6
9.
3 94
.6
27.9
33
.2
9.8
12.7
3.
7 12
.7
3.7
CM
120
6 R
ice
bran
, unp
roce
ssed
0.
065
ND
-
ND
-
ND
-
ND
-
ND
-
ND
-
VR
0075
R
oot a
nd tu
ber
vege
tabl
es
0 52
8.2
0.0
352.
8 0.
0 78
.5
0.0
270.
3 0.
0 32
4.1
0.0
261.
3 0.
0
GC
065
0 R
ye (
incl
flo
ur)
0.01
0.
1 0.
0 3.
7 0.
0 0.
3 0.
0 24
.3
0.2
25.8
0.
3 45
.8
0.5
MO
128
8 Sh
eep
kidn
ey
0.03
N
D
- N
D
- N
D
- N
D
- N
D
- N
D
-
MO
128
9 Sh
eep
liver
0.
008
ND
-
ND
-
ND
-
ND
-
ND
-
ND
-
GS
0659
Su
gar
cane
0.
02
30.9
0.
6 43
.1
0.9
51.3
1.
0 0.
1 0.
0 5.
5 0.
1 0.
0 0.
0
DM
065
9 Su
gar
cane
mol
asse
s 0.
001
ND
-
ND
-
ND
-
ND
-
ND
-
ND
-
VO
127
5 Sw
eet c
orn
kern
els
(inc
l cor
n on
the
cob
+ f
roze
n +
pr
eser
ved)
0.
03
14.7
0.
4 2.
0 0.
1 0.
2 0.
0 1.
2 0.
0 6.
5 0.
2 7.
2 0.
2
VO
044
8 To
mat
o (e
xcl j
uice
, pas
te, p
eele
d)
0.03
1.
3 0.
0 17
8.4
5.4
102.
8 3.
1 53
.4
1.6
1.6
0.0
0.0
0.0
JF 0
448
Tom
ato
juic
e 0.
002
5.2
0.0
0.5
0.0
0.4
0.0
2.1
0.0
6.9
0.0
15.2
0.
0
-d
Tom
ato
past
e 0.
007
0.5
0.0
1.3
0.0
3.5
0.0
1.0
0.0
3.8
0.0
4.5
0.0
TN
008
5 T
ree
nuts
0.
01
4.2
0.0
21.5
0.
2 3.
9 0.
0 3.
0 0.
0 5.
5 0.
1 10
.2
0.0
GC
065
3 T
riti
cale
(in
cl f
lour
) 0.
01
0.0
0.0
115.
8 1.
2 0.
0 0.
0 0.
0 0.
0 0.
3 0.
0 0.
0 0.
0
GC
065
4 W
heat
(in
cl b
ulgu
r w
hole
mea
l, fl
our)
0.
01
88.4
0.
9 39
6.3
4.0
426.
5 4.
3 39
0.2
3.9
236.
3 2.
4 21
6.0
2.2
CM
065
4 W
heat
bra
n, u
npro
cess
ed
0.04
5 N
D
- N
D
- N
D
- N
D
- N
D
- N
D
-
To
tal i
ntak
e (µ
g/pe
rson
)=
45.6
101.
7
66.3
70.5
70.4
69.1
B
ody
wei
ght p
er r
egio
n (k
g bw
) =
60
60
60
60
60
60
A
DI (
µg/
pers
on)=
12
00
12
00
12
00
12
00
12
00
12
00
%
AD
I=
3.8%
8.5%
5.5%
5.9%
5.9%
5.8%
R
ound
ed %
AD
I=
4%
8%
6%
6%
6%
6%

A
nn
ex 3
409
CY
HA
LO
TH
RIN
(1
46
) (i
ncl
ud
ing
La
mb
da
-cy
ha
loth
rin
) In
tern
atio
nal E
stim
ated
Dai
ly In
take
(IE
DI)
AD
I = 0
- 0
.02
mg/
kg b
w
STM
R o
r D
iets
: g/p
erso
n/da
y In
take
= d
aily
inta
ke: µ
g/pe
rson
STM
R-P
G
H
I
J K
L
M
C
odex
C
ode
Com
mod
ity
mg/
kg
diet
in
take
di
et
inta
ke
diet
in
take
di
et
inta
ke
diet
in
take
di
et
inta
ke
diet
in
take
FS 0
240
Apr
icot
(in
cl d
ried
) 0.
1 0.
2 0.
0 0.
1 0.
0 0.
2 0.
0 0.
0 0.
0 0.
0 0.
0 0.
1 0.
0 1.
1 0.
1
VS
0621
A
spar
agus
0.
01
3.7
0.0
0.3
0.0
0.2
0.0
0.0
0.0
0.0
0.0
0.5
0.0
1.1
0.0
GC
064
0 B
arle
y (i
ncl p
ot, p
earl
ed, f
lour
and
gri
ts, b
eer)
0.
02
5.9
0.1
20.5
0.
4 5.
9 0.
1 2.
5 0.
1 20
.2
0.4
16.8
0.
3 43
.8
0.9
FB 0
018
Ber
ries
and
oth
er s
mal
l fru
its
0.02
2.
8 0.
1 6.
6 0.
1 11
.8
0.2
0.3
0.0
8.6
0.2
17.1
0.
3 69
.4
1.4
VA
003
5 B
ulb
vege
tabl
es
0.05
31
.6
1.6
29.6
1.
5 9.
7 0.
5 19
.6
1.0
25.7
1.
3 47
.2
2.4
33.1
1.
7
VB
004
1 C
abba
ges,
Hea
d 0.
08
ND
-
ND
-
ND
-
ND
-
ND
-
ND
-
ND
-
MO
128
0 C
attle
kid
ney
0.03
0.
0 0.
0 0.
9 0.
0 0.
4 0.
0 0.
2 0.
0 0.
7 0.
0 0.
0 0.
0 0.
0 0.
0
MO
128
1 C
attle
live
r 0.
008
0.0
0.0
0.9
0.0
0.4
0.0
0.2
0.0
0.7
0.0
0.0
0.0
0.4
0.0
FS 0
013
Che
rrie
s 0.
125
0.0
0.0
0.0
0.0
0.0
0.0
0.0
0.0
0.0
0.0
0.3
0.0
2.5
0.3
FC 0
001
Cit
rus
frui
t (in
cl ju
ice)
0.
01
17.3
0.
2 15
6.8
1.6
14.9
0.
1 42
.5
0.4
222.
8 2.
2 40
.4
0.4
132.
3 1.
3
VO
044
0 E
gg p
lant
0.
03
20.1
0.
6 0.
1 0.
0 0.
6 0.
0 6.
3 0.
2 0.
5 0.
0 6.
3 0.
2 0.
7 0.
0
VB
004
2 Fl
ower
head
bra
ssic
as
0.21
5 9.
6 2.
1 7.
9 1.
7 0.
6 0.
1 0.
2 0.
0 0.
9 0.
2 1.
1 0.
2 8.
0 1.
7
VC
004
5 Fr
uiti
ng v
eget
able
s, C
ucur
bits
0.
01
69.7
0.
7 25
.9
0.3
14.9
0.
1 18
.0
0.2
18.7
0.
2 39
.1
0.4
44.2
0.
4
VP
0060
L
egum
e ve
geta
bles
0.
02
19.6
0.
4 6.
2 0.
1 6.
9 0.
1 6.
0 0.
1 1.
7 0.
0 29
.5
0.6
26.3
0.
5
GC
064
5 M
aize
(in
cl f
lour
, inc
l ger
m, i
ncl o
il, in
cl b
eer)
0.
01
35.2
0.
4 29
8.6
3.0
248.
1 2.
5 57
.4
0.6
63.1
0.
6 58
.6
0.6
85.5
0.
9
MF
0100
M
amm
alia
n fa
ts (
exce
pt m
ilk f
ats)
1
2.2
2.2
18.6
18
.6
0.5
0.5
0.8
0.8
5.7
5.7
4.5
4.5
18.2
18
.2
FI 0
345
Man
go (
incl
juic
e, p
ulp)
0.
03
12.7
0.
4 26
.2
0.8
6.1
0.2
12.7
0.
4 9.
2 0.
3 8.
0 0.
2 1.
9 0.
1
MM
009
5 M
eat f
rom
mam
mal
s ot
her
than
mar
ine
mam
mal
s: 2
0% a
s fa
t 1
11.0
11
.0
17.9
17
.9
6.1
6.1
5.7
5.7
16.4
16
.4
12.2
12
.2
31.7
31
.7
MM
009
5 M
eat f
rom
mam
mal
s ot
her
than
mar
ine
mam
mal
s: 8
0% a
s m
uscl
e 0.
04
43.8
1.
8 71
.5
2.9
24.5
1.
0 22
.9
0.9
65.7
2.
6 48
.9
2.0
126.
6 5.
1
ML
0106
M
ilks
(exc
l pro
cess
ed p
rodu
cts)
0.
08
66.0
5.
3 12
1.1
9.7
81.6
6.
5 10
2.4
8.2
207.
7 16
.6
57.0
4.
6 28
7.9
23.0
FS 0
245
Nec
tari
ne
0.1
1.7
0.2
1.7
0.2
0.0
0.0
0.0
0.0
1.0
0.1
1.7
0.2
1.4
0.1
GC
064
7 O
ats
(inc
l rol
led)
0.
01
0.2
0.0
2.0
0.0
0.8
0.0
0.0
0.0
3.5
0.0
0.7
0.0
7.6
0.1
SO 0
088
Oils
eed
0.01
26
.2
0.3
19.8
0.
2 24
.9
0.2
39.9
0.
4 7.
4 0.
1 62
.7
0.6
29.9
0.
3
VO
044
2 O
kra
0.03
4.
1 0.
1 1.
0 0.
0 7.
0 0.
2 15
.9
0.5
1.1
0.0
3.9
0.1
0.2
0.0
FT 0
305
Oliv
e (t
able
oliv
es, o
nly)
0.
125
0.0
0.0
0.1
0.0
0.0
0.0
0.0
0.0
0.6
0.1
0.0
0.0
1.0
0.1
OR
030
5 O
live
oil,
refi
ned
0.07
7 0.
0 0.
0 0.
1 0.
0 0.
0 0.
0 0.
0 0.
0 0.
3 0.
0 0.
3 0.
0 1.
6 0.
1
OR
533
0 O
live
oil,
resi
due
oil
0.09
1 0.
0 0.
0 0.
0 0.
0 0.
0 0.
0 0.
0 0.
0 0.
0 0.
0 0.
0 0.
0 0.
1 0.
0
FS 0
247
Peac
h 0.
1 1.
7 0.
2 1.
7 0.
2 1.
1 0.
1 0.
1 0.
0 1.
0 0.
1 1.
7 0.
2 10
.2
1.0
VO
005
1 Pe
pper
s 0.
03
8.7
0.3
22.4
0.
7 8.
4 0.
3 9.
4 0.
3 3.
3 0.
1 5.
3 0.
2 8.
9 0.
3

A
nn
ex 3
410C
YH
AL
OT
HR
IN (
14
6)
(in
clu
din
g L
am
bd
a-c
yh
alo
thri
n)
Inte
rnat
iona
l Est
imat
ed D
aily
Inta
ke (
IED
I)
A
DI =
0 -
0.0
2 m
g/kg
bw
STM
R o
r D
iets
: g/p
erso
n/da
y In
take
= d
aily
inta
ke: µ
g/pe
rson
STM
R-P
G
H
I
J K
L
M
C
odex
C
ode
Com
mod
ity
mg/
kg
diet
in
take
di
et
inta
ke
diet
in
take
di
et
inta
ke
diet
in
take
di
et
inta
ke
diet
in
take
FS 0
014
Plum
(in
cl d
ried
) 0.
02
3.3
0.1
1.4
0.0
0.1
0.0
0.0
0.0
0.6
0.0
1.5
0.0
2.2
0.0
FP 0
009
Pom
e fr
uit (
incl
app
le ju
ice)
0.
08
20.9
1.
7 12
.3
1.0
3.4
0.3
0.1
0.0
11.7
0.
9 24
.9
2.0
45.4
3.
6
GC
065
6 Po
pcor
n 0.
01
0.1
0.0
0.1
0.0
0.1
0.0
0.1
0.0
0.1
0.0
0.1
0.0
1.4
0.0
VD
007
0 Pu
lses
0.
01
41.9
0.
4 91
.8
0.9
35.9
0.
4 45
.2
0.5
160.
0 1.
6 59
.5
0.6
140.
1 1.
4
GC
064
9 R
ice
(hus
ked
+ p
olis
hed)
0.
295
376.
9 11
1.2
64.3
19
.0
38.0
11
.2
74.3
21
.9
238.
4 70
.3
381.
3 11
2.5
34.6
10
.2
CM
120
6 R
ice
bran
, unp
roce
ssed
0.
065
ND
-
ND
-
ND
-
ND
-
ND
-
ND
-
ND
-
VR
0075
R
oot a
nd tu
ber
vege
tabl
es
0 13
9.1
0.0
109.
8 0.
0 40
9.6
0.0
444.
6 0.
0 14
5.3
0.0
127.
0 0.
0 22
5.6
0.0
GC
065
0 R
ye (
incl
flo
ur)
0.01
0.
4 0.
0 0.
0 0.
0 0.
2 0.
0 0.
1 0.
0 0.
1 0.
0 0.
9 0.
0 0.
8 0.
0
MO
128
8 Sh
eep
kidn
ey
0.03
N
D
- N
D
- N
D
- N
D
- N
D
- N
D
- N
D
-
MO
128
9 Sh
eep
liver
0.
008
ND
-
ND
-
ND
-
ND
-
ND
-
ND
-
ND
-
GS
0659
Su
gar
cane
0.
02
26.2
0.
5 1.
5 0.
0 33
.8
0.7
5.5
0.1
18.6
0.
4 3.
0 0.
1 20
.2
0.4
DM
065
9 Su
gar
cane
mol
asse
s 0.
001
ND
-
ND
-
ND
-
ND
-
ND
-
ND
-
ND
-
VO
127
5 Sw
eet c
orn
kern
els
(inc
l cor
n on
the
cob
+
froz
en +
pre
serv
ed)
0.03
0.
4 0.
0 4.
9 0.
1 4.
5 0.
1 3.
3 0.
1 1.
7 0.
1 5.
6 0.
2 18
.1
0.5
VO
044
8 To
mat
o (e
xcl j
uice
, pas
te, p
eele
d)
0.03
22
.8
0.7
4.1
0.1
12.3
0.
4 1.
8 0.
1 32
.8
1.0
0.4
0.0
27.3
0.
8
JF 0
448
Tom
ato
juic
e 0.
002
0.0
0.0
0.8
0.0
0.1
0.0
7.2
0.0
0.0
0.0
2.4
0.0
45.2
0.
1
-d
Tom
ato
past
e 0.
007
0.1
0.0
2.1
0.0
0.6
0.0
0.4
0.0
0.6
0.0
1.4
0.0
1.2
0.0
TN
008
5 T
ree
nuts
0.
01
16.3
0.
2 15
.7
0.2
9.7
0.1
1.9
0.0
19.1
0.
2 29
.0
0.3
5.6
0.1
GC
065
3 T
riti
cale
(in
cl f
lour
) 0.
01
1.3
0.0
0.0
0.0
0.0
0.0
0.0
0.0
0.0
0.0
0.0
0.0
0.0
0.0
GC
065
4 W
heat
(in
cl b
ulgu
r w
hole
mea
l, fl
our)
0.
01
172.
9 1.
7 79
.0
0.8
68.1
0.
7 41
.9
0.4
114.
1 1.
1 10
3.4
1.0
234.
2 2.
3
CM
065
4 W
heat
bra
n, u
npro
cess
ed
0.04
5 N
D
- N
D
- N
D
- N
D
- N
D
- N
D
- N
D
-
To
tal i
ntak
e (µ
g/pe
rson
)=
144.
2
82.0
32.9
42.8
122
14
7.0
10
8.9
B
ody
wei
ght p
er r
egio
n (k
g bw
) =
55
60
60
60
60
55
60
A
DI (
µg/
pers
on)=
11
00
12
00
12
00
12
00
12
00
11
00
12
00
%
AD
I=
13.1
%
6.
8%
2.
7%
3.
6%
10
.2%
13.4
%
9.
1%
R
ound
ed %
AD
I=
10%
7%
3%
4%
10
%
10
%
9%

A
nn
ex 3
411
CY
PE
RM
ET
HR
IN (
119
) In
tern
atio
nal E
stim
ated
Dai
ly In
take
(IE
DI)
AD
I = 0
- 0
.02
mg/
kg b
w
STM
R o
r D
iets
: g/p
erso
n/da
y In
take
= d
aily
inta
ke: µ
g/pe
rson
STM
R-P
A
B
C
D
E
F
Cod
ex
Cod
e C
omm
odit
y m
g/kg
di
et
inta
ke
diet
in
take
di
et
inta
ke
diet
in
take
di
et
inta
ke
diet
in
take
VS
0620
A
rtic
hoke
glo
be
0.02
3 0.
0 0.
0 10
.0
0.2
2.1
0.0
0.1
0.0
0.8
0.0
0.1
0.0
VS
0621
A
spar
agus
0.
01
0.0
0.0
1.1
0.0
0.6
0.0
0.2
0.0
1.2
0.0
0.1
0.0
VB
040
0 B
rocc
oli
0.02
0.
0 0.
0 0.
7 0.
0 1.
2 0.
0 0.
1 0.
0 4.
2 0.
1 4.
0 0.
1
VB
040
2 B
russ
els
spro
uts
0.02
0.
0 0.
0 0.
1 0.
0 2.
8 0.
1 5.
5 0.
1 1.
5 0.
0 1.
9 0.
0
VB
004
1 C
abba
ges,
Hea
d 0.
02
1.2
0.0
14.4
0.
3 2.
7 0.
1 16
.4
0.3
15.4
0.
3 18
.5
0.4
FT 0
289
Car
ambo
la
0.02
N
D
- N
D
- N
D
- N
D
- N
D
- N
D
-
VB
040
4 C
aulif
low
er
0.02
0.
1 0.
0 5.
2 0.
1 1.
2 0.
0 0.
1 0.
0 1.
7 0.
0 0.
1 0.
0
GC
008
0 C
erea
l gra
ins
0.03
5 35
6.9
12.5
71
3.9
25.0
76
3.0
26.7
50
4.5
17.7
36
5.2
12.8
32
8.7
11.5
SB 0
716
Cof
fee
bean
s (i
ncl g
reen
, inc
l ext
ract
s, in
cl r
oast
ed)
0.05
3.
1 0.
2 12
.6
0.6
2.9
0.1
1.4
0.1
10.1
0.
5 18
.0
0.9
MO
010
5 E
dibl
e of
fal (
mam
mal
ian)
0.
014
3.9
0.1
14.4
0.
2 5.
2 0.
1 11
.8
0.2
11.7
0.
2 7.
6 0.
1
VO
044
0 E
gg p
lant
(=
aub
ergi
ne)
0.01
1.
7 0.
0 17
.5
0.2
12.3
0.
1 1.
7 0.
0 0.
8 0.
0 0.
4 0.
0
PE 0
112
Egg
s 0.
001
2.5
0.0
29.7
0.
0 25
.1
0.0
24.5
0.
0 37
.8
0.0
27.4
0.
0
VC
004
5 Fr
uiti
ng v
eget
able
s, C
ucur
bits
0.
01
26.6
0.
3 10
7.5
1.1
95.9
1.
0 82
.2
0.8
25.4
0.
3 23
.2
0.2
FB 0
269
Gra
pe (
excl
dri
ed, i
ncl j
uice
, exc
l win
e)
0.01
1.
9 0.
0 9.
4 0.
1 24
.0
0.2
9.9
0.1
2.0
0.0
1.4
0.0
DF
0269
G
rape
, dri
ed (
= c
urra
nts,
rai
sins
and
sul
tana
s)
0.03
3 0.
0 0.
0 2.
9 0.
1 0.
4 0.
0 0.
4 0.
0 2.
3 0.
1 1.
7 0.
1
VL
0053
L
eafy
veg
etab
les
0.07
5.
8 0.
4 45
.6
3.2
10.9
0.
8 26
.8
1.9
18.7
1.
3 38
.9
2.7
VA
038
4 L
eek
0.01
0.
3 0.
0 5.
3 0.
1 0.
0 0.
0 0.
2 0.
0 4.
6 0.
0 1.
5 0.
0
VP
0060
L
egum
e ve
geta
bles
0.
22
6.1
1.3
23.0
5.
1 18
.0
4.0
12.8
2.
8 26
.9
5.9
5.3
1.2
FI 0
345
Man
go (
incl
juic
e, in
cl p
ulp)
0.
19
6.3
1.2
1.0
0.2
4.6
0.9
0.2
0.0
0.7
0.1
0.3
0.1
MM
009
5 M
eat f
rom
mam
mal
s ot
her
than
mar
ine
mam
mal
s:
20%
as
fat
0.15
5.
5 0.
8 23
.3
3.5
7.7
1.2
11.0
1.
7 18
.0
2.7
26.3
3.
9
MM
009
5 M
eat f
rom
mam
mal
s ot
her
than
mar
ine
mam
mal
s: 8
0%
as m
uscl
e 0.
014
22.2
0.
3 93
.2
1.3
30.8
0.
4 44
.1
0.6
72.2
1.
0 10
5.0
1.5
ML
0106
M
ilks
(exc
l pro
cess
ed p
rodu
cts)
0.
011
68.8
0.
8 19
0.6
2.1
79.4
0.
9 30
2.6
3.3
179.
6 2.
0 23
7.9
2.6
SO 0
088
Oils
eed
0.05
22
.3
1.1
65.2
3.
3 35
.4
1.8
52.0
2.
6 62
.1
3.1
39.4
2.
0
VO
044
2 O
kra
0.08
3.
9 0.
3 1.
0 0.
1 5.
3 0.
4 0.
1 0.
0 0.
0 0.
0 0.
0 0.
0
FT 0
305
Oliv
e (i
ncl o
il)
0.05
0.
0 0.
0 76
.3
3.8
20.3
1.
0 0.
4 0.
0 8.
5 0.
4 4.
8 0.
2
VA
038
5 O
nion
, Bul
b (=
dry
+ g
reen
oni
on)
0.01
5.
5 0.
1 49
.5
0.5
33.0
0.
3 31
.3
0.3
23.2
0.
2 14
.6
0.1
FI 0
350
Papa
ya
0.13
5 5.
1 0.
7 0.
1 0.
0 0.
0 0.
0 0.
0 0.
0 0.
1 0.
0 0.
0 0.
0
VO
044
4 Pe
pper
s, C
hilli
0.
495
0.7
0.3
14.9
7.
4 4.
1 2.
0 3.
2 1.
6 3.
1 1.
5 2.
0 1.
0
VO
044
5 Pe
pper
s, s
wee
t (in
cl. p
im(i
)ent
o)
0.05
0.
7 0.
0 14
.9
0.7
8.8
0.4
3.2
0.2
3.1
0.2
2.0
0.1

A
nn
ex 3
412
CY
PE
RM
ET
HR
IN (
119
) In
tern
atio
nal E
stim
ated
Dai
ly In
take
(IE
DI)
AD
I = 0
- 0
.02
mg/
kg b
w
STM
R o
r D
iets
: g/p
erso
n/da
y In
take
= d
aily
inta
ke: µ
g/pe
rson
STM
R-P
A
B
C
D
E
F
Cod
ex
Cod
e C
omm
odit
y m
g/kg
di
et
inta
ke
diet
in
take
di
et
inta
ke
diet
in
take
di
et
inta
ke
diet
in
take
DF
0014
Pl
um, d
ried
(pr
unes
) 1.
9 0.
0 0.
0 0.
2 0.
4 0.
0 0.
0 0.
1 0.
2 0.
5 1.
0 0.
6 1.
1
FP 0
009
Pom
e fr
uit (
incl
app
le ju
ice)
0.
205
0.5
0.1
84.1
17
.2
21.9
4.
5 45
.2
9.3
61.7
12
.6
46.2
9.
5
PM 0
110
Poul
try
mea
t: 10
% a
s fa
t 0.
008
0.7
0.0
5.9
0.0
3.2
0.0
2.4
0.0
6.1
0.0
2.7
0.0
PM 0
110
Poul
try
mea
t: 90
% a
s m
uscl
e 0.
002
6.4
0.0
52.7
0.
1 28
.7
0.1
21.6
0.
0 54
.9
0.1
24.6
0.
0
PO 0
111
Poul
try,
Edi
ble
offa
l of
0.00
2 0.
4 0.
0 0.
4 0.
0 1.
7 0.
0 0.
1 0.
0 0.
6 0.
0 0.
2 0.
0
VD
007
0 Pu
lses
0.
05
54.5
2.
7 62
.9
3.1
51.4
2.
6 36
.8
1.8
49.4
2.
5 47
.9
2.4
GC
064
9 R
ice
(inc
l hus
ked,
incl
pol
ishe
d)
0.57
91
.0
51.9
31
.6
18.0
94
.6
53.9
33
.2
18.9
12
.7
7.2
12.7
7.
2
VR
0075
R
oot a
nd tu
ber
vege
tabl
es
0.01
52
8.2
5.3
352.
8 3.
5 78
.5
0.8
270.
3 2.
7 32
4.1
3.2
261.
3 2.
6
FS 0
012
Ston
e fr
uit (
excl
dri
ed p
lum
s, in
cl d
ried
apr
icot
s)
0.59
0.
7 0.
4 44
.1
26.0
14
.1
8.3
26.6
15
.7
26.3
15
.5
8.3
4.9
FB 0
275
Stra
wbe
rry
0.01
0.
0 0.
0 5.
0 0.
1 2.
0 0.
0 1.
7 0.
0 5.
2 0.
1 4.
1 0.
0
GS
0659
Su
gar
cane
0.
05
30.9
1.
5 43
.1
2.2
51.3
2.
6 0.
1 0.
0 5.
5 0.
3 0.
0 0.
0
VO
044
7 Sw
eet c
orn
(cor
n-on
-the
-cob
) 0
7.3
0.0
1.0
0.0
0.1
0.0
0.5
0.0
3.3
0.0
3.6
0.0
VO
044
8 To
mat
o (e
xcl j
uice
, inc
l pas
te, e
xcl p
eele
d)
0.05
5.
2 0.
3 18
3.9
9.2
116.
9 5.
8 57
.6
2.9
16.9
0.
8 17
.9
0.9
JF 0
448
Tom
ato
juic
e 0.
015
5.2
0.1
0.5
0.0
0.4
0.0
2.1
0.0
6.9
0.1
15.2
0.
2
-d
Tom
ato,
pee
led
0.00
6 0.
1 0.
0 0.
4 0.
0 0.
5 0.
0 0.
4 0.
0 4.
9 0.
0 3.
2 0.
0
CM
065
4 W
heat
bra
n, u
npro
cess
ed
0.08
4 N
D
- N
D
- N
D
- N
D
- N
D
- N
D
-
CF
1211
W
heat
flo
ur (
incl
mac
aron
i, br
ead,
pas
try,
sta
rch,
gl
uten
) 0.
015
63.4
1.
0 29
6.3
4.4
327.
5 4.
9 30
0.0
4.5
181.
6 2.
7 16
6.2
2.5
- W
ine
0.00
1 1.
3 0.
0 76
.8
0.1
1.1
0.0
15.4
0.
0 68
.8
0.1
25.6
0.
0
To
tal i
ntak
e (µ
g/pe
rson
)=
83.7
143.
5
126.
1
90.5
79.2
60.3
B
ody
wei
ght p
er r
egio
n (k
g bw
) =
60
60
60
60
60
60
A
DI (
µg/
pers
on)=
12
00
12
00
12
00
12
00
12
00
12
00
%
AD
I=
7.0%
12.0
%
10
.5%
7.5%
6.6%
5.0%
R
ound
ed %
AD
I=
7%
10
%
10
%
8%
7%
5%

A
nn
ex 3
413A
nnex
3
CY
PE
RM
ET
HR
IN (
119
) In
tern
atio
nal E
stim
ated
Dai
ly In
take
(IE
DI)
AD
I = 0
- 0
.02
mg/
kg b
w
STM
R o
r D
iets
: g/p
erso
n/da
y In
take
= d
aily
inta
ke: µ
g/pe
rson
STM
R-P
G
H
I
J K
L
M
C
odex
C
ode
Com
mod
ity
mg/
kg
diet
in
take
di
et
inta
ke
diet
in
take
di
et
inta
ke
diet
in
take
di
et
inta
ke
diet
in
take
VS
0620
A
rtic
hoke
glo
be
0.02
3 0.
1 0.
0 0.
1 0.
0 0.
0 0.
0 0.
0 0.
0 0.
0 0.
0 0.
0 0.
0 1.
0 0.
0
VS
0621
A
spar
agus
0.
01
3.7
0.0
0.3
0.0
0.2
0.0
0.0
0.0
0.0
0.0
0.5
0.0
1.1
0.0
VB
040
0 B
rocc
oli
0.02
3.
2 0.
1 7.
8 0.
2 0.
0 0.
0 0.
0 0.
0 0.
3 0.
0 0.
4 0.
0 6.
6 0.
1
VB
040
2 B
russ
els
spro
uts
0.02
3.
4 0.
1 0.
4 0.
0 0.
0 0.
0 0.
0 0.
0 0.
5 0.
0 7.
9 0.
2 0.
3 0.
0
VB
004
1 C
abba
ges,
Hea
d 0.
02
10.0
0.
2 1.
0 0.
0 7.
2 0.
1 1.
0 0.
0 1.
4 0.
0 23
.9
0.5
17.0
0.
3
FT 0
289
Car
ambo
la
0.02
N
D
- N
D
- N
D
- N
D
- N
D
- N
D
- N
D
-
VB
040
4 C
aulif
low
er
0.02
3.
2 0.
1 0.
1 0.
0 0.
3 0.
0 0.
1 0.
0 0.
6 0.
0 0.
4 0.
0 1.
4 0.
0
GC
008
0 C
erea
l gra
ins
0.03
5 61
7.0
21.6
48
7.1
17.0
38
9.4
13.6
38
5.7
13.5
44
0.2
15.4
56
7.7
19.9
40
9.9
14.3
SB 0
716
Cof
fee
bean
s (i
ncl g
reen
, inc
l ext
ract
s, in
cl
roas
ted)
0.
05
0.2
0.0
7.0
0.4
0.5
0.0
0.2
0.0
5.3
0.3
5.7
0.3
12.4
0.
6
MO
010
5 E
dibl
e of
fal (
mam
mal
ian)
0.
014
4.8
0.1
10.7
0.
1 4.
0 0.
1 4.
0 0.
1 6.
5 0.
1 6.
6 0.
1 5.
6 0.
1
VO
044
0 E
gg p
lant
(=
aub
ergi
ne)
0.01
20
.1
0.2
0.1
0.0
0.6
0.0
6.3
0.1
0.5
0.0
6.3
0.1
0.7
0.0
PE 0
112
Egg
s 0.
001
22.1
0.
0 71
.5
0.1
16.6
0.
0 5.
1 0.
0 17
.6
0.0
35.2
0.
0 57
.4
0.1
VC
004
5 Fr
uiti
ng v
eget
able
s, C
ucur
bits
0.
01
69.7
0.
7 25
.9
0.3
14.9
0.
1 18
.0
0.2
18.7
0.
2 39
.1
0.4
44.2
0.
4
FB 0
269
Gra
pe (
excl
dri
ed, i
ncl j
uice
, exc
l win
e)
0.01
1.
2 0.
0 2.
7 0.
0 1.
4 0.
0 0.
2 0.
0 0.
8 0.
0 4.
3 0.
0 5.
0 0.
1
DF
0269
G
rape
, dri
ed (
= c
urra
nts,
rai
sins
and
sul
tana
s)
0.03
3 0.
0 0.
0 0.
2 0.
0 0.
2 0.
0 0.
0 0.
0 0.
3 0.
0 0.
4 0.
0 2.
6 0.
1
VL
0053
L
eafy
veg
etab
les
0.07
40
.8
2.9
12.0
0.
8 12
.5
0.9
9.5
0.7
5.4
0.4
50.0
3.
5 39
.9
2.8
VA
038
4 L
eek
0.01
0.
8 0.
0 0.
2 0.
0 0.
0 0.
0 0.
0 0.
0 0.
0 0.
0 0.
3 0.
0 0.
1 0.
0
VP
0060
L
egum
e ve
geta
bles
0.
22
19.6
4.
3 6.
2 1.
4 6.
9 1.
5 6.
0 1.
3 1.
7 0.
4 29
.5
6.5
26.3
5.
8
FI 0
345
Man
go (
incl
juic
e, in
cl p
ulp)
0.
19
12.7
2.
4 26
.2
5.0
6.1
1.2
12.7
2.
4 9.
2 1.
7 8.
0 1.
5 1.
9 0.
4
MM
009
5 M
eat f
rom
mam
mal
s ot
her
than
mar
ine
mam
mal
s: 2
0% a
s fa
t 0.
15
11.0
1.
6 17
.9
2.7
6.1
0.9
5.7
0.9
16.4
2.
5 12
.2
1.8
31.7
4.
7
MM
009
5 M
eat f
rom
mam
mal
s ot
her
than
mar
ine
mam
mal
s: 8
0% a
s m
uscl
e 0.
014
43.8
0.
6 71
.5
1.0
24.5
0.
3 22
.9
0.3
65.7
0.
9 48
.9
0.7
126.
6 1.
8
ML
0106
M
ilks
(exc
l pro
cess
ed p
rodu
cts)
0.
011
66.0
0.
7 12
1.1
1.3
81.6
0.
9 10
2.4
1.1
207.
7 2.
3 57
.0
0.6
287.
9 3.
2
SO 0
088
Oils
eed
0.05
26
.2
1.3
19.8
1.
0 24
.9
1.2
39.9
2.
0 7.
4 0.
4 62
.7
3.1
29.9
1.
5
VO
044
2 O
kra
0.08
4.
1 0.
3 1.
0 0.
1 7.
0 0.
6 15
.9
1.3
1.1
0.1
3.9
0.3
0.2
0.0
FT 0
305
Oliv
e (i
ncl o
il)
0.05
0.
0 0.
0 0.
6 0.
0 0.
0 0.
0 0.
0 0.
0 2.
1 0.
1 1.
5 0.
1 9.
0 0.
5
VA
038
5 O
nion
, Bul
b (=
dry
+ g
reen
oni
on)
0.01
17
.4
0.2
27.9
0.
3 7.
3 0.
1 16
.0
0.2
22.8
0.
2 34
.5
0.3
30.1
0.
3
FI 0
350
Papa
ya
0.13
5 1.
3 0.
2 11
.5
1.6
1.6
0.2
13.7
1.
8 14
.5
2.0
1.0
0.1
0.6
0.1
VO
044
4 Pe
pper
s, C
hilli
0.
495
8.7
4.3
13.0
6.
4 4.
2 2.
1 4.
7 2.
3 1.
7 0.
8 2.
6 1.
3 4.
4 2.
2

A
nn
ex 3
414C
YP
ER
ME
TH
RIN
(11
9)
Inte
rnat
iona
l Est
imat
ed D
aily
Inta
ke (
IED
I)
A
DI =
0 -
0.0
2 m
g/kg
bw
STM
R o
r D
iets
: g/p
erso
n/da
y In
take
= d
aily
inta
ke: µ
g/pe
rson
STM
R-P
G
H
I
J K
L
M
C
odex
C
ode
Com
mod
ity
mg/
kg
diet
in
take
di
et
inta
ke
diet
in
take
di
et
inta
ke
diet
in
take
di
et
inta
ke
diet
in
take
VO
044
5 Pe
pper
s, s
wee
t (in
cl. p
im(i
)ent
o)
0.05
0.
0 0.
0 9.
4 0.
5 4.
2 0.
2 4.
7 0.
2 1.
7 0.
1 2.
6 0.
1 4.
4 0.
2
DF
0014
Pl
um, d
ried
(pr
unes
) 1.
9 0.
1 0.
2 0.
2 0.
4 0.
0 0.
0 0.
0 0.
0 0.
2 0.
4 0.
2 0.
4 0.
6 1.
1
FP 0
009
Pom
e fr
uit (
incl
app
le ju
ice)
0.
205
20.9
4.
3 12
.3
2.5
3.4
0.7
0.1
0.0
11.7
2.
4 24
.9
5.1
45.4
9.
3
PM 0
110
Poul
try
mea
t: 10
% a
s fa
t 0.
008
1.8
0.0
13.1
0.
1 2.
5 0.
0 0.
5 0.
0 14
.6
0.1
2.8
0.0
11.5
0.
1
PM 0
110
Poul
try
mea
t: 90
% a
s m
uscl
e 0.
002
15.8
0.
0 11
8.2
0.2
22.6
0.
0 4.
2 0.
0 13
1.3
0.3
24.9
0.
0 10
3.6
0.2
PO 0
111
Poul
try,
Edi
ble
offa
l of
0.00
2 0.
4 0.
0 1.
0 0.
0 1.
9 0.
0 0.
0 0.
0 0.
7 0.
0 1.
0 0.
0 0.
3 0.
0
VD
007
0 Pu
lses
0.
05
41.9
2.
1 91
.8
4.6
35.9
1.
8 45
.2
2.3
160.
0 8.
0 59
.5
3.0
140.
1 7.
0
GC
064
9 R
ice
(inc
l hus
ked,
incl
pol
ishe
d)
0.57
37
6.9
214.
8 64
.3
36.7
38
.0
21.7
74
.3
42.4
23
8.4
135.
9 38
1.3
217.
3 34
.6
19.7
VR
0075
R
oot a
nd tu
ber
vege
tabl
es
0.01
13
9.1
1.4
109.
8 1.
1 40
9.6
4.1
444.
6 4.
4 14
5.3
1.5
127.
0 1.
3 22
5.6
2.3
FS 0
012
Ston
e fr
uit (
excl
dri
ed p
lum
s, in
cl d
ried
apr
icot
s) 0
.59
6.7
4.0
4.3
2.5
1.4
0.8
0.1
0.1
4.9
2.9
4.9
2.9
17.7
10
.4
FB 0
275
Stra
wbe
rry
0.01
0.
0 0.
0 1.
8 0.
0 0.
1 0.
0 0.
0 0.
0 0.
3 0.
0 6.
2 0.
1 5.
9 0.
1
GS
0659
Su
gar
cane
0.
05
26.2
1.
3 1.
5 0.
1 33
.8
1.7
5.5
0.3
18.6
0.
9 3.
0 0.
2 20
.2
1.0
VO
044
7 Sw
eet c
orn
(cor
n-on
-the
-cob
) 0
0.2
0.0
2.4
0.0
2.2
0.0
3.3
0.0
1.7
0.0
2.8
0.0
11.2
0.
0
VO
044
8 To
mat
o (e
xcl j
uice
, inc
l pas
te, e
xcl p
eele
d)
0.05
23
.3
1.2
12.6
0.
6 14
.6
0.7
7.2
0.4
35.2
1.
8 5.
9 0.
3 45
.0
2.3
JF 0
448
Tom
ato
juic
e 0.
015
0.0
0.0
0.8
0.0
0.1
0.0
7.2
0.1
0.0
0.0
2.4
0.0
45.2
0.
7
-d
Tom
ato,
pee
led
0.00
6 0.
2 0.
0 14
.5
0.1
0.2
0.0
0.0
0.0
0.3
0.0
0.8
0.0
1.2
0.0
CM
065
4 W
heat
bra
n, u
npro
cess
ed
0.08
4 N
D
- N
D
- N
D
- N
D
- N
D
- N
D
- N
D
-
CF
1211
W
heat
flo
ur (
incl
mac
aron
i, br
ead,
pas
try,
sta
rch,
gl
uten
) 0.
015
133.
0 2.
0 60
.1
0.9
52.4
0.
8 32
.2
0.5
87.7
1.
3 79
.6
1.2
180.
1 2.
7
- W
ine
0.00
1 1.
0 0.
0 0.
9 0.
0 6.
8 0.
0 0.
1 0.
0 3.
4 0.
0 3.
6 0.
0 31
.0
0.0
To
tal i
ntak
e (µ
g/pe
rson
)=
273.
2
90.0
56.5
78.8
183.
3
273.
3
96.5
B
ody
wei
ght p
er r
egio
n (k
g bw
) =
55
60
60
60
60
55
60
A
DI (
µg/
pers
on)=
11
00
12
00
12
00
12
00
12
00
11
00
12
00
%
AD
I=
24.8
%
7.
5%
4.
7%
6.
6%
15
.3%
24.8
%
8.
0%
R
ound
ed %
AD
I=
20%
7%
5%
7%
20
%
20
%
8%

A
nn
ex 3
415
DIM
ET
HO
AT
E (
02
7)
Inte
rnat
iona
l Est
imat
ed D
aily
Inta
ke (
IED
I)
A
DI =
0 -
0.0
02 m
g/kg
bw
STM
R o
r D
iets
: g/p
erso
n/da
y In
take
= d
aily
inta
ke: µ
g/pe
rson
STM
R-P
A
B
C
D
E
F
Cod
ex
Cod
e C
omm
odit
y m
g/kg
di
et
inta
ke
diet
in
take
di
et
inta
ke
diet
in
take
di
et
inta
ke
diet
in
take
VS
0620
A
rtic
hoke
glo
be
0.1
0.0
0.0
10.0
1.
0 2.
1 0.
2 0.
1 0.
0 0.
8 0.
1 0.
1 0.
0
VS
0621
A
spar
agus
0.
22
0.0
0.0
1.1
0.2
0.6
0.1
0.2
0.0
1.2
0.3
0.1
0.0
GC
064
0 B
arle
y (i
ncl p
ot, i
ncl p
earl
ed, i
ncl f
lour
& g
rits
, inc
l bee
r)
0.40
5 40
.6
16.4
16
.8
6.8
93.9
38
.0
13.2
5.
3 48
.6
19.7
36
.1
14.6
VB
040
2 B
russ
els
spro
uts
0.35
0.
0 0.
0 0.
1 0.
0 2.
8 1.
0 5.
5 1.
9 1.
5 0.
5 1.
9 0.
7
VB
040
3 C
abba
ge, S
avoy
1/
0.77
1.
2 0.
9 14
.4
11.1
2.
7 2.
1 16
.4
12.6
15
.4
11.9
18
.5
14.2
VB
040
4 C
aulif
low
er
0.02
5 0.
1 0.
0 5.
2 0.
1 1.
2 0.
0 0.
1 0.
0 1.
7 0.
0 0.
1 0.
0
VS
0624
C
eler
y 0.
2 0.
0 0.
0 0.
9 0.
2 0.
0 0.
0 2.
0 0.
4 1.
5 0.
3 0.
0 0.
0
FS 0
013
Che
rrie
s 1.
425
0.0
0.0
6.8
9.7
0.9
1.3
6.2
8.8
3.6
5.1
0.4
0.6
FC 0
001
Cit
rus
frui
t (in
cl le
mon
juic
e, in
cl m
anda
rin
juic
e, e
xcl o
rang
e ju
ice,
incl
gr
apef
ruit
juic
e, in
cl N
ES
juic
e)
0.27
15
.7
4.2
96.7
26
.1
55.3
14
.9
25.3
6.
8 23
.4
6.3
16.2
4.
4
PE 0
112
Egg
s 0
2.5
0.0
29.7
0.
0 25
.1
0.0
24.5
0.
0 37
.8
0.0
27.4
0.
0
VL
0482
L
ettu
ce, h
ead
0.13
0.
1 0.
0 12
.3
1.6
1.3
0.2
0.1
0.0
0.1
0.0
0.0
0.0
FI 0
345
Man
go (
incl
juic
e, in
cl p
ulp)
0.
36
6.3
2.3
1.0
0.4
4.6
1.7
0.2
0.1
0.7
0.3
0.3
0.1
MM
009
5 M
eat f
rom
mam
mal
s ot
her
than
mar
ine
mam
mal
s 0
27.7
0.
0 11
6.5
0.0
38.5
0.
0 55
.1
0.0
90.2
0.
0 13
1.3
0.0
ML
0107
M
ilk o
f ca
ttle
, goa
ts &
she
ep (
excl
pro
cess
ed p
rodu
cts)
0
52.7
0.
0 18
9.5
0.0
65.7
0.
0 29
5.6
0.0
179.
6 0.
0 23
7.9
0.0
FT 0
305
Oliv
e (t
able
oliv
es, o
nly)
2.
24
0.0
0.0
4.8
10.8
0.
8 1.
8 0.
4 0.
9 1.
0 2.
2 0.
8 1.
8
OR
030
5 O
live
oil,
refi
ned
0.05
9 0.
0 0.
0 14
.3
0.8
3.9
0.2
0.0
0.0
1.5
0.1
0.8
0.0
JF 0
004
Ora
nge
juic
e 0.
49
0.0
0.0
2.1
1.0
4.4
2.2
1.4
0.7
16.2
7.
9 22
.6
11.1
FP 0
230
Pear
0.
57
0.1
0.1
22.3
12
.7
2.8
1.6
4.8
2.7
10.7
6.
1 6.
8 3.
9
VP
0063
Pe
as (
gree
n po
ds a
nd/o
r im
mat
ure
seed
s)
0.26
5 0.
1 0.
0 2.
9 0.
8 6.
0 1.
6 0.
6 0.
2 9.
7 2.
6 5.
2 1.
4
VO
044
5 Pe
pper
s, s
wee
t (in
cl. p
im(i
)ent
o)
0.28
0.
7 0.
2 14
.9
4.2
8.8
2.5
3.2
0.9
3.1
0.9
2.0
0.6
VR
058
9 Po
tato
(in
cl f
lour
, fro
zen,
sta
rch,
tapi
oca)
0.
11
19.1
2.
1 16
0.8
17.7
61
.2
6.7
243.
6 26
.8
230.
1 25
.3
204.
7 22
.5
PM 0
110
Poul
try
mea
t 0
7.1
0.0
58.5
0.
0 31
.9
0.0
24.0
0.
0 61
.0
0.0
27.3
0.
0
PO 0
111
Poul
try,
Edi
ble
offa
l of
0 0.
4 0.
0 0.
4 0.
0 1.
7 0.
0 0.
1 0.
0 0.
6 0.
0 0.
2 0.
0
PF 0
111
Poul
try,
fat
s 0
0.1
0.0
0.1
0.0
0.1
0.0
0.0
0.0
0.4
0.0
0.1
0.0
MO
082
2 Sh
eep,
edi
ble
offa
l of
0 0.
4 0.
0 1.
3 0.
0 1.
7 0.
0 1.
0 0.
0 0.
7 0.
0 0.
4 0.
0
VR
059
6 Su
gar
beet
0.
11
0.0
0.0
40.7
4.
5 0.
0 0.
0 0.
1 0.
0 6.
0 0.
7 0.
1 0.
0
VR
050
6 T
urni
p, g
arde
n 1.
1 0.
0 0.
0 0.
1 0.
1 0.
8 0.
9 2.
0 2.
2 0.
6 0.
7 14
.0
15.4
GC
065
4 W
heat
(ex
cl b
ulgu
r w
hole
mea
l, ex
cl f
lour
) 0.
021
0.0
0.0
0.0
0.0
0.0
0.0
0.0
0.0
0.1
0.0
0.0
0.0
-d
Whe
at b
ulgu
r w
hole
mea
l 0.
027
5.5
0.1
10.2
0.
3 0.
7 0.
0 0.
2 0.
0 0.
1 0.
0 0.
0 0.
0
CF
1211
W
heat
flo
ur (
incl
mac
aron
i, br
ead,
pas
try,
sta
rch,
glu
ten)
0.
014
63.4
0.
9 29
6.3
4.1
327.
5 4.
6 30
0.0
4.2
181.
6 2.
5 16
6.2
2.3

A
nn
ex 3
416
DIM
ET
HO
AT
E (
02
7)
Inte
rnat
iona
l Est
imat
ed D
aily
Inta
ke (
IED
I)
A
DI =
0 -
0.0
02 m
g/kg
bw
STM
R o
r D
iets
: g/p
erso
n/da
y In
take
= d
aily
inta
ke: µ
g/pe
rson
STM
R-P
A
B
C
D
E
F
Cod
ex
Cod
e C
omm
odit
y m
g/kg
di
et
inta
ke
diet
in
take
di
et
inta
ke
diet
in
take
di
et
inta
ke
diet
in
take
To
tal i
ntak
e (µ
g/pe
rson
)=
27.3
114.
2
81.5
74.7
93.5
93.6
B
ody
wei
ght p
er r
egio
n (k
g bw
) =
60
60
60
60
60
60
A
DI (
µg/
pers
on)=
12
0
120
12
0
120
12
0
120
%
AD
I=
22.8
%
95
.2%
67.9
%
62
.2%
77.9
%
78
.0%
R
ound
ed %
AD
I=
20%
100%
70%
60%
80%
80%
Not
e 1:
B
ecau
se n
o co
nsum
ptio
n da
ta a
re a
vail
able
for
Sav
oy c
abba
ge, t
he S
TM
R o
f S
avoy
cab
bage
was
app
lied
to h
ead
cabb
age
(VB
004
1) c
onsu
mpt
ion.
DIM
ET
HO
AT
E (
02
7)
Inte
rnat
iona
l Est
imat
ed D
aily
Inta
ke (
IED
I)
A
DI =
0 -
0.0
02 m
g/kg
bw
STM
R o
r D
iets
: g/p
erso
n/da
y In
take
= d
aily
inta
ke: µ
g/pe
rson
STM
R-P
G
H
I
J K
L
M
C
odex
C
ode
Com
mod
ity
mg/
kg
diet
in
take
di
et
inta
ke
diet
in
take
di
et
inta
ke
diet
in
take
di
et
inta
ke
diet
in
take
VS
0620
A
rtic
hoke
glo
be
0.1
0.1
0.0
0.1
0.0
0.0
0.0
0.0
0.0
0.0
0.0
0.0
0.0
1.0
0.1
VS
0621
A
spar
agus
0.
22
3.7
0.8
0.3
0.1
0.2
0.0
0.0
0.0
0.0
0.0
0.5
0.1
1.1
0.2
GC
064
0 B
arle
y (i
ncl p
ot, i
ncl p
earl
ed, i
ncl f
lour
& g
rits
, inc
l bee
r)
0.40
5 5.
9 2.
4 20
.5
8.3
5.9
2.4
2.5
1.0
20.2
8.
2 16
.8
6.8
43.8
17
.7
VB
040
2 B
russ
els
spro
uts
0.35
3.
4 1.
2 0.
4 0.
1 0.
0 0.
0 0.
0 0.
0 0.
5 0.
2 7.
9 2.
8 0.
3 0.
1
VB
040
3 C
abba
ge, S
avoy
1/
0.77
10
.0
7.7
1.0
0.8
7.2
5.5
1.0
0.8
1.4
1.1
23.9
18
.4
17.0
13
.1
VB
040
4 C
aulif
low
er
0.02
5 3.
2 0.
1 0.
1 0.
0 0.
3 0.
0 0.
1 0.
0 0.
6 0.
0 0.
4 0.
0 1.
4 0.
0
VS
0624
C
eler
y 0.
2 0.
0 0.
0 0.
3 0.
1 0.
0 0.
0 0.
0 0.
0 1.
0 0.
2 0.
0 0.
0 4.
2 0.
8
FS 0
013
Che
rrie
s 1.
425
0.0
0.0
0.0
0.0
0.0
0.0
0.0
0.0
0.0
0.0
0.3
0.4
2.5
3.6
FC 0
001
Cit
rus
frui
t (in
cl le
mon
juic
e, in
cl m
anda
rin
juic
e, e
xcl o
rang
e ju
ice,
incl
gra
pefr
uit j
uice
, inc
l NE
S ju
ice)
0.
27
16.9
4.
6 15
5.0
41.9
8.
6 2.
3 42
.5
11.5
22
0.5
59.5
28
.9
7.8
30.1
8.
1
PE 0
112
Egg
s 0
22.1
0.
0 71
.5
0.0
16.6
0.
0 5.
1 0.
0 17
.6
0.0
35.2
0.
0 57
.4
0.0
VL
0482
L
ettu
ce, h
ead
0.13
2.
4 0.
3 7.
0 0.
9 0.
2 0.
0 0.
6 0.
1 2.
0 0.
3 2.
4 0.
3 15
.7
2.0
FI 0
345
Man
go (
incl
juic
e, in
cl p
ulp)
0.
36
12.7
4.
6 26
.2
9.4
6.1
2.2
12.7
4.
6 9.
2 3.
3 8.
0 2.
9 1.
9 0.
7
MM
00
95
Mea
t fro
m m
amm
als
othe
r th
an m
arin
e m
amm
als
0 54
.8
0.0
89.4
0.
0 30
.6
0.0
28.6
0.
0 82
.1
0.0
61.1
0.
0 15
8.3
0.0
ML
0107
M
ilk o
f ca
ttle
, goa
ts &
she
ep (
excl
pro
cess
ed p
rodu
cts)
0
48.0
0.
0 12
1.1
0.0
80.8
0.
0 94
.7
0.0
207.
7 0.
0 56
.1
0.0
287.
9 0.
0
FT 0
305
Oliv
e (t
able
oliv
es, o
nly)
2.
24
0.0
0.0
0.1
0.2
0.0
0.0
0.0
0.0
0.6
1.3
0.0
0.0
1.0
2.2

A
nn
ex 3
417D
IME
TH
OA
TE
(0
27
) In
tern
atio
nal E
stim
ated
Dai
ly In
take
(IE
DI)
AD
I = 0
- 0
.002
mg/
kg b
w
STM
R o
r D
iets
: g/p
erso
n/da
y In
take
= d
aily
inta
ke: µ
g/pe
rson
STM
R-P
G
H
I
J K
L
M
C
odex
C
ode
Com
mod
ity
mg/
kg
diet
in
take
di
et
inta
ke
diet
in
take
di
et
inta
ke
diet
in
take
di
et
inta
ke
diet
in
take
OR
030
5 O
live
oil,
refi
ned
0.05
9 0.
0 0.
0 0.
1 0.
0 0.
0 0.
0 0.
0 0.
0 0.
3 0.
0 0.
3 0.
0 1.
6 0.
1
JF 0
004
Ora
nge
juic
e 0.
49
0.2
0.1
1.0
0.5
3.5
1.7
0.0
0.0
1.3
0.6
6.4
3.1
56.8
27
.8
FP 0
230
Pear
0.
57
6.4
3.6
1.9
1.1
1.2
0.7
0.0
0.0
1.8
1.0
6.9
3.9
7.8
4.4
VP
0063
Pe
as (
gree
n po
ds a
nd/o
r im
mat
ure
seed
s)
0.26
5 3.
9 1.
0 1.
6 0.
4 0.
4 0.
1 0.
0 0.
0 0.
9 0.
2 1.
0 0.
3 8.
6 2.
3
VO
044
5 Pe
pper
s, s
wee
t (in
cl. p
im(i
)ent
o)
0.28
0.
0 0.
0 9.
4 2.
6 4.
2 1.
2 4.
7 1.
3 1.
7 0.
5 2.
6 0.
7 4.
4 1.
2
VR
058
9 Po
tato
(in
cl f
lour
, fro
zen,
sta
rch,
tapi
oca)
0.
11
52.7
5.
8 57
.1
6.3
50.1
5.
5 4.
3 0.
5 54
.7
6.0
41.0
4.
5 16
8.0
18.5
PM 0
110
Poul
try
mea
t 0
17.6
0.
0 13
1.3
0.0
25.1
0.
0 4.
7 0.
0 14
5.9
0.0
27.7
0.
0 11
5.1
0.0
PO 0
111
Poul
try,
Edi
ble
offa
l of
0 0.
4 0.
0 1.
0 0.
0 1.
9 0.
0 0.
0 0.
0 0.
7 0.
0 1.
0 0.
0 0.
3 0.
0
PF 0
111
Poul
try,
fat
s 0
0.1
0.0
8.2
0.0
0.0
0.0
0.1
0.0
0.0
0.0
0.1
0.0
4.2
0.0
MO
082
2 Sh
eep,
edi
ble
offa
l of
0 0.
3 0.
0 0.
3 0.
0 0.
6 0.
0 0.
8 0.
0 0.
2 0.
0 0.
0 0.
0 0.
4 0.
0
VR
059
6 Su
gar
beet
0.
11
0.0
0.0
0.1
0.0
0.0
0.0
0.0
0.0
0.2
0.0
0.0
0.0
14.3
1.
6
VR
050
6 T
urni
p, g
arde
n 1.
1 0.
0 0.
0 0.
0 0.
0 0.
0 0.
0 0.
0 0.
0 1.
0 1.
1 0.
0 0.
0 0.
4 0.
4
GC
065
4 W
heat
(ex
cl b
ulgu
r w
hole
mea
l, ex
cl f
lour
) 0.
021
0.0
0.0
0.9
0.0
0.0
0.0
0.0
0.0
0.1
0.0
0.0
0.0
0.1
0.0
-d
Whe
at b
ulgu
r w
hole
mea
l 0.
027
0.0
0.0
0.0
0.0
0.0
0.0
0.0
0.0
0.0
0.0
0.0
0.0
0.0
0.0
CF
1211
W
heat
flo
ur (
incl
mac
aron
i, br
ead,
pas
try,
sta
rch,
glu
ten)
0.
014
133.
0 1.
9 60
.1
0.8
52.4
0.
7 32
.2
0.5
87.7
1.
2 79
.6
1.1
180.
1 2.
5
To
tal i
ntak
e (µ
g/pe
rson
)=
34.1
73.6
22.5
20.2
84.9
53.2
107.
7
B
ody
wei
ght p
er r
egio
n (k
g bw
) =
55
60
60
60
60
55
60
A
DI (
µg/
pers
on)=
11
0
120
12
0
120
12
0
110
12
0
%
AD
I=
31.0
%
61
.3%
18.7
%
16
.8%
70.7
%
48
.4%
89.7
%
R
ound
ed %
AD
I=
30%
60%
20%
20%
70%
50%
90%
Not
e 1:
B
ecau
se n
o co
nsum
ptio
n da
ta a
re a
vail
able
for
Sav
oy c
abba
ge, t
he S
TM
R o
f S
avoy
cab
bage
was
app
lied
to h
ead
cabb
age
(VB
004
1) c
onsu
mpt
ion.

A
nn
ex 3
418
ET
HO
XY
QU
IN (
03
5)
Inte
rnat
iona
l Est
imat
ed D
aily
Inta
ke (
IED
I)
A
DI =
0 -
0.0
05 m
g/kg
bw
STM
R o
r D
iets
: g/p
erso
n/da
y In
take
= d
aily
inta
ke: µ
g/pe
rson
STM
R-P
A
B
C
D
E
F
Cod
ex
Cod
e C
omm
odit
y m
g/kg
di
et
inta
ke
diet
in
take
di
et
inta
ke
diet
in
take
di
et
inta
ke
diet
in
take
FP 0
230
Pear
5
0.1
0.5
22.3
11
1.5
2.8
14.0
4.
8 24
.0
10.7
53
.5
6.8
34.0
To
tal i
ntak
e (µ
g/pe
rson
)=
0.5
11
1.5
14
.0
24
.0
53
.5
34
.0
B
ody
wei
ght p
er r
egio
n (k
g bw
) =
60
60
60
60
60
60
A
DI (
µg/
pers
on)=
30
0
300
30
0
300
30
0
300
%
AD
I=
0.2%
37.2
%
4.
7%
8.
0%
17
.8%
11.3
%
R
ound
ed %
AD
I=
0%
40
%
5%
8%
20
%
10
%
ET
HO
XY
QU
IN (
03
5)
Inte
rnat
iona
l Est
imat
ed D
aily
Inta
ke (
IED
I)
A
DI =
0 -
0.0
05 m
g/kg
bw
STM
R o
r D
iets
: g/p
erso
n/da
y In
take
= d
aily
inta
ke: µ
g/pe
rson
STM
R-P
G
H
I
J K
L
M
C
odex
C
ode
Com
mod
ity
mg/
kg
diet
in
take
di
et
inta
ke
diet
in
take
di
et
inta
ke
diet
in
take
di
et
inta
ke
diet
in
take
FP 0
230
Pear
5
6.4
32.0
1.
9 9.
5 1.
2 6.
0 0.
0 0.
0 1.
8 9.
0 6.
9 34
.5
7.8
39.0
To
tal i
ntak
e (µ
g/pe
rson
)=
32.0
9.5
6.
0
0.0
9.
0
34.5
39.0
B
ody
wei
ght p
er r
egio
n (k
g bw
) =
55
60
60
60
60
55
60
A
DI (
µg/
pers
on)=
27
5
300
30
0
300
30
0
275
30
0
%
AD
I=
11.6
%
3.
2%
2.
0%
0.
0%
3.
0%
12
.5%
13.0
%
R
ound
ed %
AD
I=
10%
3%
2%
0%
3%
10%
10%

A
nn
ex 3
419
IMID
AC
LO
PR
ID (
20
6)
Inte
rnat
iona
l Est
imat
ed D
aily
Inta
ke (
IED
I)
A
DI =
0 –
0.0
6 m
g/kg
bw
STM
R o
r D
iets
: g/p
erso
n/da
y In
take
= d
aily
inta
ke: µ
g/pe
rson
STM
R-P
A
B
C
D
E
F
Cod
ex
Cod
e C
omm
odit
y m
g/kg
di
et
inta
ke
diet
in
take
di
et
inta
ke
diet
in
take
di
et
inta
ke
diet
in
take
FP 0
226
App
le (
excl
juic
e)
0.07
0.
3 0.
0 56
.3
3.9
18.4
1.
3 38
.3
2.7
40.6
2.
8 28
.3
2.0
JF 0
226
App
le ju
ice
0.04
6 0.
0 0.
0 2.
8 0.
1 0.
1 0.
0 1.
1 0.
1 6.
8 0.
3 7.
4 0.
3
DF
0226
A
pple
, dri
ed
0.06
1 N
D
- N
D
- N
D
- N
D
- N
D
- N
D
-
FS 0
240
Apr
icot
(in
cl d
ried
) 0.
12
0.3
0.0
6.2
0.7
3.9
0.5
3.2
0.4
2.0
0.2
0.8
0.1
FI 0
327
Ban
ana
0.01
38
.8
0.4
17.4
0.
2 16
.0
0.2
6.6
0.1
21.5
0.
2 33
.8
0.3
VP
0061
B
eans
exc
ept b
road
bea
n &
soy
a be
an (
gree
n po
ds &
im
mat
ure
seed
s)
0.4
1.0
0.4
17.4
7.
0 7.
5 3.
0 0.
9 0.
4 16
.4
6.6
0.1
0.0
FB 0
264
Bla
ckbe
rrie
s 0.
89
0.0
0.0
0.1
0.1
0.0
0.0
0.3
0.3
0.1
0.1
0.3
0.3
FB 0
020
Blu
eber
ries
0.
89
0.0
0.0
0.0
0.0
0.0
0.0
0.2
0.2
0.3
0.3
0.8
0.7
FB 4
079
Boy
senb
erry
0.
89
0.0
0.0
0.0
0.0
0.0
0.0
0.3
0.3
0.0
0.0
0.3
0.3
VB
040
0 B
rocc
oli
0.08
0.
0 0.
0 0.
7 0.
1 1.
2 0.
1 0.
1 0.
0 4.
2 0.
3 4.
0 0.
3
VB
040
2 B
russ
els
spro
uts
0.08
0.
0 0.
0 0.
1 0.
0 2.
8 0.
2 5.
5 0.
4 1.
5 0.
1 1.
9 0.
2
VB
004
1 C
abba
ges,
Hea
d 0.
08
1.2
0.1
14.4
1.
2 2.
7 0.
2 16
.4
1.3
15.4
1.
2 18
.5
1.5
VB
040
4 C
aulif
low
er
0.08
0.
1 0.
0 5.
2 0.
4 1.
2 0.
1 0.
1 0.
0 1.
7 0.
1 0.
1 0.
0
GC
008
0 C
erea
l gra
ins
0.05
35
6.9
17.8
71
3.9
35.7
76
3.0
38.2
50
4.5
25.2
36
5.2
18.3
32
8.7
16.4
FS 0
244
Che
rrie
s, s
wee
t 0.
14
0.0
0.0
5.4
0.8
0.9
0.1
3.5
0.5
2.1
0.3
0.4
0.1
FC 0
001
Cit
rus
frui
t (ex
cl le
mon
juic
e, e
xcl m
anda
rin
juic
e, e
xcl
oran
ge ju
ice,
exc
l gra
pefr
uit j
uice
, exc
l NE
S ju
ice)
0.
05
15.7
0.
8 86
.5
4.3
52.6
2.
6 24
.2
1.2
16.2
0.
8 12
.0
0.6
- C
itru
s ju
ice
NE
S 0.
014
0.0
0.0
1.7
0.0
0.1
0.0
0.0
0.0
1.1
0.0
0.3
0.0
SB 0
716
Cof
fee
bean
s (i
ncl g
reen
, inc
l ext
ract
s, in
cl r
oast
ed)
0.35
3.
1 1.
1 12
.6
4.4
2.9
1.0
1.4
0.5
10.1
3.
5 18
.0
6.3
FB 0
265
Cra
nber
ries
0.
05
0.1
0.0
0.0
0.0
0.0
0.0
0.3
0.0
0.0
0.0
0.6
0.0
VC
042
4 C
ucum
ber
0.31
0.
3 0.
1 12
.7
3.9
5.9
1.8
11.5
3.
6 6.
1 1.
9 7.
1 2.
2
FB 0
278
Cur
rant
s, b
lack
0.
89
0.0
0.0
0.0
0.0
0.0
0.0
1.1
1.0
1.6
1.4
1.0
0.9
FB 0
021
Cur
rant
s, r
ed, b
lack
, whi
te
0.89
0.
0 0.
0 0.
0 0.
0 0.
0 0.
0 2.
2 2.
0 3.
1 2.
8 2.
0 1.
8
FB 0
279
Cur
rant
s, r
ed, w
hite
0.
89
0.0
0.0
0.0
0.0
0.0
0.0
1.1
1.0
1.6
1.4
1.0
0.9
FB 0
266
Dew
berr
ies,
incl
boy
sen-
& lo
ganb
erry
0.
89
0.0
0.0
0.0
0.0
0.0
0.0
0.3
0.3
0.0
0.0
0.3
0.3
MO
010
5 E
dibl
e of
fal (
mam
mal
ian)
0.
06
3.9
0.2
14.4
0.
9 5.
2 0.
3 11
.8
0.7
11.7
0.
7 7.
6 0.
5
VO
044
0 E
gg p
lant
(=
aub
ergi
ne)
0.05
1.
7 0.
1 17
.5
0.9
12.3
0.
6 1.
7 0.
1 0.
8 0.
0 0.
4 0.
0
PE 0
112
Egg
s 0.
003
2.5
0.0
29.7
0.
1 25
.1
0.1
24.5
0.
1 37
.8
0.1
27.4
0.
1
FB 0
267
Eld
erbe
rrie
s 0.
89
ND
-
ND
-
ND
-
ND
-
ND
-
ND
-
FB 0
268
Goo
sebe
rrie
s 0.
89
0.0
0.0
12.0
10
.7
0.0
0.0
0.6
0.5
1.1
1.0
0.2
0.2

A
nn
ex 3
420
IMID
AC
LO
PR
ID (
20
6)
Inte
rnat
iona
l Est
imat
ed D
aily
Inta
ke (
IED
I)
A
DI =
0 –
0.0
6 m
g/kg
bw
STM
R o
r D
iets
: g/p
erso
n/da
y In
take
= d
aily
inta
ke: µ
g/pe
rson
STM
R-P
A
B
C
D
E
F
Cod
ex
Cod
e C
omm
odit
y m
g/kg
di
et
inta
ke
diet
in
take
di
et
inta
ke
diet
in
take
di
et
inta
ke
diet
in
take
FB 0
269
Gra
pe (
incl
dri
ed, e
xcl j
uice
, inc
l win
e)
0.11
3.
7 0.
4 12
8.4
14.1
27
.0
3.0
33.0
3.
6 10
5.5
11.6
42
.6
4.7
JF 0
269
Gra
pe ju
ice
0.08
0.
0 0.
0 0.
1 0.
0 0.
1 0.
0 0.
1 0.
0 1.
4 0.
1 1.
0 0.
1
DH
110
0 H
ops,
dry
0.
7 0.
1 0.
1 0.
1 0.
1 0.
1 0.
1 0.
1 0.
1 0.
3 0.
2 0.
1 0.
1
VA
038
4 L
eek
0.05
0.
3 0.
0 5.
3 0.
3 0.
0 0.
0 0.
2 0.
0 4.
6 0.
2 1.
5 0.
1
VL
0482
L
ettu
ce, h
ead
0.9
0.1
0.1
12.3
11
.1
1.3
1.2
0.1
0.1
0.1
0.1
0.0
0.0
FI 0
345
Man
go (
incl
juic
e, in
cl p
ulp)
0.
05
6.3
0.3
1.0
0.1
4.6
0.2
0.2
0.0
0.7
0.0
0.3
0.0
MM
009
5 M
eat f
rom
mam
mal
s ot
her
than
mar
ine
mam
mal
s:
20%
as
fat
0.00
7 5.
5 0.
0 23
.3
0.2
7.7
0.1
11.0
0.
1 18
.0
0.1
26.3
0.
2
MM
009
5 M
eat f
rom
mam
mal
s ot
her
than
mar
ine
mam
mal
s: 8
0%
as m
uscl
e 0.
012
22.2
0.
3 93
.2
1.1
30.8
0.
4 44
.1
0.5
72.2
0.
9 10
5.0
1.3
VC
004
6 M
elon
s, e
xcep
t wat
erm
elon
0.
05
3.6
0.2
26.7
1.
3 22
.6
1.1
11.5
0.
6 5.
6 0.
3 2.
0 0.
1
ML
0106
M
ilks
(exc
l pro
cess
ed p
rodu
cts)
0.
018
68.8
1.
2 19
0.6
3.4
79.4
1.
4 30
2.6
5.4
179.
6 3.
2 23
7.9
4.3
FS 0
245
Nec
tari
ne
0.12
0.
0 0.
0 0.
5 0.
1 3.
3 0.
4 1.
8 0.
2 2.
8 0.
3 1.
6 0.
2
VA
038
5 O
nion
, Bul
b (=
dry
+ g
reen
oni
on)
0.05
5.
5 0.
3 49
.5
2.5
33.0
1.
7 31
.3
1.6
23.2
1.
2 14
.6
0.7
FS 0
247
Peac
h 0.
12
0.2
0.0
24.8
3.
0 3.
3 0.
4 1.
8 0.
2 5.
4 0.
6 1.
6 0.
2
SO 0
697
Pean
ut, s
helle
d (i
ncl o
il)
0.12
5.
4 0.
6 3.
1 0.
4 2.
1 0.
3 0.
7 0.
1 4.
0 0.
5 1.
4 0.
2
FP 0
230
Pear
0.
38
0.1
0.0
22.3
8.
5 2.
8 1.
1 4.
8 1.
8 10
.7
4.1
6.8
2.6
VD
007
2 Pe
as (
dry)
(=
fie
ld p
ea +
cow
pea)
0.
62
6.8
4.2
1.3
0.8
1.0
0.6
2.3
1.4
4.6
2.9
3.4
2.1
VP
0063
Pe
as (
gree
n po
ds a
nd/o
r im
mat
ure
seed
s)
0.6
0.1
0.1
2.9
1.7
6.0
3.6
0.6
0.4
9.7
5.8
5.2
3.1
VP
0064
Pe
as, s
helle
d (i
mm
atur
e se
eds
only
) 0.
58
0.0
0.0
0.9
0.5
6.0
3.5
0.6
0.3
9.7
5.6
3.2
1.9
VO
005
1 Pe
pper
s 0.
15
1.4
0.2
29.9
4.
5 13
.0
2.0
6.3
0.9
6.2
0.9
4.0
0.6
FS 0
014
Plum
(in
cl d
ried
) 0.
05
0.1
0.0
5.9
0.3
2.5
0.1
7.3
0.4
6.9
0.3
2.6
0.1
PM 0
110
Poul
try
mea
t: 10
% a
s fa
t 0.
0004
0.
7 0.
0 5.
9 0.
0 3.
2 0.
0 2.
4 0.
0 6.
1 0.
0 2.
7 0.
0
PM 0
110
Poul
try
mea
t: 90
% a
s m
uscl
e 0.
001
6.4
0.0
52.7
0.
1 28
.7
0.0
21.6
0.
0 54
.9
0.1
24.6
0.
0
PO 0
111
Poul
try,
Edi
ble
offa
l of
0.00
7 0.
4 0.
0 0.
4 0.
0 1.
7 0.
0 0.
1 0.
0 0.
6 0.
0 0.
2 0.
0
SO 0
495
Rap
e se
ed (
incl
oil)
0.
05
0.9
0.0
1.8
0.1
2.5
0.1
1.9
0.1
35.7
1.
8 26
.1
1.3
FB 0
272
Ras
pber
ries
, red
, bla
ck
0.89
0.
0 0.
0 0.
0 0.
0 0.
0 0.
0 1.
8 1.
6 0.
9 0.
8 0.
2 0.
2
VR
0075
R
oot a
nd tu
ber
vege
tabl
es
0.05
52
8.2
26.4
35
2.8
17.6
78
.5
3.9
270.
3 13
.5
324.
1 16
.2
261.
3 13
.1
FB 0
273
R
ose
hips
0.
89
ND
-
ND
-
ND
-
ND
-
ND
-
ND
-
VC
043
1 Sq
uash
, sum
mer
(=
cou
rget
te, z
ucch
ini)
0.
31
0.0
0.0
8.3
2.6
11.4
3.
5 7.
3 2.
3 3.
2 1.
0 0.
3 0.
1
FB 0
275
Stra
wbe
rry
0.17
0.
0 0.
0 5.
0 0.
9 2.
0 0.
3 1.
7 0.
3 5.
2 0.
9 4.
1 0.
7
SO 0
702
Sunf
low
er s
eed
(inc
l oil)
0.
05
0.7
0.0
44.5
2.
2 20
.5
1.0
29.6
1.
5 21
.2
1.1
5.4
0.3

A
nn
ex 3
421
IMID
AC
LO
PR
ID (
20
6)
Inte
rnat
iona
l Est
imat
ed D
aily
Inta
ke (
IED
I)
A
DI =
0 –
0.0
6 m
g/kg
bw
STM
R o
r D
iets
: g/p
erso
n/da
y In
take
= d
aily
inta
ke: µ
g/pe
rson
STM
R-P
A
B
C
D
E
F
Cod
ex
Cod
e C
omm
odit
y m
g/kg
di
et
inta
ke
diet
in
take
di
et
inta
ke
diet
in
take
di
et
inta
ke
diet
in
take
VO
044
7 Sw
eet c
orn
(cor
n-on
-the
-cob
) 0.
01
7.3
0.1
1.0
0.0
0.1
0.0
0.5
0.0
3.3
0.0
3.6
0.0
VO
044
8 To
mat
o (e
xcl j
uice
, exc
l pas
te, i
ncl p
eele
d)
0.08
3.
3 0.
3 17
9.2
14.3
10
3.5
8.3
54.1
4.
3 7.
8 0.
6 3.
9 0.
3
JF 0
448
Tom
ato
juic
e 0.
11
5.2
0.6
0.5
0.1
0.4
0.0
2.1
0.2
6.9
0.8
15.2
1.
7
-d
Tom
ato
past
e 0.
458
0.5
0.2
1.3
0.6
3.5
1.6
1.0
0.5
3.8
1.7
4.5
2.1
TN
008
5 T
ree
nuts
0.
01
4.2
0.0
21.5
0.
2 3.
9 0.
0 3.
0 0.
0 5.
5 0.
1 10
.2
0.1
VC
043
2 W
ater
mel
on
0.05
6.
1 0.
3 43
.1
2.2
47.1
2.
4 25
.8
1.3
4.4
0.2
6.0
0.3
To
tal i
ntak
e (µ
g/pe
rson
)=
57.2
170.
0
92.6
86.0
108.
9
78.7
B
ody
wei
ght p
er r
egio
n (k
g bw
) =
60
60
60
60
60
60
A
DI (
µg/
pers
on)=
36
00
36
00
36
00
36
00
36
00
36
00
%
AD
I=
1.6%
4.7%
2.6%
2.4%
3.0%
2.2%
R
ound
ed %
AD
I=
2%
5%
3%
2%
3%
2%
IMID
AC
LO
PR
ID (
20
6)
Inte
rnat
iona
l Est
imat
ed D
aily
Inta
ke (
IED
I)
A
DI =
0 –
0.0
6 m
g/kg
bw
STM
R o
r D
iets
: g/p
erso
n/da
y In
take
= d
aily
inta
ke: µ
g/pe
rson
STM
R-P
G
H
I
J K
L
M
C
odex
C
ode
Com
mod
ity
mg/
kg
diet
in
take
di
et
inta
ke
diet
in
take
di
et
inta
ke
diet
in
take
di
et
inta
ke
diet
in
take
FP 0
226
App
le (
excl
juic
e)
0.07
14
.3
1.0
9.4
0.7
2.1
0.1
0.0
0.0
8.8
0.6
16.6
1.
2 27
.8
1.9
JF 0
226
App
le ju
ice
0.04
6 0.
1 0.
0 0.
5 0.
0 0.
1 0.
0 0.
0 0.
0 0.
7 0.
0 0.
9 0.
0 5.
7 0.
3
DF
0226
A
pple
, dri
ed
0.06
1 N
D
- N
D
- N
D
- N
D
- N
D
- N
D
- N
D
-
FS 0
240
Apr
icot
(in
cl d
ried
) 0.
12
0.2
0.0
0.1
0.0
0.2
0.0
0.0
0.0
0.0
0.0
0.1
0.0
1.1
0.1
FI 0
327
Ban
ana
0.01
21
.4
0.2
36.6
0.
4 11
.4
0.1
9.2
0.1
70.2
0.
7 40
.5
0.4
32.6
0.
3
VP
0061
B
eans
exc
ept b
road
bea
n &
soy
a be
an (
gree
n po
ds &
imm
atur
e se
eds)
0.
4 2.
6 1.
0 2.
6 1.
0 1.
0 0.
4 0.
5 0.
2 0.
6 0.
2 2.
8 1.
1 9.
8 3.
9
FB 0
264
Bla
ckbe
rrie
s 0.
89
0.0
0.0
0.0
0.0
0.0
0.0
0.0
0.0
0.1
0.1
0.0
0.0
0.3
0.3
FB 0
020
Blu
eber
ries
0.
89
0.0
0.0
0.0
0.0
0.0
0.0
0.0
0.0
0.0
0.0
0.0
0.0
1.3
1.2
FB 4
079
Boy
senb
erry
0.
89
0.0
0.0
0.0
0.0
0.0
0.0
0.0
0.0
0.1
0.1
0.0
0.0
0.0
0.0
VB
040
0 B
rocc
oli
0.08
3.
2 0.
3 7.
8 0.
6 0.
0 0.
0 0.
0 0.
0 0.
3 0.
0 0.
4 0.
0 6.
6 0.
5
VB
040
2 B
russ
els
spro
uts
0.08
3.
4 0.
3 0.
4 0.
0 0.
0 0.
0 0.
0 0.
0 0.
5 0.
0 7.
9 0.
6 0.
3 0.
0
VB
004
1 C
abba
ges,
Hea
d 0.
08
10.0
0.
8 1.
0 0.
1 7.
2 0.
6 1.
0 0.
1 1.
4 0.
1 23
.9
1.9
17.0
1.
4
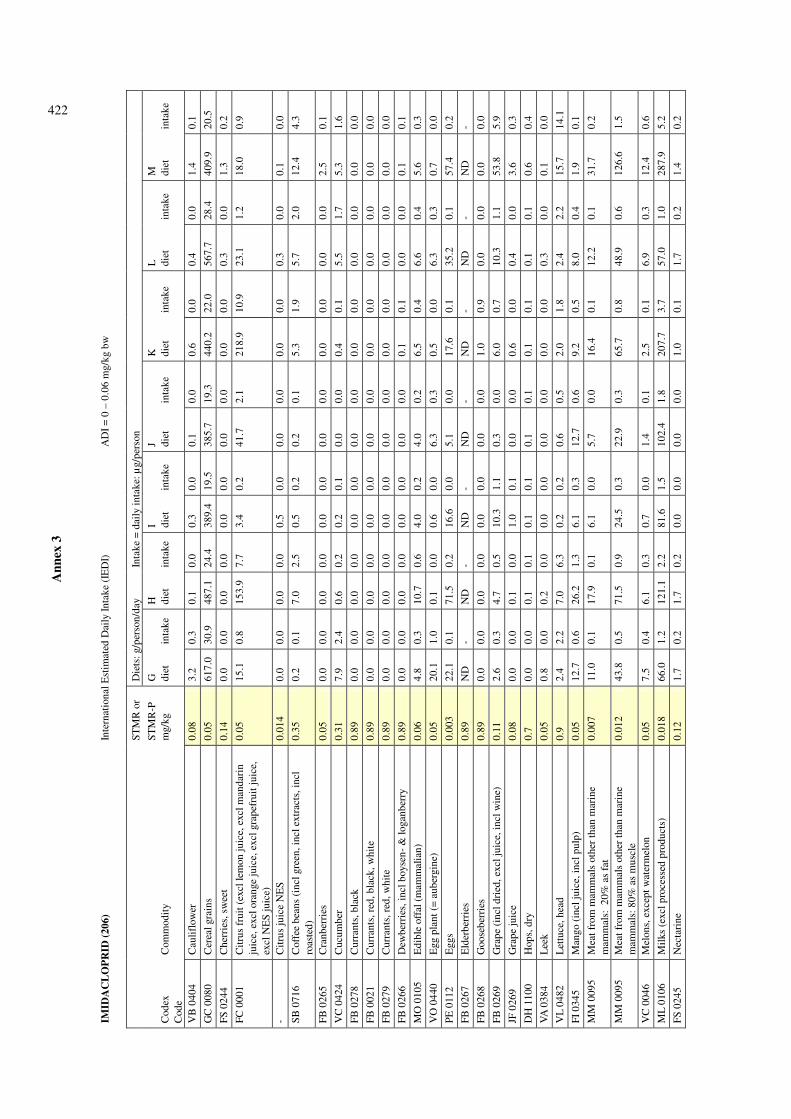
A
nn
ex 3
422IM
IDA
CL
OP
RID
(2
06
) In
tern
atio
nal E
stim
ated
Dai
ly In
take
(IE
DI)
AD
I = 0
– 0
.06
mg/
kg b
w
STM
R o
r D
iets
: g/p
erso
n/da
y In
take
= d
aily
inta
ke: µ
g/pe
rson
STM
R-P
G
H
I
J K
L
M
C
odex
C
ode
Com
mod
ity
mg/
kg
diet
in
take
di
et
inta
ke
diet
in
take
di
et
inta
ke
diet
in
take
di
et
inta
ke
diet
in
take
VB
040
4 C
aulif
low
er
0.08
3.
2 0.
3 0.
1 0.
0 0.
3 0.
0 0.
1 0.
0 0.
6 0.
0 0.
4 0.
0 1.
4 0.
1
GC
008
0 C
erea
l gra
ins
0.05
61
7.0
30.9
48
7.1
24.4
38
9.4
19.5
38
5.7
19.3
44
0.2
22.0
56
7.7
28.4
40
9.9
20.5
FS 0
244
Che
rrie
s, s
wee
t 0.
14
0.0
0.0
0.0
0.0
0.0
0.0
0.0
0.0
0.0
0.0
0.3
0.0
1.3
0.2
FC 0
001
Cit
rus
frui
t (ex
cl le
mon
juic
e, e
xcl m
anda
rin
juic
e, e
xcl o
rang
e ju
ice,
exc
l gra
pefr
uit j
uice
, ex
cl N
ES
juic
e)
0.05
15
.1
0.8
153.
9 7.
7 3.
4 0.
2 41
.7
2.1
218.
9 10
.9
23.1
1.
2 18
.0
0.9
- C
itru
s ju
ice
NE
S 0.
014
0.0
0.0
0.0
0.0
0.5
0.0
0.0
0.0
0.0
0.0
0.3
0.0
0.1
0.0
SB 0
716
Cof
fee
bean
s (i
ncl g
reen
, inc
l ext
ract
s, in
cl
roas
ted)
0.
35
0.2
0.1
7.0
2.5
0.5
0.2
0.2
0.1
5.3
1.9
5.7
2.0
12.4
4.
3
FB 0
265
Cra
nber
ries
0.
05
0.0
0.0
0.0
0.0
0.0
0.0
0.0
0.0
0.0
0.0
0.0
0.0
2.5
0.1
VC
042
4 C
ucum
ber
0.31
7.
9 2.
4 0.
6 0.
2 0.
2 0.
1 0.
0 0.
0 0.
4 0.
1 5.
5 1.
7 5.
3 1.
6
FB 0
278
Cur
rant
s, b
lack
0.
89
0.0
0.0
0.0
0.0
0.0
0.0
0.0
0.0
0.0
0.0
0.0
0.0
0.0
0.0
FB 0
021
Cur
rant
s, r
ed, b
lack
, whi
te
0.89
0.
0 0.
0 0.
0 0.
0 0.
0 0.
0 0.
0 0.
0 0.
0 0.
0 0.
0 0.
0 0.
0 0.
0
FB 0
279
Cur
rant
s, r
ed, w
hite
0.
89
0.0
0.0
0.0
0.0
0.0
0.0
0.0
0.0
0.0
0.0
0.0
0.0
0.0
0.0
FB 0
266
Dew
berr
ies,
incl
boy
sen-
& lo
ganb
erry
0.
89
0.0
0.0
0.0
0.0
0.0
0.0
0.0
0.0
0.1
0.1
0.0
0.0
0.1
0.1
MO
010
5 E
dibl
e of
fal (
mam
mal
ian)
0.
06
4.8
0.3
10.7
0.
6 4.
0 0.
2 4.
0 0.
2 6.
5 0.
4 6.
6 0.
4 5.
6 0.
3
VO
044
0 E
gg p
lant
(=
aub
ergi
ne)
0.05
20
.1
1.0
0.1
0.0
0.6
0.0
6.3
0.3
0.5
0.0
6.3
0.3
0.7
0.0
PE 0
112
Egg
s 0.
003
22.1
0.
1 71
.5
0.2
16.6
0.
0 5.
1 0.
0 17
.6
0.1
35.2
0.
1 57
.4
0.2
FB 0
267
Eld
erbe
rrie
s 0.
89
ND
-
ND
-
ND
-
ND
-
ND
-
ND
-
ND
-
FB 0
268
Goo
sebe
rrie
s 0.
89
0.0
0.0
0.0
0.0
0.0
0.0
0.0
0.0
1.0
0.9
0.0
0.0
0.0
0.0
FB 0
269
Gra
pe (
incl
dri
ed, e
xcl j
uice
, inc
l win
e)
0.11
2.
6 0.
3 4.
7 0.
5 10
.3
1.1
0.3
0.0
6.0
0.7
10.3
1.
1 53
.8
5.9
JF 0
269
Gra
pe ju
ice
0.08
0.
0 0.
0 0.
1 0.
0 1.
0 0.
1 0.
0 0.
0 0.
6 0.
0 0.
4 0.
0 3.
6 0.
3
DH
110
0 H
ops,
dry
0.
7 0.
0 0.
0 0.
1 0.
1 0.
1 0.
1 0.
1 0.
1 0.
1 0.
1 0.
1 0.
1 0.
6 0.
4
VA
038
4 L
eek
0.05
0.
8 0.
0 0.
2 0.
0 0.
0 0.
0 0.
0 0.
0 0.
0 0.
0 0.
3 0.
0 0.
1 0.
0
VL
0482
L
ettu
ce, h
ead
0.9
2.4
2.2
7.0
6.3
0.2
0.2
0.6
0.5
2.0
1.8
2.4
2.2
15.7
14
.1
FI 0
345
Man
go (
incl
juic
e, in
cl p
ulp)
0.
05
12.7
0.
6 26
.2
1.3
6.1
0.3
12.7
0.
6 9.
2 0.
5 8.
0 0.
4 1.
9 0.
1
MM
009
5 M
eat f
rom
mam
mal
s ot
her
than
mar
ine
mam
mal
s: 2
0% a
s fa
t 0.
007
11.0
0.
1 17
.9
0.1
6.1
0.0
5.7
0.0
16.4
0.
1 12
.2
0.1
31.7
0.
2
MM
009
5 M
eat f
rom
mam
mal
s ot
her
than
mar
ine
mam
mal
s: 8
0% a
s m
uscl
e 0.
012
43.8
0.
5 71
.5
0.9
24.5
0.
3 22
.9
0.3
65.7
0.
8 48
.9
0.6
126.
6 1.
5
VC
004
6 M
elon
s, e
xcep
t wat
erm
elon
0.
05
7.5
0.4
6.1
0.3
0.7
0.0
1.4
0.1
2.5
0.1
6.9
0.3
12.4
0.
6
ML
0106
M
ilks
(exc
l pro
cess
ed p
rodu
cts)
0.
018
66.0
1.
2 12
1.1
2.2
81.6
1.
5 10
2.4
1.8
207.
7 3.
7 57
.0
1.0
287.
9 5.
2
FS 0
245
Nec
tari
ne
0.12
1.
7 0.
2 1.
7 0.
2 0.
0 0.
0 0.
0 0.
0 1.
0 0.
1 1.
7 0.
2 1.
4 0.
2

A
nn
ex 3
423IM
IDA
CL
OP
RID
(2
06
) In
tern
atio
nal E
stim
ated
Dai
ly In
take
(IE
DI)
AD
I = 0
– 0
.06
mg/
kg b
w
STM
R o
r D
iets
: g/p
erso
n/da
y In
take
= d
aily
inta
ke: µ
g/pe
rson
STM
R-P
G
H
I
J K
L
M
C
odex
C
ode
Com
mod
ity
mg/
kg
diet
in
take
di
et
inta
ke
diet
in
take
di
et
inta
ke
diet
in
take
di
et
inta
ke
diet
in
take
VA
038
5 O
nion
, Bul
b (=
dry
+ g
reen
oni
on)
0.05
17
.4
0.9
27.9
1.
4 7.
3 0.
4 16
.0
0.8
22.8
1.
1 34
.5
1.7
30.1
1.
5
FS 0
247
Peac
h 0.
12
1.7
0.2
1.7
0.2
1.1
0.1
0.1
0.0
1.0
0.1
1.7
0.2
10.2
1.
2
SO 0
697
Pean
ut, s
helle
d (i
ncl o
il)
0.12
7.
6 0.
9 2.
1 0.
3 4.
7 0.
6 21
.8
2.6
0.9
0.1
0.7
0.1
6.9
0.8
FP 0
230
Pear
0.
38
6.4
2.4
1.9
0.7
1.2
0.5
0.0
0.0
1.8
0.7
6.9
2.6
7.8
3.0
VD
007
2 Pe
as (
dry)
(=
fie
ld p
ea +
cow
pea)
0.
62
1.8
1.1
2.2
1.4
3.2
2.0
26.7
16
.6
1.5
0.9
1.8
1.1
1.8
1.1
VP
0063
Pe
as (
gree
n po
ds a
nd/o
r im
mat
ure
seed
s)
0.6
3.9
2.3
1.6
1.0
0.4
0.2
0.0
0.0
0.9
0.5
1.0
0.6
8.6
5.2
VP
0064
Pe
as, s
helle
d (i
mm
atur
e se
eds
only
) 0.
58
3.9
2.3
1.6
0.9
0.0
0.0
0.0
0.0
0.4
0.2
1.0
0.6
0.8
0.5
VO
005
1 Pe
pper
s 0.
15
8.7
1.3
22.4
3.
4 8.
4 1.
3 9.
4 1.
4 3.
3 0.
5 5.
3 0.
8 8.
9 1.
3
FS 0
014
Plum
(in
cl d
ried
) 0.
05
3.3
0.2
1.4
0.1
0.1
0.0
0.0
0.0
0.6
0.0
1.5
0.1
2.2
0.1
PM 0
110
Poul
try
mea
t: 10
% a
s fa
t 0.
0004
1.
8 0.
0 13
.1
0.0
2.5
0.0
0.5
0.0
14.6
0.
0 2.
8 0.
0 11
.5
0.0
PM 0
110
Poul
try
mea
t: 90
% a
s m
uscl
e 0.
001
15.8
0.
0 11
8.2
0.1
22.6
0.
0 4.
2 0.
0 13
1.3
0.1
24.9
0.
0 10
3.6
0.1
PO 0
111
Poul
try,
Edi
ble
offa
l of
0.00
7 0.
4 0.
0 1.
0 0.
0 1.
9 0.
0 0.
0 0.
0 0.
7 0.
0 1.
0 0.
0 0.
3 0.
0
SO 0
495
Rap
e se
ed (
incl
oil)
0.
05
9.9
0.5
5.9
0.3
0.3
0.0
1.0
0.1
0.0
0.0
15.5
0.
8 9.
9 0.
5
FB 0
272
Ras
pber
ries
, red
, bla
ck
0.89
0.
0 0.
0 0.
0 0.
0 0.
0 0.
0 0.
0 0.
0 0.
2 0.
2 0.
0 0.
0 0.
5 0.
4
VR
0075
R
oot a
nd tu
ber
vege
tabl
es
0.05
13
9.1
7.0
109.
8 5.
5 40
9.6
20.5
44
4.6
22.2
14
5.3
7.3
127.
0 6.
4 22
5.6
11.3
FB 0
273
R
ose
hips
0.
89
ND
-
ND
-
ND
-
ND
-
ND
-
ND
-
ND
-
VC
043
1 Sq
uash
, sum
mer
(=
cou
rget
te, z
ucch
ini)
0.
31
2.4
0.7
1.5
0.5
0.0
0.0
0.0
0.0
3.8
1.2
2.2
0.7
2.5
0.8
FB 0
275
Stra
wbe
rry
0.17
0.
0 0.
0 1.
8 0.
3 0.
1 0.
0 0.
0 0.
0 0.
3 0.
1 6.
2 1.
1 5.
9 1.
0
SO 0
702
Sunf
low
er s
eed
(inc
l oil)
0.
05
2.7
0.1
8.8
0.4
13.5
0.
7 0.
2 0.
0 3.
6 0.
2 0.
6 0.
0 10
.4
0.5
VO
044
7 Sw
eet c
orn
(cor
n-on
-the
-cob
) 0.
01
0.2
0.0
2.4
0.0
2.2
0.0
3.3
0.0
1.7
0.0
2.8
0.0
11.2
0.
1
VO
044
8 To
mat
o (e
xcl j
uice
, exc
l pas
te, i
ncl p
eele
d)
0.08
23
.1
1.8
22.3
1.
8 12
.5
1.0
5.6
0.4
33.2
2.
7 1.
3 0.
1 41
.7
3.3
JF 0
448
Tom
ato
juic
e 0.
11
0.0
0.0
0.8
0.1
0.1
0.0
7.2
0.8
0.0
0.0
2.4
0.3
45.2
5.
0
-d
Tom
ato
past
e 0.
458
0.1
0.0
2.1
1.0
0.6
0.3
0.4
0.2
0.6
0.3
1.4
0.6
1.2
0.5
TN
008
5 T
ree
nuts
0.
01
16.3
0.
2 15
.7
0.2
9.7
0.1
1.9
0.0
19.1
0.
2 29
.0
0.3
5.6
0.1
VC
043
2 W
ater
mel
on
0.05
39
.3
2.0
14.0
0.
7 2.
5 0.
1 13
.6
0.7
8.4
0.4
14.5
0.
7 13
.6
0.7
To
tal i
ntak
e (µ
g/pe
rson
)=
68.8
70.4
52.9
71.7
63.1
64.3
106.
0
B
ody
wei
ght p
er r
egio
n (k
g bw
) =
55
60
60
60
60
55
60
A
DI (
µg/
pers
on)=
33
00
36
00
36
00
36
00
36
00
33
00
36
00
%
AD
I=
2.1%
2.0%
1.5%
2.0%
1.8%
1.9%
2.9%
R
ound
ed %
AD
I=
2%
2%
1%
2%
2%
2%
3%

A
nn
ex 3
424
MA
LA
TH
ION
(0
49
) In
tern
atio
nal E
stim
ated
Dai
ly In
take
(IE
DI)
AD
I = 0
- 0
.3 m
g/kg
bw
STM
R o
r D
iets
: g/p
erso
n/da
y In
take
= d
aily
inta
ke: µ
g/pe
rson
STM
R-P
A
B
C
D
E
F
Cod
ex
Cod
e C
omm
odit
y m
g/kg
di
et
inta
ke
diet
in
take
di
et
inta
ke
diet
in
take
di
et
inta
ke
diet
in
take
FP 0
226
App
le (
incl
juic
e)
0.11
0.
3 0.
0 60
.5
6.7
18.5
2.
0 39
.9
4.4
50.8
5.
6 39
.4
4.3
VS
0621
A
spar
agus
0.
305
0.0
0.0
1.1
0.3
0.6
0.2
0.2
0.1
1.2
0.4
0.1
0.0
VD
007
1
Bea
ns (
dry)
0.
36
15.8
5.
7 6.
1 2.
2 1.
7 0.
6 6.
3 2.
3 1.
8 0.
6 5.
0 1.
8
VP
0061
B
eans
exc
ept b
road
bea
n &
soy
a be
an (
gree
n po
ds &
im
mat
ure
seed
s)
0.31
1.
0 0.
3 17
.4
5.4
7.5
2.3
0.9
0.3
16.4
5.
1 0.
1 0.
0
FB 0
020
Blu
eber
ries
2.
27
0.0
0.0
0.0
0.0
0.0
0.0
0.2
0.5
0.3
0.7
0.8
1.8
FC 0
001
Cit
rus
frui
t (in
cl le
mon
juic
e, in
cl m
anda
rin
juic
e,
incl
ora
nge
juic
e, in
cl g
rape
frui
t jui
ce, i
ncl N
ES
juic
e)
0.02
15
.7
0.3
100.
5 2.
0 63
.2
1.3
27.8
0.
6 52
.6
1.1
56.9
1.
1
OR
069
1 C
otto
n se
ed o
il, e
dibl
e 3.
06
0.9
2.8
4.9
15.0
1.
7 5.
2 6.
6 20
.2
0.0
0.0
0.3
0.9
VC
042
4 C
ucum
ber
0.02
0.
3 0.
0 12
.7
0.3
5.9
0.1
11.5
0.
2 6.
1 0.
1 7.
1 0.
1
FB 0
269
Gra
pe (
incl
dri
ed, i
ncl j
uice
, inc
l win
e)
0.16
3.
7 0.
6 12
8.5
20.6
27
.1
4.3
33.1
5.
3 10
7.5
17.2
44
.0
7.0
GC
064
5 M
aize
(in
cl f
lour
, inc
l oil,
incl
bee
r)
0.01
82
.7
0.8
148.
4 1.
5 13
5.9
1.4
31.8
0.
3 33
.3
0.3
7.5
0.1
VL
0485
M
usta
rd g
reen
s 0.
07
0.3
0.0
0.3
0.0
0.0
0.0
5.5
0.4
0.0
0.0
1.9
0.1
- O
nion
, dry
0.
23
4.3
1.0
45.6
10
.5
27.4
6.
3 30
.2
6.9
22.1
5.
1 12
.2
2.8
VO
005
1 Pe
pper
s 0.
01
1.4
0.0
29.9
0.
3 13
.0
0.1
6.3
0.1
6.2
0.1
4.0
0.0
VL
0502
Sp
inac
h 0.
35
0.0
0.0
5.0
1.8
1.1
0.4
0.1
0.0
2.6
0.9
0.1
0.0
VA
038
9 Sp
ring
oni
on
0.52
0.
3 0.
2 1.
0 0.
5 1.
4 0.
7 0.
3 0.
2 0.
3 0.
2 0.
6 0.
3
FB 0
275
Stra
wbe
rry
0.25
0.
0 0.
0 5.
0 1.
3 2.
0 0.
5 1.
7 0.
4 5.
2 1.
3 4.
1 1.
0
VO
044
7 Sw
eet c
orn
(cor
n-on
-the
-cob
) 0.
01
7.3
0.1
1.0
0.0
0.1
0.0
0.5
0.0
3.3
0.0
3.6
0.0
VO
044
8 To
mat
o (e
xcl j
uice
, inc
l pas
te, i
ncl p
eele
d)
0.25
5.
3 1.
3 18
4.4
46.1
11
7.5
29.4
58
.1
14.5
23
.0
5.7
21.9
5.
5
JF 0
448
Tom
ato
juic
e 0
5.2
0.0
0.5
0.0
0.4
0.0
2.1
0.0
6.9
0.0
15.2
0.
0
VR
050
6 T
urni
p, g
arde
n 0.
05
0.0
0.0
0.1
0.0
0.8
0.0
2.0
0.1
0.6
0.0
14.0
0.
7
GC
065
4 W
heat
(in
cl b
ulgu
r w
hole
mea
l, ex
cl f
lour
) 10
6.
0 59
.8
11.1
11
1.1
0.8
7.5
0.2
2.0
0.2
2.2
0.0
0.0
CM
065
4 W
heat
bra
n, u
npro
cess
ed
25
ND
-
ND
-
ND
-
ND
-
ND
-
ND
-
CF
1211
W
heat
flo
ur (
incl
mac
aron
i, br
ead,
pas
try,
sta
rch,
gl
uten
) 0.
87
63.4
54
.5
296.
3 25
4.8
327.
5 28
1.7
300.
0 25
8.0
181.
6 15
6.2
166.
2 14
2.9
CP
1211
W
hite
bre
ad
0.2
0.0
0.0
0.1
0.0
0.0
0.0
0.1
0.0
0.1
0.0
1.0
0.2
CP
1212
W
hole
mea
l bre
ad
1.2
0.0
0.0
0.1
0.1
0.0
0.0
0.1
0.1
0.1
0.1
1.0
1.2
To
tal i
ntak
e (µ
g/pe
rson
)=
127.
4
480.
4
344.
0
316.
8
202.
9
172.
2
B
ody
wei
ght p
er r
egio
n (k
g bw
) =
60
60
60
60
60
60
A
DI (
µg/
pers
on)=
18
000
18
000
18
000
18
000
18
000
18
000
%
AD
I=
0.7%
2.7%
1.9%
1.8%
1.1%
1.0%
R
ound
ed %
AD
I=
1%
3%
2%
2%
1%
1%

A
nn
ex 3
425M
AL
AT
HIO
N (
04
9)
Inte
rnat
iona
l Est
imat
ed D
aily
Inta
ke (
IED
I)
A
DI =
0 -
0.3
mg/
kg b
w
STM
R o
r D
iets
: g/p
erso
n/da
y In
take
= d
aily
inta
ke: µ
g/pe
rson
STM
R-P
G
H
I
J K
L
M
C
odex
C
ode
Com
mod
ity
mg/
kg
diet
in
take
di
et
inta
ke
diet
in
take
di
et
inta
ke
diet
in
take
di
et
inta
ke
diet
in
take
FP 0
226
App
le (
incl
juic
e)
0.11
14
.4
1.6
10.1
1.
1 2.
2 0.
2 0.
0 0.
0 9.
8 1.
1 17
.9
2.0
36.3
4.
0
VS
0621
A
spar
agus
0.
305
3.7
1.1
0.3
0.1
0.2
0.1
0.0
0.0
0.0
0.0
0.5
0.2
1.1
0.3
VD
007
1
Bea
ns (
dry)
0.
36
3.4
1.2
25.5
9.
2 7.
8 2.
8 2.
1 0.
8 44
.7
16.1
5.
5 2.
0 7.
3 2.
6
VP
0061
B
eans
exc
ept b
road
bea
n &
soy
a be
an (
gree
n po
ds &
imm
atur
e se
eds)
0.
31
2.6
0.8
2.6
0.8
1.0
0.3
0.5
0.2
0.6
0.2
2.8
0.9
9.8
3.0
FB 0
020
Blu
eber
ries
2.
27
0.0
0.0
0.0
0.0
0.0
0.0
0.0
0.0
0.0
0.0
0.0
0.0
1.3
3.0
FC 0
001
Cit
rus
frui
t (in
cl le
mon
juic
e, in
cl m
anda
rin
juic
e, in
cl o
rang
e ju
ice,
incl
gra
pefr
uit j
uice
, in
cl N
ES
juic
e)
0.02
17
.3
0.3
156.
8 3.
1 14
.9
0.3
42.5
0.
9 22
2.8
4.5
40.4
0.
8 13
2.3
2.6
OR
069
1 C
otto
n se
ed o
il, e
dibl
e 3.
06
1.0
3.1
0.7
2.1
1.0
3.1
1.4
4.3
1.5
4.6
5.5
16.8
1.
2 3.
7
VC
042
4 C
ucum
ber
0.02
7.
9 0.
2 0.
6 0.
0 0.
2 0.
0 0.
0 0.
0 0.
4 0.
0 5.
5 0.
1 5.
3 0.
1
FB 0
269
Gra
pe (
incl
dri
ed, i
ncl j
uice
, inc
l win
e)
0.16
2.
6 0.
4 4.
8 0.
8 11
.7
1.9
0.3
0.0
6.8
1.1
10.9
1.
7 58
.8
9.4
GC
064
5 M
aize
(in
cl f
lour
, inc
l oil,
incl
bee
r)
0.01
35
.2
0.4
298.
6 3.
0 24
8.1
2.5
57.4
0.
6 63
.1
0.6
58.6
0.
6 85
.5
0.9
VL
0485
M
usta
rd g
reen
s 0.
07
3.4
0.2
0.4
0.0
2.4
0.2
0.3
0.0
0.5
0.0
7.9
0.6
0.3
0.0
- O
nion
, dry
0.
23
16.8
3.
9 8.
6 2.
0 6.
9 1.
6 12
.1
2.8
18.6
4.
3 23
.8
5.5
28.4
6.
5
VO
005
1 Pe
pper
s 0.
01
8.7
0.1
22.4
0.
2 8.
4 0.
1 9.
4 0.
1 3.
3 0.
0 5.
3 0.
1 8.
9 0.
1
VL
0502
Sp
inac
h 0.
35
9.4
3.3
0.4
0.1
0.0
0.0
0.0
0.0
0.2
0.1
4.3
1.5
2.0
0.7
VA
038
9 Sp
ring
oni
on
0.52
0.
1 0.
1 4.
8 2.
5 0.
1 0.
1 1.
0 0.
5 1.
0 0.
5 2.
7 1.
4 0.
6 0.
3
FB 0
275
Stra
wbe
rry
0.25
0.
0 0.
0 1.
8 0.
5 0.
1 0.
0 0.
0 0.
0 0.
3 0.
1 6.
2 1.
6 5.
9 1.
5
VO
044
7 Sw
eet c
orn
(cor
n-on
-the
-cob
) 0.
01
0.2
0.0
2.4
0.0
2.2
0.0
3.3
0.0
1.7
0.0
2.8
0.0
11.2
0.
1
VO
044
8 To
mat
o (e
xcl j
uice
, inc
l pas
te, i
ncl p
eele
d)
0.25
23
.5
5.9
30.7
7.
7 14
.9
3.7
7.2
1.8
35.6
8.
9 6.
9 1.
7 46
.5
11.6
JF 0
448
Tom
ato
juic
e 0
0.0
0.0
0.8
0.0
0.1
0.0
7.2
0.0
0.0
0.0
2.4
0.0
45.2
0.
0
VR
050
6 T
urni
p, g
arde
n 0.
05
0.0
0.0
0.0
0.0
0.0
0.0
0.0
0.0
1.0
0.1
0.0
0.0
0.4
0.0
GC
065
4 W
heat
(in
cl b
ulgu
r w
hole
mea
l, ex
cl f
lour
) 10
0.
0 0.
0 0.
9 8.
7 0.
0 0.
0 0.
0 0.
4 0.
1 0.
9 0.
0 0.
0 0.
1 0.
7
CM
065
4 W
heat
bra
n, u
npro
cess
ed
25
ND
-
ND
-
ND
-
ND
-
ND
-
ND
-
ND
-
CF
1211
W
heat
flo
ur (
incl
mac
aron
i, br
ead,
pas
try,
st
arch
, glu
ten)
0.
87
133.
0 11
4.4
60.1
51
.7
52.4
45
.1
32.2
27
.7
87.7
75
.4
79.6
68
.5
180.
1 15
4.9
CP
1211
W
hite
bre
ad
0.2
0.0
0.0
2.2
0.4
0.1
0.0
0.0
0.0
0.0
0.0
0.0
0.0
0.0
0.0
CP
1212
W
hole
mea
l bre
ad
1.2
0.0
0.0
2.2
2.6
0.1
0.1
0.0
0.0
0.0
0.0
0.0
0.0
0.0
0.0
To
tal i
ntak
e (µ
g/pe
rson
)=
136.
9
96.7
62.0
40.0
118.
4
105.
8
206.
1
B
ody
wei
ght p
er r
egio
n (k
g bw
) =
55
60
60
60
60
55
60
A
DI (
µg/
pers
on)=
16
500
18
000
18
000
18
000
18
000
16
500
18
000
%
AD
I=
0.8%
0.5%
0.3%
0.2%
0.7%
0.6%
1.1%
R
ound
ed %
AD
I=
1%
1%
0%
0%
1%
1%
1%

A
nn
ex 3
426
MA
ND
IPR
OP
AM
ID (
23
1)
Inte
rnat
iona
l Est
imat
ed D
aily
Inta
ke (
IED
I)
A
DI =
0 -
0.2
000
mg/
kg b
w
STM
R o
r D
iets
: g/p
erso
n/da
y In
take
= d
aily
inta
ke: µ
g/pe
rson
STM
R-P
A
B
C
D
E
F
Cod
ex
Cod
e C
omm
odit
y m
g/kg
di
et
inta
ke
diet
in
take
di
et
inta
ke
diet
in
take
di
et
inta
ke
diet
in
take
VB
040
0 B
rocc
oli
0.43
5 0.
0 0.
0 0.
7 0.
3 1.
2 0.
5 0.
1 0.
0 4.
2 1.
8 4.
0 1.
7
VB
004
1 C
abba
ges,
Hea
d 0.
01
1.2
0.0
14.4
0.
1 2.
7 0.
0 16
.4
0.2
15.4
0.
2 18
.5
0.2
VS
0624
C
eler
y 2.
7 0.
0 0.
0 0.
9 2.
4 0.
0 0.
0 2.
0 5.
4 1.
5 4.
1 0.
0 0.
0
VC
042
4 C
ucum
ber
0.02
0.
3 0.
0 12
.7
0.3
5.9
0.1
11.5
0.
2 6.
1 0.
1 7.
1 0.
1
FB 0
269
Gra
pe (
excl
dri
ed, e
xcl j
uice
, exc
l win
e)
0.51
1.
9 1.
0 9.
2 4.
7 23
.8
12.1
9.
8 5.
0 0.
0 0.
0 0.
0 0.
0
JF 0
269
Gra
pe ju
ice
0.14
0.
0 0.
0 0.
1 0.
0 0.
1 0.
0 0.
1 0.
0 1.
4 0.
2 1.
0 0.
1
DF
0269
G
rape
, dri
ed (
= c
urra
nts,
rai
sins
and
sul
tana
s)
1.68
0.
0 0.
0 2.
9 4.
9 0.
4 0.
7 0.
4 0.
7 2.
3 3.
9 1.
7 2.
9
VL
0053
L
eafy
veg
etab
les
5.65
5.
8 32
.8
45.6
25
7.6
10.9
61
.6
26.8
15
1.4
18.7
10
5.7
38.9
21
9.8
VC
004
6 M
elon
s, e
xcep
t wat
erm
elon
0.
115
3.6
0.4
26.7
3.
1 22
.6
2.6
11.5
1.
3 5.
6 0.
6 2.
0 0.
2
- O
nion
, dry
0.
01
4.3
0.0
45.6
0.
5 27
.4
0.3
30.2
0.
3 22
.1
0.2
12.2
0.
1
- O
nion
, gre
en (
= s
hallo
t, W
elsh
, spr
ing
onio
n, o
ther
s)
0.48
1.
2 0.
6 3.
9 1.
9 5.
6 2.
7 1.
1 0.
5 1.
1 0.
5 2.
4 1.
2
VO
005
1 Pe
pper
s 0.
12
1.4
0.2
29.9
3.
6 13
.0
1.6
6.3
0.8
6.2
0.7
4.0
0.5
VR
058
9 Po
tato
(in
cl f
lour
, fro
zen,
sta
rch,
tapi
oca)
0.
01
19.1
0.
2 16
0.8
1.6
61.2
0.
6 24
3.6
2.4
230.
1 2.
3 20
4.7
2.0
VC
043
1 Sq
uash
, sum
mer
(=
cou
rget
te, z
ucch
ini)
0.
04
0.0
0.0
8.3
0.3
11.4
0.
5 7.
3 0.
3 3.
2 0.
1 0.
3 0.
0
VO
044
8 To
mat
o (e
xcl j
uice
, exc
l pas
te, e
xcl p
eele
d)
0.06
1.
3 0.
1 17
8.4
10.7
10
2.8
6.2
53.4
3.
2 1.
6 0.
1 0.
0 0.
0
JF 0
448
Tom
ato
juic
e 0.
059
5.2
0.3
0.5
0.0
0.4
0.0
2.1
0.1
6.9
0.4
15.2
0.
9
- W
ine
0.36
6 1.
3 0.
5 76
.8
28.1
1.
1 0.
4 15
.4
5.6
68.8
25
.2
25.6
9.
4
To
tal i
ntak
e (µ
g/pe
rson
)=
36.0
320.
1
89.9
177.
5
146.
1
239.
1
B
ody
wei
ght p
er r
egio
n (k
g bw
) =
60
60
60
60
60
60
A
DI (
µg/
pers
on)=
12
000
12
000
12
000
12
000
12
000
12
000
%
AD
I=
0.3%
2.7%
0.7%
1.5%
1.2%
2.0%
R
ound
ed %
AD
I=
0%
3%
1%
1%
1%
2%

A
nn
ex 3
427 M
AN
DIP
RO
PA
MID
(2
31
) In
tern
atio
nal E
stim
ated
Dai
ly In
take
(IE
DI)
AD
I = 0
- 0
.2 m
g/kg
bw
STM
R o
r D
iets
: g/p
erso
n/da
y In
take
= d
aily
inta
ke: µ
g/pe
rson
STM
R-P
G
H
I
J K
L
M
C
odex
C
ode
Com
mod
ity
mg/
kg
diet
in
take
di
et
inta
ke
diet
in
take
di
et
inta
ke
diet
in
take
di
et
inta
ke
diet
in
take
VB
040
0 B
rocc
oli
0.43
5 3.
2 1.
4 7.
8 3.
4 0.
0 0.
0 0.
0 0.
0 0.
3 0.
1 0.
4 0.
2 6.
6 2.
9
VB
004
1 C
abba
ges,
Hea
d 0.
01
10.
0 0.
1 1.
0 0.
0 7.
2 0.
1 1.
0 0.
0 1.
4 0.
0 23
.9
0.2
17.0
0.
2
VS
0624
C
eler
y 2.
7 0.
0 0.
0 0.
3 0.
8 0.
0 0.
0 0.
0 0.
0 1.
0 2.
7 0.
0 0.
0 4.
2 11
.3
VC
042
4 C
ucum
ber
0.02
7.
9 0.
2 0.
6 0.
0 0.
2 0.
0 0.
0 0.
0 0.
4 0.
0 5.
5 0.
1 5.
3 0.
1
FB 0
269
Gra
pe (
excl
dri
ed, e
xcl j
uice
, exc
l win
e)
0.51
1.
2 0.
6 2.
6 1.
3 0.
0 0.
0 0.
2 0.
1 0.
0 0.
0 3.
7 1.
9 0.
0 0.
0
JF 0
269
Gra
pe ju
ice
0.14
0.
0 0.
0 0.
1 0.
0 1.
0 0.
1 0.
0 0.
0 0.
6 0.
1 0.
4 0.
1 3.
6 0.
5
DF
0269
G
rape
, dri
ed (
= c
urra
nts,
rai
sins
and
su
ltana
s)
1.68
0.
0 0.
0 0.
2 0.
3 0.
2 0.
3 0.
0 0.
0 0.
3 0.
5 0.
4 0.
7 2.
6 4.
4
VL
0053
L
eafy
veg
etab
les
5.65
40
.8
230.
5 12
.0
67.8
12
.5
70.6
9.
5 53
.7
5.4
30.5
50
.0
282.
5 39
.9
225.
4
VC
004
6 M
elon
s, e
xcep
t wat
erm
elon
0.
115
7.5
0.9
6.1
0.7
0.7
0.1
1.4
0.2
2.5
0.3
6.9
0.8
12.4
1.
4
- O
nion
, dry
0.
01
16.
8 0.
2 8.
6 0.
1 6.
9 0.
1 12
.1
0.1
18.6
0.
2 23
.8
0.2
28.4
0.
3
- O
nion
, gre
en (
= s
hallo
t, W
elsh
, spr
ing
onio
n,
othe
rs)
0.48
0.
6 0.
3 19
.3
9.3
0.4
0.2
3.9
1.9
4.2
2.0
10.7
5.
1 1.
7 0.
8
VO
005
1 Pe
pper
s 0.
12
8.7
1.0
22.
4 2.
7 8.
4 1.
0 9.
4 1.
1 3.
3 0.
4 5.
3 0.
6 8.
9 1.
1
VR
058
9 Po
tato
(in
cl f
lour
, fro
zen,
sta
rch,
tapi
oca)
0.
01
52.
7 0.
5 57
.1
0.6
50.
1 0.
5 4.
3 0.
0 54
.7
0.5
41.0
0.
4 16
8.0
1.7
VC
043
1 Sq
uash
, sum
mer
(=
cou
rget
te, z
ucch
ini)
0.
04
2.4
0.1
1.5
0.1
0.0
0.0
0.0
0.0
3.8
0.2
2.2
0.1
2.5
0.1
VO
044
8 To
mat
o (e
xcl j
uice
, exc
l pas
te, e
xcl p
eele
d)
0.06
22
.8
1.4
4.1
0.2
12.
3 0.
7 1.
8 0.
1 32
.8
2.0
0.4
0.0
27.3
1.
6
JF 0
448
Tom
ato
juic
e 0.
059
0.0
0.0
0.8
0.0
0.1
0.0
7.2
0.4
0.0
0.0
2.4
0.1
45.2
2.
7
- W
ine
0.36
6 1.
0 0.
4 0.
9 0.
3 6.
8 2.
5 0.
1 0.
0 3.
4 1.
2 3.
6 1.
3 31
.0
11.3
To
tal i
ntak
e (µ
g/pe
rson
)=
237.
5
87.7
76.3
57.7
40.7
294.
4
265.
8
B
ody
wei
ght p
er r
egio
n (k
g bw
) =
55
60
60
60
60
55
60
A
DI (
µg/
pers
on)=
11
000
12
000
12
000
12
000
12
000
11
000
12
000
%
AD
I=
2.2%
0.7%
0.6%
0.5%
0.3%
2.7%
2.2%
R
ound
ed %
AD
I=
2%
1%
1%
0%
0%
3%
2%

A
nn
ex 3
428 M
ET
HO
MY
L (
09
4)
Inte
rnat
iona
l Est
imat
ed D
aily
Inta
ke (
IED
I)
A
DI =
0 -
0.0
2 m
g/kg
bw
STM
R o
r D
iets
: g/p
erso
n/da
y In
take
= d
aily
inta
ke: µ
g/pe
rson
STM
R-P
A
B
C
D
E
F
Cod
ex
Cod
e C
omm
odit
y m
g/kg
di
et
inta
ke
diet
in
take
di
et
inta
ke
diet
in
take
di
et
inta
ke
diet
in
take
FP 0
226
App
le (
excl
juic
e)
0.09
0.
3 0.
0 56
.3
5.1
18.4
1.
7 38
.3
3.4
40.6
3.
7 28
.3
2.5
JF 0
226
App
le ju
ice
0.02
6 0.
0 0.
0 2.
8 0.
1 0.
1 0.
0 1.
1 0.
0 6.
8 0.
2 7.
4 0.
2
VS
0621
A
spar
agus
0.
33
0.0
0.0
1.1
0.4
0.6
0.2
0.2
0.1
1.2
0.4
0.1
0.0
GC
064
0 B
arle
y (i
ncl p
ot, i
ncl p
earl
ed, i
ncl f
lour
& g
rits
, inc
l bee
r)
0.14
40
.6
5.7
16.8
2.
4 93
.9
13.1
13
.2
1.8
48.6
6.
8 36
.1
5.1
VD
007
1
Bea
ns (
dry)
0.
02
15.8
0.
3 6.
1 0.
1 1.
7 0.
0 6.
3 0.
1 1.
8 0.
0 5.
0 0.
1
VP
0061
B
eans
exc
ept b
road
bea
n &
soy
a be
an (
gree
n po
ds &
im
mat
ure
seed
s)
0.00
5 1.
0 0.
0 17
.4
0.1
7.5
0.0
0.9
0.0
16.4
0.
1 0.
1 0.
0
VD
052
3 B
road
bea
n (d
ry)
0.02
7.
3 0.
1 2.
1 0.
0 6.
9 0.
1 0.
0 0.
0 0.
4 0.
0 0.
1 0.
0
FC 0
001
Cit
rus
frui
t (ex
cl le
mon
juic
e, e
xcl m
anda
rin
juic
e, e
xcl
oran
ge ju
ice,
exc
l gra
pefr
uit j
uice
, exc
l NE
S ju
ice)
0.
034
15.7
0.
5 86
.5
2.9
52.6
1.
8 24
.2
0.8
16.2
0.
6 12
.0
0.4
- C
itru
s ju
ice
NE
S 0.
004
0.0
0.0
1.7
0.0
0.1
0.0
0.0
0.0
1.1
0.0
0.3
0.0
VD
052
6 C
omm
on b
ean
(dry
) 0.
02
2.0
0.0
4.5
0.1
0.2
0.0
0.7
0.0
0.2
0.0
5.0
0.1
VP
0526
C
omm
on b
ean
(gre
en p
ods
and/
or im
mat
ure
seed
s)
0.05
5 0.
5 0.
0 4.
7 0.
3 4.
1 0.
2 0.
0 0.
0 13
.1
0.7
0.0
0.0
OR
069
1 C
otto
n se
ed o
il, e
dibl
e 0.
006
0.9
0.0
4.9
0.0
1.7
0.0
6.6
0.0
0.0
0.0
0.3
0.0
VC
004
5 Fr
uiti
ng v
eget
able
s, C
ucur
bits
0.
02
26.6
0.
5 10
7.5
2.2
95.9
1.
9 82
.2
1.6
25.4
0.
5 23
.2
0.5
FB 0
269
Gra
pe (
excl
dri
ed, e
xcl j
uice
, exc
l win
e)
0.01
1.
9 0.
0 9.
2 0.
1 23
.8
0.2
9.8
0.1
0.0
0.0
0.0
0.0
JF 0
269
Gra
pe ju
ice
0.01
98
0.0
0.0
0.1
0.0
0.1
0.0
0.1
0.0
1.4
0.0
1.0
0.0
DF
0269
G
rape
, dri
ed (
= c
urra
nts,
rai
sins
and
sul
tana
s)
0.01
8 0.
0 0.
0 2.
9 0.
1 0.
4 0.
0 0.
4 0.
0 2.
3 0.
0 1.
7 0.
0
JF 0
203
Gra
pefr
uit j
uice
0.
004
0.0
0.0
0.2
0.0
0.1
0.0
0.1
0.0
1.1
0.0
0.2
0.0
-d
Lem
on ju
ice
0.00
4 0.
0 0.
0 0.
9 0.
0 0.
1 0.
0 0.
0 0.
0 0.
2 0.
0 0.
4 0.
0
- L
ettu
ce (
head
, lea
f)
0.01
0.
1 0.
0 21
.5
0.2
2.3
0.0
0.2
0.0
5.5
0.1
18.0
0.
2
VD
053
4 L
ima
bean
(dr
y)
0.02
0.
0 0.
0 0.
2 0.
0 0.
2 0.
0 0.
7 0.
0 0.
0 0.
0 0.
0 0.
0
GC
064
5 M
aize
(in
cl f
lour
, exc
l oil,
incl
bee
r)
0.02
82
.7
1.7
1.4
0.0
51.4
1.
0 31
.8
0.6
0.2
0.0
0.2
0.0
OR
064
5 M
aize
oil,
edi
ble
0.00
4 0.
1 0.
0 4.
0 0.
0 2.
3 0.
0 0.
5 0.
0 0.
9 0.
0 0.
2 0.
0
- M
anda
rin
+ m
anda
rin-
like
hybr
id ju
ice
0.00
4 0.
0 0.
0 1.
4 0.
0 0.
9 0.
0 0.
4 0.
0 0.
7 0.
0 0.
9 0.
0
FS 0
245
Nec
tari
ne
0.05
0.
0 0.
0 0.
5 0.
0 3.
3 0.
2 1.
8 0.
1 2.
8 0.
1 1.
6 0.
1
GC
064
7 O
ats
(inc
l rol
led)
0.
02
1.4
0.0
0.6
0.0
0.2
0.0
4.2
0.1
5.7
0.1
8.9
0.2
- O
nion
, dry
0.
068
4.3
0.3
45.6
3.
1 27
.4
1.9
30.2
2.
1 22
.1
1.5
12.2
0.
8
JF 0
004
Ora
nge
juic
e 0.
004
0.0
0.0
2.1
0.0
4.4
0.0
1.4
0.0
16.2
0.
1 22
.6
0.1
FS 0
247
Peac
h 0.
05
0.2
0.0
24.8
1.
2 3.
3 0.
2 1.
8 0.
1 5.
4 0.
3 1.
6 0.
1
FP 0
230
Pear
0.
09
0.1
0.0
22.3
2.
0 2.
8 0.
3 4.
8 0.
4 10
.7
1.0
6.8
0.6

A
nn
ex 3
429M
ET
HO
MY
L (
09
4)
Inte
rnat
iona
l Est
imat
ed D
aily
Inta
ke (
IED
I)
A
DI =
0 -
0.0
2 m
g/kg
bw
STM
R o
r D
iets
: g/p
erso
n/da
y In
take
= d
aily
inta
ke: µ
g/pe
rson
STM
R-P
A
B
C
D
E
F
Cod
ex
Cod
e C
omm
odit
y m
g/kg
di
et
inta
ke
diet
in
take
di
et
inta
ke
diet
in
take
di
et
inta
ke
diet
in
take
VP
0063
Pe
as (
gree
n po
ds a
nd/o
r im
mat
ure
seed
s)
0.46
0.
1 0.
0 2.
9 1.
3 6.
0 2.
8 0.
6 0.
3 9.
7 4.
5 5.
2 2.
4
VO
005
1 Pe
pper
s 0.
1 1.
4 0.
1 29
.9
3.0
13.0
1.
3 6.
3 0.
6 6.
2 0.
6 4.
0 0.
4
FS 0
014
Plum
(in
cl d
ried
) 0.
08
0.1
0.0
5.9
0.5
2.5
0.2
7.3
0.6
6.9
0.6
2.6
0.2
VR
058
9 Po
tato
(in
cl f
lour
, fro
zen,
sta
rch,
tapi
oca)
0
19.1
0.
0 16
0.8
0.0
61.2
0.
0 24
3.6
0.0
230.
1 0.
0 20
4.7
0.0
OR
054
1 So
ya b
ean
oil,
refi
ned
0.04
1.
6 0.
1 6.
5 0.
3 6.
0 0.
2 4.
0 0.
2 6.
3 0.
3 7.
0 0.
3
VO
044
8 To
mat
o (i
ncl j
uice
, exc
l pas
te, i
ncl p
eele
d)
0.00
85
9.8
0.1
179.
8 1.
5 10
4.0
0.9
56.7
0.
5 16
.4
0.1
22.9
0.
2
GC
065
4 W
heat
(ex
cl b
ulgu
r w
hole
mea
l, ex
cl f
lour
) 0.
14
0.0
0.0
0.0
0.0
0.0
0.0
0.0
0.0
0.1
0.0
0.0
0.0
CM
065
4 W
heat
bra
n, u
npro
cess
ed
0.27
N
D
- N
D
- N
D
- N
D
- N
D
- N
D
-
CF
1211
W
heat
flo
ur (
incl
mac
aron
i, br
ead,
pas
try,
sta
rch,
glu
ten)
0.
003
63.4
0.
2 29
6.3
0.9
327.
5 1.
0 30
0.0
0.9
181.
6 0.
5 16
6.2
0.5
CF
1210
W
heat
ger
m
0.13
0.
0 0.
0 1.
3 0.
2 0.
0 0.
0 1.
3 0.
2 0.
9 0.
1 1.
2 0.
2
- W
ine
0.05
31
1.3
0.1
76.8
4.
1 1.
1 0.
1 15
.4
0.8
68.8
3.
7 25
.6
1.4
To
tal i
ntak
e (µ
g/pe
rson
)=
9.9
32
.1
29
.4
15
.6
26
.5
16
.5
B
ody
wei
ght p
er r
egio
n (k
g bw
) =
60
60
60
60
60
60
A
DI (
µg/
pers
on)=
12
00
12
00
12
00
12
00
12
00
12
00
%
AD
I=
0.8%
2.7%
2.4%
1.3%
2.2%
1.4%
R
ound
ed %
AD
I=
1%
3%
2%
1%
2%
1%
ME
TH
OM
YL
(0
94
) In
tern
atio
nal E
stim
ated
Dai
ly In
take
(IE
DI)
AD
I = 0
- 0
.02
mg/
kg b
w
STM
R o
r D
iets
: g/p
erso
n/da
y In
take
= d
aily
inta
ke: µ
g/pe
rson
STM
R-P
G
H
I
J K
L
M
C
odex
C
ode
Com
mod
ity
mg/
kg
diet
in
take
di
et
inta
ke
diet
in
take
di
et
inta
ke
diet
in
take
di
et
inta
ke
diet
in
tak
e FP
022
6 A
pple
(ex
cl ju
ice)
0.
09
14.3
1.
3 9.
4 0.
8 2.
1 0.
2 0.
0 0.
0 8.
8 0.
8 16
.6
1.5
27.8
2.
5
JF 0
226
App
le ju
ice
0.02
6 0.
1 0.
0 0.
5 0.
0 0.
1 0.
0 0.
0 0.
0 0.
7 0.
0 0.
9 0.
0 5.
7 0.
1
VS
0621
A
spar
agus
0.
33
3.7
1.2
0.3
0.1
0.2
0.1
0.0
0.0
0.0
0.0
0.5
0.2
1.1
0.4
GC
064
0 B
arle
y (i
ncl p
ot, i
ncl p
earl
ed, i
ncl f
lour
& g
rits
, inc
l be
er)
0.
14
5.9
0.8
20.5
2.
9 5.
9 0.
8 2.
5 0.
4 20
.2
2.8
16.8
2.
4 43
.8
6.1
VD
007
1
Bea
ns (
dry)
0.
02
3.4
0.1
25.5
0.
5 7.
8 0.
2 2.
1 0.
0 44
.7
0.9
5.5
0.1
7.3
0.1
VP
0061
B
eans
exc
ept b
road
bea
n &
soy
a be
an (
gree
n po
ds &
im
mat
ure
seed
s)
0.00
5 2.
6 0.
0 2.
6 0.
0 1.
0 0.
0 0.
5 0.
0 0.
6 0.
0 2.
8 0.
0 9.
8 0.
0

A
nn
ex 3
430M
ET
HO
MY
L (
09
4)
Inte
rnat
iona
l Est
imat
ed D
aily
Inta
ke (
IED
I)
A
DI =
0 -
0.0
2 m
g/kg
bw
STM
R o
r D
iets
: g/p
erso
n/da
y In
take
= d
aily
inta
ke: µ
g/pe
rson
STM
R-P
G
H
I
J K
L
M
C
odex
C
ode
Com
mod
ity
mg/
kg
diet
in
take
di
et
inta
ke
diet
in
take
di
et
inta
ke
diet
in
take
di
et
inta
ke
diet
in
tak
e V
D 0
523
Bro
ad b
ean
(dry
) 0.
02
0.8
0.0
1.2
0.0
0.0
0.0
2.8
0.1
0.3
0.0
0.1
0.0
5.3
0.1
FC 0
001
Cit
rus
frui
t (ex
cl le
mon
juic
e, e
xcl m
anda
rin
juic
e, e
xcl
oran
ge ju
ice,
exc
l gra
pefr
uit j
uice
, exc
l NE
S ju
ice)
0.
034
15.1
0.
5 15
3.9
5.2
3.4
0.1
41.7
1.
4 21
8.9
7.4
23.1
0.
8 18
.0
0.6
- C
itru
s ju
ice
NE
S 0.
004
0.0
0.0
0.0
0.0
0.5
0.0
0.0
0.0
0.0
0.0
0.3
0.0
0.1
0.0
VD
052
6 C
omm
on b
ean
(dry
) 0.
02
0.4
0.0
14.8
0.
3 1.
0 0.
0 0.
3 0.
0 44
.7
0.9
0.6
0.0
0.9
0.0
VP
0526
C
omm
on b
ean
(gre
en p
ods
and/
or im
mat
ure
seed
s)
0.05
5 0.
0 0.
0 1.
9 0.
1 0.
0 0.
0 0.
0 0.
0 0.
3 0.
0 1.
8 0.
1 8.
0 0.
4
OR
069
1 C
otto
n se
ed o
il, e
dibl
e 0.
006
1.0
0.0
0.7
0.0
1.0
0.0
1.4
0.0
1.5
0.0
5.5
0.0
1.2
0.0
VC
004
5 Fr
uiti
ng v
eget
able
s, C
ucur
bits
0.
02
69.7
1.
4 25
.9
0.5
14.9
0.
3 18
.0
0.4
18.7
0.
4 39
.1
0.8
44.2
0.
9
FB 0
269
Gra
pe (
excl
dri
ed, e
xcl j
uice
, exc
l win
e)
0.01
1.
2 0.
0 2.
6 0.
0 0.
0 0.
0 0.
2 0.
0 0.
0 0.
0 3.
7 0.
0 0.
0 0.
0
JF 0
269
Gra
pe ju
ice
0.01
98
0.0
0.0
0.1
0.0
1.0
0.0
0.0
0.0
0.6
0.0
0.4
0.0
3.6
0.1
DF
0269
G
rape
, dri
ed (
= c
urra
nts,
rai
sins
and
sul
tana
s)
0.01
8 0.
0 0.
0 0.
2 0.
0 0.
2 0.
0 0.
0 0.
0 0.
3 0.
0 0.
4 0.
0 2.
6 0.
0
JF 0
203
Gra
pefr
uit j
uice
0.
004
0.0
0.0
0.0
0.0
0.5
0.0
0.0
0.0
0.0
0.0
0.3
0.0
2.4
0.0
-d
Lem
on ju
ice
0.00
4 0.
3 0.
0 0.
0 0.
0 1.
0 0.
0 0.
3 0.
0 0.
0 0.
0 0.
5 0.
0 2.
6 0.
0
- L
ettu
ce (
head
, lea
f)
0.01
2.
4 0.
0 7.
0 0.
1 0.
2 0.
0 0.
6 0.
0 2.
0 0.
0 2.
4 0.
0 18
.2
0.2
VD
053
4 L
ima
bean
(dr
y)
0.02
0.
4 0.
0 1.
3 0.
0 0.
0 0.
0 0.
0 0.
0 0.
0 0.
0 0.
6 0.
0 0.
1 0.
0
GC
064
5 M
aize
(in
cl f
lour
, exc
l oil,
incl
bee
r)
0.02
35
.2
0.7
298.
6 6.
0 24
8.1
5.0
57.4
1.
1 63
.1
1.3
0.0
0.0
19.4
0.
4
OR
064
5 M
aize
oil,
edi
ble
0.00
4 0.
1 0.
0 0.
6 0.
0 1.
8 0.
0 0.
0 0.
0 1.
0 0.
0 1.
6 0.
0 1.
8 0.
0
- M
anda
rin
+ m
anda
rin-
like
hybr
id ju
ice
0.00
4 0.
5 0.
0 0.
5 0.
0 0.
1 0.
0 0.
0 0.
0 0.
7 0.
0 1.
4 0.
0 0.
0 0.
0
FS 0
245
Nec
tari
ne
0.05
1.
7 0.
1 1.
7 0.
1 0.
0 0.
0 0.
0 0.
0 1.
0 0.
1 1.
7 0.
1 1.
4 0.
1
GC
064
7 O
ats
(inc
l rol
led)
0.
02
0.2
0.0
2.0
0.0
0.8
0.0
0.0
0.0
3.5
0.1
0.7
0.0
7.6
0.2
- O
nion
, dry
0.
068
16.8
1.
1 8.
6 0.
6 6.
9 0.
5 12
.1
0.8
18.6
1.
3 23
.8
1.6
28.4
1.
9
JF 0
004
Ora
nge
juic
e 0.
004
0.2
0.0
1.0
0.0
3.5
0.0
0.0
0.0
1.3
0.0
6.4
0.0
56.8
0.
2
FS 0
247
Peac
h 0.
05
1.7
0.1
1.7
0.1
1.1
0.1
0.1
0.0
1.0
0.1
1.7
0.1
10.2
0.
5
FP 0
230
Pear
0.
09
6.4
0.6
1.9
0.2
1.2
0.1
0.0
0.0
1.8
0.2
6.9
0.6
7.8
0.7
VP
0063
Pe
as (
gree
n po
ds a
nd/o
r im
mat
ure
seed
s)
0.46
3.
9 1.
8 1.
6 0.
7 0.
4 0.
2 0.
0 0.
0 0.
9 0.
4 1.
0 0.
5 8.
6 4.
0
VO
005
1 Pe
pper
s 0.
1 8.
7 0.
9 22
.4
2.2
8.4
0.8
9.4
0.9
3.3
0.3
5.3
0.5
8.9
0.9
FS 0
014
Plum
(in
cl d
ried
) 0.
08
3.3
0.3
1.4
0.1
0.1
0.0
0.0
0.0
0.6
0.0
1.5
0.1
2.2
0.2
VR
058
9 Po
tato
(in
cl f
lour
, fro
zen,
sta
rch,
tapi
oca)
0
52.7
0.
0 57
.1
0.0
50.1
0.
0 4.
3 0.
0 54
.7
0.0
41.0
0.
0 16
8.0
0.0
OR
054
1 So
ya b
ean
oil,
refi
ned
0.04
4.
3 0.
2 10
.6
0.4
2.0
0.1
1.4
0.1
19.5
0.
8 9.
2 0.
4 22
.0
0.9
VO
044
8 To
mat
o (i
ncl j
uice
, exc
l pas
te, i
ncl p
eele
d)
0.00
85
23.1
0.
2 23
.3
0.2
12.6
0.
1 14
.6
0.1
33.2
0.
3 4.
3 0.
0 98
.2
0.8
GC
065
4 W
heat
(ex
cl b
ulgu
r w
hole
mea
l, ex
cl f
lour
) 0.
14
0.0
0.0
0.9
0.1
0.0
0.0
0.0
0.0
0.1
0.0
0.0
0.0
0.1
0.0
CM
W
heat
bra
n, u
npro
cess
ed
0.27
N
D
- N
D
- N
D
- N
D
- N
D
- N
D
- N
D
-

A
nn
ex 3
431M
ET
HO
MY
L (
09
4)
Inte
rnat
iona
l Est
imat
ed D
aily
Inta
ke (
IED
I)
A
DI =
0 -
0.0
2 m
g/kg
bw
STM
R o
r D
iets
: g/p
erso
n/da
y In
take
= d
aily
inta
ke: µ
g/pe
rson
STM
R-P
G
H
I
J K
L
M
C
odex
C
ode
Com
mod
ity
mg/
kg
diet
in
take
di
et
inta
ke
diet
in
take
di
et
inta
ke
diet
in
take
di
et
inta
ke
diet
in
tak
e 06
54
CF
1211
W
heat
flo
ur (
incl
mac
aron
i, br
ead,
pas
try,
sta
rch,
gl
uten
) 0.
003
133.
0 0.
4 60
.1
0.2
52.4
0.
2 32
.2
0.1
87.7
0.
3 79
.6
0.2
180.
1 0.
5
CF
1210
W
heat
ger
m
0.13
0.
1 0.
0 48
.1
6.3
1.8
0.2
0.0
0.0
0.0
0.0
0.0
0.0
0.6
0.1
- W
ine
0.05
31
1.0
0.1
0.9
0.0
6.8
0.4
0.1
0.0
3.4
0.2
3.6
0.2
31.0
1.
6
To
tal i
ntak
e (µ
g/pe
rson
)=
11.8
27.9
9.3
5.
5
18.5
10.4
24.7
B
ody
wei
ght p
er r
egio
n (k
g bw
) =
55
60
60
60
60
55
60
A
DI (
µg/
pers
on)=
11
00
12
00
12
00
12
00
12
00
11
00
12
00
%
AD
I=
1.1%
2.3%
0.8%
0.5%
1.5%
0.9%
2.1%
R
ound
ed %
AD
I=
1%
2%
1%
0%
2%
1%
2%

A
nn
ex 3
432
PR
OF
EN
OF
OS
(1
71
) In
tern
atio
nal E
stim
ated
Dai
ly In
take
(IE
DI)
AD
I = 0
- 0
.03
mg/
kg b
w
ST
MR
or
Diets: g/p
erso
n/da
y In
take
= d
aily
inta
ke: µ
g/pe
rson
STM
R-P
A
B
C
D
E
F C
odex
C
ode
Com
mod
ity
mg/
kg
diet
co
rrec
tion
fa
ctor
diet
in
take
D
iet
inta
ke
diet
in
take
di
et
inta
ke
diet
in
take
di
et
inta
ke
FI 0
345
Man
go (
incl
juic
e, in
cl p
ulp)
0.
06
1 6.
3 0.
4 1.
0 0.
1 4.
6 0.
3 0.
2 0.
0 0.
7 0.
0 0.
3 0.
0
- A
ssor
ted
(sub
)tro
pica
l fru
its
NE
S (e
xcl p
assi
on
frui
t)*
2.1
1 5.
2 10
.9
6.5
13.7
1.
2 2.
5 0.
0 0.
0 16
.8
35.3
0.
0 0.
0
VO
044
8 To
mat
o (i
ncl j
uice
, inc
l pas
te, i
ncl p
eele
d)
1.3
1 11
.8
15.3
18
5.0
240.
5 11
8.0
153.
4 60
.7
78.9
31
.6
41.1
40
.9
53.2
OR
069
1 C
otto
n se
ed o
il, e
dibl
e 0.
14
1 0.
9 0.
1 4.
9 0.
7 1.
7 0.
2 6.
6 0.
9 0.
0 0.
0 0.
3 0.
0
MM
009
5 M
eat f
rom
mam
mal
s ot
her
than
mar
ine
mam
mal
s 0
1 27
.7
0.0
116.
5 0.
0 38
.5
0.0
55.1
0.
0 90
.2
0.0
131.
3 0.
0
MF
0100
M
amm
alia
n fa
ts (
exce
pt m
ilk f
ats)
0
1 0.
8 0.
0 10
.0
0.0
0.9
0.0
6.6
0.0
11.8
0.
0 3.
7 0.
0
MO
010
5 E
dibl
e of
fal (
mam
mal
ian)
0
1 3.
9 0.
0 14
.4
0.0
5.2
0.0
11.8
0.
0 11
.7
0.0
7.6
0.0
PM 0
110
Poul
try
mea
t 0
1 7.
1 0.
0 58
.5
0.0
31.9
0.
0 24
.0
0.0
61.0
0.
0 27
.3
0.0
PF 0
111
Poul
try,
fat
s 0
1 0.
1 0.
0 0.
1 0.
0 0.
1 0.
0 0.
0 0.
0 0.
4 0.
0 0.
1 0.
0
PO 0
111
Poul
try,
Edi
ble
offa
l of
0 1
0.4
0.0
0.4
0.0
1.7
0.0
0.1
0.0
0.6
0.0
0.2
0.0
ML
0106
M
ilks
(exc
l pro
cess
ed p
rodu
cts)
0
1 68
.8
0.0
190.
6 0.
0 79
.4
0.0
302.
6 0.
0 17
9.6
0.0
237.
9 0.
0
PE 0
112
Egg
s 0
1 2.
5 0.
0 29
.7
0.0
25.1
0.
0 24
.5
0.0
37.8
0.
0 27
.4
0.0
*
Man
gost
een
To
tal i
ntak
e (µ
g/pe
rson
)=
26
.8
25
4.9
15
6.4
79
.8
76
.4
53
.2
B
ody
wei
ght p
er r
egio
n (k
g bw
) =
60
60
60
60
60
60
A
DI (
µg/
pers
on)=
1800
1800
1800
1800
1800
1800
%
AD
I=
1.
5%
14
.2%
8.7%
4.4%
4.2%
3.0%
R
ound
ed %
AD
I=
1%
10%
9%
4%
4%
3%

A
nn
ex 3
433
PR
OF
EN
OF
OS
(1
71
) In
tern
atio
nal E
stim
ated
Dai
ly In
take
(IE
DI)
AD
I = 0
- 0
.03
mg/
kg b
w
ST
MR
or
Diets: g/pe
rson
/day
In
take
= d
aily
inta
ke: µ
g/pe
rson
ST
MR
-P
G
H
I
J K
L
M
C
odex
C
ode
Com
mod
ity
mg/
kg
diet
co
rrec
tion
fa
ctor
diet
in
take
di
et
inta
ke
diet
in
take
di
et
inta
ke
diet
in
take
di
et
inta
ke
diet
in
take
FI 0
345
Man
go (
incl
juic
e, in
cl p
ulp)
0.
06
1 12
.7
0.8
26.2
1.
6 6.
1 0.
4 12
.7
0.8
9.2
0.6
8.0
0.5
1.9
0.1
- A
ssor
ted
(sub
)tro
pica
l fru
its
NE
S (e
xcl
pass
ion
frui
t)*
2.1
1 5.
7 12
.0
4.7
9.9
2.4
5.0
1.1
2.3
13.1
27
.5
47.2
99
.1
0.7
1.5
VO
044
8 To
mat
o (i
ncl j
uice
, inc
l pas
te, i
ncl p
eele
d)
1.3
1 23
.5
30.6
31
.7
41.2
15
.0
19.5
16
.2
21.1
35
.6
46.3
9.
9 12
.9
103.
0 13
3.9
OR
069
1 C
otto
n se
ed o
il, e
dibl
e 0.
14
1 1.
0 0.
1 0.
7 0.
1 1.
0 0.
1 1.
4 0.
2 1.
5 0.
2 5.
5 0.
8 1.
2 0.
2
MM
009
5 M
eat f
rom
mam
mal
s ot
her
than
mar
ine
mam
mal
s 0
1 54
.8
0.0
89.4
0.
0 30
.6
0.0
28.6
0.
0 82
.1
0.0
61.1
0.
0 15
8.3
0.0
MF
0100
M
amm
alia
n fa
ts (
exce
pt m
ilk f
ats)
0
1 2.
2 0.
0 18
.6
0.0
0.5
0.0
0.8
0.0
5.7
0.0
4.5
0.0
18.2
0.
0
MO
010
5 E
dibl
e of
fal (
mam
mal
ian)
0
1 4.
8 0.
0 10
.7
0.0
4.0
0.0
4.0
0.0
6.5
0.0
6.6
0.0
5.6
0.0
PM 0
110
Poul
try
mea
t 0
1 17
.6
0.0
131.
3 0.
0 25
.1
0.0
4.7
0.0
145.
9 0.
0 27
.7
0.0
115.
1 0.
0
PF 0
111
Poul
try,
fat
s 0
1 0.
1 0.
0 8.
2 0.
0 0.
0 0.
0 0.
1 0.
0 0.
0 0.
0 0.
1 0.
0 4.
2 0.
0
PO 0
111
Poul
try,
Edi
ble
offa
l of
0 1
0.4
0.0
1.0
0.0
1.9
0.0
0.0
0.0
0.7
0.0
1.0
0.0
0.3
0.0
ML
0106
M
ilks
(exc
l pro
cess
ed p
rodu
cts)
0
1 66
.0
0.0
121.
1 0.
0 81
.6
0.0
102.
4 0.
0 20
7.7
0.0
57.0
0.
0 28
7.9
0.0
PE 0
112
Egg
s 0
1 22
.1
0.0
71.5
0.
0 16
.6
0.0
5.1
0.0
17.6
0.
0 35
.2
0.0
57.4
0.
0
*
Man
gost
een
To
tal i
ntak
e (µ
g/pe
rson
)=
43
.4
52
.8
25
.0
24
.3
74
.6
11
3.2
13
5.7
B
ody
wei
ght p
er r
egio
n (k
g bw
) =
55
60
60
60
60
55
60
A
DI (
µg/
pers
on)=
1650
1800
1800
1800
1800
1650
1800
%
AD
I=
2.
6%
2.
9%
1.
4%
1.
4%
4.
1%
6.
9%
7.
5%
R
ound
ed %
AD
I=
3%
3%
1%
1%
4%
7%
8%

A
nn
ex 3
434
PR
OT
HIO
CO
NA
ZO
LE
(2
32
) In
tern
atio
nal E
stim
ated
Dai
ly In
take
(IE
DI)
AD
I = 0
- 0
.01
mg/
kg b
w
STM
R o
r D
iets
: g/p
erso
n/da
y In
take
= d
aily
inta
ke: µ
g/pe
rson
STM
R-P
A
B
C
D
E
F
Cod
ex
Cod
e C
omm
odit
y m
g/kg
di
et
inta
ke
diet
in
take
di
et
inta
ke
diet
in
take
di
et
inta
ke
diet
in
take
GC
064
0 B
arle
y (i
ncl p
ot, i
ncl p
earl
ed, i
ncl f
lour
& g
rits
, inc
l be
er)
0.
01
40.6
0.
4 16
.8
0.2
93.9
0.
9 13
.2
0.1
48.6
0.
5 36
.1
0.4
CM
008
1 B
ran,
unp
roce
ssed
of
cere
al g
rain
(ex
cept
bu
ckw
heat
, can
ihua
, qui
noa)
0.
024
ND
-
ND
-
ND
-
ND
-
ND
-
ND
-
MO
010
5 E
dibl
e of
fal (
mam
mal
ian)
0.
05
3.9
0.2
14.4
0.
7 5.
2 0.
3 11
.8
0.6
11.7
0.
6 7.
6 0.
4
MF
0100
M
amm
alia
n fa
ts (
exce
pt m
ilk f
ats)
0.
01
0.8
0.0
10.0
0.
1 0.
9 0.
0 6.
6 0.
1 11
.8
0.1
3.7
0.0
MM
009
5 M
eat f
rom
mam
mal
s ot
her
than
mar
ine
mam
mal
s 0.
01
27.7
0.
3 11
6.5
1.2
38.5
0.
4 55
.1
0.6
90.2
0.
9 13
1.3
1.3
ML
0106
M
ilks
(exc
l pro
cess
ed p
rodu
cts)
0.
004
68.8
0.
3 19
0.6
0.8
79.4
0.
3 30
2.6
1.2
179.
6 0.
7 23
7.9
1.0
GC
064
7 O
ats
(inc
l rol
led)
0.
01
1.4
0.0
0.6
0.0
0.2
0.0
4.2
0.0
5.7
0.1
8.9
0.1
SO 0
697
Pean
ut, s
helle
d (i
ncl o
il)
0.01
5.
4 0.
1 3.
1 0.
0 2.
1 0.
0 0.
7 0.
0 4.
0 0.
0 1.
4 0.
0
SO 0
495
Rap
e se
ed (
incl
oil)
0.
01
0.9
0.0
1.8
0.0
2.5
0.0
1.9
0.0
35.7
0.
4 26
.1
0.3
GC
065
0 R
ye (
incl
flo
ur)
0.01
0.
1 0.
0 3.
7 0.
0 0.
3 0.
0 24
.3
0.2
25.8
0.
3 45
.8
0.5
GC
065
3 T
riti
cale
(in
cl f
lour
) 0.
01
0.0
0.0
115.
8 1.
2 0.
0 0.
0 0.
0 0.
0 0.
3 0.
0 0.
0 0.
0
GC
065
4 W
heat
(in
cl b
ulgu
r w
hole
mea
l, ex
cl f
lour
) 0.
01
6.0
0.1
11.1
0.
1 0.
8 0.
0 0.
2 0.
0 0.
2 0.
0 0.
0 0.
0
CF
1211
W
heat
flo
ur (
incl
mac
aron
i, br
ead,
pas
try,
sta
rch,
gl
uten
) 0.
004
63.4
0.
3 29
6.3
1.2
327.
5 1.
3 30
0.0
1.2
181.
6 0.
7 16
6.2
0.7
CF
1210
W
heat
ger
m
0.02
0.
0 0.
0 1.
3 0.
0 0.
0 0.
0 1.
3 0.
0 0.
9 0.
0 1.
2 0.
0
To
tal i
ntak
e (µ
g/pe
rson
)=
1.2
5.
5
3.3
4.
1
4.3
4.
5
B
ody
wei
ght p
er r
egio
n (k
g bw
) =
60
60
60
60
60
60
A
DI (
µg/
pers
on)=
60
0
600
60
0
600
60
0
600
%
AD
I=
0.2%
0.9%
0.6%
0.7%
0.7%
0.8%
R
ound
ed %
AD
I=
0%
1%
1%
1%
1%
1%

A
nn
ex 3
435 P
RO
TH
IOC
ON
AZ
OL
E (
23
2)
Inte
rnat
iona
l Est
imat
ed D
aily
Inta
ke (
IED
I)
A
DI =
0 -
0.0
1 m
g/kg
bw
STM
R o
r D
iets
: g/p
erso
n/da
y In
take
= d
aily
inta
ke: µ
g/pe
rson
STM
R-P
G
H
I
J K
L
M
C
odex
C
ode
Com
mod
ity
mg/
kg
diet
in
take
di
et
inta
ke
diet
in
take
di
et
inta
ke
diet
in
take
di
et
inta
ke
diet
in
take
GC
064
0 B
arle
y (i
ncl p
ot, i
ncl p
earl
ed, i
ncl f
lour
& g
rits
, in
cl b
eer)
0.
01
5.9
0.1
20.5
0.
2 5.
9 0.
1 2.
5 0.
0 20
.2
0.2
16.8
0.
2 43
.8
0.4
CM
008
1 B
ran,
unp
roce
ssed
of
cere
al g
rain
(ex
cept
bu
ckw
heat
, can
ihua
, qui
noa)
0.
024
ND
-
ND
-
ND
-
ND
-
ND
-
ND
-
ND
-
MO
010
5 E
dibl
e of
fal (
mam
mal
ian)
0.
05
4.8
0.2
10.7
0.
5 4.
0 0.
2 4.
0 0.
2 6.
5 0.
3 6.
6 0.
3 5.
6 0.
3
MF
0100
M
amm
alia
n fa
ts (
exce
pt m
ilk f
ats)
0.
01
2.2
0.0
18.6
0.
2 0.
5 0.
0 0.
8 0.
0 5.
7 0.
1 4.
5 0.
0 18
.2
0.2
MM
009
5 M
eat f
rom
mam
mal
s ot
her
than
mar
ine
mam
mal
s 0.
01
54.8
0.
5 89
.4
0.9
30.6
0.
3 28
.6
0.3
82.1
0.
8 61
.1
0.6
158.
3 1.
6
ML
0106
M
ilks
(exc
l pro
cess
ed p
rodu
cts)
0.
004
66.0
0.
3 12
1.1
0.5
81.6
0.
3 10
2.4
0.4
207.
7 0.
8 57
.0
0.2
287.
9 1.
2
GC
064
7 O
ats
(inc
l rol
led)
0.
01
0.2
0.0
2.0
0.0
0.8
0.0
0.0
0.0
3.5
0.0
0.7
0.0
7.6
0.1
SO 0
697
Pean
ut, s
helle
d (i
ncl o
il)
0.01
7.
6 0.
1 2.
1 0.
0 4.
7 0.
0 21
.8
0.2
0.9
0.0
0.7
0.0
6.9
0.1
SO 0
495
Rap
e se
ed (
incl
oil)
0.
01
9.9
0.1
5.9
0.1
0.3
0.0
1.0
0.0
0.0
0.0
15.5
0.
2 9.
9 0.
1
GC
065
0 R
ye (
incl
flo
ur)
0.01
0.
4 0.
0 0.
0 0.
0 0.
2 0.
0 0.
1 0.
0 0.
1 0.
0 0.
9 0.
0 0.
8 0.
0
GC
065
3 T
riti
cale
(in
cl f
lour
) 0.
01
1.3
0.0
0.0
0.0
0.0
0.0
0.0
0.0
0.0
0.0
0.0
0.0
0.0
0.0
GC
065
4 W
heat
(in
cl b
ulgu
r w
hole
mea
l, ex
cl f
lour
) 0.
01
0.0
0.0
0.9
0.0
0.0
0.0
0.0
0.0
0.1
0.0
0.0
0.0
0.1
0.0
CF
1211
W
heat
flo
ur (
incl
mac
aron
i, br
ead,
pas
try,
st
arch
, glu
ten)
0.
004
133.
0 0.
5 60
.1
0.2
52.4
0.
2 32
.2
0.1
87.7
0.
4 79
.6
0.3
180.
1 0.
7
CF
1210
W
heat
ger
m
0.02
0.
1 0.
0 48
.1
1.0
1.8
0.0
0.0
0.0
0.0
0.0
0.0
0.0
0.6
0.0
To
tal i
ntak
e (µ
g/pe
rson
)=
1.9
3.
6
1.2
1.
3
2.6
1.
8
4.6
B
ody
wei
ght p
er r
egio
n (k
g bw
) =
55
60
60
60
60
55
60
A
DI (
µg/
pers
on)=
55
0
600
60
0
600
60
0
550
60
0
%
AD
I=
0.3%
0.6%
0.2%
0.2%
0.4%
0.3%
0.8%
R
ound
ed %
AD
I=
0%
1%
0%
0%
0%
0%
1%

A
nn
ex 3
436
SP
INE
TO
RA
M (
23
3)
Inte
rnat
iona
l Est
imat
ed D
aily
Inta
ke (
IED
I)
A
DI =
0 -
0.0
5 m
g/kg
bw
STM
R o
r D
iets
: g/p
erso
n/da
y In
take
= d
aily
inta
ke: µ
g/pe
rson
STM
R-P
A
B
C
D
E
F
Cod
ex
Cod
e C
omm
odit
y m
g/kg
di
et
inta
ke
diet
in
take
di
et
inta
ke
diet
in
take
di
et
inta
ke
diet
in
take
FC 0
004
Ora
nge,
sw
eet,
sour
+ o
rang
e-lik
e hy
brid
(ex
cl ju
ice)
0.
0435
4.
2 0.
2 54
.1
2.4
30.1
1.
4 11
.9
0.5
0.2
0.0
0.5
0.0
JF 0
004
Ora
nge
juic
e 0.
003
0.0
0.0
2.1
0.0
4.4
0.0
1.4
0.0
16.2
0.
0 22
.6
0.1
TN
008
5 T
ree
nuts
0.
02
4.2
0.1
21.5
0.
4 3.
9 0.
1 3.
0 0.
1 5.
5 0.
1 10
.2
0.2
FP 0
009
Pom
e fr
uit (
excl
app
le ju
ice)
0.
025
0.5
0.0
79.9
2.
0 21
.8
0.5
43.6
1.
1 51
.5
1.3
35.1
0.
9
JF 0
226
App
le ju
ice
0.01
1 0.
0 0.
0 2.
8 0.
0 0.
1 0.
0 1.
1 0.
0 6.
8 0.
1 7.
4 0.
1
VR
059
6 Su
gar
beet
0.
01
0.0
0.0
40.7
0.
4 0.
0 0.
0 0.
1 0.
0 6.
0 0.
1 0.
1 0.
0
VO
044
8 To
mat
o (i
ncl j
uice
, inc
l pas
te, i
ncl p
eele
d)
0.02
11
.8
0.2
185.
0 3.
7 11
8.0
2.4
60.7
1.
2 31
.6
0.6
40.9
0.
8
VL
0482
L
ettu
ce, h
ead
0.89
5 0.
1 0.
1 12
.3
11.0
1.
3 1.
2 0.
1 0.
1 0.
1 0.
1 0.
0 0.
0
VL
0483
L
ettu
ce, l
eaf
0.89
5 0.
0 0.
0 9.
2 8.
2 1.
0 0.
9 0.
1 0.
1 5.
4 4.
8 18
.0
16.1
MM
009
5 M
eat f
rom
mam
mal
s ot
her
than
mar
ine
mam
mal
s:
20%
as
fat
0.04
6 5.
5 0.
3 23
.3
1.1
7.7
0.4
11.0
0.
5 18
.0
0.8
26.3
1.
2
MM
009
5 M
eat f
rom
mam
mal
s ot
her
than
mar
ine
mam
mal
s:
80%
as
mus
cle
0.00
625
22.2
0.
1 93
.2
0.6
30.8
0.
2 44
.1
0.3
72.2
0.
5 10
5.0
0.7
MO
010
5 E
dibl
e of
fal (
mam
mal
ian)
0.
0062
5 3.
9 0.
0 14
.4
0.1
5.2
0.0
11.8
0.
1 11
.7
0.1
7.6
0.0
ML
0106
M
ilks
(exc
l pro
cess
ed p
rodu
cts)
0.
0092
5 68
.8
0.6
190.
6 1.
8 79
.4
0.7
302.
6 2.
8 17
9.6
1.7
237.
9 2.
2
To
tal i
ntak
e (µ
g/pe
rson
)=
1.8
43
.2
8.
9
6.8
10
.3
22
.3
B
ody
wei
ght p
er r
egio
n (k
g bw
) =
60
60
60
60
60
60
A
DI (
µg/
pers
on)=
30
00
30
00
30
00
30
00
30
00
30
00
%
AD
I=
0.1%
1.4%
0.3%
0.2%
0.3%
0.7%
R
ound
ed %
AD
I=
0%
1%
0%
0%
0%
1%

A
nn
ex 3
437 S
PIN
ET
OR
AM
(2
33
) In
tern
atio
nal E
stim
ated
Dai
ly In
take
(IE
DI)
AD
I = 0
- 0
.05
mg/
kg b
w
STM
R o
r D
iets
: g/p
erso
n/da
y In
take
= d
aily
inta
ke: µ
g/pe
rson
STM
R-P
G
H
I
J K
L
M
C
odex
C
ode
Com
mod
ity
mg/
kg
diet
in
take
di
et
inta
ke
diet
in
take
di
et
inta
ke
diet
in
take
di
et
inta
ke
diet
in
take
FC 0
004
Ora
nge,
sw
eet,
sour
+ o
rang
e-lik
e hy
brid
(ex
cl
juic
e)
0.04
35
7.0
0.3
117.
1 5.
3 2.
0 0.
1 2.
4 0.
1 20
0.7
9.0
0.5
0.0
0.2
0.0
JF 0
004
Ora
nge
juic
e 0.
003
0.2
0.0
1.0
0.0
3.5
0.0
0.0
0.0
1.3
0.0
6.4
0.0
56.8
0.
2
TN
008
5 T
ree
nuts
0.
02
16.3
0.
3 15
.7
0.3
9.7
0.2
1.9
0.0
19.1
0.
4 29
.0
0.6
5.6
0.1
FP 0
009
Pom
e fr
uit (
excl
app
le ju
ice)
0.
025
20.8
0.
5 11
.6
0.3
3.3
0.1
0.1
0.0
10.7
0.
3 23
.6
0.6
36.9
0.
9
JF 0
226
App
le ju
ice
0.01
1 0.
1 0.
0 0.
5 0.
0 0.
1 0.
0 0.
0 0.
0 0.
7 0.
0 0.
9 0.
0 5.
7 0.
1
VR
059
6 Su
gar
beet
0.
01
0.0
0.0
0.1
0.0
0.0
0.0
0.0
0.0
0.2
0.0
0.0
0.0
14.3
0.
1
VO
044
8 To
mat
o (i
ncl j
uice
, inc
l pas
te, i
ncl p
eele
d)
0.02
23
.5
0.5
31.7
0.
6 15
.0
0.3
16.2
0.
3 35
.6
0.7
9.9
0.2
103.
0 2.
1
VL
0482
L
ettu
ce, h
ead
0.89
5 2.
4 2.
1 7.
0 6.
3 0.
2 0.
2 0.
6 0.
5 2.
0 1.
8 2.
4 2.
1 15
.7
14.1
VL
0483
L
ettu
ce, l
eaf
0.89
5 0.
0 0.
0 0.
0 0.
0 0.
0 0.
0 0.
0 0.
0 0.
0 0.
0 0.
0 0.
0 2.
5 2.
2
MM
009
5 M
eat f
rom
mam
mal
s ot
her
than
mar
ine
mam
mal
s: 2
0% a
s fa
t 0.
046
11.0
0.
5 17
.9
0.8
6.1
0.3
5.7
0.3
16.4
0.
8 12
.2
0.6
31.7
1.
5
MM
009
5 M
eat f
rom
mam
mal
s ot
her
than
mar
ine
mam
mal
s: 8
0% a
s m
uscl
e 0.
0062
5 43
.8
0.3
71.5
0.
4 24
.5
0.2
22.9
0.
1 65
.7
0.4
48.9
0.
3 12
6.6
0.8
MO
010
5 E
dibl
e of
fal (
mam
mal
ian)
0.
0062
5 4.
8 0.
0 10
.7
0.1
4.0
0.0
4.0
0.0
6.5
0.0
6.6
0.0
5.6
0.0
ML
0106
M
ilks
(exc
l pro
cess
ed p
rodu
cts)
0.
0092
5 66
.0
0.6
121.
1 1.
1 81
.6
0.8
102.
4 0.
9 20
7.7
1.9
57.0
0.
5 28
7.9
2.7
To
tal i
ntak
e (µ
g/pe
rson
)=
7.3
21
.5
2.
2
2.9
17
.1
7.
1
38.9
B
ody
wei
ght p
er r
egio
n (k
g bw
) =
55
60
60
60
60
55
60
A
DI (
µg/
pers
on)=
27
50
30
00
30
00
30
00
30
00
27
50
30
00
%
AD
I=
0.3%
0.7%
0.1%
0.1%
0.6%
0.3%
1.3%
R
ound
ed %
AD
I=
0%
1%
0%
0%
1%
0%
1%

A
nn
ex 3
438
SP
IRO
TE
TR
AM
AT
(2
34
) In
tern
atio
nal E
stim
ated
Dai
ly In
take
(IE
DI)
AD
I = 0
- 0
.05
mg/
kg b
w
STM
R o
r D
iets
: g/p
erso
n/da
y In
take
= d
aily
inta
ke: µ
g/pe
rson
STM
R-P
A
B
C
D
E
F
Cod
ex
Cod
e C
omm
odit
y m
g/kg
di
et
inta
ke
diet
in
take
di
et
inta
ke
diet
in
take
di
et
inta
ke
diet
in
take
JF 0
226
App
le ju
ice
0.08
2 0.
0 0.
0 2.
8 0.
2 0.
1 0.
0 1.
1 0.
1 6.
8 0.
6 7.
4 0.
6
VB
004
1 C
abba
ges,
Hea
d 0.
23
1.2
0.4
14.4
4.
9 2.
7 0.
9 16
.4
5.6
15.4
5.
2 18
.5
6.3
VS
0624
C
eler
y 0.
58
0.0
0.0
0.9
0.6
0.0
0.0
2.0
1.4
1.5
1.1
0.0
0.0
FS 0
013
Che
rrie
s 1.
6 0.
0 0.
0 6.
8 10
.9
0.9
1.4
6.2
9.9
3.6
5.8
0.4
0.6
FC 0
001
Cit
rus
frui
t (in
cl le
mon
juic
e, in
cl m
anda
rin
juic
e,
incl
ora
nge
juic
e, in
cl g
rape
frui
t jui
ce, i
ncl N
ES
juic
e)
0.33
15
.7
5.2
100.
5 33
.2
63.2
20
.9
27.8
9.
2 52
.6
17.4
56
.9
18.8
MO
010
5 E
dibl
e of
fal (
mam
mal
ian)
0.
014
3.9
0.1
14.4
0.
2 5.
2 0.
1 11
.8
0.2
11.7
0.
2 7.
6 0.
1
VB
004
2 Fl
ower
head
bra
ssic
as
0.50
0.
2 0.
1 11
.1
5.3
3.6
1.7
0.4
0.2
7.7
3.7
4.1
2.0
VO
005
0 Fr
uiti
ng v
eget
able
s ot
her
than
cuc
urbi
ts
0.43
33
.5
14.4
23
6.9
101.
9 14
8.9
64.0
70
.2
30.2
50
.4
21.7
53
.9
23.2
VC
004
5 Fr
uiti
ng v
eget
able
s, C
ucur
bits
0.
057
26.6
1.
5 10
7.5
6.1
95.9
5.
5 82
.2
4.7
25.4
1.
4 23
.2
1.3
FB 0
269
Gra
pe (
excl
dri
ed, e
xcl j
uice
, exc
l win
e)
0.41
1.
9 0.
8 9.
2 3.
7 23
.8
9.5
9.8
3.9
0.0
0.0
0.0
0.0
JF 0
269
Gra
pe ju
ice
0.27
0.
0 0.
0 0.
1 0.
0 0.
1 0.
0 0.
1 0.
0 1.
4 0.
4 1.
0 0.
3
DF
0269
G
rape
, dri
ed (
= c
urra
nts,
rai
sins
and
sul
tana
s)
1.1
0.0
0.0
2.9
3.2
0.4
0.4
0.4
0.4
2.3
2.5
1.7
1.9
DH
110
0 H
ops,
dry
5.
2 0.
1 0.
6 0.
1 0.
6 0.
1 0.
6 0.
1 0.
6 0.
3 1.
7 0.
1 0.
6
-d
Let
tuce
and
sim
ilar
(inc
l wit
loof
chi
cory
spr
outs
) 3.
7 0.
2 0.
2 23
.8
28.6
3.
6 4.
3 0.
6 0.
7 11
.9
14.3
18
.0
21.6
MF
0100
M
amm
alia
n fa
ts (
exce
pt m
ilk f
ats)
0
0.8
0.0
10.0
0.
0 0.
9 0.
0 6.
6 0.
0 11
.8
0.0
3.7
0.0
MM
009
5 M
eat f
rom
mam
mal
s ot
her
than
mar
ine
mam
mal
s:
20%
as
fat
0 5.
5 0.
0 23
.3
0.1
7.7
0.0
11.0
0.
0 18
.0
0.1
26.3
0.
1
MM
009
5 M
eat f
rom
mam
mal
s ot
her
than
mar
ine
mam
mal
s:
80%
as
mus
cle
0 22
.2
0.0
93.2
0.
2 30
.8
0.1
44.1
0.
1 72
.2
0.1
105.
0 0.
2
ML
0106
M
ilks
(exc
l pro
cess
ed p
rodu
cts)
0
68.8
0.
3 19
0.6
0.8
79.4
0.
3 30
2.6
1.2
179.
6 0.
7 23
7.9
1.0
VL
0485
M
usta
rd g
reen
s 3.
7 0.
3 0.
8 0.
3 0.
8 0.
0 0.
0 5.
5 13
.8
0.0
0.0
1.9
4.8
FS 0
245
Nec
tari
ne
1.6
0.0
0.0
0.5
0.4
3.3
2.5
1.8
1.4
2.8
2.1
1.6
1.2
FS 0
247
Peac
h 1.
6 0.
2 0.
2 24
.8
18.8
3.
3 2.
5 1.
8 1.
4 5.
4 4.
1 1.
6 1.
2
VO
044
4 Pe
pper
s, C
hilli
0.
95
0.7
0.7
14.9
14
.5
4.1
4.0
3.2
3.1
3.1
3.0
2.0
1.9
FS 0
014
Plum
(ex
cl d
ried
) 1.
6 0.
1 0.
0 5.
3 1.
9 2.
5 0.
9 7.
0 2.
5 5.
5 2.
0 0.
9 0.
3
DF
0014
Pl
um, d
ried
(pr
unes
) 3.
5 0.
0 0.
0 0.
2 0.
2 0.
0 0.
0 0.
1 0.
1 0.
5 0.
5 0.
6 0.
6
FP 0
009
Pom
e fr
uit (
excl
app
le ju
ice)
0.
17
0.5
0.1
79.9
12
.8
21.8
3.
5 43
.6
7.0
51.5
8.
2 35
.1
5.6
VR
058
9 Po
tato
(in
cl f
lour
, fro
zen,
sta
rch,
tapi
oca)
0.
12
19.1
2.
3 16
0.8
19.3
61
.2
7.3
243.
6 29
.2
230.
1 27
.6
204.
7 24
.6
VL
0502
Sp
inac
h 3.
7 0.
0 0.
0 5.
0 8.
0 1.
1 1.
8 0.
1 0.
2 2.
6 4.
2 0.
1 0.
2

A
nn
ex 3
439
SP
IRO
TE
TR
AM
AT
(2
34
) In
tern
atio
nal E
stim
ated
Dai
ly In
take
(IE
DI)
AD
I = 0
- 0
.05
mg/
kg b
w
STM
R o
r D
iets
: g/p
erso
n/da
y In
take
= d
aily
inta
ke: µ
g/pe
rson
STM
R-P
A
B
C
D
E
F
Cod
ex
Cod
e C
omm
odit
y m
g/kg
di
et
inta
ke
diet
in
take
di
et
inta
ke
diet
in
take
di
et
inta
ke
diet
in
take
JF 0
448
Tom
ato
juic
e 0.
27
5.2
1.4
0.5
0.1
0.4
0.1
2.1
0.6
6.9
1.9
15.2
4.
1
-d
Tom
ato
past
e 3.
2 0.
5 1.
6 1.
3 4.
2 3.
5 11
.2
1.0
3.2
3.8
12.2
4.
5 14
.4
TN
008
5 T
ree
nuts
0.
084
4.2
0.4
21.5
1.
8 3.
9 0.
3 3.
0 0.
3 5.
5 0.
5 10
.2
0.9
- W
ine
0.23
1.
3 0.
3 76
.8
19.2
1.
1 0.
3 15
.4
3.9
68.8
17
.2
25.6
6.
4
To
tal i
ntak
e (µ
g/pe
rson
)=
31.2
302.
4
144.
2
134.
9
160.
2
144.
5
B
ody
wei
ght p
er r
egio
n (k
g bw
) =
60
60
60
60
60
60
A
DI (
µg/
pers
on)=
30
00
30
00
30
00
30
00
30
00
30
00
%
AD
I=
1.0%
10.1
%
4.
8%
4.
5%
5.
3%
4.
8%
R
ound
ed %
AD
I=
1%
10
%
5%
4%
5%
5%
SP
IRO
TE
TR
AM
AT
(2
34
) In
tern
atio
nal E
stim
ated
Dai
ly In
take
(IE
DI)
AD
I = 0
- 0
.05
mg/
kg b
w
STM
R o
r D
iets
: g/p
erso
n/da
y In
take
= d
aily
inta
ke: µ
g/pe
rson
STM
R-P
G
H
I
J K
L
M
C
odex
C
ode
Com
mod
ity
mg/
kg
diet
in
take
di
et
inta
ke
diet
in
take
di
et
inta
ke
diet
in
take
di
et
inta
ke
diet
in
take
JF 0
226
App
le ju
ice
0.08
2 0.
1 0.
0 0.
5 0.
0 0.
1 0.
0 0.
0 0.
0 0.
7 0.
1 0.
9 0.
1 5.
7 0.
5
VB
004
1 C
abba
ges,
Hea
d 0.
23
10.0
3.
4 1.
0 0.
3 7.
2 2.
4 1.
0 0.
3 1.
4 0.
5 23
.9
8.1
17.0
5.
8
VS
0624
C
eler
y 0.
58
0.0
0.0
0.3
0.2
0.0
0.0
0.0
0.0
1.0
0.7
0.0
0.0
4.2
3.0
FS 0
013
Che
rrie
s 1.
6 0.
0 0.
0 0.
0 0.
0 0.
0 0.
0 0.
0 0.
0 0.
0 0.
0 0.
3 0.
5 2.
5 4.
0
FC 0
001
Cit
rus
frui
t (in
cl le
mon
juic
e, in
cl m
anda
rin
juic
e, in
cl o
rang
e ju
ice,
incl
gra
pefr
uit j
uice
, in
cl N
ES
juic
e)
0.33
17
.3
5.7
156.
8 51
.7
14.9
4.
9 42
.5
14.0
22
2.8
73.5
40
.4
13.3
13
2.3
43.7
MO
010
5 E
dibl
e of
fal (
mam
mal
ian)
0.
014
4.8
0.1
10.7
0.
1 4.
0 0.
1 4.
0 0.
1 6.
5 0.
1 6.
6 0.
1 5.
6 0.
1
VB
004
2 Fl
ower
head
bra
ssic
as
0.5
9.6
4.6
7.9
3.8
0.6
0.3
0.2
0.1
0.9
0.4
1.1
0.5
8.0
3.8
VO
005
0 Fr
uiti
ng v
eget
able
s ot
her
than
cuc
urbi
ts
0.43
57
.2
24.6
60
.1
25.8
35
.5
15.3
51
.1
22.0
42
.2
18.1
31
.5
13.5
13
4.8
58.0
VC
004
5 Fr
uiti
ng v
eget
able
s, C
ucur
bits
0.
057
69.7
4.
0 25
.9
1.5
14.9
0.
8 18
.0
1.0
18.7
1.
1 39
.1
2.2
44.2
2.
5
FB 0
269
Gra
pe (
excl
dri
ed, e
xcl j
uice
, exc
l win
e)
0.41
1.
2 0.
5 2.
6 1.
0 0.
0 0.
0 0.
2 0.
1 0.
0 0.
0 3.
7 1.
5 0.
0 0.
0
JF 0
269
Gra
pe ju
ice
0.27
0.
0 0.
0 0.
1 0.
0 1.
0 0.
3 0.
0 0.
0 0.
6 0.
2 0.
4 0.
1 3.
6 1.
0
DF
0269
G
rape
, dri
ed (
= c
urra
nts,
rai
sins
and
su
ltana
s)
1.1
0.0
0.0
0.2
0.2
0.2
0.2
0.0
0.0
0.3
0.3
0.4
0.4
2.6
2.9
DH
110
0 H
ops,
dry
5.
2 0.
0 0.
0 0.
1 0.
6 0.
1 0.
6 0.
1 0.
6 0.
1 0.
6 0.
1 0.
6 0.
6 3.
3
-d
Let
tuce
and
sim
ilar
(inc
l wit
loof
chi
cory
3.
7 7.
1 8.
5 7.
0 8.
4 0.
6 0.
7 1.
9 2.
3 2.
0 2.
4 7.
1 8.
5 30
.6
36.7

A
nn
ex 3
440S
PIR
OT
ET
RA
MA
T (
23
4)
Inte
rnat
iona
l Est
imat
ed D
aily
Inta
ke (
IED
I)
A
DI =
0 -
0.0
5 m
g/kg
bw
STM
R o
r D
iets
: g/p
erso
n/da
y In
take
= d
aily
inta
ke: µ
g/pe
rson
STM
R-P
G
H
I
J K
L
M
C
odex
C
ode
Com
mod
ity
mg/
kg
diet
in
take
di
et
inta
ke
diet
in
take
di
et
inta
ke
diet
in
take
di
et
inta
ke
diet
in
take
spro
uts)
MF
0100
M
amm
alia
n fa
ts (
exce
pt m
ilk f
ats)
0
2.2
0.0
18.6
0.
1 0.
5 0.
0 0.
8 0.
0 5.
7 0.
0 4.
5 0.
0 18
.2
0.1
MM
009
5 M
eat f
rom
mam
mal
s ot
her
than
mar
ine
mam
mal
s: 2
0% a
s fa
t 0
11.0
0.
0 17
.9
0.1
6.1
0.0
5.7
0.0
16.4
0.
1 12
.2
0.0
31.7
0.
1
MM
009
5 M
eat f
rom
mam
mal
s ot
her
than
mar
ine
mam
mal
s: 8
0% a
s m
uscl
e 0
43.8
0.
1 71
.5
0.1
24.5
0.
0 22
.9
0.0
65.7
0.
1 48
.9
0.1
126.
6 0.
3
ML
0106
M
ilks
(exc
l pro
cess
ed p
rodu
cts)
0
66.0
0.
3 12
1.1
0.5
81.6
0.
3 10
2.4
0.4
207.
7 0.
8 57
.0
0.2
287.
9 1.
2
VL
0485
M
usta
rd g
reen
s 3.
7 3.
4 8.
5 0.
4 1.
0 2.
4 6.
0 0.
3 0.
8 0.
5 1.
3 7.
9 19
.8
0.3
0.8
FS 0
245
Nec
tari
ne
1.6
1.7
1.3
1.7
1.3
0.0
0.0
0.0
0.0
1.0
0.8
1.7
1.3
1.4
1.1
FS 0
247
Peac
h 1.
6 1.
7 1.
3 1.
7 1.
3 1.
1 0.
8 0.
1 0.
1 1.
0 0.
8 1.
7 1.
3 10
.2
7.8
VO
044
4 Pe
pper
s, C
hilli
0.
95
8.7
8.4
13.0
12
.6
4.2
4.1
4.7
4.6
1.7
1.6
2.6
2.5
4.4
4.3
FS 0
014
Plum
(ex
cl d
ried
) 1.
6 3.
0 1.
1 0.
8 0.
3 0.
1 0.
0 0.
0 0.
0 0.
0 0.
0 0.
9 0.
3 0.
5 0.
2
DF
0014
Pl
um, d
ried
(pr
unes
) 3.
5 0.
1 0.
1 0.
2 0.
2 0.
0 0.
0 0.
0 0.
0 0.
2 0.
2 0.
2 0.
2 0.
6 0.
6
FP 0
009
Pom
e fr
uit (
excl
app
le ju
ice)
0.
17
20.8
3.
3 11
.6
1.8
3.3
0.5
0.1
0.0
10.7
1.
7 23
.6
3.8
36.9
5.
9
VR
058
9 Po
tato
(in
cl f
lour
, fro
zen,
sta
rch,
tapi
oca)
0.
12
52.7
6.
3 57
.1
6.9
50.1
6.
0 4.
3 0.
5 54
.7
6.6
41.0
4.
9 16
8.0
20.2
VL
0502
Sp
inac
h 3.
7 9.
4 15
.0
0.4
0.6
0.0
0.0
0.0
0.0
0.2
0.3
4.3
6.9
2.0
3.2
JF 0
448
Tom
ato
juic
e 0.
27
0.0
0.0
0.8
0.2
0.1
0.0
7.2
1.9
0.0
0.0
2.4
0.6
45.2
12
.2
-d
Tom
ato
past
e 3.
2 0.
1 0.
3 2.
1 6.
7 0.
6 1.
9 0.
4 1.
3 0.
6 1.
9 1.
4 4.
5 1.
2 3.
8
TN
008
5 T
ree
nuts
0.
084
16.3
1.
4 15
.7
1.3
9.7
0.8
1.9
0.2
19.1
1.
6 29
.0
2.4
5.6
0.5
- W
ine
0.23
1.
0 0.
3 0.
9 0.
2 6.
8 1.
7 0.
1 0.
0 3.
4 0.
9 3.
6 0.
9 31
.0
7.8
To
tal i
ntak
e (µ
g/pe
rson
)=
99.1
129.
1
47.9
50.2
116.
6
99.3
234.
9
B
ody
wei
ght p
er r
egio
n (k
g bw
) =
55
60
60
60
60
55
60
A
DI (
µg/
pers
on)=
27
50
30
00
30
00
30
00
30
00
27
50
30
00
%
AD
I=
3.6%
4.3%
1.6%
1.7%
3.9%
3.6%
7.8%
R
ound
ed %
AD
I=
4%
4%
2%
2%
4%
4%
8%
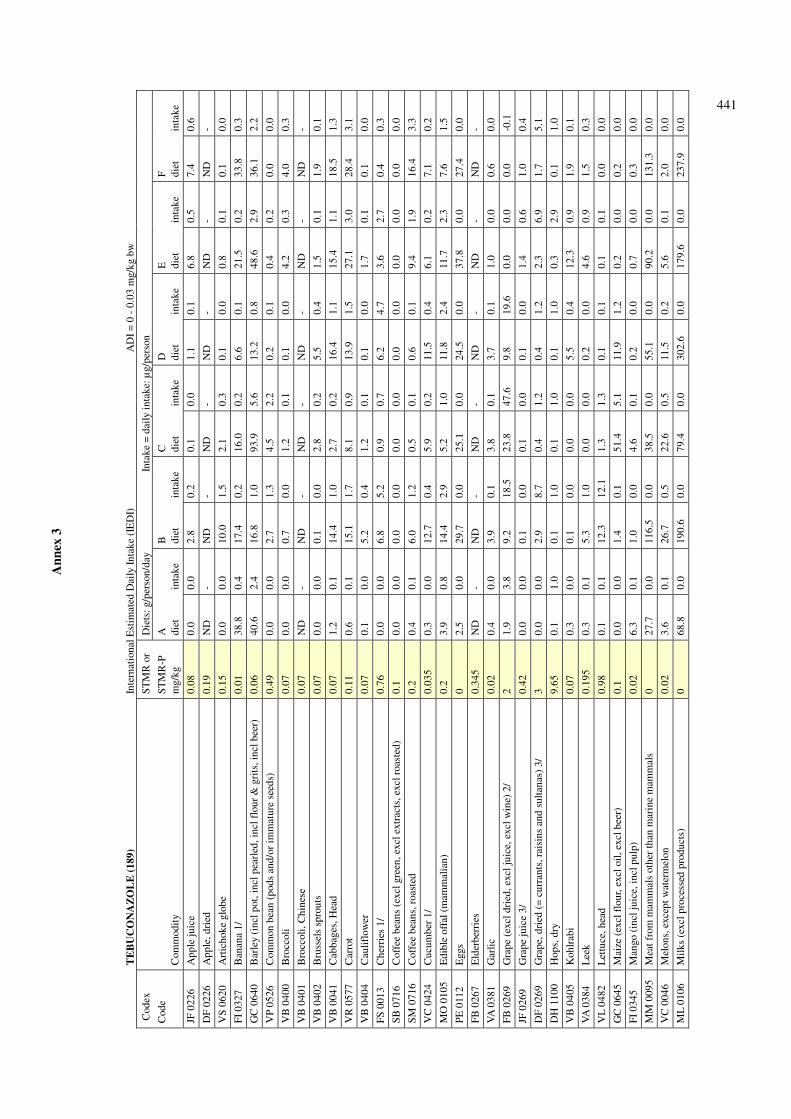
A
nn
ex 3
441
TE
BU
CO
NA
ZO
LE
(1
89
) In
tern
atio
nal E
stim
ated
Dai
ly In
take
(IE
DI)
AD
I = 0
- 0
.03
mg/
kg b
w
Cod
ex
ST
MR
or
Die
ts: g
/per
son/
day
Inta
ke =
dai
ly in
take
: µg/
pers
on
Cod
e
STM
R-P
A
B
C
D
E
F
C
omm
odit
y m
g/kg
di
et
inta
ke
diet
in
take
di
et
inta
ke
diet
in
take
di
et
inta
ke
diet
in
take
JF 0
226
App
le ju
ice
0.08
0.
0 0.
0 2.
8 0.
2 0.
1 0.
0 1.
1 0.
1 6.
8 0.
5 7.
4 0.
6
DF
0226
A
pple
, dri
ed
0.19
N
D
- N
D
- N
D
- N
D
- N
D
- N
D
-
VS
0620
A
rtic
hoke
glo
be
0.15
0.
0 0.
0 10
.0
1.5
2.1
0.3
0.1
0.0
0.8
0.1
0.1
0.0
FI 0
327
Ban
ana
1/
0.01
38
.8
0.4
17.4
0.
2 16
.0
0.2
6.6
0.1
21.5
0.
2 33
.8
0.3
GC
064
0 B
arle
y (i
ncl p
ot, i
ncl p
earl
ed, i
ncl f
lour
& g
rits
, inc
l bee
r)
0.06
40
.6
2.4
16.8
1.
0 93
.9
5.6
13.2
0.
8 48
.6
2.9
36.1
2.
2
VP
0526
C
omm
on b
ean
(pod
s an
d/or
imm
atur
e se
eds)
0.
49
0.0
0.0
2.7
1.3
4.5
2.2
0.2
0.1
0.4
0.2
0.0
0.0
VB
040
0 B
rocc
oli
0.07
0.
0 0.
0 0.
7 0.
0 1.
2 0.
1 0.
1 0.
0 4.
2 0.
3 4.
0 0.
3
VB
040
1 B
rocc
oli,
Chi
nese
0.
07
ND
-
ND
-
ND
-
ND
-
ND
-
ND
-
VB
040
2 B
russ
els
spro
uts
0.07
0.
0 0.
0 0.
1 0.
0 2.
8 0.
2 5.
5 0.
4 1.
5 0.
1 1.
9 0.
1
VB
004
1 C
abba
ges,
Hea
d 0.
07
1.2
0.1
14.4
1.
0 2.
7 0.
2 16
.4
1.1
15.4
1.
1 18
.5
1.3
VR
057
7 C
arro
t 0.
11
0.6
0.1
15.1
1.
7 8.
1 0.
9 13
.9
1.5
27.1
3.
0 28
.4
3.1
VB
040
4 C
aulif
low
er
0.07
0.
1 0.
0 5.
2 0.
4 1.
2 0.
1 0.
1 0.
0 1.
7 0.
1 0.
1 0.
0
FS 0
013
Che
rrie
s 1/
0.
76
0.0
0.0
6.8
5.2
0.9
0.7
6.2
4.7
3.6
2.7
0.4
0.3
SB 0
716
Cof
fee
bean
s (e
xcl g
reen
, exc
l ext
ract
s, e
xcl r
oast
ed)
0.1
0.0
0.0
0.0
0.0
0.0
0.0
0.0
0.0
0.0
0.0
0.0
0.0
SM 0
716
Cof
fee
bean
s, r
oast
ed
0.2
0.4
0.1
6.0
1.2
0.5
0.1
0.6
0.1
9.4
1.9
16.4
3.
3
VC
042
4 C
ucum
ber
1/
0.03
5 0.
3 0.
0 12
.7
0.4
5.9
0.2
11.5
0.
4 6.
1 0.
2 7.
1 0.
2
MO
010
5 E
dibl
e of
fal (
mam
mal
ian)
0.
2 3.
9 0.
8 14
.4
2.9
5.2
1.0
11.8
2.
4 11
.7
2.3
7.6
1.5
PE 0
112
Egg
s 0
2.5
0.0
29.7
0.
0 25
.1
0.0
24.5
0.
0 37
.8
0.0
27.4
0.
0
FB 0
267
Eld
erbe
rrie
s 0.
345
ND
-
ND
-
ND
-
ND
-
ND
-
ND
-
VA
038
1 G
arlic
0.
02
0.4
0.0
3.9
0.1
3.8
0.1
3.7
0.1
1.0
0.0
0.6
0.0
FB 0
269
Gra
pe (
excl
dri
ed, e
xcl j
uice
, exc
l win
e) 2
/ 2
1.9
3.8
9.2
18.5
23
.8
47.6
9.
8 19
.6
0.0
0.0
0.0
-0.1
JF 0
269
Gra
pe ju
ice
3/
0.42
0.
0 0.
0 0.
1 0.
0 0.
1 0.
0 0.
1 0.
0 1.
4 0.
6 1.
0 0.
4
DF
0269
G
rape
, dri
ed (
= c
urra
nts,
rai
sins
and
sul
tana
s) 3
/ 3
0.0
0.0
2.9
8.7
0.4
1.2
0.4
1.2
2.3
6.9
1.7
5.1
DH
110
0 H
ops,
dry
9.
65
0.1
1.0
0.1
1.0
0.1
1.0
0.1
1.0
0.3
2.9
0.1
1.0
VB
040
5 K
ohlr
abi
0.07
0.
3 0.
0 0.
1 0.
0 0.
0 0.
0 5.
5 0.
4 12
.3
0.9
1.9
0.1
VA
038
4 L
eek
0.19
5 0.
3 0.
1 5.
3 1.
0 0.
0 0.
0 0.
2 0.
0 4.
6 0.
9 1.
5 0.
3
VL
0482
L
ettu
ce, h
ead
0.98
0.
1 0.
1 12
.3
12.1
1.
3 1.
3 0.
1 0.
1 0.
1 0.
1 0.
0 0.
0
GC
064
5 M
aize
(ex
cl f
lour
, exc
l oil,
exc
l bee
r)
0.1
0.0
0.0
1.4
0.1
51.4
5.
1 11
.9
1.2
0.2
0.0
0.2
0.0
FI 0
345
Man
go (
incl
juic
e, in
cl p
ulp)
0.
02
6.3
0.1
1.0
0.0
4.6
0.1
0.2
0.0
0.7
0.0
0.3
0.0
MM
009
5 M
eat f
rom
mam
mal
s ot
her
than
mar
ine
mam
mal
s 0
27.7
0.
0 11
6.5
0.0
38.5
0.
0 55
.1
0.0
90.2
0.
0 13
1.3
0.0
VC
004
6 M
elon
s, e
xcep
t wat
erm
elon
0.
02
3.6
0.1
26.7
0.
5 22
.6
0.5
11.5
0.
2 5.
6 0.
1 2.
0 0.
0
ML
0106
M
ilks
(exc
l pro
cess
ed p
rodu
cts)
0
68.8
0.
0 19
0.6
0.0
79.4
0.
0 30
2.6
0.0
179.
6 0.
0 23
7.9
0.0

A
nn
ex 3
442
TE
BU
CO
NA
ZO
LE
(1
89
) In
tern
atio
nal E
stim
ated
Dai
ly In
take
(IE
DI)
AD
I = 0
- 0
.03
mg/
kg b
w
Cod
ex
ST
MR
or
Die
ts: g
/per
son/
day
Inta
ke =
dai
ly in
take
: µg/
pers
on
Cod
e
STM
R-P
A
B
C
D
E
F
C
omm
odit
y m
g/kg
di
et
inta
ke
diet
in
take
di
et
inta
ke
diet
in
take
di
et
inta
ke
diet
in
take
GC
064
7 O
ats
(exc
l rol
led)
1/
0 0.
1 0.
0 0.
0 0.
0 0.
0 0.
0 0.
0 0.
0 0.
0 0.
0 0.
0 0.
0
VA
038
5 O
nion
, Bul
b (=
dry
+ g
reen
oni
on)
0.05
5.
5 0.
3 49
.5
2.5
33.0
1.
7 31
.3
1.6
23.2
1.
2 14
.6
0.7
FI 0
350
Papa
ya
0.18
5.
1 0.
9 0.
1 0.
0 0.
0 0.
0 0.
0 0.
0 0.
1 0.
0 0.
0 0.
0
FS 0
247
Peac
h 1/
0.
21
0.2
0.0
24.8
5.
2 3.
3 0.
7 1.
8 0.
4 5.
4 1.
1 1.
6 0.
3
SO 0
697
Pean
ut, s
helle
d (e
xcl o
il)
0.04
1.
5 0.
0 1.
3 0.
0 1.
0 0.
0 0.
5 0.
0 0.
8 0.
0 0.
5 0.
0
VO
044
5 Pe
pper
s, s
wee
t (in
cl. p
im(i
)ent
o) 1
/ 0.
14
0.7
0.1
14.9
2.
1 8.
8 1.
2 3.
2 0.
4 3.
1 0.
4 2.
0 0.
3
FS 0
014
Plum
(ex
cl d
ried
) 0.
055
0.1
0.0
5.3
0.3
2.5
0.1
7.0
0.4
5.5
0.3
0.9
0.0
DF
0014
Pl
um, d
ried
(pr
unes
) 0.
18
0.0
0.0
0.2
0.0
0.0
0.0
0.1
0.0
0.5
0.1
0.6
0.1
FP 0
009
Pom
e fr
uit (
excl
app
le ju
ice)
0.
19
0.5
0.1
79.9
15
.2
21.8
4.
1 43
.6
8.3
51.5
9.
8 35
.1
6.7
PM 0
110
Poul
try
mea
t 0
7.1
0.0
58.5
0.
0 31
.9
0.0
24.0
0.
0 61
.0
0.0
27.3
0.
0
PO 0
111
Poul
try,
Edi
ble
offa
l of
0 0.
4 0.
0 0.
4 0.
0 1.
7 0.
0 0.
1 0.
0 0.
6 0.
0 0.
2 0.
0
SO 0
495
Rap
e se
ed (
excl
oil)
0.
09
0.1
0.0
0.0
0.0
0.0
0.0
0.1
0.0
0.1
0.0
0.1
0.0
OR
049
5 R
ape
seed
oil,
edi
ble
0.06
4 0.
3 0.
0 0.
7 0.
0 1.
0 0.
1 0.
7 0.
0 13
.7
0.9
10.0
0.
6
GC
064
9 R
ice
(exc
l hus
ked,
exc
l pol
ishe
d)
0.27
5 0.
0 0.
0 0.
0 0.
0 0.
0 0.
0 0.
1 0.
0 0.
0 0.
0 0.
0 0.
0
GC
065
0 R
ye (
excl
flo
ur)
3/
0.05
0.
1 0.
0 0.
1 0.
0 0.
0 0.
0 0.
0 0.
0 0.
1 0.
0 0.
0 0.
0
VD
054
1 So
ya b
ean
(dry
, exc
l oil)
0.
02
0.9
0.0
0.0
0.0
0.7
0.0
0.0
0.0
0.0
0.0
0.0
0.0
OR
054
1 So
ya b
ean
oil,
refi
ned
0.00
1 1.
6 0.
0 6.
5 0.
0 6.
0 0.
0 4.
0 0.
0 6.
3 0.
0 7.
0 0.
0
VC
043
1 Sq
uash
, sum
mer
(=
cou
rget
te, z
ucch
ini)
2/
0.02
0.
0 0.
0 8.
3 0.
2 11
.4
0.2
7.3
0.1
3.2
0.1
0.3
0.0
VO
044
7 Sw
eet c
orn
(cor
n-on
-the
-cob
) 0.
1 7.
3 0.
7 1.
0 0.
1 0.
1 0.
0 0.
5 0.
1 3.
3 0.
3 3.
6 0.
4
VO
044
8 To
mat
o (e
xcl j
uice
, exc
l pas
te, e
xcl p
eele
d)
0.19
1.
3 0.
3 17
8.4
33.9
10
2.8
19.5
53
.4
10.1
1.
6 0.
3 0.
0 0.
0
JF 0
448
Tom
ato
juic
e 0.
10
5.2
0.5
0.5
0.0
0.4
0.0
2.1
0.2
6.9
0.7
15.2
1.
5
-d
Tom
ato
past
e 0.
16
0.5
0.1
1.3
0.2
3.5
0.6
1.0
0.2
3.8
0.6
4.5
0.7
-d
Tom
ato,
pee
led
0.05
0.
1 0.
0 0.
4 0.
0 0.
5 0.
0 0.
4 0.
0 4.
9 0.
2 3.
2 0.
1
VC
043
2 W
ater
mel
on
0.02
6.
1 0.
1 43
.1
0.9
47.1
0.
9 25
.8
0.5
4.4
0.1
6.0
0.1
GC
065
4 W
heat
(ex
cl b
ulgu
r w
hole
mea
l, ex
cl f
lour
) 2/
0.
05
0.0
0.0
0.0
0.0
0.0
0.0
0.0
0.0
0.1
0.0
0.0
0.0
- W
ine
3/
0.5
1.3
0.7
76.8
38
.4
1.1
0.6
15.4
7.
7 68
.8
34.4
25
.6
12.8
To
tal i
ntak
e (µ
g/pe
rson
)=
12.9
158
98
.5
65
.6
78
.7
44
.6
B
ody
wei
ght p
er r
egio
n (k
g bw
) =
60
60
60
60
60
60
A
DI (
µg/
pers
on)=
18
00
18
00
18
00
18
00
18
00
18
00
%
AD
I=
0.7%
8.8%
5.4%
3.6%
4.4%
2.5%
R
ound
ed %
AD
I=
1%
9%
5%
4%
4%
2%
1/ S
TM
R f
rom
the
1997
JM
PR
; 2/ C
odex
MR
L r
ecom
men
ded
at th
e 19
94 J
MP
R; 3
/ PF
fro
m th
e 19
97 J
MP
R a
ppli
ed to
gra
pe M
RL

A
nn
ex 3
443T
EB
UC
ON
AZ
OL
E (
18
9)
Inte
rnat
iona
l Est
imat
ed D
aily
Inta
ke (
IED
I)
AD
I = 0
- 0
.03
mg/
kg b
w
STM
R o
r D
iets
: g/p
erso
n/da
y In
take
= d
aily
inta
ke: µ
g/pe
rson
Cod
ex
ST
MR
-P
G
H
I J
K
L
M
Cod
e C
omm
odit
y m
g/kg
di
et
inta
ke
diet
In
take
di
et
inta
ke
diet
in
take
di
et
inta
ke
diet
in
take
di
et
inta
ke
JF 0
226
App
le ju
ice
0.08
0.
1 0.
0 0.
5 0.
0 0.
1 0.
0 0.
0 0.
0 0.
7 0.
1 0.
9 0.
1 5.
7 0.
5
DF
0226
A
pple
, dri
ed
0.19
N
D
- N
D
- N
D
- N
D
- N
D
- N
D
- N
D
-
VS
0620
A
rtic
hoke
glo
be
0.15
0.
1 0.
0 0.
1 0.
0 0.
0 0.
0 0.
0 0.
0 0.
0 0.
0 0.
0 0.
0 1.
0 0.
2
FI 0
327
Ban
ana
1/
0.01
21
.4
0.2
36.6
0.
4 11
.4
0.1
9.2
0.1
70.2
0.
7 40
.5
0.4
32.6
0.
3
GC
064
0 B
arle
y (i
ncl p
ot, i
ncl p
earl
ed, i
ncl f
lour
& g
rits
, inc
l be
er)
0.
06
5.9
0.4
20.5
1.
2 5.
9 0.
4 2.
5 0.
2 20
.2
1.2
16.8
1.
0 43
.8
2.6
VP
0526
C
omm
on b
ean
(pod
s an
d/or
imm
atur
e se
eds)
0.
49
0.2
0.1
2.0
1.0
0.0
0.0
0.0
0.0
0.2
0.1
0.0
0.0
7.9
3.9
VB
040
0 B
rocc
oli
0.07
3.
2 0.
2 7.
8 0.
5 0.
0 0.
0 0.
0 0.
0 0.
3 0.
0 0.
4 0.
0 6.
6 0.
5
VB
040
1 B
rocc
oli,
Chi
nese
0.
07
ND
-
ND
-
ND
-
ND
-
ND
-
ND
-
ND
-
VB
040
2 B
russ
els
spro
uts
0.07
3.
4 0.
2 0.
4 0.
0 0.
0 0.
0 0.
0 0.
0 0.
5 0.
0 7.
9 0.
6 0.
3 0.
0
VB
004
1 C
abba
ges,
Hea
d 0.
07
10.0
0.
7 1.
0 0.
1 7.
2 0.
5 1.
0 0.
1 1.
4 0.
1 23
.9
1.7
17.0
1.
2
VR
057
7 C
arro
t 0.
11
5.4
0.6
7.9
0.9
2.5
0.3
3.5
0.4
4.1
0.5
8.6
0.9
19.4
2.
1
VB
040
4 C
aulif
low
er
0.07
3.
2 0.
2 0.
1 0.
0 0.
3 0.
0 0.
1 0.
0 0.
6 0.
0 0.
4 0.
0 1.
4 0.
1
FS 0
013
Che
rrie
s 1/
0.
76
0.0
0.0
0.0
0.0
0.0
0.0
0.0
0.0
0.0
0.0
0.3
0.2
2.5
1.9
SB 0
716
Cof
fee
bean
s (e
xcl g
reen
, exc
l ext
ract
s, e
xcl r
oast
ed)
0.1
0.0
0.0
0.0
0.0
0.0
0.0
0.0
0.0
0.0
0.0
0.0
0.0
0.0
0.0
SM 0
716
Cof
fee
bean
s, r
oast
ed
0.2
0.0
0.0
1.3
0.3
0.1
0.0
0.0
0.0
0.8
0.2
0.3
0.1
7.0
1.4
VC
042
4 C
ucum
ber
1/
0.03
5 7.
9 0.
3 0.
6 0.
0 0.
2 0.
0 0.
0 0.
0 0.
4 0.
0 5.
5 0.
2 5.
3 0.
2
PE 0
112
Egg
s 0
22.1
0.
0 71
.5
0.0
16.6
0.
0 5.
1 0.
0 17
.6
0.0
35.2
0.
0 57
.4
0.0
MO
010
5 E
dibl
e of
fal (
mam
mal
ian)
0.
2 4.
8 1.
0 10
.7
2.1
4.0
0.8
4.0
0.8
6.5
1.3
6.6
1.3
5.6
1.1
FB 0
267
Eld
erbe
rrie
s 0.
345
ND
-
ND
-
ND
-
ND
-
ND
-
ND
-
ND
-
VB
004
2 Fl
ower
head
bra
ssic
as
0.07
9.
6 0.
5 7.
9 0.
4 0.
6 0.
0 0.
2 0.
0 0.
9 0.
0 1.
1 0.
1 8.
0 0.
4
VA
038
1 G
arlic
0.
02
6.4
0.1
1.2
0.0
0.1
0.0
0.3
0.0
1.9
0.0
5.0
0.1
2.5
0.1
FB 0
269
Gra
pe (
excl
dri
ed, e
xcl j
uice
, exc
l win
e) 3
/ 2
1.2
2.4
2.6
5.2
0.0
0.0
0.2
0.3
0.0
0.0
3.7
7.4
0.0
-0.1
JF 0
269
Gra
pe ju
ice4
/ 0.
42
0.0
0.0
0.1
0.0
1.0
0.4
0.0
0.0
0.6
0.3
0.4
0.2
3.6
1.5
DF
0269
G
rape
, dri
ed (
= c
urra
nts,
rai
sins
and
sul
tana
s) 4
/ 3
0.0
0.0
0.2
0.6
0.2
0.6
0.0
0.0
0.3
0.9
0.4
1.2
2.6
7.8
DH
110
0 H
ops,
dry
9.
65
0.0
0.0
0.1
1.0
0.1
1.0
0.1
1.0
0.1
1.0
0.1
1.0
0.6
5.8
VB
040
5 K
ohlr
abi
0.07
3.
4 0.
2 0.
0 0.
0 0.
0 0.
0 0.
3 0.
0 0.
5 0.
0 7.
9 0.
6 0.
7 0.
0
VA
038
4 L
eek
0.19
5 0.
8 0.
2 0.
2 0.
0 0.
0 0.
0 0.
0 0.
0 0.
0 0.
0 0.
3 0.
1 0.
1 0.
0
VL
0482
L
ettu
ce, h
ead
0.98
2.
4 2.
4 7.
0 6.
9 0.
2 0.
2 0.
6 0.
6 2.
0 2.
0 2.
4 2.
4 15
.7
15.4
GC
064
5 M
aize
(ex
cl f
lour
, exc
l oil,
exc
l bee
r)
0.1
0.6
0.1
0.0
0.0
0.1
0.0
0.0
0.0
7.7
0.8
0.0
0.0
19.4
1.
9
FI 0
345
Man
go (
incl
juic
e, in
cl p
ulp)
0.
02
12.7
0.
3 26
.2
0.5
6.1
0.1
12.7
0.
3 9.
2 0.
2 8.
0 0.
2 1.
9 0.
0
MM
009
5 M
eat f
rom
mam
mal
s ot
her
than
mar
ine
mam
mal
s 0
54.8
0.
0 89
.4
0.0
30.6
0.
0 28
.6
0.0
82.1
0.
0 61
.1
0.0
158.
3 0.
0
VC
004
6 M
elon
s, e
xcep
t wat
erm
elon
0.
02
7.5
0.2
6.1
0.1
0.7
0.0
1.4
0.0
2.5
0.1
6.9
0.1
12.4
0.
2
ML
0106
M
ilks
(exc
l pro
cess
ed p
rodu
cts)
0
66.0
0.
0 12
1.1
0.0
81.6
0.
0 10
2.4
0.0
207.
7 0.
0 57
.0
0.0
287.
9 0.
0
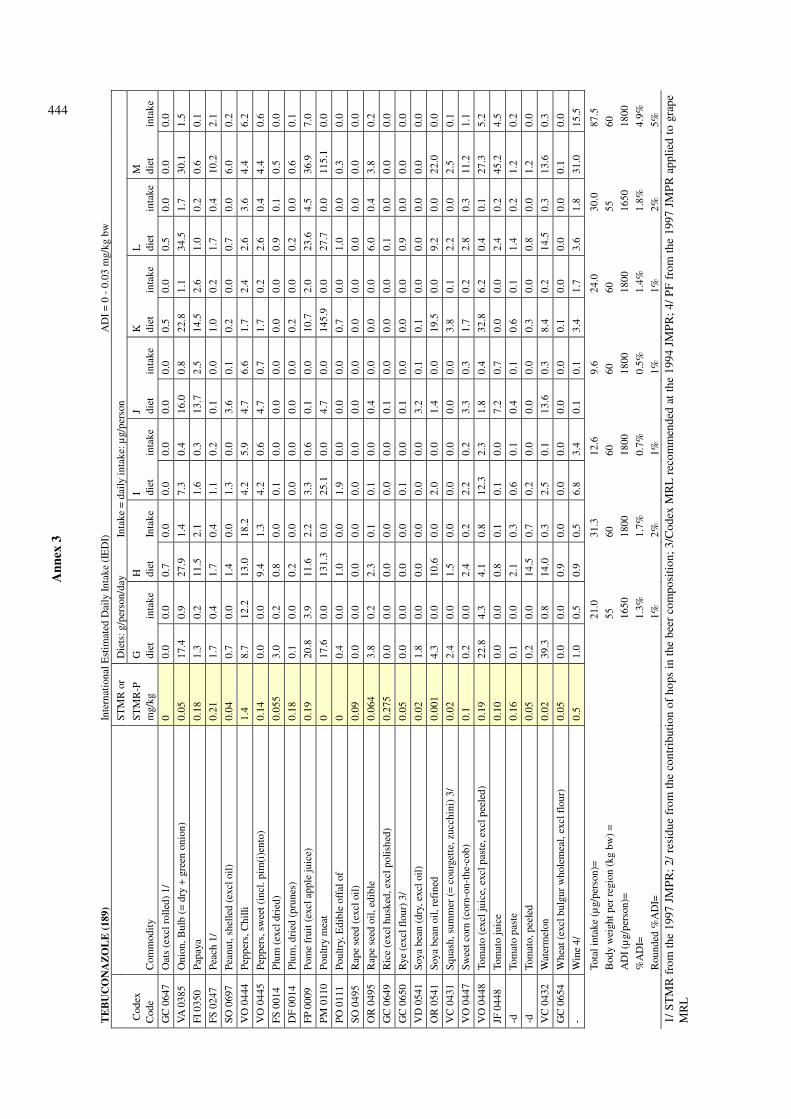
A
nn
ex 3
444T
EB
UC
ON
AZ
OL
E (
18
9)
Inte
rnat
iona
l Est
imat
ed D
aily
Inta
ke (
IED
I)
AD
I = 0
- 0
.03
mg/
kg b
w
STM
R o
r D
iets
: g/p
erso
n/da
y In
take
= d
aily
inta
ke: µ
g/pe
rson
Cod
ex
ST
MR
-P
G
H
I J
K
L
M
Cod
e C
omm
odit
y m
g/kg
di
et
inta
ke
diet
In
take
di
et
inta
ke
diet
in
take
di
et
inta
ke
diet
in
take
di
et
inta
ke
GC
064
7 O
ats
(exc
l rol
led)
1/
0 0.
0 0.
0 0.
7 0.
0 0.
0 0.
0 0.
0 0.
0 0.
5 0.
0 0.
5 0.
0 0.
0 0.
0
VA
038
5 O
nion
, Bul
b (=
dry
+ g
reen
oni
on)
0.05
17
.4
0.9
27.9
1.
4 7.
3 0.
4 16
.0
0.8
22.8
1.
1 34
.5
1.7
30.1
1.
5
FI 0
350
Papa
ya
0.18
1.
3 0.
2 11
.5
2.1
1.6
0.3
13.7
2.
5 14
.5
2.6
1.0
0.2
0.6
0.1
FS 0
247
Peac
h 1/
0.
21
1.7
0.4
1.7
0.4
1.1
0.2
0.1
0.0
1.0
0.2
1.7
0.4
10.2
2.
1
SO 0
697
Pean
ut, s
helle
d (e
xcl o
il)
0.04
0.
7 0.
0 1.
4 0.
0 1.
3 0.
0 3.
6 0.
1 0.
2 0.
0 0.
7 0.
0 6.
0 0.
2
VO
044
4 Pe
pper
s, C
hilli
1.
4 8.
7 12
.2
13.0
18
.2
4.2
5.9
4.7
6.6
1.7
2.4
2.6
3.6
4.4
6.2
VO
044
5 Pe
pper
s, s
wee
t (in
cl. p
im(i
)ent
o)
0.14
0.
0 0.
0 9.
4 1.
3 4.
2 0.
6 4.
7 0.
7 1.
7 0.
2 2.
6 0.
4 4.
4 0.
6
FS 0
014
Plum
(ex
cl d
ried
) 0.
055
3.0
0.2
0.8
0.0
0.1
0.0
0.0
0.0
0.0
0.0
0.9
0.1
0.5
0.0
DF
0014
Pl
um, d
ried
(pr
unes
) 0.
18
0.1
0.0
0.2
0.0
0.0
0.0
0.0
0.0
0.2
0.0
0.2
0.0
0.6
0.1
FP 0
009
Pom
e fr
uit (
excl
app
le ju
ice)
0.
19
20.8
3.
9 11
.6
2.2
3.3
0.6
0.1
0.0
10.7
2.
0 23
.6
4.5
36.9
7.
0
PM 0
110
Poul
try
mea
t 0
17.6
0.
0 13
1.3
0.0
25.1
0.
0 4.
7 0.
0 14
5.9
0.0
27.7
0.
0 11
5.1
0.0
PO 0
111
Poul
try,
Edi
ble
offa
l of
0 0.
4 0.
0 1.
0 0.
0 1.
9 0.
0 0.
0 0.
0 0.
7 0.
0 1.
0 0.
0 0.
3 0.
0
SO 0
495
Rap
e se
ed (
excl
oil)
0.
09
0.0
0.0
0.0
0.0
0.0
0.0
0.0
0.0
0.0
0.0
0.0
0.0
0.0
0.0
OR
049
5 R
ape
seed
oil,
edi
ble
0.06
4 3.
8 0.
2 2.
3 0.
1 0.
1 0.
0 0.
4 0.
0 0.
0 0.
0 6.
0 0.
4 3.
8 0.
2
GC
064
9 R
ice
(exc
l hus
ked,
exc
l pol
ishe
d)
0.27
5 0.
0 0.
0 0.
0 0.
0 0.
0 0.
0 0.
1 0.
0 0.
0 0.
0 0.
1 0.
0 0.
0 0.
0
GC
065
0 R
ye (
excl
flo
ur)
3/
0.05
0.
0 0.
0 0.
0 0.
0 0.
1 0.
0 0.
1 0.
0 0.
0 0.
0 0.
9 0.
0 0.
0 0.
0
VD
054
1 So
ya b
ean
(dry
, exc
l oil)
0.
02
1.8
0.0
0.0
0.0
0.0
0.0
3.2
0.1
0.1
0.0
0.0
0.0
0.0
0.0
OR
054
1 So
ya b
ean
oil,
refi
ned
0.00
1 4.
3 0.
0 10
.6
0.0
2.0
0.0
1.4
0.0
19.5
0.
0 9.
2 0.
0 22
.0
0.0
VC
043
1 Sq
uash
, sum
mer
(=
cou
rget
te, z
ucch
ini)
3/
0.02
2.
4 0.
0 1.
5 0.
0 0.
0 0.
0 0.
0 0.
0 3.
8 0.
1 2.
2 0.
0 2.
5 0.
1
VO
044
7 Sw
eet c
orn
(cor
n-on
-the
-cob
) 0.
1 0.
2 0.
0 2.
4 0.
2 2.
2 0.
2 3.
3 0.
3 1.
7 0.
2 2.
8 0.
3 11
.2
1.1
VO
044
8 To
mat
o (e
xcl j
uice
, exc
l pas
te, e
xcl p
eele
d)
0.19
22
.8
4.3
4.1
0.8
12.3
2.
3 1.
8 0.
4 32
.8
6.2
0.4
0.1
27.3
5.
2
JF 0
448
Tom
ato
juic
e 0.
10
0.0
0.0
0.8
0.1
0.1
0.0
7.2
0.7
0.0
0.0
2.4
0.2
45.2
4.
5
-d
Tom
ato
past
e 0.
16
0.1
0.0
2.1
0.3
0.6
0.1
0.4
0.1
0.6
0.1
1.4
0.2
1.2
0.2
-d
Tom
ato,
pee
led
0.05
0.
2 0.
0 14
.5
0.7
0.2
0.0
0.0
0.0
0.3
0.0
0.8
0.0
1.2
0.0
VC
043
2 W
ater
mel
on
0.02
39
.3
0.8
14.0
0.
3 2.
5 0.
1 13
.6
0.3
8.4
0.2
14.5
0.
3 13
.6
0.3
GC
065
4 W
heat
(ex
cl b
ulgu
r w
hole
mea
l, ex
cl f
lour
) 0.
05
0.0
0.0
0.9
0.0
0.0
0.0
0.0
0.0
0.1
0.0
0.0
0.0
0.1
0.0
- W
ine
4/
0.5
1.0
0.5
0.9
0.5
6.8
3.4
0.1
0.1
3.4
1.7
3.6
1.8
31.0
15
.5
To
tal i
ntak
e (µ
g/pe
rson
)=
21.0
31.3
12.6
9.6
24
.0
30
.0
87
.5
B
ody
wei
ght p
er r
egio
n (k
g bw
) =
55
60
60
60
60
55
60
A
DI (
µg/
pers
on)=
16
50
18
00
18
00
18
00
18
00
16
50
18
00
%
AD
I=
1.3%
1.7%
0.7%
0.5%
1.4%
1.8%
4.9%
R
ound
ed %
AD
I=
1%
2%
1%
1%
1%
2%
5%
1/ S
TM
R f
rom
the
199
7 JM
PR
; 2/
res
idue
fro
m t
he c
ontr
ibut
ion
of h
ops
in t
he b
eer
com
posi
tion
; 3/
Cod
ex M
RL
rec
omm
ende
d at
the
199
4 JM
PR
; 4/
PF
fro
m t
he 1
997
JMP
R a
ppli
ed t
o gr
ape
MR
L
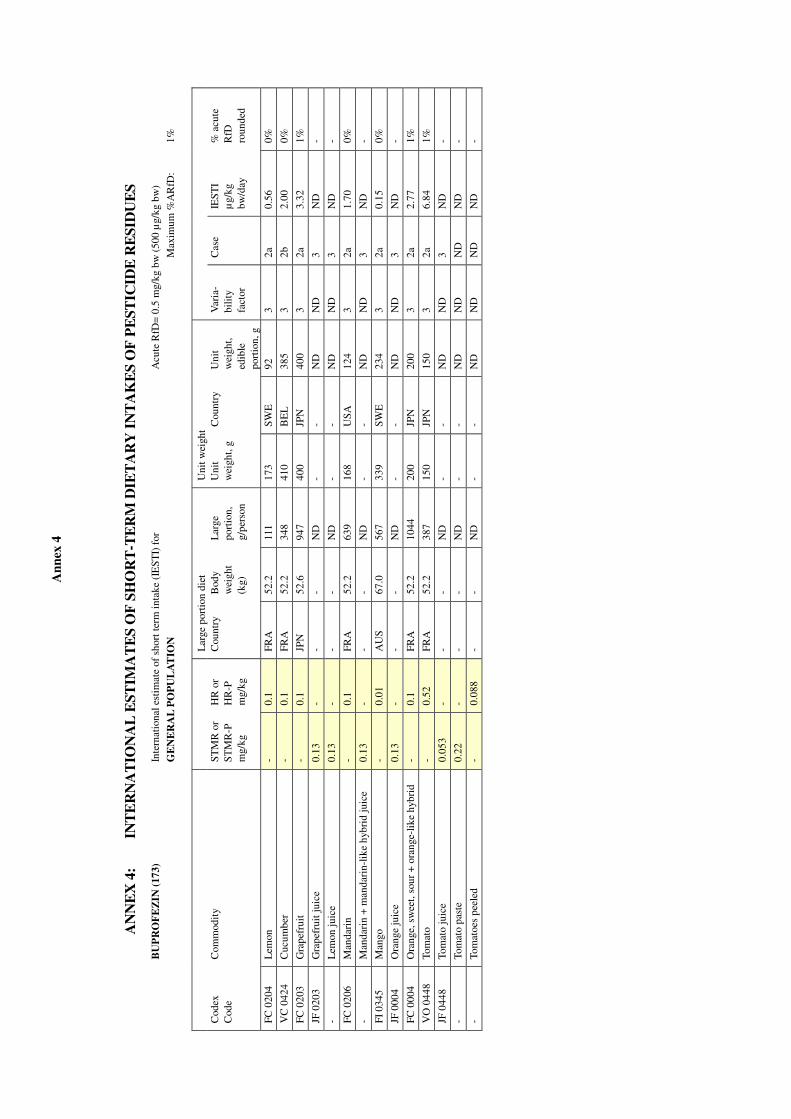
An
nex
4
AN
NE
X 4
: IN
TE
RN
AT
ION
AL
ES
TIM
AT
ES
OF
SH
OR
T-T
ER
M D
IET
AR
Y I
NT
AK
ES
OF
PE
ST
ICID
E R
ES
IDU
ES
B
UP
RO
FE
ZIN
(1
73
) In
tern
atio
nal e
stim
ate
of s
hort
term
inta
ke (
IEST
I) f
or
Acu
te R
fD=
0.5
mg/
kg b
w (
500
µg/
kg b
w)
GE
NE
RA
L P
OP
UL
AT
ION
M
axim
um %
AR
fD:
1%
Lar
ge p
orti
on d
iet
U
nit w
eigh
t
Cod
ex
Cod
e C
omm
odit
y
ST
MR
or
STM
R-P
m
g/kg
HR
or
HR
-P
mg/
kg
Cou
ntry
B
ody
wei
ght
(kg)
Lar
ge
port
ion,
g/
pers
on
Uni
t w
eigh
t, g
Cou
ntry
U
nit
wei
ght,
edib
le
port
ion,
g
Var
ia-
bilit
y fa
ctor
Cas
e IE
STI
µg/
kg
bw/d
ay
% a
cute
R
fD
roun
ded
FC 0
204
Lem
on
- 0.
1 FR
A
52.2
11
1 17
3 SW
E
92
3 2a
0.
56
0%
VC
042
4 C
ucum
ber
- 0.
1 FR
A
52.2
34
8 41
0 B
EL
38
5 3
2b
2.00
0%
FC 0
203
Gra
pefr
uit
- 0.
1 JP
N
52.6
94
7 40
0 JP
N
400
3 2a
3.
32
1%
JF 0
203
Gra
pefr
uit j
uice
0.
13
- -
- N
D
- -
ND
N
D
3 N
D
-
- L
emon
juic
e 0.
13
- -
- N
D
- -
ND
N
D
3 N
D
-
FC 0
206
Man
dari
n -
0.1
FRA
52
.2
639
168
USA
12
4 3
2a
1.70
0%
- M
anda
rin
+ m
anda
rin-
like
hybr
id ju
ice
0.13
-
- -
ND
-
- N
D
ND
3
ND
-
FI 0
345
Man
go
- 0.
01
AU
S 67
.0
567
339
SWE
23
4 3
2a
0.15
0%
JF 0
004
Ora
nge
juic
e 0.
13
- -
- N
D
- -
ND
N
D
3 N
D
-
FC 0
004
Ora
nge,
sw
eet,
sour
+ o
rang
e-lik
e hy
brid
-
0.1
FRA
52
.2
1044
20
0 JP
N
200
3 2a
2.
77
1%
VO
044
8 To
mat
o -
0.52
FR
A
52.2
38
7 15
0 JP
N
150
3 2a
6.
84
1%
JF 0
448
Tom
ato
juic
e 0.
053
- -
- N
D
- -
ND
N
D
3 N
D
-
- To
mat
o pa
ste
0.22
-
- -
ND
-
- N
D
ND
N
D
ND
-
- To
mat
oes
peel
ed
- 0.
088
- -
ND
-
- N
D
ND
N
D
ND
-

A
nn
ex 4
446
B
UP
RO
FE
ZIN
(1
73
) In
tern
atio
nal e
stim
ate
of s
hort
term
inta
ke (
IEST
I) f
or
A
cute
RfD
= 0
.5 m
g/kg
bw
(50
0 µ
g/kg
bw
)
CH
ILD
RE
N U
P T
O 6
YE
AR
S
M
axim
um %
AR
fD:
3%
Lar
ge p
orti
on d
iet
U
nit w
eigh
t
Cod
ex
Cod
e C
omm
odit
y ST
MR
or
STM
R-P
m
g/kg
HR
or
HR
-P
mg/
kg
Cou
ntry
B
ody
wei
ght
(kg)
Lar
ge
port
ion,
g/
pers
on
Uni
t w
eigh
t, g
Cou
ntry
U
nit
wei
ght,
edib
le
port
ion,
g
Var
ia-
bilit
y fa
ctor
Cas
e IE
STI
µg/
kg
bw/d
ay
% a
cute
R
fD
roun
ded
FC 0
204
Lem
on
- 0.
1 JP
N
15.9
88
17
3 SW
E
92
3 2b
1.
67
0%
VC
042
4 C
ucum
ber
- 0.
1 N
LD
17
.0
162
410
BE
L
385
3 2b
2.
86
1%
FC 0
203
Gra
pefr
uit
- 0.
1 FR
A
18.9
40
5 40
0 JP
N
400
3 2a
6.
38
1%
JF 0
203
Gra
pefr
uit j
uice
0.
13
- -
- N
D
- -
ND
N
D
3 N
D
-
- L
emon
juic
e 0.
13
- -
- N
D
- -
ND
N
D
3 N
D
-
FC 0
206
Man
dari
n -
0.1
JPN
15
.9
353
168
USA
12
4 3
2a
3.79
1%
- M
anda
rin
+ m
anda
rin-
like
hybr
id ju
ice
0.13
-
- -
ND
-
- N
D
ND
3
ND
-
FI 0
345
Man
go
- 0.
01
Tha
i 17
.1
191
339
SWE
23
4 3
2b
0.34
0%
JF 0
004
Ora
nge
juic
e 0.
13
- -
- N
D
- -
ND
N
D
3 N
D
-
FC 0
004
Ora
nge,
sw
eet,
sour
+ o
rang
e-lik
e hy
brid
-
0.1
UN
K
14.5
49
5 20
0 JP
N
200
3 2a
6.
17
1%
VO
044
8 To
mat
o -
0.52
FR
A
18.9
21
5 15
0 JP
N
150
3 2a
14
.18
3%
JF 0
448
Tom
ato
juic
e 0.
053
- -
- N
D
- -
ND
N
D
3 N
D
-
- To
mat
o pa
ste
0.22
-
- -
ND
-
- N
D
ND
N
D
ND
-
- To
mat
oes
peel
ed
- 0.
088
- -
ND
-
- N
D
ND
N
D
ND
-
C
AR
AB
AR
YL
(0
08
) In
tern
atio
nal e
stim
ate
of s
hort
term
inta
ke (
IEST
I) f
or
A
RfD
= 0
.2 m
g/kg
bw
(20
0 µ
g/kg
bw
)
GE
NE
RA
L P
OP
UL
AT
ION
M
axim
um %
AR
fD:
20%
Lar
ge p
orti
on d
iet
U
nit w
eigh
t
Cod
ex
Cod
e C
omm
odit
y
ST
MR
or
STM
R-P
m
g/kg
HR
or
HR
-P
mg/
kg
Cou
ntry
B
ody
wei
ght
(kg)
Lar
ge
port
ion,
g/
pers
on
Uni
t w
eigh
t, g
Cou
ntry
U
nit
wei
ght,
edib
le
port
ion,
g
Var
ia-
bilit
y fa
ctor
Cas
e IE
STI µ
g/kg
bw
/day
%
AR
fD
roun
ded
FC 0
203
Gra
pefr
uit
- 1.
16
JPN
52
.6
947
400
JPN
40
0 3
2a
38.5
2 20
%
FC 0
204
Lem
on
- 1.
16
FRA
52
.2
111
100
FRA
64
3
2a
5.32
3%
FC 0
206
Man
dari
n -
1.16
FR
A
52.2
63
9 16
8 U
SA
124
3 2a
19
.72
10%
FC 0
004
Ora
nge,
sw
eet,
sour
+ o
rang
e-lik
e hy
brid
-
1.16
FR
A
52.2
10
44
229
UN
K
160
3 2a
30
.32
20%

An
nex
4
447
CA
RB
AR
YL
(0
08
) In
tern
atio
nal e
stim
ate
of s
hort
term
inta
ke (
IEST
I) f
or
A
RfD
= 0
.2 m
g/kg
bw
(20
0 µ
g/kg
bw
)
CH
ILD
RE
N U
P T
O 6
YE
AR
S
M
axim
um %
AR
fD:
40%
Lar
ge p
orti
on d
iet
U
nit w
eigh
t
Cod
ex
Cod
e C
omm
odit
y ST
MR
or
STM
R-P
m
g/kg
HR
or
HR
-P
mg/
kg
Cou
ntry
B
ody
wei
ght
(kg)
Lar
ge
port
ion,
g/
pers
on
Uni
t w
eigh
t, g
Cou
ntry
U
nit
wei
ght,
edib
le
port
ion,
g
Var
ia-
bilit
y fa
ctor
Cas
e IE
STI µ
g/kg
bw
/day
%
AR
fD
roun
ded
FC 0
203
Gra
pefr
uit
- 1.
16
FRA
18
.9
405
400
JPN
40
0 3
2a
73.9
6 40
%
FC 0
204
Lem
on
- 1.
16
JPN
15
.9
88
173
SWE
92
3
2b
19.3
5 10
%
FC 0
206
Man
dari
n -
1.16
JP
N
15.9
35
3 70
JP
N
70
3 2a
35
.99
20%
FC 0
004
Ora
nge,
sw
eet,
sour
+ o
rang
e-lik
e hy
brid
-
1.16
U
NK
14
.5
495
200
JPN
20
0 3
2a
71.6
0 40
%
C
AR
BO
FU
RA
N (
96
) In
tern
atio
nal e
stim
ate
of s
hort
term
inta
ke (
IEST
I) f
or
A
cute
RfD
= 0
.001
mg/
kg b
w (
1 µ
g/kg
bw
)
GE
NE
RA
L P
OP
UL
AT
ION
M
axim
um %
AR
fD:
510%
Lar
ge p
orti
on d
iet
U
nit w
eigh
t
Cod
ex
Cod
e C
omm
odit
y
ST
MR
or
STM
R-P
m
g/kg
HR
or
HR
-P
mg/
kg
Cou
ntry
B
ody
wei
ght
(kg)
Lar
ge
port
ion,
g/
pers
on
Uni
t w
eigh
t, g
Cou
ntry
U
nit
wei
ght,
edib
le
port
ion,
g
Var
ia-
bilit
y fa
ctor
Cas
e IE
STI µ
g/kg
bw
/day
%
acu
te
RfD
ro
unde
d
FI 0
327
Ban
ana
- 0.
1 FR
A
52.2
71
4 70
8 U
SA
481
3 2a
3.
21
320%
MF
0812
C
attle
fat
-
0.05
U
SA
65.0
60
-
- N
D
ND
1
0.05
5%
SB 0
716
Cof
fee
bean
s 0.
005
- FR
A
52.2
11
7 -
- N
D
ND
3
0.01
1%
VC
042
4 C
ucum
ber
- 0.
29
FRA
52
.2
348
301
USA
28
6 3
2a
5.11
51
0%
MO
009
6 E
dibl
e of
fal o
f ca
ttle
, goa
ts, h
orse
s, p
igs
&
shee
p -
0.05
FR
A
52.2
32
7 -
- N
D
ND
1
0.31
30
%
MF
0814
G
oat f
at
- 0.
05
USA
65
.0
18
- -
ND
N
D
1 0.
01
1%
MF
0816
H
orse
fat
-
0.05
-
- N
D
- -
ND
N
D
1 N
D
-
GC
064
5 M
aize
0
- FR
A
52.2
21
2 -
- N
D
ND
3
0.00
0%
FC 0
206
Man
dari
n -
0.05
FR
A
52.2
63
9 16
8 U
SA
124
3 2a
0.
85
90%
MM
009
6 M
eat o
f ca
ttle
, goa
ts, h
orse
s, p
igs
& s
heep
-
0.05
A
US
67.0
52
0 -
- N
D
ND
1
0.39
40
%
VC
004
6 M
elon
s, e
xcep
t wat
erm
elon
, sta
ted
as
cant
alou
pe, V
C 4
199
- 0.
13
USA
65
.0
606
552
USA
27
6 3
2a
2.32
23
0%
ML
0106
M
ilks
0.05
-
USA
65
.0
2466
-
- N
D
ND
3
1.90
19
0%
FC 0
004
Ora
nge,
sw
eet,
sour
+ o
rang
e-lik
e hy
brid
-
0.05
FR
A
52.2
10
44
251
SWE
17
8 3
2a
1.34
13
0%
MF
0818
Pi
g fa
t -
0.05
A
US
67.0
14
4 -
- N
D
ND
1
0.11
10
%

A
nn
ex 4
448
CA
RB
OF
UR
AN
(9
6)
Inte
rnat
iona
l est
imat
e of
sho
rt te
rm in
take
(IE
STI)
for
Acu
te R
fD=
0.0
01 m
g/kg
bw
(1
µg/
kg b
w)
GE
NE
RA
L P
OP
UL
AT
ION
M
axim
um %
AR
fD:
510%
Lar
ge p
orti
on d
iet
U
nit w
eigh
t
Cod
ex
Cod
e C
omm
odit
y
ST
MR
or
STM
R-P
m
g/kg
HR
or
HR
-P
mg/
kg
Cou
ntry
B
ody
wei
ght
(kg)
Lar
ge
port
ion,
g/
pers
on
Uni
t w
eigh
t, g
Cou
ntry
U
nit
wei
ght,
edib
le
port
ion,
g
Var
ia-
bilit
y fa
ctor
Cas
e IE
STI µ
g/kg
bw
/day
%
acu
te
RfD
ro
unde
d
VR
058
9 Po
tato
-
0.11
FR
A
52.2
63
9 12
2 U
SA
99
3 2a
1.
76
180%
SO 0
495
Rap
e se
ed
0.05
-
- -
ND
-
- N
D
ND
3
ND
-
CM
064
9 R
ice,
hus
ked
0.02
5 -
JPN
52
.6
319
- -
ND
N
D
3 0.
15
20%
MF
0822
Sh
eep
fat
- 0.
05
USA
65
.0
54
- -
ND
N
D
1 0.
04
4%
VC
043
1 Sq
uash
, sum
mer
(=
cou
rget
te)
- 0.
26
FRA
52
.2
351
196
USA
18
6 3
2a
3.60
36
0%
GS
0659
Su
gar
cane
-
0.06
T
hai
53.5
36
6 -
- N
D
ND
N
D
ND
-
SO 0
702
Sunf
low
er s
eed
0.1
- U
SA
65.0
19
3 -
- N
D
ND
3
0.30
30
%
VO
044
7 Sw
eet c
orn
(cor
n-on
-the
-cob
) -
0.08
T
hai
53.5
38
3 20
0 JP
N
200
3 2a
1.
17
120%
C
AR
BO
FU
RA
N (
96
) In
tern
atio
nal e
stim
ate
of s
hort
term
inta
ke (
IEST
I) f
or
A
cute
RfD
= 0
.001
mg/
kg b
w (
1 µ
g/kg
bw
)
CH
ILD
RE
N U
P T
O 6
YE
AR
S
M
axim
um %
AR
fD:
830%
Lar
ge p
orti
on d
iet
U
nit w
eigh
t
Cod
ex
Cod
e C
omm
odit
y ST
MR
or
STM
R-P
m
g/kg
HR
or
HR
-P
mg/
kg
Cou
ntry
B
ody
wei
ght
(kg)
Lar
ge
port
ion,
g/
pers
on
Uni
t w
eigh
t, g
Cou
ntry
U
nit
wei
ght,
edib
le
port
ion,
g
Var
ia-
bilit
y fa
ctor
Cas
e IE
STI µ
g/kg
bw
/day
%
acu
te
RfD
ro
unde
d
FI 0
327
Ban
ana
- 0.
1 FR
A
18.9
47
7 70
8 U
SA
481
3 2b
7.
57
760%
MF
0812
C
attle
fat
-
0.05
U
SA
15.0
27
-
- N
D
ND
1
0.09
9%
SB 0
716
Cof
fee
bean
s 0.
005
- FR
A
18.9
70
-
- N
D
ND
3
0.02
2%
VC
042
4 C
ucum
ber
- 0.
29
NL
D
17.0
16
2 30
1 U
SA
286
3 2b
8.
29
830%
MO
009
6 E
dibl
e of
fal o
f ca
ttle
, goa
ts, h
orse
s, p
igs
&
shee
p -
0.05
FR
A
18.9
86
-
- N
D
ND
1
0.23
20
%
MF
0814
G
oat f
at
- 0.
05
USA
15
.0
3 -
- N
D
ND
1
0.01
1%
MF
0816
H
orse
fat
-
0.05
-
- N
D
- -
ND
N
D
1 N
D
-
GC
064
5 M
aize
0
- FR
A
18.9
11
7 -
- N
D
ND
3
0.00
0%
FC 0
206
Man
dari
n -
0.05
JP
N
15.9
35
3 16
8 U
SA
124
3 2a
1.
89
190%
MM
009
6 M
eat o
f ca
ttle
, goa
ts, h
orse
s, p
igs
& s
heep
-
0.05
A
US
19.0
26
1 -
- N
D
ND
1
0.69
70
%
VC
004
6 M
elon
s, e
xcep
t wat
erm
elon
, sta
ted
as
cant
alou
pe, V
C 4
199
- 0.
13
USA
15
.0
270
552
USA
27
6 3
2b
7.01
70
0%
ML
0106
M
ilks
0.05
-
USA
15
.0
1286
-
- N
D
ND
3
4.29
43
0%
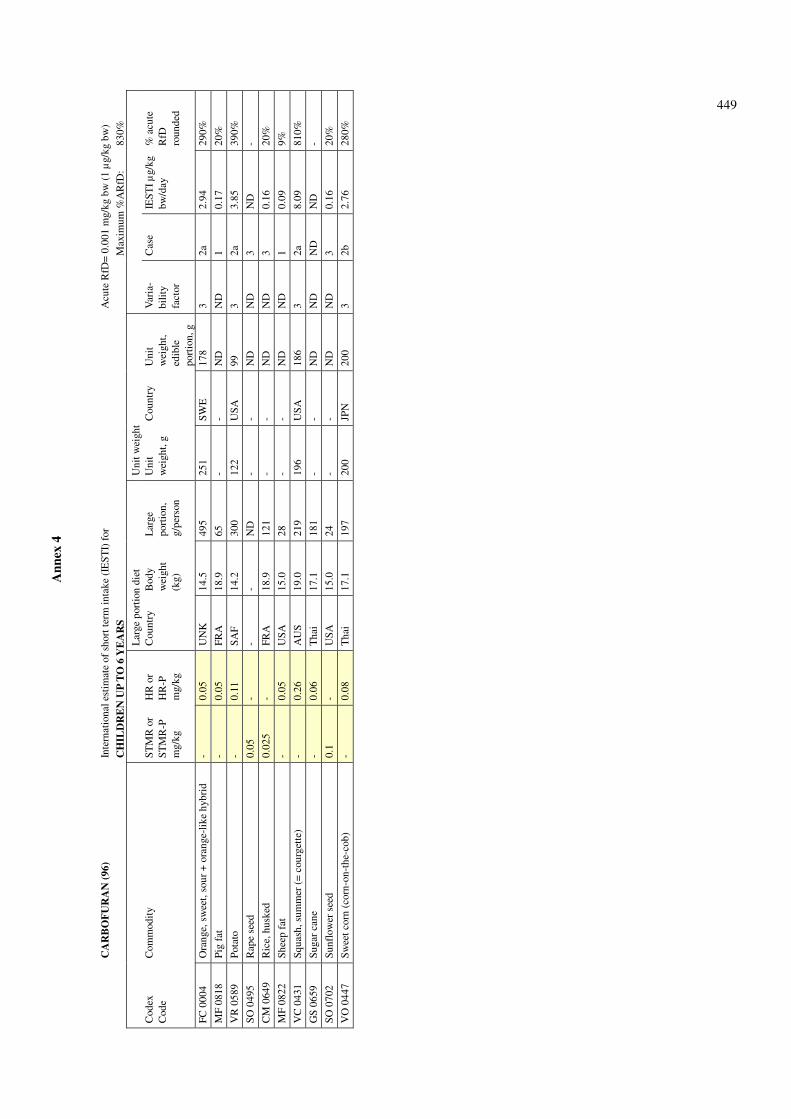
An
nex
4
449
CA
RB
OF
UR
AN
(9
6)
Inte
rnat
iona
l est
imat
e of
sho
rt te
rm in
take
(IE
STI)
for
Acu
te R
fD=
0.0
01 m
g/kg
bw
(1
µg/
kg b
w)
CH
ILD
RE
N U
P T
O 6
YE
AR
S
M
axim
um %
AR
fD:
830%
Lar
ge p
orti
on d
iet
U
nit w
eigh
t
Cod
ex
Cod
e C
omm
odit
y ST
MR
or
STM
R-P
m
g/kg
HR
or
HR
-P
mg/
kg
Cou
ntry
B
ody
wei
ght
(kg)
Lar
ge
port
ion,
g/
pers
on
Uni
t w
eigh
t, g
Cou
ntry
U
nit
wei
ght,
edib
le
port
ion,
g
Var
ia-
bilit
y fa
ctor
Cas
e IE
STI µ
g/kg
bw
/day
%
acu
te
RfD
ro
unde
d
FC 0
004
Ora
nge,
sw
eet,
sour
+ o
rang
e-lik
e hy
brid
-
0.05
U
NK
14
.5
495
251
SWE
17
8 3
2a
2.94
29
0%
MF
0818
Pi
g fa
t -
0.05
FR
A
18.9
65
-
- N
D
ND
1
0.17
20
%
VR
058
9 Po
tato
-
0.11
SA
F 14
.2
300
122
USA
99
3
2a
3.85
39
0%
SO 0
495
Rap
e se
ed
0.05
-
- -
ND
-
- N
D
ND
3
ND
-
CM
064
9 R
ice,
hus
ked
0.02
5 -
FRA
18
.9
121
- -
ND
N
D
3 0.
16
20%
MF
0822
Sh
eep
fat
- 0.
05
USA
15
.0
28
- -
ND
N
D
1 0.
09
9%
VC
043
1 Sq
uash
, sum
mer
(=
cou
rget
te)
- 0.
26
AU
S 19
.0
219
196
USA
18
6 3
2a
8.09
81
0%
GS
0659
Su
gar
cane
-
0.06
T
hai
17.1
18
1 -
- N
D
ND
N
D
ND
-
SO 0
702
Sunf
low
er s
eed
0.1
- U
SA
15.0
24
-
- N
D
ND
3
0.16
20
%
VO
044
7 Sw
eet c
orn
(cor
n-on
-the
-cob
) -
0.08
T
hai
17.1
19
7 20
0 JP
N
200
3 2b
2.
76
280%
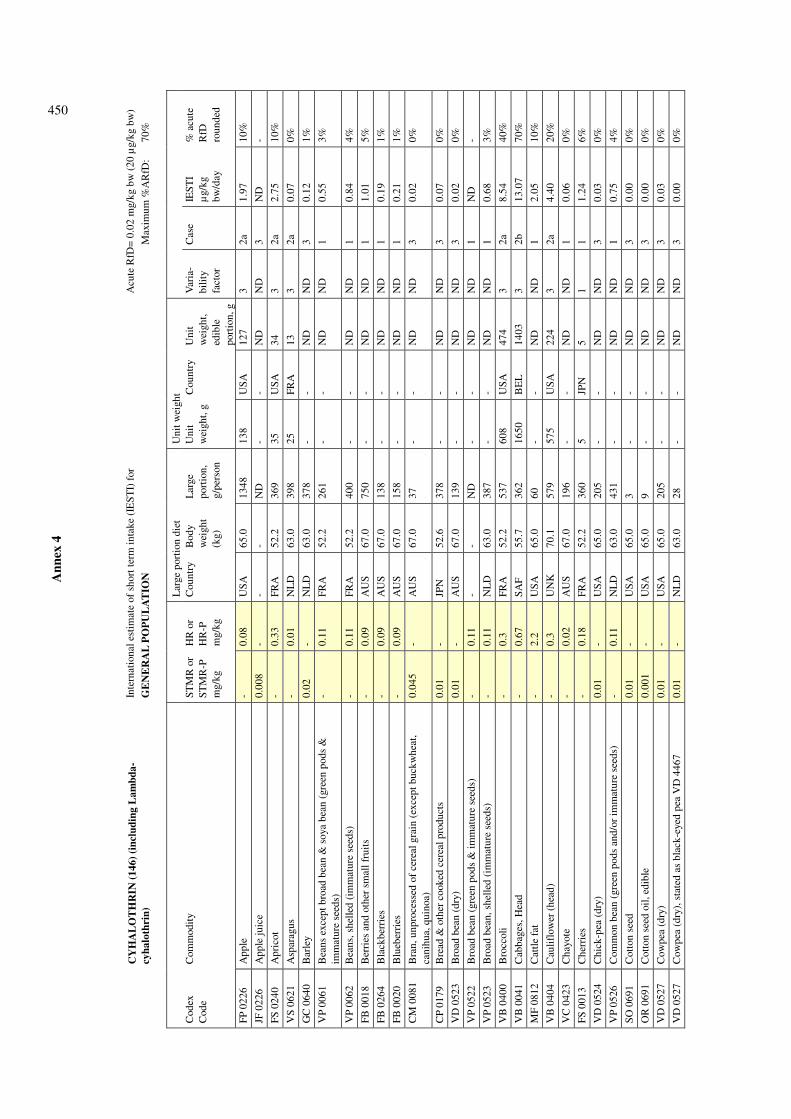
A
nn
ex 4
450
In
tern
atio
nal e
stim
ate
of s
hort
term
inta
ke (
IEST
I) f
or
A
cute
RfD
= 0
.02
mg/
kg b
w (
20 µ
g/kg
bw
)
C
YH
AL
OT
HR
IN (
14
6)
(in
clu
din
g L
am
bd
a-
cyh
alo
thri
n)
GE
NE
RA
L P
OP
UL
AT
ION
M
axim
um %
AR
fD:
70%
Lar
ge p
orti
on d
iet
U
nit w
eigh
t
Cod
ex
Cod
e C
omm
odit
y
ST
MR
or
STM
R-P
m
g/kg
HR
or
HR
-P
mg/
kg
Cou
ntry
B
ody
wei
ght
(kg)
Lar
ge
port
ion,
g/
pers
on
Uni
t w
eigh
t, g
Cou
ntry
U
nit
wei
ght,
edib
le
port
ion,
g
Var
ia-
bilit
y fa
ctor
Cas
e IE
STI
µg/
kg
bw/d
ay
% a
cute
R
fD
roun
ded
FP 0
226
App
le
- 0.
08
USA
65
.0
1348
13
8 U
SA
127
3 2a
1.
97
10%
JF 0
226
App
le ju
ice
0.00
8 -
- -
ND
-
- N
D
ND
3
ND
-
FS 0
240
Apr
icot
-
0.33
FR
A
52.2
36
9 35
U
SA
34
3 2a
2.
75
10%
VS
0621
A
spar
agus
-
0.01
N
LD
63
.0
398
25
FRA
13
3
2a
0.07
0%
GC
064
0 B
arle
y 0.
02
- N
LD
63
.0
378
- -
ND
N
D
3 0.
12
1%
VP
0061
B
eans
exc
ept b
road
bea
n &
soy
a be
an (
gree
n po
ds &
im
mat
ure
seed
s)
- 0.
11
FRA
52
.2
261
- -
ND
N
D
1 0.
55
3%
VP
0062
B
eans
, she
lled
(im
mat
ure
seed
s)
- 0.
11
FRA
52
.2
400
- -
ND
N
D
1 0.
84
4%
FB 0
018
Ber
ries
and
oth
er s
mal
l fru
its
- 0.
09
AU
S 67
.0
750
- -
ND
N
D
1 1.
01
5%
FB 0
264
Bla
ckbe
rrie
s -
0.09
A
US
67.0
13
8 -
- N
D
ND
1
0.19
1%
FB 0
020
Blu
eber
ries
-
0.09
A
US
67.0
15
8 -
- N
D
ND
1
0.21
1%
CM
008
1 B
ran,
unp
roce
ssed
of
cere
al g
rain
(ex
cept
buc
kwhe
at,
cani
hua,
qui
noa)
0.
045
- A
US
67.0
37
-
- N
D
ND
3
0.02
0%
CP
0179
B
read
& o
ther
coo
ked
cere
al p
rodu
cts
0.01
-
JPN
52
.6
378
- -
ND
N
D
3 0.
07
0%
VD
052
3 B
road
bea
n (d
ry)
0.01
-
AU
S 67
.0
139
- -
ND
N
D
3 0.
02
0%
VP
0522
B
road
bea
n (g
reen
pod
s &
imm
atur
e se
eds)
-
0.11
-
- N
D
- -
ND
N
D
1 N
D
-
VP
0523
B
road
bea
n, s
helle
d (i
mm
atur
e se
eds)
-
0.11
N
LD
63
.0
387
- -
ND
N
D
1 0.
68
3%
VB
040
0 B
rocc
oli
- 0.
3 FR
A
52.2
53
7 60
8 U
SA
474
3 2a
8.
54
40%
VB
004
1 C
abba
ges,
Hea
d -
0.67
SA
F 55
.7
362
1650
B
EL
14
03
3 2b
13
.07
70%
MF
0812
C
attle
fat
-
2.2
USA
65
.0
60
- -
ND
N
D
1 2.
05
10%
VB
040
4 C
aulif
low
er (
head
) -
0.3
UN
K
70.1
57
9 57
5 U
SA
224
3 2a
4.
40
20%
VC
042
3 C
hayo
te
- 0.
02
AU
S 67
.0
196
- -
ND
N
D
1 0.
06
0%
FS 0
013
Che
rrie
s -
0.18
FR
A
52.2
36
0 5
JPN
5
1 1
1.24
6%
VD
052
4 C
hick
-pea
(dr
y)
0.01
-
USA
65
.0
205
- -
ND
N
D
3 0.
03
0%
VP
0526
C
omm
on b
ean
(gre
en p
ods
and/
or im
mat
ure
seed
s)
- 0.
11
NL
D
63.0
43
1 -
- N
D
ND
1
0.75
4%
SO 0
691
Cot
ton
seed
0.
01
- U
SA
65.0
3
- -
ND
N
D
3 0.
00
0%
OR
069
1 C
otto
n se
ed o
il, e
dibl
e 0.
001
- U
SA
65.0
9
- -
ND
N
D
3 0.
00
0%
VD
052
7 C
owpe
a (d
ry)
0.01
-
USA
65
.0
205
- -
ND
N
D
3 0.
03
0%
VD
052
7 C
owpe
a (d
ry),
sta
ted
as b
lack
-eye
d pe
a V
D 4
467
0.01
-
NL
D
63.0
28
-
- N
D
ND
3
0.00
0%

An
nex
4
451
Inte
rnat
iona
l est
imat
e of
sho
rt te
rm in
take
(IE
STI)
for
Acu
te R
fD=
0.0
2 m
g/kg
bw
(20
µg/
kg b
w)
C
YH
AL
OT
HR
IN (
14
6)
(in
clu
din
g L
am
bd
a-
cyh
alo
thri
n)
GE
NE
RA
L P
OP
UL
AT
ION
M
axim
um %
AR
fD:
70%
Lar
ge p
orti
on d
iet
U
nit w
eigh
t
Cod
ex
Cod
e C
omm
odit
y
ST
MR
or
STM
R-P
m
g/kg
HR
or
HR
-P
mg/
kg
Cou
ntry
B
ody
wei
ght
(kg)
Lar
ge
port
ion,
g/
pers
on
Uni
t w
eigh
t, g
Cou
ntry
U
nit
wei
ght,
edib
le
port
ion,
g
Var
ia-
bilit
y fa
ctor
Cas
e IE
STI
µg/
kg
bw/d
ay
% a
cute
R
fD
roun
ded
FB 0
265
Cra
nber
ries
-
0.09
U
SA
65.0
22
9 -
- N
D
ND
1
0.32
2%
VC
042
4 C
ucum
ber
- 0.
02
FRA
52
.2
348
400
FRA
36
0 3
2b
0.40
2%
FB 0
021
Cur
rant
s, r
ed, b
lack
, whi
te
- 0.
09
FRA
52
.2
163
- -
ND
N
D
1 0.
28
1%
FB 0
266
Dew
berr
ies,
incl
boy
sen-
& lo
ganb
erry
-
0.09
A
US
67.0
15
2 -
- N
D
ND
1
0.20
1%
VO
044
0 E
gg p
lant
-
0.18
A
US
67.0
48
7 54
8 U
SA
444
3 2a
3.
69
20%
FB 0
267
Eld
erbe
rrie
s -
0.09
N
LD
63
.0
21
- -
ND
N
D
1 0.
03
0%
VA
038
0 Fe
nnel
, bul
b -
0.11
FR
A
52.2
40
1 23
4 U
SA
218
3 2a
1.
76
9%
VD
056
1 Fi
eld
pea
(dry
) 0.
01
- FR
A
52.2
35
6 -
- N
D
ND
3
0.07
0%
VD
056
1 Fi
eld
pea
(dry
), s
tate
d as
pea
(dr
y), V
D 4
511
0.01
-
NL
D
63.0
25
2 -
- N
D
ND
3
0.04
0%
VP
0528
G
arde
n pe
a (g
reen
pod
s &
imm
atur
e se
eds)
-
0.11
U
SA
65.0
24
4 -
- N
D
ND
1
0.41
2%
VP
0529
G
arde
n pe
a, s
helle
d (i
mm
atur
e se
eds)
-
0.11
N
LD
63
.0
301
- -
ND
N
D
1 0.
52
3%
VA
038
1 G
arlic
-
0.11
T
hai
52.2
33
-
- N
D
ND
1
0.07
0%
VC
042
5 G
herk
in
- 0.
02
NL
D
63.0
96
15
FR
A
15
1 1
0.03
0%
FB 0
268
Goo
sebe
rrie
s -
0.09
-
- N
D
- -
ND
N
D
1 N
D
-
FB 0
269
Gra
pe (
excl
win
e)
- 0.
09
AU
S 67
.0
513
125
FRA
11
8 3
1 0.
69
3%
JF 0
269
Gra
pe ju
ice
0.01
-
FRA
52
.2
696
- -
ND
N
D
3 0.
13
1%
FC 0
203
Gra
pefr
uit
- 0.
01
JPN
52
.6
947
400
JPN
40
0 3
2a
0.33
2%
DF
0269
G
rape
s, d
ried
(=
cur
rant
s, r
aisi
ns a
nd s
ulta
nas)
-
0.27
U
SA
65.0
70
-
- N
D
ND
1
0.29
1%
MO
009
8 K
idne
y of
cat
tle, g
oats
, pig
s an
d sh
eep
- 0.
09
USA
65
.0
788
- -
ND
N
D
1 1.
09
5%
VA
038
4 L
eek
- 0.
11
FRA
52
.2
177
100
FRA
50
3
2a
0.58
3%
FC 0
204
Lem
on
- 0.
01
FRA
52
.2
111
100
FRA
64
3
2a
0.05
0%
VD
053
3 L
enti
l (dr
y)
0.01
-
FRA
52
.2
614
- -
ND
N
D
3 0.
12
1%
VP
0534
L
ima
bean
(gr
een
pods
& im
mat
ure
seed
s)
- 0.
11
USA
65
.0
241
- -
ND
N
D
1 0.
41
2%
FC 0
205
Lim
e -
0.01
A
US
67.0
59
0 67
U
SA
56
3 2a
0.
10
1%
SO 0
693
Lin
seed
0.
01
- N
LD
63
.0
21
- -
ND
N
D
3 0.
00
0%
MO
009
9 L
iver
of
catt
le, g
oats
, pig
s an
d sh
eep
- 0.
02
USA
65
.0
380
- -
ND
N
D
1 0.
12
1%
VC
042
7 L
oofa
h, a
ngle
d (=
ang
led
gour
d)
- 0.
02
Tha
i 53
.5
215
- -
ND
N
D
1 0.
08
0%
FP 0
228
Loq
uat
- 0.
08
AU
S 67
.0
64
- -
ND
N
D
ND
N
D
-
GC
064
5 M
aize
0.
01
- FR
A
52.2
21
2 -
- N
D
ND
3
0.04
0%
FC 0
206
Man
dari
n -
0.01
FR
A
52.2
63
9 10
0 FR
A
72
3 2a
0.
15
1%

A
nn
ex 4
452
Inte
rnat
iona
l est
imat
e of
sho
rt te
rm in
take
(IE
STI)
for
Acu
te R
fD=
0.0
2 m
g/kg
bw
(20
µg/
kg b
w)
C
YH
AL
OT
HR
IN (
14
6)
(in
clu
din
g L
am
bd
a-
cyh
alo
thri
n)
GE
NE
RA
L P
OP
UL
AT
ION
M
axim
um %
AR
fD:
70%
Lar
ge p
orti
on d
iet
U
nit w
eigh
t
Cod
ex
Cod
e C
omm
odit
y
ST
MR
or
STM
R-P
m
g/kg
HR
or
HR
-P
mg/
kg
Cou
ntry
B
ody
wei
ght
(kg)
Lar
ge
port
ion,
g/
pers
on
Uni
t w
eigh
t, g
Cou
ntry
U
nit
wei
ght,
edib
le
port
ion,
g
Var
ia-
bilit
y fa
ctor
Cas
e IE
STI
µg/
kg
bw/d
ay
% a
cute
R
fD
roun
ded
FI 0
345
Man
go
- 0.
07
AU
S 67
.0
567
339
SWE
23
4 3
2a
1.08
5%
MM
009
5 M
eat f
rom
mam
mal
s ot
her
than
mar
ine
mam
mal
s: 2
0% a
s fa
t -
2.2
AU
S 67
.0
104
- -
ND
N
D
1 3.
42
20%
MM
009
5 M
eat f
rom
mam
mal
s ot
her
than
mar
ine
mam
mal
s: 8
0% a
s m
uscl
e -
0.1
AU
S 67
.0
417
- -
ND
N
D
1 0.
62
3%
VC
004
6 M
elon
s, e
xcep
t wat
erm
elon
-
0.02
FR
A
52.2
10
44
700
FRA
42
0 3
2a
0.72
4%
ML
0106
M
ilks
0.08
-
USA
65
.0
2466
-
- N
D
ND
3
3.04
20
%
VD
053
6 M
ung
bean
(dr
y)
0.01
-
Tha
i 53
.5
80
- -
ND
N
D
3 0.
02
0%
SO 0
090
Mus
tard
see
d, s
tate
d as
mus
tard
see
d SO
048
5 0.
01
- A
US
67.0
21
-
- N
D
ND
3
0.00
0%
FS 0
245
Nec
tari
ne
- 0.
33
FRA
52
.2
604
136
USA
12
5 3
2a
5.40
30
%
GC
064
7 O
ats
0.01
-
USA
65
.0
175
- -
ND
N
D
3 0.
03
0%
VO
044
2 O
kra
- 0.
18
USA
65
.0
235
10
JPN
10
1
1 0.
65
3%
FT 0
305
Oliv
e -
0.42
FR
A
52.2
11
6 -
- N
D
ND
1
0.93
5%
OR
030
5 O
live
oil,
refi
ned
0.07
7 -
FRA
52
.2
48
- -
ND
N
D
3 0.
07
0%
- O
live
oil,
resi
due
oil
0.09
1 -
- -
ND
-
- N
D
ND
3
ND
-
VA
038
5 O
nion
, Bul
b -
0.11
N
LD
63
.0
172
110
USA
10
0 3
2a
0.65
3%
VA
038
7 O
nion
, Wel
sh
- 0.
11
JPN
52
.6
99
100
JPN
10
0 3
2b
0.62
3%
FC 0
004
Ora
nge,
sw
eet,
sour
+ o
rang
e-lik
e hy
brid
-
0.01
FR
A
52.2
10
44
190
FRA
13
7 3
2a
0.25
1%
OR
124
0 Pa
lm k
erne
l oil,
edi
ble
0.01
-
FRA
52
.2
10
- -
ND
N
D
3 0.
00
0%
OR
069
6 Pa
lm o
il, e
dibl
e 0.
01
- N
LD
63
.0
7 -
- N
D
ND
3
0.00
0%
FS 0
247
Peac
h -
0.33
SA
F 55
.7
685
98
USA
85
3
2a
5.07
30
%
OR
069
7 Pe
anut
oil,
edi
ble
0.01
-
AU
S 67
.0
54
- -
ND
N
D
3 0.
01
0%
SO 0
697
Pean
ut, s
helle
d 0.
01
- FR
A
52.2
13
5 -
- N
D
ND
3
0.03
0%
SO 0
703
Pean
ut, w
hole
in s
hell
- 0.
15
SAF
55.7
14
4 -
- N
D
ND
1
0.39
2%
FP 0
230
Pear
-
0.08
FR
A
52.2
56
8 16
6 U
SA
151
3 2a
1.
33
7%
VD
007
2 Pe
as (
dry)
0.
01
- FR
A
52.2
35
6 -
- N
D
ND
3
0.07
0%
VP
0063
Pe
as (
gree
n po
ds &
imm
atur
e se
eds)
-
0.11
JP
N
52.6
63
-
- N
D
ND
1
0.13
1%
VP
0064
Pe
as, s
helle
d (i
mm
atur
e se
eds)
-
0.11
FR
A
52.2
43
5 -
- N
D
ND
1
0.92
5%
VO
044
4 Pe
pper
s, C
hilli
-
0.18
U
SA
65.0
90
45
U
SA
43
3 2a
0.
49
2%
VO
044
5 Pe
pper
s, s
wee
t (in
cl. p
im(i
)ent
o)
- 0.
18
FRA
52
.2
90
172
UN
K
160
3 2b
0.
93
5%
VD
053
7 Pi
geon
pea
0.
01
- -
- N
D
- -
ND
N
D
3 N
D
-

An
nex
4
453
Inte
rnat
iona
l est
imat
e of
sho
rt te
rm in
take
(IE
STI)
for
Acu
te R
fD=
0.0
2 m
g/kg
bw
(20
µg/
kg b
w)
C
YH
AL
OT
HR
IN (
14
6)
(in
clu
din
g L
am
bd
a-
cyh
alo
thri
n)
GE
NE
RA
L P
OP
UL
AT
ION
M
axim
um %
AR
fD:
70%
Lar
ge p
orti
on d
iet
U
nit w
eigh
t
Cod
ex
Cod
e C
omm
odit
y
ST
MR
or
STM
R-P
m
g/kg
HR
or
HR
-P
mg/
kg
Cou
ntry
B
ody
wei
ght
(kg)
Lar
ge
port
ion,
g/
pers
on
Uni
t w
eigh
t, g
Cou
ntry
U
nit
wei
ght,
edib
le
port
ion,
g
Var
ia-
bilit
y fa
ctor
Cas
e IE
STI
µg/
kg
bw/d
ay
% a
cute
R
fD
roun
ded
FS 0
014
Plum
(in
cl d
ried
) -
0.1
Tha
i 53
.5
480
66
USA
62
3
2a
1.13
6%
GC
065
6 Po
pcor
n 0.
01
- JP
N
52.6
17
5 -
- N
D
ND
3
0.03
0%
SO 0
698
Popp
y se
ed
0.01
-
AU
S 67
.0
9 -
- N
D
ND
3
0.00
0%
FP 0
231
Qui
nce
- 0.
08
AU
S 67
.0
175
92
USA
56
3
2a
0.34
2%
OR
049
5 R
ape
seed
oil,
edi
ble
0.01
-
AU
S 67
.0
65
- -
ND
N
D
3 0.
01
0%
FB 0
272
Ras
pber
ries
, red
, bla
ck
- 0.
09
FRA
52
.2
251
- -
ND
N
D
1 0.
43
2%
CM
120
6 R
ice
bran
, unp
roce
ssed
0.
065
- A
US
67.0
50
-
- N
D
ND
3
0.05
0%
CM
064
9 R
ice,
hus
ked
0.29
5 -
JPN
52
.6
319
- -
ND
N
D
3 1.
79
9%
CM
120
5 R
ice,
pol
ishe
d 0.
003
- T
hai
53.5
41
2 -
- N
D
ND
3
0.02
0%
VR
007
5 R
oot a
nd tu
ber
vege
tabl
es
- 0
- -
ND
-
- N
D
ND
N
D
ND
-
FB 0
273
R
ose
hips
-
0.09
N
LD
63
.0
25
- -
ND
N
D
1 0.
04
0%
GC
065
0 R
ye
0.01
-
FRA
52
.2
161
- -
ND
N
D
3 0.
03
0%
OR
069
9 Sa
fflo
wer
see
d oi
l, ed
ible
0.
01
- A
US
67.0
19
-
- N
D
ND
3
0.00
0%
SO 0
700
Sesa
me
seed
0.
01
- T
hai
53.5
24
-
- N
D
ND
3
0.00
0%
OR
070
0 Se
sam
e se
ed o
il, e
dibl
e 0.
01
- A
US
67.0
19
-
- N
D
ND
3
0.00
0%
FC 0
005
Shad
dock
or
pom
elo
+ s
hadd
ock-
like
hybr
id
- 0.
01
Tha
i 53
.5
554
210
FRA
12
6 3
2a
0.15
1%
VA
038
8 Sh
allo
t -
0.11
A
US
67.0
71
-
- N
D
ND
1
0.12
1%
VC
043
0 Sn
ake
gour
d -
0.02
T
hai
53.5
21
5 -
- N
D
ND
1
0.08
0%
VD
054
1 So
ya b
ean
(dry
) 0.
01
- JP
N
52.6
15
9 -
- N
D
ND
3
0.03
0%
VP
0541
So
ya b
ean
(im
mat
ure
seed
s)
- 0.
11
Tha
i 53
.5
129
- -
ND
N
D
1 0.
27
1%
OR
054
1 So
ya b
ean
oil,
refi
ned
0.01
-
USA
65
.0
98
- -
ND
N
D
3 0.
02
0%
VA
038
9 Sp
ring
oni
on
- 0.
11
Tha
i 53
.5
71
- -
ND
N
D
1 0.
15
1%
VC
043
1 Sq
uash
, sum
mer
(=
cou
rget
te)
- 0.
02
FRA
52
.2
351
300
FRA
27
0 3
2a
0.34
2%
FB 0
275
Stra
wbe
rry
- 0.
09
FRA
52
.2
531
14
FRA
13
1
1 0.
92
5%
GS
0659
Su
gar
cane
0.
03
- T
hai
53.5
36
6 -
- N
D
ND
3
0.21
1%
DM
065
9 Su
gar
cane
mol
asse
s 0.
001
- A
US
67.0
21
4 -
- N
D
ND
3
0.00
0%
SO 0
702
Sunf
low
er s
eed
0.01
-
USA
65
.0
193
- -
ND
N
D
3 0.
03
0%
OR
070
2 Su
nflo
wer
see
d oi
l, ed
ible
0.
01
- FR
A
52.2
54
-
- N
D
ND
3
0.01
0%
VO
044
7 Sw
eet c
orn
(cor
n-on
-the
-cob
) -
0.18
T
hai
53.5
38
3 21
5 U
NK
12
5 3
2a
2.13
10
%
VO
044
8 To
mat
o -
0.18
FR
A
52.2
38
7 10
5 FR
A
102
3 2a
2.
04
10%

A
nn
ex 4
454
Inte
rnat
iona
l est
imat
e of
sho
rt te
rm in
take
(IE
STI)
for
Acu
te R
fD=
0.0
2 m
g/kg
bw
(20
µg/
kg b
w)
C
YH
AL
OT
HR
IN (
14
6)
(in
clu
din
g L
am
bd
a-
cyh
alo
thri
n)
GE
NE
RA
L P
OP
UL
AT
ION
M
axim
um %
AR
fD:
70%
Lar
ge p
orti
on d
iet
U
nit w
eigh
t
Cod
ex
Cod
e C
omm
odit
y
ST
MR
or
STM
R-P
m
g/kg
HR
or
HR
-P
mg/
kg
Cou
ntry
B
ody
wei
ght
(kg)
Lar
ge
port
ion,
g/
pers
on
Uni
t w
eigh
t, g
Cou
ntry
U
nit
wei
ght,
edib
le
port
ion,
g
Var
ia-
bilit
y fa
ctor
Cas
e IE
STI
µg/
kg
bw/d
ay
% a
cute
R
fD
roun
ded
JF 0
448
Tom
ato
juic
e 0.
002
- -
- N
D
- -
ND
N
D
3 N
D
-
- To
mat
o pa
ste
0.00
7 -
- -
ND
-
- N
D
ND
N
D
ND
-
TN
008
5 T
ree
nuts
-
0.01
JP
N
52.6
10
7 -
- N
D
ND
1
0.00
0%
FB 0
019
Vac
cini
um b
erri
es (
incl
. Bea
rber
ry)
- 0.
09
- -
ND
-
- N
D
ND
1
ND
-
VC
043
2 W
ater
mel
on
- 0.
02
USA
65
.0
1939
45
18
USA
20
78
3 2b
1.
79
9%
GC
065
4 W
heat
0.
01
- FR
A
52.2
70
3 -
- N
D
ND
3
0.13
1%
CM
065
4 W
heat
bra
n, u
npro
cess
ed
0.04
5 -
USA
65
.0
80
- -
ND
N
D
3 0.
06
0%
- W
ine
0.01
-
FRA
52
.2
1006
-
- N
D
ND
3
0.19
1%
VC
043
3 W
inte
r sq
uash
(=
pum
pkin
), s
tate
d as
pum
pkin
, VC
042
9 -
0.02
SA
F 55
.7
1003
10
00
JPN
10
00
3 2a
1.
08
5%
VP
0544
Y
ard-
long
bea
ns (
gree
n po
ds &
imm
atur
e se
eds)
-
0.11
T
hai
53.5
13
9 -
- N
D
ND
1
0.28
1%

An
nex
4
455
In
tern
atio
nal e
stim
ate
of s
hort
term
inta
ke (
IEST
I) f
or
A
cute
RfD
= 0
.02
mg/
kg b
w (
20 µ
g/kg
bw
)
C
YH
AL
OT
HR
IN (
14
6)
(in
clu
din
g L
am
bd
a-
cyh
alo
thri
n)
CH
ILD
RE
N U
P T
O 6
YE
AR
S
M
axim
um %
AR
fD:
160%
Lar
ge p
orti
on d
iet
U
nit w
eigh
t
Cod
ex
Cod
e C
omm
odit
y ST
MR
or
STM
R-P
m
g/kg
HR
or
HR
-P
mg/
kg
Cou
ntry
B
ody
wei
ght
(kg)
Lar
ge
port
ion,
g/
pers
on
Uni
t w
eigh
t, g
Cou
ntry
U
nit
wei
ght,
edib
le
port
ion,
g
Var
ia-
bilit
y fa
ctor
Cas
e IE
STI
µg/
kg
bw/d
ay
% a
cute
R
fD
roun
ded
FC 0
204
Lem
on
- 0.
01
JPN
15
.9
88
100
FRA
64
3
2a
0.14
1%
FP 0
226
App
le
- 0.
08
USA
15
.0
679
138
USA
12
7 3
2a
4.97
20
%
JF 0
226
App
le ju
ice
0.00
8 -
- -
ND
-
- N
D
ND
3
ND
-
FS 0
240
Apr
icot
-
0.33
A
US
19.0
41
4 35
U
SA
34
3 2a
8.
36
40%
VS
0621
A
spar
agus
-
0.01
U
SA
15.0
17
8 25
FR
A
13
3 2a
0.
14
1%
GC
064
0 B
arle
y 0.
02
- A
US
19.0
14
-
- N
D
ND
3
0.01
0%
VP
0061
B
eans
exc
ept b
road
bea
n &
soy
a be
an (
gree
n po
ds &
im
mat
ure
seed
s)
- 0.
11
FRA
18
.9
215
- -
ND
N
D
1 1.
25
6%
VP
0062
B
eans
, she
lled
(im
mat
ure
seed
s)
- 0.
11
FRA
18
.9
220
- -
ND
N
D
1 1.
28
6%
FB 0
018
Ber
ries
and
oth
er s
mal
l fru
its
- 0.
09
AU
S 19
.0
221
- -
ND
N
D
1 1.
05
5%
FB 0
264
Bla
ckbe
rrie
s -
0.09
FR
A
18.9
50
-
- N
D
ND
1
0.24
1%
FB 0
020
Blu
eber
ries
-
0.09
U
SA
15.0
21
-
- N
D
ND
1
0.13
1%
CM
008
1 B
ran,
unp
roce
ssed
of
cere
al g
rain
(ex
cept
buc
kwhe
at,
cani
hua,
qui
noa)
0.
045
- A
US
19.0
13
-
- N
D
ND
3
0.03
0%
CP
0179
B
read
& o
ther
coo
ked
cere
al p
rodu
cts
0.01
-
JPN
15
.9
227
- -
ND
N
D
3 0.
14
1%
VD
052
3 B
road
bea
n (d
ry)
0.01
-
AU
S 19
.0
32
- -
ND
N
D
3 0.
02
0%
VP
0522
B
road
bea
n (g
reen
pod
s &
imm
atur
e se
eds)
-
0.11
-
- N
D
- -
ND
N
D
1 N
D
-
VP
0523
B
road
bea
n, s
helle
d (i
mm
atur
e se
eds)
-
0.11
-
- N
D
- -
ND
N
D
1 N
D
-
VB
040
0 B
rocc
oli
- 0.
3 FR
A
18.9
25
4 60
8 U
SA
474
3 2b
12
.11
60%
VB
004
1 C
abba
ges,
Hea
d -
0.67
SA
F 14
.2
220
1650
B
EL
14
03
3 2b
31
.16
160%
MF
0812
C
attle
fat
-
2.2
USA
15
.0
27
- -
ND
N
D
1 3.
96
20%
VB
040
4 C
aulif
low
er (
head
) -
0.3
NL
D
17.0
20
9 57
5 U
SA
224
3 2b
11
.08
60%
VC
042
3 C
hayo
te
- 0.
02
AU
S 19
.0
105
- -
ND
N
D
1 0.
11
1%
FS 0
013
Che
rrie
s -
0.18
A
US
19.0
25
0 5
JPN
5
1 1
2.37
10
%
VD
052
4 C
hick
-pea
(dr
y)
0.01
-
USA
15
.0
34
- -
ND
N
D
3 0.
02
0%
VP
0526
C
omm
on b
ean
(gre
en p
ods
and/
or im
mat
ure
seed
s)
- 0.
11
NL
D
17.0
18
4 -
- N
D
ND
1
1.19
6%
SO 0
691
Cot
ton
seed
0.
01
- U
SA
15.0
1
- -
ND
N
D
3 0.
00
0%
OR
069
1 C
otto
n se
ed o
il, e
dibl
e 0.
001
- U
SA
15.0
6
- -
ND
N
D
3 0.
00
0%
VD
052
7 C
owpe
a (d
ry)
0.01
-
USA
15
.0
43
- -
ND
N
D
3 0.
03
0%

A
nn
ex 4
456
Inte
rnat
iona
l est
imat
e of
sho
rt te
rm in
take
(IE
STI)
for
Acu
te R
fD=
0.0
2 m
g/kg
bw
(20
µg/
kg b
w)
C
YH
AL
OT
HR
IN (
14
6)
(in
clu
din
g L
am
bd
a-
cyh
alo
thri
n)
CH
ILD
RE
N U
P T
O 6
YE
AR
S
M
axim
um %
AR
fD:
160%
Lar
ge p
orti
on d
iet
U
nit w
eigh
t
Cod
ex
Cod
e C
omm
odit
y ST
MR
or
STM
R-P
m
g/kg
HR
or
HR
-P
mg/
kg
Cou
ntry
B
ody
wei
ght
(kg)
Lar
ge
port
ion,
g/
pers
on
Uni
t w
eigh
t, g
Cou
ntry
U
nit
wei
ght,
edib
le
port
ion,
g
Var
ia-
bilit
y fa
ctor
Cas
e IE
STI
µg/
kg
bw/d
ay
% a
cute
R
fD
roun
ded
VD
052
7 C
owpe
a (d
ry),
sta
ted
as b
lack
-eye
d pe
a V
D 4
467
0.01
-
NL
D
17.0
28
-
- N
D
ND
3
0.02
0%
FB 0
265
Cra
nber
ries
-
0.09
U
SA
15.0
10
2 -
- N
D
ND
1
0.61
3%
VC
042
4 C
ucum
ber
- 0.
02
NL
D
17.0
16
2 40
0 FR
A
360
3 2b
0.
57
3%
FB 0
021
Cur
rant
s, r
ed, b
lack
, whi
te
- 0.
09
AU
S 19
.0
584
- -
ND
N
D
1 2.
77
10%
FB 0
266
Dew
berr
ies,
incl
boy
sen-
& lo
ganb
erry
-
0.09
A
US
19.0
76
-
- N
D
ND
1
0.36
2%
VO
044
0 E
gg p
lant
-
0.18
JP
N
15.9
21
9 54
8 U
SA
444
3 2b
7.
45
40%
FB 0
267
Eld
erbe
rrie
s -
0.09
N
LD
17
.0
9 -
- N
D
ND
1
0.05
0%
VA
038
0 Fe
nnel
, bul
b -
0.11
FR
A
18.9
14
5 23
4 U
SA
218
3 2b
2.
54
10%
VD
056
1 Fi
eld
pea
(dry
) 0.
01
- U
SA
15.0
11
-
- N
D
ND
3
0.01
0%
VD
056
1 Fi
eld
pea
(dry
), s
tate
d as
pea
(dr
y), V
D 4
511
0.01
-
- -
ND
-
- N
D
ND
3
ND
-
VP
0528
G
arde
n pe
a (g
reen
pod
s &
imm
atur
e se
eds)
-
0.11
U
SA
15.0
10
9 -
- N
D
ND
1
0.80
4%
VP
0529
G
arde
n pe
a, s
helle
d (i
mm
atur
e se
eds)
-
0.11
N
LD
17
.0
146
- -
ND
N
D
1 0.
94
5%
VA
038
1 G
arlic
-
0.11
FR
A
18.9
4
- -
ND
N
D
1 0.
02
0%
VC
042
5 G
herk
in
- 0.
02
NL
D
17.0
56
15
FR
A
15
1 1
0.07
0%
FB 0
268
Goo
sebe
rrie
s -
0.09
-
- N
D
- -
ND
N
D
1 N
D
-
FB 0
269
Gra
pe (
excl
win
e)
- 0.
09
AU
S 19
.0
342
125
FRA
11
8 3
1 1.
62
8%
JF 0
269
Gra
pe ju
ice
0.01
-
FRA
18
.9
500
- -
ND
N
D
3 0.
26
1%
FC 0
203
Gra
pefr
uit
- 0.
01
FRA
18
.9
405
400
JPN
40
0 3
2a
0.64
3%
DF
0269
G
rape
s, d
ried
(=
cur
rant
s, r
aisi
ns a
nd s
ulta
nas)
-
0.27
U
SA
15.0
59
-
- N
D
ND
1
1.07
5%
MO
009
8 K
idne
y of
cat
tle, g
oats
, pig
s an
d sh
eep
- 0.
09
USA
15
.0
187
- -
ND
N
D
1 1.
12
6%
VA
038
4 L
eek
- 0.
11
FRA
18
.9
125
100
FRA
50
3
2a
1.31
7%
VD
053
3 L
enti
l (dr
y)
0.01
-
FRA
18
.9
291
- -
ND
N
D
3 0.
15
1%
VP
0534
L
ima
bean
(gr
een
pods
& im
mat
ure
seed
s)
- 0.
11
USA
15
.0
117
- -
ND
N
D
1 0.
86
4%
FC 0
205
Lim
e -
0.01
A
US
19.0
26
67
U
SA
56
3 2b
0.
04
0%
SO 0
693
Lin
seed
0.
01
- -
- N
D
- -
ND
N
D
3 N
D
-
MO
009
9 L
iver
of
catt
le, g
oats
, pig
s an
d sh
eep
- 0.
02
USA
15
.0
136
- -
ND
N
D
1 0.
18
1%
VC
042
7 L
oofa
h, a
ngle
d (=
ang
led
gour
d)
- 0.
02
Tha
i 17
.1
130
- -
ND
N
D
1 0.
15
1%
FP 0
228
Loq
uat
- 0.
08
- -
ND
-
- N
D
ND
N
D
ND
-
GC
064
5 M
aize
0.
01
- FR
A
18.9
11
7 -
- N
D
ND
3
0.06
0%
FC 0
206
Man
dari
n -
0.01
JP
N
15.9
35
3 10
0 FR
A
72
3 2a
0.
31
2%

An
nex
4
457
Inte
rnat
iona
l est
imat
e of
sho
rt te
rm in
take
(IE
STI)
for
Acu
te R
fD=
0.0
2 m
g/kg
bw
(20
µg/
kg b
w)
C
YH
AL
OT
HR
IN (
14
6)
(in
clu
din
g L
am
bd
a-
cyh
alo
thri
n)
CH
ILD
RE
N U
P T
O 6
YE
AR
S
M
axim
um %
AR
fD:
160%
Lar
ge p
orti
on d
iet
U
nit w
eigh
t
Cod
ex
Cod
e C
omm
odit
y ST
MR
or
STM
R-P
m
g/kg
HR
or
HR
-P
mg/
kg
Cou
ntry
B
ody
wei
ght
(kg)
Lar
ge
port
ion,
g/
pers
on
Uni
t w
eigh
t, g
Cou
ntry
U
nit
wei
ght,
edib
le
port
ion,
g
Var
ia-
bilit
y fa
ctor
Cas
e IE
STI
µg/
kg
bw/d
ay
% a
cute
R
fD
roun
ded
FI 0
345
Man
go
- 0.
07
Tha
i 17
.1
191
339
SWE
23
4 3
2b
2.35
10
%
MM
009
5 M
eat f
rom
mam
mal
s ot
her
than
mar
ine
mam
mal
s: 2
0% a
s fa
t -
2.2
AU
S 19
.0
52
- -
ND
N
D
1 6.
03
30%
MM
009
5 M
eat f
rom
mam
mal
s ot
her
than
mar
ine
mam
mal
s: 8
0% a
s m
uscl
e -
0.1
AU
S 19
.0
208
- -
ND
N
D
1 1.
10
5%
VC
004
6 M
elon
s, e
xcep
t wat
erm
elon
-
0.02
FR
A
18.9
59
7 70
0 FR
A
420
3 2a
1.
52
8%
ML
0106
M
ilks
0.08
-
USA
15
.0
1286
-
- N
D
ND
3
6.86
30
%
VD
053
6 M
ung
bean
(dr
y)
0.01
-
Tha
i 17
.1
56
- -
ND
N
D
3 0.
03
0%
SO 0
090
Mus
tard
see
d, s
tate
d as
mus
tard
see
d SO
048
5 0.
01
- A
US
19.0
13
-
- N
D
ND
3
0.01
0%
FS 0
245
Nec
tari
ne
- 0.
33
AU
S 19
.0
302
136
USA
12
5 3
2a
9.59
50
%
GC
064
7 O
ats
0.01
-
USA
15
.0
62
- -
ND
N
D
3 0.
04
0%
VO
044
2 O
kra
- 0.
18
USA
15
.0
203
10
JPN
10
1
1 2.
43
10%
FT 0
305
Oliv
e -
0.42
FR
A
18.9
20
2 -
- N
D
ND
1
4.48
20
%
OR
030
5 O
live
oil,
refi
ned
0.07
7 -
FRA
18
.9
25
- -
ND
N
D
3 0.
10
1%
- O
live
oil,
resi
due
oil
0.09
1 -
- -
ND
-
- N
D
ND
3
ND
-
VA
038
5 O
nion
, Bul
b -
0.11
N
LD
17
.0
86
110
USA
10
0 3
2b
1.66
8%
VA
038
7 O
nion
, Wel
sh
- 0.
11
JPN
15
.9
49
100
JPN
10
0 3
2b
1.01
5%
FC 0
004
Ora
nge,
sw
eet,
sour
+ o
rang
e-lik
e hy
brid
-
0.01
U
NK
14
.5
495
190
FRA
13
7 3
2a
0.53
3%
OR
124
0 Pa
lm k
erne
l oil,
edi
ble
0.01
-
FRA
18
.9
5 -
- N
D
ND
3
0.00
0%
OR
069
6 Pa
lm o
il, e
dibl
e 0.
01
- -
- N
D
- -
ND
N
D
3 N
D
-
FS 0
247
Peac
h -
0.33
A
US
19.0
31
5 98
U
SA
85
3 2a
8.
44
40%
OR
069
7 Pe
anut
oil,
edi
ble
0.01
-
AU
S 19
.0
9 -
- N
D
ND
3
0.00
0%
SO 0
697
Pean
ut, s
helle
d 0.
01
- U
SA
15.0
78
-
- N
D
ND
3
0.05
0%
SO 0
703
Pean
ut, w
hole
in s
hell
- 0.
15
SAF
14.2
50
-
- N
D
ND
1
0.53
3%
FP 0
230
Pear
-
0.08
U
NK
14
.5
279
166
USA
15
1 3
2a
3.21
20
%
VD
007
2 Pe
as (
dry)
0.
01
- U
SA
15.0
86
-
- N
D
ND
3
0.06
0%
VP
0063
Pe
as (
gree
n po
ds &
imm
atur
e se
eds)
-
0.11
JP
N
15.9
48
-
- N
D
ND
1
0.33
2%
VP
0064
Pe
as, s
helle
d (i
mm
atur
e se
eds)
-
0.11
U
NK
14
.5
174
- -
ND
N
D
1 1.
32
7%
VO
044
4 Pe
pper
s, C
hilli
-
0.18
A
US
19.0
31
45
U
SA
43
3 2b
0.
87
4%
VO
044
5 Pe
pper
s, s
wee
t (in
cl. p
im(i
)ent
o)
- 0.
18
Tha
i 17
.1
71
172
UN
K
160
3 2b
2.
25
10%
VD
053
7 Pi
geon
pea
0.
01
- -
- N
D
- -
ND
N
D
3 N
D
-

A
nn
ex 4
458
Inte
rnat
iona
l est
imat
e of
sho
rt te
rm in
take
(IE
STI)
for
Acu
te R
fD=
0.0
2 m
g/kg
bw
(20
µg/
kg b
w)
C
YH
AL
OT
HR
IN (
14
6)
(in
clu
din
g L
am
bd
a-
cyh
alo
thri
n)
CH
ILD
RE
N U
P T
O 6
YE
AR
S
M
axim
um %
AR
fD:
160%
Lar
ge p
orti
on d
iet
U
nit w
eigh
t
Cod
ex
Cod
e C
omm
odit
y ST
MR
or
STM
R-P
m
g/kg
HR
or
HR
-P
mg/
kg
Cou
ntry
B
ody
wei
ght
(kg)
Lar
ge
port
ion,
g/
pers
on
Uni
t w
eigh
t, g
Cou
ntry
U
nit
wei
ght,
edib
le
port
ion,
g
Var
ia-
bilit
y fa
ctor
Cas
e IE
STI
µg/
kg
bw/d
ay
% a
cute
R
fD
roun
ded
FS 0
014
Plum
(in
cl d
ried
) -
0.1
Tha
i 17
.1
377
66
USA
62
3
2a
2.93
10
%
GC
065
6 Po
pcor
n 0.
01
- JP
N
15.9
53
-
- N
D
ND
3
0.03
0%
SO 0
698
Popp
y se
ed
0.01
-
- -
ND
-
- N
D
ND
3
ND
-
FP 0
231
Qui
nce
- 0.
08
NL
D
17.0
1
92
USA
56
3
2b
0.01
0%
OR
049
5 R
ape
seed
oil,
edi
ble
0.01
-
AU
S 19
.0
18
- -
ND
N
D
3 0.
01
0%
FB 0
272
Ras
pber
ries
, red
, bla
ck
- 0.
09
FRA
18
.9
157
- -
ND
N
D
1 0.
75
4%
CM
120
6 R
ice
bran
, unp
roce
ssed
0.
065
- U
SA
15.0
3
- -
ND
N
D
3 0.
01
0%
CM
064
9 R
ice,
hus
ked
0.29
5 -
FRA
18
.9
121
- -
ND
N
D
3 1.
89
9%
CM
120
5 R
ice,
pol
ishe
d 0.
003
- JP
N
15.9
19
9 -
- N
D
ND
3
0.04
0%
VR
007
5 R
oot a
nd tu
ber
vege
tabl
es
- 0
- -
ND
-
- N
D
ND
N
D
ND
-
FB 0
273
R
ose
hips
-
0.09
N
LD
17
.0
16
- -
ND
N
D
1 0.
08
0%
GC
065
0 R
ye
0.01
-
NL
D
17.0
37
-
- N
D
ND
3
0.02
0%
OR
069
9 Sa
fflo
wer
see
d oi
l, ed
ible
0.
01
- FR
A
18.9
1
- -
ND
N
D
3 0.
00
0%
SO 0
700
Sesa
me
seed
0.
01
- T
hai
17.1
20
-
- N
D
ND
3
0.01
0%
OR
070
0 Se
sam
e se
ed o
il, e
dibl
e 0.
01
- A
US
19.0
5
- -
ND
N
D
3 0.
00
0%
FC 0
005
Shad
dock
or
pom
elo
+ s
hadd
ock-
like
hybr
id
- 0.
01
Tha
i 17
.1
327
210
FRA
12
6 3
2a
0.34
2%
VA
038
8 Sh
allo
t -
0.11
A
US
19.0
18
-
- N
D
ND
1
0.10
1%
VC
043
0 Sn
ake
gour
d -
0.02
T
hai
17.1
13
0 -
- N
D
ND
1
0.15
1%
VD
054
1 So
ya b
ean
(dry
) 0.
01
- JP
N
15.9
88
-
- N
D
ND
3
0.06
0%
VP
0541
So
ya b
ean
(im
mat
ure
seed
s)
- 0.
11
Tha
i 17
.1
66
- -
ND
N
D
1 0.
42
2%
OR
054
1 So
ya b
ean
oil,
refi
ned
0.01
-
USA
15
.0
35
- -
ND
N
D
3 0.
02
0%
VA
038
9 Sp
ring
oni
on
- 0.
11
Tha
i 17
.1
53
- -
ND
N
D
1 0.
34
2%
VC
043
1 Sq
uash
, sum
mer
(=
cou
rget
te)
- 0.
02
AU
S 19
.0
219
300
FRA
27
0 3
2b
0.69
3%
FB 0
275
Stra
wbe
rry
- 0.
09
FRA
18
.9
354
14
FRA
13
1
1 1.
68
8%
GS
0659
Su
gar
cane
0.
03
- T
hai
17.1
18
1 -
- N
D
ND
3
0.32
2%
DM
065
9 Su
gar
cane
mol
asse
s 0.
001
- A
US
19.0
16
8 -
- N
D
ND
3
0.01
0%
SO 0
702
Sunf
low
er s
eed
0.01
-
USA
15
.0
24
- -
ND
N
D
3 0.
02
0%
OR
070
2 Su
nflo
wer
see
d oi
l, ed
ible
0.
01
- FR
A
18.9
27
-
- N
D
ND
3
0.01
0%
VO
044
7 Sw
eet c
orn
(cor
n-on
-the
-cob
) -
0.18
T
hai
17.1
19
7 21
5 U
NK
12
5 3
2a
4.70
20
%
VO
044
8 To
mat
o -
0.18
FR
A
18.9
21
5 10
5 FR
A
102
3 2a
3.
99
20%

An
nex
4
459
Inte
rnat
iona
l est
imat
e of
sho
rt te
rm in
take
(IE
STI)
for
Acu
te R
fD=
0.0
2 m
g/kg
bw
(20
µg/
kg b
w)
C
YH
AL
OT
HR
IN (
14
6)
(in
clu
din
g L
am
bd
a-
cyh
alo
thri
n)
CH
ILD
RE
N U
P T
O 6
YE
AR
S
M
axim
um %
AR
fD:
160%
Lar
ge p
orti
on d
iet
U
nit w
eigh
t
Cod
ex
Cod
e C
omm
odit
y ST
MR
or
STM
R-P
m
g/kg
HR
or
HR
-P
mg/
kg
Cou
ntry
B
ody
wei
ght
(kg)
Lar
ge
port
ion,
g/
pers
on
Uni
t w
eigh
t, g
Cou
ntry
U
nit
wei
ght,
edib
le
port
ion,
g
Var
ia-
bilit
y fa
ctor
Cas
e IE
STI
µg/
kg
bw/d
ay
% a
cute
R
fD
roun
ded
JF 0
448
Tom
ato
juic
e 0.
002
- -
- N
D
- -
ND
N
D
3 N
D
-
- To
mat
o pa
ste
0.00
7 -
- -
ND
-
- N
D
ND
N
D
ND
-
TN
008
5 T
ree
nuts
-
0.01
A
US
19.0
28
-
- N
D
ND
1
0.00
0%
FB 0
019
Vac
cini
um b
erri
es (
incl
. Bea
rber
ry)
- 0.
09
- -
ND
-
- N
D
ND
1
ND
-
VC
043
2 W
ater
mel
on
- 0.
02
AU
S 19
.0
1473
45
18
USA
20
78
3 2b
4.
65
20%
GC
065
4 W
heat
0.
01
- FR
A
18.9
38
4 -
- N
D
ND
3
0.20
1%
CM
065
4 W
heat
bra
n, u
npro
cess
ed
0.04
5 -
USA
15
.0
30
- -
ND
N
D
3 0.
09
0%
- W
ine
0.01
-
FRA
18
.9
89
- -
ND
N
D
3 0.
05
0%
VC
043
3 W
inte
r sq
uash
(=
pum
pkin
), s
tate
d as
pum
pkin
, VC
042
9 -
0.02
SA
F 14
.2
224
1000
JP
N
1000
3
2b
0.95
5%
VP
0544
Y
ard-
long
bea
ns (
gree
n po
ds &
imm
atur
e se
eds)
-
0.11
T
hai
17.1
79
-
- N
D
ND
1
0.51
3%

A
nn
ex 4
460
C
YP
ER
ME
TH
RIN
(11
8)
Inte
rnat
iona
l est
imat
e of
sho
rt te
rm in
take
(IE
STI)
for
Acu
te R
fD=
0.0
4 m
g/kg
bw
(40
µg/
kg b
w)
GE
NE
RA
L P
OP
UL
AT
ION
M
axim
um %
AR
fD:
40%
Lar
ge p
orti
on d
iet
U
nit w
eigh
t
C
odex
C
ode
Com
mod
ity
STM
R o
r ST
MR
-P
mg/
kg
HR
or
HR
-P
mg/
kg
Cou
ntry
B
ody
wei
ght (
kg)
Lar
ge
port
ion,
g/
pers
on
Uni
t wei
ght,
g C
ount
ry
Uni
t wei
ght,
edib
le
port
ion,
g
Var
ia-b
ility
fa
ctor
C
ase
IEST
I µg/
kg
bw/d
ay
% a
cute
RfD
ro
unde
d
FP 0
226
App
le
- 0.
56
USA
65
.0
1348
13
8 U
SA
127
3 2a
13
.80
30%
VS
0620
A
rtic
hoke
glo
be
- 0.
04
FRA
62
.3
534
230
FRA
99
3
2a
0.47
1%
VS
0621
A
spar
agus
-
0.01
N
LD
63
.0
398
25
FRA
13
3
2a
0.07
0%
GC
064
0 B
arle
y 0.
035
- N
LD
63
.0
378
- -
ND
N
D
3 0.
21
1%
- B
arle
y be
er
0.00
1 -
- -
ND
-
- N
D
ND
3
ND
-
VD
007
1
Bea
ns (
dry)
0.
05
- FR
A
62.3
25
5 -
- N
D
ND
3
0.21
1%
VP
0062
B
eans
, she
lled
(im
mat
ure
seed
s)
- 0.
45
FRA
62
.3
312
- -
1 2.
25
6%
VB
040
0 B
rocc
oli
- 0.
65
USA
65
.0
376
310
BE
L
186
3 2a
7.
48
20%
VB
040
2 B
russ
els
spro
uts
- 0.
65
NL
D
63.0
39
4 10
U
NK
7
1 1
4.06
10
%
VB
004
1 C
abba
ges,
Hea
d -
0.65
SA
F 55
.7
362
771
UN
K
540
3 2b
12
.68
30%
FT 0
289
Car
ambo
la (
= s
tar
frui
t)
- 0.
09
Tha
i 53
.5
388
- -
ND
N
D
ND
N
D
-
VR
057
7 C
arro
t -
0.01
N
LD
63
.0
335
100
FRA
89
3
2a
0.08
0%
VB
040
4 C
aulif
low
er (
head
) -
0.65
U
NK
70
.1
579
1000
B
EL
64
0 3
2b
16.1
1 40
%
FS 0
013
Che
rrie
s -
0.94
FR
A
62.3
37
5 5
FRA
4
1 1
5.66
10
%
SB 0
716
Cof
fee
bean
s 0
- N
LD
63
.0
66
- -
ND
N
D
3 0.
00
0%
VP
0526
C
omm
on b
ean
(gre
en p
ods
and/
or im
mat
ure
seed
s)
- 0.
45
NL
D
63.0
43
1 -
-
1
3.08
8%
SO 0
691
Cot
ton
seed
0.
05
- U
SA
65.0
3
- -
ND
N
D
3 0.
00
0%
VC
042
4 C
ucum
ber
- 0.
05
NL
D
63.0
31
3 40
0 FR
A
360
3 2b
0.
75
2%
FI 0
334
Dur
ian
- 0.
47
Tha
i 53
.5
471
3000
T
hai
930
3 2b
12
.41
30%
MO
010
5 E
dibl
e of
fal (
mam
mal
ian)
-
0.04
FR
A
62.3
27
7 -
- N
D
ND
1
0.18
0%
VO
044
0 E
gg p
lant
-
0.02
A
US
67.0
48
7 80
JP
N
80
3 2a
0.
19
0%
PE 0
112
Egg
s -
0.00
33
Tha
i 53
.5
195
- -
ND
N
D
1 0.
01
0%
VL
0476
E
ndiv
e -
0.52
N
LD
63
.0
404
- -
ND
N
D
ND
N
D
-
VD
056
1 Fi
eld
pea
(dry
), s
tate
d as
pea
(dr
y), V
D 4
511
0.05
-
NL
D
63.0
25
2 -
- N
D
ND
3
0.20
1%
FB 0
269
Gra
pe (
excl
win
e)
- 0.
09
AU
S 67
.0
513
150
JPN
15
0 3
2a
1.09
3%
DF
0269
G
rape
s, d
ried
(=
cur
rant
s, r
aisi
ns a
nd
sulta
nas)
-
0.3
FRA
62
.3
135
- -
ND
N
D
1 0.
65
2%
VA
038
4 L
eek
- 0.
03
FRA
62
.3
374
100
FRA
50
3
2a
0.23
1%
VL
0482
L
ettu
ce, h
ead
- 0.
52
USA
65
.0
213
539
USA
51
2 3
2b
5.10
10
%

An
nex
4
461
CY
PE
RM
ET
HR
IN (
118
) In
tern
atio
nal e
stim
ate
of s
hort
term
inta
ke (
IEST
I) f
or
A
cute
RfD
= 0
.04
mg/
kg b
w (
40 µ
g/kg
bw
)
GE
NE
RA
L P
OP
UL
AT
ION
M
axim
um %
AR
fD:
40%
Lar
ge p
orti
on d
iet
U
nit w
eigh
t
C
odex
C
ode
Com
mod
ity
STM
R o
r ST
MR
-P
mg/
kg
HR
or
HR
-P
mg/
kg
Cou
ntry
B
ody
wei
ght (
kg)
Lar
ge
port
ion,
g/
pers
on
Uni
t wei
ght,
g C
ount
ry
Uni
t wei
ght,
edib
le
port
ion,
g
Var
ia-b
ility
fa
ctor
C
ase
IEST
I µg/
kg
bw/d
ay
% a
cute
RfD
ro
unde
d
FI 0
343
Lit
chi
- 0.
79
Tha
i 53
.5
264
33
Tha
i 21
3
2a
4.51
10
%
FI 0
342
Lon
gan
- 0.
47
Tha
i 53
.5
389
10
Tha
i 7
1 1
3.42
9%
GC
064
5 M
aize
0.
035
- FR
A
62.3
26
0 -
- N
D
ND
3
0.15
0%
FI 0
345
Man
go
- 0.
35
FRA
62
.3
567
207
USA
13
9 3
2a
4.74
10
%
MM
009
5 M
eat f
rom
mam
mal
s ot
her
than
mar
ine
mam
mal
s: 2
0% a
s fa
t -
0.76
A
US
67.0
10
4 -
- N
D
ND
1
1.18
3%
MM
009
5 M
eat f
rom
mam
mal
s ot
her
than
mar
ine
mam
mal
s: 8
0% a
s m
uscl
e -
0.04
A
US
67.0
41
7 -
- N
D
ND
1
0.25
1%
VC
004
6 M
elon
s, e
xcep
t wat
erm
elon
-
0.01
U
SA
65.0
65
5 70
0 FR
A
420
3 2a
0.
23
1%
ML
0106
M
ilks
0.01
1 -
USA
65
.0
2466
-
- N
D
ND
3
0.42
1%
GC
064
7 O
ats
0.03
5 -
FRA
62
.3
305
- -
ND
N
D
3 0.
17
0%
VO
044
2 O
kra
- 0.
2 U
SA
65.0
23
5 10
JP
N
10
1 1
0.72
2%
FT 0
305
Oliv
e -
0.05
N
LD
63
.0
63
- -
ND
N
D
ND
N
D
-
VA
038
5 O
nion
, Bul
b -
0.01
FR
A
62.3
30
6 14
0 FR
A
126
3 2a
0.
09
0%
FI 0
350
Papa
ya
- 0.
23
USA
65
.0
567
304
USA
20
4 3
2a
3.45
9%
FS 0
247
Peac
h -
0.94
SA
F 55
.7
685
98
USA
85
3
2a
14.4
4 40
%
FP 0
230
Pear
-
0.56
U
SA
65.0
69
3 16
6 U
SA
151
3 2a
8.
57
20%
VD
007
2 Pe
as (
dry)
0.
05
- FR
A
62.3
44
5 -
- N
D
ND
3
0.36
1%
VP
0063
Pe
as (
gree
n po
ds &
imm
atur
e se
eds)
-
0.45
JP
N
52.6
63
-
-
1.
00
0.54
1%
VP
0064
Pe
as, s
helle
d (i
mm
atur
e se
eds)
-
0.45
U
NK
70
.1
437
- -
1.00
2.
80
7%
VO
044
4 Pe
pper
s, C
hilli
-
0.69
U
SA
65.0
90
45
U
SA
43
3 2a
1.
88
5%
VO
044
5 Pe
pper
s, s
wee
t (in
cl. p
im(i
)ent
o)
- 0.
07
FRA
62
.3
207
40
JPN
40
3
2a
0.32
1%
FS 0
014
Plum
(in
cl d
ried
) -
0.94
T
hai
53.5
48
0 66
U
SA
62
3 2a
10
.61
30%
DF
0014
Pl
um, d
ried
(pr
unes
) -
3 U
SA
65.0
30
3 6
FRA
5
1 1
13.9
8 30
%
VR
058
9 Po
tato
-
0.01
N
LD
63
.0
687
200
FRA
16
0 3
2a
0.16
0%
PM 0
110
Poul
try
mea
t: 10
% a
s fa
t -
0.02
7 A
US
67.0
43
-
- N
D
ND
1
0.02
0%
PM 0
110
Poul
try
mea
t: 90
% a
s m
uscl
e -
0.00
7 A
US
67.0
38
8 -
- N
D
ND
1
0.04
0%
PO 0
111
Poul
try,
Edi
ble
offa
l of
- 0.
007
USA
65
.0
248
- -
ND
N
D
1 0.
03
0%
OR
049
5 R
ape
seed
oil,
edi
ble
0.06
-
AU
S 67
.0
65
- -
ND
N
D
3 0.
06
0%
GC
064
9 R
ice
0.57
-
FRA
62
.3
312
- -
ND
N
D
3 2.
85
7%
VD
054
1 So
ya b
ean
(dry
) 0.
05
- JP
N
52.6
15
9 -
- N
D
ND
3
0.15
0%
VL
0502
Sp
inac
h (b
unch
) -
0.52
N
LD
63
.0
820
340
USA
24
5 3
2a
10.8
1 30
%

A
nn
ex 4
462
CY
PE
RM
ET
HR
IN (
118
) In
tern
atio
nal e
stim
ate
of s
hort
term
inta
ke (
IEST
I) f
or
A
cute
RfD
= 0
.04
mg/
kg b
w (
40 µ
g/kg
bw
)
GE
NE
RA
L P
OP
UL
AT
ION
M
axim
um %
AR
fD:
40%
Lar
ge p
orti
on d
iet
U
nit w
eigh
t
C
odex
C
ode
Com
mod
ity
STM
R o
r ST
MR
-P
mg/
kg
HR
or
HR
-P
mg/
kg
Cou
ntry
B
ody
wei
ght (
kg)
Lar
ge
port
ion,
g/
pers
on
Uni
t wei
ght,
g C
ount
ry
Uni
t wei
ght,
edib
le
port
ion,
g
Var
ia-b
ility
fa
ctor
C
ase
IEST
I µg/
kg
bw/d
ay
% a
cute
RfD
ro
unde
d
FB 0
275
Stra
wbe
rry
- 0.
05
FRA
62
.3
346
14
FRA
13
1
1 0.
28
1%
GS
0659
Su
gar
cane
-
0.17
T
hai
53.5
36
6 -
- N
D
ND
N
D
ND
-
VO
044
7 Sw
eet c
orn
(cor
n-on
-the
-cob
) -
0 T
hai
53.5
38
3 21
5 U
NK
12
5 3
2a
0.00
0%
VO
044
8 To
mat
o -
0.08
U
SA
65.0
39
1 12
3 U
SA
123
3 2a
0.
78
2%
GC
065
4 W
heat
0.
035
- U
SA
65.0
38
3 -
- N
D
ND
3
0.21
1%
CM
065
4 W
heat
bra
n, u
npro
cess
ed
0.08
4 -
USA
65
.0
80
- -
ND
N
D
ND
N
D
-
- W
ine
0.00
1 -
AU
S 67
.0
1131
-
- N
D
ND
3
0.02
0%
C
YP
ER
ME
TH
RIN
(11
8)
Inte
rnat
iona
l est
imat
e of
sho
rt te
rm in
take
(IE
STI)
for
Acu
te R
fD=
0.0
4 m
g/kg
bw
(40
µg/
kg b
w)
CH
ILD
RE
N U
P T
O 6
YE
AR
S
M
axim
um %
AR
fD:
90%
Lar
ge p
orti
on d
iet
U
nit w
eigh
t
C
odex
C
ode
Com
mod
ity
STM
R o
r ST
MR
-P
mg/
kg
HR
or
HR
-P
mg/
kg
Cou
ntry
Bod
y w
eigh
t (k
g)
Lar
ge p
orti
on,
g/pe
rson
U
nit
wei
ght,
g C
ount
ry U
nit w
eigh
t, ed
ible
po
rtio
n, g
V
aria
-bili
ty
fact
or
Cas
e IE
STI µ
g/kg
bw
/day
%
acu
te R
fD
roun
ded
FP 0
226
App
le
- 0.
56
USA
15
.0
679
138
USA
12
7 3
2a
34.8
2 90
%
VS
0620
A
rtic
hoke
glo
be
- 0.
04
FRA
17
.8
89
230
FRA
99
3
2b
0.60
2%
VS
0621
A
spar
agus
-
0.01
U
SA
15.0
17
8 25
FR
A
13
3 2a
0.
14
0%
GC
064
0 B
arle
y 0.
035
- A
US
19.0
14
-
- N
D
ND
3
0.03
0%
- B
arle
y be
er
0.00
1 -
- -
ND
-
- N
D
ND
3
ND
-
VD
007
1 B
eans
(dr
y)
0.05
-
FRA
17
.8
209
- -
ND
N
D
3 0.
59
1%
VP
0062
B
eans
, she
lled
(im
mat
ure
seed
s)
- 0.
45
FRA
17
.8
198
- -
1 5.
00
10%
VB
040
0 B
rocc
oli
- 0.
65
USA
15
.0
164
310
BE
L
186
3 2b
21
.35
50%
VB
040
2 B
russ
els
spro
uts
- 0.
65
NL
D
17.0
21
3 10
U
NK
7
1 1
8.13
20
%
VB
004
1 C
abba
ges,
Hea
d -
0.65
SA
F 14
.2
220
771
UN
K
540
3 2b
30
.23
80%
FT 0
289
Car
ambo
la (
= s
tar
frui
t)
- 0.
09
Tha
i 17
.1
245
- -
ND
N
D
ND
N
D
-
VR
057
7 C
arro
t -
0.01
FR
A
17.8
20
5 10
0 FR
A
89
3 2a
0.
22
1%
VB
040
4 C
aulif
low
er (
head
) -
0.65
N
LD
17
.0
209
1000
B
EL
64
0 3
2b
24.0
0 60
%
FS 0
013
Che
rrie
s -
0.94
FR
A
17.8
29
7 5
FRA
4
1 1
15.6
7 40
%
SB 0
716
Cof
fee
bean
s 0
- N
LD
17
.0
19
- -
ND
N
D
3 0.
00
0%

An
nex
4
463
CY
PE
RM
ET
HR
IN (
118
) In
tern
atio
nal e
stim
ate
of s
hort
term
inta
ke (
IEST
I) f
or
A
cute
RfD
= 0
.04
mg/
kg b
w (
40 µ
g/kg
bw
)
CH
ILD
RE
N U
P T
O 6
YE
AR
S
M
axim
um %
AR
fD:
90%
Lar
ge p
orti
on d
iet
U
nit w
eigh
t
C
odex
C
ode
Com
mod
ity
STM
R o
r ST
MR
-P
mg/
kg
HR
or
HR
-P
mg/
kg
Cou
ntry
Bod
y w
eigh
t (k
g)
Lar
ge p
orti
on,
g/pe
rson
U
nit
wei
ght,
g C
ount
ry U
nit w
eigh
t, ed
ible
po
rtio
n, g
V
aria
-bili
ty
fact
or
Cas
e IE
STI µ
g/kg
bw
/day
%
acu
te R
fD
roun
ded
VP
0526
C
omm
on b
ean
(gre
en p
ods
and/
or
imm
atur
e se
eds)
-
0.45
N
LD
17
.0
184
- -
1 4.
87
10%
SO 0
691
Cot
ton
seed
0.
05
- U
SA
15.0
1
- -
ND
N
D
3 0.
00
0%
VC
042
4 C
ucum
ber
- 0.
05
NL
D
17.0
16
2 40
0 FR
A
360
3 2b
1.
43
4%
FI 0
334
Dur
ian
- 0.
47
Tha
i 17
.1
289
- -
ND
N
D
ND
N
D
-
MO
010
5 E
dibl
e of
fal (
mam
mal
ian)
-
0.04
FR
A
17.8
20
3 -
- N
D
ND
1
0.46
1%
VO
044
0 E
gg p
lant
-
0.02
JP
N
15.9
21
9 80
JP
N
80
3 2a
0.
48
1%
PE 0
112
Egg
s -
0.00
33
Tha
i 17
.1
109
- -
ND
N
D
1 0.
02
0%
VL
0476
E
ndiv
e -
0.52
N
LD
17
.0
212
- -
ND
N
D
ND
N
D
-
VD
056
1 Fi
eld
pea
(dry
), s
tate
d as
pea
(dr
y), V
D
4511
0.
05
- -
- N
D
- -
ND
N
D
3 N
D
-
FB 0
269
Gra
pe (
excl
win
e)
- 0.
09
AU
S 19
.0
342
150
JPN
15
0 3
2a
3.04
8%
DF
0269
G
rape
s, d
ried
(=
cur
rant
s, r
aisi
ns a
nd
sulta
nas)
-
0.3
USA
15
.0
59
- -
ND
N
D
1 1.
19
3%
VA
038
4 L
eek
- 0.
03
FRA
17
.8
121
100
FRA
50
3
2a
0.37
1%
VL
0482
L
ettu
ce, h
ead
- 0.
52
Tha
i 17
.1
117
539
USA
51
2 3
2b
10.6
5 30
%
FI 0
343
Lit
chi
- 0.
79
Tha
i 17
.1
147
- -
ND
N
D
ND
N
D
-
FI 0
342
Lon
gan
- 0.
47
Tha
i 17
.1
232
- -
ND
N
D
ND
N
D
-
GC
064
5 M
aize
0.
035
- FR
A
17.8
14
8 -
- N
D
ND
3
0.29
1%
FI 0
345
Man
go
- 0.
35
Tha
i 17
.1
191
207
USA
13
9 3
2a
9.59
20
%
MM
009
5 M
eat f
rom
mam
mal
s ot
her
than
mar
ine
mam
mal
s: 2
0% a
s fa
t -
0.76
A
US
19.0
52
-
- N
D
ND
1
2.08
5%
MM
009
5 M
eat f
rom
mam
mal
s ot
her
than
mar
ine
mam
mal
s: 8
0% a
s m
uscl
e -
0.04
A
US
19.0
20
8 -
- N
D
ND
1
0.44
1%
VC
004
6 M
elon
s, e
xcep
t wat
erm
elon
-
0.01
A
US
19.0
41
3 70
0 FR
A
420
3 2b
0.
65
2%
ML
0106
Milk
s 0.
011
- U
SA
15.0
12
86
- -
ND
N
D
3 0.
94
2%
GC
064
7 O
ats
0.03
5 -
USA
15
.0
62
- -
ND
N
D
3 0.
15
0%
VO
044
2 O
kra
- 0.
2 U
SA
15.0
20
3 10
JP
N
10
1 1
2.70
7%
FT 0
305
Oliv
e -
0.05
FR
A
17.8
49
-
- N
D
ND
N
D
ND
-
VA
038
5 O
nion
, Bul
b -
0.01
FR
A
17.8
12
7 14
0 FR
A
126
3 2a
0.
21
1%
FI 0
350
Papa
ya
- 0.
23
USA
15
.0
240
304
USA
20
4 3
2a
9.93
20
%
FS 0
247
Peac
h -
0.94
A
US
19.0
31
5 98
U
SA
85
3 2a
24
.05
60%
FP 0
230
Pear
-
0.56
U
NK
14
.5
279
166
USA
15
1 3
2a
22.4
4 60
%

A
nn
ex 4
464
CY
PE
RM
ET
HR
IN (
118
) In
tern
atio
nal e
stim
ate
of s
hort
term
inta
ke (
IEST
I) f
or
A
cute
RfD
= 0
.04
mg/
kg b
w (
40 µ
g/kg
bw
)
CH
ILD
RE
N U
P T
O 6
YE
AR
S
M
axim
um %
AR
fD:
90%
Lar
ge p
orti
on d
iet
U
nit w
eigh
t
C
odex
C
ode
Com
mod
ity
STM
R o
r ST
MR
-P
mg/
kg
HR
or
HR
-P
mg/
kg
Cou
ntry
Bod
y w
eigh
t (k
g)
Lar
ge p
orti
on,
g/pe
rson
U
nit
wei
ght,
g C
ount
ry U
nit w
eigh
t, ed
ible
po
rtio
n, g
V
aria
-bili
ty
fact
or
Cas
e IE
STI µ
g/kg
bw
/day
%
acu
te R
fD
roun
ded
VD
007
2 Pe
as (
dry)
0.
05
- FR
A
17.8
10
7 -
- N
D
ND
3
0.30
1%
VP
0063
Pe
as (
gree
n po
ds &
imm
atur
e se
eds)
-
0.45
JP
N
15.9
48
-
-
1
1.35
3%
VP
0064
Pe
as, s
helle
d (i
mm
atur
e se
eds)
-
0.45
U
NK
14
.5
174
- -
1 5.
40
10%
VO
044
4 Pe
pper
s, C
hilli
-
0.69
A
US
19.0
31
45
U
SA
43
3 2b
3.
32
8%
VO
044
5 Pe
pper
s, s
wee
t (in
cl. p
im(i
)ent
o)
- 0.
07
Tha
i 17
.1
71
40
JPN
40
3
2a
0.62
2%
FS 0
014
Plum
(in
cl d
ried
) -
0.94
T
hai
17.1
37
7 66
U
SA
62
3 2a
27
.54
70%
DF
0014
Pl
um, d
ried
(pr
unes
) -
3 A
US
19.0
17
0 6
FRA
5
1 1
26.8
5 70
%
VR
058
9 Po
tato
-
0.01
SA
F 14
.2
300
200
FRA
16
0 3
2a
0.44
1%
PM 0
110
Poul
try
mea
t: 10
% a
s fa
t -
0.02
7 A
US
19.0
22
-
- N
D
ND
1
0.03
0%
PM 0
110
Poul
try
mea
t: 90
% a
s m
uscl
e -
0.00
7 A
US
19.0
20
1 -
- N
D
ND
1
0.07
0%
PO 0
111
Poul
try,
Edi
ble
offa
l of
- 0.
007
USA
15
.0
37
- -
ND
N
D
1 0.
02
0%
OR
049
5 R
ape
seed
oil,
edi
ble
0.06
-
AU
S 19
.0
18
- -
ND
N
D
3 0.
06
0%
GC
064
9 R
ice
0.57
-
FRA
17
.8
223
- -
ND
N
D
3 7.
13
20%
VD
054
1 So
ya b
ean
(dry
) 0.
05
- JP
N
15.9
88
-
- N
D
ND
3
0.28
1%
VL
0502
Sp
inac
h (b
unch
) -
0.52
SA
F 14
.2
420
340
USA
24
5 3
2a
33.3
2 80
%
FB 0
275
Stra
wbe
rry
- 0.
05
AU
S 19
.0
176
14
FRA
13
1
1 0.
46
1%
GS
0659
Su
gar
cane
-
0.17
T
hai
17.1
18
1 -
- N
D
ND
N
D
ND
-
VO
044
7 Sw
eet c
orn
(cor
n-on
-the
-cob
) -
0 T
hai
17.1
19
7 21
5 U
NK
12
5 3
2a
0.00
0%
VO
044
8 To
mat
o -
0.08
U
SA
15.0
15
9 12
3 U
SA
123
3 2a
2.
16
5%
GC
065
4 W
heat
0.
035
- U
SA
15.0
15
1 -
- N
D
ND
3
0.35
1%
CM
065
4 W
heat
bra
n, u
npro
cess
ed
0.08
4 -
USA
15
.0
30
- -
ND
N
D
ND
N
D
-
- W
ine
0.00
1 -
AU
S 19
.0
4 -
- N
D
ND
3
0.00
0%

An
nex
4
465
DIM
ET
HO
AT
E (
02
7)
Inte
rnat
iona
l est
imat
e of
sho
rt te
rm in
take
(IE
STI)
for
Acu
te R
fD =
0.02
mg/
kg b
w (
20 µ
g/kg
bw
)
GE
NE
RA
L PO
PUL
AT
ION
Max
imum
%A
RfD
: 40
%
Lar
ge p
orti
on d
iet
Cod
ex
Cod
e C
omm
odit
y
ST
MR
or
STM
R-P
m
g/kg
HR
or
HR
-P
mg/
kg
Cou
ntry
B
ody
wei
ght
(kg)
Lar
ge
port
ion,
g/
pers
on
Uni
t w
eigh
t, g
Cou
ntry
U
nit w
eigh
t, ed
ible
por
tion
, g
Var
ia-
bilit
y fa
ctor
Cas
e IE
STI µ
g/kg
bw
/day
%
acu
te R
fD
roun
ded
VL
0482
L
ettu
ce, h
ead
- 0.
76
USA
65
.0
213
558
UN
K
413
3 2b
7.
46
40%
VO
044
5 Pe
pper
s, s
wee
t (in
cl.
pim
(i)e
nto)
-
1.3
FRA
52
.2
90
172
UN
K
160
3 2b
6.
75
30%
D
I ME
TH
OA
TE
(0
27
) In
tern
atio
nal e
stim
ate
of s
hort
term
inta
ke (
IEST
I) f
or
A
cute
RfD
=0.
02 m
g/kg
bw
(20
µg/
kg b
w)
CH
ILD
RE
N U
P T
O 6
YE
AR
S
M
axim
um %
AR
fD:
80%
Lar
ge p
orti
on d
iet
Cod
ex
Cod
e C
omm
odit
y ST
MR
or
STM
R-P
m
g/kg
HR
or
HR
-P
mg/
kg
Cou
ntry
B
ody
wei
ght
(kg)
Lar
ge
port
ion,
g/
pers
on
Uni
t w
eigh
t, g
Cou
ntry
U
nit w
eigh
t, ed
ible
por
tion
, g
Var
ia-
bilit
y fa
ctor
Cas
e IE
STI µ
g/kg
bw
/day
%
acu
te R
fD
roun
ded
VL
0482
L
ettu
ce, h
ead
- 0.
76
Tha
i 17
.1
117
558
UN
K
413
3 2b
15
.57
80%
VO
044
5 Pe
pper
s, s
wee
t (in
cl.
pim
(i)e
nto)
-
1.3
Tha
i 17
.1
71
172
UN
K
160
3 2b
16
.22
80%

A
nn
ex 4
466
E
TH
OX
YQ
UIN
(0
35
) In
tern
atio
nal e
stim
ate
of s
hort
term
inta
ke (
IEST
I) f
or
A
cute
RfD
= 0
.5 m
g/kg
bw
(50
0 µ
g/kg
bw
)
GE
NE
RA
L P
OP
UL
AT
ION
M
axim
um %
AR
fD:
20%
Lar
ge p
orti
on d
iet
U
nit w
eigh
t
Cod
ex
Cod
e C
omm
odit
y
ST
MR
or
STM
R-P
m
g/kg
HR
or
HR
-P
mg/
kg
Cou
ntry
B
ody
wei
ght
(kg)
Lar
ge
port
ion,
g/
pers
on
Uni
t w
eigh
t, g
Cou
ntry
U
nit
wei
ght,
edib
le
port
ion,
g
Var
ia-
bilit
y fa
ctor
Cas
e IE
STI
µg/
kg
bw/d
ay
% a
cute
R
fD
roun
ded
FP 0
230
Pear
-
6 FR
A
52.2
56
8 16
6 U
SA
151
3 2a
10
0.01
20
%
E
TH
OX
YQ
UIN
(0
35
) In
tern
atio
nal e
stim
ate
of s
hort
term
inta
ke (
IEST
I) f
or
A
cute
RfD
= 0
.5 m
g/kg
bw
(50
0 µ
g/kg
bw
)
CH
ILD
RE
N U
P T
O 6
YE
AR
S
M
axim
um %
AR
fD:
50%
Lar
ge p
orti
on d
iet
U
nit w
eigh
t
Cod
ex
Cod
e C
omm
odit
y ST
MR
or
STM
R-P
m
g/kg
HR
or
HR
-P
mg/
kg
Cou
ntry
B
ody
wei
ght
(kg)
Lar
ge
port
ion,
g/
pers
on
Uni
t w
eigh
t, g
Cou
ntry
U
nit
wei
ght,
edib
le
port
ion,
g
Var
ia-
bilit
y fa
ctor
Cas
e IE
STI
µg/
kg
bw/d
ay
% a
cute
R
fD
roun
ded
FP 0
230
Pear
-
6 U
NK
14
.5
279
166
USA
15
1 3
2a
240.
46
50%

An
nex
4
467
IM
IDA
CL
OP
RID
(2
06
) In
tern
atio
nal e
stim
ate
of s
hort
term
inta
ke (
IEST
I) f
or
A
cute
RfD
= 0
.4 m
g/kg
bw
(40
0 µ
g/kg
bw
)
GE
NE
RA
L P
OP
UL
AT
ION
M
axim
um %
AR
fD:
10%
Lar
ge p
orti
on d
iet
U
nit w
eigh
t
Cod
ex
Cod
e C
omm
odit
y
ST
MR
or
STM
R-P
m
g/kg
HR
or
HR
-P
mg/
kg
Cou
ntry
B
ody
wei
ght
(kg)
Lar
ge
port
ion.
g/
pers
on
Uni
t w
eigh
t. g
Cou
ntry
U
nit
wei
ght.
edib
le
port
ion.
g
Var
ia-
bilit
y fa
ctor
Cas
e IE
STI µ
g/kg
bw
/day
%
acu
te
RfD
ro
unde
d
TN
008
5 T
ree
nuts
-
0.01
JP
N
52.6
10
7 -
- N
D
ND
1
0.02
0%
TN
066
0 A
lmon
ds
- 0.
01
JPN
52
.6
74
- -
ND
N
D
1 0.
01
0%
VR
057
4 B
eetr
oot
- 0.
28
NL
D
63.0
41
4 62
U
SA
43
3 2a
2.
23
1%
FB 0
264
Bla
ckbe
rrie
s -
2.8
AU
S 67
.0
138
- -
ND
N
D
1 5.
77
1%
FB 0
020
Blu
eber
ries
-
2.8
AU
S 67
.0
158
- -
ND
N
D
1 6.
61
2%
FB 4
079
Boy
senb
erry
-
2.8
AU
S 67
.0
21
- -
ND
N
D
1 0.
90
0%
VR
057
7 C
arro
t -
0.28
N
LD
63
.0
335
61
USA
50
3
2a
1.93
0%
TN
029
5 C
ashe
w n
ut
- 0.
01
Tha
i 53
.5
200
- -
ND
N
D
1 0.
04
0%
VR
046
3 C
assa
va
- 0.
28
Tha
i 53
.5
161
- -
ND
N
D
1 0.
84
0%
VR
057
8 C
eler
iac
- 0.
28
FRA
62
.3
374
156
USA
13
4 3
2a
2.89
1%
TN
066
4 C
hest
nuts
-
0.01
A
US
67.0
40
0 -
- N
D
ND
1
0.06
0%
FB 0
265
Cra
nber
ries
-
2.8
USA
65
.0
229
- -
ND
N
D
1 9.
88
2%
FB 0
278
Cur
rant
, bla
ck
- 2.
8 U
NK
70
.1
1036
-
- N
D
ND
1
41.3
8 10
%
FB 0
279
Cur
rant
, red
, whi
te
- 2.
8 FR
A
62.3
15
3 -
- N
D
ND
1
6.89
2%
FB 0
021
Cur
rant
s, r
ed, b
lack
, whi
te
- 2.
8 FR
A
62.3
15
3 -
- N
D
ND
1
6.89
2%
FB 0
266
Dew
berr
ies,
incl
boy
sen-
& lo
ganb
erry
-
2.8
AU
S 67
.0
152
- -
ND
N
D
1 6.
36
2%
MO
010
5 E
dibl
e of
fal (
mam
mal
ian)
-
0.18
FR
A
62.3
27
7 -
- N
D
ND
1
0.80
0%
PE 0
112
Egg
s -
0.00
7 T
hai
53.5
19
5 -
- N
D
ND
1
0.03
0%
FB 0
267
Eld
erbe
rrie
s -
2.8
NL
D
63.0
21
-
- N
D
ND
1
0.95
0%
VP
0528
G
arde
n pe
a (g
reen
pod
s &
imm
atur
e se
eds)
-
3.8
USA
65
.0
244
- -
ND
N
D
1 14
.29
4%
VP
0529
G
arde
n pe
a, s
helle
d (i
mm
atur
e se
eds)
-
1.1
NL
D
63.0
30
1 -
- N
D
ND
1
5.25
1%
FB 0
268
Goo
sebe
rrie
s -
2.8
FRA
62
.3
153
- -
ND
N
D
1 6.
89
2%
TN
066
6 H
azel
nut
- 0.
01
AU
S 67
.0
70
- -
ND
N
D
1 0.
01
0%
VR
058
5 Je
rusa
lem
art
icho
ke
- 0.
28
AU
S 67
.0
10
150
USA
10
4 3
2b
0.13
0%
TN
066
9 M
acad
amia
nut
-
0.01
U
SA
65.0
10
7 -
- N
D
ND
1
0.02
0%
MM
009
5 M
eat f
rom
mam
mal
s ot
her
than
mar
ine
mam
mal
s: 2
0% a
s fa
t -
0.02
A
US
67.0
10
4 -
- N
D
ND
1
0.03
0%
MM
009
5 M
eat f
rom
mam
mal
s ot
her
than
mar
ine
mam
mal
s: 8
0% a
s m
uscl
e -
0.04
A
US
67.0
41
7 -
- N
D
ND
1
0.25
0%

A
nn
ex 4
468
IMID
AC
LO
PR
ID (
20
6)
Inte
rnat
iona
l est
imat
e of
sho
rt te
rm in
take
(IE
STI)
for
Acu
te R
fD=
0.4
mg/
kg b
w (
400
µg/
kg b
w)
GE
NE
RA
L P
OP
UL
AT
ION
M
axim
um %
AR
fD:
10%
Lar
ge p
orti
on d
iet
U
nit w
eigh
t
Cod
ex
Cod
e C
omm
odit
y
ST
MR
or
STM
R-P
m
g/kg
HR
or
HR
-P
mg/
kg
Cou
ntry
B
ody
wei
ght
(kg)
Lar
ge
port
ion.
g/
pers
on
Uni
t w
eigh
t. g
Cou
ntry
U
nit
wei
ght.
edib
le
port
ion.
g
Var
ia-
bilit
y fa
ctor
Cas
e IE
STI µ
g/kg
bw
/day
%
acu
te
RfD
ro
unde
d
ML
0106
M
ilks
0.01
8 -
USA
65
.0
2466
-
- N
D
ND
3
0.68
0%
VR
058
8 Pa
rsni
p -
0.28
U
NK
70
.1
202
133
USA
11
3 3
2a
1.71
0%
SO 0
697
Pean
ut, s
helle
d -
0.40
FR
A
62.3
16
1 -
- N
D
ND
1
1.04
0%
VD
007
2 Pe
as (
dry)
0.
62
- FR
A
62.3
44
5 -
- N
D
ND
3
4.43
1%
VP
0063
Pe
as (
gree
n po
ds &
imm
atur
e se
eds)
-
3.8
JPN
52
.6
63
- -
ND
N
D
1 4.
52
1%
VP
0064
Pe
as, s
helle
d (i
mm
atur
e se
eds)
-
1.1
UN
K
70.1
43
7 -
- N
D
ND
1
6.85
2%
TN
067
2 Pe
can
- 0.
01
AU
S 67
.0
23
- -
ND
N
D
1 0.
00
0%
TN
067
3 Pi
ne n
ut
- 0.
01
AU
S 67
.0
47
- -
ND
N
D
1 0.
01
0%
TN
067
5 Pi
stac
hio
nut
- 0.
01
AU
S 67
.0
300
- -
ND
N
D
1 0.
04
0%
VR
058
9 Po
tato
-
0.28
N
LD
63
.0
687
122
USA
99
3
2a
3.93
1%
PM 0
110
Poul
try
mea
t: 10
% a
s fa
t -
0.00
1 A
US
67.0
43
-
- N
D
ND
1
0.00
0%
PM 0
110
Poul
try
mea
t: 90
% a
s m
uscl
e -
0.00
3 A
US
67.0
38
8 -
- N
D
ND
1
0.02
0%
PO 0
111
Poul
try,
Edi
ble
offa
l of
- 0.
02
USA
65
.0
248
- -
ND
N
D
1 0.
08
0%
VR
049
4 R
adis
h -
0.28
FR
A
62.3
20
4 8
UN
K
7 1
1 0.
92
0%
VR
059
1 R
adis
h, J
apan
ese
- 0.
28
JPN
52
.6
267
1000
JP
N
1000
3
2b
4.26
1%
FB 0
272
Ras
pber
ries
, red
, bla
ck
- 2.
8 FR
A
62.3
32
4 -
- N
D
ND
1
14.5
6 4%
FB 0
273
R
ose
hips
-
2.8
NL
D
63.0
25
-
- N
D
ND
1
1.12
0%
VR
049
8 Sa
lsif
y -
0.28
U
NK
70
.1
334
- -
ND
N
D
1 1.
33
0%
FB 0
275
Stra
wbe
rry
- 0.
35
FRA
62
.3
346
13
UN
K
12
1 1
1.94
0%
SO 0
702
Sunf
low
er s
eed
0.05
-
USA
65
.0
193
- -
ND
N
D
3 0.
15
0%
VR
049
7 Sw
ede
- 0.
28
FRA
62
.3
204
- -
ND
N
D
1 0.
92
0%
VR
050
8 Sw
eet p
otat
o -
0.28
U
SA
65.0
53
6 13
0 U
SA
105
3 2a
3.
21
1%
VR
050
6 T
urni
p, g
arde
n -
0.28
U
SA
65.0
23
5 12
2 U
SA
105
3 2a
1.
91
0%
TN
067
8 W
alnu
t -
0.01
FR
A
62.3
13
6 -
- N
D
ND
1
0.02
0%

An
nex
4
469A
nnex
4
IM
IDA
CL
OP
RID
(2
06
) In
tern
atio
nal e
stim
ate
of s
hort
term
inta
ke (
IEST
I) f
or
A
cute
RfD
= 0
.4 m
g/kg
bw
(40
0 µ
g/kg
bw
)
CH
ILD
RE
N U
P T
O 6
YE
AR
S
M
axim
um %
AR
fD:
50%
Lar
ge p
orti
on d
iet
U
nit w
eigh
t
Cod
ex
Cod
e C
omm
odit
y ST
MR
or
STM
R-P
m
g/kg
HR
or
HR
-P
mg/
kg
Cou
ntry
B
ody
wei
ght
(kg)
Lar
ge
port
ion.
g/
pers
on
Uni
t w
eigh
t. g
Cou
ntry
U
nit
wei
ght.
edib
le
port
ion.
g
Var
ia-
bilit
y fa
ctor
Cas
e IE
STI µ
g/kg
bw
/day
%
acu
te
RfD
ro
unde
d
TN
008
5 T
ree
nuts
-
0.01
A
US
19.0
28
-
- N
D
ND
1
0.01
0%
TN
066
0 A
lmon
ds
- 0.
01
FRA
17
.8
31
- -
ND
N
D
1 0.
02
0%
VR
057
4 B
eetr
oot
- 0.
28
FRA
17
.8
223
62
USA
43
3
2a
4.87
1%
FB 0
264
Bla
ckbe
rrie
s -
2.8
FRA
17
.8
48
- -
ND
N
D
1 7.
48
2%
FB 0
020
Blu
eber
ries
-
2.8
FRA
17
.8
138
- -
ND
N
D
1 21
.76
5%
FB 4
079
Boy
senb
erry
-
2.8
USA
15
.0
2 -
- N
D
ND
1
0.34
0%
VR
057
7 C
arro
t -
0.28
FR
A
17.8
20
5 61
U
SA
50
3 2a
4.
79
1%
TN
029
5 C
ashe
w n
ut
- 0.
01
Tha
i 17
.1
99
- -
ND
N
D
1 0.
06
0%
VR
046
3 C
assa
va
- 0.
28
Tha
i 17
.1
113
- -
ND
N
D
1 1.
86
0%
VR
057
8 C
eler
iac
- 0.
28
FRA
17
.8
108
156
USA
13
4 3
2b
5.08
1%
TN
066
4 C
hest
nuts
-
0.01
T
hai
17.1
12
2 -
- N
D
ND
1
0.07
0%
FB 0
265
Cra
nber
ries
-
2.8
USA
15
.0
102
- -
ND
N
D
1 18
.98
5%
FB 0
278
Cur
rant
, bla
ck (
note
1)
- 2.
8 U
NK
14
.5
1054
-
- N
D
ND
1
203.
53
50%
FB 0
279
Cur
rant
, red
, whi
te
- 2.
8 -
- N
D
- -
ND
N
D
1 N
D
-
FB 0
021
Cur
rant
s, r
ed, b
lack
, whi
te
- 2.
8 A
US
19.0
58
4 -
- N
D
ND
1
86.1
0 20
%
FB 0
266
Dew
berr
ies,
incl
boy
sen-
& lo
ganb
erry
-
2.8
AU
S 19
.0
76
- -
ND
N
D
1 11
.20
3%
MO
010
5 E
dibl
e of
fal (
mam
mal
ian)
-
0.18
FR
A
17.8
20
3 -
- N
D
ND
1
2.05
1%
PE 0
112
Egg
s -
0.00
7 T
hai
17.1
10
9 -
- N
D
ND
1
0.04
0%
FB 0
267
Eld
erbe
rrie
s -
2.8
NL
D
17.0
9
- -
ND
N
D
1 1.
46
0%
VP
0528
G
arde
n pe
a (g
reen
pod
s &
imm
atur
e se
eds)
-
3.8
USA
15
.0
109
- -
ND
N
D
1 27
.70
7%
VP
0529
G
arde
n pe
a, s
helle
d (i
mm
atur
e se
eds)
-
1.1
NL
D
17.0
14
6 -
- N
D
ND
1
9.45
2%
FB 0
268
Goo
sebe
rrie
s -
2.8
- -
ND
-
- N
D
ND
1
ND
-
TN
066
6 H
azel
nut
- 0.
01
NL
D
17.0
11
-
- N
D
ND
1
0.01
0%
VR
058
5 Je
rusa
lem
art
icho
ke
- 0.
28
- -
ND
15
0 U
SA
104
3 N
D
ND
-
TN
066
9 M
acad
amia
nut
-
0.01
-
- N
D
- -
ND
N
D
1 N
D
-
MM
009
5 M
eat f
rom
mam
mal
s ot
her
than
mar
ine
mam
mal
s: 2
0% a
s fa
t -
0.02
A
US
19.0
52
-
- N
D
ND
1
0.05
0%
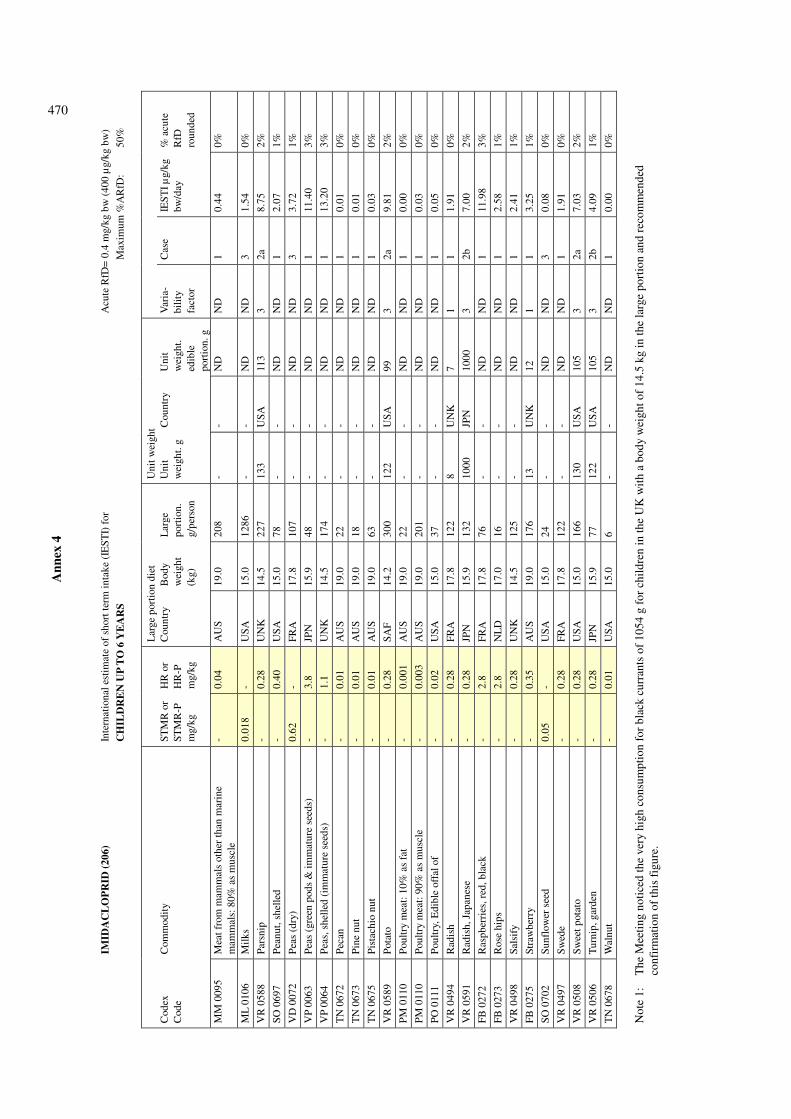
A
nn
ex 4
470
IMID
AC
LO
PR
ID (
20
6)
Inte
rnat
iona
l est
imat
e of
sho
rt te
rm in
take
(IE
STI)
for
Acu
te R
fD=
0.4
mg/
kg b
w (
400
µg/
kg b
w)
CH
ILD
RE
N U
P T
O 6
YE
AR
S
M
axim
um %
AR
fD:
50%
Lar
ge p
orti
on d
iet
U
nit w
eigh
t
Cod
ex
Cod
e C
omm
odit
y ST
MR
or
STM
R-P
m
g/kg
HR
or
HR
-P
mg/
kg
Cou
ntry
B
ody
wei
ght
(kg)
Lar
ge
port
ion.
g/
pers
on
Uni
t w
eigh
t. g
Cou
ntry
U
nit
wei
ght.
edib
le
port
ion.
g
Var
ia-
bilit
y fa
ctor
Cas
e IE
STI µ
g/kg
bw
/day
%
acu
te
RfD
ro
unde
d
MM
009
5 M
eat f
rom
mam
mal
s ot
her
than
mar
ine
mam
mal
s: 8
0% a
s m
uscl
e -
0.04
A
US
19.0
20
8 -
- N
D
ND
1
0.44
0%
ML
0106
M
ilks
0.01
8 -
USA
15
.0
1286
-
- N
D
ND
3
1.54
0%
VR
058
8 Pa
rsni
p -
0.28
U
NK
14
.5
227
133
USA
11
3 3
2a
8.75
2%
SO 0
697
Pean
ut, s
helle
d -
0.40
U
SA
15.0
78
-
- N
D
ND
1
2.07
1%
VD
007
2 Pe
as (
dry)
0.
62
- FR
A
17.8
10
7 -
- N
D
ND
3
3.72
1%
VP
0063
Pe
as (
gree
n po
ds &
imm
atur
e se
eds)
-
3.8
JPN
15
.9
48
- -
ND
N
D
1 11
.40
3%
VP
0064
Pe
as, s
helle
d (i
mm
atur
e se
eds)
-
1.1
UN
K
14.5
17
4 -
- N
D
ND
1
13.2
0 3%
TN
067
2 Pe
can
- 0.
01
AU
S 19
.0
22
- -
ND
N
D
1 0.
01
0%
TN
067
3 Pi
ne n
ut
- 0.
01
AU
S 19
.0
18
- -
ND
N
D
1 0.
01
0%
TN
067
5 Pi
stac
hio
nut
- 0.
01
AU
S 19
.0
63
- -
ND
N
D
1 0.
03
0%
VR
058
9 Po
tato
-
0.28
SA
F 14
.2
300
122
USA
99
3
2a
9.81
2%
PM 0
110
Poul
try
mea
t: 10
% a
s fa
t -
0.00
1 A
US
19.0
22
-
- N
D
ND
1
0.00
0%
PM 0
110
Poul
try
mea
t: 90
% a
s m
uscl
e -
0.00
3 A
US
19.0
20
1 -
- N
D
ND
1
0.03
0%
PO 0
111
Poul
try,
Edi
ble
offa
l of
- 0.
02
USA
15
.0
37
- -
ND
N
D
1 0.
05
0%
VR
049
4 R
adis
h -
0.28
FR
A
17.8
12
2 8
UN
K
7 1
1 1.
91
0%
VR
059
1 R
adis
h, J
apan
ese
- 0.
28
JPN
15
.9
132
1000
JP
N
1000
3
2b
7.00
2%
FB 0
272
Ras
pber
ries
, red
, bla
ck
- 2.
8 FR
A
17.8
76
-
- N
D
ND
1
11.9
8 3%
FB 0
273
R
ose
hips
-
2.8
NL
D
17.0
16
-
- N
D
ND
1
2.58
1%
VR
049
8 Sa
lsif
y -
0.28
U
NK
14
.5
125
- -
ND
N
D
1 2.
41
1%
FB 0
275
Stra
wbe
rry
- 0.
35
AU
S 19
.0
176
13
UN
K
12
1 1
3.25
1%
SO 0
702
Sunf
low
er s
eed
0.05
-
USA
15
.0
24
- -
ND
N
D
3 0.
08
0%
VR
049
7 Sw
ede
- 0.
28
FRA
17
.8
122
- -
ND
N
D
1 1.
91
0%
VR
050
8 Sw
eet p
otat
o -
0.28
U
SA
15.0
16
6 13
0 U
SA
105
3 2a
7.
03
2%
VR
050
6 T
urni
p, g
arde
n -
0.28
JP
N
15.9
77
12
2 U
SA
105
3 2b
4.
09
1%
TN
067
8 W
alnu
t -
0.01
U
SA
15.0
6
- -
ND
N
D
1 0.
00
0%
Not
e 1:
T
he M
eeti
ng n
otic
ed th
e ve
ry h
igh
cons
umpt
ion
for
blac
k cu
rran
ts o
f 10
54 g
for
chi
ldre
n in
the
UK
wit
h a
body
wei
ght o
f 14
.5 k
g in
the
larg
e po
rtio
n an
d re
com
men
ded
co
nfir
mat
ion
of th
is f
igur
e.

An
nex
4
471
MA
LA
TH
ION
(0
49
) In
tern
atio
nal e
stim
ate
of s
hort
term
inta
ke (
IEST
I) f
or
A
cute
RfD
= 2
mg/
kg b
w (
2000
µg/
kg b
w)
CH
ILD
RE
N U
P T
O 6
YE
AR
S
M
axim
um %
AR
fD:
10%
Lar
ge p
orti
on d
iet
U
nit w
eigh
t
Cod
ex
Cod
e C
omm
odit
y ST
MR
or
ST
MR
-P
mg/
kg
HR
or
HR
-P
mg/
kg
Cou
ntry
B
ody
wei
ght
(kg)
Lar
ge
port
ion,
g/
pers
on
Uni
t w
eigh
t, g
Cou
ntry
U
nit
wei
ght,
edib
le
port
ion,
g
Var
ia-
bilit
y fa
ctor
Cas
e IE
STI µ
g/kg
bw
/day
%
acu
te
RfD
ro
unde
d
GC
065
4 W
heat
-
10
FRA
18
.9
384
- -
ND
N
D
1 20
3.30
10
%
CM
065
4 W
heat
bra
n, u
npro
cess
ed
- 25
U
SA
15.0
30
-
- N
D
ND
1
49.5
0 2%
CF
1211
W
heat
flo
ur
- 0.
87
FRA
18
.9
245
- -
ND
N
D
1 11
.14
1%
CF
1212
W
heat
who
lem
eal
- 7.
5 U
SA
15.0
74
-
- N
D
ND
1
36.3
3 2%
CP
1211
W
hite
bre
ad
- 0.
2 SA
F 14
.2
270
- -
ND
N
D
1 3.
80
0%
CP
1212
W
hole
mea
l bre
ad
- 1.
2 SA
F 14
.2
240
- -
ND
N
D
1 20
.28
1%
M
AL
AT
HIO
N (
04
9)
Inte
rnat
iona
l est
imat
e of
sho
rt te
rm in
take
(IE
STI)
for
Acu
te R
fD=
2 m
g/kg
bw
(20
00 µ
g/kg
bw
)
GE
NE
RA
L P
OP
UL
AT
ION
M
axim
um %
AR
fD:
7%
Lar
ge p
orti
on d
iet
U
nit w
eigh
t
Cod
ex
Cod
e C
omm
odit
y
ST
MR
or
STM
R-P
m
g/kg
HR
or
HR
-P
mg/
kg
Cou
ntry
B
ody
wei
ght
(kg)
Lar
ge
port
ion,
g/
pers
on
Uni
t w
eigh
t, g
Cou
ntry
U
nit
wei
ght,
edib
le
port
ion,
g
Var
ia-
bilit
y fa
ctor
Cas
e IE
STI
µg/
kg
bw/d
ay
% a
cute
R
fD
roun
ded
GC
065
4 W
heat
-
10
FRA
52
.2
703
- -
ND
N
D
1 13
4.60
7%
CM
065
4 W
heat
bra
n, u
npro
cess
ed
- 25
U
SA
65.0
80
-
- N
D
ND
1
30.7
5 2%
CF
1211
W
heat
flo
ur
- 0.
86
FRA
52
.2
479
- -
ND
N
D
1 7.
89
0%
CF
1212
W
heat
who
lem
eal
- 7.
4 U
SA
65.0
15
5 -
- N
D
ND
1
17.6
9 1%
CP
1211
W
hite
bre
ad
- 0.
2 FR
A
52.2
47
4 -
- N
D
ND
1
1.82
0%
CP
1212
W
hole
mea
l bre
ad
- 1.
2 SA
F 55
.7
395
- -
ND
N
D
1 8.
52
0%
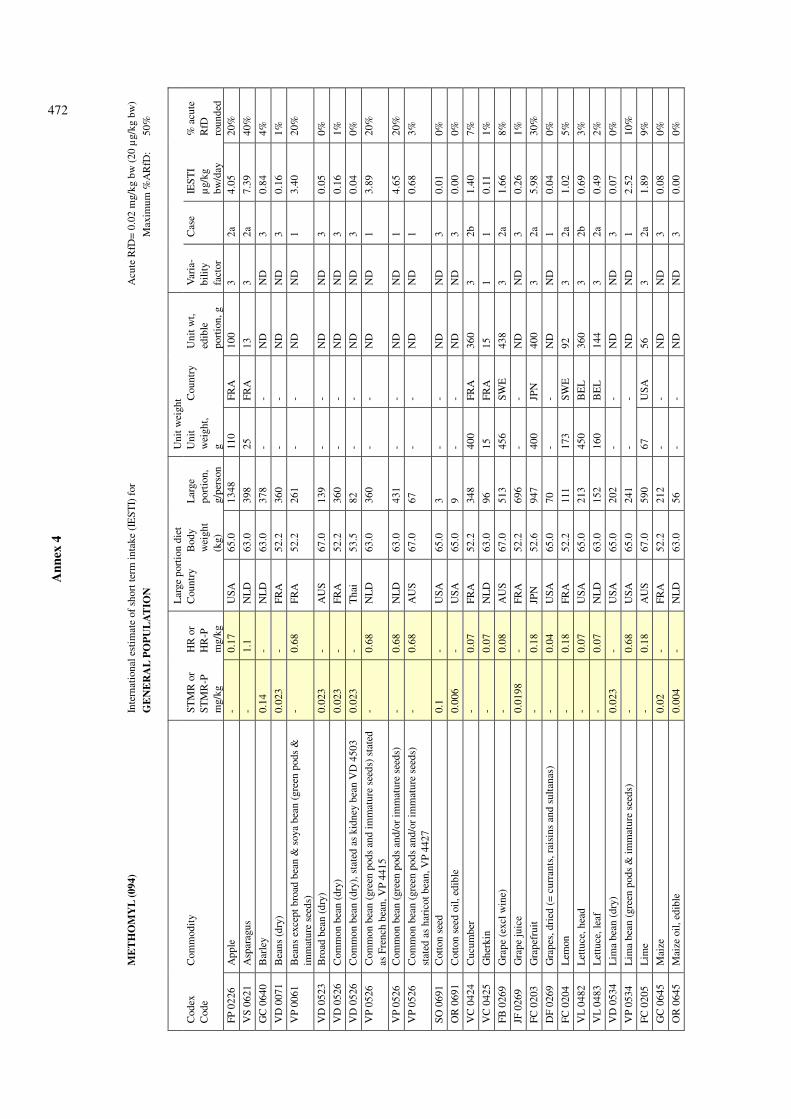
A
nn
ex 4
472
M
ET
HO
MY
L (
09
4)
Inte
rnat
iona
l est
imat
e of
sho
rt te
rm in
take
(IE
STI)
for
Acu
te R
fD=
0.0
2 m
g/kg
bw
(20
µg/
kg b
w)
GE
NE
RA
L P
OP
UL
AT
ION
M
axim
um %
AR
fD:
50%
Lar
ge p
orti
on d
iet
U
nit w
eigh
t
Cod
ex
Cod
e C
omm
odit
y
ST
MR
or
STM
R-P
m
g/kg
HR
or
HR
-P
mg/
kg
Cou
ntry
B
ody
wei
ght
(kg)
Lar
ge
port
ion,
g/
pers
on
Uni
t w
eigh
t, g
Cou
ntry
U
nit w
t, ed
ible
po
rtio
n, g
Var
ia-
bilit
y fa
ctor
Cas
e IE
STI
µg/
kg
bw/d
ay
% a
cute
R
fD
roun
ded
FP 0
226
App
le
- 0.
17
USA
65
.0
1348
11
0 FR
A
100
3 2a
4.
05
20%
VS
0621
A
spar
agus
-
1.1
NL
D
63.0
39
8 25
FR
A
13
3 2a
7.
39
40%
GC
064
0 B
arle
y 0.
14
- N
LD
63
.0
378
- -
ND
N
D
3 0.
84
4%
VD
007
1
Bea
ns (
dry)
0.
023
- FR
A
52.2
36
0 -
- N
D
ND
3
0.16
1%
VP
0061
B
eans
exc
ept b
road
bea
n &
soy
a be
an (
gree
n po
ds &
im
mat
ure
seed
s)
- 0.
68
FRA
52
.2
261
- -
ND
N
D
1 3.
40
20%
VD
052
3 B
road
bea
n (d
ry)
0.02
3 -
AU
S 67
.0
139
- -
ND
N
D
3 0.
05
0%
VD
052
6 C
omm
on b
ean
(dry
) 0.
023
- FR
A
52.2
36
0 -
- N
D
ND
3
0.16
1%
VD
052
6 C
omm
on b
ean
(dry
), s
tate
d as
kid
ney
bean
VD
450
3 0.
023
- T
hai
53.5
82
-
- N
D
ND
3
0.04
0%
VP
0526
C
omm
on b
ean
(gre
en p
ods
and
imm
atur
e se
eds)
sta
ted
as F
renc
h be
an, V
P 44
15
- 0.
68
NL
D
63.0
36
0 -
- N
D
ND
1
3.89
20
%
VP
0526
C
omm
on b
ean
(gre
en p
ods
and/
or im
mat
ure
seed
s)
- 0.
68
NL
D
63.0
43
1 -
- N
D
ND
1
4.65
20
%
VP
0526
C
omm
on b
ean
(gre
en p
ods
and/
or im
mat
ure
seed
s)
stat
ed a
s ha
rico
t bea
n, V
P 44
27
- 0.
68
AU
S 67
.0
67
- -
ND
N
D
1 0.
68
3%
SO 0
691
Cot
ton
seed
0.
1 -
USA
65
.0
3 -
- N
D
ND
3
0.01
0%
OR
069
1 C
otto
n se
ed o
il, e
dibl
e 0.
006
- U
SA
65.0
9
- -
ND
N
D
3 0.
00
0%
VC
042
4 C
ucum
ber
- 0.
07
FRA
52
.2
348
400
FRA
36
0 3
2b
1.40
7%
VC
042
5 G
herk
in
- 0.
07
NL
D
63.0
96
15
FR
A
15
1 1
0.11
1%
FB 0
269
Gra
pe (
excl
win
e)
- 0.
08
AU
S 67
.0
513
456
SWE
43
8 3
2a
1.66
8%
JF 0
269
Gra
pe ju
ice
0.01
98
- FR
A
52.2
69
6 -
- N
D
ND
3
0.26
1%
FC 0
203
Gra
pefr
uit
- 0.
18
JPN
52
.6
947
400
JPN
40
0 3
2a
5.98
30
%
DF
0269
G
rape
s, d
ried
(=
cur
rant
s, r
aisi
ns a
nd s
ulta
nas)
-
0.04
U
SA
65.0
70
-
- N
D
ND
1
0.04
0%
FC 0
204
Lem
on
- 0.
18
FRA
52
.2
111
173
SWE
92
3
2a
1.02
5%
VL
0482
L
ettu
ce, h
ead
- 0.
07
USA
65
.0
213
450
BE
L
360
3 2b
0.
69
3%
VL
0483
L
ettu
ce, l
eaf
- 0.
07
NL
D
63.0
15
2 16
0 B
EL
14
4 3
2a
0.49
2%
VD
053
4 L
ima
bean
(dr
y)
0.02
3 -
USA
65
.0
202
- -
ND
N
D
3 0.
07
0%
VP
0534
L
ima
bean
(gr
een
pods
& im
mat
ure
seed
s)
- 0.
68
USA
65
.0
241
- -
ND
N
D
1 2.
52
10%
FC 0
205
Lim
e -
0.18
A
US
67.0
59
0 67
U
SA
56
3 2a
1.
89
9%
GC
064
5 M
aize
0.
02
- FR
A
52.2
21
2 -
- N
D
ND
3
0.08
0%
OR
064
5 M
aize
oil,
edi
ble
0.00
4 -
NL
D
63.0
56
-
- N
D
ND
3
0.00
0%

An
nex
4
473
ME
TH
OM
YL
(0
94
) In
tern
atio
nal e
stim
ate
of s
hort
term
inta
ke (
IEST
I) f
or
A
cute
RfD
= 0
.02
mg/
kg b
w (
20 µ
g/kg
bw
)
GE
NE
RA
L P
OP
UL
AT
ION
M
axim
um %
AR
fD:
50%
Lar
ge p
orti
on d
iet
U
nit w
eigh
t
Cod
ex
Cod
e C
omm
odit
y
ST
MR
or
STM
R-P
m
g/kg
HR
or
HR
-P
mg/
kg
Cou
ntry
B
ody
wei
ght
(kg)
Lar
ge
port
ion,
g/
pers
on
Uni
t w
eigh
t, g
Cou
ntry
U
nit w
t, ed
ible
po
rtio
n, g
Var
ia-
bilit
y fa
ctor
Cas
e IE
STI
µg/
kg
bw/d
ay
% a
cute
R
fD
roun
ded
FC 0
206
Man
dari
n -
0.18
FR
A
52.2
63
9 16
8 U
SA
124
3 2a
3.
06
20%
VC
004
6 M
elon
s, e
xcep
t wat
erm
elon
-
0.07
FR
A
52.2
10
44
1000
U
SA
630
3 2a
3.
09
20%
FS 0
245
Nec
tari
ne
- 0.
1 FR
A
52.2
60
4 13
6 U
SA
125
3 2a
1.
64
8%
GC
064
7 O
ats
0.02
-
USA
65
.0
175
- -
ND
N
D
3 0.
05
0%
VA
038
5 O
nion
, Bul
b -
0.14
N
LD
63
.0
172
200
JPN
20
0 3
2b
1.15
6%
FC 0
004
Ora
nge,
sw
eet,
sour
+ o
rang
e-lik
e hy
brid
-
0.18
FR
A
52.2
10
44
205
BE
L
139
3 2a
4.
56
20%
FS 0
247
Peac
h -
0.1
SAF
55.7
68
5 15
0 JP
N
150
3 2a
1.
77
9%
FP 0
230
Pear
-
0.18
FR
A
52.2
56
8 17
0 B
EL
16
2 3
2a
3.07
20
%
VP
0063
Pe
as (
gree
n po
ds &
imm
atur
e se
eds)
-
4 JP
N
52.6
63
-
- N
D
ND
1
4.76
20
%
VO
044
4 Pe
pper
s, C
hilli
-
0.44
U
SA
65.0
90
45
U
SA
43
3 2a
1.
20
6%
VO
044
5 Pe
pper
s, s
wee
t (in
cl. p
im(i
)ent
o)
- 0.
44
FRA
52
.2
90
185
BE
L
148
3 2b
2.
28
10%
FS 0
014
Plum
(in
cl d
ried
) -
0.51
T
hai
53.5
48
0 59
B
EL
55
3
2a
5.63
30
%
VR
058
9 Po
tato
-
0 FR
A
52.2
63
9 12
2 U
SA
99
3 2a
0.
00
0%
FC 0
005
Shad
dock
or
pom
elo
+ s
hadd
ock-
like
hybr
id
- 0.
18
Tha
i 53
.5
554
210
FRA
12
6 3
2a
2.71
10
%
VD
054
1 So
ya b
ean
(dry
) 0.
023
- JP
N
52.6
15
9 -
- N
D
ND
3
0.07
0%
OR
054
1 So
ya b
ean
oil,
refi
ned
0.04
-
USA
65
.0
98
- -
ND
N
D
3 0.
06
0%
VC
043
1 Sq
uash
, sum
mer
(=
cou
rget
te)
- 0.
07
FRA
52
.2
351
300
FRA
27
0 3
2a
1.20
6%
VO
044
8 To
mat
o -
0.73
FR
A
52.2
38
7 15
0 B
EL
14
3 3
2a
9.39
50
%
VC
043
2 W
ater
mel
on
- 0.
07
USA
65
.0
1939
45
18
USA
20
78
3 2b
6.
26
30%
GC
065
4 W
heat
0.
14
- FR
A
52.2
70
3 -
- N
D
ND
3
1.88
9%
CM
065
4 W
heat
bra
n, u
npro
cess
ed
0.27
-
USA
65
.0
80
- -
ND
N
D
3 0.
33
2%
CF
1211
W
heat
flo
ur
0.00
3 -
FRA
52
.2
479
- -
ND
N
D
3 0.
03
0%
CF
1210
W
heat
ger
m
0.13
-
FRA
52
.2
174
- -
ND
N
D
3 0.
43
2%
- W
ine
0.05
3 -
FRA
52
.2
1006
-
- N
D
ND
3
1.02
5%
VC
043
3 W
inte
r sq
uash
(=
pum
pkin
), s
tate
d as
pum
pkin
, VC
04
29
- 0.
07
SAF
55.7
10
03
1000
JP
N
1000
3
2a
3.77
20
%
VP
0544
Y
ard-
long
bea
ns (
gree
n po
ds &
imm
atur
e se
eds)
-
0.68
T
hai
53.5
13
9 -
- N
D
ND
1
1.76
9%

A
nn
ex 4
474
M
ET
HO
MY
L (
09
4)
Inte
rnat
iona
l est
imat
e of
sho
rt te
rm in
take
(IE
STI)
for
Acu
te R
fD=
0.0
2 m
g/kg
bw
(20
µg/
kg b
w)
CH
ILD
RE
N U
P T
O 6
YE
AR
S
M
axim
um
%A
RfD
: 10
0%
Lar
ge p
orti
on d
iet
U
nit w
eigh
t
Cod
ex
Cod
e C
omm
odit
y ST
MR
or
STM
R-P
m
g/kg
HR
or
HR
-P
mg/
kg
Cou
ntry
B
ody
wei
ght
(kg)
Lar
ge
port
ion,
g/
pers
on
Uni
t w
eigh
t, g
Cou
ntry
U
nit w
t, ed
ible
po
rtio
n, g
Var
ia-
bilit
y fa
ctor
Cas
e IE
STI
µg/
kg
bw/d
ay
% a
cute
R
fD
roun
ded
FP 0
226
App
le
- 0.
17
USA
15
.0
679
162
SWE
14
9 3
2a
11.0
7 60
%
VS
0621
A
spar
agus
-
1.1
USA
15
.0
178
25
FRA
13
3
2a
14.9
0 70
%
GC
064
0 B
arle
y 0.
14
- A
US
19.0
14
-
- N
D
ND
3
0.10
1%
VD
007
1
Bea
ns (
dry)
0.
023
- A
US
19.0
22
2 -
- N
D
ND
3
0.27
1%
VP
0061
B
eans
exc
ept b
road
bea
n &
soy
a be
an (
gree
n po
ds &
im
mat
ure
seed
s)
- 0.
68
FRA
18
.9
215
- -
ND
N
D
1 7.
75
40%
VD
052
3 B
road
bea
n (d
ry)
0.02
3 -
AU
S 19
.0
32
- -
ND
N
D
3 0.
04
0%
VD
052
6 C
omm
on b
ean
(dry
) 0.
023
- FR
A
18.9
14
5 -
- N
D
ND
3
0.18
1%
VD
052
6 C
omm
on b
ean
(dry
), s
tate
d as
kid
ney
bean
VD
450
3 0.
023
- T
hai
17.1
45
-
- N
D
ND
3
0.06
0%
VP
0526
C
omm
on b
ean
(gre
en p
ods
and
imm
atur
e se
eds)
st
ated
as
Fren
ch b
ean,
VP
4415
-
0.68
N
LD
17
.0
253
- -
ND
N
D
1 10
.12
50%
VP
0526
C
omm
on b
ean
(gre
en p
ods
and/
or im
mat
ure
seed
s)
- 0.
68
NL
D
17.0
18
4 -
- N
D
ND
1
7.36
40
%
VP
0526
C
omm
on b
ean
(gre
en p
ods
and/
or im
mat
ure
seed
s)
stat
ed a
s ha
rico
t bea
n, V
P 44
27
- 0.
68
AU
S 19
.0
42
- -
ND
N
D
1 1.
50
8%
SO 0
691
Cot
ton
seed
0.
1 -
USA
15
.0
1 -
- N
D
ND
3
0.01
0%
OR
069
1 C
otto
n se
ed o
il, e
dibl
e 0.
006
- U
SA
15.0
6
- -
ND
N
D
3 0.
00
0%
VC
042
4 C
ucum
ber
- 0.
07
NL
D
17.0
16
2 40
0 FR
A
360
3 2b
2.
00
10%
VC
042
5 G
herk
in
- 0.
07
NL
D
17.0
56
59
U
KN
55
3
2a
0.69
3%
FB 0
269
Gra
pe (
incl
win
e)
- 0.
08
JPN
15
.9
388
456
SWE
43
8 3
2b
5.85
30
%
JF 0
269
Gra
pe ju
ice
0.01
98
- FR
A
18.9
50
0 -
- N
D
ND
3
0.52
3%
FC 0
203
Gra
pefr
uit
- 0.
18
FRA
18
.9
405
400
JPN
40
0 3
2a
11.4
8 60
%
DF
0269
G
rape
s, d
ried
(=
cur
rant
s, r
aisi
ns a
nd s
ulta
nas)
-
0.04
U
SA
15.0
59
-
- N
D
ND
1
0.16
1%
FC 0
204
Lem
on
- 0.
18
JPN
15
.9
88
173
SWE
92
3
2b
3.00
20
%
VL
0482
L
ettu
ce, h
ead
- 0.
07
Tha
i 17
.1
117
450
BE
L
360
3 2b
1.
43
7%
VL
0483
L
ettu
ce, l
eaf
- 0.
07
NL
D
17.0
10
2 16
0 B
EL
14
4 3
2b
1.26
6%
VD
053
4 L
ima
bean
(dr
y)
0.02
3 -
USA
15
.0
74
- -
ND
N
D
3 0.
11
1%
VP
0534
L
ima
bean
(gr
een
pods
& im
mat
ure
seed
s)
- 0.
68
USA
15
.0
117
- -
ND
N
D
1 5.
32
30%
FC 0
205
Lim
e -
0.18
A
US
19.0
26
67
U
SA
56
3 2b
0.
73
4%
GC
064
5 M
aize
0.
02
- FR
A
18.9
11
7 -
- N
D
ND
3
0.12
1%
OR
064
5 M
aize
oil,
edi
ble
0.00
4 -
NL
D
17.0
12
-
- N
D
ND
3
0.00
0%

An
nex
4
475
ME
TH
OM
YL
(0
94
) In
tern
atio
nal e
stim
ate
of s
hort
term
inta
ke (
IEST
I) f
or
A
cute
RfD
= 0
.02
mg/
kg b
w (
20 µ
g/kg
bw
)
CH
ILD
RE
N U
P T
O 6
YE
AR
S
M
axim
um
%A
RfD
: 10
0%
Lar
ge p
orti
on d
iet
U
nit w
eigh
t
Cod
ex
Cod
e C
omm
odit
y ST
MR
or
STM
R-P
m
g/kg
HR
or
HR
-P
mg/
kg
Cou
ntry
B
ody
wei
ght
(kg)
Lar
ge
port
ion,
g/
pers
on
Uni
t w
eigh
t, g
Cou
ntry
U
nit w
t, ed
ible
po
rtio
n, g
Var
ia-
bilit
y fa
ctor
Cas
e IE
STI
µg/
kg
bw/d
ay
% a
cute
R
fD
roun
ded
FC 0
206
Man
dari
n -
0.18
JP
N
15.9
35
3 16
8 U
SA
124
3 2a
6.
81
30%
VC
004
6 M
elon
s, e
xcep
t wat
erm
elon
-
0.07
FR
A
18.9
59
7 70
0 FR
A
420
3 2a
5.
32
30%
FS 0
245
Nec
tari
ne
- 0.
1 A
US
19.0
30
2 11
0 FR
A
99
3 2a
2.
63
10%
GC
064
7 O
ats
0.02
-
USA
15
.0
62
- -
ND
N
D
3 0.
08
0%
VA
038
5 O
nion
, Bul
b -
0.14
N
LD
17
.0
86
140
FRA
12
6 3
2b
2.11
10
%
FC 0
004
Ora
nge,
sw
eet,
sour
+ o
rang
e-lik
e hy
brid
-
0.18
U
NK
14
.5
495
200
JPN
20
0 3
2a
11.1
1 60
%
FS 0
247
Peac
h -
0.1
AU
S 19
.0
315
150
JPN
15
0 3
2a
3.24
20
%
FP 0
230
Pear
-
0.18
U
NK
14
.5
279
170
BE
L
162
3 2a
7.
47
40%
VP
0063
Pe
as (
gree
n po
ds &
imm
atur
e se
eds)
-
4 JP
N
15.9
48
-
- N
D
ND
1
12.0
0 60
%
VO
044
4 Pe
pper
s, C
hilli
-
0.44
A
US
19.0
31
45
U
SA
43
3 2b
2.
12
10%
VO
044
5 Pe
pper
s, s
wee
t (in
cl. p
im(i
)ent
o)
- 0.
44
Tha
i 17
.1
71
119
USA
98
3
2b
5.49
30
%
FS 0
014
Plum
(in
cl d
ried
) -
0.51
T
hai
17.1
37
7 66
U
SA
62
3 2a
14
.94
70%
VR
058
9 Po
tato
-
0 SA
F 14
.2
300
122
USA
99
3
2a
0.00
0%
FC 0
005
Shad
dock
or
pom
elo
+ s
hadd
ock-
like
hybr
id
- 0.
18
Tha
i 17
.1
327
210
FRA
12
6 3
2a
6.09
30
%
VD
054
1 So
ya b
ean
(dry
) 0.
023
- JP
N
15.9
88
-
- N
D
ND
3
0.13
1%
OR
054
1 So
ya b
ean
oil,
refi
ned
0.04
-
USA
15
.0
35
- -
ND
N
D
3 0.
09
0%
VC
043
1 Sq
uash
, sum
mer
(=
cou
rget
te)
- 0.
07
AU
S 19
.0
219
300
FRA
27
0 3
2b
2.42
10
%
VO
044
8 To
mat
o -
0.73
FR
A
18.9
21
5 15
0 B
EL
14
3 3
2a
19.3
3 10
0%
VC
043
2 W
ater
mel
on
- 0.
07
AU
S 19
.0
1473
45
18
USA
20
78
3 2b
16
.28
80%
GC
065
4 W
heat
0.
14
- FR
A
18.9
38
4 -
- N
D
ND
3
2.85
10
%
CM
065
4 W
heat
bra
n, u
npro
cess
ed
0.27
-
USA
15
.0
30
- -
ND
N
D
3 0.
53
3%
CF
1211
W
heat
flo
ur
0.00
3 -
FRA
18
.9
245
- -
ND
N
D
3 0.
04
0%
CF
1210
W
heat
ger
m
0.13
-
USA
15
.0
8 -
- N
D
ND
3
0.07
0%
- W
ine
0.05
3 -
FRA
18
.9
89
- -
ND
N
D
3 0.
25
1%
VC
043
3 W
inte
r sq
uash
(=
pum
pkin
), s
tate
d as
pum
pkin
, VC
04
29
- 0.
07
SAF
14.2
22
4 10
00
JPN
10
00
3 2b
3.
32
20%
VP
0544
Y
ard-
long
bea
ns (
gree
n po
ds &
imm
atur
e se
eds)
-
0.68
T
hai
17.1
79
-
- N
D
ND
1
3.13
20
%
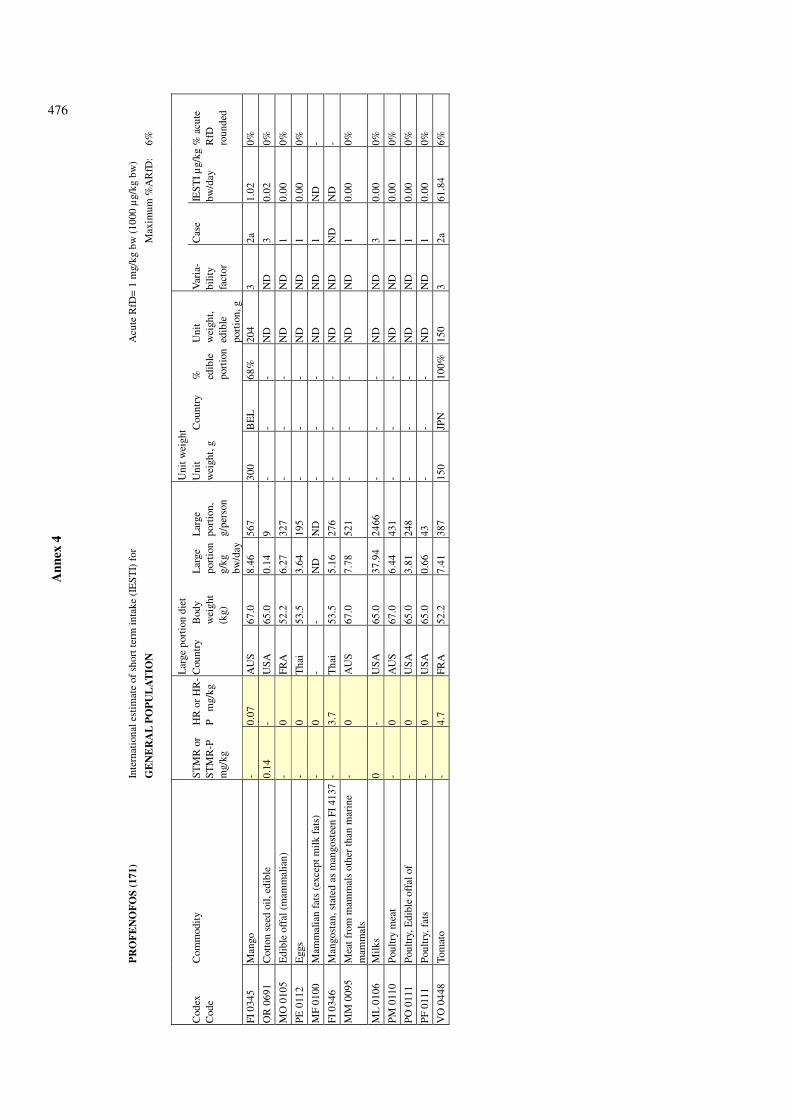
A
nn
ex 4
476
P
RO
FE
NO
FO
S (
17
1)
Inte
rnat
iona
l est
imat
e of
sho
rt te
rm in
take
(IE
STI)
for
A
cute
RfD
= 1
mg/
kg b
w (
1000
µg/
kg b
w)
GE
NE
RA
L P
OP
UL
AT
ION
M
axim
um %
AR
fD:
6%
Lar
ge p
orti
on d
iet
U
nit w
eigh
t
Cod
ex
Cod
e C
omm
odit
y
ST
MR
or
STM
R-P
m
g/kg
HR
or
HR
-P
mg/
kg
Cou
ntry
B
ody
wei
ght
(kg)
Lar
ge
port
ion
g/kg
bw
/day
Lar
ge
port
ion,
g/
pers
on
Uni
t w
eigh
t, g
Cou
ntry
%
ed
ible
po
rtio
n
Uni
t w
eigh
t, ed
ible
po
rtio
n, g
Var
ia-
bilit
y fa
ctor
Cas
e IE
STI µ
g/kg
bw
/day
%
acu
te
RfD
ro
unde
d
FI 0
345
Man
go
- 0.
07
AU
S 67
.0
8.46
56
7 30
0 B
EL
68
%
204
3 2a
1.
02
0%
OR
069
1 C
otto
n se
ed o
il, e
dibl
e 0.
14
- U
SA
65.0
0.
14
9 -
- -
ND
N
D
3 0.
02
0%
MO
010
5 E
dibl
e of
fal (
mam
mal
ian)
-
0 FR
A
52.2
6.
27
327
- -
- N
D
ND
1
0.00
0%
PE 0
112
Egg
s -
0 T
hai
53.5
3.
64
195
- -
- N
D
ND
1
0.00
0%
MF
0100
M
amm
alia
n fa
ts (
exce
pt m
ilk f
ats)
-
0 -
- N
D
ND
-
- -
ND
N
D
1 N
D
-
FI 0
346
Man
gost
an, s
tate
d as
man
gost
een
FI 4
137
- 3.
7 T
hai
53.5
5.
16
276
- -
- N
D
ND
N
D
ND
-
MM
009
5 M
eat f
rom
mam
mal
s ot
her
than
mar
ine
mam
mal
s -
0 A
US
67.0
7.
78
521
- -
- N
D
ND
1
0.00
0%
ML
0106
M
ilks
0 -
USA
65
.0
37.9
4 24
66
- -
- N
D
ND
3
0.00
0%
PM 0
110
Poul
try
mea
t -
0 A
US
67.0
6.
44
431
- -
- N
D
ND
1
0.00
0%
PO 0
111
Poul
try,
Edi
ble
offa
l of
- 0
USA
65
.0
3.81
24
8 -
- -
ND
N
D
1 0.
00
0%
PF 0
111
Poul
try,
fat
s -
0 U
SA
65.0
0.
66
43
- -
- N
D
ND
1
0.00
0%
VO
044
8 To
mat
o -
4.7
FRA
52
.2
7.41
38
7 15
0 JP
N
100%
15
0 3
2a
61.8
4 6%
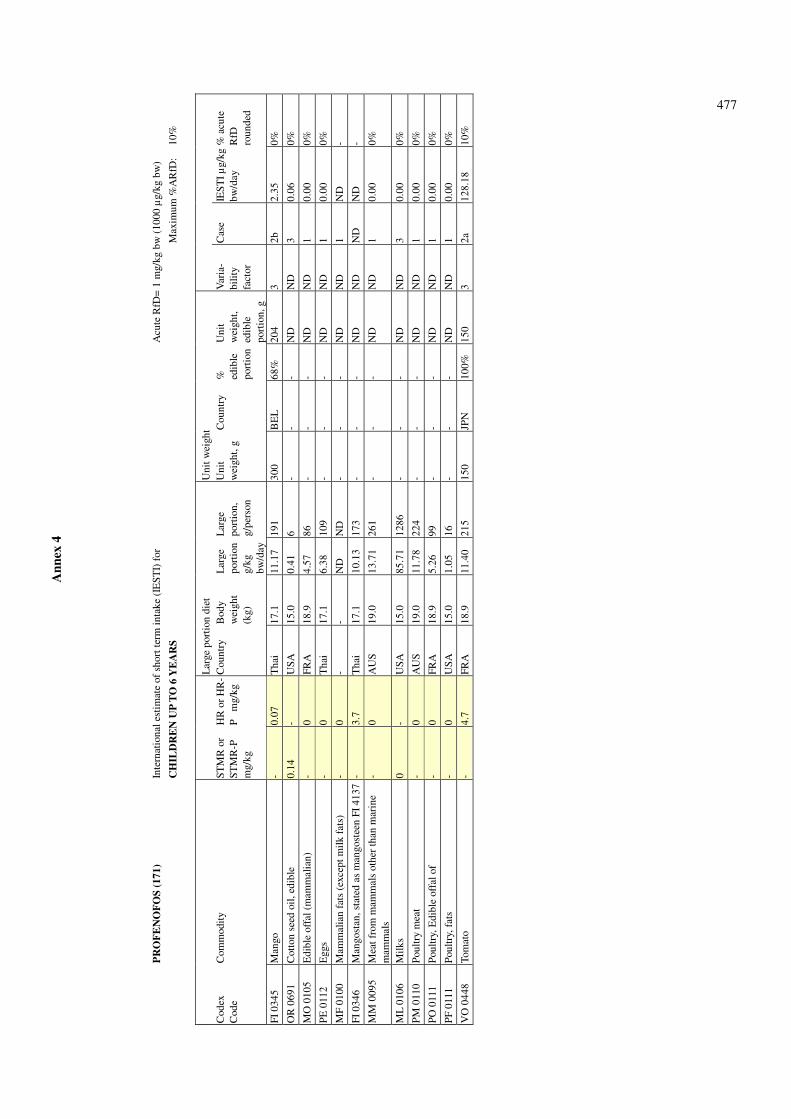
An
nex
4
477
P
RO
FE
NO
FO
S (
17
1)
Inte
rnat
iona
l est
imat
e of
sho
rt te
rm in
take
(IE
STI)
for
A
cute
RfD
= 1
mg/
kg b
w (
1000
µg/
kg b
w)
CH
ILD
RE
N U
P T
O 6
YE
AR
S
M
axim
um %
AR
fD:
10%
Lar
ge p
orti
on d
iet
U
nit w
eigh
t
Cod
ex
Cod
e C
omm
odit
y ST
MR
or
STM
R-P
m
g/kg
HR
or
HR
-P
mg/
kg
Cou
ntry
B
ody
wei
ght
(kg)
Lar
ge
port
ion
g/kg
bw
/day
Lar
ge
port
ion,
g/
pers
on
Uni
t w
eigh
t, g
Cou
ntry
%
ed
ible
po
rtio
n
Uni
t w
eigh
t, ed
ible
po
rtio
n, g
Var
ia-
bilit
y fa
ctor
Cas
e IE
STI µ
g/kg
bw
/day
%
acu
te
RfD
ro
unde
d
FI 0
345
Man
go
- 0.
07
Tha
i 17
.1
11.1
7 19
1 30
0 B
EL
68
%
204
3 2b
2.
35
0%
OR
069
1 C
otto
n se
ed o
il, e
dibl
e 0.
14
- U
SA
15.0
0.
41
6 -
- -
ND
N
D
3 0.
06
0%
MO
010
5 E
dibl
e of
fal (
mam
mal
ian)
-
0 FR
A
18.9
4.
57
86
- -
- N
D
ND
1
0.00
0%
PE 0
112
Egg
s -
0 T
hai
17.1
6.
38
109
- -
- N
D
ND
1
0.00
0%
MF
0100
M
amm
alia
n fa
ts (
exce
pt m
ilk f
ats)
-
0 -
- N
D
ND
-
- -
ND
N
D
1 N
D
-
FI 0
346
Man
gost
an, s
tate
d as
man
gost
een
FI 4
137
- 3.
7 T
hai
17.1
10
.13
173
- -
- N
D
ND
N
D
ND
-
MM
009
5 M
eat f
rom
mam
mal
s ot
her
than
mar
ine
mam
mal
s -
0 A
US
19.0
13
.71
261
- -
- N
D
ND
1
0.00
0%
ML
0106
M
ilks
0 -
USA
15
.0
85.7
1 12
86
- -
- N
D
ND
3
0.00
0%
PM 0
110
Poul
try
mea
t -
0 A
US
19.0
11
.78
224
- -
- N
D
ND
1
0.00
0%
PO 0
111
Poul
try,
Edi
ble
offa
l of
- 0
FRA
18
.9
5.26
99
-
- -
ND
N
D
1 0.
00
0%
PF 0
111
Poul
try,
fat
s -
0 U
SA
15.0
1.
05
16
- -
- N
D
ND
1
0.00
0%
VO
044
8 To
mat
o -
4.7
FRA
18
.9
11.4
0 21
5 15
0 JP
N
100%
15
0 3
2a
128.
18
10%

A
nn
ex 4
478
P
RO
TH
IOC
ON
AZ
OL
E (
23
2)
Inte
rnat
iona
l est
imat
e of
sho
rt te
rm in
take
(IE
STI)
for
Acu
te R
fD=
0.0
1 m
g/kg
bw
(10
µg/
kg b
w)
WO
ME
N O
F C
HIL
D B
EA
RIN
G A
GE
Max
imum
%A
RfD
: 2%
Lar
ge p
orti
on d
iet
U
nit w
eigh
t
Cod
ex
Cod
e C
omm
odit
y
ST
MR
or
STM
R-P
m
g/kg
HR
or
HR
-P
mg/
kg
Cou
ntry
B
ody
wei
ght
(kg)
Lar
ge
port
ion,
g/
pers
on
Uni
t w
eigh
t, g
Cou
ntry
U
nit
wei
ght,
edib
le
port
ion,
g
Var
ia-
bilit
y fa
ctor
Cas
e IE
STI µ
g/kg
bw
/day
%
acu
te
RfD
ro
unde
d
SO 0
495
Rap
e se
ed
0.01
-
- -
ND
-
- N
D
ND
3
ND
-
GC
064
0 B
arle
y 0.
01
- N
LD
63
.0
378
- -
ND
N
D
3 0.
63
1%
MO
010
5 E
dibl
e of
fal (
mam
mal
ian)
0.1
FRA
52
.2
327
- -
ND
N
D
3 N
D
-
MF
0100
M
amm
alia
n fa
ts (
exce
pt m
ilk f
ats)
0.01
-
- N
D
- -
ND
N
D
3 N
D
-
MM
009
5 M
eat f
rom
mam
mal
s ot
her
than
mar
ine
mam
mal
s
0.01
A
US
67.0
52
1 -
- N
D
ND
3
0.08
-
ML
0106
M
ilks
0.00
4 -
USA
65
.0
2466
-
- N
D
ND
3
0.15
2%
GC
064
7 O
ats
0.01
-
USA
65
.0
175
- -
ND
N
D
ND
N
D
-
GC
065
0 R
ye
0.01
-
FRA
52
.2
161
- -
ND
N
D
3 0.
03
0%
GC
065
4 W
heat
0.
01
- FR
A
52.2
70
3 -
- N
D
ND
N
D
ND
-
CF
1211
W
heat
flo
ur
0.00
4 -
FRA
52
.2
479
- -
ND
N
D
ND
N
D
-
CF
1210
W
heat
ger
m
0.02
-
FRA
52
.2
174
- -
ND
N
D
3 0.
07
1%

An
nex
4
479
PR
OT
HIO
CO
NA
ZO
LE
(2
32
) In
tern
atio
nal e
stim
ate
of s
hort
term
inta
ke (
IEST
I) f
or
A
cute
RfD
= 1
mg/
kg b
w
CH
ILD
RE
N U
P T
O 6
YE
AR
S
M
axim
um %
AR
fD:
0
Lar
ge p
orti
on d
iet
U
nit w
eigh
t
Cod
ex
Cod
e C
omm
odit
y ST
MR
or
STM
R-P
m
g/kg
HR
or
HR
-P
mg/
kg
Cou
ntry
B
ody
wei
ght
(kg)
Lar
ge
port
ion,
g/
pers
on
Uni
t w
eigh
t, g
Cou
ntry
U
nit
wei
ght,
edib
le
port
ion,
g
Var
ia-
bilit
y fa
ctor
Cas
e IE
STI µ
g/kg
bw
/day
%
acu
te
RfD
ro
unde
d
SO 0
495
Rap
e se
ed
0.01
-
- -
ND
-
- N
D
ND
3
ND
-
GC
064
0 B
arle
y 0.
01
- A
US
19.0
14
-
- N
D
ND
3
0.01
0%
MO
010
5 E
dibl
e of
fal (
mam
mal
ian)
0.1
FRA
18
.9
86
- -
ND
N
D
1 0.
45
-
MF
0100
M
amm
alia
n fa
ts (
exce
pt m
ilk f
ats)
0.01
-
- N
D
- -
ND
N
D
1 N
D
-
MM
009
5 M
eat f
rom
mam
mal
s ot
her
than
mar
ine
mam
mal
s
0.01
A
US
19.0
26
1 -
- N
D
ND
1
0.14
-
ML
0106
M
ilks
0.00
4 -
USA
15
.0
1286
-
- N
D
ND
3
0.34
0%
GC
064
7 O
ats
0.01
-
USA
15
.0
62
- -
ND
N
D
ND
N
D
-
GC
065
0 R
ye
0.01
-
NL
D
17.0
37
-
- N
D
ND
3
0.02
0%
GC
065
4 W
heat
0.
01
- FR
A
18.9
38
4 -
- N
D
ND
N
D
ND
-
CF
1211
W
heat
flo
ur
0.00
4 -
FRA
18
.9
245
- -
ND
N
D
ND
N
D
-
CF
1210
W
heat
ger
m
0.02
-
USA
15
.0
8 -
- N
D
ND
3
0.01
0%

A
nn
ex 4
480
PR
OT
HIO
CO
NA
ZO
LE
(2
32
) In
tern
atio
nal e
stim
ate
of s
hort
term
inta
ke (
IEST
I) f
or
A
cute
RfD
= 1
mg/
kg b
w
GE
NE
RA
L P
OP
UL
AT
ION
M
axim
um %
AR
fD:
0%
Lar
ge p
orti
on d
iet
U
nit w
eigh
t
Cod
ex
Cod
e C
omm
odit
y
STM
R o
r ST
MR
-P
mg/
kg
HR
or
HR
-P
mg/
kg
Cou
ntry
B
ody
wei
ght
(kg)
Lar
ge
port
ion,
g/
pers
on
Uni
t w
eigh
t, g
Cou
ntry
U
nit
wei
ght,
edib
le
port
ion,
g
Var
ia-
bilit
y fa
ctor
Cas
e IE
STI µ
g/kg
bw
/day
%
acu
te
RfD
ro
unde
d
SO 0
495
Rap
e se
ed
0.01
-
- -
ND
-
- N
D
ND
3
ND
-
GC
064
0 B
arle
y 0.
01
- N
LD
63
.0
378
- -
ND
N
D
3 0.
06
0%
MO
010
5 E
dibl
e of
fal (
mam
mal
ian)
0.1
FRA
52
.2
327
- -
ND
N
D
1 0.
63
-
MF
0100
M
amm
alia
n fa
ts (
exce
pt m
ilk f
ats)
0.01
-
- N
D
- -
ND
N
D
1 N
D
-
MM
009
5 M
eat f
rom
mam
mal
s ot
her
than
mar
ine
mam
mal
s
0.01
A
US
67.0
52
1 -
- N
D
ND
1
0.08
-
ML
0106
M
ilks
0.00
4 -
USA
65
.0
2466
-
- N
D
ND
3
0.15
0%
GC
064
7 O
ats
0.01
-
USA
65
.0
175
- -
ND
N
D
3.00
N
D
-
GC
065
0 R
ye
0.01
-
FRA
52
.2
161
- -
ND
N
D
3 0.
03
0%
GC
065
4 W
heat
0.
01
- FR
A
52.2
70
3 -
- N
D
ND
3.
00
ND
-
CF
1211
W
heat
flo
ur
0.00
4 -
FRA
52
.2
479
- -
ND
N
D
ND
N
D
-
CF
1210
W
heat
ger
m
0.02
-
FRA
52
.2
174
- -
ND
N
D
3 0.
07
0%

An
nex
4
481
S
PIR
OT
ET
RA
MA
T (
23
4)
Inte
rnat
iona
l est
imat
e of
sho
rt te
rm in
take
(IE
STI)
for
A
cute
RfD
= 1
.0 m
g/kg
bw
(10
00 µ
g/kg
bw
)
GE
NE
RA
L P
OP
UL
AT
ION
Max
imum
%A
RfD
: 10
%
Lar
ge p
orti
on d
iet
U
nit w
eigh
t
Cod
ex
Cod
e C
omm
odit
y
ST
MR
or
STM
R-P
m
g/kg
HR
or
HR
-P
mg/
kg
Cou
ntry
B
ody
wei
ght
(kg)
Lar
ge
port
ion,
g/
pers
on
Uni
t w
eigh
t, g
Cou
ntry
U
nit
wei
ght,
edib
le
port
ion,
g
Var
ia-
bilit
y fa
ctor
Cas
e IE
STI
µg/
kg
bw/d
ay
% a
cute
R
fD
roun
ded
TN
066
0 A
lmon
ds
- 0.
29
JPN
52
.6
74
- -
ND
N
D
1 0.
41
0%
FP 0
226
App
le
- 0.
55
USA
65
.0
1348
13
8 U
SA
127
3 2a
13
.56
1%
JF 0
226
App
le ju
ice
0.08
2
- -
ND
-
- N
D
ND
3
ND
-
DF
0226
A
pple
, dri
ed
- 0.
55
AU
S 67
.0
10
- -
ND
N
D
ND
N
D
-
FS 0
240
Apr
icot
-
2.1
FRA
52
.2
369
35
USA
34
3
2a
17.5
3 2%
VC
042
1 B
alsa
m p
ear,
stat
ed a
s bi
tter
gou
rd, V
C
4195
-
0.18
T
hai
53.5
12
0 -
- N
D
ND
N
D
ND
-
TN
066
2 B
razi
l nut
-
0.29
N
LD
63
.0
23
- -
ND
N
D
1 0.
10
0%
VB
040
0 B
rocc
oli
- 0.
87
FRA
52
.2
537
608
USA
47
4 3
2a
24.7
6 2%
VB
040
1 B
rocc
oli,
Chi
nese
-
0.87
A
US
67.0
23
1 -
- N
D
ND
N
D
ND
-
VB
040
2 B
russ
els
spro
uts
- 0.
87
FRA
52
.2
351
10
UN
K
7 1
1 5.
86
1%
VB
004
1 C
abba
ges,
Hea
d -
0.92
SA
F 55
.7
362
908
USA
71
7 3
2b
17.9
4 2%
TN
029
5 C
ashe
w n
ut
- 0.
29
Tha
i 53
.5
200
- -
ND
N
D
1 1.
08
0%
VB
040
4 C
aulif
low
er (
head
) -
0.87
U
NK
70
.1
579
1500
JP
N
1500
3
2b
21.5
6 2%
VS
0624
C
eler
y (s
talk
) -
2.6
FRA
52
.2
238
40
USA
40
3
2a
15.8
1 2%
VS
0624
C
eler
y (w
hole
) -
2.6
FRA
52
.2
238
700
BE
L
462
3 2b
35
.49
4%
VL
0464
C
hard
-
5.5
NL
D
63.0
56
9 -
- N
D
ND
N
D
ND
-
VC
042
3 C
hayo
te
- 0.
18
AU
S 67
.0
196
- -
ND
N
D
ND
N
D
-
FS 0
013
Che
rrie
s -
2.1
FRA
52
.2
360
5 U
NK
4
1 1
14.4
9 1%
FS 0
013
Che
rrie
s -
2.1
FRA
52
.2
360
5 B
EL
4
1 1
14.4
9 1%
TN
066
4 C
hest
nuts
-
0.29
FR
A
52.2
37
3 -
- N
D
ND
1
2.07
0%
VL
0469
C
hico
ry le
aves
(he
ad)
- 5.
5 U
SA
65.0
40
53
U
SA
47
3 2b
10
.23
1%
VL
0469
C
hico
ry le
aves
(he
ad)
- 5.
5 U
SA
65.0
40
10
0 B
EL
85
3
2b
10.2
3 1%
VL
0466
C
hine
se c
abba
ge, t
ype
pak-
choi
-
5.5
USA
65
.0
377
840
USA
79
8 3
2b
95.7
0 10
%
TN
066
5 C
ocon
ut
- 0.
29
AU
S 67
.0
84
- -
ND
N
D
ND
N
D
-
VL
0470
C
orn
sala
d -
5.5
FRA
52
.2
84
- -
ND
N
D
ND
N
D
-
VL
0510
C
os le
ttuc
e -
5.5
JPN
52
.6
144
- -
ND
N
D
ND
N
D
-
VL
0472
C
ress
, gar
den
- 5.
5 A
US
67.0
27
-
- N
D
ND
N
D
ND
-
VC
042
4 C
ucum
ber
- 0.
18
FRA
52
.2
348
301
USA
28
6 3
2a
3.17
0%

A
nn
ex 4
482
SP
IRO
TE
TR
AM
AT
(2
34
) In
tern
atio
nal e
stim
ate
of s
hort
term
inta
ke (
IEST
I) f
or
Acu
te R
fD=
1.0
mg/
kg b
w (
1000
µg/
kg b
w)
GE
NE
RA
L P
OP
UL
AT
ION
Max
imum
%A
RfD
: 10
%
Lar
ge p
orti
on d
iet
U
nit w
eigh
t
Cod
ex
Cod
e C
omm
odit
y
ST
MR
or
STM
R-P
m
g/kg
HR
or
HR
-P
mg/
kg
Cou
ntry
B
ody
wei
ght
(kg)
Lar
ge
port
ion,
g/
pers
on
Uni
t w
eigh
t, g
Cou
ntry
U
nit
wei
ght,
edib
le
port
ion,
g
Var
ia-
bilit
y fa
ctor
Cas
e IE
STI
µg/
kg
bw/d
ay
% a
cute
R
fD
roun
ded
MO
010
5 E
dibl
e of
fal (
mam
mal
ian)
-
0.02
4 FR
A
52.2
32
7 -
- N
D
ND
1
0.15
0%
VO
044
0 E
gg p
lant
-
1.1
AU
S 67
.0
487
548
USA
44
4 3
2a
22.5
7 2%
VL
0476
E
ndiv
e -
5.5
FRA
52
.2
339
- -
ND
N
D
ND
N
D
-
VC
042
5 G
herk
in
- 0.
18
NL
D
63.0
96
11
6 U
SA
81
3 2a
0.
74
0%
FB 0
269
Gra
pe (
excl
win
e)
- 1.
3 A
US
67.0
51
3 45
6 SW
E
438
3 2a
26
.94
3%
JF 0
269
Gra
pe ju
ice
0.27
-
FRA
52
.2
696
- -
ND
N
D
3 3.
60
0%
FC 0
203
Gra
pefr
uit
- 0.
47
JPN
52
.6
947
400
JPN
40
0 3
2a
15.6
1 2%
JF 0
203
Gra
pefr
uit j
uice
0.
18
- -
- N
D
- -
ND
N
D
3 N
D
-
DF
0269
G
rape
s, d
ried
(=
cur
rant
s, r
aisi
ns a
nd
sulta
nas)
-
3.4
USA
65
.0
70
- -
ND
N
D
1 3.
67
0%
TN
066
6 H
azel
nut
- 0.
29
AU
S 67
.0
70
- -
ND
N
D
1 0.
30
0%
VL
0480
K
ale
- 5.
5 N
LD
63
.0
337
- -
ND
N
D
ND
N
D
-
VB
040
5 K
ohlr
abi
- 0.
87
NL
D
63.0
28
3 13
5 U
SA
99
3 2a
6.
63
1%
FC 0
204
Lem
on
- 0.
47
FRA
52
.2
111
108
USA
72
3
2a
2.30
0%
- L
emon
juic
e 0.
18
- -
- N
D
- -
ND
N
D
3 N
D
-
VL
0482
L
ettu
ce, h
ead
- 5.
5 U
SA
65.0
21
3 53
9 U
SA
512
3 2b
53
.96
5%
VL
0483
L
ettu
ce, l
eaf
- 5.
5 N
LD
63
.0
152
160
BE
L
144
3 2a
38
.40
4%
FC 0
205
Lim
e -
0.47
A
US
67.0
59
0 67
U
SA
56
3 2a
4.
93
0%
VC
042
7 L
oofa
h, a
ngle
d (=
ang
led
gour
d)
- 0.
18
Tha
i 53
.5
215
- -
ND
N
D
ND
N
D
-
FP 0
228
Loq
uat
- 0.
55
AU
S 67
.0
64
- -
ND
N
D
ND
N
D
-
TN
066
9 M
acad
amia
nut
-
0.29
U
SA
65.0
10
7 -
- N
D
ND
1
0.48
0%
FC 0
206
Man
dari
n -
0.47
FR
A
52.2
63
9 16
8 U
SA
124
3 2a
7.
99
1%
VC
004
6 M
elon
s, e
xcep
t wat
erm
elon
-
0.18
FR
A
52.2
10
44
1000
U
SA
630
3 2a
7.
94
1%
VC
004
6 M
elon
s, e
xcep
t wat
erm
elon
, sta
ted
as
cant
alou
pe, V
C 4
199
- 0.
18
USA
65
.0
606
500
JPN
50
0 3
2a
4.45
0%
VC
004
6 M
elon
s, e
xcep
t wat
erm
elon
, sta
ted
as
cant
alou
pe, V
C 4
199
- 0.
18
USA
65
.0
606
552
USA
27
6 3
2a
3.21
0%
VL
0485
M
usta
rd g
reen
s -
5.5
USA
65
.0
228
- -
ND
N
D
ND
N
D
-
FS 0
245
Nec
tari
ne
- 2.
1 FR
A
52.2
60
4 13
6 U
SA
125
3 2a
34
.39
3%
VO
044
2 O
kra
- 1.
1 U
SA
65.0
23
5 10
JP
N
10
1 1
3.98
0%
JF 0
004
Ora
nge
juic
e 0.
18
- -
- N
D
- -
ND
N
D
3 N
D
-

An
nex
4
483
SP
IRO
TE
TR
AM
AT
(2
34
) In
tern
atio
nal e
stim
ate
of s
hort
term
inta
ke (
IEST
I) f
or
Acu
te R
fD=
1.0
mg/
kg b
w (
1000
µg/
kg b
w)
GE
NE
RA
L P
OP
UL
AT
ION
Max
imum
%A
RfD
: 10
%
Lar
ge p
orti
on d
iet
U
nit w
eigh
t
Cod
ex
Cod
e C
omm
odit
y
ST
MR
or
STM
R-P
m
g/kg
HR
or
HR
-P
mg/
kg
Cou
ntry
B
ody
wei
ght
(kg)
Lar
ge
port
ion,
g/
pers
on
Uni
t w
eigh
t, g
Cou
ntry
U
nit
wei
ght,
edib
le
port
ion,
g
Var
ia-
bilit
y fa
ctor
Cas
e IE
STI
µg/
kg
bw/d
ay
% a
cute
R
fD
roun
ded
FC 0
004
Ora
nge,
sw
eet,
sour
+ o
rang
e-lik
e hy
brid
-
0.47
FR
A
52.2
10
44
131
USA
96
3
2a
11.1
2 1%
FS 0
247
Peac
h -
2.1
SAF
55.7
68
5 15
0 JP
N
150
3 2a
37
.14
4%
FP 0
230
Pear
-
0.55
FR
A
52.2
56
8 16
6 U
SA
151
3 2a
9.
17
1%
-d
Pear
, dri
ed
- 0.
55
AU
S 67
.0
21
- -
ND
N
D
ND
N
D
-
TN
067
2 Pe
can
- 0.
29
AU
S 67
.0
23
- -
ND
N
D
1 0.
10
0%
VO
044
4 Pe
pper
s, C
hilli
-
1.5
USA
65
.0
90
45
USA
43
3
2a
4.08
0%
VO
044
5 Pe
pper
s, s
wee
t (in
cl. p
im(i
)ent
o)
- 1.
1 FR
A
52.2
90
11
9 U
SA
98
3 2b
5.
71
1%
TN
067
3 Pi
ne n
ut
- 0.
29
AU
S 67
.0
47
- -
ND
N
D
1 0.
20
0%
TN
067
5 Pi
stac
hio
nut
- 0.
29
AU
S 67
.0
300
- -
ND
N
D
1 1.
30
0%
FS 0
014
Plum
(in
cl d
ried
) -
2.1
Tha
i 53
.5
480
66
USA
62
3
2a
23.7
1 2%
FC 4
020
Pom
elo
- 0.
47
Tha
i 53
.5
554
- -
ND
N
D
ND
N
D
-
VR
058
9 Po
tato
-
0.46
FR
A
52.2
63
9 12
2 U
SA
99
3 2a
7.
37
1%
VL
0492
Pu
rsla
ne
- 5.
5 N
LD
63
.0
476
- -
ND
N
D
ND
N
D
-
FP 0
231
Qui
nce
- 0.
55
AU
S 67
.0
175
92
USA
56
3
2a
2.36
0%
FC 0
005
Shad
dock
or
pom
elo
+ s
hadd
ock-
like
hybr
id
- 0.
47
Tha
i 53
.5
554
210
FRA
12
6 3
2a
7.08
1%
VC
043
0 Sn
ake
gour
d -
0.18
T
hai
53.5
21
5 -
- N
D
ND
N
D
ND
-
VL
0502
Sp
inac
h (b
unch
) -
5.5
NL
D
63.0
82
0 34
0 U
SA
245
3 2a
11
4.30
10
%
VC
043
1 Sq
uash
, sum
mer
(=
cou
rget
te)
- 0.
18
FRA
52
.2
351
196
USA
18
6 3
2a
2.50
0%
FC 4
031
Ta
ngel
o -
0.47
A
US
67.0
11
4 -
- N
D
ND
N
D
ND
-
VO
044
8 To
mat
o -
1.1
FRA
52
.2
387
123
USA
12
3 3
2a
13.3
3 1%
JF 0
448
Tom
ato
juic
e 0.
27
- -
- N
D
- -
ND
N
D
3 N
D
-
- To
mat
o pa
ste
3.2
- -
- N
D
- -
ND
N
D
ND
N
D
-
TN
008
5 T
ree
nuts
-
0.29
JP
N
52.6
10
7 -
- N
D
ND
1
0.59
0%
VL
0506
T
urni
p gr
eens
-
5.5
USA
65
.0
353
- -
ND
N
D
ND
N
D
-
VL
0473
W
ater
cres
s -
5.5
AU
S 67
.0
86
- -
ND
N
D
ND
N
D
-
VC
043
2 W
ater
mel
on
- 0.
18
USA
65
.0
1939
45
18
USA
20
78
3 2b
16
.11
2%
- W
ine
0.23
-
FRA
52
.2
1006
-
- N
D
ND
3
4.43
0%
VC
043
3 W
inte
r sq
uash
(=
pum
pkin
) -
0.18
U
SA
65.0
72
9 10
00
JPN
10
00
3 2b
6.
06
1%

A
nn
ex 4
484
SP
IRO
TE
TR
AM
AT
(2
34
) In
tern
atio
nal e
stim
ate
of s
hort
term
inta
ke (
IEST
I) f
or
Acu
te R
fD=
1.0
00 m
g/kg
bw
(10
00 µ
g/kg
bw
)
CH
ILD
RE
N U
P T
O 6
YE
AR
S
M
axim
um %
AR
fD:
40%
Lar
ge p
orti
on d
iet
U
nit w
eigh
t
Cod
ex
Cod
e C
omm
odit
y ST
MR
or
STM
R-P
m
g/kg
HR
or
HR
-P
mg/
kg
Cou
ntry
B
ody
wei
ght
(kg)
Lar
ge
port
ion,
g/
pers
on
Uni
t w
eigh
t, g
Cou
ntry
U
nit
wei
ght,
edib
le
port
ion,
g
Var
ia-
bilit
y fa
ctor
Cas
e IE
STI
µg/
kg
bw/d
ay
% a
cute
R
fD
roun
ded
TN
066
0 A
lmon
ds
- 0.
29
USA
15
.0
13
- -
ND
N
D
1 0.
26
0%
FP 0
226
App
le
- 0.
55
USA
15
.0
679
200
JPN
20
0 3
2a
39.5
5 4%
JF 0
226
App
le ju
ice
0.08
2
- -
ND
-
- N
D
ND
3
ND
-
DF
0226
A
pple
, dri
ed
- 0.
55
AU
S 19
.0
4 -
- N
D
ND
N
D
ND
-
FS 0
240
Apr
icot
-
2.1
AU
S 19
.0
414
35
USA
34
3
2a
53.2
3 5%
VC
042
1 B
alsa
m p
ear,
stat
ed a
s bi
tter
gou
rd, V
C
4195
-
0.18
T
hai
17.1
87
-
- N
D
ND
N
D
ND
-
TN
066
2 B
razi
l nut
-
0.29
-
- N
D
- -
ND
N
D
1 N
D
-
VB
040
0 B
rocc
oli
- 0.
87
FRA
18
.9
254
608
USA
47
4 3
2b
35.1
3 4%
VB
040
1 B
rocc
oli,
Chi
nese
-
0.87
-
- N
D
- -
ND
N
D
ND
N
D
-
VB
040
2 B
russ
els
spro
uts
- 0.
87
NL
D
17.0
21
3 10
U
NK
7
1 1
10.8
8 1%
VB
004
1 C
abba
ges,
Hea
d -
0.92
SA
F 14
.2
220
908
USA
71
7 3
2b
42.7
8 4%
TN
029
5 C
ashe
w n
ut
- 0.
29
Tha
i 17
.1
99
- -
ND
N
D
1 1.
68
0%
VB
040
4 C
aulif
low
er (
head
) -
0.87
N
LD
17
.0
209
575
USA
22
4 3
2b
32.1
3 3%
VS
0624
C
eler
y (s
talk
) -
2.6
FRA
18
.9
157
40
USA
40
3
2a
32.6
6 3%
VS
0624
C
eler
y (w
hole
) -
2.6
FRA
18
.9
157
700
BE
L
462
3 2b
64
.97
6%
VL
0464
C
hard
-
5.5
FRA
18
.9
47
- -
ND
N
D
ND
N
D
-
VC
042
3 C
hayo
te
- 0.
18
AU
S 19
.0
105
- -
ND
N
D
ND
N
D
-
FS 0
013
Che
rrie
s -
2.1
AU
S 19
.0
250
5 FR
A
4 1
1 27
.64
3%
FS 0
013
Che
rrie
s -
2.1
AU
S 19
.0
250
5 JP
N
5 1
1 27
.64
3%
TN
066
4 C
hest
nuts
-
0.29
FR
A
18.9
19
6 -
- N
D
ND
1
3.00
0%
VL
0469
C
hico
ry le
aves
(he
ad)
- 5.
5 U
SA
15.0
19
53
U
SA
47
3 2b
20
.63
2%
VL
0469
C
hico
ry le
aves
(he
ad)
- 5.
5 U
SA
15.0
19
10
0 B
EL
85
3
2b
20.6
3 2%
VL
0466
C
hine
se c
abba
ge, t
ype
pak-
choi
-
5.5
JPN
15
.9
183
840
USA
79
8 3
2b
189.
59
20%
TN
066
5 C
ocon
ut
- 0.
29
NL
D
17.0
17
-
- N
D
ND
N
D
ND
-
VL
0470
C
orn
sala
d -
5.5
FRA
18
.9
40
- -
ND
N
D
ND
N
D
-
VL
0510
C
os le
ttuc
e -
5.5
- -
ND
-
- N
D
ND
N
D
ND
-
VL
0472
C
ress
, gar
den
- 5.
5 -
- N
D
- -
ND
N
D
ND
N
D
-
VC
042
4 C
ucum
ber
- 0.
18
NL
D
17.0
16
2 30
1 U
SA
286
3 2b
5.
15
1%

An
nex
4
485
SP
IRO
TE
TR
AM
AT
(2
34
) In
tern
atio
nal e
stim
ate
of s
hort
term
inta
ke (
IEST
I) f
or
Acu
te R
fD=
1.0
00 m
g/kg
bw
(10
00 µ
g/kg
bw
)
CH
ILD
RE
N U
P T
O 6
YE
AR
S
M
axim
um %
AR
fD:
40%
Lar
ge p
orti
on d
iet
U
nit w
eigh
t
Cod
ex
Cod
e C
omm
odit
y ST
MR
or
STM
R-P
m
g/kg
HR
or
HR
-P
mg/
kg
Cou
ntry
B
ody
wei
ght
(kg)
Lar
ge
port
ion,
g/
pers
on
Uni
t w
eigh
t, g
Cou
ntry
U
nit
wei
ght,
edib
le
port
ion,
g
Var
ia-
bilit
y fa
ctor
Cas
e IE
STI
µg/
kg
bw/d
ay
% a
cute
R
fD
roun
ded
MO
010
5 E
dibl
e of
fal (
mam
mal
ian)
-
0.02
4 FR
A
18.9
86
-
- N
D
ND
1
0.11
0%
VO
044
0 E
gg p
lant
-
1.1
JPN
15
.9
219
548
USA
44
4 3
2b
45.5
1 5%
VL
0476
E
ndiv
e -
5.5
NL
D
17.0
21
2 -
- N
D
ND
N
D
ND
-
VC
042
5 G
herk
in
- 0.
18
NL
D
17.0
56
11
6 U
SA
81
3 2b
1.
77
0%
FB 0
269
Gra
pe (
excl
win
e)
- 1.
3 A
US
19.0
34
2 45
6 SW
E
438
3 2b
70
.20
7%
JF 0
269
Gra
pe ju
ice
0.27
-
FRA
18
.9
500
- -
ND
N
D
3 7.
15
1%
FC 0
203
Gra
pefr
uit
- 0.
47
FRA
18
.9
405
400
JPN
40
0 3
2a
29.9
7 3%
JF 0
203
Gra
pefr
uit j
uice
0.
18
- -
- N
D
- -
ND
N
D
3 N
D
-
DF
0269
G
rape
s, d
ried
(=
cur
rant
s, r
aisi
ns a
nd
sulta
nas)
-
3.4
USA
15
.0
59
- -
ND
N
D
1 13
.43
1%
TN
066
6 H
azel
nut
- 0.
29
FRA
18
.9
27
- -
ND
N
D
1 0.
42
0%
VL
0480
K
ale
- 5.
5 N
LD
17
.0
149
- -
ND
N
D
ND
N
D
-
VB
040
5 K
ohlr
abi
- 0.
87
- -
ND
13
5 U
SA
99
3 N
D
ND
-
FC 0
204
Lem
on
- 0.
47
JPN
15
.9
88
108
USA
72
3
2a
6.89
1%
- L
emon
juic
e 0.
18
- -
- N
D
- -
ND
N
D
3 N
D
-
VL
0482
L
ettu
ce, h
ead
- 5.
5 T
hai
17.1
11
7 53
9 U
SA
512
3 2b
11
2.70
10
%
VL
0483
L
ettu
ce, l
eaf
- 5.
5 N
LD
17
.0
102
160
BE
L
144
3 2b
99
.00
10%
FC 0
205
Lim
e -
0.47
A
US
19.0
26
67
U
SA
56
3 2b
1.
92
0%
VC
042
7 L
oofa
h, a
ngle
d (=
ang
led
gour
d)
- 0.
18
Tha
i 17
.1
130
- -
ND
N
D
ND
N
D
-
FP 0
228
Loq
uat
- 0.
55
- -
ND
-
- N
D
ND
N
D
ND
-
TN
066
9 M
acad
amia
nut
-
0.29
-
- N
D
- -
ND
N
D
1 N
D
-
FC 0
206
Man
dari
n -
0.47
JP
N
15.9
35
3 16
8 U
SA
124
3 2a
17
.79
2%
VC
004
6 M
elon
s, e
xcep
t wat
erm
elon
-
0.18
FR
A
18.9
59
7 10
00
USA
63
0 3
2b
17.0
5 2%
VC
004
6 M
elon
s, e
xcep
t wat
erm
elon
, sta
ted
as
cant
alou
pe, V
C 4
199
- 0.
18
USA
15
.0
270
500
JPN
50
0 3
2b
9.71
1%
VC
004
6 M
elon
s, e
xcep
t wat
erm
elon
, sta
ted
as
cant
alou
pe, V
C 4
199
- 0.
18
USA
15
.0
270
552
USA
27
6 3
2b
9.71
1%
VL
0485
M
usta
rd g
reen
s -
5.5
USA
15
.0
53
- -
ND
N
D
ND
N
D
-
FS 0
245
Nec
tari
ne
- 2.
1 A
US
19.0
30
2 13
6 U
SA
125
3 2a
61
.05
6%
VO
044
2 O
kra
- 1.
1 U
SA
15.0
20
3 10
JP
N
10
1 1
14.8
5 1%
JF 0
004
Ora
nge
juic
e 0.
18
- -
- N
D
- -
ND
N
D
3 N
D
-

A
nn
ex 4
486
SP
IRO
TE
TR
AM
AT
(2
34
) In
tern
atio
nal e
stim
ate
of s
hort
term
inta
ke (
IEST
I) f
or
Acu
te R
fD=
1.0
00 m
g/kg
bw
(10
00 µ
g/kg
bw
)
CH
ILD
RE
N U
P T
O 6
YE
AR
S
M
axim
um %
AR
fD:
40%
Lar
ge p
orti
on d
iet
U
nit w
eigh
t
Cod
ex
Cod
e C
omm
odit
y ST
MR
or
STM
R-P
m
g/kg
HR
or
HR
-P
mg/
kg
Cou
ntry
B
ody
wei
ght
(kg)
Lar
ge
port
ion,
g/
pers
on
Uni
t w
eigh
t, g
Cou
ntry
U
nit
wei
ght,
edib
le
port
ion,
g
Var
ia-
bilit
y fa
ctor
Cas
e IE
STI
µg/
kg
bw/d
ay
% a
cute
R
fD
roun
ded
FC 0
004
Ora
nge,
sw
eet,
sour
+ o
rang
e-lik
e hy
brid
-
0.47
U
NK
14
.5
495
200
JPN
20
0 3
2a
29.0
1 3%
FS 0
247
Peac
h -
2.1
AU
S 19
.0
315
150
JPN
15
0 3
2a
68.0
3 7%
FP 0
230
Pear
-
0.55
U
NK
14
.5
279
166
USA
15
1 3
2a
22.0
4 2%
TN
067
2 Pe
can
- 0.
29
AU
S 19
.0
22
- -
ND
N
D
1 0.
34
0%
VO
005
1 Pe
pper
s -
1.1
Tha
i 17
.1
71
- -
ND
N
D
ND
N
D
-
VO
044
4 Pe
pper
s, C
hilli
-
1.5
AU
S 19
.0
31
45
USA
43
3
2b
7.22
1%
VO
044
5 Pe
pper
s, s
wee
t (in
cl. p
im(i
)ent
o)
- 1.
1 T
hai
17.1
71
11
9 U
SA
98
3 2b
13
.73
1%
TN
067
3 Pi
ne n
ut
- 0.
29
AU
S 19
.0
18
- -
ND
N
D
1 0.
27
0%
TN
067
5 Pi
stac
hio
nut
- 0.
29
AU
S 19
.0
63
- -
ND
N
D
1 0.
95
0%
FS 0
014
Plum
(in
cl d
ried
) -
2.1
Tha
i 17
.1
377
40
JPN
40
3
2a
56.1
1 6%
DF
0014
Pl
um, d
ried
(pr
unes
) -
4.6
AU
S 19
.0
170
6 FR
A
5 1
1 41
.17
4%
FC 4
020
Pom
elo
- 0.
47
Tha
i 17
.1
327
- -
ND
N
D
ND
N
D
-
VR
058
9 Po
tato
-
0.46
SA
F 14
.2
300
122
USA
99
3
2a
16.1
1 2%
VL
0492
Pu
rsla
ne
- 5.
5 -
- N
D
- -
ND
N
D
ND
N
D
-
FP 0
231
Qui
nce
- 0.
55
NL
D
17.0
1
92
USA
56
3
2b
0.10
0%
FC 0
005
Shad
dock
or
pom
elo
+ s
hadd
ock-
like
hybr
id
- 0.
47
Tha
i 17
.1
327
210
FRA
12
6 3
2a
15.9
1 2%
VC
043
0 Sn
ake
gour
d -
0.18
T
hai
17.1
13
0 -
- N
D
ND
N
D
ND
-
VL
0502
Sp
inac
h (b
unch
) -
5.5
SAF
14.2
42
0 34
0 U
SA
245
3 2a
35
2.43
40
%
VC
043
1 Sq
uash
, sum
mer
(=
cou
rget
te)
- 0.
18
AU
S 19
.0
219
196
USA
18
6 3
2a
5.60
1%
- Sq
uash
es &
pum
pkin
s &
gou
rds
- 0.
18
- -
ND
-
- N
D
ND
N
D
ND
-
VO
044
8 To
mat
o -
1.1
FRA
18
.9
215
123
USA
12
3 3
2a
26.8
6 3%
JF 0
448
Tom
ato
juic
e 0.
27
- -
- N
D
- -
ND
N
D
3 N
D
-
- To
mat
o pa
ste
3.2
- -
- N
D
- -
ND
N
D
ND
N
D
-
TN
008
5 T
ree
nuts
-
0.29
A
US
19.0
28
-
- N
D
ND
1
0.42
0%
VL
0506
T
urni
p gr
eens
-
5.5
USA
15
.0
90
- -
ND
N
D
ND
N
D
-
VL
0473
W
ater
cres
s -
5.5
AU
S 19
.0
6 -
- N
D
ND
N
D
ND
-
VC
043
2 W
ater
mel
on
- 0.
18
AU
S 19
.0
1473
45
18
USA
20
78
3 2b
41
.85
4%
- W
ine
0.23
-
FRA
18
.9
89
- -
ND
N
D
3 1.
09
0%
VC
043
3 W
inte
r sq
uash
(=
pum
pkin
) -
0.18
U
SA
15.0
16
9 10
00
JPN
10
00
3 2b
6.
07
1%

An
nex
4
487
TE
BU
CO
NA
ZO
LE
(1
89
) In
tern
atio
nal e
stim
ate
of s
hort
term
inta
ke (
IEST
I) f
or
A
RfD
= n
ot y
et c
onsi
dere
d
GE
NE
RA
L P
OP
UL
AT
ION
Lar
ge p
orti
on d
iet
Uni
t wei
ght
C
odex
C
ode
Com
mod
ity
STM
R o
r ST
MR
-P
mg/
kg
HR
or
HR
-P
mg/
kg
Cou
ntry
B
ody
wei
ght
(kg)
Lar
ge
port
ion,
g/
pers
on
Uni
t w
eigh
t, g
Cou
ntry
U
nit
wei
ght,
edib
le
port
ion,
g
Var
ia-
bilit
y fa
ctor
Cas
e IE
STI µ
g/kg
bw
/day
%
AR
fD
roun
ded
FP 0
226
App
le
- 0.
47
USA
65
.0
1348
16
2 SW
E
149
3 2a
11
.90
-
JF 0
226
App
le ju
ice
0.08
-
- -
ND
-
- N
D
ND
3
ND
-
DF
0226
A
pple
, dri
ed
0.19
-
AU
S 67
.0
10
- -
ND
N
D
3 0.
03
-
VS
0620
A
rtic
hoke
glo
be
- 0.
32
FRA
52
.2
512
350
BE
L
140
3 2a
4.
85
-
FI 0
327
Ban
ana
1/
- 0.
05
FRA
52
.2
714
1218
SW
E
767
3 2b
2.
05
-
GC
064
0 B
arle
y 0.
06
- N
LD
63
.0
378
- -
ND
N
D
3 0.
36
-
VB
040
0 B
rocc
oli
- 0.
56
FRA
52
.2
537
310
BE
L
186
3 2a
9.
75
-
VB
040
2 B
russ
els
spro
uts
- 0.
56
FRA
52
.2
351
10
UN
K
7 1
1 3.
77
-
VB
004
1 C
abba
ges,
Hea
d -
0.56
SA
F 55
.7
362
1650
B
EL
14
03
3 2b
10
.92
-
VR
057
7 C
arro
t -
0.22
FR
A
52.2
34
8 10
0 FR
A
89
3 2a
2.
22
-
VB
040
4 C
aulif
low
er (
head
) -
0.56
U
NK
70
.1
579
1000
B
EL
64
0 3
2b
13.8
8 -
FS 0
013
Che
rrie
s 1/
-
3.1
FRA
52
.2
360
5 FR
A
4 1
1 21
.39
-
SB 0
716
Cof
fee
bean
s 0.
2 -
FRA
52
.2
117
- -
ND
N
D
3 0.
45
-
VP
0526
C
omm
on b
ean
(gre
en p
ods
and/
or im
mat
ure
seed
s)
- 1.
2 N
LD
63
.0
431
- -
ND
N
D
1 8.
21
-
VC
042
4 C
ucum
ber
1/
- 0.
19
FRA
52
.2
348
410
BE
L
385
3 2b
3.
80
-
MO
010
5 E
dibl
e of
fal (
mam
mal
ian)
-
0.2
FRA
52
.2
327
- -
ND
N
D
1 1.
25
-
PE 0
112
Egg
s -
0 T
hai
53.5
19
5 -
- N
D
ND
1
0.00
-
FB 0
267
Eld
erbe
rrie
s -
0.73
N
LD
63
.0
21
- -
ND
N
D
1 0.
25
-
VA
038
1 G
arlic
-
0.06
T
hai
52.2
33
-
- N
D
ND
1
0.04
-
FB 0
269
Gra
pe (
excl
win
e) 2
/ -
2 A
US
67.0
51
3 12
5 FR
A
118
3 2a
22
.33
-
JF 0
269
Gra
pe ju
ice
3/
0.42
-
FRA
52
.2
696
- -
ND
N
D
3 5.
60
-
DF
0269
G
rape
s, d
ried
(=
cur
rant
s, r
aisi
ns a
nd
sulta
nas)
3/
- 3
USA
65
.0
70
- -
ND
N
D
1 3.
24
-
DH
110
0 H
ops,
dry
9.
65
- FR
A
52.2
13
-
- N
D
ND
3
2.41
-
VB
040
5 K
ohlr
abi
- 0.
56
NL
D
63.0
28
3 13
5 U
SA
99
3 1
2.51
-
VA
038
4 L
eek
- 0.
44
FRA
52
.2
177
225
BE
L
169
3 2a
4.
34
-
VL
0482
L
ettu
ce, h
ead
- 3.
2 U
SA
65.0
21
3 55
8 U
NK
41
3 3
2b
31.3
9 -
GC
064
5 M
aize
0.
1 -
FRA
52
.2
212
- -
ND
N
D
3 0.
41
-
FI 0
345
Man
go
- 0.
1 A
US
67.0
56
7 33
9 SW
E
234
3 2a
1.
54
-

A
nn
ex 4
488
TE
BU
CO
NA
ZO
LE
(1
89
) In
tern
atio
nal e
stim
ate
of s
hort
term
inta
ke (
IEST
I) f
or
A
RfD
= n
ot y
et c
onsi
dere
d
GE
NE
RA
L P
OP
UL
AT
ION
Lar
ge p
orti
on d
iet
Uni
t wei
ght
C
odex
C
ode
Com
mod
ity
STM
R o
r ST
MR
-P
mg/
kg
HR
or
HR
-P
mg/
kg
Cou
ntry
B
ody
wei
ght
(kg)
Lar
ge
port
ion,
g/
pers
on
Uni
t w
eigh
t, g
Cou
ntry
U
nit
wei
ght,
edib
le
port
ion,
g
Var
ia-
bilit
y fa
ctor
Cas
e IE
STI µ
g/kg
bw
/day
%
AR
fD
roun
ded
MM
009
5 M
eat f
rom
mam
mal
s ot
her
than
mar
ine
mam
mal
s -
0 A
US
67.0
52
1 -
- N
D
ND
1
0.00
-
VC
004
6 M
elon
s, e
xcep
t wat
erm
elon
-
0.02
FR
A
52.2
10
44
720
BE
L
540
3 2a
0.
81
-
ML
0106
M
ilks
0 -
USA
65
.0
2466
-
- N
D
ND
3
0.00
-
GC
064
7 O
ats
1/
0 -
USA
65
.0
175
- -
ND
N
D
3 0.
00
-
VA
038
5 O
nion
, Bul
b -
0.06
N
LD
63
.0
172
165
UN
K
150
3 2a
0.
45
-
FI 0
350
Papa
ya
- 1.
2 U
SA
65.0
56
7 25
0 JP
N
250
3 2a
19
.69
-
FS 0
247
Peac
h 1/
-
0.81
SA
F 55
.7
685
140
BE
L
126
3 2a
13
.63
-
SO 0
697
Pean
ut, s
helle
d 0.
03
- FR
A
52.2
13
5 -
- N
D
ND
3
0.08
-
FP 0
230
Pear
-
0.47
FR
A
52.2
56
8 18
7 U
NK
17
0 3
2a
8.18
-
VO
044
5 Pe
pper
s, s
wee
t (in
cl. p
im(i
)ent
o) 1
/ -
0.36
FR
A
52.2
90
17
2 U
NK
16
0 3
2b
1.87
-
FS 0
014
Plum
(in
cl d
ried
) -
0.12
T
hai
53.5
48
0 59
U
NK
55
3
2a
1.33
-
DF
0014
Pl
um, d
ried
(pr
unes
) -
0.18
U
SA
65.0
30
3 6
FRA
5
1 3.
00
0.84
-
PM 0
110
Poul
try
mea
t -
0 A
US
67.0
43
1 -
- N
D
ND
1
0.00
-
PO 0
111
Poul
try,
Edi
ble
offa
l of
- 0.
05
USA
65
.0
248
- -
ND
N
D
1 0.
19
-
FP 0
231
Qui
nce
- 0.
47
AU
S 67
.0
175
92
USA
56
3
2a
2.01
-
OR
049
5 R
ape
seed
oil,
edi
ble
0.06
4 -
AU
S 67
.0
65
- -
ND
N
D
3 0.
06
-
GC
064
9 R
ice
0.27
5 -
FRA
52
.2
246
- -
ND
N
D
3 1.
30
-
GC
065
0 R
ye 2
/ 0.
05
- FR
A
52.2
16
1 -
- N
D
ND
3
0.15
-
VD
054
1 So
ya b
ean
(dry
) 0.
02
- JP
N
52.6
15
9 -
- N
D
ND
3
0.06
-
VC
043
1 Sq
uash
, sum
mer
(=
cou
rget
te)
2/
- 0.
02
FRA
52
.2
351
300
FRA
27
0 3
2a
0.34
-
VO
044
7 Sw
eet c
orn
(cor
n-on
-the
-cob
) -
0.1
Tha
i 53
.5
383
200
JPN
20
0 3
2a
1.46
-
VO
044
8 To
mat
o -
0.46
FR
A
52.2
38
7 15
0 B
EL
14
3 3
2a
5.92
-
JF 0
448
Tom
ato
juic
e 0.
08
- -
- N
D
- -
ND
N
D
3 N
D
-
- To
mat
o pa
ste
0.13
-
- -
ND
-
- N
D
ND
3
ND
-
- To
mat
oes
peel
ed
- 0.
115
- -
ND
-
- N
D
ND
1
ND
-
VC
043
2 W
ater
mel
on
- 0.
02
USA
65
.0
1939
45
18
USA
20
78
3 2b
1.
79
-
GC
065
4 W
heat
2/
0.05
-
FRA
52
.2
703
- -
ND
N
D
3 0.
67
-
- W
ine
3/
0.5
- FR
A
52.2
10
06
- -
ND
N
D
3 9.
64
-
1/ S
TM
R f
rom
the
1997
JM
PR
; 2/ C
odex
MR
L r
ecom
men
ded
at th
e 19
94 J
MP
R; 3
/ PF
fro
m th
e 19
97 J
MP
R a
ppli
ed to
gra
pe M
RL

Annex 5 489
ANNEX 5: REPORTS AND OTHER DOCUMENTS RESULTING FROM PREVIOUS
JOINT MEETINGS
OF THE FAO PANEL OF EXPERTS ON PESTICIDE RESIDUES IN FOOD AND THE
ENVIRONMENT AND THE WHO EXPERT GROUPS ON PESTICIDE RESIDUES
1. Principles governing consumer safety in relation to pesticide residues. Report of a meeting of a WHO Expert Committee on Pesticide Residues held jointly with the FAO Panel of Experts on the Use of Pesticides in Agriculture. FAO Plant Production and Protection Division Report, No. PL/1961/11; WHO Technical Report Series, No. 240, 1962.
2. Evaluation of the toxicity of pesticide residues in food. Report of a Joint Meeting of the FAO Committee on Pesticides in Agriculture and the WHO Expert Committee on Pesticide Residues. FAO Meeting Report, No. PL/1963/13; WHO/Food Add./23, 1964.
3. Evaluation of the toxicity of pesticide residues in food. Report of the Second Joint Meeting of the FAO Committee on Pesticides in Agriculture and the WHO Expert Committee on Pesticide Residues. FAO Meeting Report, No. PL/1965/10; WHO/Food Add./26.65, 1965.
4. Evaluation of the toxicity of pesticide residues in food. FAO Meeting Report, No. PL/1965/10/1; WHO/Food Add./27.65, 1965.
5. Evaluation of the hazards to consumers resulting from the use of fumigants in the protection of food. FAO Meeting Report, No. PL/1965/10/2; WHO/Food Add./28.65, 1965.
6. Pesticide residues in food. Joint report of the FAO Working Party on Pesticide Residues and the WHO Expert Committee on Pesticide Residues. FAO Agricultural Studies, No. 73; WHO Technical Report Series, No. 370, 1967.
7. Evaluation of some pesticide residues in food. FAO/PL:CP/15; WHO/Food Add./67.32, 1967.
8. Pesticide residues. Report of the 1967 Joint Meeting of the FAO Working Party and the WHO Expert Committee. FAO Meeting Report, No. PL:1967/M/11; WHO Technical Report Series, No. 391, 1968.
9. 1967 Evaluations of some pesticide residues in food. FAO/PL:1967/M/11/1; WHO/Food Add./68.30, 1968.
10. Pesticide residues in food. Report of the 1968 Joint Meeting of the FAO Working Party of Experts on Pesticide Residues and the WHO Expert Committee on Pesticide Residues. FAO Agricultural Studies, No. 78; WHO Technical Report Series, No. 417, 1968.
11. 1968 Evaluations of some pesticide residues in food. FAO/PL:1968/M/9/1; WHO/Food Add./69.35, 1969.
12. Pesticide residues in food. Report of the 1969 Joint Meeting of the FAO Working Party of Experts on Pesticide Residues and the WHO Expert Group on Pesticide Residues. FAO Agricultural Studies, No. 84; WHO Technical Report Series, No. 458, 1970.
13. 1969 Evaluations of some pesticide residues in food. FAO/PL:1969/M/17/1; WHO/Food Add./70.38, 1970.
14. Pesticide residues in food. Report of the 1970 Joint Meeting of the FAO Working Party of Experts on Pesticide Residues and the WHO Expert Committee on Pesticide Residues. FAO Agricultural Studies, No. 87; WHO Technical Report Series, No. 4574, 1971.
15. 1970 Evaluations of some pesticide residues in food. AGP:1970/M/12/1; WHO/Food Add./71.42, 1971.
16. Pesticide residues in food. Report of the 1971 Joint Meeting of the FAO Working Party of Experts on Pesticide Residues and the WHO Expert Committee on Pesticide Residues. FAO Agricultural Studies, No. 88; WHO Technical Report Series, No. 502, 1972.

490 Annex 5
17. 1971 Evaluations of some pesticide residues in food. AGP:1971/M/9/1; WHO Pesticide Residue Series, No. 1, 1972.
18. Pesticide residues in food. Report of the 1972 Joint Meeting of the FAO Working Party of Experts on Pesticide Residues and the WHO Expert Committee on Pesticide Residues. FAO Agricultural Studies, No. 90; WHO Technical Report Series, No. 525, 1973.
19. 1972 Evaluations of some pesticide residues in food. AGP:1972/M/9/1; WHO Pesticide Residue Series, No. 2, 1973.
20. Pesticide residues in food. Report of the 1973 Joint Meeting of the FAO Working Party of Experts on Pesticide Residues and the WHO Expert Committee on Pesticide Residues. FAO Agricultural Studies, No. 92; WHO Technical Report Series, No. 545, 1974.
21. 1973 Evaluations of some pesticide residues in food. FAO/AGP/1973/M/9/1; WHO Pesticide Residue Series, No. 3, 1974.
22. Pesticide residues in food. Report of the 1974 Joint Meeting of the FAO Working Party of Experts on Pesticide Residues and the WHO Expert Committee on Pesticide Residues. FAO Agricultural Studies, No. 97; WHO Technical Report Series, No. 574, 1975.
23. 1974 Evaluations of some pesticide residues in food. FAO/AGP/1974/M/11; WHO Pesticide Residue Series, No. 4, 1975.
24. Pesticide residues in food. Report of the 1975 Joint Meeting of the FAO Working Party of Experts on Pesticide Residues and the WHO Expert Committee on Pesticide Residues. FAO Plant Production and Protection Series, No. 1; WHO Technical Report Series, No. 592, 1976.
25. 1975 Evaluations of some pesticide residues in food. AGP:1975/M/13; WHO Pesticide Residue Series, No. 5, 1976.
26. Pesticide residues in food. Report of the 1976 Joint Meeting of the FAO Panel of Experts on Pesticide Residues and the Environment and the WHO Expert Group on Pesticide Residues. FAO Food and Nutrition Series, No. 9; FAO Plant Production and Protection Series, No. 8; WHO Technical Report Series, No. 612, 1977.
27. 1976 Evaluations of some pesticide residues in food. AGP:1976/M/14, 1977.
28. Pesticide residues in food—1977. Report of the Joint Meeting of the FAO Panel of Experts on Pesticide Residues and Environment and the WHO Expert Group on Pesticide Residues. FAO Plant Production and Protection Paper 10 Rev, 1978.
29. Pesticide residues in food: 1977 evaluations. FAO Plant Production and Protection Paper 10 Suppl., 1978.
30. Pesticide residues in food—1978. Report of the Joint Meeting of the FAO Panel of Experts on Pesticide Residues and Environment and the WHO Expert Group on Pesticide Residues. FAO Plant Production and Protection Paper 15, 1979.
31. Pesticide residues in food: 1978 evaluations. FAO Plant Production and Protection Paper 15 Suppl., 1979.
32. Pesticide residues in food—1979. Report of the Joint Meeting of the FAO Panel of Experts on Pesticide Residues in Food and the Environment and the WHO Expert Group on Pesticide Residues. FAO Plant Production and Protection Paper 20, 1980.
33. Pesticide residues in food: 1979 evaluations. FAO Plant Production and Protection Paper 20 Suppl., 1980
34. Pesticide residues in food—1980. Report of the Joint Meeting of the FAO Panel of Experts on Pesticide Residues in Food and the Environment and the WHO Expert Group on Pesticide Residues. FAO Plant Production and Protection Paper 26, 1981.

Annex 5 491
35. Pesticide residues in food: 1980 evaluations. FAO Plant Production and Protection Paper 26 Suppl., 1981.
36. Pesticide residues in food—1981. Report of the Joint Meeting of the FAO Panel of Experts on Pesticide Residues in Food and the Environment and the WHO Expert Group on Pesticide Residues. FAO Plant Production and Protection Paper 37, 1982.
37. Pesticide residues in food: 1981 evaluations. FAO Plant Production and Protection Paper 42, 1982.
38. Pesticide residues in food—1982. Report of the Joint Meeting of the FAO Panel of Experts on Pesticide Residues in Food and the Environment and the WHO Expert Group on Pesticide Residues. FAO Plant Production and Protection Paper 46, 1982.
39. Pesticide residues in food: 1982 evaluations. FAO Plant Production and Protection Paper 49, 1983.
40. Pesticide residues in food—1983. Report of the Joint Meeting of the FAO Panel of Experts on Pesticide Residues in Food and the Environment and the WHO Expert Group on Pesticide Residues. FAO Plant Production and Protection Paper 56, 1985.
41. Pesticide residues in food: 1983 evaluations. FAO Plant Production and Protection Paper 61, 1985.
42. Pesticide residues in food—1984. Report of the Joint Meeting on Pesticide Residues. FAO Plant Production and Protection Paper 62, 1985.
43. Pesticide residues in food—1984 evaluations. FAO Plant Production and Protection Paper 67, 1985.
44. Pesticide residues in food—1985. Report of the Joint Meeting of the FAO Panel of Experts on Pesticide Residues in Food and the Environment and a WHO Expert Group on Pesticide Residues. FAO Plant Production and Protection Paper 68, 1986.
45. Pesticide residues in food—1985 evaluations. Part I. Residues. FAO Plant Production and Protection Paper 72/1, 1986.
46. Pesticide residues in food—1985 evaluations. Part II. Toxicology. FAO Plant Production and Protection Paper 72/2, 1986.
47. Pesticide residues in food—1986. Report of the Joint Meeting of the FAO Panel of Experts on Pesticide Residues in Food and the Environment and a WHO Expert Group on Pesticide Residues. FAO Plant Production and Protection Paper 77, 1986.
48. Pesticide residues in food—1986 evaluations. Part I. Residues. FAO Plant Production and Protection Paper 78, 1986.
49. Pesticide residues in food—1986 evaluations. Part II. Toxicology. FAO Plant Production and Protection Paper 78/2, 1987.
50. Pesticide residues in food—1987. Report of the Joint Meeting of the FAO Panel of Experts on Pesticide Residues in Food and the Environment and a WHO Expert Group on Pesticide Residues. FAO Plant Production and Protection Paper 84, 1987.
51. Pesticide residues in food—1987 evaluations. Part I. Residues. FAO Plant Production and Protection Paper 86/1, 1988.
52. Pesticide residues in food—1987 evaluations. Part II. Toxicology. FAO Plant Production and Protection Paper 86/2, 1988.
53. Pesticide residues in food—1988. Report of the Joint Meeting of the FAO Panel of Experts on Pesticide Residues in Food and the Environment and a WHO Expert Group on Pesticide Residues. FAO Plant Production and Protection Paper 92, 1988.

492 Annex 5
54. Pesticide residues in food—1988 evaluations. Part I. Residues. FAO Plant Production and Protection Paper 93/1, 1988.
55. Pesticide residues in food—1988 evaluations. Part II. Toxicology. FAO Plant Production and Protection Paper 93/2, 1989.
56. Pesticide residues in food—1989. Report of the Joint Meeting of the FAO Panel of Experts on Pesticide Residues in Food and the Environment and a WHO Expert Group on Pesticide Residues. FAO Plant Production and Protection Paper 99, 1989.
57. Pesticide residues in food—1989 evaluations. Part I. Residues. FAO Plant Production and Protection Paper 100, 1990.
58. Pesticide residues in food—1989 evaluations. Part II. Toxicology. FAO Plant Production and Protection Paper 100/2, 1990.
59. Pesticide residues in food—1990. Report of the Joint Meeting of the FAO Panel of Experts on Pesticide Residues in Food and the Environment and a WHO Expert Group on Pesticide Residues. FAO Plant Production and Protection Paper 102, Rome, 1990.
60. Pesticide residues in food—1990 evaluations. Part I. Residues. FAO Plant Production and Protection Paper 103/1, Rome, 1990.
61. Pesticide residues in food—1990 evaluations. Part II. Toxicology. World Health Organization, WHO/PCS/91.47, Geneva, 1991.
62. Pesticide residues in food—1991. Report of the Joint Meeting of the FAO Panel of Experts on Pesticide Residues in Food and the Environment and a WHO Expert Group on Pesticide Residues. FAO Plant Production and Protection Paper 111, Rome, 1991.
63. Pesticide residues in food—1991 evaluations. Part I. Residues. FAO Plant Production and Protection Paper 113/1, Rome, 1991.
64. Pesticide residues in food—1991 evaluations. Part II. Toxicology. World Health Organization, WHO/PCS/92.52, Geneva, 1992.
65. Pesticide residues in food—1992. Report of the Joint Meeting of the FAO Panel of Experts on Pesticide Residues in Food and the Environment and a WHO Expert Group on Pesticide Residues. FAO Plant Production and Protection Paper 116, Rome, 1993.
66. Pesticide residues in food—1992 evaluations. Part I. Residues. FAO Plant Production and Protection Paper 118, Rome, 1993.
67. Pesticide residues in food—1992 evaluations. Part II. Toxicology. World Health Organization, WHO/PCS/93.34, Geneva, 1993.
68. Pesticide residues in food—1993. Report of the Joint Meeting of the FAO Panel of Experts on Pesticide Residues in Food and the Environment and a WHO Expert Group on Pesticide Residues. FAO Plant Production and Protection Paper 122, Rome, 1994.
69. Pesticide residues in food—1993 evaluations. Part I. Residues. FAO Plant Production and Protection Paper 124, Rome, 1994.
70. Pesticide residues in food—1993 evaluations. Part II. Toxicology. World Health Organization, WHO/PCS/94.4, Geneva, 1994.
71. Pesticide residues in food—1994. Report of the Joint Meeting of the FAO Panel of Experts on Pesticide Residues in Food and the Environment and a WHO Expert Group on Pesticide Residues. FAO Plant Production and Protection Paper 127, Rome, 1995.
72. Pesticide residues in food—1994 evaluations. Part I. Residues. FAO Plant Production and Protection Paper 131/1 and 131/2 (2 volumes), Rome, 1995.
73. Pesticide residues in food—1994 evaluations. Part II. Toxicology. World Health Organization,

Annex 5 493
WHO/PCS/95.2, Geneva, 1995.
74. Pesticide residues in food—1995. Report of the Joint Meeting of the FAO Panel of Experts on Pesticide Residues in Food and the Environment and the Core Assessment Group. FAO Plant Production and Protection Paper 133, Rome, 1996.
75. Pesticide residues in food—1995 evaluations. Part I. Residues. FAO Plant Production and Protection Paper 137, 1996.
76. Pesticide residues in food—1995 evaluations. Part II. Toxicological and Environmental. World Health Organization, WHO/PCS/96.48, Geneva, 1996.
77. Pesticide residues in food—1996. Report of the Joint Meeting of the FAO Panel of Experts on Pesticide Residues in Food and the Environment and the WHO Core Assessment Group. FAO Plant Production and Protection Paper, 140, 1997.
78. Pesticide residues in food—1996 evaluations. Part I. Residues. FAO Plant Production and Protection Paper, 142, 1997.
79. Pesticide residues in food—1996 evaluations. Part II. Toxicological. World Health Organization, WHO/PCS/97.1, Geneva, 1997.
80. Pesticide residues in food—1997. Report of the Joint Meeting of the FAO Panel of Experts on Pesticide Residues in Food and the Environment and the WHO Core Assessment Group. FAO Plant Production and Protection Paper, 145, 1998.
81. Pesticide residues in food—1997 evaluations. Part I. Residues. FAO Plant Production and Protection Paper, 146, 1998.
82. Pesticide residues in food—1997 evaluations. Part II. Toxicological and Environmental. World Health Organization, WHO/PCS/98.6, Geneva, 1998.
83. Pesticide residues in food—1998. Report of the Joint Meeting of the FAO Panel of Experts on Pesticide Residues in Food and the Environment and the WHO Core Assessment Group. FAO Plant Production and Protection Paper, 148, 1999.
84. Pesticide residues in food—1998 evaluations. Part I. Residues. FAO Plant Production and Protection Paper, 152/1 and 152/2 (two volumes).
85. Pesticide residues in food—1998 evaluations. Part II. Toxicological and Environmental. World Health Organization, WHO/PCS/99.18, Geneva, 1999.
86. Pesticide residues in food—1999. Report of the Joint Meeting of the FAO Panel of Experts on Pesticide Residues in Food and the Environment and the WHO Core Assessment Group. FAO Plant Production and Protection Paper, 153, 1999.
87. Pesticide residues in food—1999 evaluations. Part I. Residues. FAO Plant Production and Protection Paper, 157, 2000.
88. Pesticide residues in food—1999 evaluations. Part II. Toxicological. World Health Organization, WHO/PCS/00.4, Geneva, 2000.
89. Pesticide residues in food—2000. Report of the Joint Meeting of the FAO Panel of Experts on Pesticide Residues in Food and the Environment and the WHO Core Assessment Group. FAO Plant Production and Protection Paper, 163, 2001.
90. Pesticide residues in food—2000 evaluations. Part I. Residues. FAO Plant Production and Protection Paper, 165, 2001.
91. Pesticide residues in food—2000 evaluations. Part II. Toxicological. World Health Organization, WHO/PCS/01.3, 2001.
92. Pesticide residues in food—2001. Report of the Joint Meeting of the FAO Panel of Experts on Pesticide Residues in Food and the Environment and the WHO Core Assessment Group. FAO

494 Annex 5
Plant Production and Protection Paper, 167, 2001.
93. Pesticide residues in food—2001 evaluations. Part I. Residues. FAO Plant Production and Protection Paper, 171, 2002.
94. Pesticide residues in food—2001 evaluations. Part II. Toxicological. World Health Organization, WHO/PCS/02.1, 2002.
95. Pesticide residues in food—2002. Report of the Joint Meeting of the FAO Panel of Experts on Pesticide Residues in Food and the Environment and the WHO Core Assessment Group. FAO Plant Production and Protection Paper, 172, 2002.
96. Pesticide residues in food—2002 evaluations. Part I. Residues. FAO Plant Production and Protection Paper, 175/1 and 175/2 (two volumes).
97. Pesticide residues in food—2002 evaluations. Part II. Toxicological. World Health Organization, WHO/PCS, 2003.
98. Pesticide residues in food—2003. Report of the Joint Meeting of the FAO Panel of Experts on Pesticide Residues in Food and the Environment and the WHO Core Assessment Group. FAO Plant Production and Protection Paper, 176, 2004.
99. Pesticide residues in food—2003 evaluations. Part I. Residues. FAO Plant Production and Protection Paper, 177, 2004.
100. Pesticide residues in food—2003 evaluations. Part II. Toxicological. World Health Organization, WHO/PCS, 2004.
101. Pesticide residues in food—2004. Report of the Joint Meeting of the FAO Panel of Experts on Pesticide Residues in Food and the Environment and the WHO Core Assessment Group. FAO Plant Production and Protection Paper, 178, 2004.
102. Pesticide residues in food—2004 evaluations. Part I. Residues. FAO Plant Production and Protection Paper, 182, 2005.
103. Pesticide residues in food—2004 evaluations. Part II. Toxicological. World Health Organization, WHO/PCS, 2006.
104. Pesticide residues in food—2005. Report of the Joint Meeting of the FAO Panel of Experts on Pesticide Residues in Food and the Environment and the WHO Core Assessment Group. FAO Plant Production and Protection Paper, 183, 2005.
105. Pesticide residues in food—2005 evaluations. Part I. Residues. FAO Plant Production and Protection Paper, 184, 2006.
106. Pesticide residues in food—2005 evaluations. Part II. Toxicological. World Health Organization, WHO/PCS, 2006.
107. Pesticide residues in food—2006. Report of the Joint Meeting of the FAO Panel of Experts on Pesticide Residues in Food and the Environment and the WHO Core Assessment Group. FAO Plant Production and Protection Paper, 187, 2007.
108. Pesticide residues in food—2006 evaluations. Part I. Residues. FAO Plant Production and Protection Paper, 189/1 and 189/2 (two volumes), 2007.
109. Pesticide residues in food—2006 evaluations. Part II. Toxicological. World Health Organization. WHO/PCS, 2008.
110. Pesticide residues in food—2007. Report of the Joint Meeting of the FAO Panel of Experts on Pesticide Residues in Food and the Environment and the WHO Core Assessment Group. FAO Plant Production and Protection Paper, 191, 2008.

Annex 5 495
111. Pesticide residues in food —2007 evaluations. Part 1: Residues, FAO Plant Production and Protection Paper, 192/1 and 192/2 (two volumes), 2008


Annex 6 497
ANNEX 6: LIVESTOCK DIETARY BURDEN
Livestock dietary burden tables
The livestock dietary burdens were estimated by considering the commodities listed in the tables below.
Azoxystrobin (229)
Estimated maximum dietary burden of farm animals
BEEF CATTLE MAX
Diet content (%) Residue contribution (mg/kg) Commodity
CC Residue (mg/kg)
Basis
DM (%) Residue dw (mg/kg) US-CAN EU AU US-CAN EU AU
Barley straw AS 11 hr 100 11 5 0.55
Cabbage heads and leaves VB 2.3 hr 15 15 15 2.3
Corn forage AF 7.2 hr 40 18 15 20 2.7 3.6
Corn stover AS 25 hr 100 25 25 25 6.3 6.3
Soya bean forage AL 23 hr 56 41 20 8.2
Soya bean hay AL 62 hr 100 62 30 80 19 50
Sugar beet leaves or tops AV 44 hr 23 191 20 38
Wheat forage AF 5.4 hr 25 22 25 20 5.4 4.3
Total 100 100 100 34 55 58
Azoxystrobin (229)
Estimated maximum dietary burden of farm animals
DAIRY CATTLE MAX
Diet content (%) Residue contribution (mg/kg)
Commodity
CC Residue (mg/kg)
Basis
DM (%)
Residue dw (mg/kg)
US-CAN EU AU US-CAN EU AU
Citrus pulp, dried AB 9.3 STMR-P 91 10 5 0.51
Corn forage AF 7.2 HR 40 18 10 30 1.8 5.4
Corn stover AS 25 HR 100 25 15 20 40 3.8 5.0 10
Soya bean hay AL 62 HR 100 62 30 40 19 25
Sugar beet leaves or tops AV 44 HR 23 191 30 57
Wheat forage AF 5.4 HR 25 22 40 20 20 8.6 4.3 4.3
Total 100 100 100 33 72 39
Azoxystrobin (229)
Estimated maximum dietary burden of farm animals POULTRY BROILER MAX
Diet content (%) Residue contribution (mg/kg)
Commodity
CC Residue (mg/kg)
Basis
DM (%)
Residue dw (mg/kg)
US-CAN EU AU US-CAN EU AU
Barley grain GC 0.08 STMR 88 0.09 35 70 0.03 0.06
Peanut meal SO 0.01 STMR-P 85 0.01 10 0.001
Rice bran CF 0.82 STMR-P 90 0.91 25 10 20 0.23 0.09 0.18
Rice grain GC 0.68 STMR 88 0.77 20 50 0.15 0.39
Soya bean hulls AB 0.13 STMR-P 90 0.14 20 10 5 0.03 0.01 0.01
Soya bean seed VD 0.06 STMR 89 0.07 15 0.01
Swede root VR 0.45 HR 10 4.5 10 0.45
Total 100 100 100 0.44 0.62 0.59

498 Annex 6
Azoxystrobin (229)
Estimated maximum dietary burden of farm animals
POULTRY - LAYER MAX
Diet content (%) Residue contribution (mg/kg)
Commodity
CC Residue (mg/kg)
Basis
DM (%) Residue dw (mg/kg)
US-CAN EU AU US-CAN EU AU
Barley grain GC 0.08 STMR 88 0.09 45 40 0.04 0.04
Cabbage heads and leaves VB 2.3 HR 15 15 5 0.77
Corn stover AS 25 HR 100 25 10 2.5
Peanut meal SO 0.01 STMR-P 85 0.01 10 0.001
Rice bran CF 0.82 STMR-P 90 0.91 25 5 20 0.23 0.05 0.18
Rice grain GC 0.68 STMR 88 0.77 20 50 0.15 0.39
Soya bean hay AL 62 HR 100 62 10 6.2
Soya bean hulls AB 0.13 STMR-P 90 0.14 10 5 5 0.01 0.01 0.01
Soya bean seed VD 0.06 STMR 89 0.07 15 0.01
Sugar beet leaves or tops AV 44 HR 23 191 5 9.6
Swede root VR 0.45 HR 10 4.5 10 0.45
Wheat forage AF 5.4 HR 25 22 10 2.2
Total 100 100 100 0.44 22 0.59
Azoxystrobin (229)
Estimated STMR dietary burden of farm animals
BEEF CATTLE STMR
Diet content (%) Residue contribution (mg/kg)
Commodity
CC Residue (mg/kg)
Basis
DM (%) Residue dw (mg/kg)
US-CAN EU AU US-CAN EU AU
Barley forage AF 1.7 STMR 30 5.7 5 10 0.28 0.57
Cabbage heads and leaves VB 1.2 STMR 15 8.0 20 1.6
Citrus pulp, dried AB 9.3 STMR-P 91 10 10 5 1.0 0.51
Corn forage AF 1.6 STMR 40 4.0 5 0.20
Corn stover AS 5 STMR 100 5.0 25 25 1.3 1.3
Soya bean forage AL 9.4 STMR 56 17 20 3.4
Soya bean hay AL 36 STMR 100 36 30 80 11 29
Sugar beet leaves or tops AV 16 STMR 23 70 20 14
Wheat forage AF 1.9 STMR 25 7.6 25 20 1.9 1.5
Total 100 100 100 15 19 32
Azoxystrobin (229)
Estimated STMR dietary burden of farm animals
DAIRY CATTLE STMR
Diet content (%) Residue contribution (mg/kg)
Commodity
CC Residue (mg/kg)
Basis
DM (%) Residue dw (mg/kg)
US-CAN EU AU US-CAN EU AU
Barley forage AF 1.7 STMR 30 5.7 10 0.57
Cabbage heads and leaves VB 1.2 STMR 15 8.0 20 1.6
Citrus pulp, dried AB 9.3 STMR-P 91 10 10 20 10 1.0 2.0 1.0
Corn forage AF 1.6 STMR 40 4.0 5 0.20
Corn stover AS 5 STMR 100 5.0 15 0.75
Grape pomace, wet AB 1.6 STMR-P 15 11 20 2.1
Soya bean hay AL 36 STMR 100 36 30 40 11 14
Sugar beet leaves or tops AV 16 STMR 23 70 30 21
Wheat forage AF 1.9 STMR 25 7.6 40 20 30 3.0 1.5 2.3
Total 100 100 100 16 27 20

Annex 6 499
Azoxystrobin (229)
Estimated STMR dietary burden of farm animals
POULTRY - BROILER STMR
Diet content (%) Residue contribution (mg/kg)
Commodity
CC Residue (mg/kg)
Basis
DM (%)
Residue dw (mg/kg)
US-CAN EU AU US-CAN EU AU
Peanut meal SO 0.01 STMR-P 85 0.01 10 0.001
Rice bran CF 0.82 STMR-P 90 0.91 25 10 20 0.23 0.09 0.18
Rice grain GC 0.68 STMR 88 0.77 20 50 0.15 0.39
Rice grain GC 0.08 STMR 88 0.09 35 70 0.03 0.06
Soya bean hulls AB 0.13 STMR-P 90 0.14 20 10 5 0.03 0.01 0.01
Soya bean seed VD 0.06 STMR 89 0.07 15 0.01
Swede root VR 0.23 STMR 10 2.3 10 0.23
Total 100 100 100 0.44 0.40 0.59
Azoxystrobin (229)
Estimated STMR dietary burden of farm animals
POULTRY— LAYER STMR
Diet content (%) Residue contribution (mg/kg)
Commodity
CC Residue (mg/kg)
Basis
DM (%)
Residue dw (mg/kg)
US-CAN EU AU US-CAN EU AU
Barley grain GC 0.08 STMR 88 0.09 45 40 0.04 0.04
Cabbage heads and leaves VB 1.2 STMR 15 8.0 5
0.40
Corn stover AS 5 STMR 100 5.0 10 0.50
Peanut meal SO 0.01 STMR-P 85 0.01 10 0.001
Rice bran CF 0.82 STMR-P 90 0.91 25 5 20 0.23 0.05 0.18
Rice grain GC 0.68 STMR 88 0.77 20 50 0.15 0.39
Soya bean hay AL 36 STMR 100 36 10 3.6
Soya bean hulls AB 0.13 STMR-P 90 0.14 10 5 5 0.01 0.01 0.01
Soya bean seed VD 0.06 STMR 89 0.07 15 0.01
Sugar beet leaves or tops AV 16 STMR 23 70 5 3.5
Swede root VR 0.23 STMR 10 2.3 10 0.23
Wheat forage AF 1.9 STMR 25 7.6 10 0.76
Total 100 100 100 0.44 9.1 0.59
Buprofezin (173)
Estimated mean and maximum dietary burden of farm animals BEEF CATTLE MEAN/MAX
Commodity CC Residue Basis DM Residue dw Diet content (%) Residue contribution (ppm)
mg/kg % mg/kg US-CAN EU AU US-CAN EU AU
Citrus, dried pulp AB 1.2 STMR-P 91 1.319 10 5 30 0.13 0.07 0.40
Total 10 5 30 0.13 0.07 0.40
DAIRY CATTLE MEAN/MAX
Commodity CC Residue Basis DM Residue dw Diet content (%) Residue contribution (ppm)
mg/kg % mg/kg US-CAN EU AU US-CAN EU AU
Citrus, dried pulp AB 1.2 STMR-P 91 1.319 10 20 30 0.13 0.26 0.40
Total 10 20 30 0.13 0.26 0.40

500 Annex 6
Buprofezin (173)
Estimated mean and maximum dietary burden of farm animals POULTRY - BROILER MEAN/MAX
Commodity CC Residue Basis DM Residue dw Diet content (%) Residue contribution (ppm)
mg/kg % mg/kg US-CAN EU AU US-CAN EU AU
Citrus, dried pulp AB 1.2 STMR-P 91 1.319
Total 0 0 0 0.00 0.00 0.00
POULTRY - LAYER MEAN/MAX
Commodity CC Residue Basis DM Residue dw Diet content (%) Residue contribution (ppm)
mg/kg % mg/kg US-CAN EU AU US-CAN EU AU
Citrus, dried pulp AB 1.2 STMR-P 91 1.319
Total 0 0 0 0.00 0.00 0.00
Chlorantraniliprole (230)
Estimated maximum dietary burden of farm animals
BEEF CATTLE MAX
Commodity CC Residue
Basis DM Residue dw Diet content (%) Residue contribution (ppm)
mg/kg % mg/kg US-CAN EU AU US-CAN EU AU
Apple pomace, wet AB 0.154 STMR-P 40 0.385 20 20 0.08 0.08
Grape pomace, wet AB 0.3035 STMR-P 15 2.023 20 0.40
cotton seed (for hulls) SO 0.1029 STMR 90 0.114 20 0.02
cotton gin trash AM? 4.1 STMR 90 4.556 5 0.23
barley grain 0.004 STMR 88 0.005 10 20 0.00 0.00
wheat forage 0.083 HR 25 0.332 25 20 80 0.08 0.07 0.27
wheat hay 0.15 HR 88 0.170 20 20 0.03 0.03
Total 100 80 100
0.45 0.18 0.67
Chlorantraniliprole (230)
Estimated maximum dietary burden of farm animals
DAIRY CATTLE MAX
Commodity CC Residue
Basis DM Residue dw Diet content (%) Residue contribution (ppm)
mg/kg % mg/kg US-CAN EU AU US-CAN EU AU
Apple pomace, wet AB 0.154 STMR-P 40 0.385 10 10 0.04 0.04
Grape pomace, wet AB 0.3035 STMR-P 15 2.023 20 0.40
cotton seed SO 0.049 STMR 88 0.056 10 0.01
cotton seed (for meal) SO 0.0368 STMR 89 0.041 5 0.00
cotton seed (for hulls) SO 0.1029 STMR 90 0.114 10 10 0.01 0.01
barley grain 0.004 STMR 88 0.005 15 0.00
wheat forage 0.083 HR 25 0.332 40 20 60 0.13 0.07 0.20
wheat hay 0.15 HR 88 0.170 40 20 10 0.07 0.03 0.02
Total 100 80 100
0.25 0.15 0.63

Annex 6 501
Chlorantraniliprole (230)
Estimated maximum dietary burden of farm animals
POULTRY - BROILER MAX
Commodity CC Residue
Basis DM Residue dw Diet content (%) Residue contribution (ppm)
mg/kg % mg/kg US-CAN EU AU US-CAN EU AU
Potato culls VR 0.004 HR 20 0.020 10 0.00
Cotton seed (for meal) SO 0.0368 STMR 89 0.041 20 5 10 0.01 0.00 0.00
barley grain 0.004 STMR 88 0.005 75 70 15 0.00 0.00 0.00
oat grain 0.004 STMR 89 0.004
Total 95 85 80 0.012 0.007 0.007
Chlorantraniliprole (230)
Estimated maximum dietary burden of farm animals
POULTRY - LAYER MAX
Commodity CC Residue
Basis DM Residue dw Diet content (%) Residue contribution (ppm)
mg/kg % mg/kg US-CAN EU AU US-CAN EU AU
Potato culls VR 0.004 HR 20 0.020 10 0.00
Cotton seed (for meal) SO 0.0368 STMR 89 0.041 20 5 10 0.01 0.00 0.00
barley grain 0.004 STMR 88 0.005 70 65 0.00 0.00
wheat forage 0.083 HR 25 0.332 10 0.03
wheat hay 0.15 HR 88 0.170 10 0.02
wheat grain 0.004 STMR 89 0.004 55 0.00
Total 90 100 65 0.011 0.057 0.007
Chlorantraniliprole (230)
Estimated mean dietary burden of farm animals
BEEF CATTLE MAX
Commodity CC Residue
Basis DM
Residue dw
Diet content (%) Residue contribution (ppm)
mg/kg % mg/kg US-CAN
EU AU US-CAN EU AU
Apple pomace, wet AB 0.154 STMR-P 40 0.385 20 20 0.08 0.08
Grape pomace, wet AB 0.3035 STMR-P 15 2.023 20 0.40
cotton seed (for meal) SO 0.0368 STMR 89 0.041 5 0.00
cotton seed (for hulls) SO 0.1029 STMR 90 0.114 20 20 0.02 0.02
cotton gin trash AM? 4.1 STMR 90 4.556 5 0.23
barley grain 0.004 STMR 88 0.005 30 35 0.00 0.00
wheat forage 0.022 STMR 25 0.088 25 20 60 0.02 0.02 0.05
wheat hay 0.045 STMR 88 0.051 20 0.01
Total 100 100 100 0.35 0.11 0.48

502 Annex 6
Chlorantraniliprole (230)
Estimated mean dietary burden of farm animals
DAIRY CATTLE MAX
Commodity CC Residue
Basis DM Residue dw Diet content (%) Residue contribution (ppm)
mg/kg % mg/kg US-CAN EU AU US-CAN EU AU
Apple pomace, wet AB 0.154 STMR-P 40 0.385 10 10 0.04 0.04
Grape pomace, wet AB 0.3035 STMR-P 15 2.023 20 0.40
Potato culls VR 0.003 STMR 20 0.015 10 10 0.00 0.00
cotton seed SO 0.049 STMR 88 0.056 10 0.01
cotton seed (for hulls) SO 0.1029 STMR 90 0.114 15 10 0.02 0.01
barley grain 0.004 STMR 88 0.005 25 40 0.00 0.00
wheat forage 0.022 STMR 25 0.088 40 20 60 0.04 0.02 0.05
wheat hay 0.045 STMR 88 0.051 20 0.01
Total 100 100 100
0.09 0.07 0.47
Chlorantraniliprole (230)
Estimated mean dietary burden of farm animals
POULTRY - BROILER MAX
Commodity CC Residue
Basis DM Residue dw Diet content (%) Residue contribution (ppm)
mg/kg % mg/kg US-CAN EU AU US-CAN EU AU
Potato culls VR 0.003 STMR 20 0.015 10 0.00
Cotton seed (for meal) SO 0.0368 STMR 89 0.041 20 5 10 0.01 0.00 0.00
barley grain 0.004 STMR 88 0.005 75 70 15 0.00 0.00 0.00
wheat grain 0.004 STMR 89 0.004 55 0.00
Total 95 85 80 0.012 0.007 0.007
Chlorantraniliprole (230)
Estimated mean dietary burden of farm animals
POULTRY - LAYER MAX
Commodity CC Residue
Basis DM Residue dw Diet content (%) Residue contribution (ppm)
mg/kg % mg/kg US-CAN EU AU US-CAN EU AU
Potato culls VR 0.003 STMR 20 0.015 10 0.00
Cotton seed (for meal) SO 0.0368 STMR 89 0.041 20 5 10 0.01 0.00 0.00
barley grain 0.004 STMR 88 0.005 70 65 0.00 0.00
wheat forage 0.022 STMR 25 0.088 10 0.01
wheat hay 0.045 STMR 88 0.051 10 0.01
wheat grain 0.004 STMR 89 0.004 55 0.00
Total 90 100 65 0.011 0.020 0.007
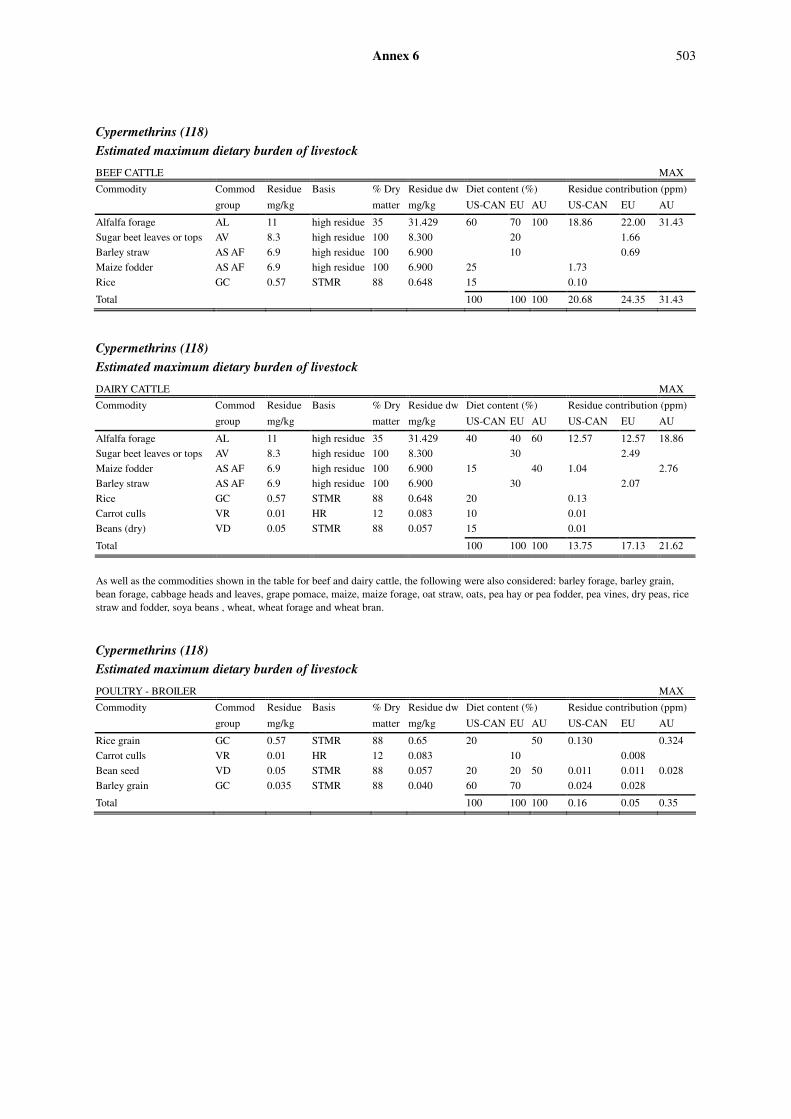
Annex 6 503
Cypermethrins (118)
Estimated maximum dietary burden of livestock
BEEF CATTLE MAX
Commodity Commod Residue Basis % Dry Residue dw Diet content (%) Residue contribution (ppm)
group mg/kg matter mg/kg US-CAN EU AU US-CAN EU AU
Alfalfa forage AL 11 high residue 35 31.429 60 70 100 18.86 22.00 31.43
Sugar beet leaves or tops AV 8.3 high residue 100 8.300 20 1.66
Barley straw AS AF 6.9 high residue 100 6.900 10 0.69
Maize fodder AS AF 6.9 high residue 100 6.900 25 1.73
Rice GC 0.57 STMR 88 0.648 15 0.10
Total 100 100 100 20.68 24.35 31.43
Cypermethrins (118)
Estimated maximum dietary burden of livestock
DAIRY CATTLE MAX
Commodity Commod Residue Basis % Dry Residue dw Diet content (%) Residue contribution (ppm)
group mg/kg matter mg/kg US-CAN EU AU US-CAN EU AU
Alfalfa forage AL 11 high residue 35 31.429 40 40 60 12.57 12.57 18.86
Sugar beet leaves or tops AV 8.3 high residue 100 8.300 30 2.49
Maize fodder AS AF 6.9 high residue 100 6.900 15 40 1.04 2.76
Barley straw AS AF 6.9 high residue 100 6.900 30 2.07
Rice GC 0.57 STMR 88 0.648 20 0.13
Carrot culls VR 0.01 HR 12 0.083 10 0.01
Beans (dry) VD 0.05 STMR 88 0.057 15 0.01
Total 100 100 100 13.75 17.13 21.62
As well as the commodities shown in the table for beef and dairy cattle, the following were also considered: barley forage, barley grain, bean forage, cabbage heads and leaves, grape pomace, maize, maize forage, oat straw, oats, pea hay or pea fodder, pea vines, dry peas, rice straw and fodder, soya beans , wheat, wheat forage and wheat bran.
Cypermethrins (118)
Estimated maximum dietary burden of livestock
POULTRY - BROILER MAX
Commodity Commod Residue Basis % Dry Residue dw Diet content (%) Residue contribution (ppm)
group mg/kg matter mg/kg US-CAN EU AU US-CAN EU AU
Rice grain GC 0.57 STMR 88 0.65 20 50 0.130 0.324
Carrot culls VR 0.01 HR 12 0.083 10 0.008
Bean seed VD 0.05 STMR 88 0.057 20 20 50 0.011 0.011 0.028
Barley grain GC 0.035 STMR 88 0.040 60 70 0.024 0.028
Total 100 100 100 0.16 0.05 0.35

504 Annex 6
Cypermethrins (118)
Estimated maximum dietary burden of livestock
POULTRY - LAYER MAX
Commodity Commod Residue Basis % Dry Residue dw Diet content (%) Residue contribution (ppm)
group mg/kg matter mg/kg US-CAN EU AU US-CAN EU AU
Pea vines AL 2.1 high residue 25 8.40 10 0.840
Beet, sugar tops AV 8.3 high residue 100 8.30 5 0.415
Wheat straw AS AF 6.9 high residue 100 6.90 10 0.690
Cabbage heads leaves VB 0.65 high residue 15 4.33 5 0.217
Rice grain GC 0.57 STMR 88 0.65 20 50 0.130 0.324
Carrot culls VR 0.01 HR 12 0.083 10 0.008
Bean seed VD 0.05 STMR 88 0.057 20 20 50 0.011 0.011 0.028
Barley grain GC 0.035 STMR 88 0.040 50 40 0.020 0.016
Wheat milled, bran CM 0.024 STMR 88 0.027 10 0.003
Total 100 100 100 0.16 2.20 0.35
As well as the commodities shown in the table for poultry broilers and layers, the following were also considered: barley grain, barley straw, bean seed, sugar beet tops, cabbage heads and leaves, carrot culls, maize fodder, maize forage, maize grain, oat grain, oat straw, pea seed, pea straw, pea vines, rice grain, wheat forage, wheat grain, wheat bran and wheat straw.
Cypermethrins (118)
Estimated mean dietary burden of livestock
BEEF CATTLE MEAN
Commodity Commod Residue Basis % Dry Residue dw Diet content (%) Residue contribution (ppm)
group mg/kg matter mg/kg US-CAN EU AU US-CAN EU AU
Alfalfa fodder AL 11.5 STMR 100 11.500 60 80 6.90 9.20
Alfalfa forage AL 3.65 STMR 35 10.429 70 20 7.30 2.09
Wheat straw and fodder, Dry AS AF 3.6 STMR 100 3.600
Maize fodder AS AF 3.6 STMR 100 3.600 25 25 0.90 0.90
Sugar beet leaves or tops AV 1.5 STMR 100 1.500 5 0.08
Rice GC 0.57 STMR 88 0.648 15 0.10
Total 100 100 100 7.90 8.28 11.29
Cypermethrins (118)
Estimated mean dietary burden of livestock
DAIRY CATTLE MEAN
Commodity Commod Residue Basis % Dry Residue dw Diet content (%) Residue contribution (ppm)
group mg/kg matter mg/kg US-CAN EU AU US-CAN EU AU
Alfalfa fodder AL 11.5 STMR 100 11.500 40 40 60 4.60 4.60 6.90
Sugar beet leaves or tops AV 1.5 STMR 23 6.522 30 1.96
Maize fodder AS AF 3.6 STMR 100 3.600 15 40 0.54 1.44
Barley straw AS AF 3.60 STMR 100 3.600 30 1.08
Rice GC 0.57 STMR 88 0.648 20 0.13
Carrot culls VR 0.01 STMR 12 0.083 10 0.01
Beans (dry) VD 0.05 STMR 88 0.057 15 0.01
Total 100 100 100 5.29 7.64 8.34

Annex 6 505
Cypermethrins (118)
Estimated mean dietary burden of livestock
POULTRY - BROILER MEAN
Commodity Commod Residue Basis % Dry Residue dw Diet content (%) Residue contribution (ppm)
group mg/kg matter mg/kg US-CAN EU AU US-CAN EU AU
Rice grain GC 0.57 STMR 88 0.65 20 50 0.130 0.324
Carrot culls VR 0.01 STMR 12 0.083 10 0.008
Bean seed VD 0.05 STMR 88 0.057 20 20 50 0.011 0.011 0.028
Barley grain GC 0.035 STMR 88 0.040 55 70 0.022 0.028
Wheat milled, bran CM 0.024 STMR 88 0.027 5 0.001
Total 100 100 100 0.16 0.05 0.35
Cypermethrins (118)
Estimated mean dietary burden of livestock
POULTRY - LAYER MEAN
Commodity Commod Residue Basis % Dry Residue dw Diet content (%) Residue contribution (ppm)
group mg/kg matter mg/kg US-CAN EU AU US-CAN EU AU
Wheat straw AS AF 3.6 STMR 100 3.60 10 0.360
Pea vines AL 0.45 STMR 25 1.80 10 0.180
Beet, sugar tops AV 1.5 STMR 100 1.50 5 0.075
Rice grain GC 0.57 STMR 88 0.65 20 50 0.130 0.324
Cabbage heads leaves VB 0.02 STMR 15 0.13 5 0.007
Carrot culls VR 0.01 STMR 12 0.083 10 0.008
Bean seed VD 0.05 STMR 100 0.050 20 20 50 0.010 0.010 0.025
Barley grain GC 0.035 STMR 88 0.040 50 40 0.020 0.016
Wheat milled, bran CM 0.024 STMR 88 0.027 10 0.003
Total 100 100 100 0.16 0.66 0.35
Imidacloprid (206)
Estimated maximum dietary burden of livestock
BEEF CATTLE MAX
Commodity Commodity Residue Basis % Dry Residue dw Diet content (%) Residue contribution (ppm)
group mg/kg matter mg/kg US-CAN EU AU US-CAN EU AU
Beet, sugar tops AM 0.67 HR 23 2.913 20 0.58
Oat, forage AF 0.67 HR 30 2.233 25 20 0.56 0.45
Peanut, hay AL 24 HR 85 28.235 25 60 7.06 16.94
Wheat, forage AF 0.67 HR 25 2.680 40 1.07
Wheat, straw AS 0.45 HR 88 0.511 10 0.05
Potato, culls VR 0.28 HR 20 1.400 30 0.42
Swede, roots VR 0.28 HR 10 2.800 40 1.12
Pea, seed VD 0.62 STMR 90 0.689 20 0.14
Almond, hulls AM 1.5 STMR 90 1.667 10 0.17
100 100 100 8.29 2.29 18.01

506 Annex 6
Imidacloprid (206)
Estimated maximum dietary burden of livestock
DAIRY CATTLE MAX
Commodity Commodity Residue Basis % Dry Residue dw Diet content (%) Residue contribution (ppm)
group mg/kg matter mg/kg US-CAN EU AU US-CAN EU AU
Beet, sugar tops AM 0.67 HR 23 2.913 30 0.87
Cabbage heads, leaves VB 0.32 HR 15 2.133 20 0.43
Oat, forage AF 0.67 HR 30 2.233 20 0.45
Peanut, hay AL 24 HR 85 28.235 20 60 5.65 16.94
Wheat, forage AF 0.67 HR 25 2.680 40 40 1.07 1.07
Carrot, culls VR 0.28 HR 12 2.333 10 0.23
Swede, roots VR 0.28 HR 10 2.800 20 0.56
Pea, seed VD 0.62 STMR 90 0.689 10 0.07
Almond, hulls AM 1.5 STMR 90 1.667 10 0.17
Wheat, milled byproducts CM 0.175 STMR 88 0.199 20 0.04
Total 100 100 100 7.16 2.38 18.01
Imidacloprid (206)
Estimated maximum dietary burden of livestock
POULTRY - BROILER MAX
Commodity Commodity Residue Basis % Dry Residue dw Diet content (%) Residue contribution (ppm)
group mg/kg matter mg/kg US-CAN EU AU US-CAN EU AU
Swede, roots VR 0.28 HR 10 2.800 10 0.28
Barley, grain GC 0.05 STMR 88 0.057 15 0.01
Corn, field, grain GC 0.05 STMR 88 0.057 80 0.05
Pea, seed VD 0.62 STMR 90 0.689 20 20 5 0.14 0.14 0.03
Rye, grain GC 0.05 STMR 88 0.057 70 50 0.04 0.03
Peanut, meal SO 0.12 STMR 85 0.141 10 0.01
Wheat, milled byproducts CM 0.175 STMR 88 0.199 20 0.04
Total 100 100 100 0.19 0.46 0.12
Imidacloprid (206)
Estimated maximum dietary burden of livestock
POULTRY - LAYER MAX
Commodity Commodity Residue Basis % Dry Residue dw Diet content (%) Residue contribution (ppm)
group mg/kg matter mg/kg US-CAN EU AU US-CAN EU AU
Beet, sugar tops AM 0.67 HR 23 2.913 5 0.15
Cabbage heads, leaves VB 0.32 HR 15 2.133 5 0.11
Wheat, forage AF 0.67 HR 25 2.680 10 0.27
Wheat, straw AS 0.45 HR 88 0.511 10 0.05
Swede, roots VR 0.28 HR 10 2.800 10 0.28
Corn, field, grain GC 0.05 STMR 88 0.057 70 40 0.04 0.02
Pea, seed VD 0.62 STMR 90 0.689 20 20 0.14 0.14
Wheat, grain GC 0.05 STMR 89 0.056 55 0.03
Peanut, meal SO 0.12 STMR 85 0.141 10 10 0.01 0.01
Sunflower, meal SO 0.05 STMR 92 0.054 15 0.01
Wheat, milled byproducts CM 0.175 STMR 88 0.199 20 0.04
Total 100 100 100 0.19 1.02 0.09

Annex 6 507
Imidacloprid (206)
Estimated mean dietary burden of livestock
BEEF CATTLE MEAN
Commodity Commodity Residue Basis % Dry Residue dw Diet content (%) Residue contribution (ppm)
group mg/kg matter mg/kg US-CAN EU AU US-CAN EU AU
Beet, sugar tops AM 0.425 STMR 23 1,848 20 0.37
Peanut, hay AL 8,2 STMR 85 9,647 25 60 2,41 5,79
Wheat, forage AF 0.09 STMR 25 0.360 25 20 0.09 0.07
Potato, culls VR 0.05 STMR 20 0.250 30 0.08
Swede, roots VR 0.05 STMR 10 0.500 40 0.20
Pea, seed VD 0.62 STMR 90 0.689 20 40 0.14 0.28
Apple pomace, wet AB 0.11 STMR 40 0.275 20 0.06
Total 100 100 100 2.64 0.78 6.07
Imidacloprid (206)
Estimated mean dietary burden of livestock
DAIRY CATTLE MEAN
Commodity Commodity Residue Basis % Dry Residue dw Diet content (%) Residue contribution (ppm)
group mg/kg matter mg/kg US-CAN EU AU US-CAN EU AU
Beet, sugar tops AM 0.425 STMR 23 1,848 30 0.55
Cabbage heads, leaves VB 0.08 STMR 15 0.533 20 0.11
Peanut, hay AL 8,2 STMR 85 9,647 20 60 1,93 5,79
Wheat, forage AF 0.09 STMR 25 0.360 40 0.14
Swede, roots VR 0.05 STMR 10 0.500 20 10 0.10 0.05
Pea, seed VD 0.62 STMR 90 0.689 20 20 0.14 0.14
Almond, hulls AM 1,5 STMR 90 1,667 10 10 0.17 0.17
Apple pomace, wet AB 0.11 STMR 40 0.275 10 0.03
Wheat, milled byproducts CM 0.175 STMR 88 0.199 30 0.06
Total 100 100 100 2.30 0.93 6.14
Imidacloprid (206)
Estimated mean dietary burden of livestock
POULTRY - BROILER MEAN
Commodity Commodity Residue Basis % Dry Residue dw
Diet content (%) Residue contribution (ppm)
group mg/kg matter mg/kg US-CAN EU AU US-CAN EU AU
Swede, roots VR 0.05 STMR 10 0.500 10 0.05
Oat, grain GC 0.05 STMR 89 0.056 15 0.01
Pea, seed VD 0.62 STMR 90 0.689 20 20 5 0.14 0.14 0.03
Rye, grain GC 0.05 STMR 88 0.057 50 0.03
Wheat, grain GC 0.05 STMR 89 0.056 40 0.02
Peanut, meal SO 0.12 STMR 85 0.141 30 10 10 0.04 0.01 0.01
Wheat, milled byproducts CM 0.175 STMR 88 0.199 50 20 20 0.10 0.04 0.04
Total 100 100 100 0.28 0.26 0.12

508 Annex 6
Imidacloprid (206)
Estimated mean dietary burden of livestock
POULTRY - LAYER MEAN
Commodity Commodity Residue Basis % Dry Residue dw Diet content (%) Residue contribution (ppm)
group mg/kg matter mg/kg US-CAN EU AU US-CAN EU AU
Beet, sugar tops AM 0.425 STMR 23 1,848 5 0.09
Cabbage heads, leaves VB 0.08 STMR 15 0.533 5 0.03
Swede, roots VR 0.05 STMR 10 0.500 10 0.05
Pea, seed VD 0.62 STMR 90 0.689 20 20 5 0.14 0.14 0.03
Wheat, grain GC 0.05 STMR 89 0.056 40 50 0.02 0.03
Peanut, meal SO 0.12 STMR 85 0.141 30 10 0.04 0.01
Sunflower, meal SO 0.05 STMR 92 0.054 15 0.01
Wheat, milled byproducts CM 0.175 STMR 88 0.199 50 20 20 0.10 0.04 0.04
Total 100 100 100 0.28 0.37 0.12
Lambda cyhalothrin (146)
Estimated maximum dietary burden
BEEF CATTLE MAX
Commodity CC Residue Basis DM Residue dw
Diet content (%) Residue contribution (ppm)
mg/kg % mg/kg US-CAN
EU AU US-CAN EU AU
Corn, field forage AF 2.8 highest residue 40 7.000 40 80 80 2.80 5.60 5.60
Peanut, hay AL 2.2 highest residue 85 2.588 25 0 20 0.65 0.00 0.52
Rice, hulls CM 1.9 STMR-P 90 2.111 10 0 0 0.21 0.00 0.00
Apple, pomace wet AB 0.65 STMR-P 40 1.625 20 20 0 0.33 0.33 0.00
Oats, straw (dry-weight) AS 1.6 highest residue 100 1.600 5 0 0 0.08 0.00 0.00
Total 100 100 100 4.07 5.93 6.12
Lambda cyhalothrin (146)
Estimated maximum dietary burden
DAIRY CATTLE MAX
Commodity CC Residue Basis DM Residue dw
Diet content (%) Residue contribution (ppm)
mg/kg % mg/kg US-CAN
EU AU US-CAN EU AU
Corn, field forage AF 2.8 highest residue 40 7.000 50 60 80 3.50 4.20 5.60
Peanut, hay AL 2.2 highest residue 85 2.588 20 0 20 0.52 0.00 0.52
Rice, hulls CM 1.9 STMR-P 90 2.111 10 0 0 0.21 0.00 0.00
Apple, pomace wet AB 0.65 STMR-P 40 1.625 10 10 0 0.16 0.16 0.00
Oats, straw (dry-weight) AS 1.6 highest residue 100 1.600 10 20 0 0.16 0.32 0.00
Wheat, milled byproducts CC 0.98 STMR-P 88 1.114 0 10 0 0.00 0.11 0.00
Total 100 100 100 4.55 4.79 6.12

Annex 6 509
Lambda cyhalothrin (146)
Estimated maximum dietary burden
POULTRY - BROILER MAX Commodity CC Residue Basis DM Residue
dw Diet content (%) Residue contribution
(ppm) mg/kg % mg/kg US-
CAN EU AU US-CAN EU AU
Wheat, milled byproducts CC 0.98 STMR-P 88 1.114 50 20 20 0.56 0.22 0.22
Rice, grain GC 0.3 STMR 88 0.335 20 0 50 0.07 0.00 0.17
Rice, bran/pollard CM 0.07 STMR-P 90 0.072 25 10 20 0.02 0.01 0.01
Barley, grain GC 0.02 STMR 88 0.023 0 70 0 0.00 0.02 0.00
Bean seed VD 0.01 STMR 88 0.011 5 0 10 0.00 0.00 0.00
Total 100 100 100 0.65 0.25 0.40
Lambda cyhalothrin (146)
Estimated maximum dietary burden
POULTRY - LAYER MAX Commodity CC Residue Basis DM Residue
dw Diet content (%) Residue contribution
(ppm) mg/kg % mg/kg US-
CAN EU AU US-CAN EU AU
Corn, field forage AF 2.8 highest residue 40 7.000 0 10 0 0.00 0.70 0.00
Wheat, straw (dry-weight) AS 1.6 highest residue 100 1.600 0 10 0 0.00 0.16 0.00
Wheat, milled byproducts CC 0.98 STMR-P 88 1.114 50 20 20 0.56 0.22 0.22
Rice, grain GC 0.3 STMR 88 0.335 20 0 50 0.07 0.00 0.17
Rice, bran/pollard CM 0.07 STMR-P 90 0.072 25 5 20 0.02 0.00 0.01
Barley, grain GC 0.02 STMR 88 0.023 0 55 0 0.00 0.01 0.00
Bean seed VD 0.01 STMR 88 0.011 5 0 10 0.00 0.00 0.00
Total 100 100 100 0.65 1.09 0.40
Lambda-cyhalothrin (146)
Estimated mean dietary burden
BEEF CATTLE MEAN
Commodity CC Residue Basis DM Residue dw
Diet content (%) Residue contribution (ppm)
mg/kg % mg/kg US-CAN
EU AU US-CAN EU AU
Corn, field forage AF 1.85 STMR 40 4.625 40 80 80 1.85 3.70 3.70
Rice, hulls CM 1.9 STMR-P 90 2.111 10 0 5 0.21 0.00 0.11
Apple, pomace wet AB 0.65 STMR-P 40 1.625 20 20 15 0.33 0.33 0.24
Peanut, hay AL 1.3 STMR 85 1.529 25 0 0 0.38 0.00 0.00
Wheat, milled byproducts CC 0.98 STMR-P 88 1.114 5 0 0 0.06 0.00 0.00
Total 100 100 100 2.83 4.03 4.05
Lambda-cyhalothrin (146)
Estimated mean dietary burden
DAIRY CATTLE MEAN
Commodity CC Residue Basis DM Residue dw
Diet content (%) Residue contribution (ppm)
mg/kg % mg/kg US-CAN
EU AU US-CAN EU AU
Corn, field forage AF 1.85 STMR 40 4.625 50 60 80 2.31 2.78 3.70
Rice, hulls CM 1.9 STMR-P 90 2.111 10 0 10 0.21 0.00 0.21
Apple, pomace wet AB 0.65 STMR-P 40 1.625 10 10 10 0.16 0.16 0.16
Peanut, hay AL 1.3 STMR 85 1.529 20 0 0 0.31 0.00 0.00
Wheat, milled byproducts CC 0.98 STMR-P 88 1.114 10 30 0 0.11 0.33 0.00
Total 100 100 100 3.1 3.27 4.07

510 Annex 6
Lambda-cyhalothrin (146)
Estimated mean dietary burden
POULTRY - BROILER MEAN Commodity CC Residue Basis DM Residue
dw Diet content (%) Residue contribution
(ppm) mg/kg % mg/kg US-
CAN EU AU US-CAN EU AU
Wheat, milled byproducts CC 0.98 STMR-P 88 1.114 50 20 20 0.56 0.22 0.22
Rice, grain GC 0.3 STMR 88 0.335 20 0 50 0.07 0.00 0.17
Rice, bran/pollard CM 0.07 STMR-P 90 0.072 25 10 20 0.02 0.01 0.01
Barley, grain GC 0.02 STMR 88 0.023 5 70 0 0.00 0.02 0.00
Bean seed VD 0.01 STMR 88 0.011 0 0 10 0.00 0.00 0.00
Total 100 100 100 0.65 0.25 0.40
Lambda-cyhalothrin (146)
Estimated mean dietary burden
POULTRY - LAYER MEAN Commodity CC Residue Basis DM Residue
dw Diet content (%) Residue contribution
(ppm) mg/kg % mg/kg US-
CAN EU AU US-CAN EU AU
Corn, field forage AF 1.85 STMR 40 4.625 0 10 0 0.00 0.46 0.00
Wheat, milled byproducts CC 0.98 STMR-P 88 1.114 50 20 20 0.56 0.22 0.22
Wheat, straw (dry-weight) AS 0.54 STMR 100 0.540 0 10 0 0.00 0.05 0.00
Rice, grain GC 0.3 STMR 88 0.335 20 0 50 0.07 0.00 0.17
Rice, bran/pollard CM 0.07 STMR-P 90 0.072 25 5 20 0.02 0.00 0.01
Barley, grain GC 0.02 STMR 88 0.023 0 55 0 0.00 0.01 0.00
Bean seed VD 0.01 STMR 88 0.011 5 0 10 0.00 0.00 0.00
Total 100 100 100 0.65 0.74 0.40
Mandipropamid (231)
Estimated maximum dietary burden of farm animals
BEEF CATTLE MAX
Commodity CC Residue Basis DM Residue dw Diet content (%) Residue contribution (ppm) mg/kg % mg/kg US–CAN EU AU US–CAN EU AU
Grape pomace, wet AB 1.16 STMR-P 15 7.733 20 1.55
Cabbage heads, leaves VC 5.8 high residue
15 38.667 20 7.73
Potato culls VR 0.01 high residue
20 0.050 30 30 10 0.02 0.02 0.01
Total 30 50 30 0.02 7.75 1.56

Annex 6 511
Mandipropamid (231)
Estimated maximum dietary burden of farm animals
DAIRY CATTLE MAX
Commodity CC Residue Basis DM Residue dw Diet content (%) Residue contribution (ppm) mg/kg % mg/kg US–CAN EU AU US–CAN EU AU
Grape pomace, wet AB 1.16 STMR-P 15 7.733 20 1.55
Cabbage heads, leaves VC 5.8 high residue
15 38.667 20 7.73
Potato culls VR 0.01 high residue
20 0.050 10 30 10 0.01 0.02 0.01
Total 10 50 30 0.01 7.75 1.56
Mandipropamid (231)
Estimated maximum dietary burden of farm animals
POULTRY – BROILER MAX
Commodity CC Residue Basis DM Residue dw Diet content (%) Residue contribution (ppm) mg/kg % mg/kg US–CAN EU AU US–CAN EU AU
Grape pomace, wet AB 1.16 STMR-P 15 7.733
Cabbage heads, leaves VC 5.8 high residue 15 38.667 5 1.93
Potato culls VR 0.01 high residue 20 0.050 10 0.01
Total 15 1.94
Mandipropamid (231)
Estimated maximum dietary burden of farm animals
POULTRY – LAYER MAX
Commodity CC Residue
Basis DM Residue dw
Diet content (%) Residue contribution (ppm) mg/kg % mg/kg US–CAN EU AU US–CAN EU AU
Grape pomace, wet AB 1.16 STMR-P 15 7.733
Cabbage heads, leaves VC 5.8 high residue
15 38.667 5 1.93
Potato culls VR 0.01 high residue
20 0.050 10 0.01
Total 15 1.94
Mandipropamid (231)
Estimated mean dietary burden of farm animals
BEEF CATTLE MEAN
Commodity CC Residue
Basis DM Residue dw Diet content (%) Residue contribution (ppm) mg/kg % mg/kg US–CAN EU AU US–CAN EU AU
Grape pomace, wet AB 1.16 STMR-P 15 7.733 20 1.55
Cabbage heads, leaves VC 3.55 STMR 15 23.667 20 4.73
Potato culls VR 0.01 STMR 20 0.050 30 30 10 0.02 0.02 0.01
Total 30 50 30 0.02 4.75 1.56

512 Annex 6
Mandipropamid (231)
Estimated mean dietary burden of farm animals
DAIRY CATTLE MEAN
Commodity CC Residue
Basis DM Residue dw Diet content (%) Residue contribution (ppm) mg/kg % mg/kg US-CAN EU AU US–CAN EU AU
Grape pomace, wet AB 1.16 STMR-P 15 7.733 20 1.55
Cabbage heads, leaves VC 3.55 STMR 15 23.667 20 4.73
Potato culls VR 0.01 STMR 20 0.050 30 30 10 0.02 0.02 0.01
Total 30 50 30 0.02 4.75 1.56
Mandipropamid (231)
Estimated mean dietary burden of farm animals
POULTRY – BROILER MEAN
Commodity CC Residue
Basis DM Residue dw Diet content (%) Residue contribution (ppm) mg/kg % mg/kg US–CAN EU AU US–CAN EU AU
Grape pomace, wet AB 1.16 STMR-P 15 7.733
Cabbage heads, leaves VC 3.55 STMR 15 23.667
Potato culls VR 0.01 STMR 20 0.050 10 0.01
Total 10 0.01
Mandipropamid (231)
Estimated mean dietary burden of farm animals
POULTRY – LAYER MEAN
Commodity CC Residue
Basis DM Residue dw Diet content (%) Residue contribution (ppm) mg/kg % mg/kg US–CAN EU AU US–CAN EU AU
Grape pomace, wet AB 1.16 STMR-P 15 7.733
Cabbage heads, leaves VC 3.55 STMR 15 23.667 5 1.18
Potato culls VR 0.01 STMR 20 0.050 10 0.01
Total 15 1.19
Profenofos (171)
Estimated maximum/mean dietary burden
BEEF CATTLE MAX/MEAN
Diet content (%) Residue contribution (ppm) Commodity
Commodity group
Residue mg/kg
Basis %Dry matter
Residue dw mg/kg US-CAN EU AU US-CAN EU AU
Cotton meal SO 0.19 STMR 89 0.213 5 0.01
Cotton hulls SO 0.49 STMR 90 0.544 20 20 0.11 0.11
Total 20 5 20 0.11 0.01 0.11
DAIRY CATTLE MAX/MEAN
Diet content (%) Residue contribution (ppm) Commodity
Commod group
Residue mg/kg
Basis %Dry matter
Residue dw mg/kg US-CAN EU AU US-CAN EU AU
Cotton meal SO 0.19 STMR 89 0.213 5 0.01
Cotton hulls SO 0.49 STMR 90 0.544 15 10 0.08 0.05
Total 15 5 10 0.08 0.01 0.05

Annex 6 513
Profenofos (171)
Estimated maximum/mean dietary burden
POULTRY - BROILER MAX/MEAN
Diet content (%) Residue contribution (ppm) Commodity
Commod group
Residue mg/kg
Basis %Dry matter
Residue dw mg/kg US-CAN EU AU US-CAN EU AU
Cotton meal SO 0.19 STMR 89 0.213 20 5 10 0.04 0.01 0.02
Total 20 5 10 0.04 0.01 0.02
POULTRY - LAYER MAX/MEAN
Diet content (%) Residue contribution (ppm) Commodity
Commod group
Residue mg/kg
Basis %Dry matter
Residue dw mg/kg US-CAN EU AU US-CAN EU AU
Cotton meal SO 0.19 STMR 89 0.213 20 5 10 0.04 0.01 0.02
Total 20 5 10 0.04 0.01 0.02
Prothioconazole (232)
Estimated maximum dietary burden of livestock
BEEF CATTLE MAX
Commodity Commodity Residue
Basis % Dry Residue dw
Diet content (%) Residue contribution (ppm)
group mg/kg matter mg/kg US-CAN
EU AU US-CAN EU AU
Barley, forage AF 2.6 HR 30 8.67 30 30 2.60 2.60
Wheat, forage AF 2.6 HR 25 10.4 100 10.4
Barley, grain GC 0.01 STMR 88 0.011 50 70 0.0057 0.0080
Total 80 100 100 2.61 2.61 10.40
Prothioconazole (232)
Estimated maximum dietary burden of livestock
DAIRY CATTLE MAX
Commodity Commodity Residue
Basis % Dry Residue dw
Diet content (%) Residue contribution (ppm)
group mg/kg matter mg/kg US-CAN
EU AU US-CAN EU AU
Barley, forage AF 2.6 HR 30 8.67 30 2.60
Oat, forage AF 2.6 HR 30 8.67 90 7.8
Wheat, forage AF 2.6 HR 25 10.4 40 4.16
Barley, grain GC 0.01 STMR 88 0.011 45 40 10 0.0051 0.0045 0.0011
Total 85 70 100 4.17 2.61 7.80
Prothioconazole (232)
Estimated mean dietary burden of livestock
BEEF CATTLE MEAN
Commodity Commodity Residue
Basis % Dry Residue dw
Diet content (%) Residue contribution (ppm)
group mg/kg matter mg/kg US-CAN
EU AU US-CAN EU AU
Barley, forage AF 0.96 STMR 30 3.05 30 30 0.96 0.96
Wheat, forage AF 0.96 STMR 25 3.66 100 3.84
Barley, grain GC 0.01 STMR 88 0.011 50 70 0.0057 0.0080
Total 80 100 100 0.96 0.96 3.84
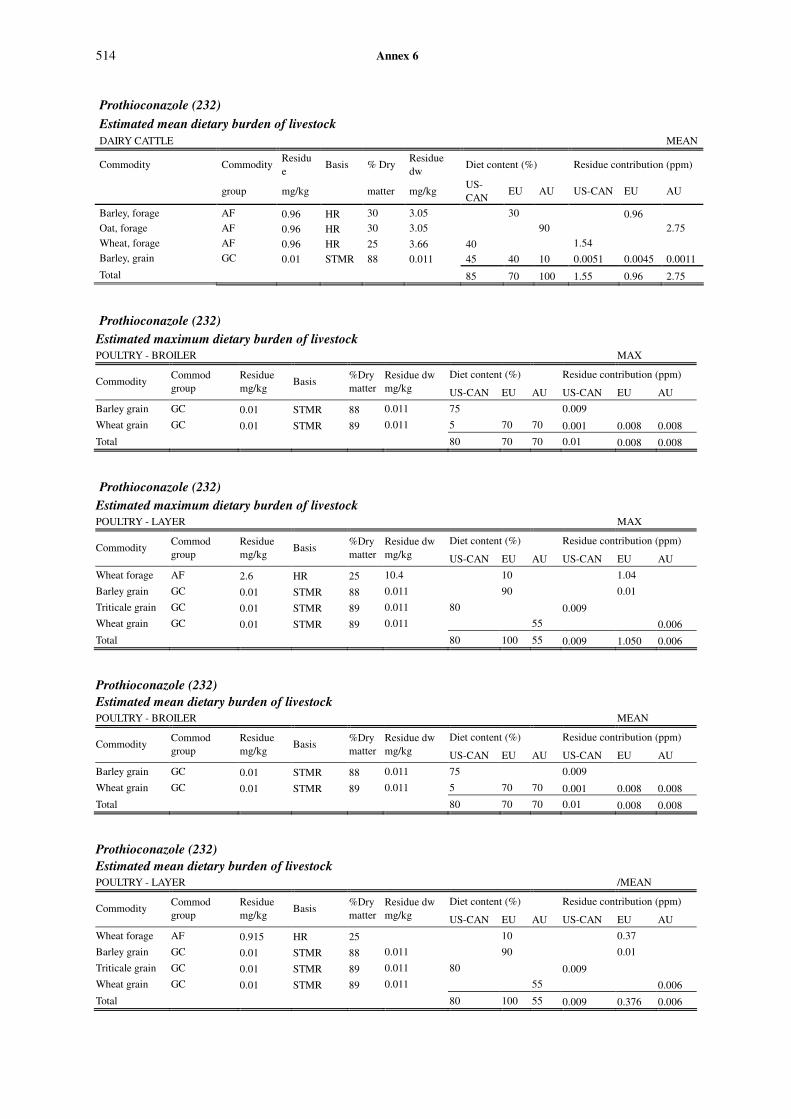
514 Annex 6
Prothioconazole (232)
Estimated mean dietary burden of livestock
DAIRY CATTLE MEAN
Commodity Commodity Residue
Basis % Dry Residue dw
Diet content (%) Residue contribution (ppm)
group mg/kg matter mg/kg US-CAN
EU AU US-CAN EU AU
Barley, forage AF 0.96 HR 30 3.05 30 0.96
Oat, forage AF 0.96 HR 30 3.05 90 2.75
Wheat, forage AF 0.96 HR 25 3.66 40 1.54
Barley, grain GC 0.01 STMR 88 0.011 45 40 10 0.0051 0.0045 0.0011
Total 85 70 100 1.55 0.96 2.75
Prothioconazole (232)
Estimated maximum dietary burden of livestock
POULTRY - BROILER MAX
Diet content (%) Residue contribution (ppm) Commodity
Commod group
Residue mg/kg
Basis %Dry matter
Residue dw mg/kg US-CAN EU AU US-CAN EU AU
Barley grain GC 0.01 STMR 88 0.011 75 0.009
Wheat grain GC 0.01 STMR 89 0.011 5 70 70 0.001 0.008 0.008
Total 80 70 70 0.01 0.008 0.008
Prothioconazole (232)
Estimated maximum dietary burden of livestock
POULTRY - LAYER MAX
Diet content (%) Residue contribution (ppm) Commodity
Commod group
Residue mg/kg
Basis %Dry matter
Residue dw mg/kg US-CAN EU AU US-CAN EU AU
Wheat forage AF 2.6 HR 25 10.4 10 1.04
Barley grain GC 0.01 STMR 88 0.011 90 0.01
Triticale grain GC 0.01 STMR 89 0.011 80 0.009
Wheat grain GC 0.01 STMR 89 0.011 55 0.006
Total 80 100 55 0.009 1.050 0.006
Prothioconazole (232)
Estimated mean dietary burden of livestock
POULTRY - BROILER MEAN
Diet content (%) Residue contribution (ppm) Commodity
Commod group
Residue mg/kg
Basis %Dry matter
Residue dw mg/kg US-CAN EU AU US-CAN EU AU
Barley grain GC 0.01 STMR 88 0.011 75 0.009
Wheat grain GC 0.01 STMR 89 0.011 5 70 70 0.001 0.008 0.008
Total 80 70 70 0.01 0.008 0.008
Prothioconazole (232)
Estimated mean dietary burden of livestock
POULTRY - LAYER /MEAN
Diet content (%) Residue contribution (ppm) Commodity
Commod group
Residue mg/kg
Basis %Dry matter
Residue dw mg/kg US-CAN EU AU US-CAN EU AU
Wheat forage AF 0.915 HR 25 10 0.37
Barley grain GC 0.01 STMR 88 0.011 90 0.01
Triticale grain GC 0.01 STMR 89 0.011 80 0.009
Wheat grain GC 0.01 STMR 89 0.011 55 0.006
Total 80 100 55 0.009 0.376 0.006
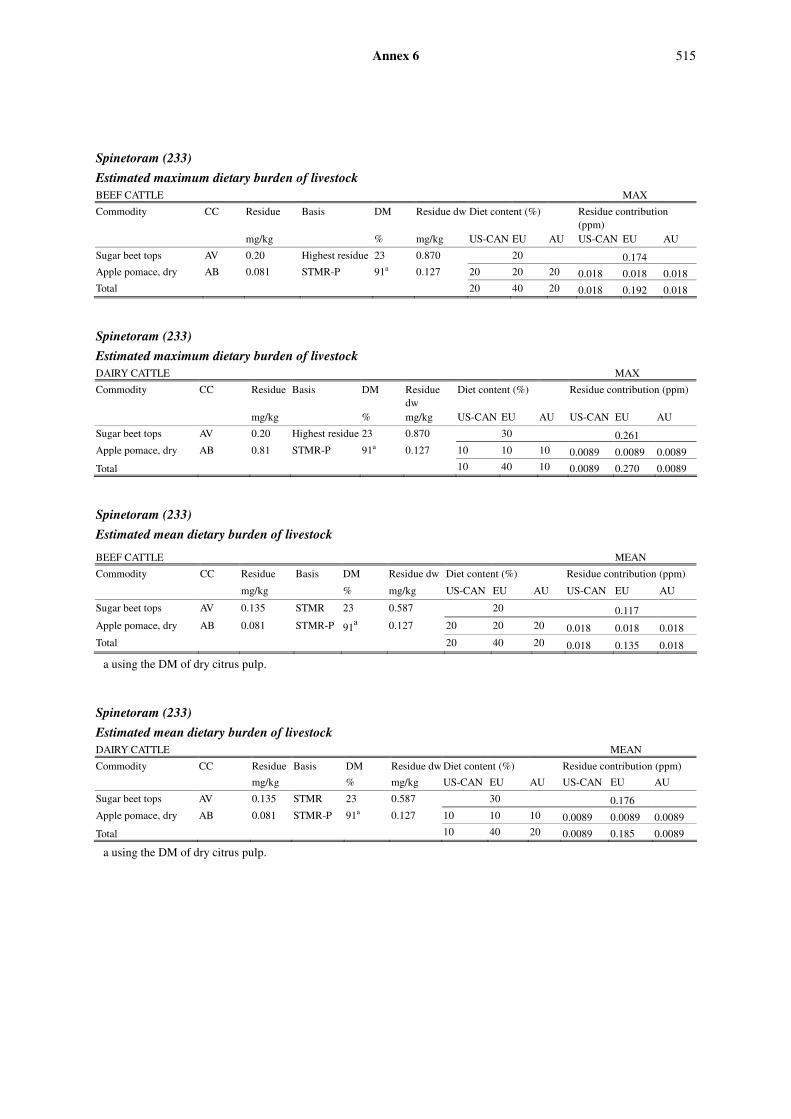
Annex 6 515
Spinetoram (233)
Estimated maximum dietary burden of livestock
BEEF CATTLE MAX
Commodity CC Residue Basis DM Residue dw Diet content (%) Residue contribution (ppm)
mg/kg % mg/kg US-CAN EU AU US-CAN EU AU
Sugar beet tops AV 0.20 Highest residue 23 0.870 20 0.174 Apple pomace, dry AB 0.081 STMR-P 91a 0.127 20 20 20 0.018 0.018 0.018 Total 20 40 20 0.018 0.192 0.018
Spinetoram (233)
Estimated maximum dietary burden of livestock
DAIRY CATTLE MAX
Commodity CC Residue Basis DM Residue dw
Diet content (%) Residue contribution (ppm)
mg/kg % mg/kg US-CAN EU AU US-CAN EU AU
Sugar beet tops AV 0.20 Highest residue 23 0.870 30 0.261
Apple pomace, dry AB 0.81 STMR-P 91a 0.127 10 10 10 0.0089 0.0089 0.0089
Total 10 40 10 0.0089 0.270 0.0089
Spinetoram (233)
Estimated mean dietary burden of livestock
BEEF CATTLE MEAN
Commodity CC Residue Basis DM Residue dw Diet content (%) Residue contribution (ppm)
mg/kg % mg/kg US-CAN EU AU US-CAN EU AU
Sugar beet tops AV 0.135 STMR 23 0.587 20 0.117
Apple pomace, dry AB 0.081 STMR-P 91a 0.127 20 20 20 0.018 0.018 0.018
Total 20 40 20 0.018 0.135 0.018
a using the DM of dry citrus pulp.
Spinetoram (233)
Estimated mean dietary burden of livestock
DAIRY CATTLE MEAN
Commodity CC Residue Basis DM Residue dw Diet content (%) Residue contribution (ppm)
mg/kg % mg/kg US-CAN EU AU US-CAN EU AU
Sugar beet tops AV 0.135 STMR 23 0.587 30 0.176
Apple pomace, dry AB 0.081 STMR-P 91a 0.127 10 10 10 0.0089 0.0089 0.0089
Total 10 40 20 0.0089 0.185 0.0089
a using the DM of dry citrus pulp.

516 Annex 6
Spirotetramat (234)
Estimated maximum dietary burden of farm animals BEEF CATTLE MAX
Commodity CC Residue Basis DM Residue dw Diet content (%) Residue contribution (ppm)
mg/kg % mg/kg US-CAN EU AU US-CAN EU AU
Apple pomace, dry AB 1.1 STMR-P 100 1.100 20 20 0 0.22 0.22
Cabbage heads VB 0.92 HR 15 6.133 0 20 0 1.23
Citrus pulp, dry AB 0.43 STMR-P 91 0.484 0.1 0 0 0.00
Grape pomace, wet AB 0.74 STMR-P 15 4.9 0 0 20 0.98
Almond hulls TN 4.9 STMR 90 5.444 10 0 10 0.54 0.54
Potato waste VR 0.44 HR-P 12 3.667 30 40 5 1.10 1.47 0.18
Total 60.1 80 35 1.86 2.91 1.71
Spirotetramat (234)
Estimated maximum dietary burden of farm animals DAIRY CATTLE MAX
Commodity CC Residue Basis DM Residue dw Diet content (%) Residue contribution (ppm)
mg/kg % mg/kg US-CAN EU AU US-CAN EU AU
Apple pomace, dry AB 1.1 STMR-P 100 1.100 10 0 0 0.11
Cabbage heads VB 0.92 HR 15 6.133 0 20 0 1.23
Citrus pulp, dry AB 0.43 STMR-P 91 0.47 0 20 0 0.09
Grape pomace, wet AB 0.74 STMR-P 15 4.9 0 0 20 0.98
Almond hulls TN 4.9 STMR 90 5.444 10 0 10 0.54 0.54
Potato waste VR 0.44 HR-P 12 3.667 10 30 0 0.37 1.10
Total 30 70 30 1.02 2.41 1.53
Spirotetramat (234)
Estimated mean dietary burden of farm animals
BEEF CATTLE MEAN
Commodity CC Residue
Basis DM Residue dw Diet content (%) Residue contribution (ppm)
mg/kg % mg/kg US-CAN EU AU US-CAN EU AU
Apple pomace, dry AB 1.1 STMR-P 100 1.100 20 20 0 0.22 0.22
Cabbage heads VB 0.23 STMR 15 1.533 0 20 0 0.31
Citrus pulp, dry AB 0.43 STMR-P 91 0.47 0 0 0
Grape pomace, wet AB 0.74 STMR-P 15 4.9 0 0 20 0.98
Almond hulls TN 4.9 STMR 90 5.444 10 0 10 0.54 0.54
Potato waste VR 0.11 STMR-P 12 0.917 30 40 5 0.28 0.37 0.05
Total 60 80 35 1.04 0.89 1.57
Spirotetramat (234)
Estimated mean dietary burden of farm animals
DAIRY CATTLE MEAN
Commodity CC Residue
Basis DM Residue dw Diet content (%) Residue contribution (ppm)
mg/kg % mg/kg US-CAN EU AU US-CAN EU AU
Apple pomace, dry AB 1.1 STMR-P 100 1.100 10 0 0 0.11
Cabbage heads VB 0.23 STMR 15 1.533 0 20 0 0.31
Citrus pulp, dry AB 0.43 STMR-P 91 0.47 0 20 0 0.09
Grape pomace, wet AB 0.74 STMR-P 15 4.9 0 0 20 0.98
Almond hulls TN 4.9 STMR 90 5.444 10 0 10 0.54 0.54
Potato waste VR 0.11 STMR-P 12 0.917 1 3 0 0.01 0.03
Total 21 43 30 0.66 0.42 1.53

Annex 6 517
Tebuconazole (189)
Estimated maximum dietary burden of farm animals
BEEF CATTLE* MEAN
Commodity CC Residue
Basis DM Residue dw Diet content (%) Residue contribution (ppm)
mg/kg % mg/kg US-CAN EU AU US-CAN EU AU
barley forage AF 18 highest residue 30 60.000 30 30 18.00 18.00
rape forage AF 18 highest residue 30 60.000 100 60.00
barley straw AS 17 highest residue 89 19.101 30 5.73
Peanut fodder AS 30 MRL 85 35.294 25 8.82
barley GC 0.06 STMR 88 0.068 20 0.01
rice GC 0.275 STMR 88 0.313 20 0.06
Soya bean aspired grain 5.5 STMR-P 85 6.471 5 0.32
Apple pomace, wet AB 0.63 STMR-P 40 1.575 20 20 0.32 0.32
Total 100 100
100 27.21 23.74 60.00
*other commodities considered : soya bean forage, rye straw, wheat straw, rye, wheat, maize, soya bean, soya bean meal, soya bean hulls
Tebuconazole (189)
Estimated maximum dietary burden of farm animals
DAIRY CATTLE* MEAN
Commodity CC Residue Basis DM Residue dw Diet content (%) Residue contribution (ppm)
mg/kg % mg/kg US-CAN EU AU US-CAN EU AU
barley forage AF 18 highest residue 30 60.000 40 30 50 24.00 18.00 30.00
barley straw AS 17 highest residue 89 19.101 30 5.73
Peanut fodder AS 30 MRL 85 35.294 25 50 8.82 17.65
barley 0.06 STMR 88 0.068 30 0.02
rice 0.275 STMR 88 0.313 20 0.06
Maize GC 0.1 STMR 88 0.114 5 0.01
Apple pomace, wet AB 0.63 STMR-P 40 1.575 10 10 0.16 0.16
Total 100 100 100 32.89 23.75 47.65
*other commodities considered : rape forage, soya bean forage, rye straw, wheat straw, rye, wheat, maize, soya bean, soya bean meal, soya bean hulls
Tebuconazole (189)
Estimated mean dietary burden of farm animals
BEEF CATTLE* MEAN
Commodity CC Residue
Basis DM Residue dw Diet content (%) Residue contribution (ppm)
mg/kg % mg/kg US-CAN EU AU US-CAN EU AU
barley forage AF 5.2 STMR 30 17.333 30 30 5.20 5.20
rape forage AF 5.2 STMR 30 17.333 100 17.33
Wheat straw and fodder AS 10 MRL 88 11.364 20 2.27
Peanut fodder AS 30 MRL 85 35.294 25 8.82
barley GC 0.06 STMR 88 0.068 20 50 0.01 0.03
Soya bean aspired grain 5.5 STMR-P 85 6.471 5 0.32
Apple pomace, wet AB 0.63 STMR-P 40 1.575 20 20 0.32 0.32
Total 100 100
100 14.36 7.51 17.33
*other commodities considered : soya bean forage, rye straw, wheat straw, rice, rye, wheat, maize, soya bean, soya bean meal, soya bean hulls

518 Annex 6
Tebuconazole (189)
Estimated mean dietary burden of farm animals
DAIRY CATTLE MEAN
Commodity CC Residue
Basis DM Residue dw
Diet content (%) Residue contribution (ppm)
mg/kg % mg/kg US-CAN EU AU US-CAN EU AU
barley forage AF 5.2 STMR 30 17.333 40 30 50 6.93 5.20 8.67
Wheat straw and fodder AS 10 MRL 88 11.364 20 2.27
Peanut fodder AS 30 MRL 85 35.294 25 50 8.82 17.65
Maize GC 0.1 STMR 88 0.114 35 40 0.04 0.05
Apple pomace, wet AB 0.63 STMR-P 40 1.575 10 10 0.16 0.16
Total 100 100
100 15.80 7.52 26.31
*other commodities considered : rape forage, soya bean forage, rye straw, barley, rice, rye, wheat, soya bean, soya bean meal, soya bean hulls
Tebuconazole (189)
Estimated maximum dietary burden of farm animals
POULTRY - BROILER MAX
Commodity CC Residue Basis DM Residue dw Diet content (%) Residue contribution (ppm)
mg/kg % mg/kg US-CAN EU AU US-CAN EU AU
barley grain 0.06 STMR 88 0.068 75 70 0.05 0.05
rice grain 0.275 STMR 88 0.313 20 50 0.06 0.16
rye grain 0.05 MRL 88 0.057 35 0.02
corn grain 0.1 STMR 88 0.114 5 30 0.01 0.03
soya bean 0.02 STMR 89 0.022
wheat GC 0.05 MRL 89 0.056 15 0.01
Total 100 70 100 0.11 0.05 0.18
*other commodities considered : soya bean
Tebuconazole (189)
Estimated maximum dietary burden of farm animals
POULTRY - LAYER MAX
Commodity CC Residue Basis DM Residue dw Diet content (%) Residue contribution (ppm)
mg/kg % mg/kg US-CAN EU AU US-CAN EU AU
rape forage 18 highest residue 30 60.000 10 6.00
wheat straw and fodder AS 10 MRL 88 11.364 10 1.14
barley grain 0.06 STMR 88 0.068 75 70 15 0.05 0.05 0.01
rice grain 0.275 STMR 88 0.313 20 50 0.06 0.16
rye grain 0.05 MRL 88 0.057 5 35 0.00 0.02
wheat GC 0.05 MRL 89 0.056 10 0.01
Total 100 80 100 0.11648 7.19 0.18636
*other commodities considered : soya bean forage, barley straw, maize, soya bean
Tebuconazole (189)
Estimated mean dietary burden of farm animals
POULTRY - BROILER MAX
Commodity CC Residue Basis DM Residue dw Diet content (%) Residue contribution (ppm)
mg/kg % mg/kg US-CAN EU AU US-CAN EU AU
barley grain 0.055 STMR 88 0.063 75 50 0.05 0.03
rice grain 0.275 STMR 88 0.313 20 50 0.06 0.16
rye grain 0.05 MRL 88 0.057 5 50 0.00 0.03
wheat GC 0.05 MRL 89 0.056 50 0.03
Total 100 100 100 0.11 0.06 0.18
*other commodities considered : maize, soya bean

Annex 6 519
Tebuconazole (189)
Estimated mean dietary burden of farm animals
POULTRY - LAYER MAX
Commodity CC Residue Basis DM Residue dw Diet content (%) Residue contribution (ppm)
mg/kg % mg/kg US-CAN EU AU US-CAN EU AU
rape forage 5.2 STMR 30 17.333 10 1.73
soya bean forage 5.2 STMR 56 9.286 10 0.93
wheat straw and fodder AS 10 MRL 88 11.364 10 1.14
barley grain 0.055 STMR 88 0.063 75 15 0.05 0.01
rice grain 0.275 STMR 88 0.313 20 50 0.06 0.16
rye grain 0.05 MRL 88 0.057 35 0.02
corn grain 0.1 STMR 88 0.114 5 70 0.01 0.08
Total 100 100 100 0.12 3.88 0.19
*other commodities considered : barley straw, soya bean and wheat

An
nex
7
521A
NN
EX
7:
CO
RR
EC
TIO
NS
TO
TH
E R
EP
OR
T O
F T
HE
2007 M
EE
TIN
G
Ann
ex 3
and
4 e
ntri
es f
or p
ropi
cona
zole
, om
itte
d fr
om th
e 20
07 R
epor
t, ar
e li
sted
bel
ow.
P
RO
PIC
ON
AZ
OL
E (
16
0)
Inte
rnat
iona
l Est
imat
ed D
aily
Inta
ke (
IED
I)
A
DI =
0 -
0.0
700
mg/
kg b
w
ST
MR
or
Die
ts: g
/per
son/
day
Inta
ke =
dai
ly in
take
: µg/
pers
on
STM
R-P
A
B
C
D
E
F
Cod
ex C
ode
Com
mod
ity
mg/
kg
diet
in
take
di
et
inta
ke
diet
in
take
di
et
inta
ke
diet
in
take
di
et
inta
ke
FI 0
327
Ban
ana
0.06
38
.8
1.6
17.4
0.
7 16
.0
0.7
6.6
0.3
21.5
0.
9 33
.8
1.4
GC
064
0 B
arle
y (i
ncl p
ot, i
ncl p
earl
ed, i
ncl f
lour
& g
rits
, inc
l be
er)
0.
0675
40
.6
2.7
16.8
1.
1 93
.9
6.3
13.2
0.
9 48
.6
3.3
36.1
2.
4
SB 0
716
Cof
fee
bean
s (i
ncl g
reen
, inc
l ext
ract
s, in
cl r
oast
ed)
0.06
3.
1 0.
2 12
.6
0.8
2.9
0.2
1.4
0.1
10.1
0.
6 18
.0
1.1
FB 0
265
Cra
nber
ries
0.
174
0.1
0.0
0.0
0.0
0.0
0.0
0.3
0.1
0.0
0.0
0.6
0.1
MO
010
5 E
dibl
e of
fal (
mam
mal
ian)
0.
6 3.
9 2.
3 14
.4
8.6
5.2
3.1
11.8
7.
1 11
.7
7.0
7.6
4.6
PE 0
112
Egg
s 0.
05
2.5
0.1
29.7
1.
5 25
.1
1.3
24.5
1.
2 37
.8
1.9
27.4
1.
4 G
C 0
645
Mai
ze (
incl
flo
ur, i
ncl o
il, in
cl b
eer)
0.
05
82.7
4.
1 14
8.4
7.4
135.
9 6.
8 31
.8
1.6
33.3
1.
7 7.
5 0.
4 M
M 0
095
Mea
t fro
m m
amm
als
othe
r th
an m
arin
e m
amm
als:
20
% a
s fa
t 0.
05
5.5
0.3
23.3
1.
2 7.
7 0.
4 11
.0
0.6
18.0
0.
9 26
.3
1.3
MM
009
5 M
eat f
rom
mam
mal
s ot
her
than
mar
ine
mam
mal
s:
80%
as
mus
cle
0.05
22
.2
1.1
93.2
4.
7 30
.8
1.5
44.1
2.
2 72
.2
3.6
105.
0 5.
3
ML
010
6 M
ilks
(exc
l pro
cess
ed p
rodu
cts)
0.
01
68.8
0.
7 19
0.6
1.9
79.4
0.
8 30
2.6
3.0
179.
6 1.
8 23
7.9
2.4
TN
067
2 Pe
can
0.02
0.
0 0.
0 0.
0 0.
0 0.
0 0.
0 0.
0 0.
0 0.
1 0.
0 0.
0 0.
0 FI
035
3 Pi
neap
ple
(inc
l can
ned,
incl
juic
e)
0.02
3.
8 0.
1 6.
2 0.
1 0.
6 0.
0 0.
9 0.
0 7.
7 0.
2 8.
2 0.
2 G
C 0
656
Popc
orn
0.05
0.
1 0.
0 0.
2 0.
0 0.
0 0.
0 0.
1 0.
0 0.
1 0.
0 0.
1 0.
0 PM
011
0 Po
ultr
y m
eat:
10%
as
fat
0.05
0.
7 0.
0 5.
9 0.
3 3.
2 0.
2 2.
4 0.
1 6.
1 0.
3 2.
7 0.
1 PM
011
0 Po
ultr
y m
eat:
90%
as
mus
cle
0.05
6.
4 0.
3 52
.7
2.6
28.7
1.
4 21
.6
1.1
54.9
2.
7 24
.6
1.2
SO 0
495
Rap
e se
ed (
incl
oil)
0.
06
0.9
0.1
1.8
0.1
2.5
0.2
1.9
0.1
35.7
2.
1 26
.1
1.6
GC
065
0 R
ye (
incl
flo
ur)
0.06
0.
1 0.
0 3.
7 0.
2 0.
3 0.
0 24
.3
1.5
25.8
1.
5 45
.8
2.7
VD
054
1 So
ya b
ean
(dry
, inc
l oil)
0.
03
9.9
0.3
36.4
1.
1 34
.3
1.0
22.4
0.
7 35
.3
1.1
39.2
1.
2 V
R 0
596
Suga
r be
et
0.06
0.
0 0.
0 40
.7
2.4
0.0
0.0
0.1
0.0
6.0
0.4
0.1
0.0
GS
0659
Su
gar
cane
0
30.9
0.
0 43
.1
0.0
51.3
0.
0 0.
1 0.
0 5.
5 0.
0 0.
0 0.
0 V
O 0
447
Swee
t cor
n (c
orn-
on-t
he-c
ob)
0.05
7.
3 0.
4 1.
0 0.
1 0.
1 0.
0 0.
5 0.
0 3.
3 0.
2 3.
6 0.
2 G
C 0
653
Tri
tica
le (
incl
flo
ur)
0.06
0.
0 0.
0 11
5.8
6.9
0.0
0.0
0.0
0.0
0.3
0.0
0.0
0.0
GC
065
4 W
heat
(in
cl b
ulgu
r w
hole
mea
l, in
cl f
lour
) 0.
06
88.4
5.
3 39
6.3
23.8
42
6.5
25.6
39
0.2
23.4
23
6.3
14.2
21
6.0
13.0
Tot
al in
take
(µ
g/pe
rson
)=
19.7
65.6
49.5
43.9
44.4
40.5
Bod
ywei
ght p
er r
egio
n (k
g bw
) =
60
60
60
60
60
60
A
DI (
µg/
pers
on)=
42
00
42
00
42
00
42
00
42
00
42
00
%
AD
I=
0.5%
1.6%
1.2%
1.0%
1.1%
1.0%
Rou
nded
%A
DI=
0%
2%
1%
1%
1%
1%

An
nex
7
522P
RO
PIC
ON
AZ
OL
E (
16
0)
Inte
rnat
iona
l Est
imat
ed D
aily
Inta
ke (
IED
I)
A
DI =
0 -
0.0
700
mg/
kg b
w
STM
R o
r D
iets
: g/p
erso
n/da
y In
take
= d
aily
inta
ke: µ
g/pe
rson
STM
R-P
G
H
I
J K
L
M
C
odex
C
ode
Com
mod
ity
mg/
kg
diet
in
take
di
et
inta
ke
diet
in
take
di
et
inta
ke
diet
in
take
di
et
inta
ke
diet
in
take
FI 0
327
Ban
ana
0.06
21
.4
0.9
36.6
1.
5 11
.4
0.5
9.2
0.4
70.2
2.
9 40
.5
1.7
32.6
1.
4
GC
064
0 B
arle
y (i
ncl p
ot, i
ncl p
earl
ed, i
ncl f
lour
& g
rits
, in
cl b
eer)
0.
0675
5.
9 0.
4 20
.5
1.4
5.9
0.4
2.5
0.2
20.2
1.
4 16
.8
1.1
43.8
3.
0
SB 0
716
Cof
fee
bean
s (i
ncl g
reen
, inc
l ext
ract
s, in
cl
roas
ted)
0.
06
0.2
0.0
7.0
0.4
0.5
0.0
0.2
0.0
5.3
0.3
5.7
0.3
12.4
0.
7
FB 0
265
Cra
nber
ries
0.
174
0.0
0.0
0.0
0.0
0.0
0.0
0.0
0.0
0.0
0.0
0.0
0.0
2.5
0.4
MO
010
5 E
dibl
e of
fal (
mam
mal
ian)
0.
6 4.
8 2.
9 10
.7
6.4
4.0
2.4
4.0
2.4
6.5
3.9
6.6
4.0
5.6
3.4
PE 0
112
Egg
s 0.
05
22.1
1.
1 71
.5
3.6
16.6
0.
8 5.
1 0.
3 17
.6
0.9
35.2
1.
8 57
.4
2.9
GC
064
5 M
aize
(in
cl f
lour
, inc
l oil,
incl
bee
r)
0.05
35
.2
1.8
298.
6 14
.9
248.
1 12
.4
57.4
2.
9 63
.1
3.2
58.6
2.
9 85
.5
4.3
MM
009
5 M
eat f
rom
mam
mal
s ot
her
than
mar
ine
mam
mal
s: 2
0% a
s fa
t 0.
05
11.0
0.
5 17
.9
0.9
6.1
0.3
5.7
0.3
16.4
0.
8 12
.2
0.6
31.7
1.
6
MM
009
5 M
eat f
rom
mam
mal
s ot
her
than
mar
ine
mam
mal
s: 8
0% a
s m
uscl
e 0.
05
43.8
2.
2 71
.5
3.6
24.5
1.
2 22
.9
1.1
65.7
3.
3 48
.9
2.4
126.
6 6.
3
ML
010
6 M
ilks
(exc
l pro
cess
ed p
rodu
cts)
0.
01
66.0
0.
7 12
1.1
1.2
81.6
0.
8 10
2.4
1.0
207.
7 2.
1 57
.0
0.6
287.
9 2.
9
TN
067
2 Pe
can
0.02
0.
0 0.
0 0.
0 0.
0 0.
0 0.
0 0.
0 0.
0 0.
0 0.
0 0.
0 0.
0 0.
1 0.
0
FI 0
353
Pine
appl
e (i
ncl c
anne
d, in
cl ju
ice)
0.
02
3.9
0.1
11.7
0.
2 12
.6
0.3
11.1
0.
2 16
.6
0.3
21.4
0.
4 22
.6
0.5
GC
065
6 Po
pcor
n 0.
05
0.1
0.0
0.1
0.0
0.1
0.0
0.1
0.0
0.1
0.0
0.1
0.0
1.4
0.1
PM 0
110
Poul
try
mea
t: 10
% a
s fa
t 0.
05
1.8
0.1
13.1
0.
7 2.
5 0.
1 0.
5 0.
0 14
.6
0.7
2.8
0.1
11.5
0.
6
PM 0
110
Poul
try
mea
t: 90
% a
s m
uscl
e 0.
05
15.8
0.
8 11
8.2
5.9
22.6
1.
1 4.
2 0.
2 13
1.3
6.6
24.9
1.
2 10
3.6
5.2
SO 0
495
Rap
e se
ed (
incl
oil)
0.
06
9.9
0.6
5.9
0.4
0.3
0.0
1.0
0.1
0.0
0.0
15.5
0.
9 9.
9 0.
6
GC
065
0 R
ye (
incl
flo
ur)
0.06
0.
4 0.
0 0.
0 0.
0 0.
2 0.
0 0.
1 0.
0 0.
1 0.
0 0.
9 0.
1 0.
8 0.
0
VD
054
1 So
ya b
ean
(dry
, inc
l oil)
0.
03
25.9
0.
8 59
.4
1.8
11.2
0.
3 11
.0
0.3
109.
3 3.
3 51
.5
1.5
123.
2 3.
7
VR
059
6 Su
gar
beet
0.
06
0.0
0.0
0.1
0.0
0.0
0.0
0.0
0.0
0.2
0.0
0.0
0.0
14.3
0.
9
GS
0659
Su
gar
cane
0
26.2
0.
0 1.
5 0.
0 33
.8
0.0
5.5
0.0
18.6
0.
0 3.
0 0.
0 20
.2
0.0
VO
044
7 Sw
eet c
orn
(cor
n-on
-the
-cob
) 0.
05
0.2
0.0
2.4
0.1
2.2
0.1
3.3
0.2
1.7
0.1
2.8
0.1
11.2
0.
6
GC
065
3 T
riti
cale
(in
cl f
lour
) 0.
06
1.3
0.1
0.0
0.0
0.0
0.0
0.0
0.0
0.0
0.0
0.0
0.0
0.0
0.0
GC
065
4 W
heat
(in
cl b
ulgu
r w
hole
mea
l, in
cl f
lour
) 0.
06
172.
9 10
.4
79.0
4.
7 68
.1
4.1
41.9
2.
5 11
4.1
6.8
103.
4 6.
2 23
4.2
14.1
T
otal
inta
ke (
µg/
pers
on)=
23
.3
47
.8
25
.0
12
.1
36
.6
26
.1
52
.9
B
odyw
eigh
t per
reg
ion
(kg
bw)
=
55
60
60
60
60
55
60
A
DI (
µg/
pers
on)=
38
50
42
00
42
00
42
00
42
00
38
50
42
00
%
AD
I=
0.6%
1.1%
0.6%
0.3%
0.9%
0.7%
1.3%
R
ound
ed %
AD
I=
1%
1%
1%
0%
1%
1%
1%

An
nex
7
523
PR
OP
ICO
NA
ZO
LE
(1
60
) In
tern
atio
nal e
stim
ate
of s
hort
term
inta
ke (
IEST
I) f
or
Acu
te R
fD=
0.3
00 m
g/kg
bw
(30
0 µ
g/kg
bw
)
GE
NE
RA
L P
OP
UL
AT
ION
M
axim
um %
AR
fD:
1%
Lar
ge p
orti
on d
iet
U
nit w
eigh
t
Cod
ex
Cod
e C
omm
odit
y
STM
R o
r ST
MR
-P
mg/
kg
HR
or
HR
-P
mg/
kg
Cou
ntry
B
ody
wei
ght
(kg)
Lar
ge
port
ion,
g/
pers
on
Uni
t w
eigh
t, g
Cou
ntry
U
nit
wei
ght,
edib
le
port
ion,
g
Var
ia-
bilit
y fa
ctor
Cas
e IE
STI
µg/
kg
bw/d
ay
% a
cute
R
fD
roun
ded
TN
067
2 Pe
can
- 0.
02
AU
S 67
.0
23
- -
ND
N
D
1 0.
01
0%
FI 0
327
Ban
ana
- 0.
087
SAF
55.7
61
3 90
0 FR
A
612
3 2a
2.
87
1%
GC
064
0 B
arle
y 0.
0675
-
NL
D
63.0
37
8 -
- N
D
ND
3
0.41
0%
SB 0
716
Cof
fee
bean
s 0.
06
- N
LD
63
.0
66
- -
ND
N
D
3 0.
06
0%
FB 0
265
Cra
nber
ries
-
0.39
U
SA
65.0
22
9 -
- N
D
ND
N
D
ND
-
MO
010
5 E
dibl
e of
fal (
mam
mal
ian)
-
0.8
FRA
62
.3
277
- -
ND
N
D
1 3.
55
1%
PE 0
112
Egg
s -
0.05
T
hai
53.5
19
5 -
- N
D
ND
1
0.18
0%
GC
064
5 M
aize
0.
05
- FR
A
62.3
26
0 -
- N
D
ND
3
0.21
0%
MM
009
5 M
eat f
rom
mam
mal
s ot
her
than
mar
ine
mam
mal
s: 2
0% a
s fa
t -
0.05
A
US
67.0
10
4 -
- N
D
ND
1
0.08
0%
MM
009
5 M
eat f
rom
mam
mal
s ot
her
than
mar
ine
mam
mal
s: 8
0% a
s m
uscl
e -
0.05
A
US
67.0
41
7 -
- N
D
ND
1
0.31
0%
ML
010
6 M
ilks
0.01
-
USA
65
.0
2466
-
- N
D
ND
3
0.38
0%
FI 0
353
Pine
appl
e -
0.02
JP
N
52.6
37
1 70
0 FR
A
420
3 2b
0.
42
0%
GC
065
6 Po
pcor
n 0.
05
- JP
N
52.6
17
5 -
- N
D
ND
N
D
ND
-
PM 0
110
Poul
try
mea
t: 10
% a
s fa
t -
0.05
A
US
67.0
43
-
- N
D
ND
1
0.03
0%
PM 0
110
Poul
try
mea
t: 90
% a
s m
uscl
e -
0.05
A
US
67.0
38
8 -
- N
D
ND
1
0.29
0%
SO 0
495
Rap
e se
ed
0.06
-
- -
ND
-
- N
D
ND
3
ND
-
GC
065
0 R
ye
0.06
-
NL
D
63.0
77
-
- N
D
ND
3
0.07
0%
VD
054
1 So
ya b
ean
(dry
) 0.
03
- JP
N
52.6
15
9 -
- N
D
ND
3
0.09
0%
VR
059
6 Su
gar
beet
0.
06
- -
- N
D
- -
ND
N
D
ND
N
D
-
GS
0659
Su
gar
cane
0
- T
hai
53.5
36
6 -
- N
D
ND
N
D
ND
-
VO
044
7 Sw
eet c
orn
(cor
n-on
-the
-cob
) -
0.05
T
hai
53.5
38
3 20
0 JP
N
200
3 2a
0.
73
0%
GC
065
3 T
riti
cale
0.
06
- -
- N
D
- -
ND
N
D
3 N
D
-
GC
065
4 W
heat
0.
06
- U
SA
65.0
38
3 -
- N
D
ND
3
0.35
0%
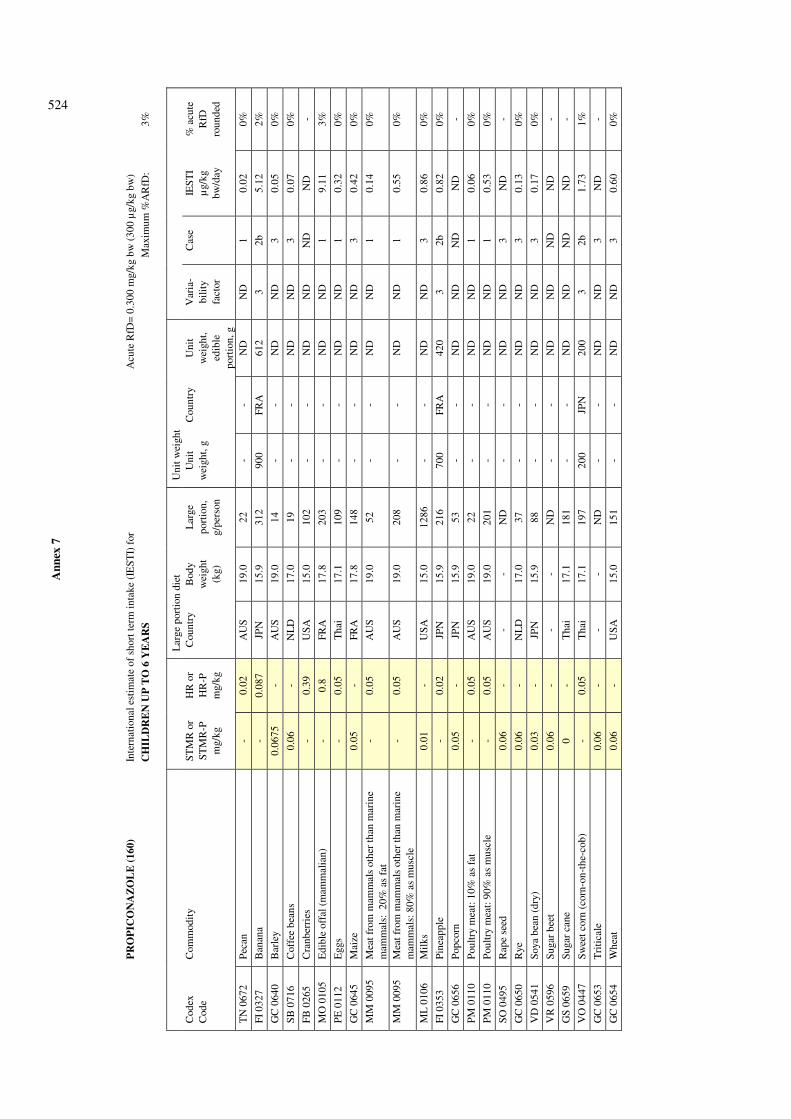
An
nex
7
524
PR
OP
ICO
NA
ZO
LE
(1
60
) In
tern
atio
nal e
stim
ate
of s
hort
term
inta
ke (
IEST
I) f
or
Acu
te R
fD=
0.3
00 m
g/kg
bw
(30
0 µ
g/kg
bw
)
CH
ILD
RE
N U
P T
O 6
YE
AR
S
M
axim
um %
AR
fD:
3%
Lar
ge p
orti
on d
iet
U
nit w
eigh
t
Cod
ex
Cod
e C
omm
odit
y ST
MR
or
STM
R-P
m
g/kg
HR
or
HR
-P
mg/
kg
Cou
ntry
B
ody
wei
ght
(kg)
Lar
ge
port
ion,
g/
pers
on
Uni
t w
eigh
t, g
Cou
ntry
U
nit
wei
ght,
edib
le
port
ion,
g
Var
ia-
bilit
y fa
ctor
Cas
e IE
STI
µg/
kg
bw/d
ay
% a
cute
R
fD
roun
ded
TN
067
2 Pe
can
- 0.
02
AU
S 19
.0
22
- -
ND
N
D
1 0.
02
0%
FI 0
327
Ban
ana
- 0.
087
JPN
15
.9
312
900
FRA
61
2 3
2b
5.12
2%
GC
064
0 B
arle
y 0.
0675
-
AU
S 19
.0
14
- -
ND
N
D
3 0.
05
0%
SB 0
716
Cof
fee
bean
s 0.
06
- N
LD
17
.0
19
- -
ND
N
D
3 0.
07
0%
FB 0
265
Cra
nber
ries
-
0.39
U
SA
15.0
10
2 -
- N
D
ND
N
D
ND
-
MO
010
5 E
dibl
e of
fal (
mam
mal
ian)
-
0.8
FRA
17
.8
203
- -
ND
N
D
1 9.
11
3%
PE 0
112
Egg
s -
0.05
T
hai
17.1
10
9 -
- N
D
ND
1
0.32
0%
GC
064
5 M
aize
0.
05
- FR
A
17.8
14
8 -
- N
D
ND
3
0.42
0%
MM
009
5 M
eat f
rom
mam
mal
s ot
her
than
mar
ine
mam
mal
s: 2
0% a
s fa
t -
0.05
A
US
19.0
52
-
- N
D
ND
1
0.14
0%
MM
009
5 M
eat f
rom
mam
mal
s ot
her
than
mar
ine
mam
mal
s: 8
0% a
s m
uscl
e -
0.05
A
US
19.0
20
8 -
- N
D
ND
1
0.55
0%
ML
010
6 M
ilks
0.01
-
USA
15
.0
1286
-
- N
D
ND
3
0.86
0%
FI 0
353
Pine
appl
e -
0.02
JP
N
15.9
21
6 70
0 FR
A
420
3 2b
0.
82
0%
GC
065
6 Po
pcor
n 0.
05
- JP
N
15.9
53
-
- N
D
ND
N
D
ND
-
PM 0
110
Poul
try
mea
t: 10
% a
s fa
t -
0.05
A
US
19.0
22
-
- N
D
ND
1
0.06
0%
PM 0
110
Poul
try
mea
t: 90
% a
s m
uscl
e -
0.05
A
US
19.0
20
1 -
- N
D
ND
1
0.53
0%
SO 0
495
Rap
e se
ed
0.06
-
- -
ND
-
- N
D
ND
3
ND
-
GC
065
0 R
ye
0.06
-
NL
D
17.0
37
-
- N
D
ND
3
0.13
0%
VD
054
1 So
ya b
ean
(dry
) 0.
03
- JP
N
15.9
88
-
- N
D
ND
3
0.17
0%
VR
059
6 Su
gar
beet
0.
06
- -
- N
D
- -
ND
N
D
ND
N
D
-
GS
0659
Su
gar
cane
0
- T
hai
17.1
18
1 -
- N
D
ND
N
D
ND
-
VO
044
7 Sw
eet c
orn
(cor
n-on
-the
-cob
) -
0.05
T
hai
17.1
19
7 20
0 JP
N
200
3 2b
1.
73
1%
GC
065
3 T
riti
cale
0.
06
- -
- N
D
- -
ND
N
D
3 N
D
-
GC
065
4 W
heat
0.
06
- U
SA
15.0
15
1 -
- N
D
ND
3
0.60
0%

1 Horticulture: a select bibliography, 1976 (E)2 Cotton specialists and research institutions in
selected countries, 1976 (E)3 Food legumes: distribution, adaptability and biology
of yield, 1977 (E F S)4 Soybean production in the tropics, 1977 (C E F S)4 Rev.1 Soybean production in the tropics (first revision),
1982 (E)5 Les systèmes pastoraux sahéliens, 1977 (F)6 Pest resistance to pesticides and crop loss assessment
– Vol. 1, 1977 (E F S)6/2 Pest resistance to pesticides and crop loss assessment
– Vol. 2, 1979 (E F S)6/3 Pest resistance to pesticides and crop loss assessment
– Vol. 3, 1981 (E F S)7 Rodent pest biology and control – Bibliography
1970-74, 1977 (E)8 Tropical pasture seed production, 1979 (E F** S**)9 Food legume crops: improvement and production,
1977 (E)10 Pesticide residues in food, 1977 – Report, 1978 (E F S)10 Rev. Pesticide residues in food 1977 – Report, 1978 (E)10 Sup. Pesticide residues in food 1977 – Evaluations,
1978 (E)11 Pesticide residues in food 1965-78 – Index and
summary, 1978 (E F S)12 Crop calendars, 1978 (E/F/S)13 The use of FAO specifications for plant protection
products, 1979 (E F S)14 Guidelines for integrated control of rice insect pests,
1979 (Ar C E F S)15 Pesticide residues in food 1978 – Report, 1979 (E F S)15 Sup. Pesticide residues in food 1978 – Evaluations,
1979 (E)16 Rodenticides: analyses, specifications, formulations,
1979 (E F S)17 Agrometeorological crop monitoring and
forecasting, 1979 (C E F S)18 Guidelines for integrated control of maize pests,
1979 (C E)19 Elements of integrated control of sorghum pests,
1979 (E F S)20 Pesticide residues in food 1979 – Report, 1980 (E F S)20 Sup. Pesticide residues in food 1979 – Evaluations,
1980 (E)21 Recommended methods for measurement of pest
resistance to pesticides, 1980 (E F)22 China: multiple cropping and related crop
production technology, 1980 (E)23 China: development of olive production, 1980 (E)24/1 Improvement and production of maize, sorghum
and millet – Vol. 1. General principles, 1980 (E F)24/2 Improvement and production of maize, sorghum
and millet – Vol. 2. Breeding, agronomy and seed production, 1980 (E F)
25 Prosopis tamarugo: fodder tree for arid zones, 1981 (E F S)
FAO TECHNICAL PAPERS
FAO PLANT PRODUCTION AND PROTECTION PAPERS
26 Pesticide residues in food 1980 – Report, 1981 (E F S)26 Sup. Pesticide residues in food 1980 – Evaluations,
1981 (E)27 Small-scale cash crop farming in South Asia, 1981 (E)28 Second expert consultation on environmental
criteria for registration of pesticides, 1981 (E F S)29 Sesame: status and improvement, 1981 (E)30 Palm tissue culture, 1981 (C E)31 An eco-climatic classification of intertropical Africa,
1981 (E)32 Weeds in tropical crops: selected abstracts, 1981 (E)32 Sup.1 Weeds in tropical crops: review of abstracts, 1982 (E)33 Plant collecting and herbarium development,
1981 (E)34 Improvement of nutritional quality of food crops,
1981 (C E)35 Date production and protection, 1982 (Ar E)36 El cultivo y la utilización del tarwi – Lupinus
mutabilis Sweet, 1982 (S)37 Pesticide residues in food 1981 – Report, 1982 (E F S)38 Winged bean production in the tropics, 1982 (E)39 Seeds, 1982 (E/F/S) 40 Rodent control in agriculture, 1982 (Ar C E F S)41 Rice development and rainfed rice production,
1982 (E)42 Pesticide residues in food 1981 – Evaluations,
1982 (E)43 Manual on mushroom cultivation, 1983 (E F)44 Improving weed management, 1984 (E F S)45 Pocket computers in agrometeorology, 1983 (E)46 Pesticide residues in food 1982 – Report, 1983 (E F S)47 The sago palm, 1983 (E F)48 Guidelines for integrated control of cotton pests,
1983 (Ar E F S)49 Pesticide residues in food 1982 – Evaluations,
1983 (E)50 International plant quarantine treatment manual,
1983 (C E)51 Handbook on jute, 1983 (E)52 The palmyrah palm: potential and perspectives,
1983 (E)53/1 Selected medicinal plants, 1983 (E)54 Manual of fumigation for insect control,
1984 (C E F S)55 Breeding for durable disease and pest resistance,
1984 (C E)56 Pesticide residues in food 1983 – Report, 1984 (E F S)57 Coconut, tree of life, 1984 (E S)58 Economic guidelines for crop pest control,
1984 (E F S)59 Micropropagation of selected rootcrops, palms,
citrus and ornamental species, 1984 (E)60 Minimum requirements for receiving and
maintaining tissue culture propagating material, 1985 (E F S)
61 Pesticide residues in food 1983 – Evaluations, 1985 (E)

62 Pesticide residues in food 1984 – Report, 1985 (E F S)63 Manual of pest control for food security reserve
grain stocks, 1985 (C E)64 Contribution à l’écologie des aphides africains,
1985 (F)65 Amélioration de la culture irriguée du riz des petits
fermiers, 1985 (F)66 Sesame and safflower: status and potentials, 1985 (E)67 Pesticide residues in food 1984 – Evaluations,
1985 (E)68 Pesticide residus in food 1985 – Report, 1986 (E F S)69 Breeding for horizontal resistance to wheat diseases,
1986 (E)70 Breeding for durable resistance in perennial crops,
1986 (E)71 Technical guideline on seed potato
micropropagation and multiplication, 1986 (E)72/1 Pesticide residues in food 1985 – Evaluations – Part I:
Residues, 1986 (E)72/2 Pesticide residues in food 1985 – Evaluations – Part II:
Toxicology, 1986 (E)73 Early agrometeorological crop yield assessment,
1986 (E F S)74 Ecology and control of perennial weeds in Latin
America, 1986 (E S)75 Technical guidelines for field variety trials,
1993 (E F S)76 Guidelines for seed exchange and plant introduction
in tropical crops, 1986 (E)77 Pesticide residues in food 1986 – Report, 1986 (E F S)78 Pesticide residues in food 1986 – Evaluations – Part I:
Residues, 1986 (E)78/2 Pesticide residues in food 1986 – Evaluations – Part II:
Toxicology, 1987 (E)79 Tissue culture of selected tropical fruit plants,
1987 (E)80 Improved weed management in the Near East,
1987 (E)81 Weed science and weed control in Southeast Asia,
1987 (E)82 Hybrid seed production of selected cereal, oil and
vegetable crops, 1987 (E)83 Litchi cultivation, 1989 (E S)84 Pesticide residues in food 1987 – Report, 1987 (E F S)85 Manual on the development and use of FAO
specifications for plant protection products, 1987 (E** F S)
86/1 Pesticide residues in food 1987 – Evaluations – Part I: Residues, 1988 (E)
86/2 Pesticide residues in food 1987 – Evaluations – Part II: Toxicology, 1988 (E)
87 Root and tuber crops, plantains and bananas in developing countries – challenges and opportunities, 1988 (E)
88 Jessenia and Oenocarpus: neotropical oil palms worthy of domestication, 1988 (E S)
89 Vegetable production under arid and semi-arid conditions in tropical Africa, 1988 (E F)
90 Protected cultivation in the Mediterranean climate, 1990 (E F S)
91 Pastures and cattle under coconuts, 1988 (E S)92 Pesticide residues in food 1988 – Report,
1988 (E F S)
93/1 Pesticide residues in food 1988 – Evaluations – Part I: Residues, 1988 (E)
93/2 Pesticide residues in food 1988 – Evaluations – Part II: Toxicology, 1989 (E)
94 Utilization of genetic resources: suitable approaches, agronomical evaluation and use, 1989 (E)
95 Rodent pests and their control in the Near East, 1989 (E)
96 Striga – Improved management in Africa, 1989 (E)97/1 Fodders for the Near East: alfalfa, 1989 (Ar E)97/2 Fodders for the Near East: annual medic pastures,
1989 (Ar E F)98 An annotated bibliography on rodent research in
Latin America 1960-1985, 1989 (E)99 Pesticide residues in food 1989 – Report, 1989 (E F S)100 Pesticide residues in food 1989 – Evaluations – Part I:
Residues, 1990 (E)100/2 Pesticide residues in food 1989 – Evaluations – Part II:
Toxicology, 1990 (E)101 Soilless culture for horticultural crop production,
1990 (E)102 Pesticide residues in food 1990 – Report, 1990 (E F S)103/1 Pesticide residues in food 1990 – Evaluations – Part I:
Residues, 1990 (E)104 Major weeds of the Near East, 1991 (E)105 Fundamentos teórico-prácticos del cultivo de tejidos
vegetales, 1990 (S)106 Technical guidelines for mushroom growing in the
tropics, 1990 (E)107 Gynandropsis gynandra (L.) Briq. – a tropical leafy
vegetable – its cultivation and utilization, 1991 (E)108 Carambola cultivation, 1993 (E S)109 Soil solarization, 1991 (E)110 Potato production and consumption in developing
countries, 1991 (E)111 Pesticide residues in food 1991 – Report, 1991 (E)112 Cocoa pest and disease management in Southeast
Asia and Australasia, 1992 (E)113/1 Pesticide residues in food 1991 – Evaluations – Part I:
Residues, 1991 (E)114 Integrated pest management for protected
vegetable cultivation in the Near East, 1992 (E)115 Olive pests and their control in the Near East,
1992 (E)116 Pesticide residues in food 1992 – Report, 1993 (E F S)117 Quality declared seed, 1993 (E F S)118 Pesticide residues in food 1992 – Evaluations – Part I: Residues, 1993 (E)119 Quarantine for seed, 1993 (E)120 Weed management for developing countries,
1993 (E S)120/1 Weed management for developing countries,
Addendum 1, 2004 (E F S)121 Rambutan cultivation, 1993 (E)122 Pesticide residues in food 1993 – Report,
1993 (E F S)123 Rodent pest management in eastern Africa, 1994 (E)124 Pesticide residues in food 1993 – Evaluations – Part I:
Residues, 1994 (E)125 Plant quarantine: theory and practice, 1994 (Ar)126 Tropical root and tuber crops – Production,
perspectives and future prospects, 1994 (E)127 Pesticide residues in food 1994 – Report, 1994 (E)

128 Manual on the development and use of FAO specifications for plant protection products – Fourth edition, 1995 (E F S)
129 Mangosteen cultivation, 1995 (E)130 Post-harvest deterioration of cassava – A biotechnology perspective, 1995 (E)131/1 Pesticide residues in food 1994 – Evaluations – Part I:
Residues, Volume 1, 1995 (E)131/2 Pesticide residues in food 1994 – Evaluations – Part I:
Residues, Volume 2, 1995 (E)132 Agro-ecology, cultivation and uses of cactus pear,
1995 (E)133 Pesticide residues in food 1995 – Report, 1996 (E)134 (Number not assigned)135 Citrus pest problems and their control in the Near
East, 1996 (E)136 El pepino dulce y su cultivo, 1996 (S)137 Pesticide residues in food 1995 – Evaluations – Part I:
Residues, 1996 (E)138 Sunn pests and their control in the Near East,
1996 (E)139 Weed management in rice, 1996 (E)140 Pesticide residues in food 1996 – Report, 1997 (E)141 Cotton pests and their control in the Near East,
1997 (E)142 Pesticide residues in food 1996 – Evaluations – Part I
Residues, 1997 (E)143 Management of the whitefly-virus complex, 1997 (E)144 Plant nematode problems and their control in the
Near East region, 1997 (E)145 Pesticide residues in food 1997 – Report, 1998 (E)146 Pesticide residues in food 1997 – Evaluations – Part I:
Residues, 1998 (E)147 Soil solarization and integrated management of
soilborne pests, 1998 (E)148 Pesticide residues in food 1998 – Report, 1999 (E)149 Manual on the development and use of FAO
specifications for plant protection products – Fifth edition, including the new procedure, 1999 (E)
150 Restoring farmers’ seed systems in disaster situations, 1999 (E)
151 Seed policy and programmes for sub-Saharan Africa, 1999 (E F)
152/1 Pesticide residues in food 1998 – Evaluations – Part I: Residues, Volume 1, 1999 (E)152/2 Pesticide residues in food 1998 – Evaluations –
Part I: Residues, Volume 2, 1999 (E)153 Pesticide residues in food 1999 – Report, 1999 (E)154 Greenhouses and shelter structures for tropical
regions, 1999 (E)155 Vegetable seedling production manual, 1999 (E)156 Date palm cultivation, 1999 (E)156 Rev.1 Date palm cultivation, 2002 (E)157 Pesticide residues in food 1999 – Evaluations –
Part I: Residues, 2000 (E)158 Ornamental plant propagation in the tropics,
2000 (E)159 Seed policy and programmes in the Near East and
North Africa, 2000160 Seed policy and programmes for Asia and the Pacific,
2000 (E)161 Silage making in the tropics with particular emphasis
on smallholders, 2000 (E S)
162 Grassland resource assessment for pastoral systems, 2001, (E)
163 Pesticide residues in food 2000 – Report, 2001 (E)164 Seed policy and programmes in Latin America and
the Caribbean, 2001 (E S)165 Pesticide residues in food 2000 – Evaluations –
Part I, 2001 (E)166 Global report on validated alternatives to the use of
methyl bromide for soil fumigation, 2001 (E)167 Pesticide residues in food 2001 – Report, 2001 (E)168 Seed policy and programmes for the Central and
Eastern European countries, Commonwealth of Independent States and other countries in transition, 2001 (E)
169 Cactus (Opuntia spp.) as forage, 2003 (E S)170 Submission and evaluation of pesticide residues data
for the estimation of maximum residue levels in food and feed, 2002 (E)
171 Pesticide residues in food 2001 – Evaluations – Part I, 2002 (E)
172 Pesticide residues in food, 2002 – Report, 2002 (E)173 Manual on development and use of FAO and WHO
specifications for pesticides, 2002 (E S)174 Genotype x environment interaction – Challenges
and opportunities for plant breeding and cultivar recommendations, 2002 (E)
175/1 Pesticide residues in food 2002 – Evaluations – Part 1: Residues – Volume 1 (E)175/2 Pesticide residues in food 2002 – Evaluations – Part 1: Residues – Volume 2 (E)176 Pesticide residues in food 2003 – Report, 2004 (E)177 Pesticide residues in food 2003 – Evaluations – Part 1: Residues, 2004 (E)178 Pesticide residues in food 2004 – Report, 2004 (E)179 Triticale improvement and production, 2004 (E)180 Seed multiplication by resource-limited farmers
- Proceedings of the Latin American workshop, 2004 (E)
181 Towards effective and sustainable seed-relief activities, 2004 (E)
182/1 Pesticide residues in food 2004 – Evaluations – Part 1: Residues, Volume 1 (E)182/2 Pesticide residues in food 2004 – Evaluations – Part 1: Residues, Volume 2 (E)183 Pesticide residues in food 2005 – Report, 2005 (E)184/1 Pesticide residues in food 2005 – Evaluations – Part 1: Residues, Volume 1 (E)184/2 Pesticide residues in food 2005 – Evaluations – Part 1: Residues, Volume 2 (E)185 Quality declared seed system, 2006 (E F S)186 Calendario de cultivos – América Latina y el Caribe,
2006 (S)187 Pesticide residues in food 2006 – Report, 2006 (E)188 Weedy rices – origin, biology, ecology and control,
2006 (E S)\189/1 Pesticide residues in food 2006 – Evaluations – Part 1: Residues, Volume 1 (E)189/2 Pesticide residues in food 2006 – Evaluations – Part 1: Residues, Volume 2 (E)190 Guidance for packing, shipping, holding and release of sterile flies in area-wide fruit fly control programmes, 2007 (E)

191 Pesticide residues in food 2007 – Report, 2007 (E)192 Pesticide residues in food 2007 – Evaluations – Part 1: Residues, 2008 (E)193 Pesticide residues in food 2008 – Report, 2008 (E)
Availability: January 2009
Ar – Arabic Multil – MultilingualC – Chinese * Out of printE – English ** In preparationF – FrenchP – PortugueseS – Spanish
The FAO Technical Papers are available through the authorized FAO Sales Agents or directly from Sales and Marketing Group, FAO, Viale delle Terme di Caracalla, 00153 Rome, Italy.