jmscr vol||05||issue||02||page 18162-18176||february 2017jmscr.igmpublication.org/v5-i2/151...
TRANSCRIPT
Dr Sumod Mathew Koshy MD, FRCR et al JMSCR Volume 05 Issue 02 February 2017 Page 18162
JMSCR Vol||05||Issue||02||Page 18162-18176||February 2017
Research Article
Role of Multiparametric MRI Prostate as A Screening Tool for Cancer
Detection
Authors
Dr Sumod Mathew Koshy MD, FRCR, Dr Anil Prahladan DNB, EDiR,
Dr Kalirajan Kalidos MD, Dr Krishnankutty Nair Ramachandran MD Division of Imageology, Regional Cancer Centre, Medical College Campus, Trivandrum, Kerala, India
PIN 695011
Corresponding Author
Dr Sumod Mathew Koshy MD, FRCR
Division of Imageology, Regional Cancer Centre, Medical College Campus, Trivandrum, Kerala, India
PIN 695011 +91 471 252 2604, +91 9446810833
Email: [email protected]
Abstract
Diagnostic screening for prostate cancer includes digital rectal examination and serum PSA. However several
studies have shown that screening using serum PSA and digital rectal examination, did not significantly
decrease prostate cancer-specific mortality. The advent of MR in prostate imaging has changes this and the
ESUR published prostate MR guidelines in 2012 and also the PIRADS reporting system. Our study aims to
assess the ability of mp-MRI to serve as a screening tool for detection of prostate cancer, to evaluate the
ESUR PIRADS scoring system for prostate cancer detection using multiparametric MRI, to find a threshold
PI-RADS sum (PIRADS-S) score for detection of prostate cancer and to evaluate the usefulness of mp-MRI in
patients with serum PSA of ≤10 ng/mL in diagnosing prostate cancer. From the 54 subjects included, a total of
274 sectors were taken for analysis. All patients underwent mpMRI which included T2,DWI and dynamic
contrast enhanced imaging. Using ESUR guidelines individual PI-RADS scores (T2WI, DWI and DCEI) were
assigned for all sectors of prostate, following which PI-RADS sum (PIRADS-S = T2WI+DWI+DCEI) score
was calculated for each sector. TRUS guided modified sextant biopsy of prostate was done for all patients
and correlated with imaging. Statistical analysis was done using independent samples t test and ROC analysis.
Sensitivity, specificity, predictive values and likelihood ratios were calculated at various cut-off levels.
Optimal cut-off point was calculated by using Youden’s statistics. From this study, ESUR PIRADS scoring
system showed good diagnostic performance for detection of prostate cancer by using mpMRI and DWI
showed the best diagnostic performance. The ROC analysis of PIRADS-S score revealed area AUC of 0.933
with p value of < 0.001. The reported AUC of PIRADS-S score in detecting carcinoma prostate was 0.768 to
0.93. The diagnostic performance of mpMRI was analysed in a group of subjects with serum PSA of ≤ 10
ng/mL. mpMRI showed high negative predictive value which indicates the ability of the test to predict the
absence of disease with high confidence, thereby helping to avoid a prostate biopsy.
www.jmscr.igmpublication.org
Impact Factor 5.84
Index Copernicus Value: 83.27
ISSN (e)-2347-176x ISSN (p) 2455-0450
DOI: https://dx.doi.org/10.18535/jmscr/v5i2.151

Dr Sumod Mathew Koshy MD, FRCR et al JMSCR Volume 05 Issue 02 February 2017 Page 18163
JMSCR Vol||05||Issue||02||Page 18162-18176||February 2017
Introduction
Prostate cancer is the second most frequently
diagnosed cancer of men and fourth most common
cancer overall. In 2012, 1.1 million men were
diagnosed with prostate cancer worldwide,
accounting for 15% of cancers diagnosed in men.
Incidence rates vary more than 25-fold worldwide,
the highest rates being in Australia/New Zealand
and North America, the lowest in Eastern Asia
and South-Central Asia, and intermediate in
Central and Eastern Europe. Almost 70% of new
cases are being detected in developed countries,
because of the widespread practice of serum
prostate specific antigen (S.PSA) testing and
subsequent biopsy. Incidence rates are low in
South-Central Asian population with estimated
incidence rates of 4.5. In India 19,000 men were
diagnosed with prostate cancer in 2012 with a 5
year prevalence of 64,000. (1)
The main aim of
screening methods is to reduce disease specific
and overall mortality and morbidity. Screening for
prostate cancer is to be performed in the absence
of any symptoms or indications of disease, which
include digital rectal examination (DRE) and
serum prostate-specific antigen (PSA) assay.
Digital rectal examination (DRE) as a screening
tool has limited utility due to poor reliability, low
sensitivity and a predominant assessment of the
peripheral zone. This is especially so for small
tumours that have not reached the prostatic
capsule. (2)
The reported sensitivity and specificity
of DRE in prostate cancer detection is 37% and
91% with even lower sensitivity with normal
serum PSA levels (0 – 4ng/mL). (3)
Serum PSA
estimation: PSA is an enzyme secreted by the
epithelial cells of prostate, which is the main
source of serum PSA. The normal range of serum
PSA is taken as 0–4 ng/mL. Serum PSA levels are
elevated in patients with a range of prostatic
diseases including carcinoma prostate, benign
hypertrophy, prostatitis and prostatic infarction.(4)
After introduction of this test in clinical practice
the incidence of prostate cancer increased
significantly with a concomitant lowering of stage
at diagnosis. However the specificity is low
especially between the levels of 4 – 10 ng/mL.
Hence 60–75% of men with PSA levels greater
than 4 ng/mL undergo unnecessary biopsy.(5)
Similarly using this cut-off value (4 ng/mL) for
men of all ages, results in exclusion of a high
number of patients with clinically significant
early-stage disease, as, approximately 20% to
50% of clinically significant organ-confined
carcinoma prostate occurs in men with serum total
PSA of less than 4 ng/mL.(6)
Because of the low
specificity and relatively low sensitivity of serum
PSA estimation, various methods have been
proposed to increase the specificity of PSA,
including age-specific PSA reference ranges, PSA
density (PSAD) and percent free PSA (% f PSA).
Percent free PSA increases the specificity with
maintained high sensitivity compared to age
specific PSA ranges and PSA density.(7)
Combined meta-analysis of five RCTs showed
that prostate cancer screening using serum PSA
and digital rectal examination, did not significa-
ntly decrease prostate cancer-specific mortality.
So, men who have a life expectancy of less than
10 to 15 years are unlikely to benefit from
screening.(8)
The advent of MR in prostate
imaging has changes this. Until recently there was
no definite accepted guideline for prostate cancer
detection and staging on MRI. In 2011 Dickinson
L et al, presented recommendations on a
standardized method for the conduct, interpret-
ation, and reporting of prostate mp-MRI for
prostate cancer detection and localization.(9)
Following this the European Society of Urogenital
Radiology (ESUR) proposed the ESUR prostate
MR guidelines in 2012. This report provides the
guidelines for magnetic resonance imaging (MRI)
in prostate cancer (minimal and optimal imaging
acquisition protocols) and a structured reporting
system which was described as PIRADS (Prostate
Imaging Reporting And Data System) scoring
system.(10)
This study was designed with the
following objectives in mind.
Primary Objective: To assess the ability of mp-
MRI to serve as a screening tool for detection of
prostate cancer
Dr Sumod Mathew Koshy MD, FRCR et al JMSCR Volume 05 Issue 02 February 2017 Page 18164
JMSCR Vol||05||Issue||02||Page 18162-18176||February 2017
Secondary Objectives:
1. To evaluate the ESUR prostate imaging
reporting and data (PIRADS) scoring
system for prostate cancer detection using
multiparametric MRI (mpMRI).
2. To find a threshold PI-RADS sum
(PIRADS-S) score for detection of
prostate cancer.
3. To evaluate the usefulness of mp-MRI in
patients with serum PSA of ≤10 ng/mL in
diagnosing prostate cancer.
Materials and Methods
The study was designed as a prospective single
institutional study and was approved by
institutional review board. Patients with either
increased serum PSA or abnormal DRE, who
were referred for mpMRI and TRUS guided
prostate biopsy were included as study subjects.
Between January 2013 to September 2014, 54
consecutive patients were registered as study
subjects. Patients with previous history of other
pelvic malignancy, contraindication for MRI or
TRUS biopsy were excluded from the study. All
patients underwent mpMRI which includes T2
weighted imaging, diffusion weighted imaging
and dynamic contrast enhanced imaging at 1.5T.
Endorectal coil (ERC) was used for optimal signal
reception and bowel preparation was done with
cleansing enema. High resolution axial fast spin
echo T2 weighted images were taken initially
perpendicular to the plane of prostatic urethra,
followed by sagittal and coronal high resolution
T2 weighted images. Diffusion weighted images
at two b values (0 and 800) were obtained in the
same plane as axial T2W sequence and ADC
maps were generated using standard post
processing software. DCE MRI was obtained by a
3D T1 weighted GRE sequence in the same plane
as axial T2W sequence with a temporal resolution
of 15 sec for 5 mins, following an intravenous
bolus injection of 0.1mmol/kg body weight of
gadolinium based contrast. MRI interpretation
was done on GE Centricity PACS work station by
a single qualified radiologist. The prostate gland
was divided into 8 segments, 6 from peripheral
zone (basal, mid and apical third on both sides)
and 2 from central gland (right and left). On mid
sagittal high resolution T2W image the supero-
inferior dimension of the prostate was measured,
which was then divided into 3 equal portions on
both sides of the peripheral zone. Central gland
was divided into right and left on axial high
resolution T2W images. On high resolution T2W
images each sector was examined for focal lesion
or signal intensity changes, followed by DWI-
ADC and DCEI analysis. Using ESUR guidelines
(Table 1) (10) individual PI-RADS scores (T2WI,
DWI and DCEI) were assigned for all sectors of
prostate, following which PI-RADS sum
(PIRADS-S = T2WI+DWI+DCEI) score was
calculated for each sectors. Representative images
given in figures I-X.
TRUS guided modified sextant biopsy of prostate
was done for all patients by a separate radiologist
blinded from the results of the MR scan, within 1
week to 2 month period, using an ultrasound
scanner with a 6 MHz transrectal probe and
biopsy adapter. Similar to MRI interpretation, on
mid sagittal view, supero-inferior dimension of
prostate was measured, and was divided into 3
equal portions on both sides of peripheral zone.
Central zone was divided into two. Biopsy cores
(one each) were obtained from the sextants of the
peripheral zone. All cores were obtained using an
18-gauge biopsy gun. All cores were labelled
according to their sextant topographic location as
the base, mid gland and apex, from each side of
the gland. Histopathology of all sextants were
recorded with Gleason score. Each sector scored
by PIRADS system was then compared with
histopathology of the corresponding core.
Statistical analysis: Independent samples t test
was applied in mean of serum PSA between
adenocarcinoma positive and negative groups.
Diagnostic accuracy of individual (T2W, DWI
and DCEI) PIRADS score and PIRADS-S score
were assessed by using receiver operating
characteristic (ROC) analysis. The area under the
ROC curve (AUC) is a measure of how well a

Dr Sumod Mathew Koshy MD, FRCR et al JMSCR Volume 05 Issue 02 February 2017 Page 18165
JMSCR Vol||05||Issue||02||Page 18162-18176||February 2017
parameter can distinguish between two diagnostic
groups. Sensitivity, specificity, predictive values
and likelihood ratios were calculated at various
cut-off levels. Optimal cut-off point was
calculated by using Youden’s statistics. A two-
tailed p value of 0.001 or less was considered
statistically significant.
Results
Fifty four subjects were included in the study with
median age of 56 years and range of 52 to 86
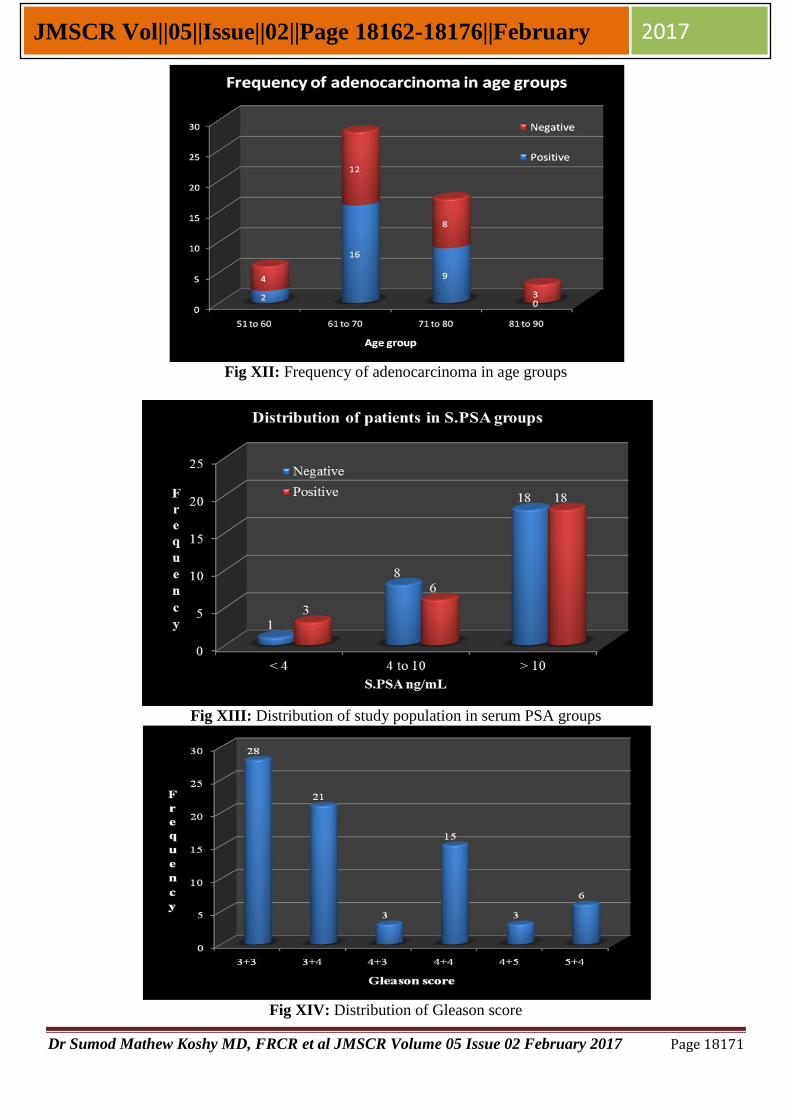
years (Table 2, Fig XI) . Twenty seven out of fifty
four subjects were positive for carcinoma prostate
(Fig XII). Serum PSA ranged from 1 to 120
ng/mL in carcinoma prostate positive group and 3
to 69 ng/mL in negative group (Fig XIII) . Mean
serum PSA of carcinoma prostate positive and
negative patients were 29.96 (±28.86) and 19.33
(±17.86) respectively with mean difference of
7.63 and p value of 0.248 (Table 3). A total of 274
sectors (76 positive and 198 negative for
malignancy) were taken for final analysis. In 76
malignant positive cores Gleason score of 3+3
was the most common (28 in 76), followed by 3+4
(21 in 76) (Fig XIV). ROC analysis was done for
each MRI sequence PIRADS score (T2WI, DWI
and DCEI) and PIRADS sum (PIRADS-S) score,
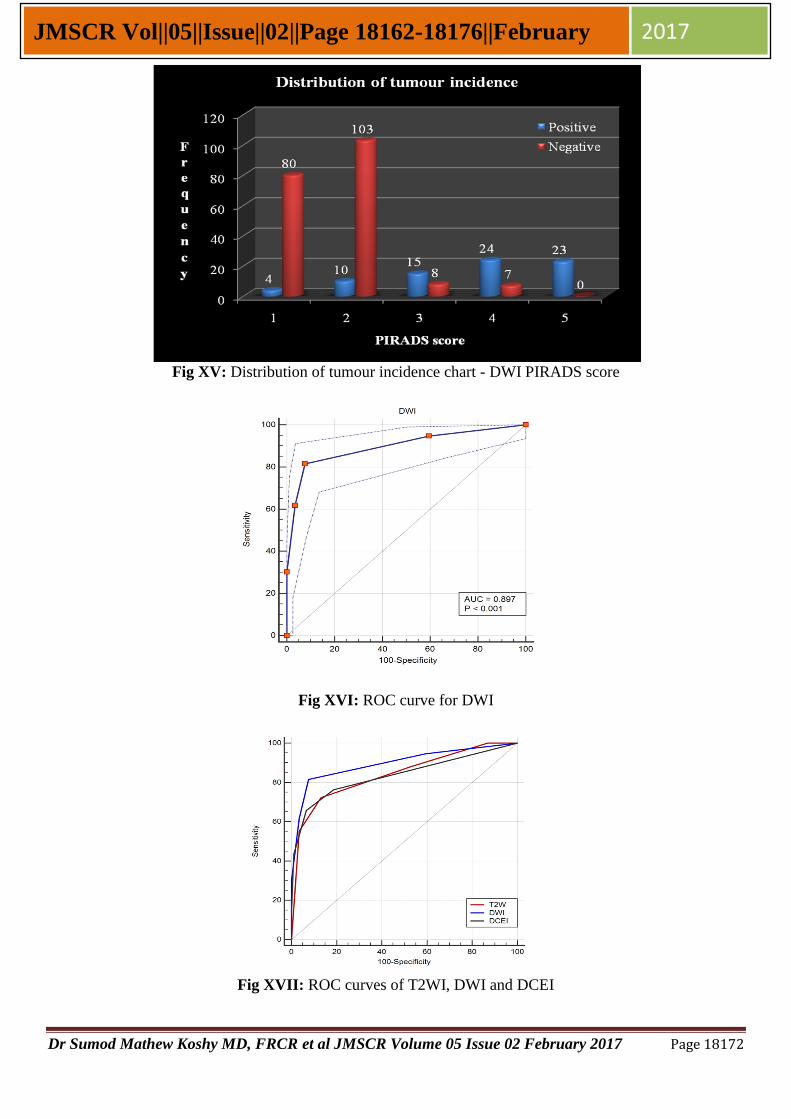
using the biopsy result as the gold standard. Area
under the ROC curve (AUC) of T2WI, DWI and
DCEI PIRADS score were 0.841 (0.792-0.882),
0.897 (0.855-0.931) and 0.836 (0.787-0.878)
respectively with p<0.001. The sensitivity and
specificity were 88.2%/47% for T2WI,
81.6%/92.4% for DWI and 65.8%/95.4% for
DCEI with cut-off score 3 (Table 4, 5 and 6). The
AUC of PIRADS-S score was 0.933 (0.896-
0.959) with p<0.001 (Table 7). Youden selected
threshold for PIRADS-S score was 9 with
sensitivity, specificity and Youden index of 79%,
95.5% and 0.744 (0.6395-0.8211) respectively.
Summary of diagnostic performance of T2WI,
DWI, DCEI and PIRADS-S score are given in
table 3, 4,5 & 6.
Eighteen out of fifty four subjects had serum PSA
of ≤10 ng/mL, with 9 subjects showed positive for
malignancy. Number of available sectors with
corresponding biopsy cores in that group were 86
(Positive - 20, Negative - 66). Gleason score 3+3
was the most common score encountered in this
group with 14 out of 20 positive cores (70%) (Fig
XXIX) . ROC curve analysis of PIRADS-S score
showed area under the curve (AUC) of 0.93 with
p value of < 0.001. Youden selected threshold for
PIRADS-S score for detection of prostate cancer
in patients with S.PSA ≤10 ng/mL was 8 with the
sensitivity, specificity, positive and negative
predictive values of 85%, 87.88%, 68% and
95.1% respectively (Table 8).
Table 1: ESUR PIRADS criteria for T2WI, DWI and DCEI. (10)
PIRADS scoring system
Score Criteria
T2WI for
peripheral
zone
1 Uniform high signal intensity (SI)
2 Linear, wedge shaped, or geographic areas of lower SI, usually not well demarcated
3 Intermediate appearances not in categories 1/2 or 4/5
4 Discrete, homogeneous low signal focus/mass confined to the prostate
5 Discrete, homogeneous low signal intensity focus with extra-capsular
extension/invasive behaviour or mass effect on the capsule (bulging), or broad (>1.5
cm) contact with the surface
T2WI for
central
gland
1 Heterogeneous TZ adenoma with well-defined margins: “organized chaos”
2 Areas of more homogeneous low SI, however well marginated, originating from the
TZ/BPH
3 Intermediate appearances not in categories 1/2 or 4/5
4 Areas of more homogeneous low SI, ill defined: “erased charcoal sign”
5 Same as 4, but involving the anterior fibromuscular stroma or the anterior horn of the
PZ, usually lenticular or water-drop shaped
DWI 1
No reduction in ADC compared with normal glandular tissue. No increase in SI on any
high b-value image (≥b800)
2 Diffuse, hyper SI on ≥b800 image with low ADC; no focal features, however, linear,

Dr Sumod Mathew Koshy MD, FRCR et al JMSCR Volume 05 Issue 02 February 2017 Page 18166
JMSCR Vol||05||Issue||02||Page 18162-18176||February 2017
triangular or geographical features are allowed
3 Intermediate appearances not in categories 1/2 or 4/5
4 Focal area(s) of reduced ADC but iso-intense SI on high b-value images (≥b800)
5 Focal area/mass of hyper SI on the high b-value images (≥b800) with reduced ADC
DCEI
1 Type 1 enhancement curve
2 Type 2 enhancement curve
3 Type 3 enhancement curve
+1 For focal enhancing lesion with curve type 2–3
+1 For asymmetric lesion or lesion at an unusual place with curve
type 2–3
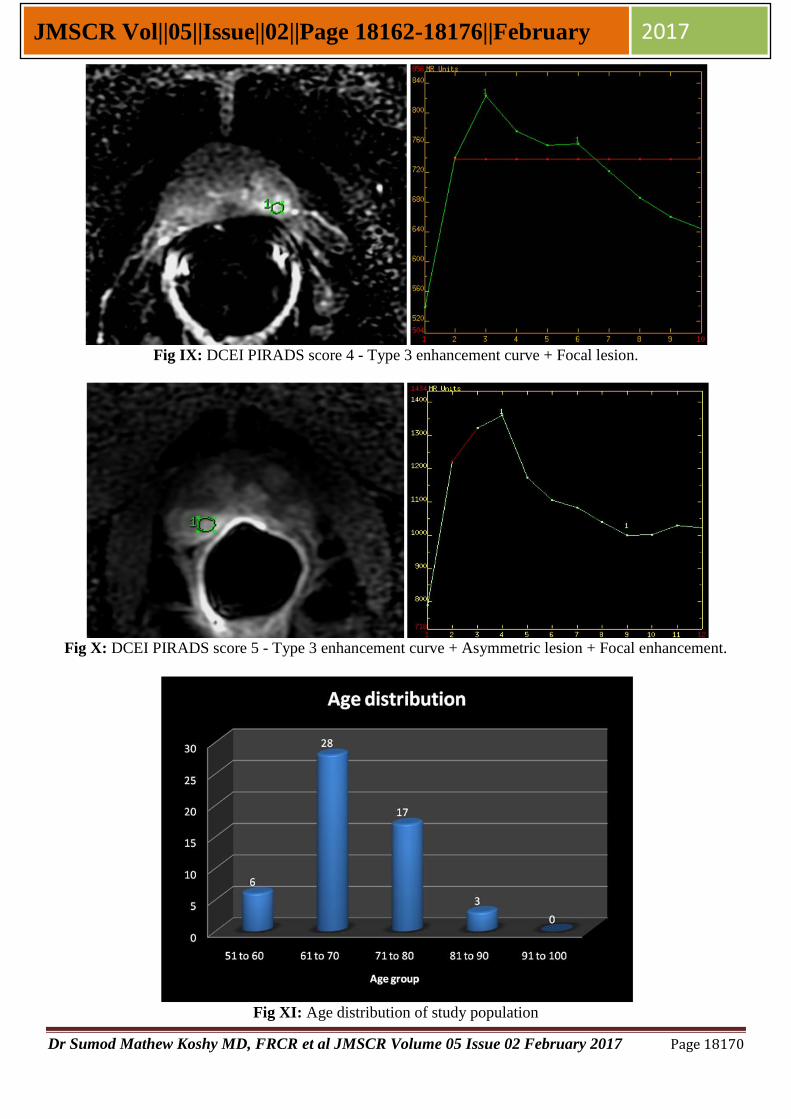
Table 2: Age distribution of study population Age group Positive Negative Total
51 to 60 2 (3.7%) 4 (7.4%) 6 (11.1%)
61 to 70 16 (29.6%) 12 (22.2%) 28 (51.8%)
71 to 80 9 (16.7%) 8 (14.8%) 17 (31.5%)
81 to 90 0 (0%) 3 (5.6%) 3 (5.6%)
Total 27 (50%) 27 (50%) 54 (100%)
Table 3: Distribution of serum PSA in study population Serum PSA ng/mL
Group Mean Standard deviation Median Range
Malignant (Positive) 29.96 28.86 19 1 to 120
Benign (Negative) 19.33 17.86 12 3 to 69
Table 4: Diagnostic performance of T2WI at cut-off PIRADS score of 2, 3 and 4. Cut-off
PIRADS
score
Sensitivity%
(95% CI)
Specificity%
(95% CI)
Youden
index
+LR
(95% CI)
-LR
(95% CI) PPV% NPV%
2 100
(95.3 - 100)
13.13
(8.8 - 18.6) 0.131
1.15
(1.1-1.2) 0.00 30.6 100
3 88.16
(78.7-94.4)
46.97
(39.9-54.2) 0.352
1.66
(1.4-1.9)
0.25
(0.1-0.5) 39 91.2
4 72.37
(60.9-82)
86.87
(81.4-91.2) 0.592
5.51
(3.8-8.1)
0.32
(0.2-0.5) 67.9 89.1
Table 5: Diagnostic performance of DWI at cut-off PIRADS score of 2, 3 and 4. Cut-off
PIRADS
score
Sensitivity%
(95% CI)
Specificity%
(95% CI)
Youden
index
+LR
(95% CI)
-LR
(95% CI) PPV% NPV%
2 94.74
(87.1-98.5)
40.4
(33.2-47.6) 0.351
1.59
(1.4-1.8)
0.13
(0.05-0.3) 37.9 95.2
3 81.58
(71-89.5)
92.42
(87.8-95.7) 0.74
10.77
(6.5-17.7)
0.2
(0.1-0.3) 80.5 92.9
4 61.84
(50-72.8)
96.46
(92.9-98.6) 0.543
17.49
(8.3-37)
0.40
(0.3-0.5) 87 86.8
Table 6: Diagnostic performance of DCEI at cut-off PIRADS score of 2, 3 and 4. Cut-off
PIRADS
score
Sensitivity%
(95% CI)
Specificity%
(95% CI)
Youden
index
+LR
(95% CI)
-LR
(95% CI) PPV% NPV%
2 76.32
(65.2-85.3)
81.31
(75.2-86.5) 0.576
4.08
(3-5.6)
0.29
(0.2-0.4) 61.1 89.9
3 65.79
(54-76.3)
93.43
(89-96.5) 0.592
10.02
(5.8-17.4)
0.37
(0.3-0.5) 79.4 87.7
4 43.42
(32.1-55.3)
98.99
(96.4-99.9) 0.424
42.99
(10.6-
174.8)
0.57
(0.5-0.7) 94.3 82
Dr Sumod Mathew Koshy MD, FRCR et al JMSCR Volume 05 Issue 02 February 2017 Page 18167
JMSCR Vol||05||Issue||02||Page 18162-18176||February 2017
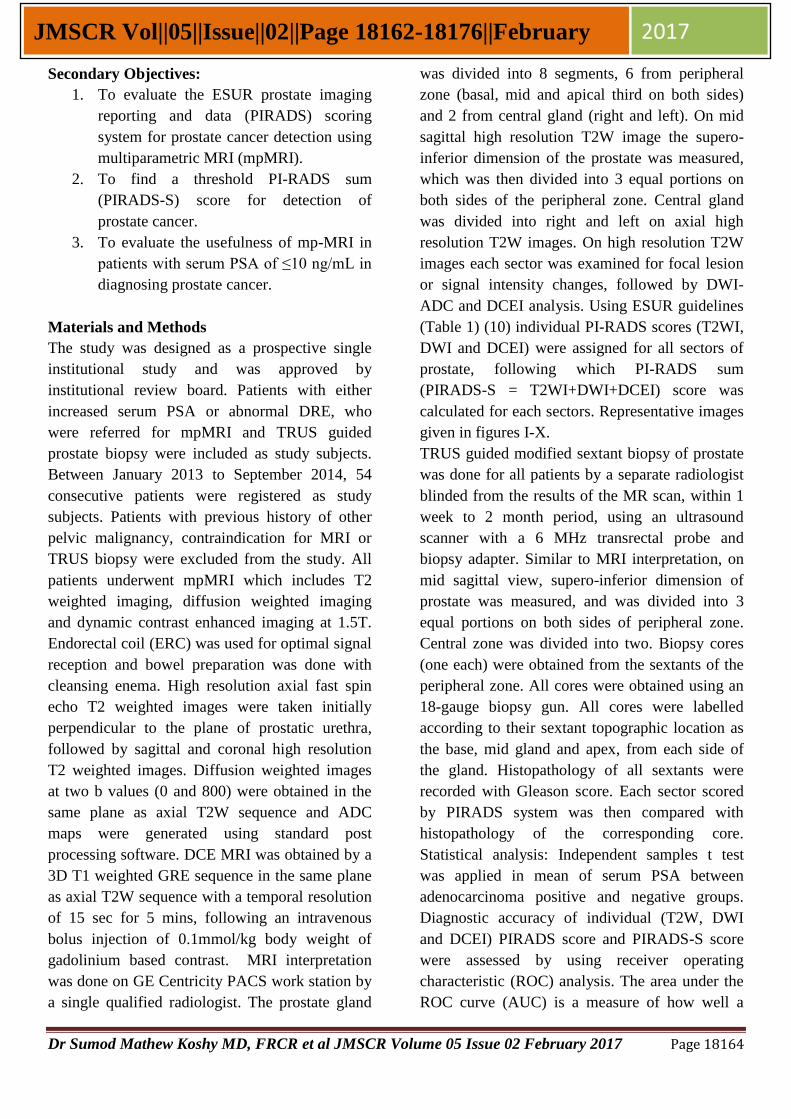
Table 7: Diagnostic performance of PIRADS-S score at threshold level. Youden-selected threshold PIRADS-S > 8
Sensitivity at threshold(95% CI) 78.95(68.1-87.5)
Specificity at threshold(95% CI) 95.45(91.5-97.9)
+LR(95% CI) 17.37(9.1-33.2)
-LR(95% CI) 0.22(0.1-0.3)
PPV % 87
NPV % 92.2
Youden index at threshold(95% CI) 0.744(0.639-0.821)
p value < 0.001
Table 8: Diagnostic performance of PIRADS-S score at threshold level in patients with serum PSA ≤ 10
ng/mL. AUC(95% CI) 0.930 (0.853-0.974)
Youden-selected threshold >7
Sensitivity at threshold(95% CI) 85 (62.1-96.8)
Specificity at threshold(95% CI) 87.88 (77.5-94.6)
+LR(95% CI) 7.01 (3.6-13.8)
-LR(95% CI) 0.17 (0.06-0.5)
PPV % 68
NPV % 95.1
Youden index at threshold(95% CI) 0.729 (0.494-0.854)
p value < 0.001
Fig I: T2WI PIRADS score 4 (Peripheral zone) - Discrete, homogeneous low signal focus confined to the
prostate.
Fig II: T2WI PIRADS score 5 (Peripheral zone) - Discrete, low signal intensity focus with extra-capsular
extension/invasive behaviour.
Dr Sumod Mathew Koshy MD, FRCR et al JMSCR Volume 05 Issue 02 February 2017 Page 18168
JMSCR Vol||05||Issue||02||Page 18162-18176||February 2017
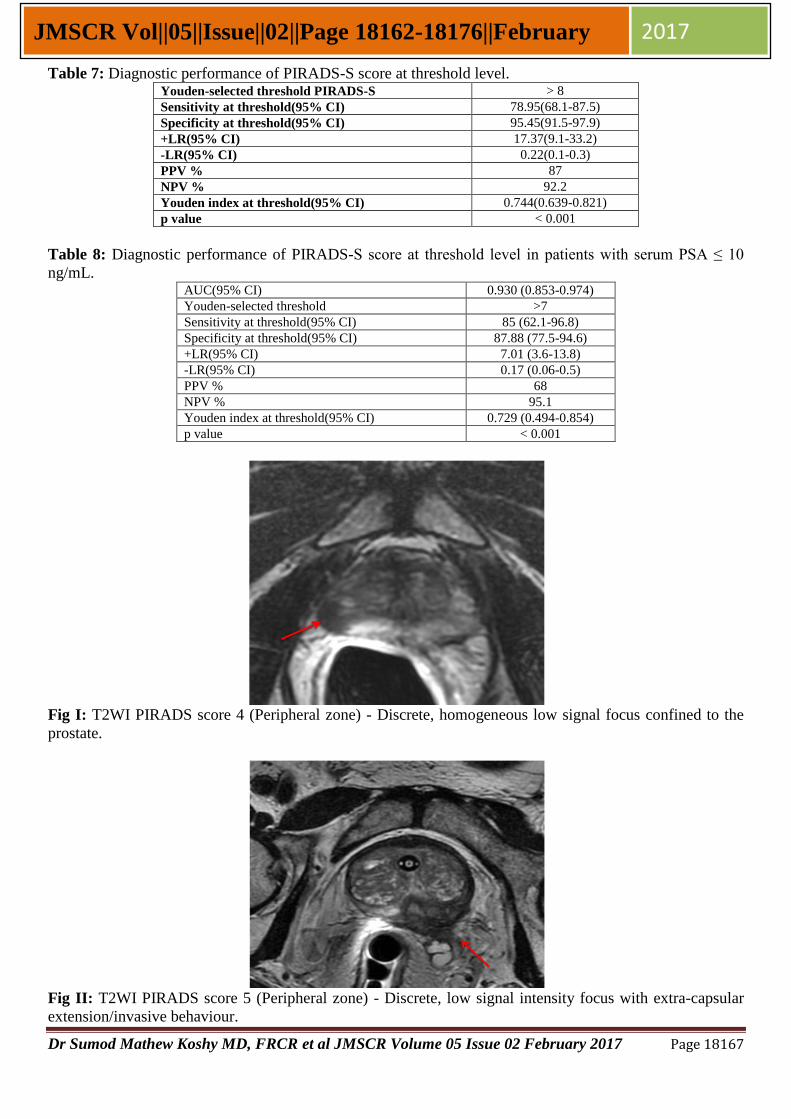
Fig III: T2WI PIRADS score 2 (Central gland) -Areas of more homogeneous low SI, however well
marginated.
Fig IV: T2WI PIRADS score 4 (Central gland) - Areas of more homogeneous low SI, ill defined: “erased
charcoal sign”.
Fig V: (A-DWI, B-ADC) DWI PIRADS score 4 - Focal area of reduced ADC but iso-intense SI on high b-
value image.
Dr Sumod Mathew Koshy MD, FRCR et al JMSCR Volume 05 Issue 02 February 2017 Page 18169
JMSCR Vol||05||Issue||02||Page 18162-18176||February 2017
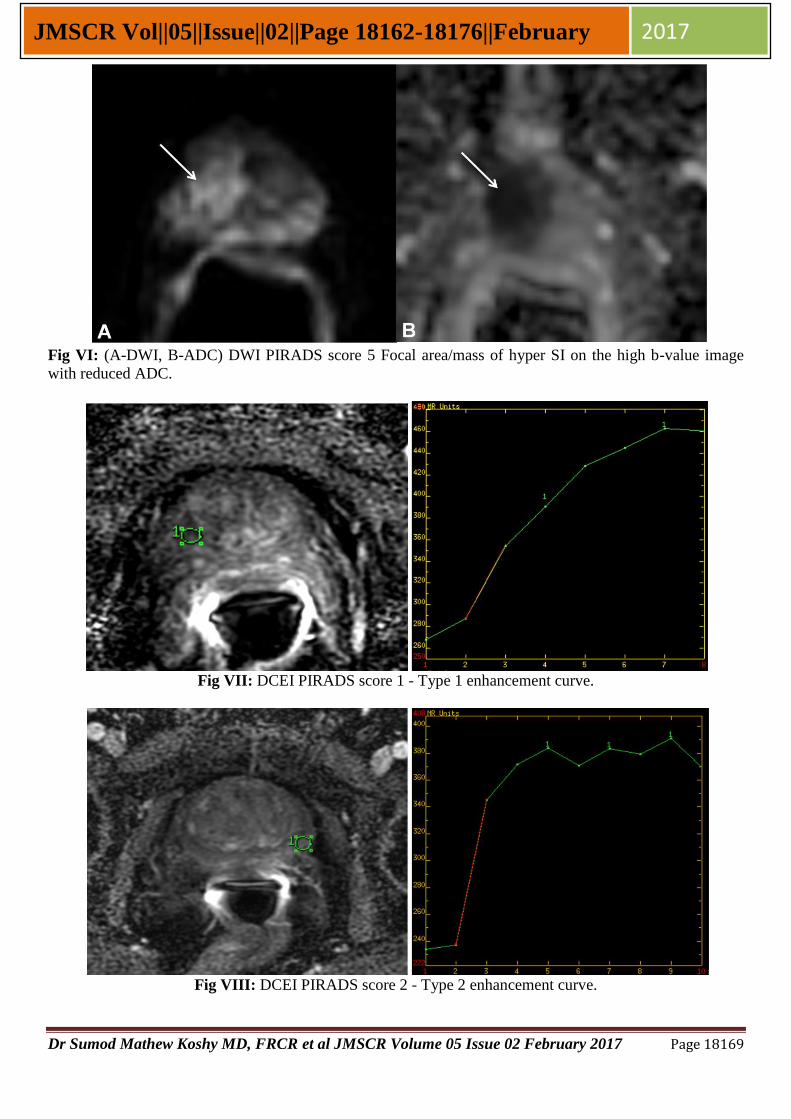
Fig VI: (A-DWI, B-ADC) DWI PIRADS score 5 Focal area/mass of hyper SI on the high b-value image
with reduced ADC.
Fig VII: DCEI PIRADS score 1 - Type 1 enhancement curve.
Fig VIII: DCEI PIRADS score 2 - Type 2 enhancement curve.
Dr Sumod Mathew Koshy MD, FRCR et al JMSCR Volume 05 Issue 02 February 2017 Page 18170
JMSCR Vol||05||Issue||02||Page 18162-18176||February 2017
Fig IX: DCEI PIRADS score 4 - Type 3 enhancement curve + Focal lesion.
Fig X: DCEI PIRADS score 5 - Type 3 enhancement curve + Asymmetric lesion + Focal enhancement.
Fig XI: Age distribution of study population
Dr Sumod Mathew Koshy MD, FRCR et al JMSCR Volume 05 Issue 02 February 2017 Page 18171
JMSCR Vol||05||Issue||02||Page 18162-18176||February 2017
Fig XII: Frequency of adenocarcinoma in age groups
Fig XIII: Distribution of study population in serum PSA groups
Fig XIV: Distribution of Gleason score
Dr Sumod Mathew Koshy MD, FRCR et al JMSCR Volume 05 Issue 02 February 2017 Page 18172
JMSCR Vol||05||Issue||02||Page 18162-18176||February 2017
Fig XV: Distribution of tumour incidence chart - DWI PIRADS score
Fig XVI: ROC curve for DWI
Fig XVII: ROC curves of T2WI, DWI and DCEI
Dr Sumod Mathew Koshy MD, FRCR et al JMSCR Volume 05 Issue 02 February 2017 Page 18173
JMSCR Vol||05||Issue||02||Page 18162-18176||February 2017
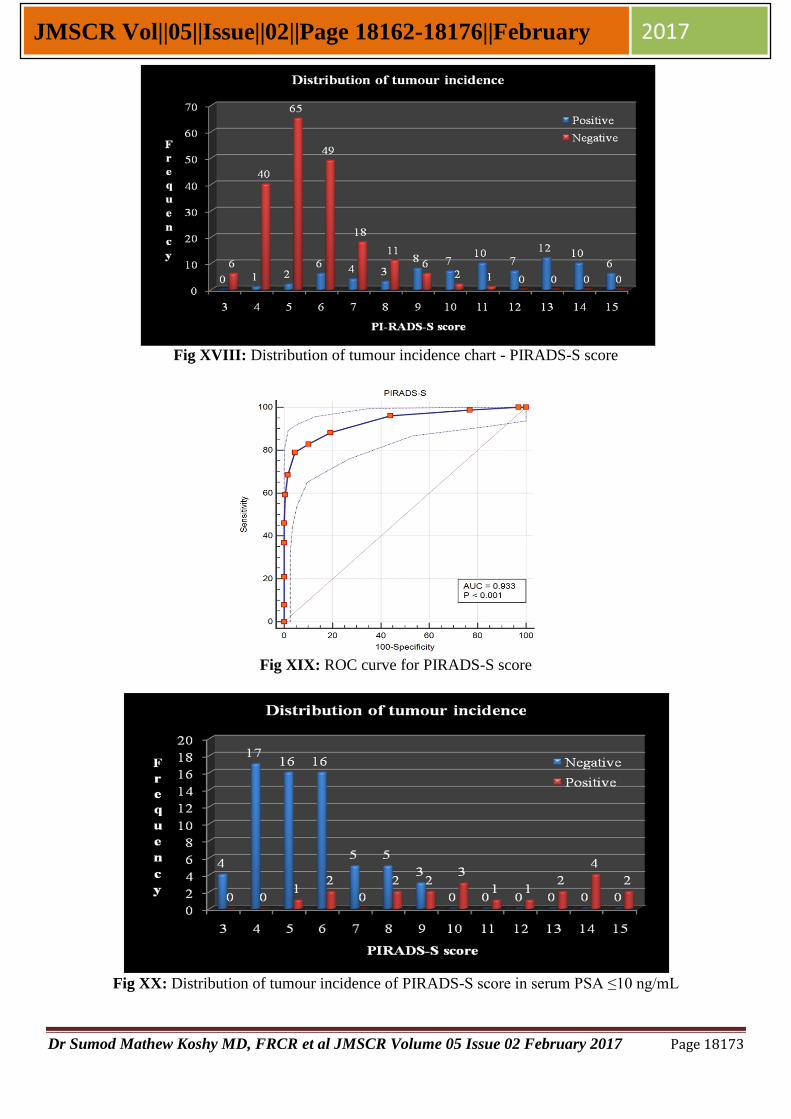
Fig XVIII: Distribution of tumour incidence chart - PIRADS-S score
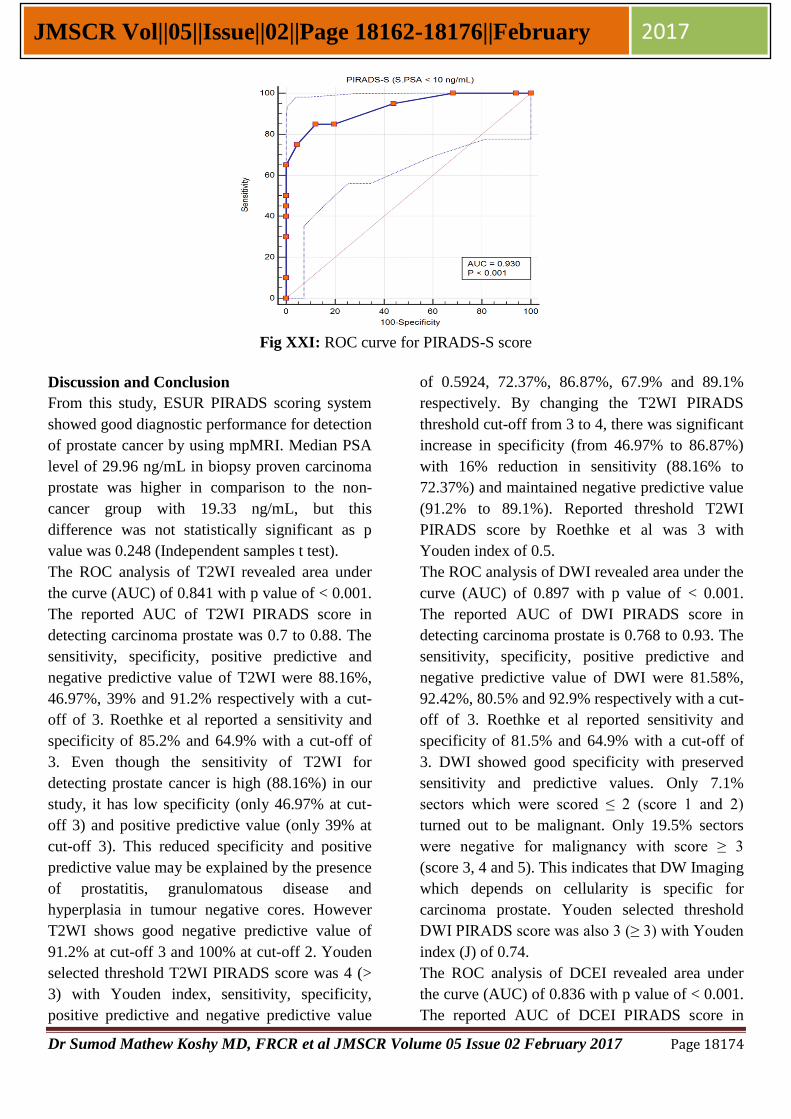
Fig XIX: ROC curve for PIRADS-S score
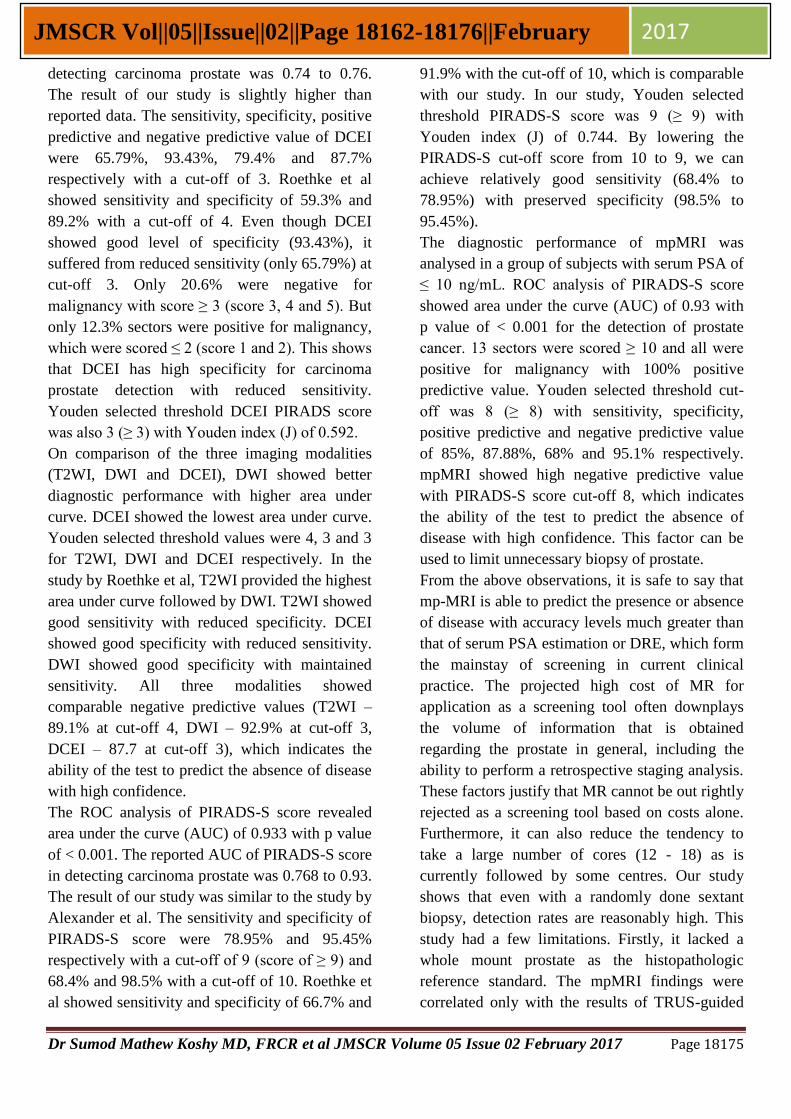
Fig XX: Distribution of tumour incidence of PIRADS-S score in serum PSA ≤10 ng/mL
Dr Sumod Mathew Koshy MD, FRCR et al JMSCR Volume 05 Issue 02 February 2017 Page 18174
JMSCR Vol||05||Issue||02||Page 18162-18176||February 2017
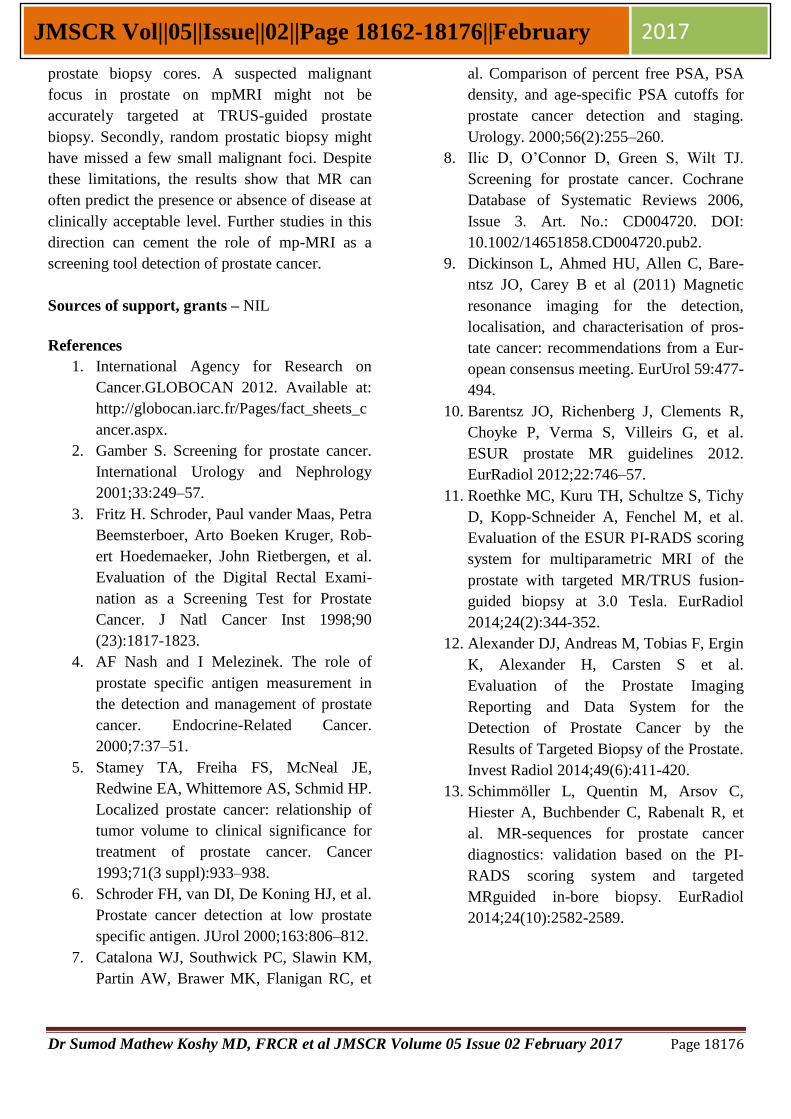
Fig XXI: ROC curve for PIRADS-S score
Discussion and Conclusion
From this study, ESUR PIRADS scoring system
showed good diagnostic performance for detection
of prostate cancer by using mpMRI. Median PSA
level of 29.96 ng/mL in biopsy proven carcinoma
prostate was higher in comparison to the non-
cancer group with 19.33 ng/mL, but this
difference was not statistically significant as p
value was 0.248 (Independent samples t test).
The ROC analysis of T2WI revealed area under
the curve (AUC) of 0.841 with p value of < 0.001.
The reported AUC of T2WI PIRADS score in
detecting carcinoma prostate was 0.7 to 0.88. The
sensitivity, specificity, positive predictive and
negative predictive value of T2WI were 88.16%,
46.97%, 39% and 91.2% respectively with a cut-
off of 3. Roethke et al reported a sensitivity and
specificity of 85.2% and 64.9% with a cut-off of
3. Even though the sensitivity of T2WI for
detecting prostate cancer is high (88.16%) in our
study, it has low specificity (only 46.97% at cut-
off 3) and positive predictive value (only 39% at
cut-off 3). This reduced specificity and positive
predictive value may be explained by the presence
of prostatitis, granulomatous disease and
hyperplasia in tumour negative cores. However
T2WI shows good negative predictive value of
91.2% at cut-off 3 and 100% at cut-off 2. Youden
selected threshold T2WI PIRADS score was 4 (>
3) with Youden index, sensitivity, specificity,
positive predictive and negative predictive value
of 0.5924, 72.37%, 86.87%, 67.9% and 89.1%
respectively. By changing the T2WI PIRADS
threshold cut-off from 3 to 4, there was significant
increase in specificity (from 46.97% to 86.87%)
with 16% reduction in sensitivity (88.16% to
72.37%) and maintained negative predictive value
(91.2% to 89.1%). Reported threshold T2WI
PIRADS score by Roethke et al was 3 with
Youden index of 0.5.
The ROC analysis of DWI revealed area under the
curve (AUC) of 0.897 with p value of < 0.001.
The reported AUC of DWI PIRADS score in
detecting carcinoma prostate is 0.768 to 0.93. The
sensitivity, specificity, positive predictive and
negative predictive value of DWI were 81.58%,
92.42%, 80.5% and 92.9% respectively with a cut-
off of 3. Roethke et al reported sensitivity and
specificity of 81.5% and 64.9% with a cut-off of
3. DWI showed good specificity with preserved
sensitivity and predictive values. Only 7.1%
sectors which were scored ≤ 2 (score 1 and 2)
turned out to be malignant. Only 19.5% sectors
were negative for malignancy with score ≥ 3
(score 3, 4 and 5). This indicates that DW Imaging
which depends on cellularity is specific for
carcinoma prostate. Youden selected threshold
DWI PIRADS score was also 3 (≥ 3) with Youden
index (J) of 0.74.
The ROC analysis of DCEI revealed area under
the curve (AUC) of 0.836 with p value of < 0.001.
The reported AUC of DCEI PIRADS score in
Dr Sumod Mathew Koshy MD, FRCR et al JMSCR Volume 05 Issue 02 February 2017 Page 18175
JMSCR Vol||05||Issue||02||Page 18162-18176||February 2017
detecting carcinoma prostate was 0.74 to 0.76.
The result of our study is slightly higher than
reported data. The sensitivity, specificity, positive
predictive and negative predictive value of DCEI
were 65.79%, 93.43%, 79.4% and 87.7%
respectively with a cut-off of 3. Roethke et al
showed sensitivity and specificity of 59.3% and
89.2% with a cut-off of 4. Even though DCEI
showed good level of specificity (93.43%), it
suffered from reduced sensitivity (only 65.79%) at
cut-off 3. Only 20.6% were negative for
malignancy with score ≥ 3 (score 3, 4 and 5). But
only 12.3% sectors were positive for malignancy,
which were scored ≤ 2 (score 1 and 2). This shows
that DCEI has high specificity for carcinoma
prostate detection with reduced sensitivity.
Youden selected threshold DCEI PIRADS score
was also 3 (≥ 3) with Youden index (J) of 0.592.
On comparison of the three imaging modalities
(T2WI, DWI and DCEI), DWI showed better
diagnostic performance with higher area under
curve. DCEI showed the lowest area under curve.
Youden selected threshold values were 4, 3 and 3
for T2WI, DWI and DCEI respectively. In the
study by Roethke et al, T2WI provided the highest
area under curve followed by DWI. T2WI showed
good sensitivity with reduced specificity. DCEI
showed good specificity with reduced sensitivity.
DWI showed good specificity with maintained
sensitivity. All three modalities showed
comparable negative predictive values (T2WI –
89.1% at cut-off 4, DWI – 92.9% at cut-off 3,
DCEI – 87.7 at cut-off 3), which indicates the
ability of the test to predict the absence of disease
with high confidence.
The ROC analysis of PIRADS-S score revealed
area under the curve (AUC) of 0.933 with p value
of < 0.001. The reported AUC of PIRADS-S score
in detecting carcinoma prostate was 0.768 to 0.93.
The result of our study was similar to the study by
Alexander et al. The sensitivity and specificity of
PIRADS-S score were 78.95% and 95.45%
respectively with a cut-off of 9 (score of ≥ 9) and
68.4% and 98.5% with a cut-off of 10. Roethke et
al showed sensitivity and specificity of 66.7% and
91.9% with the cut-off of 10, which is comparable
with our study. In our study, Youden selected
threshold PIRADS-S score was 9 (≥ 9) with
Youden index (J) of 0.744. By lowering the
PIRADS-S cut-off score from 10 to 9, we can
achieve relatively good sensitivity (68.4% to
78.95%) with preserved specificity (98.5% to
95.45%).
The diagnostic performance of mpMRI was
analysed in a group of subjects with serum PSA of
≤ 10 ng/mL. ROC analysis of PIRADS-S score
showed area under the curve (AUC) of 0.93 with
p value of < 0.001 for the detection of prostate
cancer. 13 sectors were scored ≥ 10 and all were
positive for malignancy with 100% positive
predictive value. Youden selected threshold cut-
off was 8 (≥ 8) with sensitivity, specificity,
positive predictive and negative predictive value
of 85%, 87.88%, 68% and 95.1% respectively.
mpMRI showed high negative predictive value
with PIRADS-S score cut-off 8, which indicates
the ability of the test to predict the absence of
disease with high confidence. This factor can be
used to limit unnecessary biopsy of prostate.
From the above observations, it is safe to say that
mp-MRI is able to predict the presence or absence
of disease with accuracy levels much greater than
that of serum PSA estimation or DRE, which form
the mainstay of screening in current clinical
practice. The projected high cost of MR for
application as a screening tool often downplays
the volume of information that is obtained
regarding the prostate in general, including the
ability to perform a retrospective staging analysis.
These factors justify that MR cannot be out rightly
rejected as a screening tool based on costs alone.
Furthermore, it can also reduce the tendency to
take a large number of cores (12 - 18) as is
currently followed by some centres. Our study
shows that even with a randomly done sextant
biopsy, detection rates are reasonably high. This
study had a few limitations. Firstly, it lacked a
whole mount prostate as the histopathologic
reference standard. The mpMRI findings were
correlated only with the results of TRUS-guided
Dr Sumod Mathew Koshy MD, FRCR et al JMSCR Volume 05 Issue 02 February 2017 Page 18176
JMSCR Vol||05||Issue||02||Page 18162-18176||February 2017
prostate biopsy cores. A suspected malignant
focus in prostate on mpMRI might not be
accurately targeted at TRUS-guided prostate
biopsy. Secondly, random prostatic biopsy might
have missed a few small malignant foci. Despite
these limitations, the results show that MR can
often predict the presence or absence of disease at
clinically acceptable level. Further studies in this
direction can cement the role of mp-MRI as a
screening tool detection of prostate cancer.
Sources of support, grants – NIL
References
1. International Agency for Research on
Cancer.GLOBOCAN 2012. Available at:
http://globocan.iarc.fr/Pages/fact_sheets_c
ancer.aspx.
2. Gamber S. Screening for prostate cancer.
International Urology and Nephrology
2001;33:249–57.
3. Fritz H. Schroder, Paul vander Maas, Petra
Beemsterboer, Arto Boeken Kruger, Rob-
ert Hoedemaeker, John Rietbergen, et al.
Evaluation of the Digital Rectal Exami-
nation as a Screening Test for Prostate
Cancer. J Natl Cancer Inst 1998;90
(23):1817-1823.
4. AF Nash and I Melezinek. The role of
prostate specific antigen measurement in
the detection and management of prostate
cancer. Endocrine-Related Cancer.
2000;7:37–51.
5. Stamey TA, Freiha FS, McNeal JE,
Redwine EA, Whittemore AS, Schmid HP.
Localized prostate cancer: relationship of
tumor volume to clinical significance for
treatment of prostate cancer. Cancer
1993;71(3 suppl):933–938.
6. Schroder FH, van DI, De Koning HJ, et al.
Prostate cancer detection at low prostate
specific antigen. JUrol 2000;163:806–812.
7. Catalona WJ, Southwick PC, Slawin KM,
Partin AW, Brawer MK, Flanigan RC, et
al. Comparison of percent free PSA, PSA
density, and age-specific PSA cutoffs for
prostate cancer detection and staging.
Urology. 2000;56(2):255–260.
8. Ilic D, O’Connor D, Green S, Wilt TJ.
Screening for prostate cancer. Cochrane
Database of Systematic Reviews 2006,
Issue 3. Art. No.: CD004720. DOI:
10.1002/14651858.CD004720.pub2.
9. Dickinson L, Ahmed HU, Allen C, Bare-
ntsz JO, Carey B et al (2011) Magnetic
resonance imaging for the detection,
localisation, and characterisation of pros-
tate cancer: recommendations from a Eur-
opean consensus meeting. EurUrol 59:477-
494.
10. Barentsz JO, Richenberg J, Clements R,
Choyke P, Verma S, Villeirs G, et al.
ESUR prostate MR guidelines 2012.
EurRadiol 2012;22:746–57.
11. Roethke MC, Kuru TH, Schultze S, Tichy
D, Kopp-Schneider A, Fenchel M, et al.
Evaluation of the ESUR PI-RADS scoring
system for multiparametric MRI of the
prostate with targeted MR/TRUS fusion-
guided biopsy at 3.0 Tesla. EurRadiol
2014;24(2):344-352.
12. Alexander DJ, Andreas M, Tobias F, Ergin
K, Alexander H, Carsten S et al.
Evaluation of the Prostate Imaging
Reporting and Data System for the
Detection of Prostate Cancer by the
Results of Targeted Biopsy of the Prostate.
Invest Radiol 2014;49(6):411-420.
13. Schimmöller L, Quentin M, Arsov C,
Hiester A, Buchbender C, Rabenalt R, et
al. MR-sequences for prostate cancer
diagnostics: validation based on the PI-
RADS scoring system and targeted
MRguided in-bore biopsy. EurRadiol
2014;24(10):2582-2589.