jnj pitch
TRANSCRIPT

JOHNSON & JOHNSON : JNJ March 5 , 2015
KELVIN LI BCOMM. 17

AGENDA
CONTENT SLIDE
INDUSTRY OUTLOOK 3
COMPANY OVERVIEW 4
INVESTMENT RATIONALE 5-7
CATALYSTS 8
RISKS 9
VALUATION 10-14
TARGET PRICE 15

INDUSTRY OVERVIEW
Valuation Catalysts & Risks Investment Rationale Company Overview Industry Overview
• 6.5% annual growth rate will occur within the next 5 years. The past 5 year growth rate was 3.5%.
• 22% of revenues generated in Anastasia and Respiratory, another 22% in Irradiation Services
• JNJ having 7.1% market share of this specific sector
• US residents aged 65 and over will be the largest target market within the sector, growing at an annualized rate of 3.6%
• R&D spending and increasing technology bolster growth
SOURCE: IBIS WORLD 3
US MEDICAL DEVICES INDUSTRY OUTLOOK GLOBAL PHARMACEUTICAL OUTLOOK • Pharmaceutical manufacturers will exhibit growth over the next five
years, driven by the growing middle class enabling more individuals to afford pharmaceuticals.
• 3.7% forecasted annual growth rate
• larger players will likely pursue low-risk strategies, such as acquiring small companies that have developed commercial-ready technologies. ex. neurology and cardiology.
• the industry is primarily growing by cutting costs, developing strategies for more efficient R&D methods and completing mergers and acquisitions (M&As).
• 2012 and 2011 patent cliff have caused R&D expenditures to be constrained in 2014 due to increasing number of competitors.

COMPANY OVERVIEW BUSINESS OVERVIEW
DIVERSE PRODUCT PIPELINE
Valuation Catalysts & Risks Investment Rationale Company Overview Industry Overview
• J&J is the world's comprehensive manufacturer of health care products, as well as a provider of related services, for the consumer, pharmaceutical, and medical devices market. together with its subsidiaries, researches and develops, manufactures, and sells various products in the health care field worldwide
MANAGEMENT TEAM
Alex Gorsky (CEO)
Sandra Peterson Group Worldwide
Chairman
Dominic Caruso (CFO)
Former worldwide chairman of medical
devices and diagnostic group
Oversees JNJ supply chain, Former CEO of Bayer
Medical Care
Former VP of Finance at Centecor
4
REVENUE BY GEOGRAPHIC SEGMENT
45%
26%
19%
10% USA
Europe
Asia- Pacific
Other
Strong domestic presence in the United States/ Brand Recognition
Market Cap: $283B Last Trading Price: $102.52 Beta: 0.57

INVESTMENT RATIONALE I
Valuation Catalysts & Risks Investment Rationale Company Overview Industry Overview 5
CONSISTENT CURRENT RATIO REDUCES RISK
2010 2011 2012 2013 2014 2015
Current Ratio 1.8x 2.1x 2.4x 1.9x 2.2x 2.4x
R² = 0.37136
0.0x 0.5x 1.0x 1.5x
2.0x 2.5x 3.0x
CURRENT RATIO PAST 5 YEARS
• JNJ’s current ratio remains consistent throughout the past 5 years. This highlights its ability to pay down debt if needed to be liquidated. Their ratios have held at a healthy mean of 2.1, demonstrating the company’s financial health. This number is not too high and also not too low.
• This gives JNJ minimal risk when considering further pharmaceutical projects.
2010 2011 2012 2013 2014 2015
Total Debt/Equity 28.7% 29.6% 35.4% 24.9% 24.5% 26.9%
R² = 0.21869
0.0%
10.0%
20.0%
30.0%
40.0%
DEBT/EQUITY % PAST 5 YEARS
DEBT LEVELS LOW: POSITIONED FOR GROWTH
• Financing through equity is important as banks prefer not to lend to high risk projects. Though JNJ’s size is large, its debt levels remain at a low level with minimal movement in the past 5 years. This demonstrates professional long term solvency and minimal risk moving forward.
SOURCE: CAPITAL IQ

INVESTMENT RATIONALE II
Valuation Catalysts & Risks Investment Rationale Company Overview Industry Overview 6
CONSISTENT R&D GROWTH SIGNALS INNOVATION MANY PHASE 3 STAGED DRUGS SIGNAL REVENUE INCREASE
SOURCE: CAPITAL IQ
2010 2011 2012 2013 2014 2015
R & D Exp. 6,986. 6,844. 7,548. 7,665. 8,183. 8,494.
R² = 0.93055
0
2,000.0
4,000.0
6,000.0
8,000.0
10,000.0 R&D EXP.
• To produce pharmaceutical drugs and medical devices, R&D growth is vital. JNJ has consistently increased their R&D expenses historically. A five year growth rate of 20% has been achieved.
• Roughly 11% of revenue is spent on R&D expenditure, this ratio has also remained constant over the past 5 years. JNJ definitely has room to increase their R&D even more rapidly in the coming years
• There is roughly a 6% chance of a preclinical drug to reach phase 3 of the stage. With 39 preclinical drugs, one would expect only 2 phase 3 drugs to be reached. Currently 9 are present therefore demonstrating JNJ’s ability to have a high success rate with regards to FDA approval.
• There is a 64% chance of phase 3 drugs reaching the market, therefore we can expect roughly 6 new drugs to generate revenue in the coming few years.

INVESTMENT RATIONALE III
Valuation Catalysts & Risks Investment Rationale Company Overview Industry Overview 7
JNJ IS IN A POSITION FOR A LARGE ACQUISITION
SOURCE: CAPITAL IQ
• With the last large acquisition occurring on June 2012, JNJ is due to acquire another company. The past acquisition was a 21 billion dollars purchase of Synthes Inc.
• JNJ has consistently increased their free cash flow within the past 5 years, which can be used to subsidize an acquisition. Also with such a diverse product portfolio (493 to be exact), it isn’t surprising that JNJ is eager to add another company to it.
2010 2011 2012 2013 2014 2015
Levered Free Cash Flow 10,985.1 11,723.0 8,971.1 12,383.1 11,909.4 15,453.5
R² = 0.4434
0 2,000.0 4,000.0 6,000.0 8,000.0
10,000.0 12,000.0 14,000.0 16,000.0 18,000.0
LEVERED FREE CASH FLOW

CATALYSTS
Valuation Catalysts & Risks Investment Rationale Company Overview Industry Overview 8 SOURCE: SEEKING ALPHA
ABBVIE PURCHASING PHARMACYCLICS
• This 21 billion dollar deal allows synergies to occur within the two companies.
• Imbruvica is a drug sold by Pharmacyclics and is used to treat
Leukemia. Johnson and Johnson is a partner with Pharmacyclics with regards to this drug.
• Sales around 500 million with projected end of year sales of 1
billion dollars – 5 billion post acquisition statement.
• Though JNJ did not acquire Pharmacyclics as people claimed they would this past week, they still benefit from this deal.
• Cordis, owned by JNJ makes cardiology and endovascular devices • a divestiture would be in-line with management’s efforts to prioritize
its medical device business and focus on faster growth assets where J&J has strong competitive positioning
CARDINAL HEALTH BUYS CORDIS FROM JNJ

RISKS
Valuation Catalysts & Risks Investment Rationale Company Overview Industry Overview 9
COMPETITIVE PRESSURES RAPID TECHNOLOGICAL CHANGES
UNCERTAIN R&D OUTCOMES
• The development of new products increase the competitive environment for JNJ. Patents expiring for generic drugs allow competition to enter the market and produce the same product, forcing JNJ to compete on a basis of cost.
• Adverse or inconclusive results have the potential to delay the development of a product in testing. Uncertainty is always a common theme therefore any products in the pipeline are under risk of default. Profitability is always in danger even with JNJ’s high success rate.
• The medical device sector consistently requires technological updates. With a large segment of JNJ’s revenue coming from medical devices, there is a large amount of pressure to continuously update the company’s technology. Profits may weaken if new devices are not accepted in to the market as well as the research says it will.
VALUATION
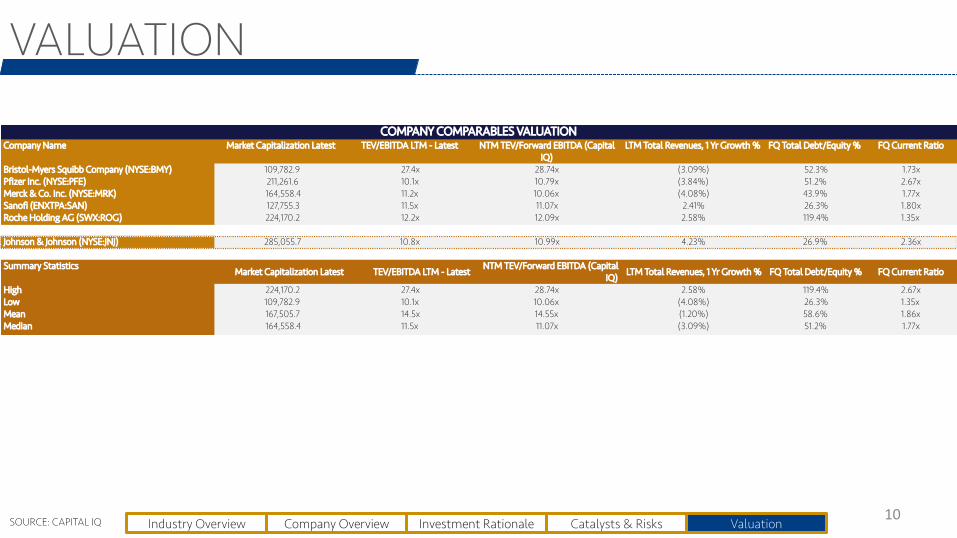
Valuation Catalysts & Risks Investment Rationale Company Overview Industry Overview 10 SOURCE: CAPITAL IQ
Company Name Market Capitalization Latest TEV/EBITDA LTM - Latest NTM TEV/Forward EBITDA (Capital IQ)
LTM Total Revenues, 1 Yr Growth % FQ Total Debt/Equity % FQ Current Ratio
Bristol-Myers Squibb Company (NYSE:BMY) 109,782.9 27.4x 28.74x (3.09%) 52.3% 1.73xPfizer Inc. (NYSE:PFE) 211,261.6 10.1x 10.79x (3.84%) 51.2% 2.67xMerck & Co. Inc. (NYSE:MRK) 164,558.4 11.2x 10.06x (4.08%) 43.9% 1.77xSanofi (ENXTPA:SAN) 127,755.3 11.5x 11.07x 2.41% 26.3% 1.80xRoche Holding AG (SWX:ROG) 224,170.2 12.2x 12.09x 2.58% 119.4% 1.35x
Johnson & Johnson (NYSE:JNJ) 285,055.7 10.8x 10.99x 4.23% 26.9% 2.36x
Summary StatisticsMarket Capitalization Latest TEV/EBITDA LTM - Latest
NTM TEV/Forward EBITDA (Capital IQ)
LTM Total Revenues, 1 Yr Growth % FQ Total Debt/Equity % FQ Current Ratio
High 224,170.2 27.4x 28.74x 2.58% 119.4% 2.67xLow 109,782.9 10.1x 10.06x (4.08%) 26.3% 1.35xMean 167,505.7 14.5x 14.55x (1.20%) 58.6% 1.86xMedian 164,558.4 11.5x 11.07x (3.09%) 51.2% 1.77x
COMPANY COMPARABLES VALUATION

VALUATION
Valuation Catalysts & Risks Investment Rationale Company Overview Industry Overview 11 SOURCE: CAPITAL IQ
DISCOUNTED CASH FLOW VALUATIONYEAR ENDING DEC 31
Revenue:Revenue Growth
COGSCOGS Growth
SG&ASG&A Growth
R&DR&D Growth
Amortization of Goodwill/IntangiblesEBIT Margin
EBITEBITDA
Less: Provision for TaxesUnlevered Net Income
Plus: D&A (excl. non-deductible GW amort.)Less: Capital ExpendituresLess: Increase in Net Working Capital
Unlevered Free Cash Flow
D&A % of SalesCapex % of SalesNWC Growth
COGSSG&AR&DTax Rate
DISCOUNTED CASH FLOW VALUATIONYEAR ENDING DEC 31 EBITDA Multiples Method
2012A 2013P 2014P 2015E 2016E 2017E 2018E 2019E 2020E 2021E 2022E 2023E 2024E 67,224.0 71,312.0 74,331.0 74,331.0 $76,375.1 $78,284.5 $80,045.9 $81,646.8 $83,075.6 $84,321.8 $85,375.8 $86,229.5 $86,876.3
3.4% 6.1% 4.2% 3.0% 2.8% 2.5% 2.3% 2.0% 1.8% 1.5% 1.3% 1.0% 0.8%
$21,313.0 $22,242.0 $22,746.0 $23,165.3 $23,802.3 $24,397.4 $24,946.3 $25,445.3 $25,890.5 $26,278.9 $26,607.4 $26,873.5 $27,075.05.1% 4.4% 2.3%
$20,869.0 $21,830.0 $21,954.0 $22,594.5 $23,215.8 $23,796.2 $24,331.6 $24,818.3 $25,252.6 $25,631.4 $25,951.8 $26,211.3 $26,407.9-0.4% 4.6% 0.6%
$7,665.0 $8,183.0 $8,494.0 $8,499.6 $8,733.3 $8,951.7 $9,153.1 $9,336.1 $9,499.5 $9,642.0 $9,762.5 $9,860.2 $9,934.11.5% 6.8% 3.8%
$1,146.0 $1,363.0 $1,398.0 $1,302.3 $1,380.5 $1,350.2 $1,341.4 $1,344.3 $1,357.4 $1,345.3 $1,347.7 $1,349.0 $1,350.125.8% 26.7% 28.4% 27.0% 27.0% 27.0% 27.0% 27.0% 27.0% 27.0% 27.0% 27.0% 27.0%
$17,377.0 $19,057.0 $21,137.0 $20,071.6 $20,623.6 $21,139.2 $21,614.8 $22,047.1 $22,432.9 $22,769.4 $23,054.1 $23,284.6 $23,459.2$19,897.0 $21,798.0 $23,634.0 $22,785.1 $23,411.7 $23,997.0 $24,536.9 $25,027.7 $25,465.7 $25,847.6 $26,170.7 $26,432.4 $26,630.7
(4,344.3) (4,764.3) (5,284.3) (5,017.9) (5,155.9) (5,284.8) (5,403.7) (5,511.8) (5,608.2) (5,692.4) (5,763.5) (5,821.1) (5,864.8)$21,721.3 $23,821.3 $26,421.3 $25,089.5 $25,779.5 $26,424.0 $27,018.5 $27,558.9 $28,041.2 $28,461.8 $28,817.6 $29,105.7 $29,324.0
2,520.0 2,741.0 2,497.0 2,713.5 2,788.1 2,857.8 2,922.1 2,980.6 3,032.7 3,078.2 3,116.7 3,147.8 3,171.5(2,934.0) (3,595.0) (3,714.0) (3,568.5) (3,666.6) (3,758.3) (3,842.8) (3,919.7) (3,988.3) (4,048.1) (4,098.7) (4,139.7) (4,170.7)
(461.0) 937.0 1,603.0 690.0 709.0 726.7 743.0 757.9 771.1 782.7 792.5 800.4 806.4$20,846.3 $23,904.3 $26,807.3 $14,888.7 $15,298.2 $15,680.6 $16,033.4 $16,354.1 $16,640.3 $16,889.9 $17,101.0 $17,272.0 $17,401.6
3.7% 3.8% 3.4% 3.7% 3.7% 3.7% 3.7% 3.7% 3.7% 3.7% 3.7% 3.7% 3.7%-4.4% -5.0% -5.0% -4.8% -4.8% -4.8% -4.8% -4.8% -4.8% -4.8% -4.8% -4.8% -4.8%-0.7% 1.3% 2.2% 0.9% 0.9% 0.9% 0.9% 0.9% 0.9% 0.9% 0.9% 0.9% 0.9%
32% 31% 31% 31.2% 31.2% 31.2% 31.2% 31.2% 31.2% 31.2% 31.2% 31.2% 31.2%31% 31% 30% 30.4% 30.4% 30.4% 30.4% 30.4% 30.4% 30.4% 30.4% 30.4% 30.4%11% 11% 11% 11.4% 11.4% 11.4% 11.4% 11.4% 11.4% 11.4% 11.4% 11.4% 11.4%
25.0% 25.0% 25.0% 25.0% 25.0% 25.0% 25.0% 25.0% 25.0% 25.0% 25.0% 25.0% 25.0%

VALUATION
Valuation Catalysts & Risks Investment Rationale Company Overview Industry Overview 12 SOURCE: CAPITAL IQ
EBITDA Multiples MethodWACC 5.6%
Multiples MethodExit Multiple 14.0 x2024E EBITDA $26,630.7Terminal Value $372,829.63
Total Enterprise Value $338,595.3Debt $15,122.0Cash 14523Minority Interest 0
Share PriceTotal Equity Value $337,996.3Shares Outstanding 2780.5
Fair Value Per Share $121.56Current Price $102.52Implied Upside 19%
Perpetuity Growth MethodWACC 5.6%
Enterprise ValuePerpetuity Growth Rate 1.0%2017E UFCF $17,401.6Terminal Value $384,110.95
Total Enterprise Value $345,152.5
Debt 15122Cash 14523Minority Interest 0Total Equity Value $344,553.5
Shares Outstanding 2780.5
Fair Value Per Share $123.92Current Price $102.52Implied Upside 21%
Rf 0.0212ErP 0.09Beta 0.57
Rs 6%
CAPM
Weighting Cost W * C
Equity 78.8% 6.0% 4.8%Debt Cost (1 - T) 21.2% 5.1% 0.8%Preferred Equity 0.0% 0.0% 0.0%WACC 5.6%

VALUATION
Valuation Catalysts & Risks Investment Rationale Company Overview Industry Overview 13 SOURCE: CAPITAL IQ
Multiples MethodEnterprise Value
Exit Multiple12.0 x 13.0 x 14.0 x 15.0 x 16.0 x
6.5% $286,766.54 $300,953.40 $315,140.26 $329,327.12 $343,513.997.0% $276,221.34 $289,759.04 $303,296.73 $316,834.42 $330,372.117.5% $266,163.56 $279,084.61 $292,005.66 $304,926.71 $317,847.75
8.0% $256,567.75 $268,902.91 $281,238.07 $293,573.24 $305,908.408.5% $247,409.93 $259,188.29 $270,966.66 $282,745.02 $294,523.39
Share PriceExit Multiple
12.0 x 13.0 x 14.0 x 15.0 x 16.0 x6.5% 102.92 108.02 113.12 118.23 123.337.0% 99.13 104.00 108.86 113.73 118.607.5% 95.51 100.16 104.80 109.45 114.10
8.0% 92.06 96.49 100.93 105.37 109.808.5% 88.76 93.00 97.24 101.47 105.71
Dis
coun
t Ra
te
(WA
CC)
Dis
coun
t Ra
te
(WA
CC)
Gordon Growth MethodEnterprise Value
Terminal Growth Rate0.5% 0.8% 1.0% 1.3% 1.5%
6.5% $271,801.31 $278,955.54 $286,760.16 $295,308.07 $304,710.787.0% $250,543.06 $256,367.86 $262,678.07 $269,536.99 $277,019.447.5% $232,330.36 $237,132.67 $242,304.40 $247,889.86 $253,940.78
8.0% $216,553.81 $220,556.17 $224,844.40 $229,450.29 $234,410.478.5% $202,756.39 $206,123.59 $209,715.27 $213,554.66 $217,668.29
Share PriceTerminal Growth Rate
0.5% 0.8% 1.0% 1.3% 1.5%6.5% $97.54 $100.11 $102.92 $105.99 $109.377.0% $89.89 $91.99 $94.26 $96.72 $99.417.5% $83.34 $85.07 $86.93 $88.94 $91.11
8.0% $77.67 $79.11 $80.65 $82.30 $84.098.5% $72.70 $73.92 $75.21 $76.59 $78.07
Dis
coun
t Ra
te
(WA
CC)
Dis
coun
t Ra
te
(WA
CC)

VALUATION
Valuation Catalysts & Risks Investment Rationale Company Overview Industry Overview 14 SOURCE: CAPITAL IQ
88.76
72.70
90.86
79.80
88.61
89.78
92.27
96.01
123.33
109.37
218.31
309.51
253.94
242.78
192.50
181.54
0.00 100.00 200.00 300.00 400.00 500.00 600.00 700.00
DCF Multiples Method (12x-16x)
DCF GGM (0.5%-1.5%)
DCF MODEL
P/E FY1
LTM P/E
FY1 EV/EBITDA
LTM EV/EBITDA
FY1 EV/Revenue
LTM EV/Revenue
Company Comparables
FOOTBALL FIELD VALUATION
$145.74

TARGET PRICE RETURNS
Valuation Catalysts & Risks Investment Rationale Company Overview Industry Overview 15 SOURCE: CAPITAL IQ
Price March 5, 2015: $102.52 Capital Gains 42%
Dividend Yield 2.73% Total Implied Return 44.73%
Target Price $145.74

THANK YOU
16