joanne rinker ms, rd, cde, ldn director of training and technical assistance center for healthy...
TRANSCRIPT

Joanne Rinker MS, RD, CDE, LDNDirector of Training and Technical Assistance
Center for Healthy North Carolina
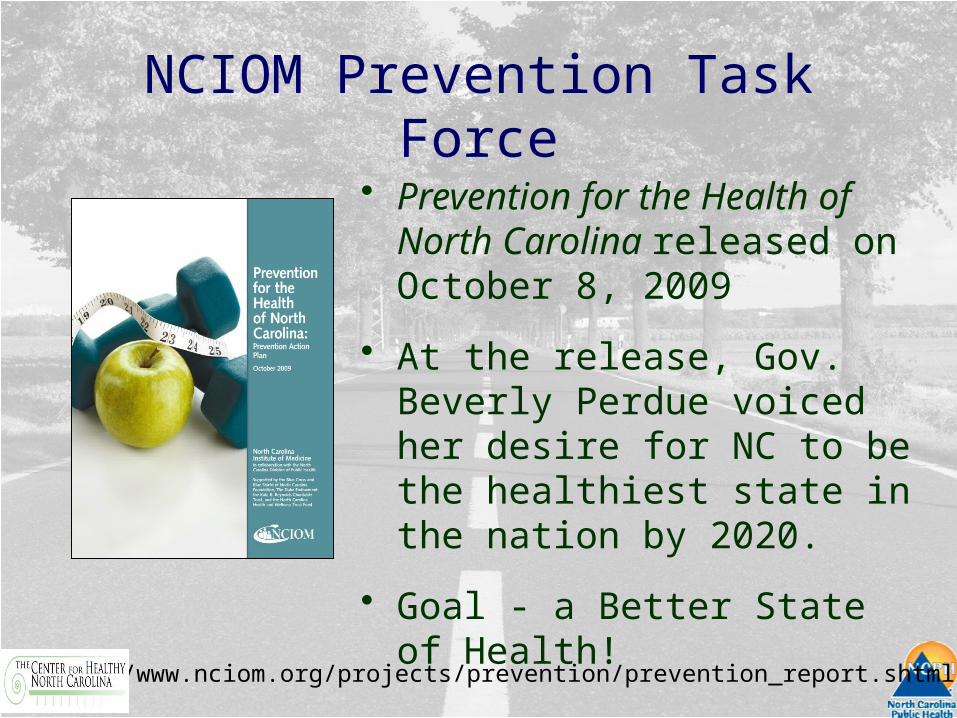
NCIOM Prevention Task Force
• Prevention for the Health of North Carolina released on October 8, 2009
• At the release, Gov. Beverly Perdue voiced her desire for NC to be the healthiest state in the nation by 2020.
• Goal - a Better State of Health!
http://www.nciom.org/projects/prevention/prevention_report.shtml
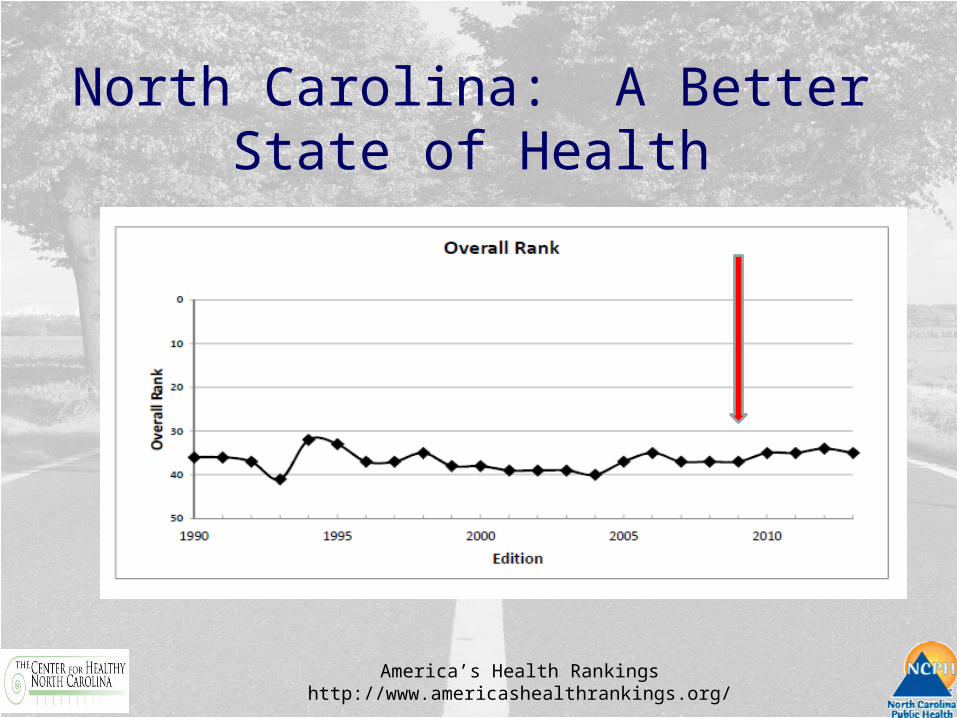
America’s Health Rankingshttp://www.americashealthrankings.org/
North Carolina: A Better State of Health
North Carolina: A Better State of HealthThe Next Step in the Journey...
• We have the Prevention Action Plan, now what?
• Healthy North Carolina 2020 Objectives• Governor’s Task Force for Healthy
Carolinians asked NCIOM to help develop NC’s 2020 objectives and targets.

Healthy North Carolina 2020• Three primary steps in setting Healthy North Carolina
2020 objectives:– 1) Identify appropriate focus (priority) areas,
building off Prevention Action Plan.– 2) Identify limited number of objectives – 3) Identify appropriate targets

Healthy NC 2020 Focus Areas
1. Tobacco use
2. Nutrition and physical activity
3. Sexually transmitted infections/Unintended pregnancy
4. Substance abuse
5. Environmental risks
6. Injury
7. Mental health
8. Infectious disease/ Food-borne illness
9. Social determinants of health
10.Dental health
11. Maternal and infant health
12.Chronic disease
13.Cross-area measures

Healthy North Carolina 2020:Moving Ahead
• Focus on prevention and reducing risk factors that contribute to the leading causes of death in North Carolina
• We cannot measure everything that is important in public health work
• Identify a limited number of health objectives to work toward across the state– 40 objectives: limited, manageable, concise – Allow for meaningful impact – Pull together to make progress

Healthy North Carolina 2020:2013 Annual Report Results
• The NC Division of Public Health/NC State Center for Health Statistics produces annual reports measuring progress towards the targets of improving population health.
• For 2013, of the 31* objectives for which we have updated data, 7 are not comparable.
• Of the 31 that are comparable to the baseline, trends may indicate:– 15 (48%) are moving in the right direction – 1 (3%) stayed the same– 15 (48%) are moving in the wrong direction
All data provided by the NC State Center for Health Statistics
*Not all data are available every year.
Note: Total does not equal 100% due to rounding

Healthy North Carolina 2020
Tobacco Use Baseline CurrentHNC2020
Target US
1. Decrease the percentage of adults who are current smokers¹
20.3% (2009)
20.9% (2012)
13.0% 21.2%(2011)
2. Decrease the percentage of high school students reporting current use of any tobacco product
25.8% (2009)
22.5% (2011)
15.0% 23.4%(2011)
3. Decrease the percentage of people exposed to secondhand smoke in the workplace in the past seven days¹
14.6% (2008)
8.6% (2012)
0% Not available
* Data for this indicator is collected only in odd numbered years.¹ In 2011, the BRFSS methodology changed, so results are not directly comparable to
previous years’ results.

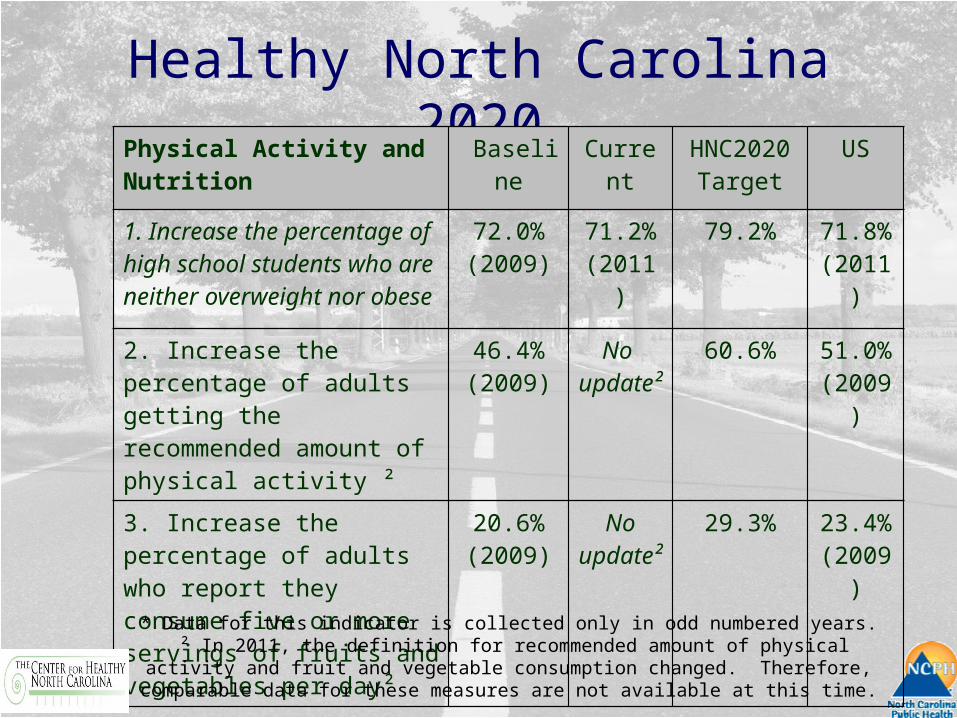
Healthy North Carolina 2020Physical Activity and Nutrition
Baseline Current HNC2020Target
US
1. Increase the percentage of high school students who are neither overweight nor obese
72.0% (2009)
71.2%(2011)
79.2% 71.8%(2011)
2. Increase the percentage of adults getting the recommended amount of physical activity ²
46.4% (2009)
No update²
60.6% 51.0%(2009)
3. Increase the percentage of adults who report they consume five or more servings of fruits and vegetables per day²
20.6% (2009)
No update²
29.3% 23.4%(2009)
* Data for this indicator is collected only in odd numbered years. ² In 2011, the definition for recommended amount of physical activity and fruit and
vegetable consumption changed. Therefore, comparable data for these measures are not available at this time.
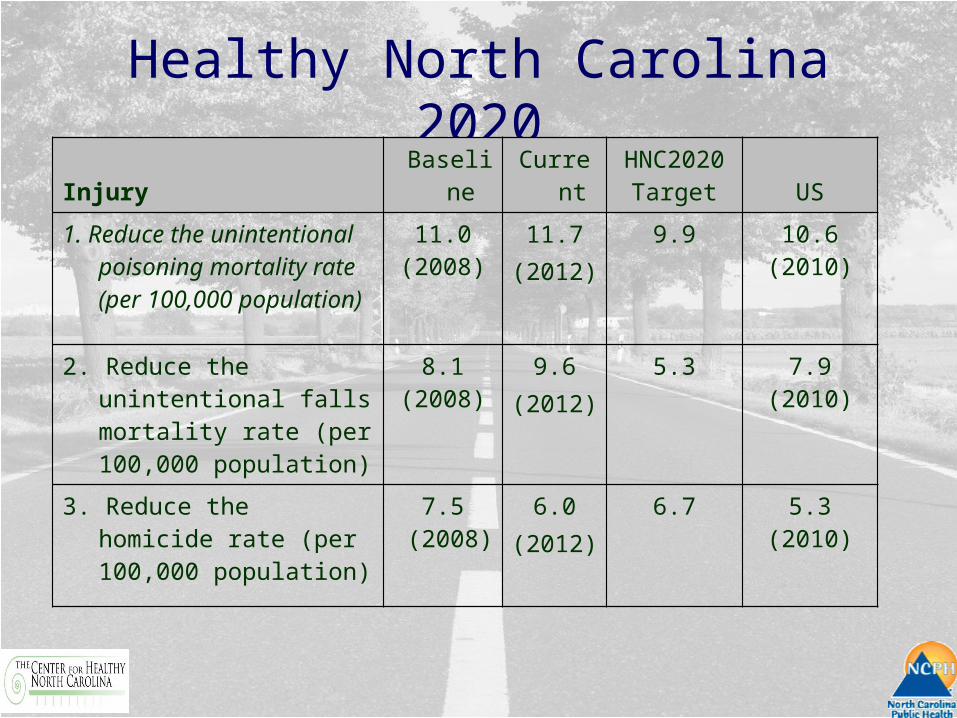
Healthy North Carolina 2020
Injury Baseline CurrentHNC2020
Target US
1. Reduce the unintentional poisoning mortality rate (per 100,000 population)
11.0(2008)
11.7 (2012)
9.9 10.6(2010)
2. Reduce the unintentional falls mortality rate (per 100,000 population)
8.1(2008)
9.6 (2012)
5.3 7.9(2010)
3. Reduce the homicide rate (per 100,000 population)
7.5 (2008)
6.0 (2012)
6.7 5.3(2010)
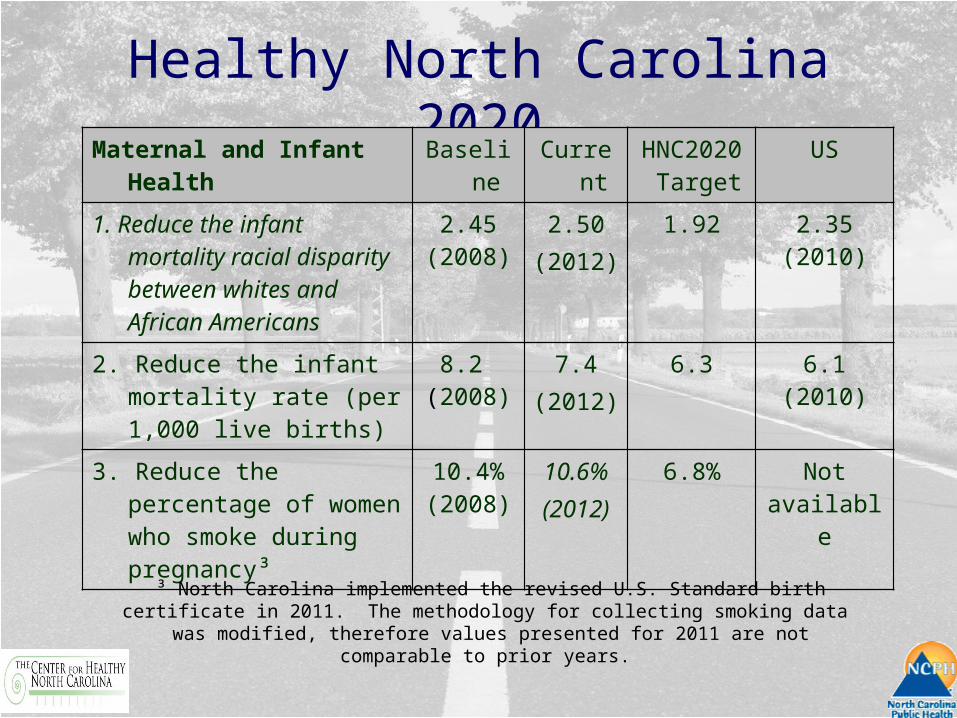
Healthy North Carolina 2020Maternal and Infant Health Baseline Current HNC2020
TargetUS
1. Reduce the infant mortality racial disparity between whites and African Americans
2.45(2008)
2.50 (2012)
1.92 2.35(2010)
2. Reduce the infant mortality rate (per 1,000 live births)
8.2 (2008)
7.4 (2012)
6.3 6.1(2010)
3. Reduce the percentage of women who smoke during pregnancy³
10.4%(2008)
10.6% (2012)
6.8% Not available
³ North Carolina implemented the revised U.S. Standard birth certificate in 2011. The methodology for collecting smoking data was modified, therefore values presented for
2011 are not comparable to prior years.

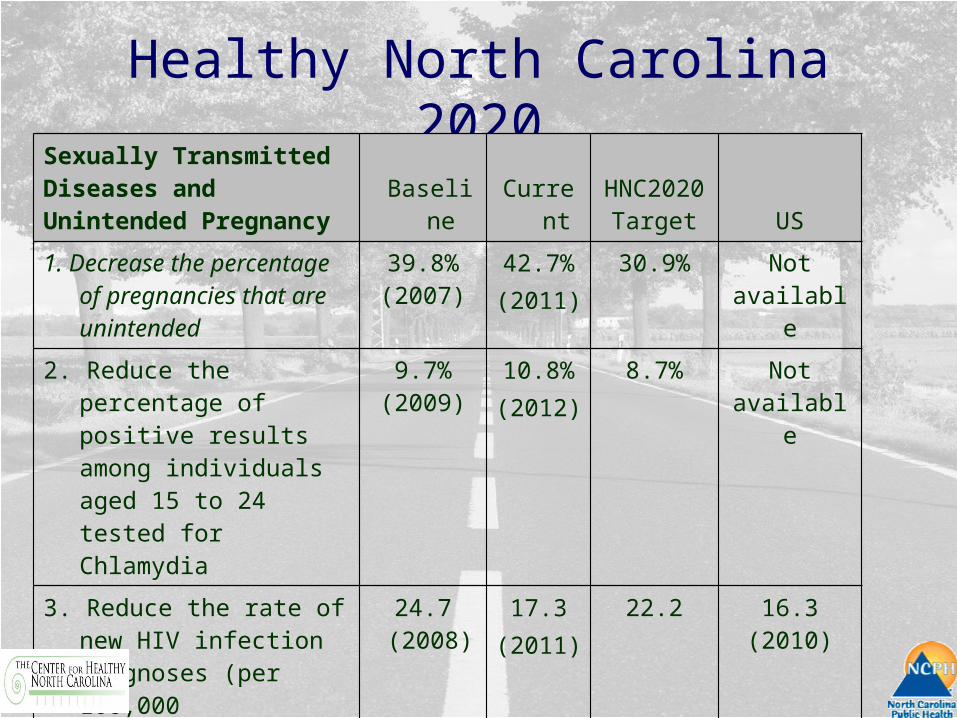
Healthy North Carolina 2020Sexually Transmitted Diseases andUnintended Pregnancy Baseline Current
HNC2020Target US
1. Decrease the percentage of pregnancies that are unintended
39.8%(2007)
42.7% (2011)
30.9% Not available
2. Reduce the percentage of positive results among individuals aged 15 to 24 tested for Chlamydia
9.7%(2009)
10.8% (2012)
8.7% Not available
3. Reduce the rate of new HIV infection diagnoses (per 100,000 population)
24.7 (2008)
17.3 (2011)
22.2 16.3(2010)

Healthy North Carolina 2020Substance Abuse Baseline Current
HNC2020 Target US
1. Reduce the percentage of high school students who had alcohol on one or more of the past 30 days
35.0%(2009)
34.3% (2011)
26.4% 38.7%(2011)
2. Reduce the percentage of traffic crashes that are alcohol-related
5.7%(2008)
5.3% (2012)
4.7% Not available
3. Reduce the percentage of individuals aged 12 years and older reporting any illicit drug use in the past 30 days
7.8%(2007-2008)
7.9% (2010-
11)
6.6% 8.8%(2010-2011)
* Data for this indicator is collected only in odd numbered years.
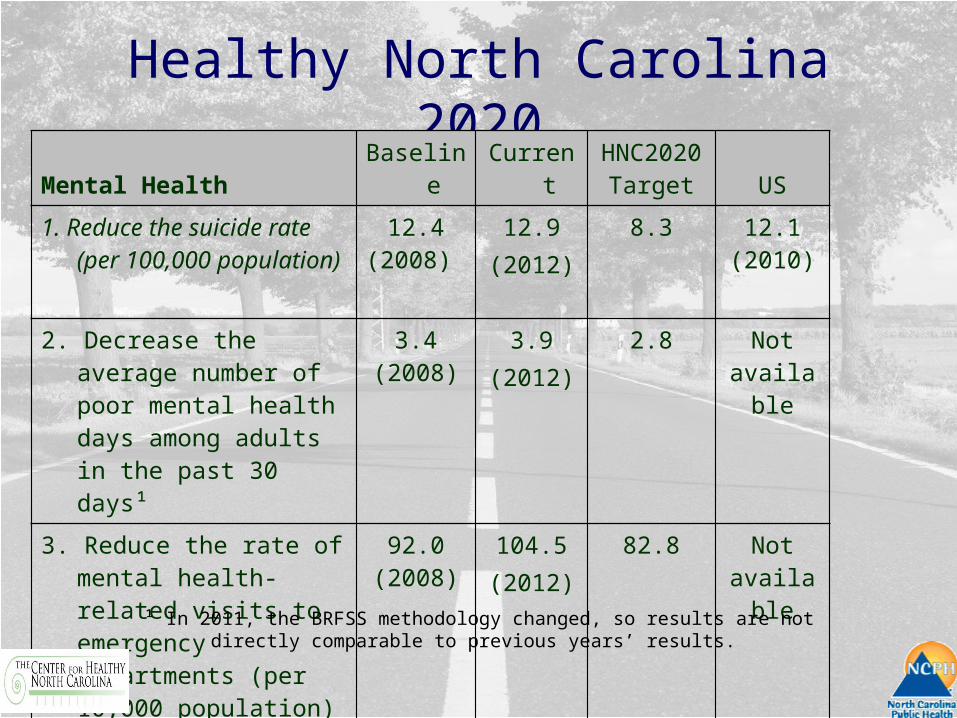
Healthy North Carolina 2020
Mental Health Baseline CurrentHNC2020
Target US
1. Reduce the suicide rate (per 100,000 population)
12.4(2008)
12.9 (2012)
8.3 12.1(2010)
2. Decrease the average number of poor mental health days among adults in the past 30 days¹
3.4(2008)
3.9 (2012)
2.8 Not available
3. Reduce the rate of mental health-related visits to emergency departments (per 10,000 population)
92.0(2008)
104.5 (2012)
82.8 Not available
¹ In 2011, the BRFSS methodology changed, so results are not directly comparable to previous years’ results.

Healthy North Carolina 2020Oral Health Baseline Current
HNC2020Target US
1. Increase the percentage of children aged 1-5 years enrolled in Medicaid who received any dental service during the previous 12 months
46.9% (2008)
57.3% (2012)
56.4% 40.3%(2011)
2. Decrease the average number of decayed, missing, or filled teeth among kindergartners
1.5(2008-2009)
1.5 (2009-
10)
1.1 Not available
3. Decrease the percentage of adults who have had permanent teeth removed due to tooth decay or gum disease
47.8% (2008)
48.3% (2012)
38.4% 43.6%(2010)

Healthy North Carolina 2020Environmental Health Baseline Current
HNC2020Target US
1. Increase the percentage of air monitor sites meeting the current ozone standard of 0.075 ppm
62.5%(2007-2009)
80.5% (2010-
12)
100% Not available
2. Increase the percentage of the population being served by community water systems (CWS) with no maximum contaminant level violations (among persons on CWS)
92.2%(2009)
97.4% (2012)
95.0% Not available
3. Reduce the mortality rate from work-related injuries (per 100,000 equivalent full time workers)
3.9 (2008)
3.7 (2011)
3.5 3.6%(2010)

Healthy North Carolina 2020Infectious DiseaseFoodborne Illness Baseline Current
HNC2020 Target US
1. Increase the percentage of children aged 19-35 months who receive the recommended vaccines
77.3%(2007)
76.2%(2012)
91.3% 77.0%(2011)
2. Reduce the pneumonia and influenza mortality rate (per 100,000 population)
19.5(2008)
19.6 (2012)
13.5 15.1(2010)
3. Decrease the average number of critical violations per restaurant/food stand
6.1(2009)
6.5 (2011)
5.5 Not available
**Data update not available

Healthy North Carolina 2020
Social Determinants of Health Baseline Current
HNC2020Target US
1. Decrease the percentage of individuals living in poverty
16.9%(2009)
17.2% (2012)
12.5% 15.0%(2011)
2. Increase the four-year high school graduation rate
71.8%(2008-9)
82.5% (2012-
13)
94.6% Not available
3. Decrease the percentage of people spending more than 30% of their income on rental housing
41.8%(2008)
44.8% (2012)
36.1% 49.3%(2011)

Healthy North Carolina 2020
Chronic Disease Baseline CurrentHNC2020
Target US
1. Reduce the cardiovascular disease mortality rate (per 100,000 population)
256.6(2008)
237.2 (2012)
161.5 234.2(2010)
2. Decrease the percentage of adults with diabetes¹
9.6%(2009)
10.4% (2012)
8.6% 9.5%(2011)
3. Reduce the colorectal cancer mortality rate (per 100,000 population)
15.7(2008)
15.1 (2012)
10.1 15.6(2010)
¹ In 2011, the BRFSS methodology changed, so results are not directly comparable to previous years’ results.

Healthy North Carolina 2020Cross-cutting Baseline Current
HNC2020Target US
1. Increase average life expectancy (years)
77.5 (2008)
78.2 (2012)
79.5 78.7(2010)
2. Increase the percentage of adults reporting good, very good, or excellent health¹
81.9%(2009)
80.7% (2012)
90.1% 83.1%(2011)
3. Reduce the percentage of non-elderly uninsured individuals (aged less than 65 years)
20.4%(2009)
18.9% (2011)
8.0% 17.9%(2011)
4. Increase the percentage of adults who are neither overweight nor obese¹
34.6%(2009)
34.2% (2012)
38.1% 36.3%(2011)
¹ In 2011, the BRFSS methodology changed, so results are not directly comparable to previous years’ results.


County Health Rankings: 2014North Carolina
1 Wake
2 Watauga
3 Orange
4 Union
5 Camden
6 Mecklenburg
7 Davie
8 Dare
9 Cabarrus
10 New Hanover
91 Bladen
92 Lenoir
93 Martin
94 Swain
95 Bertie
96 Vance
97 Robeson
98 Scotland
99 Halifax
100 Columbus
Source: County Health Rankings and Roadmaps, 2014. http://www.countyhealthrankings.org/

Healthy North Carolina 2020:Moving Forward
Where would we be if we met our HNC 2020 Goals?
Objective Current Ranking Rank if 2020 Goal Met
Diabetes Prevalence 33 13
Immunization Rates 22 1
High School Graduation 32 1
Adult Tobacco Use 33 13
Cardiovascular Mortality 32 3
Infant Mortality 40 25
The individual state’s ranking and score was determined for each of these measures using the 2013 America’s Health Rankings. The Healthy NC 2020 goal for each measure was then compared to the current ranking and a new ranking was determined based on the goal score.
Source: Personal email, Kelly Kimple, MD, MPH, UNC Preventive Medicine, Chief Resident, June 18, 2014.

Healthy North Carolina 2020:Moving Forward
• The Prevention Action Plan and the Healthy North Carolina 2020 objectives form the basis of a larger campaign to promote a “Better State of Health” in North Carolina.
• Community engagement• Locally implemented, community
appropriate, evidence based strategies
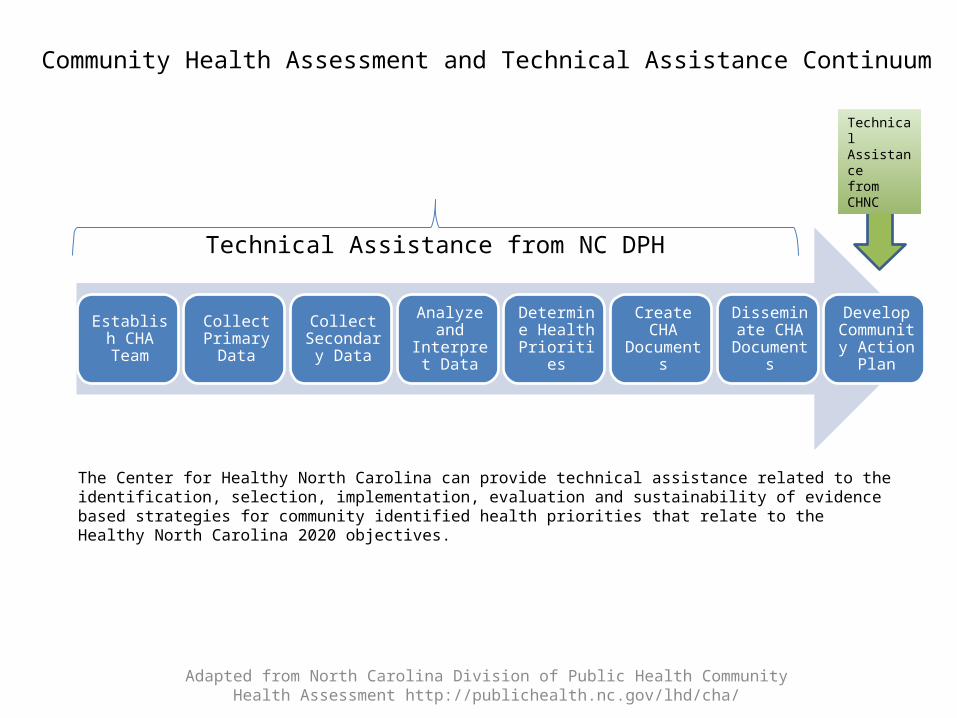
Establish CHA Team
Collect Primary
Data
Collect Secondary
Data
Analyze and Interpret
Data
Determine Health
Priorities
Create CHA Documents
Disseminate CHA
Documents
Develop Community Action Plan
The Center for Healthy North Carolina can provide technical assistance related to the identification, selection, implementation, evaluation and sustainability of evidence based strategies for community identified health priorities that relate to the Healthy North Carolina 2020 objectives.
Adapted from North Carolina Division of Public Health Community Health Assessment http://publichealth.nc.gov/lhd/cha/
Community Health Assessment and Technical Assistance Continuum
Technical Assistance from NC DPH
Technical Assistance from CHNC

Stage Ikey partners form
workgroup
Stage IIcommon priorities
formal commitment to action
Stage IIIstrategic plan
defined purpose/vision
Stage IVactive projects
established structure
Stage Vprojects maintained or
transitionedQI/Evaluation component
multiple sources of funding/support
CHAImplementation
plan with priorities
Identify & select EBS Implement & evaluate EBS
CoalitionDevelopment
PopulationHealthInitiatives
IMPROVED POPULATION HEALTH
Evaluation
Sustainability
Implementation
Technical Assistance
Action Plan
EBS Awareness

Healthy North Carolina 2020:The Campaign
• Working to improve individual, environmental and policy changes that will have a meaningful impact on health in NC
• Increase public awareness and community support
• Increase community capacity• Engage boards, organizations and
community groups
Healthy North Carolina 2020:What Can You Do Today?
• Sign the Resolution in Support of Making NC a Healthier State: http://www.publichealth.nc.gov/hnc2020/resolution.asp – Commit as an individual– Commit as an organization
• Ask for an HNC2020 presentation to your organization, board or community group

Credits/Thanks
• Thanks to the NC State Center for Health Statistics for providing the HNC2020 data
• Thanks to CHNC’s funder - The Duke Endowment
Healthy North Carolina 2020:How Can You Find Out More?
Visit the HNC2020 websitehttp://publichealth.nc.gov/hnc2020
Contact: Joanne Rinker 919-699-5886