job mobility in the european union: optimising its social ... mobility in europe.pdf · in the...
TRANSCRIPT

DANISHTECHNOLOGICAL INSTITUTE
Job Mobility in the European Union: Optimising its Social and Economic Benefits Final report
Policy and Business Analysis April 2008

2
Contents EXECUTIVE SUMMARY .............................................................................................................................................. 4
1. INTRODUCTION................................................................................................................................................. 10 1.1 CONTEXT AND SCOPE ..................................................................................................................................... 10 1.2 STRUCTURE OF THE REPORT ........................................................................................................................... 14
2. JOB MOBILITY IN EUROPE: EXTENT AND CAUSES ............................................................................... 15 2.1 DEFINITIONS AND INDICATORS OF LABOUR MOBILITY .................................................................................... 15 2.2 JOB-TO-JOB MOBILITY IN EUROPE .................................................................................................................. 20 2.3 OCCUPATIONAL MOBILITY ............................................................................................................................. 34 2.4 EMPLOYMENT MOBILITY ................................................................................................................................ 40 2.5 MULTIVARIATE ANALYSES ............................................................................................................................. 55 2.6 MOBILITY CLUSTERS AND EMPLOYMENT REGIMES IN EUROPE ....................................................................... 66 2.7 SUMMARY AND CONCLUSIONS ....................................................................................................................... 74
3. ECONOMIC AND SOCIAL EFFECTS OF JOB MOBILITY ........................................................................ 78 3.1 A FRAMEWORK FOR ANALYSING ECONOMIC AND SOCIAL EFFECTS OF JOB MOBILITY ..................................... 78 3.2 JOB MOBILITY AND ECONOMIC GROWTH......................................................................................................... 80 3.3 JOB MOBILITY AND GROWTH: CONCLUSIONS .................................................................................................. 93 3.4 JOB MOBILITY, THE QUALITY OF JOBS AND SOCIAL COHESION ........................................................................ 95 3.5 JOB MOBILITY, THE QUALITY OF JOBS AND SOCIAL COHESION: CONCLUSIONS.............................................. 104 3.6 MULTIVARIATE ANALYSES: BUILDING A COMPREHENSIVE MODEL ............................................................... 105 3.7 THE EFFECTS OF JOB MOBILITY: EVIDENCE AND IMPLICATIONS .................................................................... 108
4. OPTIMISING LEVELS OF JOB MOBILITY ................................................................................................ 111 4.1 OPTIMAL AND DESIRABLE LEVELS OF JOB MOBILITY: A TENTATIVE ANALYSIS ............................................. 111 4.2 TOWARDS ‘BALANCED JOB MOBILITY’: POLICIES, CHALLENGES AND OPTIONS ............................................. 121 4.3 OPTIONS AND CHALLENGES FOR THE EUROPEAN COMMISSION .................................................................... 124 4.4 OPTIONS AND CHALLENGES FOR THE SOCIAL PARTNERS.............................................................................. 125 4.5 CONCLUSIONS .............................................................................................................................................. 125
5. LITERATURE .................................................................................................................................................... 127
ANNEX 1: DESCRIPTION OF THE DATASETS ................................................................................................... 135 EUROBAROMETER 2005: SPECIAL FOCUS ON MOBILITY.............................................................................................. 135 EUROPEAN UNION LABOUR FORCE SURVEY (LFS) .................................................................................................... 136
ANNEX 2: MULTIVARIATE ANALYSES............................................................................................................... 140
ANNEX 3: DERIVED VARIABLES .......................................................................................................................... 152 LABOUR FORCE SURVEY ............................................................................................................................................ 152 EUROBAROMETER....................................................................................................................................................... 154 EU COMMUNITY STATISTICS ON INCOME AND LIVING CONDITIONS (EU-SILC)........................................................ 155
ANNEX 4: LIST OF FIGURES AND TABLES ........................................................................................................ 157

DANISHTECHNOLOGICAL INSTITUTE
The report was prepared under contract to the European Commission, Directorate General for Employment, Social Affairs and Equal Opportunities in response to tender no. VT/2006/043. The report was prepared by: Tine Andersen, Jens Henrik Haahr, Martin Eggert Hansen and Mikkel Holm-Pedersen, all of Danish Technological Institute, Centre for Policy and Business Analysis. Contributions to the study were made by: Jaap de Koning, SEOR; Nick Adnett, Staffordshire University Business School; Lasse S. Stambøl, Unit for Public Economics, Statistics Norway; and Michael Hout, University of California, Berkeley. The views expressed in the report are not necessarily those of the European Commission.
4
Executive summary The overall objective of this study is to inform the discussion in the European Union’s Member States on how to optimise job mobility in Europe from a social as well as from an economic perspective. Three other objectives have guided this study, with a view to achieving the overall objective: • To prepare and present a description of the current extent and character of job mobility in
Europe. • To examine ways to assess how much job mobility is desirable for European labour markets
from an economic and social point of view. • Taking these two analyses into account, to discuss how to optimise job mobility in
economic and social terms, taking into consideration both benefits and challenges in connection with increased job mobility.
Significant differences in job mobility across Member States Job mobility is a complex phenomenon, involving movements between employers (job-to-job mobility); between occupations and steps on the career ladder (occupational mobility); between different types of contracts; and in and out of employment (employment mobility). The analysis of the extent and character of job mobility in Europe highlights that levels of job mobility vary significantly between the EU Member States. Considering both movements in and out of the labour market and changes in type of employment relations, changes of job profile and job content, and change of employer, the highest levels of job mobility are found in the United Kingdom, Denmark, Sweden, Finland, the three Baltic states, and – to a smaller extent on some indicators – Ireland. Conversely, the relatively lowest levels of job mobility along all three dimensions are found in Central European new Member States (Poland, the Czech and Slovak Republics, Slovenia, to a smaller extent Hungary), in Continental European ‘old’ Member States (Germany, Belgium, Austria) and in Mediterranean countries (Italy, Greece, and to a smaller extent Spain and Cyprus). To a significant extent, these differences reflect the degree of external labour market flexibility, i.e. high levels of job mobility are generally found in employment regimes with relatively liberal EPL. On the other hand, regimes with stricter EPL tend to have medium to low levels of job mobility. Furthermore, job mobility in these regimes tends to be higher amongst unskilled segments of the labour market and upwards occupational mobility tends to be less frequent.
Also significant differences in mobility across sectors – but depending on the country Secondly, there are also clear differences in the levels of job mobility across economic sectors. At EU level, average job tenure is significantly higher in agriculture and public administration (15-16 years) than in sectors such as hotels and restaurants, wholesale trade and real estate services (6-8 years). However, differences between countries with respect to job mobility are, to a great extent, larger than differences between economic sectors. In addition, the significance

5
of the sector for job mobility varies across countries. For instance, the influence of sector on average job tenure is significantly higher in Greece, Portugal and Slovenia than in the Baltic countries, Denmark and the UK. This suggests that the overall extent of job mobility is the result of both country-specific and sector-specific characteristics, but also that country-specific characteristics are more signifi-cant. Multivariate analyses, adjusting for the significance of other variables, confirm that both sector- and country-specific characteristics have significance for job-to-job mobility and em-ployment mobility.
Age significant, gender not so significant Not surprisingly, there is a significant relation between age and job mobility, measured as share of employed persons who has experienced a job change during the past year. Overall, job mobility is highest for the age group 25-34 and also high for the age group 35-44. The differences between countries in this respect are relatively modest. For job-to-job mobility, multivariate analyses confirm the significance of age and the somewhat smaller significance of gender.
The economic effects of job mobility: too little and too much job mobility is detrimental Theoretical justifications and empirical evidence suggest that probably - and everything else being equal - there is an inverse U-shaped relationship between overall job mobility and economic growth, with very low levels as well as very high levels of job mobility being detrimental to economic growth. From a theoretical perspective, job mobility can contribute significantly to economic growth and development. Job mobility is a key aspect of the efficient allocation of productive resour-ces. Without job mobility, ongoing restructuring and development of enterprises is hampered. Without job mobility, the reallocation of resources from declining industries to growing industrial sectors is impeded, and this may again have negative implications for economic performance, and ultimately labour market performance. Conversely, job mobility can contri-bute significantly to innovation, particularly in knowledge-intensive sectors and when the mobility of knowledge workers is concerned, and there is solid empirical evidence supporting this claim. On the other hand, there are good arguments in support of the claim that high job mobility rates are connected with considerable transaction costs and sunk costs at the company level in the form of wasted investment in job-specific training. This may discourage companies from investing in competence development. There is empirical evidence that stable employment relationships and relatively long job tenures are positively correlated with productivity. There is some evidence that employing workers with 4-10 years of job tenure has the most beneficial effect on productivity, just as there is evidence that employing workers with very short or very long tenure will affect pro-ductivity negatively.
Factors affecting job mobility have wider implications These findings focus exclusively on the direct effects of job mobility on economic growth. However, factors which affect job mobility may also have other labour market effects. Average

6
job tenure has, in this connection, been found to correlate strongly and positively with the strictness of employment protection legislation. Moreover, there are both empirical evidence and theoretical arguments behind a claim that strict EPL by impeding mobility negatively affects employment prospects of those groups of the labour market that are most subject to problems when entering the labour market, such as young people, women and the long term-unemployed. Moreover, strict EPL tends to increase unemployment durations.
The challenge: a policy mix which facilitates job mobility for growth and high employment The challenge is to therefore arrive at a policy mix and an institutional set-up which facilitates both a level of job-mobility which is conducive of high productivity and rapid innovation, and high employment rates and low unemployment rates in the non-core labour force. This conclusion is particularly significant as there is strong evidence that voluntary and positi-vely motivated job mobility has much more beneficial effects at the individual level, both in terms of economic and social effects, than involuntary and negatively motivated job mobility. Voluntary and positively motivated job mobility is more likely to lead to wage gains and a positive career development than involuntary and negatively motivated job shifts, and is associated with a higher degree of job satisfaction. Long search durations and unemployment spells have lasting negative effects on career patterns and employment outcomes.
Not possible to specify context-independent optimal levels of job mobility Whereas it is possible to single out specific levels and types of job mobility that are more beneficial than others from an economic or a social perspective, it is not possible to define optimal levels of job mobility. This is so for both principal and practical reasons. An economically optimal level of job mobility from the perspective of society can be identified in principle, but the optimum level will be highly context-dependent and evidence for specifying optimal levels in practice is lacking. Socially optimal levels of job mobility are also highly context-dependent and dependent on individual preferences and life situations. Moreover, the relative priority accorded to economic values, such as wealth, and social values, such as social integration and social inclusion, cannot be decided without recourse to values. These values, in turn, cannot be derived from empirical analyses.
‘Balanced job mobility’: appropriate levels of job mobility coupled with high employment However, it can be argued that there is broad European consensus on key objectives for the European labour markets. High productivity, high levels of innovation, high economic growth, high levels of employment, low levels of unemployment, good quality jobs, and low levels of social exclusion can be seen as objectives which reflect this broad consensus. Taking into consideration available empirical evidence on the effects of job mobility, these objectives can be translated into a set of experimental job mobility and labour market performance indicators. The achievement of these targets is defined in the current study as ‘balanced job mobility’. Balanced job mobility is characterised by a combination of the following factors: Levels of job mobility that are conducive to growth and productivity; a high share of voluntary job shifts; a high share of employees in voluntary temporary employment;

7
and upward occupational mobility indicated by a high share of job shifts that require new or different skills.
Liberal and social democratic employment regimes are found to facilitate ‘balanced job mobility’ Countries with so-called Liberal or Social Democratic employment regimes tend to score highest in terms of ‘balanced job mobility’ as defined in this study. This concerns in particular the UK and Ireland, Denmark and Sweden, and Estonia, Latvia and Lithuania.
Flexicurity and ‘balanced job mobility’ The concept of ‘flexicurity’ (defined broadly as a combination of flexible contractual arrange-ments, effective active labour market policies, comprehensive lifelong learning policies and modern social security systems) is an important part of the EU’s policy agenda, and is also linked to the discussion on job mobility in Europe. However, flexicurity is a much wider concept than job mobility as it concerns not only labour market mechanisms but equally important, social protection and systems to ensure life long learning as a means to underpin employability. Hence, neither a high job mobility rate nor a high score on the index of balanced mobility can be taken as signs that a labour market is moving towards ‘more flexicurity’. For illustration, high job mobility rates may occur in very different labour market structures. It is possible to have a high job mobility rate in a dual labour market where only a core labour force enjoys high job security or employment security; but a high job mobility rate may also be found in a labour market characterised by very modest job protection and small unemployment benefits.
Why is it useful to consider balanced job mobility When job mobility is not an indicator of flexicurity, what is then the significance in policy terms of measures and comparisons of the different aspects of job mobility and of the balanced job mobility index? Whereas flexicurity provides a framework for understanding the interaction between policies, analyses of job mobility provide a more detailed look at the function and efficiency of specific labour markets. In brief, employment mobility measures describe the ability of the labour market to adapt to changing economic and technological conditions; job-to-job mobility describes whether employers and employees have the opportunities and freedom necessary to ensure that competences are brought to the most efficient use for firms and individuals; and occupational mobility describes the firms’ and individuals’ ability to create relevant careers inside companies. Overall, job mobility measures may be taken as one set of indicators of the ability of labour markets to contribute to the achievement of the renewed Lisbon goals.
What can Member States do? Review labour market regulation, promote growth Job mobility which stimulates productivity and growth is facilitated not only by the most appropriate types of labour market regulation, but also by the broader capacity of the economy to generate employment. Similarly, voluntary job mobility – which seems to be far more beneficial than involuntary job mobility from both a social and an economic perspective – is closely related to overall levels of employment and unemployment. In other words, good policies for ‘balanced job mobility’ are also good policies for employment and job creation.

8
Against this background, the following measures may help to move toward more "balanced job mobility" at a national level: • Overall economic policies should facilitate economic growth and job creation, as high
employment stimulates job mobility, and as high employment and low unemployment are objectives in their own right. The appropriate policy mix includes a macro-economic policy which ensures low and stable inflation, stabilises cyclical fluctuations and limits budget deficits; a non-distortionary tax system which encourages business and job creation (i.e. low labour taxes); policies that facilitate the functioning of capital and product markets and stimulate international trade; and growth-oriented public investments focusing on infrastructure, education and innovation.
• Regulatory labour market framework conditions should facilitate job creation and job
mobility and avoid the exclusion of specific groups from participation in the labour market. Specifically, this entails that countries with strict employment protection legislation should implement significant liberalisations. It should also be ensured that social protection, health care insurance and benefits and pensions should be independent of specific employment relationships and should be ‘portable’ from employer to employer.
• Public education and training policies (including lifelong learning policies) should focus on
maximising the general employability of the individual, as firm-specific skills, provided in the framework of public education programmes, tend to reduce voluntary job mobility. Public education and training policies should stimulate continued education and lifelong learning, in particular among low-educated groups. Public education and training policies should strengthen the efforts to reduce or as far as possible eliminate the group who leaves primary school with no further general or vocational education.
• Promoting internal flexibility (intra-firm flexibility) can be viewed as a supplementary
policy option. Under the right circumstances, internal flexibility, in the form of, for instance, flexible forms of work organisation and greater employee autonomy, can probably facilitate productivity and innovation in enterprises, and can thereby contribute to competitiveness and employment. Relying exclusively on the promotion of internal flexibility and leaving strict employment protection legislation in place will not, however, solve the unemployment problems of the non-core labour force associated with strict EPL.
What could the Commission do? Induce further reforms and monitor developments The European Commission has a continued important role to play in pushing for reforms in the Member States along these lines. In particular: • The Commission should uphold its focus on ensuring growth and employment-oriented
macroeconomic policies, competition policy, policies for research and innovation, educa-tion policy, and labour market policy in the EU Member States, such as it is currently done within the framework of the renewed Lisbon Strategy and the European Employment Strategy. It should also continue to stimulate and facilitate the debate with the EU Member States, social partners and other interested parties on flexible contractual arrangements within the overall flexicurity context.

9
• Existing initiatives to ensure transparency and permeability of educational systems and to support lifelong learning in the Member States (the implementation of European Qualifi-cations Framework in the Member States) should be given a high priority.
• The Commission should consider developing monitoring indicators for the European
Employment Strategy Guidelines, which focus on mobility in the labour markets. For example, labour market turnover, average job tenure or the share of (involuntary) non-permanent or part-time contracts could be used as relevant monitoring indicators for ‘balanced job mobility’.
• Given the change towards more transitional labour markets in Europe, statistics such as the
European Labour Force Survey could be reviewed in terms of obtaining reliable and comparable data on transitions in the labour market. Particularly, there are severe information gaps concerning occupational transitions and transitions between different employment statuses.

10
1. Introduction The present report presents the results of the study ‘Job mobility in the European Union: optimising its social and economic benefits’ (VT/2006/043). The assignment calls for the development of ways or methods that can support the assessment of whether a given level of mobility is optimal in a given national (economic and social) context or if another level of job mobility would bring about more benefits to society and to the economy. In the study, we relied upon data from statistical sources and analysed those data using theoretical propositions drawn from the current scholarly literature on mobility and related subjects. The report has been prepared by the Danish Technological Institute (Tine Andersen, Jens Henrik Haahr, Martin Eggert Hansen and Mikkel Holm-Pedersen) with contributions from Dr. Jaap de Koning and Kees Zandvliet, SEOR, NL; Prof. Michael Hout, University of Berkeley, CA; Prof. Nick Adnett, Staffordshire University; and Mr. Lasse Sigbjørn Stambøl, Statistics Norway.
1.1 Context and scope The present focus on mobility in labour markets is closely linked to the Lisbon goals which call for European governments to work to create ‘the most dynamic and competitive knowledge-based economy in the world’.
Context of the study In 2002, an action plan (European Commission 2002) for skills and mobility was drafted which focused on removing obstacles to labour market mobility. Lack of mobility was seen as a barrier for adapting to structural change. Statistical evidence pointed to a clear correlation between educational level and propensity to change job. Consequently, increased efforts towards education and lifelong learning were promoted as the main policy instrument to increase mobility. During the next few years, however, little progress was achieved towards the Lisbon goals and consequently new strategic options were being considered. Increasingly it was recognised that specific policy efforts played out very differently in the European countries and that this was partly due to differences in the specific configuration of policies in these countries. The increasing significance of the concept of job mobility The emphasis on mobility as one component of flexible labour markets is also evident in the European Employment Strategy. A number of the current Employment Guidelines (adopted in 2005) address the need to make labour markets more flexible and adaptable. Guideline 20 calls for improved matching of labour market needs through: • The modernisation and strengthening of labour market institutions, notably employment
services, also with a view to ensuring greater transparency of employment and training opportunities at national and European level,
• Removing obstacles to mobility for workers across Europe within the framework of the Treaties,
• Better anticipation of skill needs, labour market shortages and bottlenecks,

11
• Appropriate management of economic migration. In addition, Guidelines number 19 and 21 also address factors of vital importance to mobility. Guideline 19 aims to strengthen employability, and hence employment mobility, as it calls on Member States to ensure inclusive labour markets, enhance work attractiveness, and make work pay for job-seekers, including disadvantaged people, and the inactive through: • Active and preventive labour market measures (…), • Continual review of the incentives and disincentives resulting from the tax and benefit
systems (…), • Development of new sources of jobs in services to individuals and businesses, notably at
local level. Guideline 21 calls on Member States to promote flexibility (and hence occupational and job-to-job mobility) combined with employment security and to reduce labour market segmentation, among other things through: • The adaptation of employment legislation, reviewing where necessary the different
contractual and working time arrangements, • The promotion and dissemination of innovative and adaptable forms of work organisation
(…), • Support for transitions in occupational status, including training, self-employment, business
creation and geographic mobility. Job mobility and flexicurity As the guidelines quoted above suggest, policy focus has increasingly moved away from generic (labour market, social, economic) policy instruments towards a new perspective in which focus is more on specific forms of interaction between policies or ‘regimes’ with particular configurations of policies. This perspective is embodied in the debate on the ‘flexicurity’ approach. Flexicurity (a contraction of ‘flexibility’ and ‘security’) is a concept which has attracted much attention over the recent years1 as it seems in many ways to offer a policy configuration which seems highly appropriate to ensure progress towards the Lisbon goals. Referring to the 2007 Commission Communication on flexicurity2, flexicurity can be defined as an integrated strategy to enhance, at the same time, flexibility and security in the labour market. A flexicurity strategy comprises the following four components: 1. Flexible and reliable contractual arrangements (from the perspective of the employer and
the employee, of ''insiders'' and ''outsiders'') through modern labour laws, collective agreements and work organisation;
2. Comprehensive lifelong learning (LLL) strategies to ensure the continual adaptability and employability of workers, particularly the most vulnerable;
1 For an overview of the state of the debate in 2006, see e.g. the European Employment Observatory review, Autumn 2006. 2 EU Commission: Communication from the Commission to the European Parliament, the Council, the European Economic and Social Committee and the Committee of the Regions. Towards Common Principles of Flexicurity: More and better jobs through flexibility and security Brussels, 2007, COM(2007) 359 final.

12
3. Effective active labour market policies (ALMP) that help people cope with rapid change, reduce unemployment spells, and ease transitions to new jobs;
4. Modern social security systems that provide adequate income support to encourage employment and facilitate labour market mobility. This includes broad coverage of social protection provisions (unemployment benefits, pensions and healthcare) that help people combine work with private and family responsibilities such as childcare.
The efforts to increase mobility thus are strongly related to and interact with policies to increase flexicurity. The complex concept of job mobility Correlations between e.g. job tenure and long-term unemployment indicate that job mobility is one aspect of the ability of labour markets to successfully adapt to changes. What is less clear is the nature of that relationship. First, job mobility is not a very clear-cut concept. The term is used to characterise very different types of transitions in the course of individuals’ working life, i.e. between employers, between occupations and steps on the career ladder, between different types of contract and in and out of employment. Some of these transitions are voluntary and motivated by positive expectations – some are forced like redundancies or forced retirement. In addition, the mobility within an occupational group can be expected to be closely linked to the situation in a specific labour market, like when there is a scarcity of e.g. mechanical engineers causing employers to compete heavily for the best employees, making moves pay off for the engineers themselves in terms of wage rises with every move. Or, the contrary, when there is little demand for specific (maybe even obsolete) skills and people therefore cling to the job they have managed to get. Labour market regulations and active labour market policies may further serve to restrict or enhance mobility. Second, individual mobility is influenced by other factors than the nature of labour markets and of labour market policy. Individual characteristics like age or gender are known to play a strong role for individual’s propensity to move job. The age factor may go a long way to explain differences between populations and may also be a quite important factor to take into account in view of the ageing population of Europe. Gender-related differences in mobility may be caused by the different roles that men and women play in the family, and in particular by differences in the access to day-care facilities for children across Europe. A range of potential effects of job mobility The effects of transitions are not simple either. It is well-known that the more knowledge-intensive the industry, the longer time before the costs of introducing a new employee in a workplace are set off by the gain in terms of increased productivity due to the introduction of new competences. Hence, if a knowledge-intensive labour market becomes very mobile bordering at volatility, the effects may be that individuals gain, but at the expense of productivity in firms. Hence, it is clear that some instances of mobility advance the goals of a dynamic knowledge-based economy and some do not. Mobility that makes sense within a worker’s career is usually
13
very desirable. On the other hand, what may be characterised as mere ‘job churning’ ought to be avoided or at least minimised. Given this, the question of optimal levels of mobility needs to be rephrased to a question of how – in any given demographic, industrial and political context - to achieve the best possible balance between the positive and negative effects of mobility or, as it is put in OECD’s Employment Outlook 2004: How to instil labour market dynamism while also protecting workers against job and income loss? The answer to this question is not straightforward, but demands that we take a closer look at job mobility in Europe. How does job mobility vary according to age, sex, educational group, occupational status? How does job mobility affect individuals and hence society? And which institutions and policy instruments offer themselves as tools for creating the desired balance between the positive and negative effects of mobility. These are topics for the study at hand.
Job mobility – geographical mobility The present study focuses on job mobility – change of job, occupation or employment status - as distinct from geographical mobility – change of location. The concept of job mobility will be further unfolded in section 2.1 below. It will suffice for now to observe that an individual change of job, occupation or employment status – in or out of the labour market or between different jobs or employers – may or may not imply that the individual changes his or her location; the spatial aspect of mobility however is beyond the scope of the present study.
Geographical coverage of the study In order to provide a broad picture of the character, extent and distribution of job mobility, the study will provide a statistical overview which – to the extent that data is available – covers EU27 and which allows for quick and easy comparison between the countries on a number of variables. To the extent that analyses of job mobility in Europe are already available, they show considerable variation in the levels of job mobility across Europe. The 2005 Eurobarometer Survey (Vandenbrande 2006), for instance, showed that the share of the respondents who changed employers during the previous ten year period varied from approx. 34 % (Malta) to approx. 65 % (the UK); and also for shorter time horizons, the variation was considerable. Whereas this study does not intend to provide causal explanations of this variation, the differences in context are nevertheless of vital importance given that the overall objective of this study is to provide a firm empirical foundation for decision makers both at EU and national levels to select and prioritise policy instruments and institutional arrangements in order to optimise the levels of job mobility in Europe. Therefore, we will have to consider factors known or shown with a high degree of plausibility to impact on people’s propensity to change their job or occupation, including those that they do not themselves control. Once these factors are identified, it is possible to evaluate the efficiency of different policy mechanisms and instruments against the specific challenges both across Europe and in different national contexts. In order to illustrate the importance of different demographic, political, economic and institu-tional settings for job mobility, six countries have been selected to provide depth and

14
perspective to the analysis. They are Denmark, France, Germany, Poland, Italy, and the UK. Examples from these countries, and to a lesser extent, from the Baltic countries and the US, are used to illustrate important points and to provide background information. The case countries are selected because they are representative of different labour market policy regimes as well as different socio-economic contexts for job mobility.
1.2 Structure of the report In the next chapter we provide a descriptive overview over job mobility in Europe as well as an analysis of the factors affecting the extent and character of job mobility. The important distinction between employment mobility, job-to-job mobility and occupational mobility is introduced, and based on analyses of four different datasets (the European Labour Force Survey, the Eurobarometer Survey 2005, the European Community Household Panel, and the European Union Statistics on Income and Living Conditions) variations in job mobility across countries are analysed and the significance of key background variables (gender, age, education) is considered. Chapter 5 is dedicated to an analysis and discussion of the economic and social effects of job mobility. The analysis of different types of effects and of the available empirical evidence for them provides a relevant foundation for a discussion of desirable levels of job mobility. We present an analytical framework for studying the effects, a number of theoretically founded arguments are presented, and the available empirical evidence on the social and economic effects of job mobility is reviewed and analysed. Chapter 6 finally turns to the questions of desirable levels of job mobility and of how to optimise job mobility, i.e. which instruments and measures to enhance mobility can be identified in light of the preceding discussions and how do we evaluate their relevance? With a view to the current policy discussions of increased labour market flexibility in Europe, an important question concerns the feasibility of different approaches to promoting ‘optimum job mobility’.

15
2. Job mobility in Europe: extent and causes This chapter provides an overview over patterns of job mobility across Europe according to three dimensions of job mobility: job-to-job mobility, employment mobility, and occupational mobility. The overview draws on data from the European Labour Force Survey (LFS), from the European Community Household Panel (ECHP) and from The European Union Statistics on Income and Living Conditions (EU-SILC). Further, a number of analyses draw data from the Eurobarometer Survey 2005, which had a specific focus on mobility. First, in section 2.1, we discuss the definitions of labour mobility that are relevant for the present study and the advantages and disadvantages of specific indicators for measuring different types of job mobility. Second, in the subsequent sections 2.2, 2.3, and 2.4 respectively, we map and analyse the extent of job-to-job mobility, occupational mobility and employment mobility across European countries. Third, in section 2.5 we perform a multivariate analysis of the statistical relationship between the different types of mobility and a number of independent background variables, each of which will be described separately. Finally, in section 2.6, we analyse country variations concerning the degree and character of job mobility. On the basis of these variations, countries are clustered with respect to the three key dimensions of job mobility and the clustering of countries is discussed in the light of the ‘country effect’ identified in the multivariate analysis. Finally, the mobility clusters are transposed against employment regimes and flexicurity regimes as described by different authors and the differences are discussed.
2.1 Definitions and indicators of labour mobility The terms of reference call for the present study to focus on different dimensions of job mobility in the EU, i.e. mobility with the same employer (e.g. career advancement); occupational mobility; and job mobility proper (change of employer). The analysis is designed to allow for a comparative assessment of the degree of flexibility in European labour markets and the extent to which it is matched to security in terms of remaining and progressing in the labour market. This implies that the study is not limited to mobility between jobs and occupations in the labour market, but also analyses the transitions in and out of the labour market. As emphasised in a recent EU Commission Green Paper3, it is essential that policies in Europe aim to modernise EU labour markets so as to assist workers in making transitions from one labour market status to another, whether in the case of involuntary discontinuities (e.g. dismissal and unemployment) or voluntary discontinuities (e.g. in the case of education and training leave, caring responsibilities, career breaks, and parental leave). 3 Modernising labour law to meet the challenges of the 21st century’. Brussels, 22.11.2006 COM(2006) 708 final. GREEN PAPER

16
Following these requirements has led us to focus the study on the following dimensions of job mobility: • Job-to-job mobility, which is defined as change of employer • Occupational mobility, which is defined as change of occupational status e.g. change of job
profile and job content. • Employment mobility, which is defined as transitions between different labour market
states, especially the ease with which it is possible to move between employment states (employment, unemployment, self employment and inactivity) and between different contract types
The following sections will further discuss and elaborate these main definitions of mobility, drawing on typical definitions used in the literature.
Job-to-job mobility Job-to-job mobility denotes an individual’s move from one employer to another. From this simple starting point, however, many different perspectives and indicators of job-to-job mobility are applied in the literature. Current job mobility Current job mobility can be defined and measured as the share of the employed who have changed job recently, for example within the past year. Creating a time-series of such an indicator may provide a good comparison of job mobility across countries and changes over time. A methodological disadvantage of the indicator is that only a small fraction of a survey sample has experienced job change, therefore very detailed background characteristics cannot be explored. However, this is not deemed to be a problem in the analyses presented in this report, as overall annual job changes are in fact above LFS reliability limits. Another indicator for current job mobility is job tenure, which refers to the average job length people have been employed with their current employer. Job mobility in a life course perspective The life course perspective focus on an individual’s job mobility combined with employment mobility represented as a chain of events at different points in time starting the year he/she joined employment and counting the number of job changes and unemployment spells throughout his/her career. The life course perspective has been used in the Eurobarometer Study ‘Mobility in Europe 2005’ (European Foundation 2006). A methodological advantage of using a life course perspective instead of focusing only on current levels of mobility is that it creates a greater sample of job mobility events and provides a broader picture of the past patterns of mobility, covering a larger number of the employed. On the other hand, a life-course approach implies quite big differences by different age groups (age cohorts) who lived and worked in different historical environments. Consequently, to qualify results they must be broken down by age cohorts in the analysis (Macias 2006). Expected job mobility Whereas the above definitions concern past or ‘historic’ job mobility, expected mobility concerns motivations of the employed for changing jobs in the future. Expected job mobility has been used in the study ‘Voluntary and forced job mobility in Europe’ by the European Foundation in 2007. In this study, the respondents were asked whether or not they expect to

17
change employer in the next couple of years; if they did expect their next career move to be voluntary or forced; and why. An advantage of including analyses of the expected job mobility dimension is that it enables the identification of factors facilitating voluntary job mobility. An obvious drawback of the indicator is that mobility expectations do not necessarily translate into actual job mobility. Another indicator for expected mobility is included in the LFS. The survey asks whether the respondent is actively looking for another job. This indicator may be a more valid indicator for expected mobility, because it implies that the job seeking activities have begun. Forced versus voluntary job transitions When addressing the issue of job mobility, we consider it important to draw a distinction between voluntary and forced job transitions. In the study, we have sought to identify factors which enhance the share of voluntary job transitions as well as regulatory and structural factors which contribute to a reduction of the need of companies to lay off workers against their will. Voluntary transitions are the result of a decision process in which the worker assesses that the advantages of changing employer are greater than the disadvantages, whereas forced transitions are caused either by initiatives taken by the employer, by regulation or by the inability of the employee to cope with demands at work. Hence, forced transitions include labour market-related transitions (e.g. redundancy or expired contract), as well as health and age-related transitions. Voluntary transitions include those prompted by career choices (e.g. not liking the previous job, finding a better job or creating one’s own business), household-related transitions (e.g. taking up caring duties for children, elderly or other dependent people, and looking after the home), as well as a number of other types of transitions (e.g. pursuit of studies or training, the desire to stop working, or leaving the previous employer as a consequence of a geographical move). Indicators used in the study As described above, job-to-job mobility is a complex phenomenon which can be viewed from different perspectives. As each dimension has its limitations, we have adopted a complementary approach using the following indicators in the analysis of job-to-job mobility: • Current job mobility defined as the share of the employed who have changed job within
past year (Data source: EU-SILC); • Job tenure, which refers to the average job length people have been employed with their
current employer (Data sources: Eurobarometer Survey 2005, Labour Force Survey); • Average job duration, calculated as the average of individual job durations, i.e. the
duration of the labour market career of an individual divided by the number of jobs held by that person (Data source: Eurobarometer Survey 2005);
• Expected job mobility, which refers to the share of employed who actively look for another job or consider changing jobs in the future (Data sources: Labour Force Survey, European Foundation 2007);
• Share of forced versus voluntary job transitions (Data source: Eurobarometer 2005).
Occupational mobility Occupational mobility refers to individuals’ change of occupational status e.g. change of job profile and job content. The definition occupational mobility includes internal mobility, which

18
designates movements within a workplace and external occupational mobility, which designates movements between occupations and employers.4 Consequently, occupational mobility and job-to-job mobility are not mutually exclusive. Different definitions and perspectives of occupational mobility are found in the literature. Changes in job content ‘Change of occupational group’ measures occupational mobility as the rate of moves from one occupational group, defined by the ISCO-classification system to another in a given time spell (normally, one year). The magnitude of this rate is however heavily dependent not only upon the time-frame taken into consideration but also to a high degree on the precision with which individual occupations are classified and individual jobs are allocated to occupational groups. An illustrative example of how individuals may experience a big change and even a move up a career ladder without ever changing their ISCO-codes is the career university scholar whose title changes from ‘assistant’ to ‘associate professor’ and then to ‘full professor’. During these moves, however, the ISCO code remains the same, namely ISCO 2310: ‘College, university and higher education teaching professionals’. ‘Change of job title’ therefore presents itself as an alternative indicator of occupational mobility. However, there is a bias also connected with this indicator, as some countries and sectors employ more steep hierarchies of titles than others, and a person in such a country or sector will therefore seem to be more occupationally mobile than a person in a country or sector with a more flat hierarchy of titles. A way around the imprecision and ambiguity associated with ISCO codes and job titles is to look at the actual contents of the jobs. An upward move in the labour market is usually associated with moving towards a job which demands a broader range of skills, or conversely, more specialised skills, than the previous job. In order to capture this aspect, we have opted for ‘shifts in required skills between previous and current job’ as a proxy for changes in job profile and content. A drawback of the indicator is that it has a strong subjective element, as it relies on individual perceptions of skills and hierarchies of skills rather than on observable facts such as job title. While mobility entails a move, an individual’s competences may develop more or less within the frame of a given job and workplace depending on access to training, the employer’s willingness to invest in human resources, etc. With these caveats in mind, we still consider this indicator the most valid measure available. Work life mobility The increasing job mobility due to globalisation and employment flexibility lead proponents of the so-called ‘individualisation theory’ (see e.g. Beck 1992) to assume that people face similar global risks influencing their opportunities, regardless of which social class they were born into or belong to. These theorists assume that intensifying employment mobility weakens social inequalities and that social class tends to means less and less to people in their daily lives. Critics of these theories (e.g. Golthorpe 2002) argue, that social class persists, and that class membership has a strong and persistent impact on labour market prospects. The policy relevance of this research issue is obvious, as the Lisbon agenda gives high priority to decreasing the inequalities in social chances and life prospects across Europe. A key question
4 The distinction between internal and external mobility is applied in the Dutch study : Mobility into favourable jobs: Causes of external and internal labour mobility and its impact on changes in job characteristics. Maurice Gesthuizen, Jaco Dagevos, SCP 2005.

19
in this connection is whether or not people are able to move from their disadvantageous class position to a more rewarding one during their work career. This ‘work life mobility’ perspective is applied in the recent study based on the Eurobarometer Survey 2005, which examines the path leading from labour market entry to current class position, the so-called work life class mobility. The results of this analysis reveal that only about a fifth of the EU25 labour force has changed its class position by changing occupation. Indicators used in this study Based on the discussion above we will use the following indicators to analyse occupational mobility: • Occupational mobility measured as shifts in required skills. (Data source: Eurobarometer
2005). • Work life occupational category mobility, which refers to the path leading from labour
market entry to a current occupational class position. (Data source: Eurobarometer 2005).
Employment mobility A high level of workers’ mobility is an essential characteristic of ‘transitional labour markets’. The transitional labour market is an ideal typical labour market model often referred to in the context of innovative policy approaches. In a transitional labour market it is easy for employed persons to exchange one labour market position for another on a temporary basis. At certain stages in their career, people may choose to spend time with their families, re-enter education, or look for new employment opportunities. This is facilitated in a flexible labour market where workers can move more fluidly to positions that suit their aptitudes and circumstances and, according to the protagonists of the concept, lead to overall unemployment levels being reduced. Against this background it is relevant that the study include a mapping of employment mobility in Europe, looking particularly for the ease with which individuals are allowed to move temporarily between unemployment and employment and be reintegrated into the labour market following periods of unemployment, self-employment or childbirth. The study will focus on the following dimensions of employment mobility. Transitions between unemployment, employment and inactivity This dimension refers to the rate of mobility between employment, unemployment and inactivity. In order to analyse the rate of transition from one working status to another, individual movements between different positions in relation to the labour market are examined on the basis of current main status and main status the year before. This provides a measurement of mobility between employment, unemployment and inactivity. The study focuses on these indicators: • The overall extent of labour market transitions, measured as the share of the adult
population who had experienced labour market transitions within a given time-frame. This indicator may reflect the overall flexibility or ‘rigidity’ of a labour market.

20
• The efficiency of employment transitions. Everything equal the less the duration of the job search among the unemployed the lower the social and economic costs of the transitions in and out of the labour market. The longer the search for a new job due to unemployment, the greater the risk of long-term unemployment and social exclusion. Based on the LFS, the efficiency of a labour market’s transitions is measured as the share of the unemployed whose search for employment is less than 6 months.
Transitions between different types of contracts Temporary and part-time employment contracts may serve different purposes for individuals and for firms. Often, temporary or part-time employment is a stepping stone on the way to full employment. For some employees, part-time employment may serve to alleviate the balance between family needs and the need for an income. For companies in countries or sectors with strict job security regulation for permanent jobs, the use of temporary or part-time workers may deliver sought after flexibility. Consequently, in a transitional perspective it is also relevant to analyse the mobility between temporary/permanent or part-time/full-time employment contracts. The study focuses on these indicators: • The extent of mobility between temporary/permanent and part-time/full-time employment
contracts respectively. • The composition of transitions according to their relative distance to employment. This
analysis of the transitions views the labour market as a set of concentric circles according to the relative distance to employment. Hence, transitions within the labour force, i.e. between employment and unemployment and vice versa, represent the ’inner circle’ of employment mobility, while transitions between inactivity and the labour force represent the ’outer circle’ of the labour market.
2.2 Job-to-job mobility in Europe This section analyses the extent of job-to-job mobility in Europe based on the dimensions and indicators described in section 2.1 above. This part of the analysis draws data mainly from LFS and EU-SILC. These datasets provide particularly valuable insights into two important dimensions of job-to-job mobility, i.e. average tenure - the length of time that the respondents have been in their current job (LFS); and the share of persons who has experienced a change of job during the past year (EU-SILC). Tables are presented providing a comparative overview of the extent of job-to-job mobility in European countries followed by a multivariate analysis of factors explaining variations in job-to-job mobility across Europe.
Large variations in the extent of current job-to-job mobility across European countries A simple measure of current job-to-job mobility is the share of employed persons who have experienced a job change within a certain time frame. Based on EU-SILC data, Figure 2.1 below shows the share of employed persons who experienced a change of job during past year in 2005. The figure illustrates that there are large variations in the extent of job mobility across European countries. The EU average is 8.8%, which is exceeded considerably by the UK where 22.9% of the employed have experienced a change of job during past year. The shares are also relatively high in Denmark (11.5%), Hungary (11.5%), and Spain (10.6%), while the shares are lowest in Cyprus (5.8%), Finland (5.7%), and Greece (5.6%).

21
Figure 2.1: Share of employed persons who experienced a change of job during the past year by country, 2005
0% 5% 10% 15% 20% 25%
United Kingdom
Denmark
Hungary
Spain
Latvia
Slovak Rep.
Portugal
EU average*
Estonia
Luxembourg
Italy
Slovenia
Lithuania
The Netherlands
Belgium
France
Germany
Austria
Czech Rep.
Cyprus
Finland
Greece
Share of employed who experienced a change of job
Source: EU-SILC *: EU average: weighted average for the Member States for which data is available. However, Figure 2.1 has its limitations as it shows only the share of employed who have experienced a job change in only one year (2005). For a more long-term perspective, we will have to consider other indicators in addition to this one.
Average tenure ‘Average job tenure’ is defined as the amount of time a worker has spent working for the current employer, even if the person’s job within the firm has changed. Hence, average job tenure is an indicator of the stability of employment relationships.

22
Figure 2.2: Job tenure in Europe 2006
0
2
4
6
8
10
12
14
16
Greece
Portug
al
SloveniaIta
ly
BelgiumFranc
e
Poland
Luxe
mbourg
The N
etherlan
ds
Sweden
Austria
EU Average
German
y*
Cyprus
Finlan
d**Spa
inIre
land
Slovak R
ep.
Czech
Rep
.
Hungary
United King
dom
Denmark
Lithu
ania
Estonia
Latvi
a
Year
s
Average tenure EU average
Source: Labour Force Survey 2006 2nd quarter EU average: Weighted average for the Member States for which data is available. *: 2005 data The data on average job tenure displayed in Figure 2.2 points to an inverse relation between average tenure and current mobility. Countries with high levels of current job mobility (e.g. Denmark, the UK and the Baltic states) tend to be characterised by low average tenure (less than 8 years) while those with low levels of current mobility such as Greece, Portugal, and Slovenia also have high average job tenure (exceeding 12 years).
Average job tenure apparently quite stable over time With a view to the trends of globalisation, one might expect that the labour markets would become more dynamic and the relations between the employers and the employed less stable. Globalisation is generally assumed to bring about more flexible labour markets. As adjustment to shocks (for instance in relation to trade liberalisations) becomes more frequent, the labour force has to adapt more quickly and the employment relationship is said to become more volatile and short-term. For the future of work in an era of globalisation, the future of the employment relationship is relevant: Most observers see dramatic changes in the employment relationship, and some even see the end of (salaried) work (for example Rifkin & Heilbroner 1995). Indeed, the last 25 years has seen a rise in non-traditional work arrangements i.e. increase in the proportion of the labour force employed part-time, in shift-work, self-employed, and in the proportion of workers holding multiple jobs and casual/temporary jobs in Europe and North America. Consequently, we would expect to find a decrease in average job tenure when looking at this period. Figure 2.3: Development in average job tenure 1995 – 2006

23
0,0 2,0 4,0 6,0 8,0 10,0 12,0 14,0 16,0
Greece
Portugal
Slovenia
Italy
Belgium
France
Poland
Luxembourg
The Netherlands
Sweden
Austria
EU Average
Germany*
Cyprus
Finland**
Spain
Ireland
Slovak Rep.
Czech Rep.
Hungary
United Kingdom
Denmark
Lithuania
Estonia
Latvia
Average tenure in years
199520002006
Source: EU Labour Force Survey 1995-2006, 2nd quarter. EU average: weighted average for the Member States for which data is available.*: Data from 1997, 2002 and 2005 respectively. **: Data from 1995, 2002 and 2006 respectively. ***: Data from 1995, 2000 and 2005 respectively. Note: Data for some countries and years may be missing due to these countries not being included in the labour force Survey at that time. However, contrary to such expectations, time series data on the development of average job tenure in the period from 1992 to 2005 show that average tenure has been quite stable over time and that the average trend has actually been towards slightly increasing job tenure. Figure 2.3 illustrates the development in average tenure across Europe from 1995 to 2005. The figures indicate that job tenure has been relatively stable over time within each country, with changes in average tenure between 1995 and 2006 ranging from -2.2 years in Ireland to +2.1

24
years in the Netherlands. Furthermore, most country variations in job tenure over time are within the ±1.0 range, supporting the conclusion that the overall extent of job-to-job mobility has remained at a relatively stable level for the past 10 years. Temporary employment and agency work, United Kingdom, Italy, and Poland The extent of job-to-job mobility (the overall number of moves) does not tell us very much about the labour market unless we know how those moves are distributed among different segments of the population. To illustrate this, we have compared the situation concerning temporary work, and in particular temporary agency work, in different European countries. The share of the population in temporary employment influences the extent and nature of job-to-job mobility. Countries with a large share of temporary employment may display high levels of job-to-job mobility even if the average tenure in permanent employment is long. People in temporary employment are very mobile. However, this mobility will most often be sideways and employment and income security are frequently not present. There are large differences in the extent of temporary employment across Europe. In 2005, the share of the workforce who worked under temporary contracts was 5.5% (and decreasing) in the UK, 12.9% (and increasing) in Italy, and 26.2% (and increasing) in Poland. Further, the share of workers on temporary contracts who give the reason for working on a temporary contract as ‘forced’ varies considerably, from 25% in the UK to 51% in Poland and 65% in Italy. Temporary contracts may be concluded on an individual basis or through an agency. European countries have adopted different regulatory strategies towards temporary employment in the attempt to combine labour market flexibility offered by temporary employment with more security for the workforce. This is evident if, for example, we look at the differences in regulation of temporary agency work. The UK: The temp agency industry is largely unregulated. There are no limits on the length of temporary agency employment and only minimal restrictions on the circumstances under which TAW can be provided. Temp agency workers do however face problems related to their contractual status, as it is often not clear who their employer is and whether they are employed or self-employed. Moreover, they often do not qualify for basic employment rights because such rights are linked to length and continuity of employment. However, pay is the biggest area of complaint for temporary agency workers. The UK has introduced a National Minimum Wage, explicitly covering ‘workers’ (not just ‘employees’), which has addressed some of the most extreme cases of low pay. Italy: In Italy, temporary contracts (i.e. not only contracts concluded with temp agencies) may only be concluded in specific circumstances specified in a law, i.e. seasonal work; replacement of an absent employee; performance of specified tasks, at predetermined times, of an exceptional or occasional-nature; dockyard work. These rules had been supplemented by collective bargaining, which also allows hiring under a fixed-term contract for the long-term unemployed, young first-time jobseekers and workers registered on the availability-for-work list. Law No. 230/1962 also establishes that temporary employees on fixed-term contracts must be treated exactly the same as permanent employees in financial and regulatory terms, and that their employment could be extended only once, for a period not exceeding the term initially specified in the contract. Poland: The legislation regulating temp agencies in Poland is quite strict, which may account for the fact that only a small fraction of all temporary work (1% of the workforce) is provided through temp agencies. Temporary employment agencies operate on the basis of a law regarding promotion of employment and labour market institutions. The working conditions of temporary agency workers are strongly regulated. For instance, temporary workers may not be assigned to a position whose previous holder was made redundant during the preceding three months. There must be a formal contract specifying the type of work, the qualifications required, the anticipated duration of the placement, and the time and place of work, the remuneration the occupational health and safety

25
conditions. Overall, the temporary employee may not receive less favourable treatment as regards employment conditions and other aspects of their work than other employees retained by the user employee in the same, or a similar, capacity. These requirements may increase companies’ incentives to hire temporary workers directly without involving an agency.
Sources: European Foundation 2002, Chung 2005. How can the rise in the proportion of part-time, non-standard work arrangements be consistent with an apparently stable average tenure? One possible explanation is that the flexible, non-standard jobs complement standard jobs in dual labour markets, with firms using both permanent and flexible employment contracts. Hence, the increase in flexible, part-time jobs should not necessarily be taken to mean a general flexibilisation of labour markets or indeed an erosion of standard employment conditions. Doogan (2003) shows that over all the number of long-term jobs (those with more than 10 years of tenure) have grown more strongly than short-term jobs, and this is the case not only for full-time jobs but also for part-time jobs. Indeed, Doogan shows that the remarkable increase in part-time employment in Europe (from 14 percent of all jobs in the European Union in 1992 to 18 percent in 2002) is accompanied by a rapid rise in the share of long-term part-time employment (+10 years). Furthermore, many of the non-standard jobs are subsequently transformed into standard jobs. (Auer 2005). Another explanation for the stable level of average tenure may be that there is a very complex relationship between job tenure, the business cycle, employment growth, demographic factors, and firms’ hiring and firing policies. A study by Auer & Cazes (2000) indicates that job tenure and market conditions tend to be inversely related in industrialised countries; a booming economy induces workers to seek better jobs and actually reduces job tenure. Thus, the authors assert that in both the U.S. and in Europe, the recent decline in median job tenure reflects not the waning in the traditional employment relationship, but rather prosperous economic times. Another study (Picot et al. 2001) found that throughout the early and mid-1990s, quit and hiring rates have been depressed due to low GDP levels. During the late 1990s, while hiring driven by expansionary demand has increased, the hiring rate was still largely driven by replacement demand. Consequently, the low quit rate during the 1990s and the resulting lower labour mobility has resulted in rapidly rising job tenure among paid workers. An older study based on LFS (Belkhodja 1992) thus found that from 1977 to 1991, the average job tenure of paid workers increased by 10%, from 6.9 to 7.6 years. The principal factors responsible for this increase include the greater and, in particular, continuing presence of women in the labour market, the decrease in the number of young people in the population and the reduction in the number of workers with short tenure during the recessions of the early 1980s and 1990s. Among women, the increase in average tenure reflects their rising attachment to the labour market. Women have entered the workforce in large numbers in the last decades. On average, they are having fewer children, and those who have children return to work after a

26
relatively short maternity leave, so their average tenure is increasing. While average tenure is still higher among men than women, the gap between the genders has decreased.
The stable level of average tenure may conceal some diversity While the level of average tenure remains quite unchanged, many of the underlying elements that make it up have been subject to change reflecting certain segments and sectors of the labour market are affected differently. Bosch (2002) for example, shows that the most remarkable change that has occurred in the standard employment relationship is the increase in women’s participation and the parallel rise in part-time work. It has also been observed that in many countries an increase in shorter tenured jobs is often compensated by an increase in longer tenured jobs, pointing to continuing and possibly increasing segmentation, especially between younger and older workers. It seems that the level of tenure is highly related to age and that younger workers face systematically shorter employment spells. In 2001, average tenure was only two years for the 15 to 24 age group, but more than eight years for the 25 to 44 years old group and 17 years for those older than 45. (Peter Auer, 2005).
Average job duration While the share of employed having experienced job change during past year gives a simple, short-term indication of the extent of job-to-job mobility in a given year, average job duration is an indicator measuring job-to-job mobility in more ‘historic’, long-term view including the entire career of the employed. The average job duration is calculated by dividing the length of the labour market career by the number of jobs the individual has held.5
5 People who are out of employment are not taken into account when calculating the average job duration.

27
Figure 2.4: Average job duration by country, 2005
4
5
6
7
8
9
10
11
Portug
al
Slovak R
epub
lic
Austria
Malta
Slovenia
Belgium
Greece
Czech
Rep
ublic
Poland
German
yIta
ly
Luxe
mbourg
SpainIre
land
Hungary
Cypres
France
Estonia
Finlan
d
Sweden
Netherlan
ds
Lithu
aniaLa
tvia
UK
Denmark
Year
s
Average job duration EU25
Source: Eurobarometer 2005 EU average: weighted average for the Member States for which data is available. Due to this short term vs. long-term quality of the indicators, we should not expect a direct correspondence between them. Even though a country ranks high on mobility measured by the share of employed who have experienced a job change in a given year, the same country may rank lower on job mobility measured by average job duration, as this indicator draws on historic data covering a longer time span. This may explain that variations in the extent of job-to-job mobility measured by the share of employed who have experienced a job change, only partly corresponds with data on average job duration from Eurobarometer 2005, shown in Figure 2.4. For some countries, Denmark and the UK for example, we find good correspondence, as they rank high on both job-to-job mobility indicators, whereas Portugal, Spain, and the Slovak Republic rank very differently on the two indicators. Figure 2.5 shows that average job duration is lower than the EU25 average in a number of Northern European countries such as Denmark, the UK, the Netherlands, Finland, and Sweden. Average job duration is also below the EU average in the three Baltic countries. Portugal is found to have the highest average job duration, followed by Slovakia, Austria, Malta, and Slovenia.

28
Figure 2.5: Average job duration by tenure (years), 1995-2006
PL ITBE
LU
SIAT
DE
EU
NL
FRCYHU
UKLV
CZ
SKPT
GR
EE FI SE
IEES
DK
LT
4
5
6
7
8
9
10
11
12
5,0 6,0 7,0 8,0 9,0 10,0 11,0 12,0 13,0 14,0
Average tenure 1995-2006
Aver
age
job
dura
tion
2005
Source: Eurobarometer 2005 & EU Labour Force Survey 1995-2006, 2nd quarter. EU average: weighted average for the Member States for which data is available. This corresponds well with the results of the analysis of average job tenure and displays a similar picture: A group of countries characterised by lower average tenure and job duration (Denmark, United Kingdom, the Baltic countries); a second group of countries characterised by high average tenure and job duration (particularly Portugal, Greece, and the Slovak Republic); and the remaining countries occupying positions between those two extremes. Though job-to-job mobility is low in Portugal, Spain and Slovak Republic, measured by the ‘historic’ average job duration, the countries have relatively high shares of employed who have experienced job change in past year (2005). These differences between the low ‘historic’ mobility and the high ‘current’ mobility may indicate that these countries have been undergoing considerable changes in job-to-job mobility.
The higher the ‘past’ mobility – the higher future job mobility Whereas the indicators ‘average tenure’ and ‘average job duration’ concern past or ‘historic’ job mobility, future (or expected) mobility concerns the motivation of the employed for changing jobs in the future. An advantage of looking at expected job mobility is that it enables the identification of factors facilitating voluntary job mobility. A drawback is that mobility expectations do not necessarily translate into actual job mobility.

29
Figure 2.6: Share of employed persons looking for another job by country, 2000-2006
0% 2% 4% 6% 8% 10%
Denmark
Poland
Sweden
Lithuania
United Kingdom
Finland
Italy
Latvia
France
The Netherlands
Belgium
EU average*
Spain
Slovenia
Germany
Cyprus
Greece
Austria
Estonia
Luxembourg
Czech Rep.
Slovak Rep.
Portugal
Hungary
Share of employed looking for another job
200020032006
Source: Labour Force Survey 2000-2006 2nd quarter *: EU average: weighted average for the Member States for which data is available. Figure 2.6 displays the share of employed persons looking for a new job from 2000-2006. Again, it appears that there is a correlation between this indicator and other indicators of job mobility in the sense that the lower job tenure and the higher the actual job mobility, the more persons will be looking for jobs while still in employment: Countries with low job mobility

30
(high tenure) such as Portugal, Spain and Greece also have a relatively low share (mean between 1-2.7%) of the employed persons that are looking for another job. In contrast, countries with high mobility levels indicated by low average job tenure such as Denmark, Finland and Sweden have a higher share (mean between 6.0-8.2%) of employed actively looking for a new job. This indicates a certain path dependence regarding job mobility: Countries with high ‘past’ mobility, e.g. low average job duration and job tenure, also generate high future mobility. The relation between past and future mobility can be seen in Figure 2.7. Figure 2.7: Share of employed persons looking for another job by average job duration
ATLU SKPT
CZ
GR
SEFI
CYHU
FR
ESUK
DK
LV
EELT
NL
IT
PL
BE
SI
0,0%
1,0%
2,0%
3,0%
4,0%
5,0%
6,0%
7,0%
8,0%
9,0%
4,0 5,0 6,0 7,0 8,0 9,0 10,0 11,0 12,0
Average job duration 2005
Shar
e of
em
ploy
ed lo
okin
g fo
r an
othe
r jo
b 20
06
Source: Labour Force Survey 2000-2006 2nd quarter & Eurobarometer 2005 Plausible explanations for this may be found at system level as well as at individual level. The system-level explanation assumes that countries with high past mobility as well as future mobility have established legislation and institutional arrangements facilitating flexibility and job mobility in the labour market. This seems plausible, as we find the highest past as well as future mobility in those types of welfare states, which facilitate the highest levels of market flexibility; while modest job mobility is found in the welfare regimes with strict job protection. A good example of the system level-explanation is Denmark, where a flexible labour market is combined with generous financial support for unemployed people and where active labour market policies enhance the employability of those who do not immediately find a new job.

31
Denmark and the United States: Mobility and tenure Comparing job mobility in Denmark and the US, Eriksson and Westergaard-Nielsen (2007) find that worker mobility in Denmark is about as high as or even higher than in the highly fluid U.S. labour market. However, for both countries it is found that although labour turnover rates are high, a considerable portion of workers is in long-term employment relationships. The authors identify ten features of labour markets in Denmark which constitute the ‘Danish model’ and which contribute to this situation: (i) The high female labour force participation rate (among the highest in the world), (ii) A falling retirement age (iii) A very high replacement ratio of unemployment benefits for low-wage earners, (iv) The relatively widespread eligibility for unemployment benefit. (v) Voluntary membership of unemployment insurance funds. (vi) Wage bargaining that used to be highly centralised, but has gradually become more
decentralised. (vii) Trade union membership and the coverage of unions are both high by international
standards. (viii) Weak job protection for blue-collar workers and only a modest protection for white collar
workers. (ix) Indirect wage costs are internationally very low in Denmark, whereas the rate of direct
taxation of wage income is among the highest in the world. (x) Compared to many other countries, agreements between employers and trade unions
constitute a more important regulatory mechanism than legislation and government interventions.
At the individual level, studies indicate that everything being equal, people who have changed employers in the past will also be more likely to seek a new job in the future; and in addition: That people who have changed jobs voluntarily are more satisfied than are workers who haven’t changed their job. This is in line with the positive relationship which was observed between expected job mobility and the number of previous job changes. Conversely, we find low expected job mobility for workers with long job tenure, i.e. the longer the employment relationship, the more employees will be attached to the company by company-specific competencies or social networks. In sum, this may imply that at individual level, job mobility involves a circular and self-enforcing element, and that job mobility behaviour can be learned, in the sense that people tend to lose their fear of changing jobs in the future when they have experienced job changes in the past (Vandenbrande et. al. 2006). Besides this basic pattern, other factors at individual level influence the propensity to be looking for a new job at individual level. Especially age and educational levels are decisive factors. The younger people are, the more they voluntarily change employer; and conversely the older they become, the less inclined they are to do so. Findings by Topel and Ward (1992) confirms this pattern and indicate that for young men, two thirds of their total lifetime job mobility and 66% of their lifetime wage growth occurs within the first 10 years of their career. The higher the educational level, the more likely people are to change employer voluntarily, which may be explained by higher applicable human capital increasing their job opportunities outside their current organisation. However, this depends on to which extent the skills of the employee are firm-specific or general/occupation-specific. Firm-specific skills has been shown to reduce voluntary job mobility by making the employer less inclined to lay off the worker and
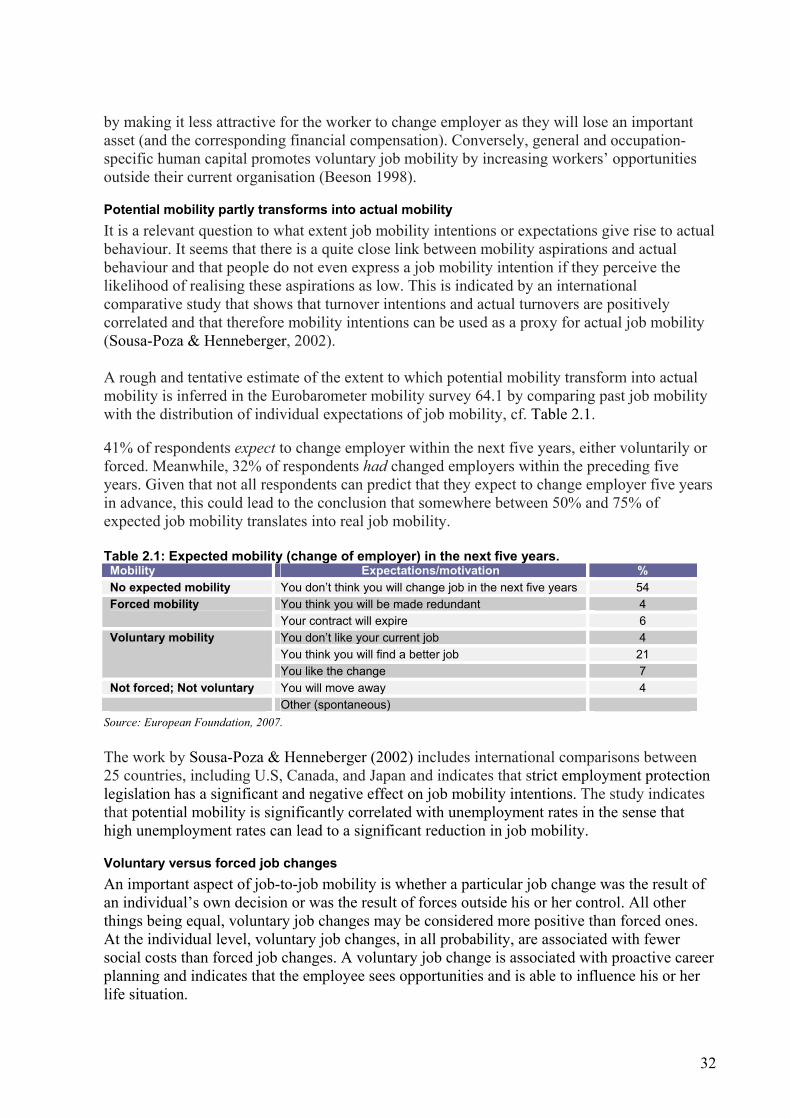
32
by making it less attractive for the worker to change employer as they will lose an important asset (and the corresponding financial compensation). Conversely, general and occupation-specific human capital promotes voluntary job mobility by increasing workers’ opportunities outside their current organisation (Beeson 1998).
Potential mobility partly transforms into actual mobility It is a relevant question to what extent job mobility intentions or expectations give rise to actual behaviour. It seems that there is a quite close link between mobility aspirations and actual behaviour and that people do not even express a job mobility intention if they perceive the likelihood of realising these aspirations as low. This is indicated by an international comparative study that shows that turnover intentions and actual turnovers are positively correlated and that therefore mobility intentions can be used as a proxy for actual job mobility (Sousa-Poza & Henneberger, 2002). A rough and tentative estimate of the extent to which potential mobility transform into actual mobility is inferred in the Eurobarometer mobility survey 64.1 by comparing past job mobility with the distribution of individual expectations of job mobility, cf. Table 2.1. 41% of respondents expect to change employer within the next five years, either voluntarily or forced. Meanwhile, 32% of respondents had changed employers within the preceding five years. Given that not all respondents can predict that they expect to change employer five years in advance, this could lead to the conclusion that somewhere between 50% and 75% of expected job mobility translates into real job mobility. Table 2.1: Expected mobility (change of employer) in the next five years. Mobility Expectations/motivation % No expected mobility You don’t think you will change job in the next five years 54
You think you will be made redundant 4 Forced mobility Your contract will expire 6 You don’t like your current job 4 You think you will find a better job 21
Voluntary mobility
You like the change 7 Not forced; Not voluntary You will move away 4 Other (spontaneous)
Source: European Foundation, 2007. The work by Sousa-Poza & Henneberger (2002) includes international comparisons between 25 countries, including U.S, Canada, and Japan and indicates that strict employment protection legislation has a significant and negative effect on job mobility intentions. The study indicates that potential mobility is significantly correlated with unemployment rates in the sense that high unemployment rates can lead to a significant reduction in job mobility.
Voluntary versus forced job changes An important aspect of job-to-job mobility is whether a particular job change was the result of an individual’s own decision or was the result of forces outside his or her control. All other things being equal, voluntary job changes may be considered more positive than forced ones. At the individual level, voluntary job changes, in all probability, are associated with fewer social costs than forced job changes. A voluntary job change is associated with proactive career planning and indicates that the employee sees opportunities and is able to influence his or her life situation.

33
At the level of society, a high share of voluntary job changes reflects a well-functioning labour market in which employees change jobs according to their own free will. Conversely, a high percentage of forced job changes may reflect a labour market where employees have fewer opportunities because they have stayed too long in jobs that have become unprofitable and have made their skills obsolete. These hypotheses will be subject to further analysis in chapter 3 below. Figure 2.8 provides an overview of the distribution of forced and voluntary labour market transitions among people who left their previous employer within the period 2000-2005..6 Figure 2.8: Levels of forced and voluntary mobility within the last 5 years across Europe
0%
5%
10%
15%
20%
25%
Malta
Italy
Poland
Greece
Austria
Slovenia
Portug
al
Luxe
mbourg
Cyprus
Belgium
Slovak R
epub
lic
Czech
Rep
ublic
German
yEU25
Spain
Hungary
Lithu
ania
Irelan
d
Estonia
Netherlan
ds
Finlan
d
France
SwedenLa
tvia
UK
Denmark
Peop
le a
ged
15+
(%)
Forced Voluntary
Source: Eurobarometer 2005 EU average: weighted average for the Member States for which data is available. Note: Forced transitions include labour market-related transitions (e.g. redundancy or expired contract), as well as health and age-related transitions. Voluntary transitions include those prompted by career choices (e.g. not liking the previous job, finding a better job or creating one’s own business), household-related transitions (e.g. taking up caring duties for children, elderly or other dependent people, and looking after the home), as well as a number of other types of transitions (e.g. pursuit of studies or training, the desire to stop working, or leaving the previous employer as a consequence of a geographical move). Not all transitions are forced or voluntary, however. Retirement is a cause for transition which is structural in the sense that it is triggered by age and can be experienced by individuals as either voluntary or forced depending on individual factors such as health, job satisfaction, life interests etc.
6 The overview is based on data from the Eurobarometer 2005 survey. The possible causes that respondents have given in the Eurobarometer Survey for leaving their previous employer have been re-coded so as to be mutually exclusive according to the distinction in the bulleted list above. Transitions are hence assigned to one and one only of the categories ‘Voluntary’, ‘Forced’, or ‘Retirement/other reason’.
34
Great variations in voluntary versus forced job changes across Europe The majority of the labour force – 81.1% of the labour force in Europe - did not change employment status within the 5-year period. 6.6% of the European labour force was forced to leave their previous employer while 8.5% of the European labour force changed employment status by their own choice. 3.9% of the European labour force left their previous employer because of retirement or gave no or other reasons for their transition. The proportion of forced to voluntary transitions varies quite considerably over the EU. The country with the highest share of forced transitions (≈ 10%) is France. At the other end of the scale, Malta has a very low overall level of transitions and no forced transitions at all, while the share of forced transitions in Cyprus and Italy was around 2.5 %.
2.3 Occupational mobility This section analyses the extent of occupational mobility, defined as individuals’ change of occupational status (e.g. job profile as well as job content). Hence, occupational mobility may include movements from one employer to another as well as movements within the same workplace.
Upward and downward occupational mobility in Europe Increasing the occupational mobility and skills development of the workforce are key political priorities. The EU has traditionally been characterised by low levels of occupational mobility and labour turnover compared to liberal economies such as the US. Yet in an increasingly knowledge-based, service-sector economy in the EU, occupational mobility is essential for adapting to structural change. Hence, efforts are made to raise participation in continuing training and to ensure access for all to training throughout their working lives.7 Against this background, it is clear that occupational mobility is related to, and can be measured by, the skills requirements of job compared to the previous job. Thus, upward occupational mobility entails that the new job requires more or different skills than the previous job, assuming that the higher skills requirement are reflected in higher pay and extended responsibilities. Conversely, a job change involving fewer skills is regarded as downward occupational mobility. A job change involving the same extent of skills, but of a different nature may also be assumed to represent accumulation of human capital and typically result in higher wages. Figure 2.9 shows the extent and direction of occupational mobility in the Member States. To estimate the extent of internal and external occupational mobility, individuals are grouped as to whether they have stayed with the same employer since labour market entry or changed job once or more times. The countries are ranked according to the share of workers who have changed employers. Hence, as this share reflects the level of job mobility, countries with high mobility levels such as Denmark, Estonia, Sweden and the UK are found at the top of the list. In general, upward occupational mobility is highest in countries with a high share of workers having changed employers once or more. In other words, higher rates of job mobility are associated with higher rates of upward occupational mobility. 7 Communication from the Commission, Commission's Action Plan for skills and mobility, COM(2002)72 final, Brussels 13 February 2002.

35
Figure 2.9: Hierarchical occupational mobility (based on skills requirements)
0% 20% 40% 60% 80% 100%
Denmark
Estonia
Sweden
United Kingdom
Finland
Lithuania
Latvia
The Netherlands
Hungary
Cyprus
France
Czech Rep.
EU average
Ireland
Luxembourg
Germany
Portugal
Spain
Poland
Belgium
Austria
Slovak Rep.
Slovenia
Greece
Italy
Malta
No change of employer, NomobilityNo change of employer, UpwardmobilityNo change of employer,Downward mobilityChanged employer, No mobility
Changed employer, UpwardmobilityChanged employer, Downwardmobility
Source: Eurobarometer 2005 *: EU average: weighted average for the Member States for which data are available. In Denmark, for example, the total share of workers having moved upward is 72.4% (67.8 experienced an upward move connected to a change of jobs while 4.6% moved up within the organisation). This is about the same level as other countries with high levels of job mobility such as Estonia (73.3%), Sweden (69.5%), and the UK (72.2%). In contrast, the upward mobility is lower in countries such as Greece (47%), Spain (45.8%), Portugal (57%), and Austria (60.3%). However, there are also exceptions to this pattern, as some countries with

36
moderate job mobility such as Slovenia and the Slovak Republic have relatively high shares of internal occupational mobility (19.4-22%). On the other hand, the figures should not lead us to conclude that all job mobility entails beneficial occupational mobility. On the contrary, since almost none of the workers who have never changed employers have experienced downward occupational mobility, while this is the case for some of the workers (typically 2-5%) who have changed employers once or more. Overall, however, the data indicate that segments of the workforce in almost all European countries inhabit a vulnerable position and face downward occupational mobility in the case of job changes.
Occupational class mobility An alternative perspective on occupational mobility is work life occupational class mobility, which measures occupational mobility as changes between hierarchically ranked classes of occupation. According to Goldthorpe (2002), although job mobility is undoubtedly higher now than it was before, work life mobility across occupational classes might be decreasing. He argues that new inequalities may be generated by a growing level of employment flexibility, and that the ‘old’ concept of occupational class, which is based on the differentiation of employment relations, still seems to be of importance. More recently, Bukodi and Róbert (2007) have used the Eurobarometer dataset to analyse differences in occupational class mobility across Europe. Based on the Eurobarometer Survey 64.1 and the analysis of Eurobarometer data by Bukodi and Róbert (2007) respondents are grouped into the following occupational classes (1 is the highest occupational class).
Table 2.2: Occupational Classes
Occupational classes 1 2 3 4 5 6 7
Upper salaried (Senior managers)
Lower salaried (Professionals)
Routine non-manual (clerical workers)
Routine service (service workers and salespersons)
Self-employed
Skilled worker
Unskilled worker
Figure 2.10 below illustrates the extent of occupational class mobility across countries. Upward mobility implies that the workers' current occupational class is higher than their occupational class at labour market entry. Also in this figure, countries are ranked according to the share having changed employers once or more, placing countries with high levels of job mobility such as Denmark, Estonia, Sweden, and the UK at the bottom of the graph. As the statistics demonstrate, countries with high levels of job mobility have the highest shares of workers having experienced upward occupational class mobility, cf. also Bukodi and Róbert (2007). Upward occupational class mobility is high in Denmark and, in particular, Sweden, where 37.7% experienced upward mobility when comparing their current job with their first job. Both

37
countries are characterised by relatively weak employment protection legislation and very active labour market policies, which may contributes to the high rates of upward class mobility. Figure 2.10: Occupational class mobility
0% 20% 40% 60% 80% 100%
Denmark
Estonia
Sweden
United Kingdom
Finland
Lithuania
Latvia
The Netherlands
Hungary
Cyprus
France
Czech Rep.
EU average
Ireland
Luxembourg
Germany
Portugal
Spain
Poland
Belgium
Austria
Slovak Rep.
Slovenia
Greece
Italy
Malta
No change of employer, NomobilityNo change of employer, UpwardmobilityNo change of employer,Downward mobilityChanged employer, No mobility
Changed employer, UpwardmobilityChanged employer, Downwardmobility
Source: Eurobarometer 2005 *: EU average: weighted average for the Member States for which data are available.

38
The role of different education systems – Germany and France The nature of qualifications and competences achieved in a country’s educational system may influence mobility. In the German educational system, the extent of vocational specificity is high. Here, certificates set a strong informal signal for employers, and the recruitment to positions takes place directly. Job assignments can be done rapidly and might be stable, because employers are less likely to change their minds later on. In the case of a high degree of vocational specificity, the match between the qualification and the labour market entry occupation is rather strong, decreasing the chance and the risk of subsequent occupational mobility during the life course. In France, the vocational specificity is lower, rendering the adequate matching of jobs and workers more difficult, resulting in a longer searching time for the first job and, probably, higher occupational mobility rates. Source: Bukodi and Róbert, 2007.
Mediterranean countries such as Spain, Portugal, and Greece display another combination of higher upward occupational mobility and low job mobility. This may be due to the relatively strict EPL and the lack of occupational specificity of the educational system. Hence, the first positions in the labour market seem to be very stable in these countries, but if the job is changed at all, the extent of the upward move tends to be substantial. There are, however, some differences in the extent of job stability exist between the countries with a family-oriented, insider-protected employment regime. In Spain, for instance, the number of persons who experienced job and occupational category mobility is higher than in Italy or Portugal. This might be due to the fact that Spain is among the European countries with the highest incidence of flexible, temporary jobs which may be either a ‘stepping stone’ to a better work position or a ‘trap’ state to an even worse occupational standing at an early stage of their working careers (European Foundation, 2007). Figures Figure 2.11 and Figure 2.12 below shows the relationship between different indicators of occupational mobility and information concerning employment protection legislation (EPL). The analyses show a mixed picture. On the one hand, countries with weak employment protection legislation exhibit high upward mobility rates measured by changes in skills requirements. In the UK for instance, where EPL is very weak, 72.2% have experienced upward mobility based on skills requirements. Thus, weak EPL combines with a labour market policy giving little priority to training instruments and low occupational specificity of the educational system to a situation where entrants into the labour market are granted, on average, a relatively rapid labour market entry but at the same time face a relatively unstable early career. The quality of occupational match is therefore low, and positions at the beginning of a work career are transitory in their character, resulting in a rather high occupational mobility in the subsequent phases of employment trajectories. (For the UK, see Scherer, 2005; for Estonia see Kogan and Unt, 2005). On the other hand, when occupational mobility is measured as changes in occupational class as in Figure 2.12, the relationship with EPL strictness is considerably weaker or non-existent, hence indicating that the relationship between EPL and occupational mobility is quite complex.

39
Figure 2.11: Occupational mobility based on skills requirements by strictness of EPL
PT
SK SE
AT
BE
CZ
FR
GR
IE
UK
ES
PL
FIDK
DEIT
NL
0%
10%
20%
30%
40%
50%
60%
70%
80%
90%
0,00 0,50 1,00 1,50 2,00 2,50 3,00 3,50 4,00
EPL (overall) 2003
Upw
ard
mob
ility
200
5 (b
ased
on
skill
s re
quir
emen
ts)
Source: Eurobarometer 2005 & OECD Figure 2.12: Occupational class mobility by strictness of EPL
PT
SK
SE
AT BECZ
FRGR
IE
UK
ES
PL
FI
DK
DE
IT NL
0
0
0
0
0
0
0
0
0
0,00 0,50 1,00 1,50 2,00 2,50 3,00 3,50 4,00
EPL (overall) 2003
Upw
ard
clas
s m
obili
ty 2
005
Source: Eurobarometer 2005 & OECD

40
2.4 Employment mobility Employment mobility is defined as the rate of transition from one employment status to another. This aspect covers movements in and out of the labour market as well as between different types of employment contracts (i.e. permanent or temporary employment and part-time/fulltime employment). The need to promote flexibility combined with security is stressed in the report of the Employment Taskforce chaired by Wim Kok (the Employment Taskforce 2003). The report states that the dynamic combination of flexibility and security is needed to capture the increasingly transitional nature of today’s labour markets, where security does not necessarily concern preserving a job for life, but rather preserving people’s ability to remain and progress in the labour market. This discourse is reflected and strengthened in the present efforts towards flexicurity across Europe, indicating that there is an increasing awareness of the need to take into account interaction and synergies the economy, the labour market, social protection, and life long learning. Likewise, job mobility is closely linked in with employment mobility. On this background, a key issue of this chapter will be the transitions between different employment states and the job retention of the workforce.
The broad picture: Transitions in the labour market ‘Labour market transitions’ is a broader concept than employment mobility, because in addition to movements in and out of the labour market and between different employment statuses, it also includes job-to-job movements in the labour market regardless of whether or not they involve a change of employment status. Hence, the concept describes in a sense the overall number of movements of people in the labour market outside the individual company. This measure of mobility was used in the 2005 Eurobarometer survey, in which respondents8 were asked about their present employment status (self employed, employed, not working). They were also asked in which year they left their previous employer (regardless of how far back this date was). These questions together with a number of background variables provide the basis for calculating indications of labour market transitions. Figure 2.13 below shows that employment mobility, measured as the extent of labour market transitions, varies considerably across Europe. Almost 30% of the adult population had experienced one or another form of employment transition in Denmark and the UK in the five years leading up to 2005, whereas the same can be said of only 5 % of the adult population in Malta.9
8 Respondents were adults aged >15 years old. Sample size was 1000 persons in most countries excluding Malta, Luxembourg and Cyprus, where sample size was only 500 persons.

41
Figure 2.13: The share of the adult population who had experienced labour market transitions in the 5 years leading up to 2005
0%
5%
10%
15%
20%
25%
30%
Denmark UK
Estonia
SwedenLa
tvia
Finlan
d
Hungary
Netherlan
ds
FranceIre
land
Lithu
ania
German
y
Cyprus
Spain
Czech
Rep
ublic
Belgium
Slovak R
epub
lic
Luxe
mbourg
Greece
Portug
al
Austria
Poland
Slovenia Ita
lyMalt
a
Peop
le a
ged
15+
(%)
Mobile within the last 5 years EU25
Source: Eurobarometer 2005 EU average: weighted average for the Member States for which data is available. A main factor which contributes to explaining the very different levels of labour market transitions across Europe is labour market performance as measured by the employment rate and the long-term unemployment rate. Countries with high levels of employment mobility (e.g. level of labour market transitions) generally have high employment rates and low long-term unemployment rates. This is illustrated in Figure 2.14 and Figure 2.15 below which show the relationship between total number of transitions in a country and the employment rate (Figure 2.14) and long-term unemployment rate (Figure 2.15). We find employment rates above EU average (63.8%) in highly mobile countries such as Denmark (employment rate 75.9%), the UK (71.7%), Estonia (64.4%) and Sweden (72.5%), while they are much lower in countries such as Malta (53.9%), Italy (57.6%) and Poland (52.8%). Accordingly, the rates of long-term unemployment are below EU-average (4.1%) in high mobility countries such as Denmark (1.1%), the UK (1%), and Sweden (1.2%) while higher in countries with low employment mobility such as Poland (10.2%), Greece (5.1%), and Slovakia (11.7%).

42
Figure 2.14: Labour market transitions by employment rate, 2005
NLIE
DE
CZLU
BE
FRHU
SK
GR
SIPLIT
SE
UKDK
FI
ATPT
0,0%
5,0%
10,0%
15,0%
20,0%
25,0%
30,0%
40,0% 45,0% 50,0% 55,0% 60,0% 65,0% 70,0% 75,0% 80,0%
Employment rate
Mob
ile w
ithin
the
last
5 y
ears
Source: Eurobarometer 2005 & OECD Figure 2.15: Labour market transitions by long-term unemployment rate, 2005
SI PLPTGR
SKBECZ
DE
HUFRNLIE
DKUK
FI
LU
IT
AT
0,0%
5,0%
10,0%
15,0%
20,0%
25,0%
30,0%
0 10 20 30 40 50 60 70 80
Long-term Unemployment Rate
Mob
ile w
ithin
the
last
5 y
ears
Source: Eurobarometer 2005 & OECD

43
These figures indicate a clear correlation between employment performance and actual mobility within five years. A condition of mobility is the existence of vacancies. In order to assess the degree to which employment performance influences on the creation of vacancies, we have analysed the relationship between unemployment and the difficulty of finding a job expressed as the average duration of job search. Figure 2.16 below, where countries are ranked according to the unemployment rate, indicates that the higher the unemployment rate, the more difficult it is to find a job. Figure 2.16: Unemployment rates by duration of employment search, 2006
0,0% 5,0% 10,0% 15,0%
Poland
Slovak Rep.
France
Spain
Greece
Belgium
Finland
Hungary
Czech Rep.
Latvia
EU average*
Sweden
Portugal
Estonia
Italy
Lithuania
Slovenia
Denmark
United Kingdom
Luxembourg
Ireland
Austria
Cyprus
The Netherlands
Unemployment rate in %
Less than 6 months6-12 monthsMore than 12 months
Source: Labour Force Survey 2006 2nd quarter *: EU average: weighted average for the Member States for which data is available.

44
In Austria for example, where the level of unemployment is relatively low (total 4.3 %), a high share of unemployed experience a job search of less than 6 months. Conversely, more unemployed experience a job search lasting more than 6 months in e.g. France, the Slovak Republic and Poland, where the unemployment rate is higher, varying from 8.8% in France to 14.2 % in Poland. Overall, we find support for the theoretical proposition that employment performance has significant impact on the probability of finding a job and hence on overall job mobility. This relationship is further supported in an analysis based on ECHP data (Employment in Europe 2004), where Member States are ranked according to their degree of mobility between economic statuses measured by a mobility index, the MT index10. The relation between mobility and employment performance will be further tested in the multivariate analysis in section 2.5 below.
Labour turnover related to strictness of EPL Indicators of labour turnover are also commonly used to capture the degree of labour market dynamism. Labour turnover measures gross flows of workers in and out of employment and corresponds to the sum of the number of separations (quits or layoffs) and hires which take place between two points in time. The empirical literature suggests that EPL has a negative impact on labour turnover, lending some support to the hypothesis that strict EPL slows down the process of labour re-allocation. Employment in Europe 2006 (European Commission 2006c) shows that countries with strict EPL such as Portugal, Greece, and Italy have high levels of average job tenure and low levels of labour turnover. Spain, which has strict EPL but high labour turnover, is an exception to this pattern, which may be explained by the high share (33%) of the labour force in temporary employment. Furthermore, stricter EPL, by reducing both hiring and firing, tends to lead higher unemployment durations, with high long-term and low short-term unemployment respectively. This indicates that unemployed workers find themselves in a disadvantaged situation given the low inflow rates into employment, which may increase the expected average duration of unemployment spells and increase the cost of unemployment. The findings in the present study reinforce this, as shown in Figure 2.17 below.
10 The index measures at a national level the degree of mobility between economic statuses. For further explanation of how the index is calculated, see Employment in Europe 2004, p. 166.

45
Figure 2.17: Average tenure by strictness of EPL
NL
IT
DE
DK
FI
PL
ES
UK
IE
GR
FR
CZ
BE
AT
SE
SK
PT
0
2
4
6
8
10
12
14
16
0,00 0,50 1,00 1,50 2,00 2,50 3,00 3,50 4,00
EPL (overall) 2003
Aver
age
tenu
re (y
ears
) 200
6
Source: OECD & Labour Force Survey 2006 2nd quarter
Mobility between different types of contracts Temporary and part-time employment may for some individuals represent an opportunity to be involved in the labour market even if for family or health reasons, they are not able to work full time. However, in many instances, temporary or part-time employment contracts can be regarded as an intermediate state between full employment and unemployment. Consequently, an important issue relating to transitions involving temporary employment is whether the transition leads to more employment, in the form of either permanent or fixed term contracts, or to some other status, in particular unemployment or inactivity. The description of transitions between different types of contracts will draw on the analysis of transitions in Employment in Europe 2004 which is based on ECHP-data11. The two next figures (Figure 2.18 and Figure 2.19) show the development in the distribution of different types of contract between 2000 and 2006. Figure 2.18 shows the distribution of voluntary/non voluntary temporary work across countries, while Figure 2.19 shows the distribution of voluntary/non voluntary part-time work across countries. There are large cross-national variations concerning the share of temporary work, ranging from below 3% (Ireland) to 31.8% (Spain). The variation can be seen as an indication that the European countries have gone down different paths in their efforts to increase the flexibility of their labour markets. Countries with strict employment protection legislation for regular workers (e.g. Spain, Portugal, and Greece) have a higher share of workers on temporary contracts. This gives support to a hypothesis that such countries address the need for flexibility
11 Unfortunately information concerning type of contract is not been included in questions about previous job is not included in the LFS questionnaires.

46
in the labour market using temporary workers (Chung 2005).12 Countries with less strict EPL such as the UK, Ireland, and Estonia on the other hand provide flexibility throughout the labour market by largely leaving employment security up to social dialogue at local or sectoral level which makes it less tempting for companies to use temporary contracts. As Figure 2.18 shows, temporary employment contracts usually do not come by as the result of a free, voluntary choice of the workers. In most countries, the share of those who express that the choice of a temporary contract is not their own is 3-5 times higher than the share of those who have chosen this form of contract themselves. The share of forced temporary contracts is particularly high in Denmark, Greece, and Italy, which represent very different employment regimes. Such high shares could indicate the existence of dual labour markets with a segment of the labour force in precarious employment. Other analyses corroborate that people with temporary contracts change employer more often than average and that job mobility for these groups is less often a free choice than for other, ‘stronger’ groups; the outcome of mobility within this group is frequently less positive (Vandenbrande et al, 2006 p. 49).
Transition from temporary to permanent employment insecure for women and low-qualified A temporary work is often not the choice of the employee him or herself, we would expect employees in general to prefer permanent contracts. However, a closer analysis of transitions indicates that less than half of the employees with a temporary contract experience a transition to more stable employment (Employment in Europe 2004) 13. Taking the year 2000 as the point of departure, around 46% of workers across EU with temporary contracts still has this type of contract one year later, while 30% managed to obtain a more stable form of employment and around 17% were out of work. The study shows that the probability of losing your job is more than three times higher if you have a temporary contract than if your contract is permanent. After six years, a high proportion of temporary workers (around 37%) are still in precarious employment, or bouncing in and out of employment, and their chances of moving to stable employment decrease over time.
12 Employment protection legislation can be defined as regulatory provisions that relate to “hiring and firing”, particularly those governing unfair dismissals, termination of employment for economic reasons, severance payments, minimum notice periods, administrative authorisation for dismissals, and prior consultations with trade union and/or labour administration representatives. 13 Based on ECHP data from 1995-2001

47
Figure 2.18: Forced/voluntary temporary work by country, 2006
0,0% 2,0% 4,0% 6,0% 8,0% 10,0%
12,0%
14,0%
16,0%
Ireland
Estonia
Germany
Luxembourg
United Kingdom
Latvia
Hungary
Slovak Rep
Lithuania
The Netherlands
EU average*
Belgium
Czech Rep
Denmark
Greece
Italy
France
Cyprus
Finland
Portugal
Sweden
Poland
Forced temporaryVoluntary temporary
Source: Labour Force Survey 2000-2006 2nd quarter *: EU average: weighted average for the Member States for which data is available. Looking at those who succeed in moving out of temporary work, the study finds that the chance of obtaining permanent employment increases with the level of qualifications, i.e. from 27.2% for the low qualified to 34.5% for the high qualified. Attending a training course in the year prior to the survey has a significant impact on the chances of moving into stable work, increasing this likelihood by 34%.

48
Women are generally more likely to move out of employment than men are. This also applies to women in permanent contracts (6.4% of whom leave their job as opposed to 4.3% for men), in temporary contracts (20.8% as opposed to 16%) and in self-employment (13.1% vs. 4.9%). The probability for men on temporary contracts to move to a more stable job is around two percentage points higher than for women. This suggests that for men, a temporary job is slightly more likely to be a first step towards stable employment, while for women it is more likely to represent a period of work in a rather more intermittent career path.
Full-time and part-time work Figure 2.19 below shows large country variations concerning the share of full-time/part-time workers by country in 2000-2006. Roughly, the share of part-time work is lowest in southern European countries, which is probable due to structural as well as cultural and socioeconomic factors. Working time patterns show major gender differences, especially as concerns the volume of hours worked. Women are more likely to be in part-time work. Analyses of LFS data from 2005 confirm that the share of full time work among women (72.7%) is lower than that among men (92.4%) (European Foundation 2001).
Part-time employment may reproduce gender inequality on the labour market
The high uptake of part-time work by women is due primarily to the care obligations that many women face. Part-time employment allows for flexibility and for upholding work-life balance, but may place women in an unfavourable labour market position impeding advancement and the full use of their skills. This is confirmed by Grant and Buckner’s (2006) studies in Britain and Austria, where women’s share of part-time employment has risen considerably. In Britain, 78% of those working part-time in 2004 were women. Large numbers of women cannot find jobs that use their abilities because there are too few part-time jobs available at an appropriate level for the skills and experience of all the women seeking part-time work to be fully utilised. Within workplaces too, opportunities for advancement for part-time workers are often limited. Thus, women can find themselves trapped in low paid jobs if they wish to work part-time. (Grant & Buckner 2006). In Austria, the number of women working part-time has increased considerably from around 28% in 1997 to about 40% of women in 2004; the corresponding EU average proportion remained stable, at around 30%–32%. Studies indicate that an increasing number of women feel that they must work on a part-time basis and that this particularly applies to those who have been out of the labour market for some time. For such workers, part-time work is seen as the only avenue to returning to work. An additional reason is that part-time work has increasingly been used by Austrian employers as a core strategy to increase flexibility and thus reduce costs, rather than as a simple to reduce working time. 14
14 Eiro-Online, 2006, Georg Adam; University of Vienna

49
Figure 2.19: Forced/voluntary part-time work by country, 2006
0,0% 10,0% 20,0% 30,0% 40,0% 50,0%
Slovak Rep
Hungary
Greece
Latvia
Estonia
Cyprus
Slovenia
Lithuania
Poland
Portugal
Spain
Italy
Finland
Luxembourg
EU average*
Austria
Belgium
Denmark
Sweden
France
United Kingdom
Norway
Czech Rep
The Netherlands
Forced part-timeVoluntary part-time
Source: Labour Force Survey 2000-2006 2nd quarter *: EU average: Weighted average for the Member States for which data is available.
Part-time work in France
Over the past 20 years, part-time work has been growing at a rapid pace in France, promoted by the government as a potential tool for stemming unemployment while affording the flexibility sought by the employers. Often imposed by employers, part-time work has thus been experienced by many employees involved as 'involuntary'. However, between 1998 and 2001 the proportion of part-time employees stating that they are not satisfied with this kind of employment has fallen. This

50
is probably attributable to the bargaining momentum generated by the law on the 35-hour working week, according to the study.
The boom in part-time work in France over the past 20 years has been tightly linked to the crisis in employment. As early as the early 1980s, regulatory measures were taken to foster the growth of this form of work and thus combat unemployment. Part-time work, frequently associated with the emergence of other 'atypical' forms of employment (fixed-term contracts and temporary agency work), has represented a response to employers' demands for more flexible use of the labour force. While at the end of the 1970s, part-time work accounted for only 6% of total employment, this figure now stands at 19%.
This phenomenon has operated in a selective manner, not affecting all the sections of the labour force in the same way, with women making up 80% of the part-time workforce. Part-time work is also often a defining characteristic of the lowest-qualified workers re-entering the labour market after unemployment. The increase in the number of the 'working poor' recently highlighted in several studies has confirmed the situation of financial precariousness experienced by those working part-time. In 2001, 71.7% of 'poor' employees and 82.8% of 'very poor' employees were working part-time. These facts help explain why this type of employment is widely regarded as unsatisfactory. Source: EIRonline feature http://www.eurofound.europa.eu/eiro/2001/11/feature/fr0111124f.htm
The ‘inner’ and ‘outer’ circle of European labour markets The results indicate that employment mobility has very different significance for those involved according to the context. The results also paint a picture of very different levels of employment mobility and different prospects for job entry and retention in European labour markets. In the ‘high mobility countries’ with low average tenure, such as Denmark, the UK and Sweden we find high levels of employment transitions and low levels of long-term unemployment. In contrast, countries with low employment mobility are characterised by higher shares of long-term unemployment and lower employment rates. In these countries stricter EPL contributes to make employment more stable and employment relationships more durable but at the same time to worsen the employment prospects of those groups that have difficulties being integrated into the labour market, such as young people, women and the long-term unemployed (European Commission 2006c, chapter 2). Temporary contracts are particularly frequent in countries with strict EPL, such as Spain, Portugal, and Greece, and for a considerable share of the workers, the temporary contracts are not a voluntary choice.

51
Figure 2.20: Total labour market transitions as share of working age population 2006
0,0% 5,0% 10,0% 15,0% 20,0% 25,0%
Denmark
Slovak Rep.
Latvia
France
Poland
Lithuania
Estonia
Finland
Hungary
EU average*
Czech Rep.
Sweden
Portugal
Slovenia
Cyprus
Italy
Greece
Austria
Belgium
Luxembourg
Employment transitions as share of working age population
200020032006
Source: EU Labour Force Survey 2000-2006 2nd quarter *: EU average: weighted average for the Member States for which data is available. In other words, the analysis shows that European labour markets display very different characteristics and that – in some of them – there is some support for the dual labour market hypothesis. Figure 2.21 and Figure 2.22 confirm these patters and analyse the composition of employment transitions. In this analysis, the labour market is conceptualised as a set of concentric circles, where employment is at the centre and inactivity at the periphery. Transitions are then ordered according to the relative distance to employment.
U → E From unemployed to employed E → U From employed to unemployed E → I From employed to inactive I → E From inactive to employed

52
U → I From unemployed to inactive I → U From inactive to unemployed
Hence, transitions within the labour force (U→E and U→E) represent the ’inner circle’ of employment mobility, while transitions in and out of inactivity (E→I, I→E, U→I, I→U) represent the ’outer circle’ of the labour market. The total share of employment transitions is presented in Figure 2.20. The figures show considerable variation in the levels of the countries’ employment transitions in the ’inner circle’ and the ’outer circle’ of the labour market. It should be emphasised that the distinction between the ’inner’ and ‘outer’ circle of the labour market is a simplification which may conceal some nuances of the transitions. For example, a student having finished his or her education may well enter from the ‘outer’ circle (inactivity) into employment directly, while a long-term unemployed may be much more marginalised even though he belongs to the ‘inner circle’. Nevertheless, the variation in the nature of employment transitions may reflect differences in the employment performance as well as in the performance of the social security and unemployment compensation systems. Inner circle transitions in Denmark Compared to other countries, Denmark has the highest level of employment transitions (6.5%) in and out of employment, which may reflect the ’flexicurity’ element of the Danish labour market. Active labour market policies combined with a generous replacement rate and the high labour market participation of women means that unemployment does not mean that a family loses its sustenance. Denmark also has a high level of transitions in the ’outer circle’ of the labour market, e.g. transitions from inactivity to employment, unemployment, or vice versa. This indicates that integration into the labour market is, if not easy, then at least not impossible, for persons who have been inactive for a short or long period.
Sweden and Finland are interesting cases, having very low levels of employment transitions in the ‘inner circle’ of the labour market, i.e. an average of 3% and 3.7% respectively from 2000 to 2006, and a quite high level of transitions in the ‘outer circle’ of the labour market, i.e. 7.5% and 9.1% respectively from 2000 to 2006. This reflects a situation with a low level of unemployment and that most transitions go directly from employment to inactivity or from inactivity to employment, probably due to maternity leave and educational leave of absence. In contrast, the level of employment transitions in the ‘inner circle’ as well as the outer circle is lower in low mobility countries such as Italy and Greece.

53
Figure 2.21: ‘Inner circle’ labour market transitions (’E U’ and ’U E’) as share of working age population, 2000-2006.
0,0% 1,0% 2,0% 3,0% 4,0% 5,0% 6,0% 7,0% 8,0%
Denmark
Slovak Rep.
Latvia
France
Poland
Lithuania
Estonia
Finland
Hungary
EU average*
Czech Rep.
Sweden
Portugal
Slovenia
Cyprus
Italy
Greece
Austria
Belgium
Luxembourg
Share of 'E->U' and 'U->E'
200020032006
Source:EU Labour Force Survey 2000-2006 2nd quarter *: EU average: weighted average for the Member States for which data is available.

54
Figure 2.22: 'Outer circle' labour market transitions as share of working age population, 2000-2006. Share of’ E I’,’I E’,’U I’ and ’I U’.
0,0% 2,0% 4,0% 6,0% 8,0% 10,0% 12,0% 14,0%
Denmark
Finland
Poland
Sweden
Lithuania
Estonia
Portugal
Cyprus
Slovenia
Czech Rep.
EU average*
Austria
France
Hungary
Belgium
Latvia
Slovak Rep.
Italy
Luxembourg
Greece
Share of 'E->I', 'I->E', 'U->I' and 'I->U'
200020032006
Source: Labour Force Survey 2000-2006 2nd quarter *: EU average: weighted average for the Member States for which data is available.

55
2.5 Multivariate analyses In order to support and underpin the hypotheses that have been discussed above we have carried out a number of multivariate analyses. Where relevant, additional tables are used to highlight important findings and support the conclusions reached. For each of the three dimensions of job mobility we have analysed the statistical relationship between the different types of job mobility and number of independent background variables, each of which will be described separately. For a technical presentation of the datasets and methods used, a full list of variables included in the models and a complete overview of the final models (including relevant statistical measures), please refer to Annex 1.
Job-to-job mobility An analysis is performed in order to estimate the effects of several independent variables on the level of job-to-job mobility, measured as job tenure (the length of time in current job). The following independent variables are included in the final model:
• gender • age • educational level • permanency of contract • number of hours worked • sector of work • level of unemployment • EPL level • Specific country characteristics.15
The individual effects of these variables are shown in Table 3.2 and will be discussed below. The model’s predictive power, as measured by R², is 0,393. This means that the variables included in the model explains almost two fifths of the variation in tenure and as such, the overall fit of the model is considered good. The explanatory power of the model is reflected in the individual regression coefficients as shown in the table. Age is seen to be the single most important factor, explaining almost half the variation in job-to-job mobility, followed by permanency of contract, which explains about one fifth. The remaining factors each explain less than 10 %.
15 These are captured by using a dummy variable for each country in the models. This means that the variable is a residual variable, i.e. it shows the variance on mobility that can be explained to country-specific factors. The variable thus contains information about nationally specific – but unspecified - factors influencing mobility.

56
Table 2.3: Determinants of job-to-job mobility, linear regression model estimates Variable name Standardized coefficient
Age 0,493 Permanency of contract 0,192 Number of hours worked 0,069 Gender 0,027 EPL level 0,020 Level of unemployment 0,013 Level of education -0,022 Sector: Public administration 0,048 Sector: Education 0,028 Sector: Financial services 0,024 Sector: Transport 0,008 Sector: Health and social work -0,012 Sector: Agriculture and fishing -0,016 Sector: Hotels -0,050 Sector: Other -0,051 Sector: Trade -0,055 Sector: Construction -0,065 Sector: Real estate -0,077 Country: Austria 0,064 Country: Belgium 0,002 Country: Portugal -0,008 Country: Sweden -0,011 Country: Italy -0,011 Country: The Netherlands -0,017 Country: Slovak Rep. -0,019 Country: Poland -0,021 Country: Finland -0,022 Country: Spain -0,025 Country: Germany -0,026 Country: Greece -0,030 Country: Ireland -0,031 Country: Norway -0,035 Country: Denmark -0,046 Country: Hungary -0,047 Country: Czech Rep. -0,053 Country: United Kingdom -0,070
All coefficients are significant at a <0.01 level Gender Due to women’s maternity leave, one should expect that, everything else being equal, they would have lower average job tenure than men. Studies indicate that women often take up a greater proportion of household tasks than do men and as a consequence perform less paid labour (Beeson 1998, Hersch and Stratton 1997). At EU-level, the percentage who has never worked differs greatly for men and women. While only 1% of all men older than 35 have never worked, this figure is 13% for women. Furthermore, in most countries women’s employment rates are lower than men’s. The multivariate analysis of employment mobility below confirms that women are generally more likely to move out of employment than their male counterparts – especially women on

57
temporary contracts. The multivariate analysis confirms that there is a significant, though relatively small, correlation between gender and tenure. Men generally tend to have higher tenure than women, resulting in higher job-to-job mobility levels for women than for men. Though women’s job-to-job mobility is higher than men’s, this may reflect that they have more frequent transitions due to maternity leave or household duties. An analysis of LFS data across countries shows that average job tenure of men is higher than that of women in most countries (17 countries of the 26 countries displayed), and at EU-level (11.1 years for men and 9.8 years for women). However, in some countries, such as Poland, Portugal, and the Slovak Republic, the gender differences are quite small and in the Baltic countries, we find the opposite pattern. Here, women’s average tenure is higher than men’s. Such variations across countries indicate that there is no general correlation between gender and job tenure, and that country-specific labour market factors and gender segregation may account for most of the differences. Age Theoretically, age can be expected to have an important influence on the extent to which people change employer, whether voluntarily or forced. It should be expected that younger workers have a greater propensity for changing jobs voluntarily than older workers given the fact that wages vary positively with experience. Young workers typically earn less than older workers, so the difference in financial utility between a current job and a new job is likely to be greater for young people. Conversely, older workers should be expected to have more reasons for not changing employer. The job matching theory states that older workers are more likely to have found a good employee-employer match. They are also more likely to benefit from match-specific rents, which increase the utility of the current job and thus reduce the potential utility gain of moving to a new job (Groot and Verberne, 1997). The multivariate analysis supports these expectations. In fact age has the strongest relation with tenure of all the variables included, indicating that job mobility decreases (and tenure rises) with age. This is not surprising, given the fact that the older an individual becomes, the longer he or she will have been on the labour market, thereby increasing the probability of having had a job for a longer period. Additional explanations include that employees tend to stay in their jobs in the late stages of their career, either because they have found a satisfactory job or because they perceive their chances of finding another job to be low (for example, because of employers’ preferences for younger candidates). An analysis of the Eurobarometer Survey comparing the share of voluntary and forced transitions across age groups confirms this explanation. In the age groups above 45 years the share of forced transitions are higher than voluntary transitions in most countries. Conversely, among the younger age groups the share of voluntary transitions is higher than the share of forced transitions. Figure 2.23 below shows that the share of employed persons who have experienced a job change during the past year is higher among the younger age groups, 25-34 years and 35-44 years than the older age groups, 55-64 years and 65+. The pattern of a decrease in job changes with age roughly applies to all countries. However, in some countries, such as Estonia, Latvia, and Lithuania, the share of employed who have experienced a job change are higher even across the age groups.

58
Figure 2.23: Age distribution of employed persons who experienced a change of job during the past year by country, 2005
0% 20% 40% 60% 80% 100%
EU average*
United Kingdom
Spain
Slovenia
Slovak Rep.
Portugal
Netherlands
Luxembourg
Lithuania
Latvia
Italy
Hungary
Greece
Germany
France
Finland
Estonia
Denmark
Czech Rep.
Cyprus
Belgium
Austria
Age distribution of employed persons who experience a job change
15-2425-3435-4445-5455-6465+
Source: EU-SILC *: EU average: weighted average for the Member States for which data is available.
Level of education The scope for future job mobility depends on the type and quantity of the human capital the worker has acquired (Dolton and Kidd, 1998). Everything else being equal, compared to people with a low education, persons with a medium or high educational level possess more competences, which increases their potential job chances, value, and usability for employers

59
. Figure 2.24: Distribution of employed persons who experienced a change of job during past year by level of education and country, 2005
0% 20% 40% 60% 80% 100%
The Netherlands
Belgium
United Kingdom
Germany
Denmark
France
Finland
Cyprus
Luxembourg
Spain
EU average*
Lithuania
Estonia
Greece
Austria
Slovenia
Slovak Rep.
Hungary
Portugal
Italy
Latvia
Czech Rep.
Share of employed persons who experienced a change of job during past year
LowMediumHigh
Source: EU-SILC *: EU average: weighted average for the Member States for which data is available.
Hence, we should expect that the higher the educational level the greater the job-to-job mobility. However, the multivariate analysis indicates only a weak relation between a person’s level of education and job mobility. In general, the higher the educational level, the lower the tenure, which means that workers with a higher education generally have slightly higher job-to-job mobility ratios. The explanation for this surprisingly weak relation is probably that the relation between educational level and job mobility is very different across countries. Figure 2.24 shows that in a

60
number of countries most of the employed having experienced job change have medium or high levels of education. In The Netherlands, Germany, Finland, Estonia, Belgium and the UK, for example, 8.1%- 17% of the movers have a low educational level. The opposite pattern applies in southern European countries such as Italy, Greece, Portugal and Spain, where most of the ‘movers’ have a low educational level. The high levels of job mobility among the lowly educated in these countries may be explained by their higher shares of temporary employment and stricter EPL creating gaps between ‘insiders’ with well protected permanent employment and ‘outsiders’ with more unstable labour market relations. This is further confirmed by the multivariate analysis of employment mobility below, which indicates that higher educated members of the workforce stand a better chance of avoiding employment transitions than low educated workers. Sector of work Certain sectors are more exposed to market forces than others are. For instance, the public sector is relatively sheltered. As market dynamics are the prime source of shocks, causing uncertainty and possibly lay-offs, it should be expected that workers in the public sector would have lower job mobility while higher mobility should be expected among workers in private sectors characterised by seasonal jobs and market competition. Figure 2.25 shows the variation in job mobility (measured by mean tenure) across sectors. Sectors with high tenure, i.e. a low level of job-to-job mobility, include public administration, financial services, transport, and education. Job protection mechanisms and payment systems rewarding seniority and length of service as well traditions of following well-defined career paths may be factors explaining the high average tenure in the public sector. Sectors with generally high levels of job-to-job mobility include agriculture and fishing, construction, trade, hotels and restaurants, real estate, health and social work and ‘other’. The average tenure is highest in agriculture and fishing. This may be explained by the self-employed character of jobs in this sector as well as strong cultural and job-identity factors related to agriculture. However, the multivariate analysis indicates that the relationship between sector and job mobility (measured by tenure) are quite weak and can be both positive and negative, depending on the sector. This may be explained by cross-country variations within the same sector. In agriculture and fishing, for example, average tenure is very high in some southern European countries such as Portugal (22.1 years), Greece (23.4 years), Slovenia (25.3 years), and Cyprus (20.9 years), but much lower in the Baltic countries (7.7 – 8.4 years) and Hungary (10.9 years). The same pattern and span of variation in average tenure are seen in other sectors. Average tenure in mining, manufacturing, and electricity varies from 7.6 years in Lithuania to 16.1 years in Luxembourg. In construction, tenure varies from 4.9 to 11.9 years, in trade from 4.8 to 11.4 years, etc. Overall, these considerable variations across countries indicate that it is only to a limited extent the character of the sector itself that explains variations in average tenure, which will have to be ascribed to country-specific sector dynamics and labour market framework conditions.

61
Figure 2.25: Job tenure by sector 2006
02468
1012141618
Agr
icul
ture
and
Fish
ing
Pub
licad
min
istra
tion
Edu
catio
n
Fina
ncia
lse
rvic
es
Tran
spor
t
Man
ufac
turin
g,E
lect
ricity
and
Min
ing
Hea
lth a
ndso
cial
wor
k
Trad
e
Oth
er
Con
stru
ctio
n
Rea
l est
ate
Yea
rs e
mpl
oyed
with
cur
rent
em
ploy
er
Mean tenure (years) EU average
Source: Labour Force Survey 2006 2nd quarter *: EU average: weighted average for the Member States for which data is available.
Level of unemployment The level of unemployment in each country has a significant, but rather small, effect on tenure. Level of Employment Protection Legislation (EPL) Empirical literature suggests that strict EPL has a negative impact on labour turnover lending some support to the hypothesis that strict EPL will contribute to slow down the process of labour re-allocation. (Chung 2005). As we have seen previously, it has been demonstrated that countries with strict EPL have high levels of average job tenure and low levels of labour turnover. The multivariate analysis confirms that there is a significant though small effect of the level of EPL on tenure, indicating that the higher the EPL level in a given country, the higher average tenure. In other words, the higher the level of EPL the lower is the level of job-to-job mobility. Country specific characteristics As can be seen from Table 2.3 above, there is great variation between countries. However, some observations can be made: Firstly, as only Austria and Belgium display positive values (although the value for Belgium is very small), most countries have specific characteristics that affect job-to-job mobility negatively. Secondly, the values for the rest of the countries are spread out rather evenly in an interval between -0,008 (Portugal) and -0,070 (United Kingdom). There seem to be no geographical coherence to the values, as for example the Nordic countries have values between -0,011 (Sweden) and -0,046 (Denmark) with Norway (-0,035) and Finland (-0,022) falling in between. Thus, no clear pattern can be detected from the analysis of country specific characteristics on job-to-job mobility.

62
Occupational mobility In this multivariate analysis, occupational mobility is measured as an individual’s transition between different occupational classes, in terms of three dimensions:
1) upward/downward mobility from first to present job, 2) overall occupational mobility (not mobile/mobile) from first to present job and 3) overall occupational mobility from previous to present job.16
The following independent variables are included in the model: gender, age, permanency of contract, level of unemployment. The individual effects of these variables are shown in Table 2.4 and will be discussed below. The predictive power of the variables, as measured by R², is below 0.05 for all variables.17 The explanatory power of the model is low, as none of the factors explain more than about 10% of the variation. However, of the factors examined, gender explains most of the variation. Table 2.4: Determinants of occupational mobility, linear regression model estimates
Variable name Standardized coefficient
Gender 0,101* Age 0,022*** Permanency of contract -0,046* Level of unemployment -0,049*
Coefficients marked with an * are significant at a <0.01 level. Coefficients marked with an *** are significant at a <0.10 level. Gender The analysis shows that there is a significant correlation between gender and occupational mobility, upward as well as downward mobility and also with the number of occupational changes between the first and the current job. Based on the analysis, it can be estimated that men have a higher propensity than women to be occupationally mobile. Gender also has a significant correlation with upward occupational mobility, indicating that men are ‘climbing higher up the social ladder’ in terms of occupational classes than women in a work-life perspective. This is confirmed by another recent study indicating that among women there is indeed slightly less career-related voluntary job mobility and substantially greater caring-orientated job mobility (European Foundation 2007, p.32). Age Age is found to have a positive correlation with occupational mobility, indicating that the older a person is, the more likely is it that he/she has changed occupation during his/hers work-life. Age is also correlated with upward occupational mobility, which indicates that the older one is the more likely is it that one has climbed upwards on the social ladder. Both these findings are rather self-evident and consistent with the fact that most people naturally enter the labour market in a lower position and then work their way upwards.
16 However, when calculating the models neither of the above-mentioned variables come out as a significant factor effecting mobility. Because of the low case number in the Eurobarometer dataset, this leads us to the tentative conclusion that the data does not allow us to test this specific dimension. 17 This is of course not satisfactory as neither variable in the models explain a large proportion of the variation on the independent variables. However, a lot of the models’ lack of predictive power can probably be linked to the low case numbers in the Eurobarometer dataset, which seriously impedes model-building. In comparison, the predictive power obtained by using pooled data from Labour Force Survey covering 10 years is considerably higher and lies in the range of 0.10 to 0.55.

63
Permanency of contract The multivariate analysis shows that whether a person has a permanent or temporary contract has an effect on occupational mobility. Individuals with permanent contracts are more upward occupationally mobile than individuals with temporary contracts. Thus, having a temporary contract can impede a person’s upward mobility chances. In contrast, having a permanent contract has a slightly negative effect on overall occupational mobility from first to present job, leading to an interpretation that individuals with permanent contract in general tend to have been less occupational mobile during their career. Level of unemployment The last variable found to have an effect on occupational mobility is a country’s level of unemployment. Level of unemployment has a significant impact on overall mobility, meaning that in countries with high unemployment rates, the level of occupational mobility is generally lower than in countries with low unemployment rates. Furthermore, a country’s level of unemployment has a significant negative effect on upward occupational mobility, which supports the conclusion that individuals’ career options are hampered in countries with high unemployment rates, this probably being due to fear of losing current job, lack of job opportunities, risk-averse behaviour etc.
Employment mobility This multivariate analysis estimates the effects of several independent variables on the level of employment mobility. The following independent variables are included in the model: gender, age, educational level, permanency of contract, number of hours worked, sector of work, level of unemployment, EPL level and specific country characteristics. The effects of these variables are shown in Table 2.5 and will be discussed below. Table 2.5 Determinants of employment mobility, linear regression model estimates
Variable name Standardized coefficient
EPL level 0,006*** Level of unemployment -0,008* Gender -0,009* Level of education -0,022* Number of hours worked -0,078* Age -0,157* Permanency of contract -0,271* Sector: Real estate 0,019* Sector: Hotels 0,018* Sector: Other 0,016* Sector: Trade 0,016* Sector: Construction 0,008* Sector: Agriculture and fishing 0,001*** Sector: Education -0,002** Sector: Financial services -0,002** Sector: Transport -0,003* Sector: Health and social work -0,003* Sector: Public administration -0,008* Country: Denmark 0,038* Country: Italy 0,035* Country: Finland 0,032*

64
Country: Hungary 0,029* Country: Slovak Rep. 0,026* Country: Poland 0,013* Country: Czech Rep. 0,011* Country: Austria 0,002*** Country: Greece -0,003* Country: Belgium -0,007* Country: Sweden -0,009* Country: Norway -0,020* Country: Portugal -0,027*
Coefficients marked with an * are significant at a <0.01 level. Coefficients marked with an ** are significant at a <0.05 level. Coefficients marked with an *** are significant at a <0.10 level. Gender Due to maternity leave and greater share of household duties, one should expect that women's employment mobility is higher than that of men. The multivariate analysis confirms this, indicates that are slightly less employment mobile than women. Thus, the analysis supports the observation made in section 2.4 above that women are generally more likely to move out of employment than men. This applies to those on permanent contract (6.4% of whom leave their job as opposed to 4.3% for men), on temporary contracts (20.8% as opposed to 16%) and in self-employment (13.1% vs. 4.9%). The explanation for the nevertheless moderate relation between gender and employment mobility may be that women’s employment rates are lower than men’s in most countries, especially in countries such as Spain (51,2%) and Greece (46,1%), which implies a considerable segment of women who are outside the labour market. Age Age is found to have a significant and quite strong relation with employment mobility, indicating that the older workers are, the less probable it is that they will experience an employment transition. Conversely, younger workers are more employment mobile as they occupy a more vulnerable position on the labour market. Level of education Above we found a rather weak relation between educational level and job mobility, which was explained by the very diverse role that is played by competences in the European labour markets. In the southern European countries the low-educated have the highest job-to-job mobility while the opposite is the case in Central Europe and Scandinavia. This is consistent with the multivariate analysis, which indicates a significant relation between the level of education and employment mobility. The data supports the conclusion that higher educated members of the workforce stand a better chance of avoiding employment transitions than lower educated workers. In other words, the higher the education level the lower the level of employment mobility. Permanency of contract (temporary/permanent) There is a rather strong link between permanency of contract and employment mobility. Thus, having a permanent contract significantly lowers the employment transition rate, resulting in generally lower employment mobility for workers with permanent contracts.

65
Number of hours worked (full-time/part-time) Not surprisingly, there is a significant relation between having a full-time job and employment mobility, meaning that full-time workers have lower levels of employment mobility. This indicates that holders of part-time jobs are indeed at a more vulnerable position on the labour market, as they generally tend to experience more employment transitions than holders of full-time jobs. In sum, being temporary or part-time employed can be regarded as intermediate, and hence more precarious positions between full employment and unemployment. Hence both variables are related to employment mobility. Sector of work There are significant relations between the sector that people work in and employment mobility. However, the relation is quite small and can be both positive and negative, depending on the sector. Sectors with high employment mobility are agriculture and fishing, construction, trade, hotels and restaurants, real estate and other. Sectors with low employment mobility are public administration, financial services, transport, education and health and social work. Level of unemployment There is a significant but small negative relation between a country’s level of unemployment and employment mobility. This finding indicates that higher unemployment rates affect the number of workers experiencing employment transitions and thus that higher unemployment rates lead to lower levels of employment mobility. EPL level Investigating the link between levels of Employment Protection legislation and employment mobility, we find a significant but very weak relationship. In countries with a strict EPL, on average, workers will tend to experience more moves between the different employment categories. The data thus supports the hypothesis that countries with strict EPL will tend to have a larger subset of the workforce on the edge of the labour market. Country specific characteristics As can be seen from Table 2.5 above, there is quite large variation between countries when it comes to country specific characteristics. The values range from -0,027 (Portugal) to 0,038 (Denmark) with a total of five countries having negative values (Belgium, Greece, Norway, Portugal and Sweden) and eight countries (Austria, Czech Rep., Denmark, Finland, Hungary, Italy, Poland and Slovak Rep.) having positive values. As was the case with job-to-job mobility, no clusters of mobility regimes can be observed and in the end, we find that no clear pattern emerges from the analysis of country specific characteristics on employment mobility.
Conclusion In this section, the results of employing multivariate analysis to data on mobility and a range of independent variables have been described. Using both linear regression models and covariance analyses has resulted in a comprehensive overview of the different factors and background variables that affect the three dimensions of job mobility that are investigated in the current report. The main findings of the multivariate analyses are as follows:

66
• There appears to be a pattern in the relations, as the same factors are seen to affect job-to-job mobility and employment mobility. Together, the findings points to the existence of a segmented labour market:
- At one end of the scale we find a group of workers with permanent full-time jobs
that enjoy high levels of security in the labour market. They do not change their job often, nor are they at risk of being pushed to the fringe of the labour market, and in addition they experience a higher degree of upward occupational mobility. This group of workers is particularly prevalent in certain sectors like public administration, financial services and education. Also, there is a higher share of men and older workers in this group.
- At the other end of the scale is a group of workers with part-time jobs and/or temporary contracts. This group does not experience high levels of upward occupational mobility. They change job more often, and often involuntarily, and are generally at higher risk of being pushed out of the labour market. The group has a relatively higher share of women and younger workers and is prevalent in sectors like agriculture and fishing, construction, trade, and hotels and restaurants.
• Country-level factors have an effect on both job-to-job and employment mobility although
the relations are quite vague. Generally speaking, the higher the unemployment level, the lower are mobility, possibly because of risk-averse behaviour. Similarly, the stricter the EPL, the lower job-to-job mobility. Interestingly, the analysis also indicate that the stricter the EPL, the slightly higher the employment mobility.
• The dummy variables covering unexplained specific country characteristics did find some
differences across countries. However, no clear pattern between groups of countries emerges, most likely because the variable could possibly be covering a host of different unexplained factors, the composition of which differs from country to country.
2.6 Mobility clusters and employment regimes in Europe It has appeared from the sections above that there are significant differences between countries when it comes to the degree and specific character of job mobility. Both as regards job-to-job mobility, as regards employment mobility and as regards occupational mobility, there are marked differences between the countries with the highest rates of mobility and the countries with the lowest rates of mobility. How can the differences in job mobility across countries be systematised? Can different clusters of countries be identified in terms of the character and nature of job mobility? And how can these clusters potentially be understood?
An inductive approach In identifying clusters of countries with respect to job mobility, various approaches are possible. Focus can be on different types of job mobility (job-to-job, employment or occupational) and on different operational definitions of these concepts. Moreover, an analysis of the potential clustering of countries as regards patterns of job mobility can be inductive, i.e. taking an outset in the empirical analysis of data, or deductive, i.e. taking an outset in theory based hypotheses and categorisations which are then applied to empirical data.

67
An inductive approach will be applied in the following. First the extent to which countries are clustered with respect to thee three key dimensions of job mobility will be analysed with on outset in empirical data. We will then discuss the clustering of countries with the basis in results from a multivariate analysis in which a specific ‘country effect’ on job mobility can be identified.
Comprehensive job mobility indexes In the table below occupational mobility, employment mobility and job-to-job mobility is measured by selected operational variables: • Occupational mobility is measured by the share of employed persons who has experienced
upward occupational class mobility from previous to present job, either with the same employer or in connection with change of employer
• Employment mobility is measured by a) the share of the adult workforce who has been unemployed for more than 12 months and are actively job seeking and b) the share of employment transitions in the workforce.
• Job-to-job mobility is measured by the average job duration in the present job among adults. It would have been possible to focus on other operational variables, but the selected variables are valid expressions of (specific aspects) of the three types of job mobility. In addition, they are the variables for which data availability is best. On the basis of the values of the three operational variables, index values have been calculated for each.18 The values are indexed so that the index value is in the range from 0 to 1. A high value signifies a high extent of mobility along the three dimensions job title mobility, long-term unemployment/employment transitions, and job duration. At an aggregate level, job mobility along the three index dimensions is highly correlated. With a few exceptions, low values on the occupational mobility index correspond to low values on the employment mobility index and the job-to-job mobility index. Similarly, high values on one of the dimensions tend to be associated with high values along the other dimensions. There are some notable exceptions to this general pattern, i.e. primarily the high employment mobility scores of Austria, Cyprus, Ireland, Luxembourg and the Netherlands in the context of relatively low overall unemployment in these countries.
18 The occupational mobility index is calculated as the ratio of the difference between each country’s occupational mobility rate and the occupational mobility rate of the country with the highest rate, divided by the occupational mobility rate of the country with the highest rate. The employment mobility index for each country is calculated as the average of the ratio of the country’s long-term unemployment rate to the country with the highest long-term unemployment rate and the ratio of employment transitions in the country to the country with the highest level of employment transitions. The job-to-job mobility index for each country is calculated as the ratio of the country’s average job duration to the country with the highest average job duration.

68
Table 3.2. Job mobility indices (values range from 0 to 1, 1 = highest mobility) Country Occupational
mobility index Employment
mobility index Job-to-job
mobility index Average job
mobility index Sweden 1.00 0.96 0.62 0.86 UK 0.79 1.00 0.77 0.86 Denmark 0.48 1.00 1.00 0.83 Latvia 0.72 0.67 0.74 0.71 Finland 0.73 0.74 0.61 0.69 Estonia 0.81 0.53 0.60 0.65 Lithuania 0.68 0.58 0.68 0.65 France 0.64 0.72 0.53 0.63 Ireland 0.47 0.95 0.44 0.62 Spain 0.49 0.89 0.42 0.60 Netherlands 0.21 0.92 0.64 0.59 Malta 0.61 0.78 0.10 0.50 Cyprus 0.05 0.71 0.51 0.43 Hungary 0.11 0.68 0.50 0.43 Austria 0.09 0.97 0.10 0.39 Greece 0.55 0.45 0.18 0.39 Portugal 0.34 0.64 0.00 0.33 Italy 0.23 0.49 0.24 0.32 Luxembourg 0.17 0.49 0.24 0.30 Germany 0.06 0.63 0.23 0.30 Slovenia 0.09 0.67 0.11 0.29 Czech Republic 0.07 0.53 0.23 0.28 Belgium 0.09 0.51 0.17 0.26 Poland 0.20 0.37 0.23 0.26 Slovak Republic 0.00 0.30 0.08 0.12
Sources: Eurobarometer 2005, Labour Force Survey 2006, own calculations. 2006 data only available for LFS (employment mobility index). Two geographically defined groups of countries can be identified among the five countries with the highest job mobility index values and thus the highest levels of job mobility in their labour markets: one group of North European EU countries (Denmark, Finland, Sweden, and the United Kingdom) and one consisting of the three Baltic states (Estonia, Latvia, and Lithuania). Among the countries with the lowest job mobility index values, three groups of countries can be identified. A group of Central European new EU Member States (the Slovak Republic, Poland, Slovenia and the Czech Republic), a group of Central European ‘old’ EU Member States (Austria, Belgium, Germany), and a group of Mediterranean Member States (Portugal, Greece, and Italy). Spain and France are, according to this grouping, placed between the countries with the lowest and the countries with the highest job mobility scores.
Country effects on job mobility: inconclusive evidence from multivariate analyses A different way to attempt cluster countries with respect to job mobility is to look at the residual ‘country effect’ in multivariate analyses of factors affecting job mobility. The residual ‘country effect’ is the effect of the country variable, when adjusting for the effects of other key independent variables (age, gender, sex, education, sector affiliation, employment status, full-time/part-time employment, permanent/temporary employment, and employment protection

69
legislation overall). The country effect may thus point to country-related factors other than the mentioned explanatory variables. As already mentioned, the residual country effect on two job mobility variables – job tenure and employment transitions – was calculated. However, the evidence is inconclusive. Across the two dependent job mobility variables there is a small independent positive country effect on job mobility for Denmark, Hungary and Finland, and also to an even lesser extent for Italy, Poland and the Czech Republic. However, effects are small, and for a number of countries the country effect points in a different direction for job tenure and employment transitions, respectively.
Mobility clusters and employment regimes Whereas country effects turn out to be small, a different hypothesis would link the mobility index more to employment regimes. Therefore, we have looked at how the empirical findings, as summarised in the comprehensive job mobility index, fit with theoretical models concerning employment regimes in Europe. The idea of welfare regimes stem from work done by Esping Andersen (1990). Several studies have discussed and elaborated Esping Andersen's central contribution. I.e. instead of analysing and comparing policy fields separately, understanding could be enhanced considerably by looking at welfare regimes, i.e. specific configurations of policy. The concept of regimes has been particularly influential in the debates on flexicurity. Esping-Andersen identifies three types of welfare regimes: ‘Social Democrat’, ‘Conservative’ and ‘Liberal’ welfare states. In his analysis, the key factor distinguishing between the different welfare regimes is the degree of ‘commoditisation’ of labour, i.e. the extent to which income and income support depends on the market price of labour in the labour market or on rights or entitlements which are not related to the market. In his analysis, pensions, sickness benefits, and unemployment benefits are of particular importance in this respect. This concept of welfare regimes does not take into account differences concerning regulatory conditions nor active labour market policies. Nevertheless, on the basis of a review of empirical literature on European social and labour market policies (including Auer and Cases 2000; Cazes and Nesporova 2003; Cedefop 2001; Ferrara 1996; Riboud et al. 2002; and Saar 2005), the proposed typology of employment regimes suggests a relatively close correspondence between Esping-Andersen’s welfare regi-mes and employment or flexicurity regimes. Two examples will illustrate this. Employment in Europe 2006 (European Commission 2006c, pp 101-109) includes a principal components analysis (PCA) and clustering analysis (CLA) based on OECD and Eurostat data for 18 countries in order to cluster flexicurity systems in Europe. The principal component analysis identifies three principal components: Flexibility/employability; security; and (tax) distortions. The distribution of countries along the principal components ‘security’ and ‘flexibility/employability’ are shown in Figure 2.26.

70
Figure 2.26: Flexicurity clusters on the basis of PCA analysis and K-means clustering
Source: European Commission 2006, p. 106. The five clusters are characterised as follows: ‘The ‘Anglo-Saxon’ cluster’ (the UK and Ireland); The ‘Continental’ cluster (Germany, Austria, Belgium, France); The ‘Mediterranean’ cluster (Spain, Portugal, Greece); The ‘Eastern European (plus Italy)’ cluster (Hungary, Poland, the Czech Republic, the Slovak Republic, Italy); and The ‘Nordic’ cluster (Finland, the Netherlands, Sweden, Denmark) The clustering (and the names given to the clusters) indicates that flexicurity configurations are distributed according to the physical location of countries in Europe. Warning words should, however, be attached both to the clustering and to the names given to the clusters. Different methodologies for clustering (different measures of distance to other points) may yield different results, a fact that appears obvious when studying the figure. Moreover, the analysis did not include a number of member states, notably Luxembourg, Slovenia, Bulgaria, and the Baltic states. Including these might have yielded different clusters, as we shall see in the following. In a more recent publication (European Foundation 2007c), another attempt has been made at identifying European employment regimes, taking into account two key dimensions: a) labour market flexibility, and b) the nature of employment sustaining policies. The analysis includes 25 EU member states, and the analysed factors differ from those analysed in Employment in Europe in two respects, i.e. expenditure on life long learning activities are only taken into account insofar as they take place as a part of active labour market policies; and passive labour market policy expenditure is excluded. The resulting clusters roughly resemble those identified in Employment in Europe (see Figure 2.27 below) with the exception that the addition of seven countries19 and the focus on ALMP give rise to some additional regimes.
19 Cyprus, Estonia, Latvia, Lithuania, Luxembourg, Malta, and Slovenia.

71
Figure 2.27 Employment regimes, EU25
After European Foundation 2007 c)20 The regimes thus identified appear to be largely similar to those identified in Employment in Europe with a few significant exceptions. The Netherlands are found to belong to the same cluster (called the ‘Conservative’ regimes) as Germany, Austria, France and Belgium. Italy, on the other hand, is found to belong to the ‘Mediterranean’ cluster. This is most probably a result of removing the expenditure for passive employment policies from the labour market policy dimension. Applying the idea of regimes to the empirical evidence on job mobility in Europe, in particular the comprehensive job mobility indexes, we find a certain correspondence, but not an exact pattern similarity, cf. Table 2.6 on page 73. Finally, another recent study commissioned by the European Foundation for the Improvement of Living and Working Conditions (European Foundation 2007b) has attempted to identify country clusters in the EU in relation to flexicurity models, based on the situation in the EU’s Member States as regards three different factors, identified through a statistical factor analysis: 1) Adaptability/flexibility. This factor is based on indicators concerning the ease of finding a
new job and worker mobility, and two indicators reflecting training issues. Other indicators also included in this factor pertain to the long-term unemployment rate, youth unemployment rate, and the employment rate of older persons.
2) Social security. This factor is based on indicators characterising expenditure on social protection and unemployment insurance.
20 The European Foundation uses a terminology partly inspired by Esping Andersen's original typology to which they add ‘Post-socialist liberal’ (the Baltic states), ‘Post-socialist conservative’ (the Eastern European Member States) and ‘Mediterranean’ (All states bordering on the Mediterranean Sea except France), thus mixing a party political terminology with a location oriented one.
Weak employment sustaining policies (no labour market policies)
Strong employment sustaining policies (active labour market policies)
High flexibility (weak EPL)
EE, LV, LT
DK, FI, SE
DE, AT, F, BE, LUX, NL
Low flexibility (strict EPL)
UK, EI
HU, PL, CS, SK, SI
ES, PT, I, GR, MT, CY

72
3) Social cohesion. This factor is based on indicators concerning poverty and income distribution data as well as the proportion of early school-leavers.
This study concluded that six different country groups can be identified according to flexicurity: • Denmark, Sweden, and Finland represent countries which are often used as benchmarking
models, and which show top scores for most of the indicators involved. • The Netherlands and the UK represent countries with fairly liberal and flexible labour
markets. The proportion of part-time workers is particularly high in this group, unem-ployment is low, and labour mobility high.
• A third group consists of the fast-growing Baltic economies and Ireland. According to the cluster analysis, Cyprus is also included. Labour market flexibility indicators are relatively high, but social protection is lower than in the EU overall, with income protection also at a low level.
• The fourth cluster consists of old Central European EU Member States – Austria, Belgium, France, Germany, and Luxembourg. Social protection is relatively high in these countries, but tenure is also relatively high, hinting at a rigid labour market.
• Greece, Italy, Malta, Portugal, and Spain form a fifth group, characterised by poor labour market adaptability and low-income protection, high unemployment and low employment.
• The last group of countries consists of the new EU Member States from Central Europe – the Czech Republic, Hungary, Poland, Slovakia, and Slovenia. Labour market mobility in this cluster is relatively low, long-term unemployment high, while the employment rate among older people is low. These results indicate that labour market adaptability is also relatively low.
Whereas the clusters arrived at in the three studies do not coincide completely, it is notable that countries with high average job mobility indices come out on the high end of the flexibility axis in all the regime models. Likewise, countries with low flexibility tend to display low mobility indices. If we look at the other axis that defines the regimes (in Employment in Europe: ‘Security’ and in European Foundation: ‘Employment sustaining policies’), there does not seem to be any relationship between a country’s position on this axis and its average mobility index.

73
Table 2.6: Flexicurity clusters, employment regimes and mobility index Cluster description
Countries Flexicurity Clusters
(Employment in Europe
terminology)
Employment regimes
(European Foundation terminology)
Flexicurity clusters (European Foundation
terminology)
Average job mobility index21
DK, FI, SE, Nordic Social Democratic Countries often used as benchmarking models
High
UK Anglo-Saxon Liberal Fairly liberal and flexible High EI Anglo-Saxon Liberal Labour market flexibility high,
social and income protection low
Medium
NL Nordic Conservative Fairly liberal and flexible Medium AU, BE, DE, FR,
Continental Conservative Social protection relatively high, tenure relatively high
AU, BE, DE low; FR medium
ES, PT, GR, Mediterranean Mediterranean Poor labour market adaptability and low income protection, high unemployment and low employment
PT low, ES and GR medium
IT Eastern European + Italy
Mediterranean Poor labour market adaptability and low income protection, high unemployment and low employment
Low
MT Not included Mediterranean Poor labour market adaptability and low income protection, high unemployment and low employment
Medium
CY Not included Mediterranean Labour market flexibility high, social and income protection low
Medium
LUX Not included Conservative Social protection relatively high, tenure relatively high
Low
EE, LT, LV Not included Post-socialist liberal Labour market flexibility high, social and income protection low
High
HU, PL, CS, SK Eastern European
Post-soc. conservative
Labour market mobility relatively low, long-term unemployment high, employment rate among older people low.
Low, except HU (medium)
SL Not included Post-socialist Conservative
Labour market mobility relatively low, long-term unemployment high, employment rate among older people low.
Low
Hence, from an overall perspective, the extent of job mobility seems more related to the flexibility of labour markets than to the security (both high and low levels of mobility may be present in countries with the same level of security but different levels of flexibility and the other way round, i.e. high levels of mobility may be found in countries with very high as well as countries with very low levels of security).
21 ‘High’ means that the Average job mobility index is > 66; ‘Medium’ means: 33<Average job mobility index<66; ‘Low’ means Average job mobility index <33

74
2.7 Summary and conclusions On the basis of available survey data, we have described and analysed job mobility in Europe along three different dimensions: job-to-job mobility, occupational mobility, and employment mobility. For each of these dimensions of overall job mobility, we have considered differences between countries, just as the significance of key background variables (gender, age, education) for job mobility has been discussed. Several cross-cutting conclusions can be formulated on the basis of the descriptive analysis.
Significant cross-country variation in job mobility First and foremost, there are significant differences between countries when it comes to the degree and specific character of job mobility. Both as regards job-to-job mobility, as regards employment mobility and as regards occupational mobility, there are marked differences between the countries with the highest rates of mobility and the countries with the lowest rates of mobility. Average job duration, which is an indicator (inverse) of job-to-job mobility, ranges from less than 5 years in Denmark and 6-7 years in the UK, Latvia, Lithuania and the Netherlands to more than 10 years in Portugal, the Slovak Republic, Austria, Malta and Slovenia. Average job tenure ranges from less than 8 years in Latvia, the UK, Estonia, Lithuania, Hungary and Denmark to more than 12 years in Belgium, Portugal and Malta. The share of voluntary job changes with the last five years is significantly higher in the UK, Latvia and Malta, for instance, with more than 14% of the adult population having experienced voluntary job changes during the past 5 years, whereas in Poland, Malta, Portugal and Greece, less than 5% of the adult population have experienced voluntary job changes within the last five years. The countries found in the analysis to display particularly high figures for job mobility (Denmark, Sweden, Finland, the UK, and the Baltic countries), are characterised by relatively low job tenure, high employment rates and relatively low long-term employment rates. These countries are characterised by high degrees of external flexibility in their labour markets aided by weak employment protection legislation for both permanent workers and temporary workers and hence a low share of temporary work. In these countries, we also find a positive relation between educational level and job mobility. The higher the educational level, the higher the incidence of voluntary job mobility. In contrast, in low mobility countries such as Portugal and Italy, we find a higher share of workers on temporary contracts, possibly as a result of the high costs that arise from hiring and firing workers on permanent contracts. This gives support to a hypothesis that such countries address the need for flexibility in the labour market using temporary workers. Furthermore, we find in these countries an inverse relation between educational level and job mobility. The lower the educational level, the higher is the level of job mobility. The higher levels of job mobility among the lowly educated in these countries may be explained by their higher shares of temporary employment and stricter EPL creating gaps between ‘insiders’ with well protected permanent employment and ‘outsiders’ with more unstable labour market relations. In medium mobility countries such as Spain, the Netherlands, and France, employment protection legislation is also quite strict. In these countries, however, efforts are being made to

75
improve the conditions for temporary workers, thus making temporary work a more attractive option for persons outside the labour market. As for occupational mobility, a similar picture applies. Looking at whether respondents’ current job requires more, the same or fewer skills than the previous job, we find that the upward movement is highest in countries with a high share of workers having changed employers once or more. In other words, higher rates of job mobility are associated with higher rates of upward occupational mobility. In Denmark for example, the total share of workers having moved upward is 72.4% (67.8 experienced an upward move connected to a change of job while 4.6% moved up within the organisation). This is about the same level as other countries with high levels of job mobility such as Estonia (73.3%), Sweden (69.5%) and the UK (72.2%). In contrast, the upward mobility is lower in countries such as Greece (47%), Spain (45.8%), Portugal (57%) and Austria (60.3%). The same pattern applies when measuring occupational class mobility, where upward mobility implies that the workers’ current occupational class is higher than the occupational class at labour market entry. Upward occupational class mobility is highest in the Social Democratic regimes such as Denmark and Sweden, the liberal countries such as the UK, and the liberal-type post-socialist regimes in the Baltic countries. In the UK for instance, 32.8% have experienced upward mobility and the same level is found in Estonia (33.3%). Conversely, the upward occupational class mobility is lower in the conservative welfare regimes of the continental European countries such as Germany 15.5%), Austria (16.3), Belgium (16.4%) and Luxembourg (18.2%). The lower occupational mobility in these countries may be related to the stronger EPL, the transfer-oriented labour market policies and the high degree of occupational specificity of the schooling system in these countries, which impede occupational category moves. As to employment mobility, we find the same differences between high mobility and low mobility countries. Measured by the broad concept of ‘transitions in the labour market’ (employed in the 2005 Eurobarometer survey) more than 25% of the adult population has experienced such transitions during the past 5 years in Denmark and the UK and close to 25% in Estonia, Sweden and Latvia. At the opposite end of the scale, this is the case for less than 10% in Malta and little more than 10% in Slovenia, Poland, Austria and Portugal. Measured as the sum of movements in and out of the labour market (on the basis of Labour Force survey data, covering 18 European countries), the share of the adult population who experiences such transitions is significantly higher in Denmark and Finland (ranging from 11.5% to more than 19%) than in Italy, Luxembourg and Greece, for instance, where the sum of such movements where below 6% in 2005.
The mobile labour markets: the North, the Baltic countries and the Anglo-Saxons In sum, we can single out a number of EU labour markets in which job mobility is higher than in the rest of the European Union, and has a somewhat different character. The UK, Ireland, Denmark, the three Baltic countries, the Netherlands, and to a lesser extent Sweden, stand out in this respect. Average job tenure is lower in these countries than in the rest of the EU (for most of the countries significantly lower); voluntary mobility makes up a significantly higher share of all job mobility in these countries; occupational mobility measured as changes in job title is higher

76
in these countries than in the rest of the EU, and – for the countries where these data are available – movements in and out of the labour market generally take place at a higher rate than the EU average.
The less mobile labour markets Correspondingly, a number of labour markets characterised by significantly lower job mobility can be identified, but with significant variations depending on whether the focus is on job-to-job mobility, employment mobility or occupational mobility. Relatively rigid labour markets thus include most Southern European EU Member States (Greece, Italy, Spain, and Portugal), a number of Central European Member States (Austria, Germany, the Czech and Slovak Republics, Poland) and also to a lesser extent, Belgium and France.
Significant differences in mobility related to background factors – but depending on the country In line with theoretical assumptions, the multivariate analysis confirms significant relations between background factors such as gender, age, sector, educational level, level of EPL, type of contract etc., and the level of job-to-job mobility. However, a general characteristic of the relations found is that they are quite moderate, which may be explained by the great and in some cases inverse variations across countries. As to educational level for example, at EU-level we find that higher educated workers generally have slightly higher job-to-job mobility ratios than lowly educated. The explanation for this surprisingly weak relation is probably that the relation between educational level and job mobility is very different across countries. In some countries, such as The Netherlands, Germany, Finland, Estonia, Belgium and the UK, for example, most of the ‘movers’ have medium or high levels of education. The opposite pattern applies in southern European countries such as Italy, Greece, Portugal and Spain where most of the ‘movers’ have low educational level. The high levels of job mobility among the lowly educated in these countries may be explained by their higher shares of temporary employment and stricter EPL creating gaps between ‘insiders’ with well protected permanent employment and ‘outsiders’ with more unstable labour market relations. This pattern also applies to sector as background variable. The multivariate analysis indicates that the relation between sector and job mobility is quite weak which may be explained by cross-country variations within the same sector. In agriculture and fishing for example, average tenure is very high in some southern European countries such as Portugal (22.1 years) Greece (23.4 years), Slovenia (25.3 years), Cyprus (20.9 years) but much lower in the Baltic countries (7.7 – 8.4 years) and Hungary (10.9 years). The same pattern and span of variation in average tenure is seen in other sectors. These considerable variations across countries indicate that it is only to a limited extent the character of the sector itself that explains variations in average tenure, which will have to be ascribed to country specific sector dynamics and labour market framework conditions.
Age significant, gender not so significant Men generally tend to have higher tenure than women, resulting in higher job-to-job mobility levels for women than for men. Women’s higher job-to-job mobility may reflect that they have more frequent transitions due to maternity leave or household duties. However, in some countries, such as Poland, Portugal, and the Slovak Republic, the gender differences are quite small, and in the Baltic countries we find the opposite pattern. Such variations across countries

77
indicate that there is no general correlation between gender and job tenure, and that country-specific labour market factors and gender segregation may account for most of the differences. Age is the most significant factor influencing job-mobility. Overall, job mobility is higher among the younger age groups, 25-34 years and 35-44 years than the older age groups, 55-64 years and 65+. The pattern of decreasing job change with age roughly applies to all countries. The differences between countries in this respect are relatively modest.
Analysis of the costs and benefits of different forms of job mobility required To which extent do the identified patterns and trends as regards job mobility in Europe constitute a problem? What can be said about good, worse or even optimal levels of job mobility? The descriptive analysis above has hinted at some possible answers to these questions, but a description of trends and patterns can only be the starting point. In order to arrive at conclusive answers to these questions, a more systematic analysis of the economic and social effects or job mobility is required. This is the subject of the following chapter.

78
3. Economic and social effects of job mobility Whereas the preceding chapter has shed light on the extent and character of job mobility in Europe and its underlying causes, this chapter will focus on the economic and social effects of job mobility. This discussion will rely on a review and analysis of existing evidence from research, supplemented with relevant information from the datasets analysed above. In chapter 4 we will then present and discuss a comprehensive model of the causes and effects of job mobility in the form of a multivariate path analysis. The analysis of the effects of job mobility concerns potentially very complex issues. This is so for several reasons: • Effects of job mobility may be of a different nature and concern vastly different outcomes.
The current study relies on a basic distinction between economic and social effects. • Effects may be analysed at different levels, for instance at the level of individuals, at the
level of enterprises or economic sectors and at the level of entire societies. • Effects may be caused by different types of transitions in the labour market, i.e. job-to-job
mobility, i.e. the change of employer; employment mobility, i.e. movement in and out of the labour market or the change from one professional status to another; or occupational mobility, i.e. the change of an individuals’ employment from one occupational group to another.
It must also be considered that job mobility can be treated as both a direct cause of certain effects and as an outcome of other forces shaping the economy. Thus, job mobility may affect economic growth, but it is even more likely that economic growth affects job mobility rates. Therefore, if we find a positive relationship between job mobility and economic growth, we cannot exclude the possibility that the causality runs from economic growth to mobility. It is likely that more growth leads to more mobility, but the relationship is probably non-linear, i.e. job mobility may increase with increased growth, but the relation may be weak at very low or very high growth rates, for instance. The relation between growth and job mobility is also likely to be related to the business cycle, with the relation probably being stronger at the top of the cycle, with a high degree of factor utilisation and low unemployment, than at the bottom of the cycle where labour is plentiful. Similarly, a high level of job mobility may also be associated with positive social effects, such as a for instance a rapid spread of new competences at the level of entire societies. Again, it cannot be ruled out that job mobility is the result of competence development rather than the opposite, to take an example.
3.1 A framework for analysing economic and social effects of job mobility The following sections provide an analysis of the effects of job mobility. The analysis is informed and structured by an analytical perspective which allows us to distinguish between economic and social effects (and causes) of job mobility.

79
• Economic effects are those effects that pertain to the production, distribution and/or consumption of goods and services. Effects on productivity and wages, innovation and employment are the most immediately relevant types of economic effects in the context of job mobility.
• Social and political effects of job mobility are effects that are not or cannot be expressed in
economic terms, but which may certainly be related to economic effects. At the individual level, such effects may include effects on individual self-esteem, behaviour or perceptions; at the enterprise level, effects may pertain to loyalty to workplace or involvement in trade unions, at the societies level effects pertain to equity, family structure, social stratification or social cohesion. Social integration and social stratification are two key concepts which capture the essence of social effects at the level of societies.
Figure 3.1 below illustrates a framework for the analysis of social and economic effects of job mobility, as well as of the causes of job mobility. Figure 3.1: A simple framework for analysing aggregate causes and effects of job mobility
The framework does not intend to capture all types of factors that may cause or be the effect of job mobility but shows only the most important ones. This is a deliberate choice: • Concerning effects of job mobility, the explicit focus of the current study is on economic
and social effects of job mobility, not on other types of effects (political, environmental etc.).
• Concerning causes of job mobility, focus is on the effects of economic growth on mobility and on the ‘institutional environment’ of job mobility as two important categories of drivers, both of which are highly relevant from a policy-making perspective. Other factors will influence the mobility decisions of individuals and firms, but many of these factors
Economic growth
Institutional environment
Labour demand and supply
Mobility incentives (firms, individuals)
Job mobility
Productivity and employment effects
Behavioural and distributive effects
Economic growth
Social integration + stratification

80
(family structure, age, gender etc.) are not immediately relevant for policy-making purposes.
The following sections first address the economic effects of job mobility and discuss the poten-tial two-way relationship between economic growth and job mobility. Theoretical considerations and hypotheses are followed by a discussion of the empirical evidence. After this, the potential social effects of job mobility are discussed – in terms of social integra-tion and/or social stratification. Data sources in both respects are existing relevant research in the field, supplemented with relevant analyses of survey data.
3.2 Job mobility and economic growth
Theoretical considerations Based on prevailing economic theory and current research, how could job mobility be expected to influence economic wealth and growth? And what is the empirical evidence? Economic benefits related to job mobility Looking at benefits first, there are good arguments that job mobility – be it job-to-job mobility, occupational mobility or employment mobility – is associated with significant macroeconomic benefits that impact positively on wealth, growth and employment as well as economic benefits for individuals: • Job mobility may effect, and be affected by, allocative efficiency. Allocative efficiency
entails that the factors of production are utilised efficiently and thus that the economy’s productive potential is larger than in situations of allocative inefficiency. Or, in other words, (potentially) wealthier societies.
• It can be argued that high levels of job mobility are positively associated with allocative
efficiency of labour markets. Job mobility is an indicator that labour is attracted to firms or sectors where demand is high, and where labour productivity and wages are the highest, and that labour is hence leaving less productive sectors and firms. Conversely, low levels of job mobility can be seen as an indicator of the presence of barriers preventing workers from moving to places and occupations where there are vacancies, entailing a resource-market inefficiency which may lead to structural unemployment.
• In a more dynamic perspective, job mobility allows the efficient adaptation of the labour
market to external shocks, such as technological change, trade liberalisations, and changes in relative commodity prices etc., developments which are frequently referred to under the heading of globalisation. Confronted with such shocks, firms may experience changes in their markets that force them to start making other types of products for which they need other types of workers. From the perspective of workers, external shocks may be seen to open up new career opportunities. However, they may also imply that the workers need to be mobile in order to uphold a wage income. From the perspective of society, this adaptation of labour markets to external shocks is an essential element in continuous economic development in market economies or the ‘creative destruction’ (Schumpeter 1975 [1942]: 82-83) by which old structures are destroyed and new are emerging. The ‘old

81
structures’ include enterprises which do not in due time adapt to the changing competitive pressures and the ‘new structures’ include enterprises which have been first and best at adopting new ways of production, at developing new products, new modes of distribution and marketing, new types of services, etc. This dynamic is a key factor behind economic growth (Cf. DTI 2006: 14-20).
• By means of the mechanisms outlined above, job mobility may be one among other factors
that facilitates economic growth by way of adaptation, i.e. by influencing the behaviour of firms and workers as a response to external pressures. However, job mobility may also in itself induce economic development by way of spreading know how, competences and ideas from organisation to organisation, thereby in itself releasing changes in the competitive pressures that affect economic development. The literature on economic clusters and agglomeration effects (e.g. Enright 2000; Porter 1998; Petersen 2001; Poulsen 2002) argues that there are synergies and/or positive externalities in the geographical concentration of particular types of enterprises. The specific dynamics related to these synergies and externalities in part reflect job mobility, for instance in the form of mobility of highly specialised labour from enterprise to enterprise in the cluster which may stimulate innovation and productivity. Theories of national or regional innovation systems (e.g. Freeman 1987; Lundvall 1992; Nelson 1993) also rest on – more or less explicit – assumptions on the positive effects of job mobility for innovation, arguing that the innovation ability in the system depends on the links between different organisations and units in the system, links that are not least constituted by job mobility. Put in another way, this strand of arguments suggests that there may be a positive relationship between multifactor productivity and job mobility.22
• At the individual level, changing jobs or occupation mobility may lead to an increase in
individual income. We would expect this to happen, because individuals will look for more rewarding jobs, where wage is one component in the reward, and because individuals will attempt to compensate for search costs by demanding a higher wage in a new job than in the present job (bidding up the wage). We would however also expect that this mechanism plays out different according to the situation of the job seeker. On-the-job search theory suggests that both the hazard rate of leaving the current job and the difference between the current wage and the reservation wage are decreasing with the current wage. A low-paid worker expects more job changes in his working life than a high-paid worker in order to improve his earnings. Therefore, compared to a high-paid worker, the wage difference necessary to make a low-paid worker quit his job in favour of a new job is higher relative to the current wage (van den Berg 1992 quoted by Pavlopoulos 2007). In this way, the low-paid worker reduces the costs related to the job-change, as he can attain his preferred life-time earning level in fewer steps. Should workers receive wage offers relatively close to their reservation wage, then the wage gains from a job change are relatively higher for the low-paid than for the high-paid worker. In addition, we would also expect that there is a limit to the number of times within a labour market career that an individual can push up his or her wage by being mobile. The reasons for this being that ‘reputation capital’ in the form of CV and recommendations of previous employers are important parameters when determining the wage level of a new employee, and this type of capital needs at least some time to be built up. Further, we would expect that at the individual level, the wage outcome
22 Multifactor productivity can be defined as Output/(KLEMS) where KLEMS represents all production inputs: K is capital services, L is labour services, E energy, M materials and S refers to purchased services.

82
will be determined by the nature of the quit (voluntary or forced). Individuals who have been fired by their previous employer and who have perhaps experienced a period of unemployment are not able to command as high a wage as those who have not had these ‘scars’ as these experiences are frequently referred to in labour market economic literature.
If high job mobility is associated with high allocative efficiency, a good ability of labour markets to adapt to external shocks and changes, and a positive effect on innovation and productivity in connection with enterprise clusters, it could thus readily be concluded that in terms of economic growth and efficiency the more job mobility the better. High job mobility would thus indicate flexible and well-functioning labour markets with a strong flow of knowledge and competences from enterprise to enterprise. Positive economic effects at the individual level in terms of wage increases may, however, be differentiated, and effects may differ according to whether the total number of moves are distributed on few or many individuals. Economic costs related to job mobility The relationship between job mobility and economic growth and efficiency is significantly more complex than this clear-cut positive picture, however. Thus, although job mobility is an important mechanism to maintain an efficient allocation of labour and may be connected with certain benefits in terms of productivity, it also involves significant costs. • Investment in ‘specific training’ by workers and firms may be wholly or partly lost as a
consequence of job mobility. ‘Specific training’ is defined in this context as training that increases the worker’s productivity only in the firm providing the training. In contrast, ‘general training’ refers to processes that improve the productivity of the worker by the same amount in the firm in which the worker undertakes the training and in other firms (Sapsford and Tzannatos 1993: 104-105). Firm investments in specific training will be lost if job mobility is high and trained workers leave an enterprise for another. The size of this loss will depend on several factors such as the size of the investment, the rate of return in terms of productivity improvements following specific training of the worker in question, and the distribution of these returns over time. The smaller the investment, the higher the rate of productivity return and the quicker the productivity effects, the sooner will investment in specific training of a worker yield positive returns from the firm, and the shorter the required duration of employment with the employer before the firm’s investment in specific training will yield positive returns. However, even if job mobility is so low that investment in specific training yields a positive return for the firm, there may be opportunity costs involved in job mobility, as the yield from investment in pure specific training would have even higher if the worker had not left.23 Society’s aggregate return on investment in pure specific training will be the aggregation of returns at the level of firms and workers, and will be affected by the same factors. In the event that training is partially
23 Lost investments in specific training in connection with job mobility have been used to explain firms’ preference for a more tenured workforce. This preference is demonstrated by the fact that standard wage equations consistently show that more tenured workers earn greater wages: An additional year of tenure increases the wage by about two percent, even after controlling for other variables (e.g. Farber 1998). According to the “firm-specific capital” explanation (cf. Becker 1962; Jovanovic 1979), tenure is a mechanism that allows firms to invest in workers over time as it minimizes the risk of having the employee leave. Firms invest in specific, on-the-job training which results in an increase in worker productivity. Because this training is specific to the firm, it is optimal for employers to share some of the returns to the investment with workers in order to retain them and thus avoid costly labour turnover. Yet, the worker does not immediately receive all of the gains from the increased productivity in the form of wage increases: By delaying some of the returns to increased productivity, and paying them as “tenure rewards”, workers are less inclined to leave the firm, as they would give up these earnings.
83
general, i.e. yielding positive productivity effects in other firms, aggregate losses will be smaller.24
• Formal training is not the only means to increase worker productivity. Productivity may
also be positively correlated with job tenure, reflecting that productivity increases may depend on other forms of learning in the workplace than training. From the perspective of the firm, there may be productivity losses from employees leaving and new employees being hired. However, productivity differences may be reflected in wage differences. For this reason, decreasing productivity does not necessarily translate into costlier production and a loss of competitiveness. From the perspective of society, the size of productivity losses from job mobility depends on the difference between the productivity of workers before and after job mobility. There will be an aggregate loss of productivity if average worker productivity levels are lower for workers who have recently switched jobs or job functions than for workers with longer job tenure. There may also be dynamic aggregate productivity effects, if there is a relation between productivity growth and job tenure. One possibility is that productivity grows most rapidly after an employment relationship of certain duration. In this instance, job mobility which entails lower average job tenure than this duration will affect productivity growth negatively.
• In addition to the low productivity of new staff, hiring new staff is in itself a source of costs
for the firm. The direct costs of recruitment include resources spent in the screening of potential new employees and in the recruitment processes. Hiring new staff can be compared with investment in specific training, in so far as it represents an investment which will only yield a return after a period of time, as new employees need instruction and at least some training in order to be productive. The return of this investment may be negative if new employees stay with the firm for a relatively brief period. From the perspective of society, the costs of hiring new staff can be viewed as a transaction cost, i.e. a cost incurred in making an economic exchange. As such, costs of hiring new staff is factor of friction which inhibits the efficient functioning of markets.
• Job mobility may frequently involve search costs for the worker, not only direct costs such
as the travel expenses incurred in visiting firms, but also various opportunity costs, including foregone leisure or income, from the time spent writing applications, visiting firms etc. From the perspective of society, such search costs are – as costs of hiring new staff – to be considered a transaction cost.
An optimum level of job mobility? There are therefore both positive and negative economic wealth and growth effects of job mobility, seen from the perspective of society. Judged on the basis of the arguments presented above, the balance between these positive and negative economic effects is likely to vary with the level of job mobility: • Very low levels of job mobility will entail very significant costs as this situation corre-
sponds to a poor allocation of productive resources and a weak capacity of the economy to adapt to external shocks. Efficient resource allocation must be considered quite
24 Most forms of training will have a significant general component. Even training in the operation of specialised systems, for instance, is likely to have an impact on the employees capacity as regards a more general “systems management” competences.

84
fundamental for economic wealth and growth. Very low levels of job mobility may also hamper the diffusion of knowledge, competence and ideas across the economy and thus inhibit innovation and structural development.
• Very high job mobility is likely to be associated with very significant transaction costs and with sizeable losses incurred from human capital investment. It may also be associated with significant aggregate productivity losses.
Figure 3.2: The possible relationship between economic growth and job mobility
These observations are compatible with a hypothesis that everything else being equal, there is an inverse U-shaped relationship between job mobility and economic growth; cf. Figure 3.2. Thus, in a situation with a very low level of job mobility, job mobility may contribute negatively to growth. Correspondingly, very high levels of job mobility may also contribute negatively to growth. The point M defines an optimum level of job mobility where the contribution of job mobility to growth is largest. Thus, a situation of very low job mobility is likely to be caused by other factors, such as for instance strict employment protection legislation or other types of stifling regulation, which is likely to affect growth negatively. Similarly, very high levels of job mobility may be the cause of overheating labour markets caused by unsustainable macroeconomic policies that will have adverse effects on growth over time. These observations reflect the fact that job mobility must to a high extent be considered an effect of other factors which are perhaps more significant for growth than job mobility itself.
Job mobility and economic effects: empirical evidence These reservations having been made, what is the empirical evidence in support of the different costs and benefits of job mobility mentioned? Is there evidence supporting the existence of optimum levels of job mobility, and what can be said about this optimum level if it exists?
M
0
Extent of job mobility
Contribution to economic growth

85
Job mobility and allocative efficiency in labour markets There is evidence that high job mobility is associated with a high degree of allocative efficiency in labour markets. Thus, looking at the wage differential between people with high and low mobility, a recent cross-country comparison indicates that the wage differential decreases with mobility, suggesting that higher job mobility increases the allocative efficiency of the labour market (Borghans and Golsteyn 2005). The empirical results, however, also suggest that there are large differences between countries in the allocative efficiency which are not related to mobility. Average job tenure and productivity Evidently, a key question in relation to the economic effects of job mobility concerns the relation between productivity and job mobility. Job tenure – the length of time that workers remain in their present job – can be interpreted as an indicator of numerical flexibility or stability in the labour market (Auer and Cazes 2003). Figure 3.3: Tenure and labour productivity growth
Source: Auer et al. 2004. A simple plot illustrating the relationship between changes in average job tenure and labour productivity growth suggests that there is a positive relationship between job tenure change and labour productivity growth – and by implication a negative relationship between the degree of job mobility and labour productivity growth. Figure 3.3 above plots the labour productivity growth 1992-2002 against the change in average job tenure for 14 OECD countries. As it appears, countries with positive changes in average job tenure have experienced higher labour productivity growth than countries with small or negative changes in average job tenure. Regression analyses underpin the existence of a positive relationship between job tenure and labour productivity. Blakemore and Hoffmann (1989) studied job tenure and manufacturing productivity, merging output data from the U.S. manufacturing sector with aggregate tenure data from population surveys. The model specifies short-run productivity as a function of the share of workers with different levels of tenure, since workers with longer or shorter tenure have received different amounts of firm-specific skills (i.e. specific training, cf. the discussion

86
earlier). Other explanatory variables include the ratio of real output to potential output as well as a time trend to control for long-time general trends in capital growth, educational attainment and labour force experience. The model estimated is simple, based on 63 observations from 1963 to 1981. • The authors find that for every one percent increase in the median year of job tenure in
manufacturing, labour productivity increases 0.39 percent. The authors argue that the findings support a hypothesis that seniority rules are established to increase productivity in firm-specific capital models. Auer et al. (2004) adopt a similar, though cruder, method, constructing a model with the use of pooled sectoral productivity and tenure data for 13 European countries for the years 1992 to 2002. Labour productivity is regressed on average tenure by sector, as well as on country and industry dummy variables. In total there are 822 observations. As in the Blakemore and Hoffmann study, it is assumed that in the short run, only firm-specific skills (specific training) will affect labour productivity, since the other variables that affect labour productivity, ability and general training (general training or education), are long-run variables. As there are no data on capital investment by sector, firm size, or other variables that affect sectoral productivity, industry and country dummies are used to control for these unobservable factors. Dummies are also used to control for business cycle effects. • The results indicate a positive and significant association between job tenure and labour
productivity. Estimated as logs, the coefficient indicates that a one percent increase in the average rate of tenure will increase productivity by 0.16 percent.
Class of job tenure and productivity Focusing on average job tenure can mask underlying patterns in the labour market, such as the existence of partial labour markets, sectors or firms with a stable core of long-term workers surrounded by temporary workers at the periphery, the existence of specific sectors or firms with a high overall turnover of labour etc. A study by Kramarz and Roux (1999) distinguishes between different groups of employees according to their job tenure. Using an employer-employee data set that covers private sector employees in France for most of the years between 1975 and 1995, the authors are able to compute the amount of time that an employee has been at that firm and, because of the firm-level data, control for the capital-labour ratio as well as the skills structure of the work force. To estimate the effects of job tenure on firm productivity, workers are grouped according to how long they have stayed on the job (less than one year, 1-4 years, 4-10 years and more than 10 years, with workers with more than 10 years of tenure used as a control). • The authors find that employing workers with 4-10 years of tenure has the most beneficial
effect on productivity, as a one percent increase in the share of this group increases firm productivity by 0.36 percent. The productivity effect of increasing the 1-4 year tenure group by one percent increases firm productivity by 0.05 percent.
• As opposed, a one percent increase in the proportion of workers with less than one year of tenure has a negative effect on productivity, lowering productivity by 0.02 percent.

87
Auer et al. (2004) analyse whether greater bifurcation in class of tenure affects productivity, distinguishing between those have been less than one year on the job (very short job tenure), those with more than 10 years of tenure (long tenure) and those with more than 20 years of tenure (very long job tenure). • The authors conclude that increasing the share of workers with very short or very long
tenure will have a negative effect on productivity. Doubling the share of workers with more than 10 years of tenure will cause productivity to fall by 1.8 percent. A doubling in the share of workers with more than 20 years of tenure has a much greater negative impact, causing a productivity drop of 9.2 percent.
• For short-term workers, the effect on productivity is also negative and significant, with a one percent increase in the share of workers with less than one year tenure causing productivity to decline by 4.2 percent.
The finding that an abundance of workers with very short job tenure – perhaps because they are employed on short-term contracts – will affect productivity negatively is supported by conclusions from other studies. Licthenberg (1981) found that workers with 0-6 months of tenure in the durable goods industries were only 24 percent as productive as workers with over two years of tenure; workers with 7-24 months experience were 65 percent as productive. In the non-durables industry, workers with 0-6 months of tenure were only 5 percent as productive as those with two years of tenure, while workers with 7-24 months job tenure were 54 percent as productive. When does job tenure affect productivity negatively? The finding that increasing the share of workers with long or very long job tenure affected productivity negatively led Auer et al. (2004) to estimate the point at which the return from tenure begin to diminish. To examine this, the authors estimated another model on tenure and tenure squared, based on the assumption that tenure is increasing but concave. • The analysis revealed that aggregate tenure has a positive effect on productivity, at least
until 13,6 years. After than point, the benefits of increased average tenure on sectoral productivity disappear and eventually turn negative.
The authors also discuss whether there is a point in duration of employment at which the increase in the wages in a particular sector as a result of tenure exceeds the effect of tenure on productivity. They find that during the period 1992-2002, this point was reached after 27,3 years on the job in the 13 European countries covered by the study. Given that average tenure in the author’s sample is 10,6 years, the authors conclude that from the perspective of firms, there is little risk that firms will reach the point in which the wage bill from tenure exceeds it productivity gains. It should be noted, however, that what is rational from the perspective of the firm is not necessarily so from the perspective of society. The conclusions of Auer et al. (2004) indeed suggest that on average it is likely to be beneficial for firms to retain workers up until approximately 27 years of tenure, because the effect of job tenure on wages is smaller than the positive effects on productivity for much of duration. From the perspective of society, it is not the difference between productivity and wages, which is interesting. Rather, what should be optimised from the perspective of society is productivity itself, which concerns how efficiently

88
resources are utilised in production. Thus, from a societal perspective, the interesting figure is the point in time when increased tenure leads to negative marginal productivity gains. According to the results of Auer et. al. this happens at 13.6 years. On average, job tenures exceeding this figure will contribute negatively to overall labour productivity. Job mobility and innovation Focusing on job tenure is one way to explore the relation between job mobility, productivity and economic growth. Another possibility is to focus on innovation. As mentioned previously, both the literature on clusters and agglomeration and the literature on national and regional innovation systems emphasise the potentially positive role of job mobility for innovation as a channel through which to diffuse knowledge and ideas. Available empirical evidence paints a more complex picture, however. In a comprehensive study of 2800 Italian firms over the period 1985 – 1991, Pacelli et al. (1998) found that workers in innovative industries have a much lower probability of separation – i.e. quits plus layoffs from the firm of employment – than workers in traditional industries, after controlling for other firm and worker characteristics. As Figure 3.4 below demonstrates, the separation rate increases from 18.3 to 31.1 when comparing firms in high innovation intensity sectors with firms in low innovation intensity sectors. The authors argue that this supports the hypothesis that more innovative firms cultivate more resilient employer-employee relationships.25 Figure 3.4: Separation rates and innovation intensity, Italian private sector 1985-1991
Innovation intensity Firm size (employees)
Low
Medium- Low
Medium-High
High
All firms 31.1 28.4 18.7 18.3 1-19 43.7 41.5 32.8 35.1 20-199 26.7 23.3 21.2 22.4 200-1000 17.7 18.3 15.0 14.2 >1000 17.2 18.9 10.4 13.4
Separation rates measured by the average monthly separations (quits plus layoffs) on the monthly stock of employees. The separation rate is 100*separation/employment. Source: Pacelli et al. 1998: 290-291. • On the other hand, Pacelli et al. also find that job-to-job moves – which are a subset of all
separations defined as quits not interrupted by unemployment spells – are much more frequent in more innovative sectors than in more traditional ones, as well as more common among non-manual workers than among non-manual ones.
Thus, the share of separations among non-manual workers which are job-to-job moves uninterrupted by unemployment spells increases from 23% to 29% when comparing small firms in low innovation-intensity sectors to small firms in high-innovation intensity sectors. Looking at firms with 200 to 1000 employees, the difference is even bigger. Job-to-job
25 Greenhalgh and Mavrotas (1991) also find a negative relation between R&D expenditures and innovative investments on the one hand and separations on the other hand. The conclusion that innovative firms promote resilient employer-employee relationships is supported by Miche & Sheenan (2003), who – using primary data on UK firms – find a negative correlation between innovating firms and a lack of employer commitment to job security, the use of short-term and temporary employment contracts and low levels of training. They find that low labour turnover and functional flexibility are positively correlated with innovation and they argue that this “may reflect the importance of employees’ tacit knowledge for the successful introduction of process innovations” (p. 139).

89
mobility makes up 34% of all separations in low-innovation firms, but 53% of all separations in high-innovation firms. Among manual workers, the share of separations between firm and employee which is job-to-job mobility uninterrupted by unemployment spells is generally significantly smaller than for non-manual workers, ranging from 23% in low-innovation firms to 38% in high-innovation firms. Still the trend is clear. Voluntary job-to-job mobility makes up a larger share of all separations in high-innovation firms than in low-innovation firms. These figures can be interpreted in different ways, of course. Is job mobility good for innovation? Or does the innovation-intensity of a firm affect the nature and extent of job mobility to and from the firm? Pacelli et al. cautiously conclude that the innovative intensity of an industry appears to have a positive effect on the share of job-to-job moves, while there is some evidence that it lowers the chances of separation. At the same time, the result is certainly linked to the higher demand for labour in high-intensity innovation sectors, where employment is growing (Pacelli et al. 1998: 296-7). However, the figures are also compatible with an interpretation according to which job-to-job mobility of non-manual workers contribute to the innovation intensity and employment growth of firms – and with an interpretation where this dynamic only to a very limited extent is valid for manual workers. The positive relationship between job-to-job mobility and innovation for knowledge workers is confirmed by other studies. Zucker et al. (1998) for instance find that the presence and the geography of star scientists (i.e. highly productive scientists) strongly affected the localisation and the performance of biotechnology firms in California. This result suggests that productive scientists are expected to be mobile between firms and that this expectation can plan a very relevant important role in the creation and success of firms. Zucker et al. (2002) further explore the causes of scientists’ movements from universities to private firms and find that their scientific productivity and the quality of their scientific production positively affect the probability of moving away from academia. This is interpreted as the result of an explicit strategy adopted by scientists in order to appropriate and exploit the economic returns of the knowledge that they have developed and possess. On the other hand, it is also concluded that these movements are an extremely important source of knowledge transfer from academia to business, and that it is the presence of formal and informal links between universities and firms, through scientists’ movements, which create localised knowledge spill over from universities to firms. Studying mobility patterns of a group of Italian inventors in the pharmaceutical sector on the basis of patent and survey data, Lenzi (2006) find that apart from variables such as labour market experience and gender, the innovative productivity of inventors (measured as the average number of patents filed in the last employment divided by the number of years in that employment) significantly affects job mobility, and that the more radical and valuable inventions are (measured by the average number of citations made per patent in the last employment), the higher the propensity to job mobility. Based on a survey of German inventors who hold at least one granted patent, Hoisl (2006) found a causal relationship between inventor mobility and inventive performance, with mobile inventors being more than four times as productive as non-movers.

90
High inventive productivity and the quality of the knowledge produced thus affects job mobility positively. On the other hand, this can also be seen as an indication that inventors represent attractive human capital and that their mobility allows the transmission of ‘good knowledge’ from firm to firm (see also Song et al. 2003). In this connection, Hoisl (2007) provides evidence that mobility increases the productivity of inventors, as grants received and citations of mobile inventors increase. Job mobility and wages An American study from the 90’s (Keith and McWilliams 1995) indicated that the direction and magnitude of wage effects (positive or negative) depend on the type of cumulative mobility examined e.g. whether the job-shifts are employee-initiated or employer-initiated. This is confirmed more recently by a cross-European study (Davia 2005). • The study finds that individuals who experience voluntary transitions tend to register wage
gains in their new jobs, although this finding is significant only in Italy and Portugal. • On the other hand, dismissed employees or those whose employment contracts came to an
end register wage losses. Workers, who experience an employment interruption and go through an unemployment or inactivity spell between two jobs, suffer relative wage losses when they re-enter employment. Wage losses are more intensive when job interruptions imply an inactivity spell than when they are related to unemployment. This is the case in all the countries of the study except in the UK, where the effect of both types of transitions is similar and very small.
Examining European data, Ignacio and Pérez (work in progress) find further evidence that it is relevant to differentiate job mobility by the type of separation from the job (voluntary or involuntary). The results indicate that voluntary job mobility has positive wage returns in Denmark, Ireland, United Kingdom and France while involuntary job changes generate negative returns ranging from 20% to 50% in all countries. Finally, Stevens (1997) found long-term effects of involuntary displacements on wages which go beyond the period immediately following the job loss. However, wage returns to mobility depend not only on whether the move is voluntary or involuntary. • Recent studies of US and European data quoted by Pavloupoulos et. al. indicate that
voluntary changes of employer produce wage gains in the US and in Europe. However, these gains decrease with age as well as with tenure, and with the number of job changes.
• Using panel data for the UK and Germany, Pavlopoulos et. al (2007) show that the relative wage returns to job changes is higher for the low-paid worker in both countries.
Hence, wage effects of mobility depend critically on how mobility is distributed among different age, tenure and income groups, and we wage gains can thus be expected to be highest for labour market entrants with little previous labour market experience. Aggregate demand effects of employment relationships The empirical evidence on the effects of job mobility on economic growth and individual income so far has been based on firm and individual level arguments and analyses. Although the microeconomic effects of different types and degrees of job mobility may sum to benefit an

91
economy’s overall productivity, the average level of job mobility or job tenure can also have unique aggregate effects on an economy. • At the aggregate level, a strong incidence of stable employment relationships can thus
arguably help an economy by ensuring constancy of aggregate demand. The financial stability created by long-term employment relationships creates economic stability as steady and growing purchasing power over the life cycle becomes a positive source of consumption and thus sustained aggregate demand growth (Auer et al. 2004: 17).These arguments are difficult to support by strong empirical evidence directly focusing on identifying the macroeconomic effects of stable employment relationships. However, prevailing economic theory assumes normally assumes an inverse relationship between household savings rates and employment rates.
Aggregate employment effects of job tenure Against this background, it is tempting to conclude that stable jobs are good for the economy, as average job tenures exceeding 10 years are not only good for productivity but are also indicative of stable employment relationships which in turn stabilises aggregate demand. However, as highlighted by Auer et al (2004: 19-20), significant correlation can be found between job tenure on the one hand and employment rates on the other hand for a number of industrialised countries, cf. Figure 3.5 and Figure 3.6. As the figures illustrate, the higher the share of workers with more than 10 years of tenure, the lower the rate of employment-to-population; and the higher the share of workers with less than one year of tenure, the higher the rate of employment-to-population. Thus, whereas relatively high average tenure (above 10 years) is probably good for the productivity of the workforce, the factors causing this high average tenure are probably detrimental for employment rates. Low employment rates in turn imply a considerable economic loss for society, as it implies that the productive potentials of the economy are not fully realised. Finally, employment protection legislation (EPL) is a likely factor affecting job tenure (positively) as well as employment rates (negatively).

92
Figure 3.5: Share of workers with more than 10 years of tenure and employment rates, 2005
DK
IE
IT
PT
CZ
HUSK
PL
SI
UK
LU
GR
P
BE
NL
FR
DE
FI AT
ES
40,0%
45,0%
50,0%
55,0%
60,0%
65,0%
70,0%
75,0%
80,0%
25,0% 30,0% 35,0% 40,0% 45,0% 50,0% 55,0%
Share of workers with more than 10 years of tenure
Empl
oym
ent r
ate
Source: Labour Force Survey and OECD. Own calculations
Figure 3.6: Share of workers with less than one year of tenure and employment rates, 2005
DK
IT
SK
UK
BE
CZ
AT
FR
HU
SE
PT
SE
FI
ES
IESI
LU
GR
NL
PL
40,0%
45,0%
50,0%
55,0%
60,0%
65,0%
70,0%
75,0%
80,0%
5,0% 10,0% 15,0% 20,0% 25,0% 30,0%
Share of workers with less than one year of tenure
Empl
oym
ent r
ate
Source: Labour Force Survey and OECD. Own calculations

93
3.3 Job mobility and growth: conclusions In a preceding section, we argued that from a theoretical point of view, we would expect to find both positive and negative economic wealth and growth effects of job mobility, seen from the perspective of society. Furthermore, we argued that the balance between these positive and negative economic effects is likely to vary with the level of job mobility: • Very low levels of job mobility will entail very significant costs as this situation corre-
sponds to a poor allocation of productive resources and a weak capacity of the economy to adapt to external shocks. Very low levels of job mobility may also hamper the diffusion of knowledge, competence and ideas across the economy and thus inhibit innovation and structural development.
• Very high levels of job mobility are likely to be associated with significant transaction costs
and with sizeable losses incurred from loss of human capital investment. It may also be associated with significant aggregate productivity losses.
These observations are compatible with a hypothesis that everything else being equal, there is an inverse U-shaped relationship between job mobility and economic growth. Thus, in a situation with a very low level of job mobility, job mobility may contribute negatively to growth. Correspondingly, very high levels of job mobility may also contribute negatively to growth. The arguments above are also compatible with a thesis that from an economic point of view, and adopting the perspective of society (‘the social planner’s perspective’), an optimal level of job mobility exists. Our review of empirical evidence tends to support or be compatible with these arguments. • A first and significant finding concerns the relationship between job mobility and pro-
ductivity. On the one hand there is relatively strong evidence in support of a positive relationship between job tenure and labour productivity. At the same time, there is evidence suggesting that the positive relationship between job tenure and productivity diminishes with very long job tenure, the steepest contributions from job tenure to productivity taking place during the first 4-6 years of employment with the same employer. One study revealed that aggregate job tenure starts having a negative effect on productivity after 13,6 years of employment with the same employer.
• A second finding concerns the relationship between job mobility and innovation. Job-to-job
moves are found to be much more frequent in innovative sectors than in more traditional ones, as well as more common among non-manual workers than among non-manual ones. Both of these findings support a thesis that job-to-job mobility facilitates innovation (and vice versa), at least for knowledge-workers in knowledge intensive industries. Other studies support the finding that job-to-job mobility is particularly important for innovation in knowledge intensive firms.
• Little empirical research has been found directly providing evidence on transaction costs in
connection with very high levels of job mobility. However, the studies reviewed highlight

94
the opportunity costs involved in very brief job tenure. Productivity increases of labour are strong during the first 4-6 years of job tenure, for which reason job mobility during the first 1-2 years is associated with foregone productivity increases. One study on job mobility and innovation also found that more innovative firms cultivate more resilient employer-employee relationships, a finding which is compatible with an interpretation that there are transaction costs in connection with job-mobility which enterprises seek to avoid. Studies on the wage effects of job mobility have also found that the wage gains from voluntary job-to-job mobility decrease with the number of job-changes, a finding compatible with the interpretation that employers are reluctant to hire workers that can be expected to quit again soon, again pointing to the significance of transaction costs.
At the same time, it is not possible on the basis of available evidence to specify in detail which specific levels of job mobility are optimal seen from the perspective of society. What can be said is the following: • In terms of productivity, a relatively high degree of employment stability is most likely
beneficial, with average job tenures below 9-10 years probably implying an aggregate productivity loss. In certain specific knowledge and innovation intensive sectors, a higher degree of job mobility and correspondingly lower average job tenure is probably beneficial for productivity, at least for non-manual knowledge workers, as this type of job mobility contributes to the spread of new knowledge and innovation from organisation to organisation.
• However, in terms of employment and wealth, the picture is different. An average job
tenure above 9-10 years may be optimal for aggregate productivity of the employed part of the workforce, but if it is the result of underlying factors which have detrimental effects on employment rates, the positive productivity effects on wealth (measured for instance as GNP) of high job tenure is probably more than offset by negative effects of relatively lower employment rates. Our analysis has pointed to a significant correlation between job tenure on the one hand and employment rates on the other hand. In countries with a relatively high share of workers with more than 10 years of tenure, the employment rate is significantly lower than in countries with a relatively low share of workers with more than 10 years of tenure. Conversely, in countries with a relatively high share of workers with less than 1 year of tenure, employment rates tend to be higher than for countries with a lower share of workers with less than 1 year of job tenure.
• Employment protection legislation (EPL) is a prominent possible explanation for the
relation between job tenure and employment rates.26 Thus, there are both theoretical arguments and empirical studies pointing to the effects of EPL on job tenure (positive), as well as on employment rates (negatively) and unemployment rates (positively), cf. e.g. the review in OECD (2004: 62-125).
Theoretically, a more stagnant labour market may - as touched upon earlier - prevent the reallocation of resources from declining industries to growing industrial sectors and this may again have negative implications for economic performance, and ultimately for labour
26 Employment protection legislation (EPL) can be defined as referring to the entire set of regulations that place some limits to the faculties of firms to hire and fire workers, even if they are not grounded primarily in the law, but originate from the collective bargaining of the social partners, or are a consequence of court rulings

95
market outcomes (cf. Hopenhayn and Rogerson 1993). In particular, stringent EPL may be an impediment to the adoption of new technologies and innovation where innovation-driven labour adjustments have to be accommodated through worker turnover (OECD 2003). EPL may also have broader implications for employment relationships than simply governing labour market flows. For instance, it may strengthen the position of protected workers (‘insiders’) in wage bargaining. EPL may thus have negative impacts on employment by raising labour costs indirectly through its effect on bargaining power. Bentolila and Dolado (1994) suggest that this effect could be reinforced by the existence of temporary forms of employment if permanent workers dominate unions and set wages for all workers. Insofar as employment adjustment is likely to fall disproportionately on temporary workers, the bargaining power of insiders under permanent contracts tends to increase with the incidence of temporary work. The consequence would be a widespread rise in wages, damaging labour market performance.
Empirically, the bulk of the studies reviewed in OECD (2004) suggest that EPL reduces overall employment rates, but there is less widespread consensus about its effect on unemployment. However, as pointed out by Baker et al. (2004), both the significance and the magnitude of the estimated effects of EPL on employment and unemployment vary widely across studies.
• In light of these findings, the conclusions seem clear. As both productivity and overall
employment rates are significant for the growth and wealth of economies, the challenge is to identify a policy mix and an institutional set-up which facilitates both a) a level of job mobility which is conducive of high productivity and b) high employment rates and low unemployment rates. The concept of flexicurity may be relevant in this connection and will be discussed in more detail in a subsequent chapter.
3.4 Job mobility, the quality of jobs and social cohesion In addition to its significant economic effects, job mobility impacts directly on the life of individuals and society in complex ways. Changing job affects individual careers in an objective sense that extends beyond economics, but is also related to individuals’ perception of job quality and career success. Likewise, mobility has an effect upon the relationships between individuals as it influences the individuals’ relationships to other individuals and hence impacts on the ties within and between peer groups, family groups, networks, communities (including professional communities); and in the final analysis, societies. In this sense, we also need to include possible political effects of mobility, such as the effect on, e.g., organisational behaviour and hence on trade union density and bargaining power. However, just as was the case concerning economic effects, the relationship between job mobility and individual and social characteristics is complicated. Job mobility as a sum of individual moves is influenced by individual characteristics as well as by structural characteristics of the labour market and the economy. Likewise, job mobility affects social structures not only by way of aggregation of individual effects but also through creation and destruction of social structures.
Theoretical considerations

96
The sociological literature on job mobility addresses mobility mainly as a result of sociological variables. The quality of social life and social interaction on the other hand is frequently seen to be the result of the intervention social institutions and/or the result of interaction between groups and individuals. Hence, job mobility most often assumes the role of an intermediate variable or an expression of more fundamental characteristics of society. Research into effects of job mobility per se as the focus of research has not commanded much interest. Still, a number of hypotheses about relationships between job mobility and effects for the individual, for firms, or for society can be derived from the literature. Social effects of mobility can be viewed from the perspective of a social entity (individual, group, or network; enterprise, family, or community), or from the perspective of the larger society, the two being closely intertwined. The concept social cohesion is of particular interest here. Social cohesion involves building shared values and communities of interpretation, reducing disparities in wealth and income, and generally enabling people to have a sense that they are engaged in a common enterprise, facing shared challenges and that they are members of the same community (Rossell 1995). Hence, the level of social cohesion is an important predictor of overall stability and prosperity of society, whereas lack of social cohesion may lead to mutual alienation, crime and anomaly. Social benefits related to job mobility For the individual, the relationship between mobility and the perceived quality of the job is pertinent. However, there are strong reasons to believe that there is not a one-to-one relationship between job quality (objective) and job satisfaction (subjective). This distinction is important exactly because individuals make decisions on whether to change jobs on the basis of subjective interpretations of their situation (‘happiness’ or job satisfaction) rather than on the basis of the objective characteristics of their present situation. In addition to economic benefits in the form of wage gain, there are a number of beneficial effects which may be obtained by an individual who is mobile in the labour market • Changing jobs may enhance a person’s chances of career success, i.e. a progression in
objective job quality. It is likely that occupational mobility would lead to greater objective career success in the long run, because moves would more often than not be into better paying occupations. We would expect that the same mechanism would apply for job-to-job mobility where individuals would only move when conditions in the new job appeared to be better than in the present. However, we would not expect the mechanism to work in exactly the same way across the whole labour force. Job mobility might partly also be associated with unemployment experiences and downward status mobility. The scarring effect of unemployment may work to produce downward mobility for the individual. We will expect that the career success effect of mobility will be highly contingent upon the situation of the individual and the structural conditions; in particular, we would expect job protection legislation to play a role in determining the opportunities for individuals to seek to improve their situation by moving job or occupation. The human and social capital of individuals is also expected to influence the direction and magnitude of the career success effect of mobility. Finally, we would expect the nature of quits (voluntary or forced) to be of utmost importance to career success effects.

97
• Being mobile may add to a person’s human capital both because the individual’s chances of
receiving formal training will rise with a move to a new employer and because there will be new contextual (informal) learning connected to every change of job. Concerning formal training, employers will need to put in training efforts to ensure that new employees become productive quickly. Hence, it can be expected that the aggregate time that an individual spend in training over a labour market career increases in proportion to the number of moves. Whether a person’s level of competence is directly proportional to the time spent in training is disputable, however. When a person takes up a new occupation, some of the competences that were developed in the previous occupation becomes redundant and in time will be lost. Along the same lines of argument, we would expect that occupational mobility is connected with a considerable gain in human capital as changing occupation gives rise to a need to learn wholly new skills. Job-to-job mobility would give rise to some training gain. Intra-company mobility would lead to the smallest training gain - however, we would still expect a person, who changes job within organisation to receive more training than the person who stays in the same job. The same arguments apply for the informal learning that takes place every time an employee starts a new job.
• Mobility may influence job satisfaction. This is almost a tautology, as job satisfaction has
been shown in several studies to be an important driver of job mobility (Fasang et al. 2007; Kristensen and Westergaard-Nielsen 2004; Clark 2004). Job satisfaction reflects the individual perception of the objective job quality, but the relationship between objective qualities of a job and the reported job satisfaction is not simple. For example whereas satisfaction with wages is certainly an element in overall job satisfaction, the correlation between actual wage and satisfaction with wage is not linear (Leontaridi and Sloane 2003). Job satisfaction is closely linked to the concept of job embeddedness (Feldman and Ng 2007). Job embeddedness is created by three components, i.e. the extent to which a job complements other areas of a person’s life, e.g. his or her family situation or interests (‘Fit’); the relationships with people and activities at work (‘Links’); and the personal costs involved in giving these up (‘Sacrifice’). We would expect that when a person is deeply embedded in a job, job satisfaction will be high and the incentive to quit low. However, a high degree of embeddedness may not be the only source of job satisfaction. Persons who have recently changed jobs voluntarily can be expected to report higher satisfaction in their new job than in the previous job for obvious psychological reasons. On the other hand, persons who have been forced to give up a job may not be so satisfied with the change, even if they have attained a new job.
• Being mobile may give individuals the opportunity to increase his or her personal network
and hence raise his or her social capital. Whether this actually takes place will however depend critically on whether the person stays in the job long enough to build relations to colleagues. Whereas the concept of social capital has gained much attention, there exists no one common definition that scholars agree upon. However, common to concepts of social capital is that the resource is connected to an individual’s relationships or position in networks and that it is similar to physical capital in the sense that it denotes resources which can be invested, accumulated and spent. Lin (2007) defines social capital as investment and

98
use of embedded resources in social relations for expected returns, while Putnam (2007) defines social capital simply as social networks and the associated norms of reciprocity and trustworthiness. The literature on returns to social capital indicates that there is evidence to the effect that there are strong effects of social capital on socioeconomic attainment (Lin 2007). Therefore, social capital is an important type of effect to consider. However, the relationship between mobility and social capital is not well understood; the correlation between tenure and social capital and between career history and social capital still needs to be investigated..
• Being mobile will increase an individual’s opportunity for future mobility. When human
capital and social capital increases, the opportunities for mobility also increase. Whether this is in itself a benefit for the individual is a matter for discussion. On the one hand, it may be argued that a larger opportunity space should always be regarded as a benefit. On the other hand, a recurring argument in the discourse on occupational stress is that choice in itself provokes stress in individuals.
• High levels of mobility may promote integration in the labour market. In a situation of
positive economic growth, high job-to-job mobility rates will be associated with a high number of vacancies in the labour market. Besides increasing churning in the labour market (the situation where individuals move around the labour market without any new jobs being created, thus enhancing individual careers but not necessarily productivity), it also increase the job chances for unemployed persons and persons outside the labour market compared to a situation with low mobility. Hence, a high level of job-to-job mobility may increase positive employment mobility. This will benefit labour market entrants, women returning from child birth, disabled people and immigrants, who will find it easier to make an entry into the labour market. Also, people in temporary jobs will find it easier to enter full-time employment.
• High levels of employment mobility may contribute to social integration. From a social-
integrative point of view, a situation in which many people have experienced both employment, unemployment and different types of employment contracts may lead to less stigmatisation of the unemployed compared to a situation in which segments of the population are fully employed, others employed part-time, on fixed term contracts or working as casual or temporary workers and others still are unemployed for longer periods of time (also known as dual labour markets27).
Social costs of mobility to individuals and communities Just like there are benefits to the individual of being mobile, so there are also costs or drawbacks. • Mobility may have a negative effect upon individuals’ perception of job security. The
perception of job security is important because it allows individuals and families to make plans for the future involving large investments like e.g. buying a house or deciding when to have children. Common sense would probably tell us that that stable jobs (long tenure)
27 Dual labour market theories assume the simultaneous existence of two separate labour markets with very different conditions. In one, employees are viewed as an asset, working conditions are favourable, job security is high and internal promotion is possible; in the other, jobs are characterised by poor pay, poor working conditions, poor job security and fewer career prospects.

99
convey more security than unstable, short-term jobs. At an aggregate level, high mobility is inversely correlated with tenure, and hence, you would expect high levels of mobility to carry with them increased feelings of job insecurity. However, if we consider the further implications of job security, it may be the case that it is not so much the security tied to not losing the particular job, but rather the security tied to not losing income that counts. In that instance, the concept of employment security becomes important. Employment security is an expression of how secure individuals feel that they will be employed in the future. We would expect that the perception of employment security is not necessarily linked to a situation with low levels of job mobility, as employment may as well be with another employer than the present.
• If a job change is involuntary, we would expect that the person will experience a decrease
in job satisfaction or indeed perception of his/her quality of life, especially in the case where that person fails to find a new job or only finds one after a prolonged period of search. A change is involuntary when a person is fired or demoted, or when s/he is forced to quit a job for reasons beyond his or her control (e.g. health reasons or forced retirement).
• A high level of job mobility may theoretically affect the stability of families negatively
through side-effects. A job change demands time and energy of the mover. This has different implications for the family. First, time may be taken from the family. The strength of relational ties depends on time spent together, so that less time with the family means that family ties are weakened. If one parent (by cultural traditions most frequently the father) is mobile in the labour market, this may mean that the mobility of the mother is restrained. If both parents still choose to be mobile, children may pay the price in the shape of less parental attention and care, unless other parts of the family, community or society are willing to take on part of the task of caring for them. Further, if jobs are interspersed by frequent periods of unemployment, the prospects for family formation and child bearing become less secure. This may lead people to refrain from forming families altogether, to delay the time for family formation and childbirth and also to families being less stable as a result of economic strains put onto them.
• Increasing cohesion in labour markets, decreasing cohesion in civil society? Whereas
mobility opens opportunities for increasing personal networks, it also may lead to those networks being shallower. When workers’ relations achieved in their working life grow with changing workplaces, the strength of each relation necessarily decreases. In this understanding, mobility may increase the individual’s social capital only up to a limit. After this, individual social capital is eroded in spite of a growing number of relations because of increasing weakness of social ties. A large network of weak ties has been shown to further career opportunities. However, the implications for civil society and citizenship are not simple. Some theories propose that structural cohesion in society increases as the overall number of ties increase whereas others warn that attention should be drawn to the differences in strength and nature of relationships or ties.28
• Larger but weaker professional networks. In a situation with high levels of job mobility,
employees’ mutual relationships may become more superficial and the feeling of mutual
28 The theories of declining social capital in modern societies, most strongly voiced in Putnam (2000), is representative of the latter strand of thinking.

100
dependence and of a common destiny may be weakened considerably when employees are more concerned about improving their employability and less about improving their present place of work. If this leads to decreasing membership and decreasing day-to-day involvement in trade union matters, the result may be that it becomes more difficult for trade unions to maintain their legitimacy in the social dialogue.
An optimal level of mobility - or an optimal distribution of mobility? From a perspective of social cohesion, the nature of theoretical effects of mobility outlined above seems to indicate that the concept of optimal levels of mobility with regard to social effects is not very relevant, as the balancing of beneficial and harmful social effects of mobility depends critically on the situation of the mobile individual. Rather, theoretical considerations point to the existence of an optimal distribution of mobility according to workers’ age, work experience and family situation: • For young workers and other groups entering the labour market, high flexibility is desir-
able, as it will increase their returns in the form of job satisfaction. This in turn will contribute to reduce the risk of marginalisation and the social and individual problems associated with so-called dual labour markets.
• For the core labour force, however, it is less obvious that there are advantages to high overall job mobility. Possible advantages in the form of for instance increased job satis-faction and individual human capital may well be cancelled out by negative effects in the form of social transaction costs and costs to families, not to mention economic transaction costs.
Social effects of job mobility – empirical evidence A large share of the substantial literature on job mobility is devoted to investigating how social characteristics influence job mobility. Empirically based studies of the effect of mobility on such characteristics are considerably thinner on the ground. Nevertheless, some implications for the relationship between mobility and features of society can be drawn from studies concerned with different aspects of mobility or with social and labour market institutions that affect the level of mobility. Effects on job quality and individual career success Whereas much work has gone into investigating the relationship between job mobility and wage formation as described above, the same cannot be said concerning other aspects of objective job quality. Indeed, a number of studies show that a dichotomy between ‘good jobs’ and ‘bad jobs’ in terms of objective indicators of job quality is not reflected in a similar distribution of job satisfaction. However, some attempts have been made at investigating the relationship between mobility and objective indicators of job quality. In a review of the empirical support for hypotheses concerning the effects of mobility on career success, Feldman and Ng (2007) consider different measures of objective career success. These measures include the highest level of education or hierarchical level attained; the highest salary earned; the rate of movement up an organisational ladder; and the badges of accomplishment. • The do not find much concrete evidence for a hypothesis that occupational mobility leads to
more tangible rewards like salary in the short run. A plausible explanation is linked to the costs of achieving the necessary skills for the new occupation. At an aggregate level, they

101
concede that occupational mobility may lead to greater individual career success in the long run as moves tend to be from lower towards higher paying occupations. The solid evidence for this hypothesis is, however, scarce.
• Feldman and Ng quote different sources to the effect that over all, job-to-job mobility tends
to be positively related to objective career success, but that the career outcome depends critically on the motivation for the move. Feldman and Ng are only concerned with voluntary moves, but introduce a distinction between moves that are motivated by a positive attitude towards a specific opportunity and moves that are motivated primarily by a desire to get away from stressful environments (‘approach’ or ‘avoidance’). They find that the former types of moves are more likely to result in successful career outcomes than the latter.
Job mobility has particularly important career implications for young people Using LFS data29 to look at the relationship between employment protection legislation, mobility of labour market entrants, and occupational status outcomes,30 Gangl (2002) finds that there is substantial job mobility during young people’s first years in the labour market, but that the labour market outcomes of these moves vary considerably. After one year in the labour market, about 10% of school leavers across Europe will already have left their first job. On average, the proportion of young people experiencing upwards moves exceeds the proportion experiencing downward mobility. Further for a considerable share of the young people, the employer changes do not involve any change in occupational status. There is however large variations between the countries studied. The share of workers who experiences upward mobility varies from about 30 % in Greece and Italy to about 50 % in France, while the share that experiences downward mobility varies from about 22 % in Sweden to about 33 % in France and Greece. • Gangl finds that neither gender, nor levels of education, nor the occupational status in the
first job explain whether or not job mobility among entrants to the labour market is associated with status gains or losses. The only significant finding across countries is that school leavers with long search durations for their first job also tend to have worse mobility outcomes once they leave the first job meaning that initial disadvantages cumulate over the early stages of the career. Hence, we will expect that the observed differences on occupational status across countries should be explained by other factors than standard stratification variables. Gangl proposes that the strictness of Employment Protection Legislation may be an important explanatory factor.
Job mobility and objective job quality - conclusions Hence, available evidence indicates that there is no simple causal relationship between a particular level of mobility and indicators of effects on overall objective job quality. At the individual level, findings suggest that a positive career effect of mobility is strongly dependent on the motivation for the move. There is also evidence of some path dependency meaning that
29 The following countries are included in the analysis: Belgium, Greece, Finland, France, Hungary, Ireland, Italy, the Netherlands, Portugal, Spain, and Sweden. 30 Gangl measures status mobility by the change in ISEI occupational status scores between individuals’ first and current job. ISEI stands for International Socio-Economic Index. The scale measures the hierarchical position of an occupation and is linked to education and income.

102
early failures to achieve upward mobility is reflected in worse labour market outcomes later in the career. At the aggregate level, findings indicate large variation between countries which cannot be explained by individual variables. Indeed the findings seem to suggest that the effects are strongly dependent on country- or system specific factors. In a later chapter, we will discuss the implications of different welfare regimes for the effects of mobility. For the time being, we will restrict ourselves to noting that the effects of job mobility on objective job quality and occupational status career varies considerably between countries and over individual careers. Effects of job mobility on perceived job security As mentioned above, it could be expected that a high degree of job mobility would be associated with a correspondingly high degree of perceived job insecurity. Conversely, one could expect that stable jobs and stable employment relationships convey more security than unstable, short-term jobs. However, it was also proposed that employment security would indeed be a more relevant indicator of a family’s or individual’s financial security. A correlation between average job tenure and the perception of employment security (see Figure 3.6) shows that long tenure does not lead to a higher perception of employment security. Figure 3.7: Perceived employment security as a function of tenure, 1996 (left) and 2000 (right)
Source: Auer (2005). Auer (2005) finds that the relationship is weak and not statistically significant, and even points in the ‘wrong’ direction - suggesting at the very least that it is not sufficient to have a long tenured job to feel safe in your job. A similar finding is reported by OECD (2004: 92): The overall strictness of employment protection regulation that correlates strongly with tenure does not convey the feeling of security that it is supposed to convey. It seems that the subjective feeling of employment security is not only determined by the elapsed length of tenure (or of Employment Protection Legislation) but is also influenced by the general state of the labour market and the economy. For example, the perceived security correlates quite strongly with the unemployment rate and it seems also that the general state of the economy (in recession or not) has a great impact on subjective feelings of job security.

103
Effects of job mobility on job satisfaction A study of Eurobarometer data from 2006 (Fasang et. al. 2007) looks into the correlation between job mobility variables and four variables related to job satisfaction. The variables are satisfaction with salary, satisfaction with contract, satisfaction with career prospects and satisfaction with work life balance. As we can see, the first three variables reflect objective qualities of the job, whilst the fourth (satisfaction with work life balance) refers more to the ‘fit’ dimension of embeddedness in the job. • The study shows a significant positive impact of voluntary mobility on all three objective
job quality related variables. This is confirmed in a study of British data using BHPS (Leontaridi and Sloane 2004) of sources of overall job satisfaction using these reported variables: satisfaction with promotions; satisfaction with pay; satisfaction with boss; satisfaction with job security; satisfactions with initiative; satisfaction with work itself; satisfaction with hours.
• Satisfaction with salary. Fasang et al. (2007) find that an increasing number of
unemployment spells has a significant negative effect on satisfaction with the salary. This does not necessarily reflect scarring resulting in objective downward mobility, as satisfaction with salary does not necessarily reflect objective wage conditions (see e.g. Clark 2004; Leontaridi and Sloane 2003).
• Concerning satisfaction with work contract, Fasang et al. (2007) find that again, the number
of unemployment spells has a significant influence. Also, satisfaction is dependent upon whether the move was voluntary or not.
• Concerning satisfaction with career prospects, the same pattern can be observed. Satis-
faction hinges on whether moves are voluntary and on an unbroken labour market career. As for satisfaction with work-life balance, this factor is found by Fasang et al. (2007) to be strongly and significantly positively influenced by job tenure.
• As for the relationship between job tenure and job satisfaction, Fasang et al. (2007) find
that job tenure does not have any effect on satisfaction with contract, but this may be due to selection effects (people with a long tenure attained a good match given their expectations which is why they have stayed with the employer for a long time). At the same time, however, the study found that having a permanent contract has a significant impact on the satisfaction with objective job quality (the three first variables) but no impact on the satisfaction with work-life quality. Leontaridi and Sloance (2004) find a U-shaped relationship between tenure and overall job satisfaction similar to the U-shaped relationship between productivity and tenure mentioned earlier in this chapter.
Effects of job mobility on cohesion and industrial relations Available figures on trade union density and trade union involvement point to the existence of a strong relationship between the two. In an overview of trade union density in OECD countries Visser (2006) finds a universal decline in union density among the young and among those that hold casual or temporary jobs, i.e. high mobility groups. Looking at the country level, the picture is considerably less clear with some countries with a generally high level of mobility, like Sweden, having a high trade union density and a net growth in trade union coverage, while others, like the UK, have a considerably lower coverage and a net decrease in coverage. Visser

104
concludes that across all these countries, the increased use of flexible employment contracts, lower inflation rates and tighter monetary policies have limited trade union power and union recruitment and that labour market institutions, legal rules, and politics mediate these forces.
3.5 Job mobility, the quality of jobs and social cohesion: conclusions As already mentioned, the bulk of the research in the area has focused on explaining the social factors behind job mobility, at individual or societal level, and not on analysing the social effects of job mobility. There is some evidence as regards both negative and positive social effects of job mobility at the level of individuals. However, in terms of the social effects of job mobility for entire societies, communities or even for social entities like families or peer groups, no relevant studies have been identified. Based on available research, conclusions on the social effects of different levels and types of job mobility therefore appear as aggregations of individual-level effects. As for individual-level social effects of job mobility, the review of empirical evidence points to the following findings: Positive effects of voluntary mobility, negative effects of forced mobility and unemployment • There is a difference between occupational mobility and job-to-job mobility. There is little
evidence that occupational mobility leads to tangible rewards for the individual in the short run, whereas job-to-job mobility is more likely to lead to positive career development.
• Positive effects of job-to-job mobility on career patterns are, however, critically dependent on the motivation for the move, i.e. whether job mobility has been negatively motivated (‘avoidance’) or positively motivated (‘approach’). Approach-motivated job-to-job mobility is more likely to result in successful career outcomes than avoidance-motivated job shifts.
• These findings fit well with the finding that voluntary mobility has a positive impact on different aspects of job satisfaction, i.e. individuals’ satisfaction with their salary, with their type of employment contract, and with the career prospects of the job.
• Among young people, long search durations for the first job is found to have lasting effects on the outcomes of job mobility in later stages of the working life, meaning that initial disadvantages cumulate over the early stages of the career.
No straightforward relationship between job mobility and perceived job security • Contrary to what could be expected, there is no straightforward relationship between job
mobility and perceptions of job security. Thus, whereas it could perhaps be expected that long job tenure would correspond to a high degree of perceived job security, this relation cannot be found. Job security thus to depends on other factors than job tenure (and by implication Employment Protection Legislation since EPL is strongly correlated with average job tenure), not least overall employment and unemployment rates and thus the general labour market performance of the country concerned. The finding that job tenure has no clear effect on job satisfaction is complementary with these findings.

105
3.6 Multivariate analyses: building a comprehensive model On the basis of multivariate analyses, this section discusses the empirical evidence for effects of job mobility on four different outcomes: • Productivity • Economic growth • Long-term unemployment • Innovation. These four outcomes have been selected for analysis on the basis of the theoretical and empirical discussion above. Indicators for the first three outcomes have been constructed using data from the OECD database on labour productivity growth, GDP growth and long-term unemployment. The rate of innovation is represented by the share of high technology exports of total exports. Data on this indicator is obtained from the World Bank’s World Development Indicator (WDI) dataset. A series of multivariate regressions were then performed, establishing the direction and strength of relationships between the three dimensions of job mobility and the four outcomes.31 Using path analysis, the effect on job mobility on these factors can then be coupled with the drivers of mobility described in chapter 3, thus producing a set of comprehensive models for all three dimension of job mobility. The path analysis is thus done within the framework set out in section 3.6. For an overview of all the final models, please refer to Annex 2. The effect of mobility on labour productivity growth
The effects of mobility on labour productivity growth are shown in Table 3.1. As expected, job-to-job mobility has a negative net effect on labour productivity growth, meaning that the length of time that a worker stays with an employer significantly affects that worker’s productivity. The negative relation means that productivity is lowered by higher job-to-job mobility. In other words, the shorter the tenure, the lower is the labour productivity growth. This result supports the theoretical considerations and empirical evidence from other sources discussed in section 3.2 indicating that there may be considerable economic costs connected with too high levels of job mobility. Table 3.1 Mobility determinants of labour productivity growth, linear regression model estimates
Variable name Standardized coefficient
Job-to-job mobility (tenure) 0,006* Occupational mobility 0,006 Employment mobility 0,000
Coefficients marked with an * are significant at a <0.01 level. Conversely, neither employment nor occupational mobility is shown to have an effect on labour productivity growth in the models. The connection between job mobility and economic costs (in the form of lower productivity) thus seems to be confined to job-to-job mobility. If it is assumed that high employment mobility is associated with the ability of labour markets to
31 The variables used for the three dimensions of mobility are: 1) length of tenure for job-to-job mobility, 2) whether there has been upward, downward or no shift in occupational class for occupational mobility and 3) whether there has been a shift in employment status or not during the past year for employment mobility.

106
adapt to changes in the macroeconomic environment, then there appears to be no clear-cut relation between this and labour productivity growth. In short, the evidence from the multivariate analyses does not lend support to the conclusion that transitions in and out of the labour market significantly affects overall labour productivity growth. That no statistical correlation can be found between occupational mobility and labour productivity growth may seem surprising. However, although occupational mobility, i.e. a change in job profile and/or content, and job-to-job mobility are closely connected, they do not necessarily produce similar economic effects. An individual worker’s occupational transition may take place within the same employer, thus leading to a higher level of initial productivity in the new job than if the worker had changed employers due to the fact that the worker brings into the job employer-specific knowledge (and thus higher productivity). On the basis of the multivariate analyses it can be summed up that there does in fact seem to be a relation between job mobility and labour productivity growth as discussed in section 3.2. However, this only holds true for job-to-job mobility, while there is no evidence for a relation between employment mobility and e labour productivity or between occupational mobility and labour productivity. The effect of job mobility on economic growth
The effects of mobility on economic growth are shown in Table 3.2 below. The effect of job mobility on economic growth is seen to depend crucially on which aspect of job mobility is considered: The multivariate analyses show negative relations between job-to-job and occupational mobility and economic growth and a positive relation between employment mobility and economic growth. Hence, if the aim is to support growth, employment mobility should be in the focus of efforts to strengthen mobility, while too high occupational mobility may in fact stall economic growth. Table 3.2: Mobility determinants of economic growth, linear regression model estimates
Variable name Standardized coefficient
Job-to-job mobility (tenure) 0,013* Occupational mobility -0,030** Employment mobility 0,008
Coefficients marked with an * are significant at a <0.01 level. Coefficients marked with an ** are significant at a <0.05 level. These findings support the proposition that there can be significant costs involved in too high levels of job mobility, possibly because of loss of productivity. The loss of productivity, while shown to be related to job-to-job mobility, cannot explain why too high levels of occupational mobility seem to affect economic growth negatively. The positive relation between employment mobility and economic growth means that the higher the level of employment mobility, the higher is the economic growth in a given country. Thus, the finding supports the hypothesis discussed above that a good ability of labour markets to adapt to external shocks and macroeconomic changes is connected with higher economic growth. Overall, the multivariate analyses show that the effect of job mobility on economic growth varies. While both job-to-job and occupational mobility have negative effects on economic

107
growth, possibly because of loss of productivity, employment mobility has a positive effect on economic growth, supporting the importance of adaptable labour markets for economic growth.
The effect of job mobility on long-term unemployment
The effects of mobility on long-term unemployment are shown in Table 3.3. The multivariate analyses lend support to the notion that higher job mobility leads to lower long-term unemployment. Such a relation can be shown to exist for both job-to-job mobility and occupational mobility. In other words, higher levels of job-to-job and occupational mobility seem to lead to lower long-term unemployment. However, there is no direct relation between employment mobility and long-term unemployment in the multivariate analyses. Table 3.3: Mobility determinants of long-term unemployment, linear regression model estimates
Variable name Standardized coefficient
Job-to-job mobility (tenure) 0,004* Occupational mobility -0,048* Employment mobility 0,000
Coefficients marked with an * are significant at a <0.01 level. This apparently counter-intuitive finding may be partly explained by the fact that long-term unemployment is influenced by other factors such as for example EPL. In the countries with stricter EPL employment relationships are more durable, but at the same time legislation contribute to exacerbate the employment prospects of those groups that have difficulties being integrated into the labour market, such as young people, women and the long-term unemployed (Employment in Europe 2006, chapter 2). In sum, the multivariate analyses support the notion that there is a positive relation between high job mobility and long-term unemployment, with higher levels of both job-to-job and occupational mobility being related to lower levels of long-term unemployment. On the other hand, no relation is found to exist between employment mobility and long-term unemployment, which may be explained by the fact that it is EPL rather than employment mobility that accounts for the variation in long-term unemployment. The effect of job mobility on innovation
As discussed earlier, other studies have confirmed a relation between job mobility and innovation. The findings from the multivariate analyses, as shown in Table 3.4 support this, as a positive connection is shown to exist between job mobility and innovation. However, this relation is not, as would be expected between job-to-job mobility and innovation. Instead the analyses establish a connection between both employment occupational mobility and innovation. Thus, both the adaptability of the labour markets and the possibility for workers to shift between qualitatively different jobs seem to be supporting higher levels of innovation, while the pure shifting of job (i.e. job-to-job mobility) cannot, in these analyses, be shown to have an effect on innovation.

108
Table 3.4: Mobility determinants of innovation, linear regression model estimates Variable name Standardized coefficient
Job-to-job mobility (tenure) 0,000 Occupational mobility 0,042* Employment mobility 0,001*
Coefficients marked with an * are significant at a <0.01 level. Overall, the multivariate analyses confirm that job mobility is indeed a complex phenomenon whose effects are not clear-cut or unidirectional. Breaking the general concept ‘job mobility’ down to the three dimensions ‘job-to-job mobility’, ‘occupational mobility’ and ‘employment mobility’ has proven fruitful and has yielded interesting insights. While there does seem to be costs connected to too high levels of both job-to-job and occupational mobility, in terms of lower productivity and growth and higher long-term unemployment, the ability of labour markets to function smoothly and incorporate external macroeconomic changes (i.e. the level of employment mobility) appears to be an important aspect of high growth and innovative economies.
3.7 The effects of job mobility: evidence and implications This chapter has discussed the economic and social effects of job mobility. On the basis of an overall analytical framework, which highlights the complex relations between job mobility as the cause of certain effects and at the same time as the result of other factors, we have presented a number of theoretical expectations to the effects of job mobility. We have also reviewed the relevant empirical research literature. Table 3.5 below provides an overview over the individual economic and social costs and benefits that have been addressed in the chapter. We distinguish in this connection between theoretical justifications and empirical evidence. Table 3.5: Economic and social benefits and costs of job mobility, theoretical justifications and empirical evidence Theoretical
justification Empirical evidence
Economic benefits of job mobility Allocative efficiency √ (√) Productivity increases for workers with tenure over 10 years √ √ Innovation in knowledge intensive sectors √ (√) Wage increases in connection with voluntary job mobility √ √ Economic costs of job mobility Productivity losses for workers with low job tenure (< 10 years) √ √ Wage losses in connection with involuntary job mobility √ √ Lost capital invested in job specific training √ Hiring costs, search costs √ Social benefits of job mobility Career success in connection with voluntary job mobility √ (√) Voluntary job mobility: improved employability + human capital √ Voluntary job mobility: job satisfaction √ √ Voluntary job mobility: strengthened social capital/networks √

109
Voluntary job mobility: strengthened social integration Social costs of job mobility Lower perceived job security √ - Involuntary job mobility: decreasing job satisfaction √ √ Lower family stability √ Civil society erosion √ Erosion of industrial relations √ √ As mentioned previously, the overall context of the present study is the question of optimising job mobility. The conclusions of the present chapter are relevant for the discussion of good or optimal job mobility. Based on the preceding analysis, a number of relevant conclusions can be formulated: • Job mobility can contribute significantly to economic growth and development. Job
mobility is a key aspect of the efficient allocation of productive resources. Without job mobility, ongoing restructuring and development of enterprises is hampered. Without job mobility, the reallocation of resources from declining industries to growing industrial sectors is impeded and this may again have negative implications for economic perfor-mance, and ultimately labour market performance. Conversely, job mobility can contribute significantly to innovation, particularly in knowledge intensive sectors and when the mobility of knowledge workers is concerned, and there is solid empirical evidence supporting this claim.
• However, more job mobility is not necessarily better job mobility. There is strong empirical
evidence that stable employment relationships and relatively long job tenures are positively correlated with productivity. There is evidence that employing workers with 4-10 years of job tenure has the most beneficial effect on productivity, just as there is evidence that employing workers with very short or very long tenure will affect productivity negatively. Theoretically, there are good arguments in support of the claim that high job mobility rates are connected with considerable transaction costs and sunk costs in the form of wasted investment in job-specific training.
• It can be concluded, against this background that probably, and everything else being equal,
there is an inverse U-shaped relationship between job mobility and economic growth, with very low levels and very high levels of job mobility being detrimental to economic growth.
These arguments have considered job mobility in isolation and have focused exclusively on the direct effects of job mobility on economic growth. This simplifying assumption needs to be relaxed, however, if the analysis is to be relevant in relation to the real challenges confronted by Europe’s labour markets. In particular, it is necessary to consider some key factors which underlie the specific levels of job mobility found in the different EU Member States, the point being that factors which affect job mobility may also have other labour market effects. • Average job tenure has, in this connection, been found to correlate strongly and positively
with the strictness of Employment Protection Legislation. Moreover, there is both empirical evidence and strong theoretical arguments behind a claim that strict EPL negatively affects

110
employment rates of weak groups in the labour market (e.g. young people and women) and that it tends to increase (long-term) unemployment rates. Such labour market outcomes are, of course, detrimental for economic growth and wealth. Furthermore, strict employment protection legislation does not ensure a high degree of perceived job security, as this perception is affected more by the overall labour market situation in each country concerned.
Against this background, the challenge is to arrive at a policy mix and an institutional set-up which facilitates both a level of job mobility conducive to high productivity and rapid innovation, high employment rates and low unemployment rates. The concept of flexicurity may be relevant in this connection and will be discussed further later on in the report. • This point is particularly significant insofar as there is ample evidence that voluntary and
positively motivated job mobility has much more beneficial effects at the individual level, both in terms of economic and social effects, than involuntary and negatively motivated job mobility. Voluntary and positively motivated job mobility is more likely to lead to wage gains and a positive career development than involuntary and negatively motivated job shifts, and is associated with a higher degree of job satisfaction. Long search durations and unemployment spells have lasting negative effects on career patterns and employment outcomes.
• And – everything else being equal – the share of voluntary and positively motivated job shifts will tend to be higher if there is a positive overall situation in the labour market, with high employment rates and low unemployment.
It is thus necessary to consider the question of job mobility, not only in the light of produc-tivity, but also in the light of the broader question on innovation, employment rates, unemployment levels and the duration of unemployment spells.

111
4. Optimising levels of job mobility The preceding sections have contained a description and analysis of the levels of job mobility in the EU, focusing on occupational mobility, employment mobility, and job-to-job mobility. We have also analysed the causes for job mobility and the social and economic effects of job mobility. In this chapter, we shall discuss the question of ways to optimise levels of job mobility. This will include several steps. First, the question of desirable levels of job mobility will be addres-sed, building on the evidence and conclusions presented in the previous chapters. We shall define a number of operational target indicators, under the heading of ‘balanced job mobility’. Subsequently, the situation in the EU Member States in 2005 will be analysed in relation to these target indicators, and against this background we shall discuss different policy options which can be considered for influencing job mobility in the direction of more preferred outcomes.
4.1 Optimal and desirable levels of job mobility: a tentative analysis Earlier in this report we have highlighted the fact that there are significant differences in the level of job mobility across the EU. We have also emphasised the fact that job mobility is as much a symptom as a cause of labour market performance.
One optimal level of job mobility cannot be identified Moreover, theoretical considerations and a review of the empirical evidence on the economic and social effects of job mobility have suggested that it is not possible to identify one optimal level of job mobility. First, as to the aggregate economic effects of job mobility, we have argued that an optimal level of job mobility probably exists, insofar as there will be a level of job mobility where the contribution of job mobility to economic growth is largest. Thus, a situation with a very low level of job mobility is likely to be detrimental to economic growth. Correspondingly, very high levels of job mobility are also likely to contribute negatively to growth. However, the precise level of optimal job mobility judged from the perspective of economic efficiency and growth cannot be identified. Empirical evidence is insufficient, and, in addition, the optimal level of job mobility very likely depends significantly on the specific economic context, i.e. which type of employee, with which type of skills and competences, carrying out which functions in which sector, and which type of enterprise do the costs and benefits of job mobility concern? Second, as to the aggregate social effects, it is also not possible to define an optimal level of job mobility. Many would agree with the statement that stable jobs convey more security than unstable, short-term jobs. However, the correlation between average tenure and the perception of employment security shown below does not support such a view. Instead, it seems that the subjective feeling of employment security is not only determined by the elapsed length of tenure but is also influenced by the general state of the labour market and the economy (Auer 2005). Nevertheless, based on theoretical considerations and available empirical evidence we can conclude that there is a significant difference between voluntary and forced job mobility. In

112
the case of voluntary job mobility, individual level effects of voluntary job mobility are mainly positive, in particular where mobility is positively motivated. In the case of involuntary job mobility or unemployment, individual effects are mainly negative. Although there is no firm evidence to support this, we expect that a more detailed analysis would find significant differences between the social effects of job mobility for those entering or re-entering the labour market, and for members of the ‘core labour force’.
Factors affecting job mobility may have wider labour market implications A third factor must be considered, however, i.e. the two lines of argument above have treated job mobility as a cause of economic and social effects, which can be viewed and analysed in isolation from other factors. However, this assumption is too simple, in particular since the factors which affect levels of job mobility may in themselves have significant labour market implications. For example, employment protection legislation influences the nature and extent of mobility. Our research shows that levels of job mobility are highly correlated with levels of EPL. Other studies indicate that strict employment protection legislation successfully reduces unwanted, forced job mobility, but at the price of a less flexible work force. A less regulated environment entails more flexibility, both voluntary and forced, and individuals’ expectations of voluntary job mobility are significantly lower in countries with strict EPL (cf. European Foundation 2007). However, EPL also has direct influence on factors that we have treated as outcome variables in relation to job mobility. Strict EPL has been shown to have negative implications for employment rates and to increase the risk of creating insider-outsider problems in the labour market with those on the margin of the labour market having considerable difficulties entering the labour market and obtaining stable employment relationships. A similar argument could be carried through concerning other factors influencing job mobility, such as the level and structure of education (general and life long learning).
The context dependency of job mobility effects We can conclude then that economically optimal job mobility levels will vary, depending on among other things the structural characteristics of the economy concerned (sector compo-sition, composition of types of enterprises etc.) and of its workforce (skills and competences). This is so since the relation between job mobility on the one hand and productivity and innovation on the other hand can be expected to vary across sectors and enterprises. Moreover, in defining economically optimal job mobility levels, it will be necessary to take into account the various factors affecting levels of job mobility and the wider economic implications of these factors. A certain level of job mobility may in itself have a positive impact on productivity and growth – but it may be the result of other factors, such as for instance regulation on employment protection legislation, which may impede job creation and hamper economic growth and development in a wider perspective. Similarly, socially optimal levels of job mobility are likely to be highly context dependent. The balancing of beneficial and harmful social effects of job mobility depends critically on the situation of the mobile individual, on his or her life situation and social context.

113
The normative aspect of ‘optimal levels of job mobility’ One final and fundamental obstacle to the idea of specifying optimal levels of job mobility concerns the question of values. In the arguments above, we have built on a distinction between economic values and social values, and economic and social costs and benefits. How, using which yardstick, can one weigh these costs and benefits in relation to each other? For instance, low levels of job mobility may be associated with high productivity and low social cohesion in the form of marginalisation of certain groups. Deciding which of these concerns should be accorded which significance is an inherently political question, which cannot be resolved by analysing empirical information of one type or another. Preferences among citizens as well as political decision makers differ in these respects: Which is more important: Growth and economic efficiency or equity and social cohesion? Which levels of job mobility to consider optimal will depend on the answers to questions such as this.
Desirable levels and types of job mobility in specific contexts Whereas these findings prevent us from defining specific levels of job mobility as being optimal regardless of the context, they do not amount to an argument that all levels and all types of job mobility are equally desirable, seen from the perspective of society. One assumption is helpful in this respect, however. The question of societal objectives is an inherently political question of values and priorities, and we should not attempt to ignore this fact. On the other hand, to the extent a political consensus can be identified, this can usefully serve as a normative yardstick against which to assess the desirability of different levels and types of job mobility. There seems to be indeed at a certain level a political consensus within the field of labour market policies across Europe. The Lisbon Strategy and the European Employment Strategy may be viewed as two central expressions of this consensus. The contents of this consensus can be summarised under the heading ‘the inclusive knowledge society’, and covers among other things explicit or implicit objectives on: • high productivity, high levels of innovation • high economic growth • high levels of employment, low levels of unemployment • good quality jobs • low levels of social exclusion, low levels of long-term unemployment Against the background of the empirical evidence presented in the previous chapters, and taking these broad and consensual political objectives into account, the following is a tentative attempt at defining a number of criteria for desirable levels of job mobility and to make these criteria operational in order to arrive at conclusions which may be relevant for policy development and policy initiatives across Europe.
The ‘inclusive knowledge society’ and desirable types and levels of job mobility The objectives reflected in the concept of an ‘inclusive knowledge society’ are broad, but nevertheless an attempt can be made to translate them into a number of statements on job
114
mobility, given the available theoretical and empirical evidence on the causes and effects of job mobility as presented previously. Thus, in light of the overall political objectives tentative normative criteria on job mobility can be developed at individual level and society level. At individual level, some transitions from one job or labour market status to another can be defined as desirable in the light of the objectives. At society level, the extent and/or the balance of different aspects of mobility and labour market performance can similarly be viewed as being conducive to the achievement of the broad objectives. The individual level: • Continuous development of new competencies. The concept of ‘an inclusive knowledge
society’ entails that investment in human capital is a key to increasing opportunities for individuals and to tackling social exclusion. Lifelong learning opportunities and incentives to learn new skills throughout careers are essential. This implies that ‘good’ job mobility should contribute to a progressive development of the employee’s competences. In this study, this aspect is reflected in the indicator on occupational mobility measured operationally by the skills requirements of the present job compared to the previous job. Thus, upward occupational mobility can be assumed to be the result when the new job requires more or different skills than the previous job. Conversely, a job change involving fewer skills can be assumed to constitute downward occupational mobility. A job change involving the same extent of skills, but of a different nature may also be assumed to represent accumulation of human capital and typically result in higher wages.
• Higher wages. Desirable job mobility implies career progress assuming that higher wages
reflects the progressive build-up of competences and productivity. • From temporary to permanent employment. Temporary and part-time employment
contracts can be regarded as intermediate stages between full-time employment and unem-ployment. Everything else being equal, workers in temporary contracts have a more precarious relationship with the labour market with a higher risk of being laid off, more discontinuous development of competences, and lower wages due to less seniority. Consequently, ‘good’ job mobility involves transitions from temporary employment to permanent employment. On the other hand, temporary employment entails flexibility which may be beneficial to the employer as well as the employed. Temporary employment can be a voluntary choice of the individual for flexibility reasons. From the employers viewpoint the use of temporary employment allows for more flexibility in the adjustment of the workforce and lower costs in hiring and laying off workers. Consequently, temporary employment, which is the result of a voluntary choice, may be defined as good mobility for the individual. Also, at firm and society level, a certain level of forced temporary employment may be conducive to the flexibility of the workforce and firms’ competitiveness
• Voluntary job moves. Individuals who experience voluntary transitions, tend to register
wage gains in their new jobs, while dismissed employees or those, whose employment contracts came to an end, register wage losses. Workers who experience an employment interruption and go through an unemployment or inactivity spell between two jobs, suffer

115
relative wage losses when they re-enter employment (Davia 2005). This implies that ‘good’ job mobility is voluntary and driven by positive motivations. Voluntary job moves reflects the objective of low levels of social exclusion, high levels of employment, and rapid job creation. It also reflects the concern in the Lisbon Strategy for not only more jobs but also better jobs, i.e. the objective of good quality jobs.
At the level of society: Given that the general policy goal is the creation of an inclusive knowledge society, job mobility in Europe should contribute: • To creating wealth and jobs. More specifically, this entails that job mobility should:
- facilitate high productivity levels - facilitate innovation and the diffusion of knowledge between Europe’s enterprises.
• To creating better jobs. More specifically, this entails that job mobility should:
- provide better possibilities for families to combine work and family lives - provide employees opportunities for career changes and upward moves - provide employees with opportunities to develop their competences throughout life.
Experimental job mobility target indicators These objectives can be further operationalised into a set of quantitative targets for job mobility in the EU. These targets are experimental and tentative. Whereas the level of ambition expressed in the targets is not arbitrary, it is important to say that it is not objective either, but rather of a political nature. Evidence tells us, for example, that a high share of voluntary job shifts is associated with many financial and social benefits, but exactly how high the share should be cannot be deducted from statistical data or analyses. For the sake of illustration, below we suggest an indicator rate of 66%, but whether the target rate should be 60, 66 or 70% just like the scope of the targets (EU or national targets?) are inherently political decisions.32 Nevertheless, we would argue that the proposed targets reflect the evidence on the social and economic effects of job mobility which is currently available and which is presented in Chapters 3 and 4 of the current report.33 For example, as for the first two of these target indicators (average job tenure: 7-10 years and average job tenure in knowledge-intensive private sector occupations: 6-9 years), their values are compatible with the available empirical evidence on the relationship between job mobility, productivity and innovation. Still, the empirical underpinning could be stronger, and certainly more research in this field would be welcome. Two target indicators have been included to cover inclusion and the quality of life of the workforce. As already mentioned, the first suggests that at least two thirds of all job shifts should be voluntary. Whereas the precise level of this target is open for discussion, a high share of voluntary job shifts is certainly in line with the Lisbon Strategy’s objectives, both as regards the quality of jobs and as regards social inclusion - as mentioned earlier, forced job mobility is thus much more likely to have negative social effects for the individual employee. The second suggests that the share of voluntary temporary employed should be higher than the share of 32 This can also be said, for instance, about a number of the quantitative targets in the EU’s Lisbon Strategy. 33 The tentative targets should not be seen as any reflection of the EU’s Lisbon Strategy. At the same time, the indicators are, as we have argued, broadly in line with the broad objectives represented by among other things the Lisbon Strategy.

116
forced temporary employed. This indicator thus reflects the fit between the needs and wants of the workforce on the one hand and the composition of the available jobs on the other. The final mobility indicator covers occupational mobility, reflecting the share of mobile persons who move upwards (in terms of skills needs) in connecting with a job shift. The target is set based on the assumption that overall upward mobility in the workforce must imply that at least 50% of all job shifts are upwardly mobile. Table 4.1: Experimental job mobility target indicators
Objective Quantitative target Productivity Facilitate high productivity levels
• Average job tenure: 7-10 years
Innovation Facilitate innovation and diffusion of knowledge
• Average job tenure in knowledge-intensive private
sector occupations: 6-9 years
Inclusion and quality of life Be voluntary and driven by positive motivations
• Voluntary job shifts as share of all job shifts: At least
66% • The share of voluntary temporary employed is higher
than the share of forced temporary employed.
Upward occupational mobility Job changes which involve increasing skill requirements
• Share of job changers who report that the present job
requires more skills than the previous job: At least 50%.
Tentative balanced job mobility status as of 2006 Table 4.2 applies values to the five target indicators defined above to the situation in 2006 (2005 for two of the targets), for 24 EU Member States for which data is available. For each indicator, each Member State has been assigned a value. The value is set at 2 when the Member State is found to achieve the target; the value is set at 1 when there is some deviation from the target; and finally, the value is set at 0 if there are significant deviations from the target. Therefore, the higher the score, the smaller the deviations from the target indicators and the closer the Member State is to a situation of ‘balanced job mobility’, in which productivity, innovation, total employment, and social inclusion are all achieved to great extent. As it appears from this experimental analysis, none of the 24 EU Member States achieved all the targets in 2006. This is illustrative of the fact that that the tentative concept of ‘balanced job mobility’ requires not only a certain level of job-to-job mobility but also a high degree of voluntariness and upward mobility in connection with job shifts. In analysing the tentative results of the ‘balanced job mobility’ scores of the 24 EU Member States, we can distinguish between three groups of countries: • Countries with a high degree of balanced job mobility, but with certain weaknesses.

117
• Countries with less mobile labour markets and with some weaknesses as regards the quality of mobility (voluntariness, upward mobility).
• Countries that deviate significantly from the targets, both as regards the extent of job mobility and the quality of job transitions.
Table 4.2: Experimental analysis of EU Member States’ ‘balanced job mobility’ scores, 2005-2006 (10=balanced job mobility), 24 EU Member States.
1. Average job tenure*
2. Avg. job tenure,
knowledge intensive
jobs*
3. Volun-tary job mobility share**
4. Share of voluntary
temp. employ-ment*
5. Share of upward occupa-
tional mobility**
Total score
UK 2 1 2 2 1 8 Ireland 2 1 2 2 0 7 Latvia 2 2 2 0 1 7 Lithuania 2 2 2 0 1 7 Estonia 2 2 2 0 1 7 Denmark 2 1 1 0 1 5 Sweden 0 1 2 1 1 5 Slovak Rep. 2 1 1 0 1 5 Luxembourg 0 1 2 0 1 4 Austria 0 0 2 1 1 4 Hungary 2 1 1 0 0 4 Cyprus 1 0 2 0 1 4 Slovenia 0 0 2 0 2 4 Italy 0 0 2 0 2 4 Netherlands 0 0 1 0 2 3 Finland 1 0 1 0 1 3 France 0 0 1 0 2 3 Czech Republic 2 1 0 0 0 3 Poland 0 1 0 0 1 2 Belgium 0 0 0 0 1 1 Germany 1 0 0 0 0 1 Spain 1 0 0 0 0 1 Greece 0 0 1 0 0 1 Portugal 0 0 0 0 0 0
*Source: Labour Force Survey 2006, 2nd quarter, ** Source: Eurobarometer 2005. Knowledge intensive jobs: Managerial and professional occupations in the non-primary private sector. Data for all 5 indicators not available for Malta. Scoring formula: 1) average job tenure: value 2 if average tenure is within target interval, value 1 if average tenure is up to 0,5 years different from target interval, value 0 if average tenure is average tenure is more than 0,5 years different from target interval; 2) avg. job tenure in knowledge intensive professions: 2 if average tenure is within target interval, value 1 if average tenure is up to 1,5 years different from target interval, value 0 if average tenure is average tenure is more than 1,5 years different from target interval; 3) voluntary job mobility share: Value 2 if at least 63,5% of job transitions are voluntary, value 1 if between 56% and 63,5% are voluntary, value 0 if less than 56% of job transitions are voluntary; 4) voluntary vs. forced temporary employment: value 2 if the ratio between voluntary and forced temporary employment is higher than or equal to 1, value 1 if the ratio between voluntary and forced temporary employment is between 0,5 and 1, value 0 if the ration is smaller than 0,5; 5) upward occupational mobility: value 2 if the share of employed who changed job once or more and has been upward occupational mobile is at least 75 %, value 1 if the share of employed who changed job once or more and has been upward occupational mobile is between 66 % and 75 %.

118
Close to balance: the Anglo-Saxons, the Scandinavians, the Baltic and Slovakia A number of countries (the Anglo-Saxon countries, two Scandinavian countries, the three Baltic countries and the Slovak Republic) are relatively close to the condition we have tentatively described as ‘balanced job mobility’, with the main challenge being the share of voluntary temporary employment (in all of the mentioned countries except the UK and Ireland) and the share of upwardly mobile job shifts (all of the countries mentioned). Sweden’s labour market also deviates to some extent from the target indicators on average job tenure and on average job tenure in knowledge intensive private sector occupations.
More significant imbalances A second set of countries (Luxembourg, Austria, Hungary, Cyprus, Slovenia, Italy, the Netherlands, Finland, France, and the Czech Republic) deviates significantly from the tentative ‘balanced job mobility’ targets. Most of the countries deviate significantly from the targets on average job tenure and job tenure in knowledge intensive private sector occupations. They all differ significantly from the target share of voluntary temporary employment. Some also differ from the target concerning the share of upwardly occupational mobile.
Out of balance: inefficient job mobility and forced job transitions
The third group of countries, consisting of Poland, Belgium, Germany, Spain, Greece, and Portugal is characterised by significant deviations from the tentative ‘balanced job mobility’ targets. Portugal deviates significantly from all five targets, and of the remaining countries in the group, all deviate significantly from at least three the five targets. Apart from the situation in Greece, voluntary job transitions as a share of all transitions make up significantly less than the target of 66% in all these countries, and for all countries, the share of voluntary temporary employment is significantly lower than the share of involuntary temporary employment.
Strong correlation between employment protection legislation and ‘balanced job mobility’ As concluded in Chapter 3 and 4 above, job mobility can be seen as both an independent and a dependent variable, i.e. job mobility has social and economic effects, but at the same time job mobility is also the result of a number of social and economic factors. The conclusions of this analysis will not be repeated here. However, it should be noted that specifically in relation to the tentative ‘balanced job mobility index’, we can observe a relatively strong correlation (R2=0,655) between the index and the OECD’s employment protection legislation index, cf. Figure 4.1. In this figure, the balanced job mobility index values from Table 4.2 above are plotted against the employment protection legislation index values for the 18 EU countries where data is avail-able,34 and the results are relatively clear. The stricter the employment protection legislation in the country concerned, the larger the deviations from the ‘balanced job mobility’ targets and the lower the ‘balanced job mobility’ score. However, this correlation should not be taken to imply that more liberal employment protection legislation is a sufficient precondition for ‘balanced job mobility’. Clearly mono-causal explanations such as this are inadequate. The good labour market performances of countries such as the UK, Ireland and Denmark during the 1990s have most likely contributed to a job
34 No EPL data available for Cyprus, Estonia, Lithuania, Luxembourg and Slovenia.

119
mobility of the kind that results in high ‘balanced job mobility’ index scores, but this performance is the outcome of the interaction of policy instruments including, but not limited to, labour market policy instruments (cf. e.g. DTI 2006: 43-44). Similarly, the example of Sweden illustrates that it is possible to achieve a relatively high degree of ‘balanced job mobility’ with comparatively strict employment protection legislation. Figure 4.1: Employment protection legislation and ‘balanced job mobility’ values for 18 EU countries, 2003 and 2005
PT
ESGR
BE
DE
FRNL
SE
HU
SK
EI
UK
DK
ITAT
CZ
PL
FI
R2 = 0,6546
-1
0
1
2
3
4
5
6
7
8
0,75 1,25 1,75 2,25 2,75 3,25 3,75
EPL index value (2003)
BJM
inde
x va
lue
(200
5-6)
Sources: EPL indicator values: OECD 2004. Balanced job mobility index values: Labour force survey 2006, Eurobarometer 2005 Nevertheless, the evidence in Figure 4.1 suggests that very strict employment protection legislation can negatively impact on ‘balanced job mobility’ and that moderate to low levels of employment protection legislation may contribute to more ‘balanced job mobility’.
Do flexicurity approaches lead to ‘balanced job mobility’ – or vice versa? In the introduction to this report, we highlighted that the efforts to increase mobility are strongly related to and interact with policies to increase flexicurity. Thus, flexicurity according to the European Commission’s 2007 communication refers to ‘flexible and reliable contractual arrangements through modern labour laws, collective agreements and work organisation’ and ‘modern social security systems that provide adequate income support, encourage employment and facilitate labour market mobility’ as two of the four key elements defining a ‘flexicurity strategy’ – the others being focus on lifelong learning and on active labour market policies.
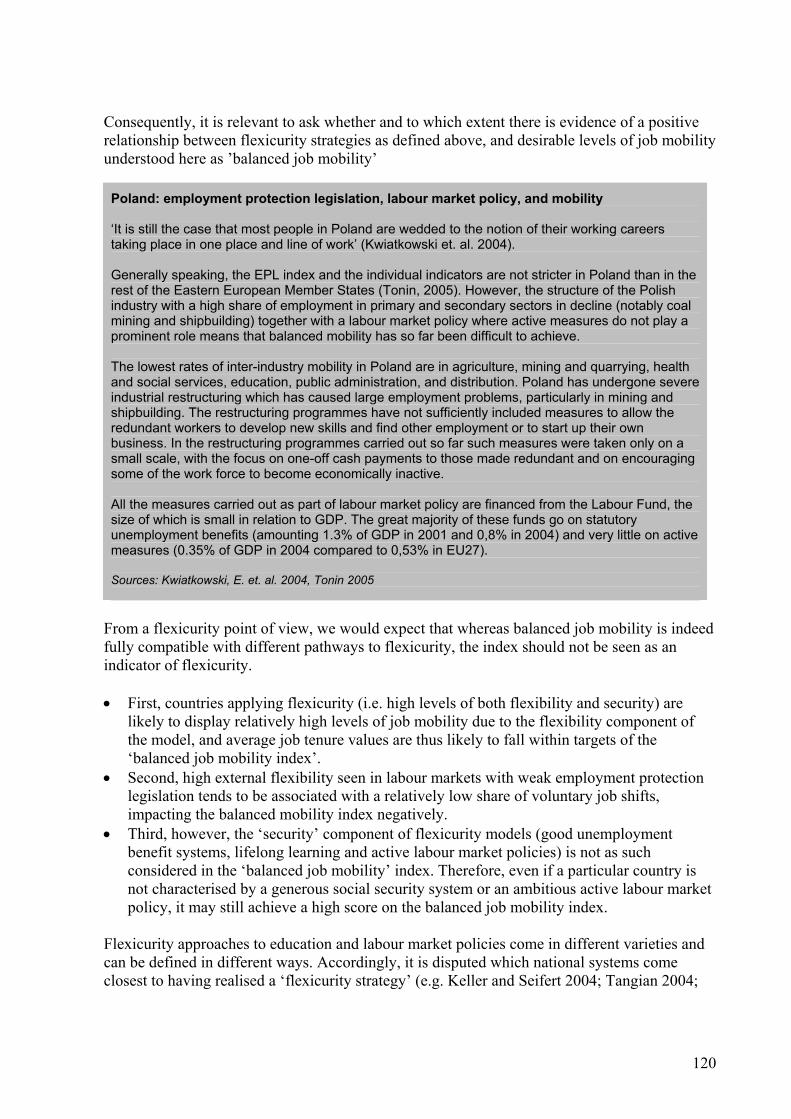
120
Consequently, it is relevant to ask whether and to which extent there is evidence of a positive relationship between flexicurity strategies as defined above, and desirable levels of job mobility understood here as ’balanced job mobility’
Poland: employment protection legislation, labour market policy, and mobility ‘It is still the case that most people in Poland are wedded to the notion of their working careers taking place in one place and line of work’ (Kwiatkowski et. al. 2004). Generally speaking, the EPL index and the individual indicators are not stricter in Poland than in the rest of the Eastern European Member States (Tonin, 2005). However, the structure of the Polish industry with a high share of employment in primary and secondary sectors in decline (notably coal mining and shipbuilding) together with a labour market policy where active measures do not play a prominent role means that balanced mobility has so far been difficult to achieve. The lowest rates of inter-industry mobility in Poland are in agriculture, mining and quarrying, health and social services, education, public administration, and distribution. Poland has undergone severe industrial restructuring which has caused large employment problems, particularly in mining and shipbuilding. The restructuring programmes have not sufficiently included measures to allow the redundant workers to develop new skills and find other employment or to start up their own business. In the restructuring programmes carried out so far such measures were taken only on a small scale, with the focus on one-off cash payments to those made redundant and on encouraging some of the work force to become economically inactive. All the measures carried out as part of labour market policy are financed from the Labour Fund, the size of which is small in relation to GDP. The great majority of these funds go on statutory unemployment benefits (amounting 1.3% of GDP in 2001 and 0,8% in 2004) and very little on active measures (0.35% of GDP in 2004 compared to 0,53% in EU27). Sources: Kwiatkowski, E. et. al. 2004, Tonin 2005
From a flexicurity point of view, we would expect that whereas balanced job mobility is indeed fully compatible with different pathways to flexicurity, the index should not be seen as an indicator of flexicurity. • First, countries applying flexicurity (i.e. high levels of both flexibility and security) are
likely to display relatively high levels of job mobility due to the flexibility component of the model, and average job tenure values are thus likely to fall within targets of the ‘balanced job mobility index’.
• Second, high external flexibility seen in labour markets with weak employment protection legislation tends to be associated with a relatively low share of voluntary job shifts, impacting the balanced mobility index negatively.
• Third, however, the ‘security’ component of flexicurity models (good unemployment benefit systems, lifelong learning and active labour market policies) is not as such considered in the ‘balanced job mobility’ index. Therefore, even if a particular country is not characterised by a generous social security system or an ambitious active labour market policy, it may still achieve a high score on the balanced job mobility index.
Flexicurity approaches to education and labour market policies come in different varieties and can be defined in different ways. Accordingly, it is disputed which national systems come closest to having realised a ‘flexicurity strategy’ (e.g. Keller and Seifert 2004; Tangian 2004;

121
Eamets and Paas 2007). In section 2.6 above, we compared job mobility index values with the clustering into 6 different employment regimes defined in recent work on occupational mobility (European Foundation 2007c). The findings here re-affirm the earlier conclusion in the sense that ‘balanced job mobility’ can not be associated with one particular articulation of policy or with one particular labour market regime, but may be achieved in different ways. • Nordic-style flexicurity strategies and flexicurity models are therefore not the only way to
achieve balanced job mobility. • Equally compatible with ‘balanced job mobility’ are more liberal approaches, with a similar
or even stronger focus on labour market flexibility and relatively liberal employment protection legislation, but with less ambitious social security and social cohesion policies.
• Labour market policy approaches emphasising job security and aiming to create flexibility mainly within firms are less compatible with ‘balanced job mobility’, especially where job security for the core workforce is at the expense of the security and upward mobility of workers at the margin of the labour market.
4.2 Towards ‘balanced job mobility’: policies, challenges and options The analysis carried through in the current chapter as well as the analyses in the previous chapters highlight that job mobility is a multi-faceted phenomenon which may be induced and influenced by a number of very diverse factors. The situation across Europe with respect to job mobility differs very much and the need to strengthen job mobility is higher in some EU Member States than in others. In addition, the question of some kind of ‘balanced job mobility’ can be addressed by other stakeholders than government. Below, we discuss a number of policy instruments and policy options for different stakeholders. In the discussion, we will refer more to the clusters of EU Member States described in a previous section and less to individual Member States and discuss for each cluster the degree to which there is a need to promote further and better job mobility in the labour markets of these Member States. First, however, we will attempt to define ‘good policies’ for balanced job mobility. Against the background of the evidence and analysis presented above, which public priorities, regulation and measures could be adopted to achieve a high degree of ‘balanced job mobility’?
Good policies for ‘balanced job mobility’: an appropriate policy mix In line with the ‘balanced job mobility’ approach, both structural framework conditions and regulatory measures directly influencing job mobility should be considered. This is because job mobility which benefits both productivity and employment is facilitated not only by the most appropriate types of labour market regulation, but also by the broader capacity of the economy to generate vacancies and new jobs. Likewise, we have demonstrated that voluntary job mobility – which from a social as well as an economic perspective is far more beneficial than involuntary job mobility – is closely correlated with overall levels of employment and unemployment. In other words, policies that enhance ‘balanced job mobility’ are also relevant for employment and job creation. Against this background, a policy mix to achieve balanced job mobility should contain the following broad elements:

122
1) General policies for economic growth and high employment Balanced job mobility, as defined here, is facilitated by high levels of employment and low levels of unemployment. Therefore: • Overall, economic policy should facilitate economic growth and job creation, as high
employment stimulates desirable levels of job mobility, and as high employment and low unemployment are objectives in their own right. The current consensus (cf. e.g. OECD 2001, 2003; European Commission 2004; DTI 2005) on essential framework conditions for economic growth and high employment include:
- a macro-economic policy which ensures low and stable inflation, stabilises cyclical
fluctuations and limits budget deficits; - a non-distortionary tax system, which encourages business and job creation; - policies that facilitate the functioning of capital and product markets and facilitate
international trade; - public investments which ensure a suitable endowment of among other things trans-
port, energy and communications infrastructure; - public investments for equipping the labour force with appropriate levels of skills
and training; - public investments and activities for promoting the development, diffusion, and
utilisation of new knowledge; - public measures and activities for promoting entrepreneurship.
2) Labour market and social protection regulation facilitating job mobility Regulatory labour market framework conditions should facilitate job creation and job mobility and avoid the exclusion of specific groups from participation in the labour market. Specifically, this implies that: • employment protection legislation should aim at minimizing disincentives for employers to
hire new staff • social protection rights and entitlements, health care insurance and benefits and pensions
should be independent of specific employment relationships and should be ‘portable’ between employers.
3) Education and training policies Firm-specific skills, provided in the framework of public education programmes, tend to reduce voluntary job mobility by making the employer less inclined to lay off the worker and by making it less attractive for the worker to change employer. Conversely, general and occupa-tion-specific human capital promotes voluntary job mobility by increasing workers’ oppor-tunities outside their current organisation. At the same time, weaker groups in terms of education and skills are less inclined than other groups to be voluntarily mobile in the labour market. Consequently: • public education and training policies (including lifelong learning policies) should focus on
increasing the general employability of workers

123
• public education and training policies should stimulate continued education and lifelong learning, in particular among those with little or no formal education
• public education and training policies should strengthen the efforts to reduce as far as possible the number of young people who leave primary school with no further general or vocational education.
Member States significantly removed from ‘balanced job mobility’: need for reforms In a number of EU Member States for which the relevant data is available, the situation devi-ates significantly from the situation defined tentatively in this report as ‘balanced job mobility’, cf. Table 5.2. This group includes some of the old central West European EU countries (Belgium and Germany), most southern European EU states (Greece, Italy, Spain), and Poland. Both from an economic and from a social perspective, there are good reasons to believe that measures that facilitate more and better job mobility would be beneficial in these countries. In particular, measures that would improve job mobility and at the same time facilitate job creation and lower long-term unemployment rates would be beneficial. On the basis of the evidence presented in this report, as well as on other types of evidence (European Commission 2006, 2006b), the following policy instruments may be considered by the countries in these group: • Reducing tax burdens in order to facilitate job creation. • Ongoing efforts to improve competition in product and capital markets • Review of employment protection legislation and regulation with a view to increasing
external flexibility. • Review of benefit systems in order to identify benefits and rights which are not portable • Measures to increase portability of rights and entitlements • Some countries are characterised by a high degree of vocational specificity of training
system (European Foundation 2007c). These countries may consider reviewing education and training policies and structures, with a view to strengthening cross-vocational employability.
• Investment in education and training, in particular focusing on low-educated groups and on lifelong learning, Particular attention should be accorded to increasing the responsiveness of education and training systems to labour market needs.
Promoting internal flexibility (intra-firm flexibility) can be viewed as a supplementary policy option. Under the right circumstances, internal flexibility, in the form of, for instance, flexible forms of work organisation and greater employee autonomy can probably facilitate productivity and innovation in enterprises, and can thereby contribute to competitiveness and employment (cf. European Commission 2007: 141-147). However, relying exclusively on the promotion of internal flexibility and leaving strict employment protection legislation in place is unlikely to solve the unemployment problems of the non-core labour force associated with strict EPL.
Member States with certain job mobility imbalances: a diversified response A second group of countries are closer to achieving ‘balanced job mobility’, but there is still some distance to the target values. Compared to a situation of balanced job mobility, this group of countries is characterised by overly long average job tenures and thus relatively rigid labour markets and/or too low quality of job mobility in the sense that the labour market is

124
characterised by low shares of voluntary job mobility, low shares of voluntary temporary employment, and low shares of upward occupational mobility. For Member States with these job mobility imbalances, the following policy options present themselves: • Review of employment protection legislation and regulation with a view to increasing
external flexibility. • Review of benefit systems to identify benefits and rights which are not portable. • Measures to increase portability of rights and entitlements. • Investment in education and training, in particular focusing on low-educated groups and on
lifelong learning. Particular attention should be accorded to increasing the responsiveness of education and training systems to labour market needs.
• Countries characterised by a high degree of vocational specificity of training systems may consider reviewing education and training policies and structures with a view to strengthening cross-vocational employability.
Close to balance: less action needed Evidently, for the group of countries with a labour market situation closest to ‘balanced job mobility’ there are less immediate needs to implement significant reforms. In some countries with full employment, such as Ireland and Denmark (from early 2008), the most immediate concern would be to prevent an unsustainable overheating of the economy, with levels of job mobility that are economically disadvantageous for society. Indeed, anecdotal evidence from Denmark suggests that levels of job mobility are currently too high, at least in some sectors such as ICT services, with average job tenure significantly below the 7-10 years which is proposed as a relevant target here.
4.3 Options and challenges for the European Commission In light of these considerations, what could the European Commission consider in order to promote the achievement to a greater extent of ‘balanced job mobility’ in the European Union? Against the background of the above findings, the following options would seem relevant for the Commission: • Upholding focus on growth and employment-oriented macroeconomic policies, competition
policy, policies for research and innovation, education policy, and labour market policy, such as it is currently done within the framework of the renewed Lisbon Strategy and the European Employment Strategy.
• Continue to stimulate and facilitate the debate with the EU Member States, social partners
and other interested parties on flexible contractual arrangements within the overall flexicurity context.
• Strengthening and broadening initiatives to ensure transparency and permeability of
educational systems and to support lifelong learning in the Member States, including the implementation of EQF and ECVET in the Member States.

125
• Further development of monitoring indicators for the European Employment Guidelines.
For example, labour market turnover, average job tenure or the share of (involuntary) non-permanent or part-time contracts could be used as relevant monitoring indicators for ‘balanced job mobility’.
• Given the change towards more transitional labour markets in Europe, Statistics such as the
European Labour Force Survey could be reviewed in terms of obtaining more reliable and comparable data on transitions in the labour market. Particularly, there is an information gap concerning occupational transitions and transitions between different employment statuses.
4.4 Options and challenges for the Social Partners The social partners have an important role in the process towards more balanced job mobility. As this study has shown, balanced job mobility is beneficial to employees as well as employers. Therefore, balanced job mobility can only be achieved if social partners at all levels actively enter into a constructive dialogue on the trade-offs involved. The following options present themselves for social partners: • Taking active part at all levels in the development of policies conducive to balanced job
mobility • Initiating or strengthening constructive social dialogue focusing on combinations of
flexibility (internal as well as external) and security, including the right to lifelong education and training
• Ensuring that members become more aware of the advantages for themselves of balanced job mobility.
4.5 Conclusions This chapter has focused on ways to optimise levels of job mobility. In this connection, we have discussed the question of desirable levels of job mobility, and we have, in an experimental manner, defined and applied a number of target indicators for a situation defined as ‘balanced job mobility’. The conclusions of the chapter can be summarised in the following key points. It is not possible to define a context-independent optimal level of job mobility. From an economic perspective, an optimal level of job mobility can be identified in principle, but the assumptions that need to be made render the exercise meaningless in a policy perspective. It is not possible to define an optimal level of job mobility from a social perspective, as social effects of job mobility are highly context dependent. Moreover, factors affecting job mobility may in themselves have significant wider labour market implications that must be considered, one of them being employment protection legislation. Secondly, the question of optimal levels of job mobility necessarily involves political priorities. It is not possible to weigh for instance economic and social costs and benefits against each others without making explicit value judgements.

126
In the further discussion about desirable levels of job mobility, a prevailing consensus in contemporary Europe on the desirability of ‘an inclusive knowledge society’ has been applied as a normative stepping stone. Based on the key elements of the policy objectives of these commonly agreed strategies, the tentative concept of ‘balanced job mobility’ was defined. • ‘Balanced job mobility’ refers to a situation where job mobility is at level which is con-
ducive to productivity and innovation, in combination with a high share of voluntary job transitions and a high share of upward occupational mobility.
• Different employment regimes are compatible with a high degree of ‘balanced job mobility’.
• Following these conclusions, we have highlighted a set of policy options for balanced job mobility for different stakeholders.

127
5. Literature Auer, P. and Cases, S., 2000. ‘The resilience of the long-term unemployment relationship: Evidence from the industrialised countries’, International Labour Review, Vol. 139, No. 1, pp. 379–408. Auer, P., Janine Berg, and Ibrahim Coulibaly, 2004. ‘Is a stable workforce good for the economy? Insights into the tenure-productivity-employment relationship’. Geneva: ILO, Employment Analysis and Research Unit. Auer, P., 2005. ‘Protected Mobility for Employment and Decent Work: Labour market security in a globalised world’. Employment Strategy Papers, International Labour Office (ILO), Employment Analysis and Research Unit, Employment Strategy Department. Auer, Peter and Cazes, Sandrine (2000), ‘The Resilience of the Long-Term Employment Relationship: Evidence from the Industrialized Countries’. International Labour Review, v. 139, no. 4. 2000. Auer and Cazes (eds.), 2003. Employment stability in an age of flexibility. Evidence from industrialized countries. Geneva: ILO. Baker, D., A. Glyn, D. Howell and J. Schmitt, 2004. ‘Labour Market Institutions and Unemployment: a critical assessment of cross-country evidence’, forthcoming in D. Howell (ed.), Fighting Unemployment: the limits of free market orthodoxy, Oxford University Press, Oxford. Beck, U., Risk society. Towards a new modernity, London, Sage, 1992. Becker, G., 1962. ‘Investment in human capital: A theoretical analysis’, Journal of Political Economy, 70, pp. 9-49. Beeson Royalty, A., 1998. ‘Job-to-job and job-to-nonemployment turnover by gender and education level’, Journal of Labor Economics, Vol. 16, No. 2, pp. 392–443. Belkhodja, Alya, 1992. ‘Staying put: Job tenure among paid Workers’, Perspectives on Labour and Income, Winter (Vol. 4, No. 4) Article No. 3. Bentolila, S. and J. Dolado (1994), ‘Spanish Labour Markets’, Economic Policy, April, pp. 53-99. Blakemore, A. and Hoffman D., 1989. ‘Seniority rules and productivity: an empirical test’, Economica 56, pp. 359-371. Bukodi, E. and P. Róbert, 2007. ‘Occupational Mobility in Europe’. European Foundation for the Improvement of Living and Working Conditions, Dublin.: http://www.eurofound.europa.eu/pubdocs/2007/11/en/1/ef0711en.pdf

128
Cazes, S. and Nesporova, A., 2003. Labour markets in transition: Balancing flexibility and security in central and eastern Europe. Geneva, International Labour Organisation. Cedefop, 2001. The transition from education to working life. Key data on vocational training in the European Union, Cedefop Reference series, Luxembourg, Office for Official Publications of the European Communities. Christofides, Louis, 2006. ‘Cyprus - Contribution to the EEO Autumn Review 2006, ‘Flexicurity’’, European Employment Observatory. Chung, H., 2005: ‘Different Strategies for Flexibility Employment protection and temporary employment: A study of cross-national variance on temporary employment in 19 OECD countries’. Paper presented at the TLM.NET conference: Managing Social Risks through Transitional Labour Markets, 19 - 21 May 2005 (Draft) Coppin, L. and T. Vandenbrande, 2007: ‘Voluntary and forced job mobility in Europe’. European Foundation for the Improvement of Living and Working Conditions, Dublin. Only available in electronic format: http://www.hiva.be/docs/rapport/R1177.pdf Cornelißen, T. et. al., 2007: ‘Cyclical effects on job-to-job mobility: An aggregated analysis on microeconomic data‘. Diskussionspapiere der Wirtschaftswissenschaftlichen Fakultät der Universität Hannover dp-371, Universität Hannover. http://ideas.repec.org/p/han/dpaper/dp-371.html Davia, María A., 2005. ‘Job mobility and wage mobility at the beginning of the working career: a comparative view across Europe’. Working Papers of the Institute for Social and Economic Research, paper 2005-03. Colchester: University of Essex. DiPrete, Th., 2005. ‘Labor markets, Inequality, and Change: A European Perspective’. Work and Occupations 2005, No.32. SAGE. Dolton P. J. and Kidd, M. P. (2001), ‘Job changes, occupational mobility and human capital acquisition: An empirical analysis’, Bulletin of Economic Research, Vol. 50, Issue 4, 1998, p. 265. DTI, Danish Technological Institute, 2005. Thematic Evaluation of the Structural Funds’ Contributions to the Lisbon Strategy. Aarhus and Brussels. DTI, Danish Technological Institute, 2006. Restructuring in Europe. Anticipating the negative labour market effects. Aarhus and Brussels. Eamets, R. and Paas, T., 2007. ‘Labour market flexibility and flexicurity’, in Paas, T. and Eamets, R. (eds.), Labour market flexibility, flexicurity and employment: Lessons of the Baltic states, Nova Science. The Employment Taskforce, 2003: Jobs, jobs, jobs. Creating more employment in Europe. Report of the Employment Taskforce chaired by Wim Kok. Available at

129
http://ec.europa.eu/employment_social/employment_strategy/pdf/etf_en.pdf . (Accessed 20. April 2008) Enright, M. J., 2000. ‘The globalisation of competition and localization of competitive advantage’, in Hood N. & S. Young, The globalisation of multinational enterprise activity and economic development, Houndsmill, Basingstoke: Macmillan. Eriksson, T. and N. Westergaard-Nielsen, 2007: ‘Wage and labor mobility in Denmark’ NBER WORKING PAPER SERIES, Working Paper 13064, Cambridge, MA. Esping-Andersen, Gösta, 1990. Three worlds of welfare capitalism, Cambridge: Polity Press. European Commission, 2004. Third Report on Economic and Social Cohesion, Brussels. European Commission, 2006. Implementing the renewed Lisbon Strategy for growth and jobs - "A year of delivery", COM(2006) 816 final, part I. European Commission, 2006b. Recommendation for a Council Recommendation on the 2007 up-date of the broad guidelines for the economic policies of the Member States and the Community and on the implementation of Member States' employment policies, COM(2006) 816 final, part III. European Commission, 2006c. Employment in Europe 2006. Brussels. European Commission, 2007. Employment in Europe 2007. Brussels. European Foundation, 2002. Temporary agency work: national reports, UK and Spain. http://www.eurofound.europa.eu/ewco/employment/status/tempagency_bk.htm#nat European Foundation, 2006. ‘Mobility in Europe Analysis of the 2005 Eurobarometer survey on geographical and labour market mobility’. Dublin: European Foundation for the Improvement of Living and Working Conditions. European Foundation, 2007. Voluntary and forced job mobility in Europe. Dublin: European Foundation for the Improvement of Living and Working Conditions. European Foundation 2007b. Approaches to flexicurity: EU models. Dublin: European Foundation for the Improvement of Living and Working Conditions. European Foundation 2007c, Occupational mobility in Europe. Dublin: European Foundation for the Improvement of Living and Working Conditions. Eurostat 2007: Labour Market Policy. Luxembourg: Office for Official Publications of the European Communities, ISSN 1725-602X Farber, H., 1998. ‘Mobility and Stability: The Dynamics of Change in Labor Markets’, Working Paper 400, Princeton, Industrial Relations Section. Princeton. Feldman, D. C. and Ng, T. W. H., 2007. ‘Careers: Mobility, Embeddedness, and Success’. Journal of Management, vol. 33, No. 3. SAGE.

130
Ferrara, M., 1996. ‘The ‘Southern model’ of welfare in social Europe’, Journal of European Social Policy, Vol. 6, No. 1, pp. 17–37. Freeman, C., 1987. Technology Policy and Economic Performance: Lessons from Japan. London: Frances Pinter Gangl, M., 2002: ‘The Only Way is Up? Employment Protection and Job Mobility among Recent Entrants to European Labour Markets’. Arbeitspapiere - Mannheimer Zentrum für Europäische Sozialforschung Nr. 48. Mannheim. Goldthorpe, J.H., ‘Globalisation and social class’, Western European Politics, Vol. 25, No. 3, 2002, pp. 1–28. Grant, Linda & Yeandle, Sue, Lisa Buckner (2006). ‘Working Below Potential: Women and Part-time Work - Synthesis Report’. Centre for Social Inclusion, Sheffield Hallam University. Greenhalgh, C. and G. Mavrotas, 1991. ‘Job training, new technology and labour turnover’, Oxford Applied Economics Discussion Paper, October, no. 121. Hersch, J. and Stratton, L. S., ‘Housework, fixed effects, and wages of married workers’, The Journal of Human Resources, Vol. 32, No. 2, 1997, pp. 285–307. Hopenhayn, H. and R. Rogerson, 1993. ‘Job Turnover and Policy Evaluation: A General Equilibrium Analysis’, Journal of Political Economy, Vol. 101, pp. 915-938. Hoisl, K., 2006. ‘Tracing Mobile Inventors - The Causality between Inventor Mobility and Inventor Productivity’ Munich Business Research, Working Paper 2006-09. Hoisl, K., 2007. Does mobility increase the productivity of inventors? New evidence from a quasi-experimental design, Paper presented at the DRUID Summer Conference, Copenhagen, June 18-20. Ignacio, J. and Pérez, J (work in progress). Wage changes through job mobility: does unemployment mean a penalty in Europe? http://epunet.essex.ac.uk/abstracts/sanz_ab.pdf Jovanovic, B., 1979. ‘Firm-specific capital and turnover’, Journal of Political Economy, 87(6), pp. 972-990. Keith, K. and McWilliams, A.: The Wage Effects of Cumulative Job Mobility. Industrial and Labor Relations Review, Vol. 49, No. 1 (Oct., 1995), pp. 121-137 Keller and Seifert, 2004. ‘Flexibility – the German trajectory’, Transfer, Vol. 10, No. 2, pp. 226–247. Kramarz, F. and Roux, S., 1999. ‘Within-firm seniority structure and firm performance’. Centre for Economic Performance Discussion Paper 420.

131
Kristensen, Nicolai; Westergaard-Nielsen: ‘Does low job satisfaction lead to job mobility?’. IZA Discussion Paper No. 1026, February 2004. Kwiatkowski, E. et. al., 2004: ‘Inter-Industry Labour Mobility in Poland’. Research Project commissioned by EU DG Employment, Social Affairs and Equal Opportunities, Contract No. VC/2003/0367. Lenzi, C., 2006. ‘Workers’ innovative productivity and job mobility. Evidence from a survey of Italian inventors’, Paper presented at the DRUID Summer Conference 2006 on ‘Knowledge, Innovation and Competitiveness’, Copenhagen 18-20 June. Leontaridi, R. M. and Sloane, P. J. 2003. ‘Low pay, higher pay, earnings mobility and job satisfaction’. Paper for BHPS 2003 conference. Lichtenberg, F., 1981. ‘Training, tenure and productivity’. NBER Working Paper 671. Lin, N., 2007. ‘Inequality in Social Capital’. Contemporary Sociology, Vol. 29, No. 6, pp 785-795. Lundvall, Bengt-Åke, ed., 1992. National Systems of Innovation: Towards a Theory of Innovation and Interactive Learning, London: Pinter. Macías, Enrique Fernández, 2006. ‘Mobility in the UK from a comparative EU perspective’. European Foundation for the Improvement of Living and Working Conditions. Discussion paper presented in the Foundation visit to the United Kingdom, London, 4-5 April. Michie, J. and Sheehan, S. 2003. ‘Labour market deregulation, ‘flexibility’ and innovation’, Cambridge Journal of Economics, vol. 27, pp. 123-143. Moody, J. and White, D. R., 2001. ‘Structural Cohesion and Embeddedness: A hierarchical conception of social groups’. Santa Fe Institute Working Papers. New Mexico: Santa Fe Institute. Nelson, R.R., 1993. National Innovation Systems. New York: Oxford University Press. OECD, 2001. The New Economy: Beyond the Hype. Final Report on the OECD Growth Project. Paris. OECD, 2003. The Sources of Economic Growth, Paris. OECD, 2004. OECD Employment Outlook. Paris

132
Omariba, W., 2002. ‘Social Cohesion in Europe – a bibliography’. Research paper, the Family Transformation and Social Cohesion Project. http://sociology.uwo.ca/ftsc/Bibliography%20of%20Papers%20on%20Social%20Cohesion%20in%20Europe.PDF Pavlopoulos, D. et al., 2007. ‘Job mobility and wage mobility of high- and low-paid workers’. Schmollers Jahrbuch: Journal of Applied Social Science Studies, 127 (1), 47-58. Picot, G., A. Heisz and A. Nakamura, 2001. ‘Job Tenure, Worker Mobility and the Youth Labour Market During the 1990s’, Statistics Canada. Pedersen, Ø. R. C., 2001. Clusteranalyse af IKT sektoren i Nordjylland, Aalborg Universitet. Porter, M. 1998. Clusters and the new economics of competition, Boston: Harvard Business Review. Porter, M., 1990. The competitive Advantage of Nations. Houndsmill, Basingstoke: Macmillan. Poulsen, M. L., 2002. En redegørelse for clusterteori med særligt henblik på kommuni-kationsclusteret i Nordjylland, Københavns Universitet. Putnam, R.D., 2000. Bowling alone. The Collapse and Revival of American Community. New York. Simon & Schuster. Putnam, R. D., 2007. ‘E Pluribus Unum: Diversity and Community in the Twenty-first Century – The 2006 Johan skytte Prize Lecture’. Scandinavian Political Studies, Vol 30 – No. 2. Copenhagen etc.: Nordic Political Science Association/Blackwell Publishing. Recchi, E. et al., 2006. ‘Geographical and Job Mobility in the EU’. DG Employment, Social Affairs and Equal Opportunities, Tender No. VT/2005/0107. Authors: Ettore Recchi, Emiliana Baldoni, Francesca Francavilla, Letizia Mencarini, CIUSPO, University of Florence. Riboud, M., Sánchez-Páramo, C. and Silva-Jáuregui, C., 2002. ‘Does Eurosclerosis matter? Institutional reform and labor market performance in central and eastern Europe’, World Bank Technical Paper, No. 519. Rifkin, J., Heilbroner, R.L., 1995, The end of work: the decline of the global labor force and the dawn of the post-market era, New York. Saar, E., ‘New entrants on the Estonian labour market: comparison with the EU countries’, European Societies, Vol. 7, 2005, pp. 513–46. Saar, E. and Helemae, J., ‘Employment career of men in Estonia’, in Blossfeld, H.-P., Mills, M. and Bernardi, F. (eds.), Globalisation, uncertainty and men’s careers. An international comparison, Cheltenham, UK and Northampton, MA, Edward Elgar, 2006.

133
Sapsford, D. and Tzannatos, Z., 1993. The Economics of the Labour Market. Houndsmill, Basingstoke: Macmillan. Sousa-Poza, A. and Henneberger, F., 2002. ’Beweggründe und Determinanten zwischenbetrieblicher Mobilität: Die Schweiz in einer internationalen Perspektive’ Mitteilungen aus der Arbeitsmarkt– und Berufsforschung, vol. 35(2), pp.205-231. Nürnberg: Institut für Arbeitsmarkt– und Berufsforschung (IAB). OECD, 2004. Employment Outlook. Paris, Organisation for Economic Co-operation and Development. Scherer, S., 2005. ‘Patterns of labour market entry – Long wait or career instability? An empirical comparison of Italy, Great Britain and West Germany’, European Sociological Review, Vol. 21, No.5, 2005, pp. 1–14. Schmid, G., 1998. ‘Transitional Labour Markets: A New European Employment Strategy’ Discussion Paper FSI pp. 98 -206, Wissenschaftszentrum Berlin für Sozialforschung Schmid, G. and Schömann, K. (eds.), 2003. The concept of transitional labour markets and some policy conclusions: The state of the art, TLM.Net Working Paper No. 2003–01, Berlin, Wissenschaftszentrum Berlin für Sozialforschung. Schumpeter, Joseph, 1975. Capitalism, Socialism and Democracy. New York: Harper. [orig. pub. 1942]. Song, J., Almeida, P. and Wu G., 2003. ‘Learning by hiring: When is mobility more likely to facilitate interfirm knowledge transfer?’ Management Science vol. 49, no. 4, pp. 351-365. Stevens, Ann H., 1997. ‘Persistent Effects of Job Displacement: The Importance of Multiple Job Losses’. Journal of Labor Economics, Vol. 15, No. 1, Part 1, pp. 165-188. Tangian, A.S., 2004. ‘Defining the Flexicurity index in application to European countries’. Diskussionspapier Nr. 122, Hans Böckler Stiftung. Tonin, M., 2005: ‘Updated Employment Protection Legislation Indicators for Central and Eastern European Countries’. Institute for International Economic Studies (IIES), Stockholm University. Available at http://www.iies.su.se/~tonin/mirco_files/MircoToninEPLIndicatorsPaper.pdf Visser, J., 2006: ‘Union membership statistics in 24 countries’. Monthly Labor Review, January 2006, pp. 38-49. White, D. R.(2003): Ties, Weak and Strong in Karen Cristensen and David Levinson, Eds. Encyclopedia of Community. Thousand Oaks, CA: Sage. Zucker, L. G., Darby, M.R., and Armstrong, J., 1998. ‘Geographically localized knowledge: Spillovers or market?’, Economic Inquiry vol 36, no. 1, pp. 65-86.

134
Zucker, L. G:, Darby, M.R. and Torero, M., 2002. ‘Labor mobility from academe to commerce’, Journal of Labor Economics, vol. 20, no. 3, pp. 629-660.
135
Annex 1: Description of the datasets The mapping of job mobility in Europe in the current study draws on data from The European Labour Force Survey (LFS), The Eurobarometer Survey 2005, the European Community Household Panel (ECHP) and the European Union Statistics on Income and Living Conditions (EU-SILC). The following sections further describe the datasets focusing on the selected variables as well as the usability and limitations of each dataset in relation to this study.
Eurobarometer 2005: Special focus on mobility The Eurobarometer EB 64.1 survey conducted in 2005 had a special focus on geographical and labour market mobility. The survey covered 25 Member States with a sample of approximately 25.000 individuals. The main advantage of Eurobarometer is that it contains up-to-date information and covers the full range of EU Member States. Furthermore, the special focus on mobility implies that a lengthy battery of relevant variables is included. The main disadvantage of Eurobarometer lies in its nature as a stand-alone survey which does not allow for the construction of time-series. However, some of the questions included do in fact have a retrospective focus, allowing for measuring changes in status. From the Eurobarometer EB 64.1, we have extracted the following list of variables which are used in the analysis: Background variables: • Country • Gender • Age group (in 10-year intervals) • Highest level of education completed • Household structure • Economic sector (NACE) • Occupational category (ISCO) • Nature of transition (forced or voluntary) Employment mobility variables: • Employment status Occupational mobility variables: • Change of job title • Need for more skills in present job compared to previous job Job-to-job mobility variables: • Job tenure • Average job duration

136
European Union Labour Force Survey (LFS) The European Union Labour Force Survey is a quarterly sample survey administered by Eurostat. The LFS covers EU Member States as well as Candidate Countries and EFTA members. The survey is intended to cover the whole of the resident population, i.e. all persons whose usual place of residence is in the territory of the participating countries. The units of measurement in the LFS are individuals and households in the participating countries. The sample size for is approximately 1.700.000 individuals for each sample, with sampling rates between 0.2 % and 3.3 % across countries. The main advantage of LFS in relation to the current study is that the national surveys follow a harmonized set of guidelines and definitions. Thus, the LFS allows for relatively precise comparisons across countries. In addition, the LFS covers a time span of more than 20 years which allows for measuring trends in job mobility over time. For the purposes of the current study we have extracted data covering the period 1995-2005. From the LFS, we have extracted the following list of variables which are used in the analysis: Background variables: • Country • Gender • Age group (in 10-year intervals) • Highest level of education completed • Type of job (full-time or part-time) • Type of contract (permanent or temporary) • Economic sector (NACE) Employment mobility variables: • Main labour status • Main labour status one year before the survey • Duration of search for employment Occupational mobility variables: • Occupational status • Occupational status in previous job Job-to-job mobility • Years in current job (Job tenure) Though the above variables cover the mobility definitions of the study, LFS however, has four main disadvantages. First of all, the list of questions is not entirely the same for each of the participating countries because several variables are included on an optional basis only. This is the case for certain key variables, e.g. ‘Main labour status’ and ‘Main labour status one year before the survey’.

137
Second, the sampling size of the LFS, though relatively large, imposes analytical limitations on the data set. This is partly caused by the fact that the amount of individuals who experience job mobility is relatively small compared to the amount of individuals who do not. Thus, an individual’s change of employment, occupational or job status is a comparatively rare event which produce small cell sizes and result in diminished accuracy of results(i.e. the cell sizes become small when data is disaggregated by country and gender, education, age group, type of contract etc.). Third, the list of variables included in the LFS dataset does not fully correspond to the analytical framework set up in the current study. Thus, while the concept of employment mobility may be covered by the variable ‘Main labour status’ the concept of job-to-job mobility is only covered in part by the variable ‘Years in current job (tenure)’. In this respect, an operational definition of the analytical concept of job mobility is hampered by the fact that the LFS does not measure an individual’s change of job directly but only by the proxy variable ‘Years in current job (tenure)’. Furthermore, the operational definition of job mobility in LFS only includes changes in status that has occurred during the past year. Changes before that as well as changes within the preceding year are not included. Fourth, the concept of occupational mobility, while covered in principle by the variables ‘Occupational status’ and ‘Occupational status one year before the survey’, cannot be analysed using the LFS. This stems from too many missing values in the dataset on these particular variables and the fact that no respondent has a non-missing value on both variables (this is required to construct a variable measuring changes in occupational status). Thus, it is not possible to compute a variable covering changes in occupational status using the LFS dataset.
European Community Household Panel (ECHP) The European Community Household panel (ECHP) was a yearly survey commissioned by Eurostat and carried out by national data collection units. The ECHP was conducted in the period 1994-2001 in a selection of EU Member States. For each year, approximately 130.000 individuals covering some 60.000 households were interviewed using a standardised questionnaire. Like the LFS, the ECHP has a major advantage in that it allows for relatively accurate cross country comparisons because of the harmonised set of sampling guidelines and list of questions. Furthermore, the longitudinal ‘panel’ design of the ECHP makes it possible to follow up and interview the same set of private households and persons over several consecutive years. Thus, the ECHP allows for individual time-series to be constructed, though only for the period 1994-2001. An extra advantage of the ECHP is that an individual’s change a status is measured every month for the 12 months preceding the interview. Thus, the operational definition of mobility is more precise than in the LFS. From the ECHP, the following list of variables is in focus in the analysis: Background variables: • Country • Gender

138
• Age group (in 10-year intervals) • Highest level of education completed Employment mobility variables: • Main activity status (monthly) Occupational mobility variables: • Occupation in current job • Occupation in previous job Job-to-job mobility variables: • Year of start of current job The main disadvantages of the ECHP are that it is not up-to-date and that it only covers EU-15. Additionally, it shares the problem of small cell sizes with the LFS, a problem caused by small sampling size and the nature of job mobility. Another serious problem that the ECHP shares with the LFS in relation to the current study is that occupational mobility, while measured in principle by a set of variables concerning the individual’s current and previous occupational status, suffers from major data deficiencies. Thus, the vast majority of respondents have system missing values on these particular variables and only a very few respondents (ranging from 200-450 for the entire European dataset) have non-missing values on the variables needed to compute a measure of change in occupational status. In conclusion, it is not possible to compute a variable covering changes in occupational status using the ECHP dataset.
EU Community Statistics on Income and Living Conditions (EU-SILC) The EU Community Statistics on Income and Living Conditions (EU-SILC) is an instrument aiming at collecting timely and comparable cross sectional and longitudinal multidimensional micro data on income poverty and social exclusion. EU-SILC was launched in 2004 in 13 Member States and reached its full scale extension in 2005 with the inclusion of all 25 Member States. The units of measurement in the EU-SILC are individuals and households in the participating countries. The main advantage of the EU-SILC is the inclusion of a set of detailed variables concerning social and labour market conditions. Like ECHP, an individual’s change of status is measured every month for the 12 months preceding the interview, allowing for a more detailed measure. The main disadvantage of the EU-SILC is its current cross-sectional nature as a full dataset is only available for 2005. However, like the Eurobarometer, some of the questions included have a retrospective focus, allowing for measuring changes in status. Nevertheless, as this is not the case for the variables covering occupational mobility, the EU-SILC has a major deficiency with regards to the analysis of this concept. Is a consequence, EU-SILC cannot be used to measure occupational mobility. From the EU-SILC, we have extracted the following list of variables which are used in the analysis:

139
Background variables: • Country • Gender • Age group (in 10-year intervals) • Highest level of education completed • Household structure • Economic sector (NACE) Employment mobility variables: • Main activity status (monthly) Job-to-job mobility variables: • Change of job during past year

140
Annex 2: Multivariate analyses The analysis provided in the current report is partly based on the use of a number of multivariate analyses. This annex presents a short introduction to the use of such analyses and gives an overview of both the data and methods used and the final models obtained.
Dataset Two datasets are used: Labour force Survey and Eurobarometer. Of these, Labour Force Survey is by far the largest in terms of number of cases, as it is possible to pool data for several years into one comprehensive dataset covering most relevant variables. For the analyses of job-to-job mobility and employment mobility, data from Labour Force Survey for the period 1995-2005 (both years included) has been pooled together. The resulting dataset consists of nearly 16 million cases from 26 countries. As Labour Force Survey does not include an appropriate variable for the analysis of occupational mobility, Eurobarometer is chosen for this analysis. Eurobarometer is a single-year survey that covers 25 countries and includes approximately 25.000 cases. As an addition to the variables included in Labour force Survey and Eurobarometer, several relevant variables have been included in the datasets. These variables mostly refer to country-specific characteristics such as employment and EPL levels, GDP growth etc. The variables are gathered from international sources, mostly the OECD.35
Methods The main methods used in the multivariate analyses are regression, where the effects of a set of quantitative variables on a dependent variable are measured and analysis of covariance, where the effects of a set of both qualitative and quantitative variables on a dependent are measured. The main strengths of using a multivariate regression and analysis of covariance are that information is provided on three different aspects: 1) whether an association exists between the variables included in the analysis, 2) the strength of such an association and 3) the form of the association, estimating a formula that can be used in predicting of the dependent variable from the scores on the independent variables. Standardised regression coefficients are used in order to show the effect of each variable controlling for the combined effect of all other variables. In this way one can gauge the effect of each individual variable while taking account of all the other variables. When presenting the models and the individual regression coefficients, the significance level is shown for each coefficient. Significance levels basically demonstrate how certain one can be that the associations in the model can be inferred to actually exist. For practical purposes, three levels of significance levels are often used: 1) weak (0.90 – 0.95), 2) medium (0.95-0.99) and 3) strong (>0.99). Significance levels below 0.90 are counted as non-significant. In the presentation of the models, the statistical measure R² is included. This measure summarizes the relative improvement in predictions using the estimated equation derived from
35 Thus, the datasets consist of variables on two different levels: Individual and country. This does not pose a problem, as long as it is borne to mind that the effects of certain variables are on country level only.

141
the analysis. R² can thus be viewed as the proportion of the total variation in the dependent variable that is explained by the simultaneous predictive power of all the independent variables included in the model. In other words, R² is a quantification of the model’s explanatory power – the higher R², the higher explanatory power.36
Variables included in the models The table below summarises the variables used when building the different models for the three dimensions of job mobility. Table 5.1: Variables included in the final models Independent
variables (individual level)
Independent variables (country
level)
Mobility variable(s) Effect variables
Job-to-job mobility
• Age • Gender • Educational
level • Permanency of
contract • Number of
hours worked • Sector of work
• Level of unemployment
• Employment Protection Legislation
• Country characteristics (residual variable)
• Job tenure • Labour productivity growth
• GDP growth • Long-term
unemployment • Share of high-tech
exports
Occupational mobility
• Age • Gender • Permanency of
contract
• Level of unemployment
• Not mobile/mobile from previous to present job
• Not mobile/mobile from first to present job
• Upward/downward mobility from first to present job
• Labour productivity growth
• GDP growth • Long-term
unemployment • Share of high-tech
exports Employment mobility
• Age • Gender • Educational
level • Permanency of
contract • Number of
hours worked • Sector of work
• Level of unemployment
• Employment Protection Legislation
• Welfare regime • Country
characteristics (residual variable)
• Not mobile/mobile during past year
• Labour productivity growth
• GDP growth • Long-term
unemployment • Share of high-tech
exports
36 R² can however, only take values between 0 and 1, as predictions based on the independent variables can never be worse than predictions based on pure guessing. In line with this, it should also be noted that R² will always rise when further independent variables are included in the model. When building a model with many independent variables, one must therefore sometimes weigh explanatory power against clarity and perhaps omit variables that add very little to the model’s explanatory power.

142
Final model: Determinants of job-to-job mobility Model specifications
Method of analysis F-value R² No. of observations Linear regression 55159,155 0,393 4670556
Individual variable specifications Variable name Variable
level Variable
type Standardized β-
coefficient t-value Significance
Age Individual Interval 0,493 1.048,621 0,000 No. of hours worked Individual Nominal 0,069 140,597 0,000 Permanency of contract Individual Nominal 0,192 399,130 0,000 Gender Individual Nominal 0,027 53,201 0,000 Level of unemployment Country Interval 0,013 9,324 0,000 Level of education Individual Ordinal -0,022 -43,631 0,000 EPL level Country Interval 0,020 8,132 0,000 Sector: Agriculture Individual -0,016 -34,430 0,000 Sector: Construction Individual -0,065 -130,316 0,000 Sector: Trade Individual -0,055 -105,204 0,000 Sector: Public administration
Individual 0,048 93,865 0,000
Sector: Hotels Individual -0,050 -103,964 0,000 Sector: Transport Individual 0,008 16,933 0,000 Sector: Financial services
Individual 0,024 50,130 0,000
Sector: Real estate Individual -0,077 -153,687 0,000 Sector: Education Individual 0,028 52,916 0,000 Sector: Health and social work
Individual -0,012 -22,451 0,000
Sector: Other Individual
Dummy-group
-0,051 -104,788 0,000 Country: Austria Individual 0,064 94,491 0,000 Country: Belgium Individual 0,002 3,129 0,002 Country: Czech Rep. Individual -0,053 -64,996 0,000 Country: Germany Individual -0,026 -31,253 0,000 Country: Denmark Individual -0,046 -60,601 0,000 Country: Spain Individual -0,025 -36,824 0,000 Country: Finland Individual -0,022 -33,080 0,000 Country: Greece Individual -0,030 -51,528 0,000 Country: Hungary Individual -0,047 -40,186 0,000 Country: Ireland Individual -0,031 -20,754 0,000 Country: Italy Individual -0,011 -13,170 0,000 Country: Netherlands Individual -0,017 -18,682 0,000 Country: Norway Individual -0,035 -56,297 0,000 Country: Poland Individual -0,021 -21,359 0,000 Country: Portugal Individual -0,008 -10,812 0,000 Country: Sweden Individual -0,011 -14,974 0,000 Country: Slovak Rep. Individual -0,019 -30,036 0,000 Country: United Kingdom
Individual
Dummy-group
-0,070 -37,241 0,000

143
Final model: Determinants of occupational mobility Model specifications
Method of analysis F-value R² No. of observations Linear regression 27,025 0,014 9488
Individual variable specifications Variable name Variable
level Variable
type Standardized β-
coefficient t-value Significance
Permanency of contract Individual Nominal -0,046 -4,000 0,000 Level of unemployment Country Interval -0,049 -4,371 0,000 Gender Individual Nominal 0,022 1,921 0,055 Age Individual Interval 0,101 8,859 0,000

144
Final model: Determinants of employment mobility Model specifications
Method of analysis F-value R² No. of observations Linear regression 7793,868 0,136 4670556
Individual variable specifications Variable name Variable
level Variable
type Standardized β-
coefficient t-value Significance
Age Individual Interval -0,157 -198,631 0,000 Number of hours worked Individual Nominal -0,078 -95,436 0,000 Permanency of contract Individual Nominal -0,271 -343,612 0,000 Gender Individual Nominal -0,009 -11,249 0,000 Level of unemployment Country Interval -0,008 -2,607 0,009 Level of education Individual Ordinal -0,022 -26,125 0,000 EPL level Country Interval 0,006 1,707 0,088 Sector: Agriculture and fishing
Individual 0,001 1,829 0,067
Sector: Construction Individual 0,008 10,047 0,000 Sector: Trade Individual 0,016 17,987 0,000 Sector: Public administration
Individual -0,008 -9,319 0,000
Sector: Hotels Individual 0,018 22,717 0,000 Sector: Transport Individual -0,003 -3,806 0,000 Sector: Financial services
Individual -0,002 -2,085 0,037
Sector: Real estate Individual 0,019 23,255 0,000 Sector: Education Individual -0,002 -2,499 0,012 Sector: Health and social work
Individual -0,003 -3,869 0,000
Sector: Other Individual
Dummy-group
0,016 19,070 0,000 Country: Austria Individual 0,002 1,736 0,083 Country: Belgium Individual -0,007 -6,432 0,000 Country: Czech Rep. Individual 0,011 6,499 0,000 Country: Denmark Individual 0,038 26,017 0,000 Country: Finland Individual 0,032 22,556 0,000 Country: Greece Individual -0,003 -3,095 0,002 Country: Hungary Individual 0,029 12,777 0,000 Country: Italy Individual 0,035 20,761 0,000 Country: Norway Individual -0,020 -14,759 0,000 Country: Poland Individual 0,013 5,064 0,000 Country: Portugal Individual -0,027 -14,441 0,000 Country: Sweden Individual -0,009 -7,347 0,000 Country: Slovak Rep. Individual
Dummy-group
0,026 15,052 0,000

145
Final model: Determinants of labour productivity growth
Model specifications Method of analysis F-value R² No. of observations Linear regression 146685,3 0,555 4670556
Individual variable specifications Variable name Variable
level Variable
type Standardized β-
coefficient t-value Significance
Job-to-job mobility Individual Interval 0,006 12,133 0,000 Employment mobility Individual Nominal 0,000 -0,187 0,852 Age Individual Nominal -0,001 -2,722 0,006 Number of hours worked Individual Nominal -0,004 -8,681 0,000 Permanency of contract Country Interval -0,009 -21,017 0,000 Gender Individual Ordinal -0,001 -1,798 0,072 Level of unemployment Country Interval -0,100 -83,348 0,000 Level of education Individual -0,001 -1,794 0,073 EPL level Individual 0,964 466,033 0,000 Country: Austria Individual 0,115 197,745 0,000 Country: Belgium Individual 0,023 46,604 0,000 Country: Czech Rep. Individual 0,440 630,589 0,000 Country: Germany Individual 0,085 117,645 0,000 Country: Denmark Individual 0,148 226,644 0,000 Country: Spain Individual -0,260 -447,013 0,000 Country: Finland Individual 0,194 334,140 0,000 Country: Greece Individual 0,029 59,054 0,000 Country: Hungary Individual 0,603 599,809 0,000 Country: Ireland Individual 0,853 671,579 0,000 Country: Italy Individual -0,060 -88,344 0,000 Country: The Netherlands
Individual 0,077 95,586 0,000
Country: Norway Individual 0,079 145,849 0,000 Country: Poland Individual 0,401 521,314 0,000 Country: Portugal Individual -0,238 -373,958 0,000 Country: Sweden Individual 0,193 316,537 0,000 Country: Slovak Rep. Individual 0,331 594,743 0,000 Country: United Kingdom
Individual
Dummy-group
0,767 476,704 0,000

146
Final model: Determinants of economic growth
Model specifications Method of analysis F-value R² No. of observations Linear regression 153898,7 0,576 4670556
Individual variable specifications Variable name Variable
level Variable
type Standardized β-
coefficient t-value Significance
Job-to-job mobility Individual Interval 0,013 27,722 0,000 Employment mobility Individual Nominal 0,008 11,595 0,000 Age Individual Nominal -0,021 -46,024 0,000 Number of hours worked Individual Nominal -0,008 -19,427 0,000 Permanency of contract Country Interval -0,006 -14,028 0,000 Gender Individual Ordinal 0,001 2,234 0,026 Level of unemployment Country Interval -0,038 -35,386 0,000 Level of education Individual -0,011 -28,060 0,000 EPL level Individual -0,091 -41,098 0,000 Country: Austria Individual 0,004 6,985 0,000 Country: Belgium Individual -0,061 -125,222 0,000 Country: Czech Rep. Individual -0,082 -111,650 0,000 Country: Germany Individual -0,271 -403,185 0,000 Country: Denmark Individual -0,060 -88,474 0,000 Country: Spain Individual 0,245 437,650 0,000 Country: Finland Individual 0,052 86,783 0,000 Country: Greece Individual 0,161 323,078 0,000 Country: Hungary Individual 0,194 181,498 0,000 Country: Ireland Individual 0,532 392,134 0,000 Country: Italy Individual -0,096 -154,604 0,000 Country: The Netherlands
Individual -0,074 -91,802 0,000
Country: Norway Individual -0,041 -77,909 0,000 Country: Poland Individual 0,083 90,307 0,000 Country: Portugal Individual -0,011 -17,709 0,000 Country: Sweden Individual -0,042 -68,324 0,000 Country: Slovak Rep. Individual 0,080 149,859 0,000 Country: United Kingdom
Individual
Dummy-group
-0,011 -6,404 0,000

147
Final model: Determinants of long-term unemployment Model specifications
Method of analysis F-value R² No. of observations Linear regression 831480,3 0,912 4670556
Individual variable specifications Variable name Variable
level Variable
type Standardized β-
coefficient t-value Significance
Job-to-job mobility Individual Interval 0,004 19,891 0,000 Employment mobility Individual Nominal 0,000 0,402 0,688 Age Individual Interval -0,007 -33,295 0,000 No. of hours worked Individual Nominal -0,002 -11,662 0,000 Permanency of contract Individual Nominal -0,006 -30,462 0,000 Gender Individual Nominal 0,001 3,084 0,002 Level of unemployment Country Interval 0,536 1.026,878 0,000 Level of education Individual Ordinal -0,004 -22,195 0,000 EPL level Country Interval -0,111 -120,204 0,000 Sector: Agriculture and fishing
Individual -0,001 -3,119 0,002
Sector: Construction Individual -0,004 -18,749 0,000 Sector: Trade Individual -0,002 -8,273 0,000 Sector: Public admin. Individual -0,002 -8,617 0,000 Sector: Hotels Individual 0,000 -1,830 0,067 Sector: Transport Individual -0,001 -7,438 0,000 Sector: Fin. services Individual -0,001 -3,196 0,001 Sector: Real estate Individual -0,002 -9,925 0,000 Sector: Education Individual 0,000 -2,313 0,021 Sector: Health and social work
Individual -0,002 -8,833 0,000
Sector: Other Individual
Dummy-group
0,000 -2,611 0,009 Country: Austria Individual -0,039 -147,377 0,000 Country: Belgium Individual 0,249 1.140,058 0,000 Country: Czech Rep. Individual 0,110 346,153 0,000 Country: Germany Individual 0,247 755,532 0,000 Country: Denmark Individual -0,100 -339,378 0,000 Country: Spain Individual 0,042 161,122 0,000 Country: Finland Individual -0,178 -679,632 0,000 Country: Greece Individual 0,230 1.036,049 0,000 Country: Hungary Individual 0,178 389,751 0,000 Country: Ireland Individual 0,080 153,117 0,000 Country: Italy Individual 0,443 1.433,850 0,000 Country: Netherlands Individual 0,101 336,603 0,000 Country: Norway Individual -0,257 -1054,60 0,000 Country: Poland Individual -0,163 -432,345 0,000 Country: Portugal Individual 0,154 537,801 0,000 Country: Sweden Individual -0,147 -533,864 0,000 Country: Slovak Rep. Individual -0,008 -33,276 0,000 Country: UK Individual
Dummy-group
-0,165 -226,188 0,000

148
Final model: Determinants of innovation
Model specifications Method of analysis F-value R² No. of observations Linear regression 985391,7 0,976 4670556
Individual variable specifications Variable name Variable
level Variable
type Standardized β-
coefficient t-value Significance
Job-to-job mobility Individual Interval 0,000 2,755 0,006 Employment mobility Individual Nominal 0,001 5,174 0,000 Age Individual Nominal -0,001 -6,817 0,000 Number of hours worked
Individual Nominal 0,000 2,068 0,039
Permanency of contract Country Interval -0,001 -9,584 0,000 Level of unemployment Country Interval -0,306 -347,959 0,000 Level of education Individual 0,000 -2,276 0,023 EPL level Individual -0,133 -135,151 0,000 Country: Austria Individual -0,106 -557,468 0,000 Country: Belgium Individual -0,147 -
1.052,476 0,000
Country: Czech Rep. Individual -0,165 -865,141 0,000 Country: Denmark Individual -0,007 -31,750 0,000 Country: Spain Individual -0,273 -715,346 0,000 Country: Finland Individual 0,156 1.042,713 0,000 Country: France Individual 0,212 608,715 0,000 Country: Greece Individual -0,071 -242,369 0,000 Country: Italy Individual -0,324 -
1.848,264 0,000
Country: The Netherlands
Individual 0,302 685,599 0,000
Country: Norway Individual 0,002 6,865 0,000 Country: Poland Individual -0,162 -324,452 0,000 Country: Portugal Individual -0,229 -538,449 0,000 Country: Sweden Individual -0,087 -314,051 0,000 Country: Slovak Rep. Individual -0,114 -307,043 0,000 Country: United Kingdom
Individual
Dummy-group
0,231 331,599 0,000
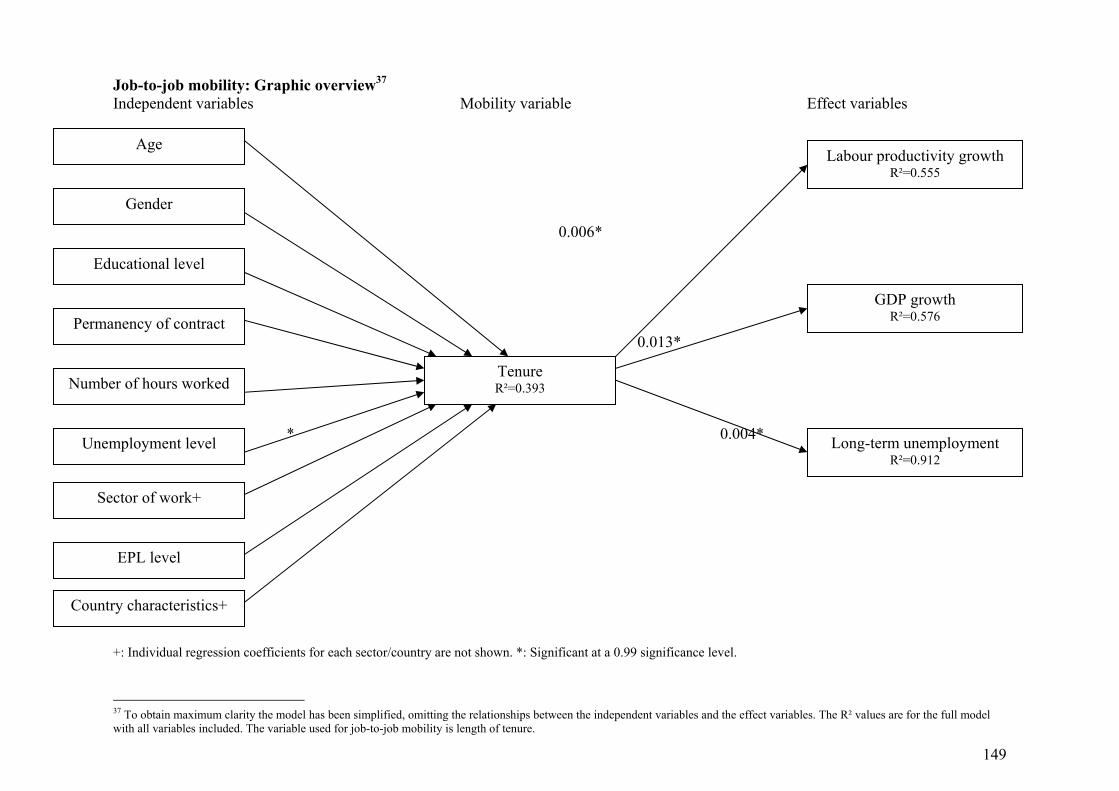
149
Job-to-job mobility: Graphic overview37 Independent variables Mobility variable Effect variables 0.493* 0.027* 0.006* -0.022* 0.192* 0.013* 0.069* 0.013 * 0.004* 0.020* +: Individual regression coefficients for each sector/country are not shown. *: Significant at a 0.99 significance level.
37 To obtain maximum clarity the model has been simplified, omitting the relationships between the independent variables and the effect variables. The R² values are for the full model with all variables included. The variable used for job-to-job mobility is length of tenure.
Age
Permanency of contract
Gender
Educational level
Number of hours worked
Sector of work+
Unemployment level
EPL level
Country characteristics+
Tenure R²=0.393
Labour productivity growth R²=0.555
GDP growth R²=0.576
Long-term unemployment R²=0.912

150
Occupational mobility: Graphic overview38 Independent variables Mobility variable Effect variables 0.101* 0.022*** -0.030** -0.048* -0.046* 0.042* -0.049* *: Significant at a 0.99 significance level. **: Significant at a 0.95 significance level. ***: Significant at a 0.90 significance level.
38 To obtain maximum clarity the model has been simplified, omitting the relationships between the independent variables and the effect variables. The R² values are for the full model with all variables included. The variable for occupational mobility is whether there has been upward, downward or no change in occupational class.
Age
Permanency of contract
Gender
Occupational mobility R²=0.014
Unemployment level
GDP growth R²=0.022
Long-term unemployment R²=0.324
Share of high-tech exports R²=0.443

151
Employment mobility: Graphic overview 39 Independent variables Mobility variable Effect variables -0.157* -0.009* -0.022* -0.271* 0.008* -0.078* -0.008* 0.001* 0.006*** +: Individual regression coefficients for each sector/country are not shown. *: Significant at a 0.99 significance level. ***: Significant at a 0.90 significance level 39 To obtain maximum clarity the model has been simplified, omitting the relationships between the independent variables and the effect variables. The R² values are for the full model with all variables included. The variable for employment mobility is whether there has been a change in employment status or not during the past year.
Permanency of contract
Gender
Educational level
Number of hours worked
Sector of work+
Unemployment level
EPL level
Country characteristics+
Employment mobility R²=0.136
GDP growth R²=0.355
Share of high-tech exports R²=0.979
Age

Annex 3: Derived variables In order to carry out certain analyses it has been necessary to recode some variables and compute new ones. This annex gives a graphic description of how key variables in the analyses have been computed.
Labour Force Survey
Tenure No Yes
Ystartwk = 9999 or blank
Tenure = SYSTEM MISSING
Tenure = (refyear – ystartwk)
Ystartwk: Year in which person started to work for current employer or as self-employed Refyear: Year of the survey

153
Employment mobility Yes Yes No Yes No Yes No No Yes Yes Yes No Yes No Yes No No Yes Yes Yes No No Yes No No Yes No Yes
Yes
Wstat1y = 1 Mainstat = 1 Employment mobility = 1
Not mobile (employed)
Wstat1y = 2
Wstat1y = 3
Wstat1y = ELSE
Employment mobility = 2 Mobile from employed to unemployed
Employment mobility = 3 Mobile from employed to inactive
Employment mobility = SYSTEM MISSING
Retired, Compulsory military service, Permanently disabled, Not applicable
Wstat1y = 1 Mainstat = 2
Wstat1y = 2
Wstat1y = 3
Wstat1y = ELSE
Employment mobility = 6 Mobile from unemployed to inactive
Employment mobility = SYSTEM MISSING
Retired, Compulsory military service, Permanently disabled, Not applicable
Employment mobility = 4 Mobile from unemployed to employed
Mainstat = 3
Employment mobility = 8 Mobile from inactive to unemployed
Employment mobility = 9 Not mobile (inactive)
Employment mobility = SYSTEM MISSING
Retired, Compulsory military service, Permanently disabled, Not applicable Mainstat = ELSE
Employment mobility = 5 Not mobile (unemployed)
Employment mobility = 7 Mobile from inactive to employed Wstat1y = 1
Wstat1y = 2
Wstat1y = 3
Wstat1y = ELSE
Mainstat: Main labour status Wstat1y: Main labour status 1 year before survey

154
Eurobarometer
Occupational mobility No Yes Yes
QA36 = blank
Occupational mobility = SYSTEM MISSING
QA25 = blank
Occupational mobility = SYSTEM MISSING
IF QA36 ≠ QA25 Occupational mobility = 1
Occupational mobile
IF QA36 = QA25 Occupational mobility = 0
Not occupationally mobile
QA25: What was the title of your first job? QA36: What is the title of your job?

155
EU Community Statistics on Income and Living Conditions (EU-SILC)
Education Yes No Yes No Yes No Yes
PE040 = -2, 0-2
PE040 = 3-4
Education = 1 Low
PE040 = 5
PE040 = ELSE Education = SYSTEM MISSING
Education = 2 Medium
Education = 3 High
PE040: Highest ISCED level attained

156
Employment mobility Yes No Yes No Yes No Yes No Yes No Yes No Yes No Yes No Yes No Yes No
Employment mobility = 0 Not mobile
Employment mobility = SYSTEM MISSING
Retired, Compulsory military service, Permanently disabled, Not applicable
PL070 = 12
PL070 = 1-11 Employment mobility = 1
Mobile
PL072 = 1-11 Employment mobility = 1 Mobile
PL072 = 12 Employment mobility = 0 Not mobile
PL080 = 1-11
PL080 = 12 Employment mobility = 0
Not mobile
Employment mobility = 1 Mobile
PL087 = 12 Employment mobility = 0
Not mobile
PL090 = 12 Employment mobility = 0 Not mobile
PL087 =1-11 Employment mobility = 1 Mobile
PL090 = 1-11 Employment mobility = 1
Mobile
PL070: Number of months spent at full-time work PL072: Number of months spent at part-time work PL080: Number of months spent in unemployment PL087: Number of months spent studying PL090: Number of months spent in inactivity

157
Annex 4: List of figures and tables
List of figures in the report FIGURE 2.1: SHARE OF EMPLOYED PERSONS WHO EXPERIENCED A CHANGE OF JOB DURING THE PAST YEAR BY
COUNTRY, 2005 ........................................................................................................................................... 21 FIGURE 2.2: JOB TENURE IN EUROPE 2006............................................................................................................. 22 FIGURE 2.3: DEVELOPMENT IN AVERAGE JOB TENURE 1995 – 2006 ...................................................................... 22 FIGURE 2.4: AVERAGE JOB DURATION BY COUNTRY, 2005.................................................................................... 27 FIGURE 2.5: AVERAGE JOB DURATION BY TENURE (YEARS), 1995-2006 ............................................................... 28 FIGURE 2.6: SHARE OF EMPLOYED PERSONS LOOKING FOR ANOTHER JOB BY COUNTRY, 2000-2006..................... 29 FIGURE 2.7: SHARE OF EMPLOYED PERSONS LOOKING FOR ANOTHER JOB BY AVERAGE JOB DURATION ................ 30 FIGURE 2.8: LEVELS OF FORCED AND VOLUNTARY MOBILITY WITHIN THE LAST 5 YEARS ACROSS EUROPE........... 33 FIGURE 2.9: HIERARCHICAL OCCUPATIONAL MOBILITY (BASED ON SKILLS REQUIREMENTS) ................................ 35 FIGURE 2.10: OCCUPATIONAL CLASS MOBILITY .................................................................................................... 37 FIGURE 2.11: OCCUPATIONAL MOBILITY BASED ON SKILLS REQUIREMENTS BY STRICTNESS OF EPL .................... 39 FIGURE 2.12: OCCUPATIONAL CLASS MOBILITY BY STRICTNESS OF EPL............................................................... 39 FIGURE 2.13: THE SHARE OF THE ADULT POPULATION WHO HAD EXPERIENCED LABOUR MARKET TRANSITIONS IN
THE 5 YEARS LEADING UP TO 2005............................................................................................................... 41 FIGURE 2.14: LABOUR MARKET TRANSITIONS BY EMPLOYMENT RATE, 2005 ........................................................ 42 FIGURE 2.15: LABOUR MARKET TRANSITIONS BY LONG-TERM UNEMPLOYMENT RATE, 2005................................ 42 FIGURE 2.16: UNEMPLOYMENT RATES BY DURATION OF EMPLOYMENT SEARCH, 2006 ......................................... 43 FIGURE 2.17: AVERAGE TENURE BY STRICTNESS OF EPL...................................................................................... 45 FIGURE 2.18: FORCED/VOLUNTARY TEMPORARY WORK BY COUNTRY, 2006......................................................... 47 FIGURE 2.19: FORCED/VOLUNTARY PART-TIME WORK BY COUNTRY, 2006 ........................................................... 49 FIGURE 2.20: TOTAL LABOUR MARKET TRANSITIONS AS SHARE OF WORKING AGE POPULATION 2006 .................. 51 FIGURE 2.21: ‘INNER CIRCLE’ LABOUR MARKET TRANSITIONS (’E U’ AND ’U E’) AS SHARE OF WORKING AGE
POPULATION, 2000-2006.............................................................................................................................. 53 FIGURE 2.22: 'OUTER CIRCLE' LABOUR MARKET TRANSITIONS AS SHARE OF WORKING AGE POPULATION, 2000-
2006. SHARE OF’ E I’,’I E’,’U I’ AND ’I U’...................................................................................... 54 FIGURE 2.23: AGE DISTRIBUTION OF EMPLOYED PERSONS WHO EXPERIENCED A CHANGE OF JOB DURING THE PAST
YEAR BY COUNTRY, 2005............................................................................................................................. 58 FIGURE 2.24: DISTRIBUTION OF EMPLOYED PERSONS WHO EXPERIENCED A CHANGE OF JOB DURING PAST YEAR BY
LEVEL OF EDUCATION AND COUNTRY, 2005................................................................................................. 59 FIGURE 2.25: JOB TENURE BY SECTOR 2006 .......................................................................................................... 61 FIGURE 2.26: FLEXICURITY CLUSTERS ON THE BASIS OF PCA ANALYSIS AND K-MEANS CLUSTERING .................. 70 FIGURE 2.27 EMPLOYMENT REGIMES, EU25 ......................................................................................................... 71 FIGURE 3.1: A SIMPLE FRAMEWORK FOR ANALYSING AGGREGATE CAUSES AND EFFECTS OF JOB MOBILITY ......... 79 FIGURE 3.2: THE POSSIBLE RELATIONSHIP BETWEEN ECONOMIC GROWTH AND JOB MOBILITY.............................. 84 FIGURE 3.3: TENURE AND LABOUR PRODUCTIVITY GROWTH................................................................................. 85 FIGURE 3.4: SEPARATION RATES AND INNOVATION INTENSITY, ITALIAN PRIVATE SECTOR 1985-1991 ................. 88 FIGURE 3.5: SHARE OF WORKERS WITH MORE THAN 10 YEARS OF TENURE AND EMPLOYMENT RATES, 2005......... 92 FIGURE 3.6: SHARE OF WORKERS WITH LESS THAN ONE YEAR OF TENURE AND EMPLOYMENT RATES, 2005 ......... 92 FIGURE 3.7: PERCEIVED EMPLOYMENT SECURITY AS A FUNCTION OF TENURE, 1996 (LEFT) AND 2000 (RIGHT) .. 102 FIGURE 4.1: EMPLOYMENT PROTECTION LEGISLATION AND ‘BALANCED JOB MOBILITY’ VALUES FOR 18 EU
COUNTRIES, 2003 AND 2005 ...................................................................................................................... 119

158
List of tables in the report TABLE 2.1: EXPECTED MOBILITY (CHANGE OF EMPLOYER) IN THE NEXT FIVE YEARS............................................ 32 TABLE 2.2: OCCUPATIONAL CLASSES ................................................................................................................... 36 TABLE 2.3: DETERMINANTS OF JOB-TO-JOB MOBILITY, LINEAR REGRESSION MODEL ESTIMATES .......................... 56 TABLE 2.4: DETERMINANTS OF OCCUPATIONAL MOBILITY, LINEAR REGRESSION MODEL ESTIMATES.................... 62 TABLE 2.5 DETERMINANTS OF EMPLOYMENT MOBILITY, LINEAR REGRESSION MODEL ESTIMATES ....................... 63 TABLE 2.6: FLEXICURITY CLUSTERS, EMPLOYMENT REGIMES AND MOBILITY INDEX ............................................ 73 TABLE 3.1 MOBILITY DETERMINANTS OF LABOUR PRODUCTIVITY GROWTH, LINEAR REGRESSION MODEL
ESTIMATES ................................................................................................................................................. 105 TABLE 3.2: MOBILITY DETERMINANTS OF ECONOMIC GROWTH, LINEAR REGRESSION MODEL ESTIMATES .......... 106 TABLE 3.3: MOBILITY DETERMINANTS OF LONG-TERM UNEMPLOYMENT, LINEAR REGRESSION MODEL ESTIMATES
.................................................................................................................................................................. 107 TABLE 3.4: MOBILITY DETERMINANTS OF INNOVATION, LINEAR REGRESSION MODEL ESTIMATES ...................... 108 TABLE 3.5: ECONOMIC AND SOCIAL BENEFITS AND COSTS OF JOB MOBILITY, THEORETICAL JUSTIFICATIONS AND
EMPIRICAL EVIDENCE................................................................................................................................. 108 TABLE 4.1: EXPERIMENTAL JOB MOBILITY TARGET INDICATORS......................................................................... 116 TABLE 4.2: EXPERIMENTAL ANALYSIS OF EU MEMBER STATES’ ‘BALANCED JOB MOBILITY’ SCORES, 2005-2006
(10=BALANCED JOB MOBILITY), 24 EU MEMBER STATES.......................................................................... 117 TABLE 5.1: VARIABLES INCLUDED IN THE FINAL MODELS ................................................................................... 141