job polarisation, technological change and routinisation ... · job polarisation, technological...
TRANSCRIPT

Job polarisation, technological change and routinisation:
evidence for Portugal
Tiago Fonseca
⇤Francisco Lima
⇤Sonia C. Pereira
†
May 3, 2016
Abstract
Job polarisation is a phenomenon characterised by employment growth at both
the bottom and the top of the income distribution. Portugal is a country with a
slow accumulation of capital stock, limiting the adoption of new technologies; with
a relatively small pool of highly educated workers, constraining the technology-skill
complementarity gains; and with low wages, reducing the potential for substitution
between capital and routine jobs. Using a firm census for 1986-2007, we uncover
polarisation in employment and wages in the second half of this period. We show a
decline in routine occupations and an increase in abstract occupations. Furthermore,
the relative wages for demographic groups holding an early comparative advantage in
non-routine tasks increase while those with a comparative advantage in routine tasks
decrease. We conclude that job polarisation in Portugal is consistent with technology
adoption that displaced routine intensive occupations.
Keywords: technological change; routinisation; job polarisation; employment; wages
JEL codes: J24, J31, O33
⇤Instituto Superior Tecnico, Universidade de Lisboa, and CEG-IST†Barnard College, Columbia University and Columbia School of Social Work
1

1 Introduction
Job polarisation is a recent phenomenon characterised by employment growth at both
the bottom and the top of the income distribution. Job polarisation has been observed
in the U.S. (Autor, Katz and Kearney, 2006) in the late 1980s and 1990s (Acemoglu and
Autor, 2011) and in the U.K. for the period between 1975 and 1999 (Goos and Man-
ning, 2007). Polarisation has also been documented in West-Germany (Spitz-Oener, 2006;
Dustmann, Ludsteck and Schonberg, 2009) and Northern European countries (Asplund
and Barth, 2011). In addition, Michaels, Natraj and Van Reenen (2014) find polarisa-
tion for several OECD countries.1 Goos, Manning and Salomons (2009, 2014) also find
evidence of polarisation in Europe as a whole, but not in every single country.2 Using
the European Labour Force Survey they find that the middle paying jobs decreased their
employment share while low-paid jobs experienced growth or modest decreases (except
Italy). High-wage jobs increased their employment shares in all but three of the countries
studied.3
While the reasons behind job polarisation are still subject to debate, the main candi-
date is technology and the so called routinisation hypothesis, first put forward by Autor,
Levy and Murnane (2003), in which technological improvements allow machines to replace
workers performing routine tasks. The increase in computer use in the workplace result-
ing from the declining price of computer capital has lead to a decrease in the demand
for workers performing routine tasks, which tend to be middle skilled. While computers
substitute for middle skilled workers, they complement high skilled workers’ whose pro-
ductivity increases with computer capital investment. The majority of workers displaced
from middle skilled occupations, unable to secure high paid jobs requiring higher skills,
take low paid jobs previously taken by low skilled workers, leading to a polarisation of
jobs in the economy.
1The study covers Austria, Denmark, Finland, France, Germany, Italy, Japan, the Netherlands, Spain,the U.K. and the U.S..
2The countries studied are: Austria, Belgium, Denmark, Finland, France, Germany, Greece, Ireland,Italy, Luxembourg, Netherlands, Norway, Portugal, Spain, Sweden and the U.K.
3Interestingly enough, the exceptions are Finland, Ireland and Portugal. Their results are not in linewith the findings in this paper, most likely due to data di↵erences. Goos, Manning and Salomons (2009,2014) use the European Labour Force Survey (ELFS), a sample based dataset (0.2% to 3.3% coverage).We use Quadros de Pessoal (QP) which is mandatory to the majority of the Portuguese firms, thoughcontrary to ELFS it does not include the self-employed.
2

Several reasons could explain why certain countries may fail to show evidence of job
polarisation, despite experiencing technological change and computerisation. First, insti-
tutional di↵erences in pay setting could act as counteracting forces in the wage distribution
which in turn may a↵ect employment growth of di↵erent types of jobs. These include min-
imum wages and collective bargaining agreements and are unlikely to largely a↵ect the
high paid jobs. Second, countries with a large public sector may also present a wage
(and occupational) structure less permeable to market forces. Third, if preferences are
non-homothetic, di↵erences in the level and distribution of income across countries may
result in di↵erences in the occupational structure of employment (Goos, Manning and
Salomons, 2014). For example, income elasticity of demand for services is thought to be
greater than one (Clark, 1957). In the case of Portugal, its lower GDP per capita relative
to the rest of Europe could explain the smaller size of its service sector, which could lead
to a non-polarised job structure.
The timing of technology dissemination and job polarisation may also di↵er across
countries. For example, Continental Europe appears to have a lag of one decade relative
to the Anglo-Saxon countries in terms of their labour market trends (Spitz-Oener, 2006;
Dustmann, Ludsteck and Schonberg, 2009), which could lead to di↵erences in the timing
of polarisation. Di↵erences in the skill composition across countries could also lead to
di↵erent job structures. A country with a highly skilled workforce could conceivably
see most of its workers moving up from middle paid to high paid jobs as a result of
computerisation. A country with a less skilled workforce like Portugal may have low
skilled workers in some of its middle paid jobs, which could result in less clear cut job
polarisation. In addition, in a country with low capital stock as Portugal, the adoption of
computer capital may be limited, especially in a setting of low educational attainment. The
existence of a relatively small pool of highly educated workers constraints complementarity
gains, and the prevalence of low wages reduces the potential for substitution of routine
task intensive occupations by computers.
In view of the above discussion and the current state of the job polarisation literature,
the study of job polarisation in Portugal is of particular interest. Are the market forces
created by computerisation likely to generate job polarisation even in countries with lower
3

physical and human capital and wages and a less developed service sector?
We use Quadros de Pessoal, the Portuguese firm census, to show that despite its lower
wages, GDP per capita, low capital stock and share of the service sector, Portugal has
experienced job polarisation from the mid-1990s. This provides evidence that job polar-
isation is not a phenomenon exclusive of richer economies. Using O*NET routine and
non-routine task measures to classify jobs, we show that the routinisation hypothesis is a
robust explanation for the employment and wage patterns observed. In a country still di-
vergent from the European counterparts, our results call for specific education and labour
market policies and serve as an example for other regions facing similar challenges.
The rest of the paper is organised as follows. Section 2 reviews the extant literature on
job polarisation and discusses what di↵erent models predict in terms of employment and
wage changes and how those can be tested. Section 3 discusses the Portuguese economic
context. Section 4 describes the data. Section 5 shows the trends for employment and
wages between 1986 and 2007 and also provides evidence of within and between industry
changes in employment. Task measures based on ONET dataset are discussed in Section
6 with a further analysis of employment and wages by task groups. Section 7 presents and
discusses regressions’ results for wages and Section 8 concludes.
2 Literature review
Since the early 1960s, the U.S. has seen the stock of capital equipment increasing rapidly
alongside a growing trend in the relative demand for skilled workers, suggesting the com-
plementarity of capital equipment and skilled labour (Krusell and Ohanian, 2000). The
skill premium – the wage ratio between skilled and unskilled workers – rose particularly
rapidly since the late 1970s despite the increase in the supply of skills (Juhn, Murphy and
Pierce, 1993). Moreover, the rate of within-industry skill upgrading was concentrated in
the most computer intensive sectors of the economy (Autor, Katz and Krueger, 1998).
During the 1980s – the decade of the microelectronics revolution – less-skilled workers
su↵ered a decrease in relative wages and demand for the less-skilled decreased in devel-
oped countries (Berman, Bound and Griliches, 1994; Berman, Bound and Machin, 1998).
4

Evidence also shows that changes in institutions such as unionisation and minimum wages
play a role in explaining the changes observed in the bottom half of the wage distribution
(for example, DiNardo, Fortin and Lemieux (1996)). The increase in the demand for skills
seems to have been pervasive in developed countries, with documented changes in the
wage structure in several countries (Machin and Van Reenen, 1998).
The literature suggests that the changes in wages and employment between the 1960s
and the 1980s are related to skills and technological change (Katz and Murphy, 1992;
Levy and Murnane, 1992; Bound and Johnson, 1992; Juhn, Murphy and Pierce, 1993).
In particular, computer capital seems to have a positive e↵ect on the wages of those
workers who use computers in the workplace (Krueger, 1993; DiNardo and Pischke, 1997).
This evidence have led to the idea that recent technology developments have been biased
towards the most skilled workers in the form of higher employment and wages – the skill-
biased technological change hypothesis (SBTC hereafter).4
When Autor, Katz and Kearney (2006) uncovered job polarisation in the U.S. and Goos
and Manning (2007) did the same for the U.K., it became clear that SBTC hypothesis
could not explain the recent labour market patters alone.5 Spitz-Oener (2006) present
similar evidence for Germany.Autor, Levy and Murnane (2003) and Autor, Katz and
Kearney (2006) proposed a distinct view of the impact of technical change in the labour
market according to which technology changes the tasks performed by workers which in
turn changes the demand for skills. In their model, technology and skilled labour are
still complements, but computer capital substitutes for workers performing routine tasks
– tasks that can be programmed into a machine because they follow a set of rules. They
show that the adoption of computers is associated with reduced labour in routine tasks
(both cognitive and manual) and increased labour input in non-routine cognitive tasks
within industries, occupations and education groups.
Building on Autor, Levy and Murnane (2003), Autor, Katz and Kearney (2006) propose
a task-based model with three categories of tasks: abstract, routine and manual, in which
college educated workers perform abstract tasks and workers with high school degrees can
4See, e.g., Krueger (1993), Berman, Bound and Machin (1998), Machin and Van Reenen (1998), Autor,Katz and Krueger (1998), Acemoglu (1998), Bresnahan (1999), Krusell and Ohanian (2000).
5Card and DiNardo (2002) describe additional issues with the SBTC hypothesis.
5

substitute between routine and manual tasks. Routine tasks and computer capital are
perfect substitutes. Because of the falling price of computer capital, exogenous to the
model, computers substitute routine workers, causing a reduction on their employment
and, by definition, wages.6 Abstract task workers see their employment and wages rise as
they complement computer capital and therefore their productivity increases. Finally, non-
routine manual task workers employment rise because of the influx of displaced workers
from routine tasks. Those routine task workers by assumption cannot perform abstract
tasks as they do not hold a college degree, and therefore are pushed into manual task jobs.
Even without the education assumption, displaced routine tasks workers should have a
stronger comparative advantage in performing manual tasks than in abstract tasks. Wages
of manual workers may drop due to the influx into manual tasks, but not as much as the
wages of workers in routine jobs otherwise workers would not move into manual jobs.
Routine jobs are not at the bottom of the wage distribution, because those jobs require
a certain amount of skills (Goos and Manning, 2007). Therefore we expect ceteris paribus
decreasing employment in the middle of the wage distribution, as routine jobs tend to
be substituted by technology. As for wages, while the wages of higher skilled workers
should increase, the relative changes for the middle and low skilled are less obvious due
to the e↵ect of demand and supply on the various skills as well as the potential selection
of workers between those who retain their jobs versus those who are pushed into di↵erent
jobs.
While in the U.S. wage polarisation has occurred hand in hand with job polarisation
(Autor, Katz and Kearney, 2006), Goos and Manning (2007) failed to find wage polari-
sation in the UK, despite strong evidence of job polarisation. They found that wages at
the top of the distribution increased relative to the median, but wages at the bottom did
not. A possible explanation is non-random selection of workers across jobs: when hit by
demand shocks, job changes do not occur randomly.7 In particular, Goos and Manning
(2007) hypothesise that if those displaced from the middling jobs are less skilled, the av-
erage skill of those who remain increases, counteracting the downward pressure in wages
6By definition, the price of computer capital is equal to the wage of routine workers.7Another potential explanation is concurrent changes in labour market institutions, such as declines in
unionisation and minimum wages.
6
from lower demand. In line with their hypothesis, they find evidence of greater educa-
tional upgrading in middle than in lower paid jobs. Selection of workers in the process of
labour market polarisation renders the straightforward wage predictions in Autor, Katz
and Kearney (2006) model empirically hard to test.
Acemoglu and Autor (2011) propose an empirical strategy to test whether wage pat-
terns are consistent with the computerization hypothesis in the presence of selection of
workers. They use demographic variables to construct skill groups and regress the wage
changes of these groups on their task measures at the beginning of the period. Their
premise is that if the market price of the tasks in which a skill group holds comparative
advantage in the beginning of the period declines, such as routine tasks, the relative wage
of that skill group should decline, whether those workers move occupations and tasks or
not. In this paper we use a similar empirical strategy to provide evidence of wage trends
that are consistent with a task based explanation for polarisation.
3 Portugal: Economic Context
Portugal is an economy of 10 million inhabitants that joined the European Union in
1986. The European Union brought new trade opportunities as well as an influx of public
investment in education and infrastructure. Our analysis starts at this point in time,
1986, and goes until 2007, which precedes the economic crisis which lead to the EU/IMF
financial assistance program.
Portugal experienced two major dips in GDP growth during the period 1986-2007. The
first occurred during 1992-1993, which lead to a rise in unemployment from 4.19% in 1991
to 6.85% in 1994 (OECD data). The recession was brief and by 1995 the GDP growth rate
returned to approximately 4%, the 1991 level. However in 2000 growth declined, becoming
negative by 2003. In contrast with the previous recession, the e↵ects on unemployment
were not short-lived and there was a sharp sustained rise in unemployment from 4.56% in
2001 to 8.92% in 2007, despite positive GDP growth by the end of the period.
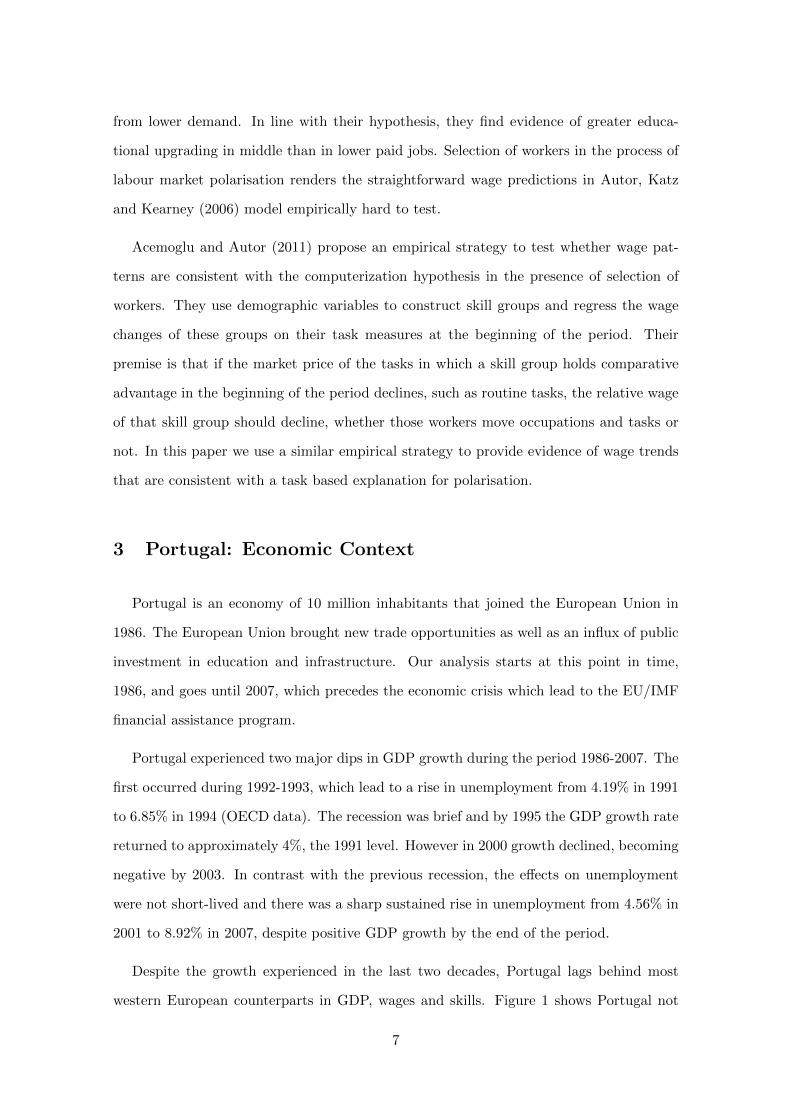
Despite the growth experienced in the last two decades, Portugal lags behind most
western European counterparts in GDP, wages and skills. Figure 1 shows Portugal not
7
catching up the rest of Southern European countries in GDP per capita, and even lagging
behind in the later part of the period. This di↵erence is even larger if we compare Portugal
with non-southern UE, as the Portuguese GDP per capita is almost half of the non-
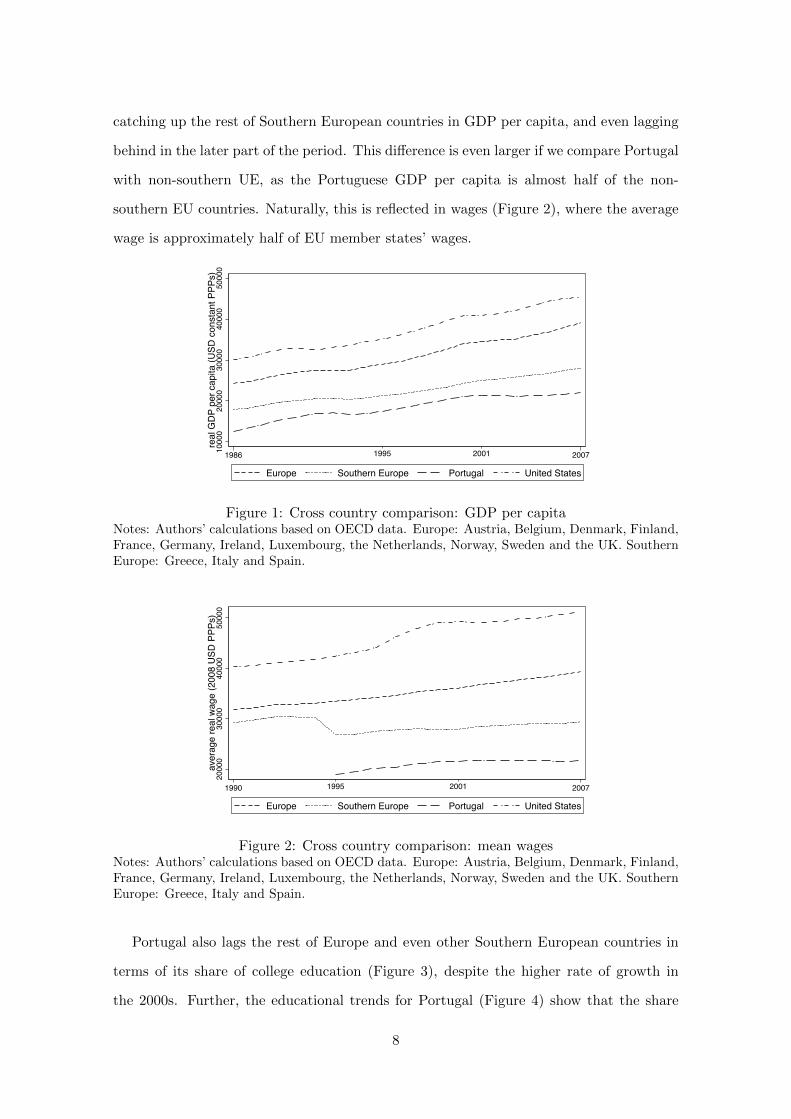
southern EU countries. Naturally, this is reflected in wages (Figure 2), where the average
wage is approximately half of EU member states’ wages.
1000
020
000
3000
040
000
5000
0re
al G
DP
per c
apita
(USD
con
stan
t PPP
s)
1995 20011986 2007
Europe Southern Europe Portugal United States
Figure 1: Cross country comparison: GDP per capitaNotes: Authors’ calculations based on OECD data. Europe: Austria, Belgium, Denmark, Finland,France, Germany, Ireland, Luxembourg, the Netherlands, Norway, Sweden and the UK. SouthernEurope: Greece, Italy and Spain.
2000
030
000
4000
050
000
aver
age
real
wag
e (2
008
USD
PPP
s)
1995 20011990 2007
Europe Southern Europe Portugal United States
Figure 2: Cross country comparison: mean wagesNotes: Authors’ calculations based on OECD data. Europe: Austria, Belgium, Denmark, Finland,France, Germany, Ireland, Luxembourg, the Netherlands, Norway, Sweden and the UK. SouthernEurope: Greece, Italy and Spain.
Portugal also lags the rest of Europe and even other Southern European countries in
terms of its share of college education (Figure 3), despite the higher rate of growth in
the 2000s. Further, the educational trends for Portugal (Figure 4) show that the share
8

of college education does not uncover all the educational growth in Portugal during this
period. Much of the skill upgrade occurred at the secondary level, with a more than
doubling of high school graduates by 2007. This is important for our study, since the
increase in the supply of skills in Portugal occurred both in terms of high and medium
skills.
1020
3040
shar
e of
col
lege
gra
duat
es (a
ge 2
5-64
)
2001 20041999 2006
Europe Southern Europe Portugal United States
Figure 3: Cross country comparison: college educationNotes: Authors’ calculations based on OECD data. Europe: Austria, Belgium, Denmark, Finland,France, Germany, Ireland, Luxembourg, the Netherlands, Norway, Sweden and the UK. SouthernEurope: Greece, Italy and Spain.
0.2
.4.6
.8em
ploy
men
t sha
re
1986 1993 2000 2007
Less than 9 years 9 years High School Post Secondary
Figure 4: Education trendsNotes: Authors’ calculations based on Quadros de Pessoal data.
In Figure 5 we plot the share of manufacturing and services between 1986 and 2007.
Services comprised just over 40% of employment in 1986, but reached close to 60% by 2007.
The magnitude of this sectorial shift is substantial and we will take this into account when
interpreting our results.
9

.4.4
5.5
.55
.6em
ploy
men
t sha
re
1986 1993 2000 2007year
Manufacturing Services
Figure 5: Employment share evolution of manufacturing and servicesNotes: Authors’ calculations based on Quadros de Pessoal data.
The evidence of Portugal lagging behind other European countries extends to capital
stock. As Figure 6 shows, the capital stock per worker in southern European countries is
approximately three times less than that of Scandinavian countries and Continental Eu-
rope. Furthermore, Portugal has even less capital per worker than the average southern
European country. Since technology investment is likely to depend on the initial techno-
logical level, the labor market impact of technological change in Portugal is likely to di↵er
from countries with a higher degree of capital stock. As the total capital includes computer
capital, it seems plausible to assume a relatively low stock of computer capital for Portu-
gal. The routinisation model as proposed by Autor, Katz and Kearney (2006) is less likely
to apply to countries with low education, low capital and low wages for two reasons. First,
due to the complementarity between computer capital and high-skilled workers which are
in less supply than in more advanced economies. Second, due to the low wages of workers
performing mostly routine tasks which can be lower than the adjusted price of computer
capital, making technology investments less profitable.
10

020
040
060
080
0
Net
cap
ital s
tock
at 2
010
pric
espe
r per
son
empl
oyed
(Mrd
EC
U/E
UR
)
1995 20011986 2007
Europe Southern Europe Portugal
Figure 6: Cross country comparison: Capital stockNotes: Authors’ calculations based on annual macro-economic database (AMECO) of the EuropeanCommission’s Directorate General for Economic and Financial A↵airs. Europe: Austria, Belgium,Denmark, Finland, France, Germany, Ireland, Luxembourg, the Netherlands, Norway, Sweden andthe UK. Southern Europe: Greece, Italy and Spain.
4 Data
The main data source used is the Quadros de Pessoal (QP). QP is a matched employer-
employee dataset created by the Portuguese Ministry of Labour in the 1980s. Every year
employers answer a mandatory survey with information on personnel and firm character-
istics. The dataset covers all Portuguese firms with at least one employee and excludes
agriculture, military, public administration and institutionalised or self-employed workers.
QP is a longitudinal dataset covering a period of 21 years from 1986 to 2007 with
an average of 1.7 million workers and 220 thousand firms per year.8 The Ministry of
Labour did not release worker level information for 1990 and 2001, and therefore we have
missing data for those two years. Firm-level characteristics include: industry, annual
sales, location, legal structure, the structure of capital (percentage of private, public and
foreign capital), initial equity and starting date. For workers, variables include gender,
age, schooling, tenure, promotion dates, job level and occupation (ISCO five-digit codes),
hours of work (regular and extra), wages (base wage, regular and irregular bonuses and
payments for extra hours of work) and type of contract (if permanent or fixed-term).
We restrict our sample to full-time workers (30 hours per week or 130 hours per month)
aged between 16 and 65. We consider that a full-time worker must earn at least 90% of
8The latest wave of data available at the time of writing this paper was 2007.
11

the minimum wage, in which the wage is the sum of base wage plus regular and seniority
related bonuses.9 Wages are deflated to the year 1986 using the Consumer Price Index
(CPI). We drop workers in occupations and industries associated with the primary sector,
as the survey is optional for those. Also, we exclude workers in public administration
and defence.10 Although public administration employs a large number of workers in
Portugal, those workers are not fully represented in the sample. Public administration
workers account for less than 0.4% of the total number of workers in the sample. We use
ISCO88 occupational codes at 2-digit level. Those codes are only available after 1994.
To overcome this problem, we employ an algorithm that converts the occupational codes
prior 1994 to ISCO88 based on the most frequent matches. The same strategy was used
to deal with prior 1994 industry codes.
5 Trends in employment and wages
Figure 7 shows the evolution in cumulative changes in wages, measured at percentiles
10, 50 and 90. There was a dramatic rise in wage inequality in the 1990s, as top wages rose
sharply, while the middle and bottom of the wage distribution experienced a moderate
increase. Since 2000 the change in the distribution was much less pronounced, with an
only slightly larger growth in the 90th percentile compared with the other two. In addition,
we can distinguish between two periods, one until the mid 1990s in which wages in the
middle of the distribution grow faster than at the bottom and another from the mid
1990s in which there is a convergence between wages at the bottom and the middle of
the distribution. According to this figure, despite the higher inequality increase in the
first part of the period, it is from the mid 1990s that one observes wage polarisation, with
median wage growth lagging behind growth at the top and the bottom of the distribution.
Figure 8 plots the log wage change (relative to the median change) by percentile for the
two sub-periods, and confirms the trends identified in Figure 7. The steeply sloped curve
9Portuguese minimum wage is set monthly. We impose a 90% lower boundary rather than the minimumwage to allow for data errors and monthly variations that can be present in the dataset. As a robustnesscheck, we have tested several wage cuts ranging from 75% to 90%. The results do not change significantly.
10These correspond to the industries (NACE) A, B, C, L and Q, and the occupations (ISCO) 11, 61 and92.
12

0.1
.2.3
.4C
umul
ativ
e lo
g w
ages
cha
nge
1986 1993 2000 2007
10th percentile 50th percentile 90th percentile
Figure 7: Evolution of cumulative changes by wage percentile, 1986 to 2007
for the first period suggests a strong increase in inequality across the wage distribution,
and the u-shaped curve observed in the second period confirms that wage polarisation
took place from the mid 1990s onwards, but not before.
Using employment data, we also find evidence of job polarisation. Figure 9 plots the
change in log employment share by skill percentile for two periods: 1986-1994 and 1995-
2007.11 The occupation skill percentile rank is performed for two skill proxy measures:
mean education years (left panel) and mean wage (right panel). For the first period (1986-
1994) the results show an upward sloping curve that is consistent with SBTC – employment
share increases for higher skills. In contrast, the second period shows polarisation of em-
ployment: the relative employment in both the bottom and top skill percentiles increases,
while in the middle it decreases. Polarisation appears stronger in the lower tail when
occupations are ranked using mean years of education than mean wages (weighted by
employment) suggesting that some occupations, despite having low education attainment,
have wages close to the median wage.12
Shifts in the industrial structure can contribute to job polarisation. For example,
if industries more intensive in manual (e.g., construction workers) and abstract (e.g.,
managerial) occupations grow in employment and industries intensive in routine (e.g.,
11As discussed before there is a change in the occupational codes from 1994 to 1995, and therefore wechose to split the data at that point. We use occupations at the 3-digit level. Besides the data constraints,the two periods are inherently di↵erent as can be observed from the results.
12Centeno, Novo and Novo (2014) studies wage inequality in Portugal and show similar patterns.
13

-.10
.1.2
Rel
ativ
e lo
g w
age
chan
ge
0 20 40 60 80 100Wage Quantile
1986-1994 1995-2007
Figure 8: Change in log wage by percentile (relative to the median), 1986-1994 and 1995-2007
-.4-.2
0.2
.4ch
ange
in lo
g em
ploy
men
t sha
re (%
)
0 20 40 60 80 100skill percentile
Education Rank
-.20
.2.4
.6ch
ange
in lo
g em
ploy
men
t sha
re (%
)
0 20 40 60 80 100skill percentile
Wage Rank
1986-1994 1995-2007
Figure 9: Changes in log employment share by skill percentile, 1986-1994 and 1995-2007Notes: Skill percentile is the occupation percentile (employment-weighted) considering mean wagerank or mean education years rank. The percentiles are obtained by performing an occupational(3-digits) employment weighted rank for each period’s initial year: 1986 for the first period; 1995for the second. The results are smoothed using a locally weighted regression (bandwidth 0.8).
14

o�ce clerks) occupations decline, job polarisation could occur. However, if polarisation
is being driven by technology changes with a resulting decline in the demand for routine-
intensive tasks across the board, we expect within-industry changes in employment to
explain most of the employment shifts observed, rather than between industry changes.
We perform a shift-share decomposition (Acemoglu and Autor, 2011) to test whether
industrial change can be pointed out as a major explanation for job polarisation.13 We
decompose the total change in employment share of each occupation j over the time
interval t (�Ejt) into two parts: the first is the change in occupational employment share
due to changes in the industry shares or between industry (�EBjt); the second captures the
change in employment share due to within-industry shifts (�EWt ). Equation 1 expresses
this relationship,
�Ejt = �EBjt +�EW
jt (1)
The changes in employment from Equation 1 can be computed as expressed in Equations 2
and 3,
�EBjt =
X
k
�Ekt�jkt (2)
�EWjt =
X
k
��jktEkt (3)
In Equation 2, �Ekt = Ekt1 � Ekt0 is the change in employment share for industry
k over time interval t = {t0; t1} and �jkt = (�jkt1 + �jkt0)/2 is the average employment
share in industry k for occupation j over the same time interval. Similarly, for Equation 3,
��jkt = �jkt1 � �jkt0 is the variation of industry k’s employment share for occupation j
during the time interval t and Ekt = (Ekt1 + Ekt0)/2 is average employment share of
industry k in the given time interval.
We decompose employment changes for our broad occupational categories for two time
periods: 1986-1994 and 1995-2007 (Figure 10). We consider seven broad occupational
groups. The top paid-groups are 1) Managerial and health professions and 2) Technical
and professional; the middle paid include 3) O�ce clerks and 4) Operators; and the
bottom paid consist of 5) Sales, ticket clerks and other services, 6) Personal and protective
13An alternative approach to calculate shifts in the industry can be found in Berman, Bound andGriliches (1994).
15

services and 7) Routine operators (Appendix Table A1 lists 2-digit ISCO occupations by
occupational group). The light shaded portion of the bars represents the within-industry
changes, while the darker shade portion represents between-industry changes. We order
occupational groups by rank of average wage, with high paid groups on top.
Both graphs in Figure 10 exhibit within and between-industry changes in the occu-
pation groups’ employment shares. For both periods, the light shaded portions of the
bars show a larger within-industry growth in top paid occupations, and largest within-
industry decline in middle paid occupations (O�ce clerks and Operators). This pattern
of within-industry change appears to be stronger in the second period, which is consistent
with the descriptive evidence on job polarisation presented in the earlier figures. Overall,
between-industry changes (darker shaded portion of the bars) are related with employment
shifts from manufacturing to services and a↵ect mostly employment changes in lower paid
occupations.
While low paid manufacturing occupations decline, low paid services related occupa-
tions grow. To be consistent with our earlier evidence of stronger employment growth at
the upper tail of the wage distribution than at the lower tail, these industry shifts most
likely cancel each other out, resulting in small employment growth among the low paid. In
other words, between industry decline in routine operators most likely is of similar magni-
tude of the between industry increase in personal and protective services, and sales, ticket
clerks and other services. For the lowest paid occupational groups, the within-industry
changes in employment are small in comparison to between-industry changes. Interest-
ingly, in the second period, the within-industry shifts among the low paid are consistent
with the routinisation hypothesis showing increases in personal and protective services,
and small declines in routine operators and sales, ticket services and other services, which
are more likely to be of a routine nature.
16

Routine operators
Personal and Protective Services
Sales, ticket clerks and other services
Operators
Office Clerks
Technical and Professional
Managerial and Health Professionals
Broad Group
-6 -4 -2 0 2 4 6
1986-1994
-6 -4 -2 0 2 4 6
1995-2007
Between Within
Figure 10: Changes in employment share by occupation groups: within and betweenindustry decompositionNotes: Each bar represents the change in employment share (in percentage points). Decompositionis performed for 11 industry breakdown (D, E, F, G, H, U, J, K M, N and O).
6 Employment, wages and task measures
6.1 Occupational task measures definition
In order to further investigate whether routinisation is driving the job polarisation
documented the previous sections, we analyse the task content of each occupation using the
O*NET descriptors (Goos, Manning and Salomons, 2009; Acemoglu and Autor, 2011).14
We select the O*NET descriptors that have importance and context scales, both between
1 and 5 (a detailed list of the descriptors by task type is in Appendix Table A2). We apply
principal components by task type to the O*NET descriptors to reduce the dimension of
the descriptors.The principal components maximise the total variability of the original
data by construction.
14The O*NET database is the primary project of the O*NET program promoted by the U.S. Departmentof Labour. The database provides information about occupations in several dimensions (we use version15.0). We converted 854 SOC codes into 27 ISCO codes using the 2007 U.S. employment data as weights.A SOC to ISCO crosswalk was kindly provided by Maarten Goos, Alan Manning and Anna Salomons towhom we are thankful.
17

With this methodology, each occupation is represented by a set of task measures. Ta-
ble 1 summarises the results obtained, displaying the standardised principal components
(mean 0 and standard deviation 1) for each task measure and the total variability of the
original data explained by the principal component. Managerial, science and health-related
occupations are the ones that require the most abstract skills. Physical, mathematical and
engineering science professional is the most abstract-intensive occupational group, with
1.62 scale points. By contrast, sales and services elementary occupations (e.g., house-
keeping) are the ones that require less abstract skills (-1.85 points), whilst they are more
intensive in routine manual and manual skills (0.23 and 0.09 respectively). O�ce clerks
have the highest measure in routine cognitive importance (1.13), while machine operators
and assemblers are, as expected, the ones with the highest importance in routine manual
(2.20 points). Most occupations with low intensity in manual tasks also have low values in
routine manual tasks. When the routine manual measure approaches the mean (0 points)
the relationship is not as straightforward. For instance, metal, machinery and related trade
workers are highly intensive in manual tasks (1.88 points, the second highest value), but
with almost null value on routine manual tasks (0.01).
We further allocate each occupation to the task for which the occupation ranks highest
in intensity. Let occupation i in task j have rank ij. Occupation i is more intensive in task
j if rank ij > rank ik with k 6= j. The process was straightforward for all occupations, but
four. For one of these exceptions, the occupation ranked equally high in two tasks (ISCO
51). For the remaining exceptions, we had to look at the occupations in the finer categories
to improve the match between the codes given that O*NET is based on the SOC code and
certain ISCO categories do not o↵er a perfect match for SOC. In particular, while in the
SOC code sales are a category in itself, in the ISCO they are separated in two categories
and are aggregated with other service related occupations.15
15The exceptions to the rank rule were: Life science and health associate professionals (ISCO 32),Personal and protective services workers (ISCO 51), Models, salespersons and demonstrators (ISCO 52)and Sales and services elementary occupations (ISCO 91)). ISCO 51 ranked equally high in two tasks, sowe had to make a judgment call. The remaining exceptions resulted from di↵erences between the SOCand ISCO codes, and correspond to occupations which rank high in two or more tasks, and in which thedisaggregated occupations fit best in a task other than the highest ranking. In particular, ISCO 32 Lifescience and health associate professionals includes health specialists such as optometrists, dieticians andphysiotherapists which fit better in the abstract category than in the routine cognitive. ISCO 52 Models,salespersons and demonstrators includes cashiers and market vendors, and therefore were classified asroutine cognitive. Finally, ISCO 91 Sales and services elementary occupations includes doormen, janitors,
18

Tab
le1:
Taskim
portance
measures
Non-routine
Routine
Routine
Occupation
ISCO
Abstra
ct
Cognitive
Manual
Manual
Smallenterprises&
corporateman
agers
12+13
1.01
-0.01
-1.32
-1.20
Phy
sical,mathem
atical
andeng.
science
prof.
211.62
0.62
-1.10
-1.09
Lifescience
andhealthprofessionals
221.37
0.63
-0.38
-0.38
Teachingprofessionals
231.30
-0.41
-1.75
-2.12
Other
professionals
241.39
0.02
-1.76
-1.96
Phy
sicalan
deng.
science
associateprof.
310.89
0.43
-0.07
-0.09
Lifescience
andhealthassociateprof.
320.24
0.49
-0.11
-0.10
Teachingassociateprofessionals
33-0.08
-1.09
-1.72
-2.42
Other
associateprofessionals
340.75
0.78
-1.44
-1.93
O�ce
clerks
41-0.41
1.13
-0.57
-1.01
Custom
erservices
clerks
42-0.69
0.49
-0.37
-1.06
Personal
andprotectiveservices
workers
51-0.88
-0.41
-0.34
-0.25
Mod
els,
salespersonsan
ddem
onstrators
520.43
0.02
-1.03
-0.81
Extractionan
dbuildingtrad
esworkers
71-0.24
-0.37
0.66
1.90
Metal,machineryan
drelatedtrad
esworkers
720.11
0.03
0.01
1.88
Precision
,han
dicraft,print.an
drel.
trad
eswork.
73-0.09
0.22
1.54
0.41
Other
craftan
drelatedtrad
esworkers
74-0.90
0.00
1.46
0.53
Station
ary-plant
andrelatedop
erators
81-0.27
0.12
1.62
1.20
Machineop
eratorsan
dassemblers
82-0.53
-0.04
2.20
1.25
Drivers
andmob
ile-plant
operators
83-0.60
-0.23
1.01
2.97
Sales
andservices
elem
entary
occupations
91-1.85
-1.12
0.23
0.09
Lab
orersin
mining,
const.,man
uf.
andtran
sp.
93-0.70
-0.27
0.91
1.53
(%)Tota
lVariabilityExplained
89%
65%
87%
81%
Notes:
Taskim
portance
measuresob
tained
usingprincipal
compon
ents
ofseveralO*N
ET
measures.
Thescores
arestan
dardized
tomean0an
dstan
darddeviation
1.
19

Our exact aggregation can be found in Table A3 in the appendix. This table also
includes summary statistics by ISCO occupation, such as mean wages and wage growth
in 1986-2007, employment share in 1986 and changes in employment share over the same
period. It is worth noting that wage growth was highest for the life sciences and health
related occupations and lowest for customer services clerks, with a 2% wage decline in the
period. Employment grew highest among personal and protective services, managers and
other professionals and lowest among o�ce clerks, routine operators and operators.
6.2 Employment by task intensity
Figure 11 shows the employment share trends by task for the economy, manufacturing
and services. For both sectors, over 40% of workers fall within the manual category and
this percentage stays relatively flat throughout the period. Routine manual tasks are more
predominant in manufacturing (ranging from 34 to 40%) than in services (13% to 16%)
with a modest decline in manufacturing . The opposite is true for routine cognitive tasks:
they are more prevalent in services than in manufacturing. Their share is at most 14% in
manufacturing and at least 28% in services. Though this share seems to decline in both
sectors, the decline is more pronounced for services, and modest for manufacturing. It
is therefore interesting that for the economy as a whole, routine cognitive occupations’
decline is very slight due to the expansion of service industries in which the share of these
occupations is higher. Abstract occupations rise steadily in both sectors, but because
services have a higher share of abstract task intensive occupations, the economy as a
whole experiences a higher increase due to the expansion of service employment.
security, cleaning and dry services and maids, which are often referred in the literature as good examples ofoccupations hard to replace with technology. These were classified as manual. Note that despite including”salespersons” in the title, ISCO 91 contains fewer sales occupations (only street vendors) than ISCO 52,hence they were allocated to di↵erent categories.
20

0.2
.4.6
.8em
ploy
men
t sha
re
1986 1993 2000 2007
Economy
0.2
.4.6
.8em
ploy
men
t sha
re1986 1993 2000 2007
Manufacturing
0.2
.4.6
.8em
ploy
men
t sha
re
1986 1993 2000 2007
Services
Abstract Routine Cognitive Routine Manual Manual
Figure 11: Employment share evolution by task and sector
6.3 Wages by task intensity
Figure 12 shows the evolution of log wage by task for the economy, manufacturing and
services. Abstract intensive occupations experience the sharpest rise in wages, widening
the gap between abstract intensive and the remaining occupations until the 2003 crisis.
From 2003 onwards, real wages decline in abstract occupations, contrasting with the flat
trend in the remaining groups. It is also worth noting an increase in routine manual wages
(the lowest paid) relative to manual (and the remaining tasks), especially in services, which
suggests that additional factors besides technology and routinisation may be at play in
the apparent compression in the bottom half of the wage distribution.
Several factors could explain the decline in wages of workers in routine manual occu-
pations. First, selection among workers who remain in routine manual occupations may
counteract declining demand, as it is possible that the more skilled are the ones retaining
their occupations. Second, compositional e↵ects of occupations within each sector (for
example, in terms of seniority or labour market experience) can also contribute to the
observed wage trends. Third, if minimum wages increased over time they could explain
some of the compression observed between routine manual and manual wages, since the
former are the lowest paid group. Figure 13 shows that the minimum wage increased over
time towards the 10th percentile of the wage distributions for routine manual and man-
ual tasks, and is therefore likely to have impacted the wage growth of these two groups
21

including the wage convergence observed. It is also clear from the figure that minimum
wages are less likely to explain the wage dynamic of the higher paid task groups: abstract
and routine cognitive.
55.
56
6.5
7lo
g w
age
1986 1993 2000 2007
Economy
55.
56
6.5
7lo
g w
age
1986 1993 2000 2007
Manufacturing
55.
56
6.5
7lo
g w
age
1986 1993 2000 2007
Services
Abstract Routine Cognitive Routine Manual Manual
Figure 12: Wage evolution by task and sector
46
46
1986 1993 2000 2007 1986 1993 2000 2007
Abstract Routine Cognitive
Routine Manual Manual
Percentile 10 Percentile 50 Mean Mininum Wage
real
log
wag
e
Figure 13: Task wage percentiles and real minimum wage
22

7 Routinisation hypothesis: evidence from wages
Is the job polarisation observed so far due to the routinisation hypothesis? Our wage
regressions presented in this section aim at answering this question by controlling for con-
founding factors. Our empirical strategy resembles that of Acemoglu and Autor (2011) and
uses age, education, region and industry variables to create skill-industry-region groups
whose wages are regressed against their task measures at the beginning of the period.
This strategy is robust to selective job and occupational changes, since it does not follow
workers nor does it look at changes in task shares over time. Our identifying assumption
is that if the relative supply of skills is fixed and the market price of tasks in which a skill
group holds comparative advantage in 1986 declines due to technology, such as routine
cognitive or manual tasks, the relative wage of that skill group should decline, indepen-
dently of whether workers initially employed in those tasks have retained or changed their
jobs and occupations. This strategy circumvents the challenges raised by the non-random
selection of workers who retain their routine intensive occupations in the estimation of
wage e↵ects. We also control for demographic, region and industry compositional e↵ects
by constructing cells defined by vectors of these variables. Cells are defined by gender,
age (<25, 25-34, 35-44, 45-54, 55-65), years of education (<9, 9, 12, >12), regions (NUTS
2) and industries (11 industries breakdown) and are our unit of observation. Depending
on the year, we obtain at least 2582 gender-age-education-region-industry cells. On aver-
age, each cell contains 611 workers and the average yearly total employment is 1.7 million
workers.
Let ⌦it be the natural logarithm of wage in cell i at time t defined as:
⌦it = tt↵+Tit0 ⇥ tt� + ci + !it (4)
Equation 4 considers a vector of yearly time dummies tt to control for macroeconomic
conditions and ci for cell fixed e↵ects. We denote Tit0 as the vector of initial employment
share in abstract, routine cognitive and routine manual tasks for cell i in time t0 - manual
tasks are the omitted group. Thus, the point estimate � from the interaction termTit0 ⇥ tt
captures the trend in wages for cells that hold comparative advantage in t0 (1986) in a
23

given task, relative to manual. We estimate Equation 4 applying least squares and using
cells’ employment as weights.
We plot the interactions’ coe�cients from wage regressions in Figure 14 by sector (for
the full results see Appendix Tables A4). The wage results from panel A show that for cells
with comparative advantage in abstract occupations in 1986 there is an upward trend for
all specifications, with some decline after the 2003 crisis. Cells with comparative advantage
in routine cognitive tasks in 1986 experience wage declines, especially in manufacturing.
Cells with comparative advantage in routine manual tasks experience stable wages (relative
to manual) in manufacturing, but increasing in services.16
-0.6
0-0.4
0-0.2
00.0
00.2
00.4
00.6
0lo
g w
age
1986 1993 2000 2007
Economy
-0.6
0-0.4
0-0.2
00.0
00.2
00.4
00.6
0lo
g w
age
1986 1993 2000 2007
Manufacturing
-0.6
0-0.4
0-0.2
00.0
00.2
00.4
00.6
0lo
g w
age
1986 1993 2000 2007
Services
A: Wage - no controls for minimum wage
-0.6
0-0.4
0-0.2
00.0
00.2
00.4
00.6
0lo
g w
age
1986 1993 2000 2007
Economy
-0.6
0-0.4
0-0.2
00.0
00.2
00.4
00.6
0lo
g w
age
1986 1993 2000 2007
Manufacturing
-0.6
0-0.4
0-0.2
00.0
00.2
00.4
00.6
0lo
g w
age
1986 1993 2000 2007
Services
B: Wage - with controls for minimum wage
Abstract Routine Cognitive Routine Manual
Figure 14: Task 1986 estimation for wages by sectorNotes: Estimations performed for gender-age-education-region-industry cells. The estimates dis-played are only for the iteration e↵ect: task 1986 times time dummies. Task stands for the shareof workers in a given task in 1986. Model contains fixed e↵ects for cells. Estimations weighted bycells’ employment. Estimated coe�cients from Appendix Table A4.
Our earlier analysis of the minimum wage (see Figure 13) indicates that wages in rou-
16Coe�cients on the time-dummy interactions with abstract task shares in 1986 are only significant acrossall specifications from 1994 onwards. Coe�cients on the routine manual time-dummy interactions are onlysignificant for services. The routine cognitive interactions are statistically significant for manufacturingand the economy as a whole, and after 2002 for services.
24

tine manual tasks are more likely to be a↵ected by the increase in the real minimum wage.
This implies that omitting minimum wages from the regression results in an overestima-
tion of the wage trend for routine manual tasks. We therefore re-estimate our regression
controlling for a measure of the ”toughness” of the minimum wage at the cell level: the
ratio of the minimum wage to the 10th wage percentile. Panel B of Figure 14 presents
the results of the wage trends with the minimum wage controls.17 With the minimum
wage controls, routine manual tasks now exhibit negative wage trends for the economy as
a whole and in manufacturing and less pronounced growth in services.18 The wage trends
for abstract and routine cognitive tasks remain essentially unchanged, though they become
smaller in magnitude. This suggests a larger overestimation of the wage growth for the
routine manual group when minimum wage controls were not included in the regressions,
as expected, since this is the lowest paid task.
While the fact that in the service sector, routine manual wages exhibit an increasing
trend relative to manual even when minimum wage controls are included, could go against
the routinisation hypothesis, a closer analysis of the occupational make up of these tasks
allow us to explain this apparent contradiction Routine manual tasks in services are com-
prised of mostly sales persons and cashiers (in terms of employment), while the majority
of manual employment in services consists of personal and protective services. Sales,
though highly routine, have not yet been substituted by technology in Portugal where
internet sales and self-checkouts are still very incipient. These results are consistent with
an increase in the demand for sales workers which is not surprising due to the dramatic
expansion of retail trade in Portugal since it joined the European Union in 1986.
In conclusion, our wage regressions are broadly in line with the routinisation hypothesis
– wages in cells with early comparative advantage in abstract and manual occupations
increased relative to those with comparative advantage in routine (cognitive or manual)
17Relative minimum wage coe�cients are negative and statistically significant. Because the minimumwage variable is negatively correlated with cells’ mean wage, it is likely to bias of e↵ect of the minimumwage on the wage trend, and to result in an underestimation of the magnitude of the task related wagetrends. Despite this potential bias, these regressions support our hypothesis that the routine manual taskswage trend is the one mostly a↵ected by the omission of the minimum wages. Employment regressions withminimum wage controls are not shown, as the inclusion of minimum wages did not change the estimatedtrends.
18The coe�cients on the routine manual time-dummy interactions become significant in manufacturingafter 2002, whereas they are not in the specification without the controls along the whole period.forminimum wage toughness.
25

occupations. While the real minimum wage increase may have contributed to the wage
growth observed at the bottom of the wage distribution, technology seems to be the major
driving force behind the wage polarisation observed.
8 Conclusion
Similar to the U.S., U.K., and continental Europe, Portugal has experienced recent job
polarisation. However, we only find evidence of a hollowing out of the middle of the wage
distribution from the mid 1990s onwards. Job polarisation has occurred hand-in-hand
with wage polarisation – both wages and employment of middle skilled workers su↵ered a
relative decline from 1995 to 2007.
We have also uncovered evidence that job polarisation in Portugal has been technology
driven. First, despite the large industry movements observed due to a shift from manufac-
turing to service industries, it is the within-industry employment changes in occupations
that accounts for the larger growth in top and bottom paid occupations versus the middle
paid. Second, using task measures derived from the Occupational Information Network
database (developed by the U.S. Department of Labour) we show an increase in employ-
ment in abstract occupations and a decline in routine occupations. Third, when controlling
for initial tasks performed by workers, demographics and industry compositional e↵ects,
and minimum wage e↵ects, the regression estimates reveal a growing trend for wages in
cells with a comparative advantage in abstract and manual occupations in 1986, and a
declining trend for wages in cells with a comparative advantage in routine (cognitive and
manual) occupations in 1986.
The Portuguese case shows that a country lagging in GDP per capita, wages, edu-
cation and capital stock relative to many of its European counterparts can experience
similar patterns of labour market polarisation explained by technology advances such as
computerisation and automation which displace routine tasks, and complement abstract
tasks. The evidence derived from the Portuguese case adds to the literature by provid-
ing a thorough analysis of job and wage polarisation for a developed country below the
technological frontier, giving evidence that technology can hit such labour markets in a
26

similar fashion as it hits more advanced economies as the US, UK or Germany.
Our results suggest that education and employment policies should promote the acqui-
sition of non-routine skills likely to sustain a comparative advantage in the near future.
In the case of Portugal, and given the comparatively low levels of education, investments
in college education seem warranted. The mismatch between the supply and demand for
skills due to the technological change is one of the probable causes for the high preva-
lence of long-term unemployment, representing more than 50% of total unemployment in
the last decade. In addition, the disappearing of middle paid jobs may bring about the
weakening of social ties associated with the thinning of the middle class. This should
also be a focus concerning the design of policies with redistributive implications (such as
those aimed at reducing the budget deficit) that may a↵ect disproportionally individuals
and families at the various sections of the wage distribution, and exacerbate the potential
negative consequences of job polarisation.
27

9 Acknowledgements
Tiago Fonseca acknowledges the financial support from the Portuguese funding insti-
tution (FCT) under Doctoral Grant SFRH/BD/93390/2013.
The authors acknowledge the financial support from the Portuguese National Foun-
dation (FCT) under Grant PTDC/IIM-ECO/5123/2012. We are also indebted to the
Portuguese Ministry of Employment and Social Security and Gabinete de Estrategia e
Planeamento (GEP) for giving us access to the matched employer-employee data. We
would like also to thank the suggestions and comments from the participants at EALE
and ESPE 2014 conferences.
28

References
Acemoglu, Daron. 1998. “Why do new technologies complement skills? Directed technical
change and wage inequality.” Quarterly Journal of Economics, 113(4): 1055–1089.
Acemoglu, Daron, and David Autor. 2011. “Skills, Tasks and Technologies: Implications
for Employment and Earnings.” Handbook of Labor Economics, , ed. Orley Ashenfelter
and David Card Vol. 4B, 1043–1171. Elsevier.
Asplund, Rita, and Erling Barth. 2011. “Polarization of the Nordic Labour Markets.”
Finnish Economic Papers, 24(2): 87–110.
Autor, David H., Frank Levy, and Richard J. Murnane. 2003. “The Skill Content of Recent
Technological Change: An empirical exploration.” Quarterly Journal of Economics,
118(4): 1279–1333.
Autor, David H., Lawrence F. Katz, and Melissa S. Kearney. 2006. “The polarization of
the US labor market.” American Economic Review, 96(2): 189–194.
Autor, David, Lawrence Katz, and Alan B. Krueger. 1998. “Computing inequality: have
computers changed the labor market?” Quarterly Journal of Economics, 113(4): 1169–
1213.
Berman, Eli, John Bound, and Stephen Machin. 1998. “Implications of Skill-Biased
Technological Change: International Evidence.” Quarterly Journal of Economics,
113(4): 1245–1279.
Berman, Eli, John Bound, and Zvi Griliches. 1994. “Changes in the Demand for Skilled La-
bor Within U.S. Manufacturing: Evidence From the Annual Survey of Manufacturers.”
Quarterly Journal of Economics, 109(2): 367–397.
Bound, John, and George Johnson. 1992. “Changes in the structure of wages in the 1980’s:
an evaluation of alternative explanations.” American Economic Review, 82(3): 371–92.
Bresnahan, Timothy F. 1999. “Computerisation and Wage Disperson: an Analytical Rein-
terpretation.” The Economic Journal, 109(456): 390–415.
29

Centeno, Mario, Alvaro Novo, and AA Novo. 2014. “When supply meets demand: Wage
inequality in Portugal.” IZA Journal of European Labor Studies, 3(23).
Clark, Colin. 1957. The Conditions of Economic Progress. London: Macmillan.
DiNardo, John E., and Jorn-Ste↵en Pischke. 1997. “The Returns to Computer Use Revis-
ited: Have Pencils Changed the Wage Structure Too?” Quarterly Journal of Economics,
112(1): 291–303.
DiNardo, John, Nicole M. Fortin, and Thomas Lemieux. 1996. “Labor Market Institutions
and the Distribution of Wages, 1973-1992: A Semiparametric Approach.” Econometrica,
64(5): 1001–1044.
Dustmann, Christian, Johannes Ludsteck, and Uta Schonberg. 2009. “Revisiting the Ger-
man Wage Structure.” Quarterly Journal of Economics, 124(2): 843–881.
Goos, Maarten, Alan Manning, and Anna Salomons. 2009. “Job polarization in Europe.”
American Economic Review, 99(2): 58–63.
Goos, Maarten, Alan Manning, and Anna Salomons. 2014. “Explaining Job Polarization:
Routine-Biased Technological Change and O↵shoring.” American Economic Review,
104(8): 2509–2526.
Goos, Maarten, and Alan Manning. 2007. “Lousy and lovely jobs: The rising polarization
of work in Britain.” Review of Economics and Statistics, 89(1): 118–133.
Juhn, Chinhui, Kevin M. Murphy, and Brooks Pierce. 1993. “Wage Inequality and the
Rise in Return to Skill.” Journal of Political Economy, 101(3): 410–442.
Katz, Lawrence F., and Kevin M. Murphy. 1992. “Changes in Relative Wages, 1963-1987:
Supply and Demand Factors.” Quarterly Journal of Economics, 107(1): 35–78.
Krueger, Alan B. 1993. “How Computers Have Changed the Wage Structure: Evidence
from Microdata, 1984-1989.” Quarterly Journal of Economics, 108(1): 33–60.
Krusell, Per, and Lee Ohanian. 2000. “Capital-skill complementarity and inequality: A
macroeconomic analysis.” Econometrica, 68(5): 1029–1053.
30

Levy, Frank, and Richard J. Murnane. 1992. “U.S. Earnings Levels and Earnings Inequal-
ity: A Review of Recent Trends and Proposed Explanations.” Journal of Economic
Literature, 30(3): 1333–1381.
Machin, Stephen, and John Van Reenen. 1998. “Technology and changes in skill structure:
evidence from seven OECD countries.” Quarterly Journal of Economics, 113(4): 1215–
1244.
Michaels, Guy, Ashwini Natraj, and John Van Reenen. 2014. “Has ICT Polarized Skill
Demand? Evidence from Eleven Countries over 25 Years.” Review of Economics and
Statistics, 96(1): 60–77.
Spitz-Oener, Alexandra. 2006. “Technical change, job tasks and rising educational de-
mands: Looking outside the wage structure.” Journal of Labor Economics, 24(2): 235–
270.
Appendix A Tables
Table A1: Broad occupational groups
Broad Occupational Groups ISCO OccupationTechnical and professional 21 Physical, mathematical and engineering science professionals
23 Teaching professionals24 Other professionals31 Physical and engineering science associate professionals33 Teaching associate professionals34 Other associate professionals
Managerial and health professionals 12+13 Small enterprises & corporate managers22 Life science and health professionals32 Life science and health associate professionals
O�ce clerks 41 O�ce clerksPersonal and protective services 51 Personal and protective services workersSales, ticket clerks and other services 42 Customer services clerks
52 Models, salespersons and demonstrators91 Sales and services elementary occupations
Routine operators 73 Precision, handicraft, printing and related trades workers74 Other craft and related trades workers81 Stationary-plant and related operators82 Machine operators and assemblers
Operators 71 Extraction and building trades workers72 Metal, machinery and related trades workers83 Drivers and mobile-plant operators93 Laborers in mining, construction, manufacturing and transport
31

Table A2: O*NET descriptor and scale type by task
O*NET descriptors Scale type
Non-routine Cognitive: Analytical (Abstract)4.A.2.a.4 Analyzing Data or Information Importance4.A.2.b.2 Thinking Creatively Importance4.A.4.a.1 Interpreting the Meaning of Information for Others Importance
Routine Cognitive4.C.3.b.4 Importance of Being Exact or Accurate Content4.C.3.b.7 Importance of Repeating Same Tasks Content4.C.3.b.8 Structured versus Unstructured Work (reverse) Content
Routine Manual4.C.3.d.3 Pace Determined by Speed of Equipment Content4.C.2.d.1.i Spend Time Making Repetitive Motions Content4.A.3.a.3 Controlling Machines and Processes Importance
Non-routine Manual Physical1.A.1.f.1 Spatial Orientation Importance1.A.2.a.2 Manual Dexterity Importance4.A.3.a.4 Operating Vehicles, Mechanized Devices, or Equipment Importance4.C.2.d.1.g Spend Time Using Your Hands to Handle, Control, or Feel
Objects, Tools, or ControlsContent
Notes: O*NET measures selected for construction of each task measures following Ace-moglu and Autor (2011). By reverse we mean that the scale has been transformed inorder for the lower values to be at the top and for the higher values be at the bottom. Forsimplicity we focused on four tasks: Analytical, which we call Abstract (to borrow Autor,Katz and Kearney (2006) terminology), Routine Cognitive, Routine Manual and Manual.If we included an interpersonal category, occupations high in interpersonal tasks can eitherbe also high in abstract tasks or in manual or routine manual tasks, and therefore it is notstraightforward how to interpret the interpersonal task content in face of the routinizationhypothesis.
32

Table A3: Allocation between occupations and tasks
Wage Wage Emp. %Change �emp. shareEducation 1986 2007 share real wage 1986-2007 (p.p.)
ISCO Occupation Task 1986 2007 real real nom. 1986 all manuf serv all manuf servTechnical and Professional21 Physical, mathematical and eng. science prof. Abstract 14 16 450 669 2049 0.2 49 59 30 1.8 0.8 1.024 Other professionals Abstract 11 15 317 543 1661 0.4 71 94 64 2.1 0.3 1.823 Teaching professionals Abstract 14 15 410 493 1509 0.0 20 0 20 0.4 0.0 0.431 Physical and eng. science associate prof. Abstract 8 12 332 446 1366 2.7 34 50 19 1.3 0.3 1.134 Other associate professionals R. Cog. 8 12 327 510 1562 3.5 56 57 54 2.3 0.0 2.333 Teaching associate professionals Abstract 7 13 201 323 988 0.5 61 48 70 0.4 -0.1 0.5
Managerial and Health Professionals12+13 Small enterprises & corporate managers Abstract 10 12 458 744 2277 2.1 62 46 71 2.0 0.4 1.622 Life science and health professionals Abstract 9 16 265 550 1683 0.2 108 120 109 0.6 0.0 0.532 Life science and health associate prof. Abstract 8 12 192 329 1008 0.2 71 87 70 0.5 0.0 0.5
O�ce Clerks41 O�ce clerks R. Cog. 8 11 240 321 981 16.3 33 43 24 -3.6 -3.3 -0.4
Personal and Protective Services51 Personal and protective services workers Manual 5 8 173 198 606 5.3 14 -4 15 5.0 0.0 5.0
Sales, ticket clerks and other services42 Customer services clerks R. Cog. 7 10 238 233 713 2.7 -2 7 -2 0.2 -0.3 0.552 Models, salespersons and demonstrators R. Man. 6 9 159 224 687 5.3 41 56 40 1.5 -0.2 1.791 Sales and services elementary occupations Manual 4 7 163 195 596 4.9 19 18 19 2.4 -0.8 3.2
Routine operators73 Precision, handicraft, print. and rel. trades work. R. Man. 4 7 193 236 722 1.3 23 22 22 -0.4 -0.4 0.074 Other craft and related trades workers R. Man. 4 6 131 180 551 10.6 37 35 44 -2.6 -2.8 0.281 Stationary-plant and related operators R. Man. 4 7 195 297 910 1.7 53 63 -7 -0.5 -0.7 0.282 Machine operators and assemblers R. Man. 4 7 167 234 717 8.6 40 42 23 -3.8 -4.1 0.3
Operators71 Extraction and building trades workers Manual 4 6 205 228 699 8.6 12 14 -1 -0.7 -0.3 -0.472 Metal, machinery and related trades workers Manual 5 7 203 269 825 9.6 32 34 30 -3.3 -2.6 -0.783 Drivers and mobile-plant operators Manual 4 7 207 262 801 4.7 27 29 23 0.2 -0.7 0.993 Laborers in mining, const., manuf. and transp. Manual 4 7 149 194 595 10.4 30 33 26 -5.77 -4.12 -1.65
Notes: Tasks are grouped as: Non-routine Cognitive Abstract, Routine Cognitive, Routine Manual and Non-routine Manual. Education is measured by mean years offormal education. Wages are the mean wages in euros in a given year. Real wage refers to wage deflated to 1986 using CPI. %Change represents the percentage changein mean wage. �emp. share is the change in employment change expressed in percentage points.
33

Table A4: Wages regression results
(1) (2) (3) (4) (5) (6)without minimum wage controls with minimum wage controls
Sector Economy Manufacturing Services Economy Manufacturing Services1987 0.047*** 0.041*** 0.057*** 0.043*** 0.039*** 0.049***
(0.005) (0.009) (0.007) (0.004) (0.007) (0.006)1988 0.064*** 0.072*** 0.054*** 0.072*** 0.084*** 0.057***
(0.005) (0.009) (0.007) (0.004) (0.007) (0.006)1989 0.075*** 0.092*** 0.049*** 0.108*** 0.126*** 0.083***
(0.005) (0.009) (0.007) (0.004) (0.007) (0.006)1991 0.169*** 0.207*** 0.112*** 0.286*** 0.343*** 0.216***
(0.005) (0.009) (0.007) (0.004) (0.007) (0.006)1992 0.202*** 0.248*** 0.137*** 0.344*** 0.406*** 0.272***
(0.005) (0.009) (0.007) (0.004) (0.007) (0.006)1993 0.242*** 0.287*** 0.176*** 0.387*** 0.447*** 0.313***
(0.005) (0.009) (0.007) (0.004) (0.007) (0.006)1994 0.254*** 0.294*** 0.197*** 0.370*** 0.419*** 0.308***
(0.005) (0.009) (0.007) (0.004) (0.007) (0.006)1995 0.235*** 0.271*** 0.183*** 0.367*** 0.414*** 0.310***
(0.005) (0.009) (0.007) (0.004) (0.007) (0.006)1996 0.258*** 0.297*** 0.204*** 0.404*** 0.457*** 0.341***
(0.005) (0.009) (0.007) (0.004) (0.007) (0.006)1997 0.262*** 0.293*** 0.218*** 0.425*** 0.472*** 0.371***
(0.005) (0.008) (0.007) (0.004) (0.007) (0.006)1998 0.271*** 0.294*** 0.233*** 0.436*** 0.472*** 0.393***
(0.005) (0.008) (0.007) (0.004) (0.007) (0.006)1999 0.278*** 0.299*** 0.242*** 0.457*** 0.492*** 0.414***
(0.005) (0.008) (0.007) (0.004) (0.007) (0.006)2000 0.284*** 0.306*** 0.246*** 0.484*** 0.528*** 0.434***
(0.005) (0.008) (0.007) (0.004) (0.007) (0.006)2002 0.287*** 0.313*** 0.246*** 0.537*** 0.592*** 0.479***
(0.005) (0.008) (0.007) (0.004) (0.007) (0.006)2003 0.280*** 0.309*** 0.235*** 0.539*** 0.596*** 0.479***
(0.005) (0.008) (0.007) (0.004) (0.007) (0.006)2004 0.282*** 0.304*** 0.241*** 0.554*** 0.609*** 0.495***
(0.005) (0.008) (0.007) (0.004) (0.007) (0.006)2005 0.290*** 0.322*** 0.240*** 0.562*** 0.624*** 0.496***
(0.005) (0.008) (0.006) (0.004) (0.007) (0.006)2006 0.290*** 0.329*** 0.233*** 0.563*** 0.628*** 0.493***
(0.005) (0.008) (0.006) (0.004) (0.007) (0.006)2007 0.312*** 0.357*** 0.248*** 0.585*** 0.652*** 0.513***
(0.005) (0.008) (0.007) (0.004) (0.007) (0.006)Abstract 1986 ⇥1987 0.004 0.023 -0.011 0.021 0.043 0.008
(0.024) (0.050) (0.028) (0.020) (0.039) (0.023)1988 0.010 0.020 0.012 0.027 0.027 0.037
(0.024) (0.050) (0.027) (0.020) (0.039) (0.023)1989 -0.177*** -0.214*** -0.127*** -0.094*** -0.121*** -0.052*
(0.023) (0.046) (0.026) (0.019) (0.036) (0.022)1991 0.047* 0.041 0.092*** 0.067*** 0.014 0.134***
(0.023) (0.047) (0.026) (0.019) (0.036) (0.022)1992 0.043 0.066 0.082** 0.050** 0.025 0.103***
(0.022) (0.047) (0.025) (0.018) (0.037) (0.021)1993 0.039 0.051 0.083*** 0.039* 0.025 0.090***
(0.022) (0.046) (0.025) (0.018) (0.036) (0.021)1994 0.175*** 0.333*** 0.154*** 0.162*** 0.200*** 0.172***
(0.022) (0.048) (0.025) (0.018) (0.038) (0.021)1995 0.307*** 0.523*** 0.260*** 0.259*** 0.377*** 0.241***
(0.021) (0.045) (0.024) (0.017) (0.035) (0.020)Continued. . .
34

(1) (2) (3) (4) (5) (6)1996 0.328*** 0.555*** 0.282*** 0.257*** 0.364*** 0.248***
(0.021) (0.045) (0.024) (0.017) (0.035) (0.020)1997 0.338*** 0.558*** 0.288*** 0.267*** 0.393*** 0.245***
(0.021) (0.044) (0.023) (0.017) (0.035) (0.019)1998 0.362*** 0.602*** 0.299*** 0.270*** 0.398*** 0.238***
(0.020) (0.044) (0.023) (0.017) (0.034) (0.019)1999 0.382*** 0.637*** 0.319*** 0.288*** 0.441*** 0.251***
(0.020) (0.043) (0.023) (0.017) (0.034) (0.019)2000 0.394*** 0.626*** 0.342*** 0.275*** 0.433*** 0.244***
(0.020) (0.043) (0.022) (0.016) (0.033) (0.019)2002 0.336*** 0.450*** 0.319*** 0.267*** 0.383*** 0.250***
(0.020) (0.041) (0.022) (0.016) (0.032) (0.019)2003 0.373*** 0.566*** 0.337*** 0.270*** 0.451*** 0.241***
(0.020) (0.042) (0.022) (0.016) (0.033) (0.018)2004 0.369*** 0.612*** 0.319*** 0.240*** 0.440*** 0.205***
(0.019) (0.041) (0.022) (0.016) (0.032) (0.018)2005 0.362*** 0.575*** 0.329*** 0.240*** 0.390*** 0.223***
(0.019) (0.041) (0.022) (0.016) (0.032) (0.018)2006 0.315*** 0.528*** 0.290*** 0.204*** 0.358*** 0.190***
(0.019) (0.041) (0.021) (0.016) (0.032) (0.018)2007 0.270*** 0.503*** 0.247*** 0.163*** 0.325*** 0.147***
(0.019) (0.041) (0.021) (0.016) (0.032) (0.018)Routine manual 1986 ⇥1987 0.017 0.032 -0.027 0.020* 0.029* -0.006
(0.011) (0.016) (0.021) (0.009) (0.013) (0.018)1988 0.024* 0.013 0.048* 0.017 -0.004 0.068***
(0.011) (0.016) (0.021) (0.009) (0.013) (0.018)1989 0.003 -0.034* 0.103*** -0.006 -0.036** 0.091***
(0.011) (0.016) (0.021) (0.009) (0.013) (0.018)1991 0.003 -0.083*** 0.209*** 0.001 -0.081*** 0.194***
(0.011) (0.016) (0.021) (0.009) (0.012) (0.017)1992 -0.004 -0.089*** 0.187*** -0.006 -0.082*** 0.180***
(0.011) (0.016) (0.021) (0.009) (0.012) (0.017)1993 -0.008 -0.102*** 0.228*** 0.014 -0.067*** 0.235***
(0.011) (0.016) (0.021) (0.009) (0.013) (0.017)1994 0.031** -0.048** 0.230*** 0.061*** -0.004 0.246***
(0.011) (0.016) (0.020) (0.009) (0.013) (0.017)1995 0.008 -0.052** 0.153*** 0.022* -0.029* 0.166***
(0.011) (0.016) (0.020) (0.009) (0.012) (0.017)1996 0.019 -0.044** 0.177*** 0.034*** -0.027* 0.201***
(0.011) (0.016) (0.020) (0.009) (0.012) (0.017)1997 0.011 -0.034* 0.138*** 0.022* -0.020 0.151***
(0.010) (0.016) (0.020) (0.009) (0.012) (0.017)1998 0.014 -0.017 0.117*** 0.020* -0.002 0.122***
(0.011) (0.016) (0.020) (0.009) (0.012) (0.017)1999 0.010 -0.019 0.138*** 0.013 -0.006 0.127***
(0.010) (0.016) (0.020) (0.009) (0.012) (0.017)2000 0.013 -0.017 0.162*** 0.004 -0.022 0.127***
(0.010) (0.015) (0.019) (0.008) (0.012) (0.016)2002 0.030** -0.010 0.182*** -0.010 -0.047*** 0.118***
(0.010) (0.015) (0.019) (0.008) (0.012) (0.016)2003 0.037*** -0.006 0.205*** -0.010 -0.046*** 0.127***
(0.010) (0.015) (0.019) (0.008) (0.012) (0.016)2004 0.027** -0.012 0.214*** -0.028*** -0.065*** 0.125***
(0.010) (0.016) (0.019) (0.008) (0.012) (0.016)2005 0.022* -0.038* 0.243*** -0.038*** -0.088*** 0.136***
(0.010) (0.016) (0.019) (0.009) (0.012) (0.016)2006 0.026* -0.047** 0.266*** -0.043*** -0.099*** 0.136***
(0.011) (0.016) (0.019) (0.009) (0.012) (0.016)Continued. . .
35

(1) (2) (3) (4) (5) (6)2007 0.007 -0.077*** 0.260*** -0.062*** -0.117*** 0.111***
(0.011) (0.016) (0.020) (0.009) (0.013) (0.017)Routine Cognitive 1986 ⇥1987 0.010 0.004 0.005 0.019* 0.014 0.016
(0.011) (0.027) (0.013) (0.009) (0.021) (0.011)1988 0.005 -0.018 0.022 0.016 0.003 0.031**
(0.011) (0.027) (0.013) (0.009) (0.021) (0.011)1989 0.014 0.013 0.030* 0.036*** 0.027 0.048***
(0.011) (0.026) (0.013) (0.009) (0.020) (0.011)1991 -0.074*** -0.058* -0.033** -0.014 -0.015 0.026*
(0.011) (0.025) (0.012) (0.009) (0.020) (0.010)1992 -0.008 -0.068** 0.062*** 0.024** -0.022 0.081***
(0.011) (0.025) (0.012) (0.009) (0.020) (0.010)1993 -0.055*** -0.088*** 0.004 -0.030*** -0.054** 0.019
(0.011) (0.025) (0.012) (0.009) (0.020) (0.010)1994 -0.067*** -0.135*** -0.002 -0.018* -0.049* 0.028**
(0.011) (0.025) (0.012) (0.009) (0.020) (0.010)1995 -0.041*** -0.150*** 0.033** 0.007 -0.055** 0.059***
(0.010) (0.024) (0.012) (0.009) (0.019) (0.010)1996 -0.053*** -0.178*** 0.027* 0.004 -0.063*** 0.060***
(0.010) (0.024) (0.012) (0.009) (0.019) (0.010)1997 -0.068*** -0.197*** 0.006 0.001 -0.072*** 0.050***
(0.010) (0.024) (0.012) (0.008) (0.018) (0.010)1998 -0.076*** -0.201*** -0.007 0.003 -0.062*** 0.042***
(0.010) (0.024) (0.012) (0.008) (0.018) (0.010)1999 -0.081*** -0.226*** -0.011 -0.003 -0.085*** 0.037***
(0.010) (0.023) (0.011) (0.008) (0.018) (0.010)2000 -0.089*** -0.252*** -0.015 -0.016* -0.114*** 0.033***
(0.010) (0.023) (0.011) (0.008) (0.018) (0.010)2002 -0.101*** -0.234*** -0.033** -0.045*** -0.134*** 0.005
(0.010) (0.023) (0.011) (0.008) (0.018) (0.009)2003 -0.118*** -0.284*** -0.040*** -0.055*** -0.165*** 0.002
(0.010) (0.023) (0.011) (0.008) (0.018) (0.009)2004 -0.134*** -0.305*** -0.061*** -0.064*** -0.178*** -0.012
(0.010) (0.022) (0.011) (0.008) (0.018) (0.009)2005 -0.159*** -0.322*** -0.081*** -0.078*** -0.185*** -0.023*
(0.010) (0.022) (0.011) (0.008) (0.017) (0.009)2006 -0.176*** -0.350*** -0.091*** -0.088*** -0.198*** -0.030**
(0.010) (0.022) (0.011) (0.008) (0.017) (0.009)2007 -0.196*** -0.384*** -0.103*** -0.104*** -0.216*** -0.042***
(0.010) (0.022) (0.011) (0.008) (0.017) (0.009)min wage/p10 (logs) -3.840*** -4.382*** -3.471***
(0.025) (0.050) (0.028)Constant 5.266*** 5.171*** 5.355*** 8.687*** 9.125*** 8.412***
(0.002) (0.003) (0.002) (0.022) (0.045) (0.025)R2-adjusted 0.971 0.970 0.972 0.993 0.995 0.991F-statistic 941 375 533 5593 3122 2740Observations 50687 12619 38068 50687 12619 38068
Notes: Dependent variable is the log wage. Regression results for gender-age-education-region-industrycells. Each task is the task’s employment share in 1986. Manual is the omitted category. Wage estimationsweighted by cells’ employment. Huber-White robust standard errors are reported. Model contains fixede↵ects for cells.
36